UNITED STATES
SECURITIES AND EXCHANGE COMMISSION
Washington, D.C. 20549
FORM N-CSR
CERTIFIED SHAREHOLDER REPORT OF REGISTERED MANAGEMENT
INVESTMENT COMPANIES
| | |
| Investment Company Act file number: | | 811-09101 |
| |
| Exact name of registrant as specified in charter: | | Prudential Investment Portfolios 9 |
| |
| Address of principal executive offices: | | 655 Broad Street, 17th Floor |
| | Newark, New Jersey 07102 |
| |
| Name and address of agent for service: | | Deborah A. Docs |
| | 655 Broad Street, 17th Floor |
| | Newark, New Jersey 07102 |
| |
| Registrant’s telephone number, including area code: | | 800-225-1852 |
| |
| Date of fiscal year end: | | 10/31/2016 |
| |
| Date of reporting period: | | 10/31/2016 |
Item 1 – Reports to Stockholders
PRUDENTIAL INVESTMENTS, A PGIM BUSINESS | MUTUAL FUNDS
Prudential Absolute Return Bond Fund
| | |
| ANNUAL REPORT | | OCTOBER 31, 2016 |

| | |
To enroll in e-delivery, go to prudentialfunds.com/edelivery | |  |
|
Objective: To seek positive returns over the long term, regardless of market
conditions |
Highlights
PRUDENTIAL ABSOLUTE RETURN BOND FUND
| • | | The Fund outperformed the BofAML USD LIBOR 3-Month CM Index because of its sector allocations and strong security selection, along with effective management of duration and yield curve positioning. (For a complete list of holdings, refer to the Portfolio of Investments section of this report.) |
| • | | Sector allocations added most to the Fund’s relative results, driven by overweight positions in high yield corporate bonds, investment-grade corporate bonds, emerging markets debt, bank loans, and commercial mortgage-backed securities. |
| • | | The Fund’s currency positioning detracted from relative performance. |
This report is not authorized for distribution to prospective investors unless preceded or accompanied by a current prospectus.
The views expressed in this report and information about the Fund’s portfolio holdings are for the period covered by this report and are subject to change thereafter.
Mutual funds are distributed by Prudential Investment Management Services LLC (PIMS), member SIPC. PGIM Fixed Income is a unit of PGIM, Inc. (PGIM), a registered investment adviser. PIMS and PGIM are Prudential Financial companies. © 2016 Prudential Financial, Inc. and its related entities. The Prudential logo and the Rock symbol are service marks of Prudential Financial, Inc. and its related entities, registered in many jurisdictions worldwide.
| | |
| 2 | | Visit our website at prudentialfunds.com |
Letter from the President

Dear Shareholder:
We hope you find the annual report for the Prudential Absolute Return Bond Fund informative and useful. The report covers performance for the 12-month period that ended October 31, 2016.
During the reporting period, the US economy experienced modest growth. Labor markets were healthy, and consumer confidence rose. The housing market brightened somewhat, as momentum continued for the new home market. The Federal Reserve kept interest rates unchanged at its September meeting, but pointed to the strong possibility of a rate hike in December. Internationally, concerns over Brexit—the term used to represent Britain’s decision to leave the European Union—remained in the spotlight.
Equity markets in the US were firmly in positive territory at the end of the reporting period, as US stocks posted strong gains. European stocks struggled earlier, but found some traction in the third quarter. Asian markets also advanced, and emerging markets rose sharply.
US fixed income markets experienced overall gains. High yield bonds posted very strong results. Corporate bonds and Treasuries also performed well. Accommodative monetary policy by central banks helped lift global bond markets.
Given the uncertainty in today’s investment environment, we believe that active professional portfolio management offers a potential advantage. Active managers often have the knowledge and flexibility to find the best investment opportunities in the most challenging markets.
Even so, it’s best if investment decisions are based on your long-term goals rather than on short-term market and economic developments. We also encourage you to work with an experienced financial advisor who can help you set goals, determine your tolerance for risk, build a diversified plan that’s right for you, and make adjustments when necessary.
By having Prudential Investments help you address your goals, you gain the advantage of asset managers that also manage money for many major corporations and pension funds around the world. That means you benefit from the same expertise, innovation, and attention to risk demanded by today’s most sophisticated investors.
Thank you for choosing our family of funds.
Sincerely,

Stuart S. Parker, President
Prudential Absolute Return Bond Fund
December 15, 2016
| | | | |
| Prudential Absolute Return Bond Fund | | | 3 | |
Your Fund’s Performance (unaudited)
Performance data quoted represent past performance. Past performance does not guarantee future results. The investment return and principal value of an investment will fluctuate, so that an investor’s shares, when redeemed, may be worth more or less than their original cost. Current performance may be lower or higher than the past performance data quoted. An investor may obtain performance data as of the most recent month-end by visiting our website at www.prudentialfunds.com or by calling (800) 225-1852.
| | | | | | | | | | |
| Cumulative Total Returns (Without Sales Charges) as of 10/31/16 | |
| | One Year (%) | | | Five Years (%) | | | | Since Inception (%) | |
| Class A | | 3.36 | | | 13.23 | | | | 11.79 (3/30/11) | |
| Class C | | 2.59 | | | 9.23 | | | | 7.34 (3/30/11) | |
| Class Q | | 3.70 | | | 15.11 | | | | 13.85 (3/30/11) | |
| Class Z | | 3.60 | | | 14.79 | | | | 13.48 (3/30/11) | |
BofAML USD LIBOR 3-Month
CM Index | | 0.54 | | | 1.85 | | | | 2.00 | |
| Lipper Alternative Credit Focus Funds Average | | 3.39 | | | 13.66 | | | | 13.33 | |
| | | | | | | | | | |
| Average Annual Total Returns (With Sales Charges) as of 9/30/16 | |
| | One Year (%) | | | Five Years (%) | | | | Since Inception (%) | |
| Class A | | –0.53 | | | 2.00 | | | | 1.17 (3/30/11) | |
| Class C | | 2.37 | | | 2.18 | | | | 1.28 (3/30/11) | |
| Class Q | | 4.38 | | | 3.26 | | | | 2.35 (3/30/11) | |
| Class Z | | 4.40 | | | 3.20 | | | | 2.29 (3/30/11) | |
BofAML USD LIBOR 3-Month
CM Index | | 0.49 | | | 0.36 | | | | 0.35 | |
| Lipper Alternative Credit Focus Funds Average | | 3.75 | | | 2.74 | | | | 2.22 | |
| | | | | | | | | | |
| Average Annual Total Returns (With Sales Charges) as of 10/31/16 | |
| | One Year (%) | | | Five Years (%) | | | | Since Inception (%) | |
| Class A | | –1.30 | | | 1.58 | | | | 1.18 (3/30/11) | |
| Class C | | 1.59 | | | 1.78 | | | | 1.27 (3/30/11) | |
| Class Q | | 3.70 | | | 2.85 | | | | 2.35 (3/30/11) | |
| Class Z | | 3.60 | | | 2.80 | | | | 2.29 (3/30/11) | |
| | |
| 4 | | Visit our website at prudentialfunds.com |
| | | | | | |
| Average Annual Total Returns (Without Sales Charges) as of 10/31/16 |
| | One Year (%) | | Five Years (%) | | Since Inception (%) |
| Class A | | 3.36 | | 2.52 | | 2.01 (3/30/11) |
| Class C | | 2.59 | | 1.78 | | 1.27 (3/30/11) |
| Class Q | | 3.70 | | 2.85 | | 2.35 (3/30/11) |
| Class Z | | 3.60 | | 2.80 | | 2.29 (3/30/11) |
Source: Prudential Investments LLC and Lipper Inc.
Inception returns are provided for any share class with less than 10 calendar years of returns.
Growth of a $10,000 Investment
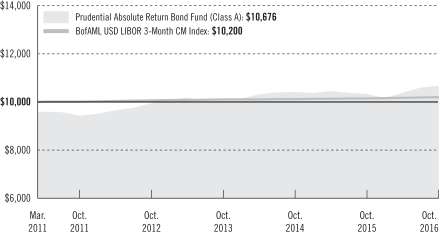
The graph compares a $10,000 investment in the Prudential Absolute Return Bond Fund (Class A shares) with a similar investment in the BofAML USD LIBOR 3-Month CM Index by portraying the initial account values at the commencement of operations for Class A shares (March 30, 2011) and the account values at the end of the current fiscal year (October 31, 2016) as measured on a quarterly basis. For purposes of the graph, and unless otherwise indicated, it has been assumed that (a) the maximum applicable front-end sales charge was deducted from the initial $10,000 investment in Class A shares; (b) all recurring fees (including management fees) were deducted; and (c) all dividends and distributions were reinvested. The line graph provides information for Class A shares only. As indicated in the tables provided earlier, performance for Class C, Class Q, and Class Z shares will vary due to the differing charges and expenses applicable to each share class (as indicated in the
| | | | |
| Prudential Absolute Return Bond Fund | | | 5 | |
Your Fund’s Performance (continued)
following paragraphs). Without waiver of fees and/or expense reimbursement, if any, the Fund’s returns would have been lower.
Past performance does not predict future performance. Total returns and the ending account values in the graph include changes in share price and reinvestment of dividends and capital gains distributions in a hypothetical investment for the periods shown. The Fund’s total returns do not reflect the deduction of income taxes on an individual’s investment. Taxes may reduce your actual investment returns on income or gains paid by the Fund or any gains you may realize if you sell your shares.
The returns in the tables do not reflect the deduction of taxes that a shareholder would pay on Fund distributions or following the redemption of Fund shares. The average annual total returns take into account applicable sales charges, which are described for each share class in the table below.
| | | | | | | | |
| | | Class A | | Class C | | Class Q | | Class Z |
| Maximum initial sales charge | | 4.50% of the public offering
price | | None | | None | | None |
| Contingent deferred sales charge (CDSC) (as a percentage of the lower of original purchase price or net asset value at redemption) | | 1% on sales of $1 million or more made within 12 months of purchase | | 1% on sales made within 12 months of purchase | | None | | None |
| Annual distribution and service (12b-1) fees (shown as a percentage of average daily net assets) | | .25%
| | 1% | | None | | None |
Benchmark Definitions
BofAML USD LIBOR 3-Month CM Index—The Bank of America Merrill Lynch US Dollar LIBOR 3-Month Constant Maturity Index (BofAML USD LIBOR 3-Month CM Index) is an unmanaged index that tracks the performance of a synthetic asset paying LIBOR to a stated maturity. The Index is based on the assumed purchase at par of a synthetic instrument having exactly its stated maturity and with a coupon equal to that current day fixing rate. That issue is assumed to be sold the following business day (priced at a yield equal to the current day fixing rate) and rolled into a new instrument.
Lipper Alternative Credit Focus Funds Average—The Lipper Alternative Credit Focus Funds Average (Lipper Average) is based on the average return of all funds in the Lipper Alternative Credit Focus Funds category for the periods noted. Funds in the Lipper Average are funds that, by prospectus language, invest in a wide range of credit-structured vehicles by using either fundamental credit research analysis or quantitative credit portfolio modeling trying to benefit from any changes in credit quality, credit spreads, and market liquidity.
Investors cannot invest directly in an index or average. The returns for the Index would be lower if they included the effects of sales charges, operating expenses of a mutual fund, or taxes. Returns for the Lipper
| | |
| 6 | | Visit our website at prudentialfunds.com |
Average reflect the deduction of operating expenses of a mutual fund, but not sales charges or taxes. The Since Inception returns for the Index and the Lipper Average are measured from the closest month-end to the inception date for the indicated share class.
| | | | | | |
| Distributions and Yields as of 10/31/16 | | | | |
| | Total Distributions
Paid for
12 Months ($) | | SEC 30-Day
Subsidized
Yield* (%) | | SEC 30-Day
Unsubsidized
Yield** (%) |
| Class A | | 0.20 | | 2.20 | | 2.19 |
| Class C | | 0.13 | | 1.55 | | 1.54 |
| Class Q | | 0.23 | | 2.68 | | 2.68 |
| Class Z | | 0.23 | | 2.54 | | 2.53 |
*SEC 30-Day Subsidized Yield (%)—A standardized yield calculation created by the Securities and Exchange Commission, it reflects the income earned during a 30-day period, after the deduction of the Fund’s net expenses (net of any expense waivers or reimbursements).
**SEC 30-Day Unsubsidized Yield (%)—A standardized yield calculation created by the Securities and Exchange Commission, it reflects the income earned during a 30-day period, after the deduction of the Fund’s gross expenses.
| | | | |
| Credit Quality expressed as a percentage of total investments as of 10/31/16 (%) | | | |
| AAA | | | 20.8 | |
| AA | | | 6.2 | |
| A | | | 6.9 | |
| BBB | | | 17.0 | |
| BB | | | 25.7 | |
| B | | | 9.2 | |
| CCC | | | 0.3 | |
| C | | | 0.2 | |
| Not Rated | | | 5.6 | |
| Cash/Cash Equivalents | | | 8.1 | |
| Total Investments | | | 100.0 | |
Source: PGIM, Inc.
Credit ratings reflect the highest rating assigned by a nationally recognized statistical rating organization (NRSRO) such as Moody’s Investor Service, Inc. (Moody’s), Standard & Poor’s (S&P), or Fitch, Inc. (Fitch). Credit ratings reflect the common nomenclature used by both S&P and Fitch. Where applicable, ratings are converted to the comparable S&P/Fitch rating tier nomenclature. These rating agencies are independent and are widely used. The Not Rated category consists of securities that have not been rated by a NRSRO. Credit ratings are subject to change. Values may not sum to 100.0% due to rounding.
| | | | |
| Prudential Absolute Return Bond Fund | | | 7 | |
Strategy and Performance Overview
How did the Fund perform?
The Prudential Absolute Return Bond Fund’s Class A shares returned 3.36% for the 12-month period ended October 31, 2016, outperforming the 0.54% gain of the BofAML USD LIBOR 3-Month CM Index (the Index). The Fund performed nearly in line with the 3.39% return of the Lipper Alternative Credit Focus Funds Average.
What were market conditions?
| • | | In the fourth quarter of 2015, the fixed income markets reflected investor uncertainty about weaker global economic growth, the Federal Reserve’s (Fed) rate hiking schedule, record new issuance, and steep declines in energy and commodity prices. In December, the Fed raised the federal funds target rate by 0.25% to a range between 0.25% and 0.50% and said it was likely to raise short-term interest rates four times during 2016. |
| • | | The first quarter of 2016 was a tale in two parts. At the beginning of the quarter, risk aversion increased amid deteriorating economic data in developed and emerging markets countries, a further drop in commodity prices, and heightened volatility in global financial markets. By March, investor sentiment had improved, commodity prices had regained some ground, and the number of negative economic surprises had diminished. At its March policy meeting, the Fed adopted a more dovish tone, suggesting it would hike rates only two times in 2016 although its forecasts for US economic growth, inflation, and unemployment were little changed from December. (A dovish tone tends to imply lower interest rates.) |
| • | | During the second quarter, fears about the global economy receded in the face of considerable stimulus by China’s policymakers, stronger-than-anticipated first-quarter European economic growth, and signs that the Japanese economy was doing somewhat better than expected. In late June, the UK’s surprise vote to leave the European Union, commonly known as “Brexit,” briefly increased market volatility. The Fed left short-term rates unchanged, with some policymakers suggesting there would be just a single rate hike in 2016. Ongoing stimulus by global central banks drove down interest rates around the world. |
| • | | In the third quarter, global central bank monetary policy remained accommodative, providing support to the fixed income markets. Credit spreads (differences in yields between corporate bonds and US Treasury securities of comparable maturity) narrowed amid stability in energy prices as well as a general search for yield in the low-interest-rate environment. |
| • | | During October, US economic conditions improved, indicating the Fed might raise rates at its December policy meeting. US employment increased and hourly wages accelerated, while the unemployment rate ticked down. The third quarter US gross domestic product (GDP) grew at an annual rate of 2.9%, rebounding from three consecutive quarters of weak growth. |
| | |
| 8 | | Visit our website at prudentialfunds.com |
What worked?
| • | | Sector allocations added most to the Fund’s relative performance, highlighted by overweight positions in spread sectors, including high yield corporate bonds, investment-grade corporate bonds, emerging markets debt, bank loans, and commercial mortgage-backed securities (CMBS). Spread sectors are types of debt securities that provide extra yield (spread) over similar-duration US Treasury securities to compensate for the greater credit risk associated with investing in them. |
| • | | The Fund also benefited from effective security selection, led by its holdings of interest rate swaps, non-agency mortgage-backed securities, collateralized loan obligations, investment-grade corporate bonds, and emerging markets debt. |
| • | | The Fund employs an absolute return strategy that seeks to mitigate (or even eliminate) interest rate risk when appropriate. During the reporting period, the Fund benefited from its strategy to manage duration, which is a measure of the interest rate sensitivity of a bond portfolio or debt securities that is expressed as a number of years. The Fund maintains an overall duration less than plus/minus three years. The more duration the Fund has versus the benchmark, the greater the potential risk and reward when interest rates move. The Fund had a long duration bias for most of the period, which allowed it to benefit from falling US and global interest rates. The Fund’s active long duration positioning ranged from 0.0 to +1.2 years, ending the period at the longer end of that range at +1.0 years. |
| • | | Also contributing positively was the Fund’s positioning for flatter yield curves. Yield curves are single line graphs that illustrate the relationship between the yields and maturities of fixed income securities. They are created by plotting the yields of different maturities for the same type of bonds. |
What didn’t work?
| • | | Currency positioning detracted from results during the reporting period. More specifically, the Fund was negatively impacted by its overweight in the US dollar relative to its modest exposure to non-US dollar currencies (accomplished through a diversified basket of currencies from faster-growing emerging markets and developed markets countries). |
| • | | In addition, security selection among high yield corporate bonds and positioning in US Treasuries hurt the Fund’s relative performance. |
Did the Fund use derivatives and how did they affect performance?
| • | | The Fund uses derivatives when they facilitate implementation of the overall investment approach. |
| • | | During the reporting period, the Fund used interest rate futures and swaps to help manage US and global duration and yield curve exposure. These positions added to performance. |
| | | | |
| Prudential Absolute Return Bond Fund | | | 9 | |
Strategy and Performance Overview (continued)
| • | | The Fund also traded foreign exchange derivatives, which hurt performance during the period. |
Current outlook
| • | | Because of PGIM Fixed Income’s positive view of bond market fundamentals, the Fund remains overweight in high yield corporate bonds, bank loans, investment-grade corporate bonds, emerging markets debt, CMBS, and asset-backed securities. |
| • | | Among investment-grade corporate bonds, PGIM Fixed Income continues to favor US money center banks given past federal government regulation significantly reducing credit risk and bolstered by third-quarter earnings which were generally solid. As higher-quality industrial companies continue to take on debt and consolidation remains a concern, PGIM Fixed Income is focusing on names for which such an “event” has passed. The Fund is generally biased toward US-centric issuers rather than multinational companies or exporters, which could be vulnerable to a strong US dollar and weaker global growth. |
| • | | Regarding high yield corporate bonds, PGIM Fixed Income believes demand for the asset class continues to be supported by a thirst for yield amid low interest rates. Outside the energy and basic materials sectors, default rates are expected to remain benign through 2018. Mergers and acquisitions, which have generally been positive for high yield credits, may increase during a Republican administration. |
| • | | As credit spreads in the credit card and automobile sectors remain tight, PGIM Fixed Income sees compelling relative value in the wider spreads of fundamentally sound non-Index sectors, such as unsecured consumer loan senior debt and auto fixed-rate revolving senior debt. |
| • | | Within CMBS, PGIM Fixed Income expects new issue supply to remain heavy in November in advance of the winter holidays and the risk retention rules which will be implemented on December 24th, and it continues to find value in high-quality securities of new-issue conduit deals. (Conduit deals are collateralized by a pool of approximately 50 to 100 fixed rate commercial mortgage loans that are fairly well diversified by loan size, geographic location, and property type.) |
| • | | The Fund maintained underweights in government-related sectors, including US Treasuries, agency bonds, and agency mortgage-backed securities, at the end of the period. |
| | |
| 10 | | Visit our website at prudentialfunds.com |
Fees and Expenses (unaudited)
As a shareholder of the Fund, you incur two types of costs: (1) transaction costs, including sales charges (loads) on purchase payments and redemptions, as applicable, and (2) ongoing costs, including management fees, distribution and/or service (12b-1) fees, and other Fund expenses, as applicable. This example is intended to help you understand your ongoing costs (in dollars) of investing in the Fund and to compare these costs with the ongoing costs of investing in other mutual funds.
The example is based on an investment of $1,000 invested on May 1, 2016, at the beginning of the period, and held through the six-month period ended October 31, 2016. The example is for illustrative purposes only; you should consult the Prospectus for information on initial and subsequent minimum investment requirements.
Actual Expenses
The first line for each share class in the table on the following page provides information about actual account values and actual expenses. You may use the information on this line, together with the amount you invested, to estimate the expenses that you paid over the period. Simply divide your account value by $1,000 (for example, an $8,600 account value ÷ $1,000 = 8.6), then multiply the result by the number on the first line under the heading “Expenses Paid During the Six-Month Period” to estimate the expenses you paid on your account during this period.
Hypothetical Example for Comparison Purposes
The second line for each share class in the table on the following page provides information about hypothetical account values and hypothetical expenses based on the Fund’s actual expense ratio and an assumed rate of return of 5% per year before expenses, which is not the Fund’s actual return. The hypothetical account values and expenses may not be used to estimate the actual ending account balance or expenses you paid for the period. You may use this information to compare the ongoing costs of investing in the Fund and other funds. To do so, compare this 5% hypothetical example with the 5% hypothetical examples that appear in the shareholder reports of the other funds.
The Fund’s transfer agent may charge additional fees to holders of certain accounts that are not included in the expenses shown in the table on the following page. These fees apply to individual retirement accounts (IRAs) and Section 403(b) accounts. As of the close of the six-month period covered by the table, IRA fees included an annual maintenance fee of $15 per account (subject to a maximum annual maintenance fee of $25 for all accounts held by the same shareholder). Section 403(b) accounts are charged an annual $25 fiduciary maintenance fee. Some of the fees may vary in amount, or may be waived, based on your total account balance or the number of Prudential Investments funds, including the Fund, that you own. You should consider the additional fees that were charged to your
| | | | |
| Prudential Absolute Return Bond Fund | | | 11 | |
Fees and Expenses (continued)
Fund account over the six-month period when you estimate the total ongoing expenses paid over the period and the impact of these fees on your ending account value, as these additional expenses are not reflected in the information provided in the expense table. Additional fees have the effect of reducing investment returns.
Please note that the expenses shown in the table are meant to highlight your ongoing costs only and do not reflect any transactional costs such as sales charges (loads). Therefore, the second line for each share class in the table is useful in comparing ongoing costs only and will not help you determine the relative total costs of owning different funds. In addition, if these transactional costs were included, your costs would have been higher.
| | | | | | | | | | | | | | | | | | |
Prudential Absolute
Return Bond Fund | | Beginning Account
Value
May 1, 2016 | | | Ending Account
Value
October 31, 2016 | | | Annualized
Expense Ratio
Based on the
Six-Month Period | | | Expenses Paid
During the
Six-Month Period* | |
| Class A | | Actual | | $ | 1,000.00 | | | $ | 1,027.90 | | | | 1.15 | % | | $ | 5.86 | |
| | Hypothetical | | $ | 1,000.00 | | | $ | 1,019.36 | | | | 1.15 | % | | $ | 5.84 | |
| Class C | | Actual | | $ | 1,000.00 | | | $ | 1,024.10 | | | | 1.90 | % | | $ | 9.67 | |
| | Hypothetical | | $ | 1,000.00 | | | $ | 1,015.58 | | | | 1.90 | % | | $ | 9.63 | |
| Class Q | | Actual | | $ | 1,000.00 | | | $ | 1,029.80 | | | | 0.83 | % | | $ | 4.23 | |
| | Hypothetical | | $ | 1,000.00 | | | $ | 1,020.96 | | | | 0.83 | % | | $ | 4.22 | |
| Class Z | | Actual | | $ | 1,000.00 | | | $ | 1,029.10 | | | | 0.90 | % | | $ | 4.59 | |
| | | Hypothetical | | $ | 1,000.00 | | | $ | 1,020.61 | | | | 0.90 | % | | $ | 4.57 | |
*Fund expenses (net of fee waivers or subsidies, if any) for each share class are equal to the annualized expense ratio for each share class (provided in the table), multiplied by the average account value over the period, multiplied by the 184 days in the six-month period ended October 31, 2016, and divided by the 366 days in the Fund’s fiscal year ended October 31, 2016 (to reflect the six-month period). Expenses presented in the table include the expenses of any underlying portfolios in which the Fund may invest.
| | |
| 12 | | Visit our website at prudentialfunds.com |
The Fund’s annual expense ratios for the 12-month period ended October 31, 2016, are as follows:
| | | | |
| Class | | Gross Operating Expenses (%) | | Net Operating Expenses (%) |
| A | | 1.24 | | 1.15 |
| C | | 1.99 | | 1.90 |
| Q | | 0.84 | | 0.84 |
| Z | | 0.99 | | 0.90 |
Net operating expenses shown above reflect any fee waivers and/or expense reimbursements. Additional information on Fund expenses and any fee waivers and/or expense reimbursements can be found in the “Financial Highlights” tables in this report and in the Notes to the Financial Statements in this report.
| | | | |
| Prudential Absolute Return Bond Fund | | | 13 | |
Portfolio of Investments
as of October 31, 2016
| | | | | | | | | | | | | | | | |
| Description | | Interest
Rate | | | Maturity
Date | | | Principal
Amount (000)# | | | Value (Note 1) | |
LONG-TERM INVESTMENTS 94.8% | |
|
ASSET-BACKED SECURITIES 32.9% | |
|
Collateralized Debt Obligation 0.1% | |
Landmark VIII CDO Ltd. (Cayman Islands), Series 2006-8A, Class A2, 144A | | | 1.208 | %(a) | | | 10/19/20 | | | | 2,500 | | | $ | 2,482,441 | |
|
Collateralized Loan Obligations 17.6% | |
A Voce CLO Ltd. (Cayman Islands), Series 2014-1A, Class A1A, 144A | | | 2.330 | (a) | | | 07/15/26 | | | | 13,250 | | | | 13,178,957 | |
ACAS CLO Ltd. (Cayman Islands), Series 2013-1A, Class A, 144A | | | 2.061 | (a) | | | 04/20/25 | | | | 6,050 | | | | 6,027,420 | |
AIMCO CLO (Cayman Islands), | | | | | | | | | | | | | | | | |
Series 2014-AA, Class B1, 144A | | | 2.881 | (a) | | | 07/20/26 | | | | 5,000 | | | | 5,010,179 | |
Series 2014-AA, Class B2, 144A | | | 4.580 | | | | 07/20/26 | | | | 1,000 | | | | 988,700 | |
Anchorage Capital CLO Ltd. (Cayman Islands), Series 2014-5A, Class A, 144A | | | 2.480 | (a) | | | 10/15/26 | | | | 9,750 | | | | 9,760,464 | |
Atlas Senior Loan Fund CLO Ltd. (Cayman Islands), Series 2014-6A, Class A, 144A | | | 2.420 | (a) | | | 10/15/26 | | | | 250 | | | | 251,242 | |
Babson CLO Ltd. (Cayman Islands), Series 2013-IA, Class A, 144A | | | 1.981 | (a) | | | 04/20/25 | | | | 2,070 | | | | 2,061,144 | |
Battalion CLO IV Ltd. (Cayman Islands), Series 2013-4A, Class A1, 144A | | | 2.282 | (a) | | | 10/22/25 | | | | 5,450 | | | | 5,454,303 | |
Battalion CLO VII Ltd. (Cayman Islands), Series 2014-7A, Class A1, 144A | | | 2.480 | (a) | | | 10/17/26 | | | | 12,500 | | | | 12,492,877 | |
Battalion CLO VIII Ltd. (Cayman Islands), Series 2015-8A, Class A1, 144A | | | 2.412 | (a) | | | 04/18/27 | | | | 12,500 | | | | 12,490,460 | |
Benefit Street Partners CLO II Ltd. (Cayman Islands), Series 2013-IIA, Class A2B, 144A | | | 3.339 | | | | 07/15/24 | | | | 10,000 | | | | 10,006,085 | |
Brookside Mill CLO Ltd. (Cayman Islands), Series 2013-1A, Class A1, 144A | | | 2.030 | (a) | | | 04/17/25 | | | | 10,300 | | | | 10,250,706 | |
Series 2013-1A, Class B1, 144A | | | 2.630 | (a) | | | 04/17/25 | | | | 5,250 | | | | 5,202,769 | |
Series 2013-1A, Class B2, 144A | | | 3.020 | | | | 04/17/25 | | | | 6,200 | | | | 5,999,400 | |
Cavalry CLO II (Cayman Islands), Series 2013-2A, Class A, 144A | | | 2.230 | (a) | | | 01/17/24 | | | | 4,200 | | | | 4,197,264 | |
ECP CLO Ltd. (Cayman Islands), Series 2014-6A, Class A1A, 144A | | | 2.330 | (a) | | | 07/15/26 | | | | 7,600 | | | | 7,584,541 | |
Flatiron CLO Ltd. (Cayman Islands), Series 2013-1A, Class A1, 144A | | | 2.280 | (a) | | | 01/17/26 | | | | 4,500 | | | | 4,497,852 | |
ICG US CLO Ltd. (Cayman Islands), Series 2014-3A, Class A1B, 144A | | | 3.280 | | | | 01/25/27 | | | | 11,000 | | | | 10,895,177 | |
See Notes to Financial Statements.
| | | | |
| Prudential Absolute Return Bond Fund | | | 15 | |
Portfolio of Investments (continued)
as of October 31, 2016
| | | | | | | | | | | | | | | | |
| Description | | Interest
Rate | | | Maturity
Date | | | Principal
Amount (000)# | | | Value (Note 1) | |
ASSET-BACKED SECURITIES (Continued) | |
|
Collateralized Loan Obligations (cont’d.) | |
ING Investment Management CLO Ltd. (Cayman Islands), | | | | | | | | | | | | | | | | |
Series 2013-1A, Class A1, 144A | | | 2.020 | %(a) | | | 04/15/24 | | | | 1,600 | | | $ | 1,592,032 | |
Series 2013-2A, Class A1, 144A | | | 2.032 | (a) | | | 04/25/25 | | | | 1,000 | | | | 996,551 | |
Series 2013-2A, Class A2B, 144A | | | 3.070 | | | | 04/25/25 | | | | 2,000 | | | | 1,999,017 | |
Jackson Mill CLO Ltd. (Cayman Islands), Series 2015-1A, Class A, 144A | | | 2.420 | (a) | | | 04/15/27 | | | | 12,000 | | | | 12,000,842 | |
KVK CLO Ltd. (Cayman Islands), Series 2014-3A, Class B, 144A | | | 2.980 | (a) | | | 10/15/26 | | | | 7,250 | | | | 7,186,784 | |
Limerock CLO II Ltd. (Cayman Islands), Series 2014-2A, Class A, 144A | | | 2.382 | (a) | | | 04/18/26 | | | | 2,000 | | | | 2,000,110 | |
Magnetite IX CLO Ltd. (Cayman Islands), Series 2014-9A, Class A1, 144A(b) | | | 2.302 | (a) | | | 07/25/26 | | | | 1,000 | | | | 1,000,144 | |
Ocean Trails CLO IV (Cayman Islands), Series 2013-4A, Class A, 144A | | | 2.117 | (a) | | | 08/13/25 | | | | 9,900 | | | | 9,883,667 | |
OneMain Financial Issuance Trust, | | | | | | | | | | | | | | | | |
Series 2014-2A, Class C, 144A | | | 4.330 | | | | 09/18/24 | | | | 8,000 | | | | 7,970,878 | |
Series 2015-1A, Class B, 144A | | | 3.850 | | | | 03/18/26 | | | | 2,000 | | | | 2,016,875 | |
Series 2015-2A, Class B, 144A(b) | | | 3.100 | | | | 07/18/25 | | | | 5,246 | | | | 5,222,457 | |
Oportun Funding IV LLC, Series 2016-C, Class B, 144A | | | 4.850 | | | | 11/08/21 | | | | 6,665 | | | | 6,665,533 | |
Palmer Square CLO Ltd. (Cayman Islands), Series 2015-2A, Class A1A, 144A | | | 2.381 | (a) | | | 07/20/27 | | | | 12,000 | | | | 12,021,136 | |
Race Point VIII CLO Ltd. (Cayman Islands), Series 2013-8A, Class A, 144A | | | 2.061 | (a) | | | 02/20/25 | | | | 1,000 | | | | 998,759 | |
Regatta III Funding Ltd. (Cayman Islands), Series 2014-1A, Class A1A, 144A | | | 2.400 | (a) | | | 04/15/26 | | | | 1,500 | | | | 1,507,623 | |
Shackleton VI CLO Ltd. (Cayman Islands), Series 2014-6A, Class A1, 144A | | | 2.360 | (a) | | | 07/17/26 | | | | 19,500 | | | | 19,523,230 | |
Sheridan Square CLO Ltd. (Cayman Islands), Series 2013-1A, Class A1, 144A | | | 1.930 | (a) | | | 04/15/25 | | | | 10,400 | | | | 10,296,462 | |
Silver Spring CLO Ltd. (Cayman Islands), Series 2014-1A, Class A, 144A | | | 2.330 | (a) | | | 10/15/26 | | | | 2,729 | | | | 2,713,022 | |
Sound Point CLO Ltd. (Cayman Islands), Series 2012-1A, Class B, 144A | | | 3.581 | (a) | | | 10/20/23 | | | | 550 | | | | 551,098 | |
THL Credit Wind River CLO Ltd. (Cayman Islands), Series 2013-2A, Class A1, 144A | | | 2.332 | (a) | | | 01/18/26 | | | | 4,750 | | | | 4,758,907 | |
Vibrant CLO Ltd. (Cayman Islands), Series 2015-3A, Class A1, 144A | | | 2.511 | (a) | | | 04/20/26 | | | | 28,000 | | | | 28,139,174 | |
| | | | | | | | | | | | | | | | |
| | | | 265,393,841 | |
| | | | | | | | | | | | | | | | |
See Notes to Financial Statements.
| | | | | | | | | | | | | | | | |
| Description | | Interest
Rate | | | Maturity
Date | | | Principal
Amount (000)# | | | Value (Note 1) | |
ASSET-BACKED SECURITIES (Continued) | |
|
Non-Residential Mortgage-Backed Securities 2.8% | |
Highbridge Loan Management Ltd. (Cayman Islands), Series 2015-6A, Class A, 144A | | | 2.228 | %(a) | | | 05/05/27 | | | | 15,250 | | | $ | 15,232,463 | |
OZLM Funding IV Ltd. (Cayman Islands), Series 2013-4A, Class A1, 144A(b) | | | 2.032 | (a) | | | 07/22/25 | | | | 4,200 | | | | 4,185,430 | |
Sierra Timeshare Receivables Funding LLC, Series 2012-3A, Class A, 144A | | | 1.870 | | | | 08/20/29 | | | | 150 | | | | 149,380 | |
Slater Mill Loan Fund LP (Cayman Islands), Series 2012-1A, Class B, 144A | | | 3.454 | (a) | | | 08/17/22 | | | | 250 | | | | 249,611 | |
Springleaf Funding Trust, | | | | | | | | | | | | | | | | |
Series 2015-AA, Class A, 144A | | | 3.160 | | | | 11/15/24 | | | | 12,930 | | | | 13,057,676 | |
Series 2015-AA, Class B, 144A | | | 3.620 | | | | 11/15/24 | | | | 3,430 | | | | 3,438,352 | |
Series 2015-AA, Class C, 144A | | | 5.040 | | | | 11/15/24 | | | | 6,000 | | | | 5,907,054 | |
| | | | | | | | | | | | | | | | |
| | | | 42,219,966 | |
| | | | | | | | | | | | | | | | |
|
Residential Mortgage-Backed Securities 12.4% | |
Accredited Mortgage Loan Trust, | | | | | | | | | | | | | | | | |
Series 2004-3, Class 2A2 | | | 1.734 | (a) | | | 10/25/34 | | | | 4,030 | | | | 4,013,798 | |
Series 2004-3, Class 2A5 | | | 1.614 | (a) | | | 10/25/34 | | | | 2,079 | | | | 1,994,053 | |
Series 2005-3, Class M1 | | | 0.980 | (a) | | | 09/25/35 | | | | 1,452 | | | | 1,435,842 | |
ACE Securities Corp. Home Equity Loan Trust, Series 2004-FM1, Class M1 | | | 1.434 | (a) | | | 09/25/33 | | | | 548 | | | | 513,784 | |
Ameriquest Mortgage Securities, Inc., Asset-Backed Pass-Through Certificates, | | | | | | | | | | | | | | | | |
Series 2003-1, Class M1 | | | 1.884 | (a) | | | 02/25/33 | | | | 1,985 | | | | 1,888,298 | |
Series 2003-10, Class AV1 | | | 1.294 | (a) | | | 12/25/33 | | | | 4,063 | | | | 3,954,530 | |
Series 2005-R10, Class A2C | | | 0.864 | (a) | | | 01/25/36 | | | | 399 | | | | 394,750 | |
Amortizing Residential Collateral Trust, Series 2002-BC8, Class A3 | | | 1.534 | (a) | | | 11/25/32 | | | | 947 | | | | 924,830 | |
Argent Securities, Inc., | | | | | | | | | | | | | | | | |
Series 2003-W5, Class M1 | | | 1.584 | (a) | | | 10/25/33 | | | | 50 | | | | 46,836 | |
Series 2003-W7, Class M1 | | | 1.569 | (a) | | | 03/25/34 | | | | 1,361 | | | | 1,263,547 | |
Argent Securities, Inc., Asset-Backed Pass-Through Certificates, | | | | | | | | | | | | | | | | |
Series 2003-W8, Class M1 | | | 1.584 | (a) | | | 12/25/33 | | | | 938 | | | | 850,954 | |
Series 2003-W9, Class M1 | | | 1.569 | (a) | | | 01/25/34 | | | | 2,284 | | | | 2,137,752 | |
Series 2004-W6, Class AF | | | 4.123 | (a) | | | 05/25/34 | | | | 268 | | | | 271,561 | |
Series 2004-W6, Class AV5 | | | 1.334 | (a) | | | 05/25/34 | | | | 587 | | | | 556,176 | |
Asset Backed Funding Certificates, Series 2004-OPT5, Class A1 | | | 1.234 | (a) | | | 06/25/34 | | | | 1,498 | | | | 1,415,565 | |
Asset-Backed Securities Corp. Home Equity Loan Trust, | | | | | | | | | | | | | | | | |
Series 2003-HE6, Class A2 | | | 1.214 | (a) | | | 11/25/33 | | | | 1,758 | | | | 1,680,584 | |
Series 2003-HE6, Class A3B | | | 1.494 | (a) | | | 11/25/33 | | | | 3,546 | | | | 3,241,816 | |
Series 2004-HE3, Class M1 | | | 1.344 | (a) | | | 06/25/34 | | | | 3,325 | | | | 3,148,287 | |
See Notes to Financial Statements.
| | | | |
| Prudential Absolute Return Bond Fund | | | 17 | |
Portfolio of Investments (continued)
as of October 31, 2016
| | | | | | | | | | | | | | | | |
| Description | | Interest
Rate | | | Maturity
Date | | | Principal
Amount (000)# | | | Value (Note 1) | |
ASSET-BACKED SECURITIES (Continued) | |
|
Residential Mortgage-Backed Securities (cont’d.) | |
Bayview Opportunity Master Fund liib NPL Trust, Series 2015-NPLA, Class A, 144A | | | 3.721 | %(a) | | | 07/28/35 | | | | 9,551 | | | $ | 9,548,556 | |
Bear Stearns Asset-Backed Securities I Trust, | | | | | | | | | | | | | | | | |
Series 2004-FR2, Class M2 | | | 1.554 | (a) | | | 06/25/34 | | | | 1,100 | | | | 1,020,802 | |
Series 2004-HE11, Class M2 | | | 2.109 | (a) | | | 12/25/34 | | | | 4,758 | | | | 4,669,709 | |
Bear Stearns Asset-Backed Securities Trust, | | | | | | | | | | | | | | | | |
Series 2002-2, Class A1 | | | 1.194 | (a) | | | 10/25/32 | | | | 1,614 | | | | 1,580,287 | |
Series 2003-3, Class A2 | | | 1.714 | (a) | | | 06/25/43 | | | | 166 | | | | 159,281 | |
Series 2003-HE1, Class M1 | | | 1.629 | (a) | | | 01/25/34 | | | | 2,418 | | | | 2,360,215 | |
Series 2004-HE5, Class M1 | | | 1.389 | (a) | | | 07/25/34 | | | | 5,039 | | | | 4,834,261 | |
Chase Funding Trust, | | | | | | | | | | | | | | | | |
Series 2002-3, Class 2A1 | | | 1.174 | (a) | | | 08/25/32 | | | | 333 | | | | 303,197 | |
Series 2003-4, Class 1A5 | | | 5.318 | (a) | | | 05/25/33 | | | | 900 | | | | 924,084 | |
Citigroup Mortgage Loan Trust, Inc., | | | | | | | | | | | | | | | | |
Series 2005-OPT1, Class M1 | | | 1.164 | (a) | | | 02/25/35 | | | | 317 | | | | 299,674 | |
Series 2005-WF1, Class A5 | | | 5.010 | (a) | | | 11/25/34 | | | | 136 | | | | 139,563 | |
Countrywide Asset-Backed Certificates, | | | | | | | | | | | | | | | | |
Series 2003-BC4, Class M1 | | | 1.584 | (a) | | | 07/25/33 | | | | 1,161 | | | | 1,104,243 | |
Series 2004-BC4, Class M1 | | | 1.584 | (a) | | | 11/25/34 | | | | 920 | | | | 881,740 | |
Series 2004-1, Class M1 | | | 1.284 | (a) | | | 03/25/34 | | | | 205 | | | | 197,775 | |
Series 2004-3, Class 1A | | | 0.954 | (a) | | | 08/25/34 | | | | 8,662 | | | | 7,853,398 | |
Series 2004-6, Class 1A1 | | | 1.074 | (a) | | | 12/25/34 | | | | 2,362 | | | | 2,241,216 | |
Credit-Based Asset Servicing and Securitization LLC, | | | | | | | | | | | | | | | | |
Series 2003-CB3, Class AF1 | | | 3.379 | (a) | | | 12/25/32 | | | | 187 | | | | 184,001 | |
Series 2003-CB5, Class M1 | | | 1.554 | (a) | | | 11/25/33 | | | | 859 | | | | 820,142 | |
Series 2004-CB1, Class AF1 | | | 4.520 | | | | 10/25/32 | | | | 1,974 | | | | 1,966,329 | |
Finance America Mortgage Loan Trust, | | | | | | | | | | | | | | | | |
Series 2003-1, Class M1 | | | 1.584 | (a) | | | 09/25/33 | | | | 2,492 | | | | 2,333,210 | |
Series 2004-2, Class M1 | | | 1.359 | (a) | | | 08/25/34 | | | | 7,209 | | | | 6,675,358 | |
First Franklin Mortgage Loan Trust, Series 2004-FF5, Class A2 | | | 1.294 | (a) | | | 08/25/34 | | | | 1,532 | | | | 1,433,534 | |
Fremont Home Loan Trust, Series 2004-4, Class M1 | | | 1.329 | (a) | | | 03/25/35 | | | | 2,512 | | | | 2,384,876 | |
GSAMP Trust, | | | | | | | | | | | | | | | | |
Series 2003-HE2, Class A1A, 144A | | | 1.134 | (a) | | | 08/25/33 | | | | 1,130 | | | | 1,054,690 | |
Series 2004-AR1, Class A2B | | | 1.734 | (a) | | | 06/25/34 | | | | 1,422 | | | | 1,406,190 | |
Series 2004-FM1, Class M1 | | | 1.509 | (a) | | | 11/25/33 | | | | 319 | | | | 301,215 | |
Series 2004-FM2, Class M1 | | | 1.284 | (a) | | | 01/25/34 | | | | 2,139 | | | | 2,007,578 | |
Series 2004-NC2, Class A1B | | | 1.434 | (a) | | | 10/25/34 | | | | 1,787 | | | | 1,529,448 | |
Home Equity Asset Trust, | | | | | | | | | | | | | | | | |
Series 2003-6, Class M1 | | | 1.584 | (a) | | | 02/25/34 | | | | 1,354 | | | | 1,292,989 | |
Series 2004-3, Class M1 | | | 1.389 | (a) | | | 08/25/34 | | | | 1,557 | | | | 1,440,808 | |
Series 2004-7, Class A2 | | | 1.374 | (a) | | | 01/25/35 | | | | 1,050 | | | | 1,002,616 | |
See Notes to Financial Statements.
| | | | | | | | | | | | | | | | |
| Description | | Interest
Rate | | | Maturity
Date | | | Principal
Amount (000)# | | | Value (Note 1) | |
ASSET-BACKED SECURITIES (Continued) | |
|
Residential Mortgage-Backed Securities (cont’d.) | |
HSBC Home Equity Loan Trust U.S.A., Series 2007-3, Class A4 | | | 2.026 | %(a) | | | 11/20/36 | | | | 629 | | | $ | 629,138 | |
JPMorgan Mortgage Acquisition Corp., Series 2005-OPT2, Class M1 | | | 0.964 | (a) | | | 12/25/35 | | | | 916 | | | | 903,115 | |
Long Beach Mortgage Loan Trust, Series 2003-4, Class AV1 | | | 1.154 | (a) | | | 08/25/33 | | | | 1,464 | | | | 1,343,241 | |
Series 2004-2, Class A1 | | | 0.974 | (a) | | | 06/25/34 | | | | 985 | | | | 898,080 | |
Mastr Asset-Backed Securities Trust, | | | | | | | | | | | | | | | | |
Series 2003-OPT1, Class M2 | | | 3.309 | (a) | | | 12/25/32 | | | | 1,588 | | | | 1,590,722 | |
Series 2003-WMC2, Class M2 | | | 3.009 | (a) | | | 08/25/33 | | | | 1,158 | | | | 1,140,250 | |
Series 2005-NC1, Class M1 | | | 1.254 | (a) | | | 12/25/34 | | | | 8,247 | | | | 7,651,129 | |
Merrill Lynch Mortgage Investors Trust, Series 2002-HE1, Class A1 | | | 1.534 | (a) | | | 08/25/32 | | | | 3,634 | | | | 3,536,342 | |
Morgan Stanley ABS Capital I, Inc. Trust, | | | | | | | | | | | | | | | | |
Series 2003-HE3, Class M1 | | | 1.554 | (a) | | | 10/25/33 | | | | 4,241 | | | | 4,002,983 | |
Series 2003-NC6, Class M1 | | | 1.734 | (a) | | | 06/25/33 | | | | 807 | | | | 790,408 | |
Series 2003-NC8, Class M1 | | | 1.584 | (a) | | | 09/25/33 | | | | 768 | | | | 734,927 | |
Series 2003-NC10, Class M1 | | | 1.554 | (a) | | | 10/25/33 | | | | 1,043 | | | | 992,645 | |
Series 2004-HE3, Class M1 | | | 1.389 | (a) | | | 03/25/34 | | | | 753 | | | | 720,227 | |
Series 2004-HE4, Class M1 | | | 1.434 | (a) | | | 05/25/34 | | | | 6,266 | | | | 6,010,336 | |
Series 2004-HE5, Class M1 | | | 1.479 | (a) | | | 06/25/34 | | | | 1,052 | | | | 1,001,067 | |
Series 2004-NC3, Class M1 | | | 1.329 | (a) | | | 03/25/34 | | | | 2,610 | | | | 2,454,456 | |
Series 2004-NC5, Class M1 | | | 1.434 | (a) | | | 05/25/34 | | | | 335 | | | | 311,911 | |
Series 2004-NC6, Class M1 | | | 1.434 | (a) | | | 07/25/34 | | | | 2,172 | | | | 2,069,946 | |
Series 2004-OP1, Class M1 | | | 1.404 | (a) | | | 11/25/34 | | | | 1,941 | | | | 1,805,250 | |
Series 2004-WMC1, Class M1 | | | 1.464 | (a) | | | 06/25/34 | | | | 160 | | | | 155,909 | |
Morgan Stanley Home Equity Loan Trust, Series 2006-1, Class A2C | | | 0.864 | (a) | | | 12/25/35 | | | | 234 | | | | 227,878 | |
Option One Mortgage Accep Corp. Asset-Backed Certificates, | | | | | | | | | | | | | | | | |
Series 2003-3, Class A1 | | | 1.114 | (a) | | | 06/25/33 | | | | 1,874 | | | | 1,746,148 | |
Series 2003-4, Class A2 | | | 1.174 | (a) | | | 07/25/33 | | | | 846 | | | | 789,030 | |
Option One Mortgage Loan Trust, | | | | | | | | | | | | | | | | |
Series 2004-1, Class M1 | | | 1.434 | (a) | | | 01/25/34 | | | | 2,018 | | | | 1,865,308 | |
Series 2005-1, Class A4 | | | 1.334 | (a) | | | 02/25/35 | | | | 407 | | | | 405,203 | |
Park Place Securities, Inc., Asset-Backed Pass-Through Certificates, | | | | | | | | | | | | | | | | |
Series 2005-WCH1, Class M3 | | | 1.374 | (a) | | | 01/25/36 | | | | 1,500 | | | | 1,481,417 | |
Series 2005-WCW1, Class M1 | | | 0.984 | (a) | | | 09/25/35 | | | | 1,354 | | | | 1,344,689 | |
RAMP Trust, Series 2005-EFC3, Class M3 | | | 1.024 | (a) | | | 08/25/35 | | | | 1,134 | | | | 1,118,922 | |
RASC Trust, | | | | | | | | | | | | | | | | |
Series 2005-KS3, Class M4 | | | 1.239 | (a) | | | 04/25/35 | | | | 1,325 | | | | 1,320,390 | |
Series 2005-KS11, Class M1 | | | 0.934 | (a) | | | 12/25/35 | | | | 800 | | | | 787,996 | |
See Notes to Financial Statements.
| | | | |
| Prudential Absolute Return Bond Fund | | | 19 | |
Portfolio of Investments (continued)
as of October 31, 2016
| | | | | | | | | | | | | | | | |
| Description | | Interest
Rate | | | Maturity
Date | | | Principal
Amount (000)# | | | Value (Note 1) | |
ASSET-BACKED SECURITIES (Continued) | |
|
Residential Mortgage-Backed Securities (cont’d.) | |
Saxon Asset Securities Trust, | | | | | | | | | | | | | | | | |
Series 2005-3, Class M1 | | | 0.994 | %(a) | | | 11/25/35 | | | | 584 | | | $ | 579,626 | |
Securitized Asset-Backed Receivables LLC Trust, | | | | | | | | | | | | | | | | |
Series 2004-NC1, Class M1 | | | 1.314 | (a) | | | 02/25/34 | | | | 1,501 | | | | 1,411,146 | |
Series 2004-OP1, Class M1 | | | 1.299 | (a) | | | 02/25/34 | | | | 4,967 | | | | 4,647,806 | |
Specialty Underwriting & Residential Finance Trust, | | | | | | | | | | | | | | | | |
Series 2003-BC4, Class M1 | | | 1.434 | (a) | | | 11/25/34 | | | | 1,977 | | | | 1,856,901 | |
Series 2004-BC2, Class M1 | | | 1.359 | (a) | | | 05/25/35 | | | | 2,852 | | | | 2,691,317 | |
Series 2004-BC3, Class M1 | | | 1.464 | (a) | | | 07/25/35 | | | | 1,697 | | | | 1,633,182 | |
Series 2004-BC4, Class A2C | | | 1.514 | (a) | | | 10/25/35 | | | | 1,487 | | | | 1,444,204 | |
Structured Asset Investment Loan Trust, | | | | | | | | | | | | | | | | |
Series 2004-1, Class A3 | | | 1.334 | (a) | | | 02/25/34 | | | | 3,453 | | | | 3,309,483 | |
Series 2004-8, Class A8 | | | 1.534 | (a) | | | 09/25/34 | | | | 2,123 | | | | 2,026,873 | |
Series 2004-BNC1, Class A2 | | | 1.534 | (a) | | | 09/25/34 | | | | 4,010 | | | | 3,890,006 | |
Series 2005-3, Class M2 | | | 1.194 | (a) | | | 04/25/35 | | | | 1,767 | | | | 1,736,770 | |
Structured Asset Securities Corp. Mortgage Loan Trust, | | | | | | | | | | | | | | | | |
Series 2005-WF4, Class M1 | | | 0.934 | (a) | | | 11/25/35 | | | | 68 | | | | 67,391 | |
Volt XLIV LLC, Series 2016-NPL4, Class A1, 144A | | | 4.250 | | | | 04/25/46 | | | | 3,458 | | | | 3,489,786 | |
Volt XXVII LLC, Series 2014-NPL7, Class A1, 144A | | | 3.375 | | | | 08/27/57 | | | | 3,107 | | | | 3,108,377 | |
Volt XXX LLC, Series 2015-NPL1, Class A1, 144A | | | 3.625 | | | | 10/25/57 | | | | 6,384 | | | | 6,385,520 | |
Volt XXXI LLC, Series 2015-NPL2, Class A1, 144A | | | 3.375 | | | | 02/25/55 | | | | 6,065 | | | | 6,081,739 | |
| | | | | | | | | | | | | | | | |
| | | | 187,873,138 | |
| | | | | | | | | | | | | | | | |
TOTAL ASSET-BACKED SECURITIES
(cost $495,619,389) | | | | | | | | | | | | | | | 497,969,386 | |
| | | | | | | | | | | | | | | | |
|
BANK LOANS(a) 2.3% | |
|
Automotive 0.1% | |
Chrysler Group LLC | | | 3.250 | | | | 12/31/18 | | | | 889 | | | | 888,372 | |
|
Brokerage 0.1% | |
LPL Holdings, Inc.(c) | | | 4.250 | | | | 03/29/21 | | | | 1,455 | | | | 1,462,445 | |
|
Capital Goods 0.1% | |
RBS Global, Inc./Rexnord LLC | | | 4.000 | | | | 08/21/20 | | | | 1,733 | | | | 1,734,681 | |
|
Chemicals 0.3% | |
Axalta Coating Systems US Holdings | | | 3.750 | | | | 02/01/20 | | | | 916 | | | | 921,727 | |
CeramTec GmbH (Germany) | | | 3.750 | | | | 08/30/20 | | | EUR | 1,700 | | | | 1,874,348 | |
Macdermid, Inc. | | | 5.000 | | | | 06/07/23 | | | | 869 | | | | 875,446 | |
| | | | | | | | | | | | | | | | |
| | | | 3,671,521 | |
See Notes to Financial Statements.
| | | | | | | | | | | | | | | | |
| Description | | Interest
Rate | | | Maturity
Date | | | Principal
Amount (000)# | | | Value (Note 1) | |
BANK LOANS(a) (Continued) | |
|
Consumer 0.2% | |
Motor Fuel Group (United Kingdom) | | | 5.750 | % | | | 07/15/22 | | | GBP | 3,000 | | | $ | 3,658,246 | |
|
Electric | |
Calpine Construction Finance Co. LP | | | 3.104 | | | | 05/04/20 | | | | 508 | | | | 503,811 | |
|
Food 0.1% | |
Albertsons LLC | | | 4.750 | | | | 06/22/23 | | | | 1,587 | | | | 1,601,584 | |
|
Healthcare & Pharmaceutical 0.7% | |
CHS Community Health Systems, Inc. | | | 3.333 | | | | 01/25/19 | | | | 3,875 | | | | 3,808,156 | |
CHS Community Health Systems, Inc. | | | 3.750 | | | | 12/31/19 | | | | 125 | | | | 118,533 | |
CHS Community Health Systems, Inc. | | | 4.000 | | | | 01/27/21 | | | | 230 | | | | 217,334 | |
CHS Community Health Systems, Inc. | | | 4.083 | | | | 12/31/18 | | | | 1,297 | | | | 1,266,955 | |
Mallinckrodt International Finance (Luxembourg) | | | 3.588 | | | | 03/19/21 | | | | 1,002 | | | | 999,943 | |
Valeant Pharmaceuticals International, Inc. | | | 5.250 | | | | 08/05/20 | | | | 1,940 | | | | 1,936,104 | |
Valeant Pharmaceuticals International, Inc. | | | 5.500 | | | | 04/01/22 | | | | 1,888 | | | | 1,886,364 | |
| | | | | | | | | | | | | | | | |
| | | | 10,233,389 | |
|
Retailers 0.3% | |
Douglas Holding AG (Germany) | | | 4.750 | | | | 08/13/22 | | | EUR | 2,000 | | | | 2,227,894 | |
Euro Garages (United Kingdom) | | | 5.765 | | | | 01/30/23 | | | GBP | 2,100 | | | | 2,507,757 | |
| | | | | | | | | | | | | | | | |
| | | | 4,735,651 | |
|
Technology 0.2% | |
BMC Software Finance, Inc. | | | 5.000 | | | | 09/10/20 | | | | 2,197 | | | | 2,165,695 | |
First Data Corp. | | | 4.274 | | | | 07/08/22 | | | | 225 | | | | 226,500 | |
First Data Corp. | | | 3.524 | | | | 03/24/21 | | | | 103 | | | | 103,351 | |
| | | | | | | | | | | | | | | | |
| | | | 2,495,546 | |
|
Telecommunications | |
SBA Senior Finance II, LLC | | | 3.340 | | | | 03/24/21 | | | | 703 | | | | 703,549 | |
|
Transportation 0.2% | |
XPO Logistics, Inc. | | | 4.250 | | | | 11/01/21 | | | | 2,481 | | | | 2,494,928 | |
| | | | | | | | | | | | | | | | |
TOTAL BANK LOANS
(cost $35,990,898) | | | | 34,183,723 | |
| | | | | | | | | | | | | | | | |
|
COMMERCIAL MORTGAGE-BACKED SECURITIES 4.7% | |
Banc of America Commercial Mortgage Trust,
Series 2007-2, Class A1A | | | 5.586 | (a) | | | 04/10/49 | | | | 1,548 | | | | 1,555,822 | |
Series 2007-5, Class A1A | | | 5.361 | | | | 02/10/51 | | | | 1,897 | | | | 1,944,958 | |
CD Commercial Mortgage Trust,
Series 2007-CD4, Class AMFX | | | 5.366 | (a) | | | 12/11/49 | | | | 8,600 | | | | 8,659,111 | |
See Notes to Financial Statements.
| | | | |
| Prudential Absolute Return Bond Fund | | | 21 | |
Portfolio of Investments (continued)
as of October 31, 2016
| | | | | | | | | | | | | | | | |
| Description | | Interest
Rate | | | Maturity
Date | | | Principal
Amount (000)# | | | Value (Note 1) | |
COMMERCIAL MORTGAGE-BACKED SECURITIES (Continued) | |
COMM Mortgage Trust,
Series 2012-CR1, Class A3 | | | 3.391 | % | | | 05/15/45 | | | | 15 | | | $ | 16,027 | |
Series 2012-CR1, Class XA, IO | | | 2.026 | (a) | | | 05/15/45 | | | | 13,680 | | | | 1,037,114 | |
Series 2013-CR7, Class A3 | | | 2.929 | | | | 03/10/46 | | | | 265 | | | | 273,631 | |
Series 2014-UBS2, Class XB, IO, 144A | | | 0.208 | (a) | | | 03/10/47 | | | | 171,811 | | | | 1,667,134 | |
Series 2015-LC19, Class XB, IO, 144A | | | 0.269 | (a) | | | 02/10/48 | | | | 123,049 | | | | 2,496,209 | |
Commercial Mortgage Loan Trust,
Series 2008-LS1, Class A1A | | | 6.093 | (a) | | | 12/10/49 | | | | 1,164 | | | | 1,201,548 | |
CSAIL Commercial Mortgage Trust,
Series 2015-C1, Class XB, IO | | | 0.256 | (a) | | | 04/15/50 | | | | 66,743 | | | | 1,338,431 | |
FHLMC Multifamily Structured Pass-Through Certificates,
Series K007, Class X1, IO | | | 1.142 | (a) | | | 04/25/20 | | | | 4,928 | | | | 134,231 | |
Series K008, Class X1, IO | | | 1.623 | (a) | | | 06/25/20 | | | | 21,552 | | | | 934,166 | |
Series K010, Class X1, IO | | | 0.307 | (a) | | | 10/25/20 | | | | 21,082 | | | | 148,824 | |
Series K018, Class X1, IO | | | 1.396 | (a) | | | 01/25/22 | | | | 15,924 | | | | 926,876 | |
Series K020, Class X1, IO | | | 1.444 | (a) | | | 05/25/22 | | | | 20,796 | | | | 1,364,700 | |
Series K021, Class X1, IO | | | 1.483 | (a) | | | 06/25/22 | | | | 4,288 | | | | 294,035 | |
Series K025, Class X1, IO | | | 0.885 | (a) | | | 10/25/22 | | | | 95,024 | | | | 4,088,501 | |
Series K055, Class X1, IO | | | 1.369 | (a) | | | 03/25/26 | | | | 46,662 | | | | 4,768,243 | |
Series K710, Class X1, IO | | | 1.760 | (a) | | | 05/25/19 | | | | 466 | �� | | | 16,796 | |
Series K711, Class X1, IO | | | 1.693 | (a) | | | 07/25/19 | | | | 3,812 | | | | 138,025 | |
GS Mortgage Securities Corp. II,
Series 2013-GC10, Class XB, IO, 144A | | | 0.496 | (a) | | | 02/10/46 | | | | 103,126 | | | | 2,992,190 | |
Series 2014-GC20, Class XB, IO | | | 0.338 | (a) | | | 04/10/47 | | | | 28,307 | | | | 857,671 | |
GS Mortgage Securities Trust, | | | | | | | | | | | | | | | | |
Series 2013-GC12, Class XB, IO | | | 0.542 | (a) | | | 06/10/46 | | | | 37,400 | | | | 1,183,598 | |
JPMBB Commercial Mortgage Securities Trust,
Series 2014-C21, Class XB, IO | | | 0.319 | (a) | | | 08/15/47 | | | | 45,056 | | | | 1,079,902 | |
Series 2015-C27, Class XB, IO | | | 0.447 | (a) | | | 02/15/48 | | | | 52,766 | | | | 1,683,061 | |
JPMorgan Chase Commercial Mortgage Securities Trust,
Series 2007-CB20, Class A4 | | | 5.794 | (a) | | | 02/12/51 | | | | 38 | | | | 39,205 | |
Series 2007-LD11, Class A4 | | | 5.755 | (a) | | | 06/15/49 | | | | 1,036 | | | | 1,047,836 | |
Series 2013-LC11, Class XB, IO | | | 0.582 | (a) | | | 04/15/46 | | | | 34,956 | | | | 1,124,833 | |
Morgan Stanley Bank of America Merrill Lynch Trust,
Series 2012-C5, Class XB, IO, 144A | | | 0.239 | (a) | | | 08/15/45 | | | | 65,968 | | | | 925,716 | |
Series 2013-C8, Class XB, IO, 144A | | | 0.497 | (a) | | | 12/15/48 | | | | 68,276 | | | | 1,783,526 | |
Morgan Stanley Capital I Trust,
Series 2007-IQ13, Class A1A | | | 5.312 | | | | 03/15/44 | | | | 140 | | | | 141,037 | |
Series 2007-IQ14, Class AAB | | | 5.654 | (a) | | | 04/15/49 | | | | 6 | | | | 6,490 | |
Series 2015-XLF1, Class B, 144A | | | 2.285 | (a) | | | 08/14/31 | | | | 8,400 | | | | 8,356,821 | |
See Notes to Financial Statements.
| | | | | | | | | | | | | | | | |
| Description | | Interest
Rate | | | Maturity
Date | | | Principal
Amount (000)# | | | Value (Note 1) | |
COMMERCIAL MORTGAGE-BACKED SECURITIES (Continued) | |
UBS-Barclays Commercial Mortgage Trust,
Series 2013-C6, Class XB, IO, 144A | | | 0.402 | %(a) | | | 04/10/46 | | | | 140,883 | | | $ | 3,471,019 | |
Wachovia Bank Commercial Mortgage Trust,
Series 2007-C31, Class A4 | | | 5.509 | | | | 04/15/47 | | | | 1,964 | | | | 1,977,470 | |
Series 2007-C31, Class A5 | | | 5.500 | | | | 04/15/47 | | | | 3,415 | | | | 3,452,915 | |
Series 2007-C32, Class A1A | | | 5.703 | (a) | | | 06/15/49 | | | | 1,922 | | | | 1,947,527 | |
Series 2007-C33, Class A4 | | | 5.959 | (a) | | | 02/15/51 | | | | 172 | | | | 173,287 | |
Series 2007-C34, Class A1A | | | 5.608 | (a) | | | 05/15/46 | | | | 5,274 | | | | 5,386,710 | |
| | | | | | | | | | | | | | | | |
TOTAL COMMERCIAL MORTGAGE-BACKED SECURITIES
(cost $73,467,245) | | | | 70,635,196 | |
| | | | | | | | | | | | | | | | |
|
CORPORATE BONDS 39.4% | |
|
Airlines 0.7% | |
American Airlines, Pass-Through Trust,
Series 2013-1, Class A, Pass Through Certificates(e) | | | 4.000 | | | | 01/15/27 | | | | 3,053 | | | | 3,251,685 | |
Continental Airlines, Inc., Pass-Through Trust,
Series 2007-1, Class A, Pass-Through Certificates | | | 5.983 | | | | 10/19/23 | | | | 920 | | | | 1,037,782 | |
Series 2012-2, Class A, Pass-Through Certificates | | | 4.000 | | | | 04/29/26 | | | | 106 | | | | 113,578 | |
Series 2012-3, Class C, Pass-Through Certificates | | | 6.125 | | | | 04/29/18 | | | | 3,000 | | | | 3,150,000 | |
Delta Air Lines, Inc., Pass-Through Trust,
Series 2007-1, Class A, Pass-Through Certificates | | | 6.821 | | | | 02/10/24 | | | | 759 | | | | 904,515 | |
Series 2011-1, Class A, Pass-Through Certificates | | | 5.300 | | | | 10/15/20 | | | | 68 | | | | 72,365 | |
United Airlines Pass-Through Trust,
Series 2013-1, Class A, Pass-Through Certificates(e)(f) | | | 4.300 | | | | 02/15/27 | | | | 2,210 | | | | 2,398,157 | |
| | | | | | | | | | | | | | | | |
| | | | 10,928,082 | |
|
Auto Manufacturer 0.2% | |
General Motors Co., Sr. Unsec’d. Notes | | | 6.250 | | | | 10/02/43 | | | | 2,230 | | | | 2,553,341 | |
|
Auto Parts & Equipment 1.0% | |
Johnson Controls, Inc., Sr. Unsec’d. Notes | | | 4.250 | | | | 03/01/21 | | | | 3,090 | | | | 3,307,005 | |
Lear Corp.,
Gtd. Notes | | | 5.250 | | | | 01/15/25 | | | | 5,375 | | | | 5,764,687 | |
Gtd. Notes | | | 5.375 | | | | 03/15/24 | | | | 1,410 | | | | 1,506,938 | |
Meritor, Inc., Gtd. Notes(f) | | | 6.250 | | | | 02/15/24 | | | | 4,150 | | | | 4,092,937 | |
| | | | | | | | | | | | | | | | |
| | | | 14,671,567 | |
See Notes to Financial Statements.
| | | | |
| Prudential Absolute Return Bond Fund | | | 23 | |
Portfolio of Investments (continued)
as of October 31, 2016
| | | | | | | | | | | | | | | | |
| Description | | Interest
Rate | | | Maturity
Date | | | Principal
Amount (000)# | | | Value (Note 1) | |
CORPORATE BONDS (Continued) | |
|
Banks 5.6% | |
Bank of America Corp.,
Jr. Sub. Notes(f) | | | 5.125 | %(a) | | | 12/29/49 | | | | 2,175 | | | $ | 2,144,115 | |
Jr. Sub. Notes | | | 6.100 | (a) | | | 12/29/49 | | | | 8,820 | | | | 9,214,783 | |
Sr. Unsec’d. Notes, MTN | | | 5.000 | | | | 01/21/44 | | | | 690 | | | | 790,109 | |
Citigroup, Inc.,
Jr. Sub. Notes | | | 5.950 | (a) | | | 12/29/49 | | | | 12,685 | | | | 13,010,053 | |
Sr. Unsec’d. Notes | | | 8.125 | | | | 07/15/39 | | | | 1,455 | | | | 2,218,908 | |
Sub. Notes | | | 4.050 | | | | 07/30/22 | | | | 550 | | | | 581,303 | |
Credit Suisse Group Funding Guernsey Ltd. (Switzerland), Gtd. Notes | | | 3.800 | | | | 09/15/22 | | | | 1,600 | | | | 1,626,422 | |
Credit Suisse New York (Switzerland), Sr. Unsec’d. Notes, MTN(e) | | | 3.625 | | | | 09/09/24 | | | | 2,375 | | | | 2,463,842 | |
Discover Bank,
Sr. Unsec’d. Notes | | | 4.200 | | | | 08/08/23 | | | | 5,500 | | | | 5,862,929 | |
Sub. Notes | | | 7.000 | | | | 04/15/20 | | | | 800 | | | | 903,443 | |
Goldman Sachs Group, Inc. (The),
Jr. Sub. Notes | | | 5.375 | (a) | | | 12/29/49 | | | | 5,225 | | | | 5,251,125 | |
Sr. Unsec’d. Notes | | | 6.250 | | | | 02/01/41 | | | | 345 | | | | 441,876 | |
Sr. Unsec’d. Notes, MTN | | | 4.800 | | | | 07/08/44 | | | | 2,105 | | | | 2,293,246 | |
JPMorgan Chase & Co.,
Jr. Sub. Notes | | | 5.150 | (a) | | | 12/29/49 | | | | 3,725 | | | | 3,715,688 | |
Jr. Sub. Notes | | | 6.000 | (a) | | | 12/29/49 | | | | 7,707 | | | | 8,034,547 | |
Jr. Sub. Notes | | | 6.100 | (a) | | | 10/29/49 | | | | 3,400 | | | | 3,573,060 | |
Jr. Sub. Notes | | | 7.900 | (a) | | | 12/29/49 | | | | 130 | | | | 133,998 | |
Morgan Stanley,
Jr. Sub. Notes | | | 5.450 | (a) | | | 07/29/49 | �� | | | 13,110 | | | | 13,144,086 | |
Sr. Unsec’d. Notes, MTN | | | 6.375 | | | | 07/24/42 | | | | 700 | | | | 935,183 | |
Sub. Notes, MTN | | | 4.100 | | | | 05/22/23 | | | | 1,710 | | | | 1,801,704 | |
National Savings Bank (Sri Lanka), Sr. Unsec’d. Notes, RegS | | | 8.875 | | | | 09/18/18 | | | | 1,000 | | | | 1,080,900 | |
People’s United Bank, Sub. Notes | | | 4.000 | | | | 07/15/24 | | | | 1,125 | | | | 1,144,272 | |
State Street Corp., Jr. Sub. Notes | | | 5.250 | (a) | | | 12/29/49 | | | | 3,555 | | | | 3,734,528 | |
| | | | | | | | | | | | | | | | |
| | | | 84,100,120 | |
| | | | |
Beverages 0.1% | | | | | | | | | | | | | | | | |
Anheuser-Busch InBev Worldwide, Inc. (Belgium), Gtd. Notes | | | 8.200 | | | | 01/15/39 | | | | 250 | | | | 395,067 | |
Coca-Cola Icecek A/S (Turkey), Sr. Unsec’d. Notes, 144A | | | 4.750 | | | | 10/01/18 | | | | 950 | | | | 981,613 | |
Constellation Brands, Inc., Gtd. Notes | | | 6.000 | | | | 05/01/22 | | | | 450 | | | | 522,000 | |
See Notes to Financial Statements.
| | | | | | | | | | | | | | | | |
| Description | | Interest
Rate | | | Maturity
Date | | | Principal
Amount (000)# | | | Value (Note 1) | |
CORPORATE BONDS (Continued) | |
|
Beverages (cont’d.) | |
Molson Coors Brewing Co., Gtd. Notes | | | 2.000 | % | | | 05/01/17 | | | | 50 | | | $ | 50,202 | |
| | | | | | | | | | | | | | | | |
| | | | 1,948,882 | |
| | | | |
Biotechnology | | | | | | | | | | | | | | | | |
Amgen, Inc., Sr. Unsec’d. Notes, 144A | | | 4.663 | | | | 06/15/51 | | | | 439 | | | | 448,959 | |
Celgene Corp., Sr. Unsec’d. Notes | | | 2.125 | | | | 08/15/18 | | | | 30 | | | | 30,285 | |
| | | | | | | | | | | | | | | | |
| | | | 479,244 | |
| | | | |
Building Materials 1.5% | | | | | | | | | | | | | | | | |
Building Materials Corp. of America, Sr. Unsec’d. Notes, 144A
(original cost $5,902,500; purchased 10/27/14-02/11/15)(b)(d) | | | 5.375 | | | | 11/15/24 | | | | 5,825 | | | | 6,021,594 | |
Cemex Finance LLC (Mexico),
Sr. Sec’d. Notes, 144A | | | 9.375 | | | | 10/12/22 | | | | 1,125 | | | | 1,229,063 | |
Sr. Sec’d. Notes, RegS | | | 9.375 | | | | 10/12/22 | | | | 600 | | | | 655,500 | |
Cemex SAB de CV (Mexico), Sr. Sec’d. Notes, 144A | | | 4.750 | | | | 01/11/22 | | | EUR | 1,600 | | | | 1,822,449 | |
CeramTec Group GmbH (Germany), Gtd. Notes, 144A (original cost $500,000; purchased 07/25/13)(b)(d) | | | 8.250 | | | | 08/15/21 | | | EUR | 500 | | | | 581,810 | |
CeramTec Group GmbH (Germany), Gtd. Notes, RegS (original cost $530,000; purchased 02/24/16)(b)(d) | | | 8.250 | | | | 08/15/21 | | | EUR | 500 | | | | 581,810 | |
Griffon Corp., Gtd. Notes | | | 5.250 | | | | 03/01/22 | | | | 6,450 | | | | 6,530,625 | |
Owens Corning, Inc., Gtd. Notes | | | 4.200 | | | | 12/15/22 | | | | 125 | | | | 132,714 | |
Unifrax I LLC/Unifrax Holding Co., Gtd. Notes, 144A (original cost $3,299,400; purchased 06/30/14)(b)(d) | | | 7.500 | | | | 02/15/19 | | | | 3,120 | | | | 3,003,000 | |
US Concrete, Inc., Gtd. Notes | | | 6.375 | | | | 06/01/24 | | | | 2,400 | | | | 2,496,000 | |
| | | | | | | | | | | | | | | | |
| | | | 23,054,565 | |
| | | | |
Chemicals 1.0% | | | | | | | | | | | | | | | | |
Agrium, Inc. (Canada),
Sr. Unsec’d. Notes | | | 4.900 | | | | 06/01/43 | | | | 1,350 | | | | 1,413,399 | |
Sr. Unsec’d. Notes | | | 6.125 | | | | 01/15/41 | | | | 170 | | | | 202,773 | |
Ashland, Inc., Sr. Unsec’d. Notes | | | 6.875 | | | | 05/15/43 | | | | 4,100 | | | | 4,489,500 | |
CF Industries, Inc.,
Gtd. Notes | | | 4.950 | | | | 06/01/43 | | | | 1,765 | | | | 1,464,309 | |
Gtd. Notes | | | 5.375 | | | | 03/15/44 | | | | 1,300 | | | | 1,111,951 | |
Gtd. Notes | | | 6.875 | | | | 05/01/18 | | | | 160 | | | | 169,089 | |
Gtd. Notes | | | 7.125 | | | | 05/01/20 | | | | 125 | | | | 138,212 | |
Dow Chemical Co. (The),
Sr. Unsec’d. Notes | | | 4.625 | | | | 10/01/44 | | | | 15 | | | | 15,656 | |
Sr. Unsec’d. Notes | | | 5.250 | | | | 11/15/41 | | | | 125 | | | | 137,429 | |
Sr. Unsec’d. Notes | | | 9.400 | | | | 05/15/39 | | | | 95 | | | | 150,751 | |
Eastman Chemical Co., Sr. Unsec’d. Notes(f) | | | 4.650 | | | | 10/15/44 | | | | 1,210 | | | | 1,225,554 | |
LYB International Finance BV,
Gtd. Notes | | | 4.875 | | | | 03/15/44 | | | | 1,160 | | | | 1,231,247 | |
Gtd. Notes | | | 5.250 | | | | 07/15/43 | | | | 415 | | | | 456,941 | |
See Notes to Financial Statements.
| | | | |
| Prudential Absolute Return Bond Fund | | | 25 | |
Portfolio of Investments (continued)
as of October 31, 2016
| | | | | | | | | | | | | | | | |
| Description | | Interest
Rate | | | Maturity
Date | | | Principal
Amount (000)# | | | Value (Note 1) | |
CORPORATE BONDS (Continued) | |
|
Chemicals (cont’d.) | |
LyondellBasell Industries NV, Sr. Unsec’d. Notes | | | 4.625 | % | | | 02/26/55 | | | | 2,765 | | | $ | 2,619,890 | |
| | | | | | | | | | | | | | | | |
| | | | 14,826,701 | |
| | | | |
Commercial Services 1.2% | | | | | | | | | | | | | | | | |
AMN Healthcare, Inc., Gtd. Notes, 144A | | | 5.125 | | | | 10/01/24 | | | | 550 | | | | 558,250 | |
Ashtead Capital, Inc. (United Kingdom), Sec’d. Notes, 144A | | | 6.500 | | | | 07/15/22 | | | | 1,925 | | | | 2,018,844 | |
ERAC USA Finance LLC,
Gtd. Notes, 144A (original cost $131,355; purchased 05/30/13)(b)(d) | | | 6.700 | | | | 06/01/34 | | | | 110 | | | | 141,709 | |
Gtd. Notes, 144A (original cost $2,232,116; purchased 05/14/13)(b)(d) | | | 7.000 | | | | 10/15/37 | | | | 1,725 | | | | 2,290,336 | |
Hertz Corp. (The), Gtd. Notes | | | 6.750 | | | | 04/15/19 | | | | 1,153 | | | | 1,176,302 | |
Service Corp. International, Sr. Unsec’d. Notes(f) | | | 4.500 | | | | 11/15/20 | | | | 2,135 | | | | 2,172,362 | |
United Rentals North America, Inc.,
Gtd. Notes(f) | | | 5.500 | | | | 07/15/25 | | | | 925 | | | | 936,562 | |
Gtd. Notes | | | 5.500 | | | | 05/15/27 | | | | 1,600 | | | | 1,592,000 | |
Gtd. Notes | | | 7.625 | | | | 04/15/22 | | | | 6,444 | | | | 6,852,421 | |
| | | | | | | | | | | | | | | | |
| | | | 17,738,786 | |
|
Computers 0.1% | |
NCR Corp., Gtd. Notes | | | 6.375 | | | | 12/15/23 | | | | 790 | | | | 835,425 | |
|
Distribution/Wholesale 0.1% | |
H&E Equipment Services, Inc., Gtd. Notes(f) | | | 7.000 | | | | 09/01/22 | | | | 2,000 | | | | 2,104,000 | |
|
Diversified Financial Services 0.7% | |
AerCap Ireland Capital Ltd./AerCap Global Aviation Trust (Netherlands), Gtd. Notes | | | 4.500 | | | | 05/15/21 | | | | 1,150 | | | | 1,195,425 | |
Capital One Bank USA NA, Sub. Notes | | | 3.375 | | | | 02/15/23 | | | | 2,065 | | | | 2,109,282 | |
Grain Spectrum Funding II LLC, Sec’d. Notes, 144A | | | 3.290 | | | | 10/10/34 | | | | 764 | | | | 764,276 | |
International Lease Finance Corp.,
Sr. Unsec’d. Notes | | | 6.250 | | | | 05/15/19 | | | | 25 | | | | 27,031 | |
Sr. Unsec’d. Notes | | | 8.750 | | | | 03/15/17 | | | | 5,340 | | | | 5,472,646 | |
Jefferies Group LLC, Sr. Unsec’d. Notes | | | 6.500 | | | | 01/20/43 | | | | 175 | | | | 181,219 | |
Navient Corp., Sr. Unsec’d. Notes, MTN(f) | | | 4.875 | | | | 06/17/19 | | | | 1,155 | | | | 1,165,106 | |
| | | | | | | | | | | | | | | | |
| | | | 10,914,985 | |
|
Electric 2.1% | |
Calpine Corp.,
Sr. Unsec’d. Notes(f) | | | 5.375 | | | | 01/15/23 | | | | 2,175 | | | | 2,153,250 | |
Sr. Unsec’d. Notes | | | 5.500 | | | | 02/01/24 | | | | 1,250 | | | | 1,218,750 | |
Sr. Unsec’d. Notes(f) | | | 5.750 | | | | 01/15/25 | | | | 3,575 | | | | 3,476,687 | |
DPL, Inc.,
Sr. Unsec’d. Notes | | | 6.750 | | | | 10/01/19 | | | | 1,650 | | | | 1,711,875 | |
Sr. Unsec’d. Notes | | | 7.250 | | | | 10/15/21 | | | | 1,475 | | | | 1,539,531 | |
See Notes to Financial Statements.
| | | | | | | | | | | | | | | | |
| Description | | Interest
Rate | | | Maturity
Date | | | Principal
Amount (000)# | | | Value (Note 1) | |
CORPORATE BONDS (Continued) | |
|
Electric (cont’d.) | |
Duke Energy Carolinas LLC, First Ref. Mtge. | | | 4.000 | % | | | 09/30/42 | | | | 50 | | | $ | 52,145 | |
Dynegy, Inc.,
Gtd. Notes(f) | | | 6.750 | | | | 11/01/19 | | | | 5,850 | | | | 5,920,726 | |
Gtd. Notes | | | 7.375 | | | | 11/01/22 | | | | 8,350 | | | | 8,052,531 | |
Entergy Corp., Sr. Unsec’d. Notes | | | 4.700 | | | | 01/15/17 | | | | 75 | | | | 75,309 | |
FirstEnergy Corp., Sr. Unsec’d. Notes | | | 2.750 | | | | 03/15/18 | | | | 950 | | | | 961,007 | |
FirstEnergy Transmission LLC, Sr. Unsec’d. Notes, 144A | | | 5.450 | | | | 07/15/44 | | | | 800 | | | | 882,682 | |
NextEra Energy Capital Holdings, Inc., Gtd. Notes | | | 3.625 | | | | 06/15/23 | | | | 1,575 | | | | 1,650,066 | |
NRG Energy, Inc.,
Gtd. Notes(f) | | | 6.250 | | | | 05/01/24 | | | | 1,748 | | | | 1,695,560 | |
Gtd. Notes(f) | | | 6.625 | | | | 03/15/23 | | | | 823 | | | | 820,943 | |
Gtd. Notes | | | 7.625 | | | | 01/15/18 | | | | 1,456 | | | | 1,554,280 | |
South Carolina Electric & Gas Co., First Mtge. | | | 4.350 | | | | 02/01/42 | | | | 130 | | | | 137,343 | |
Westar Energy, Inc., First Mtge. | | | 4.100 | | | | 04/01/43 | | | | 325 | | | | 339,926 | |
| | | | | | | | | | | | | | | | |
| | | | 32,242,611 | |
|
Electronics 0.5% | |
Jabil Circuit, Inc.,
Sr. Unsec’d. Notes | | | 4.700 | | | | 09/15/22 | | | | 1,045 | | | | 1,086,800 | |
Sr. Unsec’d. Notes | | | 5.625 | | | | 12/15/20 | | | | 5,400 | | | | 5,791,500 | |
Techem Energy Metering Service GmbH & Co. KG (Germany), Gtd. Notes, 144A, MTN | | | 7.875 | | | | 10/01/20 | | | EUR | 125 | | | | 143,175 | |
Techem GmbH (Germany), Sr. Sec’d. Notes, 144A | | | 6.125 | | | | 10/01/19 | | | EUR | 200 | | | | 226,686 | |
| | | | | | | | | | | | | | | | |
| | | | 7,248,161 | |
|
Entertainment 2.2% | |
AMC Entertainment, Inc., Gtd. Notes | | | 5.750 | | | | 06/15/25 | | | | 3,175 | | | | 3,182,938 | |
Cedar Fair LP/Canada’s Wonderland Co./Magnum Management Corp., Gtd. Notes | | | 5.375 | | | | 06/01/24 | | | | 6,900 | | | | 7,279,500 | |
Cinemark USA, Inc.,
Gtd. Notes | | | 4.875 | | | | 06/01/23 | | | | 6,500 | | | | 6,508,125 | |
Gtd. Notes | | | 5.125 | | | | 12/15/22 | | | | 3,200 | | | | 3,288,000 | |
CPUK Finance Ltd. (United Kingdom), Sec’d. Notes, 144A | | | 7.000 | | | | 08/28/20 | | | GBP | 2,550 | | | | 3,295,720 | |
NAI Entertainment Holdings/NAI Entertainment Holdings Finance Corp., Sr. Sec’d. Notes, 144A (original cost $4,724,606; purchased 09/22/14)(b)(d) | | | 5.000 | | | | 08/01/18 | | | | 4,615 | | | | 4,661,150 | |
Scientific Games International, Inc., Gtd. Notes | | | 10.000 | | | | 12/01/22 | | | | 6,000 | | | | 5,550,000 | |
| | | | | | | | | | | | | | | | |
| | | | 33,765,433 | |
|
Environmental Control 0.2% | |
Covanta Holding Corp., Sr. Unsec’d. Notes | | | 7.250 | | | | 12/01/20 | | | | 3,100 | | | | 3,181,375 | |
|
Food 1.3% | |
Ingles Markets, Inc., Sr. Unsec’d. Notes | | | 5.750 | | | | 06/15/23 | | | | 5,250 | | | | 5,433,750 | |
JBS Investments GmbH (Brazil), Sr. Unsec’d. Notes, 144A | | | 7.750 | | | | 10/28/20 | | | | 2,650 | | | | 2,762,625 | |
See Notes to Financial Statements.
| | | | |
| Prudential Absolute Return Bond Fund | | | 27 | |
Portfolio of Investments (continued)
as of October 31, 2016
| | | | | | | | | | | | | | | | |
| Description | | Interest
Rate | | | Maturity
Date | | | Principal
Amount (000)# | | | Value (Note 1) | |
CORPORATE BONDS (Continued) | |
|
Food (cont’d.) | |
JBS USA LLC/JBS USA Finance, Inc. (Brazil), Gtd. Notes, 144A
(original cost $1,081,250; purchased 06/17/14)(b)(d) | | | 7.250 | % | | | 06/01/21 | | | | 1,000 | | | $ | 1,025,000 | |
Gtd. Notes, 144A
(original cost $2,014,000; purchased 12/09/15)(b)(d)(f) | | | 7.250 | | | | 06/01/21 | | | | 2,000 | | | | 2,050,000 | |
Gtd. Notes, RegS
(original cost $1,605,000; purchased 10/01/14)(b)(d) | | | 8.250 | | | | 02/01/20 | | | | 1,500 | | | | 1,541,250 | |
Minerva Luxembourg SA (Brazil), Gtd. Notes, 144A | | | 12.250 | | | | 02/10/22 | | | | 250 | | | | 270,000 | |
Smithfield Foods, Inc.,
Sr. Unsec’d. Notes | | | 6.625 | | | | 08/15/22 | | | | 2,000 | | | | 2,107,500 | |
Sr. Unsec’d. Notes, 144A | | | 5.250 | | | | 08/01/18 | | | | 1,465 | | | | 1,475,987 | |
Sr. Unsec’d. Notes, 144A | | | 5.875 | | | | 08/01/21 | | | | 2,400 | | | | 2,502,000 | |
| | | | | | | | | | | | | | | | |
| | | | 19,168,112 | |
|
Forest & Paper Products 0.5% | |
Georgia-Pacific LLC,
Gtd. Notes, 144A
(original cost $35,100; purchased 04/20/11)(b)(d) | | | 5.400 | | | | 11/01/20 | | | | 35 | | | | 39,257 | |
Sr. Unsec’d. Notes
(original cost $544,908; purchased 12/20/12)(b)(d) | | | 7.375 | | | | 12/01/25 | | | | 400 | | | | 520,206 | |
International Paper Co.,
Sr. Unsec’d. Notes | | | 4.800 | | | | 06/15/44 | | | | 2,770 | | | | 2,820,040 | |
Sr. Unsec’d. Notes | | | 6.000 | | | | 11/15/41 | | | | 610 | | | | 715,840 | |
Sr. Unsec’d. Notes | | | 9.375 | | | | 05/15/19 | | | | 100 | | | | 117,941 | |
Smurfit Kappa Acquisitions (Ireland), Sr. Sec’d. Notes, 144A | | | 4.875 | | | | 09/15/18 | | | | 3,647 | | | | 3,765,528 | |
| | | | | | | | | | | | | | | | |
| | | | 7,978,812 | |
|
Gas 0.2% | |
AGL Capital Corp., Gtd. Notes | | | 4.400 | | | | 06/01/43 | | | | 1,375 | | | | 1,443,126 | |
CenterPoint Energy Resources Corp., Sr. Unsec’d. Notes | | | 5.850 | | | | 01/15/41 | | | | 700 | | | | 838,056 | |
Dominion Gas Holdings LLC, Sr. Unsec’d. Notes | | | 4.800 | | | | 11/01/43 | | | | 125 | | | | 133,824 | |
Fermaca Enterprises S de RL de CV (Mexico), Sr. Sec’d. Notes, 144A (original cost $583,725; purchased 07/22/14)(b)(d) | | | 6.375 | | | | 03/30/38 | | | | 558 | | | | 580,238 | |
Sempra Energy, Sr. Unsec’d. Notes | | | 2.300 | | | | 04/01/17 | | | | 50 | | | | 50,235 | |
| | | | | | | | | | | | | | | | |
| | | | 3,045,479 | |
|
Healthcare-Products 0.6% | |
ConvaTec Finance International SA (Luxembourg), Sr. Unsec’d. Notes, PIK, 144A | | | 8.250 | | | | 01/15/19 | | | | 5,024 | | | | 5,024,000 | |
ConvaTec Healthcare E SA (Luxembourg), Gtd. Notes, 144A | | | 10.500 | | | | 12/15/18 | | | | 3,684 | | | | 3,725,445 | |
| | | | | | | | | | | | | | | | |
| | | | 8,749,445 | |
See Notes to Financial Statements.
| | | | | | | | | | | | | | | | |
| Description | | Interest
Rate | | | Maturity
Date | | | Principal
Amount (000)# | | | Value (Note 1) | |
CORPORATE BONDS (Continued) | |
|
Healthcare-Services 3.5% | |
Aetna, Inc.,
Sr. Unsec’d. Notes | | | 2.750 | % | | | 11/15/22 | | | | 450 | | | $ | 457,873 | |
Sr. Unsec’d. Notes | | | 4.125 | | | | 11/15/42 | | | | 325 | | | | 322,123 | |
Sr. Unsec’d. Notes | | | 4.500 | | | | 05/15/42 | | | | 530 | | | | 563,257 | |
Anthem, Inc.,
Sr. Unsec’d. Notes | | | 4.650 | | | | 01/15/43 | | | | 120 | | | | 127,175 | |
Sr. Unsec’d. Notes | | | 5.100 | | | | 01/15/44 | | | | 515 | | | | 583,209 | |
CHS/Community Health Systems, Inc.,
Gtd. Notes(f) | | | 8.000 | | | | 11/15/19 | | | | 5,300 | | | | 4,664,000 | |
Sr. Sec’d. Notes | | | 5.125 | | | | 08/15/18 | | | | 31 | | | | 30,729 | |
Cigna Corp., Sr. Unsec’d. Notes | | | 5.375 | | | | 02/15/42 | | | | 350 | | | | 408,326 | |
HCA, Inc.,
Gtd. Notes | | | 5.375 | | | | 02/01/25 | | | | 4,500 | | | | 4,593,150 | |
Gtd. Notes | | | 5.875 | | | | 05/01/23 | | | | 2,000 | | | | 2,121,880 | |
Sr. Sec’d. Notes | | | 4.750 | | | | 05/01/23 | | | | 3,050 | | | | 3,175,813 | |
Sr. Sec’d. Notes | | | 5.250 | | | | 04/15/25 | | | | 2,000 | | | | 2,095,000 | |
Sr. Sec’d. Notes(f) | | | 5.875 | | | | 03/15/22 | | | | 3,425 | | | | 3,767,500 | |
HealthSouth Corp.,
Gtd. Notes | | | 5.125 | | | | 03/15/23 | | | | 1,200 | | | | 1,212,000 | |
Gtd. Notes(f) | | | 5.750 | | | | 11/01/24 | | | | 2,900 | | | | 2,990,625 | |
Laboratory Corp. of America Holdings,
Sr. Unsec’d. Notes | | | 3.200 | | | | 02/01/22 | | | | 25 | | | | 26,004 | |
Sr. Unsec’d. Notes | | | 4.625 | | | | 11/15/20 | | | | 4,500 | | | | 4,908,865 | |
LifePoint Hospitals, Inc., Gtd. Notes(f) | | | 5.500 | | | | 12/01/21 | | | | 3,875 | | | | 4,015,469 | |
MEDNAX, Inc., Gtd. Notes, 144A | | | 5.250 | | | | 12/01/23 | | | | 2,650 | | | | 2,769,250 | |
Select Medical Corp., Gtd. Notes(f) | | | 6.375 | | | | 06/01/21 | | | | 7,821 | | | | 7,723,237 | |
Tenet Healthcare Corp.,
Sr. Sec’d. Notes | | | 4.375 | | | | 10/01/21 | | | | 2,125 | | | | 2,114,375 | |
Sr. Sec’d. Notes | | | 6.250 | | | | 11/01/18 | | | | 600 | | | | 634,500 | |
Sr. Unsec’d. Notes | | | 8.125 | | | | 04/01/22 | | | | 1,700 | | | | 1,661,750 | |
UnitedHealth Group, Inc.,
Sr. Unsec’d. Notes | | | 3.950 | | | | 10/15/42 | | | | 175 | | | | 179,523 | |
Sr. Unsec’d. Notes(f) | | | 4.375 | | | | 03/15/42 | | | | 1,055 | | | | 1,143,944 | |
| | | | | | | | | | | | | | | | |
| | | | 52,289,577 | |
|
Holding Companies-Diversified 0.2% | |
Carlson Travel Holdings, Inc., Sr. Unsec’d. Notes, PIK, 144A
(original cost $2,543,750; purchased 08/04/14)(b)(d) | | | 7.500 | | | | 08/15/19 | | | | 2,500 | | | | 2,437,500 | |
See Notes to Financial Statements.
| | | | |
| Prudential Absolute Return Bond Fund | | | 29 | |
Portfolio of Investments (continued)
as of October 31, 2016
| | | | | | | | | | | | | | | | |
| Description | | Interest
Rate | | | Maturity
Date | | | Principal
Amount (000)# | | | Value (Note 1) | |
CORPORATE BONDS (Continued) | |
|
Home Builders 2.0% | |
CalAtlantic Group, Inc., Gtd. Notes | | | 8.375 | % | | | 05/15/18 | | | | 4,553 | | | $ | 4,962,770 | |
KB Home, Gtd. Notes(f) | | | 7.500 | | | | 09/15/22 | | | | 3,425 | | | | 3,707,562 | |
M/I Homes, Inc., Gtd. Notes | | | 6.750 | | | | 01/15/21 | | | | 5,850 | | | | 6,157,125 | |
PulteGroup, Inc., Gtd. Notes | | | 5.500 | | | | 03/01/26 | | | | 4,000 | | | | 4,160,000 | |
Taylor Morrison Communities, Inc./Monarch Communities, Inc., Gtd. Notes, 144A | | | 5.250 | | | | 04/15/21 | | | | 6,700 | | | | 6,867,500 | |
William Lyon Homes, Inc., Gtd. Notes | | | 8.500 | | | | 11/15/20 | | | | 5,000 | | | | 5,237,500 | |
| | | | | | | | | | | | | | | | |
| | | | 31,092,457 | |
|
Insurance 1.3% | |
Hartford Financial Services Group, Inc. (The),
Sr. Unsec’d. Notes | | | 5.950 | | | | 10/15/36 | | | | 215 | | | | 250,811 | |
Sr. Unsec’d. Notes | | | 6.100 | | | | 10/01/41 | | | | 280 | | | | 335,008 | |
Liberty Mutual Group, Inc.,
Gtd. Notes, 144A(f) | | | 4.250 | | | | 06/15/23 | | | | 1,975 | | | | 2,133,381 | |
Gtd. Notes, 144A | | | 4.850 | | | | 08/01/44 | | | | 1,000 | | | | 1,033,743 | |
Gtd. Notes, 144A | | | 4.950 | | | | 05/01/22 | | | | 75 | | | | 84,068 | |
Gtd. Notes, 144A | | | 6.500 | | | | 05/01/42 | | | | 1,530 | | | | 1,865,425 | |
Lincoln National Corp., Sr. Unsec’d. Notes | | | 7.000 | | | | 06/15/40 | | | | 695 | | | | 887,477 | |
Markel Corp.,
Sr. Unsec’d. Notes | | | 4.900 | | | | 07/01/22 | | | | 2,020 | | | | 2,216,988 | |
Sr. Unsec’d. Notes(e) | | | 5.000 | | | | 03/30/43 | | | | 3,125 | | | | 3,295,569 | |
Principal Financial Group, Inc., Gtd. Notes | | | 4.350 | | | | 05/15/43 | | | | 975 | | | | 977,653 | |
Swiss Re Treasury US Corp. (Switzerland),
Gtd. Notes, 144A | | | 4.250 | | | | 12/06/42 | | | | 795 | | | | 814,582 | |
Teachers Insurance & Annuity Association of America,
Sub. Notes, 144A(e) | | | 4.900 | | | | 09/15/44 | | | | 1,950 | | | | 2,168,663 | |
Sub. Notes, 144A | | | 6.850 | | | | 12/16/39 | | | | 640 | | | | 861,149 | |
TIAA Asset Management Finance LLC, Sr. Unsec’d. Notes, 144A
(original cost $1,716,904; purchased 10/27/14)(b)(d) | | | 2.950 | | | | 11/01/19 | | | | 1,720 | | | | 1,769,063 | |
W.R. Berkley Corp., Sr. Unsec’d. Notes | | | 4.625 | | | | 03/15/22 | | | | 1,435 | | | | 1,560,695 | |
| | | | | | | | | | | | | | | | |
| | | | 20,254,275 | |
|
Iron/Steel 0.1% | |
Vale Overseas Ltd. (Brazil), Gtd. Notes | | | 6.250 | | | | 08/10/26 | | | | 870 | | | | 933,075 | |
See Notes to Financial Statements.
| | | | | | | | | | | | | | | | |
| Description | | Interest
Rate | | | Maturity
Date | | | Principal
Amount (000)# | | | Value (Note 1) | |
CORPORATE BONDS (Continued) | |
|
Lodging 0.8% | |
FelCor Lodging LP,
Gtd. Notes(f) | | | 6.000 | % | | | 06/01/25 | | | | 3,400 | | | $ | 3,527,500 | |
Sr. Sec’d. Notes | | | 5.625 | | | | 03/01/23 | | | | 1,050 | | | | 1,083,589 | |
Marriott International, Inc., Sr. Unsec’d. Notes | | | 3.250 | | | | 09/15/22 | | | | 75 | | | | 77,750 | |
MGM Resorts International,
Gtd. Notes(f) | | | 6.000 | | | | 03/15/23 | | | | 4,800 | | | | 5,196,000 | |
Gtd. Notes | | | 6.625 | | | | 12/15/21 | | | | 1,000 | | | | 1,116,880 | |
Starwood Hotels & Resorts Worldwide, Inc.,
Sr. Unsec’d. Notes | | | 7.150 | | | | 12/01/19 | | | | 550 | | | | 628,329 | |
| | | | | | | | | | | | | | | | |
| | | | 11,630,048 | |
|
Machinery-Construction & Mining | |
Terex Corp., Gtd. Notes(f) | | | 6.500 | | | | 04/01/20 | | | | 580 | | | | 591,600 | |
|
Machinery-Diversified | |
Xylem, Inc., Sr. Unsec’d. Notes | | | 4.875 | | | | 10/01/21 | | | | 50 | | | | 55,273 | |
|
Media 2.2% | |
AMC Networks, Inc., Gtd. Notes | | | 4.750 | | | | 12/15/22 | | | | 1,270 | | | | 1,295,400 | |
CCO Holdings LLC/CCO Holdings Capital Corp.,
Gtd. Notes(f) | | | 5.750 | | | | 01/15/24 | | | | 1,100 | | | | 1,163,250 | |
Gtd. Notes, 144A | | | 5.125 | | | �� | 05/01/23 | | | | 2,625 | | | | 2,710,312 | |
Gtd. Notes, 144A | | | 5.375 | | | | 05/01/25 | | | | 1,650 | | | | 1,695,375 | |
Gtd. Notes, 144A | | | 5.875 | | | | 05/01/27 | | | | 5,075 | | | | 5,316,062 | |
Cequel Communications Holdings I LLC/Cequel Capital Corp., Sr. Unsec’d. Notes, 144A | | | 6.375 | | | | 09/15/20 | | | | 1,750 | | | | 1,802,500 | |
Charter Communications Operating LLC/Charter Communications Operating Capital,
Sr. Sec’d. Notes, 144A | | | 6.384 | | | | 10/23/35 | | | | 1,525 | | | | 1,757,916 | |
Sr. Sec’d. Notes, 144A | | | 6.834 | | | | 10/23/55 | | | | 485 | | | | 578,294 | |
Clear Channel Worldwide Holdings, Inc.,
Gtd. Notes | | | 6.500 | | | | 11/15/22 | | | | 135 | | | | 135,675 | |
Gtd. Notes | | | 6.500 | | | | 11/15/22 | | | | 365 | | | | 371,753 | |
CSC Holdings LLC, Sr. Unsec’d. Notes | | | 7.875 | | | | 02/15/18 | | | | 1,040 | | | | 1,110,200 | |
Liberty Interactive LLC, Sr. Unsec’d. Notes(f) | | | 8.250 | | | | 02/01/30 | | | | 2,500 | | | | 2,675,000 | |
Myriad International Holdings BV (South Africa),
Gtd. Notes, 144A | | | 6.375 | | | | 07/28/17 | | | | 3,000 | | | | 3,091,836 | |
TEGNA, Inc., Gtd. Notes, 144A | | | 4.875 | | | | 09/15/21 | | | | 1,625 | | | | 1,694,063 | |
Unitymedia Hessen GmbH & Co. KG/Unitymedia NRW GmbH (Germany),
Sr. Sec’d. Notes, 144A | | | 5.500 | | | | 09/15/22 | | | EUR | 130 | | | | 149,681 | |
See Notes to Financial Statements.
| | | | |
| Prudential Absolute Return Bond Fund | | | 31 | |
Portfolio of Investments (continued)
as of October 31, 2016
| | | | | | | | | | | | | | | | |
| Description | | Interest
Rate | | | Maturity
Date | | | Principal
Amount (000)# | | | Value (Note 1) | |
CORPORATE BONDS (Continued) | |
|
Media (cont’d.) | |
Unitymedia Hessen GmbH & Co. KG/Unitymedia NRW GmbH (Germany), (cont’d.)
Sr. Sec’d. Notes, 144A, MTN | | | 5.125 | % | | | 01/21/23 | | | EUR | 502 | | | $ | 579,993 | |
Videotron Ltd. (Canada),
Gtd. Notes | | | 5.000 | | | | 07/15/22 | | | | 4,500 | | | | 4,696,875 | |
Gtd. Notes, 144A | | | 5.375 | | | | 06/15/24 | | | | 2,400 | | | | 2,511,000 | |
| | | | | | | | | | | | | | | | |
| | | | 33,335,185 | |
|
Mining 0.6% | |
BHP Billiton Finance USA Ltd. (Australia), Gtd.
Notes, 144A(f) | | | 6.750 | (a) | | | 10/19/75 | | | | 2,675 | | | | 3,029,438 | |
Eldorado Gold Corp. (Canada), Sr. Unsec’d.
Notes, 144A | | | 6.125 | | | | 12/15/20 | | | | 2,375 | | | | 2,398,750 | |
Southern Copper Corp. (Peru),
Sr. Unsec’d. Notes(f) | | | 5.875 | | | | 04/23/45 | | | | 1,225 | | | | 1,223,841 | |
Sr. Unsec’d. Notes | | | 6.750 | | | | 04/16/40 | | | | 2,575 | | | | 2,805,115 | |
| | | | | | | | | | | | | | | | |
| | | | 9,457,144 | |
|
Miscellaneous Manufacturing 0.3% | |
Actuant Corp., Gtd. Notes | | | 5.625 | | | | 06/15/22 | | | | 3,075 | | | | 3,171,094 | |
General Electric Co., Sr. Unsec’d. Notes | | | 4.125 | | | | 10/09/42 | | | | 50 | | | | 53,076 | |
Koppers, Inc., Gtd. Notes | | | 7.875 | | | | 12/01/19 | | | | 1,200 | | | | 1,218,000 | |
Pentair Finance SA (United Kingdom), Gtd. Notes | | | 1.875 | | | | 09/15/17 | | | | 50 | | | | 50,098 | |
| | | | | | | | | | | | | | | | |
| | | | 4,492,268 | |
|
Oil & Gas 1.0% | |
Anadarko Petroleum Corp., Sr. Unsec’d. Notes | | | 6.450 | | | | 09/15/36 | | | | 750 | | | | 890,008 | |
California Resources Corp.,
Gtd. Notes | | | 6.000 | | | | 11/15/24 | | | | 65 | | | | 35,750 | |
Sec’d. Notes, 144A | | | 8.000 | | | | 12/15/22 | | | | 1,648 | | | | 1,112,400 | |
Cenovus Energy, Inc. (Canada), Sr. Unsec’d. Notes | | | 4.450 | | | | 09/15/42 | | | | 1,070 | | | | 937,911 | |
Denbury Resources, Inc., Gtd. Notes(f) | | | 5.500 | | | | 05/01/22 | | | | 2,000 | | | | 1,580,000 | |
Nabors Industries, Inc.,
Gtd. Notes | | | 4.625 | | | | 09/15/21 | | | | 762 | | | | 753,993 | |
Gtd. Notes | | | 6.150 | | | | 02/15/18 | | | | 80 | | | | 83,291 | |
Noble Energy, Inc.,
Sr. Unsec’d. Notes | | | 4.150 | | | | 12/15/21 | | | | 500 | | | | 530,395 | |
Sr. Unsec’d. Notes | | | 5.250 | | | | 11/15/43 | | | | 395 | | | | 416,216 | |
Sr. Unsec’d. Notes | | | 6.000 | | | | 03/01/41 | | | | 1,390 | | | | 1,554,737 | |
Noble Holding International Ltd. (United Kingdom), Gtd. Notes(f) | | | 2.500 | | | | 03/15/17 | | | | 25 | | | | 24,928 | |
See Notes to Financial Statements.
| | | | | | | | | | | | | | | | |
| Description | | Interest
Rate | | | Maturity
Date | | | Principal
Amount (000)# | | | Value (Note 1) | |
CORPORATE BONDS (Continued) | |
|
Oil & Gas (cont’d.) | |
Pacific Exploration and Production Corp. (Colombia), Gtd. Notes, 144A(g) | | | 5.375 | % (a) | | | 01/26/19 | | | | 6,540 | | | $ | 1,308,000 | |
Gtd. Notes, 144A(g) | | | 7.250 | (a) | | | 12/12/21 | | | | 5,750 | | | | 1,150,000 | |
Reliance Holding USA, Inc. (India), Gtd. Notes, 144A | | | 5.400 | | | | 02/14/22 | | | | 1,750 | | | | 1,953,303 | |
Sasol Financing International PLC (South Africa), Gtd. Notes | | | 4.500 | | | | 11/14/22 | | | | 2,800 | | | | 2,865,912 | |
| | | | | | | | | | | | | | | | |
| | | | 15,196,844 | |
|
Oil & Gas Services | |
Cameron International Corp., Sr. Unsec’d. Notes | | | 5.950 | | | | 06/01/41 | | | | 100 | | | | 119,396 | |
|
Packaging & Containers 0.4% | |
Ball Corp.,
Gtd. Notes(f) | | | 4.000 | | | | 11/15/23 | | | | 500 | | | | 505,750 | |
Gtd. Notes | | | 4.375 | | | | 12/15/23 | | | EUR | 1,825 | | | | 2,252,025 | |
Crown Americas LLC/Crown Americas Capital Corp. IV, Gtd. Notes | | | 4.500 | | | | 01/15/23 | | | | 525 | | | | 538,125 | |
Reynolds Group Issuer, Inc./Reynolds Group Issuer LLC (New Zealand), Sr. Sec’d. Notes | | | 5.750 | | | | 10/15/20 | | | | 2,075 | | | | 2,129,531 | |
WestRock RKT Co.,
Gtd. Notes | | | 4.450 | | | | 03/01/19 | | | | 35 | | | | 36,941 | |
Gtd. Notes | | | 4.900 | | | | 03/01/22 | | | | 1,190 | | | | 1,326,805 | |
| | | | | | | | | | | | | | | | |
| | | | 6,789,177 | |
|
Pharmaceuticals 0.8% | |
AbbVie, Inc., Sr. Unsec’d. Notes | | | 4.500 | | | | 05/14/35 | | | | 4,085 | | | | 4,166,913 | |
Actavis Funding SCS,
Gtd. Notes | | | 4.550 | | | | 03/15/35 | | | | 4,020 | | | | 4,150,682 | |
Gtd. Notes(f) | | | 4.750 | �� | | | 03/15/45 | | | | 337 | | | | 353,490 | |
Capsugel SA, Sr. Unsec’d. Notes, PIK, 144A | | | 7.000 | | | | 05/15/19 | | | | 1,926 | | | | 1,926,000 | |
Valeant Pharmaceuticals International, Inc., Sr. Unsec’d. Notes, 144A(f) | | | 6.125 | | | | 04/15/25 | | | | 1,275 | | | | 1,007,250 | |
| | | | | | | | | | | | | | | | |
| | | | 11,604,335 | |
|
Pipelines 0.6% | |
DCP Midstream LLC, Sr. Unsec’d. Notes, 144A | | | 5.350 | | | | 03/15/20 | | | | 227 | | | | 233,810 | |
DCP Midstream Operating LP, Gtd. Notes(f) | | | 2.500 | | | | 12/01/17 | | | | 225 | | | | 223,313 | |
Enterprise Products Operating LLC, Sr. Unsec’d. Notes | | | 4.950 | | | | 10/15/54 | | | | 2,700 | | | | 2,600,132 | |
Magellan Midstream Partners LP,
Sr. Unsec’d. Notes | | | 4.200 | | | | 12/01/42 | | | | 125 | | | | 120,033 | |
Sr. Unsec’d. Notes | | | 4.250 | | | | 02/01/21 | | | | 1,950 | | | | 2,101,511 | |
See Notes to Financial Statements.
| | | | |
| Prudential Absolute Return Bond Fund | | | 33 | |
Portfolio of Investments (continued)
as of October 31, 2016
| | | | | | | | | | | | | | | | |
| Description | | Interest
Rate | | | Maturity
Date | | | Principal
Amount (000)# | | | Value (Note 1) | |
CORPORATE BONDS (Continued) | |
|
Pipelines (cont’d.) | |
Magellan Midstream Partners LP, (cont’d.)
Sr. Unsec’d. Notes | | | 5.150 | % | | | 10/15/43 | | | | 1,350 | | | $ | 1,435,088 | |
Tesoro Logistics LP/Tesoro Logistics Finance Corp., Gtd. Notes | | | 6.125 | | | | 10/15/21 | | | | 1,700 | | | | 1,778,625 | |
Western Gas Partners LP, Sr. Unsec’d. Notes | | | 4.000 | | | | 07/01/22 | | | | 75 | | | | 77,107 | |
| | | | | | | | | | | | | | | | |
| | | | 8,569,619 | |
|
Real Estate Investment Trusts (REITs) 0.4% | |
Mack-Cali Realty LP, Sr. Unsec’d. Notes | | | 2.500 | | | | 12/15/17 | | | | 100 | | | | 100,352 | |
Sabra Health Care LP/Sabra Capital Corp.,
Gtd. Notes | | | 5.375 | | | | 06/01/23 | | | | 1,965 | | | | 2,004,300 | |
Gtd. Notes | | | 5.500 | | | | 02/01/21 | | | | 1,500 | | | | 1,563,750 | |
Trust F/1401 (Mexico), Sr. Unsec’d. Notes, 144A | | | 5.250 | | | | 12/15/24 | | | | 2,000 | | | | 2,095,000 | |
| | | | | | | | | | | | | | | | |
| | | | 5,763,402 | |
|
Retail 1.9% | |
Claire’s Stores, Inc., Sr. Sec’d. Notes, 144A | | | 9.000 | | | | 03/15/19 | | | | 475 | | | | 237,500 | |
CVS Health Corp.,
Sr. Unsec’d. Notes | | | 5.125 | | | | 07/20/45 | | | | 1,765 | | | | 2,059,033 | |
Sr. Unsec’d. Notes | | | 5.300 | | | | 12/05/43 | | | | 475 | | | | 556,348 | |
Douglas GmbH (Germany), Sr. Sec’d. Notes, 144A | | | 6.250 | | | | 07/15/22 | | | EUR | 1,200 | | | | 1,435,864 | |
Dufry Finance SCA (Switzerland), Sr. Unsec’d. Notes, 144A | | | 4.500 | | | | 08/01/23 | | | EUR | 2,400 | | | | 2,812,448 | |
L Brands, Inc., Gtd. Notes(f) | | | 5.625 | | | | 02/15/22 | | | | 10,975 | | | | 12,017,625 | |
Macy’s Retail Holdings, Inc., Gtd. Notes | | | 4.300 | | | | 02/15/43 | | | | 755 | | | | 630,842 | |
PVH Corp., Sr. Unsec’d. Notes | | | 4.500 | | | | 12/15/22 | | | | 5,005 | | | | 5,155,150 | |
QVC, Inc., Sr. Sec’d. Notes | | | 5.125 | | | | 07/02/22 | | | | 1,800 | | | | 1,886,134 | |
Tops Holding LLC/Tops Markets II Corp.,
Sr. Sec’d. Notes, 144A
(original cost $1,950,000; purchased 05/29/15)(b)(d) | | | 8.000 | | | | 06/15/22 | | | | 1,950 | | | | 1,716,000 | |
| | | | | | | | | | | | | | | | |
| | | | 28,506,944 | |
|
Savings & Loans | |
People’s United Financial, Inc., Sr. Unsec’d. Notes | | | 3.650 | | | | 12/06/22 | | | | 325 | | | | 333,331 | |
|
Semiconductors 0.7% | |
Micron Technology, Inc., Sr. Unsec’d. Notes | | | 5.500 | | | | 02/01/25 | | | | 8,000 | | | | 7,842,480 | |
Sensata Technologies BV, Gtd. Notes, 144A | | | 5.000 | | | | 10/01/25 | | | | 2,750 | | | | 2,818,750 | |
| | | | | | | | | | | | | | | | |
| | | | 10,661,230 | |
See Notes to Financial Statements.
| | | | | | | | | | | | | | | | |
| Description | | Interest
Rate | | | Maturity
Date | | | Principal
Amount (000)# | | | Value (Note 1) | |
CORPORATE BONDS (Continued) | |
|
Software 0.3% | |
First Data Corp., Gtd. Notes, 144A(f) | | | 7.000 | % | | | 12/01/23 | | | | 4,150 | | | $ | 4,347,125 | |
|
Telecommunications 2.1% | |
AT&T, Inc.,
Sr. Unsec’d. Notes | | | 4.750 | | | | 05/15/46 | | | | 1,520 | | | | 1,487,436 | |
Sr. Unsec’d. Notes | | | 4.800 | | | | 06/15/44 | | | | 575 | | | | 566,084 | |
Sr. Unsec’d. Notes, 144A | | | 4.500 | | | | 03/09/48 | | | | 795 | | | | 745,623 | |
Bharti Airtel International Netherlands BV (India), Gtd. Notes, 144A | | | 5.125 | | | | 03/11/23 | | | | 3,725 | | | | 4,004,930 | |
CenturyLink, Inc., Sr. Unsec’d. Notes | | | 5.150 | | | | 06/15/17 | | | | 2,035 | | | | 2,070,612 | |
CommScope Technologies Finance LLC, Sr. Unsec’d. Notes, 144A(f) | | | 6.000 | | | | 06/15/25 | | | | 1,225 | | | | 1,286,250 | |
CommScope, Inc., Gtd. Notes, 144A | | | 5.000 | | | | 06/15/21 | | | | 2,275 | | | | 2,326,187 | |
Digicel Group Ltd. (Jamaica),
Gtd. Notes, 144A | | | 6.750 | | | | 03/01/23 | | | | 2,050 | | | | 1,839,260 | |
Sr. Unsec’d. Notes, RegS | | | 8.250 | | | | 09/30/20 | | | | 1,500 | | | | 1,327,500 | |
Sprint Communications, Inc., Gtd. Notes, 144A(b) | | | 9.000 | | | | 11/15/18 | | | | 4,802 | | | | 5,282,200 | |
TBG Global Pte Ltd. (Indonesia), Gtd. Notes, RegS | | | 4.625 | | | | 04/03/18 | | | | 1,885 | | | | 1,906,112 | |
Verizon Communications, Inc.,
Sr. Unsec’d. Notes | | | 4.672 | | | | 03/15/55 | | | | 1,011 | | | | 985,583 | |
Sr. Unsec’d. Notes | | | 5.012 | | | | 08/21/54 | | | | 3,010 | | | | 3,103,680 | |
Vimpel Communications Via VIP Finance Ireland Ltd. OJSC (Russia),
Sr. Unsec’d. Notes, 144A | | | 9.125 | | | | 04/30/18 | | | | 1,300 | | | | 1,411,478 | |
Sr. Unsec’d. Notes, RegS | | | 9.125 | | | | 04/30/18 | | | | 2,335 | | | | 2,535,231 | |
Virgin Media Secured Finance PLC (United Kingdom),
Sr. Sec’d. Notes, 144A | | | 6.000 | | | | 04/15/21 | | | GBP | 720 | | | | 920,942 | |
| | | | | | | | | | | | | | | | |
| | | | 31,799,108 | |
|
Textiles | |
Mohawk Industries, Inc., Sr. Unsec’d. Notes | | | 3.850 | | | | 02/01/23 | | | | 104 | | | | 108,327 | |
|
Transportation 0.4% | |
AP Moeller-Maersk A/S (Denmark), Unsec’d. Notes, 144A | | | 2.550 | | | | 09/22/19 | | | | 2,450 | | | | 2,473,691 | |
Onorato Armatori SpA (Italy), Sr. Unsec’d. Notes, 144A | | | 7.750 | | | | 02/15/23 | | | EUR | 3,000 | | | | 3,120,369 | |
Union Pacific Corp., Sr. Unsec’d. Notes, 144A | | | 3.799 | | | | 10/01/51 | | | | 207 | | | | 204,494 | |
| | | | | | | | | | | | | | | | |
| | | | 5,798,554 | |
|
Trucking & Leasing | |
Penske Truck Leasing Co. LP/PTL Finance Corp.,
Sr. Unsec’d. Notes, 144A
(original cost $449,024; purchased 01/14/13)(b)(d) | | | 2.875 | | | | 07/17/18 | | | | 450 | | | | 458,168 | |
| | | | | | | | | | | | | | | | |
TOTAL CORPORATE BONDS
(cost $598,000,744) | | | | 596,159,088 | |
| | | | | | | | | | | | | | | | |
See Notes to Financial Statements.
| | | | |
| Prudential Absolute Return Bond Fund | | | 35 | |
Portfolio of Investments (continued)
as of October 31, 2016
| | | | | | | | | | | | | | | | |
| Description | | Interest
Rate | | | Maturity
Date | | | Principal
Amount (000)# | | | Value (Note 1) | |
MUNICIPAL BONDS 1.0% | |
|
California 0.6% | |
Bay Area Toll Authority, BABs, Revenue Bonds | | | 6.263 | % | | | 04/01/49 | | | | 550 | | | $ | 799,414 | |
Los Angeles Department of Water & Power,
BABs, Revenue Bonds | | | 6.008 | | | | 07/01/39 | | | | 3,610 | | | | 4,738,739 | |
BABs, Revenue Bonds | | | 6.574 | | | | 07/01/45 | | | | 585 | | | | 860,470 | |
University of California,
BABs, Revenue Bonds | | | 5.770 | | | | 05/15/43 | | | | 390 | | | | 502,706 | |
Taxable, Revenue Bonds, Series AP | | | 3.931 | | | | 05/15/45 | | | | 625 | | | | 646,500 | |
Taxable, Revenue Bonds, Series J | | | 4.131 | | | | 05/15/45 | | | | 675 | | | | 716,202 | |
| | | | | | | | | | | | | | | | |
| | | | 8,264,031 | |
|
Colorado 0.1% | |
Regional Transportation District, BABs, Revenue Bonds, Series 2010B | | | 5.844 | | | | 11/01/50 | | | | 1,190 | | | | 1,661,395 | |
|
Illinois | |
Chicago O’Hare International Airport, BABs, Revenue Bonds | | | 6.395 | | | | 01/01/40 | | | | 360 | | | | 498,730 | |
|
New Jersey 0.2% | |
New Jersey State Turnpike Authority, Revenue Bonds, Series F, BABs | | | 7.414 | | | | 01/01/40 | | | | 2,000 | | | | 3,035,820 | |
Rutgers State University, BABs, Revenue Bonds | | | 5.665 | | | | 05/01/40 | | | | 200 | | | | 248,996 | |
| | | | | | | | | | | | | | | | |
| | | | 3,284,816 | |
|
New York 0.1% | |
Memorial Sloan-Kettering Cancer Center, Sr. Unsec’d. Notes | | | 4.125 | | | | 07/01/52 | | | | 75 | | | | 78,793 | |
New York City Water & Sewer System, BABs, Taxable, Revenue Bonds | | | 5.882 | | | | 06/15/44 | | | | 400 | | | | 555,900 | |
| | | | | | | | | | | | | | | | |
| | | | 634,693 | |
|
Ohio | |
Ohio State University, Taxable, Revenue Bonds, Series A | | | 4.800 | | | | 06/01/2111 | | | | 180 | | | | 194,789 | |
|
Texas | |
City Public Service Board of San Antonio, BABs, Taxable, Revenue Bonds | | | 4.427 | | | | 02/01/42 | | | | 120 | | | | 136,796 | |
| | | | | | | | | | | | | | | | |
TOTAL MUNICIPAL BONDS
(cost $13,895,601) | | | | 14,675,250 | |
| | | | | | | | | | | | | | | | |
See Notes to Financial Statements.
| | | | | | | | | | | | | | | | |
| Description | | Interest
Rate | | | Maturity
Date | | | Principal
Amount (000)# | | | Value (Note 1) | |
NON-CORPORATE FOREIGN AGENCIES 1.4% | |
Comision Federal de Electricidad (Mexico), Sr. Unsec’d. Notes, 144A | | | 4.875 | % | | | 01/15/24 | | | | 1,350 | | | $ | 1,404,000 | |
Gazprom OAO Via Gaz Capital SA (Russia), Sr. Unsec’d. Notes, 144A | | | 4.950 | | | | 07/19/22 | | | | 730 | | | | 749,598 | |
Sr. Unsec’d. Notes, 144A | | | 6.510 | | | | 03/07/22 | | | | 3,420 | | | | 3,747,643 | |
KazMunayGas National Co. JSC (Kazakhstan), Sr. Unsec’d. Notes, 144A, MTN | | | 9.125 | | | | 07/02/18 | | | | 2,285 | | | | 2,505,589 | |
Majapahit Holding BV (Indonesia),
Gtd. Notes, RegS | | | 7.750 | | | | 01/20/20 | | | | 2,180 | | | | 2,496,100 | |
Gtd. Notes, RegS | | | 8.000 | | | | 08/07/19 | | | | 2,250 | | | | 2,570,175 | |
Petrobras Global Finance BV (Brazil), Gtd. Notes | | | 8.375 | | | | 05/23/21 | | | | 3,875 | | | | 4,286,912 | |
Provincia de Buenos Aires (Argentina), Sr. Unsec’d. Notes, 144A | | | 9.950 | | | | 06/09/21 | | | | 1,050 | | | | 1,197,000 | |
Russian Agricultural Bank OJSC Via RSHB Capital SA (Russia),
Sr. Unsec’d. Notes, 144A | | | 6.299 | | | | 05/15/17 | | | | 325 | | | | 330,701 | |
Sr. Unsec’d. Notes, 144A | | | 7.750 | | | | 05/29/18 | | | | 1,485 | | | | 1,582,178 | |
| | | | | | | | | | | | | | | | |
TOTAL NON-CORPORATE FOREIGN AGENCIES
(cost $20,230,104) | | | | 20,869,896 | |
| | | | | | | | | | | | | | | | |
|
RESIDENTIAL MORTGAGE-BACKED SECURITIES 8.8% | |
Banc of America Funding Corp.,
Series 2014-R2, Class 2A1, 144A | | | 0.735 | (a) | | | 05/26/37 | | | | 3,148 | | | | 2,967,313 | |
Series 2014-R5, Class 1A1, 144A | | | 2.748 | (a) | | | 09/26/45 | | | | 4,741 | | | | 4,654,002 | |
Series 2015-R3, Class 1A1, 144A | | | 0.724 | (a) | | | 03/27/36 | | | | 15,391 | | | | 14,655,024 | |
Series 2015-R3, Class 6A1, 144A | | | 0.695 | (a) | | | 05/28/36 | | | | 3,925 | | | | 3,713,926 | |
Series 2015-R4, Class 4A1, 144A | | | 3.500 | (a) | | | 07/26/36 | | | | 4,045 | | | | 4,071,300 | |
Chase Mortgage Finance Trust, Series 2007-A1, Class 1A3 | | | 3.063 | (a) | | | 02/25/37 | | | | 274 | | | | 270,802 | |
Fannie Mae Connecticut Avenue Securities, Series 2013-CO1, Class M2(h) | | | 5.784 | (a) | | | 10/25/23 | | | | 3,540 | | | | 3,894,439 | |
Freddie Mac Structured Agency Credit Risk Debt Notes, Series 2015-DNA1, Class M3(h) | | | 3.834 | (a) | | | 10/25/27 | | | | 2,000 | | | | 2,050,960 | |
GSMSC Resecuritization Trust,
Series 2015-3R, Class 1A1, 144A | | | 0.665 | (a) | | | 01/26/37 | | | | 4,251 | | | | 4,093,012 | |
Series 2015-3R, Class 1A2, 144A | | | 0.665 | (a) | | | 01/26/37 | | | | 1,670 | | | | 1,377,762 | |
Series 2015-3R, Class 2A1, 144A | | | 0.665 | (a) | | | 10/26/36 | | | | 5,083 | | | | 4,817,244 | |
Series 2015-3R, Class 2A2, 144A | | | 0.665 | (a) | | | 10/26/36 | | | | 1,400 | | | | 1,048,339 | |
Series 2015-4R, Class A1, 144A | | | 0.665 | (a) | | | 03/26/37 | | | | 9,956 | | | | 9,490,359 | |
Series 2015-4R, Class A2, 144A | | | 0.665 | (a) | | | 03/26/37 | | | | 2,702 | | | | 2,127,457 | |
JPMorgan Mortgage Trust, Series 2007-A1, Class 4A1 | | | 3.185 | (a) | | | 07/25/35 | | | | 271 | | | | 270,399 | |
JPMorgan Resecuritization Trust, Series 2015-1, Class 6A1, 144A | | | 0.814 | (a) | | | 12/27/45 | | | | 3,374 | | | | 3,232,784 | |
See Notes to Financial Statements.
| | | | |
| Prudential Absolute Return Bond Fund | | | 37 | |
Portfolio of Investments (continued)
as of October 31, 2016
| | | | | | | | | | | | | | | | |
| Description | | Interest
Rate | | | Maturity
Date | | | Principal
Amount (000)# | | | Value (Note 1) | |
RESIDENTIAL MORTGAGE-BACKED SECURITIES (Continued) | |
LSTAR Securities Investment Trust,
Series 2014-2, Class A, 144A | | | 2.527 | %(a) | | | 12/01/21 | | | | 7,976 | | | $ | 7,896,007 | |
Series 2015-2, Class A, 144A | | | 2.527 | (a) | | | 01/01/20 | | | | 11,357 | | | | 11,298,805 | |
Series 2015-3, Class A, 144A | | | 2.527 | (a) | | | 03/01/20 | | | | 9,241 | | | | 9,204,301 | |
LSTAR Securities Investment Trust, (Cayman Islands),
Series 2015-6, Class A, 144A(c) | | | 2.527 | (a) | | | 05/01/20 | | | | 15,986 | | | | 15,706,240 | |
Series 2015-8, Class A2, 144A | | | 4.027 | (a) | | | 08/01/20 | | | | 7,500 | | | | 7,401,410 | |
Series 2015-9, Class A1, 144A | | | 2.527 | (a) | | | 10/01/20 | | | | 4,376 | | | | 4,333,197 | |
Series 2016-1, Class A1, 144A | | | 2.527 | (a) | | | 01/01/21 | | | | 9,477 | | | | 9,291,109 | |
Series 2016-3, Class A, 144A | | | 2.527 | (a) | | | 09/01/21 | | | | 2,864 | | | | 2,843,540 | |
Structured Asset Securities Corp.,
Series 2003-37A, Class 3A7 | | | 2.979 | (a) | | | 12/25/33 | | | | 1,147 | | | | 1,128,390 | |
Structured Asset Securities Corp. Mortgage Pass-Through Certificates, Series 2003-30, Class 2A1 | | | 5.082 | (a) | | | 10/25/33 | | | | 391 | | | | 396,991 | |
Wells Fargo Mortgage-Backed Securities Trust, Series 2004-EE, Class 2A1 | | | 3.028 | (a) | | | 12/25/34 | | | | 232 | | | | 233,517 | |
| | | | | | | | | | | | | | | | |
TOTAL RESIDENTIAL MORTGAGE-BACKED SECURITIES
(cost $131,525,657) | | | | 132,468,629 | |
| | | | | | | | | | | | | | | | |
|
SOVEREIGN BONDS 3.8% | |
Argentina Bonar Bond (Argentina),
Sr. Unsec’d. Notes | | | 7.000 | | | | 04/17/17 | | | | 1,900 | | | | 1,936,582 | |
Argentine Republic Government International Bond (Argentina), Sr. Unsec’d. Notes, 144A | | | 6.875 | | | | 04/22/21 | | | | 7,175 | | | | 7,763,350 | |
Cyprus Government International Bond (Cyprus),
Sr. Unsec’d. Notes, 144A, EMTN, RegS | | | 4.625 | | | | 02/03/20 | | | EUR | 300 | | | | 356,167 | |
Dominican Republic International Bond (Dominican Republic),
Sr. Unsec’d. Notes, 144A | | | 7.500 | | | | 05/06/21 | | | | 500 | | | | 550,100 | |
Sr. Unsec’d. Notes, RegS | | | 7.500 | | | | 05/06/21 | | | | 2,890 | | | | 3,179,578 | |
Hellenic Republic Government International Bond (Greece), Sr. Unsec’d. Notes, EMTN(b) | | | 3.800 | | | | 08/08/17 | | | JPY | 1,010,000 | | | | 9,197,096 | |
Hungary Government International Bond (Hungary),
Sr. Unsec’d. Notes | | | 2.110 | | | | 10/26/17 | | | JPY | 400,000 | | | | 3,809,772 | |
Sr. Unsec’d. Notes | | | 6.375 | | | | 03/29/21 | | | | 6,470 | | | | 7,464,116 | |
Indonesia Government International Bond (Indonesia),
Sr. Unsec’d. Notes, 144A | | | 3.375 | | | | 07/30/25 | | | EUR | 2,975 | | | | 3,530,500 | |
Sr. Unsec’d. Notes, 144A, MTN | | | 3.750 | | | | 06/14/28 | | | EUR | 775 | | | | 913,146 | |
Peru Enhanced Pass-Through Finance Ltd. (Peru), Pass-Through Certificates, RegS | | | 1.610 | (i) | | | 05/31/18 | | | | 215 | | | | 210,268 | |
See Notes to Financial Statements.
| | | | | | | | | | | | | | | | |
| Description | | Interest
Rate | | | Maturity
Date | | | Principal
Amount (000)# | | | Value (Note 1) | |
SOVEREIGN BONDS (Continued) | |
Portugal Government International Bond (Portugal), Unsec’d. Notes, 144A, MTN | | | 5.125 | % | | | 10/15/24 | | | | 9,100 | | | $ | 9,009,000 | |
Unsec’d. Notes, MTN, RegS | | | 5.125 | | | | 10/15/24 | | | | 5,400 | | | | 5,346,000 | |
Romanian Government International Bond (Romania), Sr. Unsec’d. Notes, MTN, RegS | | | 6.125 | | | | 01/22/44 | | | | 1,880 | | | | 2,440,973 | |
Turkey Government International Bond (Turkey), Sr. Unsec’d. Notes | | | 5.625 | | | | 03/30/21 | | | | 1,450 | | | | 1,531,302 | |
| | | | | | | | | | | | | | | | |
TOTAL SOVEREIGN BONDS
(cost $56,637,811) | | | | 57,237,950 | |
| | | | | | | | | | | | | | | | |
|
U.S. TREASURY OBLIGATIONS 0.5% | |
U.S. Treasury Bonds(e)(j) | | | 2.500 | | | | 05/15/46 | | | | 8,110 | | | | 7,961,425 | |
U.S. Treasury Notes(e) | | | 0.750 | | | | 07/31/18 | | | | 250 | | | | 249,629 | |
| | | | | | | | | | | | | | | | |
TOTAL U.S. TREASURY OBLIGATIONS
(cost $8,572,420) | | | | | | | | | | | | | | | 8,211,054 | |
| | | | | | | | | | | | | | | | |
TOTAL LONG-TERM INVESTMENTS
(cost $1,433,939,869) | | | | | | | | | | | | | | | 1,432,410,172 | |
| | | | | | | | | | | | | | | | |
| | | | |
| | | | | | | | | Shares | | | | |
| | | | |
SHORT-TERM INVESTMENTS 5.9% | | | | | | | | | | | | | | | | |
| | | | |
AFFILIATED MUTUAL FUNDS | | | | | | | | | | | | | | | | |
Prudential Investment Portfolios 2 - Prudential Core Ultra Short Bond Fund(k) | | | | | | | | | | | 16,761,612 | | | | 16,761,612 | |
Prudential Investment Portfolios 2 - Prudential Institutional Money Market Fund
(cost $71,879,056; includes $71,847,552 of cash collateral for securities on loan)(k)(l) | | | | | | | | | | | 71,876,099 | | | | 71,890,474 | |
| | | | | | | | | | | | | | | | |
TOTAL SHORT-TERM INVESTMENTS
(cost $88,640,668)(Note 3) | | | | | | | | | | | | | | | 88,652,086 | |
| | | | | | | | | | | | | | | | |
TOTAL INVESTMENTS 100.7%
(cost $1,522,580,537) (Note 5) | | | | | | | | | | | | | | | 1,521,062,258 | |
Liabilities in excess of other assets(m) (0.7)% | | | | | | | | | | | | | | | (10,116,402 | ) |
| | | | | | | | | | | | | | | | |
NET ASSETS 100.0% | | | | | | | | | | | | | | $ | 1,510,945,856 | |
| | | | | | | | | | | | | | | | |
The following abbreviations are used in the annual report:
| * | Non-income producing security. |
144A—Security was purchased pursuant to Rule 144A under the Securities Act of 1933 and may not be resold subject to that rule except to qualified institutional buyers. Unless otherwise noted, 144A securities are deemed to be liquid.
RegS—Regulation S. Security was purchased pursuant to Regulation S and may not be offered, sold or delivered within the United States or to, or for the account or benefit of, U.S. persons, except pursuant to an exemption from, or in a transaction not subject to, the registration requirements of the Securities Act of 1933.
ABS—Asset-Backed Security
See Notes to Financial Statements.
| | | | |
| Prudential Absolute Return Bond Fund | | | 39 | |
Portfolio of Investments (continued)
as of October 31, 2016
AUD—Australian Dollar
BABs—Build America Bonds
BBR—New Zealand Bank Bill Rate
BBSW—Australian Bank Bill Swap Reference Rate
bps—Basis Points
BRL—Brazilian Real
CAD—Canadian Dollar
CAS—Connecticut Avenue Securities
CDO—Collateralized Debt Obligation
CDS—Credit Default Swap
CDX—Credit Derivative Index
CHF—Swiss Franc
CLO—Collateralized Loan Obligation
CMBX—Commercial Mortgage Backed Securities Index
CMM—Constant Maturity Mortgage
CMT—Constant Maturity Treasury Yield
CNH—Chinese Renminbi
COP—Colombian Peso
EMTN—Euro Medium Term Note
EUR—Euro
EURIBOR—Euro Interbank Offered Rate
FHLMC—Federal Home Loan Mortgage Corp.
GBP—British Pound
HUF—Hungarian Forint
IDR—Indonesian Rupiah
ILS—Israeli Shekel
INR—Indian Rupee
IO—Interest Only (Principal amount represents notional)
JPY—Japanese Yen
L2—Level 2
L3—Level 3
LIBOR—London Interbank Offered Rate
MTN—Medium Term Note
MXN—Mexican Peso
MYR—Malaysian Ringgit
NIBOR—Norwegian Interbank Offered Rate
NOK—Norwegian Krone
NZD—New Zealand Dollar
OIS—Overnight Index Swap
OTC—Over-the-counter
PEN—Peruvian Nuevo Sol
PHP—Philippine Peso
PIK—Payment-in-Kind
PLN—Polish Zloty
REITs—Real Estate Investment Trusts
RUB—Russian Ruble
SEK—Swedish Krona
SGD—Singapore Dollar
STACR—Structured Agency Credit Risk
See Notes to Financial Statements.
STIBOR—Stockholm Interbank Offered Rate
TELBOR—Tel Aviv Interbank Offered Rate
THB—Thai Baht
TRY—Turkish Lira
TWD—New Taiwanese Dollar
USOIS—United States Overnight Index Swap
WIBOR—Warsaw Interbank Offered Rate
ZAR—South African Rand
| # | Principal or notional amount is shown in U.S. dollars unless otherwise stated. |
| (a) | Variable rate instrument. The interest rate shown reflects the rate in effect at October 31, 2016. |
| (b) | Indicates a security that has been deemed illiquid. (unaudited) |
| (c) | Indicates a Level 3 security. The aggregate value of Level 3 securities is $17,181,509 and 1.1% of net assets. |
| (d) | Indicates a restricted security; the aggregate original cost of such securities is $29,843,638. The aggregate value, $29,418,091, is approximately 1.9% of net assets. |
| (e) | Represents security, or a portion thereof, segregated as collateral for OTC swap agreements. |
| (f) | All or a portion of security is on loan. The aggregate market value of such securities, including those sold and pending settlement, is $70,419,438; cash collateral of $71,847,552 (included in liabilities) was received with which the Fund purchased highly liquid short-term investments. Securities on loan are subject to contractual netting arrangements. |
| (g) | Represents issuer in default on interest payments and/or principal repayment; non-income producing security. |
| (h) | Represents CAS issued by Fannie Mae or STACR securities issued by Freddie Mac. |
| (i) | Represents zero coupon bond or principal only securities. Rate represents yield to maturity at purchase date. |
| (j) | Represents security, or a portion thereof, segregated as collateral for futures contracts. |
| (k) | Prudential Investments LLC, the manager of the Fund, also serves as manager of the Prudential Investment Portfolios 2 - Prudential Core Ultra Short Bond Fund and the Prudential Investment Portfolios 2 - Prudential Institutional Money Market Fund. |
| (l) | Represents security purchased with cash collateral received for securities on loan and includes dividend reinvestment. |
| (m) | Includes net unrealized appreciation (depreciation) on the following derivative contracts held at reporting period end: |
Futures contracts outstanding at October 31, 2016:
| | | | | | | | | | | | | | | | | | | | |
Number of
Contracts | | | Type | | Expiration
Date | | | Value at
Trade Date | | | Value at
October 31,
2016 | | | Unrealized
Appreciation
(Depreciation) | |
| | | | Long Positions: | | | | | | | | | | | | | | | | |
| | 2,834 | | | 5 Year U.S. Treasury Notes | | | Dec. 2016 | | | $ | 343,892,348 | | | $ | 342,338,344 | | | $ | (1,554,004 | ) |
| | 62 | | | 10 Year Euro-Bund | | | Dec. 2016 | | | | 11,034,081 | | | | 11,037,423 | | | | 3,342 | |
| | 3,853 | | | 10 Year U.S. Treasury Notes | | | Dec. 2016 | | | | 504,940,667 | | | | 499,445,125 | | | | (5,495,542 | ) |
| | 690 | | | 30 Year U.S. Ultra Treasury Bonds | | | Dec. 2016 | | | | 127,977,994 | | | | 121,396,875 | | | | (6,581,119 | ) |
| | 816 | | | 90 Day Sterling | | | Dec. 2016 | | | | 99,486,949 | | | | 99,469,320 | | | | (17,629 | ) |
| | | | | | | | | | | | | | | | | | | | |
| | | | | | | | | | | | | | | | | | | (13,644,952 | ) |
| | | | | | | | | | | | | | | | | | | | |
| | | | Short Positions: | | | | | | | | | | | | | | | | |
| | 792 | | | 2 Year U.S. Treasury Notes | | | Dec. 2016 | | | | 172,821,546 | | | | 172,767,375 | | | | 54,171 | |
| | 682 | | | 20 Year U.S. Treasury Bonds | | | Dec. 2016 | | | | 115,490,481 | | | | 110,974,188 | | | | 4,516,293 | |
| | 24 | | | 30 Year Euro-Buxl | | | Dec. 2016 | | | | 4,739,643 | | | | 4,739,140 | | | | 503 | |
| | | | | | | | | | | | | | | | | | | | |
| | | | | | | | | | | | | | | | | | | 4,570,967 | |
| | | | | | | | | | | | | | | | | | | | |
| | | | | | | | | | | | | | | | | | $ | (9,073,985 | ) |
| | | | | | | | | | | | | | | | | | | | |
Cash of $7,909,000 and a U.S. Treasury Obligation with a market value of $1,433,253 have been segregated with Goldman Sachs & Co. to cover requirements for open futures contracts at October 31, 2016.
See Notes to Financial Statements.
| | | | |
| Prudential Absolute Return Bond Fund | | | 41 | |
Portfolio of Investments (continued)
as of October 31, 2016
Forward foreign currency exchange contracts outstanding at October 31, 2016:
| | | | | | | | | | | | | | | | | | | | | | | | |
Purchase Contracts | | Counterparty | | | Notional
Amount
(000) | | | Value at
Settlement
Date | | | Current
Value | | | Unrealized
Appreciation
(Depreciation) | |
OTC forward foreign currency exchange contracts: | |
Australian Dollar, | | | | | | | | | | | | | | | | | | | | | | | | |
Expiring 01/13/2017 | | | Bank of America | | | | AUD | | | | 967 | | | $ | 735,516 | | | $ | 733,921 | | | $ | (1,595 | ) |
Expiring 01/13/2017 | | | Bank of America | | | | AUD | | | | 772 | | | | 587,885 | | | | 586,500 | | | | (1,385 | ) |
Expiring 01/13/2017 | | | Citigroup Global Markets | | | | AUD | | | | 7,806 | | | | 5,887,779 | | | | 5,927,190 | | | | 39,411 | |
Expiring 01/13/2017 | | | Goldman Sachs & Co. | | | | AUD | | | | 775 | | | | 587,885 | | | | 588,321 | | | | 436 | |
Expiring 01/13/2017 | | | JPMorgan Chase | | | | AUD | | | | 966 | | | | 735,515 | | | | 733,821 | | | | (1,694 | ) |
Brazilian Real, | | | | | | | | | | | | | | | | | | | | | | | | |
Expiring 11/03/2016 | | | Goldman Sachs & Co. | | | | BRL | | | | 2,556 | | | | 781,998 | | | | 800,129 | | | | 18,131 | |
Expiring 11/03/2016 | | | Goldman Sachs & Co. | | | | BRL | | | | 2,408 | | | | 739,687 | | | | 753,700 | | | | 14,013 | |
Expiring 11/03/2016 | |
| Hong Kong & Shanghai
Bank |
| | | BRL | | | | 4,700 | | | | 1,472,452 | | | | 1,471,081 | | | | (1,371 | ) |
Expiring 12/02/2016 | |
| Credit Suisse First
Boston Corp. |
| | | BRL | | | | 9,665 | | | | 3,055,827 | | | | 2,997,711 | | | | (58,116 | ) |
Expiring 12/02/2016 | | | UBS AG | | | | BRL | | | | 3,792 | | | | 1,200,000 | | | | 1,176,192 | | | | (23,808 | ) |
British Pound, | | | | | | | | | | | | | | | | | | | | | | | | |
Expiring 01/27/2017 | | | Bank of America | | | | GBP | | | | 2,018 | | | | 2,487,413 | | | | 2,475,619 | | | | (11,794 | ) |
Expiring 01/27/2017 | | | UBS AG | | | | GBP | | | | 3,311 | | | | 4,025,400 | | | | 4,061,785 | | | | 36,385 | |
Canadian Dollar, | | | | | | | | | | | | | | | | | | | | | | | | |
Expiring 01/13/2017 | | | Citigroup Global Markets | | | | CAD | | | | 3,108 | | | | 2,362,930 | | | | 2,318,533 | | | | (44,397 | ) |
Expiring 01/13/2017 | | | UBS AG | | | | CAD | | | | 2,481 | | | | 1,869,327 | | | | 1,850,514 | | | | (18,813 | ) |
Colombian Peso, | | | | | | | | | | | | | | | | | | | | | | | | |
Expiring 11/10/2016 | | | Bank of America | | | | COP | | | | 2,270,884 | | | | 777,700 | | | | 753,999 | | | | (23,701 | ) |
Euro, | | | | | | | | | | | | | | | | | | | | | | | | |
Expiring 01/27/2017 | | | Goldman Sachs & Co. | | | | EUR | | | | 7,069 | | | | 7,727,656 | | | | 7,792,794 | | | | 65,138 | |
Indian Rupee, | | | | | | | | | | | | | | | | | | | | | | | | |
Expiring 12/09/2016 | | | Citigroup Global Markets | | | | INR | | | | 79,633 | | | | 1,182,724 | | | | 1,185,379 | | | | 2,655 | |
Expiring 01/20/2017 | | | Citigroup Global Markets | | | | INR | | | | 95,770 | | | | 1,415,871 | | | | 1,416,798 | | | | 927 | |
Expiring 01/20/2017 | | | Goldman Sachs & Co. | | | | INR | | | | 96,790 | | | | 1,432,775 | | | | 1,431,890 | | | | (885 | ) |
Expiring 01/20/2017 | | | Goldman Sachs & Co. | | | | INR | | | | 79,317 | | | | 1,175,770 | | | | 1,173,409 | | | | (2,361 | ) |
Indonesian Rupiah, | | | | | | | | | | | | | | | | | | | | | | | | |
Expiring 11/22/2016 | | | Citigroup Global Markets | | | | IDR | | | | 17,012,168 | | | | 1,287,825 | | | | 1,300,104 | | | | 12,279 | |
Expiring 11/22/2016 | | | UBS AG | | | | IDR | | | | 15,456,512 | | | | 1,183,501 | | | | 1,181,218 | | | | (2,283 | ) |
Expiring 01/20/2017 | | | Citigroup Global Markets | | | | IDR | | | | 18,881,252 | | | | 1,432,775 | | | | 1,429,103 | | | | (3,672 | ) |
Japanese Yen, | | | | | | | | | | | | | | | | | | | | | | | | |
Expiring 01/27/2017 | | | UBS AG | | | | JPY | | | | 348,323 | | | | 3,352,952 | | | | 3,334,119 | | | | (18,833 | ) |
Malaysian Ringgit, | | | | | | | | | | | | | | | | | | | | | | | | |
Expiring 11/10/2016 | | | UBS AG | | | | MYR | | | | 1,773 | | | | 429,697 | | | | 422,405 | | | | (7,292 | ) |
Expiring 12/09/2016 | | | JPMorgan Chase | | | | MYR | | | | 6,111 | | | | 1,477,677 | | | | 1,453,618 | | | | (24,059 | ) |
Expiring 12/21/2016 | | | Bank of America | | | | MYR | | | | 4,917 | | | | 1,183,496 | | | | 1,169,104 | | | | (14,392 | ) |
Expiring 12/21/2016 | |
| Credit Suisse First
Boston Corp. |
| | | MYR | | | | 11,243 | | | | 2,719,009 | | | | 2,673,016 | | | | (45,993 | ) |
See Notes to Financial Statements.
| | | | | | | | | | | | | | | | | | | | | | |
Purchase Contracts | | Counterparty | | Notional
Amount
(000) | | | Value at
Settlement
Date | | | Current
Value | | | Unrealized
Appreciation
(Depreciation) | |
OTC forward foreign currency exchange contracts (cont’d): | |
Mexican Peso, | | | | | | | | | | | | | | | | | | | | | | |
Expiring 01/20/2017 | | Goldman Sachs & Co. | | | MXN | | | | 21,194 | | | $ | 1,106,736 | | | $ | 1,111,211 | | | $ | 4,475 | |
New Taiwanese Dollar, | | | | | | | | | | | | | | | | | | | | | | |
Expiring 12/15/2016 | | Bank of America | | | TWD | | | | 56,326 | | | | 1,803,586 | | | | 1,786,610 | | | | (16,976 | ) |
New Zealand Dollar, | | | | | | | | | | | | | | | | | | | | | | |
Expiring 01/13/2017 | | Goldman Sachs & Co. | | | NZD | | | | 1,102 | | | | 777,300 | | | | 786,189 | | | | 8,889 | |
Expiring 01/13/2017 | | UBS AG | | | NZD | | | | 1,638 | | | | 1,175,770 | | | | 1,167,900 | | | | (7,870 | ) |
Norwegian Krone, | | | | | | | | | | | | | | | | | | | | | | |
Expiring 01/25/2017 | | UBS AG | | | NOK | | | | 25,173 | | | | 3,087,732 | | | | 3,047,505 | | | | (40,227 | ) |
Peruvian Nuevo Sol, | | | | | | | | | | | | | | | | | | | | | | |
Expiring 12/09/2016 | | Citigroup Global Markets | | | PEN | | | | 2,889 | | | | 850,170 | | | | 854,876 | | | | 4,706 | |
Expiring 01/23/2017 | | Citigroup Global Markets | | | PEN | | | | 575 | | | | 167,092 | | | | 169,395 | | | | 2,303 | |
Expiring 01/23/2017 | | Goldman Sachs & Co. | | | PEN | | | | 575 | | | | 167,408 | | | | 169,395 | | | | 1,987 | |
Philippine Peso, | | | | | | | | | | | | | | | | | | | | | | |
Expiring 01/20/2017 | | Citigroup Global Markets | | | PHP | | | | 46,248 | | | | 952,790 | | | | 954,097 | | | | 1,307 | |
Polish Zloty, | | | | | | | | | | | | | | | | | | | | | | |
Expiring 01/25/2017 | | Goldman Sachs & Co. | | | PLN | | | | 8,220 | | | | 2,086,060 | | | | 2,091,888 | | | | 5,828 | |
Russian Ruble, | | | | | | | | | | | | | | | | | | | | | | |
Expiring 12/09/2016 | | Credit Suisse First Boston Corp. | | | RUB | | | | 192,961 | | | | 3,043,405 | | | | 3,012,141 | | | | (31,264 | ) |
Singapore Dollar, | | | | | | | | | | | | | | | | | | | | | | |
Expiring 12/21/2016 | | Bank of America | | | SGD | | | | 1,635 | | | | 1,182,142 | | | | 1,175,339 | | | | (6,803 | ) |
South African Rand, | | | | | | | | | | | | | | | | | | | | | | |
Expiring 01/13/2017 | | Citigroup Global Markets | | | ZAR | | | | 6,604 | | | | 456,330 | | | | 482,376 | | | | 26,046 | |
Expiring 01/13/2017 | | Citigroup Global Markets | | | ZAR | | | | 6,451 | | | | 464,099 | | | | 471,166 | | | | 7,067 | |
Expiring 01/13/2017 | | Citigroup Global Markets | | | ZAR | | | | 1,873 | | | | 129,185 | | | | 136,780 | | | | 7,595 | |
Expiring 01/13/2017 | | Hong Kong & Shanghai Bank | | | ZAR | | | | 4,637 | | | | 320,970 | | | | 338,706 | | | | 17,736 | |
Thai Baht, | | | | | | | | | | | | | | | | | | | | | | |
Expiring 11/22/2016 | | Citigroup Global Markets | | | THB | | | | 40,960 | | | | 1,173,544 | | | | 1,169,793 | | | | (3,751 | ) |
Expiring 01/20/2017 | | Citigroup Global Markets | | | THB | | | | 62,935 | | | | 1,754,173 | | | | 1,796,324 | | | | 42,151 | |
Expiring 01/20/2017 | | Citigroup Global Markets | | | THB | | | | 62,934 | | | | 1,758,918 | | | | 1,796,289 | | | | 37,371 | |
Turkish Lira, | | | | | | | | | | | | | | | | | | | | | | |
Expiring 11/18/2016 | | Citigroup Global Markets | | | TRY | | | | 5,290 | | | | 1,779,570 | | | | 1,703,129 | | | | (76,441 | ) |
| | | | | | | | | | | | | | | | | | | | | | |
| | | | | | | | | | | | $ | 77,546,022 | | | $ | 77,413,082 | | | | (132,940 | ) |
| | | | | | | | | | | | | | | | | | | | | | |
| | | | | | | | | | | | | | | | | | | | | | |
Sale Contracts | | Counterparty | | Notional
Amount
(000) | | | Value at
Settlement
Date | | | Current
Value | | | Unrealized
Appreciation
(Depreciation) | |
OTC forward foreign currency exchange contracts: | |
Australian Dollar, | | | | | | | | | | | | | | | | | | | | | | |
Expiring 01/13/2017 | | Goldman Sachs & Co. | | AUD | | | | | 1,548 | | | $ | 1,173,452 | | | $ | 1,175,516 | | | $ | (2,064 | ) |
Expiring 01/13/2017 | | Goldman Sachs & Co. | | AUD | | | | | 1,030 | | | | 777,300 | | | | 781,740 | | | | (4,440 | ) |
See Notes to Financial Statements.
| | | | |
| Prudential Absolute Return Bond Fund | | | 43 | |
Portfolio of Investments (continued)
as of October 31, 2016
| | | | | | | | | | | | | | | | | | |
Sale Contracts | | Counterparty | | Notional
Amount
(000) | | | Value at
Settlement
Date | | | Current
Value | | | Unrealized
Appreciation
(Depreciation) | |
OTC forward foreign currency exchange contracts (cont’d): | | | | | | | | | | | | | |
Brazilian Real, | | | | | | | | | | | | | | | | | | |
Expiring 11/03/2016 | | Credit Suisse First Boston Corp. | | BRL | 9,665 | | | $ | 3,082,779 | | | $ | 3,024,910 | | | $ | 57,869 | |
British Pound, | | | | | | | | | | | | | | | | | | |
Expiring 01/27/2017 | | UBS AG | | GBP | 19,301 | | | | 23,462,817 | | | | 23,674,892 | | | | (212,075 | ) |
Canadian Dollar, | | | | | | | | | | | | | | | | | | |
Expiring 01/13/2017 | | Bank of America | | CAD | 1,566 | | | | 1,181,464 | | | | 1,168,258 | | | | 13,206 | |
Expiring 01/13/2017 | | Goldman Sachs & Co. | | CAD | 1,586 | | | | 1,186,701 | | | | 1,183,228 | | | | 3,473 | |
Expiring 01/13/2017 | | Goldman Sachs & Co. | | CAD | 1,567 | | | | 1,181,465 | | | | 1,169,220 | | | | 12,245 | |
Expiring 01/13/2017 | | Goldman Sachs & Co. | | CAD | 1,565 | | | | 1,175,771 | | | | 1,167,804 | | | | 7,967 | |
Expiring 01/13/2017 | | UBS AG | | CAD | 1,570 | | | | 1,176,665 | | | | 1,170,929 | | | | 5,736 | |
Chinese Renminbi, | | | | | | | | | | | | | | | | | | |
Expiring 01/26/2017 | | Citigroup Global Markets | | CNH | 3,639 | | | | 533,252 | | | | 535,592 | | | | (2,340 | ) |
Colombian Peso, | | | | | | | | | | | | | | | | | | |
Expiring 01/23/2017 | | Citigroup Global Markets | | COP | 2,131,630 | | | | 714,833 | | | | 700,439 | | | | 14,394 | |
Euro, | | | | | | | | | | | | | | | | | | |
Expiring 01/27/2017 | | Citigroup Global Markets | | EUR | 1,725 | | | | 1,898,677 | | | | 1,901,213 | | | | (2,536 | ) |
Hungarian Forint, | | | | | | | | | | | | | | | | | | |
Expiring 01/25/2017 | | Citigroup Global Markets | | HUF | 1,162,959 | | | | 4,166,073 | | | | 4,141,199 | | | | 24,874 | |
Japanese Yen, | | | | | | | | | | | | | | | | | | |
Expiring 01/27/2017 | | Citigroup Global Markets | | JPY | 161,618 | | | | 1,549,100 | | | | 1,546,990 | | | | 2,110 | |
Expiring 01/27/2017 | | Goldman Sachs & Co. | | JPY | 146,279 | | | | 1,392,560 | | | | 1,400,167 | | | | (7,607 | ) |
Malaysian Ringgit, | | | | | | | | | | | | | | | | | | |
Expiring 12/21/2016 | | Citigroup Global Markets | | MYR | 12,070 | | | | 2,865,550 | | | | 2,869,697 | | | | (4,147 | ) |
Mexican Peso, | | | | | | | | | | | | | | | | | | |
Expiring 01/24/2017 | | Goldman Sachs & Co. | | MXN | 6,708 | | | | 356,878 | | | | 351,529 | | | | 5,349 | |
New Taiwanese Dollar, | | | | | | | | | | | | | | | | | | |
Expiring 12/15/2016 | | Citigroup Global Markets | | TWD | 29,276 | | | | 934,600 | | | | 928,619 | | | | 5,981 | |
Expiring 12/15/2016 | | UBS AG | | TWD | 37,450 | | | | 1,177,688 | | | | 1,187,896 | | | | (10,208 | ) |
Expiring 12/15/2016 | | UBS AG | | TWD | 29,547 | | | | 929,801 | | | | 937,196 | | | | (7,395 | ) |
New Zealand Dollar, | | | | | | | | | | | | | | | | | | |
Expiring 01/13/2017 | | Bank of America | | NZD | 741 | | | | 521,093 | | | | 528,238 | | | | (7,145 | ) |
Expiring 01/13/2017 | | Bank of America | | NZD | 460 | | | | 323,209 | | | | 327,807 | | | | (4,598 | ) |
Expiring 01/13/2017 | | Goldman Sachs & Co. | | NZD | 741 | | | | 521,092 | | | | 528,460 | | | | (7,368 | ) |
Expiring 01/13/2017 | | UBS AG | | NZD | 730 | | | | 513,315 | | | | 520,972 | | | | (7,657 | ) |
Norwegian Krone, | | | | | | | | | | | | | | | | | | |
Expiring 01/25/2017 | | Goldman Sachs & Co. | | NOK | 12,832 | | | | 1,549,600 | | | | 1,553,522 | | | | (3,922 | ) |
Philippine Peso, | | | | | | | | | | | | | | | | | | |
Expiring 11/29/2016 | | Citigroup Global Markets | | PHP | 31,467 | | | | 648,600 | | | | 649,774 | | | | (1,174 | ) |
Expiring 01/20/2017 | | Citigroup Global Markets | | PHP | 14,827 | | | | 303,264 | | | | 305,870 | | | | (2,606 | ) |
Singapore Dollar, | | | | | | | | | | | | | | | | | | |
Expiring 12/21/2016 | | Bank of America | | SGD | 2,380 | | | | 1,748,250 | | | | 1,711,540 | | | | 36,710 | |
Expiring 12/21/2016 | | Citigroup Global Markets | | SGD | 1,631 | | | | 1,182,142 | | | | 1,172,568 | | | | 9,574 | |
Expiring 12/21/2016 | | Citigroup Global Markets | | SGD | 1,021 | | | | 735,516 | | | | 734,357 | | | | 1,159 | |
See Notes to Financial Statements.
| | | | | | | | | | | | | | | | | | | | |
Sale Contracts | | Counterparty | | | Notional
Amount
(000) | | | Value at
Settlement
Date | | | Current
Value | | | Unrealized
Appreciation
(Depreciation) | |
OTC forward foreign currency exchange contracts (cont’d): | | | | | | | | | | | | | |
Singapore Dollar (cont’d.), | | | | | | | | | | | | | | | | | | | | |
Expiring 12/21/2016 | | | Hong Kong & Shanghai Bank | | | SGD | 711 | | | $ | 521,326 | | | $ | 511,142 | | | $ | 10,184 | |
Expiring 12/21/2016 | | | Hong Kong & Shanghai Bank | | | SGD | 711 | | | | 521,328 | | | | 511,084 | | | | 10,244 | |
Expiring 12/21/2016 | | | Hong Kong & Shanghai Bank | | | SGD | 700 | | | | 513,545 | | | | 503,436 | | | | 10,109 | |
Expiring 12/21/2016 | | | JPMorgan Chase | | | SGD | 1,021 | | | | 735,516 | | | | 734,403 | | | | 1,113 | |
Expiring 12/21/2016 | | | UBS AG | | | SGD | 1,635 | | | | 1,176,825 | | | | 1,175,595 | | | | 1,230 | |
South African Rand, | | | | | | | | | | | | | | | | | | | | |
Expiring 01/13/2017 | | | Citigroup Global Markets | | | ZAR | 45,606 | | | | 3,127,047 | | | | 3,330,995 | | | | (203,948 | ) |
Swedish Krona, | | | | | | | | | | | | | | | | | | | | |
Expiring 01/25/2017 | | | Citigroup Global Markets | | | SEK | 10,377 | | | | 1,175,770 | | | | 1,154,086 | | | | 21,684 | |
Expiring 01/25/2017 | | | Citigroup Global Markets | | | SEK | 5,217 | | | | 587,886 | | | | 580,275 | | | | 7,611 | |
Expiring 01/25/2017 | | | UBS AG | | | SEK | 5,226 | | | | 587,885 | | | | 581,284 | | | | 6,601 | |
Swiss Franc, | | | | | | | | | | | | | | | | | | | | |
Expiring 01/27/2017 | | | Barclays Capital Group | | | CHF | 1,472 | | | | 1,495,756 | | | | 1,495,694 | | | | 62 | |
Expiring 01/27/2017 | | | Goldman Sachs & Co. | | | CHF | 8,509 | | | | 8,607,908 | | | | 8,645,492 | | | | (37,584 | ) |
Turkish Lira, | | | | | | | | | | | | | | | | | | | | |
Expiring 11/18/2016 | | | Citigroup Global Markets | | | TRY | 5,365 | | | | 1,779,526 | | | | 1,727,236 | | | | 52,290 | |
Expiring 11/18/2016 | | | Goldman Sachs & Co. | | | TRY | 2,278 | | | | 739,687 | | | | 733,479 | | | | 6,208 | |
| | | | | | | | | | | | | | | | | | | | |
| | | | | | | | | | $ | 80,533,512 | | | $ | 80,734,343 | | | | (200,831 | ) |
| | | | | | | | | | | | | | | | | | | | |
| | | | | | | | | | | | | | | | | | $ | (333,771 | ) |
| | | | | | | | | | | | | | | | | | | | |
Cross currency exchange contracts outstanding at October 31, 2016:
| | | | | | | | | | | | | | | | | | | | | | |
Settlement | | Type | | | Notional
Amount
(000) | | | In Exchange
For (000) | | | Unrealized
Appreciation
(Depreciation) | | | Counterparty |
OTC cross currency exchange contracts: | | | | | | | | | | | |
01/13/2017 | | | Buy | | | EUR | 1,078 | | | | ZAR | | | | 16,694 | | | $ | (31,679 | ) | | Goldman Sachs & Co. |
01/13/2017 | | | Buy | | | ZAR | 5,832 | | | | EUR | | | | 368 | | | | 20,859 | | | Goldman Sachs & Co. |
01/25/2017 | | | Buy | | | HUF | 194,940 | | | | EUR | | | | 634 | | | | (5,065 | ) | | Citigroup Global Markets |
01/25/2017 | | | Buy | | | NOK | 13,630 | | | | SEK | | | | 14,871 | | | | (3,936 | ) | | Bank of America |
11/18/2016 | | | Buy | | | TRY | 2,345 | | | | EUR | | | | 687 | | | | 463 | | | Citigroup Global Markets |
| | | | | | | | | | | | | | | | | | | | | | |
| | | | | | | | | | | | | | | | | | $ | (19,358 | ) | | |
| | | | | | | | | | | | | | | | | | | | | | |
See Notes to Financial Statements.
| | | | |
| Prudential Absolute Return Bond Fund | | | 45 | |
Portfolio of Investments (continued)
as of October 31, 2016
Forward rate agreements outstanding at October 31, 2016:
| | | | | | | | | | | | | | | | | | | | | | | | | | |
Notional
Amount
(000)# | | | Termination
Date | | | Fixed
Rate | | | Floating Rate | | Fair
Value | | | Upfront
Premiums
Paid
(Received) | | | Unrealized
Appreciation
(Depreciation) | | | Counterparty |
| OTC forward rate agreements(c): | | | | | | | |
| | 53,100 | | | | 11/25/16 | | | | 1.785% | | | 10 Year CMT(2) | | $ | (31,591 | ) | | $ | — | | | $ | (31,591 | ) | | Citigroup Global Markets |
| | 52,500 | | | | 11/21/16 | | | | 2.790% | | | 10 Year CMT(2) | | | (40,937 | ) | | | — | | | | (40,937 | ) | | Citigroup Global Markets |
| | 52,500 | | | | 11/21/16 | | | | 2.790% | | | 102 CMM(2) | | | 35,857 | | | | — | | | | 35,857 | | | Citigroup Global Markets |
| | 53,100 | | | | 11/25/16 | | | | 2.800% | | | 102 CMM(2) | | | 31,595 | | | | — | | | | 31,595 | | | Citigroup Global Markets |
| | | | | | | | | | | | | | | | | | | | | | | | | | |
| | | | | | | | | | | | | | $ | (5,076 | ) | | $ | — | | | $ | (5,076 | ) | | |
| | | | | | | | | | | | | | | | | | | | | | | | | | |
| (1) | The fund pays the fixed rate and receives the floating rate. |
| (2) | The fund pays the floating rate and receives the fixed rate. |
Currency swap agreements outstanding at October 31, 2016:
| | | | | | | | | | | | | | | | | | | | | | | | | | | | |
Notional
Amount
(000)# | | Fund
Receives | | Notional
Amount
(000)# | | | Fund
Pays | | Counterparty | | | Termination
Date | | | Fair
Value | | | Upfront
Premiums
Paid
(Received) | | | Unrealized
Appreciation
(Depreciation)
| |
OTC currency swap agreements: | | | | | | | | | | | | | | | | | | | | |
| 1,817 | | 3 Month LIBOR | | GBP | 1,200 | | | 3 Month GBP LIBOR
minus 14.25 bps | |
| Barclays Capital
Group |
| | | 04/05/18 | | | $ | 350,000 | | | $ | — | | | $ | 350,000 | |
| 707 | | 3 Month LIBOR | | EUR | 600 | | | 3 Month EURIBOR
minus 21.25 bps | |
| Citigroup Global
Markets |
| | | 01/16/17 | | | | 48,463 | | | | — | | | | 48,463 | |
| 1,810 | | 3 Month LIBOR | | EUR | 1,560 | | | 3 Month EURIBOR
minus 24.50 bps | |
| Citigroup Global
Markets |
| | | 01/16/17 | | | | 99,625 | | | | — | | | | 99,625 | |
| 64 | | 3 Month LIBOR plus 423 bps | | JPY | 5,000 | | | 3.450% | |
| Citigroup Global
Markets |
| | | 03/24/17 | | | | 16,242 | | | | 1,542 | | | | 14,700 | |
| 2,013 | | 3 Month LIBOR | | JPY | 200,000 | | | 3 Month JPY LIBOR
minus 53.25 bps | |
| Citigroup Global
Markets |
| | | 04/24/17 | | | | 105,900 | | | | — | | | | 105,900 | |
| 43 | | 3 Month LIBOR plus 208 bps | | EUR | 35 | | | 4.250% | |
| Citigroup Global
Markets |
| | | 07/14/17 | | | | 3,227 | | | | (4,000 | ) | | | 7,227 | |
| 79 | | 3 Month LIBOR plus 220 bps | | EUR | 65 | | | 4.250% | |
| Citigroup Global
Markets |
| | | 07/14/17 | | | | 5,834 | | | | (6,770 | ) | | | 12,604 | |
| 9,427 | | 3 Month LIBOR | | JPY | 961,510 | | | 3 Month JPY LIBOR
minus 31.25 bps | |
| Deutsche Bank
AG |
| | | 05/14/17 | | | | 253,533 | | | | — | | | | 253,533 | |
| 4,025 | | 3 Month LIBOR | | EUR | 3,500 | | | 3 Month EURIBOR
minus 25.00 bps | |
| Goldman Sachs
& Co. |
| | | 01/20/17 | | | | 180,547 | | | | — | | | | 180,547 | |
| 2,656 | | 3 Month LIBOR | | GBP | 1,745 | | | 3 Month GBP LIBOR
minus 9.50 bps | |
| Hong Kong &
Shanghai Bank |
| | | 06/04/18 | | | | 522,205 | | | | — | | | | 522,205 | |
| 32,517 | | 3 Month LIBOR | | EUR | 28,300 | | | 3 Month EURIBOR
minus 26.95 | | | JPMorgan Chase | | | | 02/17/17 | | | | 1,519,662 | | | | — | | | | 1,519,662 | |
| 3,310 | | 3 Month JPY LIBOR plus 54.25 bps | | JPY | 400,000 | | | 0.155% | | | JPMorgan Chase | | | | 10/26/17 | | | | (518,942 | ) | | | — | | | | (518,942 | ) |
| | | | | | | | | | | | | | | | | | | | | | | | | | | | |
| | | | | | | | | | | | | | | | | | $ | 2,586,296 | | | $ | (9,228 | ) | | $ | 2,595,524 | |
| | | | | | | | | | | | | | | | | | | | | | | | | | | | |
See Notes to Financial Statements.
Interest rate swap agreements outstanding at October 31, 2016:
| | | | | | | | | | | | | | | | | | | | | | | | |
Notional
Amount
(000)# | | | Termination
Date | | | Fixed
Rate | | | Floating Rate | | Value at
Trade
Date | | | Value at
October 31,
2016 | | | Unrealized
Appreciation
(Depreciation) | |
| Centrally cleared swap agreements: | | | | | | | | | | | | |
| AUD | 5,030 | | | | 10/26/18 | | | | 1.765% | | | 3 Month BBSW(1) | | $ | 124 | | | $ | (794 | ) | | $ | (918 | ) |
| AUD | 7,390 | | | | 10/27/18 | | | | 1.793% | | | 3 Month BBSW(1) | | | 128 | | | | (3,959 | ) | | | (4,087 | ) |
| AUD | 4,100 | | | | 10/26/21 | | | | 2.115% | | | 6 Month BBSW(2) | | | 128 | | | | (7,597 | ) | | | (7,725 | ) |
| AUD | 6,080 | | | | 10/27/21 | | | | 2.125% | | | 6 Month BBSW(2) | | | 134 | | | | (9,449 | ) | | | (9,583 | ) |
| AUD | 19,405 | | | | 10/27/21 | | | | 2.173% | | | 6 Month BBSW(2) | | | (3,742 | ) | | | 3,254 | | | | 6,996 | |
| AUD | 1,070 | | | | 10/26/26 | | | | 2.365% | | | 6 Month BBSW(1) | | | 121 | | | | 6,191 | | | | 6,070 | |
| AUD | 1,600 | | | | 10/27/26 | | | | 2.355% | | | 6 Month BBSW(1) | | | 124 | | | | 10,462 | | | | 10,338 | |
| CAD | 31,370 | | | | 10/26/18 | | | | 0.904% | | | 3 Month Canadian Banker’s
Acceptance(2) | | | (19 | ) | | | 1,665 | | | | 1,684 | |
| EUR | 16,000 | | | | 08/13/17 | | | | 0.099% | | | 1 Day EUR OIS(1) | | | 239 | | | | (80,818 | ) | | | (81,057 | ) |
| EUR | 8,825 | | | | 08/15/25 | | | | 0.395% | | | 6 Month EURIBOR(1) | | | 235 | | | | (8,500 | ) | | | (8,735 | ) |
| EUR | 6,600 | | | | 02/23/26 | | | | 0.324% | | | 1 Day EUR OIS(1) | | | 220 | | | | (109,952 | ) | | | (110,172 | ) |
| EUR | 17,380 | | | | 05/09/31 | | | | 1.587% | | | 6 Month EURIBOR(2) | | | 440 | | | | 304,126 | | | | 303,686 | |
| EUR | 3,255 | | | | 07/04/42 | | | | 1.001% | | | 6 Month EURIBOR(2) | | | 229 | | | | 6,864 | | | | 6,635 | |
| EUR | 10,930 | | | | 05/09/46 | | | | 1.357% | | | 6 Month EURIBOR(1) | | | 397 | | | | (203,488 | ) | | | (203,885 | ) |
| GBP | 3,200 | | | | 02/23/21 | | | | 0.639% | | | 1 Day GBP OIS(1) | | | 229 | | | | (42,863 | ) | | | (43,092 | ) |
| MXN | 173,100 | | | | 11/09/18 | | | | 5.410% | | | 28 Day Mexican Interbank
Rate(2) | | | (2,990 | ) | | | (71,500 | ) | | | (68,510 | ) |
| MXN | 200,000 | | | | 04/18/19 | | | | 5.480% | | | 28 Day Mexican Interbank
Rate(2) | | | 60 | | | | (95,212 | ) | | | (95,272 | ) |
| MXN | 125,350 | | | | 08/20/19 | | | | 5.110% | | | 28 Day Mexican Interbank
Rate(2) | | | (24,351 | ) | | | (138,495 | ) | | | (114,144 | ) |
| MXN | 2,900 | | | | 05/25/22 | | | | 6.370% | | | 28 Day Mexican Interbank
Rate(2) | | | 9 | | | | 1,332 | | | | 1,323 | |
| MXN | 19,300 | | | | 04/28/23 | | | | 5.100% | | | 28 Day Mexican Interbank
Rate(2) | | | 1,140 | | | | (67,322 | ) | | | (68,462 | ) |
| MXN | 162,700 | | | | 08/13/24 | | | | 6.120% | | | 28 Day Mexican Interbank
Rate(2) | | | (14,754 | ) | | | (141,976 | ) | | | (127,222 | ) |
| MXN | 124,750 | | | | 12/27/24 | | | | 5.795% | | | 28 Day Mexican Interbank
Rate(2) | | | 64 | | | | (268,061 | ) | | | (268,125 | ) |
| MXN | 141,000 | | | | 10/15/26 | | | | 6.445% | | | 28 Day Mexican Interbank
Rate(2) | | | 68 | | | | (39,012 | ) | | | (39,080 | ) |
| MXN | 47,600 | | | | 07/27/34 | | | | 6.720% | | | 28 Day Mexican Interbank
Rate(2) | | | 40 | | | | (68,277 | ) | | | (68,317 | ) |
| NOK | 55,830 | | | | 11/01/26 | | | | 1.650% | | | 6 Month NIBOR(2) | | | 67 | | | | (1,566 | ) | | | (1,633 | ) |
| NZD | 12,215 | | | | 11/01/26 | | | | 2.835% | | | 3 Month BBR(2) | | | 170 | | | | 2,034 | | | | 1,864 | |
| PLN | 95,490 | | | | 10/27/21 | | | | 2.050% | | | 6 Month WIBOR(2) | | | (8,221 | ) | | | (71,779 | ) | | | (63,558 | ) |
| SEK | 43,000 | | | | 10/27/26 | | | | 0.700% | | | 3 Month STIBOR(2) | | | 52 | | | | (40,773 | ) | | | (40,825 | ) |
| | 202,860 | | | | 11/02/16 | | | | 0.426% | | | 1 Day USOIS(1) | | | 337 | | | | (6,662 | ) | | | (6,999 | ) |
| | 43,600 | | | | 11/10/16 | | | | 0.739% | | | 3 Month LIBOR(1) | | | 259 | | | | 751 | | | | 492 | |
See Notes to Financial Statements.
| | | | |
| Prudential Absolute Return Bond Fund | | | 47 | |
Portfolio of Investments (continued)
as of October 31, 2016
| | | | | | | | | | | | | | | | | | | | | | | | |
Notional
Amount
(000)# | | | Termination
Date | | | Fixed
Rate | | | Floating Rate | | Value at
Trade
Date | | | Value at
October 31,
2016 | | | Unrealized
Appreciation
(Depreciation) | |
| Centrally cleared swap agreements (cont’d): | | | | | | | | | | | | |
| | SEK 502,750 | | | | 12/14/16 | | | | 0.414% | | | 1 Day USOIS(1) | | $ | 602 | | | $ | 8,954 | | | $ | 8,352 | |
| | 262,280 | | | | 02/18/17 | | | | 0.466% | | | 1 Day USOIS(1) | | | 386 | | | | 5,347 | | | | 4,961 | |
| | 133,000 | | | | 03/11/17 | | | | 0.966% | | | 3 Month LIBOR(1) | | | (900,354 | ) | | | (24,532 | ) | | | 875,822 | |
| | 317,460 | | | | 03/11/17 | | | | 0.966% | | | 3 Month LIBOR(1) | | | (593,688 | ) | | | (58,557 | ) | | | 535,131 | |
| | 118,130 | | | | 08/19/17 | | | | 0.524% | | | 1 Day USOIS(1) | | | 257 | | | | 43,187 | | | | 42,930 | |
| | 470,690 | | | | 09/09/17 | | | | 0.539% | | | 1 Day USOIS(1) | | | 63,645 | | | | 280,891 | | | | 217,246 | |
| | 114,900 | | | | 10/21/17 | | | | 0.590% | | | 1 Day USOIS(1) | | | 253 | | | | 38,448 | | | | 38,195 | |
| | 111,480 | | | | 11/01/17 | | | | 0.639% | | | 1 Day USOIS(1) | | | 401 | | | | (16,433 | ) | | | (16,834 | ) |
| | 346,000 | | | | 01/26/18 | | | | 1.124% | | | 3 Month LIBOR(1) | | | (66,156 | ) | | | (262,758 | ) | | | (196,602 | ) |
| | 154,300 | | | | 02/08/18 | | | | 0.884% | | | 3 Month LIBOR(1) | | | 500 | | | | 262,218 | | | | 261,718 | |
| | 61,940 | | | | 07/11/18 | | | | 0.947% | | | 3 Month LIBOR(1) | | | 292 | | | | 116,233 | | | | 115,941 | |
| | 57,735 | | | | 11/01/18 | | | | 1.075% | | | 3 Month LIBOR(2) | | | 282 | | | | (14,250 | ) | | | (14,532 | ) |
| | 58,600 | | | | 11/09/18 | | | | 1.160% | | | 3 Month LIBOR(1) | | | (22,226 | ) | | | (83,088 | ) | | | (60,862 | ) |
| | 263,500 | | | | 05/15/21 | | | | 2.202% | | | 3 Month LIBOR(1) | | | (3,255,762 | ) | | | (10,625,285 | ) | | | (7,369,523 | ) |
| | 2,570 | | | | 07/31/21 | | | | 2.290% | | | 3 Month LIBOR(1) | | | (42,742 | ) | | | (116,600 | ) | | | (73,858 | ) |
| | 46,850 | | | | 11/01/21 | | | | 1.338% | | | 3 Month LIBOR(1) | | | 343 | | | | (1,621 | ) | | | (1,964 | ) |
| | 54,000 | | | | 12/31/21 | | | | 1.842% | | | 3 Month LIBOR(1) | | | 442 | | | | (1,347,111 | ) | | | (1,347,553 | ) |
| | 167,900 | | | | 06/30/22 | | | | 2.020% | | | 3 Month LIBOR(1) | | | 1,056 | | | | (5,844,375 | ) | | | (5,845,431 | ) |
| | 24,000 | | | | 04/03/23 | | | | 2.015% | | | 3 Month LIBOR(1) | | | 387,010 | | | | (840,317 | ) | | | (1,227,327 | ) |
| | 16,300 | | | | 06/20/23 | | | | 2.604% | | | 3 Month LIBOR(1) | | | (423,981 | ) | | | (1,187,000 | ) | | | (763,019 | ) |
| | 148,350 | | | | 08/03/23 | | | | — | (3) | | —(3) | | | (261,728 | ) | | | 363,433 | | | | 625,161 | |
| | 101,900 | | | | 09/24/23 | | | | 2.903% | | | 3 Month LIBOR(1) | | | (4,887,264 | ) | | | (9,586,903 | ) | | | (4,699,639 | ) |
| | 98,000 | | | | 08/15/24 | | | | 2.559% | | | 3 Month LIBOR(1) | | | (1,570,311 | ) | | | (7,354,993 | ) | | | (5,784,682 | ) |
| | 56,550 | | | | 09/09/24 | | | | 2.558% | | | 3 Month LIBOR(1) | | | (904,581 | ) | | | (4,252,291 | ) | | | (3,347,710 | ) |
| | 4,300 | | | | 02/23/25 | | | | 2.232% | | | 3 Month LIBOR(1) | | | 181 | | | | (218,574 | ) | | | (218,755 | ) |
| | 50,000 | | | | 02/25/25 | | | | 2.208% | | | 3 Month LIBOR(1) | | | 510 | | | | (2,447,632 | ) | | | (2,448,142 | ) |
| | 9,975 | | | | 04/28/26 | | | | 1.809% | | | 3 Month LIBOR(1) | | | 136 | | | | (132,997 | ) | | | (133,133 | ) |
| | 12,175 | | | | 11/01/26 | | | | 1.692% | | | 3 Month LIBOR(2) | | | 239 | | | | 6,700 | | | | 6,461 | |
| | 8,500 | | | | 02/15/40 | | | | 3.192% | | | 3 Month LIBOR(1) | | | (567,614 | ) | | | (1,968,794 | ) | | | (1,401,180 | ) |
| | 14,000 | | | | 02/15/41 | | | | 2.647% | | | 3 Month LIBOR(1) | | | 402 | | | | (1,781,592 | ) | | | (1,781,994 | ) |
| | 5,520 | | | | 11/15/41 | | | | 1.869% | | | 3 Month LIBOR(1) | | | 33,885 | | | | 176,772 | | | | 142,887 | |
| | 1,300 | | | | 12/12/42 | | | | 2.590% | | | 3 Month LIBOR(1) | | | 65,803 | | | | (156,459 | ) | | | (222,262 | ) |
| | 13,400 | | | | 08/21/44 | | | | 3.190% | | | 3 Month LIBOR(1) | | | (926,224 | ) | | | (3,482,257 | ) | | | (2,556,033 | ) |
| | 4,000 | | | | 07/02/45 | | | | 2.937% | | | 3 Month LIBOR(1) | | | 222 | | | | (827,248 | ) | | | (827,470 | ) |
| | 3,755 | | | | 09/27/46 | | | | 1.380% | | | 1 Day USOIS(1) | | | 218 | | | | 250,169 | | | | 249,951 | |
| | | | | | | | | | | | | | | | | | | | | | | | |
| | | | | | | | | | | | | | $ | (13,914,629 | ) | | $ | (52,220,691 | ) | | $ | (38,306,062 | ) |
| | | | | | | | | | | | | | | | | | | | | | | | |
See Notes to Financial Statements.
| | | | | | | | | | | | | | | | | | | | | | | | | | |
Notional
Amount
(000)# | | | Termination
Date | | | Fixed
Rate | | | Floating Rate | | Fair
Value | | | Upfront
Premiums
Paid
(Received) | | | Unrealized
Appreciation
(Depreciation) | | | Counterparty |
| OTC swap agreements: | | | | | | | | | | | | | | |
| ILS | 19,360 | | | | 10/27/26 | | | | 1.640% | | | 3 Month TELBOR(2) | | $ | (13,914 | ) | | $ | (1,527 | ) | | $ | (12,387 | ) | | Citigroup Global Markets |
| MXN | 143,100 | | | | 06/20/18 | | | | 6.020% | | | 28 Day Mexican Interbank Rate(2) | | | 35,970 | | | | — | | | | 35,970 | | | Credit Suisse First Boston Corp. |
| | | | | | | | | | | | | | | | | | | | | | | | | | |
| | | | | | | | | | | | | | $ | 22,056 | | | $ | (1,527 | ) | | | $23,583 | | | |
| | | | | | | | | | | | | | | | | | | | | | | | | | |
| (1) | The Fund pays the fixed rate and receives the floating rate. |
| (2) | The Fund pays the floating rate and receives the fixed rate. |
| (3) | Fund pays the floating rate of 3 Month LIBOR and receives the floating rate of 1 Day USOIS plus 38.375 bps. |
Credit default swap agreements outstanding at October 31, 2016:
| | | | | | | | | | | | | | | | | | | | | | |
Reference
Entity/
Obligation | | Termination
Date | | | Fixed
Rate | | | Notional
Amount
(000)#(3) | | Value at
Trade
Date | | | Value at
October 31,
2016(4) | | | Unrealized
Appreciation
(Depreciation) | |
Centrally cleared credit default swaps on corporate and/or sovereign issues—Sell Protection(2): | |
| Anadarko Petroleum Corp. | | | 06/20/21 | | | | 1.000% | | | 750 | | $ | (56,543 | ) | | $ | (21,128 | ) | | $ | 35,415 | |
| AT&T, Inc. | | | 06/20/21 | | | | 1.000% | | | 6,540 | | | 47,134 | | | | 50,358 | | | | 3,224 | |
| CIT Group Inc. | | | 06/20/18 | | | | 5.000% | | | 2,740 | | | 175,137 | | | | 196,880 | | | | 21,743 | |
| Eastman Chemical Co. | | | 06/20/21 | | | | 1.000% | | | 4,860 | | | 46,754 | | | | 54,121 | | | | 7,367 | |
| Ford Motor Co. | | | 06/20/21 | | | | 5.000% | | | 8,000 | | | 1,391,643 | | | | 1,201,504 | | | | (190,139 | ) |
| | | | | | | | | | | | | | | | | | | | | | |
| | | | | | | | | | | | $ | 1,604,125 | | | $ | 1,481,735 | | | $ | (122,390 | ) |
| | | | | | | | | | | | | | | | | | | | | | |
| | | | | | | | | | | | | | | | | | | | | | | | |
Reference
Entity/
Obligation | | | Termination
Date | | | Fixed
Rate | | | Notional
Amount
(000)#(3) | | Value at
Trade
Date | | | Value at
October 31,
2016(4) | | | Unrealized
Appreciation
(Depreciation) | |
| Centrally cleared credit default swap on credit indices—Buy Protection(1): | |
| | CDX.NA.IG.27.V1 | | | | 12/20/21 | | | | 1.000% | | | 50,000 | | $ | (586,225 | ) | | $ | (518,200 | ) | | $ | 68,025 | |
| | | | | | | | | | | | | | | | | | | | | | | | |
See Notes to Financial Statements.
| | | | |
| Prudential Absolute Return Bond Fund | | | 49 | |
Portfolio of Investments (continued)
as of October 31, 2016
| | | | | | | | | | | | | | | | | | | | | | | | | | |
Reference
Entity/
Obligation | | Termination
Date | | | Fixed
Rate | | | Notional
Amount
(000)#(3) | | | Fair
Value(4) | | | Upfront
Premiums
Paid
(Received) | | | Unrealized
Appreciation
(Depreciation) | | | Counterparty |
OTC credit default swaps on asset-backed securities—Sell Protection(2)(c): | | | |
Ameriquest Home Equity | | | 11/30/16 | | | | 1.500% | | | | 1,307 | | | $ | 54 | | | $ | — | | | $ | 54 | | | Goldman Sachs & Co. |
Ameriquest Home Equity | | | 11/30/16 | | | | 1.500% | | | | 1,110 | | | | 46 | | | | — | | | | 46 | | | Goldman Sachs & Co. |
Ameriquest Home Equity | | | 11/30/16 | | | | 1.500% | | | | 646 | | | | 27 | | | | — | | | | 27 | | | Goldman Sachs & Co. |
Ameriquest Home Equity | | | 11/30/16 | | | | 1.500% | | | | 729 | | | | 30 | | | | — | | | | 30 | | | Goldman Sachs & Co. |
Ameriquest Home Equity | | | 11/30/16 | | | | 1.500% | | | | 800 | | | | 33 | | | | — | | | | 33 | | | Goldman Sachs & Co. |
Ameriquest Home Equity | | | 11/30/16 | | | | 1.500% | | | | 550 | | | | 23 | | | | — | | | | 23 | | | Goldman Sachs & Co. |
Ameriquest Home Equity | | | 11/30/16 | | | | 1.500% | | | | 2,385 | | | | 99 | | | | — | | | | 99 | | | Goldman Sachs & Co. |
Ameriquest Home Equity | | | 11/30/16 | | | | 1.500% | | | | 1,192 | | | | 50 | | | | — | | | | 50 | | | Goldman Sachs & Co. |
Bank of America Prime Mortgage | | | 11/30/16 | | | | 1.500% | | | | 2,813 | | | | 117 | | | | — | | | | 117 | | | Goldman Sachs & Co. |
Bear Stearns Asset Backed Securities Trust | | | 11/30/16 | | | | 1.500% | | | | 549 | | | | 23 | | | | — | | | | 23 | | | Goldman Sachs & Co. |
BSABS | | | 11/30/16 | | | | 1.500% | | | | 2,005 | | | | 84 | | | | — | | | | 84 | | | Goldman Sachs & Co. |
Chase Mortgage | | | 11/30/16 | | | | 1.500% | | | | 2,164 | | | | 90 | | | | — | | | | 90 | | | Goldman Sachs & Co. |
Chase Mortgage | | | 11/30/16 | | | | 1.500% | | | | 2,116 | | | | 88 | | | | — | | | | 88 | | | Goldman Sachs & Co. |
Chase Mortgage | | | 11/30/16 | | | | 1.500% | | | | 760 | | | | 32 | | | | — | | | | 32 | | | Goldman Sachs & Co. |
Citigroup Commercial Mortgage Trust | | | 11/22/16 | | | | 1.500% | | | | 140 | | | | 192 | | | | — | | | | 192 | | | Goldman Sachs & Co. |
Citigroup Commercial Mortgage Trust | | | 11/22/16 | | | | 1.500% | | | | 416 | | | | 572 | | | | — | | | | 572 | | | Goldman Sachs & Co. |
Citigroup Mortgage Loan Trust, Inc. | | | 11/30/16 | | | | 1.500% | | | | 752 | | | | 31 | | | | — | | | | 31 | | | Goldman Sachs & Co. |
Citigroup Mortgage Loan Trust, Inc. | | | 11/30/16 | | | | 1.500% | | | | 688 | | | | 29 | | | | — | | | | 29 | | | Goldman Sachs & Co. |
COMM Mortgage Trust | | | 11/22/16 | | | | 1.500% | | | | 75 | | | | 103 | | | | — | | | | 103 | | | Goldman Sachs & Co. |
COMM Mortgage Trust | | | 11/22/16 | | | | 1.500% | | | | 205 | | | | 282 | | | | — | | | | 282 | | | Goldman Sachs & Co. |
COMM Mortgage Trust | | | 11/22/16 | | | | 1.500% | | | | 568 | | | | 781 | | | | — | | | | 781 | | | Goldman Sachs & Co. |
COMM Mortgage Trust | | | 11/22/16 | | | | 1.500% | | | | 530 | | | | 728 | | | | — | | | | 728 | | | Goldman Sachs & Co. |
COMM Mortgage Trust | | | 11/22/16 | | | | 1.500% | | | | 85 | | | | 117 | | | | — | | | | 117 | | | Goldman Sachs & Co. |
COMM Mortgage Trust | | | 11/22/16 | | | | 1.500% | | | | 145 | | | | 199 | | | | — | | | | 199 | | | Goldman Sachs & Co. |
COMM Mortgage Trust | | | 11/22/16 | | | | 1.500% | | | | 69 | | | | 95 | | | | — | | | | 95 | | | Goldman Sachs & Co. |
Commercial Mortgage Pass Through Certificate | | | 11/22/16 | | | | 1.500% | | | | 123 | | | | 169 | | | | — | | | | 169 | | | Goldman Sachs & Co. |
Countrywide Home Equity | | | 11/30/16 | | | | 1.500% | | | | 1,008 | | | | 42 | | | | — | | | | 42 | | | Goldman Sachs & Co. |
Countrywide Home Equity | | | 11/30/16 | | | | 1.500% | | | | 760 | | | | 32 | | | | — | | | | 32 | | | Goldman Sachs & Co. |
Countrywide Home Equity | | | 11/30/16 | | | | 1.500% | | | | 731 | | | | 30 | | | | — | | | | 30 | | | Goldman Sachs & Co. |
Federal Home Loan Mortgage Corp. | | | 11/02/16 | | | | 1.500% | | | | 218 | | | | 309 | | | | — | | | | 309 | | | Goldman Sachs & Co. |
Federal Home Loan Mortgage Corp. | | | 11/02/16 | | | | 1.500% | | | | 506 | | | | 714 | | | | — | | | | 714 | | | Goldman Sachs & Co. |
Federal Home Loan Mortgage Corp. | | | 11/02/16 | | | | 1.500% | | | | 1,839 | | | | 2,604 | | | | — | | | | 2,604 | | | Goldman Sachs & Co. |
See Notes to Financial Statements.
| | | | | | | | | | | | | | | | | | | | | | | | | | |
Reference
Entity/
Obligation | | Termination
Date | | | Fixed
Rate | | | Notional
Amount
(000)#(3) | | | Fair
Value(4) | | | Upfront
Premiums
Paid
(Received) | | | Unrealized
Appreciation
(Depreciation) | | | Counterparty |
OTC credit default swaps on asset-backed securities—Sell Protection(2)(c) (cont’d): | | | |
Federal Home Loan Mortgage Corp. | | | 11/02/16 | | | | 1.500% | | | | 161 | | | $ | 228 | | | $ | — | | | $ | 228 | | | Goldman Sachs & Co. |
GS Mortgage Securities Trust | | | 11/22/16 | | | | 1.500% | | | | 75 | | | | 103 | | | | — | | | | 103 | | | Goldman Sachs & Co. |
GS Mortgage Securities Trust | | | 11/22/16 | | | | 1.500% | | | | 210 | | | | 289 | | | | — | | | | 289 | | | Goldman Sachs & Co. |
GS Mortgage Securities Trust | | | 11/22/16 | | | | 1.500% | | | | 227 | | | | 312 | | | | — | | | | 312 | | | Goldman Sachs & Co. |
GS Mortgage Securities Trust | | | 11/22/16 | | | | 1.500% | | | | 552 | | | | 759 | | | | — | | | | 759 | | | Goldman Sachs & Co. |
GS Mortgage Securities Trust | | | 11/22/16 | | | | 1.500% | | | | 178 | | | | 245 | | | | — | | | | 245 | | | Goldman Sachs & Co. |
GS Mortgage Securities Trust | | | 11/22/16 | | | | 1.500% | | | | 118 | | | | 162 | | | | — | | | | 162 | | | Goldman Sachs & Co. |
GS Mortgage Securities Trust | | | 11/22/16 | | | | 1.500% | | | | 113 | | | | 155 | | | | — | | | | 155 | | | Goldman Sachs & Co. |
GS Mortgage Securities Trust | | | 11/22/16 | | | | 1.500% | | | | 194 | | | | 267 | | | | — | | | | 267 | | | Goldman Sachs & Co. |
GS Mortgage Securities Trust | | | 11/22/16 | | | | 1.500% | | | | 530 | | | | 728 | | | | — | | | | 728 | | | Goldman Sachs & Co. |
GSAMP Home Equity | | | 11/30/16 | | | | 1.500% | | | | 843 | | | | 35 | | | | — | | | | 35 | | | Goldman Sachs & Co. |
GSAMP Trust | | | 11/30/16 | | | | 1.500% | | | | 1,285 | | | | 54 | | | | — | | | | 54 | | | Goldman Sachs & Co. |
IndyMac Subprime Mortgage | | | 11/30/16 | | | | 1.500% | | | | 587 | | | | 24 | | | | — | | | | 24 | | | Goldman Sachs & Co. |
IndyMac Subprime Mortgage | | | 11/30/16 | | | | 1.500% | | | | 698 | | | | 29 | | | | — | | | | 29 | | | Goldman Sachs & Co. |
JPMBB Commercial Morgage Securities Trust | | | 11/22/16 | | | | 1.500% | | | | 270 | | | | 371 | | | | — | | | | 371 | | | Goldman Sachs & Co. |
JPMBB Commercial Morgage Securities Trust | | | 11/22/16 | | | | 1.500% | | | | 80 | | | | 110 | | | | — | | | | 110 | | | Goldman Sachs & Co. |
JPMorgan Chase Commercial Mortgage Securities | | | 11/22/16 | | | | 1.500% | | | | 75 | | | | 103 | | | | — | | | | 103 | | | Goldman Sachs & Co. |
Lehman Home Equity | | | 11/30/16 | | | | 1.500% | | | | 1,650 | | | | 69 | | | | — | | | | 69 | | | Goldman Sachs & Co. |
LNR CDO Ltd. | | | 11/11/16 | | | | 1.500% | | | | 2,312 | | | | 3,606 | | | | — | | | | 3,606 | | | Goldman Sachs & Co. |
Long Beach Home Equity | | | 11/30/16 | | | | 1.500% | | | | 1,499 | | | | 62 | | | | — | | | | 62 | | | Goldman Sachs & Co. |
Morgan Stanley BAML Trust | | | 11/22/16 | | | | 1.500% | | | | 541 | | | | 744 | | | | — | | | | 744 | | | Goldman Sachs & Co. |
Morgan Stanley BAML Trust | | | 11/22/16 | | | | 1.500% | | | | 107 | | | | 147 | | | | — | | | | 147 | | | Goldman Sachs & Co. |
See Notes to Financial Statements.
| | | | |
| Prudential Absolute Return Bond Fund | | | 51 | |
Portfolio of Investments (continued)
as of October 31, 2016
| | | | | | | | | | | | | | | | | | | | | | | | | | |
Reference
Entity/
Obligation | | Termination
Date | | | Fixed
Rate | | | Notional
Amount
(000)#(3) | | | Fair
Value(4) | | | Upfront
Premiums
Paid
(Received) | | | Unrealized
Appreciation
(Depreciation) | | | Counterparty |
OTC credit default swaps on asset-backed securities—Sell Protection(2)(c) (cont’d): | | | |
Morgan Stanley BAML Trust | | | 11/22/16 | | | | 1.500% | | | | 123 | | | $ | 169 | | | $ | — | | | $ | 169 | | | Goldman Sachs & Co. |
Morgan Stanley BAML Trust | | | 11/22/16 | | | | 1.500% | | | | 80 | | | | 110 | | | | — | | | | 110 | | | Goldman Sachs & Co. |
Morgan Stanley Home Equity | | | 11/30/16 | | | | 1.500% | | | | 674 | | | | 28 | | | | — | | | | 28 | | | Goldman Sachs & Co. |
New Century Home Equity | | | 11/30/16 | | | | 1.500% | | | | 772 | | | | 32 | | | | — | | | | 32 | | | Goldman Sachs & Co. |
New Century Home Equity | | | 11/30/16 | | | | 1.500% | | | | 770 | | | | 32 | | | | — | | | | 32 | | | Goldman Sachs & Co. |
New Century Home Equity | | | 11/30/16 | | | | 1.500% | | | | 595 | | | | 25 | | | | — | | | | 25 | | | Goldman Sachs & Co. |
New Century Home Equity | | | 11/30/16 | | | | 1.500% | | | | 1,426 | | | | 59 | | | | — | | | | 59 | | | Goldman Sachs & Co. |
Option One Home Equity | | | 11/30/16 | | | | 1.500% | | | | 1,516 | | | | 63 | | | | — | | | | 63 | | | Goldman Sachs & Co. |
Option One Home Equity | | | 11/30/16 | | | | 1.500% | | | | 2,631 | | | | 110 | | | | — | | | | 110 | | | Goldman Sachs & Co. |
UBS Barclays Commercial Mortgage Trust | | | 11/22/16 | | | | 1.500% | | | | 58 | | | | 80 | | | | — | | | | 80 | | | Goldman Sachs & Co. |
Wells Fargo Home Equity | | | 11/30/16 | | | | 1.500% | | | | 602 | | | | 25 | | | | — | | | | 25 | | | Goldman Sachs & Co. |
WF-RBS Commercial Mortgage Trust | | | 11/22/16 | | | | 1.500% | | | | 69 | | | | 95 | | | | — | | | | 95 | | | Goldman Sachs & Co. |
WF-RBS Commercial Mortgage Trust | | | 11/22/16 | | | | 1.500% | | | | 80 | | | | 110 | | | | — | | | | 110 | | | Goldman Sachs & Co. |
WFCG Commercial Mortgage Trust | | | 11/22/16 | | | | 1.500% | | | | 389 | | | | 535 | | | | — | | | | 535 | | | Goldman Sachs & Co. |
| | | | | | | | | | | | | | | | | | | | | | | | | | |
| | | | | | | | | | | | | | $ | 17,900 | | | $ | — | | | $ | 17,900 | | | |
| | | | | | | | | | | | | | | | | | | | | | | | | | |
| | | | | | | | | | | | | | | | | | | | | | | | | | | | | | |
Reference
Entity/
Obligation | | Termination
Date | | | Fixed
Rate | | | Notional
Amount
(000)#(3) | | | Implied
Credit
Spread at
October 31,
2016(5) | | | Fair
Value | | | Upfront
Premiums
Paid
(Received) | | | Unrealized
Appreciation
(Depreciation) | | | Counterparty |
OTC credit default swaps on corporate and/or sovereign Issues—Sell Protection(2): |
Deutsche Bank AS | | | 06/20/17 | | | | 1.000% | | | | 13,040 | | | | 1.738 | % | | $ | (50,806 | ) | | $ | (212,002 | ) | | $ | 161,196 | | | BNP Paribas SA |
Kingdom of Saudi Arabia | | | 12/20/21 | | | | 1.000% | | | | 7,700 | | | | 1.324 | % | | | (112,964 | ) | | | (156,937 | ) | | | 43,973 | | | Barclays Capital Group |
Kingdom of Spain | | | 12/20/20 | | | | 1.000% | | | | 32,160 | | | | 0.610 | % | | | 542,535 | | | | (7,147 | ) | | | 549,682 | | | JPMorgan Chase |
Mexico United Mexican States Government | | | 12/20/20 | | | | 1.000% | | | | 7,000 | | | | 1.239 | % | | | (58,469 | ) | | | (123,938 | ) | | | 65,469 | | | Goldman Sachs & Co. |
People’s Republic of China | | | 03/20/22 | | | | 1.000% | | | | 5,000 | | | | 1.141 | % | | | (29,997 | ) | | | (79,787 | ) | | | 49,790 | | | Deutsche Bank AG |
Petroleo Brasileiro SA | | | 06/20/18 | | | | 1.000% | | | | 3,750 | | | | 1.828 | % | | | (45,771 | ) | | | (287,530 | ) | | | 241,759 | | | Morgan Stanley |
See Notes to Financial Statements.
| | | | | | | | | | | | | | | | | | | | | | | | | | | | | | |
Reference
Entity/
Obligation | | Termination
Date | | | Fixed
Rate | | | Notional
Amount
(000)#(3) | | | Implied
Credit
Spread at
October 31,
2016(5) | | | Fair
Value | | | Upfront
Premiums
Paid
(Received) | | | Unrealized
Appreciation
(Depreciation) | | | Counterparty |
OTC credit default swaps on corporate and/or sovereign Issues—Sell Protection(2) (cont’d): |
Petroleos Mexicanos | | | 06/20/23 | | | | 1.000% | | | | 9,450 | | | | 3.193 | % | | $ | (1,184,761 | ) | | $ | (1,224,841 | ) | | $ | 40,080 | | | BNP Paribas SA |
Republic of Indonesia | | | 09/20/20 | | | | 1.000% | | | | 8,000 | | | | 1.175 | % | | | (43,084 | ) | | | (322,294 | ) | | | 279,210 | | | Barclays Capital Group |
Republic of Indonesia | | | 06/20/21 | | | | 1.000% | | | | 2,100 | | | | 1.400 | % | | | (34,474 | ) | | | (83,337 | ) | | | 48,863 | | | JPMorgan Chase |
Republic of Italy | | | 09/20/20 | | | | 1.000% | | | | 12,000 | | | | 1.251 | % | | | (98,416 | ) | | | (63,450 | ) | | | (34,966 | ) | | JPMorgan Chase |
Republic of Panama Government | | | 09/20/20 | | | | 1.000% | | | | 1,700 | | | | 0.988 | % | | | 2,779 | | | | (43,542 | ) | | | 46,321 | | | Deutsche Bank AG |
Republic of Portugal | | | 12/20/20 | | | | 1.000% | | | | 1,800 | | | | 2.482 | % | | | (99,886 | ) | | | (63,832 | ) | | | (36,054 | ) | | Goldman Sachs & Co. |
Republic of Slovenia | | | 09/20/20 | | | | 1.000% | | | | 2,500 | | | | 0.756 | % | | | 26,110 | | | | (18,359 | ) | | | 44,469 | | | Barclays Capital Group |
Republic of Slovenia | | | 09/20/20 | | | | 1.000% | | | | 25,000 | | | | 0.756 | % | | | 261,103 | | | | (181,168 | ) | | | 442,271 | | | Barclays Capital Group |
Republic of Turkey | | | 09/20/20 | | | | 1.000% | | | | 2,000 | | | | 2.041 | % | | | (74,829 | ) | | | (148,017 | ) | | | 73,188 | | | Barclays Capital Group |
| | | | | | | | | | | | | | | | | | | | | | | | | | | | | | |
| | | | | | | | | | | | | | | | | | $ | (1,000,930 | ) | | $ | (3,016,181 | ) | | $ | 2,015,251 | | | |
| | | | | | | | | | | | | | | | | | | | | | | | | | | | | | |
| | | | | | | | | | | | | | | | | | | | | | | | | | |
Reference
Entity/
Obligation | | Termination
Date | | | Fixed
Rate | | | Notional
Amount
(000)#(3) | | | Fair
Value(4) | | | Upfront
Premiums
Paid
(Received) | | | Unrealized
Appreciation
(Depreciation) | | | Counterparty |
OTC credit default swaps on credit indices—Sell Protection(2): | | | |
CMBX.NA.6.AA | | | 05/11/63 | | | | 1.500% | | | | 23,500 | | | $ | (399,128 | ) | | $ | 296,195 | | | $ | (695,323 | ) | | Credit Suisse First Boston Corp. |
CMBX.NA.6.AA | | | 05/11/63 | | | | 1.500% | | | | 23,500 | | | | (399,128 | ) | | | 312,157 | | | | (711,285 | ) | | Credit Suisse First Boston Corp. |
CMBX.NA.6.AA | | | 05/11/63 | | | | 1.500% | | | | 23,000 | | | | (390,635 | ) | | | 268,548 | | | | (659,183 | ) | | Deutsche Bank AG |
CMBX.NA.6.AA | | | 05/11/63 | | | | 1.500% | | | | 7,000 | | | | (118,889 | ) | | | 38,818 | | | | (157,707 | ) | | UBS AG |
CMBX.NA.6.AA | | | 05/11/63 | | | | 1.500% | | | | 8,000 | | | | (135,873 | ) | | | (489,693 | ) | | | 353,820 | | | Credit Suisse First Boston Corp. |
CMBX.NA.6.AA | | | 05/11/63 | | | | 1.500% | | | | 20,000 | | | | (339,683 | ) | | | (669,506 | ) | | | 329,823 | | | JPMorgan Chase |
| | | | | | | | | | | | | | | | | | | | | | | | | | |
| | | | | | | | | | | | | | $ | (1,783,336 | ) | | $ | (243,481 | ) | | $ | (1,539,855 | ) | | |
| | | | | | | | | | | | | | | | | | | | | | | | | | |
See Notes to Financial Statements.
| | | | |
| Prudential Absolute Return Bond Fund | | | 53 | |
Portfolio of Investments (continued)
as of October 31, 2016
Cash of $44,085,000 has been segregated with Citigroup Global Markets to cover requirements for open centrally cleared interest rate and credit default swap contracts at October 31, 2016.
The Fund entered into credit default swaps (“CDS”) to provide a measure of protection against defaults or to take an active long or short position with respect to the likelihood of a particular issuer’s default or the reference entity’s credit soundness. CDS contracts generally trade based on a spread which represents the cost a protection buyer has to pay the protection seller. The protection buyer is said to be short the credit as the value of the contract rises the more the credit deteriorates. The value of the CDS contract increases for the protection buyer if the spread increases.
| (1) | If the Fund is a buyer of protection, it pays the fixed rate. When a credit event occurs, as defined under the terms of that particular swap agreement, the Fund will either (i) receive from the seller of protection an amount equal to the notional amount of the swap and make delivery of the referenced obligation or underlying securities comprising the referenced index or (ii) receive a net settlement amount in the form of cash or securities equal to the notional amount of the swap less the recovery value of the referenced obligation or underlying securities comprising the referenced index. |
| (2) | If the Fund is a seller of protection, it receives the fixed rate. When a credit event occurs, as defined under the terms of that particular swap agreement, the Fund will either (i) pay to the buyer of protection an amount equal to the notional amount of the swap less the recovery value of the referenced obligation or underlying securities comprising the referenced index or (ii) pay a net settlement amount in the form of cash or securities equal to the notional amount of the swap less the recovery value of the referenced obligation or underlying securities comprising the referenced index. |
| (3) | Notional amount represents the maximum potential amount the Fund could be required to pay as a seller of credit protection or receive as a buyer of credit protection if a credit event occurs as defined under the terms of that particular swap agreement. |
| (4) | The fair value of credit default swap agreements on centrally cleared corporate and/or sovereign issues, credit indices and asset-backed securities serves as an indicator of the current status of the payment/performance risk and represents the likelihood of an expected liability (or profit) for the credit derivative should the notional amount of the swap agreement be closed/sold as of the reporting date. Increasing fair value in absolute terms when compared to the notional amount of the swap, represents a deterioration of the referenced entity’s credit soundness and a greater likelihood of risk of default or other credit event occurring as defined under the terms of the agreement. |
| (5) | Implied credit spreads, represented in absolute terms, utilized in determining the fair value of OTC credit default swap agreements on corporate issues or sovereign issues of an emerging country as of the reporting date serve as an indicator of the current status of the payment/performance risk and represent the likelihood of risk of default for the credit derivative. The implied credit spread of a particular referenced entity reflects the cost of buying/selling protection and may include up-front payments required to be made to enter into the agreement. Wider credit spreads represent a deterioration of the referenced entity’s credit soundness and a greater likelihood of risk of default or other credit event occurring as defined under the terms of the agreement. |
Total return swap agreements outstanding at October 31, 2016:
| | | | | | | | | | | | | | | | | | | | | | |
Counterparty | | Termination
Date | | | Long (Short)
Notional
Amount
(000)# | | | Description | | Fair
Value | | | Upfront
Premiums
Paid
(Received) | | | Unrealized
Appreciation
(Depreciation)(1) | |
OTC total return swap agreements: | |
| Citigroup Capital Markets | | | 11/05/16 | | | | 3,700 | | | Pay variable payments based on 1 Day USOIS plus 10 bps and receive variable payments based on U.S. Treasury Bond | | $ | 288,417 | | | $ | — | | | $ | 288,417 | |
See Notes to Financial Statements.
| | | | | | | | | | | | | | | | | | | | | | |
Counterparty | | Termination
Date | | | Long (Short)
Notional
Amount
(000)# | | | Description | | Fair
Value | | | Upfront
Premiums
Paid
(Received) | | | Unrealized
Appreciation
(Depreciation)(1) | |
OTC total return swap agreements (cont’d): | |
| Citigroup Capital Markets | | | 11/05/16 | | | | 4,420 | | | Pay variable payments based on 1 Day USOIS plus 25 bps and receive variable payments based on U.S. Treasury Strip | | $ | (151,286 | ) | | $ | — | | | $ | (151,286 | ) |
| Citigroup Capital Markets | | | 11/05/16 | | | | 1,820 | | | Pay variable payments based on 1 Day USOIS plus 25 bps and receive variable payments based on U.S. Treasury Strip | | | (58,297 | ) | | | — | | | | (58,297 | ) |
| Deutsche Bank AG | | | 12/08/16 | | | | 4,200 | | | Pay variable payments based on 1 Day USOIS plus 30 bps and receive variable payments based on U.S. Treasury Strip | | | (293,169 | ) | | | — | | | | (293,169 | ) |
| Deutsche Bank AG | | | 12/08/16 | | | | 4,200 | | | Pay variable payments based on 1 Day USOIS plus 30 bps and receive variable payments based on U.S. Treasury Strip | | | (255,723 | ) | | | — | | | | (255,723 | ) |
| Deutsche Bank AG | | | 12/08/16 | | | | 2,100 | | | Pay variable payments based on 1 Day USOIS plus 30 bps and receive variable payments based on U.S. Treasury Strip | | | (104,554 | ) | | | — | | | | (104,554 | ) |
| Deutsche Bank AG | | | 12/08/16 | | | | 2,100 | | | Pay variable payments based on 1 Day USOIS plus 30 bps and receive variable payments based on U.S. Treasury Strip | | | (72,133 | ) | | | — | | | | (72,133 | ) |
| Credit Suisse First Boston Corp. | | | 01/12/41 | | | | 14,172 | | | Pay variable payments based on 1 Month LIBOR and receive fixed payments based on the IOS. FN30.450.10 Index | | | 81,630 | | | | (42,003 | ) | | | 123,633 | |
| | | | | | | | | | | | | | | | | | | | | | |
| | | | | | | | | | | | $ | (565,115 | ) | | $ | (42,003 | ) | | $ | (523,112 | ) |
| | | | | | | | | | | | | | | | | | | | | | |
| (1) | Upfront/recurring fees or commissions, as applicable, are included in the net unrealized appreciation (depreciation). |
See Notes to Financial Statements.
| | | | |
| Prudential Absolute Return Bond Fund | | | 55 | |
Portfolio of Investments (continued)
as of October 31, 2016
Various inputs are used in determining the value of the Fund’s investments. These inputs are summarized in the three broad levels listed below.
Level 1—quoted prices generally in active markets for identical securities.
Level 2—quoted prices for similar securities, interest rates and yield curves, prepayment speeds, foreign currency exchange rates and other observable inputs.
Level 3—unobservable inputs for securities valued in accordance with Board approved fair valuation procedures.
The following is a summary of the inputs used as of October 31, 2016 in valuing such portfolio securities:
| | | | | | | | | | | | |
| | | Level 1 | | | Level 2 | | | Level 3 | |
Investments in Securities | | | | | | | | | | | | |
Asset-Backed Securities | | | | | | | | | | | | |
Collateralized Debt Obligation | | $ | — | | | $ | 2,482,441 | | | $ | — | |
Collateralized Loan Obligations | | | — | | | | 265,393,841 | | | | — | |
Non-Residential Mortgage-Backed Securities | | | — | | | | 42,219,966 | | | | — | |
Residential Mortgage-Backed Securities | | | — | | | | 187,873,138 | | | | — | |
Bank Loans | | | — | | | | 32,721,278 | | | | 1,462,445 | |
Commercial Mortgage-Backed Securities | | | — | | | | 70,635,196 | | | | — | |
Corporate Bonds | | | — | | | | 596,159,088 | | | | — | |
Municipal Bonds | | | — | | | | 14,675,250 | | | | — | |
Non-Corporate Foreign Agencies | | | — | | | | 20,869,896 | | | | — | |
Residential Mortgage-Backed Securities | | | — | | | | 116,762,389 | | | | 15,706,240 | |
Sovereign Bonds | | | — | | | | 57,237,950 | | | | — | |
U.S. Treasury Obligations | | | — | | | | 8,211,054 | | | | — | |
Affiliated Mutual Funds | | | 88,652,086 | | | | — | | | | — | |
Other Financial Instruments* | | | | | | | | | | | | |
Futures Contracts | | | (9,073,985 | ) | | | — | | | | — | |
OTC Forward Foreign Currency Exchange Contracts | | | — | | | | (333,771 | ) | | | — | |
OTC Cross Currency Exchange Contracts | | | — | | | | (19,358 | ) | | | — | |
OTC Forward Rate Agreements | | | — | | | | — | | | | (5,076 | ) |
OTC Currency Swap Agreements | | | — | | | | 2,586,296 | | | | — | |
Centrally Cleared Interest Rate Swap Agreements | | | — | | | | (38,306,062 | ) | | | — | |
OTC Interest Rate Swap Agreements | | | — | | | | 22,056 | | | | — | |
Centrally Cleared Credit Default Swap Agreements | | | — | | | | (54,365 | ) | | | — | |
OTC Credit Default Swap Agreements | | | — | | | | (2,784,266 | ) | | | 17,900 | |
OTC Total Return Swap Agreements | | | — | | | | (565,115 | ) | | | — | |
| | | | | | | | | | | | |
Total | | $ | 79,578,101 | | | $ | 1,375,786,902 | | | $ | 17,181,509 | |
| | | | | | | | | | | | |
During the period, there were no transfers between Level 1 and Level 2 to report.
See Notes to Financial Statements.
The following is a reconciliation of assets in which unobservable inputs (Level 3) were used in determining fair value:
| | | | | | | | | | | | | | | | | | | | |
| | | Bank
Loans | | | Asset-Backed
Non-Residential
Mortgage-Backed
Securities | | | Residential
Mortgage-Backed
Securities | | | Forward
Rate
Agreements | | | Credit
Default
Swaps | |
Balance as of 10/31/15 | | $ | 1,375,465 | | | $ | 14,607,300 | | | $ | 4,939,860 | | | $ | (386,245 | ) | | $ | — | |
Realized gain (loss) | | | (41,633 | ) | | | 14,658 | | | | 25,884 | | | | — | ** | | | — | |
Change in unrealized appreciation (depreciation)*** | | | 20,649 | | | | (8,271 | ) | | | (168,434 | ) | | | 381,169 | | | | 17,900 | |
Purchases | | | 1,466,165 | | | | — | | | | 2,267,161 | | | | — | | | | — | |
Sales/Paydowns | | | (1,358,201 | ) | | | (14,613,687 | ) | | | (2,920,142 | ) | | | — | | | | — | |
Accrued discount/premium | | | — | | | | — | | | | 35,307 | | | | — | | | | — | |
Transfer into Level 3 | | | — | | | | — | | | | 16,466,464 | | | | — | | | | — | |
Transfer out of Level 3 | | | — | | | | — | | | | (4,939,860 | ) | | | — | | | | — | |
| | | | | | | | | | | | | | | | | | | | |
Balance as of 10/31/16 | | $ | 1,462,445 | | | $ | — | | | $ | 15,706,240 | | | $ | (5,076 | ) | | $ | 17,900 | |
| | | | | | | | | | | | | | | | | | | | |
| * | Other financial instruments are derivative instruments not reflected in the Portfolio of Investments, such as futures, forwards and centrally cleared swaps contracts, which are recorded at the unrealized appreciation (depreciation) of the instrument, and OTC swap contracts which are recorded at fair value. |
| ** | The realized loss incurred during the period for other financial instruments was $(711,528). |
| *** | Of which, $(148,404) was relating to securities held at the reporting period end. |
Level 3 securities as presented in the table above are being fair valued using pricing methodologies approved by Board, which contain unobservable inputs as follows:
| | | | | | | | | | | | |
Level 3 Securities | | Fair Value as of
October 31, 2016 | | | Valuation
Methodology | | | Unobservable Inputs | |
Bank Loans | | $ | 1,462,445 | | | | Market Approach | | | | Single Broker Indicative Quote | |
Residential Mortgage-Backed Securities | | | 15,706,240 | | | | Market Approach | | | | Single Broker Indicative Quote | |
Forward Rate Agreements | | | (5,076 | ) | | | Model Pricing | | | | Forward Rate Volatility | |
Credit Default Swaps | | | 17,900 | | | | Market Approach | | | | Single Broker Indicative Quote | |
| | | | | | | | | | | | |
| | $ | 17,181,509 | | | | | | | | | |
| | | | | | | | | | | | |
See Notes to Financial Statements.
| | | | |
| Prudential Absolute Return Bond Fund | | | 57 | |
Portfolio of Investments (continued)
as of October 31, 2016
It is the Fund’s policy to recognize transfers in and transfers out at the fair value as of the beginning of period. Securities transferred levels as follows:
| | | | | | | | | | |
Investments in Securities | | Amount Transferred | | | Level Transfer | | | Logic |
Residential Mortgage-Backed Securities | | $ | 16,466,464 | | | | L2 to L3 | | | Evaluated Bid to Single Broker
Indicative Quote |
Residential Mortgage-Backed Securities | | $ | 4,939,860 | | | | L3 to L2 | | | Single Broker Indicative Quote
to Evaluated Bid |
The industry classification of investments and liabilities in excess of other assets shown as a percentage of net assets as of October 31, 2016 were as follows (unaudited):
| | | | |
Residential Mortgage-Backed Securities | | | 21.2 | % |
Collateralized Loan Obligations | | | 17.6 | |
Affiliated Mutual Funds (including 4.8% of collateral for securities on loan) | | | 5.9 | |
Banks | | | 5.6 | |
Commercial Mortgage-Backed Securities | | | 4.7 | |
Sovereign Bonds | | | 3.8 | |
Healthcare-Services | | | 3.5 | |
Non-Residential Mortgage-Backed Securities | | | 2.8 | |
Entertainment | | | 2.2 | |
Media | | | 2.2 | |
Electric | | | 2.1 | |
Telecommunications | | | 2.1 | |
Home Builders | | | 2.0 | |
Retail | | | 1.9 | |
Building Materials | | | 1.5 | |
Non-Corporate Foreign Agencies | | | 1.4 | |
Food | | | 1.4 | |
Insurance | | | 1.3 | |
Chemicals | | | 1.3 | |
Commercial Services | | | 1.2 | |
Oil & Gas | | | 1.0 | |
Municipal Bonds | | | 1.0 | |
Auto Parts & Equipment | | | 1.0 | |
Lodging | | | 0.8 | |
Pharmaceuticals | | | 0.8 | |
Airlines | | | 0.7 | |
Diversified Financial Services | | | 0.7 | |
Semiconductors | | | 0.7 | |
Healthcare & Pharmaceutical | | | 0.7 | |
Mining | | | 0.6 | % |
Healthcare-Products | | | 0.6 | |
Pipelines | | | 0.6 | |
Transportation | | | 0.6 | |
U.S. Treasury Obligations | | | 0.5 | |
Forest & Paper Products | | | 0.5 | |
Electronics | | | 0.5 | |
Packaging & Containers | | | 0.4 | |
Real Estate Investment Trusts | | | 0.4 | |
Retailers | | | 0.3 | |
Miscellaneous Manufacturing | | | 0.3 | |
Software | | | 0.3 | |
Consumer | | | 0.2 | |
Environmental Control | | | 0.2 | |
Gas | | | 0.2 | |
Auto Manufacturers | | | 0.2 | |
Technology | | | 0.2 | |
Holding Companies—Diversified | | | 0.2 | |
Collateralized Debt Obligation | | | 0.1 | |
Distribution/Wholesale | | | 0.1 | |
Beverages | | | 0.1 | |
Capital Goods | | | 0.1 | |
Brokerage | | | 0.1 | |
Iron/Steel | | | 0.1 | |
Automotive | | | 0.1 | |
Computers | | | 0.1 | |
| | | | |
| | | 100.7 | |
Liabilities in excess of other assets | | | (0.7 | ) |
| | | | |
| | | 100.0 | % |
| | | | |
See Notes to Financial Statements.
The Fund invested in derivative instruments during the reporting period. The primary types of risk associated with these derivative instruments are credit risk, foreign exchange risk and interest rate risk. The effect of such derivative instruments on the Fund’s financial position and financial performance as reflected in the Statement of Assets and Liabilities and Statement of Operations is presented in the summary below.
Fair values of derivative instruments as of October 31, 2016 as presented in the Statement of Assets and Liabilities:
| | | | | | | | | | | | |
Derivatives not accounted
for as hedging instruments,
carried at fair value | | Asset Derivatives | | | Liability Derivatives | |
| | Balance Sheet
Location | | Fair
Value | | | Balance Sheet
Location | | Fair
Value | |
| Credit contracts | | Unrealized appreciation on OTC swap agreements | | $ | 2,787,814 | | | Unrealized depreciation on OTC swap agreements | | $ | 2,294,518 | |
| Credit contracts | | Premiums paid for OTC swap agreements | | | 915,718 | | | Premiums received for OTC swap agreements | | | 4,175,380 | |
| Credit contracts | | Due from/to broker—variation margin centrally cleared swaps | | | 135,774 | * | | Due from/to broker—variation margin centrally cleared swaps | | | 190,139 | * |
| Foreign exchange contracts | | Unrealized appreciation on OTC forward foreign currency exchange contracts | | | 684,819 | | | Unrealized depreciation on OTC forward foreign currency exchange contracts | | | 1,018,590 | |
| Foreign exchange contracts | | Unrealized appreciation on OTC cross currency exchange contracts | | | 21,322 | | | Unrealized depreciation on OTC cross currency exchange contracts | | | 40,680 | |
| Interest rate contracts | | Due from/to broker—variation margin futures | | | 4,574,309 | * | | Due from/to broker—variation margin futures | | | 13,648,294 | * |
| Interest rate contracts | | Due from/to broker—variation margin centrally cleared swaps | | | 3,463,844 | * | | Due from/to broker—variation margin centrally cleared swaps | | | 41,769,906 | * |
| Interest rate contracts | | Unrealized appreciation on OTC forward rate agreements | | | 67,452 | | | Unrealized depreciation on OTC forward rate agreements | | | 72,528 | |
| Interest rate contracts | | Unrealized appreciation on OTC swap agreements | | | 3,562,486 | | | Unrealized depreciation on OTC swap agreements | | | 1,466,491 | |
| Interest rate contracts | | Premiums paid for OTC swap agreements | | | 1,542 | | | Premiums received for OTC swap agreements | | | 54,300 | |
| | | | | | | | | | | | |
Total | | | | $ | 16,215,080 | | | | | $ | 64,730,826 | |
| | | | | | | | | | | | |
| * Includes | cumulative appreciation (depreciation) as reported in the schedule of open futures contracts and centrally cleared swap contracts. Only unsettled variation margin receivable (payable) is reported within the Statement of Assets and Liabilities. |
See Notes to Financial Statements.
| | | | |
| Prudential Absolute Return Bond Fund | | | 59 | |
Portfolio of Investments (continued)
as of October 31, 2016
The effects of derivative instruments on the Statement of Operations for the year ended October 31, 2016 are as follows:
| | | | | | | | | | | | | | | | | | | | | | | | | | | | |
Amount of Realized Gain or (Loss) on Derivatives Recognized in Income | |
Derivatives not
accounted for as
hedging instruments,
carried at fair value | | Options
Purchased* | | | Options
Written | | | Futures | | | Forward
and Cross
Currency
Contracts** | | | Forward
Rate
Agreements | | | Swaps | | | Total | |
Credit contracts | | $ | (1,119,300 | ) | | $ | 572,187 | | | $ | — | | | $ | — | | | $ | — | | | $ | 952,502 | | | $ | 405,389 | |
Foreign exchange contracts | | | — | | | | — | | | | — | | | | (8,456,585 | ) | | | — | | | | — | | | | (8,456,585 | ) |
Interest rate contracts | | | (2,786,289 | ) | | | 1,109,514 | | | | 22,770,645 | | | | — | | | | (659,418 | ) | | | (13,435,466 | ) | | | 6,998,986 | |
| | | | | | | | | | | | | | | | | | | | | | | | | | | | |
| | $ | (3,905,589 | ) | | $ | 1,681,701 | | | $ | 22,770,645 | | | $ | (8,456,585 | ) | | $ | (659,418 | ) | | $ | (12,482,964 | ) | | $ | (1,052,210 | ) |
| | | | | | | | | | | | | | | | | | | | | | | | | | | | |
| * | Included in net realized gain (loss) on investment transactions in the Statement of Operations. |
| ** | Included in net realized gain (loss) on foreign currency transactions in the Statement of Operations. |
| | | | | | | | | | | | | | | | | | | | | | | | | | | | |
Change in Unrealized Appreciation or (Depreciation) on Derivatives Recognized in Income | |
Derivatives not
accounted for as
hedging instruments,
carried at fair value | | Options
Purchased* | | | Options
Written | | | Futures | | | Forward
and Cross
Currency
Contracts** | | | Forward
Rate
Agreements | | | Swaps | | | Total | |
Credit contracts | | $ | 52,135 | | | $ | 49,581 | | | $ | — | | | $ | — | | | $ | — | | | $ | 2,827,389 | | | $ | 2,929,105 | |
Foreign exchange contracts | | | — | | | | — | | | | — | | | | (1,133,615 | ) | | | — | | | | — | | | | (1,133,615 | ) |
Interest rate contracts | | | (1,769,242 | ) | | | (606,616 | ) | | | (10,685,727 | ) | | | — | | | | 381,169 | | | | (16,377,295 | ) | | | (29,057,711 | ) |
| | | | | | | | | | | | | | | | | | | | | | | | | | | | |
| | $ | (1,717,107 | ) | | $ | (557,035 | ) | | $ | (10,685,727 | ) | | $ | (1,133,615 | ) | | $ | 381,169 | | | $ | (13,549,906 | ) | | $ | (27,262,221 | ) |
| | | | | | | | | | | | | | | | | | | | | | | | | | | | |
| * | Included in net change in unrealized appreciation (depreciation) on investments in the Statement of Operations. |
| ** | Included in net change in unrealized appreciation (depreciation) on foreign currencies in the Statement of Operations. |
For the year ended October 31, 2016, the Fund’s average volume of derivative activities are as follows:
| | | | | | | | | | | | | | | | | | | | | | |
Options
Purchased(1) | | | Options
Written(2) | | | Futures
Contracts—
Long
Positions(3) | | | Futures
Contracts—
Short
Positions(3) | | | Forward
Foreign
Currency
Exchange
Contracts—
Purchased(4) | | | Forward
Foreign
Currency
Exchange
Contracts—
Sold(4) | |
| $ | 2,769,961 | | | $ | 1,287,818,000 | | | $ | 846,499,461 | | | $ | 580,888,716 | | | $ | 134,776,392 | | | $ | 176,316,150 | |
See Notes to Financial Statements.
| | | | | | | | | | | | | | | | | | | | | | | | | | |
Cross
Currency
Exchange
Contracts(3) | | | Currency
Swap
Agreements(2) | | | Forward
Rate
Agreements(2) | | | Interest
Rate
Swap
Agreements(2) | | | Credit
Default
Swap
Agreements—
Buy
Protection(2) | | | Credit
Default
Swap
Agreements—
Sell
Protection(2) | | | Total
Return
Swap
Agreements(2) | |
| $ | 28,285,440 | | | $ | 133,483,000 | | | $ | 131,500,000 | | | $ | 4,608,668,000 | | | $ | 149,310,000 | | | $ | 285,031,000 | | | $ | 36,806,000 | |
| (2) Notional | Amount in USD. |
| (4) Value | at Settlement Date. |
Offsetting of OTC derivative assets and liabilities:
The Fund invested in OTC derivatives during the reporting period that are either offset in accordance with current requirements or are subject to enforceable master netting arrangements or similar agreements that permit offsetting. The information about offsetting and related netting arrangements for OTC derivatives, where the legal right to set-off exists, is presented in the summary below.
| | | | | | | | | | | | | | | | |
Counterparty | | Gross
amounts of
recognized
assets(1) | | | Gross
amounts
available
for offset | | | Collateral
Received | | | Net
Amount | |
Bank of America | | $ | 49,916 | | | $ | (49,916 | ) | | $ | — | | | $ | — | |
Barclays Capital Group | | | 1,233,173 | | | | (826,775 | ) | | | (406,398 | ) | | | — | |
BNP Paribas SA | | | 201,276 | | | | (201,276 | ) | | | — | | | | — | |
Citigroup Global Markets | | | 969,888 | | | | (656,872 | ) | | | (313,016 | ) | | | — | |
Credit Suisse First Boston Corp. | | | 1,179,644 | | | | (1,179,644 | ) | | | — | | | | — | |
Deutsche Bank AG | | | 618,192 | | | | (618,192 | ) | | | — | | | | — | |
Goldman Sachs & Co. | | | 438,914 | | | | (321,734 | ) | | | — | | | | 117,180 | |
Hong Kong & Shanghai Bank | | | 570,478 | | | | (1,371 | ) | | | (569,107 | ) | | | — | |
JPMorgan Chase | | | 2,449,143 | | | | (1,403,101 | ) | | | (1,046,042 | ) | | | — | |
Morgan Stanley | | | 241,759 | | | | (241,759 | ) | | | — | | | | — | |
UBS AG | | | 88,770 | | | | (88,770 | ) | | | — | | | | — | |
| | | | | | | | | | | | | | | | |
| | $ | 8,041,153 | | | | | | | | | | | | | |
| | | | | | | | | | | | | | | | |
See Notes to Financial Statements.
| | | | |
| Prudential Absolute Return Bond Fund | | | 61 | |
Portfolio of Investments (continued)
as of October 31, 2016
| | | | | | | | | | | | | | | | |
Counterparty | | Gross
amounts of
recognized
liabilities(2) | | | Gross
amounts
available
for offset | | | Collateral
Pledged | | | Net
Amount | |
Bank of America | | $ | (92,325 | ) | | $ | 49,916 | | | $ | — | | | $ | (42,409 | ) |
Barclays Capital Group | | | (826,775 | ) | | | 826,775 | | | | — | | | | — | |
BNP Paribas SA | | | (1,436,843 | ) | | | 201,276 | | | | 1,235,567 | | | | — | |
Citigroup Global Markets | | | (656,872 | ) | | | 656,872 | | | | — | | | | — | |
Credit Suisse First Boston Corp. | | | (2,073,677 | ) | | | 1,179,644 | | | | 894,033 | | | | — | |
Deutsche Bank AG | | | (1,508,091 | ) | | | 618,192 | | | | 713,000 | | | | (176,899 | ) |
Goldman Sachs & Co. | | | (321,734 | ) | | | 321,734 | | | | — | | | | — | |
Hong Kong & Shanghai Bank | | | (1,371 | ) | | | 1,371 | | | | — | | | | — | |
JPMorgan Chase | | | (1,403,101 | ) | | | 1,403,101 | | | | — | | | | — | |
Morgan Stanley | | | (287,530 | ) | | | 241,759 | | | | — | | | | (45,771 | ) |
UBS AG | | | (514,168 | ) | | | 88,770 | | | | 257,231 | | | | (168,167 | ) |
| | | | | | | | | | | | | | | | |
| | $ | (9,122,487 | ) | | | | | | | | | | | | |
| | | | | | | | | | | | | | | | |
| (1) | Includes unrealized appreciation on swaps and forwards, premiums paid on swap agreements and market value of purchased options. |
| (2) | Includes unrealized depreciation on swaps and forwards, premiums received on swap agreements and market value of written options. |
See Notes to Financial Statements.
This Page Intentionally Left Blank
Statement of Assets & Liabilities
as of October 31, 2016
| | | | |
Assets | |
Investments at value, including securities on loan of $70,419,438: | |
Unaffiliated Investments (cost $1,433,939,869) | | $ | 1,432,410,172 | |
Affiliated Investments (cost $88,640,668) | | | 88,652,086 | |
Cash | | | 162,455 | |
Foreign currency, at value (cost $2,193,711) | | | 2,210,066 | |
Deposit with broker for futures | | | 7,909,000 | |
Deposit with broker for centrally cleared swaps | | | 44,085,000 | |
Interest and dividends receivable | | | 12,236,989 | |
Unrealized appreciation on OTC swap agreements | | | 6,350,300 | |
Receivable for Fund shares sold | | | 3,078,422 | |
Receivable for investments sold | | | 1,315,833 | |
Cash segregated for counterparty—OTC | | | 1,105,000 | |
Premiums paid for OTC swap agreements | | | 917,260 | |
Due from broker—variation margin futures | | | 729,423 | |
Unrealized appreciation on OTC forward foreign currency exchange contracts | | | 684,819 | |
Unrealized appreciation on OTC forward rate agreements | | | 67,452 | |
Unrealized appreciation on OTC cross currency exchange contracts | | | 21,322 | |
Prepaid expenses | | | 17,327 | |
| | | | |
Total assets | | | 1,601,952,926 | |
| | | | |
|
Liabilities | |
Payable to broker for collateral for securities on loan | | | 71,847,552 | |
Premium received for OTC swap agreements | | | 4,229,680 | |
Payable for investments purchased | | | 3,838,158 | |
Unrealized depreciation on OTC swap agreements | | | 3,761,009 | |
Payable for Fund shares reacquired | | | 3,551,523 | |
Management fee payable | | | 1,038,020 | |
Unrealized depreciation on OTC forward foreign currency exchange contracts | | | 1,018,590 | |
Accrued expenses and other liabilities | | | 592,896 | |
Dividends payable | | | 587,146 | |
Due to broker—variation margin swaps | | | 208,490 | |
Distribution fee payable | | | 143,789 | |
Affiliated transfer agent fee payable | | | 77,009 | |
Unrealized depreciation on OTC forward rate agreements | | | 72,528 | |
Unrealized depreciation on OTC cross currency exchange contracts | | | 40,680 | |
| | | | |
Total liabilities | | | 91,007,070 | |
| | | | |
| |
Net Assets | | $ | 1,510,945,856 | |
| | | | |
| | | | | |
Net assets were comprised of: | |
Shares of beneficial interest, at par | | $ | 156,971 | |
Paid-in capital in excess of par | | | 1,591,833,972 | |
| | | | |
| | | 1,591,990,943 | |
Distributions in excess of net investment income | | | (8,684,451 | ) |
Accumulated net realized loss on investment and foreign currency transactions | | | (25,608,151 | ) |
Net unrealized depreciation on investments and foreign currencies | | | (46,752,485 | ) |
| | | | |
Net assets, October 31, 2016 | | $ | 1,510,945,856 | |
| | | | |
See Notes to Financial Statements.
| | | | |
Class A | |
Net asset value and redemption price per share
($197,712,570 ÷ 20,609,357 shares of beneficial interest issued and outstanding) | | $ | 9.59 | |
Maximum sales charge (4.50% of offering price) | | | 0.45 | |
| | | | |
Maximum offering price to public | | $ | 10.04 | |
| | | | |
|
Class C | |
Net asset value, offering price and redemption price per share | |
($118,091,756 ÷ 12,271,417 shares of beneficial interest issued and outstanding) | | $ | 9.62 | |
| | | | |
|
Class Q | |
Net asset value, offering price and redemption price per share | |
($175,887,265 ÷ 18,308,672 shares of beneficial interest issued and outstanding) | | $ | 9.61 | |
| | | | |
|
Class Z | |
Net asset value, offering price and redemption price per share | |
($1,019,254,265 ÷ 105,781,485 shares of beneficial interest issued and outstanding) | | $ | 9.64 | |
| | | | |
See Notes to Financial Statements.
| | | | |
| Prudential Absolute Return Bond Fund | | | 65 | |
Statement of Operations
Year Ended October 31, 2016
| | | | |
Net Investment Income (Loss) | |
Income | |
Interest income | | $ | 73,326,043 | |
Income from securities lending, net (including affiliated income of $242,473) | | | 275,116 | |
Affiliated dividend income | | | 165,770 | |
| | | | |
Total income | | | 73,766,929 | |
| | | | |
|
Expenses | |
Management fee | | | 15,493,114 | |
Distribution fee—Class A | | | 615,216 | |
Distribution fee—Class C | | | 1,355,085 | |
Transfer agent’s fees and expenses (including affiliated expense of $584,859) | | | 2,643,000 | |
Custodian and accounting fees (net of $20,400 fee credit) | | | 360,000 | |
Shareholders’ reports | | | 145,000 | |
Registration fees | | | 80,000 | |
Audit fee | | | 65,000 | |
Trustees’ fees | | | 45,000 | |
Legal fees and expenses | | | 37,000 | |
Commitment fee on syndicated credit agreement | | | 32,000 | |
Loan interest expense | | | 30,628 | |
Insurance expenses | | | 29,000 | |
Miscellaneous | | | 16,996 | |
| | | | |
Total expenses | | | 20,947,039 | |
Less: Expense reimbursement | | | (1,612,672 | ) |
| | | | |
Net expenses | | | 19,334,367 | |
| | | | |
Net investment income (loss) | | | 54,432,562 | |
| | | | |
|
Realized And Unrealized Gain (Loss) On Investments And Foreign Currency Transactions | |
Net realized gain (loss) on: | |
Investment transactions (including affiliated of $1,307) | | | (12,364,872 | ) |
Futures transactions | | | 22,770,645 | |
Options written transactions | | | 1,681,701 | |
Swap agreement transactions | | | (12,482,964 | ) |
Foreign currency transactions | | | (6,330,838 | ) |
Forward rate agreements | | | (659,418 | ) |
| | | | |
| | | (7,385,746 | ) |
| | | | |
Net change in unrealized appreciation (depreciation) on: | |
Investments (including affiliated of $11,418) | | | 31,479,519 | |
Futures | | | (10,685,727 | ) |
Options written | | | (557,035 | ) |
Swap agreements | | | (13,549,906 | ) |
Foreign currencies | | | (1,132,129 | ) |
Forward rate agreements | | | 381,169 | |
| | | | |
| | | 5,935,891 | |
| | | | |
Net gain (loss) on investment and foreign currency transactions | | | (1,449,855 | ) |
| | | | |
Net Increase (Decrease) In Net Assets Resulting From Operations | | $ | 52,982,707 | |
| | | | |
See Notes to Financial Statements.
Statement of Changes in Net Assets
| | | | | | | | |
| | | Year Ended October 31, | |
| | | 2016 | | | 2015 | |
Increase (Decrease) in Net Assets | |
Operations | |
Net investment income (loss) | | $ | 54,432,562 | | | $ | 68,302,192 | |
Net realized gain (loss) on investment and foreign currency transactions | | | (7,385,746 | ) | | | (39,940,409 | ) |
Net change in unrealized appreciation (depreciation) on investments and foreign currencies | | | 5,935,891 | | | | (45,524,134 | ) |
| | | | | | | | |
Net increase (decrease) in net assets resulting from operations | | | 52,982,707 | | | | (17,162,351 | ) |
| | | | | | | | |
| | |
Dividends and Distributions (Note 1) | | | | | | | | |
Dividends from net investment income | |
Class A | | | (3,937,295 | ) | | | (8,455,798 | ) |
Class C | | | (1,419,933 | ) | | | (2,762,018 | ) |
Class Q | | | (2,935,476 | ) | | | (2,721,218 | ) |
Class Z | | | (24,849,029 | ) | | | (47,805,272 | ) |
| | | | | | | | |
| | | (33,141,733 | ) | | | (61,744,306 | ) |
| | | | | | | | |
Tax return of capital distributions | |
Class A | | | (1,373,095 | ) | | | (1,197,797 | ) |
Class C | | | (495,189 | ) | | | (391,251 | ) |
Class Q | | | (1,023,721 | ) | | | (385,471 | ) |
Class Z | | | (8,665,867 | ) | | | (6,771,802 | ) |
| | | | | | | | |
| | | (11,557,872 | ) | | | (8,746,321 | ) |
| | | | | | | | |
|
Fund share transactions (Net of share conversions) (Note 6) | |
Net proceeds from shares sold | | | 378,115,109 | | | | 1,007,801,320 | |
Net asset value of shares issued in reinvestment of dividends and distributions | | | 32,218,965 | | | | 44,726,683 | |
Cost of shares reacquired | | | (1,291,525,424 | ) | | | (1,319,175,381 | ) |
| | | | | | | | |
Net increase (decrease) in net assets from Fund share transactions | | | (881,191,350 | ) | | | (266,647,378 | ) |
| | | | | | | | |
Total increase (decrease) | | | (872,908,248 | ) | | | (354,300,356 | ) |
|
Net Assets: | |
Beginning of year | | | 2,383,854,104 | | | | 2,738,154,460 | |
| | | | | | | | |
End of year | | $ | 1,510,945,856 | | | $ | 2,383,854,104 | |
| | | | | | | | |
See Notes to Financial Statements.
| | | | |
| Prudential Absolute Return Bond Fund | | | 67 | |
Notes to Financial Statements
Prudential Investment Portfolios 9 (the “Trust”) is an open-end management investment company, registered under the Investment Company Act of 1940, as amended (“1940 Act”). The Trust currently consists of four funds: Prudential QMA Large-Cap Core Equity Fund, Prudential Absolute Return Bond Fund (the “Fund”), Prudential Select Real Estate Fund and Prudential Real Estate Income Fund. These financial statements relate to Prudential Absolute Return Bond Fund, a diversified fund. The financial statements of the other portfolios are not presented herein. The Trust was organized as a business trust in Delaware on September 18, 1998. The Fund commenced investment operations on March 30, 2011.
The Fund’s investment objective is to seek positive returns over the long term, regardless of market conditions.
Note 1. Accounting Policies
The Fund follows investment company accounting and reporting guidance of the Financial Accounting Standards Board (“FASB”) Accounting Standard Codification Topic 946 Financial Services—Investment Companies. The following accounting policies conform to U.S. generally accepted accounting principles. The Fund consistently follows such policies in the preparation of its financial statements.
Securities Valuation: The Fund holds securities and other assets that are fair valued at the close of each day (generally, 4:00 PM Eastern time) the New York Stock Exchange (“NYSE”) is open for trading. Fair value is the price that would be received to sell an asset or paid to transfer a liability in an orderly transaction between market participants on the measurement date. The Board of Trustees (the “Board”) has adopted Valuation Procedures for security valuation under which fair valuation responsibilities have been delegated to Prudential Investments LLC (“PI” or “Manager”). Under the current Valuation Procedures, the established Valuation Committee is responsible for supervising the valuation of portfolio securities and other assets. The Valuation Procedures permit the Fund to utilize independent pricing vendor services, quotations from market makers, and alternative valuation methods when market quotations are either not readily available or not deemed representative of fair value. A record of the Valuation Committee’s actions is subject to the Board’s review, approval, and ratification at its next regularly-scheduled quarterly meeting.
Various inputs determine how the Fund’s investments are valued, all of which are categorized according to the three broad levels (Level 1, 2, or 3) detailed in the table following the Portfolio of Investments.
Derivative instruments, such as futures or options, that are traded on a national securities exchange are valued at the last sale price as of the close of trading on the applicable exchange where the security principally trades. Securities traded via NASDAQ are valued at the NASDAQ official closing price. To the extent these securities are valued at the last sale price or NASDAQ official closing price, they are classified as Level 1 in the fair value hierarchy.
Investments in open-end, non-exchange-traded mutual funds are valued at their net asset values as of the close of the NYSE on the date of valuation. These securities are classified as Level 1 in the fair value hierarchy since they may be purchased or sold at their net asset values on the date of valuation.
Fixed income securities traded in the OTC market are generally valued at prices provided by approved independent pricing vendors. The pricing vendors provide these prices after evaluating observable inputs including, but not limited to yield curves, yield spreads, credit ratings, deal terms, tranche level attributes, default rates, cash flows, prepayment speeds, broker/dealer quotations, and reported trades. Securities valued using such vendor prices are classified as Level 2 in the fair value hierarchy.
Bank loans are generally valued at prices provided by approved independent pricing vendors. The pricing vendors utilize broker/dealer quotations and provide prices based on the average of such quotations. Bank loans valued using such vendor prices are generally classified as Level 2 in the fair value hierarchy.
OTC derivative instruments are generally valued using pricing vendor services, which derive the valuation based on inputs such as underlying asset prices, indices, spreads, interest rates, and exchange rates. These instruments are categorized as Level 2 in the fair value hierarchy.
Centrally cleared swaps listed or traded on a multilateral or trade facility platform, such as a registered exchange, are generally valued at the daily settlement price determined by the respective exchange. These securities are classified as Level 2 in the fair value hierarchy, as the daily settlement price is not public.
Securities and other assets that cannot be priced according to the methods described above are valued based on pricing methodologies approved by the Board. In the event that unobservable inputs are used when determining such valuations, the securities will be classified as Level 3 in the fair value hierarchy.
When determining the fair value of securities, some of the factors influencing the valuation include: the nature of any restrictions on disposition of the securities; assessment of the general liquidity of the securities; the issuer’s financial condition and the markets in which it does business; the cost of the investment; the size of the holding and the capitalization of the issuer; the prices of any recent transactions or bids/offers for such securities or any comparable securities; any available analyst media or other reports or information deemed
| | | | |
| Prudential Absolute Return Bond Fund | | | 69 | |
Notes to Financial Statements (continued)
reliable by the investment adviser regarding the issuer or the markets or industry in which it operates. Using fair value to price securities may result in a value that is different from a security’s most recent closing price and from the price used by other mutual funds to calculate their net asset values.
Restricted and Illiquid Securities: Subject to guidelines adopted by the Board, the Fund may invest up to 15% of its net assets in illiquid securities, including those which are restricted as to disposition under securities law (“restricted securities”). Restricted securities are valued pursuant to the valuation procedures noted above. Illiquid securities are those that, because of the absence of a readily available market or due to legal or contractual restrictions on resale, cannot be sold within seven days in the ordinary course of business at approximately the amount at which the Fund has valued the investment. Therefore, the Fund may find it difficult to sell illiquid securities at the time considered most advantageous by its Subadviser and may incur expenses that would not be incurred in the sale of securities that were freely marketable. Certain securities that would otherwise be considered illiquid because of legal restrictions on resale to the general public may be traded among qualified institutional buyers under Rule 144A of the Securities Act of 1933. These Rule 144A securities, as well as commercial paper that is sold in private placements under Section 4(2) of the Securities Act, may be deemed liquid by the Fund’s Subadviser under the guidelines adopted by the Trustees of the Fund. However, the liquidity of the Fund’s investments in Rule 144A securities could be impaired if trading does not develop or declines.
CAS and STACR: The Fund purchased government controlled Fannie Mae and Freddie Mac securities that transfer most of the cost of defaults to private investors including the funds. These are insurance-like products that are called CAS by Fannie Mae and STACR securities by Freddie Mac. Payments on the securities are based primarily on the performance of a reference pool of underlying mortgages. With such securities, the Fund could lose some or all of its principal if the underlying mortgages experience credit defaults.
Foreign Currency Translation: The books and records of the Fund are maintained in U.S. dollars. Foreign currency amounts are translated into U.S. dollars on the following basis:
(i) market value of investment securities, other assets and liabilities-at the current rates of exchange;
(ii) purchases and sales of investment securities, income and expenses-at the rates of exchange prevailing on the respective dates of such transactions.
Although the net assets of the Fund are presented at the foreign exchange rates and market values at the close of the period, the Fund does not generally isolate that portion of
the results of operations arising as a result of changes in the foreign exchange rates from the fluctuations arising from changes in the market prices of long-term portfolio securities held at the end of the period. Similarly, the Fund does not isolate the effect of changes in foreign exchange rates from the fluctuations arising from changes in the market prices of long-term portfolio securities sold during the period. Accordingly, holding period realized foreign currency gains (losses) are included in the reported net realized gains (losses) on investment transactions. Notwithstanding the above, the Fund does isolate the effect of fluctuations in foreign currency exchange rates when determining the gain (loss) upon the sale or maturity of foreign currency denominated debt obligations; such amounts are included in net realized gains (losses) on foreign currency transactions.
Net realized gains (losses) on foreign currency transactions represent net foreign exchange gains (losses) from holdings of foreign currencies, forward currency contracts, disposition of foreign currencies, currency gains (losses) realized between the trade and settlement dates on securities transactions, and the difference between the amounts of interest, dividends and foreign withholding taxes recorded on the Fund’s books and the U.S. dollar equivalent amounts actually received or paid. Net unrealized currency gains (losses) from valuing foreign currency denominated assets and liabilities (other than investments) at period end exchange rates are reflected as a component of net unrealized appreciation (depreciation) on foreign currencies.
Concentration of Risk: The ability of debt securities issuers (other than those issued or guaranteed by the U.S. Government) held by the Fund to meet its obligations may be affected by the economic or political developments in a specific industry, region or country. Foreign security and currency transactions may involve certain considerations and risks not typically associated with those of domestic origin as a result of, among other factors, the possibility of political or economic instability or the level of governmental supervision and regulation of foreign securities markets.
Financial Futures Contracts: A financial futures contract is an agreement to purchase (long) or sell (short) an agreed amount of securities at a set price for delivery on a future date. Upon entering into a financial futures contract, the Fund is required to pledge to the broker an amount of cash and/or other assets equal to a certain percentage of the contract amount. This amount is known as the “initial margin.” Subsequent payments, known as “variation margin,” are made or received by the Fund each day, depending on the daily fluctuations in the value of the underlying security. Such variation margin is recorded for financial statement purposes on a daily basis as unrealized gain (loss). When the contract expires or is closed, the gain (loss) is realized and is presented in the Statement of Operations as net realized gain (loss) on futures transactions.
The Fund invested in financial futures contracts in order to hedge its existing portfolio securities, or securities the Fund intends to purchase, against fluctuations in value caused by changes in prevailing interest rates or foreign currency exchange rates. Should interest rates move unexpectedly, the Fund may not achieve the anticipated benefits of the financial futures contracts and may realize a loss. The use of futures transactions involves
| | | | |
| Prudential Absolute Return Bond Fund | | | 71 | |
Notes to Financial Statements (continued)
the risk of imperfect correlation in movements in the price of futures contracts, interest rates and the underlying hedged assets. With exchange-traded futures contracts, there is minimal counterparty credit risk to the Fund since the exchanges’ clearinghouse acts as counterparty to all exchange-traded futures and guarantees the futures contracts against default.
Forward Currency Contracts: A forward currency contract is a commitment to purchase or sell a foreign currency at a future date at a negotiated forward rate. The Fund enters into forward currency contracts in order to hedge its exposure to changes in foreign currency exchange rates on its foreign portfolio holdings or specific receivables and payables denominated in a foreign currency. The contracts are valued daily at current exchange rates and any unrealized gain (loss) is included in net unrealized appreciation (depreciation) on foreign currencies. Gain (loss) is realized on the settlement date of the contract equal to the difference between the settlement value of the original and negotiated forward contracts. This gain (loss), if any, is included in net realized gain (loss) on foreign currency transactions. Risks may arise upon entering into these contracts from the potential inability of the counterparties to meet the terms of their contracts. Forward currency contracts involve risks from currency exchange rate and credit risk in excess of the amounts reflected on the Statement of Assets and Liabilities. The Fund’s maximum risk of loss from counterparty credit risk is the net value of the cash flows to be received from the counterparty at the end of the contract’s life.
Cross Currency Exchange Contracts: A cross currency contract is a forward contract where a specified amount of one foreign currency will be exchanged for a specified amount of another foreign currency.
Options: The Fund purchased and wrote options in order to hedge against adverse market movements or fluctuations in value caused by changes in prevailing interest rates or foreign currency exchange rates, with respect to securities which the Fund currently owns or intends to purchase. The Fund may also use options to gain additional market exposure. The Fund’s principal reason for writing options is to realize, through receipt of premiums, a greater current return than would be realized on the underlying security alone. When the Fund purchases an option, it pays a premium and an amount equal to that premium is recorded as an asset. When the Fund writes an option, it receives a premium and an amount equal to that premium is recorded as a liability. The asset or liability is adjusted daily to reflect the current market value of the option. If an option expires unexercised, the Fund realizes a gain (loss) to the extent of the premium received or paid. If an option is exercised, the premium received or paid is recorded as an adjustment to the proceeds from the sale or the cost of the purchase in determining whether the Fund has realized a gain (loss). The difference between the premium and the amount received or paid at the closing of a purchase or sale transaction is also treated as a realized gain (loss). Gain (loss) on
purchased options is included in net realized gain (loss) on investment transactions. Gain (loss) on written options is presented separately as net realized gain (loss) on options written transactions.
The Fund, as writer of an option, may have no control over whether the underlying securities may be sold (called) or purchased (put). As a result, the Fund bears the market risk of an unfavorable change in the price of the security underlying the written option. OTC options also involve the risk of the potential inability of the counterparties to meet the terms of their contracts. With exchange-traded options contracts, there is minimal counterparty credit risk to the Fund since the exchanges’ clearinghouse acts as counterparty to all exchange-traded options and guarantees the options contracts against default.
When a Fund writes an option on a swap, an amount equal to any premium received by the Fund is recorded as a liability and is subsequently adjusted to the current market value of the written option on the swap. If a call option on a swap is exercised, the Fund becomes obligated to pay a fixed interest rate (noted as the strike price) and receive a variable interest rate on a notional amount. If a put option on a swap is exercised, the Fund becomes obligated to pay a variable interest rate and receive a fixed interest rate (noted as the strike price) on a notional amount. Premiums received from writing options on swaps that expire or are exercised are treated as realized gains upon the expiration or exercise of such options on swaps. The risk associated with writing put and call options on swaps is that the Fund will be obligated to be party to a swap agreement if an option on a swap is exercised.
Forward Rate Agreements: Forward rate agreements represent an agreement between counterparties to exchange cash flows based on the difference between two interest rates, applied to a notional principal amount on a fixed future date. The Fund entered into forward rate agreements to gain yield exposure based on anticipated market conditions at the specified termination date of the agreement.
Swap Agreements: The Fund entered into credit default, interest rate and other forms of swap agreements. A swap agreement is an agreement to exchange the return generated by one instrument for the return generated by another instrument. Swap agreements are negotiated in the OTC market and may be executed either directly with counterparty (“OTC-traded”) or through a central clearing facility, such as a registered commodities exchange. Swap agreements are valued daily at current market value and any change in value is included in the net unrealized appreciation (depreciation) on investments. Centrally cleared swaps pay or receive an amount known as “variation margin”, based on daily changes in the valuation of the swap contract. Payments received or paid by the Fund are recorded as realized gains (losses) upon termination or maturity of the swap. Risk of loss may exceed amounts recognized on the Statement of Assets and Liabilities. Swap agreements outstanding at period end, if any, are listed on the Portfolio of Investments.
Interest Rate Swaps: Interest rate swaps represent an agreement between counterparties to exchange cash flows based on the difference between two interest rates, applied to a
| | | | |
| Prudential Absolute Return Bond Fund | | | 73 | |
Notes to Financial Statements (continued)
notional principal amount for a specified period. The Fund is subject to interest rate risk exposure in the normal course of pursuing its investment objectives. The Fund used interest rate swaps to maintain its ability to generate steady cash flow by receiving a stream of fixed-rate payments and to increase exposure to prevailing market rates by receiving floating rate payments. The Fund’s maximum risk of loss from counterparty credit risk is the discounted net value of the cash flows to be received from the counterparty over the contract’s remaining life.
Credit Default Swaps: Credit default swaps (“CDS”) involve one party (the protection buyer) making a stream of payments to another party (the protection seller) in exchange for the right to receive a specified payment in the event of a default or as a result of a default (collectively a “credit event”) for the referenced entity (typically corporate issues or sovereign issues of an emerging country) on its obligation; or in the event of a write-down, principal shortfall, interest shortfall or default of all or part of the referenced entities comprising a credit index. The Fund is subject to credit risk in the normal course of pursuing its investment objectives. The Fund entered into CDS contracts to provide a measure of protection against defaults or to take an active long or short position with respect to the likelihood of a particular issuer’s default or the reference entity’s credit soundness. CDS contracts generally trade based on a spread which represents the cost a protection buyer has to pay the protection seller. The protection buyer is said to be short the credit as the value of the contract rises the more the credit deteriorates. The value of the CDS contract increases for the protection buyer if the spread increases. The Fund sold protection using credit default swaps to take an active short position with respect to the likelihood of a particular issuer’s default. The Fund’s maximum risk of loss from counterparty credit risk for purchased credit default swaps is the inability of the counterparty to honor the contract up to the notional value due to a credit event.
As a seller of protection on credit default swap agreements, the Fund generally receives an agreed upon payment from the buyer of protection throughout the term of the swap, provided no credit event occurs. As the seller, the Fund effectively increases its investment risk because, in addition to its total net assets, the Fund may be subject to investment exposure on the notional amount of the swap.
The maximum amount of the payment that the Fund, as a seller of protection, could be required to make under a credit default swap agreement would be equal to the notional amount of the underlying security or index contract as a result of a credit event. This potential amount will be partially offset by any recovery values of the respective referenced obligations, or net amounts received from the settlement of buy protection credit default swap agreements which the Fund entered into for the same referenced entity or index. As a buyer of protection, the Fund generally receives an amount up to the notional value of the swap if a credit event occurs.
Implied credit spreads, represented in absolute terms, utilized in determining the market value of credit default swap agreements on corporate or sovereign issues of an emerging country as of period end are disclosed in the footnotes to the Portfolio of Investments, if applicable. These spreads serve as indicators of the current status of the payment/performance risk and represent the likelihood of default risk for the credit derivative. The implied credit spread of a particular referenced entity reflects the cost of buying/selling protection and may include upfront payments required to enter into the agreement. For credit default swap agreements on asset-backed securities and credit indices, the quoted market prices and resulting values serve as indicators of the current status of the payment/performance risk. Wider credit spreads and increased market value in absolute terms, when compared to the notional amount of the swap, represent a deterioration of the referenced entity’s credit soundness and a greater likelihood of risk of default or other credit event occurring as defined under the terms of the agreement.
Total Return Swaps: In a total return swap, one party would receive payments based on the market value of the security or the commodity involved, or total return of a specific referenced asset, such as an equity, index or bond, and in return pay a fixed amount. The Fund is subject to risk exposures associated with the referenced asset in the normal course of pursuing its investment objectives. The Fund entered into total return swaps to manage its exposure to a security or an index. The Fund’s maximum risk of loss from counterparty credit risk is the change in the value of the security, in the Fund’s favor, from the point of entering into the contract.
Currency Swaps: The Fund entered into currency swap agreements primarily to gain yield exposure on foreign bonds. Currency swap agreements involve two parties exchanging two different currencies with an agreement to reverse the exchange at a later date at specified exchange rates.
Master Netting Arrangements: The Fund is subject to various Master Agreements, or netting arrangements, with select counterparties. These are agreements which a subadviser may have negotiated and entered into on behalf of the Fund. A master netting arrangement between the Fund and the counterparty permits the Fund to offset amounts payable by the Fund to the same counterparty against amounts to be received; and by the receipt of collateral from the counterparty by the Fund to cover the Fund’s exposure to the counterparty. However, there is no assurance that such mitigating factors are easily enforceable. In addition to master netting arrangements, the right to set-off exists when all the conditions are met such that each of the parties owes the other determinable amounts, the reporting party has the right to set-off the amount owed with the amount owed by the other party, the reporting party intends to set-off and the right of set-off is enforceable by law. During the reporting period, there was no intention to settle on a net basis and all amounts are presented on a gross basis on the Statement of Assets and Liabilities.
The Fund is a party to ISDA (International Swaps and Derivatives Association, Inc.) Master Agreements with certain counterparties that govern OTC derivative and foreign exchange contracts entered into from time to time. The Master Agreements may contain provisions
| | | | |
| Prudential Absolute Return Bond Fund | | | 75 | |
Notes to Financial Statements (continued)
regarding, among other things, the parties’ general obligations, representations, agreements, collateral requirements, events of default and early termination. With respect to certain counterparties, in accordance with the terms of the Master Agreements, collateral posted to the Fund is held in a segregated account by the Fund’s custodian and with respect to those amounts which can be sold or re-pledged, is presented in the Portfolio of Investments. Collateral pledged by the Fund is segregated by the Fund’s custodian and identified in the Portfolio of Investments.
Collateral can be in the form of cash or debt securities issued by the U.S. Government or related agencies or other securities as agreed to by the Fund and the applicable counterparty. Collateral requirements are determined based on the Fund’s net position with each counterparty. Termination events applicable to the Fund may occur upon a decline in the Fund’s net assets below a specified threshold over a certain period of time. Termination events applicable to counterparties may occur upon a decline in the counterparty’s long-term and short term credit ratings below a specified level. In each case, upon occurrence, the other party may elect to terminate early and cause settlement of all derivative and foreign exchange contracts outstanding, including the payment of any losses and costs resulting from such early termination, as reasonably determined by the terminating party. Any decision by one or more of the Fund’s counterparties to elect early termination could impact the Fund’s future derivative activity.
In addition to each instrument’s primary underlying risk exposure (e.g. interest rate, credit, equity or foreign exchange, etc.), swap agreements involve, to varying degrees, elements of credit, market and documentation risk. Such risks involve the possibility that no liquid market for these agreements will exist, the counterparty to the agreement may default on its obligation to perform or disagree on the contractual terms of the agreement, and changes in net interest rates will be unfavorable. In connection with these agreements, securities in the portfolio may be identified or received as collateral from the counterparty in accordance with the terms of the respective swap agreements to provide or receive assets of value and to serve as recourse in the event of default or bankruptcy/insolvency of either party. Such OTC derivative agreements include conditions which, when materialized, give the counterparty the right to cause an early termination of the transactions under those agreements. Any election by the counterparty for early termination of the contract(s) may impact the amounts reported on financial statements.
As of October 31, 2016, the Fund has not met conditions under such agreements which give the counterparty the right to call for an early termination.
Forward currency contracts, forward rate agreements, swaps and financial futures contracts involve elements of both market and credit risk in excess of the amounts reflected
on the Statement of Assets and Liabilities. Such risks may be mitigated by engaging in master netting arrangements.
Loan Participations: The Fund may invest in loan participations, another type of restricted security. When the Fund purchases a loan participation, the Fund typically enters into a contractual relationship with the lender or third party selling such participations (“Selling Participant”), but not the borrower. As a result, the Fund assumes the credit risk of the borrower, the Selling Participant and any other persons interpositioned between the Fund and the borrower. The Fund may not directly benefit from the collateral supporting the senior loan in which it has purchased the loan participation.
Payment In Kind Securities: The Fund may invest in open market or receive pursuant to debt restructuring, securities that pay in kind (“PIK”) the interest due on such debt instruments. The PIK interest, computed at the contractual rate specified, is added to the existing principal balance of the debt when issued bonds have same terms as the bond or recorded as a separate bond when terms are different from the existing debt, and is recorded as interest income.
Securities Lending: The Fund may lend its portfolio securities to banks and broker-dealers. The loans are secured by collateral at least equal to the market value of the securities loaned. Collateral pledged by each borrower is invested in a money market fund and is marked to market daily, based on the previous day’s market value, such that the value of the collateral exceeds the value of the loaned securities. For the period March 31, 2016 through July 18, 2016 the collateral was invested in an ultra-short bond fund. Loans are subject to termination at the option of the borrower or the Fund. Upon termination of the loan, the borrower will return to the Fund securities identical to the loaned securities. Should the borrower of the securities fail financially, the Fund has the right to repurchase the securities in the open market using the collateral. The Fund recognizes income, net of any rebate and securities lending agent fees, for lending its securities in the form of fees or interest on the investment of any cash received as collateral. The borrower receives all interest and dividends from the securities loaned and such payments are passed back to the lender in amounts equivalent thereto. The Fund also continues to recognize any unrealized gain (loss) in the market price of the securities loaned and on the change in the value of the collateral invested that may occur during the term of the loan. In addition, realized gain (loss) is recognized on changes in the value of the collateral invested that may occur during the term of the loan.
Securities Transactions and Net Investment Income: Securities transactions are recorded on the trade date. Realized gains (losses) from investment and currency transactions are calculated on the identified cost basis. Dividend income is recorded on the ex-date. Interest income, including amortization of premium and accretion of discount on debt securities, as required, is recorded on an accrual basis. Expenses are recorded on an accrual basis, which may require the use of certain estimates by management that may differ from actual.
Net investment income or loss (other than distribution fees which are charged directly to the respective class and transfer agency fees specific to Class Q shares which are charged
| | | | |
| Prudential Absolute Return Bond Fund | | | 77 | |
Notes to Financial Statements (continued)
to that share class) and unrealized and realized gains (losses) are allocated daily to each class of shares based upon the relative proportion of adjusted net assets of each class at the beginning of the day.
Dividends and Distributions: The Fund declares dividends from net investment income daily and payment is made monthly. Distributions from net realized capital and currency gains, if any, are paid annually. Dividends and distributions to shareholders, which are determined in accordance with federal income tax regulations and may differ from generally accepted accounting principles, are recorded on the ex-date. Permanent book/tax differences relating to income and gain (loss) are reclassified amongst distributions in excess of net investment income, accumulated net realized gain (loss) and paid-in capital in excess of par, as appropriate.
Taxes: For federal income tax purposes, the Fund is treated as a separate taxpaying entity. It is the Fund’s policy to continue to meet the requirements of the Internal Revenue Code applicable to regulated investment companies and to distribute all of its taxable net investment income and capital gains, if any, to its shareholders. Therefore, no federal income tax provision is required. Withholding taxes on foreign interest are recorded, net of reclaimable amounts, at the time the related income is earned.
Estimates: The preparation of the financial statements requires management to make estimates and assumptions that affect the reported amounts and disclosures in the financial statements. Actual results could differ from those estimates.
Note 2. Agreements
The Fund has a management agreement with PI. Pursuant to this agreement, PI has responsibility for all investment advisory services and supervises the subadviser’s performance of such services. PI has entered into a subadvisory agreement with PGIM, Inc., which provides subadvisory services to the Fund through its PGIM Fixed Income (“PFI”) unit. The subadvisory agreement provides that PFI will furnish investment advisory services in connection with the management of the Fund. In connection therewith, PFI is obligated to keep certain books and records of the Fund. PI pays for the services of PFI, the cost of compensation of officers of the Fund, occupancy and certain clerical and bookkeeping costs of the Fund. The Fund bears all other costs and expenses. Prior to January 4, 2016, PGIM, Inc. was known as Prudential Investment Management, Inc. (“PIM”).
The management fee paid to PI is accrued daily and payable monthly at an annual rate of .80% of the Fund’s average daily net assets up to $2.5 billion, .775% of the average daily net assets up to $5 billion and .75% of the average daily net assets in excess of $5 billion. The effective management fee rate before any waivers and/or expense reimbursement was
..80% for the year ended October 31, 2016. The effective management fee rate, net of waivers and/or expense reimbursement, was .72%.
PI has contractually agreed through February 28, 2018 to limit the net annual operating expenses (exclusive of distribution and service (12b-1) fees, taxes (such as income and foreign withholdings taxes, stamp duty and deferred tax expenses), interest, underlying funds, brokerage, extraordinary and certain other expenses such as dividend, broker charges and interest expense on short sales) of each class of shares of the Fund to .90% of the Fund’s average daily net assets. Expenses waived/reimbursed by the Manager in accordance with this agreement may be recouped by the Manager within the same fiscal year during which such waiver/reimbursement is made if such recoupment can be realized without exceeding the expense limit in effect at the time of the recoupment for that fiscal year.
The Fund has a distribution agreement with Prudential Investment Management Services LLC (“PIMS”) which acts as the distributor of the Class A, Class C, Class Q and Class Z shares of the Fund. The Fund compensates PIMS for distributing and servicing the Fund’s Class A and Class C shares, pursuant to plans of distribution (the “Distribution Plans”), regardless of expenses actually incurred by PIMS. The distribution fees are accrued daily and payable monthly. No distribution or service fees are paid to PIMS as distributor of the Class Q and Class Z shares of the Fund.
Pursuant to the Distribution Plans, the Fund compensates PIMS for distribution related activities at an annual rate of up to .25% and 1% of the average daily net assets of the Class A and C shares, respectively.
PIMS has advised the Fund that it has received $100,047 in front-end sales charges resulting from sales of Class A shares during the year ended October 31, 2016. From these fees, PIMS paid such sales charges to affiliated broker-dealers, which in turn paid commissions to salespersons and incurred other distribution costs.
PIMS has advised the Fund that for the year ended October 31, 2016, it received $1,237 and $9,319, in contingent deferred sales charges imposed upon redemptions by certain Class A and Class C shareholders, respectively.
PI, PGIM, Inc. and PIMS are indirect, wholly-owned subsidiaries of Prudential Financial, Inc. (“Prudential”).
Note 3. Other Transactions with Affiliates
Prudential Mutual Fund Services LLC (“PMFS”), an affiliate of PI and an indirect, wholly-owned subsidiary of Prudential, serves as the Fund’s transfer agent. Transfer agent’s fees and expenses in the Statement of Operations include certain out-of-pocket expenses paid to non-affiliates, where applicable.
Effective July 7, 2016, the Board replaced PGIM, Inc., an indirect, wholly-owned subsidiary of Prudential, as securities lending agent with a third party agent. Prior to July 7, 2016,
| | | | |
| Prudential Absolute Return Bond Fund | | | 79 | |
Notes to Financial Statements (continued)
PGIM, Inc. was the Fund’s securities lending agent. Net earnings from securities lending are disclosed on the Statement of Operations as “Income from securities lending, net”. For the period November 1, 2015 through February 4, 2016, PGIM, Inc. had been compensated $22,920 for these services. At the June 2016 meeting of the Board, the Board approved compensation to PGIM, Inc. related to securities lending activities. The payment was for services provided from February 5, 2016 through July 5, 2016 and totaled $15,676.
The Fund may enter into certain securities purchase or sale transactions under Board approved Rule 17a-7 procedures. Rule 17a-7 is an exemptive rule under the 1940 Act, that permits purchase and sale transactions among affiliated investment companies, or between an investment company and a person that is affiliated solely by reason of having a common (or affiliated) investment adviser, common directors, and/or common officers. Such transactions are subject to ratification by the Board.
The Fund invests its overnight sweep cash in the Prudential Core Ultra Short Bond Fund, (formerly known as Prudential Core Taxable Money Market Fund), (the “Core Fund”), and its securities lending cash collateral in the Prudential Institutional Money Market Fund, (the “Money Market Fund”), each a portfolio of the Prudential Investment Portfolios 2, registered under the 1940 Act and managed by PI. Earnings from the Core and the Money Market Funds are disclosed on the Statement of Operations as “Affiliated dividend income” and “Income from securities lending, net”, respectively.
Note 4. Portfolio Securities
The cost of purchases and proceeds from sales of portfolio securities, other than short-term investments and U.S. Government securities, for year ended October 31, 2016, were $497,343,726 and $1,365,905,262, respectively.
Transactions in options written during the year ended October 31, 2016, were as follows:
| | | | | | | | |
| | | Notional
Amount
(000) | | | Premiums
Received | |
Balance at beginning of period | | $ | 2,621,160 | | | $ | 2,256,581 | |
Options written | | | 7,404,520 | | | | 5,609,193 | |
Options closed | | | (3,566,150 | ) | | | (4,030,060 | ) |
Options expired | | | (6,459,530 | ) | | | (3,835,714 | ) |
| | | | | | | | |
Balance at end of period | | $ | — | | | $ | — | |
| | | | | | | | |
Note 5. Distributions and Tax Information
Distributions to shareholders, which are determined in accordance with federal income tax regulations and which may differ from generally accepted accounting principles, are
recorded on the ex-date. In order to present distributions in excess of net investment income, accumulated net realized loss on investment and foreign currency transactions and paid-in capital in excess of par on the Statement of Assets and Liabilities that more closely represent their tax character, certain adjustments have been made to distributions in excess of net investment income and accumulated net realized loss on investment and foreign currency transactions. For the year ended October 31, 2016, the adjustments were to increase distributions in excess of net investment income and decrease accumulated net realized loss on investment and foreign currency transactions by $14,365,145 primarily due to the difference between financial and tax reporting purposes of premium amortization, certain transactions involving foreign currencies, paydown gains (losses), swaps and other book to tax adjustments. Net investment income, net realized gain (loss) on investment and foreign currency transactions and net assets were not affected by this change.
For the year ended October 31, 2016, the tax character of dividends paid by the Fund were $33,141,733 of ordinary income and $11,557,872 of tax return of capital. For the year ended October 31, 2015, the tax character of dividends paid by the Fund were $61,744,306 of ordinary income and $8,746,321 of tax return of capital.
As of October 31, 2016, the Fund had no undistributed earnings on a tax basis.
The United States federal income tax basis of the Fund’s investments and the net unrealized depreciation as of October 31, 2016 were as follows:
| | | | | | | | | | |
Tax Basis | | Appreciation | | Depreciation | | Net
Unrealized
Depreciation | | Other Cost Basis
Adjustments | | Total Net
Unrealized
Depreciation |
| $1,530,892,647 | | $54,727,907 | | $(64,558,296) | | $(9,830,389) | | $(36,065,079) | | $(45,895,468) |
The difference between book basis and tax basis is primarily attributable to deferred losses on wash sales, difference in the treatment of premium amortization and other book to tax differences. The other cost basis adjustments are primarily attributable to appreciation (depreciation) of foreign currencies, swaps, futures, forward currency transactions and mark-to-market of receivables and payables.
For federal income tax purposes, the Fund had a capital loss carryforward as of October 31, 2016 of approximately $34,561,000 which can be carried forward for an unlimited period. No capital gains distributions are expected to be paid to shareholders until net gains have been realized in excess of such losses.
Management has analyzed the Fund’s tax positions taken on federal, state and local income tax returns for all open tax years and has concluded that no provision for income tax is required in the Fund’s financial statements for the current reporting period. The Fund’s federal, state and local income and federal excise tax returns for tax years for which the applicable statutes of limitations have not expired are subject to examination by the Internal Revenue Service and state departments of revenue.
| | | | |
| Prudential Absolute Return Bond Fund | | | 81 | |
Notes to Financial Statements (continued)
Note 6. Capital
The Fund offers Class A, Class C, Class Q and Class Z shares. Class A shares are sold with a front-end sales charge of up to 4.50%. All investors who purchase Class A shares in an amount of $1 million or more and sell these shares within 12 months of purchase are subject to a contingent deferred sales charge (“CDSC”) of 1%. The Class A CDSC is waived for purchases by certain retirement and/or benefit plans. Class C shares are sold with a CDSC of 1% on shares redeemed during the first 12 months after purchase. A special exchange privilege is also available for shareholders who qualified to purchase Class A shares at net asset value. Class Q and Class Z shares are not subject to any sales or redemption charge and are offered exclusively for sale to a limited group of investors.
Under certain circumstances, an exchange may be made from specified share classes of the Fund to one or more other share classes of the Fund as presented in the table of transactions in shares of beneficial interest.
At reporting period end, 6 shareholders of record held 56% of the Fund’s outstanding shares on behalf of multiple beneficial owners.
The Trust has authorized an unlimited number of shares of beneficial interest at $.001 par value.
Transactions in shares of beneficial interest were as follows:
| | | | | | | | |
Class A | | Shares | | | Amount | |
Year ended October 31, 2016: | | | | | | | | |
Shares sold | | | 3,440,458 | | | $ | 32,494,477 | |
Shares issued in reinvestment of dividends and distributions | | | 440,040 | | | | 4,141,204 | |
Shares reacquired | | | (14,830,739 | ) | | | (138,911,852 | ) |
| | | | | | | | |
Net increase (decrease) in shares outstanding before conversion | | | (10,950,241 | ) | | | (102,276,171 | ) |
Shares issued upon conversion from other share class(es) | | | 236,862 | | | | 2,227,068 | |
Shares reacquired upon conversion into other share class(es) | | | (1,938,955 | ) | | | (18,349,729 | ) |
| | | | | | | | |
Net increase (decrease) in shares outstanding | | | (12,652,334 | ) | | $ | (118,398,832 | ) |
| | | | | | | | |
Year ended October 31, 2015: | | | | | | | | |
Shares sold | | | 9,159,964 | | | $ | 88,548,404 | |
Shares issued in reinvestment of dividends and distributions | | | 767,890 | | | | 7,406,202 | |
Shares reacquired | | | (22,214,130 | ) | | | (214,083,595 | ) |
| | | | | | | | |
Net increase (decrease) in shares outstanding before conversion | | | (12,286,276 | ) | | | (118,128,989 | ) |
Shares issued upon conversion from other share class(es) | | | 413,369 | | | | 3,999,231 | |
Shares reacquired upon conversion into other share class(es) | | | (1,116,748 | ) | | | (10,782,429 | ) |
| | | | | | | | |
Net increase (decrease) in shares outstanding | | | (12,989,655 | ) | | $ | (124,912,187 | ) |
| | | | | | | | |
| | | | | | | | |
Class C | | Shares | | | Amount | |
Year ended October 31, 2016: | | | | | | | | |
Shares sold | | | 791,028 | | | $ | 7,508,773 | |
Shares issued in reinvestment of dividends and distributions | | | 161,297 | | | | 1,523,492 | |
Shares reacquired | | | (5,247,367 | ) | | | (49,413,539 | ) |
| | | | | | | | |
Net increase (decrease) in shares outstanding before conversion | | | (4,295,042 | ) | | | (40,381,274 | ) |
Shares issued upon conversion from other share class(es) | | | 7,065 | | | | 66,762 | |
Shares reacquired upon conversion into other share class(es) | | | (444,614 | ) | | | (4,219,724 | ) |
| | | | | | | | |
Net increase (decrease) in shares outstanding | | | (4,732,591 | ) | | $ | (44,534,236 | ) |
| | | | | | | | |
Year ended October 31, 2015: | | | | | | | | |
Shares sold | | | 3,281,932 | | | $ | 31,827,844 | |
Shares issued in reinvestment of dividends and distributions | | | 252,859 | | | | 2,455,008 | |
Shares reacquired | | | (5,849,278 | ) | | | (56,486,343 | ) |
| | | | | | | | |
Net increase (decrease) in shares outstanding before conversion | | | (2,314,487 | ) | | | (22,203,491 | ) |
Shares issued upon conversion from other share class(es) | | | 293 | | | | 2,817 | |
Shares reacquired upon conversion into other share class(es) | | | (568,639 | ) | | | (5,485,484 | ) |
| | | | | | | | |
Net increase (decrease) in shares outstanding | | | (2,882,833 | ) | | $ | (27,686,158 | ) |
| | | | | | | | |
Class Q | | | | | | |
Year ended October 31, 2016: | | | | | | | | |
Shares sold | | | 808,821 | | | $ | 7,619,847 | |
Shares issued in reinvestment of dividends and distributions | | | 419,707 | | | | 3,965,545 | |
Shares reacquired† | | | (873,487 | ) | | | (8,265,086 | ) |
| | | | | | | | |
Net increase (decrease) in shares outstanding before conversion | | | 355,041 | | | | 3,320,306 | |
Shares issued upon conversion from other share class(es) | | | 2,012,539 | | | | 19,107,874 | |
| | | | | | | | |
Net increase (decrease) in shares outstanding | | | 2,367,580 | | | $ | 22,428,180 | |
| | | | | | | | |
Year ended October 31, 2015: | | | | | | | | |
Shares sold | | | 15,365,666 | | | $ | 148,814,878 | |
Shares issued in reinvestment of dividends and distributions | | | 322,957 | | | | 3,104,469 | |
Shares reacquired | | | (2,026,331 | ) | | | (19,436,578 | ) |
| | | | | | | | |
Net increase (decrease) in shares outstanding before conversion | | | 13,662,292 | | | | 132,482,769 | |
Shares issued upon conversion from other share class(es) | | | 338,526 | | | | 3,270,165 | |
| | | | | | | | |
Net increase (decrease) in shares outstanding | | | 14,000,818 | | | $ | 135,752,934 | |
| | | | | | | | |
| | | | |
| Prudential Absolute Return Bond Fund | | | 83 | |
Notes to Financial Statements (continued)
| | | | | | | | |
Class Z | | Shares | | | Amount | |
Year ended October 31, 2016: | | | | | | | | |
Shares sold | | | 34,920,821 | | | $ | 330,492,012 | |
Shares issued in reinvestment of dividends and distributions | | | 2,388,839 | | | | 22,588,724 | |
Shares reacquired | | | (116,138,163 | ) | | | (1,094,934,947 | ) |
| | | | | | | | |
Net increase (decrease) in shares outstanding before conversion | | | (78,828,503 | ) | | | (741,854,211 | ) |
Shares issued upon conversion from other share class(es) | | | 2,343,730 | | | | 22,263,641 | |
Shares reacquired upon conversion into other share class(es) | | | (2,217,019 | ) | | | (21,095,892 | ) |
| | | | | | | | |
Net increase (decrease) in shares outstanding | | | (78,701,792 | ) | | $ | (740,686,462 | ) |
| | | | | | | | |
Year ended October 31, 2015: | | | | | | | | |
Shares sold | | | 76,184,518 | | | $ | 738,610,194 | |
Shares issued in reinvestment of dividends and distributions | | | 3,283,088 | | | | 31,761,004 | |
Shares reacquired | | | (106,576,807 | ) | | | (1,029,168,865 | ) |
| | | | | | | | |
Net increase (decrease) in shares outstanding before conversion | | | (27,109,201 | ) | | | (258,797,667 | ) |
Shares issued upon conversion from other shares class(es) | | | 1,675,175 | | | | 16,217,078 | |
Shares reacquired upon conversion into other share class(es) | | | (744,228 | ) | | | (7,221,378 | ) |
| | | | | | | | |
Net increase (decrease) in shares outstanding | | | (26,178,254 | ) | | $ | (249,801,967 | ) |
| | | | | | | | |
| † | Includes affiliated redemption of 116 shares with a value of $1,093 for Class Q shares. |
Note 7. Borrowings
The Fund, along with other affiliated registered investment companies (the “Funds”), is a party to a Syndicated Credit Agreement (“SCA”) with a group of banks. The purpose of the SCA is to provide an alternative source of temporary funding for capital share redemptions. The SCA provides for a commitment of $900 million for the period October 6, 2016 through October 5, 2017. The Funds pay an annualized commitment fee of .15% of the unused portion of the SCA. The interest rate on borrowings under the SCA is paid monthly and at a per annum rate based upon the higher of 0.0%, the effective federal funds rate, or the One-Month LIBOR rate, plus a contractual spread. Prior to October 6, 2016, the Funds had another SCA that provided a commitment of $900 million and the Funds paid an annualized commitment fee of .11% of the unused portion of the SCA. The interest rate on borrowings was substantially the same. The Fund’s portion of the commitment fee for the unused amount is accrued daily and paid quarterly.
The Fund utilized the SCA during the year ended October 31, 2016. The average daily balance for the 37 days that the Fund had loans outstanding during the period was $17,718,865, borrowed at a weighted average interest rate of 1.68%. The maximum loan balance outstanding during the period was $74,114,000. At October 31, 2016, the Fund did not have an outstanding loan balance.
Note 8. Recent Accounting Pronouncements and Reporting Updates
In January 2016, the FASB issued Accounting Standards Update (“ASU”) No. 2016-01 regarding “Recognition and Measurement of Financial Assets and Financial Liabilities”. The new guidance is intended to enhance the reporting model for financial instruments to provide users of financial statements with more decision-useful information and addresses certain aspects of the recognition, measurement, presentation, and disclosure of financial instruments. The new standard affects all entities that hold financial assets or owe financial liabilities. The new guidance is effective for public companies for fiscal years beginning after December 15, 2017, including interim periods within those fiscal years. At this time, management is evaluating the implications of ASU No. 2016-01 and its impact on the financial statements and disclosures has not yet been determined.
On October 13, 2016, the Securities and Exchange Commission (the “SEC”) adopted new rules and forms and amended existing rules and forms which are intended to modernize and enhance the reporting and disclosure of information by registered investment companies and to improve the quality of information that funds provide to investors, including modifications to Regulation S-X which would require standardized, enhanced disclosure about derivatives in investment company financial statements. In an effort to enhance monitoring and regulation, the new rules and forms will allow the SEC to more effectively collect and use data reported by funds. The new rules also enhance disclosure regarding fund liquidity and redemption practices. Also under the new rules, the SEC will permit open-end funds, with the exception of money market funds, to offer swing pricing, subject to board approval and review. The compliance dates of the modifications to Regulation S-X are August 1, 2017 and other amendments and rules are generally June 1, 2018 and December 1, 2018. Management is currently evaluating the impacts to the financial statement disclosures, if any.
| | | | |
| Prudential Absolute Return Bond Fund | | | 85 | |
Financial Highlights
| | | | | | | | | | | | | | | | | | | | |
| Class A Shares | |
| | | Year Ended October 31, | |
| | | 2016 | | | 2015 | | | 2014 | | | 2013 | | | 2012 | |
| Per Share Operating Performance(a): | | | | | | | | | | | | | | | | | | | | |
| Net Asset Value, Beginning of Year | | | $9.48 | | | | $9.79 | | | | $9.82 | | | | $9.92 | | | | $9.72 | |
| Income (loss) from investment operations: | | | | | | | | | | | | | | | | | | | | |
| Net investment income (loss) | | | .25 | | | | .23 | | | | .25 | | | | .21 | | | | .22 | |
| Net realized and unrealized gain (loss) on investment transactions | | | .06 | | | | (.30 | ) | | | .02 | | | | (.03 | ) | | | .30 | |
| Total from investment operations | | | .31 | | | | (.07 | ) | | | .27 | | | | .18 | | | | .52 | |
| Less Dividends and Distributions: | | | | | | | | | | | | | | | | | | | | |
| Dividends from net investment income | | | (.15 | ) | | | (.21 | ) | | | (.30 | ) | | | (.23 | ) | | | (.30 | ) |
| Tax return of capital | | | (.05 | ) | | | (.03 | ) | | | - | | | | (.05 | ) | | | - | |
| Distributions from net realized gains | | | - | | | | - | | | | - | | | | - | | | | (.02 | ) |
| Total dividends and distributions | | | (.20 | ) | | | (.24 | ) | | | (.30 | ) | | | (.28 | ) | | | (.32 | ) |
| Net asset value, end of Year | | | $9.59 | | | | $9.48 | | | | $9.79 | | | | $9.82 | | | | $9.92 | |
| Total Return(b): | | | 3.36% | | | | (.78)% | | | | 2.76% | | | | 1.86% | | | | 5.49% | |
| | | | | | | | | | | | | |
| Ratios/Supplemental Data: | | | | | | | | | | |
| Net assets, end of year (000) | | | $197,713 | | | | $315,214 | | | | $452,955 | | | | $469,604 | | | | $91,250 | |
| Average net assets (000) | | | $246,082 | | | | $383,950 | | | | $483,199 | | | | $303,234 | | | | $18,023 | |
| Ratios to average net assets(c)(d): | | | | | | | | | | | | | | | | | | | | |
| Expenses after waivers and/or expense reimbursement | | | 1.15% | | | | 1.15% | | | | 1.15% | | | | 1.14% | | | | 1.11% | |
| Expenses before waivers and/or expense reimbursement | | | 1.24% | | | | 1.24% | | | | 1.27% | | | | 1.28% | | | | 1.54% | |
| Net investment income (loss) | | | 2.67% | | | | 2.39% | | | | 2.58% | | | | 2.17% | | | | 2.53% | |
| Portfolio turnover rate | | | 38% | | | | 64% | | | | 64% | | | | 125% | | | | 152% | |
| (a) | Calculated based on average shares outstanding during the year. |
| (b) | Total return does not consider the effects of sales loads. Total return is calculated assuming a purchase of a share on the first day and a sale on the last day of each year reported and includes reinvestment of dividends and distributions, if any. Total returns may reflect adjustments to conform to generally accepted accounting principles. |
| (c) | Does not include expenses of the underlying portfolios in which the Fund invests. |
| (d) | Effective March 9, 2015, the contractual distribution and service (12b-1) fees were reduced from .30% to .25% of the average daily net assets and the .05% contractual 12b-1 waiver was terminated. |
See Notes to Financial Statements.
| | | | | | | | | | | | | | | | | | | | |
| Class C Shares | |
| | | Year Ended October 31, | |
| | | 2016 | | | 2015 | | | 2014 | | | 2013 | | | 2012 | |
| Per Share Operating Performance(a): | | | | | | | | | | | | | | | | | | | | |
| Net Asset Value, Beginning of Year | | | $9.51 | | | | $9.82 | | | | $9.85 | | | | $9.94 | | | | $9.73 | |
| Income (loss) from investment operations: | | | | | | | | | | | | | | | | | | | | |
| Net investment income (loss) | | | .18 | | | | .16 | | | | .18 | | | | .14 | | | | .16 | |
| Net realized and unrealized gain (loss) on investment transactions | | | .06 | | | | (.31 | ) | | | .01 | | | | (.02 | ) | | | .29 | |
| Total from investment operations | | | .24 | | | | (.15 | ) | | | .19 | | | | .12 | | | | .45 | |
| Less Dividends and Distributions: | | | | | | | | | | | | | | | | | | | | |
| Dividends from net investment income | | | (.10 | ) | | | (.13 | ) | | | (.22 | ) | | | (.16 | ) | | | (.22 | ) |
| Tax return of capital | | | (.03 | ) | | | (.03 | ) | | | - | | | | (.05 | ) | | | - | |
| Distributions from net realized gains | | | - | | | | - | | | | - | | | | - | | | | (.02 | ) |
| Total dividends and distributions | | | (.13 | ) | | | (.16 | ) | | | (.22 | ) | | | (.21 | ) | | | (.24 | ) |
| Net asset value, end of year | | | $9.62 | | | | $9.51 | | | | $9.82 | | | | $9.85 | | | | $9.94 | |
| Total Return(b): | | | 2.59% | | | | (1.51)% | | | | 1.97% | | | | 1.18% | | | | 4.78% | |
| | | | | | | | | | | | | |
| Ratios/Supplemental Data: | | | | | | | | | | |
| Net assets, end of year (000) | | | $118,092 | | | | $161,679 | | | | $195,312 | | | | $172,326 | | | | $28,708 | |
| Average net assets (000) | | | $135,510 | | | | $183,419 | | | | $183,745 | | | | $97,736 | | | | $7,066 | |
| Ratios to average net assets(c): | | | | | | | | | | | | | | | | | | | | |
| Expenses after waivers and/or expense reimbursement | | | 1.90% | | | | 1.90% | | | | 1.90% | | | | 1.89% | | | | 1.88% | |
| Expenses before waivers and/or expense reimbursement | | | 1.99% | | | | 1.97% | | | | 1.97% | | | | 1.98% | | | | 2.39% | |
| Net investment income (loss) | | | 1.91% | | | | 1.62% | | | | 1.81% | | | | 1.41% | | | | 1.86% | |
| Portfolio turnover rate | | | 38% | | | | 64% | | | | 64% | | | | 125% | | | | 152% | |
| (a) | Calculated based on average shares outstanding during the year. |
| (b) | Total return does not consider the effects of sales loads. Total return is calculated assuming a purchase of a share on the first day and a sale on the last day of each year reported and includes reinvestment of dividends and distributions, if any. Total returns may reflect adjustments to conform to generally accepted accounting principles. |
| (c) | Does not include expenses of the underlying portfolios in which the Fund invests. |
See Notes to Financial Statements.
| | | | |
| Prudential Absolute Return Bond Fund | | | 87 | |
Financial Highlights (continued)
| | | | | | | | | | | | | | | | | | | | |
| Class Q Shares | |
| | | Year Ended October 31, | |
| | | 2016 | | | 2015 | | | 2014 | | | 2013 | | | 2012 | |
| Per Share Operating Performance(a): | | | | | | | | | | | | | | | | | | | | |
| Net Asset Value, Beginning of Year | | | $9.49 | | | | $9.81 | | | | $9.83 | | | | $9.94 | | | | $9.73 | |
| Income (loss) from investment operations: | | | | | | | | | | | | | | | | | | | | |
| Net investment income (loss) | | | .28 | | | | .25 | | | | .28 | | | | .27 | | | | .30 | |
| Net realized and unrealized gain (loss) on investment transactions | | | .07 | | | | (.30 | ) | | | .03 | | | | (.06 | ) | | | .26 | |
| Total from investment operations | | | .35 | | | | (.05 | ) | | | .31 | | | | .21 | | | | .56 | |
| Less Dividends and Distributions: | | | | | | | | | | | | | | | | | | | | |
| Dividends from net investment income | | | (.17 | ) | | | (.24 | ) | | | (.33 | ) | | | (.27 | ) | | | (.33 | ) |
| Tax return of capital | | | (.06 | ) | | | (.03 | ) | | | - | | | | (.05 | ) | | | - | |
| Distributions from net realized gains | | | - | | | | - | | | | - | | | | - | | | | (.02 | ) |
| Total dividends and distributions | | | (.23 | ) | | | (.27 | ) | | | (.33 | ) | | | (.32 | ) | | | (.35 | ) |
| Net asset value, end of year | | | $9.61 | | | | $9.49 | | | | $9.81 | | | | $9.83 | | | | $9.94 | |
| Total Return(b): | | | 3.81% | | | | (.57)% | | | | 3.16% | | | | 2.10% | | | | 5.99% | |
| | | | | | | | | | | | | |
| Ratios/Supplemental Data: | | | | | | | | | | |
| Net assets, end of year (000) | | | $175,887 | | | | $151,294 | | | | $19,025 | | | | $17,829 | | | | $1 | |
| Average net assets (000) | | | $158,967 | | | | $125,910 | | | | $18,604 | | | | $3,144 | | | | $1 | |
| Ratios to average net assets(c): | | | | | | | | | | | | | | | | | | | | |
| Expenses after waivers and/or expense reimbursement | | | .84% | | | | .85% | | | | .85% | | | | .90% | | | | .89% | |
| Expenses before waivers and/or expense reimbursement | | | .84% | | | | .85% | | | | .85% | | | | .94% | | | | 1.54% | |
| Net investment income (loss) | | | 2.97% | | | | 2.61% | | | | 2.87% | | | | 2.87% | | | | 3.11% | |
| Portfolio turnover rate | | | 38% | | | | 64% | | | | 64% | | | | 125% | | | | 152% | |
| (a) | Calculated based on average shares outstanding during the year. |
| (b) | Total return is calculated assuming a purchase of a share on the first day and a sale on the last day of each year reported and includes reinvestment of dividends and distributions, if any. Total returns may reflect adjustments to conform to generally accepted accounting principles. |
| (c) | Does not include expenses of the underlying portfolios in which the Fund invests. |
See Notes to Financial Statements.
| | | | | | | | | | | | | | | | | | | | |
| Class Z Shares | |
| | | Year Ended October 31, | |
| | | 2016 | | | 2015 | | | 2014 | | | 2013 | | | 2012 | |
| Per Share Operating Performance(a): | | | | | | | | | | | | | | | | | | | | |
| Net Asset Value, Beginning of Year | | | $9.52 | | | | $9.83 | | | | $9.86 | | | | $9.95 | | | | $9.74 | |
| Income (loss) from investment operations: | | | | | | | | | | | | | | | | | | | | |
| Net investment income (loss) | | | .27 | | | | .25 | | | | .27 | | | | .24 | | | | .27 | |
| Net realized and unrealized gain (loss) on investment transactions | | | .08 | | | | (.30 | ) | | | .02 | | | | (.02 | ) | | | .28 | |
| Total from investment operations | | | .35 | | | | (.05 | ) | | | .29 | | | | .22 | | | | .55 | |
| Less Dividends and Distributions: | | | | | | | | | | | | | | | | | | | | |
| Dividends from net investment income | | | (.17 | ) | | | (.23 | ) | | | (.32 | ) | | | (.26 | ) | | | (.32 | ) |
| Tax return of capital | | | (.06 | ) | | | (.03 | ) | | | - | | | | (.05 | ) | | | - | |
| Distributions from net realized gains | | | - | | | | - | | | | - | | | | - | | | | (.02 | ) |
| Total dividends and distributions | | | (.23 | ) | | | (.26 | ) | | | (.32 | ) | | | (.31 | ) | | | (.34 | ) |
| Net asset value, end of year | | | $9.64 | | | | $9.52 | | | | $9.83 | | | | $9.86 | | | | $9.95 | |
| Total Return(b): | | | 3.71% | | | | (.53)% | | | | 3.00% | | | | 2.21% | | | | 5.81% | |
| | | | | | | | | | | | | |
| Ratios/Supplemental Data: | | | | | | | | | | |
| Net assets, end of year (000) | | | $1,019,254 | | | | $1,755,667 | | | | $2,070,862 | | | | $1,201,383 | | | | $82,364 | |
| Average net assets (000) | | | $1,396,060 | | | | $2,029,397 | | | | $1,484,697 | | | | $672,382 | | | | $34,383 | |
| Ratios to average net assets(c): | | | | | | | | | | | | | | | | | | | | |
| Expenses after waivers and/or expense reimbursement | | | .90% | | | | .90% | | | | .90% | | | | .90% | | | | .89% | |
| Expenses before waivers and/or expense reimbursement | | | .99% | | | | .97% | | | | .97% | | | | .99% | | | | 1.50% | |
| Net investment income (loss) | | | 2.91% | | | | 2.61% | | | | 2.79% | | | | 2.43% | | | | 2.92% | |
| Portfolio turnover rate | | | 38% | | | | 64% | | | | 64% | | | | 125% | | | | 152% | |
| (a) | Calculated based on average shares outstanding during the year. |
| (b) | Total return is calculated assuming a purchase of a share on the first day and a sale on the last day of each year reported and includes reinvestment of dividends and distributions, if any. Total returns may reflect adjustments to conform to generally accepted accounting principles. |
| (c) | Does not include expenses of the underlying portfolios in which the Fund invests. |
See Notes to Financial Statements.
| | | | |
| Prudential Absolute Return Bond Fund | | | 89 | |
Report of Independent Registered Public Accounting Firm
The Board of Trustees and Shareholders
Prudential Investment Portfolios 9:
We have audited the accompanying statement of assets and liabilities of Prudential Absolute Return Bond Fund, one of the series constituting Prudential Investment Portfolios 9 (hereafter referred to as the “Fund”), including the portfolio of investments, as of October 31, 2016, and the related statement of operations for the year then ended, the statements of changes in net assets for each of the years in the two-year period then ended, and the financial highlights for each of the years in the five-year period then ended. These financial statements and financial highlights are the responsibility of the Fund’s management. Our responsibility is to express an opinion on these financial statements and financial highlights based on our audits.
We conducted our audits in accordance with the standards of the Public Company Accounting Oversight Board (United States). Those standards require that we plan and perform the audit to obtain reasonable assurance about whether the financial statements and financial highlights are free of material misstatement. An audit includes examining, on a test basis, evidence supporting the amounts and disclosures in the financial statements. Our procedures included confirmation of securities owned as of October 31, 2016, by correspondence with the custodian, transfer agent and brokers or by other appropriate auditing procedures when replies from brokers were not received. An audit also includes assessing the accounting principles used and significant estimates made by management, as well as evaluating the overall financial statement presentation. We believe that our audits provide a reasonable basis for our opinion.
In our opinion, the financial statements and financial highlights referred to above present fairly, in all material respects, the financial position of the Fund as of October 31, 2016, and the results of its operations for the year then ended, the changes in its net assets for each of the years in the two-year period then ended, and the financial highlights for each of the years in the five-year period then ended, in conformity with U.S. generally accepted accounting principles.

New York, New York
December 19, 2016
Federal Income Tax Information (unaudited)
For the year ended October 31, 2016, the Fund reports the maximum amount allowable but not less than 100% as interest related dividends in accordance with Section 871(k)(1) and 881(e)(1) of the Internal Revenue Code.
In January 2017, you will be advised on IRS Form 1099-DIV or substitute Form 1099-DIV as to the federal tax status of the distributions received by you in calendar year 2016.
| | | | |
| Prudential Absolute Return Bond Fund | | | 91 | |
INFORMATION ABOUT BOARD MEMBERS AND OFFICERS
(Unaudited)
Information about Board Members and Officers of the Fund is set forth below. Board Members who are not deemed to be “interested persons” of the Fund, as defined in the 1940 Act, are referred to as “Independent Board Members.” Board Members who are deemed to be “interested persons” of the Fund are referred to as “Interested Board Members.” The Board Members are responsible for the overall supervision of the operations of the Fund and perform the various duties imposed on the directors of investment companies by the 1940 Act. The Board in turn elects the Officers, who are responsible for administering the day-to-day operations of the Fund.
| | | | |
| Independent Board Members(1) |
Name, Address, Age Position(s) Portfolios Overseen | | Principal Occupation(s) During Past Five Years | | Other Directorships Held During Past Five Years |
Ellen S. Alberding (58) Board Member Portfolios Overseen: 89 | | President and Board Member, The Joyce Foundation (charitable foundation) (since 2002); Vice Chair, City Colleges of Chicago (community college system) (since 2011); Trustee, Skills for America’s Future (national initiative to connect employers to community colleges) (since 2011); Trustee, National Park Foundation (charitable foundation for national park system) (since 2009); Trustee, Economic Club of Chicago (since 2009). | | None. |
Kevin J. Bannon (64) Board Member Portfolios Overseen: 89 | | Managing Director (April 2008-May 2015) and Chief Investment Officer (October 2008-November 2013) of Highmount Capital LLC (registered investment adviser); formerly Executive Vice President and Chief Investment Officer (April 1993-August 2007) of Bank of New York Company; President (May 2003-May 2007) of BNY Hamilton Family of Mutual Funds. | | Director of Urstadt Biddle Properties (equity real estate investment trust) (since September 2008). |
Linda W. Bynoe (64) Board Member Portfolios Overseen: 89 | | President and Chief Executive Officer (since March 1995) and formerly Chief Operating Officer (December 1989-February 1995) of Telemat Ltd. (management consulting); formerly Vice President (January 1985-June 1989) at Morgan Stanley & Co. (broker-dealer). | | Director of Simon Property Group, Inc. (retail real estate) (May 2003-May 2012); Director of Anixter International, Inc. (communication products distributor) (since January 2006); Director of Northern Trust Corporation (financial services) (since April 2006); Trustee of Equity Residential (residential real estate) (since December 2009). |
Prudential Absolute Return Bond Fund
| | | | |
| Independent Board Members(1) |
Name, Address, Age Position(s) Portfolios Overseen | | Principal Occupation(s) During Past Five Years | | Other Directorships Held During Past Five Years |
Keith F. Hartstein (60) Board Member Portfolios Overseen: 89 | | Retired; Member (since November 2014) of the Governing Council of the Independent Directors Council (organization of independent mutual fund directors); formerly President and Chief Executive Officer (2005-2012), Senior Vice President
(2004-2005), Senior Vice President of Sales and Marketing (1997-2004), and various executive management positions (1990-1997), John Hancock Funds, LLC (asset management); Chairman, Investment Company Institute’s Sales Force Marketing Committee (2003-2008). | | None. |
Michael S. Hyland, CFA (71) Board Member Portfolios Overseen: 89 | | Retired (since February 2005); formerly Senior Managing Director (July 2001-February 2005) of Bear Stearns & Co, Inc.; Global Partner, INVESCO (1999-2001); Managing Director and President of Salomon Brothers Asset Management (1989-1999). | | None. |
Richard A. Redeker (73) Board Member & Independent Chair Portfolios Overseen: 89 | | Retired Mutual Fund Senior Executive (47 years); Management Consultant; Director, Mutual Fund Directors Forum (since 2014); Independent Directors Council (organization of independent mutual fund directors)-Executive Committee, Chair of Policy Steering Committee, Governing Council. | | None. |
Stephen G. Stoneburn (73) Board Member Portfolios Overseen: 89 | | Chairman (since July 2011), President and Chief Executive Officer (since June 1996) of Quadrant Media Corp. (publishing company); formerly President (June 1995-June 1996) of Argus Integrated Media, Inc.; Senior Vice President and Managing Director (January 1993-1995) of Cowles Business Media; Senior Vice President of Fairchild Publications, Inc. (1975-1989). | | None. |
Visit our website at prudentialfunds.com
| | | | |
| Interested Board Members(1) |
Name, Address, Age Position(s) Portfolios Overseen | | Principal Occupation(s) During Past Five Years | | Other Directorships Held During Past Five Years |
Stuart S. Parker (54) Board Member & President Portfolios Overseen: 89 | | President of Prudential Investments LLC (since January 2012); Executive Vice President of Prudential Investment Management Services LLC (since December 2012); Executive Vice President of Jennison Associates LLC and Head of Retail Distribution of Prudential Investments LLC (June 2005-December 2011). | | None. |
Scott E. Benjamin (43) Board Member & Vice President Portfolios Overseen: 89 | | Executive Vice President (since June 2009) of Prudential Investments LLC; Executive Vice President (June 2009-June 2012) and Vice President (since June 2012) of Prudential Investment Management Services LLC; Executive Vice President (since September 2009) of AST Investment Services, Inc.; Senior Vice President of Product Development and Marketing, Prudential Investments (since February 2006); Vice President of Product Development and Product Management, Prudential Investments (2003-2006). | | None. |
Grace C. Torres* (57) Board Member Portfolios Overseen: 87 | | Retired; formerly Treasurer and Principal Financial and Accounting Officer of the Prudential Investments Funds, Target Funds, Advanced Series Trust, Prudential Variable Contract Accounts and The Prudential Series Fund (1998-June 2014); Assistant Treasurer (March 1999-June 2014) and Senior Vice President (September 1999-June 2014) of Prudential Investments LLC; Assistant Treasurer (May 2003-June 2014) and Vice President (June 2005-June 2014) of AST Investment Services, Inc.; Senior Vice President and Assistant Treasurer (May 2003-June 2014) of Prudential Annuities Advisory Services, Inc. | | Director (since July 2015) of Sun Bancorp, Inc. N.A. |
| * | Note: Prior to her retirement in 2014, Ms. Torres was employed by Prudential Investments LLC. Due to her prior employment, she is considered to be an “interested person” under the 1940 Act. Ms. Torres is a Non-Management Interested Board Member. |
| (1) | The year that each individual joined the Board is as follows: |
Ellen S. Alberding, 2013; Linda W. Bynoe, 2005; Richard A. Redeker, 1998; Stephen G. Stoneburn, 2003; Kevin J. Bannon, 2008; Keith F. Hartstein, 2013; Michael S. Hyland, 2008; Stuart S. Parker, Board Member since 2012 and President since 2012;
Scott E. Benjamin, Board Member since 2010 and Vice President since 2009; Grace C. Torres, 2014.
Prudential Absolute Return Bond Fund
| | | | |
| Fund Officers(a) |
Name, Address and Age Position with Fund | | Principal Occupation(s) During Past Five Years | | Length of Service as Fund Officer |
Raymond A. O’Hara (61) Chief Legal Officer | | Vice President and Corporate Counsel (since July 2010) of Prudential Insurance Company of America (Prudential); Vice President (March 2011-Present) of Pruco Life Insurance Company and Pruco Life Insurance Company of New Jersey; Vice President and Corporate Counsel (March 2011-Present) of Prudential Annuities Life Assurance Corporation; Chief Legal Officer of Prudential Investments LLC (since June 2012); Chief Legal Officer of Prudential Mutual Fund Services LLC (since June 2012) and Corporate Counsel of AST Investment Services, Inc. (since June 2012); formerly Assistant Vice President and Corporate Counsel (September 2008-July 2010) of The Hartford Financial Services Group, Inc.; formerly Associate (September 1980-December 1987) and Partner (January 1988–August 2008) of Blazzard & Hasenauer, P.C. (formerly, Blazzard, Grodd & Hasenauer, P.C.). | | Since 2012 |
Chad A. Earnst (41) Chief Compliance Officer | | Chief Compliance Officer (September 2014-Present) of Prudential Investments LLC; Chief Compliance Officer (September 2014-Present) of the Prudential Investments Funds, Target Funds, Advanced Series Trust, The Prudential Series Fund, Prudential’s Gibraltar Fund, Inc., Prudential Global Short Duration High Yield Income Fund, Inc., Prudential Short Duration High Yield Fund, Inc. and Prudential Jennison MLP Income Fund, Inc.; formerly Assistant Director (March 2010-August 2014) of the Asset Management Unit, Division of Enforcement, US Securities & Exchange Commission; Assistant Regional Director (January 2010-August 2014), Branch Chief (June 2006–December 2009) and Senior Counsel (April 2003-May 2006) of the Miami Regional Office, Division of Enforcement, US Securities & Exchange Commission. | | Since 2014 |
Deborah A. Docs (58) Secretary | | Vice President and Corporate Counsel (since January 2001) of Prudential; Vice President (since December 1996) and Assistant Secretary (since March 1999) of Prudential Investments LLC; formerly Vice President and Assistant Secretary (May 2003-June 2005) of AST Investment Services, Inc. | | Since 2004 |
Jonathan D. Shain (58) Assistant Secretary | | Vice President and Corporate Counsel (since August 1998) of Prudential; Vice President and Assistant Secretary (since May 2001) of Prudential Investments LLC; Vice President and Assistant Secretary (since February 2001) of Prudential Mutual Fund Services LLC; formerly Vice President and Assistant Secretary (May 2003-June 2005) of AST Investment Services, Inc. | | Since 2005 |
Visit our website at prudentialfunds.com
| | | | |
| Fund Officers(a) |
Name, Address and Age Position with Fund | | Principal Occupation(s) During Past Five Years | | Length of Service as Fund Officer |
Claudia DiGiacomo (42) Assistant Secretary | | Vice President and Corporate Counsel (since January 2005) of Prudential; Vice President and Assistant Secretary of Prudential Investments LLC (since December 2005); Associate at Sidley Austin Brown & Wood LLP (1999-2004). | | Since 2005 |
Andrew R. French (54) Assistant Secretary | | Vice President and Corporate Counsel (since February 2010) of Prudential; formerly Director and Corporate Counsel (2006-2010) of Prudential; Vice President and Assistant Secretary (since January 2007) of Prudential Investments LLC; Vice President and Assistant Secretary (since January 2007) of Prudential Mutual Fund Services LLC. | | Since 2006 |
Theresa C. Thompson (54) Deputy Chief Compliance Officer | | Vice President, Compliance, Prudential Investments LLC (since April 2004); and Director, Compliance, Prudential Investments LLC (2001-2004). | | Since 2008 |
Charles H. Smith (43) Anti-Money Laundering Compliance Officer | | Vice President, Corporate Compliance, Anti-Money Laundering Unit (since January 2015) of Prudential; committee member of the American Council of Life Insurers Anti-Money Laundering and Critical Infrastructure Committee (since January 2016); formerly Global Head of Economic Sanctions Compliance at AIG Property Casualty (February 2007–December 2014); Assistant Attorney General at the New York State Attorney General’s Office, Division of Public Advocacy. (August 1998—January 2007). | | Since 2016 |
M. Sadiq Peshimam (52) Treasurer and Principal Financial and Accounting Officer | | Vice President (since 2005) of Prudential Investments LLC; formerly Assistant Treasurer of funds in the Prudential Mutual Fund Complex (2006-2014). | | Since 2006 |
Peter Parrella (58) Assistant Treasurer | | Vice President (since 2007) and Director (2004-2007) within Prudential Mutual Fund Administration; formerly Tax Manager at SSB Citi Fund Management LLC (1997-2004). | | Since 2007 |
Lana Lomuti (49) Assistant Treasurer | | Vice President (since 2007) and Director (2005-2007), within Prudential Mutual Fund Administration; formerly Assistant Treasurer (December 2007-February 2014) of The Greater China Fund, Inc. | | Since 2014 |
Linda McMullin (55) Assistant Treasurer | | Vice President (since 2011) and Director (2008-2011) within Prudential Mutual Fund Administration. | | Since 2014 |
Kelly A. Coyne (48) Assistant Treasurer | | Director, Investment Operations of Prudential Mutual Fund Services LLC (since 2010). | | Since 2015 |
Prudential Absolute Return Bond Fund
| (a) | Excludes Mr. Parker and Mr. Benjamin, interested Board Members who also serve as President and Vice President, respectively. |
Explanatory Notes to Tables:
| • | | Board Members are deemed to be “Interested,” as defined in the 1940 Act, by reason of their affiliation with Prudential Investments LLC and/or an affiliate of Prudential Investments LLC. |
| • | | Unless otherwise noted, the address of all Board Members and Officers is c/o Prudential Investments LLC, 655 Broad Street, Newark, New Jersey 07102-4410. |
| • | | There is no set term of office for Board Members or Officers. The Board Members have adopted a retirement policy, which calls for the retirement of Board Members on December 31 of the year in which they reach the age of 75. |
| • | | “Other Directorships Held” includes only directorships of companies required to register or file reports with the SEC under the 1934 Act (that is, “public companies”) or other investment companies registered under the 1940 Act. |
| • | | “Portfolios Overseen” includes all investment companies managed by Prudential Investments LLC. The investment companies for which Prudential Investments LLC serves as manager include the Prudential Investments Mutual Funds, The Prudential Variable Contract Accounts, Target Mutual Funds, Prudential Short Duration High Yield Fund, Inc., Prudential Global Short Duration High Yield Fund, Inc., The Prudential Series Fund, Prudential’s Gibraltar Fund, Inc. and the Advanced Series Trust. |
Visit our website at prudentialfunds.com
Approval of Advisory Agreements (unaudited)
The Fund’s Board of Trustees
The Board of Trustees (the “Board”) of Prudential Absolute Return Bond Fund (the “Fund”)1 consists of ten individuals, seven of whom are not “interested persons” of the Fund, as defined in the Investment Company Act of 1940, as amended (the “1940 Act”) (the “Independent Trustees”). The Board is responsible for the oversight of the Fund and its operations, and performs the various duties imposed on the Trustees of investment companies by the 1940 Act. The Independent Trustees have retained independent legal counsel to assist them in connection with their duties. The Chair of the Board is an Independent Trustee. The Board has established three standing committees: the Audit Committee, the Nominating and Governance Committee, and the Investment Committee. Each committee is chaired by, and composed of, Independent Trustees.
Annual Approval of the Fund’s Advisory Agreements
As required under the 1940 Act, the Board determines annually whether to renew the Fund’s management agreement with Prudential Investments LLC (“PI”), the Fund’s subadvisory agreement with PGIM, Inc. (“PGIM”) on behalf of its PGIM Fixed Income (“PGIM Fixed Income”) unit, and the Fund’s sub-subadvisory agreement with PGIM Limited (“PGIML”). In considering the renewal of the agreements, the Board, including all of the Independent Trustees, met on June 7-9, 2016 and approved the renewal of the agreements through July 31, 2017, after concluding that the renewal of the agreements was in the best interests of the Fund and its shareholders.
In advance of the meetings, the Board requested and received materials relating to the agreements, and had the opportunity to ask questions and request further information in connection with its consideration. Among other things, the Board considered comparative fee information from PI and PGIM. Also, the Board considered comparisons with other mutual funds in relevant Peer Universes and Peer Groups, as is further discussed below.
In approving the agreements, the Board, including the Independent Trustees advised by independent legal counsel, considered the factors it deemed relevant, including the nature, quality and extent of services provided by PI and the subadviser, the performance of the Fund, the profitability of PI and its affiliates, expenses and fees, and the potential for economies of scale that may be shared with the Fund and its shareholders as the Fund’s assets grow. In their deliberations, the Trustees did not identify any single factor which alone was responsible for the Board’s decision to approve the agreements with respect to the Fund. In connection with its deliberations, the Board considered information provided
| 1 | Prudential Absolute Return Bond Fund is a series of Prudential Investment Portfolios 9. |
| | |
| Prudential Absolute Return Bond Fund |
Approval of Advisory Agreements (continued)
by PI throughout the year at regular Board meetings, presentations from portfolio managers and other information, as well as information furnished at or in advance of the meetings on June 7-9, 2016.
The Trustees determined that the overall arrangements between the Fund and PI, which serves as the Fund’s investment manager pursuant to a management agreement, between PI and PGIM, which, through its PGIM Fixed Income unit. serves as the Fund’s subadviser pursuant to the terms of a subadvisory agreement with PI, and between PGIM Fixed Income and PGIML, which serves as the Fund’s sub-subadviser pursuant to the terms of a sub-subadvisory agreement with PGIM, are in the best interests of the Fund and its shareholders in light of the services performed, fees charged and such other matters as the Trustees considered relevant in the exercise of their business judgment.
The material factors and conclusions that formed the basis for the Trustees’ reaching their determinations to approve the continuance of the agreements are separately discussed below.
Nature, Quality, and Extent of Services
The Board received and considered information regarding the nature, quality and extent of services provided to the Fund by PI, PGIM Fixed Income, and PGIML. The Board considered the services provided by PI, including but not limited to the oversight of the subadviser and sub-subadviser for the Fund, as well as the provision of fund recordkeeping, compliance, and other services to the Fund. With respect to PI’s oversight of the subadviser and sub-subadviser, the Board noted that PI’s Strategic Investment Research Group (“SIRG”), which is a business unit of PI, is responsible for monitoring and reporting to PI’s senior management on the performance and operations of the subadviser and sub-subadviser. The Board also considered that PI pays the salaries of all of the officers and interested Trustees of the Fund who are part of Fund management. The Board also considered the investment subadvisory services provided by PGIM Fixed Income and PGIML, including investment research and security selection, as well as adherence to the Fund’s investment restrictions and compliance with applicable Fund policies and procedures. The Board considered PI’s evaluation of the subadviser and sub-subadviser, as well as PI’s recommendation, based on its review of the subadviser and sub-subadviser, to renew the subadvisory and sub-subadvisory agreements.
The Board considered the qualifications, backgrounds and responsibilities of PI’s senior management responsible for the oversight of the Fund, PGIM Fixed Income, and PGIML, and also considered the qualifications, backgrounds and responsibilities of PGIM Fixed Income’s portfolio managers who are responsible for the day-to-day management of the Fund’s portfolio. The Board was provided with information pertaining to PI’s, PGIM Fixed
| | |
| Visit our website at prudentialfunds.com | | |
Income’s, and PGIML’s organizational structure, senior management, investment operations, and other relevant information pertaining to PI, PGIM Fixed Income, and PGIML. The Board also noted that it received favorable compliance reports from the Fund’s Chief Compliance Officer (“CCO”) as to PI, PGIM Fixed Income, and PGIML. The Board noted that PGIM Fixed Income and PGIML are affiliated with PI.
The Board concluded that it was satisfied with the nature, extent and quality of the investment management services provided by PI, the subadvisory services provided to the Fund by PGIM Fixed Income, and the sub-subadvisory services provided by PGIML, and that there was a reasonable basis on which to conclude that the Fund benefits from the services provided by PI, PGIM Fixed Income, and PGIML under the management and subadvisory agreements.
Costs of Services and Profits Realized by PI
The Board was provided with information on the profitability of PI and its affiliates in serving as the Fund’s investment manager. The Board discussed with PI the methodology utilized in assembling the information regarding profitability and considered its reasonableness. The Board recognized that it is difficult to make comparisons of profitability from fund management contracts because comparative information is not generally publicly available and is affected by numerous factors, including the structure of the particular adviser, the types of funds it manages, its business mix, numerous assumptions regarding allocations and the adviser’s capital structure and cost of capital. The Board further noted that the subadviser and sub-subadviser are affiliated with PI and that their profitability is reflected in PI’s profitability report. Taking these factors into account, the Board concluded that the profitability of PI and its affiliates in relation to the services rendered was not unreasonable.
Economies of Scale
PI and the Board previously retained an outside business consulting firm to review management fee breakpoint usage and trends in management fees across the mutual fund industry. The consulting firm presented its analysis and conclusions as to the Fund’s management fee structures to the Board and PI. The Board and PI have discussed these conclusions extensively since that presentation.
The Board received and discussed information concerning economies of scale that PI may realize as the Fund’s assets grow beyond current levels. The Board noted that the management fee schedule for the Fund includes breakpoints, which have the effect of decreasing the fee rate as assets increase, but at its current level of assets the Fund does not realize the effect of those rate reductions. The Board took note that the Fund’s fee structure currently results in benefits to Fund shareholders whether or not PI realizes any economies of scale. The Board noted that economies of scale can be shared with the Fund
| | |
| Prudential Absolute Return Bond Fund |
Approval of Advisory Agreements (continued)
in other ways, including low management fees from inception, additional technological and personnel investments to enhance shareholder services, and maintaining existing expense structures in the face of a rising cost environment. The Board also considered PI’s assertion that it continually evaluates the management fee schedule of the Fund and the potential to share economies of scale through breakpoints or fee waivers as asset levels increase.
The Board recognized the inherent limitations of any analysis of economies of scale, stemming largely from the Board’s understanding that most of PI’s costs are not specific to individual funds, but rather are incurred across a variety of products and services.
Other Benefits to PI, PGIM Fixed Income, and PGIML
The Board considered potential ancillary benefits that might be received by PI, PGIM Fixed Income, and PGIML and their affiliates as a result of their relationship with the Fund. The Board concluded that potential benefits to be derived by PI included transfer agency fees received by the Fund’s transfer agent (which is affiliated with PI), as well as benefits to its reputation or other intangible benefits resulting from PI’s association with the Fund. The Board concluded that the potential benefits to be derived by PGIM Fixed Income and PGIML included the ability to use soft dollar credits, as well as the potential benefits consistent with those generally resulting from an increase in assets under management, specifically, potential access to additional research resources and benefits to their reputations. The Board concluded that the benefits derived by PI, PGIM Fixed Income, and PGIML were consistent with the types of benefits generally derived by investment managers and subadvisers to mutual funds.
Performance of the Fund / Fees and Expenses
The Board considered certain additional specific factors and made related conclusions relating to the historical performance of the Fund for the one- and three-year periods ended December 31, 2015. The Board considered that the Fund commenced operations on March 30, 2011 and that longer-term performance was not yet available.
The Board also considered the Fund’s actual management fee, as well as the Fund’s net total expense ratio, for the fiscal year ended October 31, 2015. The Board considered the management fee for the Fund as compared to the management fee charged by PI to other funds and the fee charged by other advisers to comparable mutual funds in a Peer Group. The actual management fee represents the fee rate actually paid by Fund shareholders and includes any fee waivers or reimbursements. The net total expense ratio for the Fund represents the actual expense ratio incurred by Fund shareholders.
The mutual funds included in the Peer Universe (the Lipper Alternative Credit Focused Funds Performance Universe) and the Peer Group were objectively determined by
| | |
| Visit our website at prudentialfunds.com | | |
Broadridge, an independent provider of mutual fund data. The comparisons placed the Fund in various quartiles, with the first quartile being the best 25% of the mutual funds (for performance, the best performing mutual funds and, for expenses, the lowest cost mutual funds).
The section below summarizes key factors considered by the Board and the Board’s conclusions regarding the Fund’s performance, fees and overall expenses. The table sets forth gross performance comparisons (which do not reflect the impact on performance of fund expenses, or any subsidies, expense caps or waivers that may be applicable) with the Peer Universe, actual management fees with the Peer Group (which reflect the impact of any subsidies or fee waivers), and net total expenses with the Peer Group, each of which were key factors considered by the Board.
| | | | | | | | |
| Performance | | 1 Year | | 3 Years | | 5 Years | | 10 Years |
| | | 2nd Quartile | | 2nd Quartile | | N/A | | N/A |
| Actual Management Fees: 4th Quartile |
| Net Total Expenses: 3rd Quartile |
| | • | | The Board noted that the Fund outperformed its benchmark index over the three-year period, although it underperformed over the one-year period. |
| | • | | The Board noted that the Fund outperformed its benchmark index in the first quarter of 2016, and that it continued to rank in the second quartile of its Peer Universe. |
| | • | | The Board also noted information provided by PI indicating that with the fee waiver the Fund’s net total expense ratio was within five basis points of the median of all funds in the Peer Group. |
| | • | | The Board and PI agreed to continue the existing expense cap of 0.90% (exclusive of 12b-1 fees and certain other fees) through February 28, 2017. |
| | • | | The Board concluded that, in light of the above, it would be in the best interests of the Fund and its shareholders to renew the agreements. |
| | • | | The Board concluded that the management fees (including subadvisory fees) and total expenses were reasonable in light of the services provided. |
* * *
After full consideration of these factors, the Board concluded that the approval of the agreements was in the best interests of the Fund and its shareholders.
| | |
| Prudential Absolute Return Bond Fund |
| | | | |
| ∎ MAIL | | ∎ TELEPHONE | | ∎ WEBSITE |
655 Broad Street
Newark, NJ 07102 | | (800) 225-1852 | | www.prudentialfunds.com |
|
| PROXY VOTING |
| The Board of Trustees of the Fund has delegated to the Fund’s investment subadviser the responsibility for voting any proxies and maintaining proxy recordkeeping with respect to the Fund. A description of these proxy voting policies and procedures is available without charge, upon request, by calling (800) 225-1852 or by visiting the Securities and Exchange Commission’s website at www.sec.gov. Information regarding how the Fund voted proxies relating to portfolio securities during the most recent 12-month period ended June 30 is available on the Fund’s website and on the Securities and Exchange Commission’s website. |
|
| TRUSTEES |
| Ellen S. Alberding • Kevin J. Bannon • Scott E. Benjamin • Linda W. Bynoe • Keith F. Hartstein • Michael S. Hyland • Stuart S. Parker • Richard A. Redeker • Stephen G. Stoneburn • Grace C. Torres |
|
| OFFICERS |
| Stuart S. Parker, President • Scott E. Benjamin, Vice President • M. Sadiq Peshimam, Treasurer and Principal Financial and Accounting Officer • Raymond A. O’Hara, Chief Legal Officer • Deborah A. Docs, Secretary • Chad A. Earnst, Chief Compliance Officer • Theresa C. Thompson, Deputy Chief Compliance Officer • Charles H. Smith, Anti-Money Laundering Compliance Officer • Jonathan D. Shain, Assistant Secretary • Claudia DiGiacomo, Assistant Secretary • Andrew R. French, Assistant Secretary • Peter Parrella, Assistant Treasurer • Lana Lomuti, Assistant Treasurer • Linda McMullin, Assistant Treasurer • Kelly A. Coyne, Assistant Treasurer |
| | | | |
| MANAGER | | Prudential Investments LLC | | 655 Broad Street
Newark, NJ 07102 |
|
| INVESTMENT SUBADVISER | | PGIM Fixed Income | | 655 Broad Street
Newark, NJ 07102 |
|
| DISTRIBUTOR | | Prudential Investment
Management Services LLC | | 655 Broad Street
Newark, NJ 07102 |
|
| CUSTODIAN | | The Bank of New York Mellon | | One Wall Street
New York, NY 10286 |
|
| TRANSFER AGENT | | Prudential Mutual Fund
Services LLC | | PO Box 9658
Providence, RI 02940 |
|
INDEPENDENT REGISTERED
PUBLIC ACCOUNTING FIRM | | KPMG LLP | | 345 Park Avenue
New York, NY 10154 |
|
| FUND COUNSEL | | Willkie Farr & Gallagher LLP | | 787 Seventh Avenue
New York, NY 10019 |
|
|
| An investor should consider the investment objectives, risks, charges, and expenses of the Fund carefully before investing. The prospectus and summary prospectus contain this and other information about the Fund. An investor may obtain a prospectus and summary prospectus by visiting our website at www.prudentialfunds.com or by calling (800) 225-1852. The prospectus and summary prospectus should be read carefully before investing. |
|
| E-DELIVERY |
| To receive your mutual fund documents online, go to www.prudentialfunds.com/edelivery and enroll. Instead of receiving printed documents by mail, you will receive notification via email when new materials are available. You can cancel your enrollment or change your email address at any time by visiting the website address above. |
|
| SHAREHOLDER COMMUNICATIONS WITH TRUSTEES |
| Shareholders can communicate directly with the Board of Trustees by writing to the Chair of the Board, Prudential Absolute Return Bond Fund, Prudential Investments, Attn: Board of Trustees, 655 Broad Street, Newark, NJ 07102. Shareholders can communicate directly with an individual Trustee by writing to the same address. Communications are not screened before being delivered to the addressee. |
|
| AVAILABILITY OF PORTFOLIO SCHEDULE |
| The Fund files its complete schedule of portfolio holdings with the Securities and Exchange Commission for the first and third quarters of each fiscal year on Form N-Q. The Fund’s Forms N-Q are available on the Commission’s website at www.sec.gov. The Fund’s Forms N-Q may also be reviewed and copied at the Commission’s Public Reference Room in Washington, D.C. Information on the operation and location of the Public Reference Room may be obtained by calling (202) 551-8090. The Fund’s schedule of portfolio holdings is also available on the Fund’s website as of the end of each month no sooner than 15 days after the end of the month. |
|
| The Fund’s Statement of Additional Information contains additional information about the Fund’s Trustees and is available without charge, upon request, by calling (800) 225-1852. |
Mutual Funds:
| | | | |
ARE NOT INSURED BY THE FDIC OR ANY
FEDERAL GOVERNMENT AGENCY | | MAY LOSE VALUE | | ARE NOT A DEPOSIT OF OR GUARANTEED
BY ANY BANK OR ANY BANK AFFILIATE |
PRUDENTIAL ABSOLUTE RETURN BOND FUND
| | | | | | | | |
| SHARE CLASS | | A | | C | | Q | | Z |
| NASDAQ | | PADAX | | PADCX | | PADQX | | PADZX |
| CUSIP | | 74441J852 | | 74441J845 | | 74441J837 | | 74441J829 |
MF213E 0300095-00001-00
PRUDENTIAL INVESTMENTS, A PGIM BUSINESS | MUTUAL FUNDS
Prudential QMA Large-Cap Core Equity Fund
| | |
| ANNUAL REPORT | | OCTOBER 31, 2016 |

| | |
To enroll in e-delivery, go to prudentialfunds.com/edelivery | |  |
|
| Objective: Long-term after-tax growth of capital |
Highlights
PRUDENTIAL QMA LARGE-CAP CORE EQUITY FUND
| • | | The Fund is comprised of a diversified portfolio of stocks that QMA identifies as attractive using a proprietary quantitative model. The model evaluates stocks with regard to quality, earnings expectations, and relative value. QMA’s emphasis on these metrics varies based on the growth rate of the company. |
| • | | Favoring high-quality, inexpensive stocks with a positive earnings expectation was particularly valuable in the health care sector over the period, where stock selection added value relative to the Index. Positions held in the energy sector, relative to the benchmark, were more challenging. (For a complete list of holdings, refer to the Portfolio of Investments section of this report.) |
| • | | As of the period’s close, the Fund had sector exposure similar to that of the Index and modest active weights in about 200 stocks across the large-cap spectrum. Therefore, sector positioning or holdings in individual companies do not have big effects on relative performance. Instead, aggregate exposure to earnings growth, valuation, and quality characteristics drove excess returns. |
This report is not authorized for distribution to prospective investors unless preceded or accompanied by a current prospectus.
The views expressed in this report and information about the Fund’s portfolio holdings are for the period covered by this report and are subject to change thereafter.
Mutual funds are distributed by Prudential Investment Management Services LLC, a Prudential Financial company and member SIPC. QMA is the primary business name of Quantitative Management Associates LLC, a wholly owned subsidiary of PGIM, Inc. (PGIM), a Prudential Financial company. © 2016 Prudential Financial, Inc. and its related entities. The Prudential logo and the Rock symbol are service marks of Prudential Financial, Inc. and its related entities, registered in many jurisdictions worldwide.
| | |
| 2 | | Visit our website at prudentialfunds.com |
Letter from the President

Dear Shareholder:
We hope you find the annual report for the Prudential QMA Large-Cap Core Equity Fund informative and useful. The report covers performance for the 12-month period that ended October 31, 2016.
During the reporting period, the US economy experienced modest growth. Labor markets were healthy, and consumer confidence rose. The housing market brightened somewhat, as momentum continued for the new home market. The Federal Reserve kept interest rates unchanged at its September meeting, but pointed to the strong possibility of a rate hike in December. Internationally, concerns over Brexit—the term used to represent Britain’s decision to leave the European Union—remained in the spotlight.
Equity markets in the US were firmly in positive territory at the end of the reporting period, as US stocks posted strong gains. European stocks struggled earlier, but found some traction in the third quarter. Asian markets also advanced, and emerging markets rose sharply.
US fixed income markets experienced overall gains. High yield bonds posted very strong results. Corporate bonds and Treasuries also performed well. Accommodative monetary policy by central banks helped lift global bond markets.
Given the uncertainty in today’s investment environment, we believe that active professional portfolio management offers a potential advantage. Active managers often have the knowledge and flexibility to find the best investment opportunities in the most challenging markets.
Even so, it’s best if investment decisions are based on your long-term goals rather than on short-term market and economic developments. We also encourage you to work with an experienced financial advisor who can help you set goals, determine your tolerance for risk, build a diversified plan that’s right for you, and make adjustments when necessary.
By having Prudential Investments help you address your goals, you gain the advantage of asset managers that also manage money for many major corporations and pension funds around the world. That means you benefit from the same expertise, innovation, and attention to risk demanded by today’s most sophisticated investors.
Thank you for choosing our family of funds.
Sincerely,

Stuart S. Parker, President
Prudential QMA Large-Cap Core Equity Fund
December 15, 2016
| | | | |
| Prudential QMA Large-Cap Core Equity Fund | | | 3 | |
Your Fund’s Performance (unaudited)
Performance data quoted represent past performance. Past performance does not guarantee future results. The investment return and principal value of an investment will fluctuate, so that an investor’s shares, when redeemed, may be worth more or less than their original cost. Current performance may be lower or higher than the past performance data quoted. An investor may obtain performance data as of the most recent month-end by visiting our website at www.prudentialfunds.com or by calling (800) 225-1852.
| | | | | | | | | | | | |
| Cumulative Total Returns (Without Sales Charges) as of 10/31/16 | |
| | | One Year (%) | | | | Five Years (%) | | | | Ten Years (%) | |
| Class A | | | 3.02 | | | | 85.51 | | | | 74.07 | |
| Class B | | | 2.31 | | | | 78.69 | | | | 61.69 | |
| Class C | | | 2.24 | | | | 78.58 | | | | 61.73 | |
| Class Z | | | 3.35 | | | | 87.80 | | | | 78.61 | |
| S&P 500 Index | | | 4.49 | | | | 88.79 | | | | 91.14 | |
| Lipper Large-Cap Core Funds Average | | | 2.53 | | | | 76.50 | | | | 78.39 | |
| | | | | | | | | | | | |
| Average Annual Total Returns (With Sales Charges) as of 9/30/16 | |
| | | One Year (%) | | | | Five Years (%) | | | | Ten Years (%) | |
| Class A | | | 7.10 | | | | 14.84 | | | | 5.67 | |
| Class B | | | 7.55 | | | | 15.16 | | | | 5.50 | |
| Class C | | | 11.53 | | | | 15.28 | | | | 5.51 | |
| Class Z | | | 13.63 | | | | 16.44 | | | | 6.55 | |
| S&P 500 Index | | | 15.41 | | | | 16.36 | | | | 7.23 | |
| Lipper Large-Cap Core Funds Average | | | 12.48 | | | | 14.76 | | | | 6.37 | |
| | | | | | | | | | | | | |
| | | | | | | | | | |
| Average Annual Total Returns (With Sales Charges) as of 10/31/16 | |
| | One Year (%) | | | Five Years (%) | | | | Ten Years (%) | |
| Class A | | –2.65 | | | 11.88 | | | | 5.10 | |
| Class B | | –2.53 | | | 12.18 | | | | 4.92 | |
| Class C | | 1.27 | | | 12.30 | | | | 4.93 | |
| Class Z | | 3.35 | | | 13.43 | | | | 5.97 | |
| | | | | | | | | | |
| Average Annual Total Returns (Without Sales Charges) as of 10/31/16 | |
| | One Year (%) | | | Five Years (%) | | | | Ten Years (%) | |
| Class A | | 3.02 | | | 13.16 | | | | 5.70 | |
| Class B | | 2.31 | | | 12.31 | | | | 4.92 | |
| Class C | | 2.24 | | | 12.30 | | | | 4.93 | |
| Class Z | | 3.35 | | | 13.43 | | | | 5.97 | |
| | |
| 4 | | Visit our website at prudentialfunds.com |
Growth of a $10,000 Investment
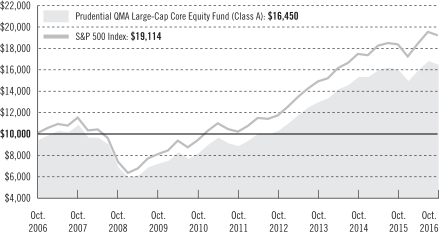
The graph compares a $10,000 investment in the Prudential QMA Large-Cap Core Equity Fund (Class A shares) with a similar investment in the S&P 500 Index by portraying the initial account values at the beginning of the 10-year period for Class A shares (October 31, 2006) and the account values at the end of the current fiscal year (October 31, 2016) as measured on a quarterly basis. For purposes of the graph, and unless otherwise indicated, it has been assumed that (a) the maximum applicable front-end sales charge was deducted from the initial $10,000 investment in Class A shares; (b) all recurring fees (including management fees) were deducted; and (c) all dividends and distributions were reinvested. The line graph provides information for Class A shares only. As indicated in the tables provided earlier, performance for Class B, Class C, and Class Z shares will vary due to the differing charges and expenses applicable to each share class (as indicated in the following paragraphs). Without waiver of fees and/or expense reimbursement, if any, the Fund’s returns would have been lower.
Past performance does not predict future performance. Total returns and the ending account values in the graph include changes in share price and reinvestment of dividends and capital gains distributions in a hypothetical investment for the periods shown. The Fund’s total returns do not reflect the deduction of income taxes on an individual’s investment. Taxes may reduce your actual investment returns on income or gains paid by the Fund or any gains you may realize if you sell your shares.
Source: Prudential Investments LLC and Lipper Inc.
| | | | |
| Prudential QMA Large-Cap Core Equity Fund | | | 5 | |
Your Fund’s Performance (continued)
The returns in the tables do not reflect the deduction of taxes that a shareholder would pay on Fund distributions or following the redemption of Fund shares. The average annual total returns take into account applicable sales charges, which are described for each share class in the table below.
| | | | | | | | |
| | | Class A | | Class B* | | Class C | | Class Z |
| Maximum initial sales charge | | 5.50% of
the public
offering price | | None | | None | | None |
Contingent deferred sales charge (CDSC) (as a
percentage of the lower of original purchase price or net asset value at redemption) | | 1% on sales of $1 million or more made within 12 months of purchase | | 5% (Yr. 1) 4% (Yr. 2) 3% (Yr. 3) 2% (Yr. 4) 1% (Yr. 5) 1% (Yr. 6) 0% (Yr. 7) | | 1% on sales made within 12 months of purchase | | None |
| Annual distribution and service (12b-1) fees (shown as a percentage of average daily net assets) | | .30% (.25% currently) | | 1% | | 1% | | None |
*Class B shares are closed to all purchase activity and no additional Class B shares may be purchased or acquired except by exchange from Class B shares of another Fund or through dividend or capital gains reinvestment.
Benchmark Definitions
S&P 500 Index—The Standard & Poor’s 500 Composite Stock Price Index (S&P 500 Index) is an unmanaged index of over 500 stocks of large US public companies. It gives a broad look at how stock prices in the United States have performed.
Lipper Large-Cap Core Funds Average—The Lipper Large-Cap Core Funds Average (Lipper Average) is based on the average return of all funds in the Lipper Large-Cap Core Funds category for the periods noted. Funds in the Lipper Average invest at least 75% of their equity assets in companies with market capitalizations (on a three-year weighted basis) greater than 300% of the dollar-weighted median market capitalization of the middle 1,000 securities of the S&P SuperComposite 1500 Index. Large-cap core funds have wide latitude in the companies in which they invest. These funds typically have a below-average price-to-earnings ratio, price-to-book ratio, and three-year sales-per-share-growth value compared with the S&P 500 Index.
Investors cannot invest directly in an index or average. The returns for the Index would be lower if they included the effects of sales charges, operating expenses of a mutual fund, or taxes. Returns for the Lipper Average reflect the deduction of operating expenses of a mutual fund, but not sales charges or taxes.
| | |
| 6 | | Visit our website at prudentialfunds.com |
| | | | |
Five Largest Holdings expressed as a
percentage of net assets as of 10/31/16 (%) | |
| Apple, Inc., Technology Hardware, Storage & Peripherals | | | 3.5 | |
| Facebook, Inc. (Class A Stock), Internet Software & Services | | | 2.0 | |
| Johnson & Johnson, Pharmaceuticals | | | 2.0 | |
| JPMorgan Chase & Co., Banks | | | 2.0 | |
| Exxon Mobil Corp., Oil, Gas & Consumable Fuels | | | 2.0 | |
Holdings reflect only long-term investments and are subject to change.
| | | | |
Five Largest Industries expressed as a
percentage of net assets as of 10/31/16 (%) | |
| Information Technology | | | 22.7 | |
| Health Care | | | 15.2 | |
| Financials | | | 12.6 | |
| Consumer Discretionary | | | 10.8 | |
| Consumer Staples | | | 10.3 | |
Industry weightings reflect only long-term investments and are subject to change.
| | | | |
| Prudential QMA Large-Cap Core Equity Fund | | | 7 | |
Strategy and Performance Overview
How did the Fund Perform?
The Prudential QMA Large-Cap Core Equity Fund’s Class A shares gained 3.02% for the 12-month reporting period ended October 31, 2016, lagging the 4.49% gain of the benchmark S&P 500 Index (the Index) and outperforming the 2.53% return of the Lipper Large-Cap Core Funds Average.
What were market conditions?
| • | | When the reporting period began, the equity markets were dominated by anxiety about the potential of a Federal Reserve (Fed) rate hike, the health of the Chinese economy, and China’s unexpected devaluation of its currency, the yuan. Fixed income markets, meanwhile, reflected investor uncertainty about weaker global economic growth, the Fed’s rate-hiking schedule and steep declines in energy and commodity prices. In mid-December, the Fed raised its federal funds rate target by 0.25%. |
| • | | Early in the first quarter of 2016, risk aversion increased amid deteriorating economic data in developed and emerging markets, a further drop in commodity prices, and heightened volatility in global financial markets. By March, investor sentiment had improved, commodity prices had regained some ground, and the number of negative economic surprises had diminished. At its March policy meeting, the Fed suggested it would likely hike rates only twice in 2016. |
| • | | During the second quarter, fears about the global economy receded in the face of considerable stimulus by China’s policymakers, stronger-than-anticipated first-quarter European economic growth, and signs that the Japanese economy was doing somewhat better than expected. Late June, the UK’s surprise vote to leave the European Union, known as “Brexit,” briefly increased market volatility, although the macroeconomic fallout appeared manageable, if not limited. Ongoing stimulus by global central banks drove down interest rates around the world. |
| • | | In the third quarter and through the end of the period, global central bank monetary policy remained accommodative, providing support to the world’s bond markets. The Fed kept its short-term interest rate target unchanged throughout 2016. Credit spreads (differences in yields between corporate bonds and US Treasury securities of comparable maturity) narrowed during the quarter. US economic data released in late October revealed stronger-than-expected growth estimates for the third quarter. Equity markets closed lower and bond markets fluctuated in October due in part to expectations of a Fed rate hike in December 2016 and mixed economic data regarding China’s economy. |
What worked?
| • | | The Fund is comprised of a diversified portfolio of stocks that QMA identifies as attractive using a proprietary quantitative model. The model evaluates stocks with regard to quality, |
| | |
| 8 | | Visit our website at prudentialfunds.com |
| | earnings expectations, and relative value. QMA’s emphasis on these metrics varies based on the growth rate of the company. |
| • | | Favoring high-quality, inexpensive stocks with a positive earnings expectation was particularly valuable in the health care sector over the period, where stock selection added value relative to the Index. |
| • | | Within the consumer discretionary and industrial sectors, stocks of high-quality companies, which the Fund favored, were a key driver of performance, adding to excess return in those sectors. |
What didn’t work?
| • | | The Fund’s stock selection in the energy sector was a drag on performance over the reporting period. In particular, the rise in energy prices in early 2016 favored stocks that QMA deemed as expensive and low quality. |
| • | | Although the Fund’s positions in the technology sector contributed the most to absolute performance, the Fund trailed the Index. This was particularly the case in the semiconductor category, where more expensive stocks tended to outperform, as the Fund generally avoided these equities. |
Did the Fund hold derivatives and how did they affect performance?
| • | | The Fund held futures contracts on the Index. QMA uses these instruments primarily to manage daily cash flows, provide liquidity, and equitize cash, and not as a means of adding to performance. Subsequently, the effect on performance was minimal. |
The percentage points shown in the tables identify each security’s positive or negative contribution to the Fund’s return, which is the sum of all contributions by individual holdings.
| | | | | | |
| Top Contributors (%) | | Top Detractors (%) |
| Facebook, Inc. | | 0.42 | | Bank of America | | –0.28 |
| Tyson Foods, Inc. | | 0.40 | | Express Scripts | | –0.27 |
| Microsoft Inc. | | 0.36 | | Wells Fargo & Co. | | –0.23 |
| Wal-Mart Stores, Inc. | | 0.28 | | Regeneron Pharmaceuticals, Inc. | | –0.23 |
| UnitedHealth Group | | 0.28 | | Celgene Corporation | | –0.20 |
Current outlook
| • | | Although there is much uncertainty, QMA thinks the bull market in the US of the past few years is likely to continue. On balance, its outlook calls for improving equity |
| | | | |
| Prudential QMA Large-Cap Core Equity Fund | | | 9 | |
Strategy and Performance Overview (continued)
| | fundamentals, including resumed earnings growth; normalizing, rising interest rates; and continued modest inflation. However, QMA believes there is limited upside to US equity returns in the coming years as the support of an expansion of price-to-earnings ratios and share buybacks subsides, and the prospect of US economic growth remains modest. |
| • | | Faced with increased uncertainty, QMA believes the QMA Large-Cap Core Equity Fund is well positioned to navigate such an environment. The Fund maintains a balance of growth and value stocks. This diversified exposure helps the effectiveness of stock selection in different market environments. |
| • | | QMA also focuses on managing unintended exposures in the portfolio, which can decrease macro exposures and mitigate the impact of exogenous shocks. Overall, uncertainty can produce attractive opportunities for active investors because when uncertainty increases, prices are more likely to become dislocated from fundamentals. The Fund is well placed, in QMA’s view, to exploit such opportunities while simultaneously managing associated increased risks. |
| | |
| 10 | | Visit our website at prudentialfunds.com |
Fees and Expenses (unaudited)
As a shareholder of the Fund, you incur two types of costs: (1) transaction costs, including sales charges (loads) on purchase payments and redemptions, as applicable, and (2) ongoing costs, including management fees, distribution, and/or service (12b-1) fees, and other Fund expenses, as applicable. This example is intended to help you understand your ongoing costs (in dollars) of investing in the Fund and to compare these costs with the ongoing costs of investing in other mutual funds.
The example is based on an investment of $1,000 invested on May 1, 2016, the beginning of the period, and held through the six-month period ended October 31, 2016. The example is for illustrative purposes only; you should consult the Prospectus for information on initial and subsequent minimum investment requirements.
Actual Expenses
The first line for each share class in the table on the following page provides information about actual account values and actual expenses. You may use the information on this line, together with the amount you invested, to estimate the expenses that you paid over the period. Simply divide your account value by $1,000 (for example, an $8,600 account value ÷ $1,000 = 8.6), then multiply the result by the number on the first line under the heading “Expenses Paid During the Six-Month Period” to estimate the expenses you paid on your account during this period.
Hypothetical Example for Comparison Purposes
The second line for each share class in the table on the following page provides information about hypothetical account values and hypothetical expenses based on the Fund’s actual expense ratio and an assumed rate of return of 5% per year before expenses, which is not the Fund’s actual return. The hypothetical account values and expenses may not be used to estimate the actual ending account balance or expenses you paid for the period. You may use this information to compare the ongoing costs of investing in the Fund and other funds. To do so, compare this 5% hypothetical example with the 5% hypothetical examples that appear in the shareholder reports of the other funds.
The Fund’s transfer agent may charge additional fees to holders of certain accounts that are not included in the expenses shown in the table on the following page. These fees apply to individual retirement accounts (IRAs) and Section 403(b) accounts. As of the close of the six-month period covered by the table, IRA fees included an annual maintenance fee of $15 per account (subject to a maximum annual maintenance fee of $25 for all accounts held by the same shareholder). Section 403(b) accounts are charged an annual $25 fiduciary maintenance fee. Some of the fees may vary in amount, or may be waived, based on your total account balance or the number of Prudential Investments funds, including the Fund, that you own. You should consider the additional fees that were charged to your Fund account over the six-month period when you estimate the total ongoing expenses paid over the period and the impact of these fees on your ending account value, as these
| | | | |
| Prudential QMA Large-Cap Core Equity Fund | | | 11 | |
Fees and Expenses (continued)
additional expenses are not reflected in the information provided in the expense table. Additional fees have the effect of reducing investment returns.
Please note that the expenses shown in the table are meant to highlight your ongoing costs only and do not reflect any transactional costs such as sales charges (loads). Therefore, the second line for each share class in the table is useful in comparing ongoing costs only and will not help you determine the relative total costs of owning different funds. In addition, if these transactional costs were included, your costs would have been higher.
| | | | | | | | | | | | | | | | | | |
Prudential QMA
Large-Cap Core
Equity Fund | | Beginning Account
Value
May 1, 2016 | | | Ending Account
Value
October 31, 2016 | | | Annualized
Expense Ratio
Based on the
Six-Month Period | | | Expenses Paid
During the
Six-Month Period* | |
| Class A | | Actual | | $ | 1,000.00 | | | $ | 1,028.60 | | | | 1.20 | % | | $ | 6.12 | |
| | Hypothetical | | $ | 1,000.00 | | | $ | 1,019.10 | | | | 1.20 | % | | $ | 6.09 | |
| Class B | | Actual | | $ | 1,000.00 | | | $ | 1,025.10 | | | | 1.95 | % | | $ | 9.93 | |
| | Hypothetical | | $ | 1,000.00 | | | $ | 1,015.33 | | | | 1.95 | % | | $ | 9.88 | |
| Class C | | Actual | | $ | 1,000.00 | | | $ | 1,024.30 | | | | 1.95 | % | | $ | 9.92 | |
| | Hypothetical | | $ | 1,000.00 | | | $ | 1,015.33 | | | | 1.95 | % | | $ | 9.88 | |
| Class Z | | Actual | | $ | 1,000.00 | | | $ | 1,029.90 | | | | 0.95 | % | | $ | 4.85 | |
| | | Hypothetical | | $ | 1,000.00 | | | $ | 1,020.36 | | | | 0.95 | % | | $ | 4.82 | |
*Fund expenses (net of fee waivers or subsidies, if any) for each share class are equal to the annualized expense ratio for each share class (provided in the table), multiplied by the average account value over the period, multiplied by the 184 days in the six-month period ended October 31, 2016, and divided by the 366 days in the Fund’s fiscal year ended October 31, 2016 (to reflect the six-month period). Expenses presented in the table include the expenses of any underlying portfolios in which the Fund may invest.
The Fund’s annual expense ratios for the 12-month period ended October 31, 2016, are as follows:
| | | | |
| Class | | Gross Operating Expenses (%) | | Net Operating Expenses (%) |
| A | | 1.22 | | 1.17 |
| B | | 1.92 | | 1.92 |
| C | | 1.92 | | 1.92 |
| Z | | 0.92 | | 0.92 |
Net operating expenses shown above reflect any fee waivers and/or expense reimbursements. Additional information on Fund expenses and any fee waivers and/or expense reimbursements can be found in the “Financial Highlights” tables in this report and in the Notes to the Financial Statements in this report.
| | |
| 12 | | Visit our website at prudentialfunds.com |
Portfolio of Investments
as of October 31, 2016
| | | | | | | | |
| Description | | Shares | | | Value (Note 1) | |
LONG-TERM INVESTMENTS 98.6% | | | | | | | | |
| | |
COMMON STOCKS | | | | | | | | |
| | |
CONSUMER DISCRETIONARY 10.8% | | | | | | | | |
| | |
Auto Components 0.5% | | | | | | | | |
Cooper-Standard Holding, Inc.* | | | 2,700 | | | $ | 246,429 | |
Dana, Inc. | | | 22,200 | | | | 343,656 | |
Tenneco, Inc.* | | | 6,000 | | | | 330,420 | |
| | | | | | | | |
| | | | | | | 920,505 | |
| | |
Automobiles 0.6% | | | | | | | | |
Ford Motor Co. | | | 60,200 | | | | 706,748 | |
General Motors Co. | | | 18,500 | | | | 584,600 | |
| | | | | | | | |
| | | | | | | 1,291,348 | |
| | |
Hotels, Restaurants & Leisure 1.9% | | | | | | | | |
Biglari Holdings, Inc.* | | | 200 | | | | 87,636 | |
Jack in the Box, Inc. | | | 3,300 | | | | 309,309 | |
McDonald’s Corp. | | | 21,900 | | | | 2,465,283 | |
Yum! Brands, Inc. | | | 11,900 | | | | 1,026,732 | |
| | | | | | | | |
| | | | | | | 3,888,960 | |
| | |
Household Durables 0.8% | | | | | | | | |
D.R. Horton, Inc. | | | 17,000 | | | | 490,110 | |
Whirlpool Corp. | | | 6,900 | | | | 1,033,758 | |
| | | | | | | | |
| | | | | | | 1,523,868 | |
| | |
Internet & Direct Marketing Retail 1.2% | | | | | | | | |
Amazon.com, Inc.* | | | 2,600 | | | | 2,053,532 | |
FTD Cos., Inc.* | | | 10,800 | | | | 217,296 | |
Liberty TripAdvisor Holdings, Inc. (Class A Stock)* | | | 3,000 | | | | 66,600 | |
| | | | | | | | |
| | | | | | | 2,337,428 | |
| | |
Leisure Products 0.2% | | | | | | | | |
Smith & Wesson Holding Corp.*(a) | | | 12,800 | | | | 338,304 | |
Vista Outdoor, Inc.* | | | 4,200 | | | | 162,414 | |
| | | | | | | | |
| | | | | | | 500,718 | |
| | |
Media 1.4% | | | | | | | | |
Comcast Corp. (Class A Stock) | | | 10,000 | | | | 618,200 | |
Discovery Communications, Inc. (Class C Stock)* | | | 8,700 | | | | 218,457 | |
New Media Investment Group, Inc. | | | 9,300 | | | | 133,920 | |
News Corp. (Class A Stock) | | | 4,100 | | | | 49,692 | |
See Notes to Financial Statements.
| | | | |
| Prudential QMA Large-Cap Core Equity Fund | | | 13 | |
Portfolio of Investments (continued)
as of October 31, 2016
| | | | | | | | |
| Description | | Shares | | | Value (Note 1) | |
CONSUMER DISCRETIONARY (Continued) | | | | | | | | |
| | |
Media (cont’d.) | | | | | | | | |
TEGNA, Inc. | | | 24,600 | | | $ | 482,652 | |
Time Warner, Inc. | | | 5,100 | | | | 453,849 | |
Twenty-First Century Fox, Inc. (Class A Stock) | | | 12,500 | | | | 328,375 | |
Viacom, Inc. (Class B Stock) | | | 14,800 | | | | 555,888 | |
Walt Disney Co. (The) | | | 800 | | | | 74,152 | |
| | | | | | | | |
| | | | | | | 2,915,185 | |
| | |
Multiline Retail 0.6% | | | | | | | | |
Dillard’s, Inc. (Class A Stock) | | | 2,400 | | | | 147,120 | |
Macy’s, Inc. | | | 31,500 | | | | 1,149,435 | |
| | | | | | | | |
| | | | | | | 1,296,555 | |
| | |
Specialty Retail 3.3% | | | | | | | | |
AutoNation, Inc.* | | | 4,600 | | | | 201,802 | |
Francesca’s Holdings Corp.* | | | 5,700 | | | | 91,599 | |
Home Depot, Inc. (The) | | | 18,300 | | | | 2,232,783 | |
L Brands, Inc. | | | 7,100 | | | | 512,549 | |
Murphy USA, Inc.* | | | 2,000 | | | | 137,560 | |
Ross Stores, Inc. | | | 26,800 | | | | 1,676,072 | |
Tilly’s, Inc. (Class A Stock)* | | | 8,300 | | | | 77,024 | |
TJX Cos., Inc. (The) | | | 22,500 | | | | 1,659,375 | |
| | | | | | | | |
| | | | | | | 6,588,764 | |
| | |
Textiles, Apparel & Luxury Goods 0.3% | | | | | | | | |
Culp, Inc. | | | 3,200 | | | | 89,600 | |
NIKE, Inc. (Class B Stock) | | | 10,200 | | | | 511,836 | |
| | | | | | | | |
| | | | | | | 601,436 | |
| | |
CONSUMER STAPLES 10.3% | | | | | | | | |
| | |
Beverages 2.0% | | | | | | | | |
Coca-Cola Co. (The) | | | 1,500 | | | | 63,600 | |
Dr. Pepper Snapple Group, Inc. | | | 13,500 | | | | 1,185,165 | |
PepsiCo, Inc. | | | 25,894 | | | | 2,775,837 | |
| | | | | | | | |
| | | | | | | 4,024,602 | |
| | |
Food & Staples Retailing 2.8% | | | | | | | | |
CVS Health Corp. | | | 22,400 | | | | 1,883,840 | |
Kroger Co. (The) | | | 44,200 | | | | 1,369,316 | |
Wal-Mart Stores, Inc. | | | 35,370 | | | | 2,476,607 | |
| | | | | | | | |
| | | | | | | 5,729,763 | |
See Notes to Financial Statements.
| | | | | | | | |
| Description | | Shares | | | Value (Note 1) | |
CONSUMER STAPLES (Continued) | | | | | | | | |
| | |
Food Products 2.3% | | | | | | | | |
Archer-Daniels-Midland Co. | | | 35,300 | | | $ | 1,538,021 | |
ConAgra Foods, Inc. | | | 28,400 | | | | 1,368,312 | |
Fresh Del Monte Produce, Inc. | | | 400 | | | | 24,140 | |
Tyson Foods, Inc. (Class A Stock) | | | 23,400 | | | | 1,657,890 | |
| | | | | | | | |
| | | | | | | 4,588,363 | |
| | |
Household Products 1.7% | | | | | | | | |
Colgate-Palmolive Co. | | | 24,200 | | | | 1,726,912 | |
Kimberly-Clark Corp. | | | 10,500 | | | | 1,201,305 | |
Procter & Gamble Co. (The) | | | 5,964 | | | | 517,675 | |
| | | | | | | | |
| | | | | | | 3,445,892 | |
| | |
Personal Products 0.1% | | | | | | | | |
Avon Products, Inc. | | | 23,300 | | | | 152,615 | |
| | |
Tobacco 1.4% | | | | | | | | |
Altria Group, Inc. | | | 42,400 | | | | 2,803,488 | |
| | |
ENERGY 6.2% | | | | | | | | |
| | |
Oil, Gas & Consumable Fuels | | | | | | | | |
Chevron Corp. | | | 6,284 | | | | 658,249 | |
ConocoPhillips | | | 35,700 | | | | 1,551,165 | |
Energen Corp. | | | 2,400 | | | | 120,312 | |
EOG Resources, Inc. | | | 5,300 | | | | 479,226 | |
Exxon Mobil Corp. | | | 47,474 | | | | 3,955,534 | |
Kinder Morgan, Inc. | | | 64,700 | | | | 1,321,821 | |
Marathon Petroleum Corp. | | | 28,300 | | | | 1,233,597 | |
Phillips 66 | | | 18,950 | | | | 1,537,792 | |
Rice Energy, Inc.* | | | 37,700 | | | | 832,793 | |
SM Energy Co. | | | 3,500 | | | | 117,705 | |
Tesoro Corp. | | | 9,300 | | | | 790,221 | |
| | | | | | | | |
| | | | 12,598,415 | |
| | |
FINANCIALS 12.6% | | | | | | | | |
| | |
Banks 6.8% | | | | | | | | |
Bank of America Corp. | | | 169,468 | | | | 2,796,222 | |
Citigroup, Inc. | | | 44,900 | | | | 2,206,835 | |
JPMorgan Chase & Co. | | | 57,400 | | | | 3,975,524 | |
PNC Financial Services Group, Inc. (The) | | | 12,100 | | | | 1,156,760 | |
Regions Financial Corp. | | | 19,300 | | | | 206,703 | |
U.S. Bancorp | | | 7,991 | | | | 357,677 | |
See Notes to Financial Statements.
| | | | |
| Prudential QMA Large-Cap Core Equity Fund | | | 15 | |
Portfolio of Investments (continued)
as of October 31, 2016
| | | | | | | | |
| Description | | Shares | | | Value (Note 1) | |
FINANCIALS (Continued) | | | | | | | | |
| | |
Banks (cont’d.) | | | | | | | | |
Wells Fargo & Co. | | | 64,464 | | | $ | 2,965,989 | |
| | | | | | | | |
| | | | | | | 13,665,710 | |
| | |
Capital Markets 2.4% | | | | | | | | |
Ameriprise Financial, Inc. | | | 7,700 | | | | 680,603 | |
BlackRock, Inc. | | | 4,500 | | | | 1,535,580 | |
Goldman Sachs Group, Inc. (The) | | | 10,600 | | | | 1,889,344 | |
Raymond James Financial, Inc. | | | 8,500 | | | | 511,020 | |
State Street Corp. | | | 4,100 | | | | 287,861 | |
| | | | | | | | |
| | | | | | | 4,904,408 | |
| | |
Consumer Finance 1.1% | | | | | | | | |
Discover Financial Services | | | 22,700 | | | | 1,278,691 | |
Navient Corp. | | | 32,400 | | | | 414,072 | |
Nelnet, Inc. (Class A Stock) | | | 12,000 | | | | 470,160 | |
| | | | | | | | |
| | | | | | | 2,162,923 | |
| | |
Diversified Financial Services 0.5% | | | | | | | | |
Berkshire Hathaway, Inc. (Class B Stock)* | | | 6,600 | | | | 952,380 | |
| | |
Insurance 1.6% | | | | | | | | |
Aflac, Inc. | | | 18,300 | | | | 1,260,321 | |
Allstate Corp. (The) | | | 19,200 | | | | 1,303,680 | |
Unum Group | | | 1,500 | | | | 53,100 | |
XL Group Ltd. (Ireland) | | | 18,900 | | | | 655,830 | |
| | | | | | | | |
| | | | | | | 3,272,931 | |
| | |
Mortgage Real Estate Investment Trusts (REITs) 0.2% | | | | | | | | |
Ares Commercial Real Estate Corp. | | | 3,700 | | | | 48,544 | |
Chimera Investment Corp. | | | 17,500 | | | | 274,225 | |
Invesco Mortgage Capital, Inc. | | | 13,000 | | | | 194,090 | |
| | | | | | | | |
| | | | | | | 516,859 | |
| | |
HEALTH CARE 15.2% | | | | | | | | |
| | |
Biotechnology 3.2% | | | | | | | | |
AbbVie, Inc. | | | 13,900 | | | | 775,342 | |
Amgen, Inc. | | | 14,200 | | | | 2,004,472 | |
Biogen, Inc.* | | | 5,100 | | | | 1,428,918 | |
Celgene Corp.* | | | 17,400 | | | | 1,777,932 | |
Gilead Sciences, Inc. | | | 7,500 | | | | 552,225 | |
| | | | | | | | |
| | | | | | | 6,538,889 | |
See Notes to Financial Statements.
| | | | | | | | |
| Description | | Shares | | | Value (Note 1) | |
HEALTH CARE (Continued) | | | | | | | | |
| | |
Health Care Equipment & Supplies 4.1% | | | | | | | | |
Abbott Laboratories | | | 4,700 | | | $ | 184,428 | |
Baxter International, Inc. | | | 27,000 | | | | 1,284,930 | |
Becton, Dickinson & Co. | | | 500 | | | | 83,955 | |
Boston Scientific Corp.* | | | 60,600 | | | | 1,333,200 | |
C.R. Bard, Inc. | | | 3,700 | | | | 801,716 | |
Danaher Corp. | | | 19,300 | | | | 1,516,015 | |
Hill-Rom Holdings, Inc. | | | 4,400 | | | | 243,804 | |
Hologic, Inc.* | | | 22,700 | | | | 817,427 | |
Medtronic PLC | | | 21,400 | | | | 1,755,228 | |
Stryker Corp. | | | 2,100 | | | | 242,235 | |
| | | | | | | | |
| | | | | | | 8,262,938 | |
| | |
Health Care Providers & Services 3.5% | | | | | | | | |
Aetna, Inc. | | | 14,300 | | | | 1,535,105 | |
Anthem, Inc. | | | 9,900 | | | | 1,206,414 | |
Express Scripts Holding Co.* | | | 21,500 | | | | 1,449,100 | |
UnitedHealth Group, Inc. | | | 19,700 | | | | 2,784,201 | |
| | | | | | | | |
| | | | | | | 6,974,820 | |
| | |
Health Care Technology | | | | | | | | |
Cerner Corp.* | | | 1,200 | | | | 70,296 | |
| | |
Life Sciences Tools & Services 0.6% | | | | | | | | |
Thermo Fisher Scientific, Inc. | | | 7,400 | | | | 1,088,022 | |
VWR Corp.* | | | 3,600 | | | | 99,036 | |
| | | | | | | | |
| | | | | | | 1,187,058 | |
| | |
Pharmaceuticals 3.8% | | | | | | | | |
Allergan PLC* | | | 300 | | | | 62,682 | |
Johnson & Johnson | | | 34,499 | | | | 4,001,539 | |
Merck & Co., Inc. | | | 12,300 | | | | 722,256 | |
Pfizer, Inc. | | | 93,634 | | | | 2,969,134 | |
| | | | | | | | |
| | | | | | | 7,755,611 | |
| | |
INDUSTRIALS 10.3% | | | | | | | | |
| | |
Aerospace & Defense 3.3% | | | | | | | | |
BWX Technologies, Inc. | | | 8,700 | | | | 341,214 | |
General Dynamics Corp. | | | 11,500 | | | | 1,733,510 | |
Huntington Ingalls Industries, Inc. | | | 5,100 | | | | 822,936 | |
Northrop Grumman Corp. | | | 8,500 | | | | 1,946,500 | |
Orbital ATK, Inc. | | | 2,700 | | | | 200,772 | |
See Notes to Financial Statements.
| | | | |
| Prudential QMA Large-Cap Core Equity Fund | | | 17 | |
Portfolio of Investments (continued)
as of October 31, 2016
| | | | | | | | |
| Description | | Shares | | | Value (Note 1) | |
INDUSTRIALS (Continued) | | | | | | | | |
| | |
Aerospace & Defense (cont’d.) | | | | | | | | |
Raytheon Co. | | | 5,200 | | | $ | 710,372 | |
Spirit AeroSystems Holdings, Inc. (Class A Stock)* | | | 8,600 | | | | 433,096 | |
Textron, Inc. | | | 10,300 | | | | 412,824 | |
| | | | | | | | |
| | | | | | | 6,601,224 | |
| | |
Air Freight & Logistics 0.7% | | | | | | | | |
FedEx Corp. | | | 8,600 | | | | 1,499,152 | |
| | |
Airlines 1.0% | | | | | | | | |
Southwest Airlines Co. | | | 37,400 | | | | 1,497,870 | |
United Continental Holdings, Inc.* | | | 8,700 | | | | 489,201 | |
| | | | | | | | |
| | | | | | | 1,987,071 | |
| | |
Building Products 0.1% | | | | | | | | |
Allegion PLC | | | 2,400 | | | | 153,216 | |
Universal Forest Products, Inc. | | | 1,900 | | | | 163,381 | |
| | | | | | | | |
| | | | | | | 316,597 | |
| | |
Commercial Services & Supplies 0.1% | | | | | | | | |
Steelcase, Inc. (Class A Stock) | | | 10,200 | | | | 136,170 | |
| | |
Construction & Engineering 0.3% | | | | | | | | |
Argan, Inc. | | | 2,600 | | | | 147,810 | |
EMCOR Group, Inc. | | | 4,100 | | | | 247,886 | |
KBR, Inc. | | | 12,600 | | | | 186,606 | |
| | | | | | | | |
| | | | 582,302 | |
| | |
Electrical Equipment 0.4% | | | | | | | | |
Eaton Corp. PLC | | | 9,700 | | | | 618,569 | |
Emerson Electric Co. | | | 2,500 | | | | 126,700 | |
| | | | | | | | |
| | | | | | | 745,269 | |
| | |
Industrial Conglomerates 2.4% | | | | | | | | |
3M Co. | | | 7,500 | | | | 1,239,750 | |
Carlisle Cos., Inc. | | | 4,600 | | | | 482,310 | |
General Electric Co. | | | 39,279 | | | | 1,143,019 | |
Honeywell International, Inc. | | | 17,300 | | | | 1,897,464 | |
| | | | | | | | |
| | | | | | | 4,762,543 | |
| | |
Machinery 1.1% | | | | | | | | |
Cummins, Inc. | | | 4,800 | | | | 613,536 | |
Ingersoll-Rand PLC | | | 2,200 | | | | 148,038 | |
See Notes to Financial Statements.
| | | | | | | | |
| Description | | Shares | | | Value (Note 1) | |
INDUSTRIALS (Continued) | | | | | | | | |
| | |
Machinery (cont’d.) | | | | | | | | |
Kadant, Inc. | | | 2,600 | | | $ | 134,290 | |
Lydall, Inc.* | | | 3,000 | | | | 140,250 | |
Stanley Black & Decker, Inc. | | | 10,000 | | | | 1,138,400 | |
| | | | | | | | |
| | | | | | | 2,174,514 | |
| | |
Professional Services | | | | | | | | |
Insperity, Inc. | | | 1,100 | | | | 82,720 | |
| | |
Road & Rail 0.9% | | | | | | | | |
AMERCO | | | 700 | | | | 225,673 | |
Union Pacific Corp. | | | 18,500 | | | | 1,631,330 | |
| | | | | | | | |
| | | | | | | 1,857,003 | |
| | |
INFORMATION TECHNOLOGY 22.7% | | | | | | | | |
| | |
Communications Equipment 1.2% | | | | | | | | |
Cisco Systems, Inc. | | | 75,350 | | | | 2,311,738 | |
NETGEAR, Inc.* | | | 3,200 | | | | 161,600 | |
| | | | | | | | |
| | | | | | | 2,473,338 | |
| | |
Electronic Equipment, Instruments & Components 0.4% | | | | | | | | |
Ingram Micro, Inc. (Class A Stock) | | | 13,900 | | | | 517,080 | |
Sanmina Corp.* | | | 7,500 | | | | 207,375 | |
| | | | | | | | |
| | | | | | | 724,455 | |
| | |
Internet Software & Services 6.0% | | | | | | | | |
Akamai Technologies, Inc.* | | | 18,100 | | | | 1,257,407 | |
Alphabet, Inc. (Class A Stock)* | | | 2,770 | | | | 2,243,423 | |
Alphabet, Inc. (Class C Stock)* | | | 4,577 | | | | 3,590,840 | |
eBay, Inc.* | | | 37,200 | | | | 1,060,572 | |
Facebook, Inc. (Class A Stock)* | | | 30,900 | | | | 4,047,591 | |
| | | | | | | | |
| | | | | | | 12,199,833 | |
| | |
IT Services 2.3% | | | | | | | | |
Accenture PLC (Class A Stock) | | | 8,500 | | | | 988,040 | |
Cognizant Technology Solutions Corp. (Class A Stock)* | | | 5,800 | | | | 297,830 | |
DST Systems, Inc. | | | 1,100 | | | | 105,776 | |
International Business Machines Corp. | | | 6,870 | | | | 1,055,850 | |
MasterCard, Inc. (Class A Stock) | | | 10,900 | | | | 1,166,518 | |
Sykes Enterprises, Inc.* | | | 8,700 | | | | 232,638 | |
Visa, Inc. (Class A Stock) | | | 10,400 | | | | 858,104 | |
| | | | | | | | |
| | | | | | | 4,704,756 | |
See Notes to Financial Statements.
| | | | |
| Prudential QMA Large-Cap Core Equity Fund | | | 19 | |
Portfolio of Investments (continued)
as of October 31, 2016
| | | | | | | | |
| Description | | Shares | | | Value (Note 1) | |
INFORMATION TECHNOLOGY (Continued) | | | | | | | | |
| | |
Semiconductors & Semiconductor Equipment 3.8% | | | | | | | | |
Applied Materials, Inc. | | | 46,600 | | | $ | 1,355,128 | |
Intel Corp. | | | 71,400 | | | | 2,489,718 | |
QUALCOMM, Inc. | | | 32,700 | | | | 2,247,144 | |
Texas Instruments, Inc. | | | 24,000 | | | | 1,700,400 | |
| | | | | | | | |
| | | | | | | 7,792,390 | |
| | |
Software 4.5% | | | | | | | | |
Adobe Systems, Inc.* | | | 6,800 | | | | 731,068 | |
Citrix Systems, Inc.* | | | 15,700 | | | | 1,331,360 | |
Dell Technologies, Inc.—VMware, Inc. (Class V Stock)* | | | 48 | | | | 2,356 | |
Intuit, Inc. | | | 12,100 | | | | 1,315,754 | |
Manhattan Associates, Inc.* | | | 6,600 | | | | 334,224 | |
Microsoft Corp. | | | 49,400 | | | | 2,960,048 | |
Oracle Corp. | | | 61,700 | | | | 2,370,514 | |
| | | | | | | | |
| | | | | | | 9,045,324 | |
| | |
Technology Hardware, Storage & Peripherals 4.5% | | | | | | | | |
Apple, Inc. | | | 61,520 | | | | 6,984,981 | |
Hewlett Packard Enterprise Co. | | | 60,000 | | | | 1,348,200 | |
HP, Inc. | | | 47,700 | | | | 691,173 | |
| | | | | | | | |
| | | | | | | 9,024,354 | |
| | |
MATERIALS 3.3% | | | | | | | | |
| | |
Chemicals 1.4% | | | | | | | | |
GCP Applied Technologies, Inc.* | | | 4,300 | | | | 111,155 | |
Huntsman Corp. | | | 7,100 | | | | 120,345 | |
LyondellBasell Industries NV (Class A Stock) | | | 17,200 | | | | 1,368,260 | |
Trinseo SA | | | 17,900 | | | | 938,855 | |
Westlake Chemical Corp. | | | 4,800 | | | | 248,592 | |
| | | | | | | | |
| | | | | | | 2,787,207 | |
| | |
Containers & Packaging 0.6% | | | | | | | | |
Greif, Inc. (Class A Stock) | | | 4,100 | | | | 192,126 | |
Owens-Illinois, Inc.* | | | 20,900 | | | | 403,370 | |
Packaging Corp. of America | | | 7,300 | | | | 602,250 | |
| | | | | | | | |
| | | | | | | 1,197,746 | |
| | |
Metals & Mining 1.2% | | | | | | | | |
Newmont Mining Corp. | | | 34,200 | | | | 1,266,768 | |
Steel Dynamics, Inc. | | | 40,700 | | | | 1,117,622 | |
| | | | | | | | |
| | | | | | | 2,384,390 | |
See Notes to Financial Statements.
| | | | | | | | |
| Description | | Shares | | | Value (Note 1) | |
MATERIALS (Continued) | | | | | | | | |
| | |
Paper & Forest Products 0.1% | | | | | | | | |
KapStone Paper & Packaging Corp. | | | 13,300 | | | $ | 241,262 | |
| | |
REAL ESTATE 1.5% | | | | | | | | |
| | |
Equity Real Estate Investment Trusts (REITs) 1.4% | | | | | | | | |
Apple Hospitality REIT, Inc. | | | 5,000 | | | | 90,150 | |
Forest City Realty Trust, Inc. (Class A Stock) | | | 16,100 | | | | 347,599 | |
HCP, Inc. | | | 7,200 | | | | 246,600 | |
Paramount Group, Inc. | | | 4,000 | | | | 62,200 | |
Prologis, Inc. | | | 7,600 | | | | 396,416 | |
RLJ Lodging Trust | | | 4,500 | | | | 88,740 | |
Ryman Hospitality Properties, Inc. | | | 7,100 | | | | 357,982 | |
VEREIT, Inc. | | | 41,100 | | | | 386,340 | |
Xenia Hotels & Resorts, Inc. | | | 56,800 | | | | 886,648 | |
| | | | | | | | |
| | | | 2,862,675 | |
| | |
Real Estate Management & Development 0.1% | | | | | | | | |
Jones Lang LaSalle, Inc. | | | 1,200 | | | | 116,220 | |
| | |
TELECOMMUNICATIONS SERVICES 1.8% | | | | | | | | |
| | |
Diversified Telecommunication Services 1.8% | | | | | | | | |
AT&T, Inc. | | | 6,054 | | | | 222,727 | |
Verizon Communications, Inc. | | | 69,400 | | | | 3,338,140 | |
| | | | | | | | |
| | | | | | | 3,560,867 | |
| | |
Wireless Telecommunication Services | | | | | | | | |
United States Cellular Corp.* | | | 2,200 | | | | 77,110 | |
| | |
UTILITIES 3.9% | | | | | | | | |
| | |
Electric Utilities 2.3% | | | | | | | | |
American Electric Power Co., Inc. | | | 21,600 | | | | 1,400,544 | |
Entergy Corp. | | | 15,900 | | | | 1,171,512 | |
Exelon Corp. | | | 43,100 | | | | 1,468,417 | |
FirstEnergy Corp. | | | 18,900 | | | | 648,081 | |
| | | | | | | | |
| | | | | | | 4,688,554 | |
| | |
Gas Utilities 0.2% | | | | | | | | |
UGI Corp. | | | 10,600 | | | | 490,674 | |
| | |
Independent Power & Renewable Electricity Producers 0.7% | | | | | | | | |
AES Corp. | | | 111,100 | | | | 1,307,647 | |
See Notes to Financial Statements.
| | | | |
| Prudential QMA Large-Cap Core Equity Fund | | | 21 | |
Portfolio of Investments (continued)
as of October 31, 2016
| | | | | | | | |
| Description | | Shares | | | Value (Note 1) | |
UTILITIES (Continued) | | | | | | | | |
| | |
Multi-Utilities 0.7% | | | | | | | | |
MDU Resources Group, Inc. | | | 11,900 | | | $ | 311,899 | |
Public Service Enterprise Group, Inc. | | | 23,600 | | | | 993,088 | |
| | | | | | | | |
| | | | | | | 1,304,987 | |
| | | | | | | | |
TOTAL LONG-TERM INVESTMENTS
(cost $139,515,128) | | | | | | | 199,201,082 | |
| | | | | | | | |
| | |
SHORT-TERM INVESTMENTS 1.0% | | | | | | | | |
| | |
AFFILIATED MUTUAL FUNDS 0.9% | | | | | | | | |
Prudential Investment Portfolios 2 -
Prudential Core Ultra Short Bond Fund(b) | | | 1,501,942 | | | | 1,501,942 | |
Prudential Investment Portfolios 2 -
Prudential Institutional Money Market Fund
(cost $334,258; includes $334,010 of cash collateral for securities on loan)(b)(c) | | | 334,191 | | | | 334,258 | |
| | | | | | | | |
TOTAL AFFILIATED MUTUAL FUNDS
(cost $1,836,200)(Note 3) | | | | | | | 1,836,200 | |
| | | | | | | | |
| | |
| | | Principal
Amount (000)# | | | | |
| | |
U.S. TREASURY OBLIGATION 0.1% | | | | | | | | |
U.S. Treasury Bills,
0.306%, 12/15/16(d)(e)
(cost $199,927) | | | 200 | | | | 199,956 | |
| | | | | | | | |
TOTAL SHORT-TERM INVESTMENTS
(cost $2,036,127) | | | | 2,036,156 | |
| | | | | | | | |
TOTAL INVESTMENTS 99.6%
(cost $141,551,255)(Note 5) | | | | | | | 201,237,238 | |
Other assets in excess of liabilities(f) 0.4% | | | | | | | 787,752 | |
| | | | | | | | |
NET ASSETS 100.0% | | | | | | $ | 202,024,990 | |
| | | | | | | | |
The following abbreviations are used in the annual report:
LIBOR—London Interbank Offered Rate
REIT—Real Estate Investment Trust
| * | Non-income producing security. |
| # | Principal amount shown in U.S. dollars unless otherwise stated. |
| (a) | All or a portion of security is on loan. The aggregate market value of such securities, including those sold and pending settlement, is $326,517; cash collateral of $334,010 (included in liabilities) was received with which the Fund purchased highly liquid short-term investments. Securities on loan are subject to contractual netting arrangements. |
| (b) | Prudential Investments LLC, the manager of the Fund, also serves as manager of the Prudential Investment Portfolios 2 - Prudential Core Ultra Short Bond Fund and the Prudential Investment Portfolios 2 - Prudential Institutional Money Market Fund. |
See Notes to Financial Statements.
| (c) | Represents security purchased with cash collateral received for securities on loan and includes dividend reinvestment. |
| (d) | Rate quoted represents yield-to-maturity as of purchase date. |
| (e) | Represents security, or a portion thereof, segregated as collateral for futures contracts. |
| (f) | Includes net unrealized appreciation (depreciation) on the following derivative contracts held at reporting period end: |
Futures contracts outstanding at October 31, 2016:
| | | | | | | | | | | | | | | | | | | | |
Number of
Contracts | | | Type | | Expiration
Date | | | Value at
Trade Date | | | Value at
October 31,
2016 | | | Unrealized
Appreciation
(Depreciation) | |
| | | | Long Position: | | | | | | | | | | | | | | | | |
| | 28 | | | S&P 500 E-Mini Index | | | Dec. 2016 | | | $ | 2,987,372 | | | $ | 2,968,140 | | | $ | (19,232 | ) |
| | | | | | | | | | | | | | | | | | | | |
A U.S. Treasury Obligation with a market value of $199,956 has been segregated with Goldman Sachs & Co. to cover requirements for open futures contracts at October 31, 2016.
Various inputs are used in determining the value of the Fund’s investments. These inputs are summarized in the three broad levels listed below.
Level 1—quoted prices generally in active markets for identical securities.
Level 2—quoted prices for similar securities, interest rates and yield curves, prepayment speeds, foreign currency exchange rates and other observable inputs.
Level 3—unobservable inputs for securities valued in accordance with Board approved fair valuation procedures.
The following is a summary of the inputs used as of October 31, 2016 in valuing such portfolio securities:
| | | | | | | | | | | | |
| | | Level 1 | | | Level 2 | | | Level 3 | |
Investments in Securities | | | | | | | | | | | | |
Common Stocks | | | | | | | | | | | | |
Consumer Discretionary | | $ | 21,864,767 | | | $ | — | | | $ | — | |
Consumer Staples | | | 20,744,723 | | | | — | | | | — | |
Energy | | | 12,598,415 | | | | — | | | | — | |
Financials | | | 25,475,211 | | | | — | | | | — | |
Health Care | | | 30,789,612 | | | | — | | | | — | |
Industrials | | | 20,744,565 | | | | — | | | | — | |
Information Technology | | | 45,964,450 | | | | — | | | | — | |
Materials | | | 6,610,605 | | | | — | | | | — | |
Real Estate | | | 2,978,895 | | | | — | | | | — | |
Telecommunications Services | | | 3,637,977 | | | | — | | | | — | |
Utilities | | | 7,791,862 | | | | — | | | | — | |
Affiliated Mutual Funds | | | 1,836,200 | | | | — | | | | — | |
See Notes to Financial Statements.
| | | | |
| Prudential QMA Large-Cap Core Equity Fund | | | 23 | |
Portfolio of Investments (continued)
as of October 31, 2016
| | | | | | | | | | | | |
| | | Level 1 | | | Level 2 | | | Level 3 | |
U.S. Treasury Obligation | | $ | — | | | $ | 199,956 | | | $ | — | |
Other Financial Instruments* | | | | | | | | | | | | |
Futures Contracts | | | (19,232 | ) | | | — | | | | — | |
| | | | | | | | | | | | |
Total | | $ | 201,018,050 | | | $ | 199,956 | | | $ | — | |
| | | | | | | | | | | | |
| * | Other financial instruments are derivative instruments not reflected in the Portfolio of Investments, such as futures, forwards and centrally cleared swap contracts, which are recorded at the unrealized appreciation (depreciation) on the instrument, and OTC swap contracts which are recorded at fair value. |
During the period, there were no transfers between Level 1 and Level 2 to report.
The industry classification of investments and other assets in excess of liabilities shown as a percentage of net assets as of October 31, 2016 were as follows (unaudited):
| | | | |
Information Technology | | | 22.7 | % |
Health Care | | | 15.2 | |
Financials | | | 12.6 | |
Consumer Discretionary | | | 10.8 | |
Consumer Staples | | | 10.3 | |
Industrials | | | 10.3 | |
Energy | | | 6.2 | |
Utilities | | | 3.9 | |
Materials | | | 3.3 | |
Telecommunications Services | | | 1.8 | % |
Real Estate | | | 1.5 | |
Affiliated Mutual Funds (including 0.2% of collateral for securities on loan) | | | 0.9 | |
U.S. Treasury Obligation | | | 0.1 | |
| | | | |
| | | 99.6 | |
Other assets in excess of liabilities | | | 0.4 | |
| | | | |
| | | 100.0 | % |
| | | | |
The Fund invested in derivative instruments during the reporting period. The primary type of risk associated with these derivative instruments is equity risk. The effect of such derivative instruments on the Fund’s financial position and financial performance as reflected in the Statement of Assets and Liabilities and Statement of Operations is presented in the summary below.
Fair values of derivative instruments as of October 31, 2016 as presented in the Statement of Assets and Liabilities:
| | | | | | | | | | | | |
| | | Asset Derivatives | | | Liability Derivatives | |
Derivatives not accounted
for as hedging instruments,
carried at fair value | | Balance
Sheet Location | | Fair
Value | | | Balance
Sheet Location | | Fair
Value | |
| Equity contracts | | — | | $ | — | | | Due from/to broker—
variation marginfutures | | $ | 19,232 | * |
| | | | | | | | | | | | |
| * | Includes cumulative appreciation (depreciation) as reported in schedule of open futures and centrally cleared swap contracts. Only unsettled variation margin receivable (payable) is reported within the Statement of Assets and Liabilities. |
See Notes to Financial Statements.
The effects of derivative instruments on the Statement of Operations for the year ended October 31, 2016 are as follows:
| | | | |
Amount of Realized Gain (Loss) on Derivatives Recognized in Income | |
Derivatives not accounted for as hedging instruments, carried at fair value | | Futures | |
Equity contracts | | $ | 515,488 | |
| | | | |
| | | | |
Change in Unrealized Appreciation (Depreciation) on Derivatives Recognized in Income | |
Derivatives not accounted for as hedging instruments, carried at fair value | | Futures | |
Equity contracts | | ($ | 197,204 | ) |
| | | | |
For the year ended October 31, 2016, the Fund’s average value at trade date for futures contracts-long positions was $2,495,613.
See Notes to Financial Statements.
| | | | |
| Prudential QMA Large-Cap Core Equity Fund | | | 25 | |
Statement of Assets & Liabilities
as of October 31, 2016
| | | | |
Assets | |
Investments at value, including securities on loan of $326,517: | | | | |
Unaffiliated investments (cost $139,715,055) | | $ | 199,401,038 | |
Affiliated investments (cost $1,836,200) | | | 1,836,200 | |
Receivable for investments sold | | | 8,250,223 | |
Dividends and interest receivable | | | 156,440 | |
Receivable for Fund shares sold | | | 18,052 | |
Tax reclaim receivable | | | 525 | |
Prepaid expenses | | | 2,105 | |
| | | | |
Total Assets | | | 209,664,583 | |
| | | | |
| |
Liabilities | | | | |
Payable for investments purchased | | | 6,921,493 | |
Payable to broker for collateral for securities on loan | | | 334,010 | |
Payable for Fund shares reacquired | | | 116,323 | |
Management fee payable | | | 112,737 | |
Accrued expenses | | | 76,653 | |
Distribution fee payable | | | 54,437 | |
Affiliated transfer agent fee payable | | | 18,760 | |
Due to broker—variation margin futures | | | 5,180 | |
| | | | |
Total Liabilities | | | 7,639,593 | |
| | | | |
| |
Net Assets | | $ | 202,024,990 | |
| | | | |
| | | | | |
Net assets were comprised of: | | | | |
Shares of beneficial interest, at par | | $ | 13,162 | |
Paid-in capital in excess of par | | | 132,378,802 | |
| | | | |
| | | 132,391,964 | |
Undistributed net investment income | | | 1,421,946 | |
Accumulated net realized gain on investment transactions | | | 8,544,329 | |
Net unrealized appreciation on investments | | | 59,666,751 | |
| | | | |
Net assets, October 31, 2016 | | $ | 202,024,990 | |
| | | | |
See Notes to Financial Statements.
| | | | |
Class A | |
Net asset value and redemption price per share
($89,169,072 ÷ 5,755,414 shares of beneficial interest issued and outstanding) | | $ | 15.49 | |
Maximum sales charge (5.50% of offering price) | | | 0.90 | |
| | | | |
Maximum offering price to public | | $ | 16.39 | |
| | | | |
| |
Class B | | | | |
Net asset value, offering price and redemption price per share
($2,131,936 ÷ 149,112 shares of beneficial interest issued and outstanding) | | $ | 14.30 | |
| | | | |
| |
Class C | | | | |
Net asset value, offering price and redemption price per share
($39,218,154 ÷ 2,739,918 shares of beneficial interest issued and outstanding) | | $ | 14.31 | |
| | | | |
| |
Class Z | | | | |
Net asset value, offering price and redemption price per share
($71,505,828 ÷ 4,517,572 shares of beneficial interest issued and outstanding) | | $ | 15.83 | |
| | | | |
See Notes to Financial Statements.
| | | | |
| Prudential QMA Large-Cap Core Equity Fund | | | 27 | |
Statement of Operations
Year Ended October 31, 2016
| | | | |
Net Investment Income (Loss) | |
Income | | | | |
Unaffiliated dividend income (net of foreign withholding taxes of $1,090) | | $ | 4,243,890 | |
Income from securities lending, net (including affiliated income of $13,305) | | | 13,489 | |
Affiliated dividend income | | | 15,511 | |
Interest income | | | 666 | |
| | | | |
Total income | | | 4,273,556 | |
| | | | |
| |
Expenses | | | | |
Management fee | | | 1,332,071 | |
Distribution fee—Class A | | | 265,324 | |
Distribution fee—Class B | | | 23,475 | |
Distribution fee—Class C | | | 383,435 | |
Transfer agent’s fees and expenses (including affiliated expense of $100,700) | | | 264,000 | |
Registration fees | | | 100,000 | |
Custodian and accounting fees (net of $6,000 fee credit) | | | 63,000 | |
Shareholders’ reports | | | 38,000 | |
Audit fee | | | 28,000 | |
Legal fees and expenses | | | 21,000 | |
Trustees’ fees | | | 13,000 | |
Insurance expenses | | | 2,000 | |
Loan interest expense | | | 119 | |
Miscellaneous | | | 15,282 | |
| | | | |
Total expenses | | | 2,548,706 | |
Less: Distribution fee waiver—Class A | | | (44,221 | ) |
| | | | |
Net expenses | | | 2,504,485 | |
| | | | |
Net investment income (loss) | | | 1,769,071 | |
| | | | |
| |
Realized And Unrealized Gain (Loss) On Investments | | | | |
Net realized gain (loss) on: | | | | |
Investment transactions (including affiliated of $98) | | | 8,352,933 | |
Futures transactions | | | 515,488 | |
| | | | |
| | | 8,868,421 | |
| | | | |
Net change in unrealized appreciation (depreciation) on: | | | | |
Investments | | | (4,446,798 | ) |
Futures | | | (197,204 | ) |
| | | | |
| | | (4,644,002 | ) |
| | | | |
Net gain (loss) on investment transactions | | | 4,224,419 | |
| | | | |
Net Increase (Decrease) In Net Assets Resulting From Operations | | $ | 5,993,490 | |
| | | | |
See Notes to Financial Statements.
Statement of Changes in Net Assets
| | | | | | | | |
| | | Year Ended October 31, | |
| | | 2016 | | | 2015 | |
Increase (Decrease) in Net Assets | | | | | | | | |
Operations | | | | | | | | |
Net investment income (loss) | | $ | 1,769,071 | | | $ | 1,510,203 | |
Net realized gain (loss) on investment transactions | | | 8,868,421 | | | | 9,377,131 | |
Net change in unrealized appreciation (depreciation) on investments | | | (4,644,002 | ) | | | (3,941,549 | ) |
| | | | | | | | |
Net increase (decrease) in net assets resulting from operations | | | 5,993,490 | | | | 6,945,785 | |
| | | | | | | | |
| | |
Dividends and Distributions (Note 1) | | | | | | | | |
Dividends from net investment income | | | | | | | | |
Class A | | | (774,919 | ) | | | (577,534 | ) |
Class B | | | (5,279 | ) | | | (162 | ) |
Class C | | | (81,031 | ) | | | (1,954 | ) |
Class Z | | | (852,298 | ) | | | (355,525 | ) |
| | | | | | | | |
| | | (1,713,527 | ) | | | (935,175 | ) |
| | | | | | | | |
Distributions from net realized gains | | | | | | | | |
Class A | | | (4,028,233 | ) | | | (6,437,641 | ) |
Class B | | | (123,545 | ) | | | (244,987 | ) |
Class C | | | (1,896,176 | ) | | | (2,948,080 | ) |
Class Z | | | (3,445,643 | ) | | | (2,966,065 | ) |
| | | | | | | | |
| | | (9,493,597 | ) | | | (12,596,773 | ) |
| | | | | | | | |
| | |
Fund share transactions (Net of share conversions) (Note 6) | | | | | | | | |
Net proceeds from shares sold | | | 26,627,981 | | | | 71,467,428 | |
Net asset value of shares issued in reinvestment of dividends and distributions | | | 10,951,763 | | | | 13,218,125 | |
Cost of shares reacquired | | | (40,951,564 | ) | | | (38,917,142 | ) |
| | | | | | | | |
Net increase (decrease) in net assets from Fund share transactions | | | (3,371,820 | ) | | | 45,768,411 | |
| | | | | | | | |
Total increase (decrease) | | | (8,585,454 | ) | | | 39,182,248 | |
| | |
Net Assets: | | | | | | | | |
Beginning of year | | | 210,610,444 | | | | 171,428,196 | |
| | | | | | | | |
End of year(a) | | $ | 202,024,990 | | | $ | 210,610,444 | |
| | | | | | | | |
(a) Includes undistributed net investment income of: | | $ | 1,421,946 | | | $ | 1,334,876 | |
| | | | | | | | |
See Notes to Financial Statements.
| | | | |
| Prudential QMA Large-Cap Core Equity Fund | | | 29 | |
Notes to Financial Statements
Prudential Investment Portfolios 9 (the “Trust”) is an open-end management investment company, registered under the Investment Company Act of 1940, as amended (“1940 Act”). The Trust currently consists of four funds: Prudential QMA Large-Cap Core Equity Fund (the “Fund”, formerly Prudential Large-Cap Core Equity Fund), Prudential Absolute Return Bond Fund, Prudential Select Real Estate Fund and Prudential Real Estate Income Fund. These financial statements relate to Prudential QMA Large-Cap Core Equity Fund, a diversified fund. The financial statements of the Prudential Absolute Return Bond Fund, Prudential Select Real Estate Fund and Prudential Real Estate Income Fund are not presented herein. The Fund’s investment objective is long-term after-tax growth of capital.
Note 1. Accounting Policies
The Fund follows investment company accounting and reporting guidance of the Financial Accounting Standards Board (“FASB”) Accounting Standard Codification Topic 946 Financial Services—Investment Companies. The following accounting policies conform to U.S. generally accepted accounting principles. The Fund consistently follows such policies in the preparation of its financial statements.
Securities Valuation: The Fund holds securities and other assets that are fair valued at the close of each day (generally, 4:00 PM Eastern time) the New York Stock Exchange (“NYSE”) is open for trading. Fair value is the price that would be received to sell an asset or paid to transfer a liability in an orderly transaction between market participants on the measurement date. The Board of Trustees (the “Board”) has adopted Valuation Procedures for security valuation under which fair valuation responsibilities have been delegated to Prudential Investments LLC (“PI” or “Manager”). Under the current Valuation Procedures, the established Valuation Committee is responsible for supervising the valuation of portfolio securities and other assets. The Valuation Procedures permit the Fund to utilize independent pricing vendor services, quotations from market makers, and alternative valuation methods when market quotations are either not readily available or not deemed representative of fair value. A record of the Valuation Committee’s actions is subject to the Board’s review, approval, and ratification at its next regularly-scheduled quarterly meeting.
Various inputs determine how the Fund’s investments are valued, all of which are categorized according to the three broad levels (Level 1, 2, or 3) detailed in the table following the Portfolio of Investments.
Common and preferred stocks, exchange-traded funds, and derivative instruments such as futures or options that are traded on a national securities exchange are valued at the last sale price as of the close of trading on the applicable exchange where the security principally trades. Securities traded via NASDAQ are valued at the NASDAQ official closing
price. To the extent these securities are valued at the last sale price or NASDAQ official closing price, they are classified as Level 1 in the fair value hierarchy.
In the event that no sale or official closing price on valuation date exists, these securities are generally valued at the mean between the last reported bid and ask prices, or at the last bid price in the absence of an ask price. These securities are classified as Level 2 in the fair value hierarchy.
Common and preferred stocks traded on foreign securities exchanges are valued using pricing vendor services that provide model prices derived using adjustment factors based on information such as local closing price, relevant general and sector indices, currency fluctuations, depositary receipts, and futures, as applicable. Securities valued using such model prices are classified as Level 2 in the fair value hierarchy. The models generate an evaluated adjustment factor for each security, which is applied to the local closing price to adjust it for post closing market movements. Utilizing that evaluated adjustment factor, the vendor provides an evaluated price for each security. If the vendor does not provide an evaluated price, securities are valued in accordance with exchange-traded common and preferred stocks discussed above.
Participatory notes (“P-notes”) are generally valued based upon the value of a related underlying security that trades actively in the market and are classified as Level 2 in the fair value hierarchy.
Investments in open-end, non-exchange-traded mutual funds are valued at their net asset values as of the close of the NYSE on the date of valuation. These securities are classified as Level 1 in the fair value hierarchy since they may be purchased or sold at their net asset values on the date of valuation.
Securities and other assets that cannot be priced according to the methods described above are valued based on pricing methodologies approved by the Board. In the event that unobservable inputs are used when determining such valuations, the securities will be classified as Level 3 in the fair value hierarchy.
When determining the fair value of securities, some of the factors influencing the valuation include: the nature of any restrictions on disposition of the securities; assessment of the general liquidity of the securities; the issuer’s financial condition and the markets in which it does business; the cost of the investment; the size of the holding and the capitalization of the issuer; the prices of any recent transactions or bids/offers for such securities or any comparable securities; any available analyst media or other reports or information deemed reliable by the investment adviser regarding the issuer or the markets or industry in which it operates. Using fair value to price securities may result in a value that is different from a security’s most recent closing price and from the price used by other mutual funds to calculate their net asset values.
| | | | |
| Prudential QMA Large-Cap Core Equity Fund | | | 31 | |
Notes to Financial Statements (continued)
Restricted and Illiquid Securities: Subject to guidelines adopted by the Board, the Fund may invest up to 15% of its net assets in illiquid securities, including those which are restricted as to disposition under securities law (“restricted securities”). Restricted securities are valued pursuant to the valuation procedures noted above. Illiquid securities are those that, because of the absence of a readily available market or due to legal or contractual restrictions on resale, cannot be sold within seven days in the ordinary course of business at approximately the amount at which the Fund has valued the investment. Therefore, the Fund may find it difficult to sell illiquid securities at the time considered most advantageous by its Subadviser and may incur expenses that would not be incurred in the sale of securities that were freely marketable. Certain securities that would otherwise be considered illiquid because of legal restrictions on resale to the general public may be traded among qualified institutional buyers under Rule 144A of the Securities Act of 1933. These Rule 144A securities, as well as commercial paper that is sold in private placements under Section 4(2) of the Securities Act, may be deemed liquid by the Fund’s Subadviser under the guidelines adopted by the Directors of the Fund. However, the liquidity of the Fund’s investments in Rule 144A securities could be impaired if trading does not develop or declines.
Financial Futures Contracts: A financial futures contract is an agreement to purchase (long) or sell (short) an agreed amount of securities at a set price for delivery on a future date. Upon entering into a financial futures contract, the Fund is required to pledge to the broker an amount of cash and/or other assets equal to a certain percentage of the contract amount. This amount is known as the “initial margin”. Subsequent payments, known as “variation margin”, are made or received by the Fund each day, depending on the daily fluctuations in the value of the underlying security. Such variation margin is recorded for financial statement purposes on a daily basis as unrealized gain (loss). When the contract expires or is closed, the gain (loss) is realized and is presented in the Statement of Operations as net realized gain (loss) on futures transactions.
The Fund invested in financial futures contracts in order to hedge its existing portfolio securities, or securities the Fund intends to purchase, against fluctuations in value caused by changes in prevailing interest rates or foreign currency exchange rates. Should interest rates move unexpectedly, the Fund may not achieve the anticipated benefits of the financial futures contracts and may realize a loss. The use of futures transactions involves the risk of imperfect correlation in movements in the price of futures contracts, interest rates and the underlying hedged assets. With exchange-traded futures contracts, there is minimal counterparty credit risk to the Fund since the exchanges’ clearinghouse acts as counterparty to all exchange-traded futures and guarantees the futures contracts against default.
Master Netting Arrangements: The Fund is subject to various Master Agreements, or netting arrangements, with select counterparties. These are agreements which a subadviser
may have negotiated and entered into on behalf of the Fund. A master netting arrangement between the Fund and the counterparty permits the Fund to offset amounts payable by the Fund to the same counterparty against amounts to be received; and by the receipt of collateral from the counterparty by the Fund to cover the Fund’s exposure to the counterparty. However, there is no assurance that such mitigating factors are easily enforceable. In addition to master netting arrangements, the right to set-off exists when all the conditions are met such that each of the parties owes the other determinable amounts, the reporting party has the right to set-off the amount owed with the amount owed by the other party, the reporting party intends to set-off and the right of set-off is enforceable by law. During the reporting period, there was no intention to settle on a net basis and all amounts are presented on a gross basis on the Statement of Assets and Liabilities.
Securities Lending: The Fund may lend its portfolio securities to banks and broker-dealers. The loans are secured by collateral at least equal to the market value of the securities loaned. Collateral pledged by each borrower is invested in a money market fund and is marked to market daily, based on the previous day’s market value, such that the value of the collateral exceeds the value of the loaned securities. For the period March 31, 2016 through July 18, 2016 the collateral was invested in an ultra-short bond fund. Loans are subject to termination at the option of the borrower or the Fund. Upon termination of the loan, the borrower will return to the Fund securities identical to the loaned securities. Should the borrower of the securities fail financially, the Fund has the right to repurchase the securities in the open market using the collateral. The Fund recognizes income, net of any rebate and securities lending agent fees, for lending its securities in the form of fees or interest on the investment of any cash received as collateral. The borrower receives all interest and dividends from the securities loaned and such payments are passed back to the lender in amounts equivalent thereto. The Fund also continues to recognize any unrealized gain (loss) in the market price of the securities loaned and on the change in the value of the collateral invested that may occur during the term of the loan. In addition, realized gain (loss) is recognized on changes in the value of the collateral invested that may occur during the term of the loan.
REITs: The Fund invests in REITs, which report information on the source of their distributions annually. Based on current and historical information, a portion of distributions received from REITs during the period is estimated to be dividend income, capital gain or return of capital and is recorded accordingly. These estimates are adjusted when the actual source of distributions is disclosed by the REITs.
Securities Transactions and Net Investment Income: Securities transactions are recorded on the trade date. Realized gains (losses) from investment transactions are calculated on the identified cost basis. Dividend income is recorded on the ex-date. Interest income, including amortization of premium and accretion of discount on debt securities, as required, is recorded on an accrual basis. Expenses are recorded on an accrual basis, which may require the use of certain estimates by management that may differ from actual.
| | | | |
| Prudential QMA Large-Cap Core Equity Fund | | | 33 | |
Notes to Financial Statements (continued)
Net investment income or loss (other than distribution fees which are charged directly to the respective class) and unrealized and realized gains (losses) are allocated daily to each class of shares based upon the relative proportion of adjusted net assets of each class at the beginning of the day.
Dividends and Distributions: The Fund expects to pay dividends from net investment income and distributions of net realized capital gains, if any, annually. Dividends and distributions to shareholders, which are determined in accordance with federal income tax regulations and which may differ from generally accepted accounting principles, are recorded on the ex-date. Permanent book/tax differences relating to income and gain (loss) are reclassified amongst undistributed net investment income, accumulated net realized gain (loss) and paid-in capital in excess of par, as appropriate.
Taxes: For federal income tax purposes, the Fund is treated as a separate taxpaying entity. It is the Fund’s policy to continue to meet the requirements of the Internal Revenue Code applicable to regulated investment companies and to distribute all of its taxable net investment income and capital gains, if any, to shareholders. Therefore, no federal income tax provision is required. Withholding taxes on foreign dividends are recorded net of reclaimable amounts, at the time related income is earned.
Estimates: The preparation of the financial statements requires management to make estimates and assumptions that affect the reported amounts and disclosures in the financial statements. Actual results could differ from those estimates.
Note 2. Agreements
The Trust has a management agreement for the Fund with PI. Pursuant to this agreement, PI has responsibility for all investment advisory services and supervises the subadvisor’s performance of such services. PI has entered into a subadvisory agreement with Quantitative Management Associates LLC (“QMA”). The subadvisory agreement provides that QMA will furnish investment advisory services in connection with the management of the Fund. In connection therewith, QMA is obligated to keep certain books and records of the Fund. PI pays for the services of QMA, the cost of compensation of officers of the Fund, occupancy and certain clerical and bookkeeping costs of the Fund. The Fund bears all other costs and expenses.
The management fee paid to PI is computed daily and payable monthly at an annual rate of .65% of the Fund’s average daily net assets up to and including $500 million and .60% of the Fund’s average daily net assets in excess of $500 million. The effective management fee rate was .65% for the year ended October 31, 2016. Effective December 9, 2016, the management fee paid to PI is computed daily and payable monthly at an annual rate of .35% of the Fund’s average daily net assets up to and including $5 billion and .34% of the Fund’s average daily net assets in excess of $5 billion.
PI had contractually agreed through February 29, 2016, to limit the net annual operating expenses (exclusive of distribution and service (12b-1) fees, taxes (such as income and foreign withholdings taxes, stamp duty and deferred tax expenses), interest, underlying funds, brokerage, extraordinary and certain other expenses such as dividend, broker charges and interest expense on short sales) of each class of shares of the Fund to .95% of the Fund’s average daily net assets. Effective December 9, 2016, PI has contractually agreed through February 28, 2018 to limit the net annual operating expenses (exclusive of distribution and service (12b-1) fees, transfer agency expenses (including sub-transfer agency and networking fees), taxes (such as income and foreign withholdings taxes, stamp duty and deferred tax expenses), interest, underlying funds, brokerage, extraordinary and certain other expenses such as dividend, broker charges and interest expense on short sales) of each class of shares of the Fund to .35% of the Fund’s average daily net assets. Expenses waived/reimbursed by the Manager in accordance with this agreement may be recouped by the Manager within the same fiscal year during which such waiver/reimbursement is made if such recoupment can be realized without exceeding the expense limit in effect at the time of the recoupment for that fiscal year.
The Fund has a distribution agreement with Prudential Investment Management Services LLC (“PIMS”), which acts as the distributor of the Class A, Class B, Class C and Class Z shares of the Fund. The Fund compensates PIMS for distributing and servicing the Fund’s Class A, Class B and Class C shares, pursuant to plans of distribution (the “Distribution Plans”), regardless of expenses actually incurred by PIMS. The distribution fees are accrued daily and payable monthly. No distribution or service fees are paid to PIMS as distributor of the Class Z shares of the Fund.
Pursuant to the Distribution Plans, the Fund compensates PIMS for distribution-related activities at an annual rate of up to .30%, 1% and 1% of the average daily net assets of the Class A, B and C shares, respectively. Through February 28, 2018, PIMS contractually agreed to limit such fees to .25% of the average daily net assets of Class A shares.
PIMS has advised the Fund that it received $68,077 in front-end sales charges resulting from sales of Class A shares during the year ended October 31, 2016.
From these fees, PIMS paid such sales charges to affiliated broker-dealers, which in turn paid commissions to salespersons and incurred other distribution costs.
PIMS has advised the Fund that for the year ended October 31, 2016 it received $7, $2,014 and $962 in contingent deferred sales charges imposed upon certain redemptions by Class A, B and Class C shareholders, respectively.
PI, QMA and PIMS are indirect, wholly-owned subsidiaries of Prudential Financial, Inc. (“Prudential”).
Note 3. Other Transactions with Affiliates
Prudential Mutual Fund Services LLC (“PMFS”), an affiliate of PI and an indirect, wholly-owned subsidiary of Prudential, serves as the Fund’s transfer agent. Transfer agent’s fees
| | | | |
| Prudential QMA Large-Cap Core Equity Fund | | | 35 | |
Notes to Financial Statements (continued)
and expenses in the Statement of Operations include certain out-of-pocket expenses paid to non-affiliates, where applicable.
Effective July 7, 2016, the Board replaced PGIM, Inc., an indirect, wholly-owned subsidiary of Prudential, as securities lending agent with a third party agent. Prior to July 7, 2016, PGIM, Inc. was the Fund’s securities lending agent. Net earnings from securities lending are disclosed on the Statement of Operations as “Income from securities lending, net”. For the period November 1, 2015 through February 4, 2016, PGIM, Inc. had been compensated $1,642 for these services. At the June 2016 meeting of the Board, the Board approved compensation to PGIM, Inc. related to securities lending activities. The payment was for services provided from February 5, 2016 through July 5, 2016 and totaled $654. Additionally, PGIM, Inc. reimbursed the Fund $1,914 related to securities lending income adjustments. Prior to January 4, 2016, PGIM, Inc. was known as Prudential Investment Management, Inc. (“PIM”).
The Fund may enter into certain securities purchase or sale transactions under Board approved Rule 17a-7 procedures. Rule 17a-7 is an exemptive rule under the 1940 Act, that permits purchase and sale transactions among affiliated investment companies, or between an investment company and a person that is affiliated solely by reason of having a common (or affiliated) investment adviser, common directors, and/or common officers. Such transactions are subject to ratification by the Board.
The Fund invests its overnight sweep cash in the Prudential Core Ultra Short Bond Fund, (formerly known as Prudential Core Taxable Money Market Fund), (the “Core Fund”), and its securities lending cash collateral in the Prudential Institutional Money Market Fund, (the “Money Market Fund”), each a portfolio of the Prudential Investment Portfolios 2, registered under the 1940 Act and managed by PI. Earnings from the Core and the Money Market Funds are disclosed on the Statement of Operations as “Affiliated dividend income” and “Income from securities lending, net”, respectively.
Note 4. Portfolio Securities
The cost of purchases and proceeds from sales of portfolio securities, other than short-term investments, for the year ended October 31, 2016, were $180,803,285 and $193,476,718, respectively.
Note 5. Distributions and Tax Information
Distributions to shareholders, which are determined in accordance with federal income tax regulations and which may differ from generally accepted accounting principles, are recorded on the ex-date. In order to present undistributed net investment income, accumulated net realized gain on investment transactions and paid-in capital in excess of
par on the Statement of Assets and Liabilities that more closely represent their tax character, certain adjustments have been made to undistributed net investment income and accumulated net realized gain on investment transactions. For the year ended October 31, 2016, the adjustments were to increase undistributed net investment income and decrease accumulated net realized gain on investment transactions by $31,526 due to certain book to tax differences. Net investment income, net realized gain (loss) on investment transactions and net assets were not affected by this change.
The tax character of dividends paid by the Fund were $1,713,527 of ordinary income and $9,493,597 of long-term capital gains for the year ended October 31, 2016 and $2,561,946 of ordinary income and $10,970,002 of long-term capital gains for the year ended October 31, 2015.
As of October 31, 2016, the accumulated undistributed earnings on a tax basis were $1,397,096 of ordinary income and $8,601,053 of long-term capital gains. This differs from the amount on the Statement of Assets and Liabilities primarily due to cumulative timing differences.
The United States federal income tax basis of the Fund’s investments and the net unrealized appreciation as of October 31, 2016 were as follows:
| | | | | | |
Tax Basis | | Appreciation | | Depreciation | | Net
Unrealized
Appreciation |
| $141,602,362 | | $61,026,168 | | $(1,391,292) | | $59,634,876 |
The difference between book basis and tax basis is primarily attributable to deferred losses on wash sales and other cost basis differences between financial and tax accounting.
Management has analyzed the Fund’s tax positions taken on federal, state and local income tax returns for all open tax years and has concluded that no provision for income tax is required in the Fund’s financial statements for the current reporting period. The Fund’s federal, state and local income and federal excise tax returns for tax years for which the applicable statutes of limitations have not expired are subject to examination by the Internal Revenue Service and state departments of revenue.
Note 6. Capital
The Fund offers Class A, Class B, Class C and Class Z shares. Class A shares are sold with a front-end sales charge of up to 5.50%. Purchases of $1 million or more are subject to a contingent deferred sales charge (“CDSC”) if shares are redeemed within 12 months of their purchase. The Class A shares CDSC is waived for purchases by certain retirement and/or benefit plans. Class B shares are sold with a CDSC which declines from 5% to zero depending upon the period of time the shares are held. Class B shares will automatically convert to Class A shares approximately seven years after purchase. Class B shares are closed to new purchases. Class C shares are sold with a CDSC of 1% on shares redeemed within the first 12 months of purchase. Class Z shares are not subject to any sales or redemption charge and are offered exclusively for a sale to a limited group of investors.
| | | | |
| Prudential QMA Large-Cap Core Equity Fund | | | 37 | |
Notes to Financial Statements (continued)
Under certain circumstances, an exchange may be made from specified share classes of the Fund to one or more other share classes of the Fund as presented in the table of transactions in shares of capital stock.
The Fund has authorized an unlimited number of shares of beneficial interest at $.001 par value.
As of October 31, 2016, 6 shareholders of record held 62% of the Fund’s outstanding shares on behalf of multiple beneficial owners.
Transactions in shares of common stock were as follows:
| | | | | | | | |
Class A | | Shares | | | Amount | |
Year ended October 31, 2016: | | | | | | | | |
Shares sold | | | 452,917 | | | $ | 6,798,596 | |
Shares issued in reinvestment of dividends and distributions | | | 320,176 | | | | 4,668,169 | |
Shares reacquired | | | (627,853 | ) | | | (9,479,684 | ) |
| | | | | | | | |
Net increase (decrease) in shares outstanding before conversion | | | 145,240 | | | | 1,987,081 | |
Shares issued upon conversion from other share class(es) | | | 33,899 | | | | 516,900 | |
Shares reacquired upon conversion into other share class(es) | | | (10,357 | ) | | | (161,318 | ) |
| | | | | | | | |
Net increase (decrease) in shares outstanding | | | 168,782 | | | $ | 2,342,663 | |
| | | | | | | | |
Year ended October 31, 2015: | | | | | | | | |
Shares sold | | | 430,871 | | | $ | 6,889,335 | |
Shares issued in reinvestment of dividends and distributions | | | 432,617 | | | | 6,839,669 | |
Shares reacquired | | | (616,725 | ) | | | (9,820,019 | ) |
| | | | | | | | |
Net increase (decrease) in shares outstanding before conversion | | | 246,763 | | | | 3,908,985 | |
Shares issued upon conversion from other share class(es) | | | 68,269 | | | | 1,096,026 | |
Shares reacquired upon conversion into other share class(es) | | | (80,198 | ) | | | (1,279,380 | ) |
| | | | | | | | |
Net increase (decrease) in shares outstanding | | | 234,834 | | | $ | 3,725,631 | |
| | | | | | | | |
Class B | | | | | | |
Year ended October 31, 2016: | | | | | | | | |
Shares sold | | | 19,444 | | | $ | 275,278 | |
Shares issued in reinvestment of dividends and distributions | | | 8,828 | | | | 119,535 | |
Shares reacquired | | | (26,494 | ) | | | (365,317 | ) |
| | | | | | | | |
Net increase (decrease) in shares outstanding before conversion | | | 1,778 | | | | 29,496 | |
Shares reacquired upon conversion into other share class(es) | | | (34,070 | ) | | | (480,472 | ) |
| | | | | | | | |
Net increase (decrease) in shares outstanding | | | (32,292 | ) | | $ | (450,976 | ) |
| | | | | | | | |
Year ended October 31, 2015: | | | | | | | | |
Shares sold | | | 33,048 | | | $ | 497,026 | |
Shares issued in reinvestment of dividends and distributions | | | 15,954 | | | | 235,324 | |
Shares reacquired | | | (32,007 | ) | | | (471,704 | ) |
| | | | | | | | |
Net increase (decrease) in shares outstanding before conversion | | | 16,995 | | | | 260,646 | |
Shares reacquired upon conversion into other share class(es) | | | (33,347 | ) | | | (493,572 | ) |
| | | | | | | | |
Net increase (decrease) in shares outstanding | | | (16,352 | ) | | $ | (232,926 | ) |
| | | | | | | | |
| | | | | | | | |
Class C | | Shares | | | Amount | |
Year ended October 31, 2016: | | | | | | | | |
Shares sold | | | 247,662 | | | $ | 3,502,745 | |
Shares issued in reinvestment of dividends and distributions | | | 141,301 | | | | 1,916,041 | |
Shares reacquired | | | (260,669 | ) | | | (3,626,640 | ) |
| | | | | | | | |
Net increase (decrease) in shares outstanding before conversion | | | 128,294 | | | | 1,792,146 | |
Shares reacquired upon conversion into other share class(es) | | | (23,953 | ) | | | (341,855 | ) |
| | | | | | | | |
Net increase (decrease) in shares outstanding | | | 104,341 | | | $ | 1,450,291 | |
| | | | | | | | |
Year ended October 31, 2015: | | | | | | | | |
Shares sold | | | 339,669 | | | $ | 5,033,340 | |
Shares issued in reinvestment of dividends and distributions | | | 194,484 | | | | 2,870,589 | |
Shares reacquired | | | (275,243 | ) | | | (4,084,964 | ) |
| | | | | | | | |
Net increase (decrease) in shares outstanding before conversion | | | 258,910 | | | | 3,818,965 | |
Shares reacquired upon conversion into other share class(es) | | | (62,640 | ) | | | (935,768 | ) |
| | | | | | | | |
Net increase (decrease) in shares outstanding | | | 196,270 | | | $ | 2,883,197 | |
| | | | | | | | |
Class Z | | | | | | |
Year ended October 31, 2016: | | | | | | | | |
Shares sold | | | 1,054,880 | | | $ | 16,051,362 | |
Shares issued in reinvestment of dividends and distributions | | | 285,869 | | | | 4,248,018 | |
Shares reacquired | | | (1,783,223 | ) | | | (27,479,923 | ) |
| | | | | | | | |
Net increase (decrease) in shares outstanding before conversion | | | (442,474 | ) | | | (7,180,543 | ) |
Shares issued upon conversion from other share class(es) | | | 30,619 | | | | 482,907 | |
Shares reacquired upon conversion into other share class(es) | | | (1,046 | ) | | | (16,162 | ) |
| | | | | | | | |
Net increase (decrease) in shares outstanding | | | (412,901 | ) | | $ | (6,713,798 | ) |
| | | | | | | | |
Year ended October 31, 2015: | | | | | | | | |
Shares sold | | | 3,631,013 | | | $ | 59,047,727 | |
Shares issued in reinvestment of dividends and distributions | | | 203,264 | | | | 3,272,543 | |
Shares reacquired | | | (1,502,440 | ) | | | (24,540,455 | ) |
| | | | | | | | |
Net increase (decrease) in shares outstanding before conversion | | | 2,331,837 | | | | 37,779,815 | |
Shares issued upon conversion from other shares class(es) | | | 100,946 | | | | 1,639,421 | |
Shares reacquired upon conversion into other share class(es) | | | (1,655 | ) | | | (26,727 | ) |
| | | | | | | | |
Net increase (decrease) in shares outstanding | | | 2,431,128 | | | $ | 39,392,509 | |
| | | | | | | | |
Note 7. Borrowings
The Fund, along with other affiliated registered investment companies (the “Funds”), is a party to a Syndicated Credit Agreement (“SCA”) with a group of banks. The purpose of the SCA is to provide an alternative source of temporary funding for capital share redemptions. The SCA provides for a commitment of $900 million for the period October 6, 2016 through October 5, 2017. The Funds pay an annualized commitment fee of .15% of the unused portion of the SCA. The interest rate on borrowings under the SCA is paid monthly and at a per annum rate based upon the higher of 0.0%, the effective federal funds rate, or the One-Month LIBOR rate, plus a contractual spread. Prior to October 6, 2016, the Funds had another SCA that provided a commitment of $900 million and the Funds paid an annualized commitment fee of .11% of the unused portion of the SCA. The interest rate on borrowings was substantially the same. The Fund’s portion of the commitment fee for the unused amount is accrued daily and paid quarterly.
The Fund utilized the SCA during the year ended October 31, 2016. The average daily balance for the 9 days the Fund had loans outstanding during the period was $277,778,
| | | | |
| Prudential QMA Large-Cap Core Equity Fund | | | 39 | |
Notes to Financial Statements (continued)
borrowed at a weighted average interest rate of 1.71%. The maximum loan balance outstanding during the period was $550,000. At October 31, 2016, the Fund did not have an outstanding loan balance.
Note 8. Dividends and Distributions to Shareholders
Subsequent to the fiscal year end, the Fund declared ordinary income dividends and capital gain distributions on December 15, 2016 to shareholders of record on December 16, 2016. The ex-date was December 19, 2016. The per share amounts declared were as follows:
| | | | | | | | |
| | | Ordinary Income | | | Long-Term Capital Gains | |
Class A | | $ | 0.15079 | | | $ | 0.66835 | |
Class B | | $ | 0.04761 | | | $ | 0.66835 | |
Class C | | $ | 0.04761 | | | $ | 0.66835 | |
Class Z | | $ | 0.18894 | | | $ | 0.66835 | |
Note 9. Recent Accounting Pronouncements and Reporting Updates
In January 2016, the FASB issued Accounting Standards Update (“ASU”) No. 2016-01 regarding “Recognition and Measurement of Financial Assets and Financial Liabilities”. The new guidance is intended to enhance the reporting model for financial instruments to provide users of financial statements with more decision-useful information and addresses certain aspects of the recognition, measurement, presentation, and disclosure of financial instruments. The new standard affects all entities that hold financial assets or owe financial liabilities. The new guidance is effective for public companies for fiscal years beginning after December 15, 2017, including interim periods within those fiscal years. At this time, management is evaluating the implications of ASU No. 2016-01 and its impact on the financial statements and disclosures has not yet been determined.
On October 13, 2016, the Securities and Exchange Commission (the “SEC”) adopted new rules and forms and amended existing rules and forms which are intended to modernize and enhance the reporting and disclosure of information by registered investment companies and to improve the quality of information that funds provide to investors, including modifications to Regulation S-X which would require standardized, enhanced disclosure about derivatives in investment company financial statements. In an effort to enhance monitoring and regulation, the new rules and forms will allow the SEC to more effectively collect and use data reported by funds. The new rules also enhance disclosure regarding fund liquidity and redemption practices. Also under the new rules, the SEC will permit open-end funds, with the exception of money market funds, to offer swing pricing, subject to board approval and review. The compliance dates of the modifications to Regulation S-X are August 1, 2017 and other amendments and rules are generally June 1, 2018 and December 1, 2018. Management is currently evaluating the impacts to the financial statement disclosures, if any.
Financial Highlights
| | | | | | | | | | | | | | | | | | | | |
| Class A Shares | |
| | | Year Ended October 31, | |
| | | 2016 | | | 2015 | | | 2014 | | | 2013 | | | 2012 | |
| Per Share Operating Performance(a): | | | | | | | | | | | | | | | | | | | | |
| Net Asset Value, Beginning of Year | | | $15.92 | | | | $16.55 | | | | $15.23 | | | | $12.70 | | | | $11.84 | |
| Income (loss) from investment operations: | | | | | | | | | | | | | | | | | | | | |
| Net investment income (loss) | | | .14 | | | | .14 | | | | .11 | | | | .14 | | | | .11 | |
| Net realized and unrealized gain (loss) on investment transactions | | | .29 | | | | .55 | | | | 2.46 | | | | 3.01 | | | | 1.65 | |
| Total from investment operations | | | .43 | | | | .69 | | | | 2.57 | | | | 3.15 | | | | 1.76 | |
| Less Dividends and Distributions: | | | | | | | | | | | | | | | | | | | | |
| Dividends from net investment income | | | (.14 | ) | | | (.11 | ) | | | (.13 | ) | | | (.13 | ) | | | (.11 | ) |
| Distributions from net realized gains | | | (.72 | ) | | | (1.21 | ) | | | (1.12 | ) | | | (.49 | ) | | | (.79 | ) |
| Total dividends and distributions | | | (.86 | ) | | | (1.32 | ) | | | (1.25 | ) | | | (.62 | ) | | | (.90 | ) |
| Net asset value, end of year | | | $15.49 | | | | $15.92 | | | | $16.55 | | | | $15.23 | | | | $12.70 | |
| Total Return(b): | | | 3.02% | | | | 4.20% | | | | 18.09% | | | | 26.00% | | | | 16.16% | |
| |
| Ratios/Supplemental Data: | | | | | | | | | | | | | | | |
| Net assets, end of year (000) | | | $89,169 | | | | $88,920 | | | | $88,561 | | | | $81,558 | | | | $70,475 | |
| Average net assets (000) | | | $88,443 | | | | $90,171 | | | | $86,047 | | | | $76,459 | | | | $65,277 | |
| Ratios to average net assets(c): | | | | | | | | | | | | | | | | | | | | |
Expenses after waivers and/or expense
reimbursement | | | 1.17% | | | | 1.14% | | | | 1.16% | | | | 1.20% | | | | 1.20% | |
| Expenses before waivers and/or expense reimbursement | | | 1.22% | | | | 1.19% | | | | 1.21% | | | | 1.30% | | | | 1.40% | |
| Net investment income (loss) | | | .91% | | | | .89% | | | | .74% | | | | .99% | | | | .95% | |
| Portfolio turnover rate | | | 89% | | | | 112% | | | | 91% | | | | 94% | | | | 89% | |
| (a) | Calculated based on average shares outstanding during the year. |
| (b) | Total return does not consider the effects of sales loads. Total return is calculated assuming a purchase of a share on the first day and a sale on the last day of each year reported and includes reinvestment of dividends and distributions, if any. Total return may reflect adjustments to conform to generally accepted accounting principles. |
| (c) | Does not include the expenses of the underlying funds in which the Fund invests. |
See Notes to Financial Statements.
| | | | |
| Prudential QMA Large-Cap Core Equity Fund | | | 41 | |
Financial Highlights (continued)
| | | | | | | | | | | | | | | | | | | | |
| Class B Shares | |
| | | Year Ended October 31, | |
| | | 2016 | | | 2015 | | | 2014 | | | 2013 | | | 2012 | |
| Per Share Operating Performance(a): | | | | | | | | | | | | | | | | | | | | |
| Net Asset Value, Beginning of Year | | | $14.75 | | | | $15.43 | | | | $14.29 | | | | $11.96 | | | | $11.20 | |
| Income (loss) from investment operations: | | | | | | | | | | | | | | | | | | | | |
| Net investment income (loss) | | | .03 | | | | .02 | | | | - | (d) | | | .03 | | | | .03 | |
| Net realized and unrealized gain (loss) on investment transactions | | | .27 | | | | .51 | | | | 2.29 | | | | 2.84 | | | | 1.55 | |
| Total from investment operations | | | .30 | | | | .53 | | | | 2.29 | | | | 2.87 | | | | 1.58 | |
| Less Dividends and Distributions: | | | | | | | | | | | | | | | | | | | | |
| Dividends from net investment income | | | (.03 | ) | | | - | (d) | | | (.03 | ) | | | (.05 | ) | | | (.03 | ) |
| Distributions from net realized gains | | | (.72 | ) | | | (1.21 | ) | | | (1.12 | ) | | | (.49 | ) | | | (.79 | ) |
| Total dividends and distributions | | | (.75 | ) | | | (1.21 | ) | | | (1.15 | ) | | | (.54 | ) | | | (.82 | ) |
| Net asset value, end of year | | | $14.30 | | | | $14.75 | | | | $15.43 | | | | $14.29 | | | | $11.96 | |
| Total Return(b): | | | 2.31% | | | | 3.42% | | | | 17.16% | | | | 25.02% | | | | 15.29% | |
| |
| Ratios/Supplemental Data: | |
| Net assets, end of year (000) | | | $2,132 | | | | $2,676 | | | | $3,052 | | | | $3,275 | | | | $3,029 | |
| Average net assets (000) | | | $2,348 | | | | $3,018 | | | | $3,150 | | | | $3,085 | | | | $3,496 | |
| Ratios to average net assets(c): | | | | | | | | | | | | | | | | | | | | |
| Expenses after waivers and/or expense reimbursement | | | 1.92% | | | | 1.89% | | | | 1.91% | | | | 1.95% | | | | 1.95% | |
| Expenses before waivers and/or expense reimbursement | | | 1.92% | | | | 1.89% | | | | 1.91% | | | | 2.00% | | | | 2.11% | |
| Net investment income (loss) | | | .19% | | | | .15% | | | | - | (e) | | | .25% | | | | .22% | |
| Portfolio turnover rate | | | 89% | | | | 112% | | | | 91% | | | | 94% | | | | 89% | |
| (a) | Calculated based on average shares outstanding during the year. |
| (b) | Total return does not consider the effects of sales loads. Total return is calculated assuming a purchase of a share on the first day and a sale on the last day of each year reported and includes reinvestment of dividends and distributions, if any. Total return may reflect adjustments to conform to generally accepted accounting principles. |
| (c) | Does not include the expenses of the underlying funds in which the Fund invests. |
| (d) | Less than $.005 per share. |
See Notes to Financial Statements.
| | | | | | | | | | | | | | | | | | | | |
| Class C Shares | |
| | | Year Ended October 31, | |
| | | 2016 | | | 2015 | | | 2014 | | | 2013 | | | 2012 | |
| Per Share Operating Performance(a): | | | | | | | | | | | | | | | | | | | | |
| Net Asset Value, Beginning of Year | | | $14.77 | | | | $15.45 | | | | $14.30 | | | | $11.97 | | | | $11.21 | |
| Income (loss) from investment operations: | | | | | | | | | | | | | | | | | | | | |
| Net investment income (loss) | | | .02 | | | | .02 | | | | - | (d) | | | .03 | | | | .02 | |
| Net realized and unrealized gain (loss) on investment transactions | | | .27 | | | | .51 | | | | 2.30 | | | | 2.84 | | | | 1.56 | |
| Total from investment operations | | | .29 | | | | .53 | | | | 2.30 | | | | 2.87 | | | | 1.58 | |
| Less Dividends and Distributions: | | | | | | | | | | | | | | | | | | | | |
| Dividends from net investment income | | | (.03 | ) | | | - | (d) | | | (.03 | ) | | | (.05 | ) | | | (.03 | ) |
| Distributions from net realized gains | | | (.72 | ) | | | (1.21 | ) | | | (1.12 | ) | | | (.49 | ) | | | (.79 | ) |
| Total dividends and distributions | | | (.75 | ) | | | (1.21 | ) | | | (1.15 | ) | | | (.54 | ) | | | (.82 | ) |
| Net asset value, end of year | | | $14.31 | | | | $14.77 | | | | $15.45 | | | | $14.30 | | | | $11.97 | |
| Total Return(b): | | | 2.24% | | | | 3.42% | | | | 17.21% | | | | 24.99% | | | | 15.28% | |
| |
| Ratios/Supplemental Data: | |
| Net assets, end of year (000) | | | $39,218 | | | | $38,919 | | | | $37,681 | | | | $32,128 | | | | $20,134 | |
| Average net assets (000) | | | $38,344 | | | | $38,738 | | | | $35,817 | | | | $23,702 | | | | $20,445 | |
| Ratios to average net assets(c): | | | | | | | | | | | | | | | | | | | | |
| Expenses after waivers and/or expense reimbursement | | | 1.92% | | | | 1.89% | | | | 1.91% | | | | 1.95% | | | | 1.95% | |
| Expenses before waivers and/or expense reimbursement | | | 1.92% | | | | 1.89% | | | | 1.91% | | | | 2.00% | | | | 2.10% | |
| Net investment income (loss) | | | .16% | | | | .14% | | | | (.01 | )% | | | .20% | | | | .20% | |
| Portfolio turnover rate | | | 89% | | | | 112% | | | | 91% | | | | 94% | | | | 89% | |
| (a) | Calculated based on average shares outstanding during the year. |
| (b) | Total return does not consider the effects of sales loads. Total return is calculated assuming a purchase of a share on the first day and a sale on the last day of each year reported and includes reinvestment of dividends and distributions, if any. Total return may reflect adjustments to conform to generally accepted accounting principles. |
| (c) | Does not include the expenses of the underlying funds in which the Fund invests. |
| (d) | Less than $.005 per share. |
See Notes to Financial Statements.
| | | | |
| Prudential QMA Large-Cap Core Equity Fund | | | 43 | |
Financial Highlights (continued)
| | | | | | | | | | | | | | | | | | | | |
| Class Z Shares | |
| | | Year Ended October 31, | |
| | | 2016 | | | 2015 | | | 2014 | | | 2013 | | | 2012 | |
| Per Share Operating Performance(a): | | | | | | | | | | | | | | | | | | | | |
| Net Asset Value, Beginning of Year | | | $16.24 | | | | $16.86 | | | | $15.49 | | | | $12.91 | | | | $12.03 | |
| Income (loss) from investment operations: | | | | | | | | | | | | | | | | | | | | |
| Net investment income (loss) | | | .18 | | | | .18 | | | | .16 | | | | .17 | | | | .15 | |
| Net realized and unrealized gain (loss) on investment transactions | | | .31 | | | | .55 | | | | 2.49 | | | | 3.06 | | | | 1.67 | |
| Total from investment operations | | | .49 | | | | .73 | | | | 2.65 | | | | 3.23 | | | | 1.82 | |
| Less Dividends and Distributions: | | | | | | | | | | | | | | | | | | | | |
| Dividends from net investment income | | | (.18 | ) | | | (.14 | ) | | | (.16 | ) | | | (.16 | ) | | | (.15 | ) |
| Distributions from net realized gains | | | (.72 | ) | | | (1.21 | ) | | | (1.12 | ) | | | (.49 | ) | | | (.79 | ) |
| Total dividends and distributions | | | (.90 | ) | | | (1.35 | ) | | | (1.28 | ) | | | (.65 | ) | | | (.94 | ) |
| Net asset value, end of year | | | $15.83 | | | | $16.24 | | | | $16.86 | | | | $15.49 | | | | $12.91 | |
| Total Return(b): | | | 3.35% | | | | 4.41% | | | | 18.39% | | | | 26.28% | | | | 16.41% | |
| |
| Ratios/Supplemental Data: | |
| Net assets, end of year (000) | | | $71,506 | | | | $80,096 | | | | $42,134 | | | | $34,851 | | | | $34,551 | |
| Average net assets (000) | | | $75,803 | | | | $57,677 | | | | $38,052 | | | | $37,799 | | | | $32,953 | |
| Ratios to average net assets(c): | | | | | | | | | | | | | | | | | | | | |
| Expenses after waivers and/or expense reimbursement | | | .92% | | | | .89% | | | | .91% | | | | .95% | | | | .95% | |
| Expenses before waivers and/or expense reimbursement | | | .92% | | | | .89% | | | | .91% | | | | 1.00% | | | | 1.10% | |
| Net investment income (loss) | | | 1.18% | | | | 1.12% | | | | .99% | | | | 1.25% | | | | 1.21% | |
| Portfolio turnover rate | | | 89% | | | | 112% | | | | 91% | | | | 94% | | | | 89% | |
| (a) | Calculated based on average shares outstanding during the year. |
| (b) | Total return is calculated assuming a purchase of a share on the first day and a sale on the last day of each year reported and includes reinvestment of dividends and distributions, if any. Total returns may reflect adjustments to conform to generally accepted accounting principles. |
| (c) | Does not include the expenses of the underlying funds in which the Fund invests. |
See Notes to Financial Statements.
Report of Independent Registered Public Accounting Firm
The Board of Trustees and Shareholders
Prudential Investment Portfolios 9:
We have audited the accompanying statement of assets and liabilities of Prudential QMA Large-Cap Core Equity Fund, one of the series constituting Prudential Investment Portfolios 9 (hereafter referred to as the “Fund”), including the portfolio of investments, as of October 31, 2016, and the related statement of operations for the year then ended, the statements of changes in net assets for each of the years in the two-year period then ended, and the financial highlights for each of the years in the five-year period then ended. These financial statements and financial highlights are the responsibility of the Fund’s management. Our responsibility is to express an opinion on these financial statements and financial highlights based on our audits.
We conducted our audits in accordance with the standards of the Public Company Accounting Oversight Board (United States). Those standards require that we plan and perform the audit to obtain reasonable assurance about whether the financial statements and financial highlights are free of material misstatement. An audit includes examining, on a test basis, evidence supporting the amounts and disclosures in the financial statements. Our procedures included confirmation of securities owned as of October 31, 2016, by correspondence with the custodian, transfer agent and brokers or by other appropriate auditing procedures when replies from brokers were not received. An audit also includes assessing the accounting principles used and significant estimates made by management, as well as evaluating the overall financial statement presentation. We believe that our audits provide a reasonable basis for our opinion.
In our opinion, the financial statements and financial highlights referred to above present fairly, in all material respects, the financial position of the Fund as of October 31, 2016, and the results of its operations for the year then ended, the changes in its net assets for each of the years in the two-year period then ended, and the financial highlights for each of the years in the five-year period then ended, in conformity with U.S. generally accepted accounting principles.

New York, New York
December 15, 2016
| | | | |
| Prudential QMA Large-Cap Core Equity Fund | | | 45 | |
Federal Income Tax Information (unaudited)
We are advising you that during the fiscal year ended October 31, 2016, the Fund reports the maximum amount allowed per share but not less than $0.72 for Class A, B, C and Z shares as a capital gain distribution in accordance with Section 852(b)(3)(C) of the Internal Revenue Code.
For the year ended October 31, 2016, the Fund reports the maximum amount allowable under Section 854 of the Internal Revenue Code, but not less than, the following percentages of the ordinary income dividends paid as 1) qualified dividend income (QDI); and 2) eligible for corporate dividends received deduction (DRD):
| | | | | | | | |
| | | QDI | | | DRD | |
Prudential QMA Large-Cap Core Equity Fund | | | 98.50 | % | | | 93.90 | % |
In January 2017, you will be advised on IRS Form 1099-DIV or substitute 1099-DIV, as to the federal tax status of dividends and distributions received by you in calendar year 2016.
INFORMATION ABOUT BOARD MEMBERS AND OFFICERS
(Unaudited)
Information about Board Members and Officers of the Fund is set forth below. Board Members who are not deemed to be “interested persons” of the Fund, as defined in the 1940 Act, are referred to as “Independent Board Members.” Board Members who are deemed to be “interested persons” of the Fund are referred to as “Interested Board Members.” The Board Members are responsible for the overall supervision of the operations of the Fund and perform the various duties imposed on the directors of investment companies by the 1940 Act. The Board in turn elects the Officers, who are responsible for administering the day-to-day operations of the Fund.
| | | | |
| Independent Board Members(1) |
Name, Address, Age Position(s) Portfolios Overseen | | Principal Occupation(s) During Past Five Years | | Other Directorships Held During Past Five Years |
Ellen S. Alberding (58) Board Member Portfolios Overseen: 89 | | President and Board Member, The Joyce Foundation (charitable foundation) (since 2002); Vice Chair, City Colleges of Chicago (community college system) (since 2011); Trustee, Skills for America’s Future (national initiative to connect employers to community colleges) (since 2011); Trustee, National Park Foundation (charitable foundation for national park system) (since 2009); Trustee, Economic Club of Chicago (since 2009). | | None. |
Kevin J. Bannon (64) Board Member Portfolios Overseen: 89 | | Managing Director (April 2008-May 2015) and Chief Investment Officer (October 2008-November 2013) of Highmount Capital LLC (registered investment adviser); formerly Executive Vice President and Chief Investment Officer (April 1993-August 2007) of Bank of New York Company; President (May 2003-May 2007) of BNY Hamilton Family of Mutual Funds. | | Director of Urstadt Biddle Properties (equity real estate investment trust) (since September 2008). |
Linda W. Bynoe (64) Board Member Portfolios Overseen: 89 | | President and Chief Executive Officer (since March 1995) and formerly Chief Operating Officer (December 1989-February 1995) of Telemat Ltd. (management consulting); formerly Vice President (January 1985-June 1989) at Morgan Stanley & Co. (broker-dealer). | | Director of Simon Property Group, Inc. (retail real estate) (May 2003-May 2012); Director of Anixter International, Inc. (communication products distributor) (since January 2006); Director of Northern Trust Corporation (financial services) (since April 2006); Trustee of Equity Residential (residential real estate) (since December 2009). |
Prudential QMA Large-Cap Core Equity Fund
| | | | |
| Independent Board Members(1) |
Name, Address, Age Position(s) Portfolios Overseen | | Principal Occupation(s) During Past Five Years | | Other Directorships Held During Past Five Years |
Keith F. Hartstein (60) Board Member Portfolios Overseen: 89 | | Retired; Member (since November 2014) of the Governing Council of the Independent Directors Council (organization of independent mutual fund directors); formerly President and Chief Executive Officer (2005-2012), Senior Vice President
(2004-2005), Senior Vice President of Sales and Marketing (1997-2004), and various executive management positions (1990-1997), John Hancock Funds, LLC (asset management); Chairman, Investment Company Institute’s Sales Force Marketing Committee (2003-2008). | | None. |
Michael S. Hyland, CFA (71) Board Member Portfolios Overseen: 89 | | Retired (since February 2005); formerly Senior Managing Director (July 2001-February 2005) of Bear Stearns & Co, Inc.; Global Partner, INVESCO (1999-2001); Managing Director and President of Salomon Brothers Asset Management (1989-1999). | | None. |
Richard A. Redeker (73) Board Member & Independent Chair Portfolios Overseen: 89 | | Retired Mutual Fund Senior Executive (47 years); Management Consultant; Director, Mutual Fund Directors Forum (since 2014); Independent Directors Council (organization of independent mutual fund directors)-Executive Committee, Chair of Policy Steering Committee, Governing Council. | | None. |
Stephen G. Stoneburn (73) Board Member Portfolios Overseen: 89 | | Chairman (since July 2011), President and Chief Executive Officer (since June 1996) of Quadrant Media Corp. (publishing company); formerly President (June 1995-June 1996) of Argus Integrated Media, Inc.; Senior Vice President and Managing Director (January 1993-1995) of Cowles Business Media; Senior Vice President of Fairchild Publications, Inc. (1975-1989). | | None. |
Visit our website at prudentialfunds.com
| | | | |
| Interested Board Members(1) |
Name, Address, Age Position(s) Portfolios Overseen | | Principal Occupation(s) During Past Five Years | | Other Directorships Held During Past Five Years |
Stuart S. Parker (54) Board Member & President Portfolios Overseen: 89 | | President of Prudential Investments LLC (since January 2012); Executive Vice President of Prudential Investment Management Services LLC (since December 2012); Executive Vice President of Jennison Associates LLC and Head of Retail Distribution of Prudential Investments LLC (June 2005-December 2011). | | None. |
Scott E. Benjamin (43) Board Member & Vice President Portfolios Overseen: 89 | | Executive Vice President (since June 2009) of Prudential Investments LLC; Executive Vice President (June 2009-June 2012) and Vice President (since June 2012) of Prudential Investment Management Services LLC; Executive Vice President (since September 2009) of AST Investment Services, Inc.; Senior Vice President of Product Development and Marketing, Prudential Investments (since February 2006); Vice President of Product Development and Product Management, Prudential Investments (2003-2006). | | None. |
Grace C. Torres* (57) Board Member Portfolios Overseen: 87 | | Retired; formerly Treasurer and Principal Financial and Accounting Officer of the Prudential Investments Funds, Target Funds, Advanced Series Trust, Prudential Variable Contract Accounts and The Prudential Series Fund (1998-June 2014); Assistant Treasurer (March 1999-June 2014) and Senior Vice President (September 1999-June 2014) of Prudential Investments LLC; Assistant Treasurer (May 2003-June 2014) and Vice President (June 2005-June 2014) of AST Investment Services, Inc.; Senior Vice President and Assistant Treasurer (May 2003-June 2014) of Prudential Annuities Advisory Services, Inc. | | Director (since July 2015) of Sun Bancorp, Inc. N.A. |
| * | Note: Prior to her retirement in 2014, Ms. Torres was employed by Prudential Investments LLC. Due to her prior employment, she is considered to be an “interested person” under the 1940 Act. Ms. Torres is a Non-Management Interested Board Member. |
| (1) | The year that each individual joined the Board is as follows: |
Ellen S. Alberding, 2013; Linda W. Bynoe, 2005; Richard A. Redeker, 1998; Stephen G. Stoneburn, 2003; Kevin J. Bannon, 2008; Keith F. Hartstein, 2013; Michael S. Hyland, 2008; Stuart S. Parker, Board Member since 2012 and President since 2012; Scott E. Benjamin, Board Member since 2010 and Vice President since 2009; Grace C. Torres, 2014.
Prudential QMA Large-Cap Core Equity Fund
| | | | |
| Fund Officers(a) |
Name, Address and Age Position with Fund | | Principal Occupation(s) During Past Five Years | | Length of Service as Fund Officer |
Raymond A. O’Hara (61) Chief Legal Officer | | Vice President and Corporate Counsel (since July 2010) of Prudential Insurance Company of America (Prudential); Vice President (March 2011-Present) of Pruco Life Insurance Company and Pruco Life Insurance Company of New Jersey; Vice President and Corporate Counsel (March 2011-Present) of Prudential Annuities Life Assurance Corporation; Chief Legal Officer of Prudential Investments LLC (since June 2012); Chief Legal Officer of Prudential Mutual Fund Services LLC (since June 2012) and Corporate Counsel of AST Investment Services, Inc. (since June 2012); formerly Assistant Vice President and Corporate Counsel (September 2008-July 2010) of The Hartford Financial Services Group, Inc.; formerly Associate (September 1980-December 1987) and Partner (January 1988–August 2008) of Blazzard & Hasenauer, P.C. (formerly, Blazzard, Grodd & Hasenauer, P.C.). | | Since 2012 |
Chad A. Earnst (41) Chief Compliance Officer | | Chief Compliance Officer (September 2014-Present) of Prudential Investments LLC; Chief Compliance Officer (September 2014-Present) of the Prudential Investments Funds, Target Funds, Advanced Series Trust, The Prudential Series Fund, Prudential’s Gibraltar Fund, Inc., Prudential Global Short Duration High Yield Income Fund, Inc., Prudential Short Duration High Yield Fund, Inc. and Prudential Jennison MLP Income Fund, Inc.; formerly Assistant Director (March 2010-August 2014) of the Asset Management Unit, Division of Enforcement, US Securities & Exchange Commission; Assistant Regional Director (January 2010-August 2014), Branch Chief (June 2006–December 2009) and Senior Counsel (April 2003-May 2006) of the Miami Regional Office, Division of Enforcement, US Securities & Exchange Commission. | | Since 2014 |
Deborah A. Docs (58) Secretary | | Vice President and Corporate Counsel (since January 2001) of Prudential; Vice President (since December 1996) and Assistant Secretary (since March 1999) of Prudential Investments LLC; formerly Vice President and Assistant Secretary (May 2003-June 2005) of AST Investment Services, Inc. | | Since 2004 |
Jonathan D. Shain (58) Assistant Secretary | | Vice President and Corporate Counsel (since August 1998) of Prudential; Vice President and Assistant Secretary (since May 2001) of Prudential Investments LLC; Vice President and Assistant Secretary (since February 2001) of Prudential Mutual Fund Services LLC; formerly Vice President and Assistant Secretary (May 2003-June 2005) of AST Investment Services, Inc. | | Since 2005 |
Visit our website at prudentialfunds.com
| | | | |
| Fund Officers(a) |
Name, Address and Age Position with Fund | | Principal Occupation(s) During Past Five Years | | Length of Service as Fund Officer |
Claudia DiGiacomo (42) Assistant Secretary | | Vice President and Corporate Counsel (since January 2005) of Prudential; Vice President and Assistant Secretary of Prudential Investments LLC (since December 2005); Associate at Sidley Austin Brown & Wood LLP (1999-2004). | | Since 2005 |
Andrew R. French (54) Assistant Secretary | | Vice President and Corporate Counsel (since February 2010) of Prudential; formerly Director and Corporate Counsel (2006-2010) of Prudential; Vice President and Assistant Secretary (since January 2007) of Prudential Investments LLC; Vice President and Assistant Secretary (since January 2007) of Prudential Mutual Fund Services LLC. | | Since 2006 |
Theresa C. Thompson (54) Deputy Chief Compliance Officer | | Vice President, Compliance, Prudential Investments LLC (since April 2004); and Director, Compliance, Prudential Investments LLC (2001-2004). | | Since 2008 |
Charles H. Smith (43) Anti-Money Laundering Compliance Officer | | Vice President, Corporate Compliance, Anti-Money Laundering Unit (since January 2015) of Prudential; committee member of the American Council of Life Insurers Anti-Money Laundering and Critical Infrastructure Committee (since January 2016); formerly Global Head of Economic Sanctions Compliance at AIG Property Casualty (February 2007–December 2014); Assistant Attorney General at the New York State Attorney General’s Office, Division of Public Advocacy. (August 1998—January 2007). | | Since 2016 |
M. Sadiq Peshimam (52) Treasurer and Principal Financial and Accounting Officer | | Vice President (since 2005) of Prudential Investments LLC; formerly Assistant Treasurer of funds in the Prudential Mutual Fund Complex (2006-2014). | | Since 2006 |
Peter Parrella (58) Assistant Treasurer | | Vice President (since 2007) and Director (2004-2007) within Prudential Mutual Fund Administration; formerly Tax Manager at SSB Citi Fund Management LLC (1997-2004). | | Since 2007 |
Lana Lomuti (49) Assistant Treasurer | | Vice President (since 2007) and Director (2005-2007), within Prudential Mutual Fund Administration; formerly Assistant Treasurer (December 2007-February 2014) of The Greater China Fund, Inc. | | Since 2014 |
Linda McMullin (55) Assistant Treasurer | | Vice President (since 2011) and Director (2008-2011) within Prudential Mutual Fund Administration. | | Since 2014 |
Kelly A. Coyne (48) Assistant Treasurer | | Director, Investment Operations of Prudential Mutual Fund Services LLC (since 2010). | | Since 2015 |
Prudential QMA Large-Cap Core Equity Fund
| (a) | Excludes Mr. Parker and Mr. Benjamin, interested Board Members who also serve as President and Vice President, respectively. |
Explanatory Notes to Tables:
| • | | Board Members are deemed to be “Interested,” as defined in the 1940 Act, by reason of their affiliation with Prudential Investments LLC and/or an affiliate of Prudential Investments LLC. |
| • | | Unless otherwise noted, the address of all Board Members and Officers is c/o Prudential Investments LLC, 655 Broad Street, Newark, New Jersey 07102-4410. |
| • | | There is no set term of office for Board Members or Officers. The Board Members have adopted a retirement policy, which calls for the retirement of Board Members on December 31 of the year in which they reach the age of 75. |
| • | | “Other Directorships Held” includes only directorships of companies required to register or file reports with the SEC under the 1934 Act (that is, “public companies”) or other investment companies registered under the 1940 Act. |
| • | | “Portfolios Overseen” includes all investment companies managed by Prudential Investments LLC. The investment companies for which Prudential Investments LLC serves as manager include the Prudential Investments Mutual Funds, The Prudential Variable Contract Accounts, Target Mutual Funds, Prudential Short Duration High Yield Fund, Inc., Prudential Global Short Duration High Yield Fund, Inc., The Prudential Series Fund, Prudential’s Gibraltar Fund, Inc. and the Advanced Series Trust. |
Visit our website at prudentialfunds.com
Approval of Advisory Agreements (unaudited)
The Fund’s Board of Trustees
The Board of Trustees (the “Board”) of Prudential QMA Large-Cap Core Equity Fund (the “Fund”)1 consists of ten individuals, seven of whom are not “interested persons” of the Fund, as defined in the Investment Company Act of 1940, as amended (the “1940 Act”) (the “Independent Trustees”). The Board is responsible for the oversight of the Fund and its operations, and performs the various duties imposed on the directors of investment companies by the 1940 Act. The Independent Trustees have retained independent legal counsel to assist them in connection with their duties. The Chair of the Board is an Independent Trustee. The Board has established three standing committees: the Audit Committee, the Nominating and Governance Committee, and the Investment Committee. Each committee is chaired by, and composed of, Independent Trustees.
Annual Approval of the Fund’s Advisory Agreements
As required under the 1940 Act, the Board determines annually whether to renew the Fund’s management agreement with Prudential Investments LLC (“PI”) and the Fund’s subadvisory agreement with Quantitative Management Associates LLC (“QMA”). In considering the renewal of the agreements, the Board, including all of the Independent Trustees, met on June 7-9, 2016 and approved the renewal of the agreements through July 31, 2017, after concluding that the renewal of the agreements was in the best interests of the Fund and its shareholders.
In advance of the meetings, the Board received materials relating to the agreements, and had the opportunity to ask questions and request further information in connection with its consideration. Among other things, the Board considered comparative fee information from PI and QMA. Also, the Board considered comparisons with other mutual funds in relevant Peer Universes and Peer Groups, as is further discussed below.
In approving the agreements, the Board, including the Independent Trustees advised by independent legal counsel, considered the factors it deemed relevant, including the nature, quality and extent of services provided by PI and the subadviser, the performance of the Fund, the profitability of PI and its affiliates, expenses and fees, and the potential for economies of scale that may be shared with the Fund and its shareholders as the Fund’s assets grow. In their deliberations, the Trustees did not identify any single factor which alone was responsible for the Board’s decision to approve the agreements with respect to the Fund. In connection with its deliberations, the Board considered information provided by PI throughout the year at regular Board meetings, presentations from portfolio managers and other information, as well as information furnished at or in advance of the meetings on June 7-9, 2016.
| 1 | Prudential QMA Large-Cap Core Equity Fund is a series of Prudential Investment Portfolios 9. |
| | |
| Prudential QMA Large-Cap Core Equity Fund |
Approval of Advisory Agreements (continued)
The Trustees determined that the overall arrangements between the Fund and PI, which serves as the Fund’s investment manager pursuant to a management agreement, and between PI and QMA, which serves as the Fund’s subadviser pursuant to the terms of a subadvisory agreement with PI, are in the best interests of the Fund and its shareholders in light of the services performed, fees charged and such other matters as the Trustees considered relevant in the exercise of their business judgment.
The material factors and conclusions that formed the basis for the Trustees’ reaching their determinations to approve the continuance of the agreements are separately discussed below.
Nature, Quality, and Extent of Services
The Board received and considered information regarding the nature, quality and extent of services provided to the Fund by PI and QMA. The Board considered the services provided by PI, including but not limited to the oversight of the subadviser for the Fund, as well as the provision of fund recordkeeping, compliance, and other services to the Fund. With respect to PI’s oversight of the subadviser, the Board noted that PI’s Strategic Investment Research Group (“SIRG”), which is a business unit of PI, is responsible for monitoring and reporting to PI’s senior management on the performance and operations of the subadviser. The Board also considered that PI pays the salaries of all of the officers and interested Trustees of the Fund who are part of Fund management. The Board also considered the investment subadvisory services provided by QMA, as well as adherence to the Fund’s investment restrictions and compliance with applicable Fund policies and procedures. The Board considered PI’s evaluation of the subadviser, as well as PI’s recommendation, based on its review of the subadviser, to renew the subadvisory agreement.
The Board considered the qualifications, backgrounds and responsibilities of PI’s senior management responsible for the oversight of the Fund and QMA, and also considered the qualifications, backgrounds and responsibilities of QMA’s portfolio managers who are responsible for the day-to-day management of the Fund’s portfolio. The Board was provided with information pertaining to PI’s and QMA’s organizational structure, senior management, investment operations, and other relevant information pertaining to both PI and QMA. The Board also noted that it received favorable compliance reports from the Fund’s Chief Compliance Officer (“CCO”) as to both PI and QMA. The Board noted that QMA is affiliated with PI.
The Board concluded that it was satisfied with the nature, extent and quality of the investment management services provided by PI and the subadvisory services provided to the Fund by QMA, and that there was a reasonable basis on which to conclude that the
| | |
| Visit our website at prudentialfunds.com | | |
Fund benefits from the services provided by PI and QMA under the management and subadvisory agreements.
Costs of Services and Profits Realized by PI
The Board was provided with information on the profitability of PI and its affiliates in serving as the Fund’s investment manager. The Board discussed with PI the methodology utilized in assembling the information regarding profitability and considered its reasonableness. The Board recognized that it is difficult to make comparisons of profitability from fund management contracts because comparative information is not generally publicly available and is affected by numerous factors, including the structure of the particular adviser, the types of funds it manages, its business mix, numerous assumptions regarding allocations and the adviser’s capital structure and cost of capital. The Board further noted that the subadviser is affiliated with PI and that its profitability is reflected in PI’s profitability report. Taking these factors into account, the Board concluded that the profitability of PI and its affiliates in relation to the services rendered was not unreasonable.
Economies of Scale
PI and the Board previously retained an outside business consulting firm to review management fee breakpoint usage and trends in management fees across the mutual fund industry. The consulting firm presented its analysis and conclusions as to the Funds’ management fee structures to the Board and PI. The Board and PI have discussed these conclusions extensively since that presentation.
The Board received and discussed information concerning economies of scale that PI may realize as the Fund’s assets grow beyond current levels. The Board noted that the management fee schedule for the Fund includes breakpoints, which have the effect of decreasing the fee rate as assets increase, but that at its current level of assets the Fund did not realize the effect of those rate reductions. The Board took note that the Fund’s fee structure currently results in benefits to Fund shareholders whether or not PI realizes any economies of scale. The Board noted that economies of scale can be shared with the Fund in other ways, including low management fees from inception, additional technological and personnel investments to enhance shareholder services, and maintaining existing expense structures in the face of a rising cost environment. The Board also considered PI’s assertion that it continually evaluates the management fee schedule of the Fund and the potential to share economies of scale through breakpoints or fee waivers as asset levels increase.
The Board recognized the inherent limitations of any analysis of economies of scale, stemming largely from the Board’s understanding that most of PI’s costs are not specific to individual funds, but rather are incurred across a variety of products and services.
| | |
| Prudential QMA Large-Cap Core Equity Fund |
Approval of Advisory Agreements (continued)
Other Benefits to PI and QMA
The Board considered potential ancillary benefits that might be received by PI and QMA and their affiliates as a result of their relationship with the Fund. The Board concluded that potential benefits to be derived by PI included transfer agency fees received by the Fund’s transfer agent (which is affiliated with PI), and benefits to its reputation as well as other intangible benefits resulting from PI’s association with the Fund. The Board concluded that the potential benefits to be derived by QMA included its ability to use soft dollar credits, as well as the potential benefits consistent with those generally resulting from an increase in assets under management, specifically, potential access to additional research resources and benefits to its reputation. The Board concluded that the benefits derived by PI and QMA were consistent with the types of benefits generally derived by investment managers and subadvisers to mutual funds.
Performance of the Fund / Fees and Expenses
The Board considered certain additional specific factors and made related conclusions relating to the historical performance of the Fund for the one-, three-, five-, and ten-year periods ended December 31, 2015.
The Board also considered the Fund’s actual management fee, as well as the Fund’s net total expense ratio, for the fiscal year ended October 31, 2015. The Board considered the management fee for the Fund as compared to the management fee charged by PI to other funds and the fee charged by other advisers to comparable mutual funds in a Peer Group. The actual management fee represents the fee rate actually paid by Fund shareholders and includes any fee waivers or reimbursements. The net total expense ratio for the Fund represents the actual expense ratio incurred by Fund shareholders.
The mutual funds included in the Peer Universe (the Lipper Large-Cap Core Funds Performance Universe) and the Peer Group were objectively determined by Broadridge, an independent provider of mutual fund data. The comparisons placed the Fund in various quartiles, with the first quartile being the best 25% of the mutual funds (for performance, the best performing mutual funds and, for expenses, the lowest cost mutual funds).
The section below summarizes key factors considered by the Board and the Board’s conclusions regarding the Fund’s performance, fees and overall expenses. The table sets forth gross performance comparisons (which do not reflect the impact on performance of fund expenses, or any subsidies, expense caps or waivers that may be applicable) with the Peer Universe, actual management fees with the Peer Group (which reflect the impact of
| | |
| Visit our website at prudentialfunds.com | | |
any subsidies or fee waivers), and net total expenses with the Peer Group, each of which were key factors considered by the Board.
| | | | | | | | |
| Performance | | 1 Year | | 3 Years | | 5 Years | | 10 Years |
| | | 2nd Quartile | | 1st Quartile | | 1st Quartile | | 2nd Quartile |
| Actual Management Fees: 2nd Quartile |
| Net Total Expenses: 2nd Quartile |
| | • | | The Board noted that the Fund outperformed its benchmark index over the three-year, five-year, and ten-year periods, although it underperformed over the one-year period. |
| | • | | The Board concluded that, in light of the above, it would be in the best interests of the Fund and its shareholders to renew the agreements. |
| | • | | The Board concluded that the management fees (including subadvisory fees) and total expenses were reasonable in light of the services provided. |
* * *
After full consideration of these factors, the Board concluded that the approval of the agreements was in the best interests of the Fund and its shareholders.
| | |
| Prudential QMA Large-Cap Core Equity Fund |
| | | | |
| ∎ MAIL | | ∎ TELEPHONE | | ∎ WEBSITE |
655 Broad Street Newark, NJ 07102 | | (800) 225-1852 | | www.prudentialfunds.com |
|
| PROXY VOTING |
| The Board of Trustees of the Fund has delegated to the Fund’s investment subadviser the responsibility for voting any proxies and maintaining proxy recordkeeping with respect to the Fund. A description of these proxy voting policies and procedures is available without charge, upon request, by calling (800) 225-1852 or by visiting the Securities and Exchange Commission’s website at www.sec.gov. Information regarding how the Fund voted proxies relating to portfolio securities during the most recent 12-month period ended June 30 is available on the Fund’s website and on the Securities and Exchange Commission’s website. |
|
| TRUSTEES |
| Ellen S. Alberding • Kevin J. Bannon • Scott E. Benjamin • Linda W. Bynoe • Keith F. Hartstein • Michael S. Hyland • Stuart S. Parker • Richard A. Redeker • Stephen G. Stoneburn • Grace C. Torres |
|
| OFFICERS |
| Stuart S. Parker, President • Scott E. Benjamin, Vice President • M. Sadiq Peshimam, Treasurer and Principal Financial and Accounting Officer • Raymond A. O’Hara, Chief Legal Officer • Deborah A. Docs, Secretary • Chad A. Earnst, Chief Compliance Officer • Theresa C. Thompson, Deputy Chief Compliance Officer • Charles H. Smith, Anti-Money Laundering Compliance Officer • Jonathan D. Shain, Assistant Secretary • Claudia DiGiacomo, Assistant Secretary • Andrew R. French, Assistant Secretary • Peter Parrella, Assistant Treasurer • Lana Lomuti, Assistant Treasurer • Linda McMullin, Assistant Treasurer • Kelly A. Coyne, Assistant Treasurer |
| | | | |
| MANAGER | | Prudential Investments LLC | | 655 Broad Street Newark, NJ 07102 |
|
| INVESTMENT SUBADVISER | | Quantitative Management Associates LLC | | Gateway Center Two
100 Mulberry Street
Newark, NJ 07102 |
|
| DISTRIBUTOR | | Prudential Investment
Management Services LLC | | 655 Broad Street Newark, NJ 07102 |
|
| CUSTODIAN | | The Bank of New York Mellon | | One Wall Street
New York, NY 10286 |
|
| TRANSFER AGENT | | Prudential Mutual Fund
Services LLC | | PO Box 9658
Providence, RI 02940 |
|
INDEPENDENT REGISTERED
PUBLIC ACCOUNTING FIRM | | KPMG LLP | | 345 Park Avenue
New York, NY 10154 |
|
| FUND COUNSEL | | Willkie Farr & Gallagher LLP | | 787 Seventh Avenue
New York, NY 10019 |
|
|
| An investor should consider the investment objectives, risks, charges, and expenses of the Fund carefully before investing. The prospectus and summary prospectus contain this and other information about the Fund. An investor may obtain a prospectus and summary prospectus by visiting our website at www.prudentialfunds.com or by calling (800) 225-1852. The prospectus and summary prospectus should be read carefully before investing. |
|
| E-DELIVERY |
| To receive your mutual fund documents online, go to www.prudentialfunds.com/edelivery and enroll. Instead of receiving printed documents by mail, you will receive notification via email when new materials are available. You can cancel your enrollment or change your email address at any time by visiting the website address above. |
|
| SHAREHOLDER COMMUNICATIONS WITH TRUSTEES |
| Shareholders can communicate directly with the Board of Trustees by writing to the Chair of the Board, Prudential QMA Large-Cap Core Equity Fund, Prudential Investments, Attn: Board of Trustees, 655 Broad Street, Newark, NJ 07102. Shareholders can communicate directly with an individual Trustee by writing to the same address. Communications are not screened before being delivered to the addressee. |
|
| AVAILABILITY OF PORTFOLIO SCHEDULE |
| The Fund files its complete schedule of portfolio holdings with the Securities and Exchange Commission for the first and third quarters of each fiscal year on Form N-Q. The Fund’s Forms N-Q are available on the Commission’s website at www.sec.gov. The Fund’s Forms N-Q may also be reviewed and copied at the Commission’s Public Reference Room in Washington, D.C. Information on the operation and location of the Public Reference Room may be obtained by calling (202) 551-8090. The Fund’s schedule of portfolio holdings is also available on the Fund’s website as of the end of each month no sooner than 15 days after the end of the month. |
|
| The Fund’s Statement of Additional Information contains additional information about the Fund’s Trustees and is available without charge, upon request, by calling (800) 225-1852. |
Mutual Funds:
| | | | |
ARE NOT INSURED BY THE FDIC OR ANY
FEDERAL GOVERNMENT AGENCY | | MAY LOSE VALUE | | ARE NOT A DEPOSIT OF OR GUARANTEED
BY ANY BANK OR ANY BANK AFFILIATE |
PRUDENTIAL QMA LARGE-CAP CORE EQUITY FUND
| | | | | | | | |
| SHARE CLASS | | A | | B | | C | | Z |
| NASDAQ | | PTMAX | | PTMBX | | PTMCX | | PTEZX |
| CUSIP | | 74441J100 | | 74441J209 | | 74441J308 | | 74441J407 |
MF187E 0300065-00001-00
PRUDENTIAL INVESTMENTS, A PGIM BUSINESS | MUTUAL FUNDS
Prudential Real Estate Income Fund
| | |
| ANNUAL REPORT | | OCTOBER 31, 2016 |

| | |
To enroll in e-delivery, go to prudentialfunds.com/edelivery | |  |
|
| Objective: To seek income and capital appreciation |
Highlights
PRUDENTIAL REAL ESTATE INCOME FUND
| • | | Performance was strong during the reporting period. All three major regions represented in the Fund performed well for the period. |
| • | | On a regional basis, Europe performed the best. An underweight allocation to the United Kingdom and strong security selection among UK names led to strong relative performance. (For a complete list of holdings, refer to the Portfolio of Investments section of this report.) |
| • | | The largest detractors from performance were several sectors in the US. Stock selection among the specialty, office, hotel, and retail companies was weak. |
This report is not authorized for distribution to prospective investors unless preceded or accompanied by a current prospectus.
The views expressed in this report and information about the Fund’s portfolio holdings are for the period covered by this report and are subject to change thereafter.
Mutual funds are distributed by Prudential Investment Management Services LLC (PIMS), member SIPC. PGIM Real Estate is a unit of PGIM, Inc. (PGIM), a registered investment adviser. PIMS and PGIM are Prudential Financial companies. © 2016 Prudential Financial, Inc. and its related entities. The Prudential logo and the Rock symbol are service marks of Prudential Financial, Inc. and its related entities, registered in many jurisdictions worldwide.
| | |
| 2 | | Visit our website at prudentialfunds.com |
Letter from the President

Dear Shareholder:
We hope you find the annual report for the Prudential Real Estate Income Fund informative and useful. The report covers performance for the 12-month period that ended October 31, 2016.
During the reporting period, the US economy experienced modest growth.
Labor markets were healthy, and consumer confidence rose. The housing market brightened somewhat, as momentum continued for the new home market. The Federal Reserve kept interest rates unchanged at its September meeting, but pointed to the strong possibility of a rate hike in December. Internationally, concerns over Brexit—the term used to represent Britain’s decision to leave the European Union—remained in the spotlight.
Equity markets in the US were firmly in positive territory at the end of the reporting period, as US stocks posted strong gains. European stocks struggled earlier, but found some traction in the third quarter. Asian markets also advanced, and emerging markets rose sharply.
US fixed income markets experienced overall gains. High yield bonds posted very strong results. Corporate bonds and Treasuries also performed well. Accommodative monetary policy by central banks helped lift global bond markets.
Given the uncertainty in today’s investment environment, we believe that active professional portfolio management offers a potential advantage. Active managers often have the knowledge and flexibility to find the best investment opportunities in the most challenging markets.
Even so, it’s best if investment decisions are based on your long-term goals rather than on short-term market and economic developments. We also encourage you to work with an experienced financial advisor who can help you set goals, determine your tolerance for risk, build a diversified plan that’s right for you, and make adjustments when necessary.
By having Prudential Investments help you address your goals, you gain the advantage of asset managers that also manage money for many major corporations and pension funds around the world. That means you benefit from the same expertise, innovation, and attention to risk demanded by today’s most sophisticated investors.
Thank you for choosing our family of funds.
Sincerely,

Stuart S. Parker, President
Prudential Real Estate Income Fund
December 15, 2016
| | | | |
| Prudential Real Estate Income Fund | | | 3 | |
Your Fund’s Performance (unaudited)
Performance data quoted represent past performance. Past performance does not guarantee future results. The investment return and principal value of an investment will fluctuate, so that an investor’s shares, when redeemed, may be worth more or less than their original cost. Current performance may be lower or higher than the past performance data quoted. An investor may obtain performance data as of the most recent month-end by visiting our website at www.prudentialfunds.com or by calling (800) 225-1852.
| | | | | | | | | | |
| Cumulative Total Returns (Without Sales Charges) as of 10/31/16 | |
| | | | | One Year (%) | | | | Since Inception (%) | |
| Class A | | | | | 6.92 | | | | 4.19 (6/3/15) | |
| Class C | | | | | 6.22 | | | | 3.13 (6/3/15) | |
| Class Z | | | | | 7.19 | | | | 4.54 (6/3/15) | |
| Custom Blend Index | | | | | 3.37 | | | | 4.19 | |
| Lipper Global Real Estate Funds Average | | | | | 1.37 | | | | 0.65 | |
| | | | | | | | | | |
| Average Annual Total Returns (With Sales Charges) as of 9/30/16 | |
| | | | | One Year (%) | | | | Since Inception (%) | |
| Class A | | | | | 8.68 | | | | 1.21 (6/3/15) | |
| Class C | | | | | 13.29 | | | | 4.87 (6/3/15) | |
| Class Z | | | | | 15.28 | | | | 5.90 (6/3/15) | |
| Custom Blend Index | | | | | 14.10 | | | | 6.93 | |
| Lipper Global Real Estate Funds Average | | | | | 12.90 | | | | 4.72 | |
| | | | | | | | | | |
| Average Annual Total Returns (With Sales Charges) as of 10/31/16 | |
| | | | | One Year (%) | | | | Since Inception (%) | |
| Class A | | | | | 1.03 | | | | –1.09 (6/3/15) | |
| Class C | | | | | 5.22 | | | | 2.20 (6/3/15) | |
| Class Z | | | | | 7.19 | | | | 3.19 (6/3/15) | |
| | | | | | | | | | |
| Average Annual Total Returns (Without Sales Charges) as of 10/31/16 | |
| | | | | One Year (%) | | | | Since Inception (%) | |
| Class A | | | | | 6.92 | | | | 2.94 (6/3/15) | |
| Class C | | | | | 6.22 | | | | 2.20 (6/3/15) | |
| Class Z | | | | | 7.19 | | | | 3.19 (6/3/15) | |
| | |
| 4 | | Visit our website at prudentialfunds.com |
Growth of a $10,000 Investment
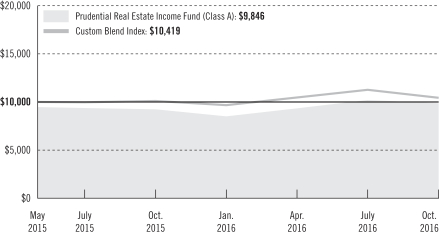
The graph compares a $10,000 investment in the Prudential Real Estate Income Fund (Class A shares) with a similar investment in the Custom Blend Index by portraying the initial account values at the commencement of operations for Class A shares (June 3, 2015) and the account values at the end of the current fiscal year (October 31, 2016) as measured on a quarterly basis. For purposes of the graph, and unless otherwise indicated, it has been assumed that (a) the maximum applicable front-end sales charge was deducted from the initial $10,000 investment in Class A shares; (b) all recurring fees (including management fees) were deducted; and (c) all dividends and distributions were reinvested. The line graph provides information for Class A shares only. As indicated in the tables provided earlier, performance for Class C and Class Z shares will vary due to the differing charges and expenses applicable to each share class (as indicated in the following paragraphs). Without waiver of fees and/or expense reimbursement, if any, the returns would have been lower.
Past performance does not predict future performance. Total returns and the ending account values in the graph include changes in share price and reinvestment of dividends and capital gains distributions in a hypothetical investment for the periods shown. The Fund’s total returns do not reflect the deduction of income taxes on an individual’s investment. Taxes may reduce your actual investment returns on income or gains paid by the Fund or any gains you may realize if you sell your shares.
Source: Prudential Investments LLC and Lipper Inc.
Inception returns are provided for any share class with less than 10 years of returns.
| | | | |
| Prudential Real Estate Income Fund | | | 5 | |
Your Fund’s Performance (continued)
The returns in the tables do not reflect the deduction of taxes that a shareholder would pay on Fund distributions or following the redemption of Fund shares. The average annual total returns take into account applicable sales charges, which are described for each share class in the table below.
| | | | | | |
| | | Class A | | Class C | | Class Z |
| Maximum initial sales charge | | 5.50% of the public offering
price | | None | | None |
| Contingent deferred sales charge (CDSC) (as a percentage of the lower of original purchase price or net asset value at redemption) | | 1% on sales of $1 million or more made within 12 months of purchase | | 1% on sales made within 12 months of purchase | | None |
| Annual distribution and service (12b-1) fees (shown as a percentage of average daily net assets) | | .30%
(.25% currently) | | 1% | | None |
Benchmark Definitions
Custom Blend Index—The Custom Blend Index is a model portfolio consisting of the FTSE EPRA/NAREIT Developed Real Estate Net Index (80%), which is an unmanaged index and reflects the stock performance of companies engaged in specific aspects of the major real estate markets/regions of the world; and the BofA Merrill Lynch 7% Constrained REIT Preferred Securities Index (20%), which is an unmanaged index that is a subset of the BofA Merrill Lynch Fixed Rate Preferred Securities Index including all REIT-issued preferred securities.
Lipper Global Real Estate Funds Average—The Lipper Global Real Estate Funds Average includes funds that invest at least 25% but less than 75% of their equity portfolios in shares of companies engaged in the real estate industry that are strictly outside of the US or whose securities are principally traded outside of the US.
Investors cannot invest directly in an index or average. The returns for the Index would be lower if they included the effects of sales charges, operating expenses of a mutual fund, or taxes. Returns for the Lipper Average reflect the deduction of operating expenses, but not sales charges or taxes.
| | |
| 6 | | Visit our website at prudentialfunds.com |
| | | | |
Five Largest Holdings expressed as a
percentage of net assets as of 10/31/16 (%) | |
| Community Healthcare Trust, Inc., Health Care REITs | | | 5.4 | |
| MedEquities Realty Trust, Inc., Health Care REITs | | | 5.0 | |
| Frasers Logistics & Industrial Trust (Singapore), Industrial REITs | | | 4.4 | |
| Care Capital Properties, Inc., Health Care REITs | | | 4.3 | |
| Cache Logistics Trust (Singapore), Industrial REITs | | | 4.2 | |
Holdings reflect only long-term investments and are subject to change.
| | | | |
Five Largest Industries expressed as a
percentage of net assets as of 10/31/16 (%) | |
| Health Care REITs | | | 23.6 | |
| Diversified REITs | | | 16.9 | |
| Retail REITs | | | 14.4 | |
| Industrial REITs | | | 14.0 | |
| Hotel & Resort REITs | | | 13.7 | |
Industry weightings reflect only long-term investments and are subject to change.
| | | | |
| Prudential Real Estate Income Fund | | | 7 | |
Strategy and Performance Overview
How did the Fund perform?
The Prudential Real Estate Income Fund’s Class A shares gained 6.92% for the 12-month reporting period ended October 31, 2016, outperforming the 3.37% return of the Customized Blend Index (the Index) and the 1.37% return of the Lipper Global Real Estate Funds Average.
What were conditions like in the global real estate securities market?
| • | | In the US, real estate investment trust (REIT) returns were primarily driven by shifting views on global economic growth, interest rates, concerns over where we are in the real estate cycle, as well as continued strong real estate fundamentals. The level of jobs growth continued to create ample real estate demand to absorb vacancies and create pricing power in most property types and markets. However, it was not so much that it created material supply additions, with the exception of apartments and select industrial and hotel markets. New supply remains well below historical averages and near historical lows at 1% of existing supply. Supply additions across property types remain well below long-term averages with the exception of multifamily, which is in line with its long-term average. REITs continued to take advantage of the availability and relatively low cost of capital. From a relative valuation perspective, certain sectors are trading at very wide discounts relative to their historical levels. |
| • | | In Europe, despite apparently large discounts to both gross and net asset value available in the UK, the Fund maintains an underweight position to the London office sector, in particular due to the still high degree of uncertainty surrounding the process of the UK’s exit from the European Union (EU) and its economic (and possibly political) consequences. The Fund continues to look for attractively valued stocks in continental Europe that will benefit from the recently expanded quantitative easing measures of the European Central Bank and signs of rental market recovery in selected continental markets that have bottomed out and are showing initial evidence of rental recovery, such as Spain and French offices. The investment market demand remains strong in Europe, from private capital in particular, exerting modest further downward pressure on capitalization rates, (the prospective rates of return on properties based on their expected income), especially in the core assets in the more liquid markets. Office markets in Dublin, Amsterdam, Paris, Frankfurt, and Berlin should benefit from the Brexit uncertainty as corporations move a portion of their London-based operations into the EU over the coming years. |
| • | | In Asia, real estate capitalization rates in the region remain compressed over the past 12 months, underpinned by a low-interest rate environment and liquidity flow from North Asia. Notwithstanding, the spread between public market implied cap rate and private real estate value continues to widen. Transactions of commercial assets remain at elevated levels, comparable to the all-time high achieved in 2015. The most robust was |
| | |
| 8 | | Visit our website at prudentialfunds.com |
| | Singapore, with volumes up over 40% while Japan was the most subdued (down less than 10%) due to absence of quality supply and peak cap rates. Chinese capital continued to pour into the Hong Kong commercial real estate market, motivated in part by concerns of further RMB devaluation. The current office stock availability in Hong Kong Central, Tokyo, and Sydney is in favor of landlords. Large new supply is expected in Tokyo and Singapore in the next 12 to 18 months and the flight to quality factor is causing some tenants in older buildings to relocate to the newer ones. In Asia Pacific, real estate market conditions remained intact post Brexit and there are no detectable changes observed after the US election. |
What worked?
| • | | Performance has been strong during the reporting period. All three major regions represented in the Fund performed well for the period. |
| • | | On a regional basis, Europe performed the best. An underweight allocation to the United Kingdom and strong security selection among UK names led to strong relative performance. |
| • | | In the US, the Health care sector made the most noteworthy contribution to performance as a result of its overweight allocation as well as strong security selection within the sector. |
| • | | The Triple Net sector also made a meaningful impact on relative performance, largely due to its overweighting. A triple net refers to a type of lease agreement in which the tenant is responsible for paying the building’s property taxes, insurance, and maintenance. |
| • | | Lastly, in Asia, Singapore and Australia were the standout performers. |
What didn’t work?
| • | | The largest detractors of performance were several sectors in the US. Stock selection among the specialty, office, hotel, and retail companies was weak. |
| • | | In addition, an underweight allocation to the Industrial sector dragged down relative performance. |
The percentage points shown in the tables identify each security’s positive or negative contribution to the Fund’s return, which is the sum of all contributions by individual holdings.
| | | | | | |
| Top Contributors (%) | | Top Detractors (%) |
| Senior Housing Properties Trust | | 2.00 | | First Potomac Realty Trust | | –0.63 |
| Community Healthcare Trust, Inc. | | 1.55 | | Cache Logistics Trust | | –0.77 |
| MGM Growth Properties LLC Class A | | 1.16 | | Chesapeake Lodging Trust | | –1.16 |
| Physicians Realty Trust | | 0.97 | | CBL & Associates Properties, Inc. | | –1.22 |
| Keppel REIT | | 0.77 | | NorthStar Realty Finance Corp. | | –1.79 |
| | | | |
| Prudential Real Estate Income Fund | | | 9 | |
Strategy and Performance Overview (continued)
Current Outlook
| • | | In the US, REITs should experience continued improvement in operating fundamentals and have the potential to deliver double-digit dividend and high-single-digit cash flow growth in the next 12 months. A slow growth, lower rates for the longer-term bodes well for US REITs. US REITs offer a valuable combination of income and growth in a volatile market. The Fund is positioned to focus on companies with strong relative internal cash flow growth and strong balance sheets that trade at reasonable valuations relative to their private market value. |
| • | | In Europe, the Fund maintains an underweight position to the London office sector, in particular due to the still high degree of uncertainty surrounding the process of the UK’s exit from the European Union (EU) and its economic (and possibly political) consequences. The Fund continues to look for attractively valued stocks in continental Europe that will benefit from the recently expanded quantitative easing measures of the European Central Bank and signs of rental market recovery in selected continental markets that have bottomed out and are showing initial evidence of rental recovery, such as Spanish and French offices. |
| • | | In Asia, particularly Japan, developers remain weak on a perceived lack of momentum in recent stimulus attempts and the country’s attempts to grow the economy. In addition, recent weak data in condominium sales has added to the pessimistic outlook. The prospect of an imminent Federal Reserve hike leading to renewed Yen weakness should help developer share prices. In the interim, the Fund is adhering to a more cautious stance in the developers. The management team also remains selective in the Japan REIT sector, owing to their strong relative performance to the developers and lower expectations of incremental Bank of Japan (BOJ) action. The Fund’s preference remains with the hotel and retail Japanese REITs on the premise that they are prime beneficiaries of the improving tourism landscape—offering both organic and acquisition growth. |
| | |
| 10 | | Visit our website at prudentialfunds.com |
Comments on Largest Holdings
| 5.4% | Community Healthcare Trust, Inc., Health Care REITs |
Community Healthcare Trust, Inc. is a fully integrated health care real estate company that was organized as a Maryland corporation to acquire and own properties that are leased to hospitals, doctors, health care systems or other health care service providers in Non-Urban markets.
| 5.0% | MedEquities Realty Trust, Inc., Health Care REITs |
MedEquities Realty Trust, Inc. operates as a real estate investment trust. The trust focuses on investment in a diversified mix of health care properties and health care related real estate debt investments. MedEquities Realty Trust owns, develops, operates, leases, and disposes health care properties and portfolios.
| 4.4% | Frasers Logistics & Industrial Trust, Industrial REITs |
Frasers Logistics & Industrial Trust is a Singapore real estate investment trust. The trust invests globally, directly or indirectly, in a diversified portfolio of income-producing real estate assets which are predominantly used for logistics or industrial purposes, whether wholly or partially, as well as such industrial real estate-related assets with an initial focus on Australia.
| 4.3% | Care Capital Properties, Inc., Health Care REITs |
Care Capital Properties, Inc. operates as a real estate investment trust. The trust focuses on a diversified portfolio of triple-net leased properties entered on the post-acute sector and skilled nursing facilities.
| 4.2% | Cache Logistics Trust, Industrial REITs |
Cache Logistics Trust is a Singapore-based REIT. The REIT invests in income-producing real estate used for logistics purposes in Asia-Pacific, as well as real estate-related assets.
| | | | |
| Prudential Real Estate Income Fund | | | 11 | |
Fees and Expenses (unaudited)
As a shareholder of the Fund, you incur two types of costs: (1) transaction costs, including sales charges (loads) on purchase payments and redemptions, as applicable, and (2) ongoing costs, including management fees, distribution and/or service (12b-1) fees, and other Fund expenses, as applicable. This example is intended to help you understand your ongoing costs (in dollars) of investing in the Fund and to compare these costs with the ongoing costs of investing in other mutual funds.
The example is based on an investment of $1,000 invested on May 1, 2016, at the beginning of the period, and held through the six-month period ended October 31, 2016. The example is for illustrative purposes only; you should consult the Prospectus for information on initial and subsequent minimum investment requirements.
Actual Expenses
The first line for each share class in the table on the following page provides information about actual account values and actual expenses. You may use the information on this line, together with the amount you invested, to estimate the expenses that you paid over the period. Simply divide your account value by $1,000 (for example, an $8,600 account value ÷ $1,000 = 8.6), then multiply the result by the number on the first line under the heading “Expenses Paid During the Six-Month Period” to estimate the expenses you paid on your account during this period.
Hypothetical Example for Comparison Purposes
The second line for each share class in the table on the following page provides information about hypothetical account values and hypothetical expenses based on the Fund’s actual expense ratio and an assumed rate of return of 5% per year before expenses, which is not the Fund’s actual return. The hypothetical account values and expenses may not be used to estimate the actual ending account balance or expenses you paid for the period. You may use this information to compare the ongoing costs of investing in the Fund and other funds. To do so, compare this 5% hypothetical example with the 5% hypothetical examples that appear in the shareholder reports of the other funds.
The Fund’s transfer agent may charge additional fees to holders of certain accounts that are not included in the expenses shown in the table on the following page. These fees apply to individual retirement accounts (IRAs) and Section 403(b) accounts. As of the close of the six-month period covered by the table, IRA fees included an annual maintenance fee of $15 per account (subject to a maximum annual maintenance fee of $25 for all accounts held by the same shareholder). Section 403(b) accounts are charged an annual $25 fiduciary maintenance fee. Some of the fees may vary in amount, or may be waived, based on your total account balance or the number of Prudential Investments funds, including the Fund, that you own. You should consider the additional fees that were charged to your Fund account over the six-month period when you estimate the total ongoing expenses
| | |
| 12 | | Visit our website at prudentialfunds.com |
paid over the period and the impact of these fees on your ending account value, as these additional expenses are not reflected in the information provided in the expense table. Additional fees have the effect of reducing investment returns.
Please note that the expenses shown in the table are meant to highlight your ongoing costs only and do not reflect any transactional costs such as sales charges (loads). Therefore, the second line for each share class in the table is useful in comparing ongoing costs only and will not help you determine the relative total costs of owning different funds. In addition, if these transactional costs were included, your costs would have been higher.
| | | | | | | | | | | | | | | | | | |
Prudential Real Estate
Income Fund | | Beginning Account
Value
May 1, 2016 | | | Ending Account
Value
October 31, 2016 | | | Annualized
Expense Ratio
Based on the
Six-Month Period | | | Expenses Paid
During the
Six-Month Period* | |
| Class A | | Actual | | $ | 1,000.00 | | | $ | 1,054.20 | | | | 1.35 | % | | $ | 6.97 | |
| | Hypothetical | | $ | 1,000.00 | | | $ | 1,018.35 | | | | 1.35 | % | | $ | 6.85 | |
| Class C | | Actual | | $ | 1,000.00 | | | $ | 1,050.30 | | | | 2.10 | % | | $ | 10.82 | |
| | Hypothetical | | $ | 1,000.00 | | | $ | 1,014.58 | | | | 2.10 | % | | $ | 10.63 | |
| Class Z | | Actual | | $ | 1,000.00 | | | $ | 1,055.60 | | | | 1.10 | % | | $ | 5.68 | |
| | | Hypothetical | | $ | 1,000.00 | | | $ | 1,019.61 | | | | 1.10 | % | | $ | 5.58 | |
*Fund expenses (net of fee waivers or subsidies, if any) for each share class are equal to the annualized expense ratio for each share class (provided in the table), multiplied by the average account value over the period, multiplied by the 184 days in the six-month period ended October 31, 2016, and divided by the 366 days in the Fund’s fiscal year ended October 31, 2016 (to reflect the six-month period). Expenses presented in the table include the expenses of any underlying portfolios in which the Fund may invest.
The Fund’s annual expense ratios for the 12-month period ended October 31, 2016, are as follows:
| | | | |
| Class | | Gross Operating Expenses (%) | | Net Operating Expenses (%) |
| A | | 3.37 | | 1.35 |
| C | | 4.78 | | 2.10 |
| Z | | 4.85 | | 1.10 |
Net operating expenses shown above reflect any fee waivers and/or expense reimbursements. Additional information on Fund expenses and any fee waivers and/or expense reimbursements can be found in the “Financial Highlights” tables in this report and in the Notes to the Financial Statements in this report.
| | | | |
| Prudential Real Estate Income Fund | | | 13 | |
Portfolio of Investments
as of October 31, 2016
| | | | | | | | |
| Description | | Shares | | | Value (Note 1) | |
LONG-TERM INVESTMENTS 99.5% | | | | | | | | |
| | |
COMMON STOCKS 80.9% | | | | | | | | |
| | |
Diversified REITs 12.0% | | | | | | | | |
Agellan Commercial Real Estate Investment Trust (Canada) | | | 8,640 | | | $ | 68,731 | |
First Potomac Realty Trust | | | 14,080 | | | | 125,593 | |
Lexington Realty Trust | | | 13,034 | | | | 132,165 | |
NorthStar Realty Finance Corp. | | | 15,841 | | | | 230,011 | |
Suntec Real Estate Investment Trust (Singapore) | | | 181,041 | | | | 218,662 | |
| | | | | | | | |
| | | | | | | 775,162 | |
| | |
Health Care REITs 23.6% | | | | | | | | |
Care Capital Properties, Inc. | | | 10,361 | | | | 275,292 | |
Community Healthcare Trust, Inc. | | | 15,609 | | | | 349,329 | |
MedEquities Realty Trust, Inc. | | | 27,800 | | | | 322,202 | |
Omega Healthcare Investors, Inc. | | | 4,287 | | | | 136,455 | |
Physicians Realty Trust | | | 2,891 | | | | 57,155 | |
Sabra Health Care REIT, Inc. | | | 7,352 | | | | 171,302 | |
Senior Housing Properties Trust | | | 7,226 | | | | 153,697 | |
Ventas, Inc. | | | 862 | | | | 58,401 | |
| | | | | | | | |
| | | | | | | 1,523,833 | |
| | |
Hotel & Resort REITs 9.4% | | | | | | | | |
Chesapeake Lodging Trust | | | 12,427 | | | | 269,790 | |
DiamondRock Hospitality Co. | | | 12,500 | | | | 114,375 | |
MGM Growth Properties LLC (Class A Stock) | | | 8,469 | | | | 222,904 | |
| | | | | | | | |
| | | | | | | 607,069 | |
| | |
Industrial REITs 11.3% | | | | | | | | |
Ascendas Real Estate Investment Trust (Singapore) | | | 42,651 | | | | 72,684 | |
Cache Logistics Trust (Singapore) | | | 455,237 | | | | 271,815 | |
Frasers Logistics & Industrial Trust (Singapore)* | | | 415,000 | | | | 287,755 | |
Prologis Property Mexico SA de CV (Mexico) | | | 60,657 | | | | 102,052 | |
| | | | | | | | |
| | | | | | | 734,306 | |
| | |
Office REITs 4.3% | | | | | | | | |
Alstria Office REIT-AG (Germany)* | | | 40 | | | | 516 | |
Keppel REIT (Singapore) | | | 278,200 | | | | 218,200 | |
New York REIT, Inc. | | | 6,249 | | | | 58,866 | |
| | | | | | | | |
| | | | | | | 277,582 | |
| | |
Real Estate Operating Companies 1.7% | | | | | | | | |
TLG Immobilien AG (Germany) | | | 5,406 | | | | 113,339 | |
See Notes to Financial Statements.
| | | | |
| Prudential Real Estate Income Fund | | | 15 | |
Portfolio of Investments (continued)
as of October 31, 2016
| | | | | | | | |
| Description | | Shares | | | Value (Note 1) | |
COMMON STOCKS (Continued) | | | | | | | | |
| | |
Residential REITs 3.4% | | | | | | | | |
Empiric Student Property PLC (United Kingdom) | | | 79,600 | | | $ | 107,958 | |
Irish Residential Properties REIT PLC (Ireland) | | | 89,048 | | | | 114,829 | |
| | | | | | | | |
| | | | | | | 222,787 | |
| | |
Retail REITs 10.9% | | | | | | | | |
Eurocommercial Properties NV (Netherlands) | | | 2,704 | | | | 115,042 | |
Kenedix Retail REIT Corp. (Japan) | | | 25 | | | | 60,344 | |
Mapletree Commercial Trust (Singapore) | | | 193,249 | | | | 212,415 | |
Starhill Global REIT (Singapore) | | | 129,400 | | | | 75,794 | |
Washington Prime Group, Inc. | | | 16,620 | | | | 174,344 | |
Wereldhave NV (Netherlands) | | | 1,500 | | | | 67,141 | |
| | | | | | | | |
| | | | | | | 705,080 | |
| | |
Specialized REITs 4.3% | | | | | | | | |
Extra Space Storage, Inc. | | | 875 | | | | 64,006 | |
Four Corners Property Trust, Inc. | | | 10,622 | | | | 213,290 | |
| | | | | | | | |
| | | | | | | 277,296 | |
| | | | | | | | |
TOTAL COMMON STOCKS
(cost $5,334,331) | | | | | | | 5,236,454 | |
| | | | | | | | |
| | |
PREFERRED STOCKS 18.6% | | | | | | | | |
| | |
Diversified REITs 4.9% | | | | | | | | |
Gramercy Property Trust | | | 5,600 | | | | 151,452 | |
VEREIT, Inc. | | | 6,025 | | | | 161,590 | |
| | | | | | | | |
| | | | | | | 313,042 | |
| | |
Hotel & Resort REITs 4.3% | | | | | | | | |
Pebblebrook Hotel Trust | | | 3,198 | | | | 83,756 | |
Sunstone Hotel Investors, Inc.(a) | | | 7,000 | | | | 193,130 | |
| | | | | | | | |
| | | | | | | 276,886 | |
| | |
Industrial REITs 2.7% | | | | | | | | |
Rexford Industrial Realty, Inc.* | | | 3,700 | | | | 93,055 | |
STAG Industrial, Inc. | | | 3,000 | | | | 79,500 | |
| | | | | | | | |
| | | | | | | 172,555 | |
| | |
Residential REITs 3.2% | | | | | | | | |
American Homes 4 Rent(a) | | | 8,000 | | | | 209,440 | |
See Notes to Financial Statements.
| | | | | | | | |
| Description | | Shares | | | Value (Note 1) | |
PREFERRED STOCKS (Continued) | | | | | | | | |
| | |
Retail REITs 3.5% | | | | | | | | |
Cedar Realty Trust, Inc. | | | 3,250 | | | $ | 83,525 | |
Pennsylvania Real Estate Investment Trust | | | 5,650 | | | | 144,922 | |
| | | | | | | | |
| | | | | | | 228,447 | |
| | |
Specialized REITs | | | | | | | | |
DuPont Fabros Technology, Inc. | | | 13 | | | | 358 | |
| | | | | | | | |
TOTAL PREFERRED STOCKS
(cost $1,135,801) | | | | | | | 1,200,728 | |
| | | | | | | | |
TOTAL LONG-TERM INVESTMENTS
(cost $6,470,132) | | | | | | | 6,437,182 | |
| | | | | | | | |
| | |
SHORT-TERM INVESTMENTS 7.3% | | | | | | | | |
| | |
AFFILIATED MUTUAL FUNDS | | | | | | | | |
Prudential Investment Portfolios 2 - Prudential Core Ultra Short Bond Fund(b) | | | 97,366 | | | | 97,366 | |
Prudential Investment Portfolios 2 - Prudential Institutional Money Market Fund
(cost $375,248; includes $375,096 of cash collateral for securities on loan)(b)(c) | | | 375,205 | | | | 375,280 | |
| | | | | | | | |
TOTAL SHORT-TERM INVESTMENTS
(cost $472,614)(Note 3) | | | | | | | 472,646 | |
| | | | | | | | |
TOTAL INVESTMENTS 106.8%
(cost $6,942,746) (Note 5) | | | | | | | 6,909,828 | |
Liabilities in excess of other assets (6.8)% | | | | | | | (439,869 | ) |
| | | | | | | | |
NET ASSETS 100.0% | | | | | | $ | 6,469,959 | |
| | | | | | | | |
The following abbreviations are used in the annual report:
REITs—Real Estate Investment Trusts
| * | Non-income producing security. |
| (a) | All or a portion of security is on loan. The aggregate market value of such securities, including those sold and pending settlement, is $366,797; cash collateral of $375,096 (included with liabilities) was received with which the Portfolio purchased highly liquid short-term investments. Securities on loan are subject to contractual netting arrangements. |
| (b) | Prudential Investments LLC, the manager of the Fund, also serves as manager of the Prudential Investment Portfolios 2 - Prudential Core Ultra Short Bond Fund and the Prudential Investment Portfolios 2 - Prudential Institutional Money Market Fund. |
| (c) | Represents security purchased with cash collateral received for securities on loan and includes dividend reinvestment. |
See Notes to Financial Statements.
| | | | |
| Prudential Real Estate Income Fund | | | 17 | |
Portfolio of Investments (continued)
as of October 31, 2016
Various inputs are used in determining the value of the Fund’s investments. These inputs are summarized in the three broad levels listed below.
Level 1—quoted prices generally in active markets for identical securities.
Level 2—quoted prices for similar securities, interest rates and yield curves, prepayment speeds, foreign currency exchange rates and other observable inputs.
Level 3—unobservable inputs for securities valued in accordance with Board approved fair valuation procedures.
The following is a summary of the inputs used as of October 31, 2016 in valuing such portfolio securities:
| | | | | | | | | | | | |
| | | Level 1 | | | Level 2 | | | Level 3 | |
Investments in Securities | | | | | | | | | | | | |
Common Stocks | | | | | | | | | | | | |
Diversified REITs | | $ | 556,500 | | | $ | 218,662 | | | $ | — | |
Health Care REITs | | | 1,523,833 | | | | — | | | | — | |
Hotel & Resort REITs | | | 607,069 | | | | — | | | | — | |
Industrial REITs | | | 102,052 | | | | 632,254 | | | | — | |
Office REITs | | | 58,866 | | | | 218,716 | | | | — | |
Real Estate Operating Companies | | | — | | | | 113,339 | | | | — | |
Residential REITs | | | — | | | | 222,787 | | | | — | |
Retail REITs | | | 174,344 | | | | 530,736 | | | | — | |
Specialized REITs | | | 277,296 | | | | — | | | | — | |
Preferred Stocks | | | | | | | | | | | | |
Diversified REITs | | | 313,042 | | | | — | | | | — | |
Hotel & Resort REITs | | | 83,756 | | | | 193,130 | | | | — | |
Industrial REITs | | | 172,555 | | | | — | | | | — | |
Residential REITs | | | 209,440 | | | | — | | | | — | |
Retail REITs | | | 228,447 | | | | — | | | | — | |
Specialized REITs | | | 358 | | | | — | | | | — | |
Affiliated Mutual Funds | | | 472,646 | | | | — | | | | — | |
| | | | | | | | | | | | |
Total | | $ | 4,780,204 | | | $ | 2,129,624 | | | $ | — | |
| | | | | | | | | | | | |
During the period, there were no transfers between Level 1 and Level 2 to report.
See Notes to Financial Statements.
The industry classification of investments and liabilities in excess of other assets shown as a percentage of net assets as of October 31, 2016 were as follows (unaudited):
| | | | |
Health Care REITs | | | 23.6 | % |
Diversified REITs | | | 16.9 | |
Retail REITs | | | 14.4 | |
Industrial REITs | | | 14.0 | |
Hotel & Resort REITs | | | 13.7 | |
Affiliated Mutual Funds (including 5.8% of collateral for securities on loan) | | | 7.3 | |
Residential REITs | | | 6.6 | % |
Specialized REITs | | | 4.3 | |
Office REITs | | | 4.3 | |
Real Estate Operating Companies | | | 1.7 | |
| | | | |
| | | 106.8 | |
Liabilities in excess of other assets | | | (6.8 | ) |
| | | | |
| | | 100.0 | % |
| | | | |
See Notes to Financial Statements.
| | | | |
| Prudential Real Estate Income Fund | | | 19 | |
Statement of Assets & Liabilities
as of October 31, 2016
| | | | |
Assets | | | | |
Investments at value, including securities on loan of $366,797: | | | | |
Unaffiliated investments (cost $6,470,132) | | $ | 6,437,182 | |
Affiliated investments (cost $472,614) | | | 472,646 | |
Cash | | | 1,074 | |
Receivable for Fund shares sold | | | 114,406 | |
Dividends and interest receivable | | | 24,274 | |
Tax reclaim receivable | | | 1,519 | |
Prepaid expenses | | | 816 | |
| | | | |
Total assets | | | 7,051,917 | |
| | | | |
| |
Liabilities | | | | |
Payable to broker for collateral for securities on loan | | | 375,096 | |
Payable for Fund shares reacquired | | | 85,516 | |
Payable for investments purchased | | | 63,977 | |
Accrued expenses and other liabilities | | | 42,335 | |
Management fee payable | | | 14,512 | |
Distribution fee payable | | | 382 | |
Affiliated transfer agent fee payable | | | 140 | |
| | | | |
Total liabilities | | | 581,958 | |
| | | | |
| |
Net Assets | | $ | 6,469,959 | |
| | | | |
| | | | | |
Net assets were comprised of: | | | | |
Shares of beneficial interest, at par | | $ | 670 | |
Paid-in capital in excess of par | | | 6,627,239 | |
| | | | |
| | | 6,627,909 | |
Distributions in excess of net investment income | | | (32,688 | ) |
Accumulated net realized loss on investment and foreign currency transactions | | | (92,294 | ) |
Net unrealized depreciation on investments and foreign currencies | | | (32,968 | ) |
| | | | |
Net assets, October 31, 2016 | | $ | 6,469,959 | |
| | | | |
See Notes to Financial Statements.
| | | | |
Class A | | | | |
Net asset value and redemption price per share, ($636,632 ÷ 65,891 shares of beneficial interest issued and outstanding) | | $ | 9.66 | |
Maximum sales charge (5.50% of offering price) | | | 0.56 | |
| | | | |
Maximum offering price to public | | $ | 10.22 | |
| | | | |
| |
Class C | | | | |
Net asset value, offering price and redemption price per share, ($321,218 ÷ 33,247 shares of beneficial interest issued and outstanding) | | $ | 9.66 | |
| | | | |
| |
Class Z | | | | |
Net asset value, offering price and redemption price per share, ($5,512,109 ÷ 570,407 shares of beneficial interest issued and outstanding) | | $ | 9.66 | |
| | | | |
See Notes to Financial Statements.
| | | | |
| Prudential Real Estate Income Fund | | | 21 | |
Statement of Operations
Year Ended October 31, 2016
| | | | |
Net Investment Income (Loss) | | | | |
Income | | | | |
Unaffiliated dividend income (net of foreign withholding taxes of $9,682) | | $ | 266,964 | |
Income from securities lending, net (including affiliated income of $63) | | | 455 | |
Affiliated dividend income | | | 315 | |
| | | | |
Total income | | | 267,734 | |
| | | | |
| |
Expenses | | | | |
Management fee | | | 42,766 | |
Distribution fee—Class A | | | 559 | |
Distribution fee—Class C | | | 1,514 | |
Registration fees | | | 61,000 | |
Custodian and accounting fees | | | 50,000 | |
Audit fee | | | 31,000 | |
Shareholders’ reports | | | 22,000 | |
Legal fees and expenses | | | 21,000 | |
Trustees’ fees | | | 10,000 | |
Transfer agent’s fees and expenses (including affiliated expense of $500) | | | 1,000 | |
Insurance expenses | | | 1,000 | |
Loan interest expense | | | 5 | |
Miscellaneous | | | 14,624 | |
| | | | |
Total expenses | | | 256,468 | |
Less: Management fee waiver and/or expense reimbursement | | | (195,586 | ) |
Distribution fee waiver—Class A | | | (93 | ) |
| | | | |
Net expenses | | | 60,789 | |
| | | | |
Net investment income (loss) | | | 206,945 | |
| | | | |
| |
Realized And Unrealized Gain (Loss) On Investments And Foreign Currency Transactions | | | | |
Net realized gain (loss) on: | | | | |
Investment transactions (including affiliated of $31) | | | 57,519 | |
Foreign currency transactions | | | (2,095 | ) |
| | | | |
| | | 55,424 | |
| | | | |
Net change in unrealized appreciation (depreciation) on: | | | | |
Investments (including affiliated of $32) | | | 103,061 | |
Foreign currencies | | | 28 | |
| | | | |
| | | 103,089 | |
| | | | |
Net gain (loss) on investment and foreign currency transactions | | | 158,513 | |
| | | | |
Net Increase (Decrease) In Net Assets Resulting From Operations | | $ | 365,458 | |
| | | | |
See Notes to Financial Statements.
Statement of Changes in Net Assets
| | | | | | | | |
| | | Year
Ended
October 31, 2016 | | | June 3, 2015*
through
October 31, 2015 | |
Increase (Decrease) in Net Assets | | | | | | | | |
Operations | | | | | | | | |
Net investment income (loss) | | $ | 206,945 | | | $ | 82,612 | |
Net realized gain (loss) on investment and foreign currency transactions | | | 55,424 | | | | (70,663 | ) |
Net change in unrealized appreciation (depreciation) on investments and foreign currencies | | | 103,089 | | | | (136,057 | ) |
| | | | | | | | |
Net increase (decrease) in net assets resulting from operations | | | 365,458 | | | | (124,108 | ) |
| | | | | | | | |
| | |
Dividends from net investment income (Note 1) | | | | | | | | |
Class A | | | (11,790 | ) | | | (434 | ) |
Class C | | | (6,735 | ) | | | (155 | ) |
Class Z | | | (308,719 | ) | | | (82,870 | ) |
| | | | | | | | |
| | | (327,244 | ) | | | (83,459 | ) |
| | | | | | | | |
| | |
Fund share transactions (Note 6) | | | | | | | | |
Net proceeds from shares sold | | | 1,198,822 | | | | 5,055,945 | |
Net asset value of shares issued in reinvestment of dividends
and distributions | | | 327,133 | | | | 83,459 | |
Cost of shares reacquired | | | (26,047 | ) | | | — | |
| | | | | | | | |
Net increase (decrease) in net assets from Fund share transactions | | | 1,499,908 | | | | 5,139,404 | |
| | | | | | | | |
Total increase (decrease) | | | 1,538,122 | | | | 4,931,837 | |
| | |
Net Assets: | | | | | | | | |
Beginning of year | | | 4,931,837 | | | | — | |
| | | | | | | | |
End of year(a) | | $ | 6,469,959 | | | $ | 4,931,837 | |
| | | | | | | | |
(a) Includes undistributed net investment income of: | | $ | — | | | $ | 14,200 | |
| | | | | | | | |
| * | Commencement of operations. |
See Notes to Financial Statements.
| | | | |
| Prudential Real Estate Income Fund | | | 23 | |
Notes to Financial Statements
Prudential Investment Portfolios 9 (the “Trust”) is an open-end management investment company, registered under the Investment Company Act of 1940, as amended (“1940 Act”). The Trust currently consists of four portfolios: Prudential Select Real Estate Fund, Prudential Real Estate Income Fund, Prudential QMA Large-Cap Core Equity Fund and Prudential Absolute Return Bond Fund. These financial statements relate only to Prudential Real Estate Income Fund (the “Fund”). The financial statements of the other portfolios are not presented herein.
The Fund commenced investment operations on June 3, 2015.
The investment objective of the Fund is to seek income and capital appreciation.
Note 1. Accounting Policies
The Fund follows investment company accounting and reporting guidance of the Financial Accounting Standards Board (“FASB”) Accounting Standard Codification Topic 946 Financial Services—Investment Companies. The following accounting policies conform to U.S. generally accepted accounting principles. The Fund consistently follows such policies in the preparation of its financial statements.
Securities Valuation: The Fund holds securities and other assets that are fair valued at the close of each day (generally, 4:00 PM Eastern time) the New York Stock Exchange (“NYSE”) is open for trading. Fair value is the price that would be received to sell an asset or paid to transfer a liability in an orderly transaction between market participants on the measurement date. The Board of Trustees (the “Board”) has adopted Valuation Procedures for security valuation under which fair valuation responsibilities have been delegated to Prudential Investments LLC (“PI” or “Manager”). Under the current Valuation Procedures, the established Valuation Committee is responsible for supervising the valuation of portfolio securities and other assets. The Valuation Procedures permit the Fund to utilize independent pricing vendor services, quotations from market makers, and alternative valuation methods when market quotations are either not readily available or not deemed representative of fair value. A record of the Valuation Committee’s actions is subject to the Board’s review, approval, and ratification at its next regularly-scheduled quarterly meeting.
Various inputs determine how the Fund’s investments are valued, all of which are categorized according to the three broad levels (Level 1, 2, or 3) detailed in the table following the Portfolio of Investments.
Common and preferred stocks, exchange-traded funds, and derivative instruments such as futures or options that are traded on a national securities exchange are valued at the last
sale price as of the close of trading on the applicable exchange where the security principally trades. Securities traded via NASDAQ are valued at the NASDAQ official closing price. To the extent these securities are valued at the last sale price or NASDAQ official closing price, they are classified as Level 1 in the fair value hierarchy.
In the event that no sale or official closing price on valuation date exists, these securities are generally valued at the mean between the last reported bid and ask prices, or at the last bid price in the absence of an ask price. These securities are classified as Level 2 in the fair value hierarchy.
Common and preferred stocks traded on foreign securities exchanges are valued using pricing vendor services that provide model prices derived using adjustment factors based on information such as local closing price, relevant general and sector indices, currency fluctuations, depositary receipts, and futures, as applicable. Securities valued using such model prices are classified as Level 2 in the fair value hierarchy. The models generate an evaluated adjustment factor for each security, which is applied to the local closing price to adjust it for post closing market movements. Utilizing that evaluated adjustment factor, the vendor provides an evaluated price for each security. If the vendor does not provide an evaluated price, securities are valued in accordance with exchange-traded common and preferred stocks discussed above.
Participatory notes (P-notes) are generally valued based upon the value of a related underlying security that trades actively in the market and are classified as Level 2 in the fair value hierarchy.
Investments in open-end, non-exchange-traded mutual funds are generally valued at their net asset values as of the close of the NYSE on the date of valuation. These securities are classified as Level 1 in the fair value hierarchy since they may be purchased or sold at their net asset values on the date of valuation.
Securities and other assets that cannot be priced according to the methods described above are valued based on pricing methodologies approved by the Board. In the event that unobservable inputs are used when determining such valuations, the securities will be classified as Level 3 in the fair value hierarchy.
When determining the fair value of securities, some of the factors influencing the valuation include: the nature of any restrictions on disposition of the securities; assessment of the general liquidity of the securities; the issuer’s financial condition and the markets in which it does business; the cost of the investment; the size of the holding and the capitalization of the issuer; the prices of any recent transactions or bids/offers for such securities or any comparable securities; any available analyst media or other reports or information deemed reliable by the investment adviser regarding the issuer or the markets or industry in which it operates. Using fair value to price securities may result in a value that is different from a security’s most recent closing price and from the price used by other mutual funds to calculate their net asset values.
| | | | |
| Prudential Real Estate Income Fund | | | 25 | |
Notes to Financial Statements (continued)
Foreign Currency Translation: The books and records of the Fund are maintained in U.S. dollars. Foreign currency amounts are translated into U.S. dollars on the following basis:
(i) market value of investment securities, other assets and liabilities-at the current rates of exchange;
(ii) purchases and sales of investment securities, income and expenses-at the rates of exchange prevailing on the respective dates of such transactions.
Although the net assets of the Fund are presented at the foreign exchange rates and market values at the close of the period, the Fund does not generally isolate that portion of the results of operations arising as a result of changes in the foreign exchange rates from the fluctuations arising from changes in the market prices of long-term portfolio securities held at the end of the period. Similarly, the Fund does not isolate the effect of changes in foreign exchange rates from the fluctuations arising from changes in the market prices of long-term portfolio securities sold during the period. Accordingly, holding period realized foreign currency gains (losses) are included in the reported net realized gains (losses) on investment transactions. Notwithstanding the above, the Fund does isolate the effect of fluctuations in foreign currency exchange rates when determining the gain (loss) upon the sale or maturity of foreign currency denominated debt obligations; such amounts are included in net realized gains (losses) on foreign currency transactions.
Net realized gains (losses) on foreign currency transactions represent net foreign exchange gains (losses) from holdings of foreign currencies, forward currency contracts, disposition of foreign currencies, currency realized between the trade date and settlement date on securities transactions, and the difference between the amounts of interest, dividends and foreign withholding taxes recorded on the Fund’s books and the U.S. dollar equivalent amounts actually received or paid. Net unrealized currency gains (losses) from valuing foreign currency denominated assets and liabilities (other than investments) at period-end exchange rates are reflected as a component of net unrealized appreciation (depreciation) on foreign currency transactions.
Master Netting Arrangements: The Fund is subject to various Master Agreements, or netting arrangements, with select counterparties. These are agreements which a subadviser may have negotiated and entered into on behalf of the Fund. A master netting arrangement between the Fund and the counterparty permits the Fund to offset amounts payable by the Fund to the same counterparty against amounts to be received; and by the receipt of collateral from the counterparty by the Fund to cover the Fund’s exposure to the counterparty. However, there is no assurance that such mitigating factors are easily enforceable. In addition to master netting arrangements, the right to set-off exists when all the conditions are met such that each of the parties owes the other determinable amounts,
the reporting party has the right to set-off the amount owed with the amount owed by the other party, the reporting party intends to set-off and the right of set-off is enforceable by law. During the reporting period, there was no intention to settle on a net basis and all amounts are presented on a gross basis on the Statement of Assets and Liabilities.
Securities Lending: The Fund may lend its portfolio securities to banks and broker-dealers. The loans are secured by collateral at least equal to the market value of the securities loaned. Collateral pledged by each borrower is invested in a money market fund and is marked to market daily, based on the previous day’s market value, such that the value of the collateral exceeds the value of the loaned securities. For the period March 31, 2016 through July 18, 2016 the collateral was invested in an ultra-short bond fund. Loans are subject to termination at the option of the borrower or the Fund. Upon termination of the loan, the borrower will return to the Fund securities identical to the loaned securities. Should the borrower of the securities fail financially, the Fund has the right to repurchase the securities in the open market using the collateral. The Fund recognizes income, net of any rebate and securities lending agent fees, for lending its securities in the form of fees or interest on the investment of any cash received as collateral. The borrower receives all interest and dividends from the securities loaned and such payments are passed back to the lender in amounts equivalent thereto. The Fund also continues to recognize any unrealized gain (loss) in the market price of the securities loaned and on the change in the value of the collateral invested that may occur during the term of the loan. In addition, realized gain (loss) is recognized on changes in the value of the collateral invested that may occur during the term of the loan.
Concentration of Risk: Foreign security and currency transactions may involve certain considerations and risks not typically associated with those of domestic origin as a result of, among other factors, the possibility of political and economic instability, or the level of governmental supervision and regulation of foreign securities markets.
Securities Transactions and Net Investment Income: Securities transactions are recorded on the trade date. Realized gains (losses) from investment and currency transactions are calculated on the identified cost basis. Dividend income is recorded on the ex-date. Interest income, including amortization of premium and accretion of discount on debt securities, as required, is recorded on the accrual basis. Expenses are recorded on an accrual basis, which may require the use of certain estimates by management that may differ from actual.
Net investment income or loss (other than distribution fees which are charged directly to the respective class) and unrealized and realized gains (losses) are allocated daily to each class of shares based upon the relative proportion of adjusted net assets of each class at the beginning of the day.
REITs: The Fund invests in REITs, which report information on the source of their distributions annually. Based on current and historical information, a portion of distributions received from REITs during the period is estimated to be dividend income, capital gain or a return of capital and recorded accordingly. These estimates are adjusted periodically when the actual sources of distributions is disclosed by the REITs.
| | | | |
| Prudential Real Estate Income Fund | | | 27 | |
Notes to Financial Statements (continued)
Dividends and Distributions: The Fund expects to pay dividends from net investment income quarterly. Distributions from net realized capital and currency gains, if any, are declared and paid annually. Dividends and distributions to shareholders, which are determined in accordance with federal income tax regulations and may differ from generally accepted accounting principles, are recorded on the ex-date. Permanent book/tax differences relating to income and gain(loss) are reclassified amongst undistributed net investment income, accumulated net realized gain (loss) and paid-in capital in excess of par, as appropriate.
Taxes: For federal income tax purposes, the Fund is treated as a separate taxpaying entity. It is the Fund’s policy to continue to meet the requirements of the Internal Revenue Code applicable to regulated investment companies and to distribute all of its taxable net investment income and capital gains, if any, to its shareholders. Therefore, no federal income tax provision is required. Withholding taxes on foreign dividends are recorded, net of reclaimable amounts, at the time the related income is earned.
Estimates: The preparation of the financial statements requires management to make estimates and assumptions that affect the reported amounts and disclosures in the financial statements. Actual results could differ from those estimates.
Note 2. Agreements
The Fund has a management agreement with PI. Pursuant to this agreement, PI has responsibility for all investment advisory services and supervises the subadviser’s performance of such services. PI has entered into a subadvisory agreement with PGIM Real Estate, formerly known as Prudential Real Estate Investors (“PREI”), which is a business unit of PGIM, Inc. The subadvisory agreement provides that PGIM Real Estate will furnish investment advisory services in connection with the management of the Fund. In connection therewith, PGIM Real Estate is obligated to keep certain books and records of the Fund. PI pays for the services of PGIM Real Estate, the cost of compensation of officers of the Fund, occupancy and certain clerical and bookkeeping costs of the Fund. The Fund bears all other costs and expenses. Prior to January 4, 2016, PGIM, Inc. was known as Prudential Investment Management, Inc. (“PIM”).
The management fee paid to PI is accrued daily and payable monthly at an annual rate of ..80% of the Fund’s average daily net assets up to and including $1 billion, .78% of the next $2 billion, .76% of the next $2 billion, .75% of the next $5 billion and .74% of the Fund’s average daily net assets in excess of $10 billion. For the year ended October 31, 2016, the effective management fee rate before any waivers and/or expense reimbursement was .80%. For the year ended October 31, 2016, the waiver and/or expense reimbursement exceeded the effective management fee rate.
PI has contractually agreed through February 28, 2018 to limit the net annual operating expenses (exclusive of distribution and service (12b-1) fees, taxes (such as income and foreign withholdings taxes, stamp duty and deferred tax expenses), interest, underlying funds, brokerage, extraordinary and certain other expenses such as dividend, broker charges and interest expense on short sales) of each class of shares of the Fund to 1.10% of the Fund’s average daily net assets. Expenses waived/reimbursed by the Manager in accordance with this agreement may be recouped by the Manager within the same fiscal year during which such waiver/reimbursement is made if such recoupment can be realized without exceeding the expense limit in effect at the time of the recoupment for that fiscal year.
The Fund has a distribution agreement with Prudential Investment Management Services LLC (“PIMS”), which acts as the distributor of the Class A, Class C and Class Z shares of the Fund. The Fund compensates PIMS for distributing and servicing the Fund’s Class A and Class C shares, pursuant to plans of distribution (the “Distribution Plans”), regardless of expenses actually incurred by PIMS. The distribution fees are accrued daily and payable monthly. No distribution or service fees are paid to PIMS as distributor of the Class Z shares of the Fund.
Pursuant to the Distribution Plans, the Fund compensates PIMS for distribution related activities at an annual rate of up to .30% and 1% of the average daily net assets of the Class A and C shares, respectively. The distributor has contractually agreed through February 28, 2018 to reduce its distribution and service (12b-1) fees for Class A shares to .25% of the average daily net assets of Class A shares.
PIMS has advised the Fund that it has received $8,525 in front-end sales charges resulting from sales of Class A shares during the year ended October 31, 2016. From these fees, PIMS paid such sales charges to affiliated broker-dealers, which in turn paid commissions to salespersons and incurred other distribution costs.
PI, PIMS and PGIM, Inc. are indirect, wholly-owned subsidiaries of Prudential Financial, Inc. (“Prudential”).
Note 3. Other Transactions with Affiliates
Prudential Mutual Fund Services LLC (“PMFS”), an affiliate of PI and an indirect, wholly-owned subsidiary of Prudential, serves as the Fund’s transfer agent. Transfer agent’s fees and expenses in the Statement of Operations include certain out-of-pocket expenses paid to non-affiliates, where applicable.
Effective July 7, 2016, the Board replaced PGIM, Inc., an indirect wholly-owned subsidiary of Prudential, as securities lending agent with a third party agent. Prior to July 7, 2016, PGIM, Inc. was the Fund’s securities lending agent. Net earnings from securities lending are disclosed on the Statement of Operations as “Income from securities lending, net”.
The Fund may enter into certain securities purchase or sale transactions under Board approved Rule 17a-7 procedures. Rule 17a-7 is an exemptive rule under the 1940 Act,
| | | | |
| Prudential Real Estate Income Fund | | | 29 | |
Notes to Financial Statements (continued)
that permits purchase and sale transactions among affiliated investment companies, or between an investment company and a person that is affiliated solely by reason of having a common (or affiliated) investment adviser, common directors, and/or common officers. Such transactions are subject to ratification by the Board.
The Fund invests its overnight sweep cash in the Prudential Core Ultra Short Bond Fund, (formerly known as Prudential Core Taxable Money Market Fund, (the “Core Fund”), and its securities lending cash collateral in the Prudential Institutional Money Market Fund, (the “Money Market Fund”), each a portfolio of Prudential Investment Portfolios 2, registered under the 1940 Act and managed by PI. Earnings from the Core and the Money Market Funds are disclosed on the Statement of Operations as “Affiliated dividend income” and “Income from securities lending, net”, respectively.
Note 4. Portfolio Securities
The cost of purchases and proceeds from sales of portfolio securities, other than short-term investments, for the year ended October 31, 2016, were $7,565,382 and $6,098,300, respectively.
Note 5. Distributions and Tax Information
Distributions to shareholders, which are determined in accordance with federal income tax regulations and which may differ from generally accepted accounting principles, are recorded on the ex-date. In order to present distributions in excess of net investment income, accumulated net realized loss on investment and foreign currency transactions and paid-in capital in excess of par on the Statement of Assets and Liabilities that more closely represent their tax character, certain adjustments have been made to distributions in excess of net investment income and accumulated net realized loss on investment and foreign currency transactions. For the year ended October 31, 2016, the adjustments were to decrease distributions in excess of net investment income and increase accumulated net realized loss on investment and foreign currency transactions by $73,411 due to foreign currency transactions, investment in passive foreign investment companies and other book to tax differences. Net investment income, net realized gain (loss) on investment and foreign currency transactions and net assets were not affected by this change.
For the year ended October 31, 2016, the tax character of dividends paid by the Fund was $327,244 of ordinary income. For the period ended October 31, 2015, the tax character of dividends paid by the Fund was $83,459 of ordinary income.
As of October 31, 2016, the accumulated undistributed earnings on a tax basis was $17,834 of ordinary income. This differs from the amount shown on the Statement of
Assets and Liabilities primarily due to cumulative timing differences between financial and tax reporting.
The United States federal income tax basis of the Fund’s investments and the net unrealized depreciation as of October 31, 2016 were as follows:
| | | | | | | | | | |
Tax Basis | | Appreciation | | Depreciation | | Net
Unrealized
Depreciation | | Other Cost Basis
Adjustments | | Total Net
Unrealized
Depreciation |
| $7,060,268 | | $170,055 | | $(320,495) | | $(150,440) | | $(50) | | $(150,490) |
The difference between book basis and tax basis was primarily attributable to deferred losses on wash sales, investments in passive foreign investment companies and other book to tax differences. The other cost basis adjustments are attributable to net depreciation on foreign currency transactions.
For federal income tax purposes, the Fund had a capital loss carryforward as of October 31, 2016 of approximately $21,000 which can be carried forward for an unlimited period. No capital gains distributions are expected to be paid to shareholders until net gains have been realized in excess of such losses.
Management has analyzed the Fund’s tax positions taken on federal, state and local income tax returns for all open tax years and has concluded that no provision for income tax is required in the Fund’s financial statements for the current reporting period. The Fund’s federal, state and local income and federal excise tax returns for tax years for which the applicable statutes of limitations have not expired are subject to examination by the Internal Revenue Service and state departments of revenue.
Note 6. Capital
The Fund offers Class A, Class C and Class Z shares. Class A shares are sold with a frontend sales charge of up to 5.50%. All investors who purchase Class A shares in an amount of $1 million or more and sell these shares within 12 months of purchase are subject to a contingent deferred sales charge (“CDSC”) of 1%. The Class A shares CDSC is waived for purchases by certain retirement and/or benefit plans. Class C shares are sold with a CDSC of 1% on shares redeemed within the first 12 months of purchase. Class Z shares are not subject to any sales or redemption charge and are offered exclusively for a sale to a limited group of investors.
Under certain circumstances, an exchange may be made from specified share classes of the Fund to one or more other share classes of the Fund as presented in the table of transactions in shares of beneficial interest.
The Trust has authorized an unlimited number of shares of beneficial interest, $.001 par value per share, divided into three classes, designated Class A, Class C, and Class Z.
| | | | |
| Prudential Real Estate Income Fund | | | 31 | |
Notes to Financial Statements (continued)
At reporting period end, Prudential, through its affiliates, owned 1,079 of Class A, 1,068 of Class C and 542,172 of Class Z shares of the Fund, which represents 81% of the Fund’s outstanding shares.
Transactions in shares of beneficial interest were as follows:
| | | | | | | | |
Class A | | Shares | | | Amount | |
Year ended October 31, 2016 : | | | | | | | | |
Shares sold | | | 63,740 | | | | 626,085 | |
Shares issued in reinvestment of dividends and distributions | | | 1,199 | | | | 11,679 | |
Shares reacquired | | | (2,470 | ) | | | (24,165 | ) |
| | | | | | | | |
Net increase (decrease) in shares outstanding | | | 62,469 | | | | 613,599 | |
| | | | | | | | |
Period ended October 31, 2015*: | | | | | | | | |
Shares sold | | | 3,377 | | | $ | 33,048 | |
Shares issued in reinvestment of dividends and distributions | | | 45 | | | | 434 | |
| | | | | | | | |
Net increase (decrease) in shares outstanding | | | 3,422 | | | $ | 33,482 | |
| | | | | | | | |
Class C | | | | | | |
Year ended October 31, 2016 : | | | | | | | | |
Shares sold | | | 31,258 | | | $ | 296,223 | |
Shares issued in reinvestment of dividends and distributions | | | 689 | | | | 6,735 | |
Shares reacquired | | | (31 | ) | | | (313 | ) |
| | | | | | | | |
Net increase (decrease) in shares outstanding | | | 31,916 | | | $ | 302,645 | |
| | | | | | | | |
Period ended October 31, 2015*: | | | | | | | | |
Shares sold | | | 1,315 | | | $ | 12,897 | |
Shares issued in reinvestment of dividends and distributions | | | 16 | | | | 155 | |
| | | | | | | | |
Net increase (decrease) in shares outstanding | | | 1,331 | | | $ | 13,052 | |
| | | | | | | | |
Class Z | | | | | | |
Year ended October 31, 2016 : | | | | | | | | |
Shares sold | | | 28,115 | | | $ | 276,514 | |
Shares issued in reinvestment of dividends and distributions | | | 32,928 | | | | 308,719 | |
Shares reacquired | | | (155 | ) | | | (1,569 | ) |
| | | | | | | | |
Net increase (decrease) in shares outstanding | | | 60,888 | | | $ | 583,664 | |
| | | | | | | | |
Period ended October 31, 2015*: | | | | | | | | |
Shares sold | | | 501,000 | | | $ | 5,010,000 | |
Shares issued in reinvestment of dividends and distributions | | | 8,519 | | | | 82,870 | |
| | | | | | | | |
Net increase (decrease) in shares outstanding | | | 509,519 | | | $ | 5,092,870 | |
| | | | | | | | |
| * | Commencement of operations was June 3, 2015. |
Note 7. Borrowings
The Fund, along with other affiliated registered investment companies (the “Funds”), is a party to a Syndicated Credit Agreement (“SCA”) with a group of banks. The purpose of the SCA is to provide an alternative source of temporary funding for capital share redemptions. The SCA provides for a commitment of $900 million for the period October 6, 2016 through October 5, 2017. The Funds pay an annualized commitment fee of .15% of the unused portion of the SCA. The interest rate on borrowings under the SCA is paid monthly and at a per annum rate based upon the higher of 0.0%, the effective Federal Funds rate, or the One Month LIBOR rate, plus a contractual spread. Prior to October 6, 2016, the Funds had another SCA that provided a commitment of $900 million and the Funds paid an annualized commitment fee of .11% of the unused portion of the SCA. Interest on any borrowings under the SCA is paid at contracted market rates. The Fund’s portion of the commitment fee for the unused amount is accrued daily and paid quarterly.
The Fund utilized the SCA during the year ended October 31, 2016. The balance for the 1 day that the Fund had a loan outstanding during the period was $105,000 borrowed at an interest rate of 1.71%. At October 31, 2016, the Fund did not have an outstanding loan balance.
Note 8. Recent Accounting Pronouncements and Reporting Updates
In January 2016, the FASB issued Accounting Standards Update (“ASU”) No. 2016-01 regarding “Recognition and Measurement of Financial Assets and Financial Liabilities”. The new guidance is intended to enhance the reporting model for financial instruments to provide users of financial statements with more decision-useful information and addresses certain aspects of the recognition, measurement, presentation, and disclosure of financial instruments. The new standard affects all entities that hold financial assets or owe financial liabilities. The new guidance is effective for public companies for fiscal years beginning after December 15, 2017, including interim periods within those fiscal years. At this time, management is evaluating the implications of ASU No. 2016-01 and its impact on the financial statements and disclosures has not yet been determined.
On October 13, 2016, the Securities and Exchange Commission (the “SEC”) adopted new rules and forms and amended existing rules and forms which are intended to modernize and enhance the reporting and disclosure of information by registered investment companies and to improve the quality of information that funds provide to investors, including modifications to Regulation S-X which would require standardized, enhanced disclosure about derivatives in investment company financial statements. In an effort to enhance monitoring and regulation, the new rules and forms will allow the SEC to more effectively collect and use data reported by funds. The new rules also enhance disclosure regarding fund liquidity and redemption practices. Also under the new rules, the SEC will permit open-end funds, with the exception of money market funds, to offer swing pricing, subject to board approval and review. The compliance dates of the modifications to Regulation S-X are August 1, 2017 and other amendments and rules are generally June 1, 2018 and December 1, 2018. Management is currently evaluating the impacts to the financial statement disclosures, if any.
| | | | |
| Prudential Real Estate Income Fund | | | 33 | |
Notes to Financial Statements (continued)
Note 9. Dividends and Distributions to Shareholders
Subsequent to the fiscal year end, the Fund declared ordinary income dividends on December 15, 2016 to shareholders of record on December 16, 2016. The ex-date was December 19, 2016. The per share amounts declared were as follows:
| | | | |
| | | Ordinary Income | |
Class A | | | 0.09405 | |
Class C | | | 0.07934 | |
Class Z | | | 0.09895 | |
Financial Highlights
| | | | | | | | |
| Class A Shares | | | | |
| | | Year Ended
October 31, 2016 | | | June 3, 2015(b)
through
October 31, 2015 | |
| Per Share Operating Performance(c): | | | | | | | | |
| Net Asset Value, Beginning of Period | | | $9.59 | | | | $10.00 | |
| Income (loss) from investment operations: | | | | | | | | |
| Net investment income (loss) | | | .24 | | | | .13 | |
| Net realized and unrealized gain (loss) on investment transactions | | | .39 | | | | (.38 | ) |
| Total from investment operations | | | .63 | | | | (.25 | ) |
| Less Dividends: | | | | | | | | |
| Dividends from net investment income | | | (.56 | ) | | | (.16 | ) |
| Net asset value, end of period | | | $9.66 | | | | $9.59 | |
| Total Return(a) | | | 6.92% | | | | (2.55)% | |
| | | | | |
| Ratios/Supplemental Data: | | | | |
| Net assets, end of period (000) | | | $637 | | | | $33 | |
| Average net assets (000) | | | $186 | | | | $24 | |
| Ratios to average net assets(d): | | | | | | | | |
| Expense after waivers and/or expense reimbursement | | | 1.35% | | | | 1.36% | (e) |
| Expense before waivers and/or expense reimbursement | | | 3.37% | | | | 9.50% | (e) |
| Net investment income (loss) | | | 2.45% | | | | 3.15% | (e) |
| Portfolio turnover rate | | | 113% | | | | 98% | (f) |
| (a) | Total return does not consider the effects of sales loads. Total return is calculated assuming a purchase of a share on the first day and a sale on the last day of each period reported and includes reinvestment of dividends and distributions, if any. Total return may reflect adjustments to conform to generally accepted accounting principles. Total returns for periods less than one full year are not annualized. |
| (b) | Commencement of operations. |
| (c) | Calculated based on average shares outstanding during the period. |
| (d) | Does not include expenses of the underlying portfolios in which the Fund invests. |
See Notes to Financial Statements.
| | | | |
| Prudential Real Estate Income Fund | | | 35 | |
Financial Highlights (continued)
| | | | | | | | |
| Class C Shares | | | | |
| | | Year Ended
October 31, 2016 | | | June 3, 2015(b)
through
October 31, 2015 | |
| Per Share Operating Performance(c): | | | | | | | | |
| Net Asset Value, Beginning of Period | | | $9.58 | | | | $10.00 | |
| Income (loss) from investment operations: | | | | | | | | |
| Net investment income (loss) | | | .19 | | | | .11 | |
| Net realized and unrealized gain (loss) on investment transactions | | | .38 | | | | (.40 | ) |
| Total from investment operations | | | .57 | | | | (.29 | ) |
| Less Dividends: | | | | | | | | |
| Dividends from net investment income | | | (.49 | ) | | | (.13 | ) |
| Net asset value, end of period | | | $9.66 | | | | $9.58 | |
| Total Return(a) | | | 6.22% | | | | (2.91)% | |
| | | | | | | | |
| Ratios/Supplemental Data: | | | | |
| Net assets, end of period (000) | | | $321 | | | | $13 | |
| Average net assets (000) | | | $151 | | | | $11 | |
| Ratios to average net assets(d): | | | | | | | | |
| Expense after waivers and/or expense reimbursement | | | 2.10% | | | | 2.13% | (e) |
| Expense before waivers and/or expense reimbursement | | | 4.78% | | | | 10.11% | (e) |
| Net investment income (loss) | | | 1.98% | | | | 2.87% | (e) |
| Portfolio turnover rate | | | 113% | | | | 98% | (f) |
| (a) | Total return does not consider the effects of sales loads. Total return is calculated assuming a purchase of a share on the first day and a sale on the last day of each period reported and includes reinvestment of dividends and distributions, if any. Total return may reflect adjustments to conform to generally accepted accounting principles. Total returns for periods less than one full year are not annualized. |
| (b) | Commencement of operations. |
| (c) | Calculated based on average shares outstanding during the period. |
| (d) | Does not include expenses of the underlying portfolios in which the Fund invests. |
See Notes to Financial Statements.
| | | | | | | | |
| Class Z Shares | | | | |
| | | Year Ended
October 31, 2016 | | | June 3, 2015(b)
through
October 31, 2015 | |
| Per Share Operating Performance(c): | | | | | | | | |
| Net Asset Value, Beginning of Period | | | $9.59 | | | | $10.00 | |
| Income (loss) from investment operations: | | | | | | | | |
| Net investment income (loss) | | | .38 | | | | .16 | |
| Net realized and unrealized gain (loss) on investment transactions | | | .28 | | | | (.41 | ) |
| Total from investment operations | | | .66 | | | | (.25 | ) |
| Less Dividends: | | | | | | | | |
| Dividends from net investment income | | | (.59 | ) | | | (.16 | ) |
| Net asset value, end of period | | | $9.66 | | | | $9.59 | |
| Total Return(a) | | | 7.19% | | | | (2.47)% | |
| | | | | |
| Ratios/Supplemental Data: | | | | |
| Net assets, end of period (000) | | | $5,512 | | | | $4,886 | |
| Average net assets (000) | | | $5,008 | | | | $4,868 | |
| Ratios to average net assets(d): | | | | | | | | |
| Expense after waivers and/or expense reimbursement | | | 1.10% | | | | 1.10% | (e) |
| Expense before waivers and/or expense reimbursement | | | 4.85% | | | | 8.98% | (e) |
| Net investment income (loss) | | | 3.98% | | | | 4.08% | (e) |
| Portfolio turnover rate | | | 113% | | | | 98% | (f) |
| (a) | Total return is calculated assuming a purchase of a share on the first day and a sale on the last day of each period reported and includes reinvestment of dividends and distributions, if any. Total return may reflect adjustments to conform to generally accepted accounting principles. Total returns for periods less than one full year are not annualized. |
| (b) | Commencement of operations. |
| (c) | Calculated based on average shares outstanding during the period. |
| (d) | Does not include expenses of the underlying portfolios in which the Fund invests. |
See Notes to Financial Statements.
| | | | |
| Prudential Real Estate Income Fund | | | 37 | |
Report of Independent Registered Public Accounting Firm
The Board of Trustees and Shareholders
Prudential Investment Portfolios 9:
We have audited the accompanying statement of assets and liabilities of Prudential Real Estate Income Fund, one of the series constituting Prudential Investment Portfolios 9 (hereafter referred to as the “Fund”), including the portfolio of investments, as of October 31, 2016, and the related statement of operations for the year then ended, the statements of changes in net assets and the financial highlights for the year then ended and the period from June 3, 2015 (commencement of operations) to October 31, 2015. These financial statements and financial highlights are the responsibility of the Fund’s management. Our responsibility is to express an opinion on these financial statements and financial highlights based on our audits.
We conducted our audits in accordance with the standards of the Public Company Accounting Oversight Board (United States). Those standards require that we plan and perform the audit to obtain reasonable assurance about whether the financial statements and financial highlights are free of material misstatement. An audit includes examining, on a test basis, evidence supporting the amounts and disclosures in the financial statements. Our procedures included confirmation of securities owned as of October 31, 2016, by correspondence with the custodian, transfer agent and brokers or by other appropriate auditing procedures when replies from brokers were not received. An audit also includes assessing the accounting principles used and significant estimates made by management, as well as evaluating the overall financial statement presentation. We believe that our audits provide a reasonable basis for our opinion.
In our opinion, the financial statements and financial highlights referred to above present fairly, in all material respects, the financial position of the Fund as of October 31, 2016, and the results of its operations, the changes in its net assets, and the financial highlights for the years or periods described in the first paragraph, in conformity with U.S. generally accepted accounting principles.

New York, New York
December 19, 2016
Federal Income Tax Information (unaudited)
For the year ended October 31, 2016, the Fund reports the maximum amount allowable, but not less than 5.94% of the ordinary income dividends paid during the year as qualified dividend income in accordance with Section 854 of the Internal Revenue Code.
In January 2017, you will be advised on IRS Form 1099-DIV or substitute 1099-DIV as to the federal tax status of the dividends received by you in calendar year 2016.
INFORMATION ABOUT BOARD MEMBERS AND OFFICERS
(Unaudited)
Information about Board Members and Officers of the Fund is set forth below. Board Members who are not deemed to be “interested persons” of the Fund, as defined in the 1940 Act, are referred to as “Independent Board Members.” Board Members who are deemed to be “interested persons” of the Fund are referred to as “Interested Board Members.” The Board Members are responsible for the overall supervision of the operations of the Fund and perform the various duties imposed on the directors of investment companies by the 1940 Act. The Board in turn elects the Officers, who are responsible for administering the day-to-day operations of the Fund.
| | | | |
| Independent Board Members(1) |
Name, Address, Age Position(s) Portfolios Overseen | | Principal Occupation(s) During Past Five Years | | Other Directorships Held During Past Five Years |
Ellen S. Alberding (58) Board Member Portfolios Overseen: 89 | | President and Board Member, The Joyce Foundation (charitable foundation) (since 2002); Vice Chair, City Colleges of Chicago (community college system) (since 2011); Trustee, Skills for America’s Future (national initiative to connect employers to community colleges) (since 2011); Trustee, National Park Foundation (charitable foundation for national park system) (since 2009); Trustee, Economic Club of Chicago (since 2009). | | None. |
Kevin J. Bannon (64) Board Member Portfolios Overseen: 89 | | Managing Director (April 2008-May 2015) and Chief Investment Officer (October 2008-November 2013) of Highmount Capital LLC (registered investment adviser); formerly Executive Vice President and Chief Investment Officer (April 1993-August 2007) of Bank of New York Company; President (May 2003-May 2007) of BNY Hamilton Family of Mutual Funds. | | Director of Urstadt Biddle Properties (equity real estate investment trust) (since September 2008). |
Linda W. Bynoe (64) Board Member Portfolios Overseen: 89 | | President and Chief Executive Officer (since March 1995) and formerly Chief Operating Officer (December 1989-February 1995) of Telemat Ltd. (management consulting); formerly Vice President (January 1985-June 1989) at Morgan Stanley & Co. (broker-dealer). | | Director of Simon Property Group, Inc. (retail real estate) (May 2003-May 2012); Director of Anixter International, Inc. (communication products distributor) (since January 2006); Director of Northern Trust Corporation (financial services) (since April 2006); Trustee of Equity Residential (residential real estate) (since December 2009). |
Prudential Real Estate Income Fund
| | | | |
| Independent Board Members(1) |
Name, Address, Age Position(s) Portfolios Overseen | | Principal Occupation(s) During Past Five Years | | Other Directorships Held During Past Five Years |
Keith F. Hartstein (60) Board Member Portfolios Overseen: 89 | | Retired; Member (since November 2014) of the Governing Council of the Independent Directors Council (organization of independent mutual fund directors); formerly President and Chief Executive Officer (2005-2012), Senior Vice President
(2004-2005), Senior Vice President of Sales and Marketing (1997-2004), and various executive management positions (1990-1997), John Hancock Funds, LLC (asset management); Chairman, Investment Company Institute’s Sales Force Marketing Committee (2003-2008). | | None. |
Michael S. Hyland, CFA (71) Board Member Portfolios Overseen: 89 | | Retired (since February 2005); formerly Senior Managing Director (July 2001-February 2005) of Bear Stearns & Co, Inc.; Global Partner, INVESCO (1999-2001); Managing Director and President of Salomon Brothers Asset Management (1989-1999). | | None. |
Richard A. Redeker (73) Board Member & Independent Chair Portfolios Overseen: 89 | | Retired Mutual Fund Senior Executive (47 years); Management Consultant; Director, Mutual Fund Directors Forum (since 2014); Independent Directors Council (organization of independent mutual fund directors)-Executive Committee, Chair of Policy Steering Committee, Governing Council. | | None. |
Stephen G. Stoneburn (73) Board Member Portfolios Overseen: 89 | | Chairman (since July 2011), President and Chief Executive Officer (since June 1996) of Quadrant Media Corp. (publishing company); formerly President (June 1995-June 1996) of Argus Integrated Media, Inc.; Senior Vice President and Managing Director (January 1993-1995) of Cowles Business Media; Senior Vice President of Fairchild Publications, Inc. (1975-1989). | | None. |
Visit our website at prudentialfunds.com
| | | | |
| Interested Board Members(1) |
Name, Address, Age Position(s) Portfolios Overseen | | Principal Occupation(s) During Past Five Years | | Other Directorships Held During Past Five Years |
Stuart S. Parker (54) Board Member & President Portfolios Overseen: 89 | | President of Prudential Investments LLC (since January 2012); Executive Vice President of Prudential Investment Management Services LLC (since December 2012); Executive Vice President of Jennison Associates LLC and Head of Retail Distribution of Prudential Investments LLC (June 2005-December 2011). | | None. |
Scott E. Benjamin (43) Board Member & Vice President Portfolios Overseen: 89 | | Executive Vice President (since June 2009) of Prudential Investments LLC; Executive Vice President (June 2009-June 2012) and Vice President (since June 2012) of Prudential Investment Management Services LLC; Executive Vice President (since September 2009) of AST Investment Services, Inc.; Senior Vice President of Product Development and Marketing, Prudential Investments (since February 2006); Vice President of Product Development and Product Management, Prudential Investments (2003-2006). | | None. |
Grace C. Torres* (57) Board Member Portfolios Overseen: 87 | | Retired; formerly Treasurer and Principal Financial and Accounting Officer of the Prudential Investments Funds, Target Funds, Advanced Series Trust, Prudential Variable Contract Accounts and The Prudential Series Fund (1998-June 2014); Assistant Treasurer (March 1999-June 2014) and Senior Vice President (September 1999-June 2014) of Prudential Investments LLC; Assistant Treasurer (May 2003-June 2014) and Vice President (June 2005-June 2014) of AST Investment Services, Inc.; Senior Vice President and Assistant Treasurer (May 2003-June 2014) of Prudential Annuities Advisory Services, Inc. | | Director (since July 2015) of Sun Bancorp, Inc. N.A. |
| * | Note: Prior to her retirement in 2014, Ms. Torres was employed by Prudential Investments LLC. Due to her prior employment, she is considered to be an “interested person” under the 1940 Act. Ms. Torres is a Non-Management Interested Board Member. |
| (1) | The year that each individual joined the Board is as follows: |
Ellen S. Alberding, 2013; Linda W. Bynoe, 2005; Richard A. Redeker, 1998; Stephen G. Stoneburn, 2003; Kevin J. Bannon, 2008; Keith F. Hartstein, 2013; Michael S. Hyland, 2008; Stuart S. Parker, Board Member since 2012 and President since 2012; Scott E. Benjamin, Board Member since 2010 and Vice President since 2009; Grace C. Torres, 2014.
Prudential Real Estate Income Fund
| | | | |
| Fund Officers(a) |
Name, Address and Age Position with Fund | | Principal Occupation(s) During Past Five Years | | Length of Service as Fund Officer |
Raymond A. O’Hara (61) Chief Legal Officer | | Vice President and Corporate Counsel (since July 2010) of Prudential Insurance Company of America (Prudential); Vice President (March 2011-Present) of Pruco Life Insurance Company and Pruco Life Insurance Company of New Jersey; Vice President and Corporate Counsel (March 2011-Present) of Prudential Annuities Life Assurance Corporation; Chief Legal Officer of Prudential Investments LLC (since June 2012); Chief Legal Officer of Prudential Mutual Fund Services LLC (since June 2012) and Corporate Counsel of AST Investment Services, Inc. (since June 2012); formerly Assistant Vice President and Corporate Counsel (September 2008-July 2010) of The Hartford Financial Services Group, Inc.; formerly Associate (September 1980-December 1987) and Partner (January 1988–August 2008) of Blazzard & Hasenauer, P.C. (formerly, Blazzard, Grodd & Hasenauer, P.C.). | | Since 2012 |
Chad A. Earnst (41) Chief Compliance Officer | | Chief Compliance Officer (September 2014-Present) of Prudential Investments LLC; Chief Compliance Officer (September 2014-Present) of the Prudential Investments Funds, Target Funds, Advanced Series Trust, The Prudential Series Fund, Prudential’s Gibraltar Fund, Inc., Prudential Global Short Duration High Yield Income Fund, Inc., Prudential Short Duration High Yield Fund, Inc. and Prudential Jennison MLP Income Fund, Inc.; formerly Assistant Director (March 2010-August 2014) of the Asset Management Unit, Division of Enforcement, US Securities & Exchange Commission; Assistant Regional Director (January 2010-August 2014), Branch Chief (June 2006–December 2009) and Senior Counsel (April 2003-May 2006) of the Miami Regional Office, Division of Enforcement, US Securities & Exchange Commission. | | Since 2014 |
Deborah A. Docs (58) Secretary | | Vice President and Corporate Counsel (since January 2001) of Prudential; Vice President (since December 1996) and Assistant Secretary (since March 1999) of Prudential Investments LLC; formerly Vice President and Assistant Secretary (May 2003-June 2005) of AST Investment Services, Inc. | | Since 2004 |
Jonathan D. Shain (58) Assistant Secretary | | Vice President and Corporate Counsel (since August 1998) of Prudential; Vice President and Assistant Secretary (since May 2001) of Prudential Investments LLC; Vice President and Assistant Secretary (since February 2001) of Prudential Mutual Fund Services LLC; formerly Vice President and Assistant Secretary (May 2003-June 2005) of AST Investment Services, Inc. | | Since 2005 |
Visit our website at prudentialfunds.com
| | | | |
| Fund Officers(a) |
Name, Address and Age Position with Fund | | Principal Occupation(s) During Past Five Years | | Length of Service as Fund Officer |
Claudia DiGiacomo (42) Assistant Secretary | | Vice President and Corporate Counsel (since January 2005) of Prudential; Vice President and Assistant Secretary of Prudential Investments LLC (since December 2005); Associate at Sidley Austin Brown & Wood LLP (1999-2004). | | Since 2005 |
Andrew R. French (54) Assistant Secretary | | Vice President and Corporate Counsel (since February 2010) of Prudential; formerly Director and Corporate Counsel (2006-2010) of Prudential; Vice President and Assistant Secretary (since January 2007) of Prudential Investments LLC; Vice President and Assistant Secretary (since January 2007) of Prudential Mutual Fund Services LLC. | | Since 2006 |
Theresa C. Thompson (54) Deputy Chief Compliance Officer | | Vice President, Compliance, Prudential Investments LLC (since April 2004); and Director, Compliance, Prudential Investments LLC (2001-2004). | | Since 2008 |
Charles H. Smith (43) Anti-Money Laundering Compliance Officer | | Vice President, Corporate Compliance, Anti-Money Laundering Unit (since January 2015) of Prudential; committee member of the American Council of Life Insurers Anti-Money Laundering and Critical Infrastructure Committee (since January 2016); formerly Global Head of Economic Sanctions Compliance at AIG Property Casualty (February 2007–December 2014); Assistant Attorney General at the New York State Attorney General’s Office, Division of Public Advocacy. (August 1998—January 2007). | | Since 2016 |
M. Sadiq Peshimam (52) Treasurer and Principal Financial and Accounting Officer | | Vice President (since 2005) of Prudential Investments LLC; formerly Assistant Treasurer of funds in the Prudential Mutual Fund Complex (2006-2014). | | Since 2006 |
Peter Parrella (58) Assistant Treasurer | | Vice President (since 2007) and Director (2004-2007) within Prudential Mutual Fund Administration; formerly Tax Manager at SSB Citi Fund Management LLC (1997-2004). | | Since 2007 |
Lana Lomuti (49) Assistant Treasurer | | Vice President (since 2007) and Director (2005-2007), within Prudential Mutual Fund Administration; formerly Assistant Treasurer (December 2007-February 2014) of The Greater China Fund, Inc. | | Since 2014 |
Linda McMullin (55) Assistant Treasurer | | Vice President (since 2011) and Director (2008-2011) within Prudential Mutual Fund Administration. | | Since 2014 |
Kelly A. Coyne (48) Assistant Treasurer | | Director, Investment Operations of Prudential Mutual Fund Services LLC (since 2010). | | Since 2015 |
Prudential Real Estate Income Fund
| (a) | Excludes Mr. Parker and Mr. Benjamin, interested Board Members who also serve as President and Vice President, respectively. |
Explanatory Notes to Tables:
| • | | Board Members are deemed to be “Interested,” as defined in the 1940 Act, by reason of their affiliation with Prudential Investments LLC and/or an affiliate of Prudential Investments LLC. |
| • | | Unless otherwise noted, the address of all Board Members and Officers is c/o Prudential Investments LLC, 655 Broad Street, Newark, New Jersey 07102-4410. |
| • | | There is no set term of office for Board Members or Officers. The Board Members have adopted a retirement policy, which calls for the retirement of Board Members on December 31 of the year in which they reach the age of 75. |
| • | | “Other Directorships Held” includes only directorships of companies required to register or file reports with the SEC under the 1934 Act (that is, “public companies”) or other investment companies registered under the 1940 Act. |
| • | | “Portfolios Overseen” includes all investment companies managed by Prudential Investments LLC. The investment companies for which Prudential Investments LLC serves as manager include the Prudential Investments Mutual Funds, The Prudential Variable Contract Accounts, Target Mutual Funds, Prudential Short Duration High Yield Fund, Inc., Prudential Global Short Duration High Yield Fund, Inc., The Prudential Series Fund, Prudential’s Gibraltar Fund, Inc. and the Advanced Series Trust. |
Visit our website at prudentialfunds.com
Approval of Advisory Agreements (unaudited)
The Fund’s Board of Trustees
The Board of Trustees (the “Board”) of Prudential Real Estate Income Fund (the “Fund”)1 consists of ten individuals, seven of whom are not “interested persons” of the Fund, as defined in the Investment Company Act of 1940, as amended (the “1940 Act”) (the “Independent Trustees”). The Board is responsible for the oversight of the Fund and its operations, and performs the various duties imposed on the directors of investment companies by the 1940 Act. The Independent Trustees have retained independent legal counsel to assist them in connection with their duties. The Chair of the Board is an Independent Trustee. The Board has established three standing committees: the Audit Committee, the Nominating and Governance Committee, and the Investment Committee. Each committee is chaired by, and composed of, Independent Trustees.
Annual Approval of the Fund’s Advisory Agreements
As required under the 1940 Act, the Board determines annually whether to renew the Fund’s management agreement with Prudential Investments LLC (“PI”) and the Fund’s subadvisory agreement with PGIM, Inc. (“PGIM”), which provides subadvisory services to the Fund through its PGIM Real Estate unit (“PGIM Real Estate”). In considering the renewal of the agreements, the Board, including all of the Independent Trustees, met on June 7-9, 2016 and approved the renewal of the agreements through July 31, 2017, after concluding that the renewal of the agreements was in the best interests of the Fund and its shareholders.
In advance of the meetings, the Board requested and received materials relating to the agreements, and had the opportunity to ask questions and request further information in connection with its consideration. Among other things, the Board considered comparative fee information from PI and PGIM. Also, the Board considered comparisons with other mutual funds in relevant Peer Universes and Peer Groups, as is further discussed below.
In approving the agreements, the Board, including the Independent Trustees advised by independent legal counsel, considered the factors it deemed relevant, including the nature, quality and extent of services provided by PI and the subadviser, the performance of the Fund, the profitability of PI and its affiliates, expenses and fees, and the potential for economies of scale that may be shared with the Fund and its shareholders as the Fund’s assets grow. In their deliberations, the Trustees did not identify any single factor which alone was responsible for the Board’s decision to approve the agreements with respect to the Fund. In connection with its deliberations, the Board considered information provided by PI throughout the year at regular Board meetings, presentations from portfolio managers and other information, as well as information furnished at or in advance of the meetings on June 7-9, 2016.
| 1 | Prudential Real Estate Income Fund is a series of Prudential Investment Portfolios 9. |
| | |
| Prudential Real Estate Income Fund |
Approval of Advisory Agreements (continued)
The Trustees determined that the overall arrangements between the Fund and PI, which serves as the Fund’s investment manager pursuant to a management agreement, and between PI and PGIM, which serves as the Fund’s subadviser pursuant to the terms of a subadvisory agreement with PI, are in the best interests of the Fund and its shareholders in light of the services performed, fees charged and such other matters as the Trustees considered relevant in the exercise of their business judgment.
The material factors and conclusions that formed the basis for the Trustees’ reaching their determinations to approve the continuance of the agreements are separately discussed below.
Nature, Quality, and Extent of Services
The Board received and considered information regarding the nature, quality and extent of services provided to the Fund by PI and PGIM Real Estate. The Board considered the services provided by PI, including but not limited to the oversight of the subadviser for the Fund, as well as the provision of fund recordkeeping, compliance, and other services to the Fund. With respect to PI’s oversight of the subadviser, the Board noted that PI’s Strategic Investment Research Group (“SIRG”), which is a business unit of PI, is responsible for monitoring and reporting to PI’s senior management on the performance and operations of the subadviser. The Board also considered that PI pays the salaries of all of the officers and interested Trustees of the Fund who are part of Fund management. The Board also considered the investment subadvisory services provided by PGIM Real Estate, as well as adherence to the Fund’s investment restrictions and compliance with applicable Fund policies and procedures. The Board considered PI’s evaluation of the subadviser, as well as PI’s recommendation, based on its review of the subadviser, to renew the subadvisory agreement.
The Board considered the qualifications, backgrounds and responsibilities of PI’s senior management responsible for the oversight of the Fund and PGIM Real Estate, and also considered the qualifications, backgrounds and responsibilities of the PGIM Real Estate’s portfolio managers who are responsible for the day-to-day management of the Fund’s portfolio. The Board was provided with information pertaining to PI’s, PGIM Real Estate’s, and PGIM’s organizational structure, senior management, investment operations, and other relevant information pertaining to PI, PGIM Real Estate, and PGIM. The Board also noted that it received favorable compliance reports from the Fund’s Chief Compliance Officer (“CCO”) as to PI, PGIM Real Estate, and PGIM. The Board noted that PGIM Real Estate and PGIM are affiliated with PI.
The Board concluded that it was satisfied with the nature, extent and quality of the investment management services provided by PI and the subadvisory services provided to
| | |
| Visit our website at prudentialfunds.com | | |
the Fund by PGIM through PGIM Real Estate, and that there was a reasonable basis on which to conclude that the Fund benefits from the services provided by PI and PGIM through PGIM Real Estate under the management and subadvisory agreements.
Costs of Services and Profits Realized by PI
The Board was provided with information on the profitability of PI and its affiliates in serving as the Fund’s investment manager. The Board discussed with PI the methodology utilized in assembling the information regarding profitability and considered its reasonableness. The Board recognized that it is difficult to make comparisons of profitability from fund management contracts because comparative information is not generally publicly available and is affected by numerous factors, including the structure of the particular adviser, the types of funds it manages, its business mix, numerous assumptions regarding allocations and the adviser’s capital structure and cost of capital. However, the Board considered that the cost of services provided by PI to the Fund during the year ended December 31, 2015 exceeded the management fees paid by the Fund, resulting in an operating loss to PI. The Board further noted that the subadviser is affiliated with PI and that its profitability is reflected in PI’s profitability report. Taking these factors into account, the Board concluded that the profitability of PI and its affiliates in relation to the services rendered was not unreasonable.
Economies of Scale
PI and the Board previously retained an outside business consulting firm to review management fee breakpoint usage and trends in management fees across the mutual fund industry. The consulting firm presented its analysis and conclusions as to the Funds’ management fee structures to the Board and PI. The Board and PI have discussed these conclusions extensively since that presentation.
The Board received and discussed information concerning economies of scale that PI may realize as the Fund’s assets grow beyond current levels. The Board considered information provided by PI regarding the launch date of the Fund, the management fees of the Fund compared to those of similarly managed funds and PI’s investment in the Fund over time. The Board noted that economies of scale, if any, may be shared with the Fund in several ways, including low management fees from inception, additional technological and personnel investments to enhance shareholder services, and maintaining existing expense structures in the face of a rising cost environment. The Board considered PI’s assertion that it continually evaluates the management fee schedule of the Fund and the potential to share economies of scale through breakpoints or fee waivers as asset levels increase.
| | |
| Prudential Real Estate Income Fund |
Approval of Advisory Agreements (continued)
The Board recognized the inherent limitations of any analysis of economies of scale, stemming largely from the Board’s understanding that most of PI’s costs are not specific to individual funds, but rather are incurred across a variety of products and services.
Other Benefits to PI and PGIM
The Board considered potential ancillary benefits that might be received by PI and PGIM and their affiliates as a result of their relationship with the Fund. The Board concluded that potential benefits to be derived by PI included transfer agency fees received by the Fund’s transfer agent (which is affiliated with PI), and benefits to its reputation as well as other intangible benefits resulting from PI’s association with the Fund. The Board concluded that the potential benefits to be derived by PGIM included its ability to use soft dollar credits, as well as the potential benefits consistent with those generally resulting from an increase in assets under management, specifically, potential access to additional research resources and benefits to its reputation. The Board concluded that the benefits derived by PI and PGIM were consistent with the types of benefits generally derived by investment managers and subadvisers to mutual funds.
Performance of the Fund / Fees and Expenses
The Board considered certain additional specific factors and made related conclusions relating to the historical performance of the Fund for the quarter ended December 31, 2015. The Board considered that the Fund commenced operations on June 3, 2015 and that longer-term performance was not yet available.
The Board also considered the Fund’s actual management fee, as well as the Fund’s net total expense ratio, for the fiscal period ended October 31, 2015. The Board considered the management fee for the Fund as compared to the management fee charged by PI to other funds and the fee charged by other advisers to comparable mutual funds in a Peer Group. The actual management fee represents the fee rate actually paid by Fund shareholders and includes any fee waivers or reimbursements. The net total expense ratio for the Fund represents the actual expense ratio incurred by Fund shareholders.
The mutual funds included in the Peer Universe (the Lipper Global Real Estate Funds Performance Universe) and the Peer Group were objectively determined by Broadridge, an independent provider of mutual fund data. The comparisons placed the Fund in various quartiles, with the first quartile being the best 25% of the mutual funds (for performance, the best performing mutual funds and, for expenses, the lowest cost mutual funds).
The section below summarizes key factors considered by the Board and the Board’s conclusions regarding the Fund’s performance, fees and overall expenses. The table sets
forth gross performance comparisons (which do not reflect the impact on performance of
| | |
| Visit our website at prudentialfunds.com | | |
fund expenses, or any subsidies, expense caps or waivers that may be applicable) with the Peer Universe, actual management fees with the Peer Group (which reflect the impact of any subsidies or fee waivers), and net total expenses with the Peer Group, each of which were key factors considered by the Board.
| | | | | | | | |
| Performance | | 1 Year | | 3 Years | | 5 Years | | 10 Years |
| | | N/A | | N/A | | N/A | | N/A |
| Actual Management Fees: 1st Quartile |
| Net Total Expenses: 2nd Quartile |
| • | | The Board considered that, because the Fund commenced operations during 2015, there was less than a full year of performance to review. |
| • | | The Board and PI agreed to continue the Fund’s existing expense cap of 1.10% (exclusive of 12b-1 and certain other fees) through February 28, 2017. |
| • | | The Board concluded that in light of the above, it would be in the best interests of the Fund and its shareholders to continue to allow the Fund to create a performance record, and to renew the agreements. |
| • | | The Board concluded that the management fees (including subadvisory fees) and total expenses were reasonable in light of the services provided. |
* * *
After full consideration of these factors, the Board concluded that the approval of the agreements was in the best interests of the Fund and its shareholders.
| | |
| Prudential Real Estate Income Fund |
| | | | |
| ∎ MAIL | | ∎ TELEPHONE | | ∎ WEBSITE |
655 Broad Street Newark, NJ 07102 | | (800) 225-1852 | | www.prudentialfunds.com |
|
| PROXY VOTING |
| The Board of Trustees of the Fund has delegated to the Fund’s investment subadviser the responsibility for voting any proxies and maintaining proxy recordkeeping with respect to the Fund. A description of these proxy voting policies and procedures is available without charge, upon request, by calling (800) 225-1852 or by visiting the Securities and Exchange Commission’s website at www.sec.gov. Information regarding how the Fund voted proxies relating to portfolio securities during the most recent 12-month period ended June 30 is available on the Fund’s website and on the Securities and Exchange Commission’s website. |
|
| TRUSTEES |
| Ellen S. Alberding • Kevin J. Bannon • Scott E. Benjamin • Linda W. Bynoe • Keith F. Hartstein • Michael S. Hyland • Stuart S. Parker • Richard A. Redeker • Stephen G. Stoneburn • Grace C. Torres |
|
| OFFICERS |
| Stuart S. Parker, President • Scott E. Benjamin, Vice President • M. Sadiq Peshimam, Treasurer and Principal Financial and Accounting Officer • Raymond A. O’Hara, Chief Legal Officer • Deborah A. Docs, Secretary • Chad A. Earnst, Chief Compliance Officer • Theresa C. Thompson, Deputy Chief Compliance Officer • Charles H. Smith, Anti-Money Laundering Compliance Officer • Jonathan D. Shain, Assistant Secretary • Claudia DiGiacomo, Assistant Secretary • Andrew R. French, Assistant Secretary • Peter Parrella, Assistant Treasurer • Lana Lomuti, Assistant Treasurer • Linda McMullin, Assistant Treasurer • Kelly A. Coyne, Assistant Treasurer |
| | | | |
| MANAGER | | Prudential Investments LLC | | 655 Broad Street
Newark, NJ 07102 |
|
| INVESTMENT SUBADVISER | | PGIM Real Estate | | 7 Giralda Farms
Madison, NJ 07940 |
|
| DISTRIBUTOR | | Prudential Investment
Management Services LLC | | 655 Broad Street
Newark, NJ 07102 |
|
| CUSTODIAN | | The Bank of New York Mellon | | One Wall Street
New York, NY 10286 |
|
| TRANSFER AGENT | | Prudential Mutual Fund
Services LLC | | PO Box 9658
Providence, RI 02940 |
|
INDEPENDENT REGISTERED
PUBLIC ACCOUNTING FIRM | | KPMG LLP | | 345 Park Avenue
New York, NY 10154 |
|
| FUND COUNSEL | | Willkie Farr & Gallagher LLP | | 787 Seventh Avenue
New York, NY 10019 |
|
|
| An investor should consider the investment objectives, risks, charges, and expenses of the Fund carefully before investing. The prospectus and summary prospectus contain this and other information about the Fund. An investor may obtain a prospectus and summary prospectus by visiting our website at www.prudentialfunds.com or by calling (800) 225-1852. The prospectus and summary prospectus should be read carefully before investing. |
|
| E-DELIVERY |
| To receive your mutual fund documents online, go to www.prudentialfunds.com/edelivery and enroll. Instead of receiving printed documents by mail, you will receive notification via email when new materials are available. You can cancel your enrollment or change your email address at any time by visiting the website address above. |
|
| SHAREHOLDER COMMUNICATIONS WITH TRUSTEES |
| Shareholders can communicate directly with the Board of Trustees by writing to the Chair of the Board, Prudential Real Estate Income Fund, Prudential Investments, Attn: Board of Trustees, 655 Broad Street, Newark, NJ 07102. Shareholders can communicate directly with an individual Trustee by writing to the same address. Communications are not screened before being delivered to the addressee. |
|
| AVAILABILITY OF PORTFOLIO SCHEDULE |
| The Fund files its complete schedule of portfolio holdings with the Securities and Exchange Commission for the first and third quarters of each fiscal year on Form N-Q. The Fund’s Forms N-Q are available on the Commission’s website at www.sec.gov. The Fund’s Forms N-Q may also be reviewed and copied at the Commission’s Public Reference Room in Washington, D.C. Information on the operation and location of the Public Reference Room may be obtained by calling (202) 551-8090. The Fund’s schedule of portfolio holdings is also available on the Fund’s website as of the end of each month. |
|
| The Fund’s Statement of Additional Information contains additional information about the Fund’s Trustees and is available without charge, upon request, by calling (800) 225-1852. |
Mutual Funds:
| | | | |
ARE NOT INSURED BY THE FDIC OR ANY
FEDERAL GOVERNMENT AGENCY | | MAY LOSE VALUE | | ARE NOT A DEPOSIT OF OR GUARANTEED
BY ANY BANK OR ANY BANK AFFILIATE |
PRUDENTIAL REAL ESTATE INCOME FUND
| | | | | | |
| SHARE CLASS | | A | | C | | Z |
| NASDAQ | | PRKAX | | PRKCX | | PRKZX |
| CUSIP | | 74441J761 | | 74441J753 | | 74441J746 |
MF228E 0300086-00001-00
PRUDENTIAL INVESTMENTS, A PGIM BUSINESS | MUTUAL FUNDS
Prudential Select Real Estate Fund
| | |
| ANNUAL REPORT | | OCTOBER 31, 2016 |

| | |
To enroll in e-delivery, go to prudentialfunds.com/edelivery | |  |
|
| Objective: Capital appreciation and income |
Highlights
PRUDENTIAL SELECT REAL ESTATE FUND
| • | | Strong security selection in the US residential sector, avoiding France, and good security selection in Germany and Singapore all augmented performance. |
| • | | Weak security selection in Japan hurt relative performance against the 2.48% gain of the FTSE EPRA/NAREIT Developed Real Estate Net Index. (For a complete list of holdings, refer to the Portfolio of Investments section of this report.) |
| • | | An overweight in the United Kingdom also detracted. |
This report is not authorized for distribution to prospective investors unless preceded or accompanied by a current prospectus.
The views expressed in this report and information about the Fund’s portfolio holdings are for the period covered by this report and are subject to change thereafter.
Mutual funds are distributed by Prudential Investment Management Services LLC (PIMS), member SIPC. PGIM Real Estate is a unit of PGIM, Inc. (PGIM), a registered investment adviser. PIMS and PGIM are Prudential Financial companies. © 2016 Prudential Financial, Inc. and its related entities. The Prudential logo and the Rock symbol are service marks of Prudential Financial, Inc. and its related entities, registered in many jurisdictions worldwide.
| | |
| 2 | | Visit our website at prudentialfunds.com |
Letter from the President

Dear Shareholder:
We hope you find the annual report for the Prudential Select Real Estate Fund informative and useful. The report covers performance for the 12-month period that ended October 31, 2016.
During the reporting period, the US economy experienced modest growth.
Labor markets were healthy, and consumer confidence rose. The housing market brightened somewhat, as momentum continued for the new home market. The Federal Reserve kept interest rates unchanged at its September meeting, but pointed to the strong possibility of a rate hike in December. Internationally, concerns over Brexit—the term used to represent Britain’s decision to leave the European Union—remained in the spotlight.
Equity markets in the US were firmly in positive territory at the end of the reporting period, as US stocks posted strong gains. European stocks struggled earlier, but found some traction in the third quarter. Asian markets also advanced, and emerging markets rose sharply.
US fixed income markets experienced overall gains. High yield bonds posted very strong results. Corporate bonds and Treasuries also performed well. Accommodative monetary policy by central banks helped lift global bond markets.
Given the uncertainty in today’s investment environment, we believe that active professional portfolio management offers a potential advantage. Active managers often have the knowledge and flexibility to find the best investment opportunities in the most challenging markets.
Even so, it’s best if investment decisions are based on your long-term goals rather than on short-term market and economic developments. We also encourage you to work with an experienced financial advisor who can help you set goals, determine your tolerance for risk, build a diversified plan that’s right for you, and make adjustments when necessary.
By having Prudential Investments help you address your goals, you gain the advantage of asset managers that also manage money for many major corporations and pension funds around the world. That means you benefit from the same expertise, innovation, and attention to risk demanded by today’s most sophisticated investors.
Thank you for choosing our family of funds.
Sincerely,

Stuart S. Parker, President
Prudential Select Real Estate Fund
December 15, 2016
| | | | |
| Prudential Select Real Estate Fund | | | 3 | |
Your Fund’s Performance (unaudited)
Performance data quoted represent past performance. Past performance does not guarantee future results. The investment return and principal value of an investment will fluctuate, so that an investor’s shares, when redeemed, may be worth more or less than their original cost. Current performance may be lower or higher than the past performance data quoted. An investor may obtain performance data as of the most recent month-end by visiting our website at www.prudentialfunds.com or by calling (800) 225-1852.
| | | | | | | | |
| Cumulative Total Returns (Without Sales Charges) as of 10/31/16 | |
| | | One Year (%) | | | | Since Inception (%) | |
| Class A | | | 0.01 | | | | 8.01 (8/1/14) | |
| Class C | | | –0.63 | | | | 6.21 (8/1/14) | |
| Class Q | | | 0.30 | | | | 8.59 (8/1/14) | |
| Class Z | | | 0.36 | | | | 8.69 (8/1/14) | |
| FTSE EPRA/NAREIT Developed Real Estate Net Index* | | | 2.48 | | | | 5.84 | |
| S&P 500 Index | | | 4.49 | | | | 15.47 | |
| S&P Developed Property Net Index* | | | 3.20 | | | | 6.39 | |
| Lipper Global Real Estate Funds Average | | | 1.37 | | | | 4.76 | |
| | | | | | | | |
| Average Annual Total Returns (With Sales Charges) as of 9/30/16 | |
| | | One Year (%) | | | | Since Inception (%) | |
| Class A | | | 4.68 | | | | 2.95 (8/1/14) | |
| Class C | | | 9.04 | | | | 4.87 (8/1/14) | |
| Class Q | | | 11.13 | | | | 5.92 (8/1/14) | |
| Class Z | | | 11.27 | | | | 5.99 (8/1/14) | |
| FTSE EPRA/NAREIT Developed Real Estate Net Index* | | | 14.85 | | | | 5.47 | |
| S&P 500 Index | | | 15.41 | | | | 7.77 | |
| S&P Developed Property Net Index* | | | 15.14 | | | | 5.52 | |
| Lipper Global Real Estate Funds Average | | | 12.90 | | | | 4.80 | |
*Effective as of June 30, 2016, the Fund’s primary benchmark is the FTSE EPRA/NAREIT Developed Real Estate Net Index and the S&P Developed Property Net Index has been discontinued as a benchmark for the Fund. The Fund’s Manager believes that the FTSE EPRA/NAREIT Developed Real Estate Net Index provides a more appropriate basis for Fund performance comparisons.
| | |
| 4 | | Visit our website at prudentialfunds.com |
| | | | | | | | |
| Average Annual Total Returns (With Sales Charges) as of 10/31/16 | |
| | | One Year (%) | | | | Since Inception (%) | |
| Class A | | | –5.49 | | | | 0.91 (8/1/14) | |
| Class C | | | –1.57 | | | | 2.71 (8/1/14) | |
| Class Q | | | 0.30 | | | | 3.73 (8/1/14) | |
| Class Z | | | 0.36 | | | | 3.77 (8/ 1/14) | |
| | | | | | | | |
| Average Annual Total Returns (Without Sales Charges) as of 10/31/16 | |
| | | One Year (%) | | | | Since Inception (%) | |
| Class A | | | 0.01 | | | | 3.48 (8/1/14) | |
| Class C | | | –0.63 | | | | 2.71 (8/1/14) | |
| Class Q | | | 0.30 | | | | 3.73 (8/1/14) | |
| Class Z | | | 0.36 | | | | 3.77 (8/1/14) | |
Growth of a $10,000 Investment
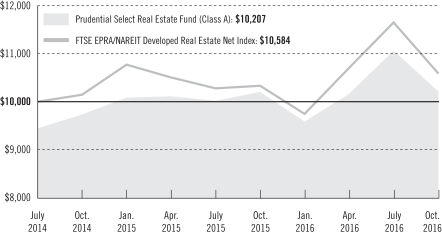
The graph compares a $10,000 investment in the Prudential Select Real Estate Fund (Class A shares) with a similar investment in the FTSE EPRA/NAREIT Developed Real Estate Net Index, by portraying the initial account values at the commencement of operations for Class A shares (August 1, 2014) and the account values at the end of the current fiscal year (October 31, 2016) as measured on a quarterly basis. For purposes of
| | | | |
| Prudential Select Real Estate Fund | | | 5 | |
Your Fund’s Performance (continued)
the graph, and unless otherwise indicated, it has been assumed that (a) the maximum applicable front-end sales charge was deducted from the initial $10,000 investment in Class A shares; (b) all recurring fees (including management fees) were deducted; and (c) all dividends and distributions were reinvested. The line graph provides information for Class A shares only. As indicated in the tables provided earlier, performance for Class C, Class Q, and Class Z shares will vary due to the differing charges and expenses applicable to each share class (as explained in the following paragraphs). Without waiver of fees and/or expense reimbursements, if any, the Fund’s returns would have been lower.
Past performance does not predict future performance. Total returns and the ending account values in the graph include changes in share price and reinvestment of dividends and capital gains distributions in a hypothetical investment for the periods shown. The Fund’s total returns do not reflect the deduction of income taxes on an individual’s investment. Taxes may reduce your actual investment returns on income or gains paid by the Fund or any gains you may realize if you sell your shares.
Source: Prudential Investments LLC and Lipper Inc.
Inception returns are provided for any share class with less than 10 calendar years of returns.
The returns in the tables do not reflect the deduction of taxes that a shareholder would pay on Fund distributions or following the redemption of Fund shares. The average annual total returns take into account applicable sales charges, which are described for each share class in the table below.
| | | | | | | | |
| | | Class A | | Class C | | Class Q | | Class Z |
| Maximum initial sales charge | | 5.50% of the public offering price | | None | | None | | None |
| Contingent deferred sales charge (CDSC) (as a percentage of the lower of original purchase price or net asset value at redemption) | | 1% on sales of $1 million or more made within 12 months of purchase | | 1% on sales made within 12 months of purchase | | None | | None |
| Annual distribution and service (12b-1) fees (shown as a percentage of average daily net assets) | | .30% (.25% currently) | | 1% | | None | | None |
| | |
| 6 | | Visit our website at prudentialfunds.com |
Benchmark Definitions
FTSE EPRA/NAREIT Developed Real Estate Net Index—The Financial Times Stock Exchange European Public Real Estate Association/National Association of Real Estate investment Trusts (FTSE EPRA/NAREIT) Developed Real Estate Net Index is unmanaged and designed to track the performance of listed real estate companies and REITs worldwide.
S&P 500 Index—The Standard & Poor’s 500 Composite Stock Price Index (S&P 500 Index) is an unmanaged index of over 500 stocks of large US public companies. It gives a broad look at how stock prices in the United States have performed.
Lipper Global Real Estate Funds Average—The Lipper Global Real Estate Funds Average (Lipper Average) includes funds that invest at least 25% but less than 75% of their equity portfolios in shares of companies engaged in the real estate industry that are strictly outside of the US or whose securities are principally traded outside of the US.
S&P Developed Property Net Index—The S&P Developed Property Net Index is an unmanaged, weighted index which measures the investable universe of publicly traded property companies domiciled in developed markets.
Investors cannot invest directly in an index or average. The returns for the Indexes would be lower if they included the effects of sales charges, operating expenses of a mutual fund, or taxes. Returns for the Lipper Average reflect the deduction of operating expenses, but not sales charges or taxes. The Since Inception returns for the Indexes and Lipper Average are measured from the closest month-end to the inception date for the indicated share class.
| | | | |
Five Largest Holdings expressed as a
percentage of net assets as of 10/31/16 (%) | |
| Federal Realty Investment Trust, Retail REITs | | | 4.0 | |
| Extra Space Storage, Inc., Specialized REITs | | | 4.0 | |
| CyrusOne, Inc., Specialized REITs | | | 3.8 | |
| Alexandria Real Estate Equities, Inc., Office REITs | | | 3.7 | |
| Sun Communities, Inc., Residential REITs | | | 3.5 | |
Holdings reflect only long-term investments and are subject to change.
| | | | |
Five Largest Industries expressed as a
percentage of net assets as of 10/31/16 (%) | |
| Residential REITs | | | 18.4 | |
| Specialized REITs | | | 15.2 | |
| Retail REITs | | | 14.0 | |
| Office REITs | | | 12.8 | |
| Diversified REITs | | | 12.7 | |
Industry weightings reflect only long-term investments and are subject to change.
| | | | |
| Prudential Select Real Estate Fund | | | 7 | |
Strategy and Performance Overview
How Did The Fund Perform?
The Prudential Select Real Estate Fund’s Class A shares were flat at 0.01% for the 12-months ended October 31, 2016, trailing the 2.48% gain of the FTSE EPRA/NAREIT Developed Real Estate Net Index (Index), and the 1.37% gain of the Lipper Global Real Estate Funds Average.
What were conditions in the global real estate securities market?
| • | | In the United States, shifting views about global economic growth, changing interest rates, and concerns over where the real estate cycle is now, and continued strong real estate fundamentals affected returns. Employment growth created ample demand to absorb vacancies and to create pricing power, but not enough to generate additional supply, which remains near historical lows. The exception is new multifamily units, which are in line with their long-term average growth. |
| • | | Europe has been the global region with the weakest performance over the last 12 months. The primary reason for this lagging performance was the shock referendum result in the UK in June in favor of leaving the European Union. This caught the market by surprise and caused a severe correction in share prices and the value of the British pound against the US dollar, depressing Fund returns. The Fund sold a significant portion of its UK office exposure in the weeks leading up to the referendum because the management team was not comfortable with the risk/reward trade-off for both stock prices and the value of the currency. In the rest of Europe, underlying economic growth has been slow outside of Germany, Ireland, Spain, and Sweden. However, the very low interest rate environment created downward pressure on capitalization rates (the rate of return on a real estate investment property based on the expected income that the property will generate) across the region, especially for core properties in the more liquid markets. Foreign investor demand has been strong, in advance of the emergence of clear rental growth momentum. Central banks have been forced to extend and expand their monetary stimulus in both the eurozone and the UK, further supporting real estate values. |
| • | | In Asia, the implied capitalization rates remain compressed because of low interest rates and investment from North Asia. The implied capitalization rate is the net operating income of the REIT divided it by the market capitalization. Nonetheless, the spread between public market prices and private real estate values continues to widen as sales of commercial assets remain near their all-time high. The most robust market was Singapore, while Japan was the most subdued. Chinese capital continued to pour into the Hong Kong commercial real estate market, motivated in part by concerns that China’s currency may fall further. Landlords are the beneficiaries of the current lack of office availability in Hong Kong Central, Tokyo, and Sydney. Large new supply is expected in Tokyo and Singapore over the next 12 to 18 months and some tenants in older buildings are relocating. |
| | |
| 8 | | Visit our website at prudentialfunds.com |
What didn’t work?
| • | | The Fund’s underperformance was driven by weak stock selection in the Asia Pacific region, particularly in Japan, although holdings in Hong Kong and Australia also detracted. |
| • | | An overweight allocation to the United Kingdom compared with Fund’s benchmark hurt its relative performance in Europe. Although overall performance in North America was good, positions in the Office and Data Center sectors had a negative impact on relative performance. |
What worked?
| • | | In the United States, the Residential sector performed well, while the Specialty sector had a smaller positive impact. |
| • | | In Europe, performance relative to the benchmarks was helped by the absence of exposure to France and by good stock selection in Germany. |
| • | | In Asia, stock selection in Singapore was strong. |
Current outlook
| • | | In the US, REITs should experience continued improvement in operating fundamentals and have the potential to deliver double-digit dividend and high-single-digit cash flow growth in the next 12 months. A slow growth, lower rates for the longer-term bodes well for US REITs. US REITs offer a valuable combination of income and growth in a volatile market. The Fund is positioned to focus on companies with strong relative internal cash flow growth and strong balance sheets that trade at reasonable valuations relative to their private market value. |
| • | | In Europe, the Fund maintains an underweight position to the London office sector, in particular due to the still high degree of uncertainty surrounding the process of the UK’s exit from the European Union (EU) and its economic (and possibly political) consequences. The Fund continues to look for attractively valued stocks in continental Europe that will benefit from the recently expanded quantitative easing measures of the European Central Bank and signs of rental market recovery in selected continental markets that have bottomed out and are showing initial evidence of rental recovery, such as Spanish and French offices. |
| • | | In Asia, particularly Japan, developers remain weak on a perceived lack of momentum in recent stimulus attempts and the country’s attempts to grow the economy. In addition, recent weak data in condominium sales has added to the pessimistic outlook. The prospect of an imminent Federal Reserve hike leading to renewed yen weakness should lead help developer share prices. In the interim, the Fund is adhering to a more cautious stance in the developers. The management team also remains selective in the Japan REIT sector, owing to their strong relative performance to the developers and lower expectations of incremental Bank of Japan (BOJ) action. The Fund’s preference remains with the hotel and retail Japanese REITs on the premise that they are prime beneficiaries of the improving tourism landscape—offering both organic and acquisition growth. |
| | | | |
| Prudential Select Real Estate Fund | | | 9 | |
Strategy and Performance Overview (continued)
The percentage points shown in the tables identify each security’s positive or negative contribution to the Fund’s return, which is the sum of all contributions by individual holdings.
| | | | | | |
| Top Contributors (%) | | Top Detractors (%) |
| Duke Realty Corporation | | 0.56 | | Empiric Student Property PLC | | –0.47 |
| Sun Communities, Inc. | | 0.49 | | First Potomac Realty Trust | | –0.53 |
| Community Healthcare Trust, Inc. | | 0.47 | | Great Portland Estates PLC | | –0.67 |
| Hudson Pacific Properties, Inc. | | 0.43 | | British Land Company PLC | | –0.71 |
| Sun Hung Kai Properties Limited | | 0.40 | | Mitsui Fudosan Co., Ltd. | | –1.03 |
| | |
| 10 | | Visit our website at prudentialfunds.com |
Comments on Largest Holdings
| 4.0% | Federal Realty Investment Trust, Retail REITs |
Federal Realty Investment Trust is a self-administered real estate investment trust. The specializes in the ownership, management, development, and redevelopment of prime community and neighborhood shopping centers.
| 4.0% | Extra Space Storage, Inc., Specialized REITs |
Extra Space Storage Inc. is a fully integrated, self-administered, and self-managed real estate investment trust. The Company owns, operates, acquires, develops, and redevelops professionally managed self-storage properties.
| 3.8% | CyrusOne, Inc., Specialized REITs |
CyrusOne Inc. is an owner, operator, and developer of enterprise-class, carrier-neutral data center properties. The Company provides mission-critical data center facilities that protect and ensure the continued operation of IT infrastructure.
| 3.7% | Alexandria Real Estate Equities, Inc., Office REITs |
Alexandria Real Estate Equities, Inc. acquires, manages, expands, and develops office and laboratory space properties. The Company leases its properties to pharmaceutical, biotechnology, diagnostic and personal care products companies, research institutions, and related government agencies. Properties are located in California, suburban Washington D.C., New England, the Mideast, and Southeast.
| 3.5% | Sun Communities, Inc., Residential REITs |
Sun Communities, Inc. is a real estate investment trust that currently owns and operates a portfolio of manufactured housing communities primarily in the midwest and southeast United States.
| | | | |
| Prudential Select Real Estate Fund | | | 11 | |
Fees and Expenses (unaudited)
As a shareholder of the Fund, you incur two types of costs: (1) transaction costs, including sales charges (loads) on purchase payments and redemptions, as applicable, and (2) ongoing costs, including management fees, distribution, and/or service (12b-1) fees, and other Fund expenses, as applicable. This example is intended to help you understand your ongoing costs (in dollars) of investing in the Fund and to compare these costs with the ongoing costs of investing in other mutual funds.
The example is based on an investment of $1,000 invested on May 1, 2016, at the beginning of the period, and held through the six-month period ended October 31, 2016. The example is for illustrative purposes only; you should consult the Prospectus for information on initial and subsequent minimum investment requirements.
Actual Expenses
The first line for each share class in the table on the following page provides information about actual account values and actual expenses. You may use the information on this line, together with the amount you invested, to estimate the expenses that you paid over the period. Simply divide your account value by $1,000 (for example, an $8,600 account value ÷ $1,000 = 8.6), then multiply the result by the number on the first line under the heading “Expenses Paid During the Six-Month Period” to estimate the expenses you paid on your account during this period.
Hypothetical Example for Comparison Purposes
The second line for each share class in the table on the following page provides information about hypothetical account values and hypothetical expenses based on the Fund’s actual expense ratio and an assumed rate of return of 5% per year before expenses, which is not the Fund’s actual return. The hypothetical account values and expenses may not be used to estimate the actual ending account balance or expenses you paid for the period. You may use this information to compare the ongoing costs of investing in the Fund and other funds. To do so, compare this 5% hypothetical example with the 5% hypothetical examples that appear in the shareholder reports of the other funds.
The Fund’s transfer agent may charge additional fees to holders of certain accounts that are not included in the expenses shown in the table on the following page. These fees apply to individual retirement accounts (IRAs) and Section 403(b) accounts. As of the close of the period covered by the table, IRA fees included an annual maintenance fee of $15 per account (subject to a maximum annual maintenance fee of $25 for all accounts held by the same shareholder). Section 403(b) accounts are charged an annual $25 fiduciary maintenance fee. Some of the fees may vary in amount, or may be waived, based on your total account balance or the number of Prudential Investments funds, including the Fund, that you own. You should consider the additional fees that were charged to your Fund account over the six-month period when you estimate the total ongoing expenses paid over
| | |
| 12 | | Visit our website at prudentialfunds.com |
the period and the impact of these fees on your ending account value, as these additional expenses are not reflected in the information provided in the expense table. Additional fees have the effect of reducing investment returns.
Please note that the expenses shown in the table are meant to highlight your ongoing costs only and do not reflect any transactional costs such as sales charges (loads). Therefore, the second line for each share class in the table is useful in comparing ongoing costs only and will not help you determine the relative total costs of owning different funds. In addition, if these transactional costs were included, your costs would have been higher.
| | | | | | | | | | | | | | | | | | |
Prudential Select
Real Estate Fund | | Beginning Account
Value
May 1, 2016 | | | Ending Account
Value
October 31, 2016 | | | Annualized
Expense Ratio
Based on the
Six-Month Period | | | Expenses Paid
During the
Six-Month Period* | |
| Class A | | Actual | | $ | 1,000.00 | | | $ | 1,004.10 | | | | 1.31 | % | | $ | 6.60 | |
| | Hypothetical | | $ | 1,000.00 | | | $ | 1,018.55 | | | | 1.31 | % | | $ | 6.65 | |
| Class C | | Actual | | $ | 1,000.00 | | | $ | 1,000.30 | | | | 2.06 | % | | $ | 10.36 | |
| | Hypothetical | | $ | 1,000.00 | | | $ | 1,014.78 | | | | 2.06 | % | | $ | 10.43 | |
| Class Q | | Actual | | $ | 1,000.00 | | | $ | 1,005.40 | | | | 1.06 | % | | $ | 5.34 | |
| | Hypothetical | | $ | 1,000.00 | | | $ | 1,019.81 | | | | 1.06 | % | | $ | 5.38 | |
| Class Z | | Actual | | $ | 1,000.00 | | | $ | 1,005.30 | | | | 1.06 | % | | $ | 5.34 | |
| | | Hypothetical | | $ | 1,000.00 | | | $ | 1,019.81 | | | | 1.06 | % | | $ | 5.38 | |
*Fund expenses (net of fee waivers or subsidies, if any) for each share class are equal to the annualized expense ratio for each share class (provided in the table), multiplied by the average account value over the period, multiplied by the 184 days in the six-month period ended October 31, 2016, and divided by the 366 days in the Fund’s fiscal year ended October 31, 2016 (to reflect the six-month period). Expenses presented in the table include the expenses of any underlying portfolios in which the Fund may invest.
The Fund’s annual expense ratios for the 12-month period ended October 31, 2016, are as follows:
| | | | |
| Class | | Gross Operating Expenses (%) | | Net Operating Expenses (%) |
| A | | 4.81 | | 1.33 |
| C | | 5.64 | | 2.08 |
| Q | | 4.40 | | 1.08 |
| Z | | 4.82 | | 1.08 |
Net operating expenses shown above reflect any fee waivers and/or expense reimbursements. Additional information on Fund expenses and any fee waivers and/or expense reimbursements can be found in the “Financial Highlights” tables in this report and in the Notes to the Financial Statements in this report.
| | | | |
| Prudential Select Real Estate Fund | | | 13 | |
Portfolio of Investments
as of October 31, 2016
| | | | | | | | |
| Description | | Shares | | | Value (Note 1) | |
LONG-TERM INVESTMENTS 94.9% | | | | | | | | |
| | |
COMMON STOCKS | | | | | | | | |
| | |
Diversified Real Estate Activities 4.8% | | | | | | | | |
Sumitomo Realty & Development Co. Ltd. (Japan) | | | 4,000 | | | $ | 105,143 | |
Sun Hung Kai Properties Ltd. (Hong Kong) | | | 11,770 | | | | 175,269 | |
| | | | | | | | |
| | | | | | | 280,412 | |
| | |
Diversified REITs 12.7% | | | | | | | | |
Activia Properties, Inc. (Japan) | | | 25 | | | | 121,311 | |
Empire State Realty Trust, Inc. (Class A Stock) | | | 4,440 | | | | 86,891 | |
First Potomac Realty Trust | | | 16,194 | | | | 144,451 | |
Hibernia REIT PLC (Ireland) | | | 65,000 | | | | 91,533 | |
Land Securities Group PLC (United Kingdom) | | | 6,750 | | | | 82,422 | |
STORE Capital Corp. | | | 4,160 | | | | 113,526 | |
Suntec Real Estate Investment Trust (Singapore) | | | 84,650 | | | | 102,240 | |
| | | | | | | | |
| | | | | | | 742,374 | |
| | |
Health Care REITs 7.5% | | | | | | | | |
Community Healthcare Trust, Inc. | | | 2,511 | | | | 56,196 | |
MedEquities Realty Trust, Inc.* | | | 15,390 | | | | 178,370 | |
Physicians Realty Trust | | | 5,820 | | | | 115,062 | |
Ventas, Inc. | | | 1,323 | | | | 89,633 | |
| | | | | | | | |
| | | | | | | 439,261 | |
| | |
Hotel & Resort REITs 4.7% | | | | | | | | |
DiamondRock Hospitality Co. | | | 16,300 | | | | 149,145 | |
MGM Growth Properties LLC (Class A Stock) | | | 4,700 | | | | 123,704 | |
| | | | | | | | |
| | | | | | | 272,849 | |
| | |
Industrial REITs 3.6% | | | | | | | | |
LaSalle Logiport REIT (Japan) | | | 44 | | | | 46,680 | |
Rexford Industrial Realty, Inc. | | | 5,566 | | | | 117,220 | |
Segro PLC (United Kingdom) | | | 8,000 | | | | 42,849 | |
| | | | | | | | |
| | | | | | | 206,749 | |
| | |
Office REITs 12.8% | | | | | | | | |
Alexandria Real Estate Equities, Inc. | | | 1,974 | | | | 212,817 | |
Great Portland Estates PLC (United Kingdom) | | | 5,870 | | | | 42,592 | |
Hudson Pacific Properties, Inc. | | | 4,000 | | | | 134,480 | |
Keppel REIT (Singapore) | | | 137,630 | | | | 107,947 | |
New York REIT, Inc. | | | 14,561 | | | | 137,165 | |
Vornado Realty Trust | | | 1,220 | | | | 113,192 | |
| | | | | | | | |
| | | | | | | 748,193 | |
See Notes to Financial Statements.
| | | | |
| Prudential Select Real Estate Fund | | | 15 | |
Portfolio of Investments (continued)
as of October 31, 2016
| | | | | | | | |
| Description | | Shares | | | Value (Note 1) | |
| | |
Real Estate Development 1.2% | | | | | | | | |
Kennedy Wilson Europe Real Estate PLC (United Kingdom) | | | 5,700 | | | $ | 70,752 | |
| | |
Residential REITs 18.4% | | | | | | | | |
American Campus Communities, Inc. | | | 2,800 | | | | 145,908 | |
Empiric Student Property PLC (United Kingdom) | | | 83,283 | | | | 112,953 | |
Equity LifeStyle Properties, Inc. | | | 1,980 | | | | 150,163 | |
Equity Residential | | | 2,180 | | | | 134,615 | |
Essex Property Trust, Inc. | | | 396 | | | | 84,780 | |
Irish Residential Properties REIT PLC (Ireland) | | | 73,398 | | | | 94,648 | |
Monogram Residential Trust, Inc. | | | 14,020 | | | | 147,771 | |
Sun Communities, Inc. | | | 2,613 | | | | 201,018 | |
| | | | | | | | |
| | | | | | | 1,071,856 | |
| | |
Retail REITs 14.0% | | | | | | | | |
British Land Co. PLC (The) (United Kingdom) | | | 10,750 | | | | 76,964 | |
Equity One, Inc. | | | 3,056 | | | | 87,096 | |
Federal Realty Investment Trust | | | 1,590 | | | | 230,916 | |
General Growth Properties, Inc. | | | 6,705 | | | | 167,290 | |
Kenedix Retail REIT Corp. (Japan) | | | 33 | | | | 79,653 | |
Retail Properties of America, Inc. (Class A Stock) | | | 10,989 | | | | 171,099 | |
| | | | | | | | |
| | | 813,018 | |
| | |
Specialized REITs 15.2% | | | | | | | | |
CoreSite Realty Corp. | | | 1,500 | | | | 110,610 | |
CyrusOne, Inc. | | | 4,979 | | | | 222,113 | |
Extra Space Storage, Inc. | | | 3,145 | | | | 230,057 | |
Four Corners Property Trust, Inc. | | | 9,990 | | | | 200,599 | |
Life Storage, Inc. | | | 1,500 | | | | 120,975 | |
| | | | | | | | |
| | | 884,354 | |
TOTAL LONG-TERM INVESTMENTS
(cost $5,692,661) | | | | 5,529,818 | |
| | | | | | | | |
SHORT-TERM INVESTMENT 6.4% | | | | | | | | |
| | |
AFFILIATED MUTUAL FUND | | | | | | | | |
Prudential Investment Portfolios 2 - Prudential Core Ultra Short Bond Fund
(cost $370,295)(Note 3)(a) | | | 370,295 | | | | 370,295 | |
| | | | | | | | |
TOTAL INVESTMENTS 101.3%
(cost $6,062,956) (Note 5) | | | | 5,900,113 | |
Liabilities in excess of other assets (1.3)% | | | | (76,672 | ) |
| | | | | | | | |
NET ASSETS 100.0% | | | $ | 5,823,441 | |
| | | | | | | | |
See Notes to Financial Statements.
The following abbreviations are used in the annual report:
REITs—Real Estate Investment Trusts
L1—Level 1
L2—Level 2
| * | Non-income producing security. |
| (a) | Prudential Investments LLC, the manager of the Fund, also serves as manager of the Prudential Investment |
| | Portfolios 2 - Prudential Core Ultra Short Bond Fund. |
Various inputs are used in determining the value of the Fund’s investments. These inputs are summarized in the three broad levels listed below.
Level 1—quoted prices generally in active markets for identical securities.
Level 2—quoted prices for similar securities, interest rates and yield curves, prepayment speeds, foreign currency exchange rates and other observable inputs.
Level 3—unobservable inputs for securities valued in accordance with Board approved fair valuation procedures.
The following is a summary of the inputs used as of October 31, 2016 in valuing such portfolio securities:
| | | | | | | | | | | | |
| | | Level 1 | | | Level 2 | | | Level 3 | |
Investments in Securities | | | | | | | | | | | | |
Common Stocks | | | | | | | | | | | | |
Diversified Real Estate Activities | | $ | — | | | $ | 280,412 | | | $ | — | |
Diversified REITs | | | 344,868 | | | | 397,506 | | | | — | |
Health Care REITs | | | 439,261 | | | | — | | | | — | |
Hotel & Resort REITs | | | 272,849 | | | | — | | | | — | |
Industrial REITs | | | 117,220 | | | | 89,529 | | | | — | |
Office REITs | | | 597,654 | | | | 150,539 | | | | — | |
Real Estate Development | | | — | | | | 70,752 | | | | — | |
Residential REITs | | | 864,255 | | | | 207,601 | | | | — | |
Retail REITs | | | 656,401 | | | | 156,617 | | | | — | |
Specialized REITs | | | 884,354 | | | | — | | | | — | |
Affiliated Mutual Fund | | | 370,295 | | | | — | | | | — | |
| | | | | | | | | | | | |
Total | | $ | 4,547,157 | | | $ | 1,352,956 | | | $ | — | |
| | | | | | | | | | | | |
It is the Fund’s policy to recognize transfers in and transfers out at the fair value as of the beginning of period. Securities transferred levels as follows:
| | | | | | | | | | | | |
Investments in Securities | | Amount Transferred | | | Level Transfer | | | Logic | |
Common Stocks | | $ | 204,312 | | | | L1 to L2 | | | | Official Close to Model Price | |
See Notes to Financial Statements.
| | | | |
| Prudential Select Real Estate Fund | | | 17 | |
Portfolio of Investments (continued)
as of October 31, 2016
The industry classification of investments and liabilities in excess of other assets shown as a percentage of net assets as of October 31, 2016 were as follows (unaudited):
| | | | |
Residential REITs | | | 18.4 | % |
Specialized REITs | | | 15.2 | |
Retail REITs | | | 14.0 | |
Office REITs | | | 12.8 | |
Diversified REITs | | | 12.7 | |
Health Care REITs | | | 7.5 | |
Affiliated Mutual Fund | | | 6.4 | |
Diversified Real Estate Activities | | | 4.8 | |
Hotel & Resort REITs | | | 4.7 | % |
Industrial REITs | | | 3.6 | |
Real Estate Development | | | 1.2 | |
| | | | |
| | | 101.3 | |
Liabilities in excess of other assets | | | (1.3 | ) |
| | | | |
| | | 100.0 | % |
| | | | |
See Notes to Financial Statements.
This Page Intentionally Left Blank
Statement of Assets & Liabilities
as of October 31, 2016
| | | | |
Assets | |
Investments at value: | | | | |
Unaffiliated investments (cost $5,692,661) | | $ | 5,529,818 | |
Affiliated investments (cost $370,295) | | | 370,295 | |
Dividends receivable | | | 7,712 | |
Prepaid expenses and other assets | | | 829 | |
| | | | |
Total assets | | | 5,908,654 | |
| | | | |
| |
Liabilities | | | | |
Payable for investments purchased | | | 46,422 | |
Accrued expenses and other liabilities | | | 32,503 | |
Management fee payable | | | 6,085 | |
Affiliated transfer agent fee payable | | | 115 | |
Distribution fee payable | | | 88 | |
| | | | |
Total liabilities | | | 85,213 | |
| | | | |
| |
Net Assets | | $ | 5,823,441 | |
| | | | |
| | | | | |
Net assets were comprised of: | | | | |
Shares of beneficial interest, at par | | $ | 589 | |
Paid-in capital in excess of par | | | 5,906,649 | |
| | | | |
| | | 5,907,238 | |
Distributions in excess of net investment income | | | (14,329 | ) |
Accumulated net realized gain on investment and foreign currency transactions | | | 93,552 | |
Net unrealized depreciation on investments and foreign currencies | | | (163,020 | ) |
| | | | |
Net assets, October 31, 2016 | | $ | 5,823,441 | |
| | | | |
See Notes to Financial Statements.
| | | | |
|
Class A | |
Net asset value and redemption price per share,
($184,808 ÷ 18,474 shares of beneficial interest issued and outstanding) | | $ | 10.00 | |
Maximum sales charge (5.50% of offering price) | | | 0.58 | |
| | | | |
Maximum offering price to public | | $ | 10.58 | |
| | | | |
| |
Class C | | | | |
Net asset value, offering price and redemption price per share,
($58,992 ÷ 5,937 shares of beneficial interest issued and outstanding) | | $ | 9.94 | |
| | | | |
| |
Class Q | | | | |
Net asset value, offering price and redemption price per share,
($5,441,231 ÷ 550,651 shares of beneficial interest issued and outstanding) | | $ | 9.88 | |
| | | | |
| |
Class Z | | | | |
Net asset value, offering price and redemption price per share,
($138,410 ÷ 13,810 shares of beneficial interest issued and outstanding) | | $ | 10.02 | |
| | | | |
See Notes to Financial Statements.
| | | | |
| Prudential Select Real Estate Fund | | | 21 | |
Statement of Operations
Year Ended October 31, 2016
| | | | |
Net Investment Income (Loss) | |
Income | | | | |
Unaffiliated dividend income (net of foreign withholding taxes $5,776) | | $ | 185,325 | |
Affiliated dividend income | | | 946 | |
| | | | |
Total income | | | 186,271 | |
| | | | |
| |
Expenses | | | | |
Management fee | | | 51,303 | |
Distribution fee—Class A | | | 357 | |
Distribution fee—Class C | | | 483 | |
Registration fees | | | 57,000 | |
Custodian and accounting fees | | | 49,000 | |
Audit fee | | | 29,000 | |
Shareholders’ reports | | | 22,000 | |
Legal fees and expenses | | | 17,000 | |
Trustees’ fees | | | 8,000 | |
Transfer agent’s fees and expenses (including affiliated expense of $540) | | | 1,000 | |
Insurance expenses | | | 1,000 | |
Miscellaneous | | | 17,106 | |
| | | | |
Total expenses | | | 253,249 | |
Less: Management fee waiver and/or expense reimbursement | | | (190,505 | ) |
Distribution fee waiver—Class A | | | (59 | ) |
| | | | |
Net expenses | | | 62,685 | |
| | | | |
Net investment income (loss) | | | 123,586 | |
| | | | |
| |
Realized And Unrealized Gain (Loss) On Investment And Foreign Currency Transactions | | | | |
Net realized gain (loss) on: | | | | |
Investment transactions | | | 143,113 | |
Foreign currency transactions | | | (1,961 | ) |
| | | | |
| | | 141,152 | |
| | | | |
Net change in unrealized appreciation (depreciation) on: | | | | |
Investments | | | (262,342 | ) |
Foreign currencies | | | (150 | ) |
| | | | |
| | | (262,492 | ) |
| | | | |
Net gain (loss) on investment and foreign currency transactions | | | (121,340 | ) |
| | | | |
Net Increase (Decrease) In Net Assets Resulting From Operations | | $ | 2,246 | |
| | | | |
See Notes to Financial Statements.
Statement of Changes in Net Assets
| | | | | | | | |
| | | Year Ended October 31, | |
| | | 2016 | | | 2015 | |
Increase (Decrease) in Net Assets | | | | | | | | |
Operations | | | | | | | | |
Net investment income (loss) | | $ | 123,586 | | | $ | 51,391 | |
Net realized gain (loss) on investment and foreign currency transactions | | | 141,152 | | | | 221,338 | |
Net change in unrealized appreciation (depreciation) on investments and foreign currencies | | | (262,492 | ) | | | (4,864 | ) |
| | | | | | | | |
Net increase (decrease) in net assets resulting from operations | | | 2,246 | | | | 267,865 | |
| | | | | | | | |
| | |
Dividends and Distributions (Note 1) | | | | | | | | |
Dividends from net investment income | | | | | | | | |
Class A | | | (3,136 | ) | | | — | |
Class C | | | (677 | ) | | | — | |
Class Q | | | (184,388 | ) | | | (51,503 | ) |
Class Z | | | (4,261 | ) | | | — | |
| | | | | | | | |
| | | (192,462 | ) | | | (51,503 | ) |
| | | | | | | | |
Distributions from net realized gains | | | | | | | | |
Class A | | | (3,969 | ) | | | (160 | ) |
Class C | | | (1,433 | ) | | | (322 | ) |
Class Q | | | (215,530 | ) | | | (43,237 | ) |
Class Z | | | (5,495 | ) | | | (87 | ) |
| | | | | | | | |
| | | (226,427 | ) | | | (43,806 | ) |
| | | | | | | | |
| | |
Fund share transactions (Net of share conversions)(Note 6) | | | | | | | | |
Net proceeds from shares sold | | | 341,596 | | | | 184,146 | |
Net asset value of shares issued in reinvestment of dividends and distributions | | | 418,881 | | | | 95,307 | |
Cost of shares reacquired | | | (147,504 | ) | | | (27,737 | ) |
| | | | | | | | |
Net increase (decrease) in net assets from Fund share transactions | | | 612,973 | | | | 251,716 | |
| | | | | | | | |
Total increase (decrease) | | | 196,330 | | | | 424,272 | |
| | |
Net Assets: | | | | | | | | |
Beginning of year | | | 5,627,111 | | | | 5,202,839 | |
| | | | | | | | |
End of year(a) | | $ | 5,823,441 | | | $ | 5,627,111 | |
| | | | | | | | |
(a) Includes undistributed net investment income of: | | $ | — | | | $ | 38,178 | |
| | | | | | | | |
See Notes to Financial Statements.
| | | | |
| Prudential Select Real Estate Fund | | | 23 | |
Notes to Financial Statements
Prudential Investment Portfolios 9 (the “Trust”) is an open-end management investment company, registered under the Investment Company Act of 1940, as amended (“1940 Act”). The Trust currently consists of four portfolios: Prudential Select Real Estate Fund (the “Fund”), Prudential QMA Large-Cap Core Equity Fund, Prudential Absolute Return Bond Fund and Prudential Real Estate Income Fund. These financial statements relate only to Prudential Select Real Estate Fund. The financial statements of the other portfolios are not presented herein. The Trust was organized as a Delaware business trust on September 18, 1998. The Fund commenced operations on August 1, 2014.
The Fund’s investment objective is to seek capital appreciation and income.
Note 1. Accounting Policies
The Fund follows investment company accounting and reporting guidance of the Financial Accounting Standards Board (“FASB”) Accounting Standard Codification Topic 946 Financial Services—Investment Companies. The following accounting policies conform to U.S. generally accepted accounting principles. The Fund consistently follows such policies in the preparation of its financial statements.
Securities Valuation: The Fund holds securities and other assets that are fair valued at the close of each day (generally, 4:00 PM Eastern time) the New York Stock Exchange (“NYSE”) is open for trading. Fair value is the price that would be received to sell an asset or paid to transfer a liability in an orderly transaction between market participants on the measurement date. The Board of Trustees (the “Board”) has adopted Valuation Procedures for security valuation under which fair valuation responsibilities have been delegated to Prudential Investments LLC (“PI” or “Manager”). Under the current Valuation Procedures, the established Valuation Committee is responsible for supervising the valuation of portfolio securities and other assets. The Valuation Procedures permit the Fund to utilize independent pricing vendor services, quotations from market makers, and alternative valuation methods when market quotations are either not readily available or not deemed representative of fair value. A record of the Valuation Committee’s actions is subject to the Board’s review, approval, and ratification at its next regularly-scheduled quarterly meeting.
Various inputs determine how the Fund’s investments are valued, all of which are categorized according to the three broad levels (Level 1, 2, or 3) detailed in the table following the Portfolio of Investments.
Common and preferred stocks, exchange-traded funds, and derivative instruments such as futures or options that are traded on a national securities exchange are valued at the last sale price as of the close of trading on the applicable exchange where the security
principally trades. Securities traded via NASDAQ are valued at the NASDAQ official closing price. To the extent these securities are valued at the last sale price or NASDAQ official closing price, they are classified as Level 1 in the fair value hierarchy. In the event that no sale or official closing price on valuation date exists, these securities are generally valued at the mean between the last reported bid and ask prices, or at the last bid price in the absence of an ask price. These securities are classified as Level 2 in the fair value hierarchy.
Common and preferred stocks traded on foreign securities exchanges are valued using pricing vendor services that provide model prices derived using adjustment factors based on information such as local closing price, relevant general and sector indices, currency fluctuations, depositary receipts, and futures, as applicable. Securities valued using such model prices are classified as Level 2 in the fair value hierarchy. The models generate an evaluated adjustment factor for each security, which is applied to the local closing price to adjust it for post closing market movements. Utilizing that evaluated adjustment factor, the vendor provides an evaluated price for each security. If the vendor does not provide an evaluated price, securities are valued in accordance with exchange traded common and preferred stocks discussed above.
Participatory notes (“P-notes”) are generally valued based upon the value of a related underlying security that trades actively in the market and are classified as Level 2 in the fair value hierarchy.
Investments in open-end, non-exchange-traded mutual funds are valued at their net asset values as of the close of the NYSE on the date of valuation. These securities are classified as Level 1 in the fair value hierarchy since they may be purchased or sold at their net asset values on the date of valuation.
Securities and other assets that cannot be priced according to the methods described above are valued based on pricing methodologies approved by the Board. In the event that unobservable inputs are used when determining such valuations, the securities will be classified as Level 3 in the fair value hierarchy.
When determining the fair value of securities, some of the factors influencing the valuation include: the nature of any restrictions on disposition of the securities; assessment of the general liquidity of the securities; the issuer’s financial condition and the markets in which it does business; the cost of the investment; the size of the holding and the capitalization of the issuer; the prices of any recent transactions or bids/offers for such securities or any comparable securities; any available analyst media or other reports or information deemed reliable by the investment adviser regarding the issuer or the markets or industry in which it operates. Using fair value to price securities may result in a value that is different from a security’s most recent closing price and from the price used by other mutual funds to calculate their net asset values.
| | | | |
| Prudential Select Real Estate Fund | | | 25 | |
Notes to Financial Statements (continued)
Foreign Currency Translation: The books and records of the Fund are maintained in U.S. dollars. Foreign currency amounts are translated into U.S. dollars on the following basis:
(i) market value of investment securities, other assets and liabilities at the current daily rates of exchange;
(ii) purchases and sales of investment securities, income and expenses at the rates of exchange prevailing on the respective dates of such transactions.
Although the net assets of the Fund are presented at the foreign exchange rates and market values at the close of the period, the Fund does not generally isolate that portion of the results of operations arising as a result of changes in the foreign exchange rates from the fluctuations arising from changes in the market prices of long-term portfolio securities held at the end of the period. Similarly, the Fund does not isolate the effect of changes in foreign exchange rates from the fluctuations arising from changes in the market prices of long-term portfolio securities sold during the period. Accordingly, holding period realized foreign currency gains (losses) are included in the reported net realized gains (losses) on investment transactions. Notwithstanding the above, the Fund does isolate the effect of fluctuations in foreign currency exchange rates when determining the gain (loss) upon the sale or maturity of foreign currency denominated debt obligations: such amounts are included in net realized gain (loss) on foreign currency transactions.
Net realized gains (losses) on foreign currency transactions represent net foreign exchange gains (losses) from holdings of foreign currencies, forward currency contracts, disposition of foreign currencies, currency gains (losses) realized between the trade and settlement dates on securities transactions, and the difference between the amounts of interest, dividends and foreign withholding taxes recorded on the Fund’s books and the U.S. dollar equivalent amounts actually received or paid. Net unrealized currency gains (losses) from valuing foreign currency denominated assets and liabilities (other than investments) at period end exchange rates are reflected as a component of net unrealized appreciation (depreciation) on foreign currencies.
Foreign security and currency transactions may involve certain considerations and risks not typically associated with those of domestic origin as a result of, among other factors, the possibility of political and economic instability or the level of the governmental supervision and regulation of foreign securities markets.
Securities Transactions and Net Investment Income: Securities transactions are recorded on the trade date. Realized gains (losses) from investment and currency transactions are calculated on the identified cost basis. Dividend income is recorded on the ex-date. Interest income, including amortization of premium and accretion of discount on debt securities, as
required, is recorded on the accrual basis. Expenses are recorded on the accrual basis, which may require the use of certain estimates by management that may differ from actual.
Net investment income (loss) (other than distribution fees which are charged directly to the respective class and transfer agency fees specific to Class Q shares which are charged to that share class) and unrealized and realized gains (losses) are allocated daily to each class of shares based upon the relative proportion of adjusted net assets of each class at the beginning of the day.
REITs: The Fund invests in REITs, which report information on the source of their distributions annually. Based on current and historical information, a portion of distributions received from REITs during the period is estimated to be dividend income, capital gain or return of capital and is recorded accordingly. These estimates are adjusted when the actual source of distributions is disclosed by the REITs.
Dividends and Distributions: The Fund expects to pay dividends from net investment income quarterly and distributions of net realized capital, if any, annually. Dividends and distributions to shareholders, which are determined in accordance with federal income tax regulations and which may differ from generally accepted accounting principles, are recorded on the ex-date. Permanent book/tax differences relating to income and gain (loss) are reclassified amongst undistributed net investment income, accumulated net realized gain (loss) and paid-in capital in excess of par, as appropriate.
Taxes: For federal income tax purposes, the Fund is treated as a separate tax paying entity. It is the Fund’s policy to continue to meet the requirements of the Internal Revenue Code applicable to regulated investment companies and to distribute all of its taxable net investment income and capital gains, if any, to its shareholders. Therefore, no federal income tax provision is required. Withholding taxes on foreign dividends are recorded, net of reclaimable amounts, at the time the related income is earned.
Estimates: The preparation of the financial statements requires management to make estimates and assumptions that affect the reported amounts and disclosures in the financial statements. Actual results could differ from those estimates.
Note 2. Agreements
The Fund has a management agreement with PI. Pursuant to this agreement, PI has responsibility for all investment advisory services and supervises the subadviser’s performance of such services. PI has entered into a subadvisory agreement with PGIM Real Estate, formerly known as Prudential Real Estate Investors (“PREI”), which is a business unit of PGIM, Inc. The subadvisory agreement provides that PGIM Real Estate will furnish investment advisory services in connection with the management of the Fund. In connection therewith, PGIM Real Estate is obligated to keep certain books and records of the Fund. PI pays for the services of PGIM Real Estate, the cost of compensation of officers of the Fund, occupancy and certain clerical and bookkeeping costs of the Fund. The Fund
| | | | |
| Prudential Select Real Estate Fund | | | 27 | |
Notes to Financial Statements (continued)
bears all other costs and expenses. Prior to January 4, 2016, PGIM, Inc. was known as Prudential Investment Management, Inc. (“PIM”).
Effective July 1, 2016, the management fee paid to PI is accrued daily and payable monthly at an annual rate of .80% of the Fund’s average daily net assets up to and including $1 billion, .78% on the next $2 billion of average daily net assets, .76% on the next $2 billion of average daily net assets, .75% on the next $5 billion of average daily net assets and .74% on the average daily net assets in excess of $10 billion. Prior to July 1, 2016, the management fee paid to PI was accrued daily and payable monthly at an annual rate of .95% of the Fund’s average daily net assets up to and including $1 billion, .93% on the next $2 billion of average daily net assets, .91% on the next $2 billion of average daily net assets, .90% on the next $5 billion of average daily net assets and .89% on the average daily net assets in excess of $10 billion. The effective management fee rate, before any waivers and/or expense reimbursement was .90% for the year ended October 31, 2016. For the year ended October 31, 2016, waivers and/or expense reimbursements exceeded the effective management fee.
Effective July 1, 2016, PI has contractually agreed through February 28, 2018 to limit the net annual operating expenses (exclusive of distribution and service (12b-1) fees, taxes (such as income and foreign withholdings taxes, stamp duty and deferred tax expenses), interest, underlying funds, brokerage, extraordinary and certain other expenses such as dividend, broker charges and interest expense on short sales) of each class of shares of the Fund to 1.05% of the Fund’s average daily net assets. Prior to July 1, 2016, PI had contractually agreed to limit the net annual operating expenses (exclusive of distribution and service (12b-1) fees, taxes (such as income and foreign withholdings taxes, stamp duty and deferred tax expenses), interest, underlying funds, brokerage, extraordinary and certain other expenses such as dividend, broker charges and interest expense on short sales) of each class of shares of the Fund to 1.10% of the Fund’s average daily net assets. Expenses waived/reimbursed by the Manager in accordance with this agreement may be recouped by the Manager within the same fiscal year during which such waiver/reimbursement is made if such recoupment can be realized without exceeding the expense limit in effect at the time of the recoupment for that fiscal year.
The Fund has a distribution agreement with Prudential Investment Management Services LLC (“PIMS”), which acts as the distributor of the Class A, C, Q and Z shares of the Fund.
The Fund compensates PIMS for distributing and servicing the Fund’s Class A and C shares, pursuant to plans of distribution (the “Distribution Plans”), regardless of expenses actually incurred by PIMS. The distribution fees are accrued daily and payable monthly. No distribution or service fees are paid to PIMS as distributor of the Class Q or Class Z shares of the Fund.
Pursuant to the Distribution Plans, the Fund compensates PIMS for distribution related activities at an annual rate of up to .30% and 1% of the average daily net assets of the Class A and C shares, respectively. PIMS has contractually agreed through February 28, 2018 to limit such fees to .25% of the average daily net assets of the Class A shares.
PIMS has advised the Fund that it has received $973 in front-end sales charges resulting from sales of Class A shares during the year ended October 31, 2016. From these fees, PIMS paid such sales charges to affiliated broker-dealers, which in turn paid commissions to salespersons and incurred other distribution costs.
PIMS has advised the Fund that for the year ended October 31, 2016, there were no contingent deferred sales charges imposed.
PI, PGIM, Inc., and PIMS are indirect, wholly-owned subsidiaries of Prudential Financial, Inc. (“Prudential”).
Note 3. Other Transactions with Affiliates
Prudential Mutual Fund Services LLC (“PMFS”), an affiliate of PI and an indirect, wholly-owned subsidiary of Prudential, serves as the Fund’s transfer agent. Transfer agent fees and expenses in the Statement of Operations include certain out-of-pocket expenses paid to non-affiliates, where applicable.
The Fund may enter into certain securities purchase or sale transactions under Board approved Rule 17a-7 procedures. Rule 17a-7 is an exemptive rule under the 1940 Act, that permits purchase and sale transactions among affiliated investment companies, or between and investment company and a person that is affiliated solely by reason of having a common (or affiliated) investment adviser, common directors, and/or common officers. Such transactions are subject to ratification by the Board.
The Fund invests in the Prudential Core Ultra Short Bond Fund, (formerly known as Prudential Core Taxable Money Market Fund), (the “Core Fund”), a portfolio of the Prudential Investment Portfolios 2, registered under the Investment Company 1940 Act, and managed by PI. Earnings from the Core Fund are disclosed on the Statement of Operations as “Affiliated dividend income.”
Note 4. Portfolio Securities
The cost of purchases and proceeds from sales of portfolio securities, other than short-term investments, for the year ended October 31, 2016, were $8,936,676 and $8,887,049, respectively.
Note 5. Distributions and Tax Information
Distributions to shareholders, which are determined in accordance with federal income tax regulations and which may differ from generally accepted accounting principles, are
| | | | |
| Prudential Select Real Estate Fund | | | 29 | |
Notes to Financial Statements (continued)
recorded on the ex-date. In order to present distributions in excess of net investment income, accumulated net realized gain on investment and foreign currency transactions and paid-in capital in excess of par on the Statement of Assets and Liabilities that more closely represent their tax character, certain adjustments have been made to distributions in excess of net investment income and accumulated net realized gain on investment and foreign currency transactions. For the year ended October 31, 2016, the adjustments were to decrease distributions in excess of net investment income and decrease accumulated net realized gain on investment and foreign currency transactions by $16,369 due to differences in the treatment for book and tax purposes of certain transactions involving foreign currencies, reclassification of dividends and investments in passive foreign investment companies. Net investment income, net realized gain (loss) on investment transactions and net assets were not affected by this change.
For the year ended October 31, 2016, the tax character of distributions paid by the Fund were $341,110 of ordinary income and $77,779 of long-term capital gains. For the year ended October 31, 2015, the tax character of distributions paid by the Fund were $91,501 of ordinary income and $3,808 of long-term capital gains.
As of October 31, 2016, the accumulated undistributed earnings on a tax basis was $129,509 of ordinary income. This differs from the amount shown on the Statement of Assets and Liabilities primarily due to cumulative timing differences between financial and tax reporting.
The United States federal income tax basis of the Fund’s investments and the net unrealized depreciation as of October 31, 2016 were as follows:
| | | | | | | | | | |
Tax Basis | | Appreciation | | Depreciation | | Net Unrealized
Depreciation | | Other Cost Basis
Adjustment | | Total Net
Unrealized
Depreciation |
| $6,113,242 | | $180,169 | | $(393,298) | | $(213,129) | | $(177) | | $(213,306) |
The difference between book basis and tax basis is primarily attributable to deferred losses on wash sales and investments in passive foreign investment companies. The other cost basis adjustments are primarily attributable to appreciation (depreciation) of foreign currencies and mark-to-market of receivables and payables.
Management has analyzed the Fund’s tax positions taken on federal, state and local income tax returns for all open tax years and has concluded that no provision for income tax is required in the Fund’s financial statements for the current reporting period. The Fund’s federal, state and local income and federal excise tax returns for tax years for which the applicable statutes of limitations have not expired are subject to examination by the Internal Revenue Service and state departments of revenue.
Note 6. Capital
The Fund offers Class A, Class C, Class Q and Class Z shares. Class A shares are subject to a maximum front-end sales charge of up to 5.50%. Investors who purchase Class A shares in an amount of $1 million or more and sell these shares within 12 months of purchase are not subject to an initial sales charge, but are subject to a contingent deferred sales charge (“CDSC”) of 1%. The Class A CDSC is waived for purchases by certain retirement or benefit plans. Class C shares are sold with a CDSC of 1% on shares redeemed within the first 12 months after purchase. A special exchange privilege is also available for shareholders who qualified to purchase Class A shares at net asset value. Class Q and Class Z shares are not subject to any sales or redemption charge and are offered exclusively for sale to a limited group of investors.
Under certain circumstances, an exchange may be made from specified share classes of the Fund to one or more other share classes of the Fund as presented in the table of transactions in shares of beneficial interest.
The Trust has authorized an unlimited number of shares of beneficial interest at $.001 par value per share.
At reporting period end, Prudential, through its affiliates, owned 1,080 Class A shares, 1,069 Class C shares, 550,651 Class Q shares and 1,085 Class Z shares of the Fund, which represents 93% of the Fund’s outstanding shares.
Transactions in shares of beneficial interest were as follows:
| | | | | | | | |
Class A | | Shares | | | Amount | |
Year ended October 31, 2016: | | | | | | | | |
Shares sold | | | 14,750 | | | $ | 152,673 | |
Shares issued in reinvestment of dividends and distributions | | | 709 | | | | 7,104 | |
Shares reacquired | | | (2,707 | ) | | | (24,987 | ) |
| | | | | | | | |
Net increase (decrease) in shares outstanding before conversion | | | 12,752 | | | | 134,790 | |
Shares reacquired upon conversion into other share class(es) | | | (52 | ) | | | (567 | ) |
| | | | | | | | |
Net increase (decrease) in shares outstanding | | | 12,700 | | | $ | 134,223 | |
| | | | | | | | |
Year ended October 31, 2015: | | | | | | | | |
Shares sold | | | 5,019 | | | $ | 51,736 | |
Shares issued in reinvestment of dividends and distributions | | | 15 | | | | 160 | |
Shares reacquired | | | (396 | ) | | | (4,113 | ) |
| | | | | | | | |
Net increase (decrease) in shares outstanding before conversion | | | 4,638 | | | | 47,783 | |
Shares reacquired upon conversion into other share class(es) | | | (579 | ) | | | (6,225 | ) |
| | | | | | | | |
Net increase (decrease) in shares outstanding | | | 4,059 | | | $ | 41,558 | |
| | | | | | | | |
| | | | |
| Prudential Select Real Estate Fund | | | 31 | |
Notes to Financial Statements (continued)
| | | | | | | | |
Class C | | Shares | | | Amount | |
Year ended October 31, 2016: | | | | | | | | |
Shares sold | | | 2,332 | | | $ | 24,001 | |
Shares issued in reinvestment of dividends and distributions | | | 212 | | | | 2,110 | |
| | | | | | | | |
Net increase (decrease) in shares outstanding | | | 2,544 | | | $ | 26,111 | |
| | | | | | | | |
Year ended October 31, 2015: | | | | | | | | |
Shares sold | | | 4,423 | | | $ | 45,727 | |
Shares issued in reinvestment of dividends and distributions | | | 31 | | | | 322 | |
Shares reacquired | | | (2,061 | ) | | | (21,998 | ) |
| | | | | | | | |
Net increase (decrease) in shares outstanding | | | 2,393 | | | $ | 24,051 | |
| | | | | | | | |
Class Q | | | | | | |
Year ended October 31, 2016: | | | | | | | | |
Shares sold | | | — | | | $ | — | |
Shares issued in reinvestment of dividends and distributions | | | 40,399 | | | | 399,911 | |
| | | | | | | | |
Net increase (decrease) in shares outstanding | | | 40,399 | | | $ | 399,911 | |
| | | | | | | | |
Year ended October 31, 2015: | | | | | | | | |
Shares issued in reinvestment of dividends and distributions | | | 9,252 | | | $ | 94,739 | |
| | | | | | | | |
Net increase (decrease) in shares outstanding | | | 9,252 | | | $ | 94,739 | |
| | | | | | | | |
Class Z | | | | | | |
Year ended October 31, 2016: | | | | | | | | |
Shares sold | | | 16,305 | | | $ | 164,922 | |
Shares issued in reinvestment of dividends and distributions | | | 974 | | | | 9,756 | |
Shares reacquired | | | (13,445 | ) | | | (122,517 | ) |
| | | | | | | | |
Net increase (decrease) in shares outstanding before conversion | | | 3,834 | | | | 52,161 | |
Shares issued upon conversion from other share class(es) | | | 52 | | | | 567 | |
| | | | | | | | |
Net increase (decrease) in shares outstanding | | | 3,886 | | | $ | 52,728 | |
| | | | | | | | |
Year ended October 31, 2015: | | | | | | | | |
Shares sold | | | 8,495 | | | $ | 86,683 | |
Shares issued in reinvestment of dividends and distributions | | | 8 | | | | 86 | |
Shares reacquired | | | (156 | ) | | | (1,626 | ) |
| | | | | | | | |
Net increase (decrease) in shares outstanding before conversion | | | 8,347 | | | | 85,143 | |
Shares issued upon conversion from other share class(es) | | | 577 | | | | 6,225 | |
| | | | | | | | |
Net increase (decrease) in shares outstanding | | | 8,924 | | | $ | 91,368 | |
| | | | | | | | |
Note 7. Borrowings
The Fund, along with other affiliated registered investment companies (the “Funds”), is a party to a Syndicated Credit Agreement (“SCA”) with a group of banks. The purpose of the SCA is to provide an alternative source of temporary funding for capital share redemptions. The SCA provides for a commitment of $900 million for the period October 6, 2016 through
October 5, 2017. The Funds pay an annualized commitment fee of .15% of the unused portion of the SCA. The interest rate on borrowings under the SCA is paid monthly and at a per annum rate based upon the higher of 0.0%, the effective federal funds rate, or the One-Month LIBOR rate, plus a contractual spread. Prior to October 6, 2016, the Funds had another SCA that provided a commitment of $900 million and the Funds paid an annualized commitment fee of .11% of the unused portion of the SCA. The interest rate on borrowings was substantially the same. The Fund’s portion of the commitment fee for the unused amount is accrued daily and paid quarterly.
The Fund did not utilize the SCA during the year ended October 31, 2016.
Note 8. Recent Accounting Pronouncements and Reporting Updates
In January 2016, the FASB issued ASU No. 2016-01 regarding “Recognition and Measurement of Financial Assets and Financial Liabilities”. The new guidance is intended to enhance the reporting model for financial instruments to provide users of financial statements with more decision-useful information and addresses certain aspects of the recognition, measurement, presentation, and disclosure of financial instruments. The new standard affects all entities that hold financial assets or owe financial liabilities. The new guidance is effective for public companies for fiscal years beginning after December 15, 2017, including interim periods within those fiscal years. At this time, management is evaluating the implications of ASU No. 2016-01 and its impact on the financial statements and disclosures has not yet been determined.
On October 13, 2016, the Securities and Exchange Commission (the “SEC”) adopted new rules and forms and amended existing rules and forms which are intended to modernize and enhance the reporting and disclosure of information by registered investment companies and to improve the quality of information that funds provide to investors, including modifications to Regulation S-X which would require standardized, enhanced disclosure about derivatives in investment company financial statements. In an effort to enhance monitoring and regulation, the new rules and forms will allow the SEC to more effectively collect and use data reported by funds. The new rules also enhance disclosure regarding fund liquidity and redemption practices. Also under the new rules, the SEC will permit open-end funds, with the exception of money market funds, to offer swing pricing, subject to board approval and review. The compliance dates of the modifications to Regulation S-X are August 1, 2017 and other amendments and rules are generally June 1, 2018 and December 1, 2018. Management is currently evaluating the impacts to the financial statement disclosures, if any.
Note 9. Dividends and Distributions to Shareholders
Subsequent to the fiscal year end, the Fund declared ordinary income dividends and capital gains distributions on December 16, 2016 to shareholders of record on
| | | | |
| Prudential Select Real Estate Fund | | | 33 | |
Notes to Financial Statements (continued)
December 19, 2016. The ex-date was December 20, 2016. The per share amounts declared were as follows:
| | | | | | | | |
| | | Ordinary Income | | | Short Term Capital Gains | |
Class A | | $ | 0.03819 | | | $ | 0.22814 | |
Class C | | $ | 0.02295 | | | $ | 0.22814 | |
Class Q | | $ | 0.04332 | | | $ | 0.22814 | |
Class Z | | $ | 0.04332 | | | $ | 0.22814 | |
Financial Highlights
| | | | | | | | | | | | | | | | |
| Class A Shares | | | | | | | | | | | | |
| | | Year Ended October 31, | | | | | | August 1,
2014(b)
through
October 31, | |
| | | 2016 | | | 2015 | | | | | | 2014 | |
| Per Share Operating Performance(c): | | | | | | | | | | | | | | | | |
| Net Asset Value, Beginning of Period | | | $10.71 | | | | $10.30 | | | | | | | | $10.00 | |
| Income (loss) from investment operations: | | | | | | | | | | | | | | | | |
| Net investment income (loss) | | | .17 | | | | .09 | | | | | | | | .01 | |
Net realized and unrealized gain (loss) on investment and foreign
currency transactions | | | (.18 | ) | | | .41 | | | | | | | | .29 | |
| Total from investment operations | | | (.01 | ) | | | .50 | | | | | | | | .30 | |
| Less Dividends and Distributions: | | | | | | | | | | | | | | | | |
| Dividends from net investment income | | | (.28 | ) | | | - | | | | | | | | - | |
| Distributions from net realized gains | | | (.42 | ) | | | (.09 | ) | | | | | | | - | |
| Total dividends and distributions | | | (.70 | ) | | | (.09 | ) | | | | | | | - | |
| Net asset value, end of period | | | $10.00 | | | | $10.71 | | | | | | | | $10.30 | |
| Total Return(a) | | | .01% | | | | 4.85% | | | | | | | | 3.00% | |
| | | | | | | | | | | | | | | | |
| Ratios/Supplemental Data: | | | | | | | | | | | | |
| Net assets, end of period (000) | | | $185 | | | | $62 | | | | | | | | $18 | |
| Average net assets (000) | | | $119 | | | | $27 | | | | | | | | $15 | |
| Ratios to average net assets(d): | | | | | | | | | | | | | | | | |
| Expense after waivers and/or expense reimbursement | | | 1.33% | | | | 1.35% | | | | | | | | 1.35% | (e) |
| Expense before waivers and/or expense reimbursement | | | 4.81% | | | | 5.16% | | | | | | | | 20.58% | (e) |
| Net investment income (loss) | | | 1.70% | | | | .86% | | | | | | | | .46% | (e) |
| Portfolio turnover rate | | | 158% | | | | 150% | | | | | | | | 18% | (f) |
| (a) | Total return does not consider the effect of sales load. Total return is calculated assuming a purchase of a share on the first day and a sale on the last day of each period reported and includes reinvestment of dividends and distributions, if any. Total returns may reflect adjustments to conform to generally accepted accounting principles. Total returns for periods less than one full year are not annualized. |
| (b) | Commencement of operations. |
| (c) | Calculated based on average shares outstanding during the period. |
| (d) | Does not include expenses of the underlying portfolio in which the Fund invests. |
See Notes to Financial Statements.
| | | | |
| Prudential Select Real Estate Fund | | | 35 | |
Financial Highlights (continued)
| | | | | | | | | | | | | | | | |
| Class C Shares | | | | | | | | | | | | |
| | | Year Ended October 31, | | | | | | August 1,
2014(b)
through
October 31,
| |
| | | 2016 | | | 2015 | | | | | | 2014 | |
| Per Share Operating Performance(c): | | | | | | | | | | | | | | | | |
| Net Asset Value, Beginning of Period | | | $10.60 | | | | $10.28 | | | | | | | | $10.00 | |
| Income (loss) from investment operations: | | | | | | | | | | | | | | | | |
| Net investment income (loss) | | | .11 | | | | (.03 | ) | | | | | | | (.01 | ) |
Net realized and unrealized gain (loss) on investment and foreign
currency transactions | | | (.18 | ) | | | .44 | | | | | | | | .29 | |
| Total from investment operations | | | (.07 | ) | | | .41 | | | | | | | | .28 | |
| Less Dividends and Distributions: | | | | | | | | | | | | | | | | |
| Dividends from net investment income | | | (.17 | ) | | | - | | | | | | | | - | |
| Distributions from net realized gains | | | (.42 | ) | | | (.09 | ) | | | | | | | - | |
| Total dividends and distributions | | | (.59 | ) | | | (.09 | ) | | | | | | | - | |
| Net asset value, end of period | | | $9.94 | | | | $10.60 | | | | | | | | $10.28 | |
| Total Return(a) | | | (.63)% | | | | 3.98% | | | | | | | | 2.80% | |
| | | | | | | | | | | | | | | | |
| Ratios/Supplemental Data: | | | | | | | | | | | | |
| Net assets, end of period (000) | | | $59 | | | | $36 | | | | | | | | $10 | |
| Average net assets (000) | | | $48 | | | | $46 | | | | | | | | $10 | |
| Ratios to average net assets(d): | | | | | | | | | | | | | | | | |
| Expense after waivers and/or expense reimbursement | | | 2.08% | | | | 2.10% | | | | | | | | 2.10% | (e) |
| Expense before waivers and/or expense reimbursement | | | 5.64% | | | | 5.54% | | | | | | | | 20.42% | (e) |
| Net investment income (loss) | | | 1.08% | | | | (.30)% | | | | | | | | (.26)% | (e) |
| Portfolio turnover rate | | | 158% | | | | 150% | | | | | | | | 18% | (f) |
| (a) | Total return does not consider the effect of sales load. Total return is calculated assuming a purchase of a share on the first day and a sale on the last day of each period reported and includes reinvestment of dividends and distributions, if any. Total returns may reflect adjustments to conform to generally accepted accounting principles. Total returns for periods less than one full year are not annualized. |
| (b) | Commencement of operations. |
| (c) | Calculated based on average shares outstanding during the period. |
| (d) | Does not include expenses of the underlying portfolio in which the Fund invests. |
See Notes to Financial Statements.
| | | | | | | | | | | | | | | | |
| Class Q Shares | |
| | | Year Ended October 31, | | | | | | August 1,
2014(b)
through
October 31,
| |
| | | 2016 | | | 2015 | | | | | | 2014 | |
| Per Share Operating Performance(c): | | | | | | | | | | | | | | | | |
| Net Asset Value, Beginning of Period | | | $10.63 | | | | $10.31 | | | | | | | | $10.00 | |
| Income (loss) from investment operations: | | | | | | | | | | | | | | | | |
| Net investment income (loss) | | | .22 | | | | .10 | | | | | | | | .02 | |
Net realized and unrealized gain (loss) on investment and foreign
currency transactions | | | (.20 | ) | | | .41 | | | | | | | | .29 | |
| Total from investment operations | | | .02 | | | | .51 | | | | | | | | .31 | |
| Less Dividends and Distributions: | | | | | | | | | | | | | | | | |
| Dividends from net investment income | | | (.35 | ) | | | (.10 | ) | | | | | | | - | |
| Distributions from net realized gains | | | (.42 | ) | | | (.09 | ) | | | | | | | - | |
| Total dividends and distributions | | | (.77 | ) | | | (.19 | ) | | | | | | | - | |
| Net asset value, end of period | | | $9.88 | | | | $10.63 | | | | | | | | $10.31 | |
| Total Return(a) | | | .30% | | | | 5.01% | | | | | | | | 3.10% | |
| | | | | | | | | | | | | | | | |
| Ratios/Supplemental Data: | |
| Net assets, end of period (000) | | | $5,441 | | | | $5,423 | | | | | | | | $5,165 | |
| Average net assets (000) | | | $5,413 | | | | $5,288 | | | | | | | | $4,983 | |
| Ratios to average net assets(d): | | | | | | | | | | | | | | | | |
| Expense after waivers and/or expense reimbursement | | | 1.08% | | | | 1.10% | | | | | | | | 1.10% | (e) |
| Expense before waivers and/or expense reimbursement | | | 4.40% | | | | 4.51% | | | | | | | | 14.06% | (e) |
| Net investment income (loss) | | | 2.18% | | | | .96% | | | | | | | | .75% | (e) |
| Portfolio turnover rate | | | 158% | | | | 150% | | | | | | | | 18% | (f) |
| (a) | Total return is calculated assuming a purchase of a shares on the first day and a sale on the last day of each period reported and includes reinvestment of dividends and distributions, if any. Total returns may reflect adjustments to conform to generally accepted accounting principles. Total returns for periods less than one full year are not annualized. |
| (b) | Commencement of operations. |
| (c) | Calculated based on average shares outstanding during the period. |
| (d) | Does not include expenses of the underlying portfolio in which the Fund invests. |
See Notes to Financial Statements.
| | | | |
| Prudential Select Real Estate Fund | | | 37 | |
Financial Highlights (continued)
| | | | | | | | | | | | | | | | |
| Class Z Shares | | | | | | | | | | | | |
| | | Year Ended October 31, | | | | | | August 1,
2014(b)
through
October 31, | |
| | | 2016 | | | 2015 | | | | | | 2014 | |
| Per Share Operating Performance(c): | | | | | | | | | | | | | | | | |
| Net Asset Value, Beginning of Period | | | $10.74 | | | | $10.31 | | | | | | | | $10.00 | |
| Income (loss) from investment operations: | | | | | | | | | | | | | | | | |
| Net investment income (loss) | | | .21 | | | | .10 | | | | | | | | .02 | |
Net realized and unrealized gain (loss) on investment and foreign
currency transactions | | | (.18 | ) | | | .42 | | | | | | | | .29 | |
| Total from investment operations | | | .03 | | | | .52 | | | | | | | | .31 | |
| Less Dividends and Distributions: | | | | | | | | | | | | | | | | |
| Dividends from net investment income | | | (.33 | ) | | | - | | | | | | | | - | |
| Distributions from net realized gains | | | (.42 | ) | | | (.09 | ) | | | | | | | - | |
| Total dividends and distributions | | | (.75 | ) | | | (.09 | ) | | | | | | | - | |
| Net asset value, end of period | | | $10.02 | | | | $10.74 | | | | | | | | $10.31 | |
| Total Return(a) | | | .36% | | | | 5.04% | | | | | | | | 3.10% | |
| | | | | | | | | | | | | | | | |
| Ratios/Supplemental Data: | | | | | | | | | | | | |
| Net assets, end of period (000) | | | $138 | | | | $107 | | | | | | | | $10 | |
| Average net assets (000) | | | $139 | | | | $39 | | | | | | | | $10 | |
| Ratios to average net assets(d): | | | | | | | | | | | | | | | | |
| Expense after waivers and/or expense reimbursement | | | 1.08% | | | | 1.10% | | | | | | | | 1.10% | (e) |
| Expense before waivers and/or expense reimbursement | | | 4.82% | | | | 5.16% | | | | | | | | 19.50% | (e) |
| Net investment income (loss) | | | 2.09% | | | | .98% | | | | | | | | .77% | (e) |
| Portfolio turnover rate | | | 158% | | | | 150% | | | | | | | | 18% | (f) |
| (a) | Total return is calculated assuming a purchase of a share on the first day and a sale on the last day of each period reported and includes reinvestment of dividends and distributions, if any. Total returns may reflect adjustments to conform to generally accepted accounting principles. Total returns for periods less than one full year are not annualized. |
| (b) | Commencement of operations. |
| (c) | Calculated based on average shares outstanding during the period. |
| (d) | Does not include expenses of the underlying portfolio in which the Fund invests. |
See Notes to Financial Statements.
Report of Independent Registered Public Accounting Firm
The Board of Trustees and Shareholders
Prudential Investment Portfolios 9:
We have audited the accompanying statement of assets and liabilities of Prudential Select Real Estate Fund, one of the series constituting Prudential Investment Portfolios 9 (hereafter referred to as the “Fund”), including the portfolio of investments, as of October 31, 2016, and the related statement of operations for the year then ended, the statements of changes in net assets for each of the years in the two-year period then ended and the financial highlights for each of the years in the two-year period then ended and the period from August 1, 2014 (commencement of operations) to October 31, 2014. These financial statements and financial highlights are the responsibility of the Fund’s management. Our responsibility is to express an opinion on these financial statements and financial highlights based on our audits.
We conducted our audits in accordance with the standards of the Public Company Accounting Oversight Board (United States). Those standards require that we plan and perform the audit to obtain reasonable assurance about whether the financial statements and financial highlights are free of material misstatement. An audit includes examining, on a test basis, evidence supporting the amounts and disclosures in the financial statements. Our procedures included confirmation of securities owned as of October 31, 2016, by correspondence with the custodian, transfer agent and brokers or by other appropriate auditing procedures when replies from brokers were not received. An audit also includes assessing the accounting principles used and significant estimates made by management, as well as evaluating the overall financial statement presentation. We believe that our audits provide a reasonable basis for our opinion.
In our opinion, the financial statements and financial highlights referred to above present fairly, in all material respects, the financial position of the Fund as of October 31, 2016, and the results of its operations, the changes in its net assets, and the financial highlights for the years or periods described in the first paragraph, in conformity with U.S. generally accepted accounting principles.

New York, New York
December 19, 2016
| | | | |
| Prudential Select Real Estate Fund | | | 39 | |
Federal Income Tax Information (unaudited)
We are advising you that during the fiscal year ended October 31, 2016, the Fund reported the maximum amount allowed per share, but not less than $0.15 for Class A, C, Q and Z shares as a capital gain distribution in accordance with Section 852(b)(3)(C) of the Internal Revenue Code.
For the year ended October 31, 2016, the Fund reports the maximum amount allowable under Section 854 of the Internal Revenue Code, but not less than 6.29% of the ordinary income dividends paid during the year as qualified dividend income.
In January 2017, you will be advised on IRS Form 1099-DIV or substitute 1099-DIV as to the federal tax status of the distributions received by you in calendar year 2016.
INFORMATION ABOUT BOARD MEMBERS AND OFFICERS
(Unaudited)
Information about Board Members and Officers of the Fund is set forth below. Board Members who are not deemed to be “interested persons” of the Fund, as defined in the 1940 Act, are referred to as “Independent Board Members.” Board Members who are deemed to be “interested persons” of the Fund are referred to as “Interested Board Members.” The Board Members are responsible for the overall supervision of the operations of the Fund and perform the various duties imposed on the directors of investment companies by the 1940 Act. The Board in turn elects the Officers, who are responsible for administering the day-to-day operations of the Fund.
| | | | |
| Independent Board Members(1) |
Name, Address, Age Position(s) Portfolios Overseen | | Principal Occupation(s) During Past Five Years | | Other Directorships Held During Past Five Years |
Ellen S. Alberding (58) Board Member Portfolios Overseen: 89 | | President and Board Member, The Joyce Foundation (charitable foundation) (since 2002); Vice Chair, City Colleges of Chicago (community college system) (since 2011); Trustee, Skills for America’s Future (national initiative to connect employers to community colleges) (since 2011); Trustee, National Park Foundation (charitable foundation for national park system) (since 2009); Trustee, Economic Club of Chicago (since 2009). | | None. |
Kevin J. Bannon (64) Board Member Portfolios Overseen: 89 | | Managing Director (April 2008-May 2015) and Chief Investment Officer (October 2008-November 2013) of Highmount Capital LLC (registered investment adviser); formerly Executive Vice President and Chief Investment Officer (April 1993-August 2007) of Bank of New York Company; President (May 2003-May 2007) of BNY Hamilton Family of Mutual Funds. | | Director of Urstadt Biddle Properties (equity real estate investment trust) (since September 2008). |
Linda W. Bynoe (64) Board Member Portfolios Overseen: 89 | | President and Chief Executive Officer (since March 1995) and formerly Chief Operating Officer (December 1989-February 1995) of Telemat Ltd. (management consulting); formerly Vice President (January 1985-June 1989) at Morgan Stanley & Co. (broker-dealer). | | Director of Simon Property Group, Inc. (retail real estate) (May 2003-May 2012); Director of Anixter International, Inc. (communication products distributor) (since January 2006); Director of Northern Trust Corporation (financial services) (since April 2006); Trustee of Equity Residential (residential real estate) (since December 2009). |
Prudential Select Real Estate Fund
| | | | |
| Independent Board Members(1) |
Name, Address, Age Position(s) Portfolios Overseen | | Principal Occupation(s) During Past Five Years | | Other Directorships Held During Past Five Years |
Keith F. Hartstein (60) Board Member Portfolios Overseen: 89 | | Retired; Member (since November 2014) of the Governing Council of the Independent Directors Council (organization of independent mutual fund directors); formerly President and Chief Executive Officer (2005-2012), Senior Vice President (2004-2005), Senior Vice President of Sales and Marketing (1997-2004), and various executive management positions (1990-1997), John Hancock Funds, LLC (asset management); Chairman, Investment Company Institute’s Sales Force Marketing Committee (2003-2008). | | None. |
Michael S. Hyland, CFA (71) Board Member Portfolios Overseen: 89 | | Retired (since February 2005); formerly Senior Managing Director (July 2001-February 2005) of Bear Stearns & Co, Inc.; Global Partner, INVESCO (1999-2001); Managing Director and President of Salomon Brothers Asset Management (1989-1999). | | None. |
Richard A. Redeker (73) Board Member & Independent Chair Portfolios Overseen: 89 | | Retired Mutual Fund Senior Executive (47 years); Management Consultant; Director, Mutual Fund Directors Forum (since 2014); Independent Directors Council (organization of independent mutual fund directors)-Executive Committee, Chair of Policy Steering Committee, Governing Council. | | None. |
Stephen G. Stoneburn (73) Board Member Portfolios Overseen: 89 | | Chairman (since July 2011), President and Chief Executive Officer (since June 1996) of Quadrant Media Corp. (publishing company); formerly President (June 1995-June 1996) of Argus Integrated Media, Inc.; Senior Vice President and Managing Director (January 1993-1995) of Cowles Business Media; Senior Vice President of Fairchild Publications, Inc. (1975-1989). | | None. |
Visit our website at prudentialfunds.com
| | | | |
| Interested Board Members(1) |
Name, Address, Age Position(s) Portfolios Overseen | | Principal Occupation(s) During Past Five Years | | Other Directorships Held During Past Five Years |
Stuart S. Parker (54) Board Member & President Portfolios Overseen: 89 | | President of Prudential Investments LLC (since January 2012); Executive Vice President of Prudential Investment Management Services LLC (since December 2012); Executive Vice President of Jennison Associates LLC and Head of Retail Distribution of Prudential Investments LLC (June 2005-December 2011). | | None. |
Scott E. Benjamin (43) Board Member & Vice President Portfolios Overseen: 89 | | Executive Vice President (since June 2009) of Prudential Investments LLC; Executive Vice President (June 2009-June 2012) and Vice President (since June 2012) of Prudential Investment Management Services LLC; Executive Vice President (since September 2009) of AST Investment Services, Inc.; Senior Vice President of Product Development and Marketing, Prudential Investments (since February 2006); Vice President of Product Development and Product Management, Prudential Investments (2003-2006). | | None. |
Grace C. Torres* (57) Board Member Portfolios Overseen: 87 | | Retired; formerly Treasurer and Principal Financial and Accounting Officer of the Prudential Investments Funds, Target Funds, Advanced Series Trust, Prudential Variable Contract Accounts and The Prudential Series Fund (1998-June 2014); Assistant Treasurer (March 1999-June 2014) and Senior Vice President (September 1999-June 2014) of Prudential Investments LLC; Assistant Treasurer (May 2003-June 2014) and Vice President (June 2005-June 2014) of AST Investment Services, Inc.; Senior Vice President and Assistant Treasurer (May 2003-June 2014) of Prudential Annuities Advisory Services, Inc. | | Director (since July 2015) of Sun Bancorp, Inc. N.A. |
| * | Note: Prior to her retirement in 2014, Ms. Torres was employed by Prudential Investments LLC. Due to her prior employment, she is considered to be an “interested person” under the 1940 Act. Ms. Torres is a Non-Management Interested Board Member. |
| (1) | The year that each individual joined the Board is as follows: |
Ellen S. Alberding, 2013; Linda W. Bynoe, 2005; Richard A. Redeker, 1998; Stephen G. Stoneburn, 2003; Kevin J. Bannon, 2008; Keith F. Hartstein, 2013; Michael S. Hyland, 2008; Stuart S. Parker, Board Member since 2012 and President since 2012; Scott E. Benjamin, Board Member since 2010 and Vice President since 2009; Grace C. Torres, 2014.
Prudential Select Real Estate Fund
| | | | |
| Fund Officers(a) |
Name, Address and Age Position with Fund | | Principal Occupation(s) During Past Five Years | | Length of Service as Fund Officer |
Raymond A. O’Hara (61) Chief Legal Officer | | Vice President and Corporate Counsel (since July 2010) of Prudential Insurance Company of America (Prudential); Vice President (March 2011-Present) of Pruco Life Insurance Company and Pruco Life Insurance Company of New Jersey; Vice President and Corporate Counsel (March 2011-Present) of Prudential Annuities Life Assurance Corporation; Chief Legal Officer of Prudential Investments LLC (since June 2012); Chief Legal Officer of Prudential Mutual Fund Services LLC (since June 2012) and Corporate Counsel of AST Investment Services, Inc. (since June 2012); formerly Assistant Vice President and Corporate Counsel (September 2008-July 2010) of The Hartford Financial Services Group, Inc.; formerly Associate (September 1980-December 1987) and Partner (January 1988–August 2008) of Blazzard & Hasenauer, P.C. (formerly, Blazzard, Grodd & Hasenauer, P.C.). | | Since 2012 |
Chad A. Earnst (41) Chief Compliance Officer | | Chief Compliance Officer (September 2014-Present) of Prudential Investments LLC; Chief Compliance Officer (September 2014-Present) of the Prudential Investments Funds, Target Funds, Advanced Series Trust, The Prudential Series Fund, Prudential’s Gibraltar Fund, Inc., Prudential Global Short Duration High Yield Income Fund, Inc., Prudential Short Duration High Yield Fund, Inc. and Prudential Jennison MLP Income Fund, Inc.; formerly Assistant Director (March 2010-August 2014) of the Asset Management Unit, Division of Enforcement, US Securities & Exchange Commission; Assistant Regional Director (January 2010-August 2014), Branch Chief (June 2006–December 2009) and Senior Counsel (April 2003-May 2006) of the Miami Regional Office, Division of Enforcement, US Securities & Exchange Commission. | | Since 2014 |
Deborah A. Docs (58) Secretary | | Vice President and Corporate Counsel (since January 2001) of Prudential; Vice President (since December 1996) and Assistant Secretary (since March 1999) of Prudential Investments LLC; formerly Vice President and Assistant Secretary (May 2003-June 2005) of AST Investment Services, Inc. | | Since 2004 |
Jonathan D. Shain (58) Assistant Secretary | | Vice President and Corporate Counsel (since August 1998) of Prudential; Vice President and Assistant Secretary (since May 2001) of Prudential Investments LLC; Vice President and Assistant Secretary (since February 2001) of Prudential Mutual Fund Services LLC; formerly Vice President and Assistant Secretary (May 2003-June 2005) of AST Investment Services, Inc. | | Since 2005 |
Visit our website at prudentialfunds.com
| | | | |
| Fund Officers(a) |
Name, Address and Age Position with Fund | | Principal Occupation(s) During Past Five Years | | Length of Service as Fund Officer |
Claudia DiGiacomo (42) Assistant Secretary | | Vice President and Corporate Counsel (since January 2005) of Prudential; Vice President and Assistant Secretary of Prudential Investments LLC (since December 2005); Associate at Sidley Austin Brown & Wood LLP (1999-2004). | | Since 2005 |
Andrew R. French (54) Assistant Secretary | | Vice President and Corporate Counsel (since February 2010) of Prudential; formerly Director and Corporate Counsel (2006-2010) of Prudential; Vice President and Assistant Secretary (since January 2007) of Prudential Investments LLC; Vice President and Assistant Secretary (since January 2007) of Prudential Mutual Fund Services LLC. | | Since 2006 |
Theresa C. Thompson (54) Deputy Chief Compliance Officer | | Vice President, Compliance, Prudential Investments LLC (since April 2004); and Director, Compliance, Prudential Investments LLC (2001-2004). | | Since 2008 |
Charles H. Smith (43) Anti-Money Laundering Compliance Officer | | Vice President, Corporate Compliance, Anti-Money Laundering Unit (since January 2015) of Prudential; committee member of the American Council of Life Insurers Anti-Money Laundering and Critical Infrastructure Committee (since January 2016); formerly Global Head of Economic Sanctions Compliance at AIG Property Casualty (February 2007 – December 2014); Assistant Attorney General at the New York State Attorney General’s Office, Division of Public Advocacy. (August 1998 —January 2007). | | Since 2016 |
M. Sadiq Peshimam (52) Treasurer and Principal Financial and Accounting Officer | | Vice President (since 2005) of Prudential Investments LLC; formerly Assistant Treasurer of funds in the Prudential Mutual Fund Complex (2006-2014). | | Since 2006 |
Peter Parrella (58) Assistant Treasurer | | Vice President (since 2007) and Director (2004-2007) within Prudential Mutual Fund Administration; formerly Tax Manager at SSB Citi Fund Management LLC (1997-2004). | | Since 2007 |
Lana Lomuti (49) Assistant Treasurer | | Vice President (since 2007) and Director (2005-2007), within Prudential Mutual Fund Administration; formerly Assistant Treasurer (December 2007-February 2014) of The Greater China Fund, Inc. | | Since 2014 |
Linda McMullin (55) Assistant Treasurer | | Vice President (since 2011) and Director (2008-2011) within Prudential Mutual Fund Administration. | | Since 2014 |
Kelly A. Coyne (48) Assistant Treasurer | | Director, Investment Operations of Prudential Mutual Fund Services LLC (since 2010). | | Since 2015 |
Prudential Select Real Estate Fund
| (a) | Excludes Mr. Parker and Mr. Benjamin, interested Board Members who also serve as President and Vice President, respectively. |
Explanatory Notes to Tables:
| • | | Board Members are deemed to be “Interested,” as defined in the 1940 Act, by reason of their affiliation with Prudential Investments LLC and/or an affiliate of Prudential Investments LLC. |
| • | | Unless otherwise noted, the address of all Board Members and Officers is c/o Prudential Investments LLC, 655 Broad Street, Newark, New Jersey 07102-4410. |
| • | | There is no set term of office for Board Members or Officers. The Board Members have adopted a retirement policy, which calls for the retirement of Board Members on December 31 of the year in which they reach the age of 75. |
| • | | “Other Directorships Held” includes only directorships of companies required to register or file reports with the SEC under the 1934 Act (that is, “public companies”) or other investment companies registered under the 1940 Act. |
| • | | “Portfolios Overseen” includes all investment companies managed by Prudential Investments LLC. The investment companies for which Prudential Investments LLC serves as manager include the Prudential Investments Mutual Funds, The Prudential Variable Contract Accounts, Target Mutual Funds, Prudential Short Duration High Yield Fund, Inc., Prudential Global Short Duration High Yield Fund, Inc., The Prudential Series Fund, Prudential’s Gibraltar Fund, Inc. and the Advanced Series Trust. |
Visit our website at prudentialfunds.com
Approval of Advisory Agreements (unaudited)
The Fund’s Board of Trustees
The Board of Trustees (the “Board”) of Prudential Select Real Estate Fund (the “Fund”)1 consists of ten individuals, seven of whom are not “interested persons” of the Fund, as defined in the Investment Company Act of 1940, as amended (the “1940 Act”) (the “Independent Trustees”). The Board is responsible for the oversight of the Fund and its operations, and performs the various duties imposed on the directors of investment companies by the 1940 Act. The Independent Trustees have retained independent legal counsel to assist them in connection with their duties. The Chair of the Board is an Independent Trustee. The Board has established three standing committees: the Audit Committee, the Nominating and Governance Committee, and the Investment Committee. Each committee is chaired by, and composed of, Independent Trustees.
Annual Approval of the Fund’s Advisory Agreements
As required under the 1940 Act, the Board determines annually whether to renew the Fund’s management agreement with Prudential Investments LLC (“PI”) and the Fund’s subadvisory agreement with PGIM, Inc. (“PGIM”), which provides subadvisory services to the Fund through its PGIM Real Estate unit (“PGIM Real Estate”). In considering the renewal of the agreements, the Board, including all of the Independent Trustees, met on June 7-9, 2016 and approved the renewal of the agreements through July 31, 2017, after concluding that the renewal of the agreements was in the best interests of the Fund and its shareholders.
In advance of the meetings, the Board requested and received materials relating to the agreements, and had the opportunity to ask questions and request further information in connection with its consideration. Among other things, the Board considered comparative fee information from PI and PGIM. Also, the Board considered comparisons with other mutual funds in relevant Peer Universes and Peer Groups, as is further discussed below.
In approving the agreements, the Board, including the Independent Trustees advised by independent legal counsel, considered the factors it deemed relevant, including the nature, quality and extent of services provided by PI and the subadviser, the performance of the Fund, the profitability of PI and its affiliates, expenses and fees, and the potential for economies of scale that may be shared with the Fund and its shareholders as the Fund’s assets grow. In their deliberations, the Trustees did not identify any single factor which alone was responsible for the Board’s decision to approve the agreements with respect to the Fund. In connection with its deliberations, the Board considered information provided by PI throughout the year at regular Board meetings, presentations from portfolio managers and other information, as well as information furnished at or in advance of the meetings on June 7-9, 2016.
| 1 | Prudential Select Real Estate Fund is a series of Prudential Investment Portfolios 9. |
| | |
| Prudential Select Real Estate Fund |
Approval of Advisory Agreements (continued)
The Trustees determined that the overall arrangements between the Fund and PI, which serves as the Fund’s investment manager pursuant to a management agreement, and between PI and PGIM, which serves as the Fund’s subadviser pursuant to the terms of a subadvisory agreement with PI, are in the best interests of the Fund and its shareholders in light of the services performed, fees charged and such other matters as the Trustees considered relevant in the exercise of their business judgment.
The material factors and conclusions that formed the basis for the Trustees’ reaching their determinations to approve the continuance of the agreements are separately discussed below.
Nature, Quality, and Extent of Services
The Board received and considered information regarding the nature, quality and extent of services provided to the Fund by PI and PGIM Real Estate. The Board considered the services provided by PI, including but not limited to the oversight of the subadviser for the Fund, as well as the provision of fund recordkeeping, compliance, and other services to the Fund. With respect to PI’s oversight of the subadviser, the Board noted that PI’s Strategic Investment Research Group (“SIRG”), which is a business unit of PI, is responsible for monitoring and reporting to PI’s senior management on the performance and operations of the subadviser. The Board also considered that PI pays the salaries of all of the officers and interested Trustees of the Fund who are part of Fund management. The Board also considered the investment subadvisory services provided by PGIM Real Estate, as well as adherence to the Fund’s investment restrictions and compliance with applicable Fund policies and procedures. The Board considered PI’s evaluation of the subadviser, as well as PI’s recommendation, based on its review of the subadviser, to renew the subadvisory agreement.
The Board considered the qualifications, backgrounds and responsibilities of PI’s senior management responsible for the oversight of the Fund and PGIM Real Estate, and also considered the qualifications, backgrounds and responsibilities of the PGIM Real Estate’s portfolio managers who are responsible for the day-to-day management of the Fund’s portfolio. The Board was provided with information pertaining to PI’s, PGIM Real Estate’s, and PGIM’s organizational structure, senior management, investment operations, and other relevant information pertaining to PI, PGIM Real Estate, and PGIM. The Board also noted that it received favorable compliance reports from the Fund’s Chief Compliance Officer (“CCO”) as to PI, PGIM Real Estate, and PGIM. The Board noted that PGIM Real Estate and PGIM are affiliated with PI.
The Board concluded that it was satisfied with the nature, extent and quality of the investment management services provided by PI and the subadvisory services provided to
| | |
| Visit our website at prudentialfunds.com | | |
the Fund by PGIM through PGIM Real Estate, and that there was a reasonable basis on which to conclude that the Fund benefits from the services provided by PI and PGIM through PGIM Real Estate under the management and subadvisory agreements.
Costs of Services and Profits Realized by PI
The Board was provided with information on the profitability of PI and its affiliates in serving as the Fund’s investment manager. The Board discussed with PI the methodology utilized in assembling the information regarding profitability and considered its reasonableness. The Board recognized that it is difficult to make comparisons of profitability from fund management contracts because comparative information is not generally publicly available and is affected by numerous factors, including the structure of the particular adviser, the types of funds it manages, its business mix, numerous assumptions regarding allocations and the adviser’s capital structure and cost of capital. However, the Board considered that the cost of services provided by PI to the Fund during the year ended December 31, 2015 exceeded the management fees paid by the Fund, resulting in an operating loss to PI. The Board further noted that the subadviser is affiliated with PI and that its profitability is reflected in PI’s profitability report. Taking these factors into account, the Board concluded that the profitability of PI and its affiliates in relation to the services rendered was not unreasonable.
Economies of Scale
PI and the Board previously retained an outside business consulting firm to review management fee breakpoint usage and trends in management fees across the mutual fund industry. The consulting firm presented its analysis and conclusions as to the Funds’ management fee structures to the Board and PI. The Board and PI have discussed these conclusions extensively since that presentation.
The Board received and discussed information concerning economies of scale that PI may realize as the Fund’s assets grow beyond current levels. The Board considered information provided by PI regarding the launch date of the Fund, the management fees of the Fund compared to those of similarly managed funds and PI’s investment in the Fund over time. The Board noted that economies of scale, if any, may be shared with the Fund in several ways, including low management fees from inception, additional technological and personnel investments to enhance shareholder services, and maintaining existing expense structures in the face of a rising cost environment. The Board considered PI’s assertion that it continually evaluates the management fee schedule of the Fund and the potential to share economies of scale through breakpoints or fee waivers as asset levels increase.
| | |
| Prudential Select Real Estate Fund |
Approval of Advisory Agreements (continued)
The Board recognized the inherent limitations of any analysis of economies of scale, stemming largely from the Board’s understanding that most of PI’s costs are not specific to individual funds, but rather are incurred across a variety of products and services.
Other Benefits to PI and PGIM
The Board considered potential ancillary benefits that might be received by PI and PGIM and their affiliates as a result of their relationship with the Fund. The Board concluded that potential benefits to be derived by PI included transfer agency fees received by the Fund’s transfer agent (which is affiliated with PI), and benefits to its reputation as well as other intangible benefits resulting from PI’s association with the Fund. The Board concluded that the potential benefits to be derived by PGIM included its ability to use soft dollar credits, as well as the potential benefits consistent with those generally resulting from an increase in assets under management, specifically, potential access to additional research resources and benefits to its reputation. The Board concluded that the benefits derived by PI and PGIM were consistent with the types of benefits generally derived by investment managers and subadvisers to mutual funds.
Performance of the Fund / Fees and Expenses
The Board considered certain additional specific factors and made related conclusions relating to the historical performance of the Fund for the one-year period ended December 31, 2015.
The Board also considered the Fund’s actual management fee, as well as the Fund’s net total expense ratio, for the fiscal period ended October 31, 2015. The Board considered the management fee for the Fund as compared to the management fee charged by PI to other funds and the fee charged by other advisers to comparable mutual funds in a Peer Group. The actual management fee represents the fee rate actually paid by Fund shareholders and includes any fee waivers or reimbursements. The net total expense ratio for the Fund represents the actual expense ratio incurred by Fund shareholders.
The mutual funds included in the Peer Universe (the Global Real Estate Funds Performance Universe) and the Peer Group were objectively determined by Broadridge, an independent provider of mutual fund data. The comparisons placed the Fund in various quartiles, with the first quartile being the best 25% of the mutual funds (for performance, the best performing mutual funds and, for expenses, the lowest cost mutual funds).
The section below summarizes key factors considered by the Board and the Board’s conclusions regarding the Fund’s performance, fees and overall expenses. The table sets forth gross performance comparisons (which do not reflect the impact on performance of fund expenses, or any subsidies, expense caps or waivers that may be applicable) with the
| | |
| Visit our website at prudentialfunds.com | | |
Peer Universe, actual management fees with the Peer Group (which reflect the impact of any subsidies or fee waivers), and net total expenses with the Peer Group, each of which were key factors considered by the Board.
| | | | | | | | |
| Performance | | 1 Year | | 3 Years | | 5 Years | | 10 Years |
| | | 1st Quartile | | N/A | | N/A | | N/A |
| Actual Management Fees: 1st Quartile |
| Net Total Expenses: 1st Quartile |
| | • | | The Board noted that the Fund outperformed its benchmark index over the one-year period. |
| | • | | The Board noted that the Fund does not yet have a three-year performance record and that, therefore, the subadviser should have more time to develop that record. |
| | • | | The Board and PI agreed to reduce the existing expense cap of 1.10% (exclusive of 12b-1 and certain other fees), effective July 1, 2016, so that the Fund’s annual operating expenses do not exceed 1.05% (exclusive of 12b-1 and certain other fees) of the Fund’s average net assets through February 28, 2018. |
| | • | | The Board and PI also agreed to a permanent reduction in the Fund’s management fee schedule so that the Fund’s management fee rate would be 0.80% of average daily net assets up to $1 billion, 0.78% of average daily net assets from $1 billion to $3 billion, 0.76% of average daily net assets from $3 billion to $5 billion, 0.75% of average daily net assets from $5 billion to $10 billion, and 0.74% of average daily net assets over $10 billion. |
| | • | | The Board and PI also agreed to a permanent reduction in the Fund’s subadvisory fee schedule so that the Fund’s subadvisory fee rate would be 0.375% on all assets. |
| | • | | The Board concluded that in light of the above, it would be in the best interests of the Fund and its shareholders to continue to allow the Fund to create a performance record, and to renew the agreements with the permanent reduction in fees. |
| | • | | The Board concluded that the management fees (including subadvisory fees) and total expenses were reasonable in light of the services provided. |
* * *
After full consideration of these factors, the Board concluded that the approval of the agreements was in the best interests of the Fund and its shareholders.
| | |
| Prudential Select Real Estate Fund |
| | | | |
| ∎ MAIL | | ∎ TELEPHONE | | ∎ WEBSITE |
655 Broad Street
Newark, NJ 07102 | | (800) 225-1852 | | www.prudentialfunds.com |
|
| PROXY VOTING |
| The Board of Trustees of the Fund has delegated to the Fund’s investment subadviser the responsibility for voting any proxies and maintaining proxy recordkeeping with respect to the Fund. A description of these proxy voting policies and procedures is available without charge, upon request, by calling (800) 225-1852. Information regarding how the Fund voted proxies relating to portfolio securities during the most recent 12-month period ended June 30 is available on the Fund’s website and on the Securities and Exchange Commission’s website. |
|
| TRUSTEES |
| Ellen S. Alberding • Kevin J. Bannon • Scott E. Benjamin • Linda W. Bynoe • Keith F. Hartstein • Michael S. Hyland • Stuart S. Parker • Richard A. Redeker • Stephen G. Stoneburn • Grace C. Torres |
|
| OFFICERS |
| Stuart S. Parker, President • Scott E. Benjamin, Vice President • M. Sadiq Peshimam, Treasurer and Principal Financial and Accounting Officer • Raymond A. O’Hara, Chief Legal Officer • Chad A. Earnst, Chief Compliance Officer • Deborah A. Docs, Secretary • Theresa C. Thompson, Deputy Chief Compliance Officer • Charles H. Smith, Anti-Money Laundering Compliance Officer • Jonathan D. Shain, Assistant Secretary • Claudia DiGiacomo, Assistant Secretary • Andrew R. French, Assistant Secretary • Peter Parrella, Assistant Treasurer • Lana Lomuti, Assistant Treasurer • Linda McMullin, Assistant Treasurer • Kelly A. Coyne, Assistant Treasurer |
| | | | |
| MANAGER | | Prudential Investments LLC | | 655 Broad Street
Newark, NJ 07102 |
|
| INVESTMENT SUBADVISER | | PGIM Real Estate | | 7 Giralda Farms
Madison, NJ 07940 |
|
| DISTRIBUTOR | | Prudential Investment
Management Services LLC | | 655 Broad Street
Newark, NJ 07102 |
|
| CUSTODIAN | | The Bank of New York Mellon | | One Wall Street
New York, NY 10286 |
|
| TRANSFER AGENT | | Prudential Mutual Fund
Services LLC | | PO Box 9658
Providence, RI 02940 |
|
| INDEPENDENT REGISTERED PUBLIC ACCOUNTING FIRM | | KPMG LLP | | 345 Park Avenue New York, NY 10154 |
|
| FUND COUNSEL | | Willkie Farr & Gallagher LLP | | 787 Seventh Avenue
New York, NY 10019 |
|
|
| An investor should consider the investment objectives, risks, charges, and expenses of the Fund carefully before investing. The prospectus and summary prospectus contain this and other information about the Fund. An investor may obtain a prospectus and summary prospectus by visiting our website at www.prudentialfunds.com or by calling (800) 225-1852. The prospectus and summary prospectus should be read carefully before investing. |
|
| E-DELIVERY |
| To receive your mutual fund documents online, go to www.prudentialfunds.com/edelivery and enroll. Instead of receiving printed documents by mail, you will receive notification via email when new materials are available. You can cancel your enrollment or change your email address at any time by visiting the website address above. |
|
| SHAREHOLDER COMMUNICATIONS WITH TRUSTEES |
| Shareholders can communicate directly with the Board of Trustees by writing to the Chair of the Board, Prudential Select Real Estate Fund, Prudential Investments, Attn: Board of Trustees, 655 Broad Street, Newark, NJ 07102. Shareholders can communicate directly with an individual Director by writing to the same address. Communications are not screened before being delivered to the addressee. |
|
| AVAILABILITY OF PORTFOLIO SCHEDULE |
| The Fund files its complete schedule of portfolio holdings with the Securities and Exchange Commission for the first and third quarters of each fiscal year on Form N-Q. The Fund’s Forms N-Q are available on the Commission’s website at www.sec.gov. The Fund’s Forms N-Q may also be reviewed and copied at the Commission’s Public Reference Room in Washington, D.C. Information on the operation and location of the Public Reference Room may be obtained by calling (202) 551-8090. The Fund’s schedule of portfolio holdings is also available on the Fund’s website as of the end of each month no sooner than 15 days after the end of the month. |
|
| The Fund’s Statement of Additional Information contains additional information about the Fund’s Trustees and is available without charge, upon request, by calling (800) 225-1852. |
Mutual Funds:
| | | | |
| ARE NOT INSURED BY THE FDIC OR ANY FEDERAL GOVERNMENT AGENCY | | MAY LOSE VALUE | | ARE NOT A DEPOSIT OF OR GUARANTEED BY ANY BANK OR ANY BANK AFFILIATE |
PRUDENTIAL SELECT REAL ESTATE FUND
| | | | | | | | |
| SHARE CLASS | | A | | C | | Q | | Z |
| NASDAQ | | SREAX | | SRECX | | SREQX | | SREZX |
| CUSIP | | 74441J811 | | 74441J795 | | 74441J787 | | 74441J779 |
MF223E 0300080-00001-00
Item 2 – Code of Ethics – See Exhibit (a)
As of the end of the period covered by this report, the registrant has adopted a code of ethics (the “Section 406 Standards for Investment Companies – Ethical Standards for Principal Executive and Financial Officers”) that applies to the registrant’s Principal Executive Officer and Principal Financial Officer; the registrant’s Principal Financial Officer also serves as the Principal Accounting Officer. During the period covered by this report, there have been no amendments to any provision of the code of ethics nor have any waivers been granted from any provision of the code of ethics.
The registrant hereby undertakes to provide any person, without charge, upon request, a copy of the code of ethics. To request a copy of the code of ethics, contact the registrant 800-225-1852, and ask for a copy of the Section 406 Standards for Investment Companies - Ethical Standards for Principal Executive and Financial Officers.
Item 3 – Audit Committee Financial Expert –
The registrant’s Board has determined that Mr. Kevin J. Bannon, member of the Board’s Audit Committee is an “audit committee financial expert,” and that he is “independent,” for purposes of this Item.
Item 4 – Principal Accountant Fees and Services –
(a) Audit Fees
For the fiscal years ended October 31, 2016 and October 31, 2015, KPMG LLP (“KPMG”), the Registrant’s principal accountant, billed the Registrant $155,769 and $174,330, respectively, for professional services rendered for the audit of the Registrant’s annual financial statements or services that are normally provided in connection with statutory and regulatory filings.
(b) Audit-Related Fees
For the fiscal years ended October 31, 2016 and October 31, 2015: none.
(c) Tax Fees
For the fiscal years ended October 31, 2016 and October 31, 2015: none.
(d) All Other Fees
For the fiscal years ended October 31, 2016 and October 31, 2015: none.
(e) (1) Audit Committee Pre-Approval Policies and Procedures
THE PRUDENTIAL MUTUAL FUNDS
AUDIT COMMITTEE POLICY
on
Pre-Approval of Services Provided by the Independent Accountants
The Audit Committee of each Prudential Mutual Fund is charged with the responsibility to monitor the independence of the Fund’s independent accountants. As part of this responsibility, the Audit Committee must pre-approve the independent accounting firm’s engagement to render audit and/or permissible non-audit services, as required by law. In evaluating a proposed engagement of the independent accountants, the Audit Committee will assess the effect that the engagement might reasonably be expected to have on the accountant’s independence. The Committee’s evaluation will be based on:
| | • | | a review of the nature of the professional services expected to be provided, |
| | • | | a review of the safeguards put into place by the accounting firm to safeguard independence, and |
| | • | | periodic meetings with the accounting firm. |
Policy for Audit and Non-Audit Services Provided to the Funds
On an annual basis, the scope of audits for each Fund, audit fees and expenses, and audit-related and non-audit services (and fees proposed in respect thereof) proposed to be performed by the Fund’s independent accountants will be presented by the Treasurer and the independent accountants to the Audit Committee for review and, as appropriate, approval prior to the initiation of such services. Such presentation shall be accompanied by confirmation by both the Treasurer and the independent accountants that the proposed non-audit services will not adversely affect the independence of the independent accountants. Such proposed non-audit services shall be described in sufficient detail to enable the Audit Committee to assess the appropriateness of such services and fees, and the compatibility of the provision of such services with the auditor’s independence. The Committee shall receive periodic reports on the progress of the audit and other services which are approved by the Committee or by the Committee Chair pursuant to authority delegated in this Policy.
The categories of services enumerated under “Audit Services”, “Audit-related Services”, and “Tax Services” are intended to provide guidance to the Treasurer and the independent accountants as to those categories of services which the Committee believes are generally consistent with the independence of the independent accountants and which the Committee (or the Committee Chair) would expect upon the presentation of specific proposals to pre-approve. The enumerated categories are not intended as an exclusive list of audit, audit-related or tax services, which the Committee (or the Committee Chair) would consider for pre-approval.
Audit Services
The following categories of audit services are considered to be consistent with the role of the Fund’s independent accountants:
| | Ø | Annual Fund financial statement audits |
| | Ø | Seed audits (related to new product filings, as required) |
| | Ø | SEC and regulatory filings and consents |
Audit-related Services
The following categories of audit-related services are considered to be consistent with the role of the Fund’s independent accountants:
| | Ø | Accounting consultations |
| | Ø | Fund merger support services |
| | Ø | Agreed Upon Procedure Reports |
| | Ø | Other Internal Control Reports |
Individual audit-related services that fall within one of these categories (except for fund merger support services) and are not presented to the Audit Committee as part of the annual pre-approval process are subject to an authorized pre-approval by the Audit Committee so long as the estimated fee for those services does not exceed $30,000. Any services provided under such pre-approval will be reported to the Audit Committee at its next regular meeting. Should the amount of such services exceed $30,000, any additional fees will be subject to pre-approval by the Committee Chair (or any other Committee member on whom this responsibility has been delegated). Fees related to fund merger support services are subject to a separate authorized pre-approval by the Audit Committee with fees determined on a per occurrence and merger complexity basis.
Tax Services
The following categories of tax services are considered to be consistent with the role of the Fund’s independent accountants:
| | Ø | Tax compliance services related to the filing or amendment of the following: |
| | | ∎ Federal, state and local income tax compliance; and, |
| | | ∎ Sales and use tax compliance |
| | Ø | Timely RIC qualification reviews |
| | Ø | Tax distribution analysis and planning |
| | Ø | Tax authority examination services |
| | Ø | Tax appeals support services |
| | Ø | Accounting methods studies |
| | Ø | Fund merger support services |
| | Ø | Tax consulting services and related projects |
Individual tax services that fall within one of these categories and are not presented to the Audit Committee as part of the annual pre-approval process are subject to an authorized pre-approval by the Audit Committee so long as the estimated fee for those services does not exceed $30,000. Any services provided under such pre-approval will be reported to the Audit Committee at its next regular meeting. Should the amount of such services exceed $30,000, any additional fees will be subject to pre-approval by the Committee Chair (or any other Committee member on whom this responsibility has been delegated).
Other Non-audit Services
Certain non-audit services that the independent accountants are legally permitted to render will be subject to pre-approval by the Committee or by one or more Committee members to whom the Committee has delegated this authority and who will report to the full Committee any pre-approval decisions made pursuant to this Policy. Non-audit services presented for pre-approval pursuant to this paragraph will be accompanied by a confirmation from both the Treasurer and the independent accountants that the proposed services will not adversely affect the independence of the independent accountants.
Proscribed Services
The Fund’s independent accountants will not render services in the following categories of non-audit services:
| | Ø | Bookkeeping or other services related to the accounting records or financial statements of the Fund |
| | Ø | Financial information systems design and implementation |
| | Ø | Appraisal or valuation services, fairness opinions, or contribution-in-kind reports |
| | Ø | Internal audit outsourcing services |
| | Ø | Management functions or human resources |
| | Ø | Broker or dealer, investment adviser, or investment banking services |
| | Ø | Legal services and expert services unrelated to the audit |
| | Ø | Any other service that the Public Company Accounting Oversight Board determines, by regulation, is impermissible. |
Pre-approval of Non-Audit Services Provided to Other Entities Within the Prudential Fund Complex
Certain non-audit services provided to Prudential Investments LLC or any of its affiliates that also provide ongoing services to the Prudential Mutual Funds will be subject to pre-approval by the Audit Committee. The only non-audit services provided to these entities that will require pre-approval are those related directly to the operations and financial reporting of the Funds. Individual projects that are not presented to the Audit Committee as part of the annual pre-approval process will be subject to pre-approval by the Committee Chair (or any other Committee
member on whom this responsibility has been delegated) so long as the estimated fee for those services does not exceed $30,000. Services presented for pre-approval pursuant to this paragraph will be accompanied by a confirmation from both the Treasurer and the independent accountants that the proposed services will not adversely affect the independence of the independent accountants.
Although the Audit Committee will not pre-approve all services provided to Prudential Investments LLC and its affiliates, the Committee will receive an annual report from the Fund’s independent accounting firm showing the aggregate fees for all services provided to Prudential Investments and its affiliates.
(e) (2) Percentage of services referred to in 4(b) – 4(d) that were approved by the audit committee –
For the fiscal years ended October 31, 2016 and October 31, 2015: none.
(f) Percentage of hours expended attributable to work performed by other than full time employees of principal accountant if greater than 50%.
The percentage of hours expended on the principal accountant’s engagement to audit the registrant’s financial statements for the most recent fiscal year that were attributed to work performed by persons other than the principal accountant’s full-time, permanent employees was 0%.
(g) Non-Audit Fees
The aggregate non-audit fees billed by KPMG for services rendered to the registrant’s investment adviser and any entity controlling, controlled by, or under common control with the investment adviser that provides ongoing services to the registrant for the fiscal years ended October 31, 2016 and October 31, 2015 were $0 and $0, respectively.
(h) Principal Accountant’s Independence
Not applicable as KPMG has not provided non-audit services to the registrant’s investment adviser and any entity controlling, controlled by, or under common control with the investment adviser that provides ongoing services to the registrant that were not pre-approved pursuant to Rule 2-01(c)(7)(ii) of Regulation S-X.
| | | | |
| Item 5 | | – | | Audit Committee of Listed Registrants – Not applicable. |
| | |
| Item 6 | | – | | Schedule of Investments – The schedule is included as part of the report to shareholders filed under Item 1 of this Form. |
| | |
| Item 7 | | – | | Disclosure of Proxy Voting Policies and Procedures for Closed-End Management Investment Companies – Not applicable. |
| | |
| Item 8 | | – | | Portfolio Managers of Closed-End Management Investment Companies – Not applicable. |
| | |
| Item 9 | | – | | Purchases of Equity Securities by Closed-End Management Investment Company and Affiliated Purchasers – Not applicable. |
| | | | |
| |
| Item 10 | | – Submission of Matters to a Vote of Security Holders – Not applicable. |
| |
| Item 11 | | – Controls and Procedures |
| | |
| | (a) | | It is the conclusion of the registrant’s principal executive officer and principal financial officer that the effectiveness of the registrant’s current disclosure controls and procedures (such disclosure controls and procedures having been evaluated within 90 days of the date of this filing) provide reasonable assurance that the information required to be disclosed by the registrant has been recorded, processed, summarized and reported within the time period specified in the Commission’s rules and forms and that the information required to be disclosed by the registrant has been accumulated and communicated to the registrant’s principal executive officer and principal financial officer in order to allow timely decisions regarding required disclosure. |
| | |
| | (b) | | There has been no significant change in the registrant’s internal control over financial reporting that occurred during the registrant’s most recent fiscal quarter of the period covered by this report that has materially affected, or is likely to materially affect, the registrant’s internal control over financial reporting. |
| |
| Item 12 | | – Exhibits |
| | |
| | (a) | | (1) Code of Ethics – Attached hereto as Exhibit EX-99.CODE-ETH |
| | |
| | | | (2) Certifications pursuant to Section 302 of the Sarbanes-Oxley Act – Attached hereto as Exhibit EX-99.CERT. |
| | |
| | | | (3) Any written solicitation to purchase securities under Rule 23c-1. – Not applicable. |
| | |
| | (b) | | Certifications pursuant to Section 906 of the Sarbanes-Oxley Act – Attached hereto as Exhibit
EX-99.906CERT. |
SIGNATURES
Pursuant to the requirements of the Securities Exchange Act of 1934 and the Investment Company Act of 1940, the registrant has duly caused this report to be signed on its behalf by the undersigned, thereunto duly authorized.
| | |
| Registrant: | | Prudential Investment Portfolios 9 |
| |
| By: | | /s/ Deborah A. Docs |
| | Deborah A. Docs |
| | Secretary |
| |
| Date: | | December 20, 2016 |
Pursuant to the requirements of the Securities Exchange Act of 1934 and the Investment Company Act of 1940, this report has been signed below by the following persons on behalf of the registrant and in the capacities and on the dates indicated.
| | |
| By: | | /s/ Stuart S. Parker |
| | Stuart S. Parker |
| | President and Principal Executive Officer |
| |
| Date: | | December 20, 2016 |
| |
| By: | | /s/ M. Sadiq Peshimam |
| | M. Sadiq Peshimam |
| | Treasurer and Principal Financial and Accounting Officer |
| |
| Date: | | December 20, 2016 |