UNITED STATES
SECURITIES AND EXCHANGE COMMISSION
Washington, D.C. 20549
FORM N-CSR
CERTIFIED SHAREHOLDER REPORT OF REGISTERED MANAGEMENT INVESTMENT COMPANIES
| | |
| Investment Company Act file number: | | 811-09101 |
| |
| Exact name of registrant as specified in charter: | | Prudential Investment Portfolios 9 |
| |
| Address of principal executive offices: | | 655 Broad Street, 17th Floor |
| | Newark, New Jersey 07102 |
| |
| Name and address of agent for service: | | Andrew R. French |
| | 655 Broad Street, 17th Floor |
| | Newark, New Jersey 07102 |
| |
| Registrant’s telephone number, including area code: | | 800-225-1852 |
| |
| Date of fiscal year end: | | 10/31/2018 |
| |
| Date of reporting period: | | 10/31/2018 |
Item 1 – Reports to Stockholders

PGIM ABSOLUTE RETURN BOND FUND
(Formerly known as Prudential Absolute Return Bond Fund)
ANNUAL REPORT
OCTOBER 31, 2018
COMING SOON: PAPERLESS SHAREHOLDER REPORTS
Beginning on January 1, 2021, as permitted by regulations adopted by the Securities and Exchange Commission, paper copies of the Fund’s annual and semi-annual shareholder reports will no longer be sent by mail, unless you specifically request paper copies of the reports. Instead, the reports will be made available on the Fund’s website (www.pgiminvestments.com), and you will be notified by mail each time a report is posted and provided with a website link to access the report.
If you already elected to receive shareholder reports electronically, you will not be affected by this change and you need not take any action. You may elect to receive shareholder reports and other communications from the Fund electronically anytime by contacting your financial intermediary (such as a broker-dealer or bank) or, if you are a direct investor, by calling 1-800-225-1852 or by sending an e-mail request to PGIM Investments at shareholderreports@pgim.com.
Beginning on January 1, 2019, you may elect to receive all future reports in paper free of charge. If you invest through a financial intermediary, you can contact your financial intermediary or follow instructions included with this notice to elect to continue to receive paper copies of your shareholder reports. If you invest directly with the Fund, you can call 1-800-225-1852 or send an email request to shareholderreports@pgim.com to let the Fund know you wish to continue receiving paper copies of your shareholder reports. Your election to receive reports in paper will apply to all funds held in your account if you invest through your financial intermediary or all funds held with the fund complex if you invest directly with the Fund.

To enroll in e-delivery, go to pgiminvestments.com/edelivery
|
Objective: To seek positive returns over the long term, regardless of market
conditions |
Highlights (unaudited)
| • | | The Fund outperformed the ICE BofAML USD LIBOR 3-Month Constant Maturity Index over the reporting period, highlighted by strong security selection and yield curve positioning. |
| • | | Security selection was the largest contributor to Fund performance, led by positioning in interest rate swaps, collateralized loan obligations, high yield corporate bonds, non-agency mortgage-backed securities, sovereign bonds, US Treasury securities, and commercial mortgage-backed securities. |
| • | | Although overall security selection contributed to performance, positioning in emerging markets limited results. |
This report is not authorized for distribution to prospective investors unless preceded or accompanied by a current prospectus.
The views expressed in this report and information about the Fund’s portfolio holdings are for the period covered by this report and are subject to change thereafter.
Mutual funds are distributed by Prudential Investment Management Services LLC (PIMS), member SIPC. PGIM Fixed Income is a unit of PGIM, Inc. (PGIM), a registered investment adviser. PIMS and PGIM are Prudential Financial companies. © 2018 Prudential Financial, Inc. and its related entities. PGIM and the PGIM logo are service marks of Prudential Financial, Inc. and its related entities, registered in many jurisdictions worldwide.
| | |
| 2 | | Visit our website at pgiminvestments.com |
PGIM FUNDS — UPDATE
The Board of Directors/Trustees for the Fund has approved the implementation of an automatic conversion feature for Class C shares, effective as of April 1, 2019. To reflect these changes, effective April 1, 2019, the section of the Fund’s Prospectus entitled “How to Buy, Sell and Exchange Fund Shares—How to Exchange Your Shares—Frequent Purchases and Redemptions of Fund Shares” is restated to read as follows:
This supplement should be read in conjunction with your Summary Prospectus, Statutory Prospectus and Statement of Additional Information, be retained for future reference and is in addition to any existing Fund supplements.
| | 1. | In each Fund’s Statutory Prospectus, the following is added at the end of the section entitled “Fund Distributions And Tax Issues—If You Sell or Exchange Your Shares”: |
Automatic Conversion of Class C Shares
The conversion of Class C shares into Class A shares—which happens automatically approximately 10 years after purchase—is not a taxable event for federal income tax purposes. For more information about the automatic conversion of Class C shares, see Class C Shares Automatically Convert to Class A Shares in How to Buy, Sell and Exchange Fund Shares.
| | 2. | In each Fund’s Statutory Prospectus, the following sentence is added at the end of the section entitled “How to Buy, Sell and Exchange Shares—Closure of Certain Share Classes to New Group Retirement Plans”: |
Shareholders owning Class C shares may continue to hold their Class C shares until the shares automatically convert to Class A shares under the conversion schedule, or until the shareholder redeems their Class C shares.
| | 3. | In each Fund’s Statutory Prospectus, the following disclosure is added immediately following the section entitled “How to Buy, Sell and Exchange Shares—How to Buy Shares—Class B Shares Automatically Convert to Class A Shares”: |
Class C Shares Automatically Convert to Class A Shares
Starting on or about April 1, 2019 (the “Effective Date”), Class C shares will be eligible for automatic conversion into Class A shares on a monthly basis approximately ten years after the original date of purchase (the “Conversion Date”). Conversion will take place based on the relative NAV of the two classes, without the imposition of any sales load, fee or other charge. All such automatic conversions of Class C shares will constitute tax-free exchanges for federal income tax purposes.
For shareholders investing in Class C shares through retirement plans or omnibus accounts, and in certain other instances, the Fund and its agents may not have
| | | | |
| PGIM Absolute Return Bond Fund | | | 3 | |
transparency into how long a shareholder has held Class C shares for purposes of determining whether such Class C shares are eligible for automatic conversion into Class A shares, and the relevant financial intermediary may not have the ability to track purchases in order to credit individual shareholders’ holding periods. In these circumstances, the Fund will not be able to automatically convert Class C shares into Class A shares as described above. In order to determine eligibility for conversion in these circumstances, it is the responsibility of the financial intermediary to notify the Fund that the shareholder is eligible for the conversion of Class C shares to Class A shares, and the financial intermediary may be required to maintain and provide the Fund with records that substantiate the holding period of Class C shares. It is the financial intermediary’s (and not the Fund’s) responsibility to keep records of transactions made in accounts it holds and to ensure that the shareholder is credited with the proper holding period based on such records or those provided to the financial intermediary by the shareholder. Please consult with your financial intermediary for the applicability of this conversion feature to your shares.
A financial intermediary may sponsor and/or control accounts, programs or platforms that impose a different conversion schedule or different eligibility requirements for the exchange of Class C shares for Class A shares (see Appendix A: Waivers and Discounts Available From Certain Financial Intermediaries of the Prospectus). Please consult with your financial intermediary if you have any questions regarding your shares’ conversion from Class C shares to Class A shares.
| | 4. | In Part II of each Fund’s Statement of Additional Information, the following disclosure is added immediately following the section entitled “Purchase, Redemption and Pricing of Fund Shares—Share Classes—Automatic Conversion of Class B Shares”: |
AUTOMATIC CONVERSION OF CLASS C SHARES. Starting on or about April 1, 2019 (the “Effective Date”), Class C shares will be eligible for automatic conversion into Class A shares on a monthly basis approximately ten years after the original date of purchase (the “Conversion Date”). Conversion will take place based on the relative NAV of the two classes, without the imposition of any sales load, fee or other charge. Class C shares of a Fund acquired through automatic reinvestment of dividends or distributions will convert to Class A shares of the Fund on the Conversion Date pro rata with the converting Class C shares of the Fund that were not acquired through reinvestment of dividends or distributions. All such automatic conversions of Class C shares will constitute tax-free exchanges for federal income tax purposes.
For shareholders investing in Class C shares through retirement plans or omnibus accounts, and in certain other instances, the Fund and its agents may not have transparency into how long a shareholder has held Class C shares for purposes of determining whether such Class C shares are eligible for automatic conversion into Class A shares, and the relevant financial intermediary may not have the ability to track purchases in order to credit individual shareholders’ holding periods. In these circumstances, the
| | |
| 4 | | Visit our website at pgiminvestments.com |
Fund will not be able to automatically convert Class C shares into Class A shares as described above. In order to determine eligibility for conversion in these circumstances, it is the responsibility of the financial intermediary to notify the Fund that the shareholder is eligible for the conversion of Class C shares to Class A shares, and the financial intermediary may be required to maintain and provide the Fund with records that substantiate the holding period of Class C shares. It is the financial intermediary’s (and not the Fund’s) responsibility to keep records of transactions made in accounts it holds and to ensure that the shareholder is credited with the proper holding period based on such records or those provided to the financial intermediary by the shareholder. Please consult with your financial intermediary for the applicability of this conversion feature to your shares.
Class C shares were generally closed to investments by new group retirement plans effective June 1, 2018. Group retirement plans (and their successor, related and affiliated plans) that have Class C shares of the Fund available to participants on or before the Effective Date may continue to open accounts for new participants in such share class and purchase additional shares in existing participant accounts.
The Fund has no responsibility for monitoring or implementing a financial intermediary’s process for determining whether a shareholder meets the required holding period for conversion. A financial intermediary may sponsor and/or control accounts, programs or platforms that impose a different conversion schedule or different eligibility requirements for the exchange of Class C shares for Class A shares, as set forth on Appendix A: Waivers and Discounts Available From Certain Financial Intermediaries of the Prospectus. In these cases, Class C shareholders may have their shares exchanged for Class A shares under the policies of the financial intermediary. Financial intermediaries will be responsible for making such exchanges in those circumstances. Please consult with your financial intermediary if you have any questions regarding your shares’ conversion from Class C shares to Class A shares.
LR1094
- Not part of the Annual Report -
| | | | |
| PGIM Absolute Return Bond Fund | | | 5 | |
Table of Contents
| | |
| 6 | | Visit our website at pgiminvestments.com |
Letter from the President

Dear Shareholder:
We hope you find the annual report for PGIM Absolute Return Bond Fund informative and useful. The report covers performance for the 12-month period that ended October 31, 2018.
We have important information to share with you. Effective June 11, 2018, Prudential Mutual Funds were renamed PGIM Funds. This renaming is part of our ongoing effort to further build our reputation and establish our global brand, which began when our firm adopted PGIM Investments as its name in April 2017. Please note that only the Fund’s name has changed. Your Fund’s management and operation, along with its symbols, remained the same.*
During the reporting period, the global economy continued to grow, and central banks gradually tightened monetary policy. In the US, the economy expanded and employment increased. In September, the Federal Reserve hiked interest rates for the eighth time since 2015, based on confidence in the economy.
Equity returns on the whole were strong, due to optimistic earnings expectations and investor sentiment. Global equities, including emerging markets, generally posted positive returns. However, they trailed the performance of US equities, which rose on higher corporate profits, new regulatory policies, and tax reform benefits. Volatility spiked briefly early in the period on inflation concerns, rising interest rates, and a potential global trade war, and again late in the period on worries that profit growth might slow in 2019.
The overall bond market declined modestly during the period, as measured by the Bloomberg Barclays US Aggregate Bond Index. The best performance came from higher-yielding, economically sensitive sectors, such as high yield bonds and bank loans, which posted small gains. US investment-grade corporate bonds and US Treasury bonds both finished the period with negative returns. A major trend during the period was the flattening of the US Treasury yield curve, which increased the yield on fixed income investments with shorter maturities and made them more attractive to investors.
Regarding your investments with PGIM, we believe it is important to maintain a diversified portfolio of funds consistent with your tolerance for risk, time horizon, and financial goals. Your financial advisor can help you create a diversified investment plan that may include funds covering all the basic asset classes and that reflects your personal investor profile and risk tolerance. However, diversification and asset allocation strategies do not assure a profit or protect against loss in declining markets.
At PGIM Investments, we consider it a great privilege and responsibility to help investors participate in opportunities across global markets while meeting their toughest investment challenges. PGIM is a top-10 global investment manager with more than $1 trillion in assets under management. This investment expertise allows us to deliver actively managed funds and strategies to meet the needs of investors around the globe.
Thank you for choosing our family of funds.
Sincerely,

Stuart S. Parker, President
PGIM Absolute Return Bond Fund
December 14, 2018
*The Prudential Day One Funds did not change their names.
| | | | |
| PGIM Absolute Return Bond Fund | | | 7 | |
Your Fund’s Performance (unaudited)
Performance data quoted represents past performance. Past performance does not guarantee future results. The investment return and principal value of an investment will fluctuate, so that an investor’s shares, when redeemed, may be worth more or less than their original cost. Current performance may be lower or higher than the past performance data quoted. An investor may obtain performance data as of the most recent month-end by visiting our website at www.pgiminvestments.com or by calling (800) 225-1852.
| | | | | | | | | | |
| | | Average Annual Total Returns as of 10/31/18
(with sales charges) | |
| | | One Year (%) | | Five Years (%) | | | Since Inception (%) | |
| Class A | | –2.39 | | | 1.73 | | | | 1.93 (3/30/11) | |
| Class C | | 0.44 | | | 1.91 | | | | 1.80 (3/30/11) | |
| Class Z | | 2.48 | | | 2.93 | | | | 2.82 (3/30/11) | |
| Class R6* | | 2.42 | | | 2.97 | | | | 2.86 (3/30/11) | |
| ICE BofAML USD LIBOR 3-Month CM Index | |
| | 1.85 | | | 0.79 | | | | 0.65 | |
| Bloomberg Barclays US Aggregate Bond Index | |
| | –2.05 | | | 1.83 | | | | 2.57 | |
| Lipper Alternative Credit Focus Funds Average | |
| | | –0.07 | | | 1.91 | | | | 2.25 | |
| | | | | | | | | | |
| | | Average Annual Total Returns as of 10/31/18
(without sales charges) | |
| | | One Year (%) | | Five Years (%) | | | Since Inception (%) | |
| Class A | | 2.21 | | | 2.68 | | | | 2.55 (3/30/11) | |
| Class C | | 1.43 | | | 1.91 | | | | 1.80 (3/30/11) | |
| Class Z | | 2.48 | | | 2.93 | | | | 2.82 (3/30/11) | |
| Class R6* | | 2.42 | | | 2.97 | | | | 2.86 (3/30/11) | |
| ICE BofAML USD LIBOR 3-Month CM Index | | | | | | | | | | |
| | 1.85 | | | 0.79 | | | | 0.65 | |
| Bloomberg Barclays US Aggregate Bond Index | | | | | | | | | | |
| | –2.05 | | | 1.83 | | | | 2.57 | |
| Lipper Alternative Credit Focus Funds Average | | | | | | | | | | |
| | | –0.07 | | | 1.91 | | | | 2.25 | |
| | |
| 8 | | Visit our website at pgiminvestments.com |
Growth of a $10,000 Investment (unaudited)
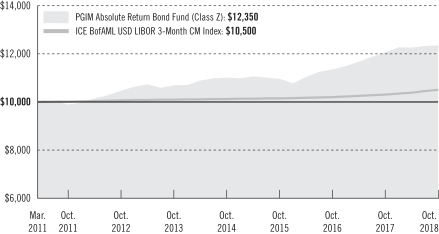
The graph compares a $10,000 investment in the Fund’s Class Z shares with a similar investment in the ICE BofAML USD LIBOR 3-Month CM Index by portraying the initial account values at the commencement of operations for Class Z shares (March 30, 2011) and the account values at the end of the current fiscal year (October 31, 2018) as measured on a quarterly basis. For purposes of the graph, and unless otherwise indicated, it has been assumed that (a) all recurring fees (including management fees) were deducted; and (b) all dividends and distributions were reinvested. The line graph provides information for Class Z shares only. As indicated in the tables provided earlier, performance for other share classes will vary due to the differing charges and expenses applicable to each share class (as indicated in the following paragraphs). Without waiver of fees and/or expense reimbursements, if any, the Fund’s returns would have been lower.
Past performance does not predict future performance. Total returns and the ending account values in the graph include changes in share price and reinvestment of dividends and capital gains distributions in a hypothetical investment for the periods shown. The Fund’s total returns do not reflect the deduction of income taxes on an individual’s investment. Taxes may reduce your actual investment returns on income or gains paid by the Fund or any gains you may realize if you sell your shares.
Source: PGIM Investments LLC and Lipper Inc.
*Formerly known as Class Q shares.
Since Inception returns are provided since the Fund has less than 10 fiscal years of returns. Since Inception returns for the Index and the Lipper Average are measured from the closest month-end to the Fund’s inception date.
| | | | |
| PGIM Absolute Return Bond Fund | | | 9 | |
Your Fund’s Performance (continued)
The returns in the tables do not reflect the deduction of taxes that a shareholder would pay on Fund distributions or following the redemption of Fund shares. The average annual total returns take into account applicable sales charges, which are described for each share class in the table below.
| | | | | | | | |
| | | Class A | | Class C | | Class Z | | Class R6* |
| Maximum initial sales charge | | 4.50% of the public offering
price | | None | | None | | None |
| Contingent deferred sales charge (CDSC) (as a percentage of the lower of original purchase price or net asset value at redemption) | | 1.00% on sales of $1 million or more made within 12 months of purchase | | 1.00% on sales made within 12 months of purchase | | None | | None |
| Annual distribution and service (12b-1) fees (shown as a percentage of average daily net assets) | | 0.25%
| | 1.00% | | None | | None |
*Formerly known as Class Q shares.
Benchmark Definitions
ICE BofAML USD LIBOR 3-Month CM Index—The ICE BofA Merrill Lynch US Dollar LIBOR 3-Month Constant Maturity Index is an unmanaged index that tracks the performance of a synthetic asset paying LIBOR to a stated maturity. The Index is based on the assumed purchase at par of a synthetic instrument having exactly its stated maturity and with a coupon equal to that current day fixing rate. That issue is assumed to be sold the following business day (priced at a yield equal to the current day fixing rate) and rolled into a new instrument.
Bloomberg Barclays US Aggregate Bond Index—The Bloomberg Barclays US Aggregate Bond Index is unmanaged and represents securities that are SEC registered, taxable, and dollar denominated. It covers the US investment-grade fixed rate bond market, with index components for government and corporate securities, mortgage pass-through securities, and asset-backed securities.
Lipper Alternative Credit Focus Funds Average—The Lipper Alternative Credit Focus Funds Average (Lipper Average) is based on the average return of all funds in the Lipper Alternative Credit Focus Funds universe for the periods noted. Funds in the Lipper Average are funds that, by prospectus language, invest in a wide range of credit-structured vehicles by using either fundamental credit research analysis or quantitative credit portfolio modeling, trying to benefit from any changes in credit quality, credit spreads, and market liquidity.
Investors cannot invest directly in an index or average. The returns for the Index would be lower if they included the effects of sales charges, operating expenses of a mutual fund, or taxes. Returns for the Lipper Average reflect the deduction of operating expenses of a mutual fund, but not sales charges or taxes.
| | |
| 10 | | Visit our website at pgiminvestments.com |
| | | | | | |
| Distributions and Yields as of 10/31/18 | | | | |
| | Total Distributions
Paid for
12 Months ($) | | SEC 30-Day
Subsidized
Yield* (%) | | SEC 30-Day
Unsubsidized
Yield** (%) |
| Class A | | 0.33 | | 2.81 | | 2.81 |
| Class C | | 0.25 | | 2.19 | | 2.19 |
| Class Z | | 0.35 | | 3.25 | | 3.12 |
| Class R6*** | | 0.36 | | 3.34 | | 3.47 |
*SEC 30-Day Subsidized Yield (%)—A standardized yield calculation created by the Securities and Exchange Commission, it reflects the income earned during a 30-day period, after the deduction of the Fund’s net expenses (net of any expense waivers or reimbursements).
**SEC 30-Day Unsubsidized Yield (%)—A standardized yield calculation created by the Securities and Exchange Commission, it reflects the income earned during a 30-day period, after the deduction of the Fund’s gross expenses. The investor experience is represented by the SEC 30-Day Subsidized Yield.
***Formerly known as Class Q shares.
| | | | |
| Credit Quality expressed as a percentage of total investments as of 10/31/18 (%) | | | |
| AAA | | | 29.3 | |
| AA | | | 7.5 | |
| A | | | 5.2 | |
| BBB | | | 15.6 | |
| BB | | | 16.3 | |
| B | | | 8.1 | |
| CCC | | | 0.9 | |
| CC | | | 0.1 | |
| C | | | 0.1 | |
| Not Rated | | | 9.2 | |
| Cash/Cash Equivalents | | | 7.8 | |
| Total Investments | | | 100.0 | |
Source: PGIM Fixed Income
Credit ratings reflect the highest rating assigned by a nationally recognized statistical rating organization (NRSRO) such as Moody’s Investors Service, Inc. (Moody’s), S&P Global Ratings (S&P), or Fitch, Inc. (Fitch). Credit ratings reflect the common nomenclature used by both S&P and Fitch. Where applicable, ratings are converted to the comparable S&P/Fitch rating tier nomenclature. These rating agencies are independent and are widely used. The Not Rated category consists of securities that have not been rated by a NRSRO. Credit ratings are subject to change. Values may not sum to 100.0% due to rounding.
| | | | |
| PGIM Absolute Return Bond Fund | | | 11 | |
Strategy and Performance Overview (unaudited)
How did the Fund perform?
The PGIM Absolute Return Bond Fund’s Class Z shares returned 2.48% in the 12-month reporting period that ended October 31, 2018, outperforming the 1.85% return of the ICE BofAML USD LIBOR 3-Month Constant Maturity Index (the Index) and the –0.07% return of the Lipper Alternative Credit Focus Funds Average.
What were market conditions?
| • | | At the beginning of the reporting period, positive economic momentum continued across the G3. (The G3, or Group of Three, refers to the US, Japan, and the European Union.) The US economy grew at an annualized 3.3% rate in the third quarter of 2017, following a similarly robust 3.1% pace in the second quarter. In the European Union, real gross domestic product (GDP) growth, at 2.4% in the third quarter, was broad based across countries. (Real GDP is a measurement of economic output adjusted for inflation.) Japan outpaced its potential growth rate by a wide margin, as its real GDP rose 2.5% in the third quarter after 2.9% growth in the second quarter. Consumer spending moderated across the G3, though remained at a solid pace. Business investment notably picked up, supporting market expectations that solid economic momentum was likely to carry into 2018. |
| • | | Stock and credit markets continued flying high with little volatility at the start of 2018 on optimism regarding the economic outlook. Their smooth flight soon hit an air pocket, however, on concerns about the US budget deficit’s potential to destabilize markets by pushing up Treasury yields and pushing down the dollar. Later in the first quarter, the markets floundered amid rising concerns of trade wars, troubles among technology companies, and—closer to the credit markets—concerns about merger-and-acquisition (M&A) activity, which had been running high. Stocks moved in a wide range during the first quarter, and at one point were nearly 10% off their highs. At quarter end, Treasury yields were higher, credit spreads (yield differentials between corporate bonds and Treasury securities of the same maturity) were wider, and stocks were little changed. |
| • | | The markets struggled in the second quarter as fears about trade and political issues, which had emerged early in the year, were realized to varying degrees. Meanwhile, the long shadow of quantitative monetary policy tightening stretched across the markets. The trade conflicts were awkward at the meeting of the G20, but then became real as US barbs were met with tit-for-tat measures that were at risk of intensifying. (The G20 is a leading forum of the world’s major economies that seeks to develop global policies to address pressing challenges.) The results of Italy’s elections, which took place in the first quarter, sparked market fears during the second quarter as renegade parties entered a coalition with a platform that appeared to jeopardize Italy’s finances and its relationship with Europe. Meanwhile, emerging market developments, including elections in Turkey and Mexico, raised concerns about the potential rise in policy heterodoxy. Over the first |
| | |
| 12 | | Visit our website at pgiminvestments.com |
| | half of 2018, these concerns fueled spread widening, which appeared to get slightly ahead of fundamentals. |
| • | | Despite a third-quarter 2018 bounce in the fixed income spread sectors, it wasn’t enough to undo the damage from the first half of the year. On the rates side, yields either moved sideways or higher—significantly so in some cases. In currencies, the US dollar was the biggest beneficiary of the anxious market backdrop. And across markets, idiosyncratic fundamental vulnerabilities and policy missteps brought stiff punishment from the markets. While the markets have been volatile, the underlying causes have been more or less constant with minor variations. To set the stage, after a decade of balance sheet expansion, the G3 central banks were finally—at least in aggregate—turning off the liquidity spigot. The Federal Reserve (the Fed) was in the lead, hiking short-term interest rates and continuing to trim its balance sheet at an accelerating pace. The European Central Bank was in the final months of its asset purchase program, which was expected to increase market anxiety about the timing and pace of eventual rate hikes. Meanwhile, the Bank of Japan (BoJ) sent mixed messages. With the Japanese economy taking longer to hit the BoJ’s 2% inflation target, policymakers tried to improve their long-term policy effectiveness by taking certain steps, such as reducing bond purchase amounts and widening the target range for the 10-year Japanese government bond yield, with the intent of reducing the BoJ’s power over the fixed income market and the steepening of the yield curve. |
| • | | Against a backdrop of increased equity market volatility, economic data releases in October 2018 suggested the US economy was continuing to grow at a solidly above-trend pace. Third-quarter real GDP growth slowed only modestly to an annualized 3.5% pace, following a robust 4.2% gain in the second quarter, while economic data releases in the fourth quarter suggested the strength was enduring. That said, the sources of strength in the third quarter narrowed to the household and government sectors. Growth in consumer spending, already strong in the second quarter, accelerated slightly to a 4.0% pace in the third quarter. Moreover, government spending added 0.6% to US GDP growth, reflecting a pickup in spending at the federal, state, and local levels. Business investment faltered, however, decelerating from a 10% overall pace in the first half of 2018 to just 0.8% in the third quarter. Meanwhile, residential investment declined another 4.0% in real terms; it has now fallen in seven out of the last 10 quarters. |
What worked?
| • | | The Fund outperformed the Index over the reporting period, highlighted by strong security selection and yield curve positioning. Duration positioning, sector allocation, and currency selection detracted from performance over the period. The Index does not include any bonds but closely tracks the Bank of America Merrill Lynch US Dollar LIBOR 3-Month Constant Maturity Index (LIBOR), the most widely used benchmark for short-term interest rates. |
| | | | |
| PGIM Absolute Return Bond Fund | | | 13 | |
Strategy and Performance Overview (continued)
| • | | Security selection was the largest contributor to Fund performance, led by positioning in interest rate swaps, collateralized loan obligations (CLOs), high yield corporate bonds, non-agency mortgage-backed securities, sovereign bonds, US Treasury securities, and commercial mortgage-backed securities (CMBS). |
| • | | Corporate positioning in the health care & pharmaceutical and technology sectors added value. Within health care & pharmaceutical, overweights in Tenet Healthcare and HCA Healthcare were positive. Contributors in the technology sector included an overweight in Interxion Holding. An overweight in Greece was the largest contributor to the Fund’s performance. |
| • | | In sector allocation, overweights in high yield bonds, emerging markets debt, and CMBS were positive. |
| • | | Also contributing positively was the Fund’s yield curve flattener positioning, as the curve flattened over the reporting period. |
What didn’t work?
| • | | Although overall security selection contributed to performance, positioning in emerging markets limited results. |
| • | | Within corporate bonds, security selection in the building materials & home construction and transportation & environmental services sectors hurt performance. Detractors in building materials & home construction included overweights in William Lyon Homes and US Concrete. Within transportation & environmental services, an overweight in Onorato Armatori was negative. An overweight in Argentina was the largest detractor from performance. |
| • | | Looking at sector allocation, overweights in sovereign bonds and investment-grade corporates limited results over the period. |
| • | | The Fund employs an absolute return strategy that seeks to mitigate (or even eliminate) interest rate risk when appropriate. During the reporting period, the Fund was hurt by its strategy to manage duration, which is a measure of the interest rate sensitivity of a bond portfolio or debt securities that is expressed as a number of years. The Fund’s long duration positioning detracted as US rates were higher during the period. The Fund’s active duration positioning ranged from neutral to 1.0 years long, ending October at the shorter end of the range at +0.4 years. |
| • | | The Fund occasionally features modest notional exposure to non-US dollar currencies across a diversified basket of currencies in faster-growing emerging and developed markets countries. The Fund’s currency positioning detracted from performance during the period, with overweights in the Indian rupee, Russian ruble, and Indonesian rupiah the largest detractors. |
| | |
| 14 | | Visit our website at pgiminvestments.com |
Did the Fund use derivatives, and how did they affect performance?
| • | | The Fund uses derivatives when they facilitate implementation of the overall investment approach. During the reporting period, the Fund used interest rate futures, options, and swaps to help manage duration positioning and yield curve exposure. Futures and swaps added to performance during the period, while options modestly detracted. In addition, the Fund traded foreign exchange derivatives, which had a negative impact on performance during the reporting period. |
Current outlook
| • | | Given ongoing US economic strength, the Fed is expected to raise short-term interest rates at its policy meeting on December 19, which PGIM Fixed Income believes will be followed by additional hikes around March and June 2019. At that point, the federal funds rate would be at 2.9%—roughly in line with Fed officials’ median estimate of the long-run neutral policy rate (although their estimates range from 2.5% to 3.5%). If 1) the fiscal stimulus shows signs of waning by the second half of next year, 2) congressional gridlock following the mid-term elections rules out further fiscal stimulus, and 3) inflation on average remains contained, as PGIM Fixed Income anticipates, the Fed is likely to become more cautious by the second half of next year. Meanwhile, banks’ reserve balances at the Fed continue to shrink as quantitative tightening proceeds. PGIM Fixed Income anticipates further updates from the Fed over the next several meetings about its thinking regarding the likely terminal size of its balance sheet. |
| • | | At the end of the period, PGIM Fixed Income maintained a positive view of fundamentals in the credit sectors, with the Fund positioned in spread sectors such as high yield corporate bonds, emerging markets debt and structured products (CMBS, CLOs, asset- backed securities). |
| • | | In investment-grade corporate bonds, as the US economy enters the later stage of the credit cycle, PGIM Fixed Income continues to favor better-quality financials and electric utilities over industrials that are subject to event risk. Within industrials, the focus is on select issuers where an “event” has passed, as higher-quality issuers continue to add debt and M&A remains a concern. |
| • | | Because of a combination of solid fundamentals (strong earnings and low defaults) and favorable technicals (limited net supply and persistent institutional demand from Asia), PGIM Fixed Income holds a modestly positive view on US high yield bonds in the near term. However, concerns over current valuations, risk appetite on recent lower-quality M&A transactions that is reminiscent of 2007, as well as broader concerns about trade wars and the timing of the next US recession merit longer-term caution. |
| • | | PGIM Fixed Income expects CMBS issuance to be heavy for the remainder of 2018 and continues to find value in high-quality securities of new issue conduit deals. In asset-backed securities, a fundamentally driven, up-in quality focus is being maintained. PGIM |
| | | | |
| PGIM Absolute Return Bond Fund | | | 15 | |
Strategy and Performance Overview (continued)
| | Fixed Income favors select securitizations from originators of unsecured consumer loans, subprime auto loans, and private refinance student loans that practice strong underwriting and display robust structural features. |
| • | | Government-related sectors, including Treasuries and agency mortgage-backed securities, remain significant Fund underweights as PGIM Fixed Income finds more compelling value in the aforementioned sectors. The Fund also occasionally has a modest notional exposure to non-US dollar currencies across a diversified basket of currencies in faster-growing emerging and developed countries with current positioning featuring an overweight to the US dollar. |
| | |
| 16 | | Visit our website at pgiminvestments.com |
Fees and Expenses (unaudited)
As a shareholder of the Fund, you incur two types of costs: (1) transaction costs, including sales charges (loads) on purchase payments and redemptions, as applicable, and (2) ongoing costs, including management fees, distribution and/or service (12b-1) fees, and other Fund expenses, as applicable. This example is intended to help you understand your ongoing costs (in dollars) of investing in the Fund and to compare these costs with the ongoing costs of investing in other mutual funds.
The example is based on an investment of $1,000 held through the six-month period ended October 31, 2018. The example is for illustrative purposes only; you should consult the Prospectus for information on initial and subsequent minimum investment requirements.
Actual Expenses
The first line for each share class in the table on the following page provides information about actual account values and actual expenses. You may use the information on this line, together with the amount you invested, to estimate the expenses that you paid over the period. Simply divide your account value by $1,000 (for example, an $8,600 account value ÷ $1,000 = 8.6), then multiply the result by the number on the first line under the heading “Expenses Paid During the Six-Month Period” to estimate the expenses you paid on your account during this period.
Hypothetical Example for Comparison Purposes
The second line for each share class in the table on the following page provides information about hypothetical account values and hypothetical expenses based on the Fund’s actual expense ratio and an assumed rate of return of 5% per year before expenses, which is not the Fund’s actual return. The hypothetical account values and expenses may not be used to estimate the actual ending account balance or expenses you paid for the period. You may use this information to compare the ongoing costs of investing in the Fund and other funds. To do so, compare this 5% hypothetical example with the 5% hypothetical examples that appear in the shareholder reports of the other funds.
The Fund’s transfer agent may charge additional fees to holders of certain accounts that are not included in the expenses shown in the table on the following page. These fees apply to individual retirement accounts (IRAs) and Section 403(b) accounts. As of the close of the six-month period covered by the table, IRA fees included an annual maintenance fee of $15 per account (subject to a maximum annual maintenance fee of $25 for all accounts held by the same shareholder). Section 403(b) accounts are charged an annual $25 fiduciary maintenance fee. Some of the fees may vary in amount, or may be waived, based on your total account balance or the number of PGIM funds, including the Fund, that you own. You should consider the additional fees that were charged to your Fund account over the six-month period when you estimate the total ongoing expenses paid over the period
| | | | |
| PGIM Absolute Return Bond Fund | | | 17 | |
Fees and Expenses (continued)
and the impact of these fees on your ending account value, as these additional expenses are not reflected in the information provided in the expense table. Additional fees have the effect of reducing investment returns.
Please note that the expenses shown in the table are meant to highlight your ongoing costs only and do not reflect any transactional costs such as sales charges (loads). Therefore, the second line for each share class in the table is useful in comparing ongoing costs only and will not help you determine the relative total costs of owning different funds. In addition, if these transactional costs were included, your costs would have been higher.
| | | | | | | | | | | | | | | | | | |
PGIM Absolute
Return Bond Fund | | Beginning Account
Value
May 1, 2018 | | | Ending Account
Value
October 31, 2018 | | | Annualized
Expense Ratio
Based on the
Six-Month Period | | | Expenses Paid
During the
Six-Month Period* | |
| Class A | | Actual | | $ | 1,000.00 | | | $ | 1,006.10 | | | | 1.01 | % | | $ | 5.11 | |
| | Hypothetical | | $ | 1,000.00 | | | $ | 1,020.11 | | | | 1.01 | % | | $ | 5.14 | |
| Class C | | Actual | | $ | 1,000.00 | | | $ | 1,002.30 | | | | 1.77 | % | | $ | 8.93 | |
| | Hypothetical | | $ | 1,000.00 | | | $ | 1,016.28 | | | | 1.77 | % | | $ | 9.00 | |
| Class Z | | Actual | | $ | 1,000.00 | | | $ | 1,007.50 | | | | 0.73 | % | | $ | 3.69 | |
| | Hypothetical | | $ | 1,000.00 | | | $ | 1,021.53 | | | | 0.73 | % | | $ | 3.72 | |
| Class R6** | | Actual | | $ | 1,000.00 | | | $ | 1,006.70 | | | | 0.70 | % | | $ | 3.54 | |
| | | Hypothetical | | $ | 1,000.00 | | | $ | 1,021.68 | | | | 0.70 | % | | $ | 3.57 | |
*Fund expenses (net of fee waivers or subsidies, if any) for each share class are equal to the annualized expense ratio for each share class (provided in the table), multiplied by the average account value over the period, multiplied by the 184 days in the six-month period ended October 31, 2018, and divided by the 365 days in the Fund’s fiscal year ended October 31, 2018 (to reflect the six-month period). Expenses presented in the table include the expenses of any underlying portfolios in which the Fund may invest.
**Formerly known as Class Q shares.
| | |
| 18 | | Visit our website at pgiminvestments.com |
Schedule of Investments
as of October 31, 2018
| | | | | | | | | | | | | | | | |
| Description | | Interest
Rate | | | Maturity
Date | | | Principal
Amount (000)# | | | Value | |
LONG-TERM INVESTMENTS 88.0% | | | | | | | | | | | | | | | | |
| | | | |
ASSET-BACKED SECURITIES 34.4% | | | | | | | | | | | | | | | | |
| | | | |
Automobiles 0.2% | | | | | | | | | | | | | | | | |
OneMain Direct Auto Receivables Trust, | | | | | | | | | | | | | | | | |
Series 2017-01A, Class C, 144A | | | 3.910 | % | | | 08/16/21 | | | | 4,100 | | | $ | 4,113,130 | |
Series 2017-02A, Class E, 144A | | | 4.740 | | | | 11/14/25 | | | | 1,200 | | | | 1,187,155 | |
| | | | | | | | | | | | | | | | |
| | | | | | | | | | | | | | | 5,300,285 | |
| | | | |
Collateralized Loan Obligations 23.3% | | | | | | | | | | | | | | | | |
Anchorage Capital CLO Ltd. (Cayman Islands),
Series 2015-06A, Class AR, 144A, 3 Month LIBOR + 1.270% | | | 3.706 | (c) | | | 07/15/30 | | | | 1,750 | | | | 1,752,466 | |
Armada Euro CLO (Ireland), | | | | | | | | | | | | | | | | |
Series 2018-02A, Class A1, 144A, 3 Month EURIBOR + 0.760% | | | 0.760 | (c) | | | 11/15/31 | | | EUR | 12,500 | | | | 13,990,602 | |
Series 2018-02A, Class A3, 144A | | | 1.500 | | | | 11/15/31 | | | EUR | 2,500 | | | | 2,829,635 | |
ArrowMark Colorado Holdings (Cayman Islands),
Series 2017-06A, Class A1, 144A, 3 Month LIBOR + 1.280% | | | 3.716 | (c) | | | 07/15/29 | | | | 2,500 | | | | 2,503,053 | |
Atlas Senior Loan Fund Ltd. (Cayman Islands), | | | | | | | | | | | | | | | | |
Series 2014-01A, Class AR2, 144A, 3 Month LIBOR + 1.260% | | | 3.696 | (c) | | | 07/16/29 | | | | 2,000 | | | | 2,001,906 | |
Series 2017-08A, Class A, 144A, 3 Month LIBOR + 1.300% | | | 3.736 | (c) | | | 01/16/30 | | | | 4,500 | | | | 4,497,062 | |
Aurium CLO DAC (Ireland), | | | | | | | | | | | | | | | | |
Series 4A, Class A1, 144A, 3 Month EURIBOR + 0.750% | | | 0.750 | (c) | | | 01/16/31 | | | EUR | 15,500 | | | | 17,351,603 | |
Series 4A, Class A2, 144A | | | 1.620 | | | | 01/16/31 | | | EUR | 3,100 | | | | 3,514,933 | |
Bain Capital Euro CLO DAC (Ireland),
Series 2018-01A, Class A, 144A, 3 Month EURIBOR + 0.780% | | | 0.780 | (c) | | | 04/20/32 | | | EUR | 10,000 | | | | 11,244,881 | |
Battalion CLO Ltd. (Cayman Islands),
Series 2015-08A, Class A1R, 144A, 3 Month LIBOR + 1.340% | | | 3.673 | (c) | | | 07/18/30 | | | | 2,000 | | | | 2,005,170 | |
Benefit Street Partners CLO Ltd. (Cayman Islands), | | | | | | | | | | | | | | | | |
Series 2013-IIA, Class A1R, 144A, 3 Month LIBOR + 1.250% | | | 3.686 | (c) | | | 07/15/29 | | | | 3,500 | | | | 3,504,685 | |
Series 2017-12A, Class A1, 144A, 3 Month LIBOR + 1.250% | | | 3.686 | (c) | | | 10/15/30 | | | | 9,250 | | | | 9,263,528 | |
Brookside Mill CLO Ltd. (Cayman Islands),
Series 2013-01A, Class BR, 144A, 3 Month LIBOR + 1.350% | | | 3.799 | (c) | | | 01/17/28 | | | | 4,000 | | | | 3,971,276 | |
See Notes to Financial Statements.
| | | | |
| PGIM Absolute Return Bond Fund | | | 19 | |
Schedule of Investments (continued)
as of October 31, 2018
| | | | | | | | | | | | | | | | |
| Description | | Interest
Rate | | | Maturity
Date | | | Principal
Amount (000)# | | | Value | |
ASSET-BACKED SECURITIES (Continued) | | | | | | | | | | | | | | | | |
| | | | |
Collateralized Loan Obligations (cont’d.) | | | | | | | | | | | | | | | | |
Carlyle Global Market Strategies Euro CLO Ltd. (Ireland),
Series 2015-3A, Class A1BR, 144A | | | 1.150 | % | | | 07/15/30 | | | EUR | 8,500 | | | $ | 9,571,371 | |
Carlyle US CLO Ltd. (Cayman Islands),
Series 2017-02A, Class A1B, 144A, 3 Month LIBOR + 1.220% | | | 3.689 | (c) | | | 07/20/31 | | | | 3,000 | | | | 3,006,231 | |
Catamaran CLO Ltd. (Cayman Islands),
Series 2014-01A, Class A1AR, 144A, 3 Month LIBOR + 1.260% | | | 3.729 | (c) | | | 04/22/30 | | | | 10,500 | | | | 10,485,082 | |
CIFC Funding Ltd. (Cayman Islands),
Series 2015-01A, Class ARR, 144A, 3 Month LIBOR + 1.110% | | | 3.579 | (c) | | | 01/22/31 | | | | 8,000 | | | | 7,984,572 | |
CVC Cordatus Loan Fund (Ireland),
Series 3A, Class A2RR, 144A | | | 1.750 | | | | 08/15/32 | | | EUR | 7,200 | | | | 8,199,207 | |
ECP CLO Ltd. (Cayman Islands),
Series 2014-06A, Class A1A, 144A, 3 Month LIBOR + 1.450% | | | 3.886 | (c) | | | 07/15/26 | | | | 7,055 | | | | 7,056,530 | |
Elevation CLO Ltd. (Cayman Islands),
Series 2017-07A, Class A, 144A, 3 Month LIBOR + 1.220% | | | 3.656 | (c) | | | 07/15/30 | | | | 4,000 | | | | 4,002,163 | |
Ellington CLO Ltd. (Cayman Islands),
Series 2017-02A, Class A, 144A, 3 Month LIBOR + 1.700% | | | 4.014 | (c) | | | 02/15/29 | | | | 20,000 | | | | 20,040,230 | |
Galaxy CLO Ltd. (Cayman Islands),
Series 2018-29A, Class B, 144A, 3 Month LIBOR + 1.400% | | | 3.714 | (c) | | | 11/15/26 | | | | 3,000 | | | | 2,994,682 | |
Hayfin Emerald CLO DAC (Ireland),
Series 1A, Class A3, 144A | | | 1.700 | | | | 09/06/31 | | | EUR | 3,000 | | | | 3,415,543 | |
Highbridge Loan Management Ltd. (Cayman Islands),
Series 2015-06A, Class A1R, 144A, 3 Month LIBOR + 1.000% | | | 3.341 | (c) | | | 02/05/31 | | | | 15,250 | | | | 15,166,582 | |
ICG US CLO Ltd. (Cayman Islands),
Series 2017-02A, Class A1, 144A, 3 Month LIBOR + 1.280% | | | 3.757 | (c) | | | 10/23/29 | | | | 3,000 | | | | 3,005,722 | |
Jubilee CLO BV (Netherlands),
Series 2016-17A, Class A2R, 144A, 3 Month EURIBOR + 1.150% (Cap 2.200%, Floor 1.150%) | | | 1.150 | (c) | | | 04/15/31 | | | EUR | 12,800 | | | | 14,540,628 | |
Jubilee CLO Ltd. (Netherlands),
Series 2017-19A, Class A1, 144A, 3 Month EURIBOR + 0.800% | | | 0.800 | (c) | | | 07/15/30 | | | EUR | 1,500 | | | | 1,686,061 | |
See Notes to Financial Statements.
| | | | | | | | | | | | | | | | |
| Description | | Interest
Rate | | | Maturity
Date | | | Principal
Amount (000)# | | | Value | |
ASSET-BACKED SECURITIES (Continued) | | | | | | | | | | | | | | | | |
| | | | |
Collateralized Loan Obligations (cont’d.) | | | | | | | | | | | | | | | | |
KKR CLO Ltd. (Cayman Islands), | | | | | | | | | | | | | | | | |
Series 11, Class AR, 144A, 3 Month LIBOR + 1.180% | | | 3.616 | %(c) | | | 01/15/31 | | | | 8,000 | | | $ | 7,999,891 | |
Series 18, Class A, 144A, 3 Month LIBOR + 1.270% | | | 3.715 | (c) | | | 07/18/30 | | | | 8,000 | | | | 8,009,974 | |
KVK CLO Ltd. (Cayman Islands), | | | | | | | | | | | | | | | | |
Series 2014-01A, Class A1R, 144A, 3 Month LIBOR + 1.300% | | | 3.614 | (c) | | | 05/15/26 | | | | 7,013 | | | | 7,016,225 | |
Series 2018-01A, Class B, 144A, 3 Month LIBOR + 1.650% | | | 3.981 | (c) | | | 05/20/29 | | | | 18,000 | | | | 18,028,276 | |
MidOcean Credit CLO (Cayman Islands), | | | | | | | | | | | | | | | | |
Series 2014-03A, Class A1R, 144A, 3 Month LIBOR + 1.120% | | | 3.589 | (c) | | | 04/21/31 | | | | 7,500 | | | | 7,478,378 | |
Series 2014-03A, Class BR, 144A, 3 Month LIBOR + 1.800% | | | 4.269 | (c) | | | 04/21/31 | | | | 18,000 | | | | 18,006,527 | |
Mountain View CLO LLC (Cayman Islands),
Series 2017-02A, Class A, 144A, 3 Month LIBOR + 1.210% | | | 3.646 | (c) | | | 01/16/31 | | | | 8,000 | | | | 8,003,121 | |
Mountain View CLO Ltd. (Cayman Islands),
Series 2015-09A, Class A2R, 144A, 3 Month LIBOR + 1.780% | | | 4.216 | (c) | | | 07/15/31 | | | | 22,500 | | | | 22,475,689 | |
North Westerly CLO BV (Netherlands),
Series IV-A, Class A2R, 144A | | | 1.250 | | | | 01/15/26 | | | EUR | 1,495 | | | | 1,691,645 | |
OCP CLO Ltd. (Cayman Islands),
Series 2017-13A, Class A1A, 144A, 3 Month LIBOR + 1.260% | | | 3.696 | (c) | | | 07/15/30 | | | | 5,750 | | | | 5,758,738 | |
OZLM Ltd. (Cayman Islands), | | | | | | | | | | | | | | | | |
Series 2014-06A, Class A2AS, 144A, 3 Month LIBOR + 1.750% | | | 4.199 | (c) | | | 04/17/31 | | | | 4,000 | | | | 3,997,250 | |
Series 2015-11A, Class A1R, 144A, 3 Month LIBOR + 1.250% | | | 3.770 | (c) | | | 10/30/30 | | | | 3,000 | | | | 3,005,108 | |
Series 2016-15A, Class A1, 144A, 3 Month LIBOR + 1.490% | | | 3.959 | (c) | | | 01/20/29 | | | | 22,750 | | | | 22,789,806 | |
Series 2018-20A, Class A2, 144A, 3 Month LIBOR + 1.650% | | | 4.119 | (c) | | | 04/20/31 | | | | 3,000 | | | | 2,997,569 | |
OZLME Designated Activity Co. (Netherlands), | | | | | | | | | | | | | | | | |
Series 3A, Class A1, 144A, 3 Month EURIBOR + 0.750% | | | 0.750 | (c) | | | 08/24/30 | | | EUR | 38,000 | | | | 42,668,613 | |
Series 3A, Class A2, 144A | | | 1.150 | | | | 08/24/30 | | | EUR | 8,000 | | | | 8,939,958 | |
Palmer Square CLO Ltd. (Cayman Islands), | | | | | | | | | | | | | | | | |
Series 2014-1A, Class A1R2, 144A, 3 Month LIBOR + 1.130% | | | 3.579 | (c) | | | 01/17/31 | | | | 10,000 | | | | 9,991,808 | |
See Notes to Financial Statements.
| | | | |
| PGIM Absolute Return Bond Fund | | | 21 | |
Schedule of Investments (continued)
as of October 31, 2018
| | | | | | | | | | | | | | | | |
| Description | | Interest
Rate | | | Maturity
Date | | | Principal
Amount (000)# | | | Value | |
ASSET-BACKED SECURITIES (Continued) | | | | | | | | | | | | | | | | |
| | | | |
Collateralized Loan Obligations (cont’d.) | | | | | | | | | | | | | | | | |
Palmer Square CLO Ltd. (Cayman Islands), (cont’d.) | | | | | | | | | | | | | | | | |
Series 2015-01A, Class A1R, 144A, 3 Month LIBOR + 1.300% | | | 3.612 | %(c) | | | 05/21/29 | | | | 10,200 | | | $ | 10,217,153 | |
Series 2015-02A, Class A1AR, 144A, 3 Month LIBOR + 1.270% | | | 3.739 | (c) | | | 07/20/30 | | | | 5,750 | | | | 5,758,937 | |
Series 2018-2A, Class A1A, 144A, 3 Month LIBOR + 1.100% | | | 3.362 | (c) | | | 07/16/31 | | | | 12,000 | | | | 11,962,080 | |
Regatta Funding LP (Cayman Islands),
Series 2013-02A, Class A1R, 144A, 3 Month LIBOR + 1.540% | | | 3.976 | (c) | | | 01/15/29 | | | | 7,250 | | | | 7,262,564 | |
Regatta Funding Ltd. (Cayman Islands),
Series 2017-01A, Class A, 144A, 3 Month LIBOR + 1.250% | | | 3.699 | (c) | | | 10/17/30 | | | | 4,750 | | | | 4,757,157 | |
Romark CLO Ltd. (Cayman Islands), | | | | | | | | | | | | | | | | |
Series 2018-01A, Class A1, 144A, 3 Month LIBOR + 1.030% | | | 3.499 | (c) | | | 04/20/31 | | | | 1,500 | | | | 1,491,846 | |
Series 2018-02A, Class A1, 144A, 3 Month LIBOR + 1.175% | | | 3.431 | (c) | | | 07/25/31 | | | | 5,000 | | | | 4,993,611 | |
Shackleton CLO Ltd. (Cayman Islands), | | | | | | | | | | | | | | | | |
Series 2014-05RA, Class B, 144A, 3 Month LIBOR + 1.700% | | | 4.063 | (c) | | | 05/07/31 | | | | 12,500 | | | | 12,496,679 | |
Series 2017-11A, Class A, 144A, 3 Month LIBOR + 1.270% | | | 3.584 | (c) | | | 08/15/30 | | | | 2,500 | | | | 2,503,481 | |
Sound Point CLO Ltd. (Cayman Islands), | | | | | | | | | | | | | | | | |
Series 2015-02A, Class AR, 144A, 3 Month LIBOR + 0.880% | | | 3.349 | (c) | | | 07/20/27 | | | | 7,500 | | | | 7,479,236 | |
Series 2017-02A, Class A, 144A, 3 Month LIBOR + 1.280% | | | 3.770 | (c) | | | 07/25/30 | | | | 8,500 | | | | 8,514,016 | |
Series 2017-03A, Class A1B, 144A, 3 Month LIBOR + 1.220% | | | 3.689 | (c) | | | 10/20/30 | | | | 8,750 | | | | 8,731,640 | |
TICP CLO Ltd. (Cayman Islands),
Series 2017-07A, Class AS, 144A, 3 Month LIBOR + 1.230% | | | 3.666 | (c) | | | 07/15/29 | | | | 5,500 | | | | 5,506,205 | |
Trinitas CLO Ltd. (Cayman Islands), | | | | | | | | | | | | | | | | |
Series 2015-03A, Class BR, 144A, 3 Month LIBOR + 1.400% | | | 3.836 | (c) | | | 07/15/27 | | | | 12,880 | | | | 12,790,454 | |
Series 2017-06A, Class A, 144A, 3 Month LIBOR + 1.320% | | | 3.810 | (c) | | | 07/25/29 | | | | 9,750 | | | | 9,770,253 | |
Series 2017-07A, Class A, 144A, 3 Month LIBOR + 1.210% | | | 3.700 | (c) | | | 01/25/31 | | | | 4,500 | | | | 4,502,802 | |
See Notes to Financial Statements.
| | | | | | | | | | | | | | | | |
| Description | | Interest
Rate | | | Maturity
Date | | | Principal
Amount (000)# | | | Value | |
ASSET-BACKED SECURITIES (Continued) | | | | | | | | | | | | | | | | |
| | | | |
Collateralized Loan Obligations (cont’d.) | | | | | | | | | | | | | | | | |
Trinitas CLO Ltd. (Cayman Islands), (cont’d.)
Series 2017-07A, Class B, 144A, 3 Month LIBOR + 1.600% | | | 4.090 | %(c) | | | 01/25/31 | | | | 3,000 | | | $ | 2,989,179 | |
Tryon Park CLO Ltd. (Cayman Islands),
Series 2013-01A, Class A2R, 144A, 3 Month LIBOR + 1.500% | | | 3.936 | (c) | | | 04/15/29 | | | | 4,000 | | | | 3,991,220 | |
Venture CLO Ltd. (Cayman Islands),
Series 2015-21A, Class AR, 144A, 3 Month LIBOR + 0.880% | | | 3.316 | (c) | | | 07/15/27 | | | | 7,500 | | | | 7,480,168 | |
Voya CLO Ltd. (Cayman Islands), | | | | | | | | | | | | | | | | |
Series 2013-01A, Class A1AR, 144A, 3 Month LIBOR + 1.210% | | | 3.646 | (c) | | | 10/15/30 | | | | 2,750 | | | | 2,752,872 | |
Series 2015-01A, Class A1R, 144A, 3 Month LIBOR + 0.900% | | | 3.345 | (c) | | | 01/18/29 | | | | 19,000 | | | | 18,952,846 | |
Voya Euro CLO Designated Activity Co. (Ireland),
Series 01A, Class A, 144A, 3 Month EURIBOR + 0.750% | | | 0.750 | (c) | | | 10/15/30 | | | EUR | 13,000 | | | | 14,588,902 | |
Wellfleet CLO Ltd. (Cayman Islands), | | | | | | | | | | | | | | | | |
Series 2017-01A, Class A1, 144A, 3 Month LIBOR + 1.320% | | | 3.789 | (c) | | | 04/20/29 | | | | 4,000 | | | | 4,007,418 | |
Series 2017-02A, Class A1, 144A, 3 Month LIBOR + 1.250% | | | 3.719 | (c) | | | 10/20/29 | | | | 7,000 | | | | 7,011,612 | |
Series 2017-03A, Class A1, 144A, 3 Month LIBOR + 1.150% | | | 3.599 | (c) | | | 01/17/31 | | | | 10,500 | | | | 10,472,544 | |
York CLO Ltd. (Cayman Islands),
Series 2015-01A, Class AR, 144A, 3 Month LIBOR + 1.150% | | | 3.619 | (c) | | | 01/22/31 | | | | 3,000 | | | | 2,993,948 | |
Zais CLO Ltd. (Cayman Islands), | | | | | | | | | | | | | | | | |
Series 2015-03A, Class A2R, 144A, 3 Month LIBOR + 2.190% | | | 4.626 | (c) | | | 07/15/31 | | | | 12,800 | | | | 12,806,870 | |
Series 2017-01A, Class A1, 144A, 3 Month LIBOR + 1.370% | | | 3.806 | (c) | | | 07/15/29 | | | | 8,750 | | | | 8,770,387 | |
Series 2017-02A, Class A, 144A, 3 Month LIBOR + 1.290% | | | 3.726 | (c) | | | 04/15/30 | | | | 4,750 | | | | 4,775,677 | |
| | | | | | | | | | | | | | | | |
| | | | | | | | | | | | | | | 608,775,737 | |
| | | | |
Consumer Loans 2.3% | | | | | | | | | | | | | | | | |
Lendmark Funding Trust, | | | | | | | | | | | | | | | | |
Series 2017-01A, Class B, 144A | | | 3.770 | | | | 12/22/25 | | | | 1,300 | | | | 1,290,798 | |
Series 2017-02A, Class C, 144A | | | 4.330 | | | | 05/20/26 | | | | 700 | | | | 691,995 | |
Series 2018-02A, Class A, 144A | | | 4.230 | | | | 04/20/27 | | | | 3,200 | | | | 3,199,595 | |
See Notes to Financial Statements.
| | | | |
| PGIM Absolute Return Bond Fund | | | 23 | |
Schedule of Investments (continued)
as of October 31, 2018
| | | | | | | | | | | | | | | | |
| Description | | Interest
Rate | | | Maturity
Date | | | Principal
Amount (000)# | | | Value | |
ASSET-BACKED SECURITIES (Continued) | | | | | | | | | | | | | | | | |
| | | | |
Consumer Loans (cont’d.) | | | | | | | | | | | | | | | | |
OneMain Financial Issuance Trust, | | | | | | | | | | | | | | | | |
Series 2015-01A, Class B, 144A | | | 3.850 | % | | | 03/18/26 | | | | 2,000 | | | $ | 2,007,518 | |
Series 2015-02A, Class B, 144A | | | 3.100 | | | | 07/18/25 | | | | 4,497 | | | | 4,495,355 | |
Series 2015-02A, Class C, 144A | | | 4.320 | | | | 07/18/25 | | | | 2,100 | | | | 2,105,961 | |
Series 2017-01A, Class A2, 144A, 1 Month LIBOR + 0.800% | | | 3.080 | (c) | | | 09/14/32 | | | | 4,300 | | | | 4,310,801 | |
Series 2017-01A, Class C, 144A | | | 3.350 | | | | 09/14/32 | | | | 700 | | | | 682,898 | |
Oportun Funding LLC, | | | | | | | | | | | | | | | | |
Series 2016-C, Class B, 144A | | | 4.850 | | | | 11/08/21 | | | | 6,665 | | | | 6,666,869 | |
Series 2017-B, Class B, 144A | | | 4.260 | | | | 10/10/23 | | | | 7,500 | | | | 7,471,783 | |
Series 2018-B, Class A, 144A | | | 3.910 | | | | 07/08/24 | | | | 2,050 | | | | 2,039,876 | |
Series 2018-B, Class B, 144A | | | 4.500 | | | | 07/08/24 | | | | 500 | | | | 498,677 | |
Series 2018-B, Class C, 144A | | | 5.430 | | | | 07/08/24 | | | | 1,000 | | | | 994,248 | |
Series 2018-C, Class A, 144A | | | 4.100 | | | | 10/08/24 | | | | 3,200 | | | | 3,198,583 | |
Series 2018-C, Class B, 144A | | | 4.590 | | | | 10/08/24 | | | | 1,300 | | | | 1,312,322 | |
Series 2018-C, Class C, 144A | | | 5.520 | | | | 10/08/24 | | | | 2,000 | | | | 1,996,633 | |
PNMAC FMSR Issuer Trust,
Series 2018-FT01, Class A, 144A, 1 Month LIBOR + 2.350% | | | 4.631 | (c) | | | 04/25/23 | | | | 3,200 | | | | 3,223,045 | |
PNMAC GMSR Issuer Trust, | | | | | | | | | | | | | | | | |
Series 2018-GT01, Class A, 144A, 1 Month LIBOR + 2.850% | | | 5.131 | (c) | | | 02/25/23 | | | | 1,650 | | | | 1,667,620 | |
Series 2018-GT02, Class A, 144A, 1 Month LIBOR + 2.650% | | | 4.931 | (c) | | | 08/25/25 | | | | 3,400 | | | | 3,423,760 | |
Springleaf Funding Trust, | | | | | | | | | | | | | | | | |
Series 2015-AA, Class B, 144A | | | 3.620 | | | | 11/15/24 | | | | 3,430 | | | | 3,417,574 | |
Series 2015-AA, Class C, 144A | | | 5.040 | | | | 11/15/24 | | | | 6,000 | | | | 5,970,064 | |
| | | | | | | | | | | | | | | | |
| | | | | | | | | | | | | | | 60,665,975 | |
| | | | |
Home Equity Loans 2.5% | | | | | | | | | | | | | | | | |
ABFC Trust,
Series 2004-OPT5, Class A1, 1 Month LIBOR + 0.700% | | | 2.981 | (c) | | | 06/25/34 | | | | 1,211 | | | | 1,220,637 | |
Accredited Mortgage Loan Trust, | | | | | | | | | | | | | | | | |
Series 2004-3, Class 2A2, 1 Month LIBOR + 1.200% (Cap 13.000%, Floor 0.600%) | | | 3.481 | (c) | | | 10/25/34 | | | | 2,891 | | | | 2,946,832 | |
Series 2004-3, Class 2A5, 1 Month LIBOR + 1.080% (Cap 13.000%, Floor 0.540%) | | | 3.361 | (c) | | | 10/25/34 | | | | 1,672 | | | | 1,676,136 | |
Series 2005-3, Class M1, 1 Month LIBOR + 0.450% (Cap N/A, Floor 0.450%) | | | 2.960 | (c) | | | 09/25/35 | | | | 5 | | | | 5,220 | |
See Notes to Financial Statements.
| | | | | | | | | | | | | | | | |
| Description | | Interest
Rate | | | Maturity
Date | | | Principal
Amount (000)# | | | Value | |
ASSET-BACKED SECURITIES (Continued) | | | | | | | | | | | | | | | | |
| | | | |
Home Equity Loans (cont’d.) | | | | | | | | | | | | | | | | |
Ameriquest Mortgage Securities, Inc., Asset-Backed Pass-Through Certificates, | | | | | | | | | | | | | | | | |
Series 2003-01, Class M1, 1 Month LIBOR + 1.350% | | | 3.631 | %(c) | | | 02/25/33 | | | | 1,526 | | | $ | 1,508,605 | |
Series 2003-10, Class AV1, 1 Month LIBOR + 0.760% | | | 3.041 | (c) | | | 12/25/33 | | | | 2,749 | | | | 2,735,263 | |
Argent Securities, Inc., Asset-Backed Pass-Through Certificates, | | | | | | | | | | | | | | | | |
Series 2003-W05, Class M1, 1 Month LIBOR + 1.050% | | | 3.331 | (c) | | | 10/25/33 | | | | 22 | | | | 22,434 | |
Series 2003-W07, Class M1, 1 Month LIBOR + 1.035% | | | 3.316 | (c) | | | 03/25/34 | | | | 900 | | | | 900,124 | |
Series 2003-W08, Class M1, 1 Month LIBOR + 1.050% | | | 3.331 | (c) | | | 12/25/33 | | | | 717 | | | | 722,038 | |
Series 2003-W09, Class M1, 1 Month LIBOR + 1.035% | | | 3.316 | (c) | | | 01/25/34 | | | | 1,761 | | | | 1,764,265 | |
Series 2004-W06, Class AF | | | 4.123 | | | | 05/25/34 | | | | 193 | | | | 193,304 | |
Series 2004-W06, Class AV5, 1 Month LIBOR + 0.800% | | | 3.081 | (c) | | | 05/25/34 | | | | 587 | | | | 571,361 | |
Asset-Backed Securities Corp. Home Equity Loan Trust, | | | | | | | | | | | | | | | | |
Series 2003-HE06, Class A2, 1 Month LIBOR + 0.680% | | | 2.961 | (c) | | | 11/25/33 | | | | 1,757 | | | | 1,706,217 | |
Series 2003-HE6, Class A3B, 1 Month LIBOR + 0.960% | | | 3.241 | (c) | | | 11/25/33 | | | | 3,546 | | | | 3,431,427 | |
Series 2004-HE03, Class M1, 1 Month LIBOR + 0.810% | | | 3.091 | (c) | | | 06/25/34 | | | | 2,628 | | | | 2,626,130 | |
Bear Stearns Asset-Backed Securities Trust, | | | | | | | | | | | | | | | | |
Series 2002-2, Class A1, 1 Month LIBOR + 0.660% | | | 2.941 | (c) | | | 10/25/32 | | | | 871 | | | | 873,326 | |
Series 2003-3, Class A2, 1 Month LIBOR + 1.180% | | | 3.461 | (c) | | | 06/25/43 | | | | 106 | | | | 105,103 | |
Series 2003-HE1, Class M1, 1 Month LIBOR + 1.095% | | | 3.376 | (c) | | | 01/25/34 | | | | 2,418 | | | | 2,455,736 | |
Series 2004-FR02, Class M2, 1 Month LIBOR + 1.020% | | | 3.301 | (c) | | | 06/25/34 | | | | 1,100 | | | | 1,115,254 | |
Series 2004-HE05, Class M1, 1 Month LIBOR + 0.855% | | | 3.136 | (c) | | | 07/25/34 | | | | 4,858 | | | | 4,857,335 | |
Series 2004-HE11, Class M2, 1 Month LIBOR + 1.575% | | | 3.856 | (c) | | | 12/25/34 | | | | 2,799 | | | | 2,860,516 | |
See Notes to Financial Statements.
| | | | |
| PGIM Absolute Return Bond Fund | | | 25 | |
Schedule of Investments (continued)
as of October 31, 2018
| | | | | | | | | | | | | | | | |
| Description | | Interest
Rate | | | Maturity
Date | | | Principal
Amount (000)# | | | Value | |
ASSET-BACKED SECURITIES (Continued) | | | | | | | | | | | | | | | | |
| | | | |
Home Equity Loans (cont’d.) | | | | | | | | | | | | | | | | |
Home Equity Asset Trust, | | | | | | | | | | | | | | | | |
Series 2003-06, Class M1, 1 Month LIBOR + 1.050% | | | 3.331 | %(c) | | | 02/25/34 | | | | 1,093 | | | $ | 1,069,659 | |
Series 2004-7, Class A2, 1 Month LIBOR + 0.840% (Cap N/A, Floor 0.420%) | | | 3.121 | (c) | | | 01/25/35 | | | | 1,050 | | | | 1,059,054 | |
MASTR Asset-Backed Securities Trust, | | | | | | | | | | | | | | | | |
Series 2003-WMC2, Class M2, 1 Month LIBOR + 2.475% (Cap N/A, Floor 1.650%) | | | 4.756 | (c) | | | 08/25/33 | | | | 912 | | | | 955,744 | |
Series 2005-NC01, Class M1, 1 Month LIBOR + 0.720% | | | 3.001 | (c) | | | 12/25/34 | | | | 8,247 | | | | 8,236,500 | |
Merrill Lynch Mortgage Investors Trust,
Series 2002-HE01, Class A1, 1 Month LIBOR + 1.000% | | | 3.281 | (c) | | | 08/25/32 | | | | 2,670 | | | | 2,628,764 | |
Morgan Stanley ABS Capital I, Inc. Trust, | | | | | | | | | | | | | | | | |
Series 2003-HE03, Class M1, 1 Month LIBOR + 1.020% | | | 3.301 | (c) | | | 10/25/33 | | | | 2,686 | | | | 2,685,273 | |
Series 2003-NC08, Class M1, 1 Month LIBOR + 1.050% | | | 3.331 | (c) | | | 09/25/33 | | | | 575 | | | | 570,373 | |
Series 2003-NC10, Class M1, 1 Month LIBOR + 1.020% | | | 3.301 | (c) | | | 10/25/33 | | | | 698 | | | | 691,810 | |
Series 2004-HE04, Class M1, 1 Month LIBOR + 0.900% | | | 3.181 | (c) | | | 05/25/34 | | | | 4,887 | | | | 4,879,388 | |
Series 2004-HE05, Class M1, 1 Month LIBOR + 0.945% | | | 3.226 | (c) | | | 06/25/34 | | | | 779 | | | | 779,623 | |
Series 2004-OP01, Class M1, 1 Month LIBOR + 0.870% | | | 3.151 | (c) | | | 11/25/34 | | | | 1,941 | | | | 1,933,987 | |
New Residential Mortgage Loan Trust,
Series 2018-01A, Class A1A, 144A | | | 4.000 | (cc) | | | 12/25/57 | | | | 2,988 | | | | 2,992,795 | |
Option One Mortgage Loan Trust, | | | | | | | | | | | | | | | | |
Series 2004-01, Class M1, 1 Month LIBOR + 0.900% | | | 3.181 | (c) | | | 01/25/34 | | | | 1,626 | | | | 1,615,342 | |
Series 2005-01, Class A4, 1 Month LIBOR + 0.800% (Cap N/A, Floor 0.400%) | | | 3.081 | (c) | | | 02/25/35 | | | | 40 | | | | 40,389 | |
RASC Series Trust,
Series 2005-KS11, Class M1, 1 Month LIBOR + 0.400% (Cap 14.000%, Floor 0.400%) | | | 2.681 | (c) | | | 12/25/35 | | | | 433 | | | | 433,695 | |
Securitized Asset-Backed Receivables LLC Trust,
Series 2004-NC01, Class M1, 1 Month LIBOR + 0.780% | | | 3.061 | (c) | | | 02/25/34 | | | | 1,089 | | | | 1,092,624 | |
| | | | | | | | | | | | | | | | |
| | | | | | | | | | | | | | | 65,962,283 | |
See Notes to Financial Statements.
| | | | | | | | | | | | | | | | |
| Description | | Interest
Rate | | | Maturity
Date | | | Principal
Amount (000)# | | | Value | |
ASSET-BACKED SECURITIES (Continued) | | | | | | | | | | | | | | | | |
| | | | |
Residential Mortgage-Backed Securities 5.4% | | | | | | | | | | | | | | | | |
Amortizing Residential Collateral Trust,
Series 2002-BC08, Class A3, 1 Month LIBOR + 1.000% | | | 3.281 | %(c) | | | 11/25/32 | | | | 601 | | | $ | 599,799 | |
Chase Funding Trust Series, | | | | | | | | | | | | | | | | |
Series 2002-3, Class 2A1, 1 Month LIBOR + 0.640% (Cap N/A, Floor 0.320%) | | | 2.921 | (c) | | | 08/25/32 | | | | 312 | | | | 305,878 | |
Series 2003-4, Class 1A5 | | | 5.235 | | | | 05/25/33 | | | | 679 | | | | 686,967 | |
Citigroup Mortgage Loan Trust, Inc., | | | | | | | | | | | | | | | | |
Series 2005-OPT1, Class M1, 1 Month LIBOR + 0.630% (Cap N/A, Floor 0.420%) | | | 2.911 | (c) | | | 02/25/35 | | | | 310 | | | | 309,294 | |
Series 2005-WF1, Class A5 | | | 5.010 | (cc) | | | 11/25/34 | | | | 22 | | | | 21,637 | |
Countrywide Asset-Backed Certificates, | | | | | | | | | | | | | | | | |
Series 2003-BC04, Class M1, 1 Month LIBOR + 1.050% | | | 3.331 | (c) | | | 07/25/33 | | | | 837 | | | | 833,067 | |
Series 2004-03, Class 1A, 1 Month LIBOR + 0.420% | | | 2.701 | (c) | | | 08/25/34 | | | | 7,769 | | | | 7,395,820 | |
Series 2004-BC04, Class M1, 1 Month LIBOR + 1.050% | | | 3.331 | (c) | | | 11/25/34 | | | | 575 | | | | 575,518 | |
Credit Suisse Mortgage Trust, | | | | | | | | | | | | | | | | |
Series 2016-RPL01, Class A1, 144A, 1 Month LIBOR + 3.150% | | | 5.406 | (c) | | | 12/26/46 | | | | 4,789 | | | | 4,867,100 | |
Series 2018-03R, Class 1A1, 144A, 1 Month LIBOR + 1.200% | | | 3.474 | (c) | | | 12/25/46 | | | | 6,490 | | | | 6,509,761 | |
Series 2018-RPL08, Class A1, 144A | | | 4.125 | | | | 07/25/58 | | | | 7,678 | | | | 7,623,746 | |
Credit-Based Asset Servicing & Securitization LLC, | | | | | | | | | | | | | | | | |
Series 2003-CB03, Class AF1 | | | 3.379 | | | | 12/25/32 | | | | 135 | | | | 134,064 | |
Series 2003-CB05, Class M1, 1 Month LIBOR + 1.020% | | | 3.301 | (c) | | | 11/25/33 | | | | 697 | | | | 679,815 | |
CWABS, Inc., Asset-Backed Certificates, | | | | | | | | | | | | | | | | |
Series 2004-01, Class M1, 1 Month LIBOR + 0.750% | | | 3.031 | (c) | | | 03/25/34 | | | | 119 | | | | 119,703 | |
Series 2004-6, Class 1A1, 1 Month LIBOR + 0.540% | | | 2.821 | (c) | | | 12/25/34 | | | | 1,862 | | | | 1,858,626 | |
Finance America Mortgage Loan Trust, | | | | | | | | | | | | | | | | |
Series 2003-1, Class M1, 1 Month LIBOR + 1.050% (Cap N/A, Floor 0.700%) | | | 3.331 | (c) | | | 09/25/33 | | | | 1,916 | | | | 1,876,262 | |
Series 2004-02, Class M1, 1 Month LIBOR + 0.825% | | | 3.106 | (c) | | | 08/25/34 | | | | 5,248 | | | | 5,233,625 | |
First Franklin Mortgage Loan Trust,
Series 2004-FF5, Class A2, 1 Month LIBOR + 0.760% (Cap N/A, Floor 0.380%) | | | 3.041 | (c) | | | 08/25/34 | | | | 1,016 | | | | 991,808 | |
See Notes to Financial Statements.
| | | | |
| PGIM Absolute Return Bond Fund | | | 27 | |
Schedule of Investments (continued)
as of October 31, 2018
| | | | | | | | | | | | | | | | |
| Description | | Interest
Rate | | | Maturity
Date | | | Principal
Amount (000)# | | | Value | |
ASSET-BACKED SECURITIES (Continued) | | | | | | | | | | | | | | | | |
| | | | |
Residential Mortgage-Backed Securities (cont’d.) | | | | | | | | | | | | | | | | |
Fremont Home Loan Trust,
Series 2004-4, Class M1, 1 Month LIBOR + 0.795% (Cap N/A, Floor 0.530%) | | | 3.076 | %(c) | | | 03/25/35 | | | | 2,512 | | | $ | 2,492,658 | |
GSAMP Trust, | | | | | | | | | | | | | | | | |
Series 2003-HE2, Class A1A, 144A, 1 Month LIBOR + 0.600% (Cap N/A, Floor 0.300%) | | | 2.881 | (c) | | | 08/25/33 | | | | 729 | | | | 712,231 | |
Series 2004-AR1, Class A2B, 1 Month LIBOR + 1.200% (Cap N/A, Floor 0.600%) | | | 3.481 | (c) | | | 06/25/34 | | | | 1,422 | | | | 1,423,426 | |
Series 2004-NC2, Class A1B, 1 Month LIBOR + 0.900% (Cap N/A, Floor 0.450%) | | | 3.181 | (c) | | | 10/25/34 | | | | 1,787 | | | | 1,719,258 | |
Series 2007-HE01, Class A1, 1 Month LIBOR + 0.140% | | | 2.421 | (c) | | | 03/25/47 | | | | 2,362 | | | | 2,232,186 | |
JPMorgan Mortgage Acquisition Corp.,
Series 2005-OPT2, Class M1, 1 Month LIBOR + 0.430% (Cap N/A, Floor 0.430%) | | | 2.711 | (c) | | | 12/25/35 | | | | 276 | | | | 275,976 | |
Long Beach Mortgage Loan Trust, | | | | | | | | | | | | | | | | |
Series 2003-04, Class AV1, 1 Month LIBOR + 0.620% | | | 2.901 | (c) | | | 08/25/33 | | | | 1,464 | | | | 1,464,857 | |
Series 2004-2, Class A1, 1 Month LIBOR + 0.440% (Cap N/A, Floor 0.220%) | | | 2.721 | (c) | | | 06/25/34 | | | | 985 | | | | 971,768 | |
LSFVT,
Series 2018-01, 1 Month LIBOR + 2.000%^ | | | 3.982 | (c) | | | 04/01/21 | | | | 20,876 | | | | 20,813,302 | |
Morgan Stanley ABS Capital I, Inc. Trust, | | | | | | | | | | | | | | | | |
Series 2004-NC05, Class M1, 1 Month LIBOR + 0.900% | | | 3.181 | (c) | | | 05/25/34 | | | | 258 | | | | 252,667 | |
Series 2004-NC06, Class M1, 1 Month LIBOR + 0.900% | | | 3.181 | (c) | | | 07/25/34 | | | | 1,595 | | | | 1,548,927 | |
Park Place Securities, Inc., Asset-Backed Pass-Through Certificates, | | | | | | | | | | | | | | | | |
Series 2005-WCH1, Class M3, 1 Month LIBOR + 0.840% (Cap N/A, Floor 0.560%) | | | 3.121 | (c) | | | 01/25/36 | | | | 829 | | | | 829,907 | |
Series 2005-WCW1, Class M1, 1 Month LIBOR + 0.450% (Cap N/A, Floor 0.450%) | | | 2.731 | (c) | | | 09/25/35 | | | | 161 | | | | 161,280 | |
Specialty Underwriting & Residential Finance Trust, | | | | | | | | | | | | | | | | |
Series 2003-BC04, Class M1, 1 Month LIBOR + 0.900% | | | 3.181 | (c) | | | 11/25/34 | | | | 1,310 | | | | 1,260,898 | |
Series 2004-BC02, Class M1, 1 Month LIBOR + 0.825% | | | 3.106 | (c) | | | 05/25/35 | | | | 2,073 | | | | 2,067,687 | |
Series 2004-BC4, Class A2C, 1 Month LIBOR + 0.980% (Cap N/A, Floor 0.490%) | | | 3.261 | (c) | | | 10/25/35 | | | | 1,249 | | | | 1,225,578 | |
See Notes to Financial Statements.
| | | | | | | | | | | | | | | | |
| Description | | Interest
Rate | | | Maturity
Date | | | Principal
Amount (000)# | | | Value | |
ASSET-BACKED SECURITIES (Continued) | | | | | | | | | | | | | | | | |
| | | | |
Residential Mortgage-Backed Securities (cont’d.) | | | | | | | | | | | | | | | | |
Structured Asset Investment Loan Trust, | | | | | | | | | | | | | | | | |
Series 2004-08, Class A8, 1 Month LIBOR + 1.000% | | | 3.281 | %(c) | | | 09/25/34 | | | | 2,123 | | | $ | 2,120,821 | |
Series 2004-BNC01, Class A2, 1 Month LIBOR + 1.000% | | | 3.281 | (c) | | | 09/25/34 | | | | 3,300 | | | | 3,302,584 | |
Series 2005-3, Class M2, 1 Month LIBOR + 0.660% (Cap N/A, Floor 0.440%) | | | 2.941 | (c) | | | 04/25/35 | | | | 841 | | | | 841,370 | |
TFS (Spain),
Series 2018-03, Class A1, 1 Month EURIBOR + 2.900% | | | 2.900 | (c) | | | 03/16/23 | | | EUR | 13,155 | | | | 14,900,200 | |
Towd Point Mortgage Trust, | | | | | | | | | | | | | | | | |
Series 2017-04, Class A1, 144A | | | 2.750 | (cc) | | | 06/25/57 | | | | 2,697 | | | | 2,611,859 | |
Series 2018-02, Class A1, 144A | | | 3.250 | (cc) | | | 03/25/58 | | | | 13,675 | | | | 13,449,455 | |
Series 2018-03, Class A1, 144A | | | 3.750 | (cc) | | | 05/25/58 | | | | 16,277 | | | | 16,195,296 | |
Series 2018-06, Class A1A, 144A | | | 3.750 | (cc) | | | 03/25/58 | | | | 7,910 | | | | 7,883,945 | |
VOLT LLC,
Series 2017-NPL07, Class A1, 144A | | | 3.250 | | | | 06/25/47 | | | | 408 | | | | 405,166 | |
| | | | | | | | | | | | | | | | |
| | | | | | | | | | | | | | | 141,785,792 | |
| | | | |
Student Loans 0.7% | | | | | | | | | | | | | | | | |
SLM Student Loan Trust, | | | | | | | | | | | | | | | | |
Series 2004-02X, Class A6, 3 Month EURIBOR + 0.550% | | | 0.233 | (c) | | | 07/25/39 | | | EUR | 7,950 | | | | 8,672,622 | |
Series 2007-02, Class B, 3 Month LIBOR + 0.170% | | | 2.660 | (c) | | | 07/25/25 | | | | 11,503 | | | | 10,525,125 | |
| | | | | | | | | | | | | | | | |
| | | | | | | | | | | | | | | 19,197,747 | |
| | | | | | | | | | | | | | | | |
TOTAL ASSET-BACKED SECURITIES
(cost $907,588,352) | | | | | | | | | | | | | | | 901,687,819 | |
| | | | | | | | | | | | | | | | |
| | | | |
BANK LOANS 1.2% | | | | | | | | | | | | | | | | |
| | | | |
Chemicals 0.1% | | | | | | | | | | | | | | | | |
Starfruit Finco BV (Netherlands),
Initial Euro Term Loan, 6 Month EURIBOR + 3.750% | | | 3.750 | (c) | | | 10/01/25 | | | EUR | 2,100 | | | | 2,396,391 | |
| | | | |
Consumer Services 0.0% | | | | | | | | | | | | | | | | |
Richmond UK Bidco Ltd. (United Kingdom),
Facility B, 1 Month GBP LIBOR + 4.250% | | | 4.980 | (c) | | | 03/03/24 | | | GBP | 971 | | | | 1,204,227 | |
See Notes to Financial Statements.
| | | | |
| PGIM Absolute Return Bond Fund | | | 29 | |
Schedule of Investments (continued)
as of October 31, 2018
| | | | | | | | | | | | | | | | |
| Description | | Interest
Rate | | | Maturity
Date | | | Principal
Amount (000)# | | | Value | |
BANK LOANS (Continued) | | | | | | | | | | | | | | | | |
| | | | |
Foods 0.2% | | | | | | | | | | | | | | | | |
Sigma Bidco BV,
Facility B4 Loan, 3 Month GBP LIBOR + 4.000% | | | 4.800 | %(c) | | | 07/02/25 | | | GBP | 3,700 | | | $ | 4,725,964 | |
| | | | |
Healthcare & Pharmaceuticals 0.0% | | | | | | | | | | | | | | | | |
Nidda Healthcare Holding AG (Germany),
Facility C GBP, 3 Month GBP LIBOR + 4.500% | | | 4.993 | (c) | | | 08/21/24 | | | GBP | 57 | | | | 73,374 | |
| | | | |
Healthcare-Services 0.1% | | | | | | | | | | | | | | | | |
Avantor, Inc.,
Initial Euro Term Loan, 1 Month EURIBOR + 4.250% | | | 4.250 | (c) | | | 11/21/24 | | | EUR | 1,365 | | | | 1,561,162 | |
| | | | |
Oil & Gas 0.2% | | | | | | | | | | | | | | | | |
EG Finco Ltd. (United Kingdom), | | | | | | | | | | | | | | | | |
Second Lien Term Loan, 3 Month EURIBOR + 7.750% | | | 8.750 | (c) | | | 04/06/26 | | | EUR | 675 | | | | 766,924 | |
Term B, 3 Month GBP LIBOR + 4.750% | | | 5.550 | (c) | | | 02/06/25 | | | GBP | 1,119 | | | | 1,436,407 | |
Term B1, 3 Month EURIBOR + 4.000% | | | 4.000 | (c) | | | 02/07/25 | | | EUR | 1,634 | | | | 1,856,277 | |
Term B3, 2 Month EURIBOR + 4.000% | | | 4.000 | (c) | | | 02/07/25 | | | EUR | 833 | | | | 945,698 | |
| | | | | | | | | | | | | | | | |
| | | | | | | | | | | | | | | 5,005,306 | |
| | | | |
Oil, Gas & Coal 0.0% | | | | | | | | | | | | | | | | |
EG America LLC,
Second Lien Facility (USD), 3 Month LIBOR + 8.000%^ | | | 10.390 | (c) | | | 03/23/26 | | | | 1,150 | | | | 1,138,500 | |
| | | | |
Technology 0.4% | | | | | | | | | | | | | | | | |
Dell International LLC,
Replacement Term A-3 Loan, 1 Month LIBOR + 1.500% | | | 3.810 | (c) | | | 12/31/18 | | | | 6,721 | | | | 6,713,589 | |
McAfee LLC, | | | | | | | | | | | | | | | | |
Retired Closing Date Term Loan, 1 Month LIBOR + 4.500% | | | 6.790 | (c) | | | 09/30/24 | | | | 2,085 | | | | 2,087,674 | |
Second Lien Initial Loan, 1 Month LIBOR + 8.500% | | | 10.790 | (c) | | | 09/29/25 | | | | 1,950 | | | | 1,971,124 | |
| | | | | | | | | | | | | | | | |
| | | | | | | | | | | | | | | 10,772,387 | |
See Notes to Financial Statements.
| | | | | | | | | | | | | | | | |
| Description | | Interest
Rate | | | Maturity
Date | | | Principal
Amount (000)# | | | Value | |
BANK LOANS (Continued) | | | | | | | | | | | | | | | | |
| | | | |
Telecommunications 0.2% | | | | | | | | | | | | | | | | |
Sprint Communications, Inc.,
Initial Term Loan, 1 Month LIBOR + 2.500% | | | 4.810 | %(c) | | | 02/02/24 | | | | 3,980 | | | $ | 3,971,508 | |
| | | | | | | | | | | | | | | | |
TOTAL BANK LOANS
(cost $31,765,736) | | | | | | | | | | | | | | | 30,848,819 | |
| | | | | | | | | | | | | | | | |
|
COMMERCIAL MORTGAGE-BACKED SECURITIES 6.2% | |
20 Times Square Trust, | | | | | | | | | | | | | | | | |
Series 2018-20TS, Class G, 144A | | | 3.100 | (cc) | | | 05/15/35 | | | | 2,700 | | | | 2,434,240 | |
Series 2018-20TS, Class H, 144A | | | 3.100 | (cc) | | | 05/15/35 | | | | 2,700 | | | | 2,375,092 | |
BANK,
Series 2017-BNK08, Class A3 | | | 3.229 | | | | 11/15/50 | | | | 1,300 | | | | 1,222,997 | |
BBCMS Mortgage Trust,
Series 2018-TALL, Class D, 144A, 1 Month LIBOR + 1.449% | | | 3.728 | (c) | | | 03/15/37 | | | | 16,400 | | | | 16,374,227 | |
BX Commercial Mortgage Trust,
Series 2018-IND, Class G, 144A, 1 Month LIBOR + 2.050% (Cap N/A, Floor 2.050%) | | | 4.330 | (c) | | | 11/15/35 | | | | 9,150 | | | | 9,149,998 | |
COMM Mortgage Trust, | | | | | | | | | | | | | | | | |
Series 2012-CR01, Class XA, IO | | | 1.869 | (cc) | | | 05/15/45 | | | | 11,327 | | | | 614,516 | |
Series 2015-LC19, Class XB, IO, 144A | | | 0.267 | (cc) | | | 02/10/48 | | | | 123,049 | | | | 1,891,079 | |
CSAIL Commercial Mortgage Trust, | | | | | | | | | | | | | | | | |
Series 2015-C1, Class XB, IO | | | 0.252 | (cc) | | | 04/15/50 | | | | 66,743 | | | | 1,031,840 | |
Series 2018-CX11, Class A3 | | | 4.095 | | | | 04/15/51 | | | | 9,000 | | | | 9,091,394 | |
CSMC Trust, | | | | | | | | | | | | | | | | |
Series 2017-LSTK, Class D, 144A | | | 3.331 | (cc) | | | 04/05/33 | | | | 6,850 | | | | 6,684,958 | |
Series 2017-LSTK, Class E, 144A | | | 3.331 | (cc) | | | 04/05/33 | | | | 12,575 | | | | 12,202,137 | |
DBGS Mortgage Trust, | | | | | | | | | | | | | | | | |
Series 2018-BIOD, Class E, 144A, 1 Month LIBOR + 1.700% | | | 3.980 | (c) | | | 05/15/35 | | | | 3,432 | | | | 3,416,676 | |
Series 2018-BIOD, Class F, 144A, 1 Month LIBOR + 2.000% | | | 4.280 | (c) | | | 05/15/35 | | | | 13,253 | | | | 13,243,788 | |
DBWF Mortgage Trust,
Series 2016-85T, Class E, 144A | | | 3.808 | (cc) | | | 12/10/36 | | | | 15,500 | | | | 13,786,641 | |
FHLMC Multifamily Structured Pass-Through Certificates, | | | | | | | | | | | | | | | | |
Series K007, Class X1, IO | | | 1.035 | (cc) | | | 04/25/20 | | | | 4,079 | | | | 46,760 | |
Series K008, Class X1, IO | | | 1.518 | (cc) | | | 06/25/20 | | | | 18,315 | | | | 344,760 | |
Series K010, Class X1, IO | | | 0.149 | (cc) | | | 10/25/20 | | | | 17,902 | | | | 51,452 | |
Series K018, Class X1, IO | | | 1.352 | (cc) | | | 01/25/22 | | | | 15,189 | | | | 518,332 | |
Series K020, Class X1, IO | | | 1.412 | (cc) | | | 05/25/22 | | | | 19,859 | | | | 814,529 | |
Series K021, Class X1, IO | | | 1.447 | (cc) | | | 06/25/22 | | | | 4,088 | | | | 176,677 | |
Series K025, Class X1, IO | | | 0.856 | (cc) | | | 10/25/22 | | | | 91,051 | | | | 2,581,175 | |
See Notes to Financial Statements.
| | | | |
| PGIM Absolute Return Bond Fund | | | 31 | |
Schedule of Investments (continued)
as of October 31, 2018
| | | | | | | | | | | | | | | | |
| Description | | Interest
Rate | | | Maturity
Date | | | Principal
Amount (000)# | | | Value | |
COMMERCIAL MORTGAGE-BACKED SECURITIES (Continued) | |
FHLMC Multifamily Structured Pass-Through Certificates, (cont’d.) | |
Series K055, Class X1, IO | | | 1.366 | %(cc) | | | 03/25/26 | | | | 23,096 | | | $ | 1,903,076 | |
Series K066, Class X1, IO | | | 0.753 | (cc) | | | 06/25/27 | | | | 235,826 | | | | 12,613,386 | |
Series K710, Class X1, IO | | | 1.728 | (cc) | | | 05/25/19 | | | | 421 | | | | 1,794 | |
Series K711, Class X1, IO | | | 1.680 | (cc) | | | 07/25/19 | | | | 3,432 | | | | 19,284 | |
Freddie Mac Multifamily Structured Pass Through Certificates,
Series KC02, Class X1, IO | | | 0.374 | (cc) | | | 03/25/24 | | | | 142,397 | | | | 2,705,485 | |
GS Mortgage Securities Corp.,
Series 2013-GC10, Class XB, IO, 144A | | | 0.483 | (cc) | | | 02/10/46 | | | | 103,126 | | | | 2,038,399 | |
GS Mortgage Securities Trust,
Series 2014-GC20, Class XB, IO | | | 0.431 | (cc) | | | 04/10/47 | | | | 28,307 | | | | 649,252 | |
Independence Plaza Trust,
Series 2018-INDP, Class E, 144A | | | 4.996 | | | | 07/10/35 | | | | 5,200 | | | | 5,075,351 | |
JPMBB Commercial Mortgage Securities Trust, | | | | | | | | | | | | | | | | |
Series 2014-C21, Class XB, IO | | | 0.313 | (cc) | | | 08/15/47 | | | | 45,056 | | | | 830,936 | |
Series 2015-C27, Class XB, IO | | | 0.445 | (cc) | | | 02/15/48 | | | | 52,766 | | | | 1,242,001 | |
JPMorgan Chase Commercial Mortgage Securities Corp.,
Series 2018-AON, Class E, 144A | | | 4.613 | (cc) | | | 07/05/31 | | | | 15,950 | | | | 15,899,683 | |
JPMorgan Chase Commercial Mortgage Securities Trust,
Series 2013-LC11, Class XB, IO | | | 0.508 | (cc) | | | 04/15/46 | | | | 34,956 | | | | 765,325 | |
Morgan Stanley Bank of America Merrill Lynch Trust, | | | | | | | | | | | | | | | | |
Series 2012-C5, Class XB, IO, 144A | | | 0.243 | (cc) | | | 08/15/45 | | | | 65,968 | | | | 629,176 | |
Series 2013-C8, Class XB, IO, 144A | | | 0.497 | (cc) | | | 12/15/48 | | | | 68,276 | | | | 1,193,874 | |
UBS-Barclays Commercial Mortgage Trust,
Series 2013-C6, Class XB, IO, 144A | | | 0.381 | (cc) | | | 04/10/46 | | | | 140,883 | | | | 2,294,153 | |
Wells Fargo Commercial Mortgage Trust, | | | | | | | | | | | | | | | | |
Series 2017-C39, Class A4 | | | 3.157 | | | | 09/15/50 | | | | 15,000 | | | | 14,055,654 | |
Series 2017-C40, Class A3 | | | 3.317 | | | | 10/15/50 | | | | 3,380 | | | | 3,200,806 | |
| | | | | | | | | | | | | | | | |
TOTAL COMMERCIAL MORTGAGE-BACKED SECURITIES
(cost $166,132,647) | | | | | | | | | | | | | | | 163,170,903 | |
| | | | | | | | | | | | | | | | |
| | | | |
CONVERTIBLE BOND 0.2% | | | | | | | | | | | | | | | | |
| | | | |
Investment Companies | | | | | | | | | | | | | | | | |
Aabar Investments PJSC (United Arab Emirates),
Sr. Unsec’d. Notes, MTN
(cost $6,444,432) | | | 0.500 | | | | 03/27/20 | | | EUR | 5,700 | | | | 5,945,531 | |
| | | | | | | | | | | | | | | | |
See Notes to Financial Statements.
| | | | | | | | | | | | | | | | |
| Description | | Interest
Rate | | | Maturity
Date | | | Principal
Amount (000)# | | | Value | |
CORPORATE BONDS 27.8% | | | | | | | | | | | | | | | | |
| | | | |
Aerospace & Defense 0.3% | | | | | | | | | | | | | | | | |
Bombardier, Inc. (Canada),
Sr. Unsec’d. Notes, 144A | | | 7.500 | % | | | 12/01/24 | | | | 7,850 | | | $ | 7,977,562 | |
| | | | |
Airlines 0.2% | | | | | | | | | | | | | | | | |
American Airlines, Pass-Through Trust,
Series 2013-1, Class A, Pass-Through Certificates(h) | | | 4.000 | | | | 01/15/27 | | | | 2,692 | | | | 2,677,534 | |
Continental Airlines, Pass-Through Trust, | | | | | | | | | | | | | | | | |
Series 2007-1, Class A, Pass-Through Certificates^ | | | 5.983 | | | | 10/19/23 | | | | 834 | | | | 873,453 | |
Series 2012-2, Class A, Pass-Through Certificates | | | 4.000 | | | | 04/29/26 | | | | 94 | | | | 93,060 | |
Delta Air Lines, Pass-Through Trust, | | | | | | | | | | | | | | | | |
Series 2007-1, Class A, Pass-Through Certificates^ | | | 6.821 | | | | 02/10/24 | | | | 639 | | | | 694,503 | |
Series 2011-1, Class A, Pass-Through Certificates | | | 5.300 | | | | 10/15/20 | | | | 48 | | | | 48,453 | |
United Airlines, Pass-Through Trust,
Series 2013-1, Class A, Pass-Through Certificates | | | 4.300 | | | | 02/15/27 | | | | 1,966 | | | | 1,995,446 | |
| | | | | | | | | | | | | | | | |
| | | | | | | | | | | | | | | 6,382,449 | |
| | | | |
Apparel 0.1% | | | | | | | | | | | | | | | | |
PVH Corp.,
Sr. Unsec’d. Notes, 144A | | | 3.125 | | | | 12/15/27 | | | EUR | 2,175 | | | | 2,404,726 | |
| | | | |
Auto Manufacturers 0.2% | | | | | | | | | | | | | | | | |
BMW US Capital LLC (Germany), | | | | | | | | | | | | | | | | |
Gtd. Notes, 144A, 3 Month LIBOR + 0.410% | | | 2.835 | (c) | | | 04/12/21 | | | | 820 | | | | 819,267 | |
Gtd. Notes, 144A | | | 3.100 | | | | 04/12/21 | | | | 1,095 | | | | 1,083,558 | |
General Motors Co.,
Sr. Unsec’d. Notes | | | 6.250 | | | | 10/02/43 | | | | 2,230 | | | | 2,134,200 | |
| | | | | | | | | | | | | | | | |
| | | | | | | | | | | | | | | 4,037,025 | |
See Notes to Financial Statements.
| | | | |
| PGIM Absolute Return Bond Fund | | | 33 | |
Schedule of Investments (continued)
as of October 31, 2018
| | | | | | | | | | | | | | | | |
| Description | | Interest
Rate | | | Maturity
Date | | | Principal
Amount (000)# | | | Value | |
CORPORATE BONDS (Continued) | | | | | | | | | | | | | | | | |
| | | | |
Auto Parts & Equipment 0.3% | | | | | | | | | | | | | | | | |
Lear Corp., | | | | | | | | | | | | | | | | |
Sr. Unsec’d. Notes(h) | | | 5.250 | % | | | 01/15/25 | | | | 5,375 | | | $ | 5,507,567 | |
Sr. Unsec’d. Notes | | | 5.375 | | | | 03/15/24 | | | | 1,410 | | | | 1,444,398 | |
| | | | | | | | | | | | | | | | |
| | | | | | | | | | | | | | | 6,951,965 | |
| | | | |
Banks 4.8% | | | | | | | | | | | | | | | | |
Banco do Brasil SA (Brazil),
Gtd. Notes | | | 3.875 | | | | 10/10/22 | | | | 3,000 | | | | 2,845,530 | |
Banco Nacional de Costa Rica (Costa Rica),
Sr. Unsec’d. Notes, 144A | | | 5.875 | | | | 04/25/21 | | | | 750 | | | | 718,133 | |
Bank of America Corp., | | | | | | | | | | | | | | | | |
Jr. Sub. Notes, Series AA | | | 6.100 | | | | 12/29/49 | | | | 8,820 | | | | 9,051,525 | |
Jr. Sub. Notes, Series V | | | 5.125 | | | | 12/31/49 | | | | 2,175 | | | | 2,169,563 | |
Sr. Unsec’d. Notes, GMTN | | | 3.593 | | | | 07/21/28 | | | | 1,555 | | | | 1,461,529 | |
Sr. Unsec’d. Notes, MTN | | | 3.824 | | | | 01/20/28 | | | | 1,905 | | | | 1,822,466 | |
Sr. Unsec’d. Notes, MTN | | | 4.271 | | | | 07/23/29 | | | | 1,450 | | | | 1,429,480 | |
Bank of Baroda (India),
Sr. Unsec’d. Notes, 144A | | | 4.875 | | | | 07/23/19 | | | | 5,000 | | | | 5,034,545 | |
Caixa Economica Federal (Brazil),
Sub. Notes | | | 7.250 | | | | 07/23/24 | | | | 5,400 | | | | 5,440,500 | |
Citigroup, Inc., | | | | | | | | | | | | | | | | |
Jr. Sub. Notes, Series Q | | | 5.950 | | | | 12/29/49 | | | | 12,685 | | | | 12,891,131 | |
Sr. Unsec’d. Notes | | | 3.200 | | | | 10/21/26 | | | | 1,145 | | | | 1,051,087 | |
Sr. Unsec’d. Notes | | | 3.887 | | | | 01/10/28 | | | | 980 | | | | 937,165 | |
Sr. Unsec’d. Notes | | | 8.125 | | | | 07/15/39 | | | | 620 | | | | 865,672 | |
Sub. Notes | | | 4.400 | | | | 06/10/25 | | | | 405 | | | | 401,108 | |
Sub. Notes | | | 4.750 | | | | 05/18/46 | | | | 395 | | | | 368,359 | |
Credit Suisse AG (Switzerland),
Sr. Unsec’d. Notes, MTN | | | 3.625 | | | | 09/09/24 | | | | 2,375 | | | | 2,326,323 | |
Credit Suisse Group Funding Guernsey Ltd. (Switzerland),
Gtd. Notes | | | 3.750 | | | | 03/26/25 | | | | 1,200 | | | | 1,148,590 | |
Development Bank of Japan, Inc. (Japan), | | | | | | | | | | | | | | | | |
Gov’t. Gtd. Notes, 144A, MTN | | | 3.125 | | | | 09/06/23 | | | | 5,000 | | | | 4,942,360 | |
Gov’t. Gtd. Notes, GMTN | | | 2.125 | | | | 01/30/19 | | | | 3,000 | | | | 2,995,134 | |
Sr. Unsec’d. Notes, GMTN | | | 2.000 | | | | 10/19/21 | | | | 400 | | | | 384,617 | |
Dexia Credit Local SA (France), | | | | | | | | | | | | | | | | |
Gov’t. Liquid Gtd. Notes | | | 1.875 | | | | 01/29/20 | | | | 500 | | | | 492,937 | |
Gov’t. Liquid Gtd. Notes, 144A | | | 1.875 | | | | 09/15/21 | | | | 2,000 | | | | 1,923,812 | |
Gov’t. Liquid Gtd. Notes, 144A, MTN | | | 3.250 | | | | 09/26/23 | | | | 1,000 | | | | 993,858 | |
Gov’t. Liquid Gtd. Notes, EMTN | | | 2.250 | | | | 01/30/19 | | | | 1,000 | | | | 998,977 | |
See Notes to Financial Statements.
| | | | | | | | | | | | | | | | |
| Description | | Interest
Rate | | | Maturity
Date | | | Principal
Amount (000)# | | | Value | |
CORPORATE BONDS (Continued) | | | | | | | | | | | | | | | | |
| | | | |
Banks (cont’d.) | | | | | | | | | | | | | | | | |
Discover Bank, | | | | | | | | | | | | | | | | |
Sr. Unsec’d. Notes | | | 4.200 | % | | | 08/08/23 | | | | 5,500 | | | $ | 5,486,153 | |
Sub. Notes | | | 7.000 | | | | 04/15/20 | | | | 800 | | | | 835,715 | |
Goldman Sachs Group, Inc. (The), | | | | | | | | | | | | | | | | |
Jr. Sub. Notes, Series M | | | 5.375 | | | | 12/29/49 | | | | 5,225 | | | | 5,264,188 | |
Sr. Unsec’d. Notes | | | 3.814 | | | | 04/23/29 | | | | 1,660 | | | | 1,559,319 | |
Sr. Unsec’d. Notes | | | 3.850 | | | | 01/26/27 | | | | 3,940 | | | | 3,775,307 | |
Sr. Unsec’d. Notes | | | 4.223 | | | | 05/01/29 | | | | 7,330 | | | | 7,106,976 | |
JPMorgan Chase & Co., | | | | | | | | | | | | | | | | |
Jr. Sub. Notes, Ser. R | | | 6.000 | | | | 12/29/49 | | | | 7,707 | | | | 7,745,535 | |
Jr. Sub. Notes, Ser. X | | | 6.100 | | | | 12/29/49 | | | | 3,400 | | | | 3,456,270 | |
Jr. Sub. Notes, Series I, 3 Month LIBOR + 3.470% | | | 5.990 | (c) | | | 12/31/49 | | | | 93 | | | | 93,499 | |
Jr. Sub. Notes, Series Q(a) | | | 5.150 | | | | 12/29/49 | | | | 3,725 | | | | 3,656,460 | |
Morgan Stanley, | | | | | | | | | | | | | | | | |
Jr. Sub. Notes, Series H | | | 5.450 | | | | 12/31/49 | | | | 13,110 | | | | 13,226,417 | |
Sr. Unsec’d. Notes | | | 4.375 | | | | 01/22/47 | | | | 1,260 | | | | 1,174,770 | |
Sr. Unsec’d. Notes | | | 4.457 | | | | 04/22/39 | | | | 395 | | | | 377,714 | |
Sr. Unsec’d. Notes, GMTN(a) | | | 3.772 | | | | 01/24/29 | | | | 1,750 | | | | 1,658,218 | |
Sr. Unsec’d. Notes, MTN | | | 3.591 | | | | 07/22/28 | | | | 1,125 | | | | 1,053,577 | |
Sr. Unsec’d. Notes, MTN | | | 6.375 | | | | 07/24/42 | | | | 225 | | | | 271,949 | |
Sub. Notes, MTN(a) | | | 4.100 | | | | 05/22/23 | | | | 1,710 | | | | 1,706,980 | |
People’s United Bank NA,
Sub. Notes | | | 4.000 | | | | 07/15/24 | | | | 325 | | | | 319,729 | |
State Street Corp.,
Jr. Sub. Notes | | | 5.250 | | | | 12/29/49 | | | | 2,555 | | | | 2,583,744 | |
Turkiye Garanti Bankasi AS (Turkey),
Sr. Unsec’d. Notes, 144A(a) | | | 5.875 | | | | 03/16/23 | | | | 2,435 | | | | 2,252,862 | |
| | | | | | | | | | | | | | | | |
| | | | | | | | | | | | | | | 126,299,783 | |
| | | | |
Beverages 0.1% | | | | | | | | | | | | | | | | |
Anheuser-Busch InBev Worldwide, Inc. (Belgium),
Gtd. Notes | | | 8.200 | | | | 01/15/39 | | | | 250 | | | | 335,886 | |
Central American Bottling Corp. (Guatemala),
Gtd. Notes, 144A | | | 5.750 | | | | 01/31/27 | | | | 1,500 | | | | 1,478,265 | |
Sunshine Mid BV (Netherlands),
Gtd. Notes(a) | | | 6.500 | | | | 05/15/26 | | | EUR | 1,350 | | | | 1,471,806 | |
| | | | | | | | | | | | | | | | |
| | | | | | | | | | | | | | | 3,285,957 | |
| | | | |
Biotechnology 0.1% | | | | | | | | | | | | | | | | |
Celgene Corp.,
Sr. Unsec’d. Notes | | | 4.350 | | | | 11/15/47 | | | | 2,100 | | | | 1,751,463 | |
See Notes to Financial Statements.
| | | | |
| PGIM Absolute Return Bond Fund | | | 35 | |
Schedule of Investments (continued)
as of October 31, 2018
| | | | | | | | | | | | | | | | |
| Description | | Interest
Rate | | | Maturity
Date | | | Principal
Amount (000)# | | | Value | |
CORPORATE BONDS (Continued) | | | | | | | | | | | | | | | | |
| | | | |
Building Materials 0.8% | | | | | | | | | | | | | | | | |
Griffon Corp.,
Gtd. Notes | | | 5.250 | % | | | 03/01/22 | | | | 8,950 | | | $ | 8,390,625 | |
Johnson Controls International PLC,
Sr. Unsec’d. Notes | | | 4.250 | | | | 03/01/21 | | | | 3,090 | | | | 3,132,514 | |
Owens Corning,
Sr. Unsec’d. Notes | | | 4.200 | | | | 12/15/22 | | | | 125 | | | | 124,630 | |
Standard Industries, Inc.,
Sr. Unsec’d. Notes, 144A | | | 5.375 | | | | 11/15/24 | | | | 5,000 | | | | 4,800,000 | |
U.S. Concrete, Inc.,
Gtd. Notes | | | 6.375 | | | | 06/01/24 | | | | 4,725 | | | | 4,400,156 | |
| | | | | | | | | | | | | | | | |
| | | | | | | | | | | | | | | 20,847,925 | |
| | | | |
Chemicals 1.4% | | | | | | | | | | | | | | | | |
Ashland LLC,
Gtd. Notes | | | 6.875 | | | | 05/15/43 | | | | 4,100 | | | | 4,151,250 | |
CF Industries, Inc., | | | | | | | | | | | | | | | | |
Gtd. Notes(a) | | | 4.950 | | | | 06/01/43 | | | | 1,765 | | | | 1,491,425 | |
Gtd. Notes | | | 5.375 | | | | 03/15/44 | | | | 1,300 | | | | 1,144,000 | |
Gtd. Notes | | | 7.125 | | | | 05/01/20 | | | | 59 | | | | 61,360 | |
Chemours Co. (The),
Gtd. Notes | | | 4.000 | | | | 05/15/26 | | | EUR | 14,000 | | | | 15,176,115 | |
CNAC HK Finbridge Co. Ltd. (China),
Gtd. Notes | | | 3.500 | | | | 07/19/22 | | | | 500 | | | | 482,473 | |
LYB International Finance BV,
Gtd. Notes | | | 5.250 | | | | 07/15/43 | | | | 415 | | | | 399,753 | |
LyondellBasell Industries NV,
Sr. Unsec’d. Notes | | | 4.625 | | | | 02/26/55 | | | | 164 | | | | 137,877 | |
Mexichem SAB de CV (Mexico),
Gtd. Notes, 144A | | | 5.500 | | | | 01/15/48 | | | | 480 | | | | 422,165 | |
NOVA Chemicals Corp. (Canada),
Sr. Unsec’d. Notes, 144A | | | 5.250 | | | | 06/01/27 | | | | 4,625 | | | | 4,174,063 | |
Nutrien Ltd. (Canada), | | | | | | | | | | | | | | | | |
Sr. Unsec’d. Notes | | | 4.900 | | | | 06/01/43 | | | | 1,350 | | | | 1,280,968 | |
Sr. Unsec’d. Notes | | | 6.125 | | | | 01/15/41 | | | | 170 | | | | 181,931 | |
PSPC Escrow Corp.,
Sr. Unsec’d. Notes | | | 6.000 | | | | 02/01/23 | | | EUR | 1,000 | | | | 1,174,155 | |
Sasol Financing International Ltd. (South Africa),
Gtd. Notes | | | 4.500 | | | | 11/14/22 | | | | 5,885 | | | | 5,716,042 | |
See Notes to Financial Statements.
| | | | | | | | | | | | | | | | |
| Description | | Interest
Rate | | | Maturity
Date | | | Principal
Amount (000)# | | | Value | |
CORPORATE BONDS (Continued) | | | | | | | | | | | | | | | | |
| | | | |
Chemicals (cont’d.) | | | | | | | | | | | | | | | | |
SASOL Financing USA LLC (South Africa),
Gtd. Notes | | | 5.875 | % | | | 03/27/24 | | | | 500 | | | $ | 503,691 | |
Sherwin-Williams Co. (The),
Sr. Unsec’d. Notes | | | 3.450 | | | | 08/01/25 | | | | 635 | | | | 604,027 | |
| | | | | | | | | | | | | | | | |
| | | | | | | | | | | | | | | 37,101,295 | |
| | | | |
Commercial Services 1.0% | | | | | | | | | | | | | | | | |
ERAC USA Finance LLC, | | | | | | | | | | | | | | | | |
Gtd. Notes, 144A | | | 6.700 | | | | 06/01/34 | | | | 110 | | | | 128,902 | |
Gtd. Notes, 144A | | | 7.000 | | | | 10/15/37 | | | | 1,725 | | | | 2,107,276 | |
Laureate Education, Inc.,
Gtd. Notes, 144A(a) | | | 8.250 | | | | 05/01/25 | | | | 6,350 | | | | 6,778,625 | |
Nexi Capital SpA (Italy),
Sec’d. Notes, 144A | | | 4.125 | | | | 11/01/23 | | | EUR | 2,950 | | | | 3,344,955 | |
Nielsen Co. Luxembourg SARL (The),
Gtd. Notes, 144A | | | 5.500 | | | | 10/01/21 | | | | 1,675 | | | | 1,683,375 | |
SNCF Reseau EPIC (France),
Sr. Unsec’d. Notes, EMTN | | | 2.000 | | | | 10/13/20 | | | | 2,200 | | | | 2,150,368 | |
United Rentals North America, Inc., | | | | | | | | | | | | | | | | |
Gtd. Notes(a) | | | 4.875 | | | | 01/15/28 | | | | 4,554 | | | | 4,102,926 | |
Gtd. Notes | | | 5.500 | | | | 05/15/27 | | | | 1,600 | | | | 1,518,000 | |
Western Union Co. (The),
Sr. Unsec’d. Notes, 3 Month LIBOR + 0.800% | | | 3.110 | (c) | | | 05/22/19 | | | | 4,300 | | | | 4,309,447 | |
| | | | | | | | | | | | | | | | |
| | | | | | | | | | | | | | | 26,123,874 | |
| | | | |
Computers 0.1% | | | | | | | | | | | | | | | | |
Everi Payments, Inc.,
Gtd. Notes, 144A | | | 7.500 | | | | 12/15/25 | | | | 2,325 | | | | 2,313,375 | |
NCR Corp.,
Gtd. Notes | | | 6.375 | | | | 12/15/23 | | | | 790 | | | | 788,025 | |
| | | | | | | | | | | | | | | | |
| | | | | | | | | | | | | | | 3,101,400 | |
| | | | |
Distribution/Wholesale 0.1% | | | | | | | | | | | | | | | | |
Global Partners LP/GLP Finance Corp.,
Gtd. Notes | | | 6.250 | | | | 07/15/22 | | | | 2,425 | | | | 2,382,562 | |
| | | | |
Diversified Financial Services 0.2% | | | | | | | | | | | | | | | | |
CPPIB Capital, Inc. (Canada),
Gtd. Notes, 144A, MTN | | | 3.125 | | | | 09/25/23 | | | | 1,000 | | | | 993,692 | |
See Notes to Financial Statements.
| | | | |
| PGIM Absolute Return Bond Fund | | | 37 | |
Schedule of Investments (continued)
as of October 31, 2018
| | | | | | | | | | | | | | | | |
| Description | | Interest
Rate | | | Maturity
Date | | | Principal
Amount (000)# | | | Value | |
CORPORATE BONDS (Continued) | | | | | | | | | | | | | | | | |
| | | | |
Diversified Financial Services (cont’d.) | | | | | | | | | | | | | | | | |
Grain Spectrum Funding II LLC,
Sec’d. Notes, 144A | | | 3.290 | % | | | 10/10/34 | | | | 728 | | | $ | 724,634 | |
International Lease Finance Corp.,
Sr. Unsec’d. Notes | | | 6.250 | | | | 05/15/19 | | | | 25 | | | | 25,399 | |
Jefferies Group LLC,
Sr. Unsec’d. Notes | | | 6.500 | | | | 01/20/43 | | | | 175 | | | | 175,079 | |
Nationstar Mortgage Holdings, Inc.,
Gtd. Notes, 144A | | | 8.125 | | | | 07/15/23 | | | | 2,450 | | | | 2,492,875 | |
Navient Corp., | | | | | | | | | | | | | | | | |
Sr. Unsec’d. Notes, MTN | | | 4.875 | | | | 06/17/19 | | | | 970 | | | | 973,637 | |
Sr. Unsec’d. Notes, MTN | | | 5.500 | | | | 01/15/19 | | | | 185 | | | | 185,694 | |
| | | | | | | | | | | | | | | | |
| | | | | | | | | | | | | | | 5,571,010 | |
| | | | |
Electric 1.2% | | | | | | | | | | | | | | | | |
AES Panama SRL (Panama),
Sr. Unsec’d. Notes, 144A | | | 6.000 | | | | 06/25/22 | | | | 3,015 | | | | 3,094,928 | |
Calpine Corp., | | | | | | | | | | | | | | | | |
Sr. Unsec’d. Notes(a) | | | 5.375 | | | | 01/15/23 | | | | 1,080 | | | | 1,023,300 | |
Sr. Unsec’d. Notes(a) | | | 5.750 | | | | 01/15/25 | | | | 9,775 | | | | 8,734,451 | |
Comision Federal de Electricidad (Mexico),
Sr. Unsec’d. Notes, 144A | | | 4.875 | | | | 01/15/24 | | | | 1,350 | | | | 1,330,438 | |
Duke Energy Carolinas LLC,
First Mortgage | | | 4.000 | | | | 09/30/42 | | | | 50 | | | | 46,679 | |
Eskom Holdings SOC Ltd. (South Africa),
Gov’t. Gtd. Notes, 144A, MTN | | | 6.350 | | | | 08/10/28 | | | | 1,225 | | | | 1,180,349 | |
FirstEnergy Transmission LLC,
Sr. Unsec’d. Notes, 144A | | | 5.450 | | | | 07/15/44 | | | | 800 | | | | 849,464 | |
Hydro-Quebec (Canada), | | | | | | | | | | | | | | | | |
Local Gov’t. Gtd. Notes | | | 8.400 | | | | 01/15/22 | | | | 1,000 | | | | 1,139,607 | |
Local Gov’t. Gtd. Notes | | | 8.500 | | | | 12/01/29 | | | | 1,055 | | | | 1,493,845 | |
NextEra Energy Capital Holdings, Inc.,
Gtd. Notes | | | 3.625 | | | | 06/15/23 | | | | 1,575 | | | | 1,553,411 | |
NRG Energy, Inc.,
Gtd. Notes(a) | | | 6.250 | | | | 05/01/24 | | | | 1,248 | | | | 1,274,058 | |
South Carolina Electric & Gas Co.,
First Mtge. | | | 4.350 | | | | 02/01/42 | | | | 130 | | | | 122,460 | |
Vistra Energy Corp.,
Gtd. Notes | | | 7.375 | | | | 11/01/22 | | | | 6,925 | | | | 7,184,687 | |
See Notes to Financial Statements.
| | | | | | | | | | | | | | | | |
| Description | | Interest
Rate | | | Maturity
Date | | | Principal
Amount (000)# | | | Value | |
CORPORATE BONDS (Continued) | | | | | | | | | | | | | | | | |
| | | | |
Electric (cont’d.) | | | | | | | | | | | | | | | | |
Vistra Operations Co. LLC,
Gtd. Notes, 144A | | | 5.500 | % | | | 09/01/26 | | | | 2,925 | | | $ | 2,881,125 | |
Westar Energy, Inc.,
First Mtge. | | | 4.100 | | | | 04/01/43 | | | | 325 | | | | 308,408 | |
| | | | | | | | | | | | | | | | |
| | | | | | | | | | | | | | | 32,217,210 | |
| | | | |
Electrical Components & Equipment 0.1% | | | | | | | | | | | | | | | | |
Energizer Gamma Acquisition BV,
Sr. Sec’d. Notes, 144A | | | 4.625 | | | | 07/15/26 | | | EUR | 2,600 | | | | 3,015,551 | |
| | | | |
Electronics 0.3% | | | | | | | | | | | | | | | | |
Jabil, Inc., | | | | | | | | | | | | | | | | |
Sr. Unsec’d. Notes | | | 4.700 | | | | 09/15/22 | | | | 80 | | | | 80,152 | |
Sr. Unsec’d. Notes | | | 5.625 | | | | 12/15/20 | | | | 5,400 | | | | 5,567,400 | |
Sensata Technologies BV,
Gtd. Notes, 144A | | | 5.000 | | | | 10/01/25 | | | | 2,750 | | | | 2,653,750 | |
| | | | | | | | | | | | | | | | |
| | | | | | | | | | | | | | | 8,301,302 | |
| | | | |
Energy-Alternate Sources 0.1% | | | | | | | | | | | | | | | | |
Neerg Energy Ltd. (Mauritius),
Sr. Sec’d. Notes | | | 6.000 | | | | 02/13/22 | | | | 850 | | | | 798,126 | |
Rio Energy SA/UGEN SA/UENSA SA (Argentina),
Sr. Sec’d. Notes, 144A | | | 6.875 | | | | 02/01/25 | | | | 3,220 | | | | 2,535,750 | |
| | | | | | | | | | | | | | | | |
| | | | | | | | | | | | | | | 3,333,876 | |
| | | | |
Entertainment 1.0% | | | | | | | | | | | | | | | | |
AMC Entertainment Holdings, Inc., | | | | | | | | | | | | | | | | |
Gtd. Notes(a) | | | 5.750 | | | | 06/15/25 | | | | 1,908 | | | | 1,764,901 | |
Gtd. Notes | | | 5.875 | | | | 11/15/26 | | | | 400 | | | | 367,000 | |
Gtd. Notes | | | 6.375 | | | | 11/15/24 | | | GBP | 1,875 | | | | 2,396,530 | |
Caesars Resort Collection LLC/CRC Finco, Inc.,
Gtd. Notes, 144A(a) | | | 5.250 | | | | 10/15/25 | | | | 4,025 | | | | 3,745,766 | |
Cinemark USA, Inc.,
Gtd. Notes | | | 4.875 | | | | 06/01/23 | | | | 3,825 | | | | 3,734,156 | |
CPUK Finance Ltd. (United Kingdom), | | | | | | | | | | | | | | | | |
Sec’d. Notes, 144A | | | 4.250 | | | | 02/28/47 | | | GBP | 550 | | | | 705,622 | |
Sec’d. Notes, 144A | | | 4.875 | | | | 02/28/47 | | | GBP | 200 | | | | 254,862 | |
Eldorado Resorts, Inc.,
Gtd. Notes | | | 7.000 | | | | 08/01/23 | | | | 3,500 | | | | 3,675,000 | |
See Notes to Financial Statements.
| | | | |
| PGIM Absolute Return Bond Fund | | | 39 | |
Schedule of Investments (continued)
as of October 31, 2018
| | | | | | | | | | | | | | | | |
| Description | | Interest
Rate | | | Maturity
Date | | | Principal
Amount (000)# | | | Value | |
CORPORATE BONDS (Continued) | | | | | | | | | | | | | | | | |
| | | | |
Entertainment (cont’d.) | | | | | | | | | | | | | | | | |
National CineMedia LLC, | | | | | | | | | | | | | | | | |
Sr. Sec’d. Notes(a) | | | 6.000 | % | | | 04/15/22 | | | | 2,000 | | | $ | 2,020,000 | |
Sr. Unsec’d. Notes | | | 5.750 | | | | 08/15/26 | | | | 2,925 | | | | 2,764,125 | |
Scientific Games International, Inc.,
Gtd. Notes | | | 10.000 | | | | 12/01/22 | | | | 4,500 | | | | 4,702,500 | |
| | | | | | | | | | | | | | | | |
| | | | | | | | | | | | | | | 26,130,462 | |
| | | | |
Foods 0.4% | | | | | | | | | | | | | | | | |
B&G Foods, Inc.,
Gtd. Notes | | | 4.625 | | | | 06/01/21 | | | | 1,600 | | | | 1,590,000 | |
Ingles Markets, Inc.,
Sr. Unsec’d. Notes(a) | | | 5.750 | | | | 06/15/23 | | | | 1,325 | | | | 1,318,375 | |
Matterhorn Merger Sub LLC/Matterhorn Finance Sub, Inc.,
Sr. Unsec’d. Notes, 144A | | | 8.500 | | | | 06/01/26 | | | | 3,000 | | | | 2,760,000 | |
Picard Groupe SAS (France),
Sr. Sec’d., 144A, 3 Month EURIBOR + 3.000% | | | 3.000 | (c) | | | 11/30/23 | | | EUR | 2,075 | | | | 2,320,858 | |
Pilgrim’s Pride Corp.,
Gtd. Notes, 144A | | | 5.750 | | | | 03/15/25 | | | | 2,425 | | | | 2,261,313 | |
| | | | | | | | | | | | | | | | |
| | | | | | | | | | | | | | | 10,250,546 | |
| | | | |
Forest Products & Paper 0.0% | | | | | | | | | | | | | | | | |
Georgia-Pacific LLC, | | | | | | | | | | | | | | | | |
Gtd. Notes, 144A | | | 5.400 | | | | 11/01/20 | | | | 35 | | | | 36,270 | |
Sr. Unsec’d. Notes | | | 7.375 | | | | 12/01/25 | | | | 400 | | | | 478,344 | |
| | | | | | | | | | | | | | | | |
| | | | | | | | | | | | | | | 514,614 | |
| | | | |
Gas 0.2% | | | | | | | | | | | | | | | | |
AmeriGas Partners LP/AmeriGas Finance Corp.,
Sr. Unsec’d. Notes | | | 5.500 | | | | 05/20/25 | | | | 2,900 | | | | 2,711,500 | |
CenterPoint Energy Resources Corp.,
Sr. Unsec’d. Notes | | | 5.850 | | | | 01/15/41 | | | | 700 | | | | 784,532 | |
Dominion Energy Gas Holdings LLC,
Sr. Unsec’d. Notes | | | 4.800 | | | | 11/01/43 | | | | 125 | | | | 122,609 | |
Southern Co. Gas Capital Corp.,
Gtd. Notes | | | 4.400 | | | | 06/01/43 | | | | 1,375 | | | | 1,276,845 | |
| | | | | | | | | | | | | | | | |
| | | | | | | | | | | | | | | 4,895,486 | |
See Notes to Financial Statements.
| | | | | | | | | | | | | | | | |
| Description | | Interest
Rate | | | Maturity
Date | | | Principal
Amount (000)# | | | Value | |
CORPORATE BONDS (Continued) | | | | | | | | | | | | | | | | |
| | | | |
Healthcare-Services 1.3% | | | | | | | | | | | | | | | | |
Aetna, Inc., | | | | | | | | | | | | | | | | |
Sr. Unsec’d. Notes | | | 2.750 | % | | | 11/15/22 | | | | 450 | | | $ | 431,618 | |
Sr. Unsec’d. Notes | | | 4.500 | | | | 05/15/42 | | | | 530 | | | | 492,016 | |
Anthem, Inc., | | | | | | | | | | | | | | | | |
Sr. Unsec’d. Notes | | | 4.101 | | | | 03/01/28 | | | | 700 | | | | 676,725 | |
Sr. Unsec’d. Notes | | | 4.650 | | | | 01/15/43 | | | | 120 | | | | 113,333 | |
Sr. Unsec’d. Notes | | | 5.100 | | | | 01/15/44 | | | | 515 | | | | 516,761 | |
Catalent Pharma Solutions, Inc.,
Gtd. Notes, 144A | | | 4.750 | | | | 12/15/24 | | | EUR | 980 | | | | 1,159,907 | |
CHS/Community Health Systems, Inc.,
Sr. Sec’d. Notes(a) | | | 5.125 | | | | 08/01/21 | | | | 650 | | | | 615,875 | |
Encompass Health Corp., | | | | | | | | | | | | | | | | |
Gtd. Notes | | | 5.125 | | | | 03/15/23 | | | | 1,200 | | | | 1,200,000 | |
Gtd. Notes | | | 5.750 | | | | 11/01/24 | | | | 2,900 | | | | 2,892,750 | |
Halfmoon Parent, Inc.,
Sr. Sec’d. Notes, 144A | | | 4.375 | | | | 10/15/28 | | | | 3,990 | | | | 3,902,377 | |
HCA, Inc., | | | | | | | | | | | | | | | | |
Gtd. Notes(a) | | | 5.375 | | | | 02/01/25 | | | | 4,500 | | | | 4,528,125 | |
Gtd. Notes | | | 5.875 | | | | 05/01/23 | | | | 1,825 | | | | 1,895,719 | |
Laboratory Corp. of America Holdings, | | | | | | | | | | | | | | | | |
Sr. Unsec’d. Notes | | | 3.200 | | | | 02/01/22 | | | | 25 | | | | 24,625 | |
Sr. Unsec’d. Notes | | | 4.625 | | | | 11/15/20 | | | | 4,500 | | | | 4,588,601 | |
Memorial Sloan-Kettering Cancer Center,
Sr. Unsec’d. Notes | | | 4.125 | | | | 07/01/52 | | | | 75 | | | | 70,674 | |
Select Medical Corp.,
Gtd. Notes | | | 6.375 | | | | 06/01/21 | | | | 3,746 | | | | 3,778,777 | |
Tenet Healthcare Corp., | | | | | | | | | | | | | | | | |
Sr. Unsec’d. Notes | | | 6.750 | | | | 06/15/23 | | | | 200 | | | | 198,750 | |
Sr. Unsec’d. Notes(a) | | | 7.000 | | | | 08/01/25 | | | | 4,300 | | | | 4,217,741 | |
Sr. Unsec’d. Notes | | | 8.125 | | | | 04/01/22 | | | | 1,475 | | | | 1,535,844 | |
| | | | | | | | | | | | | | | | |
| | | | | | | | | | | | | | | 32,840,218 | |
| | | | |
Home Builders 2.0% | | | | | | | | | | | | | | | | |
Beazer Homes USA, Inc.,
Gtd. Notes | | | 8.750 | | | | 03/15/22 | | | | 7,550 | | | | 7,606,625 | |
Brookfield Residential Properties, Inc./Brookfield Residential US Corp. (Canada),
Gtd. Notes, 144A | | | 6.125 | | | | 07/01/22 | | | | 5,000 | | | | 4,875,000 | |
KB Home,
Gtd. Notes | | | 7.500 | | | | 09/15/22 | | | | 3,425 | | | | 3,613,375 | |
See Notes to Financial Statements.
| | | | |
| PGIM Absolute Return Bond Fund | | | 41 | |
Schedule of Investments (continued)
as of October 31, 2018
| | | | | | | | | | | | | | | | |
| Description | | Interest
Rate | | | Maturity
Date | | | Principal
Amount (000)# | | | Value | |
CORPORATE BONDS (Continued) | | | | | | | | | | | | | | | | |
| | | | |
Home Builders (cont’d.) | | | | | | | | | | | | | | | | |
M/I Homes, Inc.,
Gtd. Notes | | | 6.750 | % | | | 01/15/21 | | | | 5,850 | | | $ | 5,864,625 | |
Mattamy Group Corp. (Canada), | | | | | | | | | | | | | | | | |
Sr. Unsec’d. Notes, 144A(a) | | | 6.500 | | | | 10/01/25 | | | | 2,500 | | | | 2,350,000 | |
Sr. Unsec’d. Notes, 144A | | | 6.875 | | | | 12/15/23 | | | | 4,000 | | | | 3,895,000 | |
Meritage Homes Corp., | | | | | | | | | | | | | | | | |
Gtd. Notes | | | 5.125 | | | | 06/06/27 | | | | 3,692 | | | | 3,248,960 | |
Gtd. Notes | | | 6.000 | | | | 06/01/25 | | | | 1,275 | | | | 1,239,938 | |
New Home Co., Inc. (The),
Gtd. Notes | | | 7.250 | | | | 04/01/22 | | | | 2,500 | | | | 2,475,000 | |
PulteGroup, Inc.,
Gtd. Notes | | | 5.500 | | | | 03/01/26 | | | | 4,000 | | | | 3,920,000 | |
Taylor Morrison Communities, Inc./Taylor Morrison Holdings II, Inc.,
Gtd. Notes, 144A | | | 5.250 | | | | 04/15/21 | | | | 6,700 | | | | 6,674,875 | |
William Lyon Homes, Inc.,
Gtd. Notes | | | 5.875 | | | | 01/31/25 | | | | 7,625 | | | | 6,719,531 | |
| | | | | | | | | | | | | | | | |
| | | | | | | | | | | | | | | 52,482,929 | |
| | | | |
Home Furnishings 0.1% | | | | | | | | | | | | | | | | |
Tempur Sealy International, Inc.,
Gtd. Notes | | | 5.500 | | | | 06/15/26 | | | | 2,700 | | | | 2,470,500 | |
| | | | |
Household Products/Wares 0.1% | | | | | | | | | | | | | | | | |
Diamond BC BV,
Sr. Unsec’d. Notes(a) | | | 5.625 | | | | 08/15/25 | | | EUR | 2,125 | | | | 2,263,669 | |
| | | | |
Housewares 0.1% | | | | | | | | | | | | | | | | |
Newell Brands, Inc.,
Sr. Unsec’d. Notes | | | 5.500 | | | | 04/01/46 | | | | 2,000 | | | | 1,724,142 | |
| | | | |
Insurance 0.7% | | | | | | | | | | | | | | | | |
Hartford Financial Services Group, Inc. (The), | | | | | | | | | | | | | | | | |
Sr. Unsec’d. Notes | | | 5.950 | | | | 10/15/36 | | | | 215 | | | | 240,011 | |
Sr. Unsec’d. Notes | | | 6.100 | | | | 10/01/41 | | | | 280 | | | | 320,747 | |
Liberty Mutual Group, Inc., | | | | | | | | | | | | | | | | |
Gtd. Notes, 144A | | | 4.250 | | | | 06/15/23 | | | | 1,975 | | | | 1,981,355 | |
Gtd. Notes, 144A | | | 4.850 | | | | 08/01/44 | | | | 1,000 | | | | 964,296 | |
Gtd. Notes, 144A | | | 4.950 | | | | 05/01/22 | | | | 75 | | | | 77,212 | |
See Notes to Financial Statements.
| | | | | | | | | | | | | | | | |
| Description | | Interest
Rate | | | Maturity
Date | | | Principal
Amount (000)# | | | Value | |
CORPORATE BONDS (Continued) | | | | | | | | | | | | | | | | |
| | | | |
Insurance (cont’d.) | | | | | | | | | | | | | | | | |
Liberty Mutual Group, Inc., (cont’d.)
Gtd. Notes, 144A | | | 6.500 | % | | | 05/01/42 | | | | 1,530 | | | $ | 1,782,588 | |
Lincoln National Corp.,
Sr. Unsec’d. Notes | | | 7.000 | | | | 06/15/40 | | | | 695 | | | | 854,476 | |
Markel Corp., | | | | | | | | | | | | | | | | |
Sr. Unsec’d. Notes | | | 4.900 | | | | 07/01/22 | | | | 2,020 | | | | 2,075,438 | |
Sr. Unsec’d. Notes | | | 5.000 | | | | 03/30/43 | | | | 3,125 | | | | 3,020,852 | |
Nuveen Finance LLC,
Sr. Unsec’d. Notes, 144A | | | 2.950 | | | | 11/01/19 | | | | 1,720 | | | | 1,716,642 | |
Principal Financial Group, Inc.,
Gtd. Notes | | | 4.350 | | | | 05/15/43 | | | | 975 | | | | 895,584 | |
Swiss Re Treasury US Corp. (Switzerland),
Gtd. Notes, 144A | | | 4.250 | | | | 12/06/42 | | | | 795 | | | | 750,562 | |
Teachers Insurance & Annuity Association of America, | | | | | | | | | | | | | | | | |
Sub. Notes, 144A | | | 4.270 | | | | 05/15/47 | | | | 640 | | | | 599,385 | |
Sub. Notes, 144A | | | 4.900 | | | | 09/15/44 | | | | 1,950 | | | | 2,013,066 | |
Sub. Notes, 144A | | | 6.850 | | | | 12/16/39 | | | | 54 | | | | 69,249 | |
W.R. Berkley Corp.,
Sr. Unsec’d. Notes | | | 4.625 | | | | 03/15/22 | | | | 1,435 | | | | 1,468,119 | |
| | | | | | | | | | | | | | | | |
| | | | | | | | | | | | | | | 18,829,582 | |
| | | | |
Internet 0.0% | | | | | | | | | | | | | | | | |
Netflix, Inc.,
Sr. Unsec’d. Notes | | | 3.625 | | | | 05/15/27 | | | EUR | 850 | | | | 954,323 | |
| | | | |
Iron/Steel 0.0% | | | | | | | | | | | | | | | | |
Vale Overseas Ltd. (Brazil),
Gtd. Notes | | | 6.250 | | | | 08/10/26 | | | | 404 | | | | 431,783 | |
| | | | |
Leisure Time 0.1% | | | | | | | | | | | | | | | | |
Silversea Cruise Finance Ltd.,
Sr. Sec’d. Notes, 144A | | | 7.250 | | | | 02/01/25 | | | | 2,225 | | | | 2,397,460 | |
| | | | |
Lodging 0.5% | | | | | | | | | | | | | | | | |
Jack Ohio Finance LLC/Jack Ohio Finance 1 Corp.,
Sr. Sec’d. Notes, 144A(a) | | | 6.750 | | | | 11/15/21 | | | | 6,500 | | | | 6,670,625 | |
Marriott International, Inc.,
Sr. Unsec’d. Notes | | | 3.250 | | | | 09/15/22 | | | | 75 | | | | 73,304 | |
See Notes to Financial Statements.
| | | | |
| PGIM Absolute Return Bond Fund | | | 43 | |
Schedule of Investments (continued)
as of October 31, 2018
| | | | | | | | | | | | | | | | |
| Description | | Interest
Rate | | | Maturity
Date | | | Principal
Amount (000)# | | | Value | |
CORPORATE BONDS (Continued) | | | | | | | | | | | | | | | | |
| | | | |
Lodging (cont’d.) | | | | | | | | | | | | | | | | |
Marriott International, Inc., (cont’d.) | | | | | | | | | | | | | | | | |
Sr. Unsec’d. Notes | | | 7.150 | % | | | 12/01/19 | | | | 550 | | | $ | 570,449 | |
MGM Resorts International,
Gtd. Notes | | | 6.000 | | | | 03/15/23 | | | | 3,600 | | | | 3,654,000 | |
Sands China Ltd. (Macau),
Sr. Unsec’d. Notes, 144A | | | 5.125 | | | | 08/08/25 | | | | 1,000 | | | | 980,534 | |
Studio City Co., Ltd. (Hong Kong), | | | | | | | | | | | | | | | | |
Sr. Sec’d. Notes | | | 7.250 | | | | 11/30/21 | | | | 500 | | | | 512,500 | |
Sr. Sec’d. Notes, 144A | | | 7.250 | | | | 11/30/21 | | | | 1,200 | | | | 1,230,000 | |
| | | | | | | | | | | | | | | | |
| | | | | | | | | | | | | | | 13,691,412 | |
| | | | |
Machinery-Diversified 0.0% | | | | | | | | | | | | | | | | |
Xylem, Inc.,
Sr. Unsec’d. Notes | | | 4.875 | | | | 10/01/21 | | | | 50 | | | | 51,513 | |
| | | | |
Media 1.7% | | | | | | | | | | | | | | | | |
CCO Holdings LLC/CCO Holdings Capital Corp., | | | | | | | | | | | | | | | | |
Sr. Unsec’d. Notes, 144A | | | 5.125 | | | | 05/01/23 | | | | 2,625 | | | | 2,611,875 | |
Sr. Unsec’d. Notes, 144A | | | 5.375 | | | | 05/01/25 | | | | 1,115 | | | | 1,091,306 | |
Sr. Unsec’d. Notes, 144A | | | 5.875 | | | | 05/01/27 | | | | 5,075 | | | | 4,986,187 | |
Cequel Communications Holdings I LLC/Cequel Capital Corp., | | | | | | | | | | | | | | | | |
Sr. Unsec’d. Notes, 144A | | | 5.125 | | | | 12/15/21 | | | | 5,500 | | | | 5,485,040 | |
Sr. Unsec’d. Notes, 144A | | | 5.125 | | | | 12/15/21 | | | | 706 | | | | 704,080 | |
Sr. Unsec’d. Notes, 144A | | | 7.500 | | | | 04/01/28 | | | | 3,625 | | | | 3,757,204 | |
Charter Communications Operating LLC/Charter Communications Operating Capital, | | | | | | | | | | | | | | | | |
Sr. Sec’d. Notes | | | 6.384 | | | | 10/23/35 | | | | 1,525 | | | | 1,574,903 | |
Sr. Sec’d. Notes | | | 6.834 | | | | 10/23/55 | | | | 485 | | | | 505,342 | |
Clear Channel Worldwide Holdings, Inc., | | | | | | | | | | | | | | | | |
Gtd. Notes | | | 6.500 | | | | 11/15/22 | | | | 1,145 | | | | 1,149,294 | |
Gtd. Notes | | | 6.500 | | | | 11/15/22 | | | | 365 | | | | 370,548 | |
Gtd. Notes(a) | | | 7.625 | | | | 03/15/20 | | | | 3,200 | | | | 3,196,000 | |
Comcast Corp., | | | | | | | | | | | | | | | | |
Gtd. Notes(h) | | | 4.150 | | | | 10/15/28 | | | | 2,605 | | | | 2,583,596 | |
Gtd. Notes | | | 4.250 | | | | 10/15/30 | | | | 890 | | | | 877,813 | |
Discovery Communications LLC,
Gtd. Notes | | | 5.000 | | | | 09/20/37 | | | | 957 | | | | 893,216 | |
DISH DBS Corp.,
Gtd. Notes(a) | | | 7.750 | | | | 07/01/26 | | | | 7,300 | | | | 6,533,500 | |
See Notes to Financial Statements.
| | | | | | | | | | | | | | | | |
| Description | | Interest
Rate | | | Maturity
Date | | | Principal
Amount (000)# | | | Value | |
CORPORATE BONDS (Continued) | | | | | | | | | | | | | | | | |
| | | | |
Media (cont’d.) | | | | | | | | | | | | | | | | |
Liberty Interactive LLC,
Sr. Unsec’d. Notes(a) | | | 8.250 | % | | | 02/01/30 | | | | 800 | | | $ | 836,000 | |
TEGNA, Inc.,
Gtd. Notes, 144A | | | 4.875 | | | | 09/15/21 | | | | 1,625 | | | | 1,616,875 | |
Univision Communications, Inc.,
Sr. Sec’d. Notes, 144A | | | 6.750 | | | | 09/15/22 | | | | 1,292 | | | | 1,317,840 | |
Videotron Ltd. (Canada), | | | | | | | | | | | | | | | | |
Gtd. Notes(a) | | | 5.000 | | | | 07/15/22 | | | | 3,000 | | | | 2,996,250 | |
Gtd. Notes, 144A(a) | | | 5.375 | | | | 06/15/24 | | | | 865 | | | | 863,919 | |
Warner Media LLC,
Gtd. Notes | | | 3.800 | | | | 02/15/27 | | | | 1,350 | | | | 1,264,939 | |
| | | | | | | | | | | | | | | | |
| | | | | | | | | | | | | | | 45,215,727 | |
| | | | |
Mining 0.0% | | | | | | | | | | | | | | | | |
Constellium NV,
Gtd. Notes | | | 4.250 | | | | 02/15/26 | | | EUR | 500 | | | | 552,589 | |
| | | | |
Miscellaneous Manufacturing 0.1% | | | | | | | | | | | | | | | | |
Actuant Corp.,
Gtd. Notes(a) | | | 5.625 | | | | 06/15/22 | | | | 3,075 | | | | 3,082,687 | |
| | | | |
Multi-National 0.1% | | | | | | | | | | | | | | | | |
Corp. Andina de Fomento (Supranational Bank),
Sr. Unsec’d. Notes | | | 4.375 | | | | 06/15/22 | | | | 2,000 | | | | 2,047,540 | |
| | | | |
Oil & Gas 1.5% | | | | | | | | | | | | | | | | |
Anadarko Petroleum Corp., | | | | | | | | | | | | | | | | |
Sr. Unsec’d. Notes | | | 4.637 | (s) | | | 10/10/36 | | | | 3,000 | | | | 1,241,593 | |
Sr. Unsec’d. Notes | | | 6.450 | | | | 09/15/36 | | | | 750 | | | | 812,241 | |
Cenovus Energy, Inc. (Canada), | | | | | | | | | | | | | | | | |
Sr. Unsec’d. Notes | | | 4.450 | | | | 09/15/42 | | | | 1,070 | | | | 887,938 | |
Sr. Unsec’d. Notes | | | 5.400 | | | | 06/15/47 | | | | 2,645 | | | | 2,479,508 | |
CNX Resources Corp.,
Gtd. Notes | | | 5.875 | | | | 04/15/22 | | | | 2,000 | | | | 1,963,760 | |
Concho Resources, Inc.,
Gtd. Notes | | | 4.875 | | | | 10/01/47 | | | | 275 | | | | 259,930 | |
Denbury Resources, Inc.,
Gtd. Notes(a) | | | 5.500 | | | | 05/01/22 | | | | 2,000 | | | | 1,730,000 | |
Endeavor Energy Resources LP/EER Finance, Inc.,
Sr. Unsec’d. Notes, 144A | | | 5.500 | | | | 01/30/26 | | | | 2,700 | | | | 2,774,250 | |
See Notes to Financial Statements.
| | | | |
| PGIM Absolute Return Bond Fund | | | 45 | |
Schedule of Investments (continued)
as of October 31, 2018
| | | | | | | | | | | | | | | | |
| Description | | Interest
Rate | | | Maturity
Date | | | Principal
Amount (000)# | | | Value | |
CORPORATE BONDS (Continued) | | | | | | | | | | | | | | | | |
| | | | |
Oil & Gas (cont’d.) | | | | | | | | | | | | | | | | |
Gazprom OAO Via Gaz Capital SA (Russia), | | | | | | | | | | | | | | | | |
Sr. Unsec’d. Notes | | | 5.999 | % | | | 01/23/21 | | | | 2,000 | | | $ | 2,048,760 | |
Sr. Unsec’d. Notes, 144A | | | 4.950 | | | | 07/19/22 | | | | 730 | | | | 731,513 | |
Sr. Unsec’d. Notes, 144A | | | 6.510 | | | | 03/07/22 | | | | 3,420 | | | | 3,579,187 | |
Harvest Operations Corp. (South Korea),
Gtd. Notes, 144A | | | 4.200 | | | | 06/01/23 | | | | 1,640 | | | | 1,656,187 | |
HPCL-Mittal Energy Ltd. (India),
Sr. Unsec’d. Notes(a) | | | 5.250 | | | | 04/28/27 | | | | 1,478 | | | | 1,296,468 | |
KazMunayGas National Co. JSC (Kazakhstan),
Sr. Unsec’d. Notes, 144A | | | 3.875 | | | | 04/19/22 | | | | 1,520 | | | | 1,505,238 | |
MEG Energy Corp. (Canada),
Gtd. Notes, 144A | | | 7.000 | | | | 03/31/24 | | | | 2,000 | | | | 1,965,000 | |
Noble Energy, Inc.,
Sr. Unsec’d. Notes | | | 4.150 | | | | 12/15/21 | | | | 500 | | | | 503,595 | |
Petrobras Global Finance BV (Brazil), | | | | | | | | | | | | | | | | |
Gtd. Notes | | | 5.299 | | | | 01/27/25 | | | | 975 | | | | 929,906 | |
Gtd. Notes | | | 5.750 | | | | 02/01/29 | | | | 1,275 | | | | 1,176,634 | |
Gtd. Notes | | | 6.125 | | | | 01/17/22 | | | | 68 | | | | 70,465 | |
Gtd. Notes | | | 7.375 | | | | 01/17/27 | | | | 560 | | | | 580,356 | |
Gtd. Notes | | | 8.375 | | | | 05/23/21 | | | | 1,016 | | | | 1,105,662 | |
Petroleos Mexicanos (Mexico), | | | | | | | | | | | | | | | | |
Gtd. Notes | | | 6.500 | | | | 03/13/27 | | | | 1,550 | | | | 1,500,400 | |
Gtd. Notes, 144A | | | 5.350 | | | | 02/12/28 | | | | 575 | | | | 512,268 | |
Petroleum Co. of Trinidad & Tobago Ltd. (Trinidad & Tobago),
Sr. Unsec’d. Notes | | | 9.750 | | | | 08/14/19 | | | | 1,915 | | | | 1,787,652 | |
Sinopec Group Overseas Development 2014 Ltd. (China),
Gtd. Notes | | | 2.750 | | | | 04/10/19 | | | | 1,000 | | | | 997,843 | |
Sinopec Group Overseas Development 2017 Ltd. (China),
Gtd. Notes, 144A | | | 2.250 | | | | 09/13/20 | | | | 4,350 | | | | 4,248,249 | |
| | | | | | | | | | | | | | | | |
| | | | | | | | | | | | | | | 38,344,603 | |
| | | | |
Oil & Gas Services 0.0% | | | | | | | | | | | | | | | | |
Cameron International Corp.,
Gtd. Notes | | | 5.950 | | | | 06/01/41 | | | | 100 | | | | 111,407 | |
| | | | |
Packaging & Containers 0.6% | | | | | | | | | | | | | | | | |
Crown European Holdings SA,
Gtd. Notes, 144A | | | 2.875 | | | | 02/01/26 | | | EUR | 5,050 | | | | 5,591,155 | |
See Notes to Financial Statements.
| | | | | | | | | | | | | | | | |
| Description | | Interest
Rate | | | Maturity
Date | | | Principal
Amount (000)# | | | Value | |
CORPORATE BONDS (Continued) | | | | | | | | | | | | | | | | |
| | | | |
Packaging & Containers (cont’d.) | | | | | | | | | | | | | | | | |
Horizon Parent Holdings Sarl (France),
Sr. Sec’d. Notes, 144A, Cash coupon 8.250% or PIK 9.00% | | | 8.250 | % | | | 02/15/22 | | | EUR | 825 | | | $ | 966,669 | |
Reynolds Group Issuer, Inc./Reynolds Group Issuer LLC,
Sr. Sec’d. Notes(a) | | | 5.750 | | | | 10/15/20 | | | | 6,784 | | | | 6,783,754 | |
WestRock RKT Co., | | | | | | | | | | | | | | | | |
Gtd. Notes | | | 4.450 | | | | 03/01/19 | | | | 35 | | | | 35,165 | |
Gtd. Notes | | | 4.900 | | | | 03/01/22 | | | | 1,190 | | | | 1,229,165 | |
| | | | | | | | | | | | | | | | |
| | | | | | | | | | | | | | | 14,605,908 | |
| | | | |
Pharmaceuticals 0.6% | | | | | | | | | | | | | | | | |
AbbVie, Inc.,
Sr. Unsec’d. Notes | | | 4.500 | | | | 05/14/35 | | | | 4,085 | | | | 3,767,538 | |
Allergan Funding SCS,
Gtd. Notes | | | 4.550 | | | | 03/15/35 | | | | 4,155 | | | | 3,913,814 | |
Bausch Health Cos., Inc.,
Gtd. Notes, 144A(a) | | | 6.125 | | | | 04/15/25 | | | | 1,075 | | | | 988,678 | |
CVS Health Corp., | | | | | | | | | | | | | | | | |
Sr. Unsec’d. Notes | | | 4.780 | | | | 03/25/38 | | | | 140 | | | | 134,710 | |
Sr. Unsec’d. Notes(a) | | | 5.050 | | | | 03/25/48 | | | | 690 | | | | 672,792 | |
Sr. Unsec’d. Notes | | | 5.125 | | | | 07/20/45 | | | | 1,315 | | | | 1,289,857 | |
Sr. Unsec’d. Notes | | | 5.300 | | | | 12/05/43 | | | | 475 | | | | 476,492 | |
Mylan NV,
Gtd. Notes | | | 5.250 | | | | 06/15/46 | | | | 520 | | | | 447,889 | |
Rossini Sarl (Italy),
First Lien, 144A | | | 6.750 | | | | 10/30/25 | | | EUR | 2,875 | | | | 3,313,337 | |
| | | | | | | | | | | | | | | | |
| | | | | | | | | | | | | | | 15,005,107 | |
| | | | |
Pipelines 0.7% | | | | | | | | | | | | | | | | |
DCP Midstream Operating LP,
Gtd. Notes, 144A | | | 5.350 | | | | 03/15/20 | | | | 227 | | | | 229,554 | |
Energy Transfer Operating LP, | | | | | | | | | | | | | | | | |
Gtd. Notes | | | 5.300 | | | | 04/15/47 | | | | 125 | | | | 112,379 | |
Gtd. Notes(a) | | | 6.000 | | | | 06/15/48 | | | | 180 | | | | 178,368 | |
Enterprise Products Operating LLC,
Gtd. Notes | | | 4.950 | | | | 10/15/54 | | | | 2,700 | | | | 2,398,016 | |
Fermaca Enterprises S de RL de CV (Mexico),
Sr. Sec’d. Notes, 144A | | | 6.375 | | | | 03/30/38 | | | | 528 | | | | 538,360 | |
Magellan Midstream Partners LP,
Sr. Unsec’d. Notes | | | 4.200 | | | | 12/01/42 | | | | 125 | | | | 105,932 | |
See Notes to Financial Statements.
| | | | |
| PGIM Absolute Return Bond Fund | | | 47 | |
Schedule of Investments (continued)
as of October 31, 2018
| | | | | | | | | | | | | | | | |
| Description | | Interest
Rate | | | Maturity
Date | | | Principal
Amount (000)# | | | Value | |
CORPORATE BONDS (Continued) | | | | | | | | | | | | | | | | |
| | | | |
Pipelines (cont’d.) | | | | | | | | | | | | | | | | |
Magellan Midstream Partners LP, (cont’d.) | | | | | | | | | | | | | | | | |
Sr. Unsec’d. Notes(a) | | | 4.250 | % | | | 02/01/21 | | | | 1,950 | | | $ | 1,975,116 | |
Sr. Unsec’d. Notes | | | 5.150 | | | | 10/15/43 | | | | 1,350 | | | | 1,354,880 | |
MPLX LP,
Sr. Unsec’d. Notes | | | 5.200 | | | | 03/01/47 | | | | 145 | | | | 137,140 | |
NGPL PipeCo LLC, | | | | | | | | | | | | | | | | |
Sr. Unsec’d. Notes, 144A | | | 4.375 | | | | 08/15/22 | | | | 150 | | | | 148,125 | |
Sr. Unsec’d. Notes, 144A | | | 4.875 | | | | 08/15/27 | | | | 500 | | | | 481,250 | |
ONEOK, Inc.,
Gtd. Notes | | | 4.950 | | | | 07/13/47 | | | | 1,060 | | | | 1,002,019 | |
Rockies Express Pipeline LLC, | | | | | | | | | | | | | | | | |
Sr. Unsec’d. Notes, 144A | | | 5.625 | | | | 04/15/20 | | | | 3,700 | | | | 3,780,290 | |
Sr. Unsec’d. Notes, 144A | | | 6.875 | | | | 04/15/40 | | | | 1,850 | | | | 2,011,875 | |
Tallgrass Energy Partners LP/Tallgrass Energy Finance Corp.,
Gtd. Notes, 144A | | | 5.500 | | | | 01/15/28 | | | | 1,875 | | | | 1,853,550 | |
Western Gas Partners LP, | | | | | | | | | | | | | | | | |
Sr. Unsec’d. Notes | | | 4.000 | | | | 07/01/22 | | | | 75 | | | | 74,359 | |
Sr. Unsec’d. Notes | | | 5.300 | | | | 03/01/48 | | | | 910 | | | | 795,584 | |
| | | | | | | | | | | | | | | | |
| | | | | | | | | | | | | | | 17,176,797 | |
| | | | |
Real Estate 0.2% | | | | | | | | | | | | | | | | |
Five Point Operating Co. LP/Five Point Capital Corp.,
Gtd. Notes, 144A | | | 7.875 | | | | 11/15/25 | | | | 2,475 | | | | 2,451,982 | |
Greystar Real Estate Partners LLC,
Sr. Sec’d. Notes, 144A | | | 5.750 | | | | 12/01/25 | | | | 1,750 | | | | 1,697,500 | |
WeWork Cos., Inc.,
Gtd. Notes, 144A(a) | | | 7.875 | | | | 05/01/25 | | | | 1,475 | | | | 1,353,313 | |
| | | | | | | | | | | | | | | | |
| | | | | | | | | | | | | | | 5,502,795 | |
| | | | |
Real Estate Investment Trusts (REITs) 0.6% | | | | | | | | | | | | | | | | |
Globalworth Real Estate Investments Ltd. (Romania),
Sr. Unsec’d. Notes, EMTN | | | 3.000 | | | | 03/29/25 | | | EUR | 3,750 | | | | 4,237,060 | |
MGM Growth Properties Operating Partnership LP/MGP Finance Co-Issuer, Inc.,
Gtd. Notes | | | 4.500 | | | | 09/01/26 | | | | 675 | | | | 610,875 | |
MPT Operating Partnership LP/MPT Finance Corp.,
Gtd. Notes | | | 3.325 | | | | 03/24/25 | | | EUR | 3,775 | | | | 4,360,365 | |
Sabra Health Care LP/Sabra Capital Corp.,
Gtd. Notes | | | 5.375 | | | | 06/01/23 | | | | 1,965 | | | | 1,955,175 | |
See Notes to Financial Statements.
| | | | | | | | | | | | | | | | |
| Description | | Interest
Rate | | | Maturity
Date | | | Principal
Amount (000)# | | | Value | |
CORPORATE BONDS (Continued) | | | | | | | | | | | | | | | | |
| | | | |
Real Estate Investment Trusts (REITs) (cont’d.) | | | | | | | | | | | | | | | | |
Sabra Health Care LP/Sabra Capital Corp., (cont’d.) | | | | | | | | | | | | | | | | |
Gtd. Notes | | | 5.500 | % | | | 02/01/21 | | | | 1,500 | | | $ | 1,519,687 | |
Trust F/1401 (Mexico),
Sr. Unsec’d. Notes, 144A | | | 5.250 | | | | 12/15/24 | | | | 2,000 | | | | 1,993,520 | |
| | | | | | | | | | | | | | | | |
| | | | | | | | | | | | | | | 14,676,682 | |
| | | | |
Retail 1.0% | | | | | | | | | | | | | | | | |
Brinker International, Inc.,
Gtd. Notes, 144A | | | 5.000 | | | | 10/01/24 | | | | 1,000 | | | | 940,000 | |
Golden Nugget, Inc.,
Sr. Unsec’d. Notes, 144A | | | 6.750 | | | | 10/15/24 | | | | 5,951 | | | | 5,936,123 | |
Grupo Unicomer Co. Ltd. (El Salvador),
Gtd. Notes, 144A | | | 7.875 | | | | 04/01/24 | | | | 1,797 | | | | 1,873,390 | |
L Brands, Inc., | | | | | | | | | | | | | | | | |
Gtd. Notes(a) | | | 5.625 | | | | 02/15/22 | | | | 6,205 | | | | 6,267,050 | |
Gtd. Notes | | | 5.625 | | | | 10/15/23 | | | | 1,225 | | | | 1,211,280 | |
Macy’s Retail Holdings, Inc.,
Gtd. Notes | | | 4.300 | | | | 02/15/43 | | | | 705 | | | | 499,193 | |
PetSmart, Inc.,
Sr. Sec’d. Notes, 144A | | | 5.875 | | | | 06/01/25 | | | | 1,775 | | | | 1,384,500 | |
Rite Aid Corp.,
Gtd. Notes, 144A(a) | | | 6.125 | | | | 04/01/23 | | | | 2,675 | | | | 2,272,078 | |
Sally Holdings LLC/Sally Capital, Inc., | | | | | | | | | | | | | | | | |
Gtd. Notes | | | 5.500 | | | | 11/01/23 | | | | 1,500 | | | | 1,443,750 | |
Gtd. Notes(a) | | | 5.625 | | | | 12/01/25 | | | | 5,000 | | | | 4,643,500 | |
| | | | | | | | | | | | | | | | |
| | | | | | | | | | | | | | | 26,470,864 | |
| | | | |
Savings & Loans 0.0% | | | | | | | | | | | | | | | | |
People’s United Financial, Inc.,
Sr. Unsec’d. Notes | | | 3.650 | | | | 12/06/22 | | | | 325 | | | | 320,889 | |
| | | | |
Semiconductors 0.2% | | | | | | | | | | | | | | | | |
Broadcom Corp./Broadcom Cayman Finance Ltd.,
Gtd. Notes | | | 3.875 | | | | 01/15/27 | | | | 2,905 | | | | 2,667,485 | |
Micron Technology, Inc.,
Sr. Unsec’d. Notes | | | 5.500 | | | | 02/01/25 | | | | 2,100 | | | | 2,134,398 | |
| | | | | | | | | | | | | | | | |
| | | | | | | | | | | | | | | 4,801,883 | |
See Notes to Financial Statements.
| | | | |
| PGIM Absolute Return Bond Fund | | | 49 | |
Schedule of Investments (continued)
as of October 31, 2018
| | | | | | | | | | | | | | | | |
| Description | | Interest
Rate | | | Maturity
Date | | | Principal
Amount (000)# | | | Value | |
CORPORATE BONDS (Continued) | | | | | | | | | | | | | | | | |
| | | | |
Software 0.8% | | | | | | | | | | | | | | | | |
First Data Corp.,
Gtd. Notes, 144A | | | 7.000 | % | | | 12/01/23 | | | | 6,150 | | | $ | 6,377,550 | |
Infor US, Inc.,
Gtd. Notes | | | 5.750 | | | | 05/15/22 | | | EUR | 1,800 | | | | 2,092,786 | |
InterXion Holding NV (Netherlands),
Gtd. Notes, 144A | | | 4.750 | | | | 06/15/25 | | | EUR | 9,600 | | | | 11,335,501 | |
| | | | | | | | | | | | | | | | |
| | | | | | | | | | | | | | | 19,805,837 | |
| | | | |
Telecommunications 1.4% | | | | | | | | | | | | | | | | |
Bharti Airtel International Netherlands BV (India),
Gtd. Notes, 144A | | | 5.125 | | | | 03/11/23 | | | | 3,725 | | | | 3,613,190 | |
CenturyLink, Inc.,
Sr. Unsec’d. Notes, Ser. V | | | 5.625 | | | | 04/01/20 | | | | 3,000 | | | | 3,037,500 | |
CommScope Technologies LLC,
Gtd. Notes, 144A(a) | | | 6.000 | | | | 06/15/25 | | | | 1,225 | | | | 1,191,313 | |
CommScope, Inc.,
Gtd. Notes, 144A | | | 5.000 | | | | 06/15/21 | | | | 2,275 | | | | 2,267,606 | |
Digicel Group Ltd. (Jamaica),
Sr. Unsec’d. Notes | | | 8.250 | | | | 09/30/20 | | | | 1,500 | | | | 1,072,515 | |
Digicel Ltd. (Jamaica),
Gtd. Notes, 144A | | | 6.750 | | | | 03/01/23 | | | | 2,050 | | | | 1,645,125 | |
Level 3 Financing, Inc.,
Gtd. Notes | | | 6.125 | | | | 01/15/21 | | | | 3,500 | | | | 3,508,750 | |
Sprint Capital Corp.,
Gtd. Notes | | | 8.750 | | | | 03/15/32 | | | | 5,525 | | | | 6,036,062 | |
Sprint Communications, Inc.,
Gtd. Notes, 144A | | | 7.000 | | | | 03/01/20 | | | | 5,900 | | | | 6,113,875 | |
Veon Holdings BV (Netherlands),
Sr. Unsec’d. Notes, 144A | | | 4.950 | | | | 06/16/24 | | | | 3,500 | | | | 3,312,995 | |
Wind Tre SpA (Italy), | | | | | | | | | | | | | | | | |
Sr. Sec’d. Notes | | | 3.125 | | | | 01/20/25 | | | EUR | 1,600 | | | | 1,649,130 | |
Sr. Sec’d. Notes, 144A | | | 2.625 | | | | 01/20/23 | | | EUR | 1,375 | | | | 1,447,624 | |
Sr. Sec’d. Notes, 144A | | | 3.125 | | | | 01/20/25 | | | EUR | 3,000 | | | | 3,092,118 | |
| | | | | | | | | | | | | | | | |
| | | | | | | | | | | | | | | 37,987,803 | |
| | | | |
Textiles 0.0% | | | | | | | | | | | | | | | | |
Mohawk Industries, Inc.,
Sr. Unsec’d. Notes | | | 3.850 | | | | 02/01/23 | | | | 104 | | | | 103,279 | |
See Notes to Financial Statements.
| | | | | | | | | | | | | | | | |
| Description | | Interest
Rate | | | Maturity
Date | | | Principal
Amount (000)# | | | Value | |
CORPORATE BONDS (Continued) | | | | | | | | | | | | | | | | |
| | | | |
Transportation 0.2% | | | | | | | | | | | | | | | | |
AP Moller-Maersk A/S (Denmark),
Sr. Unsec’d. Notes, 144A | | | 2.550 | % | | | 09/22/19 | | | | 2,450 | | | $ | 2,427,617 | |
Moby SpA (Italy),
Sr. Sec’d. Notes, 144A(a) | | | 7.750 | | | | 02/15/23 | | | EUR | 3,000 | | | | 1,673,644 | |
| | | | | | | | | | | | | | | | |
| | | | | | | | | | | | | | | 4,101,261 | |
| | | | |
Trucking & Leasing 0.1% | | | | | | | | | | | | | | | | |
Avolon Holdings Funding Ltd. (Ireland),
Gtd. Notes, 144A | | | 5.500 | | | | 01/15/23 | | | | 3,000 | | | | 2,985,000 | |
| | | | |
Water 0.1% | | | | | | | | | | | | | | | | |
Aegea Finance Sarl (Brazil),
Gtd. Notes, 144A | | | 5.750 | | | | 10/10/24 | | | | 3,015 | | | | 2,901,968 | |
| | | | | | | | | | | | | | | | |
TOTAL CORPORATE BONDS
(cost $747,354,989) | | | | | | | | | | | | | | | 726,816,200 | |
| | | | | | | | | | | | | | | | |
| | | | |
MUNICIPAL BONDS 0.5% | | | | | | | | | | | | | | | | |
| | | | |
California 0.3% | | | | | | | | | | | | | | | | |
Bay Area Toll Authority,
BABs, Revenue Bonds | | | 6.263 | | | | 04/01/49 | | | | 550 | | | | 727,386 | |
Los Angeles Department of Water & Power, | | | | | | | | | | | | | | | | |
BABs, Revenue Bonds, | | | 6.574 | | | | 07/01/45 | | | | 585 | | | | 782,730 | |
BABs, Taxable, Revenue Bonds, Series SY | | | 6.008 | | | | 07/01/39 | | | | 3,610 | | | | 4,282,038 | |
University of California, | | | | | | | | | | | | | | | | |
BABs, Revenue Bonds, | | | 5.770 | | | | 05/15/43 | | | | 390 | | | | 456,725 | |
Taxable, Revenue Bonds, Series AP | | | 3.931 | | | | 05/15/45 | | | | 625 | | | | 589,469 | |
Taxable, Revenue Bonds, Series J | | | 4.131 | | | | 05/15/45 | | | | 675 | | | | 654,088 | |
| | | | | | | | | | | | | | | | |
| | | | | | | | | | | | | | | 7,492,436 | |
| | | | |
Colorado 0.1% | | | | | | | | | | | | | | | | |
Regional Transportation District,
BABs, Revenue Bonds, Series 2010B | | | 5.844 | | | | 11/01/50 | | | | 1,190 | | | | 1,482,026 | |
| | | | |
Illinois 0.0% | | | | | | | | | | | | | | | | |
Chicago O’Hare International Airport,
BABs, Revenue Bonds | | | 6.395 | | | | 01/01/40 | | | | 360 | | | | 453,542 | |
See Notes to Financial Statements.
| | | | |
| PGIM Absolute Return Bond Fund | | | 51 | |
Schedule of Investments (continued)
as of October 31, 2018
| | | | | | | | | | | | | | | | |
| Description | | Interest
Rate | | | Maturity
Date | | | Principal
Amount (000)# | | | Value | |
MUNICIPAL BONDS (Continued) | | | | | | | | | | | | | | | | |
| | | | |
New Jersey 0.1% | | | | | | | | | | | | | | | | |
New Jersey State Turnpike Authority,
BABs, Revenue Bonds, Series F | | | 7.414 | % | | | 01/01/40 | | | | 2,000 | | | $ | 2,787,960 | |
Rutgers State University,
BABs, Revenue Bonds | | | 5.665 | | | | 05/01/40 | | | | 200 | | | | 230,870 | |
| | | | | | | | | | | | | | | | |
| | | | | | | | | | | | | | | 3,018,830 | |
| | | | |
New York 0.0% | | | | | | | | | | | | | | | | |
New York City Water & Sewer System,
BABs, Taxable, Revenue Bonds | | | 5.882 | | | | 06/15/44 | | | | 400 | | | | 498,448 | |
| | | | |
Ohio 0.0% | | | | | | | | | | | | | | | | |
Ohio State University (The),
Taxable, Revenue Bonds, Series A | | | 4.800 | | | | 06/01/2111 | | | | 180 | | | | 183,370 | |
| | | | |
Texas 0.0% | | | | | | | | | | | | | | | | |
City Public Service Board of San Antonio, Taxable, Revenue Bonds | | | 4.427 | | | | 02/01/42 | | | | 120 | | | | 125,372 | |
| | | | | | | | | | | | | | | | |
TOTAL MUNICIPAL BONDS
(cost $13,683,440) | | | | | | | | | | | | | | | 13,254,024 | |
| | | | | | | | | | | | | | | | |
|
RESIDENTIAL MORTGAGE-BACKED SECURITIES 4.5% | |
Banc of America Funding Corp., | | | | | | | | | | | | | | | | |
Series 2014-R02, Class 2A1, 144A, 1 Month LIBOR + 0.210% | | | 2.504 | (c) | | | 05/26/37 | | | | 1,587 | | | | 1,573,893 | |
Series 2015-R03, Class 1A1, 144A, 1 Month LIBOR + 0.190% | | | 2.471 | (c) | | | 03/27/36 | | | | 9,344 | | | | 9,155,628 | |
Series 2015-R03, Class 6A1, 144A, 1 Month LIBOR + 0.170% | | | 2.451 | (c) | | | 05/27/36 | | | | 2,013 | | | | 1,991,021 | |
Series 2015-R04, Class 4A1, 144A | | | 3.500 | (cc) | | | 01/27/30 | | | | 1,851 | | | | 1,831,712 | |
Banc of America Funding Trust,
Series 2014-R05, Class 1A1, 144A, 6 Month LIBOR + 1.500% | | | 4.092 | (c) | | | 09/26/45 | | | | 2,547 | | | | 2,608,930 | |
Bellemeade Re Ltd., | | | | | | | | | | | | | | | | |
Series 2017-01, Class M1, 144A, 1 Month LIBOR + 1.700% | | | 3.981 | (c) | | | 10/25/27 | | | | 912 | | | | 917,072 | |
Series 2018-01A, Class M1B, 144A, 1 Month LIBOR + 1.600% | | | 3.881 | (c) | | | 04/25/28 | | | | 2,147 | | | | 2,158,201 | |
Series 2018-02A, Class M1B, 144A, 1 Month LIBOR + 1.350% | | | 3.631 | (c) | | | 08/25/28 | | | | 1,200 | | | | 1,203,756 | |
Series 2018-02A, Class M1C, 144A, 1 Month LIBOR + 1.600% | | | 3.881 | (c) | | | 08/25/28 | | | | 1,200 | | | | 1,208,208 | |
See Notes to Financial Statements.
| | | | | | | | | | | | | | | | |
| Description | | Interest
Rate | | | Maturity
Date | | | Principal
Amount (000)# | | | Value | |
RESIDENTIAL MORTGAGE-BACKED SECURITIES (Continued) | |
Bellemeade Re Ltd., (cont’d.) | | | | | | | | | | | | | | | | |
Series 2018-03A, Class M1B, 144A, 1 Month LIBOR + 1.850% (Cap N/A, Floor 1.850%) | | | 4.130 | %(c) | | | 10/25/27 | | | | 3,290 | | | $ | 3,289,990 | |
Chase Mortgage Finance Trust Series,
Series 2007-A1, Class 1A3 | | | 4.161 | (cc) | | | 02/25/37 | | | | 159 | | | | 161,538 | |
CHL Mortgage Pass-Through Trust,
Series 2007-17, Class 2A1 | | | 6.500 | | | | 10/25/37 | | | | 3,609 | | | | 2,741,441 | |
CIM Trust, | | | | | | | | | | | | | | | | |
Series 2017-03, Class A1, 144A, 1 Month LIBOR + 2.000% | | | 4.256 | (c) | | | 01/25/57 | | | | 6,566 | | | | 6,689,247 | |
Series 2017-06, Class A1, 144A | | | 3.015 | (cc) | | | 06/25/57 | | | | 2,085 | | | | 2,000,933 | |
Series 2017-08, Class A1, 144A | | | 3.000 | (cc) | | | 12/25/65 | | | | 4,590 | | | | 4,478,618 | |
Freddie Mac Structured Agency Credit Risk Debt Notes,
Series 2015-DNA01, Class M3, 1 Month LIBOR + 3.300% | | | 5.581 | (c) | | | 10/25/27 | | | | 2,000 | | | | 2,237,041 | |
GSMSC Resecuritization Trust, | | | | | | | | | | | | | | | | |
Series 2015-03R, Class 1A1, 144A, 1 Month LIBOR + 0.140% | | | 2.421 | (c) | | | 01/26/37 | | | | 1,981 | | | | 1,953,917 | |
Series 2015-03R, Class 1A2, 144A, 1 Month LIBOR + 0.140% | | | 2.421 | (c) | | | 01/26/37 | | | | 1,670 | | | | 1,598,617 | |
Series 2015-03R, Class 2A1, 144A, 1 Month LIBOR + 0.140% | | | 2.421 | (c) | | | 10/26/36 | | | | 3,121 | | | | 3,062,364 | |
Series 2015-03R, Class 2A2, 144A, 1 Month LIBOR + 0.140% | | | 2.421 | (c) | | | 10/26/36 | | | | 1,400 | | | | 1,341,210 | |
Home Re Ltd.,
Series 2018-01, Class M1, 144A, 1 Month LIBOR + 1.600% | | | 3.830 | (c) | | | 10/25/28 | | | | 1,860 | | | | 1,859,918 | |
JPMorgan Mortgage Trust, | | | | | | | | | | | | | | | | |
Series 2007-A01, Class 4A1 | | | 4.574 | (cc) | | | 07/25/35 | | | | 145 | | | | 148,051 | |
Series 2018-7FRB, Class A2, 144A, 1 Month LIBOR + 0.750% | | | 2.966 | (c) | | | 04/25/46 | | | | 3,069 | | | | 3,073,936 | |
Lehman XS Trust,
Series 2006-GP04, Class 1A1, 1 Month LIBOR + 0.205% | | | 2.486 | (c) | | | 08/25/46 | | | | 1,701 | | | | 1,684,551 | |
LSTAR Securities Investment Ltd., | | | | | | | | | | | | | | | | |
Series 2017-05, Class A, 144A, 1 Month LIBOR + 2.000% | | | 4.256 | (c) | | | 05/01/22 | | | | 1,824 | | | | 1,821,694 | |
Series 2017-08, Class A, 144A, 1 Month LIBOR + 1.650% | | | 3.906 | (c) | | | 11/01/22 | | | | 1,407 | | | | 1,415,668 | |
Series 2017-09, Class A, 144A, 1 Month LIBOR + 1.550% | | | 3.806 | (c) | | | 12/01/22 | | | | 434 | | | | 433,622 | |
See Notes to Financial Statements.
| | | | |
| PGIM Absolute Return Bond Fund | | | 53 | |
Schedule of Investments (continued)
as of October 31, 2018
| | | | | | | | | | | | | | | | |
| Description | | Interest
Rate | | | Maturity
Date | | | Principal
Amount (000)# | | | Value | |
RESIDENTIAL MORTGAGE-BACKED SECURITIES (Continued) | |
LSTAR Securities Investment Trust, | | | | | | | | | | | | | | | | |
Series 2017-06, Class A, 144A, 1 Month LIBOR + 1.750% | | | 4.006 | %(c) | | | 09/01/22 | | | | 1,522 | | | $ | 1,529,999 | |
Series 2018-02, Class A1, 144A, 1 Month LIBOR + 1.500% | | | 3.756 | (c) | | | 04/01/23 | | | | 8,224 | | | | 8,229,052 | |
New Residential Mortgage Loan Trust, | | | | | | | | | | | | | | | | |
Series 2018-04A, Class A1S, 144A, 1 Month LIBOR + 0.750% (Cap N/A, Floor 0.750%) | | | 3.031 | (c) | | | 01/25/48 | | | | 5,749 | | | | 5,749,254 | |
Series 2018-RPL1, Class A1, 144A | | | 3.500 | (cc) | | | 12/25/57 | | | | 34,048 | | | | 33,381,325 | |
Oaktown Re Ltd.,
Series 2018-01A, Class M1, 144A, 1 Month LIBOR + 1.550% | | | 3.831 | (c) | | | 07/25/28 | | | | 1,500 | | | | 1,501,810 | |
Radnor RE Ltd., | | | | | | | | | | | | | | | | |
Series 2018-01, Class M1, 144A, 1 Month LIBOR + 1.400% | | | 3.681 | (c) | | | 03/25/28 | | | | 2,350 | | | | 2,353,723 | |
Series 2018-01, Class M2, 144A, 1 Month LIBOR + 2.700% | | | 4.981 | (c) | | | 03/25/28 | | | | 1,240 | | | | 1,256,930 | |
Structured Asset Securities Corp.,
Series 2003-37A, Class 3A7 | | | 4.240 | (cc) | | | 12/25/33 | | | | 622 | | | | 620,116 | |
Wells Fargo Mortgage Backed Securities Trust,
Series 2004-EE, Class 2A1 | | | 4.443 | (cc) | | | 12/25/34 | | | | 116 | | | | 117,939 | |
| | | | | | | | | | | | | | | | |
TOTAL RESIDENTIAL MORTGAGE-BACKED SECURITIES
(cost $116,369,904) | | | | | | | | | | | | | | | 117,380,925 | |
| | | | | | | | | | | | | | | | |
| | | | |
SOVEREIGN BONDS 9.5% | | | | | | | | | | | | | | | | |
Argentine Republic Government International Bond (Argentina), | | | | | | | | | | | | | | | | |
Sr. Unsec’d. Notes | | | 4.625 | | | | 01/11/23 | | | | 2,800 | | | | 2,366,000 | |
Sr. Unsec’d. Notes | | | 6.875 | | | | 04/22/21 | | | | 7,175 | | | | 6,862,887 | |
Sr. Unsec’d. Notes | | | 7.820 | | | | 12/31/33 | | | EUR | 1,064 | | | | 1,088,005 | |
Sr. Unsec’d. Notes | | | 7.820 | | | | 12/31/33 | | | EUR | 139 | | | | 141,680 | |
Unsec’d. Notes | | | 5.000 | | | | 01/15/27 | | | EUR | 3,970 | | | | 3,462,739 | |
Brazil Loan Trust 1 (Brazil),
Gov’t. Gtd. Notes | | | 5.477 | | | | 07/24/23 | | | | 3,686 | | | | 3,717,593 | |
Brazil Minas SPE via State of Minas Gerais (Brazil),
Gov’t. Gtd. Notes | | | 5.333 | | | | 02/15/28 | | | | 7,070 | | | | 6,849,062 | |
Costa Rica Government International Bond (Costa Rica),
Bonds | | | 4.370 | | | | 05/22/19 | | | | 2,000 | | | | 1,987,530 | |
Dominican Republic International Bond (Dominican Republic), | | | | | | | | | | | | | | | | |
Sr. Unsec’d. Notes | | | 7.500 | | | | 05/06/21 | | | | 6,075 | | | | 6,287,625 | |
Sr. Unsec’d. Notes, 144A | | | 6.000 | | | | 07/19/28 | | | | 1,200 | | | | 1,189,500 | |
Sr. Unsec’d. Notes, 144A | | | 7.500 | | | | 05/06/21 | | | | 1,300 | | | | 1,345,500 | |
See Notes to Financial Statements.
| | | | | | | | | | | | | | | | |
| Description | | Interest
Rate | | | Maturity
Date | | | Principal
Amount (000)# | | | Value | |
SOVEREIGN BONDS (Continued) | |
Egypt Government International Bond (Egypt), | | | | | | | | | | | | | | | | |
Sr. Unsec’d. Notes, 144A | | | 6.588 | % | | | 02/21/28 | | | | 430 | | | $ | 393,824 | |
Sr. Unsec’d. Notes, 144A, MTN | | | 4.750 | | | | 04/16/26 | | | EUR | 2,985 | | | | 3,164,501 | |
Hellenic Republic Government Bond (Greece), | | | | | | | | | | | | | | | | |
Bonds | | | 0.000 | (cc) | | | 10/15/42 | | | EUR | 940,000 | | | | 3,194,056 | |
Bonds | | | 3.000 | (cc) | | | 02/24/23 | | | EUR | 500 | | | | 561,290 | |
Bonds | | | 3.000 | (cc) | | | 02/24/24 | | | EUR | 1,030 | | | | 1,148,023 | |
Bonds | | | 3.000 | (cc) | | | 02/24/25 | | | EUR | 500 | | | | 547,662 | |
Bonds | | | 3.000 | (cc) | | | 02/24/26 | | | EUR | 500 | | | | 546,475 | |
Bonds | | | 3.000 | (cc) | | | 02/24/27 | | | EUR | 500 | | | | 539,649 | |
Bonds | | | 3.000 | (cc) | | | 02/24/28 | | | EUR | 500 | | | | 533,059 | |
Bonds | | | 3.000 | (cc) | | | 02/24/29 | | | EUR | 1,600 | | | | 1,685,829 | |
Bonds | | | 3.000 | (cc) | | | 02/24/30 | | | EUR | 550 | | | | 570,450 | |
Bonds | | | 3.000 | (cc) | | | 02/24/31 | | | EUR | 1,830 | | | | 1,875,061 | |
Bonds | | | 3.000 | (cc) | | | 02/24/32 | | | EUR | 1,855 | | | | 1,873,098 | |
Bonds | | | 3.000 | (cc) | | | 02/24/33 | | | EUR | 500 | | | | 496,623 | |
Bonds | | | 3.000 | (cc) | | | 02/24/34 | | | EUR | 1,650 | | | | 1,611,010 | |
Bonds | | | 3.000 | (cc) | | | 02/24/35 | | | EUR | 2,125 | | | | 2,040,957 | |
Bonds | | | 3.000 | (cc) | | | 02/24/36 | | | EUR | 500 | | | | 473,574 | |
Bonds | | | 3.000 | (cc) | | | 02/24/37 | | | EUR | 500 | | | | 467,715 | |
Bonds | | | 3.000 | (cc) | | | 02/24/38 | | | EUR | 500 | | | | 466,512 | |
Bonds | | | 3.000 | (cc) | | | 02/24/39 | | | EUR | 1,600 | | | | 1,488,209 | |
Bonds | | | 3.000 | (cc) | | | 02/24/40 | | | EUR | 500 | | | | 464,810 | |
Bonds | | | 3.000 | (cc) | | | 02/24/41 | | | EUR | 500 | | | | 464,399 | |
Bonds | | | 3.000 | (cc) | | | 02/24/42 | | | EUR | 500 | | | | 465,466 | |
Bonds | | | 3.500 | | | | 01/30/23 | | | EUR | 3,385 | | | | 3,862,755 | |
Bonds | | | 3.750 | | | | 01/30/28 | | | EUR | 3,600 | | | | 3,929,260 | |
Bonds | | | 4.000 | | | | 01/30/37 | | | EUR | 2,500 | | | | 2,460,765 | |
Bonds | | | 4.200 | | | | 01/30/42 | | | EUR | 1,515 | | | | 1,489,449 | |
Hellenic Republic Government International Bond (Greece), | | | | | | | | | | | | | | | | |
Sr. Unsec’d. Notes | | | 5.200 | | | | 07/17/34 | | | EUR | 5,485 | | | | 6,195,157 | |
Sr. Unsec’d. Notes | | | 6.140 | | | | 04/14/28 | | | EUR | 2,000 | | | | 2,490,231 | |
Hungary Government International Bond (Hungary), | | | | | | | | | | | | | | | | |
Sr. Unsec’d. Notes | | | 6.250 | | | | 01/29/20 | | | | 10,600 | | | | 10,944,500 | |
Sr. Unsec’d. Notes | | | 6.375 | | | | 03/29/21 | | | | 14,470 | | | | 15,316,495 | |
Indonesia Government International Bond (Indonesia), | | | | | | | | | | | | | | | | |
Sr. Unsec’d. Notes | | | 3.375 | | | | 07/30/25 | | | EUR | 2,975 | | | | 3,567,749 | |
Sr. Unsec’d. Notes, EMTN | | | 3.750 | | | | 06/14/28 | | | EUR | 775 | | | | 946,081 | |
Iraq International Bond (Iraq),
Sr. Unsec’d. Notes | | | 6.752 | | | | 03/09/23 | | | | 4,715 | | | | 4,589,864 | |
Ivory Coast Government International Bond (Ivory Coast), | | | | | | | | | | | | | | | | |
Sr. Unsec’d. Notes | | | 5.125 | | | | 06/15/25 | | | EUR | 500 | | | | 556,864 | |
See Notes to Financial Statements.
| | | | |
| PGIM Absolute Return Bond Fund | | | 55 | |
Schedule of Investments (continued)
as of October 31, 2018
| | | | | | | | | | | | | | | | |
| Description | | Interest
Rate | | | Maturity
Date | | | Principal
Amount (000)# | | | Value | |
SOVEREIGN BONDS (Continued) | |
Ivory Coast Government International Bond (Ivory Coast), (cont’d.) | |
Sr. Unsec’d. Notes, 144A | | | 5.125 | % | | | 06/15/25 | | | EUR | 2,250 | | | $ | 2,505,890 | |
Japan Bank for International Cooperation (Japan), | | | | | | | | | | | | | | | | |
Gov’t. Gtd. Notes | | | 1.750 | | | | 11/13/18 | | | | 1,000 | | | | 999,690 | |
Gov’t. Gtd. Notes | | | 1.875 | | | | 04/20/21 | | | | 2,000 | | | | 1,934,014 | |
Gov’t. Gtd. Notes | | | 2.125 | | | | 06/01/20 | | | | 200 | | | | 196,866 | |
Gov’t. Gtd. Notes | | | 2.125 | | | | 07/21/20 | | | | 600 | | | | 589,442 | |
Gov’t. Gtd. Notes | | | 2.500 | | | | 06/01/22 | | | | 4,200 | | | | 4,076,763 | |
Gov’t. Gtd. Notes | | | 3.375 | | | | 10/31/23 | | | | 2,400 | | | | 2,394,702 | |
Japan Finance Organization for Municipalities (Japan), | | | | | | | | | | | | | | | | |
Sr. Unsec’d. Notes, 144A | | | 3.375 | | | | 09/27/23 | | | | 2,200 | | | | 2,188,419 | |
Sr. Unsec’d. Notes, 144A, MTN | | | 3.250 | | | | 04/24/23 | | | | 800 | | | | 791,861 | |
Sr. Unsec’d. Notes, EMTN | | | 2.125 | | | | 04/13/21 | | | | 600 | | | | 581,553 | |
Japan International Cooperation Agency (Japan),
Gov’t. Gtd. Notes | | | 1.875 | | | | 11/13/19 | | | | 4,000 | | | | 3,946,804 | |
Kenya Government International Bond (Kenya),
Sr. Unsec’d. Notes | | | 6.875 | | | | 06/24/24 | | | | 3,005 | | | | 2,923,589 | |
Portugal Government International Bond (Portugal),
Sr. Unsec’d. Notes, EMTN | | | 5.125 | | | | 10/15/24 | | | | 65,228 | | | | 67,757,542 | |
Portugal Obrigacoes do Tesouro OT (Portugal),
Sr. Unsec’d. Notes, 144A | | | 3.875 | | | | 02/15/30 | | | EUR | 1,515 | | | | 2,013,502 | |
Province of Alberta (Canada),
Sr. Unsec’d. Notes | | | 3.300 | | | | 03/15/28 | | | | 2,475 | | | | 2,410,682 | |
Province of Ontario (Canada),
Sr. Unsec’d. Notes | | | 3.400 | | | | 10/17/23 | | | | 2,335 | | | | 2,339,306 | |
Provincia de Buenos Aires (Argentina), | | | | | | | | | | | | | | | | |
Sr. Unsec’d. Notes, 144A | | | 6.500 | | | | 02/15/23 | | | | 600 | | | | 513,000 | |
Sr. Unsec’d. Notes, 144A | | | 9.950 | | | | 06/09/21 | | | | 1,650 | | | | 1,612,380 | |
Republic of Italy Government International Bond (Italy),
Sr. Unsec’d. Notes | | | 6.875 | | | | 09/27/23 | | | | 6,773 | | | | 7,265,722 | |
Saudi Government International Bond (Saudi Arabia),
Sr. Unsec’d. Notes, 144A, MTN | | | 4.000 | | | | 04/17/25 | | | | 1,325 | | | | 1,301,055 | |
Senegal Government International Bond (Senegal), | | | | | | | | | | | | | | | | |
Sr. Unsec’d. Notes | | | 4.750 | | | | 03/13/28 | | | EUR | 1,600 | | | | 1,689,180 | |
Sr. Unsec’d. Notes, 144A | | | 4.750 | | | | 03/13/28 | | | EUR | 900 | | | | 950,164 | |
Serbia International Bond (Serbia),
Unsec’d. Notes | | | 5.875 | | | | 12/03/18 | | | | 2,000 | | | | 2,003,420 | |
Tokyo Metropolitan Government (Japan), | | | | | | | | | | | | | | | | |
Sr. Unsec’d. Notes | | | 2.000 | | | | 05/17/21 | | | | 4,500 | | | | 4,347,815 | |
Sr. Unsec’d. Notes | | | 2.125 | | | | 05/20/19 | | | | 3,000 | | | | 2,987,973 | |
Sr. Unsec’d. Notes | | | 2.125 | | | | 05/19/20 | | | | 2,500 | | | | 2,455,290 | |
See Notes to Financial Statements.
| | | | | | | | | | | | | | | | |
| Description | | Interest
Rate | | | Maturity
Date | | | Principal
Amount (000)# | | | Value | |
SOVEREIGN BONDS (Continued) | |
Tokyo Metropolitan Government (Japan), (cont’d.) | |
Sr. Unsec’d. Notes, 144A | | | 2.500 | % | | | 06/08/22 | | | | 1,000 | | | $ | 968,118 | |
Sr. Unsec’d. Notes, 144A | | | 3.250 | | | | 06/01/23 | | | | 1,000 | | | | 992,226 | |
Turkey Government International Bond (Turkey),
Sr. Unsec’d. Notes | | | 5.625 | | | | 03/30/21 | | | | 1,450 | | | | 1,413,669 | |
Ukraine Government International Bond (Ukraine), | | | | | | | | | | | | | | | | |
Sr. Unsec’d. Notes | | | 7.750 | | | | 09/01/22 | | | | 1,000 | | | | 969,360 | |
Sr. Unsec’d. Notes | | | 7.750 | | | | 09/01/26 | | | | 4,760 | | | | 4,302,183 | |
Uruguay Government International Bond (Uruguay),
Sr. Unsec’d. Notes | | | 4.975 | | | | 04/20/55 | | | | 605 | | | | 561,138 | |
| | | | | | | | | | | | | | | | |
TOTAL SOVEREIGN BONDS
(cost $255,579,405) | | | | | | | | | | | | | | | 248,702,861 | |
| | | | | | | | | | | | | | | | |
| | | | |
U.S. TREASURY OBLIGATIONS 3.6% | | | | | | | | | | | | | | | | |
U.S. Treasury Bonds(h)(k) | | | 2.500 | | | | 02/15/45 | | | | 38,760 | | | | 32,668,926 | |
U.S. Treasury Bonds(h) | | | 2.500 | | | | 05/15/46 | | | | 4,110 | | | | 3,444,052 | |
U.S. Treasury Bonds | | | 2.875 | | | | 11/15/46 | | | | 120 | | | | 108,530 | |
U.S. Treasury Bonds | | | 3.125 | | | | 05/15/48 | | | | 19,180 | | | | 18,189,533 | |
U.S. Treasury Bonds | | | 3.625 | | | | 08/15/43 | | | | 90 | | | | 93,371 | |
U.S. Treasury Notes | | | 1.875 | | | | 01/31/22 | | | | 715 | | | | 691,316 | |
U.S. Treasury Notes | | | 1.875 | | | | 04/30/22 | | | | 2,040 | | | | 1,966,847 | |
U.S. Treasury Notes | | | 2.000 | | | | 11/15/26 | | | | 785 | | | | 722,813 | |
U.S. Treasury Notes | | | 2.250 | | | | 11/15/24 | | | | 4,000 | | | | 3,824,219 | |
U.S. Treasury Notes | | | 2.250 | | | | 02/15/27 | | | | 1,530 | | | | 1,432,463 | |
U.S. Treasury Notes | | | 2.500 | | | | 05/31/20 | | | | 205 | | | | 203,911 | |
U.S. Treasury Notes | | | 2.500 | | | | 05/15/24 | | | | 7,000 | | | | 6,813,516 | |
U.S. Treasury Notes(h) | | | 2.875 | | | | 08/15/28 | | | | 7,405 | | | | 7,229,420 | |
U.S. Treasury Notes | | | 3.000 | | | | 10/31/25 | | | | 5,510 | | | | 5,482,450 | |
U.S. Treasury Strips Coupon | | | 2.143 | (s) | | | 11/15/28 | | | | 1,820 | | | | 1,313,540 | |
U.S. Treasury Strips Coupon(k) | | | 2.174 | (s) | | | 05/15/29 | | | | 4,420 | | | | 3,133,345 | |
U.S. Treasury Strips Coupon | | | 2.783 | (s) | | | 08/15/29 | | | | 2,100 | | | | 1,476,724 | |
U.S. Treasury Strips Coupon | | | 2.878 | (s) | | | 05/15/31 | | | | 2,100 | | | | 1,388,898 | |
U.S. Treasury Strips Coupon(h) | | | 3.042 | (s) | | | 11/15/35 | | | | 4,200 | | | | 2,366,697 | |
U.S. Treasury Strips Coupon | | | 3.202 | (s) | | | 08/15/40 | | | | 4,200 | | | | 1,989,055 | |
| | | | | | | | | | | | | | | | |
TOTAL U.S. TREASURY OBLIGATIONS
(cost $99,966,183) | | | | | | | | | | | | | | | 94,539,626 | |
| | | | | | | | | | | | | | | | |
See Notes to Financial Statements.
| | | | |
| PGIM Absolute Return Bond Fund | | | 57 | |
Schedule of Investments (continued)
as of October 31, 2018
| | | | | | | | |
| Description | | Shares | | | Value | |
COMMON STOCK 0.1% | | | | | | | | |
| | |
Oil, Gas & Consumable Fuels | | | | | | | | |
Frontera Energy Corp. (Colombia)*
(cost $2,719,465) | | | 132,434 | | | $ | 1,725,615 | |
| | | | | | | | |
TOTAL LONG-TERM INVESTMENTS
(cost $2,347,604,553) | | | | | | | 2,304,072,323 | |
| | | | | | | | |
| | |
SHORT-TERM INVESTMENTS 13.1% | | | | | | | | |
| | |
AFFILIATED MUTUAL FUNDS 10.5% | | | | | | | | |
PGIM Core Ultra Short Bond Fund(w) | | | 193,786,688 | | | | 193,786,688 | |
PGIM Institutional Money Market Fund
(cost $80,234,245; includes $80,080,072 of cash collateral for securities on loan)(b)(w) | | | 80,235,942 | | | | 80,235,942 | |
| | | | | | | | |
TOTAL AFFILIATED MUTUAL FUNDS
(cost $274,020,933) | | | | | | | 274,022,630 | |
| | | | | | | | |
| | |
OPTIONS PURCHASED*~ 2.6% | | | | | | | | |
(cost $79,635,477) | | | | | | | 67,626,094 | |
| | | | | | | | |
TOTAL SHORT-TERM INVESTMENTS
(cost $353,656,410) | | | | | | | 341,648,724 | |
| | | | | | | | |
TOTAL INVESTMENTS, BEFORE OPTIONS WRITTEN 101.1%
(cost $2,701,260,963) | | | | | | | 2,645,721,047 | |
| | | | | | | | |
| | |
OPTIONS WRITTEN*~ (2.6)% | | | | | | | | |
(premiums received $66,394,378) | | | | | | | (67,467,473 | ) |
| | | | | | | | |
| | |
TOTAL INVESTMENTS, NET OF OPTIONS WRITTEN 98.5%
(cost $2,634,866,585) | | | | | | | 2,578,253,574 | |
Other assets in excess of liabilities(z) 1.5% | | | | | | | 39,979,105 | |
| | | | | | | | |
NET ASSETS 100.0% | | | | | | $ | 2,618,232,679 | |
| | | | | | | | |
The following abbreviations are used in the annual report:
144A—Security was purchased pursuant to Rule 144A under the Securities Act of 1933 and may not be resold subject to that rule except to qualified institutional buyers. Unless otherwise noted, 144A securities are deemed to be liquid.
A—Annual payment frequency for swaps
ABS—Asset-Backed Security
BABs—Build America Bonds
BROIS—Brazil Overnight Index Swap
CDO—Collateralized Debt Obligation
CDS—Credit Default Swap
CDX—Credit Derivative Index
See Notes to Financial Statements.
CLO—Collateralized Loan Obligation
CMBX—Commercial Mortgage-Backed Index
CMS—Constant Maturity Swap
CPI—Consumer Price Index
EMTN—Euro Medium Term Note
EURIBOR—Euro Interbank Offered Rate
FHLMC—Federal Home Loan Mortgage Corporation
GMAC—General Motors Acceptance Corporation
GMTN—Global Medium Term Note
IO—Interest Only (Principal amount represents notional)
iTraxx—International Credit Derivative Index
JIBAR—Johannesburg Interbank Agreed Rate
L2—Level 2
L3—Level 3
LIBOR—London Interbank Offered Rate
M—Monthly payment frequency for swaps
MTN—Medium Term Note
OTC—Over-the-counter
PIK—Payment-in-Kind
PJSC—Public Joint-Stock Company
Q—Quarterly payment frequency for swaps
REITs—Real Estate Investment Trusts
S—Semiannual payment frequency for swaps
Strips—Separate Trading of Registered Interest and Principal of Securities
T—Swap payment upon termination
USOIS—United States Overnight Index Swap
AUD—Australian Dollar
BRL—Brazilian Real
CAD—Canadian Dollar
CHF—Swiss Franc
CLP—Chilean Peso
CNH—Chinese Renminbi
COP—Colombian Peso
CZK—Czech Koruna
EUR—Euro
GBP—British Pound
HUF—Hungarian Forint
IDR—Indonesian Rupiah
ILS—Israeli Shekel
INR—Indian Rupee
JPY—Japanese Yen
KRW—South Korean Won
MXN—Mexican Peso
NOK—Norwegian Krone
NZD—New Zealand Dollar
PEN—Peruvian Nuevo Sol
PHP—Philippine Peso
PLN—Polish Zloty
RUB—Russian Ruble
SAR—Saudi Arabian Riyal
SEK—Swedish Krona
SGD—Singapore Dollar
See Notes to Financial Statements.
| | | | |
| PGIM Absolute Return Bond Fund | | | 59 | |
Schedule of Investments (continued)
as of October 31, 2018
THB—Thai Baht
TRY—Turkish Lira
TWD—New Taiwanese Dollar
USD—US Dollar
ZAR—South African Rand
| * | Non-income producing security. |
| # | Principal or notional amount is shown in U.S. dollars unless otherwise stated. |
| ~ | See tables subsequent to the Schedule of Investments for options detail. |
| ^ | Indicates a Level 3 security. The aggregate value of Level 3 securities is $23,516,560 and 0.9% of net assets. |
| (a) | All or a portion of security is on loan. The aggregate market value of such securities, including those sold and pending settlement, is $78,059,324; cash collateral of $80,080,072 (included in liabilities) was received with which the Fund purchased highly liquid short-term investments. |
| (b) | Represents security purchased with cash collateral received for securities on loan and includes dividend reinvestment. |
| (c) | Variable rate instrument. The interest rate shown reflects the rate in effect at October 31, 2018. |
| (cc) | Variable rate instrument. The rate shown is based on the latest available information as of October 31, 2018. Certain variable rate securities are not based on a published reference rate and spread but are determined by the issuer or agent and are based on current market conditions. These securities do not indicate a reference rate and spread in their description. |
| (h) | Represents security, or a portion thereof, segregated as collateral for OTC derivatives. |
| (k) | Represents security, or a portion thereof, segregated as collateral for centrally cleared/exchange-traded derivatives. |
| (s) | Represents zero coupon bond or principal only security. Rate represents yield to maturity at purchase date. |
| (w) | PGIM Investments LLC, the manager of the Fund, also serves as manager of the PGIM Core Ultra Short Bond Fund and PGIM Institutional Money Market Fund. |
| (z) | Includes net unrealized appreciation/(depreciation) and/or market value of the below holdings which are excluded from the Schedule of Investments: |
Unfunded loan commitment outstanding at October 31, 2018
| | | | | | | | | | | | | | | | |
Borrower | | Principal
Amount
(000) | | | Current
Value | | | Unrealized
Appreciation | | | Unrealized
Depreciation | |
Nidda Healthcare Holding AG (Germany), Facility CGBP, 4.500%, Maturity Date 8/21/24 (cost $2,210,191) | | | GBP 1,643 | | | $ | 2,105,000 | | | $ | — | | | $ | (105,191 | ) |
| | | | | | | | | | | | | | | | |
Options Purchased:
OTC Traded
| | | | | | | | | | | | | | | | | | | | | | | | |
Description | | Call/
Put | | Counterparty | | Expiration
Date | | | Strike | | | Contracts | | | Notional
Amount
(000)# | | | Value | |
2-Year 10 CMS Curve CAP | | Call | | Barclays Bank PLC | | | 07/12/21 | | | | 0.11 | % | | | — | | | | 47,045 | | | $ | 44,189 | |
2-Year 10 CMS Curve CAP | | Call | | Barclays Bank PLC | | | 07/13/21 | | | | 0.11 | % | | | — | | | | 50,000 | | | | 46,973 | |
2-Year 10 CMS Curve CAP | | Call | | Bank of America | | | 08/16/21 | | | | 0.15 | % | | | — | | | | 114,350 | | | | 105,425 | |
2-Year 10 CMS Curve CAP | | Call | | Bank of America | | | 08/20/21 | | | | 0.15 | % | | | — | | | | 231,665 | | | | 665,041 | |
See Notes to Financial Statements.
Options Purchased (continued):
OTC Traded
| | | | | | | | | | | | | | | | | | | | | | | | | | | | |
Description | | Call/
Put | | Counterparty | | Expiration
Date | | | Strike | | | Contracts | | | Notional
Amount
(000)# | | | Value | |
2-Year 10 CMS Curve CAP | | Call | | Bank of America | | | 09/13/21 | | | | 0.14 | % | | | — | | | | | | | | 234,900 | | | $ | 252,802 | |
Currency Option AUD vs JPY | | Call | | Morgan Stanley | | | 11/25/20 | | | | 92.00 | | | | — | | | | AUD | | | | 70,000 | | | | 401,657 | |
Currency Option AUD vs USD | | Call | | Morgan Stanley | | | 08/27/19 | | | | 0.78 | | | | — | | | | AUD | | | | 79,000 | | | | 313,897 | |
Currency Option EUR vs TRY | | Call | | Goldman Sachs International | | | 11/28/18 | | | | 10.00 | | | | — | | | | EUR | | | | 30,000 | | | | 640 | |
Currency Option EUR vs TRY | | Call | | BNP Paribas | | | 04/28/20 | | | | 10.00 | | | | — | | | | EUR | | | | 30,000 | | | | 2,945,733 | |
Currency Option EUR vs TRY | | Call | | Morgan Stanley | | | 07/28/20 | | | | 12.00 | | | | — | | | | EUR | | | | 30,000 | | | | 2,405,498 | |
Currency Option EUR vs ZAR | | Call | | Morgan Stanley | | | 01/31/19 | | | | 28.00 | | | | — | | | | EUR | | | | 34,000 | | | | 4,397 | |
Currency Option EUR vs ZAR | | Call | | Morgan Stanley | | | 12/24/19 | | | | 24.00 | | | | — | | | | EUR | | | | 25,000 | | | | 583,125 | |
Currency Option USD vs BRL | | Call | | Deutsche Bank AG | | | 12/10/18 | | | | 6.50 | | | | — | | | | | | | | 74,000 | | | | 42 | |
Currency Option USD vs BRL | | Call | | Deutsche Bank AG | | | 03/14/19 | | | | 8.50 | | | | — | | | | | | | | 37,000 | | | | 719 | |
Currency Option USD vs BRL | | Call | | Deutsche Bank AG | | | 12/20/19 | | | | 5.00 | | | | — | | | | | | | | 30,000 | | | | 381,934 | |
Currency Option USD vs BRL | | Call | | Deutsche Bank AG | | | 03/27/20 | | | | 4.65 | | | | — | | | | | | | | 30,000 | | | | 768,745 | |
Currency Option USD vs CAD | | Call | | Bank of America | | | 01/30/19 | | | | 1.50 | | | | — | | | | | | | | 30,000 | | | | 2,014 | |
Currency Option USD vs CAD | | Call | | Bank of America | | | 07/30/19 | | | | 1.30 | | | | — | | | | | | | | 30,000 | | | | 872,630 | |
Currency Option USD vs CNH | | Call | | Morgan Stanley | | | 03/27/19 | | | | 8.25 | | | | — | | | | | | | | 36,000 | | | | 31,717 | |
Currency Option USD vs CNH | | Call | | Morgan Stanley | | | 06/26/20 | | | | 7.25 | | | | — | | | | | | | | 36,000 | | | | 983,164 | |
Currency Option USD vs INR | | Call | | BNP Paribas | | | 11/30/18 | | | | 82.50 | | | | — | | | | | | | | 37,000 | | | | 913 | |
Currency Option USD vs JPY | | Call | | Citibank NA | | | 01/27/21 | | | | 110.00 | | | | — | | | | | | | | 30,000 | | | | 795,695 | |
Currency Option USD vs JPY | | Call | | Morgan Stanley | | | 01/27/21 | | | | 110.00 | | | | — | | | | | | | | 7,000 | | | | 185,662 | |
Currency Option USD vs KRW | | Call | | Goldman Sachs International | | | 12/20/19 | | | | 1,200.00 | | | | — | | | | | | | | 30,000 | | | | 618,239 | |
Currency Option USD vs KRW | | Call | | BNP Paribas | | | 12/20/19 | | | | 1,350.00 | | | | — | | | | | | | | 60,000 | | | | 463,568 | |
See Notes to Financial Statements.
| | | | |
| PGIM Absolute Return Bond Fund | | | 61 | |
Schedule of Investments (continued)
as of October 31, 2018
Options Purchased (continued):
OTC Traded
| | | | | | | | | | | | | | | | | | | | | | | | | | | | |
Description | | Call/
Put | | Counterparty | | Expiration
Date | | | Strike | | | Contracts | | | Notional
Amount
(000)# | | | Value | |
Currency Option USD vs MXN | | Call | | Citibank NA | | | 11/26/18 | | | | 26.00 | | | | — | | | | | | | | 51,000 | | | $ | 1,276 | |
Currency Option USD vs MXN | | Call | | BNP Paribas | | | 11/26/18 | | | | 25.00 | | | | — | | | | | | | | 23,000 | | | | 1,402 | |
Currency Option USD vs RUB | | Call | | Goldman Sachs International | | | 01/11/19 | | | | 95.00 | | | | — | | | | | | | | 33,000 | | | | 8,902 | |
Currency Option USD vs RUB | | Call | | Citibank NA | | | 12/23/19 | | | | 85.00 | | | | — | | | | | | | | 30,000 | | | | 593,502 | |
Currency Option USD vs TRY | | Call | | Morgan Stanley | | | 12/14/18 | | | | 9.00 | | | | — | | | | | | | | 36,000 | | | | 7,464 | |
Currency Option USD vs TRY | | Call | | Goldman Sachs International | | | 12/23/19 | | | | 6.00 | | | | — | | | | | | | | 30,000 | | | | 5,222,082 | |
Currency Option USD vs TRY | | Call | | Morgan Stanley | | | 04/29/20 | | | | 7.00 | | | | — | | | | | | | | 35,000 | | | | 5,096,130 | |
Currency Option USD vs TRY | | Call | | Deutsche Bank AG | | | 06/29/20 | | | | 9.00 | | | | — | | | | | | | | 36,000 | | | | 2,993,824 | |
Currency Option USD vs ZAR | | Call | | BNP Paribas | | | 12/14/18 | | | | 25.00 | | | | — | | | | | | | | 37,000 | | | | 446 | |
Currency Option USD vs ZAR | | Call | | Goldman Sachs International | | | 04/26/19 | | | | 25.00 | | | | — | | | | | | | | 39,000 | | | | 46,538 | |
Currency Option USD vs ZAR | | Call | | Morgan Stanley | | | 12/24/19 | | | | 14.00 | | | | — | | | | | | | | 30,000 | | | | 3,797,618 | |
Currency Option USD vs ZAR | | Call | | BNP Paribas | | | 12/24/19 | | | | 17.00 | | | | — | | | | | | | | 60,000 | | | | 3,111,222 | |
Currency Option USD vs ZAR | | Call | | Goldman Sachs International | | | 09/28/20 | | | | 17.00 | | | | — | | | | | | | | 39,000 | | | | 3,340,438 | |
Currency Option AUD vs JPY | | Put | | Deutsche Bank AG | | | 11/27/18 | | | | 60.00 | | | | — | | | | AUD | | | | 180,000 | | | | 71 | |
Currency Option AUD vs JPY | | Put | | Morgan Stanley | | | 01/29/20 | | | | 82.00 | | | | — | | | | AUD | | | | 180,000 | | | | 10,432,068 | |
Currency Option AUD vs JPY | | Put | | Deutsche Bank AG | | | 01/29/20 | | | | 73.00 | | | | — | | | | AUD | | | | 360,000 | | | | 7,796,534 | |
Currency Option AUD vs JPY | | Put | | Deutsche Bank AG | | | 02/26/20 | | | | 76.00 | | | | — | | | | AUD | | | | 180,000 | | | | 5,738,012 | |
Currency Option AUD vs USD | | Put | | Citibank NA | | | 01/29/20 | | | | 0.69 | | | | — | | | | AUD | | | | 38,000 | | | | 800,375 | |
Currency Option EUR vs TRY | | Put | | JPMorgan Chase | | | 02/26/19 | | | | 4.60 | | | | — | | | | EUR | | | | 24,000 | | | | 1,194 | |
Currency Option EUR vs TRY | | Put | | Goldman Sachs International | | | 04/28/20 | | | | 6.00 | | | | — | | | | EUR | | | | 30,000 | | | | 189,708 | |
Currency Option EUR vs TRY | | Put | | BNP Paribas | | | 07/28/20 | | | | 7.00 | | | | — | | | | EUR | | | | 30,000 | | | | 557,731 | |
See Notes to Financial Statements.
Options Purchased (continued):
OTC Traded
| | | | | | | | | | | | | | | | | | | | | | | | | | | | |
Description | | Call/
Put | | Counterparty | | Expiration
Date | | | Strike | | | Contracts | | | Notional
Amount
(000)# | | | Value | |
Currency Option GBP vs USD | | Put | | Hong Kong & Shanghai Bank | | | 04/25/19 | | | | 1.00 | | | | — | | | | GBP | | | | 31,500 | | | $ | 34,798 | |
Currency Option GBP vs USD | | Put | | Hong Kong & Shanghai Bank | | | 09/28/20 | | | | 1.28 | | | | — | | | | GBP | | | | 31,500 | | | | 1,688,689 | |
Currency Option USD vs BRL | | Put | | JPMorgan Chase | | | 03/27/20 | | | | 3.10 | | | | — | | | | | | | | 30,000 | | | | 149,362 | |
Currency Option USD vs BRL | | Put | | Deutsche Bank AG | | | 06/26/20 | | | | 3.50 | | | | — | | | | | | | | 36,000 | | | | 881,335 | |
Currency Option USD vs BRL | | Put | | Deutsche Bank AG | | | 06/26/20 | | | | 3.50 | | | | — | | | | | | | | 1,000 | | | | 24,482 | |
Currency Option USD vs BRL | | Put | | Deutsche Bank AG | | | 08/27/20 | | | | 3.50 | | | | — | | | | | | | | 37,000 | | | | 935,369 | |
Currency Option USD vs BRL | | Put | | Morgan Stanley | | | 08/27/20 | | | | 3.25 | | | | — | | | | | | | | 37,000 | | | | 422,169 | |
Currency Option USD vs CNH | | Put | | Morgan Stanley | | | 06/26/19 | | | | 6.00 | | | | — | | | | | | | | 36,000 | | | | 6,393 | |
Currency Option USD vs INR | | Put | | BNP Paribas | | | 08/27/19 | | | | 69.50 | | | | — | | | | | | | | 37,000 | | | | 70,977 | |
Currency Option USD vs JPY | | Put | | Morgan Stanley | | | 01/07/19 | | | | 91.00 | | | | — | | | | | | | | 37,000 | | | | 957 | |
Currency Option USD vs MXN | | Put | | BNP Paribas | | | 08/27/19 | | | | 17.00 | | | | — | | | | | | | | 23,000 | | | | 35,212 | |
Currency Option USD vs MXN | | Put | | Citibank NA | | | 04/28/20 | | | | 17.00 | | | | — | | | | | | | | 51,000 | | | | 180,094 | |
Currency Option USD vs TRY | | Put | | Goldman Sachs International | | | 04/29/20 | | | | 4.00 | | | | — | | | | | | | | 35,000 | | | | 31,063 | |
Currency Option USD vs TRY | | Put | | Morgan Stanley | | | 06/29/20 | | | | 5.00 | | | | — | | | | | | | | 36,000 | | | | 156,259 | |
Currency Option USD vs ZAR | | Put | | BNP Paribas | | | 07/27/20 | | | | 12.00 | | | | — | | | | | | | | 37,000 | | | | 293,288 | |
| | | | | | | | | | | | | | | | | | | | | | | | | | | | |
Total OTC Traded (cost $79,525,330) | | | | | | | | | | | | | | | | | | | | | | $ | 67,521,403 | |
| | | | | | | | | | | | | | | | | | | | | | | | | | | | |
OTC Swaptions
| | | | | | | | | | | | | | | | | | | | | | | | | | |
Description | | Call/
Put | | Counterparty | | Expiration
Date | | | Strike | | | Receive | | | Pay | | Notional
Amount
(000)# | | | Value | |
CDX.NA.HY.31.V1, 12/20/23 | | Call | | Bank of America | | | 03/20/19 | | | $ | 107.50 | | | | 5.00%(Q) | | | CDX.NA.HY. 31.V1(Q) | | | 22,870 | | | $ | 21,413 | |
See Notes to Financial Statements.
| | | | |
| PGIM Absolute Return Bond Fund | | | 63 | |
Schedule of Investments (continued)
as of October 31, 2018
Options Purchased (continued):
OTC Swaptions
| | | | | | | | | | | | | | | | | | | | | | | | | | |
Description | | Call/
Put | | Counterparty | | Expiration
Date | | | Strike | | | Receive | | | Pay | | Notional
Amount
(000)# | | | Value | |
CDX.NA.HY.31.V1, 12/20/23 | | Call | | Deutsche Bank AG | | | 03/20/19 | | | | $107.50 | | | | 5.00%(Q) | | | CDX.NA.HY. 31.V1(Q) | | | 30,130 | | | $ | 28,210 | |
CDX.NA.HY.31.V1, 12/20/23 | | Call | | Bank of America | | | 03/20/19 | | | | $106.50 | | | | 5.00%(Q) | | | CDX.NA.HY. 31.V1(Q) | | | 24,350 | | | | 55,068 | |
| | | | | | | | | | | | | | | | | | | | | | | | | | |
Total OTC Swaptions (cost $110,147) | | | | | | | | | | | | | | | | | | | | $ | 104,691 | |
| | | | | | | | | | | | | | | | | | | | | | | | | | |
Total Options Purchased (cost $79,635,477) | | | | | | | | | | | | | | | | | $ | 67,626,094 | |
| | | | | | | | | | | | | | | | | | | | | | | | | | |
Options Written:
OTC Traded
| | | | | | | | | | | | | | | | | | | | | | | | | | | | |
Description | | Call/
Put | | Counterparty | | Expiration
Date | | | Strike | | | Contracts | | | Notional
Amount
(000)# | | | Value | |
Currency Option EUR vs TRY | | Call | | Morgan Stanley | | | 11/28/18 | | | | 10.00 | | | | — | | | | EUR | | | | 30,000 | | | $ | (640 | ) |
Currency Option EUR vs TRY | | Call | | Goldman Sachs International | | | 04/28/20 | | | | 10.00 | | | | — | | | | EUR | | | | 30,000 | | | | (2,945,733 | ) |
Currency Option EUR vs TRY | | Call | | BNP Paribas | | | 07/28/20 | | | | 12.00 | | | | — | | | | EUR | | | | 30,000 | | | | (2,405,498 | ) |
Currency Option EUR vs ZAR | | Call | | Deutsche Bank AG | | | 12/24/19 | | | | 24.00 | | | | — | | | | EUR | | | | 25,000 | | | | (583,125 | ) |
Currency Option EUR vs ZAR | | Call | | Morgan Stanley | | | 08/27/20 | | | | 28.00 | | | | — | | | | EUR | | | | 34,000 | | | | (963,170 | ) |
Currency Option USD vs BRL | | Call | | JPMorgan Chase | | | 12/20/19 | | | | 5.00 | | | | — | | | | | | | | 30,000 | | | | (381,934 | ) |
Currency Option USD vs BRL | | Call | | JPMorgan Chase | | | 03/27/20 | | | | 4.65 | | | | — | | | | | | | | 30,000 | | | | (768,745 | ) |
Currency Option USD vs BRL | | Call | | Deutsche Bank AG | | | 07/27/20 | | | | 6.50 | | | | — | | | | | | | | 74,000 | | | | (612,390 | ) |
Currency Option USD vs BRL | | Call | | Deutsche Bank AG | | | 08/27/20 | | | | 8.50 | | | | — | | | | | | | | 37,000 | | | | (130,639 | ) |
Currency Option USD vs CAD | | Call | | Bank of America | | | 07/30/19 | | | | 1.40 | | | | — | | | | | | | | 60,000 | | | | (411,075 | ) |
Currency Option USD vs CNH | | Call | | Morgan Stanley | | | 06/26/20 | | | | 7.75 | | | | — | | | | | | | | 72,000 | | | | (1,019,654 | ) |
Currency Option USD vs INR | | Call | | BNP Paribas | | | 08/27/19 | | | | 82.50 | | | | — | | | | | | | | 37,000 | | | | (388,363 | ) |
Currency Option USD vs KRW | | Call | | Goldman Sachs International | | | 12/20/19 | | | | 1,350.00 | | | | — | | | | | | | | 60,000 | | | | (463,568 | ) |
Currency Option USD vs KRW | | Call | | BNP Paribas | | | 12/20/19 | | | | 1,200.00 | | | | — | | | | | | | | 30,000 | | | | (618,239 | ) |
See Notes to Financial Statements.
Options Written (continued):
OTC Traded
| | | | | | | | | | | | | | | | | | | | | | | | | | | | |
Description | | Call/
Put | | Counterparty | | Expiration
Date | | | Strike | | | Contracts | | | Notional
Amount
(000)# | | | Value | |
Currency Option USD vs MXN | | Call | | BNP Paribas | | | 08/27/19 | | | | 25.00 | | | | — | | | | | | | | 23,000 | | | $ | (353,915 | ) |
Currency Option USD vs MXN | | Call | | Citibank NA | | | 04/28/20 | | | | 26.00 | | | | — | | | | | | | | 51,000 | | | | (1,480,585 | ) |
Currency Option USD vs RUB | | Call | | Goldman Sachs International | | | 12/23/19 | | | | 85.00 | | | | — | | | | | | | | 30,000 | | | | (593,502 | ) |
Currency Option USD vs RUB | | Call | | Citibank NA | | | 03/30/20 | | | | 95.00 | | | | — | | | | | | | | 33,000 | | | | (525,835 | ) |
Currency Option USD vs TRY | | Call | | Deutsche Bank AG | | | 12/14/18 | | | | 9.00 | | | | — | | | | | | | | 36,000 | | | | (7,464 | ) |
Currency Option USD vs TRY | | Call | | BNP Paribas | | | 12/23/19 | | | | 6.00 | | | | — | | | | | | | | 30,000 | | | | (5,222,082 | ) |
Currency Option USD vs TRY | | Call | | Goldman Sachs International | | | 04/29/20 | | | | 7.00 | | | | — | | | | | | | | 35,000 | | | | (5,096,130 | ) |
Currency Option USD vs TRY | | Call | | Morgan Stanley | | | 06/29/20 | | | | 9.00 | | | | — | | | | | | | | 36,000 | | | | (2,993,824 | ) |
Currency Option USD vs ZAR | | Call | | Morgan Stanley | | | 12/24/19 | | | | 17.00 | | | | — | | | | | | | | 60,000 | | | | (3,111,222 | ) |
Currency Option USD vs ZAR | | Call | | BNP Paribas | | | 12/24/19 | | | | 14.00 | | | | — | | | | | | | | 30,000 | | | | (3,797,618 | ) |
Currency Option USD vs ZAR | | Call | | BNP Paribas | | | 07/27/20 | | | | 25.00 | | | | — | | | | | | | | 37,000 | | | | (771,422 | ) |
Currency Option USD vs ZAR | | Call | | Goldman Sachs International | | | 09/28/20 | | | | 21.00 | | | | — | | | | | | | | 78,000 | | | | (3,287,616 | ) |
Currency Option AUD vs JPY | | Put | | Morgan Stanley | | | 01/29/20 | | | | 73.00 | | | | — | | | | AUD | | | | 360,000 | | | | (7,796,534 | ) |
Currency Option AUD vs JPY | | Put | | Deutsche Bank AG | | | 01/29/20 | | | | 82.00 | | | | — | | | | AUD | | | | 180,000 | | | | (10,432,068 | ) |
Currency Option AUD vs JPY | | Put | | Deutsche Bank AG | | | 02/26/20 | | | | 67.00 | | | | — | | | | AUD | | | | 360,000 | | | | (4,369,981 | ) |
Currency Option AUD vs USD | | Put | | Morgan Stanley | | | 01/29/20 | | | | 0.69 | | | | — | | | | AUD | | | | 38,000 | | | | (800,375 | ) |
Currency Option EUR vs TRY | | Put | | Morgan Stanley | | | 04/28/20 | | | | 6.00 | | | | — | | | | EUR | | | | 30,000 | | | | (189,708 | ) |
Currency Option EUR vs TRY | | Put | | Morgan Stanley | | | 07/28/20 | | | | 7.00 | | | | — | | | | EUR | | | | 30,000 | | | | (557,731 | ) |
Currency Option GBP vs USD | | Put | | Hong Kong & Shanghai Bank | | | 09/28/20 | | | | 1.16 | | | | — | | | | GBP | | | | 63,000 | | | | (1,535,000 | ) |
Currency Option USD vs BRL | | Put | | Deutsche Bank AG | | | 03/27/20 | | | | 3.10 | | | | — | | | | | | | | 30,000 | | | | (149,362 | ) |
Currency Option USD vs BRL | | Put | | Morgan Stanley | | | 08/27/20 | | | | 3.50 | | | | — | | | | | | | | 37,000 | | | | (935,369 | ) |
See Notes to Financial Statements.
| | | | |
| PGIM Absolute Return Bond Fund | | | 65 | |
Schedule of Investments (continued)
as of October 31, 2018
Options Written (continued):
OTC Traded
| | | | | | | | | | | | | | | | | | | | | | | | | | | | |
Description | | Call/
Put | | Counterparty | | Expiration
Date | | | Strike | | | Contracts | | | Notional
Amount
(000)# | | | Value | |
Currency Option USD vs JPY | | Put | | Morgan Stanley | | | 01/27/21 | | | | 91.00 | | | | — | | | | | | | | 37,000 | | | $ | (574,799 | ) |
Currency Option USD vs TRY | | Put | | Deutsche Bank AG | | | 04/29/20 | | | | 4.00 | | | | — | | | | | | | | 35,000 | | | | (31,063 | ) |
Currency Option USD vs TRY | | Put | | Deutsche Bank AG | | | 06/29/20 | | | | 5.00 | | | | — | | | | | | | | 36,000 | | | | (156,259 | ) |
Hellenic Republic, 3.75%, 01/30/28^ | | Put | | Deutsche Bank AG | | | 09/10/20 | | | | 87.00 | | | | — | | | | EUR | | | | 5,000 | | | | (30,885 | ) |
Lebanese Republic, 8.25%, 04/12/21^ | | Put | | Deutsche Bank AG | | | 04/08/19 | | | | $66.00 | | | | — | | | | | | | | 9,170 | | | | (10,687 | ) |
| | | | | | | | | | | | | | | | | | | | | | | | | | | | |
Total OTC Traded (premiums received $65,434,751) | | | | | | | | | | | | | | | $ | (66,503,809 | ) |
| | | | | | | | | | | | | | | | | | | | | | | | | | | | |
OTC Swaptions
| | | | | | | | | | | | | | | | | | | | | | | | |
Description | | Call/
Put | | Counterparty | | Expiration
Date | | | Strike | | | Receive | | Pay | | Notional
Amount
(000)# | | | Value | |
CDX.NA.HY.31.V1, 12/20/23 | | Put | | BNP Paribas | | | 11/21/18 | | | $ | 101.00 | | | 5.00%(Q) | | CDX.NA.HY. 31.V1(Q) | | | 23,500 | | | $ | (13,894 | ) |
CDX.NA.HY.31.V1, 12/20/23 | | Put | | Credit Suisse International | | | 11/21/18 | | | $ | 100.00 | | | 5.00%(Q) | | CDX.NA.HY. 31.V1(Q) | | | 34,570 | | | | (16,224 | ) |
CDX.NA.HY.31.V1, 12/20/23 | | Put | | Citibank NA | | | 01/16/19 | | | $ | 94.00 | | | 5.00%(Q) | | CDX.NA.HY. 31.V1(Q) | | | 23,500 | | | | (19,657 | ) |
CDX.NA.HY.31.V1, 12/20/23 | | Put | | BNP Paribas | | | 01/16/19 | | | $ | 97.00 | | | 5.00%(Q) | | CDX.NA.HY. 31.V1(Q) | | | 11,580 | | | | (23,516 | ) |
CDX.NA.HY.31.V1, 12/20/23 | | Put | | BNP Paribas | | | 01/16/19 | | | $ | 101.00 | | | 5.00%(Q) | | CDX.NA.HY. 31.V1(Q) | | | 11,580 | | | | (53,023 | ) |
CDX.NA.HY.31.V1, 12/20/23 | | Put | | Deutsche Bank AG | | | 01/16/19 | | | $ | 98.00 | | | 5.00%(Q) | | CDX.NA.HY. 31.V1(Q) | | | 6,640 | | | | (16,356 | ) |
CDX.NA.HY.31.V1, 12/20/23 | | Put | | Goldman Sachs International | | | 02/20/19 | | | $ | 102.00 | | | 5.00%(Q) | | CDX.NA.HY. 31.V1(Q) | | | 4,430 | | | | (40,409 | ) |
CDX.NA.HY.31.V1, 12/20/23 | | Put | | Goldman Sachs International | | | 03/20/19 | | | $ | 99.00 | | | 5.00%(Q) | | CDX.NA.HY. 31.V1(Q) | | | 11,070 | | | | (78,533 | ) |
CDX.NA.HY.31.V1, 12/20/23 | | Put | | Barclays Bank PLC | | | 03/20/19 | | | $ | 100.00 | | | 5.00%(Q) | | CDX.NA.HY. 31.V1(Q) | | | 11,070 | | | | (92,680 | ) |
CDX.NA.HY.31.V1, 12/20/23 | | Put | | Deutsche Bank AG | | | 03/20/19 | | | $ | 98.00 | | | 5.00%(Q) | | CDX.NA.HY. 31.V1(Q) | | | 30,130 | | | | (181,352 | ) |
CDX.NA.HY.31.V1, 12/20/23 | | Put | | Bank of America | | | 03/20/19 | | | $ | 98.00 | | | 5.00%(Q) | | CDX.NA.HY. 31.V1(Q) | | | 22,870 | | | | (137,654 | ) |
iTraxx.XO.30.V1, 12/20/23 | | Put | | Citibank NA | | | 03/20/19 | | | | 400.00 | | | 5.00%(Q) | | iTraxx.XO. 30.V1(Q) | | | EUR 14,100 | | | | (104,710 | ) |
See Notes to Financial Statements.
Options Written (continued):
OTC Swaptions
| | | | | | | | | | | | | | | | | | | | | | | | |
Description | | Call/
Put | | Counterparty | | Expiration
Date | | | Strike | | | Receive | | Pay | | Notional
Amount
(000)# | | | Value | |
iTraxx.XO.30.V1, 12/20/23 | | Put | | Citibank NA | | | 03/20/19 | | | | 400.00 | | | 5.00%(Q) | | iTraxx.XO. 30.V1(Q) | | | EUR 25,000 | | | $ | (185,656 | ) |
| | | | | | | | | | | | | | | | | | | | | | | | |
| Total OTC Swaptions (premiums received $959,627) | | | | | | $ | (963,664 | ) |
| | | | | | | | | | | | | | | | | | | | | | | | |
| Total Options Written (premiums received $66,394,378) | | | | | | $ | (67,467,473 | ) |
| | | | | | | | | | | | | | | | | | | | | | |
Futures contracts outstanding at October 31, 2018:
| | | | | | | | | | | | | | | | |
Number of
Contracts | | | Type | | Expiration
Date | | | Current
Notional
Amount | | | Value /
Unrealized
Appreciation
(Depreciation) | |
| | Long Positions: | | | | | | | | | | | | |
| | 522 | | | 90 Day Euro Dollar | | | Dec. 2020 | | | $ | 126,317,475 | | | $ | (357,336 | ) |
| | 3,580 | | | 5 Year U.S. Treasury Notes | | | Dec. 2018 | | | | 402,330,469 | | | | (2,499,220 | ) |
| | 10,425 | | | 10 Year U.S. Treasury Notes | | | Dec. 2018 | | | | 1,234,710,937 | | | | (11,310,371 | ) |
| | 165 | | | 30 Year U.S. Ultra Treasury Bonds | | | Dec. 2018 | | | | 24,621,094 | | | | (669,848 | ) |
| | | | | | | | | | | | | | | | |
| | | | | | | | | | | | | | | (14,836,775 | ) |
| | | | | | | | | | | | | | | | |
| | Short Positions: | | | | | | | | | | | | |
| | 522 | | | 90 Day Euro Dollar | | | Dec. 2021 | | | | 126,363,150 | | | | 244,239 | |
| | 998 | | | 2 Year U.S. Treasury Notes | | | Dec. 2018 | | | | 210,234,938 | | | | (177,910 | ) |
| | 240 | | | 5 Year Euro-Bobl | | | Dec. 2018 | | | | 35,729,932 | | | | 27,902 | |
| | 735 | | | 20 Year U.S. Treasury Notes | | | Dec. 2018 | | | | 101,521,875 | | | | 4,734,866 | |
| | 327 | | | Euro Schatz. DUA Index | | | Dec. 2018 | | | | 41,472,692 | | | | (3,996 | ) |
| | | | | | | | | | | | | | | | |
| | | | | | | | | | | | | | | 4,825,101 | |
| | | | | | | | | | | | | | | | |
| | | | | | | | | | | | | | $ | (10,011,674 | ) |
| | | | | | | | | | | | | | | | |
Forward foreign currency exchange contracts outstanding at October 31, 2018:
| | | | | | | | | | | | | | | | | | | | | | | | | | |
Purchase Contracts | | Counterparty | | Notional
Amount
(000) | | | Value at
Settlement
Date | | | Current
Value | | | Unrealized
Appreciation | | | Unrealized
Depreciation | |
OTC Forward Foreign Currency Exchange Contracts: | | | | | |
Australian Dollar, | | | | | | | | | | | | | | | | | | | | | | | | | | |
Expiring 01/18/19 | | Morgan Stanley | | | AUD | | | | 3,395 | | | $ | 2,416,000 | | | $ | 2,406,873 | | | $ | — | | | $ | (9,127 | ) |
Expiring 01/18/19 | | Toronto Dominion | | | AUD | | | | 4,173 | | | | 2,980,000 | | | | 2,958,267 | | | | — | | | | (21,733 | ) |
Expiring 01/18/19 | | Toronto Dominion | | | AUD | | | | 3,433 | | | | 2,452,000 | | | | 2,433,494 | | | | — | | | | (18,506 | ) |
Expiring 01/18/19 | | Toronto Dominion | | | AUD | | | | 2,181 | | | | 1,555,000 | | | | 1,546,284 | | | | — | | | | (8,716 | ) |
See Notes to Financial Statements.
| | | | |
| PGIM Absolute Return Bond Fund | | | 67 | |
Schedule of Investments (continued)
as of October 31, 2018
Forward foreign currency exchange contracts outstanding at October 31, 2018 (continued):
| | | | | | | | | | | | | | | | | | | | | | |
Purchase Contracts | | Counterparty | | Notional
Amount
(000) | | | Value at
Settlement
Date | | | Current
Value | | | Unrealized
Appreciation | | | Unrealized
Depreciation | |
OTC Forward Foreign Currency Exchange Contracts (cont’d.): | | | | | | | | | | | | | |
Australian Dollar (cont’d.), | | | | | | | | | | | | | | | | | | | | | | |
Expiring 01/31/19 | | Deutsche Bank AG | | AUD | 1,233 | | | $ | 875,000 | | | $ | 874,310 | | | $ | — | | | $ | (690 | ) |
Expiring 01/31/19 | | JPMorgan Chase | | AUD | 3,176 | | | | 2,254,000 | | | | 2,251,973 | | | | — | | | | (2,027 | ) |
Expiring 01/31/19 | | UBS AG | | AUD | 2,053 | | | | 1,454,000 | | | | 1,455,650 | | | | 1,650 | | | | — | |
Expiring 01/31/19 | | UBS AG | | AUD | 1,121 | | | | 792,000 | | | | 794,598 | | | | 2,598 | | | | — | |
Expiring 08/29/19 | | Morgan Stanley | | AUD | 8,920 | | | | 6,333,799 | | | | 6,351,957 | | | | 18,158 | | | | — | |
Expiring 01/31/20 | | Citibank NA | | AUD | 7,067 | | | | 5,269,724 | | | | 5,051,697 | | | | — | | | | (218,027 | ) |
Expiring 01/31/20 | | Citibank NA | | AUD | 5,351 | | | | 4,288,399 | | | | 3,825,151 | | | | — | | | | (463,248 | ) |
Expiring 11/30/20 | | Morgan Stanley | | AUD | 3,823 | | | | 2,744,881 | | | | 2,752,826 | | | | 7,945 | | | | — | |
Brazilian Real, | | | | | | | | | | | | | | | | | | | | | | |
Expiring 12/04/18 | | Barclays Bank PLC | | BRL | 3,495 | | | | 947,000 | | | | 936,151 | | | | — | | | | (10,849 | ) |
Expiring 12/04/18 | | Hong Kong &
Shanghai Bank | | BRL | 4,372 | | | | 1,117,550 | | | | 1,170,894 | | | | 53,344 | | | | — | |
Expiring 12/04/18 | | JPMorgan Chase | | BRL | 5,519 | | | | 1,482,000 | | | | 1,478,120 | | | | — | | | | (3,880 | ) |
Expiring 12/04/18 | | Morgan Stanley | | BRL | 6,510 | | | | 1,603,193 | | | | 1,743,438 | | | | 140,245 | | | | — | |
Expiring 12/14/18 | | Citibank NA | | BRL | 5,925 | | | | 1,414,000 | | | | 1,585,769 | | | | 171,769 | | | | — | |
Expiring 01/31/19 | | UBS AG | | BRL | 6,025 | | | | 1,611,000 | | | | 1,606,067 | | | | — | | | | (4,933 | ) |
Expiring 02/25/19 | | Citibank NA | | BRL | 9,857 | | | | 2,917,999 | | | | 2,622,431 | | | | — | | | | (295,568 | ) |
Expiring 09/30/19 | | JPMorgan Chase | | BRL | 10,454 | | | | 2,980,000 | | | | 2,723,551 | | | | — | | | | (256,449 | ) |
Expiring 09/30/19 | | JPMorgan Chase | | BRL | 1,958 | | | | 481,439 | | | | 510,186 | | | | 28,747 | | | | — | |
Expiring 12/24/19 | | Citibank NA | | BRL | 7,836 | | | | 2,004,000 | | | | 2,021,156 | | | | 17,156 | | | | — | |
Expiring 12/24/19 | | Deutsche Bank AG | | BRL | 22,576 | | | | 5,602,000 | | | | 5,823,360 | | | | 221,360 | | | | — | |
Expiring 03/31/20 | | Deutsche Bank AG | | BRL | 42,866 | | | | 10,500,000 | | | | 10,923,431 | | | | 423,431 | | | | — | |
Expiring 06/30/20 | | Deutsche Bank AG | | BRL | 47,619 | | | | 10,804,000 | | | | 11,996,587 | | | | 1,192,587 | | | | — | |
Expiring 06/30/20 | | Morgan Stanley | | BRL | 3,245 | | | | 796,000 | | | | 817,588 | | | | 21,588 | | | | — | |
Expiring 08/31/20 | | Morgan Stanley | | BRL | 14,942 | | | | 3,669,000 | | | | 3,734,779 | | | | 65,779 | | | | — | |
British Pound, | | | | | | | | | | | | | | | | | | | | | | |
Expiring 01/25/19 | | Toronto Dominion | | GBP | 1,662 | | | | 2,139,000 | | | | 2,135,036 | | | | — | | | | (3,964 | ) |
Expiring 01/25/19 | | Toronto Dominion | | GBP | 1,424 | | | | 1,828,000 | | | | 1,828,995 | | | | 995 | | | | — | |
Expiring 01/25/19 | | Toronto Dominion | | GBP | 674 | | | | 875,000 | | | | 866,155 | | | | — | | | | (8,845 | ) |
See Notes to Financial Statements.
Forward foreign currency exchange contracts outstanding at October 31, 2018 (continued):
| | | | | | | | | | | | | | | | | | | | | | |
Purchase Contracts | | Counterparty | | Notional
Amount
(000) | | | Value at
Settlement
Date | | | Current
Value | | | Unrealized
Appreciation | | | Unrealized
Depreciation | |
OTC Forward Foreign Currency Exchange Contracts (cont’d.): | | | | | | | | | | | | | |
Canadian Dollar, | | | | | | | | | | | | | | | | | | | | | | |
Expiring 01/18/19 | | Citibank NA | | CAD | 7,526 | | | $ | 5,785,654 | | | $ | 5,726,322 | | | $ | — | | | $ | (59,332 | ) |
Expiring 01/18/19 | | Citibank NA | | CAD | 6,737 | | | | 5,172,500 | | | | 5,126,006 | | | | — | | | | (46,494 | ) |
Expiring 01/18/19 | | Goldman Sachs
International | | CAD | 7,787 | | | | 5,953,300 | | | | 5,925,223 | | | | — | | | | (28,077 | ) |
Expiring 01/18/19 | | Toronto Dominion | | CAD | 3,032 | | | | 2,318,000 | | | | 2,307,239 | | | | — | | | | (10,761 | ) |
Expiring 01/18/19 | | Toronto Dominion | | CAD | 2,934 | | | | 2,241,000 | | | | 2,232,377 | | | | — | | | | (8,623 | ) |
Expiring 01/18/19 | | Toronto Dominion | | CAD | 2,617 | | | | 2,002,999 | | | | 1,991,503 | | | | — | | | | (11,496 | ) |
Expiring 01/18/19 | | Toronto Dominion | | CAD | 2,150 | | | | 1,645,000 | | | | 1,636,074 | | | | — | | | | (8,926 | ) |
Expiring 01/18/19 | | Toronto Dominion | | CAD | 1,835 | | | | 1,400,000 | | | | 1,396,595 | | | | — | | | | (3,405 | ) |
Expiring 01/31/19 | | Toronto Dominion | | CAD | 1,322 | | | | 1,010,495 | | | | 1,006,110 | | | | — | | | | (4,385 | ) |
Expiring 01/31/19 | | UBS AG | | CAD | 633 | | | | 483,000 | | | | 481,739 | | | | — | | | | (1,261 | ) |
Expiring 07/31/19 | | Bank of America | | CAD | 2,377 | | | | 1,918,000 | | | | 1,813,652 | | | | — | | | | (104,348 | ) |
Expiring 07/31/19 | | JPMorgan Chase | | CAD | 2,483 | | | | 1,904,400 | | | | 1,894,566 | | | | — | | | | (9,834 | ) |
Chilean Peso, | | | | | | | | | | | | | | | | | | | | | | |
Expiring 12/19/18 | | JPMorgan Chase | | CLP | 1,693,931 | | | | 2,536,500 | | | | 2,435,664 | | | | — | | | | (100,836 | ) |
Expiring 12/19/18 | | Morgan Stanley | | CLP | 1,226,381 | | | | 1,758,000 | | | | 1,763,385 | | | | 5,385 | | | | — | |
Expiring 12/19/18 | | Morgan Stanley | | CLP | 588,875 | | | | 875,000 | | | | 846,730 | | | | — | | | | (28,270 | ) |
Expiring 12/19/18 | | Morgan Stanley | | CLP | 572,697 | | | | 867,000 | | | | 823,468 | | | | — | | | | (43,532 | ) |
Expiring 12/19/18 | | Morgan Stanley | | CLP | 397,680 | | | | 597,028 | | | | 571,815 | | | | — | | | | (25,213 | ) |
Expiring 12/19/18 | | UBS AG | | CLP | 1,619,750 | | | | 2,356,000 | | | | 2,329,001 | | | | — | | | | (26,999 | ) |
Expiring 12/19/18 | | UBS AG | | CLP | 1,287,036 | | | | 1,925,000 | | | | 1,850,599 | | | | — | | | | (74,401 | ) |
Chinese Renminbi, | | | | | | | | | | | | | | | | | | | | | | |
Expiring 06/28/19 | | Citibank NA | | CNH | 7,363 | | | | 1,051,104 | | | | 1,046,131 | | | | — | | | | (4,973 | ) |
Expiring 02/28/20 | | Citibank NA | | CNH | 10,395 | | | | 1,476,014 | | | | 1,478,651 | | | | 2,637 | | | | — | |
Expiring 02/28/20 | | Morgan Stanley | | CNH | 52,459 | | | | 8,078,000 | | | | 7,462,265 | | | | — | | | | (615,735 | ) |
Colombian Peso, | | | | | | | | | | | | | | | | | | | | | | |
Expiring 12/14/18 | | Citibank NA | | COP | 7,156,241 | | | | 2,265,350 | | | | 2,218,485 | | | | — | | | | (46,865 | ) |
Expiring 12/14/18 | | JPMorgan Chase | | COP | 6,863,810 | | | | 2,145,363 | | | | 2,127,829 | | | | — | | | | (17,534 | ) |
Czech Koruna, | | | | | | | | | | | | | | | | | | | | | | |
Expiring 01/25/19 | | JPMorgan Chase | | CZK | 21,362 | | | | 957,000 | | | | 940,407 | | | | — | | | | (16,593 | ) |
Expiring 01/25/19 | | UBS AG | | CZK | 50,511 | | | | 2,262,000 | | | | 2,223,669 | | | | — | | | | (38,331 | ) |
See Notes to Financial Statements.
| | | | |
| PGIM Absolute Return Bond Fund | | | 69 | |
Schedule of Investments (continued)
as of October 31, 2018
Forward foreign currency exchange contracts outstanding at October 31, 2018 (continued):
| | | | | | | | | | | | | | | | | | | | | | |
Purchase Contracts | | Counterparty | | Notional
Amount
(000) | | | Value at
Settlement
Date | | | Current
Value | | | Unrealized
Appreciation | | | Unrealized
Depreciation | |
OTC Forward Foreign Currency Exchange Contracts (cont’d.): | | | | | | | | | |
Euro, | | | | | | | | | | | | | | | | | | | | | | |
Expiring 01/31/19 | | Deutsche Bank AG | | EUR | 524 | | | $ | 599,000 | | | $ | 599,083 | | | $ | 83 | | | $ | — | |
Expiring 02/25/19 | | Citibank NA | | EUR | 575 | | | | 681,145 | | | | 658,467 | | | | — | | | | (22,678 | ) |
Expiring 01/31/20 | | Morgan Stanley | | EUR | 4,298 | | | | 5,216,483 | | | | 5,084,398 | | | | — | | | | (132,085 | ) |
Expiring 02/28/20 | | Bank of America | | EUR | 5,226 | | | | 6,837,176 | | | | 6,199,024 | | | | — | | | | (638,152 | ) |
Expiring 02/28/20 | | Morgan Stanley | | EUR | 4,622 | | | | 5,622,447 | | | | 5,482,355 | | | | — | | | | (140,092 | ) |
Indian Rupee, | | | | | | | | | | | | | | | | | | | | | | |
Expiring 01/11/19 | | Citibank NA | | INR | 137,371 | | | | 1,837,000 | | | | 1,841,660 | | | | 4,660 | | | | — | |
Expiring 01/11/19 | | Goldman Sachs
International | | INR | 305,729 | | | | 4,081,277 | | | | 4,098,744 | | | | 17,467 | | | | — | |
Expiring 01/11/19 | | Goldman Sachs
International | | INR | 292,275 | | | | 3,923,423 | | | | 3,918,385 | | | | — | | | | (5,038 | ) |
Expiring 01/11/19 | | JPMorgan Chase | | INR | 1,137,918 | | | | 15,276,112 | | | | 15,255,474 | | | | — | | | | (20,638 | ) |
Expiring 01/11/19 | | JPMorgan Chase | | INR | 917,186 | | | | 12,192,563 | | | | 12,296,233 | | | | 103,670 | | | | — | |
Expiring 01/31/19 | | Hong Kong &
Shanghai Bank | | INR | 46,830 | | | | 631,000 | | | | 626,340 | | | | — | | | | (4,660 | ) |
Expiring 01/31/19 | | JPMorgan Chase | | INR | 40,233 | | | | 539,200 | | | | 538,109 | | | | — | | | | (1,091 | ) |
Indonesian Rupiah, | | | | | | | | | | | | | | | | | | | | | | |
Expiring 12/14/18 | | Citibank NA | | IDR | 32,585,927 | | | | 2,123,000 | | | | 2,130,794 | | | | 7,794 | | | | — | |
Expiring 12/19/18 | | Barclays Bank PLC | | IDR | 198,645,824 | | | | 13,029,972 | | | | 12,979,717 | | | | — | | | | (50,255 | ) |
Expiring 12/19/18 | | Barclays Bank PLC | | IDR | 140,295,130 | | | | 9,268,970 | | | | 9,167,024 | | | | — | | | | (101,946 | ) |
Expiring 12/19/18 | | Barclays Bank PLC | | IDR | 40,327,504 | | | | 2,632,000 | | | | 2,635,039 | | | | 3,039 | | | | — | |
Expiring 12/19/18 | | Barclays Bank PLC | | IDR | 28,847,996 | | | | 1,884,000 | | | | 1,884,957 | | | | 957 | | | | — | |
Expiring 12/19/18 | | Citibank NA | | IDR | 21,360,196 | | | | 1,396,000 | | | | 1,395,697 | | | | — | | | | (303 | ) |
Expiring 12/19/18 | | JPMorgan Chase | | IDR | 115,584,926 | | | | 7,612,235 | | | | 7,552,435 | | | | — | | | | (59,800 | ) |
Expiring 12/19/18 | | JPMorgan Chase | | IDR | 26,398,403 | | | | 1,730,475 | | | | 1,724,898 | | | | — | | | | (5,577 | ) |
Expiring 12/19/18 | | Morgan Stanley | | IDR | 36,463,460 | | | | 2,354,000 | | | | 2,382,559 | | | | 28,559 | | | | — | |
Expiring 12/19/18 | | Morgan Stanley | | IDR | 15,335,320 | | | | 1,001,000 | | | | 1,002,025 | | | | 1,025 | | | | — | |
Expiring 12/19/18 | | UBS AG | | IDR | 20,353,652 | | | | 1,331,000 | | | | 1,329,928 | | | | — | | | | (1,072 | ) |
Israeli Shekel, | | | | | | | | | | | | | | | | | | | | | | |
Expiring 01/28/19 | | Barclays Bank PLC | | ILS | 1,918 | | | | 519,500 | | | | 519,431 | | | | — | | | | (69 | ) |
See Notes to Financial Statements.
Forward foreign currency exchange contracts outstanding at October 31, 2018 (continued):
| | | | | | | | | | | | | | | | | | | | | | |
Purchase Contracts | | Counterparty | | Notional
Amount
(000) | | | Value at
Settlement
Date | | | Current
Value | | | Unrealized
Appreciation | | | Unrealized
Depreciation | |
OTC Forward Foreign Currency Exchange Contracts (cont’d.): | | | | | | | | | | | | | |
Japanese Yen, | | | | | | | | | | | | | | | | | | | | | | |
Expiring 01/25/19 | | Toronto Dominion | | JPY | 437,459 | | | $ | 3,918,000 | | | $ | 3,907,569 | | | $ | — | | | $ | (10,431 | ) |
Expiring 01/25/19 | | Toronto Dominion | | JPY | 153,441 | | | | 1,371,000 | | | | 1,370,603 | | | | — | | | | (397 | ) |
Expiring 01/25/19 | | UBS AG | | JPY | 153,182 | | | | 1,371,906 | | | | 1,368,284 | | | | — | | | | (3,622 | ) |
Expiring 01/31/19 | | Morgan Stanley | | JPY | 98,119 | | | | 879,000 | | | | 876,874 | | | | — | | | | (2,126 | ) |
Expiring 01/29/21 | | Citibank NA | | JPY | 748,513 | | | | 7,462,000 | | | | 7,176,217 | | | | — | | | | (285,783 | ) |
Expiring 01/29/21 | | Morgan Stanley | | JPY | 992,486 | | | | 9,655,000 | | | | 9,515,253 | | | | — | | | | (139,747 | ) |
Mexican Peso, | | | | | | | | | | | | | | | | | | | | | | |
Expiring 12/19/18 | | Deutsche Bank AG | | MXN | 18,183 | | | | 947,000 | | | | 887,712 | | | | — | | | | (59,288 | ) |
Expiring 12/19/18 | | JPMorgan Chase | | MXN | 17,911 | | | | 938,000 | | | | 874,410 | | | | — | | | | (63,590 | ) |
Expiring 12/19/18 | | UBS AG | | MXN | 17,945 | | | | 933,000 | | | | 876,083 | | | | — | | | | (56,917 | ) |
Expiring 01/29/19 | | UBS AG | | MXN | 40,341 | | | | 2,041,000 | | | | 1,956,112 | | | | — | | | | (84,888 | ) |
Expiring 01/29/19 | | UBS AG | | MXN | 36,769 | | | | 1,859,000 | | | | 1,782,898 | | | | — | | | | (76,102 | ) |
Expiring 08/29/19 | | Morgan Stanley | | MXN | 62,161 | | | | 3,063,738 | | | | 2,911,581 | | | | — | | | | (152,157 | ) |
Expiring 12/24/19 | | Goldman Sachs
International | | MXN | 23,280 | | | | 1,139,332 | | | | 1,071,090 | | | | — | | | | (68,242 | ) |
Expiring 04/30/20 | | Citibank NA | | MXN | 42,285 | | | | 2,048,669 | | | | 1,909,913 | | | | — | | | | (138,756 | ) |
Expiring 04/30/20 | | JPMorgan Chase | | MXN | 13,553 | | | | 665,000 | | | | 612,150 | | | | — | | | | (52,850 | ) |
New Taiwanese Dollar, | | | | | | | | | | | | | | | | | | | | | | |
Expiring 01/11/19 | | Citibank NA | | TWD | 101,497 | | | | 3,305,000 | | | | 3,300,097 | | | | — | | | | (4,903 | ) |
Expiring 01/11/19 | | JPMorgan Chase | | TWD | 105,782 | | | | 3,444,000 | | | | 3,439,451 | | | | — | | | | (4,549 | ) |
Expiring 01/11/19 | | JPMorgan Chase | | TWD | 102,173 | | | | 3,304,000 | | | | 3,322,088 | | | | 18,088 | | | | — | |
Expiring 01/11/19 | | Morgan Stanley | | TWD | 126,348 | | | | 4,088,000 | | | | 4,108,121 | | | | 20,121 | | | | — | |
New Zealand Dollar, | | | | | | | | | | | | | | | | | | | | | | |
Expiring 01/18/19 | | Bank of America | | NZD | 1,939 | | | | 1,262,959 | | | | 1,266,776 | | | | 3,817 | | | | — | |
Expiring 01/18/19 | | Toronto Dominion | | NZD | 3,387 | | | | 2,226,000 | | | | 2,212,543 | | | | — | | | | (13,457 | ) |
Expiring 01/18/19 | | Toronto Dominion | | NZD | 2,462 | | | | 1,625,000 | | | | 1,608,201 | | | | — | | | | (16,799 | ) |
Expiring 01/18/19 | | Toronto Dominion | | NZD | 2,081 | | | | 1,374,000 | | | | 1,359,430 | | | | — | | | | (14,570 | ) |
Expiring 01/18/19 | | Toronto Dominion | | NZD | 1,707 | | | | 1,123,000 | | | | 1,115,081 | | | | — | | | | (7,919 | ) |
Expiring 01/18/19 | | Toronto Dominion | | NZD | 1,652 | | | | 1,076,000 | | | | 1,078,813 | | | | 2,813 | | | | — | |
See Notes to Financial Statements.
| | | | |
| PGIM Absolute Return Bond Fund | | | 71 | |
Schedule of Investments (continued)
as of October 31, 2018
Forward foreign currency exchange contracts outstanding at October 31, 2018 (continued):
| | | | | | | | | | | | | | | | | | | | | | |
Purchase Contracts | | Counterparty | | Notional
Amount
(000) | | | Value at
Settlement
Date | | | Current
Value | | | Unrealized
Appreciation | | | Unrealized
Depreciation | |
OTC Forward Foreign Currency Exchange Contracts (cont’d.): | |
Norwegian Krone, | | | | | | | | | | | | | | | | | | | | | | |
Expiring 01/25/19 | | Bank of America | | NOK | 57,224 | | | $ | 6,963,713 | | | $ | 6,816,955 | | | $ | — | | | $ | (146,758 | ) |
Peruvian Nuevo Sol, | | | | | | | | | | | | | | | | | | | | | | |
Expiring 12/19/18 | | Barclays Bank PLC | | PEN | 4,012 | | | | 1,202,000 | | | | 1,187,755 | | | | — | | | | (14,245 | ) |
Expiring 12/19/18 | | BNP Paribas | | PEN | 33,595 | | | | 10,058,100 | | | | 9,945,157 | | | | — | | | | (112,943 | ) |
Expiring 12/19/18 | | BNP Paribas | | PEN | 33,459 | | | | 10,116,024 | | | | 9,904,805 | | | | — | | | | (211,219 | ) |
Expiring 12/19/18 | | BNP Paribas | | PEN | 4,875 | | | | 1,456,000 | | | | 1,443,271 | | | | — | | | | (12,729 | ) |
Expiring 12/19/18 | | Citibank NA | | PEN | 19,190 | | | | 5,763,590 | | | | 5,680,784 | | | | — | | | | (82,806 | ) |
Expiring 12/19/18 | | JPMorgan Chase | | PEN | 9,822 | | | | 2,959,121 | | | | 2,907,497 | | | | — | | | | (51,624 | ) |
Expiring 12/19/18 | | JPMorgan Chase | | PEN | 9,785 | | | | 2,952,479 | | | | 2,896,688 | | | | — | | | | (55,791 | ) |
Expiring 12/19/18 | | JPMorgan Chase | | PEN | 4,916 | | | | 1,466,000 | | | | 1,455,180 | | | | — | | | | (10,820 | ) |
Philippine Peso, | | | | | | | | | | | | | | | | | | | | | | |
Expiring 12/14/18 | | Barclays Bank PLC | | PHP | 226,873 | | | | 4,155,000 | | | | 4,227,539 | | | | 72,539 | | | | — | |
Expiring 12/14/18 | | Barclays Bank PLC | | PHP | 181,127 | | | | 3,321,000 | | | | 3,375,111 | | | | 54,111 | | | | — | |
Expiring 12/14/18 | | Barclays Bank PLC | | PHP | 162,132 | | | | 2,969,999 | | | | 3,021,159 | | | | 51,160 | | | | — | |
Expiring 12/14/18 | | Barclays Bank PLC | | PHP | 161,622 | | | | 2,968,000 | | | | 3,011,659 | | | | 43,659 | | | | — | |
Expiring 12/14/18 | | Barclays Bank PLC | | PHP | 153,084 | | | | 2,798,000 | | | | 2,852,558 | | | | 54,558 | | | | — | |
Expiring 12/14/18 | | Citibank NA | | PHP | 128,725 | | | | 2,375,000 | | | | 2,398,651 | | | | 23,651 | | | | — | |
Expiring 12/14/18 | | Citibank NA | | PHP | 122,728 | | | | 2,249,000 | | | | 2,286,902 | | | | 37,902 | | | | — | |
Expiring 12/14/18 | | JPMorgan Chase | | PHP | 209,584 | | | | 3,859,000 | | | | 3,905,375 | | | | 46,375 | | | | — | |
Expiring 12/14/18 | | JPMorgan Chase | | PHP | 169,236 | | | | 3,134,000 | | | | 3,153,529 | | | | 19,529 | | | | — | |
Expiring 12/14/18 | | JPMorgan Chase | | PHP | 129,342 | | | | 2,360,000 | | | | 2,410,151 | | | | 50,151 | | | | — | |
Expiring 12/14/18 | | JPMorgan Chase | | PHP | 41,633 | | | | 779,300 | | | | 775,777 | | | | — | | | | (3,523 | ) |
Expiring 12/14/18 | | Morgan Stanley | | PHP | 218,951 | | | | 3,994,000 | | | | 4,079,916 | | | | 85,916 | | | | — | |
Expiring 12/14/18 | | Morgan Stanley | | PHP | 177,492 | | | | 3,268,000 | | | | 3,307,364 | | | | 39,364 | | | | — | |
Expiring 12/14/18 | | Morgan Stanley | | PHP | 167,768 | | | | 3,080,000 | | | | 3,126,167 | | | | 46,167 | | | | — | |
Polish Zloty, | | | | | | | | | | | | | | | | | | | | | | |
Expiring 01/25/19 | | JPMorgan Chase | | PLN | 3,985 | | | | 1,057,000 | | | | 1,041,342 | | | | — | | | | (15,658 | ) |
See Notes to Financial Statements.
Forward foreign currency exchange contracts outstanding at October 31, 2018 (continued):
| | | | | | | | | | | | | | | | | | | | | | |
Purchase Contracts | | Counterparty | | Notional
Amount
(000) | | | Value at
Settlement
Date | | | Current
Value | | | Unrealized
Appreciation | | | Unrealized
Depreciation | |
OTC Forward Foreign Currency Exchange Contracts (cont’d.): | | | | | | | | | | | | | |
Polish Zloty (cont’d.), | | | | | | | | | | | | | | | | | | | | | | |
Expiring 01/25/19 | | Toronto Dominion | | PLN | 3,337 | | | $ | 895,000 | | | $ | 871,926 | | | $ | — | | | $ | (23,074 | ) |
Russian Ruble, | | | | | | | | | | | | | | | | | | | | | | |
Expiring 12/19/18 | | Barclays Bank PLC | | RUB | 145,495 | | | | 2,167,000 | | | | 2,194,980 | | | | 27,980 | | | | — | |
Expiring 12/19/18 | | Barclays Bank PLC | | RUB | 92,346 | | | | 1,409,000 | | | | 1,393,161 | | | | — | | | | (15,839 | ) |
Expiring 12/19/18 | | Barclays Bank PLC | | RUB | 90,697 | | | | 1,375,000 | | | | 1,368,287 | | | | — | | | | (6,713 | ) |
Expiring 12/19/18 | | Barclays Bank PLC | | RUB | 66,987 | | | | 1,016,000 | | | | 1,010,583 | | | | — | | | | (5,417 | ) |
Expiring 12/19/18 | | Barclays Bank PLC | | RUB | 64,067 | | | | 968,000 | | | | 966,539 | | | | — | | | | (1,461 | ) |
Expiring 12/24/19 | | Citibank NA | | RUB | 382,303 | | | | 5,577,000 | | | | 5,520,002 | | | | — | | | | (56,998 | ) |
Expiring 03/31/20 | | Barclays Bank PLC | | RUB | 303,739 | | | | 4,366,582 | | | | 4,337,878 | | | | — | | | | (28,704 | ) |
Saudi Arabian Riyal, | | | | | | | | | | | | | | | | | | | | | | |
Expiring 11/12/19 | | Morgan Stanley | | SAR | 113,400 | | | | 30,157,168 | | | | 30,196,685 | | | | 39,517 | | | | — | |
Singapore Dollar, | | | | | | | | | | | | | | | | | | | | | | |
Expiring 11/09/18 | | Bank of America | | SGD | 2,322 | | | | 1,706,000 | | | | 1,676,493 | | | | — | | | | (29,507 | ) |
Expiring 11/09/18 | | Bank of America | | SGD | 1,375 | | | | 1,000,000 | | | | 992,596 | | | | — | | | | (7,404 | ) |
Expiring 11/09/18 | | Citibank NA | | SGD | 2,399 | | | | 1,753,000 | | | | 1,732,136 | | | | — | | | | (20,864 | ) |
Expiring 11/09/18 | | Citibank NA | | SGD | 1,837 | | | | 1,342,000 | | | | 1,326,798 | | | | — | | | | (15,202 | ) |
Expiring 11/09/18 | | Citibank NA | | SGD | 1,598 | | | | 1,159,000 | | | | 1,153,671 | | | | — | | | | (5,329 | ) |
Expiring 11/09/18 | | Citibank NA | | SGD | 1,510 | | | | 1,106,000 | | | | 1,090,483 | | | | — | | | | (15,517 | ) |
Expiring 11/09/18 | | Deutsche Bank AG | | SGD | 5,780 | | | | 4,219,000 | | | | 4,173,374 | | | | — | | | | (45,626 | ) |
Expiring 11/09/18 | | Deutsche Bank AG | | SGD | 3,260 | | | | 2,388,000 | | | | 2,353,714 | | | | — | | | | (34,286 | ) |
Expiring 11/09/18 | | Deutsche Bank AG | | SGD | 1,424 | | | | 1,033,000 | | | | 1,028,170 | | | | — | | | | (4,830 | ) |
Expiring 11/09/18 | | Goldman Sachs
International | | SGD | 1,349 | | | | 981,000 | | | | 973,912 | | | | — | | | | (7,088 | ) |
Expiring 11/09/18 | | JPMorgan Chase | | SGD | 2,224 | | | | 1,634,000 | | | | 1,605,566 | | | | — | | | | (28,434 | ) |
Expiring 11/09/18 | | JPMorgan Chase | | SGD | 2,210 | | | | 1,624,000 | | | | 1,595,759 | | | | — | | | | (28,241 | ) |
Expiring 11/09/18 | | JPMorgan Chase | | SGD | 1,379 | | | | 1,008,000 | | | | 995,951 | | | | — | | | | (12,049 | ) |
Expiring 11/09/18 | | Morgan Stanley | | SGD | 1,931 | | | | 1,411,000 | | | | 1,394,639 | | | | — | | | | (16,361 | ) |
See Notes to Financial Statements.
| | | | |
| PGIM Absolute Return Bond Fund | | | 73 | |
Schedule of Investments (continued)
as of October 31, 2018
Forward foreign currency exchange contracts outstanding at October 31, 2018 (continued):
| | | | | | | | | | | | | | | | | | | | | | |
Purchase Contracts | | Counterparty | | Notional
Amount
(000) | | | Value at
Settlement
Date | | | Current
Value | | | Unrealized
Appreciation | | | Unrealized
Depreciation | |
OTC Forward Foreign Currency Exchange Contracts (cont’d.): | | | | | | | | | | | | | |
Singapore Dollar (cont’d.), | | | | | | | | | | | | | | | | | | | | | | |
Expiring 11/09/18 | | Morgan Stanley | | SGD | 1,418 | | | $ | 1,040,000 | | | $ | 1,023,699 | | | $ | — | | | $ | (16,301 | ) |
Expiring 11/09/18 | | UBS AG | | SGD | 2,508 | | | | 1,839,000 | | | | 1,811,248 | | | | — | | | | (27,752 | ) |
Expiring 11/09/18 | | UBS AG | | SGD | 2,067 | | | | 1,514,000 | | | | 1,492,465 | | | | — | | | | (21,535 | ) |
Expiring 11/09/18 | | UBS AG | | SGD | 1,506 | | | | 1,105,000 | | | | 1,087,410 | | | | — | | | | (17,590 | ) |
South African Rand, | | | | | | | | | | | | | | | | | | | | | | |
Expiring 12/07/18 | | Deutsche Bank AG | | ZAR | 13,442 | | | | 915,000 | | | | 906,941 | | | | — | | | | (8,059 | ) |
Expiring 12/07/18 | | JPMorgan Chase | | ZAR | 17,438 | | | | 1,197,000 | | | | 1,176,530 | | | | — | | | | (20,470 | ) |
Expiring 12/07/18 | | JPMorgan Chase | | ZAR | 14,268 | | | | 980,000 | | | | 962,653 | | | | — | | | | (17,347 | ) |
Expiring 12/07/18 | | Morgan Stanley | | ZAR | 16,004 | | | | 1,068,000 | | | | 1,079,753 | | | | 11,753 | | | | — | |
Expiring 12/07/18 | | Toronto Dominion | | ZAR | 15,504 | | | | 1,031,000 | | | | 1,046,057 | | | | 15,057 | | | | — | |
Expiring 12/07/18 | | UBS AG | | ZAR | 33,280 | | | | 2,331,000 | | | | 2,245,391 | | | | — | | | | (85,609 | ) |
Expiring 12/07/18 | | UBS AG | | ZAR | 24,770 | | | | 1,725,000 | | | | 1,671,236 | | | | — | | | | (53,764 | ) |
Expiring 12/07/18 | | UBS AG | | ZAR | 18,339 | | | | 1,276,000 | | | | 1,237,295 | | | | — | | | | (38,705 | ) |
Expiring 12/07/18 | | UBS AG | | ZAR | 14,369 | | | | 997,000 | | | | 969,448 | | | | — | | | | (27,552 | ) |
Expiring 01/31/19 | | Morgan Stanley | | ZAR | 24,322 | | | | 1,673,201 | | | | 1,628,878 | | | | — | | | | (44,323 | ) |
Expiring 12/30/19 | | Barclays Bank PLC | | ZAR | 38,671 | | | | 3,005,230 | | | | 2,480,513 | | | | — | | | | (524,717 | ) |
Expiring 12/30/19 | | BNP Paribas | | ZAR | 68,785 | | | | 4,346,000 | | | | 4,412,113 | | | | 66,113 | | | | — | |
Expiring 03/31/20 | | UBS AG | | ZAR | 29,283 | | | | 2,052,800 | | | | 1,854,438 | | | | — | | | | (198,362 | ) |
Expiring 03/31/20 | | UBS AG | | ZAR | 27,854 | | | | 1,806,000 | | | | 1,763,923 | | | | — | | | | (42,077 | ) |
South Korean Won, | | | | | | | | | | | | | | | | | | | | | | |
Expiring 01/16/19 | | JPMorgan Chase | | KRW | 4,661,447 | | | | 4,131,390 | | | | 4,101,994 | | | | — | | | | (29,396 | ) |
Swiss Franc, | | | | | | | | | | | | | | | | | | | | | | |
Expiring 01/25/19 | | Goldman Sachs International | | CHF | 1,830 | | | | 1,853,000 | | | | 1,833,884 | | | | — | | | | (19,116 | ) |
Expiring 01/25/19 | | Toronto Dominion | | CHF | 1,289 | | | | 1,307,000 | | | | 1,291,337 | | | | — | | | | (15,663 | ) |
Thai Baht, | | | | | | | | | | | | | | | | | | | | | | |
Expiring 11/09/18 | | Citibank NA | | THB | 170,336 | | | | 5,276,432 | | | | 5,139,447 | | | | — | | | | (136,985 | ) |
Expiring 11/09/18 | | Citibank NA | | THB | 92,240 | | | | 2,829,000 | | | | 2,783,082 | | | | — | | | | (45,918 | ) |
Expiring 11/09/18 | | Citibank NA | | THB | 89,624 | | | | 2,773,999 | | | | 2,704,158 | | | | — | | | | (69,841 | ) |
Expiring 11/09/18 | | Citibank NA | | THB | 79,390 | | | | 2,426,000 | | | | 2,395,371 | | | | — | | | | (30,629 | ) |
Expiring 11/09/18 | | Citibank NA | | THB | 75,959 | | | | 2,294,000 | | | | 2,291,872 | | | | — | | | | (2,128 | ) |
Expiring 11/09/18 | | Citibank NA | | THB | 72,105 | | | | 2,223,000 | | | | 2,175,590 | | | | — | | | | (47,410 | ) |
Expiring 11/09/18 | | Citibank NA | | THB | 71,074 | | | | 2,173,000 | | | | 2,144,483 | | | | — | | | | (28,517 | ) |
Expiring 11/09/18 | | Citibank NA | | THB | 63,128 | | | | 1,952,000 | | | | 1,904,709 | | | | — | | | | (47,291 | ) |
Expiring 11/09/18 | | Citibank NA | | THB | 56,239 | | | | 1,720,000 | | | | 1,696,857 | | | | — | | | | (23,143 | ) |
See Notes to Financial Statements.
Forward foreign currency exchange contracts outstanding at October 31, 2018 (continued):
| | | | | | | | | | | | | | | | | | | | | | |
Purchase Contracts | | Counterparty | | Notional
Amount
(000) | | | Value at
Settlement
Date | | | Current
Value | | | Unrealized
Appreciation | | | Unrealized
Depreciation | |
OTC Forward Foreign Currency Exchange Contracts (cont’d.): | | | | | | | | | | | | | |
Thai Baht (cont’d.), | | | | | | | | | | | | | | | | | | | | | | |
Expiring 11/09/18 | | Citibank NA | | THB | 56,198 | | | $ | 1,727,000 | | | $ | 1,695,634 | | | $ | — | | | $ | (31,366 | ) |
Expiring 11/09/18 | | Citibank NA | | THB | 51,026 | | | | 1,559,000 | | | | 1,539,576 | | | | — | | | | (19,424 | ) |
Expiring 11/09/18 | | Citibank NA | | THB | 46,050 | | | | 1,428,000 | | | | 1,389,440 | | | | — | | | | (38,560 | ) |
Expiring 11/09/18 | | Citibank NA | | THB | 45,008 | | | | 1,361,000 | | | | 1,358,005 | | | | — | | | | (2,995 | ) |
Expiring 11/09/18 | | Citibank NA | | THB | 44,502 | | | | 1,382,000 | | | | 1,342,723 | | | | — | | | | (39,277 | ) |
Expiring 11/09/18 | | Citibank NA | | THB | 43,359 | | | | 1,317,000 | | | | 1,308,240 | | | | — | | | | (8,760 | ) |
Expiring 11/09/18 | | Citibank NA | | THB | 40,509 | | | | 1,239,000 | | | | 1,222,254 | | | | — | | | | (16,746 | ) |
Expiring 11/09/18 | | Citibank NA | | THB | 39,519 | | | | 1,197,000 | | | | 1,192,379 | | | | — | | | | (4,621 | ) |
Expiring 11/09/18 | | Deutsche Bank AG | | THB | 87,942 | | | | 2,708,000 | | | | 2,653,424 | | | | — | | | | (54,576 | ) |
Turkish Lira, | | | | | | | | | | | | | | | | | | | | | | |
Expiring 12/07/18 | | Barclays Bank PLC | | TRY | 9,449 | | | | 1,445,000 | | | | 1,651,478 | | | | 206,478 | | | | — | |
Expiring 12/07/18 | | Barclays Bank PLC | | TRY | 7,713 | | | | 1,336,000 | | | | 1,348,036 | | | | 12,036 | | | | — | |
Expiring 12/07/18 | | Barclays Bank PLC | | TRY | 6,462 | | | | 1,012,000 | | | | 1,129,367 | | | | 117,367 | | | | — | |
Expiring 12/07/18 | | BNP Paribas | | TRY | 5,066 | | | | 872,000 | | | | 885,513 | | | | 13,513 | | | | — | |
Expiring 12/07/18 | | Deutsche Bank AG | | TRY | 6,378 | | | | 1,029,000 | | | | 1,114,699 | | | | 85,699 | | | | — | |
Expiring 12/07/18 | | JPMorgan Chase | | TRY | 16,784 | | | | 2,684,674 | | | | 2,933,551 | | | | 248,877 | | | | — | |
Expiring 12/07/18 | | JPMorgan Chase | | TRY | 6,327 | | | | 1,067,000 | | | | 1,105,782 | | | | 38,782 | | | | — | |
Expiring 12/07/18 | | Morgan Stanley | | TRY | 10,256 | | | | 1,589,000 | | | | 1,792,487 | | | | 203,487 | | | | — | |
Expiring 12/07/18 | | Morgan Stanley | | TRY | 7,068 | | | | 1,154,000 | | | | 1,235,284 | | | | 81,284 | | | | — | |
Expiring 12/07/18 | | Toronto Dominion | | TRY | 7,600 | | | | 1,194,000 | | | | 1,328,277 | | | | 134,277 | | | | — | |
Expiring 12/07/18 | | UBS AG | | TRY | 8,381 | | | | 1,439,000 | | | | 1,464,791 | | | | 25,791 | | | | — | |
Expiring 02/28/19 | | Barclays Bank PLC | | TRY | 3,103 | | | | 688,983 | | | | 516,500 | | | | — | | | | (172,483 | ) |
Expiring 02/28/19 | | JPMorgan Chase | | TRY | 10,043 | | | | 1,982,906 | | | | 1,671,908 | | | | — | | | | (310,998 | ) |
Expiring 12/24/19 | | Goldman Sachs International | | TRY | 55,080 | | | | 9,962,000 | | | | 7,828,660 | | | | — | | | | (2,133,340 | ) |
Expiring 04/30/20 | | Citibank NA | | TRY | 4,397 | | | | 748,000 | | | | 589,079 | | | | — | | | | (158,921 | ) |
Expiring 04/30/20 | | Deutsche Bank AG | | TRY | 3,185 | | | | 318,000 | | | | 426,718 | | | | 108,718 | | | | — | |
Expiring 04/30/20 | | Morgan Stanley | | TRY | 77,540 | | | | 12,091,000 | | | | 10,389,307 | | | | — | | | | (1,701,693 | ) |
See Notes to Financial Statements.
| | | | |
| PGIM Absolute Return Bond Fund | | | 75 | |
Schedule of Investments (continued)
as of October 31, 2018
Forward foreign currency exchange contracts outstanding at October 31, 2018 (continued):
| | | | | | | | | | | | | | | | | | | | | | |
Purchase Contracts | | Counterparty | | Notional
Amount
(000) | | | Value at
Settlement
Date | | | Current
Value | | | Unrealized
Appreciation | | | Unrealized
Depreciation | |
OTC Forward Foreign Currency Exchange Contracts (cont’d.): | | | | | | | | | | | | | |
Turkish Lira (cont’d.), | | | | | | | | | | | | | | | | | | | | |
Expiring 06/30/20 | | Bank of America | | TRY | 6,776 | | | $ | 1,017,000 | | | $ | 881,550 | | | $ | — | | | $ | (135,450 | ) |
Expiring 06/30/20 | | Deutsche Bank AG | | TRY | 157,506 | | | | 15,218,000 | | | | 20,492,393 | | | | 5,274,393 | | | | — | |
| | | | | | | | | | | | | | | | | | | | | | |
| | | | | | | | $ | 597,832,964 | | | $ | 595,056,830 | | | $ | 9,923,671 | | | $ | (12,699,805 | ) |
| | | | | | | | | | | | | | | | | | | | | | |
| | | | | | |
Sale Contracts | | Counterparty | | Notional
Amount
(000) | | | Value at
Settlement
Date | | | Current
Value | | | Unrealized
Appreciation | | | Unrealized
Depreciation | |
OTC Forward Foreign Currency Exchange Contracts: | | | | | | | | | | | | | |
Australian Dollar, | | | | | | | | | | | | | | | | | | | | | | |
Expiring 01/18/19 | | Bank of America | | AUD | 3,707 | | | $ | 2,625,453 | | | $ | 2,627,831 | | | $ | — | | | $ | (2,378 | ) |
Expiring 01/18/19 | | Morgan Stanley | | AUD | 9,801 | | | | 6,988,098 | | | | 6,947,606 | | | | 40,492 | | | | — | |
Expiring 01/18/19 | | Morgan Stanley | | AUD | 2,312 | | | | 1,638,000 | | | | 1,638,955 | | | | — | | | | (955 | ) |
Expiring 01/18/19 | | Toronto Dominion | | AUD | 2,700 | | | | 1,907,000 | | | | 1,913,561 | | | | — | | | | (6,561 | ) |
Expiring 01/18/19 | | Toronto Dominion | | AUD | 1,517 | | | | 1,074,000 | | | | 1,075,333 | | | | — | | | | (1,333 | ) |
Expiring 01/31/19 | | Morgan Stanley | | AUD | 1,960 | | | | 1,389,000 | | | | 1,389,727 | | | | — | | | | (727 | ) |
Expiring 01/31/19 | | UBS AG | | AUD | 1,929 | | | | 1,366,000 | | | | 1,367,749 | | | | — | | | | (1,749 | ) |
Expiring 01/31/19 | | UBS AG | | AUD | 1,652 | | | | 1,176,000 | | | | 1,171,221 | | | | 4,779 | | | | — | |
Expiring 08/29/19 | | Morgan Stanley | | AUD | 15,457 | | | | 11,139,087 | | | | 11,006,863 | | | | 132,224 | | | | — | |
Expiring 01/31/20 | | Morgan Stanley | | AUD | 13,184 | | | | 9,526,099 | | | | 9,424,553 | | | | 101,546 | | | | — | |
Brazilian Real, | | | | | | | | | | | | | | | | | | | | | | |
Expiring 12/04/18 | | Barclays Bank PLC | | BRL | 4,533 | | | | 1,219,000 | | | | 1,214,078 | | | | 4,922 | | | | — | |
Expiring 12/04/18 | | Citibank NA | | BRL | 5,089 | | | | 1,350,000 | | | | 1,363,076 | | | | — | | | | (13,076 | ) |
Expiring 12/04/18 | | Goldman Sachs International | | BRL | 6,746 | | | | 1,813,461 | | | | 1,806,771 | | | | 6,690 | | | | — | |
Expiring 12/04/18 | | JPMorgan Chase | | BRL | 7,806 | | | | 2,085,750 | | | | 2,090,652 | | | | — | | | | (4,902 | ) |
Expiring 12/04/18 | | JPMorgan Chase | | BRL | 6,756 | | | | 1,808,800 | | | | 1,809,394 | | | | — | | | | (594 | ) |
See Notes to Financial Statements.
Forward foreign currency exchange contracts outstanding at October 31, 2018 (continued):
| | | | | | | | | | | | | | | | | | | | | | |
| | | | | | |
Sale Contracts | | Counterparty | | Notional
Amount
(000) | | | Value at
Settlement
Date | | | Current
Value | | | Unrealized
Appreciation | | | Unrealized
Depreciation | |
OTC Forward Foreign Currency Exchange Contracts (cont’d.): | | | | | | | | | | | | | |
Brazilian Real (cont’d.), | | | | | | | | | | | | | | | | | | | | | | |
Expiring 12/04/18 | | JPMorgan Chase | | BRL | 5,758 | | | $ | 1,536,180 | | | $ | 1,542,033 | | | $ | — | | | $ | (5,853 | ) |
Expiring 12/04/18 | | UBS AG | | BRL | 3,658 | | | | 973,000 | | | | 979,782 | | | | — | | | | (6,782 | ) |
Expiring 01/31/19 | | Bank of America | | BRL | 2,902 | | | | 783,000 | | | | 773,527 | | | | 9,473 | | | | — | |
Expiring 01/31/19 | | Barclays Bank PLC | | BRL | 1,945 | | | | 522,377 | | | | 518,466 | | | | 3,911 | | | | — | |
Expiring 02/25/19 | | Citibank NA | | BRL | 2,677 | | | | 681,240 | | | | 712,209 | | | | — | | | | (30,969 | ) |
Expiring 09/30/19 | | JPMorgan Chase | | BRL | 12,412 | | | | 3,549,000 | | | | 3,233,737 | | | | 315,263 | | | | — | |
Expiring 12/24/19 | | BNP Paribas | | BRL | 3,641 | | | | 900,000 | | | | 939,208 | | | | — | | | | (39,208 | ) |
Expiring 12/24/19 | | Citibank NA | | BRL | 6,946 | | | | 1,675,000 | | | | 1,791,737 | | | | — | | | | (116,737 | ) |
Expiring 12/24/19 | | JPMorgan Chase | | BRL | 11,825 | | | | 3,331,000 | | | | 3,050,201 | | | | 280,799 | | | | — | |
Expiring 12/24/19 | | UBS AG | | BRL | 2,906 | | | | 725,000 | | | | 749,534 | | | | — | | | | (24,534 | ) |
Expiring 03/31/20 | | JPMorgan Chase | | BRL | 38,335 | | | | 10,714,000 | | | | 9,768,673 | | | | 945,327 | | | | — | |
Expiring 03/31/20 | | JPMorgan Chase | | BRL | 13,430 | | | | 3,231,950 | | | | 3,422,406 | | | | — | | | | (190,456 | ) |
Expiring 06/30/20 | | Deutsche Bank AG | | BRL | 80,093 | | | | 19,440,000 | | | | 20,177,822 | | | | — | | | | (737,822 | ) |
Expiring 07/29/20 | | Deutsche Bank AG | | BRL | 27,045 | | | | 6,116,000 | | | | 6,788,495 | | | | — | | | | (672,495 | ) |
Expiring 08/31/20 | | Deutsche Bank AG | | BRL | 26,630 | | | | 5,810,000 | | | | 6,656,411 | | | | — | | | | (846,411 | ) |
British Pound, | | | | | | | | | | | | | | | | | | | | | | |
Expiring 01/25/19 | | Goldman Sachs International | | GBP | 21,407 | | | | 27,810,765 | | | | 27,492,587 | | | | 318,178 | | | | — | |
Canadian Dollar, | | | | | | | | | | | | | | | | | | | | | | |
Expiring 01/18/19 | | Goldman Sachs International | | CAD | 6,810 | | | | 5,246,306 | | | | 5,181,644 | | | | 64,662 | | | | — | |
Expiring 01/18/19 | | Toronto Dominion | | CAD | 2,148 | | | | 1,658,000 | | | | 1,634,398 | | | | 23,602 | | | | — | |
Expiring 01/18/19 | | Toronto Dominion | | CAD | 1,071 | | | | 825,000 | | | | 814,657 | | | | 10,343 | | | | — | |
Chilean Peso, | | | | | | | | | | | | | | | | | | | | | | |
Expiring 12/19/18 | | Barclays Bank PLC | | CLP | 834,309 | | | | 1,233,000 | | | | 1,199,634 | | | | 33,366 | | | | — | |
Expiring 12/19/18 | | Barclays Bank PLC | | CLP | 822,537 | | | | 1,204,000 | | | | 1,182,707 | | | | 21,293 | | | | — | |
See Notes to Financial Statements.
| | | | |
| PGIM Absolute Return Bond Fund | | | 77 | |
Schedule of Investments (continued)
as of October 31, 2018
Forward foreign currency exchange contracts outstanding at October 31, 2018 (continued):
| | | | | | | | | | | | | | | | | | | | | | |
| | | | | | |
Sale Contracts | | Counterparty | | Notional
Amount
(000) | | | Value at
Settlement
Date | | | Current
Value | | | Unrealized
Appreciation | | | Unrealized
Depreciation | |
OTC Forward Foreign Currency Exchange Contracts (cont’d.): | | | | | | | | | | | | | |
Chilean Peso (cont’d.), | | | | | | | | | | | | | | | | | | | | | | |
Expiring 12/19/18 | | Barclays Bank PLC | | CLP | 692,057 | | | $ | 1,015,000 | | | $ | 995,093 | | | $ | 19,907 | | | $ | — | |
Expiring 12/19/18 | | BNP Paribas | | CLP | 13,636,364 | | | | 20,267,478 | | | | 19,607,415 | | | | 660,063 | | | | — | |
Chinese Renminbi, | | | | | | | | | | | | | | | | | | | | | | |
Expiring 01/28/19 | | Deutsche Bank AG | | CNH | 36,788 | | | | 5,272,000 | | | | 5,249,650 | | | | 22,350 | | | | — | |
Expiring 01/28/19 | | Deutsche Bank AG | | CNH | 16,317 | | | | 2,340,000 | | | | 2,328,451 | | | | 11,549 | | | | — | |
Expiring 01/28/19 | | Morgan Stanley | | CNH | 217,333 | | | | 31,159,774 | | | | 31,013,258 | | | | 146,516 | | | | — | |
Expiring 06/28/19 | | Morgan Stanley | | CNH | 7,363 | | | | 1,100,000 | | | | 1,046,131 | | | | 53,869 | | | | — | |
Expiring 02/28/20 | | Morgan Stanley | | CNH | 71,811 | | | | 10,656,000 | | | | 10,215,137 | | | | 440,863 | | | | — | |
Colombian Peso, | | | | | | | | | | | | | | | | | | | | | | |
Expiring 12/14/18 | | Barclays Bank PLC | | COP | 3,043,777 | | | | 1,008,000 | | | | 943,592 | | | | 64,408 | | | | — | |
Expiring 12/14/18 | | Barclays Bank PLC | | COP | 2,806,716 | | | | 933,000 | | | | 870,102 | | | | 62,898 | | | | — | |
Expiring 12/14/18 | | Citibank NA | | COP | 22,742,710 | | | | 7,286,411 | | | | 7,050,399 | | | | 236,012 | | | | — | |
Expiring 12/14/18 | | Citibank NA | | COP | 2,412,374 | | | | 794,000 | | | | 747,853 | | | | 46,147 | | | | — | |
Expiring 12/14/18 | | Morgan Stanley | | COP | 5,183,101 | | | | 1,686,000 | | | | 1,606,798 | | | | 79,202 | | | | — | |
Expiring 12/14/18 | | Morgan Stanley | | COP | 4,297,096 | | | | 1,434,000 | | | | 1,332,130 | | | | 101,870 | | | | — | |
Expiring 12/14/18 | | Morgan Stanley | | COP | 2,793,500 | | | | 925,000 | | | | 866,005 | | | | 58,995 | | | | — | |
Czech Koruna, | | | | | | | | | | | | | | | | | | | | | | |
Expiring 01/25/19 | | Citibank NA | | CZK | 252,283 | | | | 11,213,075 | | | | 11,106,363 | | | | 106,712 | | | | — | |
Expiring 01/25/19 | | Deutsche Bank AG | | CZK | 252,283 | | | | 11,280,258 | | | | 11,106,362 | | | | 173,896 | | | | — | |
Expiring 01/25/19 | | Goldman Sachs International | | CZK | 20,702 | | | | 911,000 | | | | 911,374 | | | | — | | | | (374 | ) |
Euro, | | | | | | | | | | | | | | | | | | | | | | |
Expiring 12/19/18 | | UBS AG | | EUR | 278,610 | | | | 318,640,662 | | | | 317,009,413 | | | | 1,631,249 | | | | — | |
Expiring 01/25/19 | | JPMorgan Chase | | EUR | 1,093 | | | | 1,265,064 | | | | 1,247,902 | | | | 17,162 | | | | — | |
Expiring 01/25/19 | | Morgan Stanley | | EUR | 4,500 | | | | 5,168,665 | | | | 5,139,267 | | | | 29,398 | | | | — | |
Expiring 01/25/19 | | Toronto Dominion | | EUR | 1,541 | | | | 1,765,000 | | | | 1,759,935 | | | | 5,065 | | | | — | |
See Notes to Financial Statements.
Forward foreign currency exchange contracts outstanding at October 31, 2018 (continued):
| | | | | | | | | | | | | | | | | | | | | | |
Sale Contracts | | Counterparty | | Notional
Amount
(000) | | | Value at
Settlement
Date | | | Current
Value | | | Unrealized
Appreciation | | | Unrealized
Depreciation | |
OTC Forward Foreign Currency Exchange Contracts (cont’d.): | |
Euro (cont’d.), | | | | | | | | | | | | | | | | | | | | | | |
Expiring 01/25/19 | | Toronto Dominion | | EUR | 1,083 | | | $ | 1,237,000 | | | $ | 1,237,308 | | | $ | — | | | $ | (308 | ) |
Expiring 01/25/19 | | Toronto Dominion | | EUR | 1,009 | | | | 1,166,000 | | | | 1,152,682 | | | | 13,318 | | | | — | |
Expiring 01/25/19 | | Toronto Dominion | | EUR | 1,004 | | | | 1,153,000 | | | | 1,146,994 | | | | 6,006 | | | | — | |
Expiring 01/25/19 | | Toronto Dominion | | EUR | 958 | | | | 1,098,000 | | | | 1,094,122 | | | | 3,878 | | | | — | |
Expiring 01/25/19 | | UBS AG | | EUR | 678 | | | | 775,750 | | | | 774,117 | | | | 1,633 | | | | — | |
Expiring 01/31/19 | | JPMorgan Chase | | EUR | 576 | | | | 667,000 | | | | 658,666 | | | | 8,334 | | | | — | |
Expiring 02/25/19 | | Citibank NA | | EUR | 2,300 | | | | 2,917,890 | | | | 2,633,866 | | | | 284,024 | | | | — | |
Expiring 02/28/19 | | Deutsche Bank AG | | EUR | 2,458 | | | | 3,084,372 | | | | 2,815,530 | | | | 268,842 | | | | — | |
Expiring 12/30/19 | | Deutsche Bank AG | | EUR | 1,231 | | | | 1,587,473 | | | | 1,451,703 | | | | 135,770 | | | | — | |
Expiring 02/28/20 | | Bank of America | | EUR | 11,032 | | | | 13,441,389 | | | | 13,086,037 | | | | 355,352 | | | | — | |
Expiring 07/29/20 | | UBS AG | | EUR | 1,857 | | | | 2,262,267 | | | | 2,234,739 | | | | 27,528 | | | | — | |
Hungarian Forint, | | | | | | | | | | | | | | | | | | | | | | |
Expiring 01/25/19 | | JPMorgan Chase | | HUF | 2,481,590 | | | | 8,947,505 | | | | 8,723,349 | | | | 224,156 | | | | — | |
Expiring 01/25/19 | | Toronto Dominion | | HUF | 3,375,715 | | | | 12,104,152 | | | | 11,866,397 | | | | 237,755 | | | | — | |
Expiring 01/25/19 | | Toronto Dominion | | HUF | 1,662,666 | | | | 5,971,798 | | | | 5,844,644 | | | | 127,154 | | | | — | |
Expiring 01/25/19 | | UBS AG | | HUF | 332,540 | | | | 1,175,000 | | | | 1,168,952 | | | | 6,048 | | | | — | |
Indian Rupee, | | | | | | | | | | | | | | | | | | | | | | |
Expiring 01/11/19 | | Barclays Bank PLC | | INR | 106,031 | | | | 1,424,000 | | | | 1,421,503 | | | | 2,497 | | | | — | |
Expiring 01/11/19 | | JPMorgan Chase | | INR | 239,430 | | | | 3,227,000 | | | | 3,209,921 | | | | 17,079 | | | | — | |
Expiring 01/11/19 | | JPMorgan Chase | | INR | 188,890 | | | | 2,528,000 | | | | 2,532,346 | | | | — | | | | (4,346 | ) |
Expiring 01/11/19 | | JPMorgan Chase | | INR | 127,287 | | | | 1,718,000 | | | | 1,706,466 | | | | 11,534 | | | | — | |
Expiring 01/11/19 | | JPMorgan Chase | | INR | 64,237 | | | | 868,000 | | | | 861,193 | | | | 6,807 | | | | — | |
Expiring 01/11/19 | | JPMorgan Chase | | INR | 58,229 | | | | 779,300 | | | | 780,640 | | | | — | | | | (1,340 | ) |
Expiring 01/11/19 | | Morgan Stanley | | INR | 123,864 | | | | 1,673,000 | | | | 1,660,579 | | | | 12,421 | | | | — | |
See Notes to Financial Statements.
| | | | |
| PGIM Absolute Return Bond Fund | | | 79 | |
Schedule of Investments (continued)
as of October 31, 2018
Forward foreign currency exchange contracts outstanding at October 31, 2018 (continued):
| | | | | | | | | | | | | | | | | | | | | | |
Sale Contracts | | Counterparty | | Notional
Amount
(000) | | | Value at
Settlement
Date | | | Current
Value | | | Unrealized
Appreciation | | | Unrealized
Depreciation | |
OTC Forward Foreign Currency Exchange Contracts (cont’d.): | | | | | | | | | | | | | |
Indian Rupee (cont’d.), | | | | | | | | | | | | | | | | | | | | | | |
Expiring 08/29/19 | | BNP Paribas | | INR | 861,995 | | | $ | 11,620,000 | | | $ | 11,257,684 | | | $ | 362,316 | | | $ | — | |
Indonesian Rupiah, | | | | | | | | | | | | | | | | | | | | | | |
Expiring 12/19/18 | | Barclays Bank PLC | | IDR | 65,284,011 | | | | 4,254,000 | | | | 4,265,723 | | | | — | | | | (11,723 | ) |
Expiring 12/19/18 | | Barclays Bank PLC | | IDR | 64,828,514 | | | | 4,292,000 | | | | 4,235,960 | | | | 56,040 | | | | — | |
Expiring 12/19/18 | | Barclays Bank PLC | | IDR | 61,806,349 | | | | 4,073,000 | | | | 4,038,489 | | | | 34,511 | | | | — | |
Expiring 12/19/18 | | Barclays Bank PLC | | IDR | 40,210,780 | | | | 2,605,000 | | | | 2,627,413 | | | | — | | | | (22,413 | ) |
Expiring 12/19/18 | | Barclays Bank PLC | | IDR | 33,987,778 | | | | 2,214,000 | | | | 2,220,795 | | | | — | | | | (6,795 | ) |
Expiring 12/19/18 | | Barclays Bank PLC | | IDR | 18,589,656 | | | | 1,212,000 | | | | 1,214,667 | | | | — | | | | (2,667 | ) |
Expiring 12/19/18 | | Citibank NA | | IDR | 16,730,485 | | | | 1,091,000 | | | | 1,093,187 | | | | — | | | | (2,187 | ) |
Expiring 12/19/18 | | JPMorgan Chase | | IDR | 77,833,735 | | | | 5,140,000 | | | | 5,085,734 | | | | 54,266 | | | | — | |
Expiring 12/19/18 | | JPMorgan Chase | | IDR | 73,874,739 | | | | 4,904,000 | | | | 4,827,049 | | | | 76,951 | | | | — | |
Expiring 12/19/18 | | JPMorgan Chase | | IDR | 70,401,015 | | | | 4,635,000 | | | | 4,600,073 | | | | 34,927 | | | | — | |
Expiring 12/19/18 | | JPMorgan Chase | | IDR | 70,096,736 | | | | 4,641,000 | | | | 4,580,191 | | | | 60,809 | | | | — | |
Expiring 12/19/18 | | JPMorgan Chase | | IDR | 48,931,626 | | | | 3,253,000 | | | | 3,197,241 | | | | 55,759 | | | | — | |
Expiring 12/19/18 | | JPMorgan Chase | | IDR | 37,137,660 | | | | 2,452,140 | | | | 2,426,612 | | | | 25,528 | | | | — | |
Expiring 12/19/18 | | JPMorgan Chase | | IDR | 30,038,575 | | | | 1,955,000 | | | | 1,962,751 | | | | — | | | | (7,751 | ) |
Expiring 12/19/18 | | JPMorgan Chase | | IDR | 28,950,828 | | | | 1,884,860 | | | | 1,891,676 | | | | — | | | | (6,816 | ) |
Expiring 12/19/18 | | JPMorgan Chase | | IDR | 25,275,711 | | | | 1,673,334 | | | | 1,651,540 | | | | 21,794 | | | | — | |
Expiring 12/19/18 | | JPMorgan Chase | | IDR | 25,161,197 | | | | 1,632,000 | | | | 1,644,058 | | | | — | | | | (12,058 | ) |
Expiring 12/19/18 | | Morgan Stanley | | IDR | 40,195,955 | | | | 2,650,574 | | | | 2,626,444 | | | | 24,130 | | | | — | |
Israeli Shekel, | | | | | | | | | | | | | | | | | | | | | | |
Expiring 01/28/19 | | Citibank NA | | ILS | 32,572 | | | | 8,893,264 | | | | 8,821,032 | | | | 72,232 | | | | — | |
Japanese Yen, | | | | | | | | | | | | | | | | | | | | | | |
Expiring 01/31/19 | | JPMorgan Chase | | JPY | 120,853 | | | | 1,080,000 | | | | 1,080,044 | | | | — | | | | (44 | ) |
See Notes to Financial Statements.
Forward foreign currency exchange contracts outstanding at October 31, 2018 (continued):
| | | | | | | | | | | | | | | | | | | | | | |
Sale Contracts | | Counterparty | | Notional
Amount
(000) | | | Value at
Settlement
Date | | | Current
Value | | | Unrealized
Appreciation | | | Unrealized
Depreciation | |
OTC Forward Foreign Currency Exchange Contracts (cont’d.): | | | | | | | | | | | | | |
Japanese Yen (cont’d.), | | | | | | | | | |
Expiring 11/30/20 | | JPMorgan Chase | | JPY | 819,678 | | | $ | 7,848,316 | | | $ | 7,810,860 | | | $ | 37,456 | | | $ | — | |
Mexican Peso, | | | | | | | | | | | | | | | | | | | | | | |
Expiring 12/19/18 | | Citibank NA | | MXN | 18,598 | | | | 946,000 | | | | 907,987 | | | | 38,013 | | | | — | |
Expiring 12/19/18 | | Citibank NA | | MXN | 8,393 | | | | 435,458 | | | | 409,747 | | | | 25,711 | | | | — | |
Expiring 12/19/18 | | JPMorgan Chase | | MXN | 23,220 | | | | 1,209,314 | | | | 1,133,615 | | | | 75,699 | | | | — | |
Expiring 12/19/18 | | JPMorgan Chase | | MXN | 20,864 | | | | 1,091,000 | | | | 1,018,613 | | | | 72,387 | | | | — | |
Expiring 12/19/18 | | UBS AG | | MXN | 220,940 | | | | 11,663,699 | | | | 10,786,396 | | | | 877,303 | | | | — | |
Expiring 01/29/19 | | UBS AG | | MXN | 36,259 | | | | 1,853,000 | | | | 1,758,141 | | | | 94,859 | | | | — | |
Expiring 01/31/19 | | Deutsche Bank AG | | MXN | 24,839 | | | | 1,209,000 | | | | 1,204,024 | | | | 4,976 | | | | — | |
Expiring 01/31/19 | | UBS AG | | MXN | 33,314 | | | | 1,643,000 | | | | 1,614,816 | | | | 28,184 | | | | — | |
Expiring 01/31/19 | | UBS AG | | MXN | 15,791 | | | | 798,000 | | | | 765,442 | | | | 32,558 | | | | — | |
Expiring 08/29/19 | | BNP Paribas | | MXN | 100,179 | | | | 5,049,000 | | | | 4,692,345 | | | | 356,655 | | | | — | |
Expiring 12/24/19 | | Citibank NA | | MXN | 32,954 | | | | 1,606,000 | | | | 1,516,198 | | | | 89,802 | | | | — | |
Expiring 12/24/19 | | Citibank NA | | MXN | 3,596 | | | | 169,000 | | | | 165,463 | | | | 3,537 | | | | — | |
Expiring 04/30/20 | | Citibank NA | | MXN | 298,979 | | | | 14,344,000 | | | | 13,504,330 | | | | 839,670 | | | | — | |
Expiring 04/30/20 | | UBS AG | | MXN | 27,628 | | | | 1,218,000 | | | | 1,247,909 | | | | — | | | | (29,909 | ) |
New Taiwanese Dollar, | | | | | | | | | | | | | | | | | | | | | | |
Expiring 01/11/19 | | JPMorgan Chase | | TWD | 68,988 | | | | 2,240,000 | | | | 2,243,086 | | | | — | | | | (3,086 | ) |
Expiring 01/11/19 | | JPMorgan Chase | | TWD | 33,335 | | | | 1,083,000 | | | | 1,083,858 | | | | — | | | | (858 | ) |
Expiring 01/11/19 | | Morgan Stanley | | TWD | 58,932 | | | | 1,914,000 | | | | 1,916,139 | | | | — | | | | (2,139 | ) |
Expiring 01/11/19 | | UBS AG | | TWD | 202,384 | | | | 6,650,790 | | | | 6,580,375 | | | | 70,415 | | | | — | |
New Zealand Dollar, | | | | | | | | | | | | | | | | | | | | | | |
Expiring 01/18/19 | | Toronto Dominion | | NZD | 3,142 | | | | 2,056,000 | | | | 2,052,372 | | | | 3,628 | | | | — | |
Expiring 01/18/19 | | Toronto Dominion | | NZD | 2,372 | | | | 1,547,000 | | | | 1,549,622 | | | | — | | | | (2,622 | ) |
Expiring 01/18/19 | | Toronto Dominion | | NZD | 1,478 | | | | 966,000 | | | | 965,576 | | | | 424 | | | | — | |
Norwegian Krone, | | | | | | | | | | | | | | | | | | | | | | |
Expiring 01/25/19 | | Toronto Dominion | | NOK | 9,445 | | | | 1,143,000 | | | | 1,125,108 | | | | 17,892 | | | | — | |
Peruvian Nuevo Sol, | | | | | | | | | | | | | | | | | | | | | | |
Expiring 12/19/18 | | Barclays Bank PLC | | PEN | 3,581 | | | | 1,061,000 | | | | 1,060,016 | | | | 984 | | | | — | |
See Notes to Financial Statements.
| | | | |
| PGIM Absolute Return Bond Fund | | | 81 | |
Schedule of Investments (continued)
as of October 31, 2018
Forward foreign currency exchange contracts outstanding at October 31, 2018 (continued):
| | | | | | | | | | | | | | | | | | | | | | |
Sale Contracts | | Counterparty | | Notional
Amount
(000) | | | Value at
Settlement
Date | | | Current
Value | | | Unrealized
Appreciation | | | Unrealized
Depreciation | |
OTC Forward Foreign Currency Exchange Contracts (cont’d.): | | | | | | | | | | | | | |
Peruvian Nuevo Sol (cont’d.), | | | | | | | | | |
Expiring 12/19/18 | | JPMorgan Chase | | PEN | 7,834 | | | $ | 2,354,000 | | | $ | 2,318,961 | | | $ | 35,039 | | | $ | — | |
Expiring 12/19/18 | | JPMorgan Chase | | PEN | 5,638 | | | | 1,691,000 | | | | 1,669,158 | | | | 21,842 | | | | — | |
Expiring 12/19/18 | | JPMorgan Chase | | PEN | 4,104 | | | | 1,235,000 | | | | 1,214,844 | | | | 20,156 | | | | — | |
Expiring 12/19/18 | | JPMorgan Chase | | PEN | 3,639 | | | | 1,096,000 | | | | 1,077,236 | | | | 18,764 | | | | — | |
Expiring 12/19/18 | | Morgan Stanley | | PEN | 5,165 | | | | 1,557,000 | | | | 1,529,100 | | | | 27,900 | | | | — | |
Philippine Peso, | | | | | | | | | | | | | | | | | | | | | | |
Expiring 12/14/18 | | Barclays Bank PLC | | PHP | 179,619 | | | | 3,314,000 | | | | 3,347,001 | | | | — | | | | (33,001 | ) |
Expiring 12/14/18 | | Barclays Bank PLC | | PHP | 46,154 | | | | 857,000 | | | | 860,025 | | | | — | | | | (3,025 | ) |
Expiring 12/14/18 | | Citibank NA | | PHP | 158,944 | | | | 2,914,000 | | | | 2,961,751 | | | | — | | | | (47,751 | ) |
Expiring 12/14/18 | | Citibank NA | | PHP | 86,083 | | | | 1,590,000 | | | | 1,604,056 | | | | — | | | | (14,056 | ) |
Expiring 12/14/18 | | JPMorgan Chase | | PHP | 165,531 | | | | 3,062,000 | | | | 3,084,481 | | | | — | | | | (22,481 | ) |
Expiring 12/14/18 | | JPMorgan Chase | | PHP | 158,838 | | | | 2,939,000 | | | | 2,959,779 | | | | — | | | | (20,779 | ) |
Expiring 12/14/18 | | JPMorgan Chase | | PHP | 154,974 | | | | 2,833,000 | | | | 2,887,765 | | | | — | | | | (54,765 | ) |
Expiring 12/14/18 | | JPMorgan Chase | | PHP | 89,267 | | | | 1,661,250 | | | | 1,663,399 | | | | — | | | | (2,149 | ) |
Expiring 12/14/18 | | JPMorgan Chase | | PHP | 61,449 | | | | 1,139,000 | | | | 1,145,036 | | | | — | | | | (6,036 | ) |
Expiring 12/14/18 | | Morgan Stanley | | PHP | 192,137 | | | | 3,519,962 | | | | 3,580,267 | | | | — | | | | (60,305 | ) |
Polish Zloty, | | | | | | | | | | | | | | | | | | | | | | |
Expiring 01/25/19 | | Goldman Sachs International | | PLN | 76,556 | | | | 20,510,520 | | | | 20,003,198 | | | | 507,322 | | | | — | |
Russian Ruble, | | | | | | | | | | | | | | | | | | | | | | |
Expiring 12/19/18 | | JPMorgan Chase | | RUB | 340,848 | | | | 5,074,024 | | | | 5,142,143 | | | | — | | | | (68,119 | ) |
Expiring 12/19/18 | | JPMorgan Chase | | RUB | 99,843 | | | | 1,479,291 | | | | 1,506,258 | | | | — | | | | (26,967 | ) |
Expiring 12/24/19 | | Barclays Bank PLC | | RUB | 114,712 | | | | 1,758,315 | | | | 1,656,311 | | | | 102,004 | | | | — | |
See Notes to Financial Statements.
Forward foreign currency exchange contracts outstanding at October 31, 2018 (continued):
| | | | | | | | | | | | | | | | | | | | | | |
Sale Contracts | | Counterparty | | Notional
Amount
(000) | | | Value at
Settlement
Date | | | Current
Value | | | Unrealized
Appreciation | | | Unrealized
Depreciation | |
OTC Forward Foreign Currency Exchange Contracts (cont’d.): | | | | | | | | | | | | | |
Russian Ruble (cont’d.), | | | | | | | | | |
Expiring 12/24/19 | | Goldman Sachs International | | RUB | 207,704 | | | $ | 3,385,000 | | | $ | 2,998,991 | | | $ | 386,009 | | | $ | — | |
Expiring 12/24/19 | | JPMorgan Chase | | RUB | 59,887 | | | | 804,126 | | | | 864,701 | | | | — | | | | (60,575 | ) |
Expiring 03/31/20 | | Citibank NA | | RUB | 305,303 | �� | | | 4,444,000 | | | | 4,360,205 | | | | 83,795 | | | | — | |
Expiring 03/31/20 | | JPMorgan Chase | | RUB | 311,865 | | | | 4,119,743 | | | | 4,453,918 | | | | — | | | | (334,175 | ) |
Saudi Arabian Riyal, | | | | | | | | | | | | | | | | | | | | | | |
Expiring 11/12/19 | | Morgan Stanley | | SAR | 113,400 | | | | 30,000,000 | | | | 30,196,685 | | | | — | | | | (196,685 | ) |
Singapore Dollar, | | | | | | | | | | | | | | | | | | | | | | |
Expiring 11/09/18 | | Citibank NA | | SGD | 4,792 | | | | 3,506,546 | | | | 3,460,302 | | | | 46,244 | | | | — | |
Expiring 11/09/18 | | Citibank NA | | SGD | 4,069 | | | | 2,981,690 | | | | 2,938,384 | | | | 43,306 | | | | — | |
Expiring 11/09/18 | | Deutsche Bank AG | | SGD | 3,758 | | | | 2,728,000 | | | | 2,713,609 | | | | 14,391 | | | | — | |
Expiring 11/09/18 | | Deutsche Bank AG | | SGD | 2,742 | | | | 1,979,000 | | | | 1,979,870 | | | | — | | | | (870 | ) |
Expiring 11/09/18 | | Deutsche Bank AG | | SGD | 2,623 | | | | 1,898,000 | | | | 1,894,146 | | | | 3,854 | | | | — | |
Expiring 11/09/18 | | Deutsche Bank AG | | SGD | 1,486 | | | | 1,073,000 | | | | 1,072,842 | | | | 158 | | | | — | |
Expiring 11/09/18 | | Deutsche Bank AG | | SGD | 1,237 | | | | 894,000 | | | | 893,532 | | | | 468 | | | | — | |
Expiring 11/09/18 | | Goldman Sachs International | | SGD | 1,865 | | | | 1,357,000 | | | | 1,346,558 | | | | 10,442 | | | | — | |
Expiring 11/09/18 | | Goldman Sachs International | | SGD | 1,276 | | | | 926,000 | | | | 921,306 | | | | 4,694 | | | | — | |
Expiring 11/09/18 | | JPMorgan Chase | | SGD | 2,967 | | | | 2,165,000 | | | | 2,142,138 | | | | 22,862 | | | | — | |
Expiring 11/09/18 | | JPMorgan Chase | | SGD | 2,700 | | | | 1,962,000 | | | | 1,949,653 | | | | 12,347 | | | | — | |
Expiring 11/09/18 | | JPMorgan Chase | | SGD | 1,842 | | | | 1,333,000 | | | | 1,329,727 | | | | 3,273 | | | | — | |
Expiring 11/09/18 | | Morgan Stanley | | SGD | 4,025 | | | | 2,954,300 | | | | 2,906,603 | | | | 47,697 | | | | — | |
Expiring 11/09/18 | | Toronto Dominion | | SGD | 1,335 | | | | 970,000 | | | | 964,089 | | | | 5,911 | | | | — | |
Expiring 11/09/18 | | UBS AG | | SGD | 5,107 | | | | 3,695,000 | | | | 3,687,901 | | | | 7,099 | | | | — | |
See Notes to Financial Statements.
| | | | |
| PGIM Absolute Return Bond Fund | | | 83 | |
Schedule of Investments (continued)
as of October 31, 2018
Forward foreign currency exchange contracts outstanding at October 31, 2018 (continued):
| | | | | | | | | | | | | | | | | | | | | | |
Sale Contracts | | Counterparty | | Notional
Amount
(000) | | | Value at
Settlement
Date | | | Current
Value | | | Unrealized
Appreciation | | | Unrealized
Depreciation | |
OTC Forward Foreign Currency Exchange Contracts (cont’d.): | | | | | |
South African Rand, | | | | | | | | | | | | | | | | | | | | | | |
Expiring 11/09/18 | | Citibank NA | | ZAR | 47,105 | | | $ | 3,274,836 | | | $ | 3,189,398 | | | $ | 85,438 | | | $ | — | |
Expiring 12/07/18 | | Barclays Bank PLC | | ZAR | 108,903 | | | | 7,121,483 | | | | 7,347,620 | | | | — | | | | (226,137 | ) |
Expiring 12/07/18 | | Barclays Bank PLC | | ZAR | 108,903 | | | | 7,121,483 | | | | 7,347,620 | | | | — | | | | (226,137 | ) |
Expiring 12/07/18 | | Citibank NA | | ZAR | 38,151 | | | | 2,672,660 | | | | 2,574,014 | | | | 98,646 | | | | — | |
Expiring 12/07/18 | | Citibank NA | | ZAR | 29,112 | | | | 2,022,693 | | | | 1,964,195 | | | | 58,498 | | | | — | |
Expiring 12/07/18 | | Citibank NA | | ZAR | 18,108 | | | | 1,247,562 | | | | 1,221,759 | | | | 25,803 | | | | — | |
Expiring 12/07/18 | | Citibank NA | | ZAR | 12,720 | | | | 874,668 | | | | 858,230 | | | | 16,438 | | | | — | |
Expiring 12/07/18 | | Goldman Sachs International | | ZAR | 31,831 | | | | 2,057,485 | | | | 2,147,639 | | | | — | | | | (90,154 | ) |
Expiring 12/07/18 | | JPMorgan Chase | | ZAR | 34,738 | | | | 2,231,000 | | | | 2,343,742 | | | | — | | | | (112,742 | ) |
Expiring 12/07/18 | | JPMorgan Chase | | ZAR | 31,257 | | | | 2,079,896 | | | | 2,108,867 | | | | — | | | | (28,971 | ) |
Expiring 12/07/18 | | Toronto Dominion | | ZAR | 14,649 | | | | 955,000 | | | | 988,329 | | | | — | | | | (33,329 | ) |
Expiring 12/30/19 | | Goldman Sachs International | | ZAR | 36,889 | | | | 2,328,000 | | | | 2,366,183 | | | | — | | | | (38,183 | ) |
Expiring 12/30/19 | | JPMorgan Chase | | ZAR | 15,685 | | | | 1,039,428 | | | | 1,006,089 | | | | 33,339 | | | | — | |
Expiring 03/31/20 | | Barclays Bank PLC | | ZAR | 25,650 | | | | 1,706,000 | | | | 1,624,338 | | | | 81,662 | | | | — | |
Expiring 03/31/20 | | Goldman Sachs International | | ZAR | 25,843 | | | | 1,633,000 | | | | 1,636,583 | | | | — | | | | (3,583 | ) |
Expiring 03/31/20 | | JPMorgan Chase | | ZAR | 57,893 | | | | 3,787,558 | | | | 3,666,221 | | | | 121,337 | | | | — | |
Expiring 07/29/20 | | BNP Paribas | | ZAR | 134,737 | | | | 8,256,000 | | | | 8,389,224 | | | | — | | | | (133,224 | ) |
Expiring 09/30/20 | | Goldman Sachs International | | ZAR | 26,420 | | | | 1,651,000 | | | | 1,630,254 | | | | 20,746 | | | | — | |
South Korean Won, | | | | | | | | | | | | | | | | | | | | | | |
Expiring 01/16/19 | | Barclays Bank PLC | | KRW | 5,670,610 | | | | 4,991,690 | | | | 4,990,040 | | | | 1,650 | | | | — | |
Expiring 01/16/19 | | Barclays Bank PLC | | KRW | 3,013,278 | | | | 2,684,674 | | | | 2,651,633 | | | | 33,041 | | | | — | |
Expiring 01/16/19 | | Barclays Bank PLC | | KRW | 1,153,142 | | | | 1,015,000 | | | | 1,014,745 | | | | 255 | | | | — | |
See Notes to Financial Statements.
Forward foreign currency exchange contracts outstanding at October 31, 2018 (continued):
| | | | | | | | | | | | | | | | | | | | | | |
Sale Contracts | | Counterparty | | Notional
Amount
(000) | | | Value at
Settlement
Date | | | Current
Value | | | Unrealized
Appreciation | | | Unrealized
Depreciation | |
OTC Forward Foreign Currency Exchange Contracts (cont’d.): | | | | | | | | | | | | | |
South Korean Won (cont’d.), | | | | | |
Expiring 01/16/19 | | Goldman Sachs International | | KRW | 2,974,049 | | | $ | 2,634,000 | | | $ | 2,617,113 | | | $ | 16,887 | | | $ | — | |
Expiring 01/16/19 | | JPMorgan Chase | | KRW | 1,626,411 | | | | 1,430,000 | | | | 1,431,214 | | | | — | | | | (1,214 | ) |
Expiring 01/16/19 | | JPMorgan Chase | | KRW | 1,555,096 | | | | 1,364,000 | | | | 1,368,458 | | | | — | | | | (4,458 | ) |
Expiring 01/16/19 | | JPMorgan Chase | | KRW | 1,320,123 | | | | 1,177,000 | | | | 1,161,686 | | | | 15,314 | | | | — | |
Expiring 01/16/19 | | JPMorgan Chase | | KRW | 1,141,334 | | | | 1,012,000 | | | | 1,004,354 | | | | 7,646 | | | | — | |
Expiring 01/16/19 | | JPMorgan Chase | | KRW | 1,011,206 | | | | 893,000 | | | | 889,844 | | | | 3,156 | | | | — | |
Expiring 01/16/19 | | JPMorgan Chase | | KRW | 216,037 | | | | 190,437 | | | | 190,109 | | | | 328 | | | | — | |
Expiring 01/16/19 | | Morgan Stanley | | KRW | 3,485,704 | | | | 3,073,000 | | | | 3,067,360 | | | | 5,640 | | | | — | |
Expiring 01/16/19 | | Morgan Stanley | | KRW | 1,505,295 | | | | 1,324,000 | | | | 1,324,634 | | | | — | | | | (634 | ) |
Expiring 12/24/19 | | Goldman Sachs International | | KRW | 130,134 | | | | 123,000 | | | | 116,466 | | | | 6,534 | | | | — | |
Swedish Krona, | | | | | | | | | | | | | | | | | | | | | | |
Expiring 01/25/19 | | Goldman Sachs International | | SEK | 66,848 | | | | 7,497,577 | | | | 7,368,668 | | | | 128,909 | | | | — | |
Expiring 01/25/19 | | Toronto Dominion | | SEK | 11,622 | | | | 1,282,000 | | | | 1,281,033 | | | | 967 | | | | — | |
Swiss Franc, | | | | | | | | | | | | | | | | | | | | | | |
Expiring 01/25/19 | | BNP Paribas | | CHF | 18,514 | | | | 18,731,695 | | | | 18,554,015 | | | | 177,680 | | | | — | |
Expiring 01/25/19 | | Toronto Dominion | | CHF | 18,514 | | | | 18,749,716 | | | | 18,554,014 | | | | 195,702 | | | | — | |
Expiring 01/25/19 | | Toronto Dominion | | CHF | 2,306 | | | | 2,325,000 | | | | 2,311,059 | | | | 13,941 | | | | — | |
Expiring 01/25/19 | | Toronto Dominion | | CHF | 1,381 | | | | 1,385,000 | | | | 1,384,212 | | | | 788 | | | | — | |
Thai Baht, | | | | | | | | | | | | | | | | | | | | | | |
Expiring 11/09/18 | | Citibank NA | | THB | 72,214 | | | | 2,221,000 | | | | 2,178,853 | | | | 42,147 | | | | — | |
Expiring 11/09/18 | | Citibank NA | | THB | 57,777 | | | | 1,742,000 | | | | 1,743,264 | | | | — | | | | (1,264 | ) |
Expiring 11/09/18 | | Citibank NA | | THB | 44,865 | | | | 1,354,000 | | | | 1,353,675 | | | | 325 | | | | — | |
Expiring 11/09/18 | | Citibank NA | | THB | 34,591 | | | | 1,040,000 | | | | 1,043,704 | | | | — | | | | (3,704 | ) |
Expiring 11/09/18 | | Citibank NA | | THB | 31,289 | | | | 964,000 | | | | 944,048 | | | | 19,952 | | | | — | |
See Notes to Financial Statements.
| | | | |
| PGIM Absolute Return Bond Fund | | | 85 | |
Schedule of Investments (continued)
as of October 31, 2018
Forward foreign currency exchange contracts outstanding at October 31, 2018 (continued):
| | | | | | | | | | | | | | | | | | | | | | |
Sale Contracts | | Counterparty | | Notional
Amount
(000) | | | Value at
Settlement
Date | | | Current
Value | | | Unrealized
Appreciation | | | Unrealized
Depreciation | |
OTC Forward Foreign Currency Exchange Contracts (cont’d.): | | | | | | | | | | | | | |
Thai Baht (cont’d.), | | | | | | | | | |
Expiring 11/09/18 | | Citibank NA | | THB | 29,429 | | | $ | 884,000 | | | $ | 887,936 | | | $ | — | | | $ | (3,936 | ) |
Expiring 11/09/18 | | Citibank NA | | THB | 28,470 | | | | 864,000 | | | | 858,994 | | | | 5,006 | | | | — | |
Expiring 11/09/18 | | UBS AG | | THB | 71,720 | | | | 2,154,802 | | | | 2,163,973 | | | | — | | | | (9,171 | ) |
Turkish Lira, | | | | | | | | | | | | | | | | | | | | | | |
Expiring 12/07/18 | | JPMorgan Chase | | TRY | 13,543 | | | | 2,327,600 | | | | 2,367,080 | | | | — | | | | (39,480 | ) |
Expiring 12/07/18 | | JPMorgan Chase | | TRY | 3,309 | | | | 568,480 | | | | 578,420 | | | | — | | | | (9,940 | ) |
Expiring 12/24/19 | | BNP Paribas | | TRY | 23,277 | | | | 5,000,000 | | | | 3,308,354 | | | | 1,691,646 | | | | — | |
Expiring 12/24/19 | | JPMorgan Chase | | TRY | 31,803 | | | | 5,614,016 | | | | 4,520,306 | | | | 1,093,710 | | | | — | |
Expiring 01/31/20 | | JPMorgan Chase | | TRY | 41,748 | | | | 7,293,523 | | | | 5,832,821 | | | | 1,460,702 | | | | — | |
Expiring 04/30/20 | | Citibank NA | | TRY | 36,508 | | | | 4,824,900 | | | | 4,891,550 | | | | — | | | | (66,650 | ) |
Expiring 04/30/20 | | Citibank NA | | TRY | 14,821 | | | | 2,294,125 | | | | 1,985,850 | | | | 308,275 | | | | — | |
Expiring 04/30/20 | | Citibank NA | | TRY | 5,288 | | | | 736,000 | | | | 708,545 | | | | 27,455 | | | | — | |
Expiring 04/30/20 | | Goldman Sachs International | | TRY | 53,577 | | | | 9,291,000 | | | | 7,178,569 | | | | 2,112,431 | | | | — | |
Expiring 04/30/20 | | JPMorgan Chase | | TRY | 10,122 | | | | 1,566,000 | | | | 1,356,243 | | | | 209,757 | | | | — | |
Expiring 06/30/20 | | Citibank NA | | TRY | 16,668 | | | | 1,734,392 | | | | 2,168,530 | | | | — | | | | (434,138 | ) |
Expiring 06/30/20 | | Citibank NA | | TRY | 10,788 | | | | 1,120,000 | | | | 1,403,554 | | | | — | | | | (283,554 | ) |
Expiring 06/30/20 | | JPMorgan Chase | | TRY | 15,609 | | | | 2,128,000 | | | | 2,030,805 | | | | 97,195 | | | | — | |
Expiring 06/30/20 | | Morgan Stanley | | TRY | 72,659 | | | | 11,029,000 | | | | 9,453,323 | | | | 1,575,677 | | | | — | |
| | | | | | | | | | | | | | | | | | | | | | |
| | | | | | | | $ | 1,121,348,744 | | | $ | 1,104,067,311 | | | | 22,804,753 | | | | (5,523,320 | ) |
| | | | | | | | | | | | | | | | | | | | | | |
| | | | | | | | | | | | | | | | $ | 32,728,424 | | | $ | (18,223,125 | ) |
| | | | | | | | | | | | | | | | | | | | | | |
Cross currency exchange contracts outstanding at October 31, 2018:
| | | | | | | | | | | | | | | | | | | | | | | | | | | | |
Settlement | | Type | | Notional
Amount
(000) | | | In Exchange
For (000) | | | Unrealized
Appreciation | | | Unrealized
Depreciation | | | Counterparty | |
OTC Cross Currency Exchange Contracts: | | | | | | | | | |
01/25/19 | | | | CHF | | | 2,957 | | | | EUR | | | | 2,596 | | | $ | — | | | $ | (1,250 | ) | | | Toronto Dominion | |
02/28/19 | | | | EUR | | | 2,458 | | | | TRY | | | | 13,146 | | | | 627,122 | | | | — | | | | JPMorgan Chase | |
12/30/19 | | | | EUR | | | 3,269 | | | | ZAR | | | | 56,766 | | | | 213,908 | | | | — | | | | Deutsche Bank AG | |
12/30/19 | | | | ZAR | | | 33,780 | | | | EUR | | | | 2,038 | | | | — | | | | (236,630 | ) | | | Morgan Stanley | |
See Notes to Financial Statements.
Cross currency exchange contracts outstanding at October 31, 2018 (continued):
| | | | | | | | | | | | | | | | | | | | | | | | | | | | |
Settlement | | Type | | Notional
Amount
(000) | | | In Exchange
For (000) | | | Unrealized
Appreciation | | | Unrealized
Depreciation | | | Counterparty | |
OTC Cross Currency Exchange Contracts (cont’d.): | | | | | | | | | | | | | |
01/31/20 | | | | AUD | | | 6,894 | | | | JPY | | | | 536,215 | | | $ | — | | | $ | (30,087 | ) | | | Deutsche Bank AG | |
01/31/20 | | | | TRY | | | 59,401 | | | | EUR | | | | 8,169 | | | | — | | | | (1,364,500 | ) | | | Goldman Sachs International | |
01/31/20 | | | | EUR | | | 3,871 | | | | TRY | | | | 23,609 | | | | 1,280,717 | | | | — | | | | Goldman Sachs International | |
03/31/20 | | | | ZAR | | | 153,638 | | | | EUR | | | | 8,269 | | | | — | | | | (109,486 | ) | | | Morgan Stanley | |
03/31/20 | | | | EUR | | | 7,965 | | | | ZAR | | | | 134,569 | | | | 955,384 | | | | — | | | | Morgan Stanley | |
04/30/20 | | | | TRY | | | 102,842 | | | | EUR | | | | 11,170 | | | | 450,141 | | | | — | | | | BNP Paribas | |
04/30/20 | | | | EUR | | | 10,404 | | | | TRY | | | | 78,478 | | | | 1,900,348 | | | | — | | | | Goldman Sachs International | |
07/29/20 | | | | EUR | | | 12,064 | | | | TRY | | | | 116,743 | | | | — | | | | (452,360 | ) | | | BNP Paribas | |
07/29/20 | | | | TRY | | | 85,431 | | | | EUR | | | | 7,021 | | | | 2,506,439 | | | | — | | | | Morgan Stanley | |
08/31/20 | | | | EUR | | | 4,722 | | | | ZAR | | | | 91,088 | | | | 56,887 | | | | — | | | | Morgan Stanley | |
11/30/20 | | | | JPY | | | 1,016,141 | | | | AUD | | | | 12,805 | | | | 462,256 | | | | — | | | | Morgan Stanley | |
| | | | | | | | | | | | | | | | | | | | | | | | | | | | |
| | | | | | | | | | | | | | | | | | $ | 8,453,202 | | | $ | (2,194,313 | ) | | | | |
| | | | | | | | | | | | | | | | | | | | | | | | | | | | |
Credit default swap agreements outstanding at October 31, 2018:
| | | | | | | | | | | | | | | | | | | | | | | | | | | | | | |
Reference
Entity/
Obligation | | Termination
Date | | | Fixed
Rate | | | Notional
Amount
(000)#(3) | | | Implied
Credit
Spread at
October 31,
2018(4) | | | Fair
Value | | | Upfront
Premiums
Paid
(Received) | | | Unrealized
Appreciation
(Depreciation) | | | Counterparty |
OTC Credit Default Swap Agreements on asset-backed securities—Sell Protection(2)^: |
3i Debt Management | | | 12/07/18 | | | | 1.000%(M) | | | | 1,705 | | | | * | | | $ | 2,030 | | | $ | — | | | $ | 2,030 | | | Goldman Sachs International |
AMMC CLO Ltd. | | | 12/07/18 | | | | 1.000%(M) | | | | 632 | | | | * | | | | 753 | | | | — | | | | 753 | | | Goldman Sachs International |
Anchorage Capital CLO Ltd. | | | 12/07/18 | | | | 0.500%(M) | | | | 1,912 | | | | 15.670 | % | | | 1,166 | | | | — | | | | 1,166 | | | Goldman Sachs International |
Anchorage Capital CLO Ltd. | | | 12/07/18 | | | | 0.500%(M) | | | | 328 | | | | * | | | | 195 | | | | — | | | | 195 | | | Goldman Sachs International |
Arrowpoint CLO Ltd. | | | 12/07/18 | | | | 0.500%(M) | | | | 2,175 | | | | * | | | | 1,295 | | | | — | | | | 1,295 | | | Goldman Sachs International |
Arrowpoint CLO Ltd. | | | 12/07/18 | | | | 0.500%(M) | | | | 1,270 | | | | * | | | | 1,018 | | | | — | | | | 1,018 | | | Goldman Sachs International |
Bain Capital Credit LP | | | 12/07/18 | | | | 1.000%(M) | | | | 365 | | | | * | | | | 435 | | | | — | | | | 435 | | | Goldman Sachs International |
See Notes to Financial Statements.
| | | | |
| PGIM Absolute Return Bond Fund | | | 87 | |
Schedule of Investments (continued)
as of October 31, 2018
Credit default swap agreements outstanding at October 31, 2018 (continued):
| | | | | | | | | | | | | | | | | | | | | | | | | | | | | | |
Reference
Entity/
Obligation | | Termination
Date | | | Fixed
Rate | | | Notional
Amount
(000)#(3) | | | Implied
Credit
Spread at
October 31,
2018(4) | | | Fair
Value | | | Upfront
Premiums
Paid
(Received) | | | Unrealized
Appreciation
(Depreciation) | | | Counterparty |
OTC Credit Default Swap Agreements on asset-backed securities—Sell Protection(2)^ (cont’d.): |
Banc of America Commercial Mortgage Trust | | | 11/29/18 | | | | 1.250%(M) | | | | 50 | | | | 6.794 | % | | $ | 55 | | | $ | — | | | $ | 55 | | | Goldman Sachs International |
Banc of America Commercial Mortgage Trust | | | 11/29/18 | | | | 1.250%(M) | | | | 28 | | | | 6.780 | % | | | 31 | | | | — | | | | 31 | | | Goldman Sachs International |
Bear Stearns Asset-Backed Securities Trust | | | 11/30/18 | | | | 1.250%(M) | | | | 791 | | | | * | | | | 850 | | | | — | | | | 850 | | | Goldman Sachs International |
Bear Stearns Asset-Backed Securities Trust | | | 11/30/18 | | | | 1.250%(M) | | | | 458 | | | | * | | | | 492 | | | | — | | | | 492 | | | Goldman Sachs International |
Bear Stearns Asset-Backed Securities Trust | | | 11/30/18 | | | | 1.250%(M) | | | | 248 | | | | * | | | | 266 | | | | — | | | | 266 | | | Goldman Sachs International |
BlackRock | | | 12/07/18 | | | | 1.000%(M) | | | | 156 | | | | * | | | | 186 | | | | — | | | | 186 | | | Goldman Sachs International |
Blue Mountain CLO II Ltd. | | | 12/07/18 | | | | 1.000%(M) | | | | 211 | | | | * | | | | 251 | | | | — | | | | 251 | | | Goldman Sachs International |
BlueMountain CLO II Ltd. | | | 12/07/18 | | | | 0.500%(M) | | | | 39 | | | | * | | | | 43 | | | | — | | | | 43 | | | Goldman Sachs International |
Carlyle | | | 12/07/18 | | | | 0.500%(M) | | | | 39 | | | | * | | | | 23 | | | | — | | | | 23 | | | Goldman Sachs International |
Chase Mortgage | | | 11/30/18 | | | | 1.250%(M) | | | | 959 | | | | * | | | | 1,030 | | | | — | | | | 1,030 | | | Goldman Sachs International |
CIFC | | | 12/07/18 | | | | 0.500%(M) | | | | 313 | | | | * | | | | 186 | | | | — | | | | 186 | | | Goldman Sachs International |
Citigroup Commercial Mortgage Trust | | | 11/29/18 | | | | 1.250%(M) | | | | 397 | | | | * | | | | 440 | | | | — | | | | 440 | | | Goldman Sachs International |
Citigroup Commercial Mortgage Trust | | | 11/29/18 | | | | 1.250%(M) | | | | 151 | | | | * | | | | 168 | | | | — | | | | 168 | | | Goldman Sachs International |
See Notes to Financial Statements.
Credit default swap agreements outstanding at October 31, 2018 (continued):
| | | | | | | | | | | | | | | | | | | | | | | | | | | | | | |
Reference
Entity/
Obligation | | Termination
Date | | | Fixed
Rate | | | Notional
Amount
(000)#(3) | | | Implied
Credit
Spread at
October 31,
2018(4) | | | Fair
Value | | | Upfront
Premiums
Paid
(Received) | | | Unrealized
Appreciation
(Depreciation) | | | Counterparty |
OTC Credit Default Swap Agreements on asset-backed securities—Sell Protection(2)^ (cont’d.): |
Citigroup Commercial Mortgage Trust | | | 11/29/18 | | | | 1.250%(M) | | | | 137 | | | | * | | | $ | 152 | | | $ | — | | | $ | 152 | | | Goldman Sachs International |
Citigroup Commercial Mortgage Trust | | | 11/29/18 | | | | 1.250%(M) | | | | 32 | | | | * | | | | 36 | | | | — | | | | 36 | | | Goldman Sachs International |
Citigroup Mortgage Loan Trust | | | 11/30/18 | | | | 1.250%(M) | | | | 242 | | | | * | | | | 260 | | | | — | | | | 260 | | | Goldman Sachs International |
COMM Mortgage Trust | | | 11/29/18 | | | | 1.250%(M) | | | | 213 | | | | 4.550 | % | | | 236 | | | | — | | | | 236 | | | Goldman Sachs International |
COMM Mortgage Trust | | | 11/29/18 | | | | 1.250%(M) | | | | 199 | | | | 19.740 | % | | | 221 | | | | — | | | | 221 | | | Goldman Sachs International |
COMM Mortgage Trust | | | 11/29/18 | | | | 1.250%(M) | | | | 191 | | | | * | | | | 212 | | | | — | | | | 212 | | | Goldman Sachs International |
COMM Mortgage Trust | | | 11/29/18 | | | | 1.250%(M) | | | | 174 | | | | * | | | | 193 | | | | — | | | | 193 | | | Goldman Sachs International |
COMM Mortgage Trust | | | 11/29/18 | | | | 1.250%(M) | | | | 158 | | | | * | | | | 175 | | | | — | | | | 175 | | | Goldman Sachs International |
COMM Mortgage Trust | | | 11/29/18 | | | | 1.250%(M) | | | | 103 | | | | * | | | | 114 | | | | — | | | | 114 | | | Goldman Sachs International |
COMM Mortgage Trust | | | 11/29/18 | | | | 1.250%(M) | | | | 73 | | | | * | | | | 81 | | | | — | | | | 81 | | | Goldman Sachs International |
COMM Mortgage Trust | | | 11/29/18 | | | | 1.250%(M) | | | | 71 | | | | 7.460 | % | | | 79 | | | | — | | | | 79 | | | Goldman Sachs International |
COMM Mortgage Trust | | | 11/29/18 | | | | 1.250%(M) | | | | 54 | | | | * | | | | 60 | | | | — | | | | 60 | | | Goldman Sachs International |
Countrywide Alternative Loan Trust | | | 11/30/18 | | | | 1.250%(M) | | | | 550 | | | | * | | | | 591 | | | | — | | | | 591 | | | Goldman Sachs International |
See Notes to Financial Statements.
| | | | |
| PGIM Absolute Return Bond Fund | | | 89 | |
Schedule of Investments (continued)
as of October 31, 2018
Credit default swap agreements outstanding at October 31, 2018 (continued):
| | | | | | | | | | | | | | | | | | | | | | | | | | | | | | |
Reference
Entity/
Obligation | | Termination
Date | | | Fixed
Rate | | | Notional
Amount
(000)#(3) | | | Implied
Credit
Spread at
October 31,
2018(4) | | | Fair
Value | | | Upfront
Premiums
Paid
(Received) | | | Unrealized
Appreciation
(Depreciation) | | | Counterparty |
OTC Credit Default Swap Agreements on asset-backed securities—Sell Protection(2)^ (cont’d.): |
Countrywide Prime Mortgage | | | 11/30/18 | | | | 1.250%(M) | | | | 200 | | | | * | | | $ | 214 | | | $ | — | | | $ | 214 | | | Goldman Sachs International |
CSAM | | | 12/07/18 | | | | 0.500%(M) | | | | 47 | | | | * | | | | 28 | | | | — | | | | 28 | | | Goldman Sachs International |
Deutsche Bank Alta Mortgages | | | 11/30/18 | | | | 1.250%(M) | | | | 779 | | | | * | | | | 837 | | | | — | | | | 837 | | | Goldman Sachs International |
Deutsche Bank Alta Mortgages | | | 11/30/18 | | | | 1.250%(M) | | | | 412 | | | | * | | | | 443 | | | | — | | | | 443 | | | Goldman Sachs International |
Ellington CLO I Ltd. | | | 12/07/18 | | | | 0.500%(M) | | | | 813 | | | | * | | | | 484 | | | | — | | | | 484 | | | Goldman Sachs International |
Ellington CLO I Ltd. | | | 12/07/18 | | | | 1.000%(M) | | | | 508 | | | | * | | | | 605 | | | | — | | | | 605 | | | Goldman Sachs International |
Ellington CLO I Ltd. | | | 12/07/18 | | | | 1.000%(M) | | | | 457 | | | | * | | | | 545 | | | | — | | | | 545 | | | Goldman Sachs International |
Equity One Home Equity | | | 11/30/18 | | | | 1.250%(M) | | | | 655 | | | | * | | | | 704 | | | | — | | | | 704 | | | Goldman Sachs International |
First Franklin Home Equity | | | 11/30/18 | | | | 1.250%(M) | | | | 268 | | | | * | | | | 288 | | | | — | | | | 288 | | | Goldman Sachs International |
First Franklin Home Equity | | | 11/30/18 | | | | 1.250%(M) | | | | 97 | | | | * | | | | 104 | | | | — | | | | 104 | | | Goldman Sachs International |
Fortress Credit BSL Ltd. CLO | | | 12/07/18 | | | | 0.500%(M) | | | | 698 | | | | * | | | | 416 | | | | — | | | | 416 | | | Goldman Sachs International |
Fortress Credit BSL Ltd. CLO | | | 12/07/18 | | | | 0.500%(M) | | | | 450 | | | | * | | | | 268 | | | | — | | | | 268 | | | Goldman Sachs International |
Galaxy CLO Ltd. | | | 12/07/18 | | | | 1.000%(M) | | | | 252 | | | | * | | | | 300 | | | | — | | | | 300 | | | Goldman Sachs International |
See Notes to Financial Statements.
Credit default swap agreements outstanding at October 31, 2018 (continued):
| | | | | | | | | | | | | | | | | | | | | | | | | | | | | | |
Reference
Entity/
Obligation | | Termination
Date | | | Fixed
Rate | | | Notional
Amount
(000)#(3) | | | Implied
Credit
Spread at
October 31,
2018(4) | | | Fair
Value | | | Upfront
Premiums
Paid
(Received) | | | Unrealized
Appreciation
(Depreciation) | | | Counterparty |
OTC Credit Default Swap Agreements on asset-backed securities—Sell Protection(2)^ (cont’d.): |
GMAC Home Equity | | | 11/30/18 | | | | 1.250%(M) | | | | 101 | | | | * | | | $ | 108 | | | $ | — | | | $ | 108 | | | Goldman Sachs International |
Golub Capital Partners Fundings Ltd. | | | 12/07/18 | | | | 0.500%(M) | | | | 309 | | | | * | | | | 184 | | | | — | | | | 184 | | | Goldman Sachs International |
Greywolf CLO III Ltd. | | | 12/07/18 | | | | 1.000%(M) | | | | 222 | | | | * | | | | 264 | | | | — | | | | 264 | | | Goldman Sachs International |
GS Mortgage Securities Trust | | | 11/29/18 | | | | 1.250%(M) | | | | 236 | | | | 0.620 | % | | | 262 | | | | — | | | | 262 | | | Goldman Sachs International |
GS Mortgage Securities Trust | | | 11/29/18 | | | | 1.250%(M) | | | | 120 | | | | * | | | | 133 | | | | — | | | | 133 | | | Goldman Sachs International |
GS Mortgage Securities Trust | | | 11/29/18 | | | | 1.250%(M) | | | | 115 | | | | * | | | | 128 | | | | — | | | | 128 | | | Goldman Sachs International |
GS Mortgage Securities Trust | | | 11/29/18 | | | | 1.250%(M) | | | | 96 | | | | * | | | | 107 | | | | — | | | | 107 | | | Goldman Sachs International |
GSO | | | 12/07/18 | | | | 0.500%(M) | | | | 78 | | | | * | | | | 47 | | | | — | | | | 47 | | | Goldman Sachs International |
Halcyon Access LLC | | | 12/07/18 | | | | 0.500%(M) | | | | 78 | | | | * | | | | 47 | | | | — | | | | 47 | | | Goldman Sachs International |
HAYFIN | | | 12/07/18 | | | | 0.500%(M) | | | | 93 | | | | * | | | | 55 | | | | — | | | | 55 | | | Goldman Sachs International |
HighBridge | | | 12/07/18 | | | | 0.500%(M) | | | | 613 | | | | * | | | | 365 | | | | — | | | | 365 | | | Goldman Sachs International |
ICG US CLO Ltd. | | | 12/07/18 | | | | 1.000%(M) | | | | 665 | | | | * | | | | 791 | | | | — | | | | 791 | | | Goldman Sachs International |
Invesco | | | 12/07/18 | | | | 1.000%(M) | | | | 298 | | | | * | | | | 354 | | | | — | | | | 354 | | | Goldman Sachs International |
See Notes to Financial Statements.
| | | | |
| PGIM Absolute Return Bond Fund | | | 91 | |
Schedule of Investments (continued)
as of October 31, 2018
Credit default swap agreements outstanding at October 31, 2018 (continued):
| | | | | | | | | | | | | | | | | | | | | | | | | | | | | | |
Reference
Entity/
Obligation | | Termination
Date | | | Fixed
Rate | | | Notional
Amount
(000)#(3) | | | Implied
Credit
Spread at
October 31,
2018(4) | | | Fair
Value | | | Upfront
Premiums
Paid
(Received) | | | Unrealized
Appreciation
(Depreciation) | | | Counterparty |
OTC Credit Default Swap Agreements on asset-backed securities—Sell Protection(2)^ (cont’d.): |
Invesco | | | 12/07/18 | | | | 0.500%(M) | | | | 90 | | | | * | | | $ | 53 | | | $ | — | | | $ | 53 | | | Goldman Sachs International |
JPMBB Commercial Mortgage Securities Trust | | | 11/29/18 | | | | 1.250%(M) | | | | 283 | | | | * | | | | 314 | | | | — | | | | 314 | | | Goldman Sachs International |
JPMBB Commercial Mortgage Securities Trust | | | 11/29/18 | | | | 1.250%(M) | | | | 223 | | | | * | | | | 247 | | | | — | | | | 247 | | | Goldman Sachs International |
JPMBB Commercial Mortgage Securities Trust | | | 11/29/18 | | | | 1.250%(M) | | | | 31 | | | | * | | | | 34 | | | | — | | | | 34 | | | Goldman Sachs International |
KVK CLO Ltd. | | | 12/07/18 | | | | 1.000%(M) | | | | 273 | | | | * | | | | 325 | | | | — | | | | 325 | | | Goldman Sachs International |
Lehman Home Equity | | | 11/30/18 | | | | 1.250%(M) | | | | 717 | | | | * | | | | 770 | | | | — | | | | 770 | | | Goldman Sachs International |
Lehman Home Equity | | | 11/30/18 | | | | 1.250%(M) | | | | 111 | | | | * | | | | 120 | | | | — | | | | 120 | | | Goldman Sachs International |
MidOcean Credit CLO I | | | 12/07/18 | | | | 0.500%(M) | | | | 793 | | | | * | | | | 472 | | | | — | | | | 472 | | | Goldman Sachs International |
Morgan Stanley BAML Trust | | | 11/29/18 | | | | 1.250%(M) | | | | 187 | | | | 7.460 | % | | | 207 | | | | — | | | | 207 | | | Goldman Sachs International |
Morgan Stanley BAML Trust | | | 11/29/18 | | | | 1.250%(M) | | | | 129 | | | | 10.400 | % | | | 143 | | | | — | | | | 143 | | | Goldman Sachs International |
Morgan Stanley BAML Trust | | | 11/29/18 | | | | 1.250%(M) | | | | 121 | | | | * | | | | 134 | | | | — | | | | 134 | | | Goldman Sachs International |
Morgan Stanley BAML Trust | | | 11/29/18 | | | | 1.250%(M) | | | | 97 | | | | * | | | | 108 | | | | — | | | | 108 | | | Goldman Sachs International |
Morgan Stanley BAML Trust | | | 11/29/18 | | | | 1.250%(M) | | | | 40 | | | | 2.593 | % | | | 44 | | | | — | | | | 44 | | | Goldman Sachs International |
See Notes to Financial Statements.
Credit default swap agreements outstanding at October 31, 2018 (continued):
| | | | | | | | | | | | | | | | | | | | | | | | | | | | | | |
Reference
Entity/
Obligation | | Termination
Date | | | Fixed
Rate | | | Notional
Amount
(000)#(3) | | | Implied
Credit
Spread at
October 31,
2018(4) | | | Fair
Value | | | Upfront
Premiums
Paid
(Received) | | | Unrealized
Appreciation
(Depreciation) | | | Counterparty |
OTC Credit Default Swap Agreements on asset-backed securities—Sell Protection(2)^ (cont’d.): |
Morgan Stanley Home Equity | | | 11/30/18 | | | | 1.250%(M) | | | | 295 | | | | * | | | $ | 317 | | | $ | — | | | $ | 317 | | | Goldman Sachs International |
New Century Home Equity | | | 11/30/18 | | | | 1.250%(M) | | | | 707 | | | | * | | | | 760 | | | | — | | | | 760 | | | Goldman Sachs International |
New Century Home Equity | | | 11/30/18 | | | | 1.250%(M) | | | | 322 | | | | * | | | | 346 | | | | — | | | | 346 | | | Goldman Sachs International |
New Century Home Equity | | | 11/30/18 | | | | 1.250%(M) | | | | 131 | | | | * | | | | 141 | | | | — | | | | 141 | | | Goldman Sachs International |
Octagon | | | 12/07/18 | | | | 0.500%(M) | | | | 568 | | | | * | | | | 338 | | | | — | | | | 338 | | | Goldman Sachs International |
Octagon | | | 12/07/18 | | | | 0.500%(M) | | | | 89 | | | | * | | | | 53 | | | | — | | | | 53 | | | Goldman Sachs International |
Octagon Investment Partners X Ltd. | | | 12/07/18 | | | | 0.500%(M) | | | | 153 | | | | * | | | | 91 | | | | — | | | | 91 | | | Goldman Sachs International |
Octagon Investment Partners X Ltd. | | | 12/07/18 | | | | 0.500%(M) | | | | 147 | | | | * | | | | 88 | | | | — | | | | 88 | | | Goldman Sachs International |
Octagon Investment Partners X Ltd. | | | 12/07/18 | | | | 1.000%(M) | | | | 52 | | | | * | | | | 62 | | | | — | | | | 62 | | | Goldman Sachs International |
Octagon Investment Partners XXV Ltd. | | | 12/07/18 | | | | 1.000%(M) | | | | 46 | | | | * | | | | 8 | | | | — | | | | 8 | | | Goldman Sachs International |
RAAC Series | | | 11/30/18 | | | | 1.250%(M) | | | | 75 | | | | * | | | | 81 | | | | — | | | | 81 | | | Goldman Sachs International |
Residential Asset Securities Corp. | | | 11/30/18 | | | | 1.250%(M) | | | | 91 | | | | * | | | | 98 | | | | — | | | | 98 | | | Goldman Sachs International |
Rothchild Corp. | | | 12/07/18 | | | | 0.500%(M) | | | | 69 | | | | * | | | | 41 | | | | — | | | | 41 | | | Goldman Sachs International |
See Notes to Financial Statements.
| | | | |
| PGIM Absolute Return Bond Fund | | | 93 | |
Schedule of Investments (continued)
as of October 31, 2018
Credit default swap agreements outstanding at October 31, 2018 (continued):
| | | | | | | | | | | | | | | | | | | | | | | | | | | | | | |
Reference
Entity/
Obligation | | Termination
Date | | | Fixed
Rate | | | Notional
Amount
(000)#(3) | | | Implied
Credit
Spread at
October 31,
2018(4) | | | Fair
Value | | | Upfront
Premiums
Paid
(Received) | | | Unrealized
Appreciation
(Depreciation) | | | Counterparty |
OTC Credit Default Swap Agreements on asset-backed securities—Sell Protection(2)^ (cont’d.): |
Rsource CLO | | | 12/07/18 | | | | 0.500%(M) | | | | 308 | | | | * | | | $ | 183 | | | $ | — | | | $ | 183 | | | Goldman Sachs International |
SEIX Investments Advisors | | | 12/07/18 | | | | 0.500%(M) | | | | 2,076 | | | | * | | | | 1,266 | | | | — | | | | 1,266 | | | Goldman Sachs International |
SEIX Investments Advisors | | | 12/07/18 | | | | 0.500%(M) | | | | 430 | | | | * | | | | 256 | | | | — | | | | 256 | | | Goldman Sachs International |
Shackleton I CLO Ltd. | | | 12/07/18 | | | | 1.000%(M) | | | | 138 | | | | * | | | | 169 | | | | — | | | | 169 | | | Goldman Sachs International |
Shenkman Capital | | | 12/07/18 | | | | 0.500%(M) | | | | 622 | | | | * | | | | 371 | | | | — | | | | 371 | | | Goldman Sachs International |
Sound Point CLO I Ltd. | | | 12/07/18 | | | | 1.000%(M) | | | | 450 | | | | * | | | | 535 | | | | — | | | | 535 | | | Goldman Sachs International |
Steele Creek | | | 12/07/18 | | | | 1.000%(M) | | | | 418 | | | | * | | | | 498 | | | | — | | | | 498 | | | Goldman Sachs International |
Steele Creek | | | 12/07/18 | | | | 0.500%(M) | | | | 321 | | | | * | | | | 191 | | | | — | | | | 191 | | | Goldman Sachs International |
Steele Creek | | | 12/07/18 | | | | 0.500%(M) | | | | 315 | | | | * | | | | 187 | | | | — | | | | 187 | | | Goldman Sachs International |
Structured Agency Credit Risk | | | 11/30/18 | | | | 1.250%(M) | | | | 301 | | | | * | | | | 324 | | | | — | | | | 324 | | | Goldman Sachs International |
Telos CLO Ltd. | | | 12/07/18 | | | | 0.500%(M) | | | | 507 | | | | * | | | | 302 | | | | — | | | | 302 | | | Goldman Sachs International |
TPG | | | 12/07/18 | | | | 1.000%(M) | | | | 962 | | | | * | | | | 1,145 | | | | — | | | | 1,145 | | | Goldman Sachs International |
Trimaran | | | 12/07/18 | | | | 1.000%(M) | | | | 351 | | | | 9.580 | % | | | 428 | | | | — | | | | 428 | | | Goldman Sachs International |
See Notes to Financial Statements.
Credit default swap agreements outstanding at October 31, 2018 (continued):
| | | | | | | | | | | | | | | | | | | | | | | | | | | | | | |
Reference
Entity/
Obligation | | Termination
Date | | | Fixed
Rate | | | Notional
Amount
(000)#(3) | | | Implied
Credit
Spread at
October 31,
2018(4) | | | Fair
Value | | | Upfront
Premiums
Paid
(Received) | | | Unrealized
Appreciation
(Depreciation) | | | Counterparty |
OTC Credit Default Swap Agreements on asset-backed securities—Sell Protection(2)^ (cont’d.): |
Trimaran | | | 12/07/18 | | | | 1.000%(M) | | | | 258 | | | | * | | | $ | 307 | | | $ | — | | | $ | 307 | | | Goldman Sachs International |
Venture CDO Ltd. | | | 12/07/18 | | | | 0.500%(M) | | | | 752 | | | | * | | | | 448 | | | | — | | | | 448 | | | Goldman Sachs International |
Venture CDO Ltd. | | | 12/07/18 | | | | 1.000%(M) | | | | 367 | | | | * | | | | 249 | | | | — | | | | 249 | | | Goldman Sachs International |
Venture CDO Ltd. | | | 12/07/18 | | | | 1.000%(M) | | | | 62 | | | | * | | | | 74 | | | | — | | | | 74 | | | Goldman Sachs International |
VOYA | | | 12/07/18 | | | | 1.000%(M) | | | | 783 | | | | * | | | | 933 | | | | — | | | | 933 | | | Goldman Sachs International |
Wells Fargo Commercial Mortgage Trust | | | 11/29/18 | | | | 1.250%(M) | | | | 439 | | | | * | | | | 487 | | | | — | | | | 487 | | | Goldman Sachs International |
Wells Fargo Commercial Mortgage Trust | | | 11/29/18 | | | | 1.250%(M) | | | | 57 | | | | * | | | | 63 | | | | — | | | | 63 | | | Goldman Sachs International |
Wells Fargo Commercial Mortgage Trust | | | 11/29/18 | | | | 1.250%(M) | | | | 54 | | | | 6.780 | % | | | 60 | | | | — | | | | 60 | | | Goldman Sachs International |
Wells Fargo Commercial Mortgage Trust | | | 11/29/18 | | | | 1.250%(M) | | | | 47 | | | | 8.493 | % | | | 52 | | | | — | | | | 52 | | | Goldman Sachs International |
Wells Fargo Commercial Mortgage Trust | | | 11/29/18 | | | | 1.250%(M) | | | | 31 | | | | 4.670 | % | | | 34 | | | | — | | | | 34 | | | Goldman Sachs International |
Wells Fargo Commercial Mortgage Trust | | | 11/29/18 | | | | 1.250%(M) | | | | 25 | | | | 6.780 | % | | | 28 | | | | — | | | | 28 | | | Goldman Sachs International |
Wind River CLO Ltd. | | | 12/07/18 | | | | 1.000%(M) | | | | 1,001 | | | | * | | | | 1,191 | | | | — | | | | 1,191 | | | Goldman Sachs International |
Wind River CLO Ltd. | | | 12/07/18 | | | | 0.500%(M) | | | | 586 | | | | * | | | | 349 | | | | — | | | | 349 | | | Goldman Sachs International |
See Notes to Financial Statements.
| | | | |
| PGIM Absolute Return Bond Fund | | | 95 | |
Schedule of Investments (continued)
as of October 31, 2018
Credit default swap agreements outstanding at October 31, 2018 (continued):
| | | | | | | | | | | | | | | | | | | | | | | | | | | | | | |
Reference
Entity/
Obligation | | Termination
Date | | | Fixed
Rate | | | Notional
Amount
(000)#(3) | | | Implied
Credit
Spread at
October 31,
2018(4) | | | Fair
Value | | | Upfront
Premiums
Paid
(Received) | | | Unrealized
Appreciation
(Depreciation) | | | Counterparty |
OTC Credit Default Swap Agreements on asset-backed securities—Sell Protection(2)^ (cont’d.): |
Wind River CLO Ltd. | | | 12/07/18 | | | | 1.000%(M) | | | | 439 | | | | 7.000 | % | | $ | 522 | | | $ | — | | | $ | 522 | | | Goldman Sachs International |
Wind River CLO Ltd. | | | 12/07/18 | | | | 0.500%(M) | | | | 286 | | | | * | | | | 170 | | | | — | | | | 170 | | | Goldman Sachs International |
Wind River CLO Ltd. | | | 12/07/18 | | | | 0.500%(M) | | | | 268 | | | | * | | | | 160 | | | | — | | | | 160 | | | Goldman Sachs International |
Wind River CLO Ltd. | | | 12/07/18 | | | | 0.500%(M) | | | | 161 | | | | * | | | | 96 | | | | — | | | | 96 | | | Goldman Sachs International |
Wind River CLO Ltd. | | | 12/07/18 | | | | 1.000%(M) | | | | 73 | | | | * | | | | 87 | | | | — | | | | 87 | | | Goldman Sachs International |
Wind River CLO Ltd. | | | 12/07/18 | | | | 1.000%(M) | | | | 73 | | | | * | | | | 87 | | | | — | | | | 87 | | | Goldman Sachs International |
ZAIS CDO | | | 12/07/18 | | | | 1.000%(M) | | | | 271 | | | | * | | | | 323 | | | | — | | | | 323 | | | Goldman Sachs International |
| | | | | | | | | | | | | | | | | | | | | | | | | | | | | | |
| | | | | | | | | | | | | | | | | | $ | 38,374 | | | $ | — | | | $ | 38,374 | | | |
| | | | | | | | | | | | | | | | | | | | | | | | | | | | | | |
| | | | | | | | | | | | | | | | | | | | | | | | | | | | |
Reference
Entity/
Obligation | | Termination
Date | | | Fixed
Rate | | | Notional
Amount
(000)#(3) | | | Implied
Credit
Spread at
October 31,
2018(4) | | | Value at
Trade
Date | | | Value at
October 31,
2018 | | | Unrealized
Appreciation
(Depreciation) | |
Centrally Cleared Credit Default Swap Agreements on corporate and/or sovereign issues—Sell Protection(2): | |
Anadarko Petroleum Corp. | | | 06/20/21 | | | | 1.000%(Q) | | | | 750 | | | | 0.385 | % | | $ | (56,543 | ) | | $ | 12,625 | | | $ | 69,168 | |
AT&T, Inc. | | | 06/20/21 | | | | 1.000%(Q) | | | | 6,540 | | | | 0.456 | % | | | 47,134 | | | | 99,681 | | | | 52,547 | |
Eastman Chemical Co. | | | 06/20/21 | | | | 1.000%(Q) | | | | 4,860 | | | | 0.350 | % | | | 46,754 | | | | 87,629 | | | | 40,875 | |
Ford Motor Co. | | | 06/20/21 | | | | 5.000%(Q) | | | | 8,000 | | | | 0.944 | % | | | 1,391,643 | | | | 885,251 | | | | (506,392 | ) |
| | | | | | | | | | | | | | | | | | | | | | | | | | | | |
| | | | | | | | | | | | | | | | | | $ | 1,428,988 | | | $ | 1,085,186 | | | $ | (343,802 | ) |
| | | | | | | | | | | | | | | | | | | | | | | | | | | | |
See Notes to Financial Statements.
Credit default swap agreements outstanding at October 31, 2018 (continued):
| | | | | | | | | | | | | | | | | | | | | | | | | | |
Reference
Entity/
Obligation | | Termination
Date | | | Fixed
Rate | | | Notional
Amount
(000)#(3) | | | Fair
Value | | | Upfront
Premiums
Paid
(Received) | | | Unrealized
Appreciation
(Depreciation) | | | Counterparty |
OTC Credit Default Swap Agreements on corporate and/or sovereign issues—Buy Protection(1): |
Hellenic Republic | | | 06/20/23 | | | | 1.000%(Q) | | | | 1,000 | | | $ | 93,234 | | | $ | 94,493 | | | $ | (1,259 | ) | | Bank of America |
Kingdom of Spain | | | 06/20/23 | | | | 1.000%(Q) | | | | 4,400 | | | | (94,418 | ) | | | (108,878 | ) | | | 14,460 | | | Bank of America |
Republic of Italy | | | 06/20/19 | | | | 1.000%(Q) | | | | 5,360 | | | | (17,954 | ) | | | (3,816 | ) | | | (14,138 | ) | | Deutsche Bank AG |
Republic of Italy | | | 06/20/23 | | | | 1.000%(Q) | | | | 10,000 | | | | 221,555 | | | | 223,706 | | | | (2,151 | ) | | Bank of America |
Republic of Italy | | | 06/20/23 | | | | 1.000%(Q) | | | | 4,000 | | | | 88,622 | | | | 61,473 | | | | 27,149 | | | Bank of America |
Republic of Italy | | | 06/20/28 | | | | 1.000%(Q) | | | | 4,455 | | | | 577,655 | | | | 451,501 | | | | 126,154 | | | Goldman Sachs International |
United Mexican States | | | 06/20/23 | | | | 1.000%(Q) | | | | 1,400 | | | | 17,646 | | | | 8,710 | | | | 8,936 | | | Citibank NA |
United Mexican States | | | 06/20/23 | | | | 1.000%(Q) | | | | 1,385 | | | | 17,457 | | | | 21,836 | | | | (4,379 | ) | | Citibank NA |
United Mexican States | | | 06/20/23 | | | | 1.000%(Q) | | | | 460 | | | | 5,798 | | | | 8,122 | | | | (2,324 | ) | | Citibank NA |
United Mexican States | | | 06/20/23 | | | | 1.000%(Q) | | | | 460 | | | | 5,798 | | | | 7,457 | | | | (1,659 | ) | | Citibank NA |
United Mexican States | | | 06/20/23 | | | | 1.000%(Q) | | | | 455 | | | | 5,735 | | | | 2,663 | | | | 3,072 | | | Citibank NA |
United Mexican States | | | 06/20/23 | | | | 1.000%(Q) | | | | 240 | | | | 3,025 | | | | 1,492 | | | | 1,533 | | | Citibank NA |
| | | | | | | | | | | | | | | | | | | | | | | | | | |
| | | | | | | | | | | | | | $ | 924,153 | | | $ | 768,759 | | | $ | 155,394 | | | |
| | | | | | | | | | | | | | | | | | | | | | | | | | |
| | | | | | | | | | | | | | | | | | | | | | | | | | | | | | |
Reference
Entity/
Obligation | | Termination
Date | | | Fixed
Rate | | | Notional
Amount
(000)#(3) | | | Implied
Credit
Spread at
October 31,
2018(4) | | | Fair
Value | | | Upfront
Premiums
Paid
(Received) | | | Unrealized
Appreciation
(Depreciation) | | | Counterparty |
OTC Credit Default Swap Agreements on corporate and/or sovereign issues—Sell Protection(2): |
Hellenic Republic | | | 06/20/22 | | | | 1.000%(Q) | | | | 2,160 | | | | 3.398 | % | | $ | (165,379 | ) | | $ | 207,461 | | | $ | (372,840 | ) | | Citibank NA |
Hellenic Republic | | | 06/20/22 | | | | 1.000%(Q) | | | | 540 | | | | 3.398 | % | | | (41,345 | ) | | | (95,850 | ) | | | 54,505 | | | Goldman Sachs International |
Hellenic Republic | | | 12/20/22 | | | | 1.000%(Q) | | | | 1,000 | | | | 3.541 | % | | | (90,599 | ) | | | (99,155 | ) | | | 8,556 | | | Citibank NA |
Hellenic Republic | | | 06/20/23 | | | | 1.000%(Q) | | | | 1,000 | | | | 3.710 | % | | | (106,223 | ) | | | (106,874 | ) | | | 651 | | | Bank of America |
Hellenic Republic | | | 06/20/24 | | | | 1.000%(Q) | | | | 1,000 | | | | 3.942 | % | | | (134,555 | ) | | | (216,250 | ) | | | 81,695 | | | Barclays Bank PLC |
Kingdom of Spain | | | 06/20/19 | | | | 1.000%(Q) | | | | 10,000 | | | | 0.288 | % | | | 56,878 | | | | 82,236 | | | | (25,358 | ) | | Goldman Sachs International |
Kingdom of Spain | | | 06/20/19 | | | | 1.000%(Q) | | | | 4,900 | | | | 0.288 | % | | | 40,393 | | | | 15,969 | | | | 24,424 | | | Morgan Stanley |
Kingdom of Spain | | | 06/20/23 | | | | 1.000%(Q) | | | | 3,920 | | | | 0.773 | % | | | 42,513 | | | | 56,650 | | | | (14,137 | ) | | Bank of America |
Kingdom of Spain | | | 06/20/23 | | | | 1.000%(Q) | | | | 4,400 | | | | 0.773 | % | | | 47,718 | | | | 66,653 | | | | (18,935 | ) | | Bank of America |
See Notes to Financial Statements.
| | | | |
| PGIM Absolute Return Bond Fund | | | 97 | |
Schedule of Investments (continued)
as of October 31, 2018
Credit default swap agreements outstanding at October 31, 2018 (continued):
| | | | | | | | | | | | | | | | | | | | | | | | | | | | | | |
Reference
Entity/
Obligation | | Termination
Date | | | Fixed
Rate | | | Notional
Amount
(000)#(3) | | | Implied
Credit
Spread at
October 31,
2018(4) | | | Fair
Value | | | Upfront
Premiums
Paid
(Received) | | | Unrealized
Appreciation
(Depreciation) | | | Counterparty |
OTC Credit Default Swap Agreements on corporate and/or sovereign issues—Sell Protection(2) (cont’d.): |
Kingdom of Spain | | | 06/20/23 | | | | 1.000%(Q) | | | | 4,280 | | | | 0.773 | % | | $ | 46,417 | | | $ | 46,541 | | | $ | (124 | ) | | Citibank NA |
Kingdom of Spain | | | 06/20/23 | | | | 1.000%(Q) | | | | 8,570 | | | | 0.773 | % | | | 92,942 | | | | 99,201 | | | | (6,259 | ) | | Goldman Sachs International |
Petroleos Mexicanos | | | 12/20/18 | | | | 1.000%(Q) | | | | 8,000 | | | | 0.781 | % | | | 11,745 | | | | 4,231 | | | | 7,514 | | | Citibank NA |
Petroleos Mexicanos | | | 06/20/23 | | | | 1.000%(Q) | | | | 9,450 | | | | 2.465 | % | | | (560,264 | ) | | | (1,224,841 | ) | | | 664,577 | | | BNP Paribas |
Petroleos Mexicanos | | | 06/20/23 | | | | 1.000%(Q) | | | | 195 | | | | 2.465 | % | | | (11,561 | ) | | | (10,774 | ) | | | (787 | ) | | Citibank NA |
Petroleos Mexicanos | | | 06/20/23 | | | | 1.000%(Q) | | | | 380 | | | | 2.465 | % | | | (22,529 | ) | | | (21,107 | ) | | | (1,422 | ) | | Citibank NA |
Petroleos Mexicanos | | | 06/20/23 | | | | 1.000%(Q) | | | | 385 | | | | 2.465 | % | | | (22,826 | ) | | | (26,182 | ) | | | 3,356 | | | Citibank NA |
Petroleos Mexicanos | | | 06/20/23 | | | | 1.000%(Q) | | | | 385 | | | | 2.465 | % | | | (22,826 | ) | | | (25,708 | ) | | | 2,882 | | | Citibank NA |
Petroleos Mexicanos | | | 06/20/23 | | | | 1.000%(Q) | | | | 1,155 | | | | 2.465 | % | | | (68,477 | ) | | | (76,647 | ) | | | 8,170 | | | Citibank NA |
Petroleos Mexicanos | | | 06/20/23 | | | | 1.000%(Q) | | | | 1,165 | | | | 2.465 | % | | | (69,070 | ) | | | (64,405 | ) | | | (4,665 | ) | | Citibank NA |
Republic of Indonesia | | | 06/20/21 | | | | 1.000%(Q) | | | | 2,100 | | | | 0.923 | % | | | 6,522 | | | | (83,337 | ) | | | 89,859 | | | JPMorgan Chase |
Republic of Indonesioa | | | 09/20/20 | | | | 1.000%(Q) | | | | 8,000 | | | | 0.717 | % | | | 51,030 | | | | (322,295 | ) | | | 373,325 | | | Barclays Bank PLC |
Republic of Italy | | | 06/20/20 | | | | 1.000%(Q) | | | | 11,530 | | | | 1.937 | % | | | (157,225 | ) | | | (166,111 | ) | | | 8,886 | | | Bank of America |
Republic of Italy | | | 06/20/21 | | | | 1.000%(Q) | | | | 7,090 | | | | 2.254 | % | | | (210,105 | ) | | | (146,421 | ) | | | (63,684 | ) | | Goldman Sachs International |
Republic of Italy | | | 12/20/21 | | | | 1.000%(Q) | | | | 5,360 | | | | 2.343 | % | | | (200,316 | ) | | | (199,150 | ) | | | (1,166 | ) | | Bank of America |
Republic of Italy | | | 06/20/23 | | | | 1.000%(Q) | | | | 4,000 | | | | 2.605 | % | | | (252,558 | ) | | | (210,871 | ) | | | (41,687 | ) | | Bank of America |
Republic of Italy | | | 06/20/23 | | | | 1.000%(Q) | | | | 10,000 | | | | 2.605 | % | | | (631,396 | ) | | | (601,778 | ) | | | (29,618 | ) | | Bank of America |
Republic of Italy | | | 06/20/23 | | | | 1.000%(Q) | | | | 7,070 | | | | 2.605 | % | | | (446,397 | ) | | | (334,487 | ) | | | (111,910 | ) | | Goldman Sachs International |
Republic of Portugal | | | 12/20/23 | | | | 1.000%(Q) | | | | 990 | | | | 0.993 | % | | | 1,468 | | | | 459 | | | | 1,009 | | | JPMorgan Chase |
Republic of Portugal | | | 12/20/23 | | | | 1.000%(Q) | | | | 2,070 | | | | 0.993 | % | | | 3,069 | | | | — | | | | 3,069 | | | Morgan Stanley |
See Notes to Financial Statements.
Credit default swap agreements outstanding at October 31, 2018 (continued):
| | | | | | | | | | | | | | | | | | | | | | | | | | | | | | |
Reference Entity/
Obligation | | Termination
Date | | | Fixed
Rate | | | Notional
Amount
(000)#(3) | | | Implied
Credit
Spread at
October 31,
2018(4) | | | Fair
Value | | | Upfront
Premiums
Paid
(Received) | | | Unrealized
Appreciation
(Depreciation) | | | Counterparty |
OTC Credit Default Swap Agreements on corporate and/or sovereign issues—Sell Protection(2) (cont’d.): |
Republic of Serbia | | | 06/20/21 | | | | 1.000%(Q) | | | | 5,000 | | | | 0.608 | % | | $ | 55,672 | | | $ | 74,308 | | | $ | (18,636 | ) | | BNP Paribas |
Republic of Turkey | | | 12/20/18 | | | | 1.000%(Q) | | | | 5,900 | | | | 2.996 | % | | | (9,339 | ) | | | (94,390 | ) | | | 85,051 | | | Citibank NA |
United Mexican States | | | 12/20/20 | | | | 1.000%(Q) | | | | 7,000 | | | | 0.820 | % | | | 34,192 | | | | (123,939 | ) | | | 158,131 | | | Goldman Sachs International |
| | | | | | | | | | | | | | | | | | | | | | | | | | | | | | |
| | | | | | | | | | | | | | | | | | $ | (2,732,431 | ) | | $ | (4,177,164 | ) | | $ | 1,444,733 | | | |
| | | | | | | | | | | | | | | | | | | | | | | | | | | | | | |
| | | | | | | | | | | | | | | | | | | | | | | | |
Reference
Entity/
Obligation | | Termination
Date | | | Fixed
Rate | | | Notional
Amount
(000)#(3) | | | Value at
Trade
Date | | | Value at
October 31,
2018 | | | Unrealized
Appreciation
(Depreciation) | |
Centrally Cleared Credit Default Swap Agreements on credit indices—Buy Protection(1): | | | | | |
CDX.NA.IG.30.V1 | | | 06/20/28 | | | | 1.000%(Q) | | | | 31,535 | | | $ | 92,657 | | | $ | 238,794 | | | $ | 146,137 | |
CDX.NA.IG.31.V1 | | | 12/20/28 | | | | 1.000%(Q) | | | | 71,755 | | | | 424,457 | | | | 741,827 | | | | 317,370 | |
| | | | | | | | | | | | | | | | | | | | | | | | |
| | | | | | | | | | | | | | $ | 517,114 | | | $ | 980,621 | | | $ | 463,507 | |
| | | | | | | | | | | | | | | | | | | | | | | | |
| | | | | | | | | | | | | | | | | | | | | | | | | | | | | | |
Reference
Entity/
Obligation | | Termination
Date | | | Fixed
Rate | | | Notional
Amount
(000)#(3) | | | Implied
Credit
Spread at
October 31,
2018(4) | | | Fair
Value | | | Upfront
Premiums
Paid
(Received) | | | Unrealized
Appreciation
(Depreciation) | | | Counterparty |
OTC Credit Default Swap Agreements on credit indices—Sell Protection(2): |
CMBX.NA.6.AA | | | 05/11/63 | | | | 1.500%(M) | | | | 10,000 | | | | * | | | $ | 84,343 | | | $ | 113,221 | | | $ | (28,878 | ) | | Deutsche Bank AG |
CMBX.NA.6.AA | | | 05/11/63 | | | | 1.500%(M) | | | | 8,000 | | | | * | | | | 67,475 | | | | (489,693 | ) | | | 557,168 | | | Credit Suisse International |
CMBX.NA.6.AA | | | 05/11/63 | | | | 1.500%(M) | | | | 7,000 | | | | * | | | | 59,040 | | | | 92,983 | | | | (33,943 | ) | | Credit Suisse International |
CMBX.NA.6.AA | | | 05/11/63 | | | | 1.500%(M) | | | | 2,000 | | | | * | | | | 16,869 | | | | (66,951 | ) | | | 83,820 | | | JPMorgan Securities |
| | | | | | | | | | | | | | | | | | | | | | | | | | | | | | |
| | | | | | | | | | | | | | | | | | $ | 227,727 | | | $ | (350,440 | ) | | $ | 578,167 | | | |
| | | | | | | | | | | | | | | | | | | | | | | | | | | | | | |
The Fund entered into credit default swaps (“CDS”) to provide a measure of protection against defaults or to take an active long or short position with respect to the likelihood of a particular issuer’s default or the reference entity’s credit soundness. CDS contracts generally trade based on a spread which represents the cost a protection buyer has to pay the protection seller. The protection buyer is said to be short the credit as the value of the contract rises the more the credit deteriorates. The value of the CDS contract increases for the protection buyer if the spread increases.
See Notes to Financial Statements.
| | | | |
| PGIM Absolute Return Bond Fund | | | 99 | |
Schedule of Investments (continued)
as of October 31, 2018
| (1) | If the Fund is a buyer of protection, it pays the fixed rate. When a credit event occurs, as defined under the terms of that particular swap agreement, the Fund will either (i) receive from the seller of protection an amount equal to the notional amount of the swap and make delivery of the referenced obligation or underlying securities comprising the referenced index or (ii) receive a net settlement amount in the form of cash or securities equal to the notional amount of the swap less the recovery value of the referenced obligation or underlying securities comprising the referenced index. |
| (2) | If the Fund is a seller of protection, it receives the fixed rate. When a credit event occurs, as defined under the terms of that particular swap agreement, the Fund will either (i) pay to the buyer of protection an amount equal to the notional amount of the swap and take delivery of the referenced obligation or underlying securities comprising the referenced index or (ii) pay a net settlement amount in the form of cash or securities equal to the notional amount of the swap less the recovery value of the referenced obligation or underlying securities comprising the referenced index. |
| (3) | Notional amount represents the maximum potential amount the Fund could be required to pay as a seller of credit protection or receive as a buyer of credit protection if a credit event occurs as defined under the terms of that particular swap agreement. |
| (4) | Implied credit spreads, represented in absolute terms, utilized in determining the fair value of credit default swap agreements where the Fund is the seller of protection as of the reporting date serve as an indicator of the current status of the payment/ performance risk and represent the likelihood of risk of default for the credit derivative. The implied credit spread of a particular referenced entity reflects the cost of buying/selling protection and may include up-front payments required to be made to enter into the agreement. Wider credit spreads represent a deterioration of the referenced entity’s credit soundness and a greater likelihood of risk of default or other credit event occurring as defined under the terms of the agreement. |
| * | When an implied credit spread is not available, reference the fair value of credit default swap agreements on credit indices and asset-backed securities. Where the Fund is the seller of protection, it serves as an indicator of the current status of the payment/performance risk and represents the likelihood of an expected liability (or profit) for the credit derivative should the notional amount of the swap agreement be closed/sold as of the reporting date. Increasing fair value in absolute terms, when compared to the notional amount of the swap, represents a deterioration of the referenced entity’s credit soundness and a greater likelihood of risk of default or other credit event occurring as defined under the terms of the agreement. |
Inflation swap agreement outstanding at October 31, 2018:
| | | | | | | | | | | | | | | | | | | | | | | | |
Notional
Amount
(000)# | | | Termination
Date | | | Fixed
Rate | | | Floating Rate | | Value at
Trade
Date | | | Value at
October 31,
2018 | | | Unrealized
Appreciation
(Depreciation) | |
| Centrally Cleared Inflation Swap Agreement: | | | | | | | | | |
| | 11,000 | | | | 10/25/27 | | | | 2.160%(T) | | | U.S. CPI Urban Consumers NSA Index(2)(T) | | $ | 256 | | | $ | (147,525 | ) | | $ | (147,781 | ) |
| | | | | | | | | | | | | | | | | | | | | | | | |
| (1) | The Fund pays the fixed rate and receives the floating rate. |
| (2) | The Fund pays the floating rate and receives the fixed rate. |
Interest rate swap agreements outstanding at October 31, 2018:
See Notes to Financial Statements.
Interest rate swap agreements outstanding at October 31, 2018 (continued):
| | | | | | | | | | | | | | | | | | | | | | | | |
Notional
Amount
(000)# | | | Termination
Date | | | Fixed Rate | | | Floating Rate | | Value at
Trade Date | | | Value at
October 31,
2018 | | | Unrealized
Appreciation
(Depreciation) | |
| Centrally Cleared Interest Rate Swap Agreements: | | | | | | | |
| BRL | 33,237 | | | | 01/02/25 | | | | 9.400%(T) | | | 1 Day BROIS(2)(T) | | $ | — | | | $ | 18,614 | | | $ | 18,614 | |
| BRL | 33,671 | | | | 01/02/25 | | | | 9.685%(T) | | | 1 Day BROIS(2)(T) | | | — | | | | 167,919 | | | | 167,919 | |
| BRL | 33,633 | | | | 01/02/25 | | | | 9.775%(T) | | | 1 Day BROIS(2)(T) | | | — | | | | 218,636 | | | | 218,636 | |
| BRL | 17,286 | | | | 01/02/25 | | | | 9.920%(T) | | | 1 Day BROIS(2)(T) | | | — | | | | 287,628 | | | | 287,628 | |
| BRL | 16,970 | | | | 01/02/25 | | | | 10.040%(T) | | | 1 Day BROIS(2)(T) | | | — | | | | 330,661 | | | | 330,661 | |
| BRL | 18,978 | | | | 01/02/25 | | | | 12.050%(T) | | | 1 Day BROIS(2)(T) | | | — | | | | 820,180 | | | | 820,180 | |
| BRL | 16,515 | | | | 01/04/27 | | | | 12.095%(T) | | | 1 Day BROIS(2)(T) | | | — | | | | 856,083 | | | | 856,083 | |
| EUR | 5,735 | | | | 05/11/19 | | | | (0.144)%(A) | | | 6 Month EURIBOR(1)(S) | | | (8,233 | ) | | | (7,950 | ) | | | 283 | |
| EUR | 79,640 | | | | 05/11/20 | | | | (0.054)%(A) | | | 6 Month EURIBOR(1)(S) | | | (190,612 | ) | | | (276,276 | ) | | | (85,664 | ) |
| EUR | 20,545 | | | | 05/11/22 | | | | 0.156%(A) | | | 6 Month EURIBOR(1)(S) | | | 43,876 | | | | (75,053 | ) | | | (118,929 | ) |
| EUR | 53,410 | | | | 05/11/23 | | | | 0.650%(A) | | | 6 Month EURIBOR(1)(S) | | | (1,175,307 | ) | | | (1,281,970 | ) | | | (106,663 | ) |
| EUR | 190 | | | | 05/11/25 | | | | 0.650%(A) | | | 6 Month EURIBOR(1)(S) | | | 479 | | | | (2,168 | ) | | | (2,647 | ) |
| EUR | 2,740 | | | | 05/11/26 | | | | 0.750%(A) | | | 6 Month EURIBOR(1)(S) | | | (3,999 | ) | | | (29,377 | ) | | | (25,378 | ) |
| EUR | 43,095 | | | | 05/11/28 | | | | 0.750%(A) | | | 6 Month EURIBOR(1)(S) | | | 1,286,120 | | | | 483,895 | | | | (802,225 | ) |
| EUR | 1,290 | | | | 02/15/30 | | | | 1.124%(A) | | | 6 Month EURIBOR(1)(S) | | | (308 | ) | | | (21,226 | ) | | | (20,918 | ) |
| EUR | 2,860 | | | | 05/11/30 | | | | 0.850%(A) | | | 6 Month EURIBOR(1)(S) | | | 105,811 | | | | 67,806 | | | | (38,005 | ) |
| EUR | 6,595 | | | | 05/11/33 | | | | 1.000%(A) | | | 6 Month EURIBOR(1)(S) | | | 395,138 | | | | 238,089 | | | | (157,049 | ) |
| EUR | 3,985 | | | | 05/11/37 | | | | 1.253%(A) | | | 6 Month EURIBOR(1)(S) | | | 139,351 | | | | 96,811 | | | | (42,540 | ) |
| EUR | 18,530 | | | | 10/25/37 | | | | 2.085%(A) | | | 3 Month EURIBOR(2)(Q) | | | — | | | | 148,607 | | | | 148,607 | |
| EUR | 18,530 | | | | 10/25/37 | | | | 2.114%(A) | | | 6 Month EURIBOR(1)(S) | | | — | | | | (133,606 | ) | | | (133,606 | ) |
| EUR | 2,955 | | | | 05/11/42 | | | | 1.350%(A) | | | 6 Month EURIBOR(1)(S) | | | 109,595 | | | | 72,157 | | | | (37,438 | ) |
See Notes to Financial Statements.
| | | | |
| PGIM Absolute Return Bond Fund | | | 101 | |
Schedule of Investments (continued)
as of October 31, 2018
Interest rate swap agreements outstanding at October 31, 2018 (continued):
| | | | | | | | | | | | | | | | | | | | | | | | |
Notional
Amount
(000)# | | | Termination
Date | | | Fixed
Rate | | | Floating Rate | | Value at
Trade
Date | | | Value at
October 31,
2018 | | | Unrealized
Appreciation
(Depreciation) | |
| Centrally Cleared Interest Rate Swap Agreements (cont’d.): | |
| EUR | 475 | | | | 05/11/43 | | | | 1.350%(A) | | | 6 Month EURIBOR(1)(S) | | $ | 4,934 | | | $ | 12,733 | | | $ | 7,799 | |
| EUR | 2,975 | | | | 01/26/48 | | | | 1.853%(A) | | | 3 Month EURIBOR(2)(Q) | | | — | | | | 25,189 | | | | 25,189 | |
| EUR | 2,975 | | | | 01/26/48 | | | | 1.863%(A) | | | 6 Month EURIBOR(1)(S) | | | — | | | | (21,936 | ) | | | (21,936 | ) |
| EUR | 11,050 | | | | 03/19/48 | | | | 1.650%(A) | | | 3 Month EURIBOR(2)(Q) | | | — | | | | (2,870 | ) | | | (2,870 | ) |
| EUR | 11,050 | | | | 03/19/48 | | | | 1.658%(A) | | | 6 Month EURIBOR(1)(S) | | | — | | | | 8,620 | | | | 8,620 | |
| GBP | 3,280 | | | | 05/08/21 | | | | 0.716%(S) | | | 6 Month GBP LIBOR(1)(S) | | | 39,091 | | | | 50,646 | | | | 11,555 | |
| | 58,600 | | | | 11/09/18 | | | | 1.160%(S) | | | 3 Month LIBOR(1)(Q) | | | (22,226 | ) | | | 10,429 | | | | 32,655 | |
| | 116,540 | | | | 11/17/18 | | | | 1.080%(T) | | | 1 Day USOIS(1)(T) | | | 412 | | | | 769,211 | | | | 768,799 | |
| | 175,200 | | | | 11/18/18 | | | | 0.911%(A) | | | 1 Day USOIS(1)(A) | | | (9,360 | ) | | | 1,452,633 | | | | 1,461,993 | |
| | 76,310 | | | | 11/22/18 | | | | 1.297%(S) | | | 3 Month LIBOR(1)(Q) | | | 325 | | | | (43,316 | ) | | | (43,641 | ) |
| | 250,430 | | | | 02/15/19 | | | | 1.820%(T) | | | 1 Day USOIS(1)(T) | | | — | | | | 388,460 | | | | 388,460 | |
| | 762,460 | | | | 05/11/19 | | | | 1.613%(S) | | | 3 Month LIBOR(1)(Q) | | | 732,490 | | | | 2,725,362 | | | | 1,992,872 | |
| | 44,680 | | | | 06/30/19 | | | | 1.486%(A) | | | 1 Day USOIS(1)(A) | | | (10,717 | ) | | | 364,459 | | | | 375,176 | |
| | 99,170 | | | | 06/30/19 | | | | 1.502%(A) | | | 1 Day USOIS(1)(A) | | | (67,560 | ) | | | 793,272 | | | | 860,832 | |
| | 61,890 | | | | 09/08/19 | | | | 1.290%(A) | | | 1 Day USOIS(1)(A) | | | — | | | | 723,389 | | | | 723,389 | |
| | 195,680 | | | | 09/30/19 | | | | 1.707%(A) | | | 1 Day USOIS(1)(A) | | | 55,515 | | | | 1,584,329 | | | | 1,528,814 | |
| | 442,890 | | | | 12/31/19 | | | | 1.840%(A) | | | 1 Day USOIS(1)(A) | | | 1,459,074 | | | | 4,051,486 | | | | 2,592,412 | |
| | 92,015 | | | | 12/31/19 | | | | 1.950%(A) | | | 1 Day USOIS(1)(A) | | | 24,841 | | | | 666,593 | | | | 641,752 | |
| | 70,240 | | | | 12/31/19 | | | | 2.040%(A) | | | 1 Day USOIS(1)(A) | | | 1,006 | | | | 397,151 | | | | 396,145 | |
| | 135,665 | | | | 12/31/19 | | | | 2.107%(A) | | | 1 Day USOIS(1)(A) | | | (8,388 | ) | | | 615,618 | | | | 624,006 | |
| | 238,735 | | | | 02/05/20 | | | | 2.350%(S) | | | 3 Month LIBOR(1)(Q) | | | 50,769 | | | | 1,890,737 | | | | 1,839,968 | |
See Notes to Financial Statements.
Interest rate swap agreements outstanding at October 31, 2018 (continued):
| | | | | | | | | | | | | | | | | | | | | | | | |
Notional
Amount
(000)# | | | Termination
Date | | | Fixed
Rate | | | Floating Rate | | Value at
Trade Date | | | Value at
October 31,
2018 | | | Unrealized
Appreciation
(Depreciation) | |
| Centrally Cleared Interest Rate Swap Agreements (cont’d.): | |
| | 123,850 | | | | 03/31/20 | | | | 2.295%(A) | | | 1 Day USOIS(1)(A) | | $ | 29,661 | | | $ | 512,088 | | | $ | 482,427 | |
| | 18,880 | | | | 03/31/20 | | | | 2.369%(A) | | | 1 Day USOIS(1)(A) | | | (25,566 | ) | | | 54,368 | | | | 79,934 | |
| | 87,960 | | | | 04/24/20 | | | | 2.311%(A) | | | 1 Day USOIS(1)(A) | | | — | | | | 287,154 | | | | 287,154 | |
| | 2,149,020 | | | | 05/11/20 | | | | 1.763%(S) | | | 3 Month LIBOR(1)(Q) | | | 37,832,375 | | | | 33,647,961 | | | | (4,184,414 | ) |
| | 7,450 | | | | 05/11/21 | | | | 1.600%(S) | | | 3 Month LIBOR(1)(Q) | | | 106,003 | | | | 255,745 | | | | 149,742 | |
| | 263,500 | | | | 05/15/21 | | | | 2.202%(S) | | | 3 Month LIBOR(1)(Q) | | | (3,255,762 | ) | | | 4,488,599 | | | | 7,744,361 | |
| | 72,470 | | | | 05/31/21 | | | | 1.849%(S) | | | 3 Month LIBOR(2)(Q) | | | 432 | | | | (1,978,079 | ) | | | (1,978,511 | ) |
| | 79,680 | | | | 05/31/21 | | | | 1.948%(S) | | | 3 Month LIBOR(2)(Q) | | | 476 | | | | (1,945,347 | ) | | | (1,945,823 | ) |
| | 363,990 | | | | 05/31/21 | | | | 1.953%(S) | | | 3 Month LIBOR(2)(Q) | | | 435,959 | | | | (8,836,642 | ) | | | (9,272,601 | ) |
| | 191,000 | | | | 05/31/21 | | | | 1.980%(S) | | | 3 Month LIBOR(2)(Q) | | | 931 | | | | (4,486,781 | ) | | | (4,487,712 | ) |
| | 2,570 | | | | 07/31/21 | | | | 2.290%(S) | | | 3 Month LIBOR(1)(Q) | | | (42,742 | ) | | | 41,291 | | | | 84,033 | |
| | 5,870 | | | | 11/22/21 | | | | 1.792%(S) | | | 3 Month LIBOR(2)(Q) | | | 38 | | | | (208,798 | ) | | | (208,836 | ) |
| | 133,150 | | | | 05/11/22 | | | | 1.982%(S) | | | 3 Month LIBOR(2)(Q) | | | (1,449,345 | ) | | | (4,540,750 | ) | | | (3,091,405 | ) |
| | 16,120 | | | | 05/31/22 | | | | 2.353%(A) | | | 1 Day USOIS(1)(A) | | | — | | | | 206,511 | | | | 206,511 | |
| | 11,430 | | | | 08/31/22 | | | | 2.550%(A) | | | 1 Day USOIS(1)(A) | | | 2,236 | | | | 86,090 | | | | 83,854 | |
| | 10,635 | | | | 08/31/22 | | | | 2.552%(A) | | | 1 Day USOIS(1)(A) | | | — | | | | 79,285 | | | | 79,285 | |
| | 10,550 | | | | 09/28/22 | | | | 2.177%(S) | | | 3 Month LIBOR(1)(Q) | | | — | | | | 193,430 | | | | 193,430 | |
| | 24,000 | | | | 04/03/23 | | | | 2.015%(S) | | | 3 Month LIBOR(1)(Q) | | | 387,010 | | | | 1,106,655 | | | | 719,645 | |
| | 623,643 | | | | 05/11/23 | | | | 2.000%(S) | | | 3 Month LIBOR(2)(Q) | | | (26,590,583 | ) | | | (27,077,102 | ) | | | (486,519 | ) |
| | 16,300 | | | | 06/20/23 | | | | 2.604%(S) | | | 3 Month LIBOR(1)(Q) | | | (423,981 | ) | | | 255,642 | | | | 679,623 | |
| | 40,810 | | | | 08/28/23 | | | | 2.842%(S) | | | 3 Month LIBOR(1)(Q) | | | — | | | | 491,321 | | | | 491,321 | |
See Notes to Financial Statements.
| | | | |
| PGIM Absolute Return Bond Fund | | | 103 | |
Schedule of Investments (continued)
as of October 31, 2018
Interest rate swap agreements outstanding at October 31, 2018 (continued):
| | | | | | | | | | | | | | | | | | | | | | | | |
Notional
Amount
(000)# | | | Termination
Date | | | Fixed
Rate | | | Floating Rate | | Value at
Trade
Date | | | Value at
October 31,
2018 | | | Unrealized
Appreciaton
(Depreciation) | |
| Centrally Cleared Interest Rate Swap Agreements (cont’d.): | |
| | 101,900 | | | | 09/24/23 | | | | 2.903%(S) | | | 3 Month LIBOR(1)(Q) | | $ | (4,887,264 | ) | | $ | 996,857 | | | $ | 5,884,121 | |
| | 124,000 | | | | 11/15/23 | | | | 2.230%(S) | | | 3 Month LIBOR(1)(Q) | | | 827 | | | | 4,591,136 | | | | 4,590,309 | |
| | 22,745 | | | | 02/15/24 | | | | 2.115%(S) | | | 3 Month LIBOR(1)(Q) | | | 56,893 | | | | 1,151,918 | | | | 1,095,025 | |
| | 25,504 | | | | 02/15/24 | | | | 2.151%(S) | | | 3 Month LIBOR(1)(Q) | | | (46,430 | ) | | | 1,244,984 | | | | 1,291,414 | |
| | 47,110 | | | | 02/15/24 | | | | 2.167%(S) | | | 3 Month LIBOR(1)(Q) | | | (362,554 | ) | | | 2,261,211 | | | | 2,623,765 | |
| | 45,915 | | | | 02/15/24 | | | | 2.183%(S) | | | 3 Month LIBOR(1)(Q) | | | (51,777 | ) | | | 2,164,594 | | | | 2,216,371 | |
| | 172,911 | | | | 05/11/24 | | | | 2.139%(S) | | | 3 Month LIBOR(1)(Q) | | | (1,876,191 | ) | | | 7,983,226 | | | | 9,859,417 | |
| | 28,490 | | | | 08/15/24 | | | | 2.168%(S) | | | 3 Month LIBOR(1)(Q) | | | — | | | | 1,489,965 | | | | 1,489,965 | |
| | 291,235 | | | | 08/15/24 | | | | 2.170%(S) | | | 3 Month LIBOR(1)(Q) | | | 1,162,401 | | | | 15,204,098 | | | | 14,041,697 | |
| | 89,045 | | | | 08/15/24 | | | | 2.176%(S) | | | 3 Month LIBOR(1)(Q) | | | 307,192 | | | | 4,621,204 | | | | 4,314,012 | |
| | 98,000 | | | | 08/15/24 | | | | 2.559%(S) | | | 3 Month LIBOR(1)(Q) | | | (1,570,311 | ) | | | 3,010,588 | | | | 4,580,899 | |
| | 20,260 | | | | 09/01/24 | | | | 1.972%(S) | | | 3 Month LIBOR(2)(Q) | | | — | | | | (1,281,868 | ) | | | (1,281,868 | ) |
| | 56,550 | | | | 09/09/24 | | | | 2.558%(S) | | | 3 Month LIBOR(1)(Q) | | | (904,581 | ) | | | 1,757,942 | | | | 2,662,523 | |
| | 99,875 | | | | 11/15/24 | | | | 2.334%(S) | | | 3 Month LIBOR(1)(Q) | | | 263,894 | | | | 3,920,845 | | | | 3,656,951 | |
| | 4,300 | | | | 02/23/25 | | | | 2.232%(S) | | | 3 Month LIBOR(1)(Q) | | | 181 | | | | 228,931 | | | | 228,750 | |
| | 44,450 | | | | 02/25/25 | | | | 2.208%(S) | | | 3 Month LIBOR(1)(Q) | | | 453 | | | | 2,423,248 | | | | 2,422,795 | |
| | 18,415 | | | | 02/28/25 | | | | 2.454%(A) | | | 1 Day USOIS(1)(A) | | | 15,095 | | | | 341,129 | | | | 326,034 | |
| | 16,810 | | | | 02/28/25 | | | | 3.019%(S) | | | 3 Month LIBOR(1)(Q) | | | — | | | | 108,064 | | | | 108,064 | |
| | 3,370 | | | | 05/11/25 | | | | 1.900%(S) | | | 3 Month LIBOR(1)(Q) | | | 191,039 | | | | 238,094 | | | | 47,055 | |
| | 330,667 | | | | 05/31/25 | | | | 2.998%(S) | | | 3 Month LIBOR(1)(Q) | | | (228,936 | ) | | | 2,867,986 | | | | 3,096,922 | |
| | 188,411 | | | | 07/31/25 | | | | 3.109%(S) | | | 3 Month LIBOR(1)(Q) | | | 132,018 | | | | 727,988 | | | | 595,970 | |
See Notes to Financial Statements.
Interest rate swap agreements outstanding at October 31, 2018 (continued):
| | | | | | | | | | | | | | | | | | | | | | | | |
Notional
Amount
(000)# | | | Termination
Date | | | Fixed
Rate | | | Floating Rate | | Value at
Trade
Date | | | Value at
October 31,
2018 | | | Unrealized
Appreciaton
(Depreciation) | |
| Centrally Cleared Interest Rate Swap Agreements (cont’d.): | |
| | 9,975 | | | | 04/28/26 | | | | 1.809%(S) | | | 3 Month LIBOR(1)(Q) | | $ | 136 | | | $ | 912,801 | | | $ | 912,665 | |
| | 52,572 | | | | 02/15/27 | | | | 1.824%(A) | | | 1 Day USOIS(1)(A) | | | 667,355 | | | | 3,927,368 | | | | 3,260,013 | |
| | 53,535 | | | | 02/15/27 | | | | 1.899%(A) | | | 1 Day USOIS(1)(A) | | | 38,163 | | | | 3,675,327 | | | | 3,637,164 | |
| | 12,575 | | | | 02/15/27 | | | | 1.965%(A) | | | 1 Day USOIS(1)(A) | | | — | | | | 796,042 | | | | 796,042 | |
| | 23,100 | | | | 02/15/27 | | | | 2.068%(A) | | | 1 Day USOIS(1)(A) | | | (15,258 | ) | | | 1,269,217 | | | | 1,284,475 | |
| | 11,080 | | | | 05/08/27 | | | | 2.309%(S) | | | 3 Month LIBOR(1)(Q) | | | — | | | | 676,068 | | | | 676,068 | |
| | 6,735 | | | | 05/11/27 | | | | 2.305%(S) | | | 3 Month LIBOR(2)(Q) | | | (37,107 | ) | | | (412,185 | ) | | | (375,078 | ) |
| | 9,360 | | | | 05/15/27 | | | | 1.823%(A) | | | 1 Day USOIS(1)(A) | | | — | | | | 726,292 | | | | 726,292 | |
| | 6,290 | | | | 05/15/27 | | | | 2.295%(S) | | | 3 Month LIBOR(1)(Q) | | | — | | | | 391,146 | | | | 391,146 | |
| | 26,265 | | | | 05/11/28 | | | | 2.000%(S) | | | 3 Month LIBOR(2)(Q) | | | (2,053,953 | ) | | | (2,535,888 | ) | | | (481,935 | ) |
| | 7,770 | | | | 10/16/33 | | | | 2.890%(S) | | | 3 Month LIBOR(2)(Q) | | | — | | | | (286,485 | ) | | | (286,485 | ) |
| | 42,995 | | | | 02/15/36 | | | | 2.338%(S) | | | 3 Month LIBOR(2)(Q) | | | (284,412 | ) | | | (5,602,550 | ) | | | (5,318,138 | ) |
| | 7,975 | | | | 05/11/37 | | | | 2.537%(S) | | | 3 Month LIBOR(1)(Q) | | | (168,401 | ) | | | 818,041 | | | | 986,442 | |
| | 17,245 | | | | 03/16/38 | | | | 2.987%(S) | | | 3 Month LIBOR(2)(Q) | | | — | | | | (792,263 | ) | | | (792,263 | ) |
| | 37,960 | | | | 05/11/38 | | | | 2.200%(S) | | | 3 Month LIBOR(1)(Q) | | | 3,931,864 | | | | 6,026,981 | | | | 2,095,117 | |
| | 8,500 | | | | 02/15/40 | | | | 3.192%(S) | | | 3 Month LIBOR(1)(Q) | | | (567,614 | ) | | | 139,669 | | | | 707,283 | |
| | 14,000 | | | | 02/15/41 | | | | 2.647%(S) | | | 3 Month LIBOR(1)(Q) | | | 402 | | | | 1,498,966 | | | | 1,498,564 | |
| | 5,520 | | | | 11/15/41 | | | | 1.869%(S) | | | 3 Month LIBOR(1)(Q) | | | 33,885 | | | | 1,303,105 | | | | 1,269,220 | |
| | 31,400 | | | | 05/11/42 | | | | 2.562%(S) | | | 3 Month LIBOR(2)(Q) | | | 204,062 | | | | (3,732,621 | ) | | | (3,936,683 | ) |
| | 1,300 | | | | 12/12/42 | | | | 2.590%(S) | | | 3 Month LIBOR(1)(Q) | | | 65,803 | | | | 150,797 | | | | 84,994 | |
| | 1,890 | | | | 11/15/43 | | | | 2.659%(S) | | | 3 Month LIBOR(1)(Q) | | | — | | | | 201,299 | | | | 201,299 | |
See Notes to Financial Statements.
| | | | |
| PGIM Absolute Return Bond Fund | | | 105 | |
Schedule of Investments
as of October 31, 2018
Interest rate swap agreements outstanding at October 31, 2018 (continued):
| | | | | | | | | | | | | | | | | | | | | | | | |
Notional
Amount
(000)# | | | Termination
Date | | | Fixed
Rate | | | Floating Rate | | Value at
Trade
Date | | | Value at
October 31,
2018 | | | Unrealized
Appreciation
(Depreciation) | |
| Centrally Cleared Interest Rate Swap Agreements (cont’d.): | |
| | 13,400 | | | | 08/21/44 | | | | 3.190%(S) | | | 3 Month LIBOR(1)(Q) | | $ | (926,224 | ) | | $ | 247,898 | | | $ | 1,174,122 | |
| | 3,755 | | | | 09/27/46 | | | | 1.380%(A) | | | 1 Day USOIS(1)(A) | | | 218 | | | | 1,099,757 | | | | 1,099,539 | |
| | 1,365 | | | | 05/11/47 | | | | 2.570%(S) | | | 3 Month LIBOR(1)(Q) | | | 99,638 | | | | 181,581 | | | | 81,943 | |
| | 12,945 | | | | 03/16/48 | | | | 2.970%(S) | | | 3 Month LIBOR(1)(Q) | | | — | | | | 812,844 | | | | 812,844 | |
| | 2,410 | | | | 04/09/48 | | | | 2.545%(S) | | | 3 Month LIBOR(1)(Q) | | | — | | | | 354,395 | | | | 354,395 | |
| | 2,225 | | | | 05/08/48 | | | | 2.627%(S) | | | 3 Month LIBOR(1)(Q) | | | — | | | | 276,645 | | | | 276,645 | |
| | 12,540 | | | | 05/11/48 | | | | 2.300%(S) | | | 3 Month LIBOR(1)(Q) | | | 2,334,356 | | | | 2,384,016 | | | | 49,660 | |
| | 9,500 | | | | 08/28/48 | | | | 2.915%(S) | | | 3 Month LIBOR(2)(Q) | | | — | | | | (702,048 | ) | | | (702,048 | ) |
| ZAR | 371,600 | | | | 07/16/28 | | | | 8.170%(Q) | | | 3 Month JIBAR(2)(Q) | | | (16,955 | ) | | | (792,019 | ) | | | (775,064 | ) |
| ZAR | 225,000 | | | | 08/14/28 | | | | 8.350%(Q) | | | 3 Month JIBAR(2)(Q) | | | — | | | | (269,560 | ) | | | (269,560 | ) |
| | | | | | | | | | | | | | | | | | | | | | | | |
| | | | | | | | | | | | | | $ | 5,467,166 | | | $ | 79,871,072 | | | $ | 74,403,906 | |
| | | | | | | | | | | | | | | | | | | | | | | | |
| (1) | The Fund pays the fixed rate and receives the floating rate. |
| (2) | The Fund pays the floating rate and receives the fixed rate. |
Total return swap agreements outstanding at October 31, 2018:
| | | | | | | | | | | | | | | | | | | | | | | | |
Reference Entity | | Financing Rate | | Counterparty | | Termination
Date | | | Long (Short)
Notional
Amount
(000)#(2) | | | Fair
Value | | | Upfront
Premiums
Paid
(Received) | | | Unrealized
Appreciation
(Depreciation)(1) | |
OTC Total Return Swap Agreement: | |
IOS. FN30.450.10(M) | | 1 Month LIBOR(M) | | Credit Suisse
International | | | 1/12/41 | | | | 7,769 | | | $ | 12,518 | | | $ | (23,726 | ) | | $ | 36,244 | |
| | | | | | | | | | | | | | | | | | | | | | | | |
| (1) | Upfront/recurring fees or commissions, as applicable, are included in the net unrealized appreciation (depreciation). |
| (2) | On a Long Total Return Swap, the Fund receives payments for any positive return on the reference entity (makes payments for any negative return) and pays the financing rate. On a Short Total Return Swap, the Fund makes payments for any positive return on the reference entity (receives payments for any negative return) and receives the financing rate. |
See Notes to Financial Statements.
Balances Reported in the Statement of Assets and Liabilities for OTC Swap Agreements:
| | | | | | | | | | | | | | | | |
| | | Premiums Paid | | | Premiums Received | | | Unrealized
Appreciation | | | Unrealized
Depreciation | |
OTC Swap Agreements | | $ | 1,533,905 | | | $ | (5,316,476 | ) | | $ | 2,680,031 | | | $ | (427,119 | ) |
Summary of Collateral for Centrally Cleared/Exchange-traded Derivatives:
Cash and securities segregated as collateral to cover requirements for open centrally cleared/exchange-traded derivatives are listed by broker as follows:
| | | | | | | | |
Broker | | Cash and/or Foreign Currency | | | Securities Market Value | |
Citigroup Global Markets | | $ | 70,466,000 | | | $ | 8,461,126 | |
| | | | | | | | |
Fair Value Measurements:
Various inputs are used in determining the value of the Fund’s investments. These inputs are summarized in the three broad levels listed below.
Level 1—unadjusted quoted prices generally in active markets for identical securities.
Level 2—quoted prices for similar securities, interest rates and yield curves, prepayment speeds, foreign currency exchange rates and other observable inputs.
Level 3—unobservable inputs for securities valued in accordance with Board approved fair valuation procedures.
The following is a summary of the inputs used as of October 31, 2018 in valuing such portfolio securities:
| | | | | | | | | | | | |
| | | Level 1 | | | Level 2 | | | Level 3 | |
Investments in Securities | | | | | | | | | | | | |
Asset-Backed Securities | | | | | | | | | | | | |
Automobiles | | $ | — | | | $ | 5,300,285 | | | $ | — | |
Collateralized Loan Obligations | | | — | | | | 608,775,737 | | | | — | |
Consumer Loans | | | — | | | | 60,665,975 | | | | — | |
Home Equity Loans | | | — | | | | 65,962,283 | | | | — | |
Residential Mortgage-Backed Securities | | | — | | | | 120,972,490 | | | | 20,813,302 | |
Student Loans | | | — | | | | 19,197,747 | | | | — | |
Bank Loans | | | — | | | | 29,710,319 | | | | 1,138,500 | |
Commercial Mortgage-Backed Securities | | | — | | | | 163,170,903 | | | | — | |
Convertible Bond | | | — | | | | 5,945,531 | | | | — | |
Corporate Bonds | | | — | | | | 725,248,244 | | | | 1,567,956 | |
Municipal Bonds | | | — | | | | 13,254,024 | | | | — | |
Residential Mortgage-Backed Securities | | | — | | | | 117,380,925 | | | | — | |
Sovereign Bonds | | | — | | | | 248,702,861 | | | | — | |
U.S. Treasury Obligations | | | — | | | | 94,539,626 | | | | — | |
Common Stock | | | 1,725,615 | | | | — | | | | — | |
Affiliated Mutual Funds | | | 274,022,630 | | | | — | | | | — | |
Options Purchased | | | — | | | | 67,626,094 | | | | — | |
Options Written | | | — | | | | (67,425,901 | ) | | | (41,572 | ) |
Other Financial Instruments* | | | | | | | | | | | | |
Unfunded Loan Commitment | | | — | | | | (105,191 | ) | | | — | |
See Notes to Financial Statements.
| | | | |
| PGIM Absolute Return Bond Fund | | | 107 | |
Schedule of Investments (continued)
as of October 31, 2018
| | | | | | | | | | | | |
| | | Level 1 | | | Level 2 | | | Level 3 | |
Other Financial Instruments* (continued) | | | | | | | | | | | | |
Futures Contracts | | $ | (10,011,674 | ) | | $ | — | | | $ | — | |
OTC Forward Foreign Currency Exchange Contracts | | | — | | | | 14,505,299 | | | | — | |
OTC Cross Currency Exchange Contracts | | | — | | | | 6,258,889 | | | | — | |
Centrally Cleared Credit Default Swap Agreements | | | — | | | | 119,705 | | | | — | |
OTC Credit Default Swap Agreements | | | — | | | | (1,580,551 | ) | | | 38,374 | |
Centrally Cleared Inflation Swap Agreement | | | — | | | | (147,781 | ) | | | — | |
Centrally Cleared Interest Rate Swap Agreements | | | — | | | | 74,403,906 | | | | — | |
OTC Total Return Swap Agreement | | | — | | | | 12,518 | | | | — | |
| | | | | | | | | | | | |
Total | | $ | 265,736,571 | | | $ | 2,372,493,937 | | | $ | 23,516,560 | |
| | | | | | | | | | | | |
The following is a reconciliation of assets in which unobservable inputs (Level 3) were used in determining fair value:
| | | | | | | | | | | | | | | | |
| | | Asset-Backed
Securities—
Collateralized Loan
Obligations | | | Asset-Backed
Securities—
Residential
Mortgage-Backed
Securities | | | Bank
Loans | | | Commercial
Mortgage-Backed
Securities | |
Balance as of 10/31/17 | | $ | 12,800,000 | | | $ | 2,900,000 | | | $ | — | | | $ | 1,312,964 | |
Realized gain (loss) | | | — | | | | 3,522 | | | | — | | | | — | |
Change in unrealized appreciation (depreciation) | | | — | | | | — | | | | — | | | | — | |
Purchases/Exchanges/Issuances | | | | | | | 21,983,850 | | | | 1,138,500 | | | | — | |
Sales/Paydowns | | | (12,800,000 | ) | | | (4,074,070 | ) | | | — | | | | — | |
Accrued discount/premium | | | — | | | | — | | | | — | | | | — | |
Transfers into of Level 3 | | | — | | | | — | | | | — | | | | — | |
Transfers out of Level 3 | | | — | | | | — | | | | — | | | | (1,312,964 | ) |
| | | | | | | | | | | | | | | | |
Balance as of 10/31/18 | | $ | — | | | $ | 20,813,302 | | | $ | 1,138,500 | | | $ | — | |
| | | | | | | | | | | | | | | | |
Change in unrealized appreciation (depreciation) relating to securities still held at reporting period end | | $ | — | | | $ | — | | | $ | — | | | $ | — | |
| | | | | | | | | | | | | | | | |
| | | | |
| | | Corporate Bonds | | | Residential
Mortgage-Backed
Securities | | | Options
Written | | | Credit Default
Swap Agreements | |
Balance as of 10/31/17 | | $ | 743,919 | | | $ | 9,337,675 | | | $ | — | | | $ | 32,417 | |
Realized gain (loss) | | | (13,956 | ) | | | — | | | | — | | | | 34,255 | |
Change in unrealized appreciation (depreciation) | | | (90,028 | ) | | | — | | | | 36,019 | | | | 5,957 | |
Purchases/Exchanges/Issuances | | | — | | | | — | | | | — | | | | — | |
Sales/Paydowns | | | (100,940 | ) | | | — | | | | (77,591 | ) | | | (34,255 | ) |
Accrued discount/premium | | | — | | | | — | | | | — | | | | — | |
Transfers into of Level 3 | | | 1,772,880 | | | | — | | | | — | | | | — | |
Transfers out of Level 3 | | | (743,919 | ) | | | (9,337,675 | ) | | | — | | | | — | |
| | | | | | | | | | | | | | | | |
Balance as of 10/31/18 | | $ | 1,567,956 | | | $ | — | | | $ | (41,572 | ) | | $ | 38,374 | |
| | | | | | | | | | | | | | | | |
See Notes to Financial Statements.
| | | | | | | | | | | | | | | | |
| | | Corporate
Bonds | | | Residential
Mortgage-Backed
Securities | | | Options
Written | | | Credit Default
Swap Agreements | |
Change in unrealized appreciation (depreciation) relating to securities still held at reporting period end | | $ | (90,028 | ) | | $ | — | | | $ | 36,019 | | | $ | 38,374 | |
| | | | | | | | | | | | | | | | |
| * | Other financial instruments are derivatives, with the exception of unfunded loan commitments and are not reflected in the Schedule of Investments. Futures, forwards, centrally cleared swap contracts and unfunded loan commitments are recorded at net unrealized appreciation (depreciation) and OTC swap contracts are recorded at fair value. |
Level 3 securities as presented in the table above are being fair valued using pricing methodologies approved by Board, which contain unobservable inputs as follows:
| | | | | | | | | | | | |
Level 3 Securities | | Fair Value as of
October 31, 2018 | | | Valuation
Methodology | | | Unobservable Inputs | |
Asset-Backed Securities—Residential Mortgage-Backed Securities | | $ | 20,813,302 | | | | Market Approach | | | | Single Broker Indicative Quote | |
Bank Loans | | | 1,138,500 | | | | Market Approach | | | | Single Broker Indicative Quote | |
Corporate Bonds | | | 1,567,956 | | | | Market Approach | | | | Single Broker Indicative Quote | |
Options Written | | | (41,572 | ) | | | Market Approach | | | | Single Broker Indicative Quote | |
Credit Default Swap Agreements | | | 38,374 | | | | Market Approach | | | | Single Broker Indicative Quote | |
| | | | | | | | | | | | |
| | $ | 23,516,560 | | | | | | | | | |
| | | | | | | | | | | | |
It is the Fund’s policy to recognize transfers in and transfers out at the fair value as of the beginning of period. Securities transferred levels as follows:
| | | | | | | | | | |
Investments in Securities | | Amount Transferred | | | Level Transfer | | Logic | |
Commercial Mortgage-Backed Securities | | $ | 1,312,964 | | | L3 to L2 | | | Single Broker Indicative Quote to Evaluated Bid | |
Corporate Bonds | | $ | 743,919 | | | L3 to L2 | | | Single Broker Indicative Quote to Evaluated Bid | |
Corporate Bonds | | $ | 1,772,880 | | | L2 to L3 | | | Evaluated Bid to Single Broker Indicative Quote | |
Residential Mortgage-Backed Securities | | $ | 9,337,675 | | | L3 to L2 | | | Single Broker Indicative Quote to Evaluated Bid | |
Industry Classification:
The industry classification of investments and other assets in excess of liabilities shown as a percentage of net assets as of October 31, 2018 were as follows (unaudited):
| | | | |
Collateralized Loan Obligations | | | 23.3 | % |
Affiliated Mutual Funds (3.1% represents investments purchased with collateral from securities on loan) | | | 10.5 | |
Residential Mortgage-Backed Securities | | | 9.9 | % |
Sovereign Bonds | | | 9.5 | |
Commercial Mortgage-Backed Securities | | | 6.2 | |
Banks | | | 4.8 | |
See Notes to Financial Statements.
| | | | |
| PGIM Absolute Return Bond Fund | | | 109 | |
Schedule of Investments (continued)
as of October 31, 2018
Industry Classification (continued):
| | | | |
U.S. Treasury Obligations | | | 3.6 | % |
Options Purchased | | | 2.6 | |
Home Equity Loans | | | 2.5 | |
Consumer Loans | | | 2.3 | |
Home Builders | | | 2.0 | |
Media | | | 1.7 | |
Oil & Gas | | | 1.7 | |
Telecommunications | | | 1.6 | |
Chemicals | | | 1.5 | |
Healthcare-Services | | | 1.4 | |
Electric | | | 1.2 | |
Retail | | | 1.0 | |
Entertainment | | | 1.0 | |
Commercial Services | | | 1.0 | |
Building Materials | | | 0.8 | |
Software | | | 0.8 | |
Student Loans | | | 0.7 | |
Insurance | | | 0.7 | |
Pipelines | | | 0.7 | |
Pharmaceuticals | | | 0.6 | |
Foods | | | 0.6 | |
Real Estate Investment Trusts (REITs) | | | 0.6 | |
Packaging & Containers | | | 0.6 | |
Lodging | | | 0.5 | |
Municipal Bonds | | | 0.5 | |
Technology | | | 0.4 | |
Electronics | | | 0.3 | |
Aerospace & Defense | | | 0.3 | |
Auto Parts & Equipment | | | 0.3 | |
Airlines | | | 0.2 | |
Investment Companies | | | 0.2 | |
Diversified Financial Services | | | 0.2 | |
Real Estate | | | 0.2 | |
Automobiles | | | 0.2 | |
Gas | | | 0.2 | |
Semiconductors | | | 0.2 | |
Transportation | | | 0.2 | |
| | | | |
Auto Manufacturers | | | 0.2 | % |
Energy-Alternate Sources | | | 0.1 | |
Beverages | | | 0.1 | |
Computers | | | 0.1 | |
Miscellaneous Manufacturing | | | 0.1 | |
Electrical Components & Equipment | | | 0.1 | |
Trucking & Leasing | | | 0.1 | |
Water | | | 0.1 | |
Home Furnishings | | | 0.1 | |
Apparel | | | 0.1 | |
Leisure Time | | | 0.1 | |
Distribution/Wholesale | | | 0.1 | |
Household Products/Wares | | | 0.1 | |
Multi-National | | | 0.1 | |
Biotechnology | | | 0.1 | |
Oil, Gas & Consumable Fuels | | | 0.1 | |
Housewares | | | 0.1 | |
Consumer Services | | | 0.0 | * |
Oil, Gas & Coal | | | 0.0 | * |
Internet | | | 0.0 | * |
Mining | | | 0.0 | * |
Forest Products & Paper | | | 0.0 | * |
Iron/Steel | | | 0.0 | * |
Savings & Loans | | | 0.0 | * |
Oil & Gas Services | | | 0.0 | * |
Textiles | | | 0.0 | * |
Healthcare & Pharmaceuticals | | | 0.0 | * |
Machinery-Diversified | | | 0.0 | * |
| | | | |
| | | 101.1 | |
| Options Written | | | (2.6 | ) |
| Other assets in excess of liabilities | | | 1.5 | |
| | | | |
| | | 100.0 | % |
| | | | |
Effects of Derivative Instruments on the Financial Statements and Primary Underlying Risk Exposure:
The Fund invested in derivative instruments during the reporting period. The primary types of risk associated with these derivative instruments are credit contracts risk, foreign exchange contracts risk and interest rate contracts risk. The effect of such derivative instruments on the Fund’s financial position and financial performance as reflected in the Statement of Assets and Liabilities and Statement of Operations is presented in the summary below.
See Notes to Financial Statements.
Fair values of derivative instruments as of October 31, 2018 as presented in the Statement of Assets and Liabilities:
| | | | | | | | | | | | |
| | | Asset Derivatives | | | Liability Derivatives | |
Derivatives not
accounted
for as hedging instruments,
carried at fair value | | Statement of Assets
and
Liabilities Location | | Fair
Value | | | Statement of Assets
and
Liabilities Location | | Fair
Value | |
| Credit contracts | | Due from/to broker-variation
margin swaps | | $ | 626,097 | * | | Due from/to broker-variation
margin swaps | | $ | 506,392 | * |
| Credit contracts | | Premiums paid for OTC
swap agreements | | | 1,533,905 | | | Premiums received for OTC
swap agreements | | | 5,292,750 | |
| Credit contracts | | Unaffiliated investments | | | 104,691 | | | Options written
outstanding, at value | | | 963,664 | |
| Credit contracts | | Unrealized appreciation on
OTC swap agreements | | | 2,643,787 | | | Unrealized depreciation on
OTC swap agreements | | | 427,119 | |
| Foreign exchange contracts | | Unaffiliated investments | | | 66,406,973 | | | Options written
outstanding, at value | | | 66,462,237 | |
| Foreign exchange contracts | | Unrealized appreciation on
OTC cross currency
exchange contracts | | | 8,453,202 | | | Unrealized depreciation on
OTC cross currency
exchange contracts | | | 2,194,313 | |
| Foreign exchange contracts | | Unrealized appreciation on
OTC forward foreign
currency exchange contracts | | | 32,728,424 | | | Unrealized depreciation on
OTC forward foreign
currency exchange contracts | | �� | 18,223,125 | |
| Interest rate contracts | | Due from/to broker-variation
margin futures | | | 5,007,007 | * | | Due from/to broker-variation
margin futures | | | 15,018,681 | * |
| Interest rate contracts | | Due from/to broker-variation
margin swaps | | | 115,918,358 | * | | Due from/to broker-variation
margin swaps | | | 41,662,233 | * |
| Interest rate contracts | | — | | | — | | | Premiums received for OTC
swap agreements | | | 23,726 | |
| Interest rate contracts | | Unaffiliated investments | | | 1,114,430 | | | Options written
outstanding, at value | | | 41,572 | |
| Interest rate contracts | | Unrealized appreciation on
OTC swap agreements | | | 36,244 | | | — | | | — | |
| | | | | | | | | | | | |
| | | | $ | 234,573,118 | | | | | $ | 150,815,812 | |
| | | | | | | | | | | | |
| * | Includes cumulative appreciation (depreciation) as reported in the schedule of open futures and centrally cleared swap contracts. Only unsettled variation margin receivable (payable) is reported within the Statement of Assets and Liabilities. |
See Notes to Financial Statements.
| | | | |
| PGIM Absolute Return Bond Fund | | | 111 | |
Schedule of Investments (continued)
as of October 31, 2018
The effects of derivative instruments on the Statement of Operations for the year ended October 31, 2018 are as follows:
| | | | | | | | | | | | | | | | | | | | | | | | |
Amount of Realized Gain (Loss) on Derivatives Recognized in Income | |
Derivatives not accounted
for as hedging instruments,
carried at fair value | | Options
Purchased(1) | | | Options
Written | | | Futures | | | Forward
& Cross
Currency
Exchange
Contracts | | | Forward
Rate
Agreements | | | Swaps | |
Credit contracts | | $ | (186,461 | ) | | $ | 2,245,800 | | | $ | — | | | $ | — | | | $ | — | | | $ | 3,601,217 | |
Foreign exchange contracts | | | (374,495 | ) | | | 2,056,569 | | | | — | | | | 8,782,556 | | | | — | | | | — | |
Interest rate contracts | | | (2,375,320 | ) | | | 1,858,749 | | | | (17,765,290 | ) | | | — | | | | (197,618 | ) | | | (3,330,559 | ) |
| | | | | | | | | | | | | | | | | | | | | | | | |
Total | | $ | (2,936,276 | ) | | $ | 6,161,118 | | | $ | (17,765,290 | ) | | $ | 8,782,556 | | | $ | (197,618 | ) | | $ | 270,658 | |
| | | | | | | | | | | | | | | | | | | | | | | | |
| (1) | Included in net realized gain (loss) on investment transactions in the Statement of Operations. |
| | | | | | | | | | | | | | | | | | | | |
Change in Unrealized Appreciation (Depreciation) on Derivatives Recognized in Income | |
Derivatives not accounted
for as hedging instruments,
carried at fair value | | Options
Purchased(2) | | | Options
Written | | | Futures | | | Forward
& Cross
Currency
Exchange
Contracts | | | Swaps | |
Credit contracts | | $ | (5,456 | ) | | $ | (715,885 | ) | | $ | — | | | $ | — | | | $ | (683,842 | ) |
Foreign exchange contracts | | | (12,366,387 | ) | | | (1,357,112 | ) | | | — | | | | 21,062,194 | | | | — | |
Interest rate contracts | | | 1,435,729 | | | | (783,934 | ) | | | (13,311,364 | ) | | | — | | | | 77,028,460 | |
| | | | | | | | | | | | | | | | | | | | |
Total | | $ | (10,936,114 | ) | | $ | (2,856,931 | ) | | $ | (13,311,364 | ) | | $ | 21,062,194 | | | $ | 76,344,618 | |
| | | | | | | | | | | | | | | | | | | | |
| (2) | Included in net change in unrealized appreciation (depreciation) on investments in the Statement of Operations. |
For the year ended October 31, 2018, the Fund’s average volume of derivative activities is as follows:
| | | | | | | | | | | | | | | | | | |
Options
Purchased(1) | | | Options
Written(2) | | | Futures
Contracts—
Long
Positions(2) | | | Futures
Contracts—
Short
Positions(2) | | | Forward
Foreign
Currency
Exchange
Contracts—
Purchased(3) | |
| $ | 36,331,262 | | | $ | 1,597,768,710 | | | $ | 1,321,425,157 | | | $ | 629,500,022 | | | $ | 315,717,974 | |
| | | | | | | | | | | | | | | | | | |
Forward
Foreign
Currency
Exchange
Contracts—
Sold(3) | | | Cross
Currency
Exchange
Contracts(4) | | | Forward Rate
Agreements(2) | | | Interest Rate
Swap
Agreements(2) | | | Credit Default
Swap Agreements—
Buy Protection(2) | |
| $ | 591,554,363 | | | $ | 57,533,337 | | | $ | 169,560,000 | | | $ | 8,801,354,271 | | | $ | 67,605,800 | |
| | | | | | | | | | | | | | |
Credit
Default
Swap
Agreements—
Sell
Protection(2) | | | Currency
Swap
Agreements(2) | | | Total Return
Swap
Agreements(2) | | | Inflation
Swap
Agreements(2) | |
| $ | 211,027,994 | | | $ | 20,289,600 | | | $ | 16,921,200 | | | $ | 62,074,099 | |
See Notes to Financial Statements.
| (2) | Notional Amount in USD. |
| (3) | Value at Settlement Date. |
Financial Instruments/Transactions—Summary of Offsetting and Netting Arrangements:
The Fund invested in OTC derivatives and entered into financial instruments/transactions during the reporting period that are either offset in accordance with current requirements or are subject to enforceable master netting arrangements or similar agreements that permit offsetting. The information about offsetting and related netting arrangements for OTC derivatives and financial instruments/transactions, where the legal right to set-off exists, is presented in the summary below.
Offsetting of financial instrument/transaction assets and liabilities:
| | | | | | | | | | | | |
Description | | Gross Market
Value of
Recognized
Assets/(Liabilities) | | | Collateral
Pledged/
(Received)(2) | | | Net Amount | |
Securities on Loan | | $ | 78,059,324 | | | $ | (78,059,324 | ) | | $ | — | |
| | | | | | | | | | | | |
Offsetting of OTC derivative assets and liabilities:
| | | | | | | | | | | | | | | | | | | | |
Counterparty | | Gross
Amounts of
Recognized
Assets(1) | | | Gross
Amounts of
Recognized
Liabilities(1) | | | Net Amounts of
Recognized
Assets/(Liabilities) | | | Collateral
Pledged/
(Received)(2) | | | Net Amount | |
Bank of America | | $ | 2,897,156 | | | $ | (3,115,341 | ) | | $ | (218,185 | ) | | $ | 218,185 | | | $ | — | |
Barclays Bank PLC | | | 1,713,415 | | | | (2,095,821 | ) | | | (382,406 | ) | | | 382,406 | | | | — | |
BNP Paribas | | | 11,997,504 | | | | (15,852,730 | ) | | | (3,855,226 | ) | | | 3,855,226 | | | | — | |
Citibank NA | | | 5,677,282 | | | | (6,677,211 | ) | | | (999,929 | ) | | | 999,929 | | | | — | |
Credit Suisse | | | | | | | | | | | | | | | | | | | | |
International | | | 686,395 | | | | (563,586 | ) | | | 122,809 | | | | (122,809 | ) | | | — | |
Deutsche Bank AG | | | 27,818,931 | | | | (19,253,503 | ) | | | 8,565,428 | | | | (8,129,780 | ) | | | 435,648 | |
Goldman Sachs | | | | | | | | | | | | | | | | | | | | |
International | | | 17,249,748 | | | | (17,171,094 | ) | | | 78,654 | | | | — | | | | 78,654 | |
Hong Kong & | | | | | | | | | | | | | | | | | | | | |
Shanghai Bank | | | 1,776,831 | | | | (1,539,660 | ) | | | 237,171 | | | | — | | | | 237,171 | |
JPMorgan Chase | | | 6,942,028 | | | | (3,464,570 | ) | | | 3,477,458 | | | | (3,477,458 | ) | | | — | |
JPMorgan | | | | | | | | | | | | | | | | | | | | |
Securities | | | 83,820 | | | | (66,951 | ) | | | 16,869 | | | | — | | | | 16,869 | |
Morgan Stanley | | | 32,547,336 | | | | (22,617,349 | ) | | | 9,929,987 | | | | (9,929,987 | ) | | | — | |
Toronto Dominion | | | 819,516 | | | | (257,073 | ) | | | 562,443 | | | | (562,443 | ) | | | — | |
UBS AG | | | 2,811,694 | | | | (953,617 | ) | | | 1,858,077 | | | | (1,055,068 | ) | | | 803,009 | |
| | | | | | | | | | | | | | | | | | | | |
| | $ | 113,021,656 | | | $ | (93,628,506 | ) | | $ | 19,393,150 | | | $ | (17,821,799 | ) | | $ | 1,571,351 | |
| | | | | | | | | | | | | | | | | | | | |
| (1) | Includes unrealized appreciation/(depreciation) on swaps and forwards, premiums paid/(received) on swap agreements and market value of purchased and written options, as represented on the Statement of Assets and Liabilities. |
| (2) | Collateral amount disclosed by the Fund is limited to the market value of financial instruments/transactions and the Fund’s OTC derivative exposure by counterparty. |
| | | | |
| PGIM Absolute Return Bond Fund | | | 113 | |
Statement of Assets and Liabilities
as of October 31, 2018
| | | | |
Assets | | | | |
Investments at value, including securities on loan of $78,059,324: | | | | |
Unaffiliated investments (cost $2,427,240,030) | | $ | 2,371,698,417 | |
Affiliated investments (cost $274,020,933) | | | 274,022,630 | |
Cash | | | 1,836,412 | |
Foreign currency, at value (cost $3,503,656) | | | 3,493,887 | |
Cash segregated for counterparty—OTC | | | 270,000 | |
Deposit with broker for centrally cleared/exchange-traded derivatives | | | 70,466,000 | |
Unrealized appreciation on OTC forward foreign currency exchange contracts | | | 32,728,424 | |
Receivable for Fund shares sold | | | 19,655,094 | |
Dividends and interest receivable | | | 18,876,344 | |
Unrealized appreciation on OTC cross currency exchange contracts | | | 8,453,202 | |
Due from broker—variation margin swaps | | | 5,670,380 | |
Receivable for investments sold | | | 2,992,336 | |
Unrealized appreciation on OTC swap agreements | | | 2,680,031 | |
Premiums paid for OTC swap agreements | | | 1,533,905 | |
Prepaid expenses | | | 19,241 | |
| | | | |
Total Assets | | | 2,814,396,303 | |
| | | | |
| |
Liabilities | | | | |
Payable to broker for collateral for securities on loan | | | 80,080,072 | |
Options written outstanding, at value (proceeds received $66,394,378) | | | 67,467,473 | |
Unrealized depreciation on OTC forward foreign currency exchange contracts | | | 18,223,125 | |
Payable for Fund shares reacquired | | | 8,900,140 | |
Payable for investments purchased | | | 5,807,813 | |
Premiums received for OTC swap agreements | | | 5,316,476 | |
Due to broker—variation margin futures | | | 3,934,972 | |
Unrealized depreciation on OTC cross currency exchange contracts | | | 2,194,313 | |
Dividends payable | | | 1,796,946 | |
Management fee payable | | | 1,222,760 | |
Accrued expenses and other liabilities | | | 557,322 | |
Unrealized depreciation on OTC swap agreements | | | 427,119 | |
Distribution fee payable | | | 123,154 | |
Unrealized depreciation on unfunded loan commitment | | | 105,191 | |
Affiliated transfer agent fee payable | | | 6,748 | |
| | | | |
Total Liabilities | | | 196,163,624 | |
| | | | |
| |
Net Assets | | $ | 2,618,232,679 | |
| | | | |
| | | | | |
Net assets were comprised of: | | | | |
Shares of beneficial interest, at par | | $ | 265,594 | |
Paid-in capital in excess of par | | | 2,670,114,229 | |
Total distributable earnings (loss) | | | (52,147,144 | ) |
| | | | |
Net assets, October 31, 2018 | | $ | 2,618,232,679 | |
| | | | |
See Notes to Financial Statements.
| | | | |
Class A | | | | |
Net asset value and redemption price per share, | | | | |
($148,609,295 ÷ 15,127,567 shares of beneficial interest issued and outstanding) | | $ | 9.82 | |
Maximum sales charge (4.50% of offering price) | | | 0.46 | |
| | | | |
Maximum offering price to public | | $ | 10.28 | |
| | | | |
|
Class C | |
Net asset value, offering price and redemption price per share, | | | | |
($106,734,014 ÷ 10,834,265 shares of beneficial interest issued and outstanding) | | $ | 9.85 | |
| | | | |
|
Class Z | |
Net asset value, offering price and redemption price per share, | | | | |
($2,159,517,732 ÷ 218,931,000 shares of beneficial interest issued and outstanding) | | $ | 9.86 | |
| | | | |
|
Class R6 | |
Net asset value, offering price and redemption price per share, | | | | |
($203,371,638 ÷ 20,700,865 shares of beneficial interest issued and outstanding) | | $ | 9.82 | |
| | | | |
See Notes to Financial Statements.
| | | | |
| PGIM Absolute Return Bond Fund | | | 115 | |
Statement of Operations
Year Ended October 31, 2018
| | | | |
Net Investment Income (Loss) | |
Income | |
Interest income (net of $2,238 foreign withholding tax) | | $ | 80,492,145 | |
Affiliated dividend income | | | 3,704,433 | |
Income from securities lending, net (including affiliated income of $110,038) | | | 396,699 | |
| | | | |
Total income | | | 84,593,277 | |
| | | | |
|
Expenses | |
Management fee | | | 15,129,812 | |
Distribution fee(a) | | | 1,385,189 | |
Transfer agent’s fees and expenses (including affiliated expense of $176,142)(a) | | | 2,047,736 | |
Custodian and accounting fees | | | 328,116 | |
Registration fees(a) | | | 142,937 | |
Shareholders’ reports | | | 124,399 | |
Audit fee | | | 65,237 | |
Trustees’ fees | | | 50,437 | |
Legal fees and expenses | | | 32,313 | |
Miscellaneous | | | 35,262 | |
| | | | |
Total expenses | | | 19,341,438 | |
Less: Fee waiver and/or expense reimbursement(a) | | | (973,229 | ) |
| | | | |
Net expenses | | | 18,368,209 | |
| | | | |
Net investment income (loss) | | | 66,225,068 | |
| | | | |
| |
Realized And Unrealized Gain (Loss) On Investment And Foreign Currency Transactions | | | | |
Net realized gain (loss) on: | | | | |
Investment transactions (including affiliated of $(3,291)) | | | (3,231,668 | ) |
Futures transactions | | | (17,765,290 | ) |
Forward rate agreement transactions | | | (197,618 | ) |
Forward and cross currency contract transactions | | | 8,782,556 | |
Options written transactions | | | 6,161,118 | |
Swap agreement transactions | | | 270,658 | |
Foreign currency transactions | | | (1,498,926 | ) |
| | | | |
| | | (7,479,170 | ) |
| | | | |
Net change in unrealized appreciation (depreciation) on: | | | | |
Investments (including affiliated of $(2,919)) | | | (88,152,249 | ) |
Futures | | | (13,311,364 | ) |
Forward and cross currency contracts | | | 21,062,194 | |
Options written | | | (2,856,931 | ) |
Swap agreements | | | 76,344,618 | |
Foreign currencies | | | 144,752 | |
Unfunded loan commitment | | | (105,191 | ) |
| | | | |
| | | (6,874,171 | ) |
| | | | |
Net gain (loss) on investment and foreign currency transactions | | | (14,353,341 | ) |
| | | | |
Net Increase (Decrease) In Net Assets Resulting From Operations | | $ | 51,871,727 | |
| | | | |
See Notes to Financial Statements.
| (a) | Class specific expenses and waivers were as follows: |
| | | | | | | | | | | | | | | | |
| | | Class A | | | Class C | | | Class Z | | | Class R6 | |
Distribution fee | | | 356,531 | | | | 1,028,658 | | | | — | | | | — | |
Transfer agent’s fees and expenses | | | 101,777 | | | | 81,275 | | | | 1,746,832 | | | | 117,852 | |
Registration fees | | | 21,866 | | | | 14,941 | | | | 86,911 | | | | 19,219 | |
Fee waiver and/or expense reimbursement | | | (7,197 | ) | | | (5,952 | ) | | | (913,213 | ) | | | (46,867 | ) |
See Notes to Financial Statements.
| | | | |
| PGIM Absolute Return Bond Fund | | | 117 | |
Statements of Changes in Net Assets
| | | | | | | | |
| | | Year Ended October 31, | |
| | | 2018 | | | 2017 | |
Increase (Decrease) in Net Assets | | | | | | | | |
Operations | | | | | | | | |
Net investment income (loss) | | $ | 66,225,068 | | | $ | 41,264,043 | |
Net realized gain (loss) on investment and foreign currency transactions | | | (7,479,170 | ) | | | (27,972,409 | ) |
Net change in unrealized appreciation (depreciation) on investments and foreign currencies | | | (6,874,171 | ) | | | 84,184,745 | |
| | | | | | | | |
Net increase (decrease) in net assets resulting from operations | | | 51,871,727 | | | | 97,476,379 | |
| | | | | | | | |
| | |
Dividends and Distributions | | | | | | | | |
Distributions from distributable earnings* | | | | | | | | |
Class A | | | (4,734,445 | ) | | | — | |
Class C | | | (2,615,351 | ) | | | — | |
Class Z | | | (60,484,857 | ) | | | — | |
Class R6 | | | (11,823,707 | ) | | | — | |
| | | | | | | | |
| | | (79,658,360 | ) | | | — | |
| | | | | | | | |
Dividends from net investment income | | | | | | | | |
Class A | | | | | | | (3,294,330 | ) |
Class C | | | | | | | (1,651,332 | ) |
Class Z | | | | | | | (28,720,055 | ) |
Class R6 | | | | | | | (7,126,086 | ) |
| | | | | | | | |
| | | * | | | | (40,791,803 | ) |
| | | | | | | | |
Fund share transactions (Net of share conversions) | | | | | | | | |
Net proceeds from shares sold | | | 1,576,859,957 | | | | 772,806,468 | |
Net asset value of shares issued in reinvestment of dividends and distributions | | | 62,358,791 | | | | 29,178,897 | |
Cost of shares reacquired | | | (835,611,009 | ) | | | (527,204,224 | ) |
| | | | | | | | |
Net increase (decrease) in net assets from Fund share transactions | | | 803,607,739 | | | | 274,781,141 | |
| | | | | | | | |
Total increase (decrease) | | | 775,821,106 | | | | 331,465,717 | |
|
Net Assets: | |
Beginning of year | | | 1,842,411,573 | | | | 1,510,945,856 | |
| | | | | | | | |
End of year(a) | | $ | 2,618,232,679 | | | $ | 1,842,411,573 | |
| | | | | | | | |
(a) Includes undistributed/(distributions in excess of) net investment income of: | | $ | * | | | $ | 5,723,264 | |
| | | | | | | | |
| * | For the year ended October 31, 2018, the Fund has adopted amendments to Regulation S-X (refer to Note 9). |
See Notes to Financial Statements.
Notes to Financial Statements
Prudential Investment Portfolios 9 (the “Trust”) is registered under the Investment Company Act of 1940, as amended (“1940 Act”), as an open-end management investment company. The Trust was established as a Delaware business trust on September 18, 1998. The Trust currently consists of five funds: PGIM Absolute Return Bond Fund and PGIM QMA Large-Cap Core Equity Fund, each of which are diversified funds and PGIM International Bond Fund, PGIM Select Real Estate Fund and PGIM Real Estate Income Fund, each of which are non-diversified funds for purposes of the 1940 Act and may invest a greater percentage of their assets in the securities of a single company or other issuer than a diversified fund. Investing in a non-diversified fund involves greater risk than investing in a diversified fund because a loss resulting from the decline in value of any one security may represent a greater portion of the total assets of a non-diversified fund. These financial statements relate only to the PGIM Absolute Return Bond Fund (the “Fund”). Effective June 11, 2018, the names of the Fund and the other funds which comprise the Trust were changed by replacing “Prudential” with “PGIM” and each fund’s Class Q shares were renamed Class R6 shares.
The investment objective of the Fund is seek positive returns over the long term, regardless of market conditions.
1. Accounting Policies
The Fund follows the investment company accounting and reporting guidance of the Financial Accounting Standards Board (“FASB”) Accounting Standard Codification (“ASC”) Topic 946 Financial Services—Investment Companies. The following accounting policies conform to U.S. generally accepted accounting principles. The Fund consistently follows such policies in the preparation of its financial statements.
Securities Valuation: The Fund holds securities and other assets and liabilities that are fair valued at the close of each day (generally, 4:00 PM Eastern time) the New York Stock Exchange (“NYSE”) is open for trading. Fair value is the price that would be received to sell an asset or paid to transfer a liability in an orderly transaction between market participants on the measurement date. The Trust’s Board of Trustees (the “Board”) has adopted valuation procedures for security valuation under which fair valuation responsibilities have been delegated to PGIM Investments LLC (“PGIM Investments” or the “Manager”). Pursuant to the Board’s delegation, a Valuation Committee has been established as two persons, being one or more officers of the Trust, including: the Trust’s Treasurer (or the Treasurer’s direct reports); and the Trust’s Chief or Deputy Chief Compliance Officer (or Vice-President-level direct reports of the Chief or Deputy Chief Compliance Officer). Under the current valuation procedures, the Valuation Committee of the Board is responsible for supervising the valuation of portfolio securities and other assets and liabilities. The valuation procedures permit the Fund to utilize independent pricing vendor services, quotations from
| | | | |
| PGIM Absolute Return Bond Fund | | | 119 | |
Notes to Financial Statements (continued)
market makers, and alternative valuation methods when market quotations are either not readily available or not deemed representative of fair value. A record of the Valuation Committee’s actions is subject to the Board’s review, approval, and ratification at its next regularly scheduled quarterly meeting.
For the fiscal reporting period-end, securities and other assets and liabilities were fair valued at the close of the last U.S. business day. Trading in certain foreign securities may occur when the NYSE is closed (including weekends and holidays). Because such foreign securities trade in markets that are open on weekends and U.S. holidays, the values of some of the Fund’s foreign investments may change on days when investors cannot purchase or redeem Fund shares.
Various inputs determine how the Fund’s investments are valued, all of which are categorized according to the three broad levels (Level 1, 2, or 3) detailed in the Schedule of Investments and referred to herein as the “fair value hierarchy” in accordance with FASB ASC Topic 820—Fair Value Measurements and Disclosures.
Derivative instruments, such as futures or options, that are traded on a national securities exchange are valued at the last sale price as of the close of trading on the applicable exchange where the security principally trades. Securities traded via NASDAQ are valued at the NASDAQ official closing price. To the extent these securities are valued at the last sale price or NASDAQ official closing price, they are classified as Level 1 in the fair value hierarchy.
Investments in open-end, non-exchange-traded mutual funds are valued at their net asset values as of the close of the NYSE on the date of valuation. These securities are classified as Level 1 in the fair value hierarchy since they may be purchased or sold at their net asset values on the date of valuation.
Fixed income securities traded in the OTC market are generally classified as Level 2 in the fair value hierarchy. Such fixed income securities are typically valued using the market approach which generally involves obtaining data from an approved independent third-party vendor source. The Fund utilizes the market approach as the primary method to value securities when market prices of identical or comparable instruments are available. The third-party vendors’ valuation techniques used to derive the evaluated bid price are based on evaluating observable inputs, including but not limited to, yield curves, yield spreads, credit ratings, deal terms, tranche level attributes, default rates, cash flows, prepayment speeds, broker/dealer quotations and reported trades. Certain Level 3 securities are also valued using the market approach when obtaining a single broker quote or when utilizing transaction prices for identical securities that have been used in excess of five business
days. During the reporting period, there were no changes to report with respect to the valuation approach and/or valuation techniques discussed above.
Bank loans are generally valued at prices provided by approved independent pricing vendors. The pricing vendors utilize broker/dealer quotations and provide prices based on the average of such quotations. Bank loans valued using such vendor prices are generally classified as Level 2 in the fair value hierarchy. Bank loans valued based on a single broker quote or at the original transaction price in excess of five business days are classified as Level 3 in the fair value hierarchy.
OTC derivative instruments are generally classified as Level 2 in the fair value hierarchy. Such derivative instruments are typically valued using the market approach and/or income approach which generally involves obtaining data from an approved independent third-party vendor source. The Fund utilizes the market approach when quoted prices in broker-dealer markets are available but also includes consideration of alternative valuation approaches, including the income approach. In the absence of reliable market quotations, the income approach is typically utilized for purposes of valuing OTC derivatives such as interest rate swaps based on a discounted cash flow analysis whereby the value of the instrument is equal to the present value of its future cash inflows or outflows. Such analysis includes projecting future cash flows and determining the discount rate (including the present value factors that affect the discount rate) used to discount the future cash flows. In addition, the third-party vendors’ valuation techniques used to derive the evaluated OTC derivative price is based on evaluating observable inputs, including but not limited to, underlying asset prices, indices, spreads, interest rates and exchange rates. Certain OTC derivatives may be classified as Level 3 when valued using the market approach by obtaining a single broker quote or when utilizing unobservable inputs in the income approach. During the reporting period, there were no changes to report with respect to the valuation approach and/or valuation techniques discussed above.
Centrally cleared swaps listed or traded on a multilateral or trade facility platform, such as a registered exchange, are generally valued at the daily settlement price determined by the respective exchange. These securities are classified as Level 2 in the fair value hierarchy, as the daily settlement price is not public.
Securities and other assets that cannot be priced according to the methods described above are valued based on pricing methodologies approved by the Board. In the event that unobservable inputs are used when determining such valuations, the securities will be classified as Level 3 in the fair value hierarchy.
When determining the fair value of securities, some of the factors influencing the valuation include: the nature of any restrictions on disposition of the securities; assessment of the general liquidity of the securities; the issuer’s financial condition and the markets in which it does business; the cost of the investment; the size of the holding and the capitalization of the issuer; the prices of any recent transactions or bids/offers for such securities or any comparable securities; any available analyst media or other reports or information deemed
| | | | |
| PGIM Absolute Return Bond Fund | | | 121 | |
Notes to Financial Statements (continued)
reliable by the Manager regarding the issuer or the markets or industry in which it operates. Using fair value to price securities may result in a value that is different from a security’s most recent closing price and from the price used by other unaffiliated mutual funds to calculate their net asset values.
Restricted and Illiquid Securities: Subject to guidelines adopted by the Board, the Fund may invest up to 15% of its net assets in illiquid securities, including those which are restricted as to disposition under securities law (“restricted securities”). Restricted securities are valued pursuant to the valuation procedures noted above. Illiquid securities are those that, because of the absence of a readily available market or due to legal or contractual restrictions on resale, cannot be sold within seven days in the ordinary course of business at approximately the amount at which the Fund has valued the investment. Therefore, the Fund may find it difficult to sell illiquid securities at the time considered most advantageous by its subadviser and may incur transaction costs that would not be incurred in the sale of securities that were freely marketable. Certain securities that would otherwise be considered illiquid because of legal restrictions on resale to the general public may be traded among qualified institutional buyers under Rule 144A of the Securities Act of 1933. These Rule 144A securities, as well as commercial paper that is sold in private placements under Section 4(2) of the Securities Act, may be deemed liquid by the Fund’s subadviser under the guidelines adopted by the Trustees of the Trust. However, the liquidity of the Fund’s investments in Rule 144A securities could be impaired if trading does not develop or declines.
Connecticut Avenue Securities (CAS) and Structured Agency Credit Risk (STACR): The Fund purchased government controlled Fannie Mae and Freddie Mac securities that transfer most of the cost of defaults to private investors including the Fund. These are insurance-like products that are called CAS by Fannie Mae and STACR securities by Freddie Mac. Payments on the securities are based primarily on the performance of a reference pool of underlying mortgages. With such securities, the Fund could lose some or all of its principal if the underlying mortgages experience credit defaults.
Foreign Currency Translation: The books and records of the Fund are maintained in U.S. dollars. Foreign currency amounts are translated into U.S. dollars on the following basis:
(i) market value of investment securities, other assets and liabilities—at the current rates of exchange;
(ii) purchases and sales of investment securities, income and expenses—at the rates of exchange prevailing on the respective dates of such transactions.
Although the net assets of the Fund are presented at the foreign exchange rates and market values at the close of the period, the Fund does not generally isolate that portion of the results of operations arising as a result of changes in the foreign exchange rates from the fluctuations arising from changes in the market prices of long-term portfolio securities held at the end of the period. Similarly, the Fund does not isolate the effect of changes in foreign exchange rates from the fluctuations arising from changes in the market prices of long-term portfolio securities sold during the period. Accordingly, holding period realized foreign currency gains (losses) are included in the reported net realized gains (losses) on investment transactions. Notwithstanding the above, the Fund does isolate the effect of fluctuations in foreign currency exchange rates when determining the gain (loss) upon the sale or maturity of foreign currency denominated debt obligations; such amounts are included in net realized gains (losses) on foreign currency transactions.
Additionally, net realized gains (losses) on foreign currency transactions represent net foreign exchange gains (losses) from the disposition of holdings of foreign currencies, currency gains (losses) realized between the trade and settlement dates on securities transactions, and the difference between the amounts of interest, dividends and foreign withholding taxes recorded on the Fund’s books and the U.S. dollar equivalent amounts actually received or paid. Net unrealized currency gains (losses) arise from valuing foreign currency denominated assets and liabilities (other than investments) at period end exchange rates.
Forward and Cross Currency Contracts: A forward currency contract is a commitment to purchase or sell a foreign currency at a future date at a negotiated forward rate. The Fund enters into forward currency contracts in order to hedge its exposure to changes in foreign currency exchange rates on its foreign portfolio holdings or specific receivables and payables denominated in a foreign currency and to gain exposure to certain currencies. The contracts are valued daily at current forward exchange rates and any unrealized gain (loss) is included in net unrealized appreciation (depreciation) on investments and foreign currencies. Gain (loss) is realized on the settlement date of the contract equal to the difference between the settlement value of the original and negotiated forward contracts. This gain (loss), if any, is included in net realized gain (loss) on forward and cross currency contract transactions. Risks may arise upon entering into these contracts from the potential inability of the counterparties to meet the terms of their contracts. Forward currency contracts involve risks from currency exchange rate and credit risk in excess of the amounts reflected on the Statement of Assets and Liabilities. The Fund’s maximum risk of loss from counterparty credit risk is the net value of the cash flows to be received from the counterparty at the end of the contract’s life. A cross currency contract is a forward contract where a specified amount of one foreign currency will be exchanged for a specified amount of another foreign currency.
Options: The Fund purchased or wrote options in order to hedge against adverse market movements or fluctuations in value caused by changes in prevailing interest rates, value of equities or foreign currency exchange rates with respect to securities or financial instruments which the Fund currently owns or intends to purchase. The Fund may also use
| | | | |
| PGIM Absolute Return Bond Fund | | | 123 | |
Notes to Financial Statements (continued)
options to gain additional market exposure. The Fund’s principal reason for writing options is to realize, through receipt of premiums, a greater current return than would be realized on the underlying security alone. When the Fund purchases an option, it pays a premium and an amount equal to that premium is recorded as an asset. When the Fund writes an option, it receives a premium and an amount equal to that premium is recorded as a liability. The asset or liability is adjusted daily to reflect the current market value of the option. If an option expires unexercised, the Fund realizes a gain (loss) to the extent of the premium received or paid. If an option is exercised, the premium received or paid is recorded as an adjustment to the proceeds from the sale or the cost of the purchase in determining whether the Fund has realized a gain (loss). The difference between the premium and the amount received or paid at the closing of a purchase or sale transaction is also treated as a realized gain (loss). Gain (loss) on purchased options is included in net realized gain (loss) on investment transactions. Gain (loss) on written options is presented separately as net realized gain (loss) on options written transactions.
The Fund, as writer of an option, may have no control over whether the underlying securities or financial instruments may be sold (called) or purchased (put). As a result, the Fund bears the market risk of an unfavorable change in the price of the security or financial instrument underlying the written option. The Fund, as purchaser of an OTC option, bears the risk of the potential inability of the counterparties to meet the terms of their contracts. With exchange-traded options contracts, there is minimal counterparty credit risk to the Fund since the exchanges’ clearinghouse acts as counterparty to all exchange-traded options and guarantees the options contracts against default.
When the Fund writes an option on a swap, an amount equal to any premium received by the Fund is recorded as a liability and is subsequently adjusted to the current market value of the written option on the swap. If a call option on a swap is exercised, the Fund becomes obligated to pay a fixed interest rate (noted as the strike price) and receive a variable interest rate on a notional amount. If a put option on a swap is exercised, the Fund becomes obligated to pay a variable interest rate and receive a fixed interest rate (noted as the strike price) on a notional amount. Premiums received from writing options on swaps that expire or are exercised are treated as realized gains upon the expiration or exercise of such options on swaps. The risk associated with writing put and call options on swaps is that the Fund will be obligated to be party to a swap agreement if an option on a swap is exercised.
Financial Futures Contracts: A financial futures contract is an agreement to purchase (long) or sell (short) an agreed amount of securities at a set price for delivery on a future date. Upon entering into a financial futures contract, the Fund is required to pledge to the broker an amount of cash and/or other assets equal to a certain percentage of the contract amount. This amount is known as the “initial margin.” Subsequent payments, known as “variation margin,” are made or received by the Fund each day, depending on the daily fluctuations in
the value of the underlying security. Such variation margin is recorded for financial statement purposes on a daily basis as unrealized gain (loss). When the contract expires or is closed, the gain (loss) is realized and is presented in the Statement of Operations as net realized gain (loss) on futures transactions.
The Fund invested in financial futures contracts in order to hedge its existing portfolio securities, or securities the Fund intends to purchase, against fluctuations in value caused by changes in prevailing interest rates. Should interest rates move unexpectedly, the Fund may not achieve the anticipated benefits of the financial futures contracts and may realize a loss. The use of futures transactions involves the risk of imperfect correlation in movements in the price of futures contracts, interest rates and the underlying hedged assets. Since futures contracts are exchange-traded, there is minimal counterparty credit risk to the Fund since the exchanges’ clearinghouse acts as counterparty to all exchange-traded futures and guarantees the futures contracts against default.
Bank Loans: The Fund invests in bank loans. Bank loans include fixed and floating rate loans that are privately negotiated between a corporate borrower and one or more financial institutions, including, but not limited to, term loans, revolvers, and other instruments issued in the bank loan market. The Fund may acquire interests in loans directly (by way of assignment from the selling institution) or indirectly (by way of the purchase of a participation interest from the selling institution). Under a bank loan assignment, the Fund generally will succeed to all the rights and obligations of an assigning lending institution and becomes a lender under the loan agreement with the relevant borrower in connection with that loan. Under a bank loan participation, the Fund generally will have a contractual relationship only with the lender, not with the relevant borrower. As a result, the Fund generally will have the right to receive payments of principal, interest, and any fees to which it is entitled only from the lender selling the participation and only upon receipt by the lender of the payments from the relevant borrower. The Fund may not directly benefit from the collateral supporting the debt obligation in which it has purchased the participation. As a result, the Fund will assume the credit risk of both the borrower and the institution selling the participation to the Fund.
Forward Rate Agreements: Forward rate agreements represent an agreement between counterparties to exchange cash flows based on the difference between two interest rates, applied to a notional principal amount on a fixed future date. The Fund entered into forward rate agreements to gain yield exposure based on anticipated market conditions at the specified termination date of the agreement.
Swap Agreements: The Fund may enter into credit default, interest rate and other types of swap agreements. A swap agreement is an agreement to exchange the return generated by one instrument for the return generated by another instrument. Swap agreements are negotiated in the OTC market and may be executed either directly with counterparty (“OTC-traded”) or through a central clearing facility, such as a registered exchange. Swap agreements are valued daily at current market value and any change in value is included in the net unrealized appreciation (depreciation) on swap agreements. Centrally cleared swaps
| | | | |
| PGIM Absolute Return Bond Fund | | | 125 | |
Notes to Financial Statements (continued)
pay or receive an amount known as “variation margin”, based on daily changes in the valuation of the swap contract. Any upfront premiums paid and received are shown as swap premiums paid and swap premiums received in the Statement of Assets and Liabilities. Risk of loss may exceed amounts recognized on the Statement of Assets and Liabilities. Swap agreements outstanding at period end, if any, are listed on the Schedule of Investments.
Interest Rate Swaps: Interest rate swaps represent an agreement between counterparties to exchange cash flows based on the difference between two interest rates, applied to a notional principal amount for a specified period. The Fund is subject to interest rate risk exposure in the normal course of pursuing its investment objective. The Fund used interest rate swaps to maintain its ability to generate steady cash flow by receiving a stream of fixed-rate payments and to increase exposure to prevailing market rates by receiving floating rate payments. The Fund’s maximum risk of loss from counterparty credit risk is the discounted net present value of the cash flows to be received from the counterparty over the contract’s remaining life.
Inflation Swaps: The Fund entered into inflation swap agreements to protect against fluctuations in inflation rates. Inflation swaps are characterized by one party paying a fixed rate in exchange for a floating rate that is derived from an inflation index, such as the Consumer Price Index or UK Retail Price Index. Inflation swaps subject the Fund to interest rate risk.
Credit Default Swaps (“CDS”): CDS involve one party (the protection buyer) making a stream of payments to another party (the protection seller) in exchange for the right to receive a specified payment in the event of a default or as a result of a default (collectively a “credit event”) for the referenced entity (typically corporate issues or sovereign issues of an emerging country) on its obligation; or in the event of a write-down, principal shortfall, interest shortfall or default of all or part of the referenced entities comprising a credit index.
The Fund is subject to credit risk in the normal course of pursuing its investment objectives, and as such, has entered into CDS contracts to provide a measure of protection against defaults or to take an active long or short position with respect to the likelihood of a particular issuer’s default or the reference entity’s credit soundness. CDS contracts generally trade based on a spread which represents the cost a protection buyer has to pay the protection seller. The protection buyer is said to be short the credit as the value of the contract rises the more the credit deteriorates. The value of the CDS contract increases for the protection buyer if the spread increases. The Fund’s maximum risk of loss from counterparty credit risk for purchased CDS is the inability of the counterparty to honor the contract up to the notional value due to a credit event.
As a seller of protection on credit default swap agreements, the Fund generally receives an agreed upon payment from the buyer of protection throughout the term of the swap, provided no credit event occurs. As the seller, the Fund effectively increases its investment risk because, in addition to its total net assets, the Fund may be subject to investment exposure on the notional amount of the swap.
The maximum amount of the payment that the Fund, as a seller of protection, could be required to make under a credit default swap agreement would be equal to the notional amount of the underlying security or index contract as a result of a credit event. This potential amount will be partially offset by any recovery values of the respective referenced obligations, or net amounts received from the settlement of buy protection credit default swap agreements which the Fund entered into for the same referenced entity or index. As a buyer of protection, the Fund generally receives an amount up to the notional value of the swap if a credit event occurs.
Implied credit spreads, represented in absolute terms, utilized in determining the market value of credit default swap agreements where the Fund is the seller of protection as of period end are disclosed in the footnotes to the Schedule of Investments, if applicable. These spreads serve as indicators of the current status of the payment/performance risk and represent the likelihood of default risk for the credit derivative. The implied credit spread of a particular referenced entity reflects the cost of buying/selling protection and may include upfront payments required to enter into the agreement. Wider credit spreads and increased market value in absolute terms, when compared to the notional amount of the swap, represent a deterioration of the referenced entity’s credit soundness and a greater likelihood of risk of default or other credit event occurring as defined under the terms of the agreement.
Currency Swaps: The Fund entered into currency swap agreements primarily to gain yield exposure on foreign bonds. Currency swap agreements involve two parties exchanging two different currencies with an agreement to reverse the exchange at a later date at specified exchange rates.
Total Return Swaps: In a total return swap, one party receives payments based on the market value of the security or the commodity involved, or total return of a specific referenced asset, such as an equity, index or bond, and in return pays a fixed amount. The Fund is subject to risk exposures associated with the referenced asset in the normal course of pursuing its investment objectives. The Fund entered into total return swaps to manage its exposure to a security or an index. The Fund’s maximum risk of loss from counterparty credit risk is the change in the value of the security, in the Fund’s favor, from the point of entering into the contract.
Master Netting Arrangements: The Trust, on behalf of the Fund, is subject to various Master Agreements, or netting arrangements, with select counterparties. These are agreements which a subadviser may have negotiated and entered into on behalf of the Fund. A master netting arrangement between the Fund and the counterparty permits the Fund to offset
| | | | |
| PGIM Absolute Return Bond Fund | | | 127 | |
Notes to Financial Statements (continued)
amounts payable by the Fund to the same counterparty against amounts to be received; and by the receipt of collateral from the counterparty by the Fund to cover the Fund’s exposure to the counterparty. However, there is no assurance that such mitigating factors are easily enforceable. In addition to master netting arrangements, the right to set-off exists when all the conditions are met such that each of the parties owes the other determinable amounts, the reporting party has the right to set-off the amount owed with the amount owed by the other party, the reporting party intends to set-off and the right of set-off is enforceable by law. During the reporting period, there was no intention to settle on a net basis and all amounts are presented on a gross basis on the Statement of Assets and Liabilities.
The Trust, on behalf of the Fund, is a party to International Swaps and Derivatives Association, Inc. (“ISDA”) Master Agreements with certain counterparties that govern OTC derivative and foreign exchange contracts entered into from time to time. The Master Agreements may contain provisions regarding, among other things, the parties’ general obligations, representations, agreements, collateral requirements, events of default and early termination. With respect to certain counterparties, in accordance with the terms of the Master Agreements, collateral posted to the Fund is held in a segregated account by the Fund’s custodian and with respect to those amounts which can be sold or re-pledged, is presented in the Schedule of Investments. Collateral pledged by the Fund is segregated by the Fund’s custodian and identified in the Schedule of Investments. Collateral can be in the form of cash or debt securities issued by the U.S. Government or related agencies or other securities as agreed to by the Fund and the applicable counterparty. Collateral requirements are determined based on the Fund’s net position with each counterparty. Termination events applicable to the Fund may occur upon a decline in the Fund’s net assets below a specified threshold over a certain period of time. Termination events applicable to counterparties may occur upon a decline in the counterparty’s long-term and short-term credit ratings below a specified level. In each case, upon occurrence, the other party may elect to terminate early and cause settlement of all derivative and foreign exchange contracts outstanding, including the payment of any losses and costs resulting from such early termination, as reasonably determined by the terminating party. Any decision by one or more of the Fund’s counterparties to elect early termination could impact the Fund’s future derivative activity.
In addition to each instrument’s primary underlying risk exposure (e.g. interest rate, credit, equity or foreign exchange, etc.), swap agreements involve, to varying degrees, elements of credit, market and documentation risk. Such risks involve the possibility that no liquid market for these agreements will exist, the counterparty to the agreement may default on its obligation to perform or disagree on the contractual terms of the agreement, and changes in net interest rates will be unfavorable. In connection with these agreements, securities in the portfolio may be identified or received as collateral from the counterparty in accordance with the terms of the respective swap agreements to provide or receive assets of value and to serve as recourse in the event of default or bankruptcy/insolvency of either party. Such OTC derivative agreements include conditions which, when materialized, give the counterparty
the right to cause an early termination of the transactions under those agreements. Any election by the counterparty for early termination of the contract(s) may impact the amounts reported on financial statements.
As of October 31, 2018, the Fund has not met conditions under such agreements which give the counterparty the right to call for an early termination.
Forward currency contracts, forward rate agreements, written options, short sales, swaps and financial futures contracts involve elements of both market and credit risk in excess of the amounts reflected on the Statement of Assets and Liabilities. Such risks may be mitigated by engaging in master netting arrangements.
Payment-In-Kind: The Fund invests in the open market or receive pursuant to debt restructuring, securities that pay-in-kind (PIK) the interest due on such debt instruments. The PIK interest, computed at the contractual rate specified, is added to the existing principal balance of the debt when issued bonds have same terms as the bond or recorded as a separate bond when terms are different from the existing debt, and is recorded as interest income.
Securities Lending: The Fund lends its portfolio securities to banks and broker-dealers. The loans are secured by collateral at least equal to the market value of the securities loaned. Collateral pledged by each borrower is invested in an affiliated money market fund and is marked to market daily, based on the previous day’s market value, such that the value of the collateral exceeds the value of the loaned securities. In the event of significant appreciation in value of securities on loan on the last business day of the reporting period, the financial statements may reflect a collateral value that is less than the market value of the loaned securities. Such shortfall is remedied as described above. Loans are subject to termination at the option of the borrower or the Fund. Upon termination of the loan, the borrower will return to the Fund securities identical to the loaned securities. Should the borrower of the securities fail financially, the Fund has the right to repurchase the securities in the open market using the collateral.
The Fund recognizes income, net of any rebate and securities lending agent fees, for lending its securities in the form of fees or interest on the investment of any cash received as collateral. The borrower receives all interest and dividends from the securities loaned and such payments are passed back to the lender in amounts equivalent thereto. The Fund also continues to recognize any unrealized gain (loss) in the market price of the securities loaned and on the change in the value of the collateral invested that may occur during the term of the loan. In addition, realized gain (loss) is recognized on changes in the value of the collateral invested upon liquidation of the collateral. Net earnings from securities lending are disclosed on the Statement of Operations as “Income from securities lending, net”.
Securities Transactions and Net Investment Income: Securities transactions are recorded on the trade date. Realized gains (losses) from investment and currency transactions are calculated on the specific identification method. Dividend income is recorded on the ex-date. Interest income, including amortization of premium and accretion of discount on
| | | | |
| PGIM Absolute Return Bond Fund | | | 129 | |
Notes to Financial Statements (continued)
debt securities, as required, is recorded on the accrual basis. Expenses are recorded on an accrual basis, which may require the use of certain estimates by management that may differ from actual. Net investment income or loss (other than class specific expenses and waivers, which are allocated as noted below) and unrealized and realized gains (losses) are allocated daily to each class of shares based upon the relative proportion of adjusted net assets of each class at the beginning of the day. Class specific expenses and waivers, where applicable, are charged to the respective share classes. Class specific expenses include distribution fees and distribution fee waivers, shareholder servicing fees, transfer agent’s fees and expenses, registration fees and fee waivers and/or expense reimbursements, as applicable.
Taxes: It is the Fund’s policy to continue to meet the requirements of the Internal Revenue Code applicable to regulated investment companies and to distribute all of its taxable net investment income and capital gains, if any, to its shareholders. Therefore, no federal income tax provision is required. Withholding taxes on foreign dividends, interest and capital gains, if any, are recorded, net of reclaimable amounts, at the time the related income is earned.
Dividends and Distributions: The Fund expects to declare dividends of its net investment income daily and pay such dividends monthly. Distributions of net realized capital and currency gains, if any, are declared and paid at least annually. Dividends and distributions to shareholders, which are determined in accordance with federal income tax regulations and which may differ from generally accepted accounting principles, are recorded on the ex-date. Permanent book/tax differences relating to income and gain (loss) are reclassified amongst total distributable earnings (loss) and paid-in capital in excess of par, as appropriate.
Estimates: The preparation of financial statements requires management to make estimates and assumptions that affect the reported amounts and disclosures in the financial statements. Actual results could differ from those estimates.
2. Agreements
The Trust, on behalf of the Fund, has a management agreement with PGIM Investments. Pursuant to this agreement, PGIM Investments has responsibility for all investment advisory services and supervises the subadviser’s performance of such services. In addition, under the management agreement, PGIM Investments provides all of the administrative functions necessary for the organization, operation and management of the Fund. PGIM Investments administers the corporate affairs of the Fund and, in connection therewith, furnishes the Fund with office facilities, together with those ordinary clerical and bookkeeping services which are not being furnished by the Fund’s custodian and the Fund’s transfer agent. PGIM
Investments is also responsible for the staffing and management of dedicated groups of legal, marketing, compliance and related personnel necessary for the operation of the Fund. The legal, marketing, compliance and related personnel are also responsible for the management and oversight of the various service providers to the Fund, including, but not limited to, the custodian, transfer agent, and accounting agent.
PGIM Investments has entered into a subadvisory agreement with PGIM, Inc., which provides subadvisory services to the Fund through its PGIM Fixed Income unit. The subadvisory agreement provides that PGIM, Inc. will furnish investment advisory services in connection with the management of the Fund. In connection therewith, PGIM, Inc. is obligated to keep certain books and records of the Fund. PGIM Investments pays for the services of PGIM, Inc., the cost of compensation of officers of the Fund, occupancy and certain clerical and bookkeeping costs of the Fund. The Fund bears all other costs and expenses.
Effective January 1, 2018, the management fee paid to PGIM Investments is accrued daily and payable monthly at an annual rate of 0.650% of the Fund’s average daily net assets up to and including $2.5 billion, 0.625% of the next $2.5 billion and 0.600% of the average daily net assets in excess of $5 billion. Prior to January 1, 2018, the management fee paid to PGIM Investments was accrued daily and payable monthly at an annual rate of 0.80% of the Fund’s average daily net assets up to $2.5 billion, 0.775% of the next $2.5 billion and 0.75% of such assets in excess of $5 billion. The effective management fee rate before any waivers and/or expense reimbursements was 0.670% for the year ended October 31, 2018.
Effective January 1, 2018, PGIM Investments has contractually agreed, through February 28, 2019, to limit total annual operating expenses after fee waivers and/or expense reimbursements to 0.73% of average daily net assets for Class Z shares, and 0.70% of average daily net assets for Class R6 shares. This contractual waiver excludes interest, brokerage, taxes (such as income and foreign withholding taxes, stamp duty and deferred tax expenses), acquired fund fees and expenses, extraordinary expenses, and certain other Fund expenses such as dividend and interest expense and broker charges on short sales. Expenses waived/reimbursed by the Manager in accordance with this agreement may be recouped by the Manager within the same fiscal year during which such waiver/reimbursement is made if such recoupment can be realized without exceeding the expense limit in effect at the time of the recoupment for that fiscal year. Effective November 1, 2018 this waiver agreement was extended through February 29, 2020.
Where applicable, PGIM Investments voluntarily agreed through October 31, 2018, to waive management fees or shared operating expenses on any share class to the same extent that it waives similar expenses on any other share class and, in addition, total annual operating expenses for Class R6 shares will not exceed total annual operating expenses for Class Z shares. Effective November 1, 2018 this voluntary agreement became part of the Fund’s contractual waiver agreement through February 29, 2020 and is subject to recoupment by the Manager within the same fiscal year during which such wavier/reimbursement is made if such recoupment can be realized without exceeding the expense limit in effect at the time of
| | | | |
| PGIM Absolute Return Bond Fund | | | 131 | |
Notes to Financial Statements (continued)
the recoupment for that fiscal year. Prior to January 1, 2018, PGIM Investments had contractually agreed to limit the net annual operating expenses (exclusive of distribution and service (12b-1) fees, taxes (such as income and foreign withholdings taxes, stamp duty and deferred tax expenses), interest, acquired fund fees and expenses, brokerage, extraordinary and certain other expenses such as dividend, broker charges and interest expense on short sales) of each class of shares of the Fund to 0.90% of the Fund’s average daily net assets.
The Trust, on behalf of the Fund, has a distribution agreement with Prudential Investment Management Services LLC (“PIMS”), which acts as the distributor of the Class A, Class C, Class Z and Class R6 shares of the Fund. The Fund compensates PIMS for distributing and servicing the Fund’s Class A and Class C shares, pursuant to the plans of distribution (the “Distribution Plans”), regardless of expenses actually incurred by PIMS. The distribution fees are accrued daily and payable monthly. No distribution or service fees are paid to PIMS as distributor of the Class Z or Class R6 shares of the Fund.
Pursuant to the Distribution Plans, the Fund compensates PIMS for distribution related activities at an annual rate of up to 0.25% and 1% of the average daily net assets of the Class A and Class C shares, respectively.
PIMS has advised the Fund that it received $317,625 in front-end sales charges resulting from sales of Class A shares during the year ended October 31, 2018. From these fees, PIMS paid such sales charges to broker-dealers, who in turn paid commissions to salespersons and incurred other distribution costs.
PIMS has advised the Fund that for the year ended October 31, 2018, it received $2,700 and $9,632 in contingent deferred sales charges imposed upon redemptions by certain Class A and Class C shareholders, respectively.
PGIM Investments, PGIM, Inc. and PIMS are indirect, wholly-owned subsidiaries of Prudential Financial, Inc. (“Prudential”).
3. Other Transactions with Affiliates
Prudential Mutual Fund Services LLC (“PMFS”), an affiliate of PGIM Investments and an indirect, wholly-owned subsidiary of Prudential, serves as the Fund’s transfer agent. Transfer agent’s fees and expenses in the Statement of Operations include certain out-of-pocket expenses paid to non-affiliates, where applicable.
The Fund may enter into certain securities purchase or sale transactions under Board approved Rule 17a-7 procedures. Rule 17a-7 is an exemptive rule under the 1940 Act, that, subject to certain conditions, permits purchase and sale transactions among affiliated
investment companies, or between an investment company and a person that is affiliated solely by reason of having a common (or affiliated) investment adviser, common directors, and/or common officers. Such transactions are subject to ratification by the Board. For the reporting period ended October 31, 2018, no such transactions were entered into by the Fund.
The Fund may invest its overnight sweep cash in the PGIM Core Ultra Short Bond Fund (the “Core Fund”), and its securities lending cash collateral in the PGIM Institutional Money Market Fund (the “Money Market Fund”), each a series of Prudential Investment Portfolios 2, registered under the 1940 Act and managed by PGIM Investments. For the reporting period ended October 31, 2018, PGIM, Inc. was compensated $49,748 by PGIM Investments for managing the Fund’s securities lending cash collateral as subadviser to the Money Market Fund. Earnings from the Core Fund and Money Market Fund are disclosed on the Statement of Operations as “Affiliated dividend income” and “Income from securities lending, net”, respectively.
4. Portfolio Securities
The aggregate cost of purchases and proceeds from sales of portfolio securities (excluding short-term investments and U.S. Government securities) for the year ended October 31, 2018, were $1,446,532,772 and $703,096,068, respectively.
A summary of the cost of purchases and proceeds from sales of shares of affiliated mutual funds for the year ended October 31, 2018, is presented as follows:
| | | | | | | | | | | | | | | | | | | | | | | | | | | | | | |
Value,
Beginning
of Year | | | Cost of
Purchases | | | Proceeds
from Sales | | | Change in
Unrealized
Gain
(Loss) | | | Realized
Gain
(Loss) | | | Value,
End of
Year | | | Shares,
End of
Year | | | Income | |
| | PGIM Core Ultra Short Bond Fund* | | | | | | | | | | | | | | | | | |
| $ | 143,027,511 | | | $ | 1,151,247,608 | | | $ | 1,100,488,431 | | | $ | — | | | $ | — | | | $ | 193,786,688 | | | | 193,786,688 | | | $ | 3,704,433 | |
| | PGIM Institutional Money Market Fund* | |
| | 68,469,036 | | | | 274,478,785 | | | | 262,705,669 | | | | (2,919 | ) | | | (3,291 | ) | | | 80,235,942 | | | | 80,235,942 | | | | 110,038 | ** |
| | | | | | | | | | | | | | | | | | | | | | | | | | | | | | |
| $ | 211,496,547 | | | $ | 1,425,726,393 | | | $ | 1,363,194,100 | | | $ | (2,919 | ) | | $ | (3,291 | ) | | $ | 274,022,630 | | | | | | | $ | 3,814,471 | |
| | | | | | | | | | | | | | | | | | | | | | | | | | | | | | |
| * | The Fund did not have any capital gain distributions during the reporting period. |
| ** | This amount is included in “Income from securities lending, net” on the Statement of Operations. |
5. Distributions and Tax Information
Distributions to shareholders, which are determined in accordance with federal income tax regulations and which may differ from generally accepted accounting principles, are recorded on the ex-date.
| | | | |
| PGIM Absolute Return Bond Fund | | | 133 | |
Notes to Financial Statements (continued)
For the year ended October 31, 2018, the tax character of dividends paid by the Fund was $79,658,360 of ordinary income. For the year ended October 31, 2017, the tax character of dividends paid by the Fund was $40,791,803 of ordinary income.
As of October 31, 2018, the accumulated undistributed earnings on a tax basis was $33,488,313 of ordinary income.
The United States federal income tax basis of the Fund’s investments and the net unrealized appreciation as of October 31, 2018 were as follows:
| | | | | | |
Tax Basis | | Gross
Unrealized
Appreciation | | Gross
Unrealized
Depreciation | | Net
Unrealized
Appreciation |
| $2,644,939,632 | | $80,872,185 | | $(64,064,749) | | $16,807,436 |
The differences between book basis and tax basis were primarily attributable to deferred losses on wash sales, straddle loss deferral, future and forward contracts, difference in the treatment of premium amortization and other cost basis differences between financial and tax accounting.
For federal income tax purposes, the Fund had a capital loss carryforward as of October 31, 2018 of approximately $100,645,000 which can be carried forward for an unlimited period. No capital gains distributions are expected to be paid to shareholders until net gains have been realized in excess of such losses.
Management has analyzed the Fund’s tax positions taken on federal, state and local income tax returns for all open tax years and has concluded that no provision for income tax is required in the Fund’s financial statements for the current reporting period. The Fund’s federal, state and local income and federal excise tax returns for tax years for which the applicable statutes of limitations have not expired are subject to examination by the Internal Revenue Service and state departments of revenue.
6. Capital and Ownership
The Fund offers Class A, Class C, Class Z and Class R6 shares. Class A shares are sold with a maximum front-end sales charge of 4.50%. Investors who purchase $1 million or more of Class A shares and sell these shares within 12 months of purchase are subject to a contingent deferred sales charge (“CDSC”) of 1%, although they are not subject to an initial sales charge. The Class A CDSC is waived for certain retirement and/or benefit plans. A special exchange privilege is also available for shareholders who qualified to purchase Class A shares at net asset value. Class C shares are sold with a CDSC of 1% on sales made
within 12 months of purchase. Class Z and Class R6 shares are not subject to any sales or redemption charge and are available exclusively for sale to a limited group of investors.
Under certain circumstances, an exchange may be made from specified share classes of the Fund to one or more other share classes of the Fund as presented in the table of transactions in shares of beneficial interest.
The Trust has authorized an unlimited number of shares of beneficial interest at $0.001 par value per share, divided into four classes, designated Class A, Class C, Class Z and Class R6.
As of October 31, 2018, Prudential, through its affiliated entities, including affiliated funds (if applicable), owned and 794,458 Class R6 shares of the Fund. At reporting period end, nine shareholders of record held 85% of the Fund’s outstanding shares on behalf of multiple beneficial owners.
Transactions in shares of beneficial interest were as follows:
| | | | | | | | |
Class A | | Shares | | | Amount | |
Year ended October 31, 2018: | | | | | | | | |
Shares sold | | | 7,737,083 | | | $ | 76,766,423 | |
Shares issued in reinvestment of dividends and distributions | | | 363,796 | | | | 3,599,637 | |
Shares reacquired | | | (3,470,620 | ) | | | (34,386,767 | ) |
| | | | | | | | |
Net increase (decrease) in shares outstanding before conversion | | | 4,630,259 | | | | 45,979,293 | |
Shares issued upon conversion from other share class(es) | | | 542,478 | | | | 5,369,357 | |
Shares reacquired upon conversion into other share class(es) | | | (2,125,033 | ) | | | (20,970,487 | ) |
| | | | | | | | |
Net increase (decrease) in shares outstanding | | | 3,047,704 | | | $ | 30,378,163 | |
| | | | | | | | |
Year ended October 31, 2017: | | | | | | | | |
Shares sold | | | 5,287,444 | | | $ | 51,389,408 | |
Shares issued in reinvestment of dividends and distributions | | | 263,023 | | | | 2,563,014 | |
Shares reacquired | | | (6,475,151 | ) | | | (62,665,690 | ) |
| | | | | | | | |
Net increase (decrease) in shares outstanding before conversion | | | (924,684 | ) | | | (8,713,268 | ) |
Shares issued upon conversion from other share class(es) | | | 260,628 | | | | 2,533,357 | |
Shares reacquired upon conversion into other share class(es) | | | (7,865,438 | ) | | | (76,474,888 | ) |
| | | | | | | | |
Net increase (decrease) in shares outstanding | | | (8,529,494 | ) | | $ | (82,654,799 | ) |
| | | | | | | | |
Class C | | | | | | |
Year ended October 31, 2018: | | | | | | | | |
Shares sold | | | 3,141,833 | | | $ | 31,222,637 | |
Shares issued in reinvestment of dividends and distributions | | | 219,367 | | | | 2,176,489 | |
Shares reacquired | | | (1,939,289 | ) | | | (19,269,209 | ) |
| | | | | | | | |
Net increase (decrease) in shares outstanding before conversion | | | 1,421,911 | | | | 14,129,917 | |
Shares reacquired upon conversion into other share class(es) | | | (506,587 | ) | | | (5,024,802 | ) |
| | | | | | | | |
Net increase (decrease) in shares outstanding | | | 915,324 | | | $ | 9,105,115 | |
| | | | | | | | |
Year ended October 31, 2017: | | | | | | | | |
Shares sold | | | 1,372,212 | | | $ | 13,418,733 | |
Shares issued in reinvestment of dividends and distributions | | | 136,492 | | | | 1,336,820 | |
Shares reacquired | | | (2,985,937 | ) | | | (29,077,382 | ) |
| | | | | | | | |
Net increase (decrease) in shares outstanding before conversion | | | (1,477,233 | ) | | | (14,321,829 | ) |
Shares reacquired upon conversion into other share class(es) | | | (875,243 | ) | | | (8,568,509 | ) |
| | | | | | | | |
Net increase (decrease) in shares outstanding | | | (2,352,476 | ) | | $ | (22,890,338 | ) |
| | | | | | | | |
| | | | |
| PGIM Absolute Return Bond Fund | | | 135 | |
Notes to Financial Statements (continued)
| | | | | | | | |
Class Z | | Shares | | | Amount | |
Year ended October 31, 2018: | | | | | | | | |
Shares sold | | | 137,049,289 | | | $ | 1,363,011,556 | |
Shares issued in reinvestment of dividends and distributions | | | 4,728,423 | | | | 46,966,093 | |
Shares reacquired | | | (50,759,062 | ) | | | (504,637,628 | ) |
| | | | | | | | |
Net increase (decrease) in shares outstanding before conversion | | | 91,018,650 | | | | 905,340,021 | |
Shares issued upon conversion from other share class(es) | | | 2,629,628 | | | | 26,073,554 | |
Shares reacquired upon conversion into other share class(es) | | | (2,814,518 | ) | | | (27,907,422 | ) |
| | | | | | | | |
Net increase (decrease) in shares outstanding | | | 90,833,760 | | | $ | 903,506,153 | |
| | | | | | | | |
Year ended October 31, 2017: | | | | | | | | |
Shares sold | | | 58,776,093 | | | $ | 574,643,248 | |
Shares issued in reinvestment of dividends and distributions | | | 2,154,719 | | | | 21,153,567 | |
Shares reacquired | | | (30,565,874 | ) | | | (297,888,862 | ) |
| | | | | | | | |
Net increase (decrease) in shares outstanding before conversion | | | 30,364,938 | | | | 297,907,953 | |
Shares issued upon conversion from other share class(es) | | | 9,644,649 | | | | 94,171,386 | |
Shares reacquired upon conversion into other share class(es) | | | (17,693,832 | ) | | | (172,517,504 | ) |
| | | | | | | | |
Net increase (decrease) in shares outstanding | | | 22,315,755 | | | $ | 219,561,835 | |
| | | | | | | | |
Class R6 | | | | | | |
Year ended October 31, 2018: | | | | | | | | |
Shares sold | | | 10,649,660 | | | $ | 105,859,341 | |
Shares issued in reinvestment of dividends and distributions | | | 971,802 | | | | 9,616,572 | |
Shares reacquired | | | (28,032,106 | ) | | | (277,317,405 | ) |
| | | | | | | | |
Net increase (decrease) in shares outstanding before conversion | | | (16,410,644 | ) | | | (161,841,492 | ) |
Shares issued upon conversion from other share class(es) | | | 2,284,964 | | | | 22,552,844 | |
Shares reacquired upon conversion into other share class(es) | | | (9,358 | ) | | | (93,044 | ) |
| | | | | | | | |
Net increase (decrease) in shares outstanding | | | (14,135,038 | ) | | $ | (139,381,692 | ) |
| | | | | | | | |
Year ended October 31, 2017: | | | | | | | | |
Shares sold | | | 13,571,706 | | | $ | 133,355,079 | |
Shares issued in reinvestment of dividends and distributions | | | 422,868 | | | | 4,125,496 | |
Shares reacquired | | | (14,035,658 | ) | | | (137,572,290 | ) |
| | | | | | | | |
Net increase (decrease) in shares outstanding before conversion | | | (41,084 | ) | | | (91,715 | ) |
Shares issued upon conversion from other share class(es) | | | 17,546,616 | | | | 170,377,523 | |
Shares reacquired upon conversion into other share class(es) | | | (978,301 | ) | | | (9,521,365 | ) |
| | | | | | | | |
Net increase (decrease) in shares outstanding | | | 16,527,231 | | | $ | 160,764,443 | |
| | | | | | | | |
7. Borrowings
The Trust, on behalf of the Fund, along with other affiliated registered investment companies (the “Funds”), is a party to a Syndicated Credit Agreement (“SCA”) with a group of banks. The purpose of the SCA is to provide an alternative source of temporary funding for capital share redemptions. The SCA provides for a commitment of $900 million for the period October 4, 2018 through October 3, 2019. The Funds pay an annualized commitment fee of 0.15% of the unused portion of the SCA. The Fund’s portion of the commitment fee for the unused amount, allocated based upon a method approved by the Board, is accrued daily and paid quarterly. Prior to October 4, 2018, the Funds had another SCA that provided a commitment of $900 million and the Funds paid an annualized commitment fee of 0.15%
of the unused portion of the SCA. The interest on borrowings under both SCAs is paid monthly and at a per annum interest rate based upon a contractual spread plus the higher of (1) the effective federal funds rate, (2) the 1-month LIBOR rate or (3) zero percent.
Other affiliated registered investment companies that are parties to the SCA include portfolios that are subject to a predetermined mathematical formula used to manage certain benefit guarantees offered under variable annuity contracts. The formula may result in large scale asset flows into and out of these portfolios. Consequently, these portfolios may be more likely to utilize the SCA for purposes of funding redemptions. It may be possible for those portfolios to fully exhaust the committed amount of the SCA, thereby requiring the Manager to allocate available funding per a Board-approved methodology designed to treat the Funds in the SCA equitably.
The Fund did not utilize the SCA during the reporting period ended October 31, 2018.
8. Risks of Investing in the Fund
The Fund’s risks include, but are not limited to, some or all of the risks discussed below:
Bond Obligations Risk: The Fund’s holdings, share price, yield and total return may fluctuate in response to bond market movements. The value of bonds may decline for issuer-related reasons, including management performance, financial leverage and reduced demand for the issuer’s goods and services. Certain types of fixed-income obligations also may be subject to “call and redemption risk,” which is the risk that the issuer may call a bond held by the Fund for redemption before it matures and the Fund may not be able to reinvest at the same level and therefore would earn less income.
Derivatives Risk: Derivatives involve special risks and costs and may result in losses to the Fund. The successful use of derivatives requires sophisticated management, and, to the extent that derivatives are used, the Fund will depend on the subadviser’s ability to analyze and manage derivative transactions. The prices of derivatives may move in unexpected ways, especially in abnormal market conditions. Some derivatives are “leveraged” and therefore may magnify or otherwise increase investment losses to the Fund. The Fund’s use of derivatives may also increase the amount of taxes payable by shareholders. Other risks arise from the potential inability to terminate or sell derivatives positions. A liquid secondary market may not always exist for the Fund’s derivatives positions. In fact, many OTC derivative instruments will not have liquidity beyond the counterparty to the instrument. OTC derivative instruments also involve the risk that the other party will not meet its obligations to the Fund.
Foreign Securities Risk: The Fund’s investments in securities of foreign issuers or issuers with significant exposure to foreign markets involve additional risk. Foreign countries in which the Fund may invest may have markets that are less liquid, less regulated and more volatile than US markets. The value of the Fund’s investments may decline because of
| | | | |
| PGIM Absolute Return Bond Fund | | | 137 | |
Notes to Financial Statements (continued)
factors affecting the particular issuer as well as foreign markets and issuers generally, such as unfavorable government actions, and political or financial instability.
Interest Rate Risk: The value of an investment may go down when interest rates rise. A rise in rates tends to have a greater impact on the prices of longer term or duration securities. When interest rates fall, the issuers of debt obligations may prepay principal more quickly than expected, and the Fund may be required to reinvest the proceeds at a lower interest rate. This is referred to as “prepayment risk.” When interest rates rise, debt obligations may be repaid more slowly than expected, and the value of the Fund’s holdings may fall sharply. This is referred to as “extension risk. The Fund may face a heightened level of interest rate risk as a result of the US Federal Reserve Board’s policies. The Fund’s investments may lose value if short-term or long-term interest rates rise sharply or in a manner not anticipated by the subadviser.
Liquidity Risk: The Fund may invest in instruments that trade in lower volumes and are less liquid than other investments. Liquidity risk exists when particular investments made by the Fund are difficult to purchase or sell. Liquidity risk includes the risk that the Fund may make investments that may become less liquid in response to market developments or adverse investor perceptions. Investments that are illiquid or that trade in lower volumes may be more difficult to value. If the Fund is forced to sell these investments to pay redemption proceeds or for other reasons, the Fund may lose money. In addition, when there is no willing buyer and investments cannot be readily sold at the desired time or price, the Fund may have to accept a lower price or may not be able to sell the instrument at all. The reduction in dealer market-making capacity in the fixed-income markets that has occurred in recent years also has the potential to reduce liquidity. An inability to sell a portfolio position can adversely affect the Fund’s value or prevent the Fund from being able to take advantage of other investment opportunities.
Mortgage-Backed and Other Asset-Backed Securities Risk: Mortgage-related securities are usually pass-through instruments that pay investors a share of all interest and principal payments from an underlying pool of fixed or adjustable rate mortgages. Asset-backed securities are another type of pass-through instruments that pays interest based upon the cash flow of an underlying pool of assets, such as automobile loans or credit card receivables. Asset-backed securities can also be collateralized by a portfolio of corporate bonds including junk bonds or other securities. The values of mortgage-backed and asset-backed securities vary with changes in interest rates and are particularly sensitive to prepayments (the risk is that the underlying debt instruments may be partially or wholly prepaid during periods of falling interest rates, which could require the Fund to reinvest in lower yielding debt instruments) or extensions (the risk is that rising interest rates may cause the underlying debt instruments to be repaid more slowly by the debtor, causing the value of the securities to fall). Asset-backed securities are also subject to liquidity risk.
9. Recent Accounting Pronouncements and Reporting Updates
In August 2018, the Securities and Exchange Commission (the “SEC”) adopted amendments to Regulation S-X to update and simplify the disclosure requirements for registered investment companies by eliminating requirements that are redundant or duplicative of US GAAP requirements or other SEC disclosure requirements. The new amendments require the presentation of the total, rather than the components, of distributable earnings on the Statement of Assets and Liabilities and the total, rather than the components, of dividends from net investment income and distributions from net realized gains on the Statements of Changes in Net Assets. The amendments also removed the requirement for the parenthetical disclosure of undistributed net investment income on the Statements of Changes in Net Assets and certain tax adjustments that were reflected in the Notes to Financial Statements. All of these have been reflected in the Fund’s financial statements.
In August 2018, the FASB issued Accounting Standards Update (“ASU”) No. 2018-13, which changes certain fair value measurement disclosure requirements. The new ASU, in addition to other modifications and additions, removes the requirement to disclose the amount and reasons for transfers between Level 1 and Level 2 of the fair value hierarchy, and the Fund’s policy for the timing of transfers between levels. The amendments are effective for financial statements issued for fiscal years beginning after December 15, 2019, and interim periods within those fiscal years. Management has evaluated the implications of certain provisions of the ASU and has determined to early adopt aspects related to the removal and modification of certain fair value measurement disclosures under the ASU effective immediately. At this time, management is evaluating the implications of certain other provisions of the ASU related to new disclosure requirements and any impact on the financial statement disclosures has not yet been determined.
| | | | |
| PGIM Absolute Return Bond Fund | | | 139 | |
Financial Highlights
| | | | | | | | | | | | | | | | | | | | |
| Class A Shares | |
| | | Year Ended October 31, | |
| | | 2018 | | | 2017 | | | 2016 | | | 2015 | | | 2014 | |
| Per Share Operating Performance(a): | | | | | | | | | | | | | | | | | | | | |
| Net Asset Value, Beginning of Year | | | $9.93 | | | | $9.59 | | | | $9.48 | | | | $9.79 | | | | $9.82 | |
| Income (loss) from investment operations: | | | | | | | | | | | | | | | | | | | | |
| Net investment income (loss) | | | 0.27 | | | | 0.23 | | | | 0.25 | | | | 0.23 | | | | 0.25 | |
| Net realized and unrealized gain (loss) on investment and foreign currency transactions | | | (0.05 | ) | | | 0.33 | | | | 0.06 | | | | (0.30 | ) | | | 0.02 | |
| Total from investment operations | | | 0.22 | | | | 0.56 | | | | 0.31 | | | | (0.07 | ) | | | 0.27 | |
| Less Dividends and Distributions: | | | | | | | | | | | | | | | | | | | | |
| Dividends from net investment income | | | (0.33 | ) | | | (0.22 | ) | | | (0.15 | ) | | | (0.21 | ) | | | (0.30 | ) |
| Tax return of capital distributions | | | - | | | | - | | | | (0.05 | ) | | | (0.03 | ) | | | - | |
| Total dividends and distributions | | | (0.33 | ) | | | (0.22 | ) | | | (0.20 | ) | | | (0.24 | ) | | | (0.30 | ) |
| Net asset value, end of year | | | $9.82 | | | | $9.93 | | | | $9.59 | | | | $9.48 | | | | $9.79 | |
| Total Return(b): | | | 2.21% | | | | 5.95% | | | | 3.36% | | | | (0.78)% | | | | 2.76% | |
| | | | | | | | | | | | | | | | | | | | |
| Ratios/Supplemental Data: | |
| Net assets, end of year (000) | | | $148,609 | | | | $119,969 | | | | $197,713 | | | | $315,214 | | | | $452,955 | |
| Average net assets (000) | | | $142,613 | | | | $145,290 | | | | $246,082 | | | | $383,950 | | | | $483,199 | |
| Ratios to average net assets(c)(d): | | | | | | | | | | | | | | | | | | | | |
| Expenses after waivers and/or expense reimbursement | | | 1.03% | | | | 1.15% | | | | 1.15% | | | | 1.15% | | | | 1.15% | |
| Expenses before waivers and/or expense reimbursement | | | 1.04% | | | | 1.22% | (e) | | | 1.24% | | | | 1.24% | | | | 1.27% | |
| Net investment income (loss) | | | 2.72% | | | | 2.31% | | | | 2.67% | | | | 2.39% | | | | 2.58% | |
| Portfolio turnover rate(f) | | | 52% | | | | 72% | | | | 38% | | | | 64% | | | | 64% | |
| (a) | Calculated based on average shares outstanding during the year. |
| (b) | Total return does not consider the effects of sales loads. Total return is calculated assuming a purchase of a share on the first day and a sale on the last day of each year reported and includes reinvestment of dividends and distributions, if any. Total returns may reflect adjustments to conform to generally accepted accounting principles. |
| (c) | Does not include expenses of the underlying funds in which the Fund invests. |
| (d) | Effective March 9, 2015, the contractual distribution and service (12b-1) fees were reduced from 0.30% to 0.25% of the average daily net assets and the 0.05% contractual 12b-1 fee waiver was terminated. |
| (e) | Effective August 1, 2017, class specific expenses include transfer agent fees and expenses and registration fees, which are charged to their respective share class. |
| (f) | The Fund’s portfolio turnover rate is calculated in accordance with regulatory requirements, without regard to transactions involving short term investments and certain derivatives. If such transactions were included, the Fund’s portfolio turnover rate may be higher. |
See Notes to Financial Statements.
| | | | | | | | | | | | | | | | | | | | |
| Class C Shares | |
| | | Year Ended October 31, | |
| | | 2018 | | | 2017 | | | 2016 | | | 2015 | | | 2014 | |
| Per Share Operating Performance(a): | | | | | | | | | | | | | | | | | | | | |
| Net Asset Value, Beginning of Year | | | $9.96 | | | | $9.62 | | | | $9.51 | | | | $9.82 | | | | $9.85 | |
| Income (loss) from investment operations: | | | | | | | | | | | | | | | | | | | | |
| Net investment income (loss) | | | 0.19 | | | | 0.15 | | | | 0.18 | | | | 0.16 | | | | 0.18 | |
| Net realized and unrealized gain (loss) on investment and foreign currency transactions | | | (0.05 | ) | | | 0.34 | | | | 0.06 | | | | (0.31 | ) | | | 0.01 | |
| Total from investment operations | | | 0.14 | | | | 0.49 | | | | 0.24 | | | | (0.15 | ) | | | 0.19 | |
| Less Dividends and Distributions: | | | | | | | | | | | | | | | | | | | | |
| Dividends from net investment income | | | (0.25 | ) | | | (0.15 | ) | | | (0.10 | ) | | | (0.13 | ) | | | (0.22 | ) |
| Tax return of capital distributions | | | - | | | | - | | | | (0.03 | ) | | | (0.03 | ) | | | - | |
| Total dividends and distributions | | | (0.25 | ) | | | (0.15 | ) | | | (0.13 | ) | | | (0.16 | ) | | | (0.22 | ) |
| Net asset value, end of year | | | $9.85 | | | | $9.96 | | | | $9.62 | | | | $9.51 | | | | $9.82 | |
| Total Return(b): | | | 1.43% | | | | 5.16% | | | | 2.59% | | | | (1.51)% | | | | 1.97% | |
| | | | | | | | | | | | | | | | | | | | |
| Ratios/Supplemental Data: | |
| Net assets, end of year (000) | | | $106,734 | | | | $98,789 | | | | $118,092 | | | | $161,679 | | | | $195,312 | |
| Average net assets (000) | | | $102,866 | | | | $106,174 | | | | $135,510 | | | | $183,419 | | | | $183,745 | |
| Ratios to average net assets(c): | | | | | | | | | | | | | | | | | | | | |
| Expenses after waivers and/or expense reimbursement | | | 1.79% | | | | 1.90% | | | | 1.90% | | | | 1.90% | | | | 1.90% | |
| Expenses before waivers and/or expense reimbursement | | | 1.80% | | | | 1.97% | (d) | | | 1.99% | | | | 1.97% | | | | 1.97% | |
| Net investment income (loss) | | | 1.93% | | | | 1.58% | | | | 1.91% | | | | 1.62% | | | | 1.81% | |
| Portfolio turnover rate(e) | | | 52% | | | | 72% | | | | 38% | | | | 64% | | | | 64% | |
| (a) | Calculated based on average shares outstanding during the year. |
| (b) | Total return does not consider the effects of sales loads. Total return is calculated assuming a purchase of a share on the first day and a sale on the last day of each year reported and includes reinvestment of dividends and distributions, if any. Total returns may reflect adjustments to conform to generally accepted accounting principles. |
| (c) | Does not include expenses of the underlying funds in which the Fund invests. |
| (d) | Effective August 1, 2017, class specific expenses include transfer agent fees and expenses and registration fees, which are charged to their respective share class. |
| (e) | The Fund’s portfolio turnover rate is calculated in accordance with regulatory requirements, without regard to transactions involving short term investments and certain derivatives. If such transactions were included, the Fund’s portfolio turnover rate may be higher. |
See Notes to Financial Statements.
| | | | |
| PGIM Absolute Return Bond Fund | | | 141 | |
Financial Highlights (continued)
| | | | | | | | | | | | | | | | | | | | |
| Class Z Shares | |
| | | Year Ended October 31, | |
| | | 2018 | | | 2017 | | | 2016 | | | 2015 | | | 2014 | |
| Per Share Operating Performance(a): | | | | | | | | | | | | | | | | | | | | |
| Net Asset Value, Beginning of Year | | | $9.97 | | | | $9.64 | | | | $9.52 | | | | $9.83 | | | | $9.86 | |
| Income (loss) from investment operations: | | | | | | | | | | | | | | | | | | | | |
| Net investment income (loss) | | | 0.30 | | | | 0.25 | | | | 0.27 | | | | 0.25 | | | | 0.27 | |
| Net realized and unrealized gain (loss) on investment and foreign currency transactions | | | (0.06 | ) | | | 0.33 | | | | 0.08 | | | | (0.30 | ) | | | 0.02 | |
| Total from investment operations | | | 0.24 | | | | 0.58 | | | | 0.35 | | | | (0.05 | ) | | | 0.29 | |
| Less Dividends and Distributions: | | | | | | | | | | | | | | | | | | | | |
| Dividends from net investment income | | | (0.35 | ) | | | (0.25 | ) | | | (0.17 | ) | | | (0.23 | ) | | | (0.32 | ) |
| Tax return of capital distributions | | | - | | | | - | | | | (0.06 | ) | | | (0.03 | ) | | | - | |
| Total dividends and distributions | | | (0.35 | ) | | | (0.25 | ) | | | (0.23 | ) | | | (0.26 | ) | | | (0.32 | ) |
| Net asset value, end of year | | | $9.86 | | | | $9.97 | | | | $9.64 | | | | $9.52 | | | | $9.83 | |
| Total Return(b): | | | 2.48% | | | | 6.08% | | | | 3.71% | | | | (0.53)% | | | | 3.00% | |
| | | | | | | | | | | | | | | | | | | | |
| Ratios/Supplemental Data: | |
| Net assets, end of year (000) | | | $2,159,518 | | | | $1,277,401 | | | | $1,019,254 | | | | $1,755,667 | | | | $2,070,862 | |
| Average net assets (000) | | | $1,679,461 | | | | $1,121,943 | | | | $1,396,060 | | | | $2,029,397 | | | | $1,484,697 | |
| Ratios to average net assets(c): | | | | | | | | | | | | | | | | | | | | |
| Expenses after waivers and/or expense reimbursement | | | 0.75% | | | | 0.90% | | | | 0.90% | | | | 0.90% | | | | 0.90% | |
| Expenses before waivers and/or expense reimbursement | | | 0.81% | | | | 0.96% | (d) | | | 0.99% | | | | 0.97% | | | | 0.97% | |
| Net investment income (loss) | | | 3.01% | | | | 2.59% | | | | 2.91% | | | | 2.61% | | | | 2.79% | |
| Portfolio turnover rate(e) | | | 52% | | | | 72% | | | | 38% | | | | 64% | | | | 64% | |
| (a) | Calculated based on average shares outstanding during the year. |
| (b) | Total return is calculated assuming a purchase of a share on the first day and a sale on the last day of each year reported and includes reinvestment of dividends and distributions, if any. Total returns may reflect adjustments to conform to generally accepted accounting principles. |
| (c) | Does not include expenses of the underlying funds in which the Fund invests. |
| (d) | Effective August 1, 2017, class specific expenses include transfer agent fees and expenses and registration fees, which are charged to their respective share class. |
| (e) | The Fund’s portfolio turnover rate is calculated in accordance with regulatory requirements, without regard to transactions involving short term investments and certain derivatives. If such transactions were included, the Fund’s portfolio turnover rate may be higher. |
See Notes to Financial Statements.
| | | | | | | | | | | | | | | | | | | | |
| Class R6 Shares | |
| | | Year Ended October 31, | |
| | | 2018 | | | 2017 | | | 2016 | | | 2015 | | | 2014 | |
| Per Share Operating Performance(a): | | | | | | | | | | | | | | | | | | | | |
| Net Asset Value, Beginning of Year | | | $9.94 | | | | $9.61 | | | | $9.49 | | | | $9.81 | | | | $9.83 | |
| Income (loss) from investment operations: | | | | | | | | | | | | | | | | | | | | |
| Net investment income (loss) | | | 0.29 | | | | 0.26 | | | | 0.28 | | | | 0.25 | | | | 0.28 | |
| Net realized and unrealized gain (loss) on investment and foreign currency transactions | | | (0.05 | ) | | | 0.32 | | | | 0.07 | | | | (0.30 | ) | | | 0.03 | |
| Total from investment operations | | | 0.24 | | | | 0.58 | | | | 0.35 | | | | (0.05 | ) | | | 0.31 | |
| Less Dividends and Distributions: | | | | | | | | | | | | | | | | | | | | |
| Dividends from net investment income | | | (0.36 | ) | | | (0.25 | ) | | | (0.17 | ) | | | (0.24 | ) | | | (0.33 | ) |
| Tax return of capital distributions | | | - | | | | - | | | | (0.06 | ) | | | (0.03 | ) | | | - | |
| Total dividends and distributions | | | (0.36 | ) | | | (0.25 | ) | | | (0.23 | ) | | | (0.27 | ) | | | (0.33 | ) |
| Net asset value, end of year | | | $9.82 | | | | $9.94 | | | | $9.61 | | | | $9.49 | | | | $9.81 | |
| Total Return(b): | | | 2.42% | | | | 6.15% | | | | 3.81% | | | | (0.57)% | | | | 3.16% | |
| | | | | | | | | | | | | | | | | | | | |
| Ratios/Supplemental Data: | |
| Net assets, end of year (000) | | | $203,372 | | | | $346,253 | | | | $175,887 | | | | $151,294 | | | | $19,025 | |
| Average net assets (000) | | | $329,668 | | | | $270,229 | | | | $158,967 | | | | $125,910 | | | | $18,604 | |
| Ratios to average net assets(c): | | | | | | | | | | | | | | | | | | | | |
| Expenses after waivers and/or expense reimbursement | | | 0.74% | | | | 0.90% | | | | 0.84% | | | | 0.85% | | | | 0.85% | |
| Expenses before waivers and/or expense reimbursement | | | 0.75% | | | | 0.90% | (d) | | | 0.84% | | | | 0.85% | | | | 0.85% | |
| Net investment income (loss) | | | 2.95% | | | | 2.64% | | | | 2.97% | | | | 2.61% | | | | 2.87% | |
| Portfolio turnover rate(e) | | | 52% | | | | 72% | | | | 38% | | | | 64% | | | | 64% | |
| (a) | Calculated based on average shares outstanding during the year. |
| (b) | Total return is calculated assuming a purchase of a share on the first day and a sale on the last day of each year reported and includes reinvestment of dividends and distributions, if any. Total returns may reflect adjustments to conform to generally accepted accounting principles. |
| (c) | Does not include expenses of the underlying funds in which the Fund invests. |
| (d) | Effective August 1, 2017, class specific expenses include transfer agent fees and expenses and registration fees, which are charged to their respective share class. |
| (e) | The Fund’s portfolio turnover rate is calculated in accordance with regulatory requirements, without regard to transactions involving short term investments and certain derivatives. If such transactions were included, the Fund’s portfolio turnover rate may be higher. |
See Notes to Financial Statements.
| | | | |
| PGIM Absolute Return Bond Fund | | | 143 | |
Report of Independent Registered Public Accounting Firm
The Board of Trustees and Shareholders
Prudential Investment Portfolios 9:
Opinion on the Financial Statements
We have audited the accompanying statement of assets and liabilities of PGIM Absolute Return Bond Fund (formerly Prudential Absolute Return Bond Fund) (the “Fund”), a series of Prudential Investment Portfolios 9, including the schedule of investments, as of October 31, 2018, the related statement of operations for the year then ended, the statements of changes in net assets for each of the years in the two-year period then ended, and the related notes (collectively, the financial statements) and the financial highlights for the years indicated therein. In our opinion, the financial statements and financial highlights present fairly, in all material respects, the financial position of the Fund as of October 31, 2018, the results of its operations for the year then ended, the changes in its net assets for each of the years in the two-year period then ended, and the financial highlights for the years indicated therein, in conformity with U.S. generally accepted accounting principles.
Basis for Opinion
These financial statements and financial highlights are the responsibility of the Fund’s management. Our responsibility is to express an opinion on these financial statements and financial highlights based on our audits. We are a public accounting firm registered with the Public Company Accounting Oversight Board (United States) (“PCAOB”) and are required to be independent with respect to the Fund in accordance with the U.S. federal securities laws and the applicable rules and regulations of the Securities and Exchange Commission and the PCAOB.
We conducted our audits in accordance with the standards of the PCAOB. Those standards require that we plan and perform the audit to obtain reasonable assurance about whether the financial statements and financial highlights are free of material misstatement, whether due to error or fraud. Our audits included performing procedures to assess the risks of material misstatement of the financial statements and financial highlights, whether due to error or fraud, and performing procedures that respond to those risks. Such procedures included examining, on a test basis, evidence regarding the amounts and disclosures in the financial statements and financial highlights. Such procedures also included confirmation of securities owned as of October 31, 2018, by correspondence with the custodians, transfer agents and brokers or by other appropriate auditing procedures when replies from brokers were not received. Our audits also included evaluating the accounting principles used and significant estimates made by management, as well as evaluating the overall presentation of the financial statements and financial highlights. We believe that our audits provide a reasonable basis for our opinion.

We have served as the auditor of one or more PGIM and/or Prudential Retail investment companies since 2003.
New York, New York
December 18, 2018
Federal Income Tax Information (unaudited)
For the year ended October 31, 2018, the Fund reports the maximum amount allowable but not less than 47.39% as interest related dividends in accordance with Section 871(k)(1) and 881(e)(1) of the Internal Revenue Code.
In January 2019, you will be advised on IRS Form 1099-DIV or substitute Form 1099-DIV as to the federal tax status of the distributions received by you in calendar year 2018.
We are required by Massachusetts, Missouri and Oregon to inform you that dividends which have been derived from interest on federal obligations are not taxable to shareholders providing the Mutual Fund meets certain requirements mandated by the respective state’s taxing authorities. We are pleased to report that 2.25% of the dividends paid by the Fund qualifies for such deduction.
Please consult your tax adviser or state/local authorities to properly report this information on your tax return. If you have any questions concerning the amounts listed above, please call your financial adviser.
| | | | |
| PGIM Absolute Return Bond Fund | | | 145 | |
INFORMATION ABOUT BOARD MEMBERS AND OFFICERS (unaudited)
Information about Board Members and Officers of the Fund is set forth below. Board Members who are not deemed to be “interested persons” of the Fund, as defined in the 1940 Act, are referred to as “Independent Board Members.” Board Members who are deemed to be “interested persons” of the Fund are referred to as “Interested Board Members.” The Board Members are responsible for the overall supervision of the operations of the Fund and perform the various duties imposed on the directors of investment companies by the 1940 Act. The Board in turn elects the Officers, who are responsible for administering the day-to-day operations of the Fund.
| | | | | | |
| Independent Board Members | | | | |
| | | | |
Name, Address, Age Position(s) Portfolios Overseen | | Principal Occupation(s) During Past Five Years | | Other Directorships Held During Past Five Years | | Length of Board Service |
| | | | |
Ellen S. Alberding (60) Board Member Portfolios Overseen: 93 | | President and Board Member, The Joyce Foundation (charitable foundation) (since 2002); Vice Chair, City Colleges of Chicago (community college system) (2011-2015); Trustee, National Park Foundation (charitable foundation for national park system) (2009-2018); Trustee, Economic Club of Chicago (since 2009); Trustee, Loyola University (since 2018). | | None. | | Since September 2013 |
| | | | |
Kevin J. Bannon (66) Board Member Portfolios Overseen: 93 | | Retired; Managing Director (April 2008-May 2015) and Chief Investment Officer (October 2008-November 2013) of Highmount Capital LLC (registered investment adviser); formerly Executive Vice President and Chief Investment Officer (April 1993-August 2007) of Bank of New York Company; President (May 2003-May 2007) of BNY Hamilton Family of Mutual Funds. | | Director of Urstadt Biddle Properties (equity real estate investment trust) (since September 2008). | | Since July 2008 |
| | | | |
Linda W. Bynoe (66) Board Member Portfolios Overseen: 93 | | President and Chief Executive Officer (since March 1995) and formerly Chief Operating Officer (December 1989-February 1995) of Telemat Ltd. (management consulting); formerly Vice President (January 1985-June 1989) at Morgan Stanley & Co. (broker-dealer). | | Director of Anixter International, Inc. (communication products distributor) (since January 2006); Director of Northern Trust Corporation (financial services) (since April 2006); Trustee of Equity Residential (residential real estate) (since December 2009). | | Since March 2005 |
PGIM Absolute Return Bond Fund
| | | | | | |
Independent Board Members | | | | |
| | | | |
Name, Address, Age Position(s) Portfolios Overseen | | Principal Occupation(s) During Past Five Years | | Other Directorships Held During Past Five Years | | Length of Board Service |
| | | | |
Barry H. Evans (58) Board Member Portfolios Overseen: 92 | | Retired; formerly President (2005 – 2016), Global Chief Operating Officer (2014– 2016), Chief Investment Officer – Global Head of Fixed Income (1998-2014), and various portfolio manager roles (1986-2006), Manulife Asset Management U.S. | | Director, Manulife Trust Company (since 2011); formerly Director, Manulife Asset Management Limited (2015-2017); formerly Chairman of the Board of Directors of Manulife Asset Management U.S. (2005-2016); formerly Chairman of the Board, Declaration Investment Management and Research (2008-2016). | | Since September 2017 |
| | | | |
Keith F. Hartstein (62) Board Member & Independent Chair Portfolios Overseen: 93 | | Retired; Member (since November 2014) of the Governing Council of the Independent Directors Council (organization of independent mutual fund directors); formerly President and Chief Executive Officer (2005-2012), Senior Vice President (2004-2005), Senior Vice President of Sales and Marketing (1997-2004), and various executive management positions (1990-1997), John Hancock Funds, LLC (asset management); Chairman, Investment Company Institute’s Sales Force Marketing Committee (2003-2008). | | None. | | Since September 2013 |
Visit our website at pgiminvestments.com
| | | | | | |
| Independent Board Members | | | | |
| | | | |
Name, Address, Age Position(s) Portfolios Overseen | | Principal Occupation(s) During Past Five Years | | Other Directorships Held During Past Five Years | | Length of Board Service |
| | | | |
Laurie Simon Hodrick (56) Board Member Portfolios Overseen: 92 | | A. Barton Hepburn Professor Emerita of Economics in the Faculty of Business, Columbia Business School (since 2018); Visiting Professor of Law, Stanford Law School (since 2015); Visiting Fellow at the Hoover Institution, Stanford University (since 2015); Sole Member, ReidCourt LLC (since 2008) (a consulting firm); formerly A. Barton Hepburn Professor of Economics in the Faculty of Business, Columbia Business School (1996-2017); formerly Managing Director, Global Head of Alternative Investment Strategies, Deutsche Bank (2006-2008). | | Independent Director, Corporate Capital Trust (since April 2017) (a business development company); Independent Director, Kabbage, Inc. (since July 2018) (financial services). | | Since September 2017 |
| | | | |
Michael S. Hyland, CFA (73) Board Member Portfolios Overseen: 93 | | Retired (since February 2005); formerly Senior Managing Director (July 2001-February 2005) of Bear Stearns & Co, Inc.; Global Partner, INVESCO (1999-2001); Managing Director and President of Salomon Brothers Asset Management (1989-1999). | | None. | | Since July 2008 |
| | | | |
Richard A. Redeker (75) Board Member Portfolios Overseen: 93 | | Retired Mutual Fund Senior Executive (50 years); Management Consultant; Director, Mutual Fund Directors Forum (since 2014); Independent Directors Council (organization of independent mutual fund directors)-Executive Committee, Chair of Policy Steering Committee, Governing Council. | | None. | | Since October 1993 |
PGIM Absolute Return Bond Fund
| | | | | | |
| Independent Board Members | | | | |
| | | | |
Name, Address, Age Position(s) Portfolios Overseen | | Principal Occupation(s) During Past Five Years | | Other Directorships Held During Past Five Years | | Length of Board Service |
| | | | |
Brian K. Reid (56)# Board Member Portfolios Overseen: 92 | | Retired; formerly Chief Economist for the Investment Company Institute (ICI) (2005-2017); formerly Senior Economist and Director of Industry and Financial Analysis at the ICI (1998-2004); formerly Senior Economist, Industry and Financial Analysis at the ICI (1996-1998); formerly Staff Economist at the Federal Reserve Board (1989-1996); Director, ICI Mutual Insurance Company (2012-2017). | | None. | �� | Since March 2018 |
| # | Mr. Reid joined the Board effective as of March 1, 2018. |
| | | | | | |
| Interested Board Members | | | | |
| | | | |
Name, Address, Age Position(s) Portfolios Overseen | | Principal Occupation(s) During Past Five Years | | Other Directorships Held During Past Five Years | | Length of
Board Service |
| | | | |
Stuart S. Parker (56) Board Member & President Portfolios Overseen: 93 | | President of PGIM Investments LLC (formerly known as Prudential Investments LLC) (since January 2012); Executive Vice President of Prudential Investment Management Services LLC (since December 2012); formerly Executive Vice President of Jennison Associates LLC and Head of Retail Distribution of PGIM Investments LLC (June 2005-December 2011). | | None. | | Since January 2012 |
Visit our website at pgiminvestments.com
| | | | | | |
| Interested Board Members | | | | |
| | | | |
Name, Address, Age Position(s) Portfolios Overseen | | Principal Occupation(s) During Past Five Years | | Other Directorships Held During Past Five Years | | Length of Board Service |
| | | | |
Scott E. Benjamin (45) Board Member & Vice President Portfolios Overseen:93 | | Executive Vice President (since June 2009) of PGIM Investments LLC; Executive Vice President (June 2009-June 2012) and Vice President (since June 2012) of Prudential Investment Management Services LLC; Executive Vice President (since September 2009) of AST Investment Services, Inc.; Senior Vice President of Product Development and Marketing, PGIM Investments (since February 2006); formerly Vice President of Product Development and Product Management, PGIM Investments LLC (2003-2006). | | None. | | Since March 2010 |
| | | | |
Grace C. Torres* (59) Board Member Portfolios Overseen: 92 | | Retired; formerly Treasurer and Principal Financial and Accounting Officer of the PGIM Funds, Target Funds, Advanced Series Trust, Prudential Variable Contract Accounts and The Prudential Series Fund (1998-June 2014); Assistant Treasurer (March 1999-June 2014) and Senior Vice President (September 1999-June 2014) of PGIM Investments LLC; Assistant Treasurer (May 2003-June 2014) and Vice President (June 2005-June 2014) of AST Investment Services, Inc.; Senior Vice President and Assistant Treasurer (May 2003-June 2014) of Prudential Annuities Advisory Services, Inc. | | Formerly Director (July 2015-January 2018) of Sun Bancorp, Inc. N.A. and Sun National Bank; Director (since January 2018) of OceanFirst Financial Corp. and OceanFirst Bank. | | Since November 2014 |
* Note: Prior to her retirement in 2014, Ms. Torres was employed by PGIM Investments LLC. Due to her prior employment, she is considered to be an “interested person” under the 1940 Act. Ms. Torres is a Non-Management Interested Board Member.
PGIM Absolute Return Bond Fund
| | | | |
| Fund Officers(a) | | | | |
| | | |
Name, Address and Age Position with Fund | | Principal Occupation(s) During Past Five Years | | Length of Service as Fund Officer |
| | | |
Raymond A. O’Hara (63) Chief Legal Officer | | Vice President and Corporate Counsel (since July 2010) of Prudential Insurance Company of America (Prudential); Vice President (March 2011-Present) of Pruco Life Insurance Company and Pruco Life Insurance Company of New Jersey; Vice President and Corporate Counsel (March 2011-Present) of Prudential Annuities Life Assurance Corporation; Chief Legal Officer of PGIM Investments LLC (since June 2012); Chief Legal Officer of Prudential Mutual Fund Services LLC (since June 2012) and Corporate Counsel of AST Investment Services, Inc. (since June 2012); formerly Assistant Vice President and Corporate Counsel (September 2008-July 2010) of The Hartford Financial Services Group, Inc.; formerly Associate (September 1980-December 1987) and Partner (January 1988–August 2008) of Blazzard & Hasenauer, P.C. (formerly, Blazzard, Grodd & Hasenauer, P.C.). | | Since June 2012 |
| | | |
Chad A. Earnst (43) Chief Compliance Officer | | Chief Compliance Officer (September 2014-Present) of PGIM Investments LLC; Chief Compliance Officer (September 2014-Present) of the PGIM Funds, Target Funds, Advanced Series Trust, The Prudential Series Fund, Prudential’s Gibraltar Fund, Inc., PGIM Global Short Duration High Yield Income Fund, Inc., PGIM Short Duration High Yield Fund, Inc. and PGIM Jennison MLP Income Fund, Inc.; formerly Assistant Director (March 2010-August 2014) of the Asset Management Unit, Division of Enforcement, US Securities & Exchange Commission; Assistant Regional Director (January 2010-August 2014), Branch Chief (June 2006–December 2009) and Senior Counsel (April 2003-May 2006) of the Miami Regional Office, Division of Enforcement, US Securities & Exchange Commission. | | Since September 2014 |
| | | |
Dino Capasso (44) Deputy Chief Compliance Officer | | Vice President and Deputy Chief Compliance Officer (June 2017-Present) of PGIM Investments LLC; formerly, Senior Vice President and Senior Counsel (January 2016-June 2017), and Vice President and Counsel (February 2012-December 2015) of Pacific Investment Management Company LLC. | | Since March 2018 |
| | | |
Andrew R. French (56) Secretary | | Vice President and Corporate Counsel (since February 2010) of Prudential; formerly Director and Corporate Counsel (2006-2010) of Prudential; Vice President and Assistant Secretary (since January 2007) of PGIM Investments LLC; Vice President and Assistant Secretary (since January 2007) of Prudential Mutual Fund Services LLC. | | Since October 2006 |
Visit our website at pgiminvestments.com
| | | | |
| Fund Officers(a) | | | | |
| | | |
Name, Address and Age Position with Fund | | Principal Occupation(s) During Past Five Years | | Length of Service as Fund Officer |
| | | |
Jonathan D. Shain (60) Assistant Secretary | | Vice President and Corporate Counsel (since August 1998) of Prudential; Vice President and Assistant Secretary (since May 2001) of PGIM Investments LLC; Vice President and Assistant Secretary (since February 2001) of Prudential Mutual Fund Services LLC; formerly Vice President and Assistant Secretary (May 2003-June 2005) of AST Investment Services, Inc. | | Since May 2005 |
| | | |
Claudia DiGiacomo (44) Assistant Secretary | | Vice President and Corporate Counsel (since January 2005) of Prudential; Vice President and Assistant Secretary of PGIM Investments LLC (since December 2005); formerly Associate at Sidley Austin Brown & Wood LLP (1999-2004). | | Since December 2005 |
| | | |
Charles H. Smith (45) Anti-Money Laundering Compliance Officer | | Vice President, Corporate Compliance, Anti-Money Laundering Unit (since January 2015) of Prudential; committee member of the American Council of Life Insurers Anti-Money Laundering and Critical Infrastructure Committee (since January 2016); formerly Global Head of Economic Sanctions Compliance at AIG Property Casualty (February 2007 – December 2014); Assistant Attorney General at the New York State Attorney General’s Office, Division of Public Advocacy. (August 1998 —January 2007). | | Since January 2017 |
| | | |
Brian D. Nee (52) Treasurer and Principal Financial and Accounting Officer | | Vice President and Head of Finance of PGIM Investments LLC (since August 2015) and PGIM Global Partners (since February 2017); formerly, Vice President, Treasurer’s Department of Prudential (September 2007-August 2015). | | Since July 2018 |
| | | |
Peter Parrella (60) Assistant Treasurer | | Vice President (since 2007) and Director (2004-2007) within Prudential Mutual Fund Administration; formerly Tax Manager at SSB Citi Fund Management LLC (1997-2004). | | Since June 2007 |
| | | |
Lana Lomuti (51) Assistant Treasurer | | Vice President (since 2007) and Director (2005-2007), within Prudential Mutual Fund Administration; formerly Assistant Treasurer (December 2007-February 2014) of The Greater China Fund, Inc. | | Since April 2014 |
| | | |
Linda McMullin (57) Assistant Treasurer | | Vice President (since 2011) and Director (2008-2011) within Prudential Mutual Fund Administration. | | Since April 2014 |
| | | |
Kelly A. Coyne (50) Assistant Treasurer | | Director, Investment Operations of Prudential Mutual Fund Services LLC (since 2010). | | Since March 2015 |
(a) Excludes Mr. Parker and Mr. Benjamin, interested Board Members who also serve as President and Vice President, respectively.
Explanatory Notes to Tables:
| ∎ | | Board Members are deemed to be “Interested,” as defined in the 1940 Act, by reason of their affiliation with PGIM Investments LLC and/or an affiliate of PGIM Investments LLC. |
| ∎ | | Unless otherwise noted, the address of all Board Members and Officers is c/o PGIM Investments LLC, 655 Broad Street, Newark, New Jersey 07102-4410. |
| ∎ | | There is no set term of office for Board Members or Officers. The Board Members have adopted a retirement policy, which calls for the retirement of Board Members on December 31 of the year in which they reach the age of 75. |
PGIM Absolute Return Bond Fund
| ∎ | | “Other Directorships Held” includes only directorships of companies required to register or file reports with the SEC under the 1934 Act (that is, “public companies”) or other investment companies registered under the 1940 Act. |
| ∎ | | “Portfolios Overseen” includes all investment companies managed by PGIM Investments LLC. The investment companies for which PGIM Investments LLC serves as manager include the PGIM Funds, The Prudential Variable Contract Accounts, PGIM ETF Trust, PGIM Short Duration High Yield Fund, Inc., PGIM Global Short Duration High Yield Fund, Inc., The Prudential Series Fund, Prudential’s Gibraltar Fund, Inc. and the Advanced Series Trust. |
Visit our website at pgiminvestments.com
Approval of Advisory Agreements (unaudited)
The Fund’s Board of Trustees
The Board of Trustees (the “Board”) of PGIM Absolute Return Bond Fund (the “Fund”)1 consists of twelve individuals, nine of whom are not “interested persons” of the Fund, as defined in the Investment Company Act of 1940, as amended (the “1940 Act”) (the “Independent Trustees”). The Board is responsible for the oversight of the Fund and its operations, and performs the various duties imposed on the directors of investment companies by the 1940 Act. The Independent Trustees have retained independent legal counsel to assist them in connection with their duties. The Chair of the Board is an Independent Trustee. The Board has established four standing committees: the Audit Committee, the Nominating and Governance Committee, and two Investment Committees. Each committee is chaired by, and composed of, Independent Trustees.
Annual Approval of the Fund’s Advisory Agreements
As required under the 1940 Act, the Board determines annually whether to renew the Fund’s management agreement with PGIM Investments LLC (“PGIM Investments”), the Fund’s subadvisory agreement with PGIM, Inc. (“PGIM”) on behalf of its PGIM Fixed Income unit, and the Fund’s sub-subadvisory agreement with PGIM Limited (“PGIML”). In considering the renewal of the agreements, the Board, including all of the Independent Trustees, met on June 7, 2018 and on June 19-21, 2018 and approved the renewal of the agreements through July 31, 2019, after concluding that the renewal of the agreements was in the best interests of the Fund and its shareholders.
In advance of the meetings, the Board requested and received materials relating to the agreements, and had the opportunity to ask questions and request further information in connection with its consideration. Among other things, the Board considered comparative fee information from PGIM Investments, PGIM, and where appropriate, affiliates of PGIM. Also, the Board considered comparisons with other mutual funds in relevant Peer Universes and Peer Groups, as is further discussed below.
In approving the agreements, the Board, including the Independent Trustees advised by independent legal counsel, considered the factors it deemed relevant, including the nature, quality and extent of services provided by PGIM Investments, the subadviser, and, as relevant, its affiliates, the performance of the Fund, the profitability of PGIM Investments and its affiliates, expenses and fees, and the potential for economies of scale that may be shared with the Fund and its shareholders as the Fund’s assets grow. In their deliberations, the Trustees did not identify any single factor which alone was responsible for the Board’s decision to approve the agreements with respect to the Fund. In connection with its deliberations, the Board considered information provided by PGIM Investments throughout
| 1 | PGIM Absolute Return Bond Fund is a series of Prudential Investment Portfolios 9. |
| | |
| PGIM Absolute Return Bond Fund |
Approval of Advisory Agreements (continued)
the year at regular Board meetings, presentations from portfolio managers and other information, as well as information furnished at or in advance of the meetings on June 7, 2018 and on June 19-21, 2018.
The Trustees determined that the overall arrangements between the Fund and PGIM Investments, which serves as the Fund’s investment manager pursuant to a management agreement, between PGIM Investments and PGIM, which, through its PGIM Fixed Income unit, serves as the Fund’s subadviser pursuant to the terms of a subadvisory agreement with PGIM Investments, and between PGIM and PGIML, which serves as the Fund’s sub-subadviser pursuant to the terms of a sub-subadvisory agreement with PGIM, are in the best interests of the Fund and its shareholders in light of the services performed, fees charged and such other matters as the Trustees considered relevant in the exercise of their business judgment.
The material factors and conclusions that formed the basis for the Trustees’ reaching their determinations to approve the continuance of the agreements are separately discussed below.
Nature, Quality and Extent of Services
The Board received and considered information regarding the nature, quality and extent of services provided to the Fund by PGIM Investments, PGIM Fixed Income, and PGIML. The Board considered the services provided by PGIM Investments, including but not limited to the oversight of the subadviser and sub-subadviser for the Fund, as well as the provision of fund recordkeeping, compliance, and other services to the Fund. With respect to PGIM Investments’ oversight of the subadviser and sub-subadviser, the Board noted that PGIM Investments’ Strategic Investment Research Group (“SIRG”), which is a business unit of PGIM Investments, is responsible for monitoring and reporting to PGIM Investments senior management on the performance and operations of the subadviser and sub-subadviser. The Board also considered that PGIM Investments pays the salaries of all of the officers and interested Trustees of the Fund who are part of Fund management. The Board also considered the investment subadvisory services provided by PGIM Fixed Income and PGIML, including investment research and security selection, as well as adherence to the Fund’s investment restrictions and compliance with applicable Fund policies and procedures. The Board considered PGIM Investments’ evaluation of the subadviser and sub-subadviser, as well as PGIM Investments’ recommendation, based on its review of the subadviser and sub-subadviser, to renew the subadvisory and sub-subadvisory agreements.
The Board considered the qualifications, backgrounds and responsibilities of PGIM Investments’ senior management responsible for the oversight of the Fund, PGIM Fixed Income, and PGIML, and also considered the qualifications, backgrounds and
| | |
| Visit our website at pgiminvestments.com | | |
responsibilities of PGIM Fixed Income’s portfolio managers who are responsible for the day-to-day management of the Fund’s portfolio. The Board was provided with information pertaining to PGIM Investments’, PGIM Fixed Income’s, and PGIML’s organizational structure, senior management, investment operations, and other relevant information pertaining to PGIM Investments, PGIM Fixed Income, and PGIML. The Board also noted that it received favorable compliance reports from the Fund’s Chief Compliance Officer (“CCO”) as to PGIM Investments, PGIM Fixed Income, and PGIML. The Board noted that PGIM Fixed Income and PGIML are affiliated with PGIM Investments.
The Board concluded that it was satisfied with the nature, extent and quality of the investment management services provided by PGIM Investments, the subadvisory services provided to the Fund by PGIM Fixed Income, and the sub-subadvisory services provided by PGIML, and that there was a reasonable basis on which to conclude that the Fund benefits from the services provided by PGIM Investments, PGIM Fixed Income, and PGIML under the management, subadvisory and sub-subadvisory agreements.
Costs of Services and Profits Realized by PGIM Investments
The Board was provided with information on the profitability of PGIM Investments and its affiliates in serving as the Fund’s investment manager. The Board discussed with PGIM Investments the methodology utilized in assembling the information regarding profitability and considered its reasonableness. The Board recognized that it is difficult to make comparisons of profitability from fund management contracts because comparative information is not generally publicly available and is affected by numerous factors, including the structure of the particular adviser, the types of funds it manages, its business mix, numerous assumptions regarding allocations and the adviser’s capital structure and cost of capital. Taking these factors into account, the Board concluded that the profitability of PGIM Investments and its affiliates in relation to the services rendered was not unreasonable.
Economies of Scale
The Board received and discussed information concerning economies of scale that PGIM Investments may realize as the Fund’s assets grow beyond current levels. The Board noted that the management fee schedule for the Fund includes breakpoints, which have the effect of decreasing the fee rate as assets increase. During the course of time, the Board has considered information regarding the launch date of the Fund, the management fees of the Fund compared to those of similarly managed funds and PGIM Investments’ investment in the Fund over time. The Board noted that economies of scale can be shared with the Fund in other ways, including low management fees from inception, additional technological and personnel investments to enhance shareholder services, and maintaining existing expense structures in the face of a rising cost environment. The Board also
| | |
| PGIM Absolute Return Bond Fund |
Approval of Advisory Agreements (continued)
considered PGIM Investments’ assertion that it continually evaluates the management fee schedule of the Fund and the potential to share economies of scale through breakpoints or fee waivers as asset levels increase.
The Board recognized the inherent limitations of any analysis of economies of scale, stemming largely from the Board’s understanding that most of PGIM Investments’ costs are not specific to individual funds, but rather are incurred across a variety of products and services.
Other Benefits to PGIM Investments, PGIM Fixed Income, and PGIML
The Board considered potential ancillary benefits that might be received by PGIM Investments, PGIM Fixed Income, PGIML and their affiliates as a result of their relationship with the Fund. The Board concluded that potential benefits to be derived by PGIM Investments included transfer agency fees received by the Fund’s transfer agent (which is affiliated with PGIM Investments), as well as benefits to its reputation or other intangible benefits resulting from PGIM Investments’ association with the Fund. The Board concluded that the potential benefits to be derived by PGIM Fixed Income and PGIML included the ability to use soft dollar credits, as well as the potential benefits consistent with those generally resulting from an increase in assets under management, specifically, potential access to additional research resources and benefits to their reputations. The Board concluded that the benefits derived by PGIM Investments, PGIM Fixed Income, and PGIML were consistent with the types of benefits generally derived by investment managers and subadvisers to mutual funds.
Performance of the Fund / Fees and Expenses
The Board considered certain additional specific factors and made related conclusions relating to the historical performance of the Fund for the one, three-, and five-year periods ended December 31, 2017.
The Board also considered the Fund’s actual management fee, as well as the Fund’s net total expense ratio, for the fiscal year ended October 31, 2017. The Board considered the management fee for the Fund as compared to the management fee charged by PGIM Investments to other funds and the fee charged by other advisers to comparable mutual funds in a Peer Group. The actual management fee represents the fee rate actually paid by Fund shareholders and includes any fee waivers or reimbursements. The net total expense ratio for the Fund represents the actual expense ratio incurred by Fund shareholders.
The mutual funds included in the Peer Universe, which was used to consider performance, and the Peer Group, which was used to consider expenses and fees, were objectively
| | |
| Visit our website at pgiminvestments.com | | |
determined by Broadridge, an independent provider of mutual fund data. In certain circumstances, PGIM Investments also may have provided supplemental Peer Universe or Peer Group information, for reasons addressed with the Board. The comparisons placed the Fund in various quartiles, with the first quartile being the best 25% of the mutual funds (for performance, the best performing mutual funds and, for expenses, the lowest cost mutual funds).
The section below summarizes key factors considered by the Board and the Board’s conclusions regarding the Fund’s performance, fees and overall expenses. The table sets forth gross performance comparisons (which do not reflect the impact on performance of fund expenses, or any subsidies, expense caps or waivers that may be applicable) with the Peer Universe, actual management fees with the Peer Group (which reflect the impact of any subsidies or fee waivers), and net total expenses with the Peer Group, each of which were key factors considered by the Board.
| | | | | | | | |
Gross
Performance | | 1 Year | | 3 Years | | 5 Years | | 10 Years |
| | | 2nd Quartile | | 2nd Quartile | | 2nd Quartile | | N/A |
| Actual Management Fees: 4th Quartile |
| Net Total Expenses: 2nd Quartile |
| | • | | The Board noted that the Fund outperformed its benchmark index over all periods. |
| | • | | The Board and PGIM Investments agreed to retain the existing contractual expense cap, which (exclusive of certain fees and expenses) caps the Fund’s annual operating expenses at 0.70% for Class R6 shares, and 0.73% for Class Z shares through February 28, 2019. |
| | • | | The Board also noted information provided by PGIM Investments which indicated that because the Fund’s expense cap had not been in effect for the full fiscal year, the Fund’s ranking for net total expenses did not reflect the full impact of the expense cap, and that if the expense cap had been in effect for the full fiscal year, the Fund would have ranked in the first quartile of its Peer Group. |
| | • | | The Board concluded that, in light of the above, it would be in the best interests of the Fund and its shareholders to renew the agreements. |
| | • | | The Board concluded that the management fees (including subadvisory fees) and total expenses were reasonable in light of the services provided. |
* * *
After full consideration of these factors, the Board concluded that the approval of the agreements was in the best interests of the Fund and its shareholders.
| | |
| PGIM Absolute Return Bond Fund |
| | | | |
| ∎ MAIL | | ∎ TELEPHONE | | ∎ WEBSITE |
655 Broad Street
Newark, NJ 07102 | | (800) 225-1852 | | www.pgiminvestments.com |
|
| PROXY VOTING |
| The Board of Trustees of the Fund has delegated to the Fund’s subadviser the responsibility for voting any proxies and maintaining proxy recordkeeping with respect to the Fund. A description of these proxy voting policies and procedures is available without charge, upon request, by calling (800) 225-1852. Information regarding how the Fund voted proxies relating to portfolio securities during the most recent 12-month period ended June 30 is available on the Fund’s website and on the Securities and Exchange Commission’s website. |
|
| TRUSTEES |
| Ellen S. Alberding • Kevin J. Bannon • Scott E. Benjamin • Linda W. Bynoe • Barry H. Evans • Keith F. Hartstein • Laurie Simon Hodrick • Michael S. Hyland • Stuart S. Parker • Richard A. Redeker • Brian K. Reid • Grace C. Torres |
|
| OFFICERS |
| Stuart S. Parker, President • Scott E. Benjamin, Vice President • Brian D. Nee, Treasurer and Principal Financial and Accounting Officer • Raymond A. O’Hara, Chief Legal Officer • Andrew R. French, Secretary • Chad A. Earnst, Chief Compliance Officer • Dino Capasso, Vice President and Deputy Chief Compliance Officer • Charles H. Smith, Anti-Money Laundering Compliance Officer • Jonathan D. Shain, Assistant Secretary • Claudia DiGiacomo, Assistant Secretary • Peter Parrella, Assistant Treasurer • Lana Lomuti, Assistant Treasurer • Linda McMullin, Assistant Treasurer • Kelly A. Coyne, Assistant Treasurer |
| | | | |
| MANAGER | | PGIM Investments LLC | | 655 Broad Street
Newark, NJ 07102 |
|
| SUBADVISER | | PGIM Fixed Income | | 655 Broad Street
Newark, NJ 07102 |
|
| DISTRIBUTOR | | Prudential Investment
Management Services LLC | | 655 Broad Street
Newark, NJ 07102 |
|
| CUSTODIAN | | The Bank of New York Mellon | | 225 Liberty Street
New York, NY 10286 |
|
| TRANSFER AGENT | | Prudential Mutual Fund
Services LLC | | PO Box 9658
Providence, RI 02940 |
|
INDEPENDENT REGISTERED
PUBLIC ACCOUNTING FIRM | | KPMG LLP | | 345 Park Avenue
New York, NY 10154 |
|
| FUND COUNSEL | | Willkie Farr & Gallagher LLP | | 787 Seventh Avenue
New York, NY 10019 |
|
|
| An investor should consider the investment objectives, risks, charges, and expenses of the Fund carefully before investing. The prospectus and summary prospectus contain this and other information about the Fund. An investor may obtain a prospectus and summary prospectus by visiting our website at www.pgiminvestments.com or by calling (800) 225-1852. The prospectus and summary prospectus should be read carefully before investing. |
|
| E-DELIVERY |
| To receive your mutual fund documents online, go to www.pgiminvestments.com/edelivery and enroll. Instead of receiving printed documents by mail, you will receive notification via email when new materials are available. You can cancel your enrollment or change your email address at any time by visiting the website address above. |
|
| SHAREHOLDER COMMUNICATIONS WITH TRUSTEES |
| Shareholders can communicate directly with the Board of Trustees by writing to the Chair of the Board, PGIM Absolute Return Bond Fund, PGIM Investments, Attn: Board of Trustees, 655 Broad Street, Newark, NJ 07102. Shareholders can communicate directly with an individual Trustee by writing to the same address. Communications are not screened before being delivered to the addressee. |
|
| AVAILABILITY OF PORTFOLIO SCHEDULE |
| The Fund files its complete schedule of portfolio holdings with the Securities and Exchange Commission for the first and third quarters of each fiscal year on Form N-Q. The Fund’s Forms N-Q are available on the Commission’s website at www.sec.gov. The Fund’s schedule of portfolio holdings is also available on the Fund’s website as of the end of each month no sooner than 15 days after the end of the month. |
|
| The Fund’s Statement of Additional Information contains additional information about the Fund’s Trustees and is available without charge, upon request, by calling (800) 225-1852. |
Mutual Funds:
| | | | |
ARE NOT INSURED BY THE FDIC OR ANY
FEDERAL GOVERNMENT AGENCY | | MAY LOSE VALUE | | ARE NOT A DEPOSIT OF OR GUARANTEED
BY ANY BANK OR ANY BANK AFFILIATE |
PGIM ABSOLUTE RETURN BOND FUND
| | | | | | | | |
| SHARE CLASS | | A | | C | | Z | | R6* |
| NASDAQ | | PADAX | | PADCX | | PADZX | | PADQX |
| CUSIP | | 74441J852 | | 74441J845 | | 74441J829 | | 74441J837 |
*Formerly known as Class Q shares.
MF213E

PGIM QMA LARGE-CAP CORE EQUITY FUND
(Formerly known as Prudential QMA Large-Cap Core Equity Fund)
ANNUAL REPORT
OCTOBER 31, 2018
COMING SOON: PAPERLESS SHAREHOLDER REPORTS
Beginning on January 1, 2021, as permitted by regulations adopted by the Securities and Exchange Commission, paper copies of the Fund’s annual and semi-annual shareholder reports will no longer be sent by mail, unless you specifically request paper copies of the reports. Instead, the reports will be made available on the Fund’s website (www.pgiminvestments.com), and you will be notified by mail each time a report is posted and provided with a website link to access the report.
If you already elected to receive shareholder reports electronically, you will not be affected by this change and you need not take any action. You may elect to receive shareholder reports and other communications from the Fund electronically anytime by contacting your financial intermediary (such as a broker-dealer or bank) or, if you are a direct investor, by calling 1-800-225-1852 or by sending an e-mail request to PGIM Investments at shareholderreports@pgim.com.
Beginning on January 1, 2019, you may elect to receive all future reports in paper free of charge. If you invest through a financial intermediary, you can contact your financial intermediary or follow instructions included with this notice to elect to continue to receive paper copies of your shareholder reports. If you invest directly with the Fund, you can call 1-800-225-1852 or send an email request to shareholderreports@pgim.com to let the Fund know you wish to continue receiving paper copies of your shareholder reports. Your election to receive reports in paper will apply to all funds held in your account if you invest through your financial intermediary or all funds held with the fund complex if you invest directly with the Fund.

To enroll in e-delivery, go to pgiminvestments.com/edelivery
|
| Objective: Long-term growth of capital |
Highlights (unaudited)
| • | | Favoring companies with improving earnings prospects and good quality was particularly additive to performance during the reporting period. |
| • | | The Fund’s modest overweight in the health care sector helped performance. |
| • | | The Fund’s relative value strategy, which favors stocks that are inexpensive relative to industry peers, detracted from performance during the period. |
| • | | Stock selection in the consumer discretionary and information technology sectors lagged the S&P 500 Index. |
This report is not authorized for distribution to prospective investors unless preceded or accompanied by a current prospectus.
The views expressed in this report and information about the Fund’s portfolio holdings are for the period covered by this report and are subject to change thereafter.
Mutual funds are distributed by Prudential Investment Management Services LLC, a Prudential Financial company and member SIPC. QMA is the primary business name of Quantitative Management Associates LLC, a registered investment adviser and a wholly owned subsidiary of PGIM, Inc., a Prudential Financial company. © 2018 Prudential Financial, Inc. and its related entities. PGIM and the PGIM logo are service marks of Prudential Financial, Inc. and its related entities, registered in many jurisdictions worldwide.
| | |
| 2 | | Visit our website at pgiminvestments.com |
PGIM FUNDS — UPDATE
The Board of Directors/Trustees for the Fund has approved the implementation of an automatic conversion feature for Class C shares, effective as of April 1, 2019. To reflect these changes, effective April 1, 2019, the section of the Fund’s Prospectus entitled “How to Buy, Sell and Exchange Fund Shares—How to Exchange Your Shares—Frequent Purchases and Redemptions of Fund Shares” is restated to read as follows:
This supplement should be read in conjunction with your Summary Prospectus, Statutory Prospectus and Statement of Additional Information, be retained for future reference and is in addition to any existing Fund supplements.
| | 1. | In each Fund’s Statutory Prospectus, the following is added at the end of the section entitled “Fund Distributions And Tax Issues—If You Sell or Exchange Your Shares”: |
Automatic Conversion of Class C Shares
The conversion of Class C shares into Class A shares—which happens automatically approximately 10 years after purchase—is not a taxable event for federal income tax purposes. For more information about the automatic conversion of Class C shares, see Class C Shares Automatically Convert to Class A Shares in How to Buy, Sell and Exchange Fund Shares.
| | 2. | In each Fund’s Statutory Prospectus, the following sentence is added at the end of the section entitled “How to Buy, Sell and Exchange Shares—Closure of Certain Share Classes to New Group Retirement Plans”: |
Shareholders owning Class C shares may continue to hold their Class C shares until the shares automatically convert to Class A shares under the conversion schedule, or until the shareholder redeems their Class C shares.
| | 3. | In each Fund’s Statutory Prospectus, the following disclosure is added immediately following the section entitled “How to Buy, Sell and Exchange Shares—How to Buy Shares—Class B Shares Automatically Convert to Class A Shares”: |
Class C Shares Automatically Convert to Class A Shares
Starting on or about April 1, 2019 (the “Effective Date”), Class C shares will be eligible for automatic conversion into Class A shares on a monthly basis approximately ten years after the original date of purchase (the “Conversion Date”). Conversion will take place based on the relative NAV of the two classes, without the imposition of any sales load, fee or other charge. All such automatic conversions of Class C shares will constitute tax-free exchanges for federal income tax purposes.
For shareholders investing in Class C shares through retirement plans or omnibus accounts, and in certain other instances, the Fund and its agents may not have
| | | | |
| PGIM QMA Large-Cap Core Equity Fund | | | 3 | |
transparency into how long a shareholder has held Class C shares for purposes of determining whether such Class C shares are eligible for automatic conversion into Class A shares, and the relevant financial intermediary may not have the ability to track purchases in order to credit individual shareholders’ holding periods. In these circumstances, the Fund will not be able to automatically convert Class C shares into Class A shares as described above. In order to determine eligibility for conversion in these circumstances, it is the responsibility of the financial intermediary to notify the Fund that the shareholder is eligible for the conversion of Class C shares to Class A shares, and the financial intermediary may be required to maintain and provide the Fund with records that substantiate the holding period of Class C shares. It is the financial intermediary’s (and not the Fund’s) responsibility to keep records of transactions made in accounts it holds and to ensure that the shareholder is credited with the proper holding period based on such records or those provided to the financial intermediary by the shareholder. Please consult with your financial intermediary for the applicability of this conversion feature to your shares.
A financial intermediary may sponsor and/or control accounts, programs or platforms that impose a different conversion schedule or different eligibility requirements for the exchange of Class C shares for Class A shares (see Appendix A: Waivers and Discounts Available From Certain Financial Intermediaries of the Prospectus). Please consult with your financial intermediary if you have any questions regarding your shares’ conversion from Class C shares to Class A shares.
| | 4. | In Part II of each Fund’s Statement of Additional Information, the following disclosure is added immediately following the section entitled “Purchase, Redemption and Pricing of Fund Shares—Share Classes—Automatic Conversion of Class B Shares”: |
AUTOMATIC CONVERSION OF CLASS C SHARES. Starting on or about April 1, 2019 (the “Effective Date”), Class C shares will be eligible for automatic conversion into Class A shares on a monthly basis approximately ten years after the original date of purchase (the “Conversion Date”). Conversion will take place based on the relative NAV of the two classes, without the imposition of any sales load, fee or other charge. Class C shares of a Fund acquired through automatic reinvestment of dividends or distributions will convert to Class A shares of the Fund on the Conversion Date pro rata with the converting Class C shares of the Fund that were not acquired through reinvestment of dividends or distributions. All such automatic conversions of Class C shares will constitute tax-free exchanges for federal income tax purposes.
For shareholders investing in Class C shares through retirement plans or omnibus accounts, and in certain other instances, the Fund and its agents may not have transparency into how long a shareholder has held Class C shares for purposes of determining whether such Class C shares are eligible for automatic conversion into Class A shares, and the relevant financial intermediary may not have the ability to track purchases in order to credit individual shareholders’ holding periods. In these circumstances, the
| | |
| 4 | | Visit our website at pgiminvestments.com |
Fund will not be able to automatically convert Class C shares into Class A shares as described above. In order to determine eligibility for conversion in these circumstances, it is the responsibility of the financial intermediary to notify the Fund that the shareholder is eligible for the conversion of Class C shares to Class A shares, and the financial intermediary may be required to maintain and provide the Fund with records that substantiate the holding period of Class C shares. It is the financial intermediary’s (and not the Fund’s) responsibility to keep records of transactions made in accounts it holds and to ensure that the shareholder is credited with the proper holding period based on such records or those provided to the financial intermediary by the shareholder. Please consult with your financial intermediary for the applicability of this conversion feature to your shares.
Class C shares were generally closed to investments by new group retirement plans effective June 1, 2018. Group retirement plans (and their successor, related and affiliated plans) that have Class C shares of the Fund available to participants on or before the Effective Date may continue to open accounts for new participants in such share class and purchase additional shares in existing participant accounts.
The Fund has no responsibility for monitoring or implementing a financial intermediary’s process for determining whether a shareholder meets the required holding period for conversion. A financial intermediary may sponsor and/or control accounts, programs or platforms that impose a different conversion schedule or different eligibility requirements for the exchange of Class C shares for Class A shares, as set forth on Appendix A: Waivers and Discounts Available From Certain Financial Intermediaries of the Prospectus. In these cases, Class C shareholders may have their shares exchanged for Class A shares under the policies of the financial intermediary. Financial intermediaries will be responsible for making such exchanges in those circumstances. Please consult with your financial intermediary if you have any questions regarding your shares’ conversion from Class C shares to Class A shares.
LR1094
- Not part of the Annual Report -
| | | | |
| PGIM QMA Large-Cap Core Equity Fund | | | 5 | |
Table of Contents
| | |
| 6 | | Visit our website at pgiminvestments.com |
Letter from the President

Dear Shareholder:
We hope you find the annual report for PGIM QMA Large-Cap Core Equity Fund informative and useful. The report covers performance for the 12-month period that ended October 31, 2018.
We have important information to share with you. Effective June 11, 2018, Prudential Mutual Funds were renamed PGIM Funds. This renaming is part of our ongoing effort to further build our reputation and establish our global brand, which began when our firm adopted PGIM Investments as its name in April 2017. Please note that only the Fund’s name has changed. Your Fund’s management and operation, along with its symbols, remained the same.*
During the reporting period, the global economy continued to grow, and central banks gradually tightened monetary policy. In the US, the economy expanded and employment increased. In September, the Federal Reserve hiked interest rates for the eighth time since 2015, based on confidence in the economy.
Equity returns on the whole were strong, due to optimistic earnings expectations and investor sentiment. Global equities, including emerging markets, generally posted positive returns. However, they trailed the performance of US equities, which rose on higher corporate profits, new regulatory policies, and tax reform benefits. Volatility spiked briefly early in the period on inflation concerns, rising interest rates, and a potential global trade war, and again late in the period on worries that profit growth might slow in 2019.
The overall bond market declined modestly during the period, as measured by the Bloomberg Barclays US Aggregate Bond Index. The best performance came from higher-yielding, economically sensitive sectors, such as high yield bonds and bank loans, which posted small gains. US investment-grade corporate bonds and US Treasury bonds both finished the period with negative returns. A major trend during the period was the flattening of the US Treasury yield curve, which increased the yield on fixed income investments with shorter maturities and made them more attractive to investors.
Regarding your investments with PGIM, we believe it is important to maintain a diversified portfolio of funds consistent with your tolerance for risk, time horizon, and financial goals. Your financial advisor can help you create a diversified investment plan that may include funds covering all the basic asset classes and that reflects your personal investor profile and risk tolerance. However, diversification and asset allocation strategies do not assure a profit or protect against loss in declining markets.
At PGIM Investments, we consider it a great privilege and responsibility to help investors participate in opportunities across global markets while meeting their toughest investment challenges. PGIM is a top-10 global investment manager with more than $1 trillion in assets under management. This investment expertise allows us to deliver actively managed funds and strategies to meet the needs of investors around the globe.
Thank you for choosing our family of funds.
Sincerely,

Stuart S. Parker, President
PGIM QMA Large-Cap Core Equity Fund
December 14, 2018
*The Prudential Day One Funds did not change their names.
| | | | |
| PGIM QMA Large-Cap Core Equity Fund | | | 7 | |
Your Fund’s Performance (unaudited)
Performance data quoted represents past performance. Past performance does not guarantee future results. The investment return and principal value of an investment will fluctuate, so that an investor’s shares, when redeemed, may be worth more or less than their original cost. Current performance may be lower or higher than the past performance data quoted. An investor may obtain performance data as of the most recent month-end by visiting our website at www.pgiminvestments.com or by calling (800) 225-1852.
| | | | | | | | | | | | | | |
| | | Average Annual Total Returns as of 10/31/18
(with sales charges)
| |
| | | One Year (%) | | Five Years (%) | | | Ten Years (%) | | | Since Inception (%) | |
| Class A | | –0.15 | | | 9.56 | | | | 11.57 | | | | — | |
| Class B | | 0.18 | | | 9.80 | | | | 11.35 | | | | — | |
| Class C | | 4.01 | | | 9.99 | | | | 11.38 | | | | — | |
| Class Z | | 5.98 | | | 11.08 | | | | 12.49 | | | | — | |
| Class R6* | | 6.10 | | | N/A | | | | N/A | | | | 12.52 (12/28/16) | |
| S&P 500 Index | |
| | 7.35 | | | 11.33 | | | | 13.23 | | | | — | |
| Lipper Large-Cap Core Funds Average | |
| | | 5.58 | | | 9.64 | | | | 12.06 | | | | — | |
| | | | | | | | | | | | | | |
| | | Average Annual Total Returns as of 10/31/18
(without sales charges) | |
| | | One Year (%) | | Five Years (%) | | | Ten Years (%) | | | Since Inception (%) | |
| Class A | | 5.67 | | | 10.81 | | | | 12.20 | | | | — | |
| Class B | | 4.67 | | | 9.94 | | | | 11.35 | | | | — | |
| Class C | | 4.91 | | | 9.99 | | | | 11.38 | | | | — | |
| Class Z | | 5.98 | | | 11.08 | | | | 12.49 | | | | — | |
| Class R6* | | 6.10 | | | N/A | | | | N/A | | | | 12.52 (12/28/16) | |
| S&P 500 Index | | | | | | | | | | | | | | |
| | 7.35 | | | 11.33 | | | | 13.23 | | | | — | |
| Lipper Large-Cap Core Funds Average | |
| | | 5.58 | | | 9.64 | | | | 12.06 | | | | — | |
| | |
| 8 | | Visit our website at pgiminvestments.com |
Growth of a $10,000 Investment (unaudited)
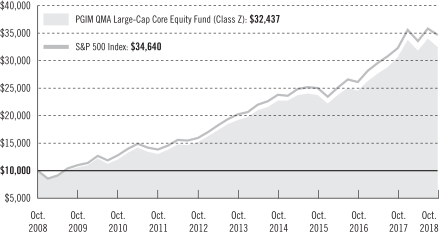
The graph compares a $10,000 investment in the Fund’s Class Z shares with a similar investment in the S&P 500 Index by portraying the initial account values at the beginning of the 10-year period for Class Z shares (October 31, 2008) and the account values at the end of the current fiscal year (October 31, 2018) as measured on a quarterly basis. For purposes of the graph, and unless otherwise indicated, it has been assumed that (a) all recurring fees (including management fees) were deducted; and (b) all dividends and distributions were reinvested. The line graph provides information for Class Z shares only. As indicated in the tables provided earlier, performance for other share classes will vary due to the differing charges and expenses applicable to each share class (as indicated in the following paragraphs). Without waiver of fees and/or expense reimbursements, if any, the Fund’s returns would have been lower.
Past performance does not predict future performance. Total returns and the ending account values in the graph include changes in share price and reinvestment of dividends and capital gains distributions in a hypothetical investment for the periods shown. The Fund’s total returns do not reflect the deduction of income taxes on an individual’s investment. Taxes may reduce your actual investment returns on income or gains paid by the Fund or any gains you may realize if you sell your shares.
Source: PGIM Investments LLC and Lipper Inc.
*Formerly known as Class Q shares.
Since Inception returns are provided for any share class with less than 10 fiscal years of returns. Since Inception returns for the Index and the Lipper Average are measured from the closest month-end to the class’ inception date.
| | | | |
| PGIM QMA Large-Cap Core Equity Fund | | | 9 | |
Your Fund’s Performance (continued)
The returns in the tables do not reflect the deduction of taxes that a shareholder would pay on Fund distributions or following the redemption of Fund shares. The average annual total returns take into account applicable sales charges, which are described for each share class in the table below.
| | | | | | | | | | |
| | | Class A | | Class B* | | Class C | | Class Z | | Class R6** |
| Maximum initial sales charge | | 5.50% of
the public
offering price | | None | | None | | None | | None |
| Contingent deferred sales charge (CDSC) (as a percentage of the lower of original purchase price or net asset value at redemption) | | 1.00% on sales of $1 million or more made within 12 months of purchase | | 5.00% (Yr. 1) 4.00% (Yr. 2) 3.00% (Yr. 3) 2.00% (Yr. 4) 1.00% (Yr. 5) 1.00% (Yr. 6) 0.00% (Yr. 7) | | 1.00% on sales made within 12 months of purchase | | None | | None |
| Annual distribution and service (12b-1) fees (shown as a percentage of average daily net assets) | | 0.30% (0.25% currently) | | 1.00% | | 1.00% | | None | | None |
*Class B shares are closed to all purchase activity and no additional Class B shares may be purchased or acquired except by exchange from Class B shares of another Fund or through dividend or capital gains reinvestment.
**Formerly known as Class Q shares.
Benchmark Definitions
S&P 500 Index—The S&P 500 Index is an unmanaged index of over 500 stocks of large US public companies. It gives a broad look at how stock prices in the United States have performed. The average annual total return for the Index measured from the month-end closest to the inception date of the Fund’s Class R6 shares is 13.18%.
Lipper Large-Cap Core Funds Average—The Lipper Large-Cap Core Funds Average (Lipper Average) is based on the average return of all funds in the Lipper Large-Cap Core Funds universe for the periods noted. Funds in the Lipper Average invest at least 75% of their equity assets in companies with market capitalizations (on a three-year weighted basis) greater than 300% of the dollar-weighted median market capitalization of the middle 1,000 securities of the S&P SuperComposite 1500 Index. Large-cap core funds have wide latitude in the companies in which they invest. These funds typically have a below-average price-to-earnings ratio, price-to-book ratio, and three-year sales-per-share-growth value compared with the S&P 500 Index. The average annual total return for the Lipper Average measured from the month-end closest to the inception date of the Fund’s Class R6 shares is 11.73%.
| | |
| 10 | | Visit our website at pgiminvestments.com |
Investors cannot invest directly in an index or average. The returns for the Index would be lower if they included the effects of sales charges, operating expenses of a mutual fund, or taxes. Returns for the Lipper Average reflect the deduction of operating expenses of a mutual fund, but not sales charges or taxes.
Presentation of Fund Holdings
| | |
Five Largest Holdings expressed as a
percentage of net assets as of 10/31/18 (%) |
| | | | |
| Apple, Inc., Technology Hardware, Storage & Peripherals | | | 3.9 | |
| Microsoft Corp., Software | | | 3.5 | |
| Amazon.com, Inc., Internet & Direct Marketing Retail | | | 2.4 | |
| JPMorgan Chase & Co., Banks | | | 2.2 | |
| Alphabet, Inc. (Class C Stock), Interactive Media & Services | | | 1.9 | |
Holdings reflect only long-term investments and are subject to change.
| | |
Five Largest Industries expressed as a
percentage of net assets as of 10/31/18 (%) |
| | | | |
| Software | | | 6.6 | |
| Oil, Gas & Consumable Fuels | | | 5.5 | |
| Pharmaceuticals | | | 5.4 | |
| Technology Hardware, Storage & Peripherals | | | 5.2 | |
| Banks | | | 5.1 | |
Industry weightings reflect only long-term investments and are subject to change.
| | | | |
| PGIM QMA Large-Cap Core Equity Fund | | | 11 | |
Strategy and Performance Overview (unaudited)
How did the Fund perform?
The PGIM QMA Large-Cap Core Equity Fund’s Class Z shares returned 5.98% for the 12-month reporting period that ended October 31, 2018, underperforming the 7.35% return of the S&P 500 Index. The Fund outperformed the 5.58% return of the Lipper Large-Cap Core Funds Average over the period.
What were the market conditions?
| • | | In December 2017, the US Congress passed a tax reform bill that cut corporate and individual tax rates. The US equity market surged thereafter but was choppy from late January 2018 into the end of the reporting period. |
| • | | Fiscal stimulus generated by the tax cuts translated into significant corporate earnings growth. Other solid fundamentals included continuing economic growth and robust employment. Meanwhile, though inflation remained benign, interest rates increased. |
| • | | Despite a favorable economic backdrop, US stocks generated only modestly positive returns during the reporting period, as geopolitical concerns arose. Anxiety regarding a global trade war emerged in March 2018 and subsequently intensified as the Trump administration threatened to impose multiple rounds of tariffs on Chinese goods. |
What worked?
| • | | The Fund is comprised of a diversified portfolio of stocks that QMA identifies as attractive using a proprietary quantitative model. The model evaluates stocks with regard to earnings expectations, quality, and relative value. Over the past year, favoring companies with improving earnings prospects helped performance, particularly in the health care sector. |
| • | | Favoring companies with good quality also helped performance over the past year. This was most evident in the energy sector, where high-quality stocks outperformed their poor-quality counterparts. |
| • | | We build the portfolio from the bottom up, and place limits on risks we do not believe will add value to the portfolio. For example, we keep the Fund’s sector weights close to those of the S&P 500 Index. During the period, our model’s risk controls were effective at keeping unwanted risk out of the portfolio. |
What didn’t work?
| • | | QMA favors stocks that are inexpensive relative to industry peers. The relative value strategy detracted from the Fund’s performance during the reporting period. In general, stocks that were more expensive based on measures like forward price-to-earnings, price-to-book, and price-to-sales ratios outperformed those that were attractively priced. |
| | |
| 12 | | Visit our website at pgiminvestments.com |
| • | | Stock selection in the consumer discretionary and information technology sectors lagged the S&P 500 Index. This was driven primarily by the underweighting of certain Internet-related companies that, despite having reasonable growth prospects, were very expensive relative to peers. These stocks continued to do well throughout the period, detracting from the Fund’s performance. |
Did the Fund hold derivatives, and how did they affect performance?
| • | | The Fund held futures contracts on the S&P 500 Index. QMA uses these instruments primarily to manage daily cash flows, provide liquidity, and equitize cash, and not as a means of adding to performance. Subsequently, the effect on performance was minimal. |
The percentage points shown in the tables below identify each security’s positive or negative contribution to the Fund’s return relative to the benchmark, which is the sum of all contributions by individual holdings.
| | | | | | |
| Top Contributors (%) | | Top Detractors (%) |
| General Electric Co. | | 0.47 | | Amazon.com, Inc. | | –0.58 |
| Philip Morris International, Inc. | | 0.35 | | Celgene Corp. | | –0.25 |
| Lululemon Athletica Inc. | | 0.25 | | Chemours Co. | | –0.23 |
| Macy’s, Inc. | | 0.24 | | Nutrisystem, Inc. | | –0.23 |
| DowDuPont, Inc. | | 0.20 | | Apple, Inc. | | –0.16 |
Current outlook
| • | | Investors tend to overreact to headline news, which provides opportunities for a disciplined approach. This overreaction was evident during the reporting period in the widening spread (or difference in price) between expensive and cheap stocks relative to earnings. In QMA’s view, this implies that valuation factors are underpriced and suggests the potential for solid returns to value factors in the future. |
| | | | |
| PGIM QMA Large-Cap Core Equity Fund | | | 13 | |
Fees and Expenses (unaudited)
As a shareholder of the Fund, you incur two types of costs: (1) transaction costs, including sales charges (loads) on purchase payments and redemptions, as applicable, and (2) ongoing costs, including management fees, distribution, and/or service (12b-1) fees, and other Fund expenses, as applicable. This example is intended to help you understand your ongoing costs (in dollars) of investing in the Fund and to compare these costs with the ongoing costs of investing in other mutual funds.
The example is based on an investment of $1,000 held through the six-month period ended October 31, 2018. The example is for illustrative purposes only; you should consult the Prospectus for information on initial and subsequent minimum investment requirements.
Actual Expenses
The first line for each share class in the table on the following page provides information about actual account values and actual expenses. You may use the information on this line, together with the amount you invested, to estimate the expenses that you paid over the period. Simply divide your account value by $1,000 (for example, an $8,600 account value ÷ $1,000 = 8.6), then multiply the result by the number on the first line under the heading “Expenses Paid During the Six-Month Period” to estimate the expenses you paid on your account during this period.
Hypothetical Example for Comparison Purposes
The second line for each share class in the table on the following page provides information about hypothetical account values and hypothetical expenses based on the Fund’s actual expense ratio and an assumed rate of return of 5% per year before expenses, which is not the Fund’s actual return. The hypothetical account values and expenses may not be used to estimate the actual ending account balance or expenses you paid for the period. You may use this information to compare the ongoing costs of investing in the Fund and other funds. To do so, compare this 5% hypothetical example with the 5% hypothetical examples that appear in the shareholder reports of the other funds.
The Fund’s transfer agent may charge additional fees to holders of certain accounts that are not included in the expenses shown in the table on the following page. These fees apply to individual retirement accounts (IRAs) and Section 403(b) accounts. As of the close of the six-month period covered by the table, IRA fees included an annual maintenance fee of $15 per account (subject to a maximum annual maintenance fee of $25 for all accounts held by the same shareholder). Section 403(b) accounts are charged an annual $25 fiduciary maintenance fee. Some of the fees may vary in amount, or may be waived, based on your total account balance or the number of PGIM funds, including the Fund, that you own. You should consider the additional fees that were charged to your Fund account over the six-month period when you estimate the total ongoing expenses paid over the period
| | |
| 14 | | Visit our website at pgiminvestments.com |
and the impact of these fees on your ending account value, as these additional expenses are not reflected in the information provided in the expense table. Additional fees have the effect of reducing investment returns.
Please note that the expenses shown in the table are meant to highlight your ongoing costs only and do not reflect any transactional costs such as sales charges (loads). Therefore, the second line for each share class in the table is useful in comparing ongoing costs only and will not help you determine the relative total costs of owning different funds. In addition, if these transactional costs were included, your costs would have been higher.
| | | | | | | | | | | | | | | | | | |
PGIM QMA
Large-Cap Core
Equity Fund | | Beginning Account
Value
May 1, 2018 | | | Ending Account
Value
October 31, 2018 | | | Annualized
Expense Ratio
Based on the
Six-Month Period | | | Expenses Paid
During the
Six-Month Period* | |
| Class A | | Actual | | $ | 1,000.00 | | | $ | 1,018.80 | | | | 0.72 | % | | $ | 3.66 | |
| | Hypothetical | | $ | 1,000.00 | | | $ | 1,021.58 | | | | 0.72 | % | | $ | 3.67 | |
| Class B | | Actual | | $ | 1,000.00 | | | $ | 1,014.10 | | | | 1.65 | % | | $ | 8.38 | |
| | Hypothetical | | $ | 1,000.00 | | | $ | 1,016.89 | | | | 1.65 | % | | $ | 8.39 | |
| Class C | | Actual | | $ | 1,000.00 | | | $ | 1,014.70 | | | | 1.43 | % | | $ | 7.26 | |
| | Hypothetical | | $ | 1,000.00 | | | $ | 1,018.00 | | | | 1.43 | % | | $ | 7.27 | |
| Class Z | | Actual | | $ | 1,000.00 | | | $ | 1,020.20 | | | | 0.47 | % | | $ | 2.39 | |
| | Hypothetical | | $ | 1,000.00 | | | $ | 1,022.84 | | | | 0.47 | % | | $ | 2.40 | |
| Class R6** | | Actual | | $ | 1,000.00 | | | $ | 1,020.70 | | | | 0.35 | % | | $ | 1.78 | |
| | | Hypothetical | | $ | 1,000.00 | | | $ | 1,023.44 | | | | 0.35 | % | | $ | 1.79 | |
*Fund expenses (net of fee waivers or subsidies, if any) for each share class are equal to the annualized expense ratio for each share class (provided in the table), multiplied by the average account value over the period, multiplied by the 184 days in the six-month period ended October 31, 2018, and divided by the 365 days in the Fund’s fiscal year ended October 31, 2018 (to reflect the six-month period). Expenses presented in the table include the expenses of any underlying portfolios in which the Fund may invest.
**Formerly known as Class Q shares.
| | | | |
| PGIM QMA Large-Cap Core Equity Fund | | | 15 | |
Schedule of Investments
as of October 31, 2018
| | | | | | | | |
| Description | | Shares | | | Value | |
LONG-TERM INVESTMENTS 96.9% | | | | | | | | |
| | |
COMMON STOCKS | | | | | | | | |
| | |
Aerospace & Defense 2.0% | | | | | | | | |
Lockheed Martin Corp. | | | 7,500 | | | $ | 2,203,875 | |
Raytheon Co. | | | 10,450 | | | | 1,829,168 | |
United Technologies Corp. | | | 11,200 | | | | 1,391,152 | |
Vectrus, Inc.* | | | 5,350 | | | | 143,380 | |
| | | | | | | | |
| | | | | | | 5,567,575 | |
| | |
Air Freight & Logistics 0.8% | | | | | | | | |
United Parcel Service, Inc. (Class B Stock) | | | 20,100 | | | | 2,141,454 | |
| | |
Auto Components 0.1% | | | | | | | | |
Garrett Motion, Inc. (Switzerland)* | | | 1,860 | | | | 28,216 | |
Tenneco, Inc. (Class A Stock) | | | 6,400 | | | | 220,352 | |
| | | | | | | | |
| | | | | | | 248,568 | |
| | |
Banks 5.1% | | | | | | | | |
Bank of America Corp. | | | 98,968 | | | | 2,721,620 | |
BB&T Corp. | | | 8,600 | | | | 422,776 | |
Citigroup, Inc. | | | 50,300 | | | | 3,292,638 | |
JPMorgan Chase & Co. | | | 56,500 | | | | 6,159,630 | |
Synovus Financial Corp. | | | 8,700 | | | | 326,772 | |
Wells Fargo & Co. | | | 21,100 | | | | 1,123,153 | |
| | | | | | | | |
| | | | | | | 14,046,589 | |
| | |
Beverages 1.2% | | | | | | | | |
PepsiCo, Inc. | | | 30,244 | | | | 3,398,821 | |
| | |
Biotechnology 2.4% | | | | | | | | |
Amgen, Inc. | | | 700 | | | | 134,953 | |
Biogen, Inc.* | | | 1,200 | | | | 365,124 | |
Celgene Corp.* | | | 26,600 | | | | 1,904,560 | |
Gilead Sciences, Inc. | | | 34,900 | | | | 2,379,482 | |
Vertex Pharmaceuticals, Inc.* | | | 11,300 | | | | 1,914,898 | |
| | | | | | | | |
| | | | | | | 6,699,017 | |
| | |
Building Products 0.5% | | | | | | | | |
Armstrong World Industries, Inc.* | | | 7,000 | | | | 432,250 | |
Masco Corp. | | | 7,800 | | | | 234,000 | |
See Notes to Financial Statements.
| | | | |
| PGIM QMA Large-Cap Core Equity Fund | | | 17 | |
Schedule of Investments (continued)
as of October 31, 2018
| | | | | | | | |
| Description | | Shares | | | Value | |
COMMON STOCKS (Continued) | | | | | | | | |
| | |
Building Products (cont’d.) | | | | | | | | |
Resideo Technologies, Inc.* | | | 3,100 | | | $ | 65,255 | |
Universal Forest Products, Inc. | | | 19,100 | | | | 539,957 | |
| | | | | | | | |
| | | | | | | 1,271,462 | |
| | |
Capital Markets 1.9% | | | | | | | | |
Ameriprise Financial, Inc. | | | 11,750 | | | | 1,495,070 | |
Goldman Sachs Group, Inc. (The) | | | 6,750 | | | | 1,521,247 | |
Morgan Stanley | | | 10,750 | | | | 490,845 | |
Raymond James Financial, Inc. | | | 4,800 | | | | 368,112 | |
State Street Corp. | | | 12,550 | | | | 862,812 | |
T. Rowe Price Group, Inc. | | | 5,450 | | | | 528,596 | |
| | | | | | | | |
| | | | | | | 5,266,682 | |
| | |
Chemicals 1.5% | | | | | | | | |
Eastman Chemical Co. | | | 17,600 | | | | 1,378,960 | |
Huntsman Corp. | | | 29,350 | | | | 642,178 | |
LyondellBasell Industries NV (Class A Stock) | | | 3,900 | | | | 348,153 | |
Sherwin-Williams Co. (The) | | | 4,300 | | | | 1,691,921 | |
| | | | | | | | |
| | | | | | | 4,061,212 | |
| | |
Communications Equipment 1.9% | | | | | | | | |
Arista Networks, Inc.* | | | 3,400 | | | | 783,190 | |
Cisco Systems, Inc. | | | 89,550 | | | | 4,096,912 | |
CommScope Holding Co., Inc.* | | | 10,700 | | | | 257,442 | |
Plantronics, Inc. | | | 300 | | | | 17,691 | |
| | | | | | | | |
| | | | | | | 5,155,235 | |
| | |
Construction & Engineering 0.2% | | | | | | | | |
EMCOR Group, Inc. | | | 5,850 | | | | 415,233 | |
Quanta Services, Inc.* | | | 7,400 | | | | 230,880 | |
| | | | | | | | |
| | | | | | | 646,113 | |
| | |
Consumer Finance 1.3% | | | | | | | | |
American Express Co. | | | 7,200 | | | | 739,656 | |
Capital One Financial Corp. | | | 20,750 | | | | 1,852,975 | |
Discover Financial Services | | | 3,950 | | | | 275,196 | |
See Notes to Financial Statements.
| | | | | | | | |
| Description | | Shares | | | Value | |
COMMON STOCKS (Continued) | | | | | | | | |
| | |
Consumer Finance (cont’d.) | | | | | | | | |
Navient Corp. | | | 10,200 | | | $ | 118,116 | |
OneMain Holdings, Inc.* | | | 23,350 | | | | 665,942 | |
| | | | | | | | |
| | | | | | | 3,651,885 | |
| | |
Containers & Packaging 0.4% | | | | | | | | |
Avery Dennison Corp. | | | 4,800 | | | | 435,456 | |
Greif, Inc. (Class A Stock) | | | 1,700 | | | | 80,410 | |
WestRock Co. | | | 15,100 | | | | 648,847 | |
| | | | | | | | |
| | | | | | | 1,164,713 | |
| | |
Distributors 0.1% | | | | | | | | |
Core-Mark Holding Co., Inc. | | | 2,700 | | | | 103,707 | |
| | |
Diversified Financial Services 1.1% | | | | | | | | |
Berkshire Hathaway, Inc. (Class B Stock)* | | | 12,900 | | | | 2,648,112 | |
Jefferies Financial Group, Inc. | | | 21,600 | | | | 463,752 | |
| | | | | | | | |
| | | | | | | 3,111,864 | |
| | |
Diversified Telecommunication Services 2.8% | | | | | | | | |
AT&T, Inc. | | | 124,154 | | | | 3,809,045 | |
Verizon Communications, Inc. | | | 68,250 | | | | 3,896,392 | |
| | | | | | | | |
| | | | | | | 7,705,437 | |
| | |
Electric Utilities 1.1% | | | | | | | | |
Entergy Corp. | | | 2,200 | | | | 184,690 | |
Eversource Energy | | | 8,650 | | | | 547,199 | |
Exelon Corp. | | | 47,750 | | | | 2,091,928 | |
Portland General Electric Co. | | | 6,500 | | | | 293,020 | |
| | | | | | | | |
| | | | | | | 3,116,837 | |
| | |
Electrical Equipment 0.5% | | | | | | | | |
AMETEK, Inc. | | | 6,450 | | | | 432,666 | |
Atkore International Group, Inc.* | | | 27,200 | | | | 523,872 | |
Emerson Electric Co. | | | 3,900 | | | | 264,732 | |
Encore Wire Corp. | | | 2,600 | | | | 114,920 | |
| | | | | | | | |
| | | | | | | 1,336,190 | |
See Notes to Financial Statements.
| | | | |
| PGIM QMA Large-Cap Core Equity Fund | | | 19 | |
Schedule of Investments (continued)
as of October 31, 2018
| | | | | | | | |
| Description | | Shares | | | Value | |
COMMON STOCKS (Continued) | | | | | | | | |
| | |
Electronic Equipment, Instruments & Components 0.3% | | | | | | | | |
Anixter International, Inc.* | | | 5,300 | | | $ | 348,157 | |
CDW Corp. | | | 4,050 | | | | 364,541 | |
Tech Data Corp.* | | | 900 | | | | 63,594 | |
| | | | | | | | |
| | | | | | | 776,292 | |
| | |
Energy Equipment & Services 0.2% | | | | | | | | |
Exterran Corp.* | | | 8,100 | | | | 169,209 | |
Superior Energy Services, Inc.* | | | 31,400 | | | | 245,862 | |
| | | | | | | | |
| | | | | | | 415,071 | |
| | |
Entertainment 1.3% | | | | | | | | |
Activision Blizzard, Inc. | | | 29,150 | | | | 2,012,807 | |
Marcus Corp. (The) | | | 6,200 | | | | 241,924 | |
Twenty-First Century Fox, Inc. (Class A Stock) | | | 13,400 | | | | 609,968 | |
Viacom, Inc. (Class B Stock) | | | 22,350 | | | | 714,753 | |
| | | | | | | | |
| | | | | | | 3,579,452 | |
| | |
Equity Real Estate Investment Trusts (REITs) 1.8% | | | | | | | | |
Apple Hospitality REIT, Inc. | | | 18,350 | | | | 296,720 | |
CoreCivic, Inc. | | | 12,150 | | | | 272,889 | |
Gaming & Leisure Properties, Inc. | | | 5,200 | | | | 175,188 | |
GEO Group, Inc. (The) | | | 17,050 | | | | 376,975 | |
Host Hotels & Resorts, Inc., REIT | | | 76,600 | | | | 1,463,826 | |
Park Hotels & Resorts, Inc., REIT | | | 2,800 | | | | 81,396 | |
Prologis, Inc., REIT | | | 7,800 | | | | 502,866 | |
Ryman Hospitality Properties, Inc. | | | 4,650 | | | | 360,793 | |
Spirit MTA REIT | | | 4,560 | | | | 48,838 | |
Spirit Realty Capital, Inc. | | | 67,300 | | | | 526,286 | |
Xenia Hotels & Resorts, Inc. | | | 42,300 | | | | 869,265 | |
| | | | | | | | |
| | | | | | | 4,975,042 | |
| | |
Food & Staples Retailing 0.9% | | | | | | | | |
Walgreens Boots Alliance, Inc. | | | 29,350 | | | | 2,341,250 | |
| | |
Food Products 1.7% | | | | | | | | |
Archer-Daniels-Midland Co. | | | 37,550 | | | | 1,774,237 | |
Hershey Co. (The) | | | 800 | | | | 85,720 | |
See Notes to Financial Statements.
| | | | | | | | |
| Description | | Shares | | | Value | |
COMMON STOCKS (Continued) | | | | | | | | |
| | |
Food Products (cont’d.) | | | | | | | | |
Kraft Heinz Co. (The) | | | 33,100 | | | $ | 1,819,507 | |
Tyson Foods, Inc. (Class A Stock) | | | 18,400 | | | | 1,102,527 | |
| | | | | | | | |
| | | | | | | 4,781,991 | |
| | |
Gas Utilities 0.2% | | | | | | | | |
UGI Corp. | | | 11,450 | | | | 607,537 | |
| | |
Health Care Equipment & Supplies 3.5% | | | | | | | | |
Abbott Laboratories | | | 43,600 | | | | 3,005,784 | |
Align Technology, Inc.* | | | 800 | | | | 176,960 | |
Baxter International, Inc. | | | 11,200 | | | | 700,112 | |
Danaher Corp. | | | 17,950 | | | | 1,784,230 | |
Edwards Lifesciences Corp.* | | | 3,350 | | | | 494,460 | |
IDEXX Laboratories, Inc.* | | | 3,800 | | | | 806,056 | |
Intuitive Surgical, Inc.* | | | 1,600 | | | | 833,888 | |
Medtronic PLC | | | 18,200 | | | | 1,634,724 | |
Stryker Corp. | | | 1,800 | | | | 291,996 | |
| | | | | | | | |
| | | | | | | 9,728,210 | |
| | |
Health Care Providers & Services 3.0% | | | | | | | | |
Anthem, Inc. | | | 800 | | | | 220,456 | |
HCA Healthcare, Inc. | | | 16,400 | | | | 2,189,892 | |
Humana, Inc. | | | 4,150 | | | | 1,329,701 | |
UnitedHealth Group, Inc. | | | 16,900 | | | | 4,416,815 | |
| | | | | | | | |
| | | | | | | 8,156,864 | |
| | |
Hotels, Restaurants & Leisure 0.9% | | | | | | | | |
Biglari Holdings, Inc. (Class A Stock)* | | | 20 | | | | 15,000 | |
Biglari Holdings, Inc. (Class B Stock)* | | | 200 | | | | 28,500 | |
Bloomin’ Brands, Inc. | | | 9,300 | | | | 185,535 | |
Churchill Downs, Inc. | | | 400 | | | | 99,844 | |
Darden Restaurants, Inc. | | | 5,200 | | | | 554,060 | |
Extended Stay America, Inc., UTS | | | 25,000 | | | | 407,000 | |
Hilton Grand Vacations, Inc.* | | | 16,400 | | | | 440,668 | |
Las Vegas Sands Corp. | | | 6,200 | | | | 316,386 | |
Marriott International, Inc. (Class A Stock) | | | 850 | | | | 99,357 | |
Penn National Gaming, Inc.* | | | 7,200 | | | | 174,816 | |
| | | | | | | | |
| | | | | | | 2,321,166 | |
See Notes to Financial Statements.
| | | | |
| PGIM QMA Large-Cap Core Equity Fund | | | 21 | |
Schedule of Investments (continued)
as of October 31, 2018
| | | | | | | | |
| Description | | Shares | | | Value | |
COMMON STOCKS (Continued) | | | | | | | | |
| | |
Household Durables 0.1% | | | | | | | | |
Meritage Homes Corp.* | | | 8,700 | | | $ | 324,075 | |
| | |
Household Products 1.0% | | | | | | | | |
Procter & Gamble Co. (The) | | | 30,564 | | | | 2,710,416 | |
| | |
Independent Power & Renewable Electricity Producers 0.8% | | | | | | | | |
AES Corp. | | | 86,850 | | | | 1,266,273 | |
NRG Energy, Inc. | | | 28,600 | | | | 1,035,034 | |
| | | | | | | | |
| | | | | | | 2,301,307 | |
| | |
Industrial Conglomerates 1.0% | | | | | | | | |
Honeywell International, Inc. | | | 18,600 | | | | 2,693,652 | |
| | |
Insurance 1.9% | | | | | | | | |
Allstate Corp. (The) | | | 14,100 | | | | 1,349,652 | |
American International Group, Inc. | | | 25,600 | | | | 1,057,024 | |
CNA Financial Corp. | | | 700 | | | | 30,359 | |
Lincoln National Corp. | | | 9,300 | | | | 559,767 | |
Loews Corp. | | | 4,100 | | | | 190,896 | |
MetLife, Inc. | | | 44,050 | | | | 1,814,419 | |
Unum Group | | | 3,550 | | | | 128,723 | |
| | | | | | | | |
| | | | | | | 5,130,840 | |
| | |
Interactive Media & Services 4.9% | | | | | | | | |
Alphabet, Inc. (Class A Stock)* | | | 3,520 | | | | 3,838,842 | |
Alphabet, Inc. (Class C Stock)* | | | 4,827 | | | | 5,197,569 | |
Facebook, Inc. (Class A Stock)* | | | 29,750 | | | | 4,515,752 | |
| | | | | | | | |
| | | | | | | 13,552,163 | |
| | |
Internet & Direct Marketing Retail 2.7% | | | | | | | | |
Amazon.com, Inc.* | | | 4,120 | | | | 6,583,801 | |
eBay, Inc.* | | | 12,250 | | | | 355,618 | |
Qurate Retail, Inc.* | | | 23,500 | | | | 515,590 | |
| | | | | | | | |
| | | | | | | 7,455,009 | |
| | |
IT Services 4.2% | | | | | | | | |
Accenture PLC (Class A Stock) | | | 13,050 | | | | 2,056,941 | |
Automatic Data Processing, Inc. | | | 15,600 | | | | 2,247,648 | |
Cognizant Technology Solutions Corp. (Class A Stock) | | | 25,900 | | | | 1,787,877 | |
See Notes to Financial Statements.
| | | | | | | | |
| Description | | Shares | | | Value | |
COMMON STOCKS (Continued) | | | | | | | | |
| | |
IT Services (cont’d.) | | | | | | | | |
DXC Technology Co. | | | 19,100 | | | $ | 1,391,053 | |
VeriSign, Inc.* | | | 4,900 | | | | 698,446 | |
Visa, Inc. (Class A Stock) | | | 25,400 | | | | 3,501,390 | |
| | | | | | | | |
| | | | | | | 11,683,355 | |
| | |
Leisure Products 0.1% | | | | | | | | |
Johnson Outdoors, Inc. (Class A Stock) | | | 1,500 | | | | 112,965 | |
Vista Outdoor, Inc.* | | | 20,450 | | | | 255,625 | |
| | | | | | | | |
| | | | | | | 368,590 | |
| | |
Life Sciences Tools & Services 1.0% | | | | | | | | |
Illumina, Inc.* | | | 7,600 | | | | 2,364,740 | |
Thermo Fisher Scientific, Inc. | | | 1,600 | | | | 373,840 | |
| | | | | | | | |
| | | | | | | 2,738,580 | |
| | |
Machinery 1.2% | | | | | | | | |
Caterpillar, Inc. | | | 12,800 | | | | 1,552,896 | |
Cummins, Inc. | | | 10,950 | | | | 1,496,755 | |
Pentair PLC (United Kingdom) | | | 8,800 | | | | 353,320 | |
| | | | | | | | |
| | | | | | | 3,402,971 | |
| | |
Media 1.6% | | | | | | | | |
Comcast Corp. (Class A Stock) | | | 94,100 | | | | 3,588,974 | |
News Corp. (Class A Stock) | | | 24,850 | | | | 327,771 | |
Tribune Media Co. (Class A Stock) | | | 13,800 | | | | 524,538 | |
| | | | | | | | |
| | | | | | | 4,441,283 | |
| | |
Metals & Mining 0.5% | | | | | | | | |
Alcoa Corp.* | | | 1,950 | | | | 68,231 | |
Freeport-McMoRan, Inc. | | | 114,950 | | | | 1,339,167 | |
| | | | | | | | |
| | | | | | | 1,407,398 | |
| | |
Mortgage Real Estate Investment Trusts (REITs) 0.5% | | | | | | | | |
Ladder Capital Corp. | | | 67,300 | | | | 1,133,332 | |
Two Harbors Investment Corp. | | | 21,000 | | | | 308,490 | |
| | | | | | | | |
| | | | | | | 1,441,822 | |
See Notes to Financial Statements.
| | | | |
| PGIM QMA Large-Cap Core Equity Fund | | | 23 | |
Schedule of Investments (continued)
as of October 31, 2018
| | | | | | | | |
| Description | | Shares | | | Value | |
COMMON STOCKS (Continued) | | | | | | | | |
| | |
Multiline Retail 1.3% | | | | | | | | |
Dollar General Corp. | | | 1,400 | | | $ | 155,932 | |
Kohl’s Corp. | | | 22,050 | | | | 1,669,846 | |
Macy’s, Inc. | | | 47,950 | | | | 1,644,206 | |
Nordstrom, Inc. | | | 2,200 | | | | 144,694 | |
| | | | | | | | |
| | | | | | | 3,614,678 | |
| | |
Multi-Utilities 0.2% | | | | | | | | |
CenterPoint Energy, Inc. | | | 8,550 | | | | 230,936 | |
MDU Resources Group, Inc. | | | 13,250 | | | | 330,720 | |
| | | | | | | | |
| | | | | | | 561,656 | |
| | |
Oil, Gas & Consumable Fuels 5.5% | | | | | | | | |
Anadarko Petroleum Corp. | | | 30,700 | | | | 1,633,240 | |
Chevron Corp. | | | 5,350 | | | | 597,328 | |
ConocoPhillips | | | 38,350 | | | | 2,680,665 | |
Continental Resources, Inc.* | | | 15,700 | | | | 827,076 | |
Exxon Mobil Corp. | | | 13,974 | | | | 1,113,448 | |
Hess Corp. | | | 16,300 | | | | 935,620 | |
Kinder Morgan, Inc. | | | 75,700 | | | | 1,288,414 | |
Marathon Oil Corp. | | | 4,500 | | | | 85,455 | |
Marathon Petroleum Corp. | | | 24,900 | | | | 1,754,205 | |
Murphy Oil Corp. | | | 9,500 | | | | 302,670 | |
Phillips 66 | | | 18,100 | | | | 1,861,042 | |
Valero Energy Corp. | | | 21,450 | | | | 1,953,880 | |
World Fuel Services Corp. | | | 3,200 | | | | 102,400 | |
| | | | | | | | |
| | | | | | | 15,135,443 | |
| | |
Personal Products 0.6% | | | | | | | | |
Herbalife Nutrition Ltd.* | | | 18,850 | | | | 1,003,951 | |
Nu Skin Enterprises, Inc. (Class A Stock) | | | 4,900 | | | | 344,078 | |
USANA Health Sciences, Inc.* | | | 2,750 | | | | 321,805 | |
| | | | | | | | |
| | | | | | | 1,669,834 | |
| | |
Pharmaceuticals 5.4% | | | | | | | | |
Allergan PLC | | | 12,150 | | | | 1,919,822 | |
Bristol-Myers Squibb Co. | | | 30,150 | | | | 1,523,781 | |
Eli Lilly & Co. | | | 13,100 | | | | 1,420,564 | |
Johnson & Johnson | | | 26,449 | | | | 3,702,596 | |
Merck & Co., Inc. | | | 35,950 | | | | 2,646,279 | |
See Notes to Financial Statements.
| | | | | | | | |
| Description | | Shares | | | Value | |
COMMON STOCKS (Continued) | | | | | | | | |
| | |
Pharmaceuticals (cont’d.) | | | | | | | | |
Pfizer, Inc. | | | 64,084 | | | $ | 2,759,457 | |
Zoetis, Inc. | | | 10,700 | | | | 964,605 | |
| | | | | | | | |
| | | | | | | 14,937,104 | |
| | |
Professional Services 0.4% | | | | | | | | |
Heidrick & Struggles International, Inc. | | | 8,300 | | | | 286,433 | |
Insperity, Inc. | | | 3,350 | | | | 367,998 | |
Korn/Ferry International | | | 3,000 | | | | 135,420 | |
Robert Half International, Inc. | | | 6,300 | | | | 381,339 | |
| | | | | | | | |
| | | | | | | 1,171,190 | |
| | |
Real Estate Management & Development 0.5% | | | | | | | | |
CBRE Group, Inc. (Class A Stock)* | | | 36,650 | | | | 1,476,629 | |
| | |
Road & Rail 1.6% | | | | | | | | |
CSX Corp. | | | 30,600 | | | | 2,107,116 | |
Norfolk Southern Corp. | | | 13,150 | | | | 2,206,964 | |
| | | | | | | | |
| | | | | | | 4,314,080 | |
| | |
Semiconductors & Semiconductor Equipment 3.0% | | | | | | | | |
Analog Devices, Inc. | | | 19,050 | | | | 1,594,675 | |
Cypress Semiconductor Corp. | | | 20,400 | | | | 263,976 | |
Intel Corp. | | | 85,800 | | | | 4,022,304 | |
Micron Technology, Inc.* | | | 30,550 | | | | 1,152,346 | |
NVIDIA Corp. | | | 150 | | | | 31,625 | |
Qorvo, Inc.* | | | 7,300 | | | | 536,623 | |
Texas Instruments, Inc. | | | 6,800 | | | | 631,244 | |
| | | | | | | | |
| | | | | | | 8,232,793 | |
| | |
Software 6.6% | | | | | | | | |
Adobe, Inc.* | | | 11,650 | | | | 2,863,104 | |
Aspen Technology, Inc.* | | | 12,700 | | | | 1,078,103 | |
Cadence Design Systems, Inc.* | | | 9,800 | | | | 436,786 | |
Fortinet, Inc.* | | | 5,700 | | | | 468,426 | |
Microsoft Corp. | | | 90,800 | | | | 9,698,348 | |
Oracle Corp. | | | 44,400 | | | | 2,168,496 | |
Synopsys, Inc.* | | | 16,600 | | | | 1,486,198 | |
| | | | | | | | |
| | | | | | | 18,199,461 | |
See Notes to Financial Statements.
| | | | |
| PGIM QMA Large-Cap Core Equity Fund | | | 25 | |
Schedule of Investments (continued)
as of October 31, 2018
| | | | | | | | |
| Description | | Shares | | | Value | |
COMMON STOCKS (Continued) | | | | | | | | |
| | |
Specialty Retail 3.0% | | | | | | | | |
Advance Auto Parts, Inc. | | | 2,200 | | | $ | 351,472 | |
Asbury Automotive Group, Inc.* | | | 4,000 | | | | 260,400 | |
AutoNation, Inc.* | | | 3,650 | | | | 147,752 | |
Dick’s Sporting Goods, Inc. | | | 12,900 | | | | 456,273 | |
Foot Locker, Inc. | | | 27,200 | | | | 1,282,208 | |
Gap, Inc. (The) | | | 22,900 | | | | 625,170 | |
Home Depot, Inc. (The) | | | 16,500 | | | | 2,902,020 | |
TJX Cos., Inc. (The) | | | 21,100 | | | | 2,318,468 | |
| | | | | | | | |
| | | | | | | 8,343,763 | |
| | |
Technology Hardware, Storage & Peripherals 5.2% | | | | | | | | |
Apple, Inc. | | | 49,120 | | | | 10,750,403 | |
Hewlett Packard Enterprise Co. | | | 109,150 | | | | 1,664,538 | |
HP, Inc. | | | 82,300 | | | | 1,986,722 | |
| | | | | | | | |
| | | | | | | 14,401,663 | |
| | |
Textiles, Apparel & Luxury Goods 1.5% | | | | | | | | |
Hanesbrands, Inc. | | | 40,100 | | | | 688,116 | |
NIKE, Inc. (Class B Stock) | | | 29,400 | | | | 2,206,176 | |
VF Corp. | | | 11,250 | | | | 932,400 | |
Wolverine World Wide, Inc. | | | 7,500 | | | | 263,775 | |
| | | | | | | | |
| | | | | | | 4,090,467 | |
| | |
Thrifts & Mortgage Finance 0.5% | | | | | | | | |
Radian Group, Inc. | | | 71,800 | | | | 1,377,842 | |
| | |
Tobacco 1.0% | | | | | | | | |
Philip Morris International, Inc. | | | 31,500 | | | | 2,774,205 | |
| | |
Trading Companies & Distributors 0.3% | | | | | | | | |
United Rentals, Inc.* | | | 1,700 | | | | 204,119 | |
WESCO International, Inc.* | | | 9,100 | | | | 456,638 | |
| | | | | | | | |
| | | | | | | 660,757 | |
See Notes to Financial Statements.
| | | | | | | | | | | | | | | | |
| Description | | | | | | | | Shares | | | Value | |
COMMON STOCKS (Continued) | | | | | | | | | | | | | | | | |
| | | | |
Transportation Infrastructure 0.1% | | | | | | | | | | | | | | | | |
Macquarie Infrastructure Corp. | | | | | | | | | | | 6,800 | | | $ | 251,260 | |
| | | | | | | | | | | | | | | | |
TOTAL LONG-TERM INVESTMENTS
(cost $227,399,819) | | | | | | | | | | | | | | | 267,240,522 | |
| | | | | | | | | | | | | | | | |
| | |
SHORT-TERM INVESTMENTS 2.9% | | | | | | | | | |
| | |
AFFILIATED MUTUAL FUND 2.7% | | | | | | | | | |
PGIM Core Ultra Short Bond Fund
(cost $7,609,208)(w) | | | | | | | | | | | 7,609,208 | | | | 7,609,208 | |
| | | | | | | | | | | | | | | | |
| | | | |
| | | Interest
Rate | | | Maturity
Date | | | Principal
Amount (000)# | | | | |
U.S. TREASURY OBLIGATION 0.2% | | | | | | | | | | | | | | | | |
U.S. Treasury Bill(k)(n)
(cost $448,694) | | | 2.168 | % | | | 12/20/18 | | | | 450 | | | | 448,684 | |
| | | | | | | | | | | | | | | | |
TOTAL SHORT-TERM INVESTMENTS
(cost $8,057,902) | | | | | | | | 8,057,892 | |
| | | | | | | | | | | | | | | | |
TOTAL INVESTMENTS 99.8%
(cost $235,457,721) | | | | | | | | 275,298,414 | |
Other assets in excess of liabilities(z) 0.2% | | | | | | | | 535,274 | |
| | | | | | | | | | | | | | | | |
NET ASSETS 100.0% | | | | | | | $ | 275,833,688 | |
| | | | | | | | | | | | | | | | |
The following abbreviations are used in the annual report:
LIBOR—London Interbank Offered Rate
REITs—Real Estate Investment Trusts
UTS—Unit Trust Security
| * | Non-income producing security. |
| # | Principal amount is shown in U.S. dollars unless otherwise stated. |
| (k) | Represents security, or a portion thereof, segregated as collateral for centrally cleared/exchange-traded derivatives. |
| (n) | Rate shown reflects yield to maturity at purchased date. |
| (w) | PGIM Investments LLC, the manager of the Fund, also serves as manager of the PGIM Core Ultra Short Bond Fund. |
| (z) | Includes net unrealized appreciation/(depreciation) and/or market value of the below holdings which are excluded from the Schedule of Investments: |
See Notes to Financial Statements.
| | | | |
| PGIM QMA Large-Cap Core Equity Fund | | | 27 | |
Schedule of Investments (continued)
as of October 31, 2018
Futures contracts outstanding at October 31, 2018:
| | | | | | | | | | | | | | | | |
Number of
Contracts | | | Type | | Expiration
Date | | | Current
Notional
Amount | | | Value /
Unrealized
Appreciation
(Depreciation) | |
| | | | Long Position: | | | | | | | | | | | | |
| | 58 | | | S&P 500 E-Mini Index | | | Dec. 2018 | | | $ | 7,862,190 | | | $ | (214,278 | ) |
| | | | | | | | | | | | | | | | |
Summary of Collateral for Centrally Cleared/Exchange-traded Derivatives:
Cash and securities segregated as collateral to cover requirements for open centrally cleared/exchange-traded derivatives are listed by broker as follows:
| | | | | | | | |
Broker | | Cash and/or
Foreign Currency | | | Securities
Market Value | |
| Goldman Sachs & Co. | | $ | — | | | $ | 448,684 | |
| | | | | | | | |
Fair Value Measurements:
Various inputs are used in determining the value of the Fund’s investments. These inputs are summarized in the three broad levels listed below.
Level 1—unadjusted quoted prices generally in active markets for identical securities.
Level 2—quoted prices for similar securities, interest rates and yield curves, prepayment speeds, foreign currency exchange rates and other observable inputs.
Level 3—unobservable inputs for securities valued in accordance with Board approved fair valuation procedures.
The following is a summary of the inputs used as of October 31, 2018 in valuing such portfolio securities:
| | | | | | | | | | | | |
| | | Level 1 | | | Level 2 | | | Level 3 | |
Investments in Securities | | | | | | | | | | | | |
Common Stocks | | | | | | | | | | | | |
Aerospace & Defense | | $ | 5,567,575 | | | $ | — | | | $ | — | |
Air Freight & Logistics | | | 2,141,454 | | | | — | | | | — | |
Auto Components | | | 248,568 | | | | — | | | | — | |
Banks | | | 14,046,589 | | | | — | | | | — | |
Beverages | | | 3,398,821 | | | | — | | | | — | |
Biotechnology | | | 6,699,017 | | | | — | | | | — | |
Building Products | | | 1,271,462 | | | | — | | | | — | |
Capital Markets | | | 5,266,682 | | | | — | | | | — | |
Chemicals | | | 4,061,212 | | | | — | | | | — | |
Communications Equipment | | | 5,155,235 | | | | — | | | | — | |
Construction & Engineering | | | 646,113 | | | | — | | | | — | |
Consumer Finance | | | 3,651,885 | | | | — | | | | — | |
Containers & Packaging | | | 1,164,713 | | | | — | | | | — | |
Distributors | | | 103,707 | | | | — | | | | — | |
See Notes to Financial Statements.
| | | | | | | | | | | | |
| | | Level 1 | | | Level 2 | | | Level 3 | |
Investments in Securities (continued) | | | | | | | | | | | | |
Common Stocks (continued) | | | | | | | | | | | | |
Diversified Financial Services | | $ | 3,111,864 | | | $ | — | | | $ | — | |
Diversified Telecommunication Services | | | 7,705,437 | | | | — | | | | — | |
Electric Utilities | | | 3,116,837 | | | | �� | | | | — | |
Electrical Equipment | | | 1,336,190 | | | | — | | | | — | |
Electronic Equipment, Instruments & Components | | | 776,292 | | | | — | | | | — | |
Energy Equipment & Services | | | 415,071 | | | | — | | | | — | |
Entertainment | | | 3,579,452 | | | | — | | | | — | |
Equity Real Estate Investment Trusts (REITs) | | | 4,975,042 | | | | — | | | | — | |
Food & Staples Retailing | | | 2,341,250 | | | | — | | | | — | |
Food Products | | | 4,781,991 | | | | — | | | | — | |
Gas Utilities | | | 607,537 | | | | — | | | | — | |
Health Care Equipment & Supplies | | | 9,728,210 | | | | — | | | | — | |
Health Care Providers & Services | | | 8,156,864 | | | | — | | | | — | |
Hotels, Restaurants & Leisure | | | 2,321,166 | | | | — | | | | — | |
Household Durables | | | 324,075 | | | | — | | | | — | |
Household Products | | | 2,710,416 | | | | — | | | | — | |
Independent Power & Renewable Electricity Producers | | | 2,301,307 | | | | — | | | | — | |
Industrial Conglomerates | | | 2,693,652 | | | | — | | | | — | |
Insurance | | | 5,130,840 | | | | — | | | | — | |
Interactive Media & Services | | | 13,552,163 | | | | — | | | | — | |
Internet & Direct Marketing Retail | | | 7,455,009 | | | | — | | | | — | |
IT Services | | | 11,683,355 | | | | — | | | | — | |
Leisure Products | | | 368,590 | | | | — | | | | — | |
Life Sciences Tools & Services | | | 2,738,580 | | | | — | | | | — | |
Machinery | | | 3,402,971 | | | | — | | | | — | |
Media | | | 4,441,283 | | | | — | | | | — | |
Metals & Mining | | | 1,407,398 | | | | — | | | | — | |
Mortgage Real Estate Investment Trusts (REITs) | | | 1,441,822 | | | | — | | | | — | |
Multiline Retail | | | 3,614,678 | | | | — | | | | — | |
Multi-Utilities | | | 561,656 | | | | — | | | | — | |
Oil, Gas & Consumable Fuels | | | 15,135,443 | | | | — | | | | — | |
Personal Products | | | 1,669,834 | | | | — | | | | — | |
Pharmaceuticals | | | 14,937,104 | | | | — | | | | — | |
Professional Services | | | 1,171,190 | | | | — | | | | — | |
Real Estate Management & Development | | | 1,476,629 | | | | — | | | | — | |
Road & Rail | | | 4,314,080 | | | | — | | | | — | |
Semiconductors & Semiconductor Equipment | | | 8,232,793 | | | | — | | | | — | |
Software | | | 18,199,461 | | | | — | | | | — | |
Specialty Retail | | | 8,343,763 | | | | — | | | | — | |
Technology Hardware, Storage & Peripherals | | | 14,401,663 | | | | — | | | | — | |
Textiles, Apparel & Luxury Goods | | | 4,090,467 | | | | — | | | | — | |
Thrifts & Mortgage Finance | | | 1,377,842 | | | | — | | | | — | |
Tobacco | | | 2,774,205 | | | | — | | | | — | |
Trading Companies & Distributors | | | 660,757 | | | | — | | | | — | |
See Notes to Financial Statements.
| | | | |
| PGIM QMA Large-Cap Core Equity Fund | | | 29 | |
Schedule of Investments (continued)
as of October 31, 2018
| | | | | | | | | | | | |
| | | Level 1 | | | Level 2 | | | Level 3 | |
Investments in Securities (continued) | | | | | | | | | | | | |
Common Stocks (continued) | | | | | | | | | | | | |
Transportation Infrastructure | | $ | 251,260 | | | $ | — | | | $ | — | |
Affiliated Mutual Fund | | | 7,609,208 | | | | — | | | | — | |
U.S. Treasury Obligation | | | — | | | | 448,684 | | | | — | |
Other Financial Instruments* | | | | | | | | | | | | |
Futures Contracts | | | (214,278 | ) | | | — | | | | — | |
| | | | | | | | | | | | |
Total | | $ | 274,635,452 | | | $ | 448,684 | | | $ | — | |
| | | | | | | | | | | | |
| * | Other financial instruments are derivative instruments not reflected in the Schedule of Investments, such as futures, forwards and centrally cleared swap contracts, which are recorded at the unrealized appreciation (depreciation) on the instrument, and OTC swap contracts which are recorded at fair value. |
Industry Classification:
The industry classification of investments and other assets in excess of liabilities shown as a percentage of net assets as of October 31, 2018 were as follows (unaudited):
| | | | |
Software | | | 6.6 | % |
Oil, Gas & Consumable Fuels | | | 5.5 | |
Pharmaceuticals | | | 5.4 | |
Technology Hardware, Storage & Peripherals | | | 5.2 | |
Banks | | | 5.1 | |
Interactive Media & Services | | | 4.9 | |
IT Services | | | 4.2 | |
Health Care Equipment & Supplies | | | 3.5 | |
Specialty Retail | | | 3.0 | |
Semiconductors & Semiconductor Equipment | | | 3.0 | |
Health Care Providers & Services | | | 3.0 | |
Diversified Telecommunication Services | | | 2.8 | |
Affiliated Mutual Fund | | | 2.7 | |
Internet & Direct Marketing Retail | | | 2.7 | |
Biotechnology | | | 2.4 | |
Aerospace & Defense | | | 2.0 | |
Capital Markets | | | 1.9 | |
Communications Equipment | | | 1.9 | |
Insurance | | | 1.9 | |
Equity Real Estate Investment Trusts (REITs) | | | 1.8 | |
Food Products | | | 1.7 | |
Media | | | 1.6 | |
Road & Rail | | | 1.6 | |
Textiles, Apparel & Luxury Goods | | | 1.5 | |
Chemicals | | | 1.5 | |
Consumer Finance | | | 1.3 | |
Multiline Retail | | | 1.3 | |
Entertainment | | | 1.3 | % |
Machinery | | | 1.2 | |
Beverages | | | 1.2 | |
Electric Utilities | | | 1.1 | |
Diversified Financial Services | | | 1.1 | |
Tobacco | | | 1.0 | |
Life Sciences Tools & Services | | | 1.0 | |
Household Products | | | 1.0 | |
Industrial Conglomerates | | | 1.0 | |
Food & Staples Retailing | | | 0.9 | |
Hotels, Restaurants & Leisure | | | 0.9 | |
Independent Power & Renewable Electricity Producers | | | 0.8 | |
Air Freight & Logistics | | | 0.8 | |
Personal Products | | | 0.6 | |
Real Estate Management & Development | | | 0.5 | |
Mortgage Real Estate Investment Trusts (REITs) | | | 0.5 | |
Metals & Mining | | | 0.5 | |
Thrifts & Mortgage Finance | | | 0.5 | |
Electrical Equipment | | | 0.5 | |
Building Products | | | 0.5 | |
Professional Services | | | 0.4 | |
Containers & Packaging | | | 0.4 | |
Electronic Equipment, Instruments & Components | | | 0.3 | |
Trading Companies & Distributors | | | 0.3 | |
Construction & Engineering | | | 0.2 | |
Gas Utilities | | | 0.2 | |
See Notes to Financial Statements.
| | | | |
Industry Classification (cont’d.): | | | |
Multi-Utilities | | | 0.2 | % |
U.S. Treasury Obligation | | | 0.2 | |
Energy Equipment & Services | | | 0.2 | |
Leisure Products | | | 0.1 | |
Household Durables | | | 0.1 | |
Transportation Infrastructure | | | 0.1 | |
Auto Components | | | 0.1 | |
Distributors | | | 0.1 | % |
| | | | |
| | | 99.8 | |
Other assets in excess of liabilities | | | 0.2 | |
| | | | |
| | | 100.0 | % |
| | | | |
Effects of Derivative Instruments on the Financial Statements and Primary Underlying Risk Exposure:
The Fund invested in derivative instruments during the reporting period. The primary type of risk associated with these derivative instruments is equity contracts risk. The effect of such derivative instruments on the Fund’s financial position and financial performance as reflected in the Statement of Assets and Liabilities and Statement of Operations is presented in the summary below.
Fair values of derivative instruments as of October 31, 2018 as presented in the Statement of Assets and Liabilities:
| | | | | | | | | | | | |
Derivatives not accounted for as hedging instruments, carried at fair value | | Asset Derivatives | | | Liability Derivatives | |
| | Statement of
Assets and
Liabilities Location | | Fair
Value | | | Statement of
Assets and
Liabilities Location | | Fair
Value | |
| Equity contracts | | — | | $ | — | | | Due from/to broker—variation margin futures | | $ | 214,278 | * |
| | | | | | | | | | | | |
| * | Includes cumulative appreciation (depreciation) as reported in the schedule of open futures and centrally cleared swap contracts. Only unsettled variation margin receivable (payable) is reported within the Statement of Assets and Liabilities. |
The effects of derivative instruments on the Statement of Operations for the year ended October 31, 2018 are as follows:
| | | | |
Amount of Realized Gain (Loss) on Derivatives Recognized in Income | |
Derivatives not accounted for as hedging
instruments, carried at fair value | | Futures | |
Equity contracts | | $ | 657,712 | |
| | | | |
| | | | |
Change in Unrealized Appreciation (Depreciation) on Derivatives Recognized in Income | |
Derivatives not accounted for as hedging
instruments, carried at fair value | | Futures | |
Equity contracts | | $ | (306,086 | ) |
| | | | |
See Notes to Financial Statements.
| | | | |
| PGIM QMA Large-Cap Core Equity Fund | | | 31 | |
Schedule of Investments (continued)
as of October 31, 2018
For the year ended October 31, 2018, the Fund’s average volume of derivative activities is as follows:
| | | | |
| | | Futures
Contracts—
Long
Positions(1) | |
|
|
|
| | $ | 6,113,259 | |
| (1) | Notional Amount in USD. |
See Notes to Financial Statements.
Statement of Assets & Liabilities
as of October 31, 2018
| | | | |
Assets | |
Investments at value: | |
Unaffiliated investments (cost $227,848,513) | | $ | 267,689,206 | |
Affiliated investments (cost $7,609,208) | | | 7,609,208 | |
Receivable for Fund shares sold | | | 595,962 | |
Dividends receivable | | | 266,799 | |
Due from broker—variation margin futures | | | 70,122 | |
Prepaid expenses | | | 3,052 | |
| | | | |
Total Assets | | | 276,234,349 | |
| | | | |
|
Liabilities | |
Payable for Fund shares reacquired | | | 211,877 | |
Distribution fee payable | | | 51,037 | |
Management fee payable | | | 44,896 | |
Accrued expenses and other liabilities | | | 25,799 | |
Affiliated transfer agent fee payable | | | 24,529 | |
Printing fee payable | | | 21,570 | |
Custodian and accounting fees payable | | | 20,953 | |
| | | | |
Total Liabilities | | | 400,661 | |
| | | | |
| |
Net Assets | | $ | 275,833,688 | |
| | | | |
| | | | | |
Net assets were comprised of: | |
Shares of beneficial interest, at par | | $ | 16,430 | |
Paid-in capital in excess of par | | | 188,499,157 | |
Total distributable earnings (loss) | | | 87,318,101 | |
| | | | |
Net assets, October 31, 2018 | | $ | 275,833,688 | |
| | | | |
See Notes to Financial Statements.
| | | | |
| PGIM QMA Large-Cap Core Equity Fund | | | 33 | |
Statement of Assets & Liabilities
as of October 31, 2018
| | | | |
Class A | | | | |
Net asset value and redemption price per share,
($105,854,805 ÷ 6,315,397 shares of beneficial interest issued and outstanding) | | $ | 16.76 | |
Maximum sales charge (5.50% of offering price) | | | 0.98 | |
| | | | |
Maximum offering price to public | | $ | 17.74 | |
| | | | |
| |
Class B | | | | |
Net asset value, offering price and redemption price per share, | | | | |
($1,641,074 ÷ 108,316 shares of beneficial interest issued and outstanding) | | $ | 15.15 | |
| | | | |
| |
Class C | | | | |
Net asset value, offering price and redemption price per share, | | | | |
($29,929,615 ÷ 1,968,830 shares of beneficial interest issued and outstanding) | | $ | 15.20 | |
| | | | |
| |
Class Z | | | | |
Net asset value, offering price and redemption price per share, | | | | |
($61,857,078 ÷ 3,595,651 shares of beneficial interest issued and outstanding) | | $ | 17.20 | |
| | | | |
| |
Class R6 | | | | |
Net asset value, offering price and redemption price per share, | | | | |
($76,551,116 ÷ 4,442,169 shares of beneficial interest issued and outstanding) | | $ | 17.23 | |
| | | | |
See Notes to Financial Statements.
Statement of Operations
Year Ended October 31, 2018
| | | | |
Net Investment Income (Loss) | | | | |
Income | | | | |
Unaffiliated dividend income | | $ | 5,104,085 | |
Affiliated dividend income | | | 99,194 | |
Interest income | | | 7,049 | |
Income from securities lending, net (including affiliated income of $459) | | | 661 | |
| | | | |
Total income | | | 5,210,989 | |
| | | | |
| |
Expenses | | | | |
Management fee | | | 979,902 | |
Distribution fee(a) | | | 674,538 | |
Transfer agent’s fees and expenses (including affiliated expense of $118,885)(a) | | | 238,946 | |
Custodian and accounting fees | | | 74,265 | |
Registration fees(a) | | | 70,547 | |
Shareholders’ reports | | | 44,637 | |
Legal fees and expenses | | | 25,347 | |
Audit fee | | | 24,352 | |
Trustees’ fees | | | 17,079 | |
Miscellaneous | | | 19,584 | |
| | | | |
Total expenses | | | 2,169,197 | |
Less: Fee waiver and/or expense reimbursement(a) | | | (275,807 | ) |
Distribution fee waiver(a) | | | (56,197 | ) |
| | | | |
Net expenses | | | 1,837,193 | |
| | | | |
Net investment income (loss) | | | 3,373,796 | |
| | | | |
| |
Realized And Unrealized Gain (Loss) On Investments | | | | |
Net realized gain (loss) on: | | | | |
Investment transactions (including affiliated of $(406)) | | | 44,697,366 | |
Futures transactions | | | 657,712 | |
| | | | |
| | | 45,355,078 | |
| | | | |
Net change in unrealized appreciation (depreciation) on: | | | | |
Investments | | | (32,619,007 | ) |
Futures | | | (306,086 | ) |
| | | | |
| | | (32,925,093 | ) |
| | | | |
Net gain (loss) on investment transactions | | | 12,429,985 | |
| | | | |
Net Increase (Decrease) In Net Assets Resulting From Operations | | $ | 15,803,781 | |
| | | | |
| (a) | Class specific expenses and waivers were as follows: |
| | | | | | | | | | | | | | | | | | | | |
| | | Class A | | | Class B | | | Class C | | | Class Z | | | Class R6 | |
Distribution fee | | | 337,174 | | | | 19,529 | | | | 317,835 | | | | — | | | | — | |
Transfer agent’s fees and expenses | | | 136,870 | | | | 6,275 | | | | 27,485 | | | | 67,691 | | | | 625 | |
Registration fees | | | 14,815 | | | | 13,827 | | | | 13,880 | | | | 13,854 | | | | 14,171 | |
Fee waiver and/or expense reimbursement | | | (96,953 | ) | | | (15,242 | ) | | | (37,096 | ) | | | (59,689 | ) | | | (66,827 | ) |
Distribution fee waiver | | | (56,197 | ) | | | — | | | | — | | | | — | | | | — | |
See Notes to Financial Statements.
| | | | |
| PGIM QMA Large-Cap Core Equity Fund | | | 35 | |
Statements of Changes in Net Assets
| | | | | | | | |
| | | Year Ended October 31, | |
| | | 2018 | | | 2017 | |
Increase (Decrease) in Net Assets | | | | | | | | |
Operations | | | | | | | | |
Net investment income (loss) | | $ | 3,373,796 | | | $ | 2,563,792 | |
Net realized gain (loss) on investment transactions | | | 45,355,078 | | | | 34,410,327 | |
Net change in unrealized appreciation (depreciation) on investments | | | (32,925,093 | ) | | | 12,884,757 | |
| | | | | | | | |
Net increase (decrease) in net assets resulting from operations | | | 15,803,781 | | | | 49,858,876 | |
| | | | | | | | |
| | |
Dividends and Distributions | | | | | | | | |
Distributions from distributable earnings* | | | | | | | | |
Class A | | | (15,856,544 | ) | | | — | |
Class B | | | (299,083 | ) | | | — | |
Class C | | | (4,505,168 | ) | | | — | |
Class Z | | | (8,182,105 | ) | | | — | |
Class R6 | | | (8,674,924 | ) | | | — | |
| | | | | | | | |
| | | (37,517,824 | ) | | | — | |
| | | | | | | | |
Dividends from net investment income | | | | | | | | |
Class A | | | | | | | (856,818 | ) |
Class B | | | | | | | (6,885 | ) |
Class C | | | | | | | (126,338 | ) |
Class Z | | | | | | | (837,894 | ) |
| | | | | | | | |
| | | | * | | | (1,827,935 | ) |
| | | | | | | | |
Distributions from net realized gains | | | | | | | | |
Class A | | | | | | | (3,797,694 | ) |
Class B | | | | | | | (96,656 | ) |
Class C | | | | | | | (1,773,534 | ) |
Class Z | | | | | | | (2,963,939 | ) |
| | | | | | | | |
| | | | * | | | (8,631,823 | ) |
| | | | | | | | |
| | |
Fund share transactions (Net of share conversions) | | | | | | | | |
Net proceeds from shares sold | | | 69,862,792 | | | | 59,068,734 | |
Net asset value of shares issued in reinvestment of dividends and distributions | | | 36,692,050 | | | | 10,162,081 | |
Cost of shares reacquired | | | (70,529,311 | ) | | | (49,132,723 | ) |
| | | | | | | | |
Net increase (decrease) in net assets from Fund share transactions | | | 36,025,531 | | | | 20,098,092 | |
| | | | | | | | |
Total increase (decrease) | | | 14,311,488 | | | | 59,497,210 | |
| | |
Net Assets: | | | | | | | | |
Beginning of year | | | 261,522,200 | | | | 202,024,990 | |
| | | | | | | | |
End of year(a) | | $ | 275,833,688 | | | $ | 261,522,200 | |
| | | | | | | | |
(a) Includes undistributed/(distributions in excess of) net investment income of: | | $ | | * | | $ | 2,178,899 | |
| | | | | | | | |
| * | For the year ended October 31, 2018, the Fund has adopted amendments to Regulation S-X (refer to Note 10). |
See Notes to Financial Statements.
Notes to Financial Statements
Prudential Investment Portfolios 9 (the “Trust”) is registered under the Investment Company Act of 1940, as amended (“1940 Act”), as an open-end management investment company. The Trust was established as a Delaware business trust on September 18, 1998. The Trust currently consists of five funds: PGIM Absolute Return Bond Fund and PGIM QMA Large-Cap Core Equity Fund, each of which are diversified funds and PGIM International Bond Fund, PGIM Select Real Estate Fund and PGIM Real Estate Income Fund, each of which are non-diversified funds for purposes of the 1940 Act and may invest a greater percentage of their assets in the securities of a single company or other issuer than a diversified fund. Investing in a non-diversified fund involves greater risk than investing in a diversified fund because a loss resulting from the decline in value of any one security may represent a greater portion of the total assets of a non-diversified fund. These financial statements relate only to the PGIM QMA Large-Cap Core Equity Fund (the “Fund”). Effective June 11, 2018, the names of the Fund and the other funds which comprise the Trust were changed by replacing “Prudential” with “PGIM” and each fund’s Class Q shares were renamed Class R6 shares.
The investment objective of the Fund is to seek long-term growth of capital.
1. Accounting Policies
The Fund follows the investment company accounting and reporting guidance of the Financial Accounting Standards Board (“FASB”) Accounting Standard Codification (“ASC”) Topic 946 Financial Services—Investment Companies. The following accounting policies conform to U.S. generally accepted accounting principles. The Fund consistently follows such policies in the preparation of its financial statements.
Securities Valuation: The Fund holds securities and other assets and liabilities that are fair valued at the close of each day (generally, 4:00 PM Eastern time) the New York Stock Exchange (“NYSE”) is open for trading. Fair value is the price that would be received to sell an asset or paid to transfer a liability in an orderly transaction between market participants on the measurement date. The Trust’s Board of Trustees (the “Board”) has adopted valuation procedures for security valuation under which fair valuation responsibilities have been delegated to PGIM Investments LLC (“PGIM Investments” or the “Manager”). Pursuant to the Board’s delegation, a Valuation Committee has been established as two persons, being one or more officers of the Trust, including: the Trust’s Treasurer (or the Treasurer’s direct reports); and the Trust’s Chief or Deputy Chief Compliance Officer (or Vice-President-level direct reports of the Chief or Deputy Chief Compliance Officer). Under the current valuation procedures, the Valuation Committee of the Board is responsible for supervising the valuation of portfolio securities and other assets and liabilities. The valuation procedures permit the Fund to utilize independent pricing vendor services, quotations from market makers, and alternative valuation methods when market quotations are either not
| | | | |
| PGIM QMA Large-Cap Core Equity Fund | | | 37 | |
Notes to Financial Statements (continued)
readily available or not deemed representative of fair value. A record of the Valuation Committee’s actions is subject to the Board’s review, approval, and ratification at its next regularly scheduled quarterly meeting.
For the fiscal reporting period-end, securities and other assets and liabilities were fair valued at the close of the last U.S. business day. Trading in certain foreign securities may occur when the NYSE is closed (including weekends and holidays). Because such foreign securities trade in markets that are open on weekends and U.S. holidays, the values of some of the Fund’s foreign investments may change on days when investors cannot purchase or redeem Fund shares.
Various inputs determine how the Fund’s investments are valued, all of which are categorized according to the three broad levels (Level 1, 2, or 3) detailed in the Schedule of Investments and referred to herein as the “fair value hierarchy” in accordance with FASB ASC Topic 820—Fair Value Measurements and Disclosures.
Common and preferred stocks, exchange-traded funds, and derivative instruments, such as futures or options, that are traded on a national securities exchange are valued at the last sale price as of the close of trading on the applicable exchange where the security principally trades. Securities traded via NASDAQ are valued at the NASDAQ official closing price. To the extent these securities are valued at the last sale price or NASDAQ official closing price, they are classified as Level 1 in the fair value hierarchy. In the event that no sale or official closing price on valuation date exists, these securities are generally valued at the mean between the last reported bid and ask prices, or at the last bid price in the absence of an ask price. These securities are classified as Level 2 in the fair value hierarchy.
Foreign equities traded on foreign securities exchanges are generally valued using pricing vendor services that provide model prices derived using adjustment factors based on information such as local closing price, relevant general and sector indices, currency fluctuations, depositary receipts, and futures, as applicable. Securities valued using such model prices are classified as Level 2 in the fair value hierarchy. The models generate an evaluated adjustment factor for each security, which is applied to the local closing price to adjust it for post closing market movements up to the time the Fund is valued. Utilizing that evaluated adjustment factor, the vendor provides an evaluated price for each security. If the vendor does not provide an evaluated price, securities are valued in accordance with exchange-traded common and preferred stock valuation policies discussed above.
Investments in open-end, non-exchange-traded mutual funds are valued at their net asset values as of the close of the NYSE on the date of valuation. These securities are classified as Level 1 in the fair value hierarchy since they may be purchased or sold at their net asset values on the date of valuation.
Securities and other assets that cannot be priced according to the methods described above are valued based on pricing methodologies approved by the Board. In the event that unobservable inputs are used when determining such valuations, the securities will be classified as Level 3 in the fair value hierarchy.
When determining the fair value of securities, some of the factors influencing the valuation include: the nature of any restrictions on disposition of the securities; assessment of the general liquidity of the securities; the issuer’s financial condition and the markets in which it does business; the cost of the investment; the size of the holding and the capitalization of the issuer; the prices of any recent transactions or bids/offers for such securities or any comparable securities; any available analyst media or other reports or information deemed reliable by the Manager regarding the issuer or the markets or industry in which it operates. Using fair value to price securities may result in a value that is different from a security’s most recent closing price and from the price used by other unaffiliated mutual funds to calculate their net asset values.
Restricted and Illiquid Securities: Subject to guidelines adopted by the Board, the Fund may invest up to 15% of its net assets in illiquid securities, including those which are restricted as to disposition under securities law (“restricted securities”). Restricted securities are valued pursuant to the valuation procedures noted above. Illiquid securities are those that, because of the absence of a readily available market or due to legal or contractual restrictions on resale, cannot be sold within seven days in the ordinary course of business at approximately the amount at which the Fund has valued the investment. Therefore, the Fund may find it difficult to sell illiquid securities at the time considered most advantageous by its subadviser and may incur transaction costs that would not be incurred in the sale of securities that were freely marketable. Certain securities that would otherwise be considered illiquid because of legal restrictions on resale to the general public may be traded among qualified institutional buyers under Rule 144A of the Securities Act of 1933. These Rule 144A securities, as well as commercial paper that is sold in private placements under Section 4(2) of the Securities Act, may be deemed liquid by the Fund’s subadviser under the guidelines adopted by the Trustees of the Trust. However, the liquidity of the Fund’s investments in Rule 144A securities could be impaired if trading does not develop or declines.
Financial Futures Contracts: A financial futures contract is an agreement to purchase (long) or sell (short) an agreed amount of securities at a set price for delivery on a future date. Upon entering into a financial futures contract, the Fund is required to pledge to the broker an amount of cash and/or other assets equal to a certain percentage of the contract amount. This amount is known as the “initial margin.” Subsequent payments, known as “variation margin,” are made or received by the Fund each day, depending on the daily fluctuations in the value of the underlying security. Such variation margin is recorded for financial statement purposes on a daily basis as unrealized gain (loss). When the contract expires or is closed, the gain (loss) is realized and is presented in the Statement of Operations as net realized gain (loss) on futures transactions.
| | | | |
| PGIM QMA Large-Cap Core Equity Fund | | | 39 | |
Notes to Financial Statements (continued)
The Fund invested in financial futures contracts in order to hedge its existing portfolio securities, or securities the Fund intends to purchase, against fluctuations in value caused by changes in value of equities. The use of futures transactions involves the risk of imperfect correlation in movements in the price of futures contracts and the underlying hedged assets. Since futures contracts are exchange-traded, there is minimal counterparty credit risk to the Fund since the exchanges’ clearinghouse acts as counterparty to all exchange-traded futures and guarantees the futures contracts against default.
Master Netting Arrangements: The Trust, on behalf of the Fund, is subject to various Master Agreements, or netting arrangements, with select counterparties. These are agreements which a subadviser may have negotiated and entered into on behalf of the Fund. A master netting arrangement between the Fund and the counterparty permits the Fund to offset amounts payable by the Fund to the same counterparty against amounts to be received; and by the receipt of collateral from the counterparty by the Fund to cover the Fund’s exposure to the counterparty. However, there is no assurance that such mitigating factors are easily enforceable. In addition to master netting arrangements, the right to set-off exists when all the conditions are met such that each of the parties owes the other determinable amounts, the reporting party has the right to set-off the amount owed with the amount owed by the other party, the reporting party intends to set-off and the right of set-off is enforceable by law. During the reporting period, there was no intention to settle on a net basis and all amounts are presented on a gross basis on the Statement of Assets and Liabilities.
Securities Lending: The Fund lends its portfolio securities to banks and broker-dealers. The loans are secured by collateral at least equal to the market value of the securities loaned. Collateral pledged by each borrower is invested in an affiliated money market fund and is marked to market daily, based on the previous day’s market value, such that the value of the collateral exceeds the value of the loaned securities. In the event of significant appreciation in value of securities on loan on the last business day of the reporting period, the financial statements may reflect a collateral value that is less than the market value of the loaned securities. Such shortfall is remedied as described above. Loans are subject to termination at the option of the borrower or the Fund. Upon termination of the loan, the borrower will return to the Fund securities identical to the loaned securities. Should the borrower of the securities fail financially, the Fund has the right to repurchase the securities in the open market using the collateral.
The Fund recognizes income, net of any rebate and securities lending agent fees, for lending its securities in the form of fees or interest on the investment of any cash received as collateral. The borrower receives all interest and dividends from the securities loaned and such payments are passed back to the lender in amounts equivalent thereto. The Fund also continues to recognize any unrealized gain (loss) in the market price of the securities loaned and on the change in the value of the collateral invested that may occur during the term of
the loan. In addition, realized gain (loss) is recognized on changes in the value of the collateral invested upon liquidation of the collateral. Net earnings from securities lending are disclosed on the Statement of Operations as “Income from securities lending, net”.
Securities Transactions and Net Investment Income: Securities transactions are recorded on the trade date. Realized gains (losses) from investment and currency transactions are calculated on the specific identification method. Dividend income is recorded on the ex-date. Expenses are recorded on an accrual basis, which may require the use of certain estimates by management that may differ from actual. Net investment income or loss (other than class specific expenses and waivers, which are allocated as noted below) and unrealized and realized gains (losses) are allocated daily to each class of shares based upon the relative proportion of adjusted net assets of each class at the beginning of the day. Class specific expenses and waivers, where applicable, are charged to the respective share classes. Class specific expenses include distribution fees and distribution fee waivers, shareholder servicing fees, transfer agent’s fees and expenses, registration fees and fee waivers and/or expense reimbursements, as applicable.
Taxes: It is the Fund’s policy to continue to meet the requirements of the Internal Revenue Code applicable to regulated investment companies and to distribute all of its taxable net investment income and capital gains, if any, to its shareholders. Therefore, no federal income tax provision is required. Withholding taxes on foreign dividends, interest and capital gains, if any, are recorded, net of reclaimable amounts, at the time the related income is earned.
Dividends and Distributions: The Fund expects to pay dividends from net investment income and distributions from net realized capital gains, if any, annually. Dividends and distributions to shareholders, which are determined in accordance with federal income tax regulations and which may differ from generally accepted accounting principles, are recorded on the ex-date. Permanent book/tax differences relating to income and gain (loss) are reclassified amongst total distributable earnings (loss) and paid-in capital in excess of par, as appropriate.
Estimates: The preparation of financial statements requires management to make estimates and assumptions that affect the reported amounts and disclosures in the financial statements. Actual results could differ from those estimates.
2. Agreements
The Trust, on behalf of the Fund, has a management agreement with PGIM Investments. Pursuant to this agreement, PGIM Investments has responsibility for all investment advisory services and supervises the subadviser’s performance of such services. In addition, under the management agreement, PGIM Investments provides all of the administrative functions necessary for the organization, operation and management of the Fund. PGIM Investments administers the corporate affairs of the Fund and, in connection therewith, furnishes the Fund with office facilities, together with those ordinary clerical and bookkeeping services
| | | | |
| PGIM QMA Large-Cap Core Equity Fund | | | 41 | |
Notes to Financial Statements (continued)
which are not being furnished by the Fund’s custodian and the Fund’s transfer agent. PGIM Investments is also responsible for the staffing and management of dedicated groups of legal, marketing, compliance and related personnel necessary for the operation of the Fund. The legal, marketing, compliance and related personnel are also responsible for the management and oversight of the various service providers to the Fund, including, but not limited to, the custodian, transfer agent, and accounting agent.
PGIM Investments has entered into a subadvisory agreement with Quantitative Management Associates LLC (“QMA”). The subadvisory agreement provides that QMA will furnish investment advisory services in connection with the management of the Fund. In connection therewith, QMA is obligated to keep certain books and records of the Fund. PGIM
Investments pays for the services of QMA, the cost of compensation of officers of the Fund, occupancy and certain clerical and bookkeeping costs of the Fund. The Fund bears all other costs and expenses.
The management fee paid to PGIM Investments is accrued daily and payable monthly at an annual rate of 0.350% of the Fund’s average daily net assets up to and including $5 billion and 0.340% of the Fund’s average daily net assets in excess of $5 billion. The effective management fee rate before any waivers and/or expense reimbursements was 0.350% for the year ended October 31, 2018.
PGIM Investments has contractually agreed through February 28, 2019, to limit net annual Fund operating expenses (exclusive of distribution and service (12b-1) fees, transfer agency expenses (including sub-transfer agency and networking fees), taxes (such as income and foreign withholding taxes, stamp duty and deferred tax expenses), interest, acquired fund fees and expenses, brokerage, extraordinary and certain other expenses such as dividend, broker charges and interest expense on short sales) of each class of shares to 0.35% of the Fund’s average daily net assets. Expenses waived/reimbursed by the Manager in accordance with this agreement may be recouped by the Manager within the same fiscal year during which such waiver/reimbursement is made if such recoupment can be realized without exceeding the expense limit in effect at the time of the recoupment for that fiscal year. Effective July 1, 2018 this waiver agreement was extended through February 29, 2020.
Where applicable, PGIM Investments voluntarily agreed through June 30, 2018, to waive management fees or shared operating expenses on any share class to the same extent that it waives similar expenses on any other share class and, in addition, total annual operating expenses for Class R6 shares will not exceed total annual operating expenses for Class Z shares. Effective July 1, 2018 this voluntary agreement became part of the Fund’s contractual waiver agreement through February 29, 2020 and is subject to recoupment by the Manager within the same fiscal year during which such wavier/reimbursement is made if
such recoupment can be realized without exceeding the expense limit in effect at the time of the recoupment for that fiscal year.
The Trust, on behalf of the Fund, has a distribution agreement with Prudential Investment Management Services LLC (“PIMS”), which acts as the distributor of the Class A, Class B, Class C, Class Z and Class R6 shares of the Fund. The Fund compensates PIMS for distributing and servicing the Fund’s Class A, Class B and Class C shares, pursuant to the plans of distribution (the “Distribution Plans”), regardless of expenses actually incurred by PIMS. The distribution fees are accrued daily and payable monthly. No distribution or service fees are paid to PIMS as distributor of the Class Z and Class R6 shares of the Fund.
Pursuant to the Distribution Plans, the Fund compensates PIMS for distribution related activities at an annual rate of up to 0.30%, 1% and 1% of the average daily net assets of the Class A, Class B and Class C shares, respectively. PIMS has contractually agreed through February 29, 2020 to limit such fees to 0.25% of the average daily net assets of the Class A shares.
PIMS has advised the Fund that it received $89,754 in front-end sales charges resulting from sales of Class A shares during the year ended October 31, 2018. From these fees, PIMS paid such sales charges to broker-dealers, who in turn paid commissions to salespersons and incurred other distribution costs.
PIMS has advised the Fund that for the year ended October 31, 2018, it received $934 and $585 in contingent deferred sales charges imposed upon redemptions by certain Class B and Class C shareholders, respectively.
PGIM Investments, PIMS and QMA are indirect, wholly-owned subsidiaries of Prudential Financial, Inc. (“Prudential”).
3. Other Transactions with Affiliates
Prudential Mutual Fund Services LLC (“PMFS”), an affiliate of PGIM Investments and an indirect, wholly-owned subsidiary of Prudential, serves as the Fund’s transfer agent. Transfer agent’s fees and expenses in the Statement of Operations include certain out-of-pocket expenses paid to non-affiliates, where applicable.
The Fund may enter into certain securities purchase or sale transactions under Board approved Rule 17a-7 procedures. Rule 17a-7 is an exemptive rule under the 1940 Act, that subject to certain conditions, permits purchase and sale transactions among affiliated investment companies, or between an investment company and a person that is affiliated solely by reason of having a common (or affiliated) investment adviser, common directors, and/or common officers. Such transactions are subject to ratification by the Board. For the reporting period ended October 31, 2018, no such transactions were entered into by the Fund.
| | | | |
| PGIM QMA Large-Cap Core Equity Fund | | | 43 | |
Notes to Financial Statements (continued)
The Fund may invest its overnight sweep cash in the PGIM Core Ultra Short Bond Fund (the “Core Fund”), and its securities lending cash collateral in the PGIM Institutional Money Market Fund (the “Money Market Fund”), each a series of Prudential Investment Portfolios 2, registered under the 1940 Act and managed by PGIM Investments. For the reporting period ended October 31, 2018, PGIM, Inc. was compensated $198 by PGIM Investments for managing the Fund’s securities lending cash collateral as subadviser to the Money Market Fund. Earnings from the Core Fund and Money Market Fund are disclosed on the Statement of Operations as “Affiliated dividend income” and “Income from securities lending, net”, respectively.
4. Portfolio Securities
The aggregate cost of purchases and proceeds from sales of portfolio securities (excluding short-term investments and U.S. Government securities) for the year ended October 31, 2018, were $258,958,310 and $258,444,357, respectively.
A summary of the cost of purchases and proceeds from sales of shares of affiliated mutual funds for the year ended October 31, 2018, is presented as follows:
| | | | | | | | | | | | | | | | | | | | | | | | | | | | | | |
Value,
Beginning
of Year | | | Cost of
Purchases | | | Proceeds
from Sales | | | Change in
Unrealized
Gain
(Loss) | | | Realized
Gain
(Loss) | | | Value,
End of Year | | | Shares,
End
of Year | | | Income | |
| | PGIM Core Ultra Short Bond Fund* | | | | | | | | | | | | | |
| $ | 5,787,229 | | | $ | 55,956,342 | | | $ | 54,134,363 | | | $ | — | | | $ | — | | | $ | 7,609,208 | | | | 7,609,208 | | | $ | 99,194 | |
| | PGIM Institutional Money Market Fund* | | | | | | | | | | | | | |
| | 170 | | | | 14,838,275 | | | | 14,838,039 | | | | — | | | | (406 | ) | | | — | | | | — | | | | 459 | ** |
| | | | | | | | | | | | | | | | | | | | | | | | | | | | | | |
| $ | 5,787,399 | | | $ | 70,794,617 | | | $ | 68,972,402 | | | $ | — | | | $ | (406 | ) | | $ | 7,609,208 | | | | | | | $ | 99,653 | |
| | | | | | | | | | | | | | | | | | | | | | | | | | | | | | |
| * | The Fund did not have any capital gain distributions during the reporting period. |
| ** | This amount is included in “Income from securities lending, net” on the Statement of Operations. |
5. Distributions and Tax Information
Distributions to shareholders, which are determined in accordance with federal income tax regulations and which may differ from generally accepted accounting principles, are recorded on the ex-date.
The tax character of dividends paid by the Fund were $4,297,427 of ordinary income and $33,220,397 of long-term capital gains, for the year ended October 31, 2018 and $1,827,935 of ordinary income and $8,631,823 of long-term capital gains for the year ended October 31, 2017.
As of October 31, 2018, the accumulated undistributed earnings on a tax basis were $8,904,468 of ordinary income and $38,796,903 of long-term capital gains.
The United States federal income tax basis of the Fund’s investments and the net unrealized appreciation as of October 31, 2018 were as follows:
| | | | | | |
Tax Basis | | Gross Unrealized Appreciation | | Gross Unrealized Depreciation | | Net Unrealized Appreciation |
| $235,467,407 | | $53,702,196 | | $(14,085,467) | | $39,616,729 |
The difference between book basis and tax basis is primarily attributable to deferred losses on wash sales and other cost basis differences between financial and tax accounting.
Management has analyzed the Fund’s tax positions taken on federal, state and local income tax returns for all open tax years and has concluded that no provision for income tax is required in the Fund’s financial statements for the current reporting period. The Fund’s federal, state and local income and federal excise tax returns for tax years for which the applicable statutes of limitations have not expired are subject to examination by the Internal Revenue Service and state departments of revenue.
6. Capital and Ownership
The Fund offers Class A, Class B, Class C, Class Z and Class R6 shares. Class A shares are sold with a maximum front-end sales charge of 5.50%. Investors who purchase $1 million or more of Class A shares and sell these shares within 12 months of purchase are subject to a contingent deferred sales charge (“CDSC”) of 1%, although they are not subject to an initial sales charge. The Class A CDSC is waived for certain retirement and/or benefit plans. A special exchange privilege is also available for shareholders who qualified to purchase Class A shares at net asset value. Class B shares are sold with a CDSC which declines from 5% to zero depending on the period of time the shares are held. Class B shares will automatically convert to Class A shares on a quarterly basis approximately seven years after purchase. Class B shares are closed to new purchases. Class C shares are sold with a CDSC of 1% on sales made within 12 months of purchase. Class Z and Class R6 shares are not subject to any sales or redemption charge and are available exclusively for sale to a limited group of investors.
Under certain circumstances, an exchange may be made from specified share classes of the Fund to one or more other share classes of the Fund as presented in the table of transactions in shares of beneficial interest.
The Trust has authorized an unlimited number of shares of beneficial interest at $0.001 par value per share, divided into five classes, designated Class A, Class B, Class C, Class Z and Class R6.
| | | | |
| PGIM QMA Large-Cap Core Equity Fund | | | 45 | |
Notes to Financial Statements (continued)
As of October 31, 2018, Prudential, through its affiliated entities, including affiliated funds (if applicable), owned 4,149,094 Class R6 shares of the Fund. At reporting period end, three shareholders of record held 36% of the Fund’s outstanding shares on behalf of multiple beneficial owners, of which 14% were held by an affiliate of Prudential.
Transactions in shares of beneficial interest were as follows:
| | | | | | | | |
Class A | | Shares | | | Amount | |
Year ended October 31, 2018: | | | | | | | | |
Shares sold | | | 342,696 | | | $ | 5,962,112 | |
Shares issued in reinvestment of dividends and distributions | | | 935,749 | | | | 15,430,504 | |
Shares reacquired | | | (1,182,113 | ) | | | (20,369,261 | ) |
| | | | | | | | |
Net increase (decrease) in shares outstanding before conversion | | | 96,332 | | | | 1,023,355 | |
Shares issued upon conversion from other share class(es) | | | 80,033 | | | | 1,418,612 | |
Shares reacquired upon conversion into other share class(es) | | | (32,240 | ) | | | (556,387 | ) |
| | | | | | | | |
Net increase (decrease) in shares outstanding | | | 144,125 | | | $ | 1,885,580 | |
| | | | | | | | |
Year ended October 31, 2017: | | | | | | | | |
Shares sold | | | 998,488 | | | $ | 16,661,824 | |
Shares issued in reinvestment of dividends and distributions | | | 283,780 | | | | 4,492,233 | |
Shares reacquired | | | (814,914 | ) | | | (13,634,813 | ) |
| | | | | | | | |
Net increase (decrease) in shares outstanding before conversion | | | 467,354 | | | | 7,519,244 | |
Shares issued upon conversion from other share class(es) | | | 71,380 | | | | 1,202,394 | |
Shares reacquired upon conversion into other share class(es) | | | (122,876 | ) | | | (2,056,576 | ) |
| | | | | | | | |
Net increase (decrease) in shares outstanding | | | 415,858 | | | $ | 6,665,062 | |
| | | | | | | | |
Class B | | | | | | |
Year ended October 31, 2018: | | | | | | | | |
Shares sold | | | 9,464 | | | $ | 154,199 | |
Shares issued in reinvestment of dividends and distributions | | | 19,561 | | | | 294,007 | |
Shares reacquired | | | (14,671 | ) | | | (228,377 | ) |
| | | | | | | | |
Net increase (decrease) in shares outstanding before conversion | | | 14,354 | | | | 219,829 | |
Shares reacquired upon conversion into other share class(es) | | | (41,880 | ) | | | (688,725 | ) |
| | | | | | | | |
Net increase (decrease) in shares outstanding | | | (27,526 | ) | | $ | (468,896 | ) |
| | | | | | | | |
Year ended October 31, 2017: | | | | | | | | |
Shares sold | | | 32,575 | | | $ | 484,522 | |
Shares issued in reinvestment of dividends and distributions | | | 6,633 | | | | 97,048 | |
Shares reacquired | | | (21,465 | ) | | | (328,742 | ) |
| | | | | | | | |
Net increase (decrease) in shares outstanding before conversion | | | 17,743 | | | | 252,828 | |
Shares reacquired upon conversion into other share class(es) | | | (31,013 | ) | | | (480,554 | ) |
| | | | | | | | |
Net increase (decrease) in shares outstanding | | | (13,270 | ) | | $ | (227,726 | ) |
| | | | | | | | |
| | | | | | | | |
Class C | | Shares | | | Amount | |
Year ended October 31, 2018: | | | | | | | | |
Shares sold | | | 175,337 | | | $ | 2,730,103 | |
Shares issued in reinvestment of dividends and distributions | | | 289,701 | | | | 4,359,999 | |
Shares reacquired | | | (300,244 | ) | | | (4,757,478 | ) |
| | | | | | | | |
Net increase (decrease) in shares outstanding before conversion | | | 164,794 | | | | 2,332,624 | |
Shares reacquired upon conversion into other share class(es) | | | (62,370 | ) | | | (997,024 | ) |
| | | | | | | | |
Net increase (decrease) in shares outstanding | | | 102,424 | | | $ | 1,335,600 | |
| | | | | | | | |
Year ended October 31, 2017: | | | | | | | | |
Shares sold | | | 176,345 | | | $ | 2,686,035 | |
Shares issued in reinvestment of dividends and distributions | | | 124,849 | | | | 1,829,037 | |
Shares reacquired | | | (876,008 | ) | | | (13,327,502 | ) |
| | | | | | | | |
Net increase (decrease) in shares outstanding before conversion | | | (574,814 | ) | | | (8,812,430 | ) |
Shares reacquired upon conversion into other share class(es) | | | (298,698 | ) | | | (4,536,579 | ) |
| | | | | | | | |
Net increase (decrease) in shares outstanding | | | (873,512 | ) | | $ | (13,349,009 | ) |
| | | | | | | | |
Class Z | | | | | | |
Year ended October 31, 2018: | | | | | | | | |
Shares sold | | | 936,671 | | | $ | 16,621,264 | |
Shares issued in reinvestment of dividends and distributions | | | 469,942 | | | | 7,932,616 | |
Shares reacquired | | | (840,971 | ) | | | (14,918,448 | ) |
| | | | | | | | |
Net increase (decrease) in shares outstanding before conversion | | | 565,642 | | | | 9,635,432 | |
Shares issued upon conversion from other share class(es) | | | 80,826 | | | | 1,445,454 | |
Shares reacquired upon conversion into other share class(es) | | | (35,726 | ) | | | (638,785 | ) |
| | | | | | | | |
Net increase (decrease) in shares outstanding | | | 610,742 | | | $ | 10,442,101 | |
| | | | | | | | |
Year ended October 31, 2017: | | | | | | | | |
Shares sold | | | 578,951 | | | $ | 9,707,348 | |
Shares issued in reinvestment of dividends and distributions | | | 231,812 | | | | 3,743,763 | |
Shares reacquired | | | (813,565 | ) | | | (13,706,717 | ) |
| | | | | | | | |
Net increase (decrease) in shares outstanding before conversion | | | (2,802 | ) | | | (255,606 | ) |
Shares issued upon conversion from other share class(es) | | | 350,173 | | | | 5,899,969 | |
Shares reacquired upon conversion into other share class(es) | | | (1,880,034 | ) | | | (30,196,682 | ) |
| | | | | | | | |
Net increase (decrease) in shares outstanding | | | (1,532,663 | ) | | $ | (24,552,319 | ) |
| | | | | | | | |
Class R6 | | | | | | |
Year ended October 31, 2018: | | | | | | | | |
Shares sold | | | 2,515,007 | | | $ | 44,395,114 | |
Shares issued in reinvestment of dividends and distributions | | | 513,613 | | | | 8,674,924 | |
Shares reacquired | | | (1,686,475 | ) | | | (30,255,747 | ) |
| | | | | | | | |
Net increase (decrease) in shares outstanding before conversion | | | 1,342,145 | | | | 22,814,291 | |
Shares issued upon conversion from other share class(es) | | | 945 | | | | 16,855 | |
| | | | | | | | |
Net increase (decrease) in shares outstanding | | | 1,343,090 | | | $ | 22,831,146 | |
| | | | | | | | |
Period ended October 31, 2017*: | | | | | | | | |
Shares sold | | | 1,679,002 | | | $ | 29,529,005 | |
Shares reacquired | | | (458,288 | ) | | | (8,134,949 | ) |
| | | | | | | | |
Net increase (decrease) in shares outstanding before conversion | | | 1,220,714 | | | | 21,394,056 | |
Shares issued upon conversion from other share class(es) | | | 1,878,365 | | | | 30,168,028 | |
| | | | | | | | |
Net increase (decrease) in shares outstanding | | | 3,099,079 | | | $ | 51,562,084 | |
| | | | | | | | |
| * | Commencement of operations was December 28, 2016. |
| | | | |
| PGIM QMA Large-Cap Core Equity Fund | | | 47 | |
Notes to Financial Statements (continued)
7. Borrowings
The Trust, on behalf of the Fund, along with other affiliated registered investment companies (the “Funds”), is a party to a Syndicated Credit Agreement (“SCA”) with a group of banks. The purpose of the SCA is to provide an alternative source of temporary funding for capital share redemptions. The SCA provides for a commitment of $900 million for the period October 4, 2018 through October 3, 2019. The Funds pay an annualized commitment fee of 0.15% of the unused portion of the SCA. The Fund’s portion of the commitment fee for the unused amount, allocated based upon a method approved by the Board, is accrued daily and paid quarterly. Prior to October 4, 2018, the Funds had another SCA that provided a commitment of $900 million and the Funds paid an annualized commitment fee of 0.15% of the unused portion of the SCA. The interest on borrowings under both SCAs is paid monthly and at a per annum interest rate based upon a contractual spread plus the higher of (1) the effective federal funds rate, (2) the 1-month LIBOR rate or (3) zero percent.
Other affiliated registered investment companies that are parties to the SCA include portfolios that are subject to a predetermined mathematical formula used to manage certain benefit guarantees offered under variable annuity contracts. The formula may result in large scale asset flows into and out of these portfolios. Consequently, these portfolios may be more likely to utilize the SCA for purposes of funding redemptions. It may be possible for those portfolios to fully exhaust the committed amount of the SCA, thereby requiring the Manager to allocate available funding per a Board-approved methodology designed to treat the Funds in the SCA equitably.
The Fund did not utilize the SCA during the reporting period ended October 31, 2018.
8. Dividends and Distributions to Shareholders
Subsequent to the fiscal year end, the Fund declared ordinary income dividends and distributions on December 11, 2018 to shareholders of record on December 12, 2018. The ex-date was December 13, 2018. The per share amounts declared were as follows:
| | | | | | |
| | | Ordinary Income | | Short-Term Capital Gains | | Long-Term Capital Gains |
| Class A | | $0.21756 | | $0.36750 | | $2.37300 |
| Class B | | $0.07457 | | $0.36750 | | $2.37300 |
| Class C | | $0.11109 | | $0.36750 | | $2.37300 |
| Class Z | | $0.26179 | | $0.36750 | | $2.37300 |
| Class R6 | | $0.28110 | | $0.36750 | | $2.37300 |
9. Risks of Investing in the Fund
The Fund’s risks include, but are not limited to, some or all of the risks discussed below:
Derivatives Risk: Derivatives involve special risks and costs and may result in losses to the Fund. The successful use of derivatives requires sophisticated management, and, to the extent that derivatives are used, the Fund will depend on the subadviser’s ability to analyze and manage derivative transactions. The prices of derivatives may move in unexpected ways, especially in abnormal market conditions. Some derivatives are “leveraged” and therefore may magnify or otherwise increase investment losses to the Fund. The Fund’s use of derivatives may also increase the amount of taxes payable by shareholders. Other risks arise from the potential inability to terminate or sell derivatives positions. A liquid secondary market may not always exist for the Fund’s derivatives positions. In fact, many OTC derivative instruments will not have liquidity beyond the counterparty to the instrument. OTC derivative instruments also involve the risk that the other party will not meet its obligations to the Fund.
Equity and Equity-Related Securities Risks: The value of a particular security could go down and you could lose money. In addition to an individual security losing value, the value of the equity markets or a sector in which the Fund invests could go down. The Fund’s holdings can vary significantly from broad market indexes and the performance of the Fund can deviate from the performance of these indexes. Different parts of a market can react differently to adverse issuer, market, regulatory, political and economic developments.
10. Recent Accounting Pronouncements and Reporting Updates
In August 2018, the Securities and Exchange Commission (the “SEC”) adopted amendments to Regulation S-X to update and simplify the disclosure requirements for registered investment companies by eliminating requirements that are redundant or duplicative of US GAAP requirements or other SEC disclosure requirements. The new amendments require the presentation of the total, rather than the components, of distributable earnings on the Statement of Assets and Liabilities and the total, rather than the components, of dividends from net investment income and distributions from net realized gains on the Statements of Changes in Net Assets. The amendments also removed the requirement for the parenthetical disclosure of undistributed net investment income on the Statements of Changes in Net Assets and certain tax adjustments that were reflected in the Notes to Financial Statements. All of these have been reflected in the Fund’s financial statements.
In August 2018, the FASB issued Accounting Standards Update (“ASU”) No. 2018-13, which changes certain fair value measurement disclosure requirements. The new ASU, in addition to other modifications and additions, removes the requirement to disclose the amount and reasons for transfers between Level 1 and Level 2 of the fair value hierarchy, and the Fund’s policy for the timing of transfers between levels. The amendments are effective for financial statements issued for fiscal years beginning after December 15, 2019, and interim periods within those fiscal years. Management has evaluated the implications of certain provisions of the ASU and has determined to early adopt aspects related to the removal and modification of certain fair value measurement disclosures under the ASU
| | | | |
| PGIM QMA Large-Cap Core Equity Fund | | | 49 | |
Notes to Financial Statements (continued)
effective immediately. At this time, management is evaluating the implications of certain other provisions of the ASU related to new disclosure requirements and any impact on the financial statement disclosures has not yet been determined.
11. Reorganization
On June 19, 2018, the Board approved an Agreement and Plan of Reorganization (the “Plan”) which provided for the transfer of all the assets of PGIM QMA Defensive Equity Fund (the “Merged Fund”) for shares of PGIM QMA Large-Cap Core Equity Fund (the “Acquiring Fund”) and the assumption of the liabilities of the Merged Fund respectively. Shareholders approved the Plan at a meeting on November 16, 2018 and the reorganization took place on December 14, 2018. Upon implementation of the reorganization, PGIM Investments contractually agreed through February 29, 2020, to limit total annual operating expenses to 1.58% of average daily net assets for Class B shares of the proforma combined Fund.
On the reorganization date, the Merged Fund had the following total investment cost and value, representing the principal assets acquired by the Acquiring Fund:
| | | | | | | | |
Merged Fund | | Total Investment Value | | | Total Investment Cost | |
PGIM QMA Defensive Equity Fund | | $ | 196,953,251 | | | $ | 176,956,178 | |
The purpose of the transaction was to combine two portfolios with substantially similar investment objectives and policies.
The acquisition was accomplished by a tax-free exchange of the following shares on December 14, 2018:
| | | | | | | | | | | | | | | | |
| Merged Fund | | | Acquiring Fund | | | | |
PGIM QMA Defensive
Equity Fund | | | PGIM QMA Large-Cap
Core Equity Fund | | | | |
Class | | Shares | | | Class | | | Shares | | | Value | |
| A | | | 14,206,470 | | | | A | | | | 12,327,519 | | | $ | 160,997,399 | |
| B | | | 327,165 | | | | B | | | | 317,128 | | | | 3,694,545 | |
| C | | | 2,570,544 | | | | C | | | | 2,486,331 | | | | 29,015,483 | |
| R* | | | 382 | | | | R6 | | | | 18,392 | | | | 247,372 | |
| R6 | | | 21,770 | | | | Z | | | | 383,096 | | | | 5,148,805 | |
| Z | | | 453,555 | | | | | | | | | | | | | |
| * | Class R shares were converted to Class A shares in the reorganization. |
For financial reporting purposes, assets received and shares issued by the Acquiring Fund were recorded at fair value; however, the cost basis of the investments received from the Merged Portfolio were carried forward to reflect the tax-free status of the acquisition.
The net assets and net unrealized appreciation immediately before the acquisition were as follows:
| | | | | | | | | | | | | | | | |
| Merged Fund | | | | | | Acquiring Fund | |
PGIM QMA Defensive
Equity Fund | | | | | | PGIM QMA Lare-Cap
Core Equity Fund | |
Class | | Net Assets | | | Unrealized
Appreciation
On Investments | | | Class | | | Net Assets | |
| A | | $ | 160,993,013 | | | $ | 16,169,416 | | | | A | | | $ | 97,991,911 | |
| B | | | 3,694,545 | | | | 371,064 | | | | B | | | | 1,525,457 | |
| C | | | 29,015,483 | | | | 2,914,185 | | | | C | | | | 27,863,342 | |
| R | | | 4,386 | | | | 441 | | | | R6 | | | | 73,674,073 | |
| R6 | | | 247,372 | | | | 24,845 | | | | Z | | | | 57,822,232 | |
| Z | | | 5,148,805 | | | | 517,123 | | | | | | | | | |
12. Subsequent Event
At a meeting held on December 6, 2018, the Board of Trustees of the Fund approved a plan of reorganization whereby PGIM QMA Large-Cap Core Equity Fund would acquire the PGIM Growth Allocation Fund. The reorganization is subject to approval by the shareholders of PGIM Growth Allocation Fund. A special meeting of the shareholders will be held in April, 2019. It is expected that the reorganization, if approved, would be completed in May, 2019.
| | | | |
| PGIM QMA Large-Cap Core Equity Fund | | | 51 | |
Financial Highlights
| | | | | | | | | | | | | | | | | | | | |
| Class A Shares | | | | | | | | | | | | | | | |
| | | Year Ended October 31, | |
| | | 2018 | | | 2017 | | | 2016 | | | 2015 | | | 2014 | |
| Per Share Operating Performance(a): | | | | | | | | | | | | | | | | | | | | |
| Net Asset Value, Beginning of Year | | | $18.37 | | | | $15.49 | | | | $15.92 | | | | $16.55 | | | | $15.23 | |
| Income (loss) from investment operations: | | | | | | | | | | | | | | | | | | | | |
| Net investment income (loss) | | | 0.20 | | | | 0.19 | | | | 0.14 | | | | 0.14 | | | | 0.11 | |
| Net realized and unrealized gain (loss) on investment transactions | | | 0.80 | | | | 3.51 | | | | 0.29 | | | | 0.55 | | | | 2.46 | |
| Total from investment operations | | | 1.00 | | | | 3.70 | | | | 0.43 | | | | 0.69 | | | | 2.57 | |
| Less Dividends and Distributions: | | | | | | | | | | | | | | | | | | | | |
| Dividends from net investment income | | | (0.18 | ) | | | (0.15 | ) | | | (0.14 | ) | | | (0.11 | ) | | | (0.13 | ) |
| Distributions from net realized gains | | | (2.43 | ) | | | (0.67 | ) | | | (0.72 | ) | | | (1.21 | ) | | | (1.12 | ) |
| Total dividends and distributions | | | (2.61 | ) | | | (0.82 | ) | | | (0.86 | ) | | | (1.32 | ) | | | (1.25 | ) |
| Net asset value, end of year | | | $16.76 | | | | $18.37 | | | | $15.49 | | | | $15.92 | | | | $16.55 | |
| Total Return(b): | | | 5.67% | | | | 24.73% | | | | 3.02% | | | | 4.20% | | | | 18.09% | |
| |
| Ratios/Supplemental Data: | |
| Net assets, end of year (000) | | | $105,855 | | | | $113,343 | | | | $89,169 | | | | $88,920 | | | | $88,561 | |
| Average net assets (000) | | | $112,391 | | | | $101,852 | | | | $88,443 | | | | $90,171 | | | | $86,047 | |
| Ratios to average net assets(c): | | | | | | | | | | | | | | | | | | | | |
| Expenses after waivers and/or expense reimbursement | | | 0.72% | | | | 0.77% | | | | 1.17% | | | | 1.14% | | | | 1.16% | |
| Expenses before waivers and/or expense reimbursement | | | 0.86% | (d) | | | 0.93% | | | | 1.22% | | | | 1.19% | | | | 1.21% | |
| Net investment income (loss) | | | 1.14% | | | | 1.13% | | | | 0.91% | | | | 0.89% | | | | 0.74% | |
| Portfolio turnover rate(e) | | | 95% | | | | 89% | | | | 89% | | | | 112% | | | | 91% | |
| (a) | Calculated based on average shares outstanding during the year. |
| (b) | Total return does not consider the effects of sales loads. Total return is calculated assuming a purchase of a share on the first day and a sale on the last day of each year reported and includes reinvestment of dividends and distributions, if any. Total returns may reflect adjustments to conform to generally accepted accounting principles. |
| (c) | Does not include expenses of the underlying funds in which the Fund invests. |
| (d) | Effective November 1, 2017, class specific expenses include transfer agent fees and expenses and registration fees, which are charged to their respective share class. |
| (e) | The Fund’s portfolio turnover rate is calculated in accordance with regulatory requirements, without regard to transactions involving short term investments and certain derivatives. If such transactions were included, the Fund’s portfolio turnover rate may be higher. |
See Notes to Financial Statements.
| | | | | | | | | | | | | | | | | | | | |
| Class B Shares | | | | | | | | | | | | | | | |
| | | Year Ended October 31, | |
| | | 2018 | | | 2017 | | | 2016 | | | 2015 | | | 2014 | |
| Per Share Operating Performance(a): | | | | | | | | | | | | | | | | | | | | |
| Net Asset Value, Beginning of Year | | | $16.87 | | | | $14.30 | | | | $14.75 | | | | $15.43 | | | | $14.29 | |
| Income (loss) from investment operations: | | | | | | | | | | | | | | | | | | | | |
| Net investment income (loss) | | | 0.03 | | | | 0.06 | | | | 0.03 | | | | 0.02 | | | | - | (b) |
| Net realized and unrealized gain (loss) on investment transactions | | | 0.74 | | | | 3.23 | | | | 0.27 | | | | 0.51 | | | | 2.29 | |
| Total from investment operations | | | 0.77 | | | | 3.29 | | | | 0.30 | | | | 0.53 | | | | 2.29 | |
| Less Dividends and Distributions: | | | | | | | | | | | | | | | | | | | | |
| Dividends from net investment income | | | (0.06 | ) | | | (0.05 | ) | | | (0.03 | ) | | | - | (b) | | | (0.03 | ) |
| Distributions from net realized gains | | | (2.43 | ) | | | (0.67 | ) | | | (0.72 | ) | | | (1.21 | ) | | | (1.12 | ) |
| Total dividends and distributions | | | (2.49 | ) | | | (0.72 | ) | | | (0.75 | ) | | | (1.21 | ) | | | (1.15 | ) |
| Net asset value, end of year | | | $15.15 | | | | $16.87 | | | | $14.30 | | | | $14.75 | | | | $15.43 | |
| Total Return(c): | | | 4.67% | | | | 23.75% | | | | 2.31% | | | | 3.42% | | | | 17.16% | |
| |
| Ratios/Supplemental Data: | |
| Net assets, end of year (000) | | | $1,641 | | | | $2,291 | | | | $2,132 | | | | $2,676 | | | | $3,052 | |
| Average net assets (000) | | | $1,953 | | | | $2,311 | | | | $2,348 | | | | $3,018 | | | | $3,150 | |
| Ratios to average net assets(d): | | | | | | | | | | | | | | | | | | | | |
| Expenses after waivers and/or expense reimbursement | | | 1.67% | | | | 1.52% | | | | 1.92% | | | | 1.89% | | | | 1.91% | |
| Expenses before waivers and/or expense reimbursement | | | 2.45% | (e) | | | 1.63% | | | | 1.92% | | | | 1.89% | | | | 1.91% | |
| Net investment income (loss) | | | 0.20% | | | | 0.40% | | | | 0.19% | | | | 0.15% | | | | -% | (f) |
| Portfolio turnover rate(g) | | | 95% | | | | 89% | | | | 89% | | | | 112% | | | | 91% | |
| (a) | Calculated based on average shares outstanding during the year. |
| (b) | Less than $0.005 per share. |
| (c) | Total return does not consider the effects of sales loads. Total return is calculated assuming a purchase of a share on the first day and a sale on the last day of each year reported and includes reinvestment of dividends and distributions, if any. Total returns may reflect adjustments to conform to generally accepted accounting principles. |
| (d) | Does not include expenses of the underlying funds in which the Fund invests. |
| (e) | Effective November 1, 2017, class specific expenses include transfer agent fees and expenses and registration fees, which are charged to their respective share class. |
| (g) | The Fund’s portfolio turnover rate is calculated in accordance with regulatory requirements, without regard to transactions involving short term investments and certain derivatives. If such transactions were included, the Fund’s portfolio turnover rate may be higher. |
See Notes to Financial Statements.
| | | | |
| PGIM QMA Large-Cap Core Equity Fund | | | 53 | |
Financial Highlights (continued)
| | | | | | | | | | | | | | | | | | | | |
| Class C Shares | | | | | | | | | | | | | | | |
| | | Year Ended October 31, | |
| | | 2018 | | | 2017 | | | 2016 | | | 2015 | | | 2014 | |
| Per Share Operating Performance(a): | | | | | | | | | | | | | | | | | | | | |
| Net Asset Value, Beginning of Year | | | $16.89 | | | | $14.31 | | | | $14.77 | | | | $15.45 | | | | $14.30 | |
| Income (loss) from investment operations: | | | | | | | | | | | | | | | | | | | | |
| Net investment income (loss) | | | 0.07 | | | | 0.06 | | | | 0.02 | | | | 0.02 | | | | - | (b) |
| Net realized and unrealized gain (loss) on investment transactions | | | 0.73 | | | | 3.24 | | | | 0.27 | | | | 0.51 | | | | 2.30 | |
| Total from investment operations | | | 0.80 | | | | 3.30 | | | | 0.29 | | | | 0.53 | | | | 2.30 | |
| Less Dividends and Distributions: | | | | | | | | | | | | | | | | | | | | |
| Dividends from net investment income | | | (0.06 | ) | | | (0.05 | ) | | | (0.03 | ) | | | - | (b) | | | (0.03 | ) |
| Distributions from net realized gains | | | (2.43 | ) | | | (0.67 | ) | | | (0.72 | ) | | | (1.21 | ) | | | (1.12 | ) |
| Total dividends and distributions | | | (2.49 | ) | | | (0.72 | ) | | | (0.75 | ) | | | (1.21 | ) | | | (1.15 | ) |
| Net asset value, end of year | | | $15.20 | | | | $16.89 | | | | $14.31 | | | | $14.77 | | | | $15.45 | |
| Total Return(c): | | | 4.91% | | | | 23.80% | | | | 2.24% | | | | 3.42% | | | | 17.21% | |
| |
| Ratios/Supplemental Data: | |
| Net assets, end of year (000) | | | $29,930 | | | | $31,518 | | | | $39,218 | | | | $38,919 | | | | $37,681 | |
| Average net assets (000) | | | $31,783 | | | | $34,697 | | | | $38,344 | | | | $38,738 | | | | $35,817 | |
| Ratios to average net assets(d): | | | | | | | | | | | | | | | | | | | | |
| Expenses after waivers and/or expense reimbursement | | | 1.44% | | | | 1.53% | | | | 1.92% | | | | 1.89% | | | | 1.91% | |
| Expenses before waivers and/or expense reimbursement | | | 1.55% | (e) | | | 1.64% | | | | 1.92% | | | | 1.89% | | | | 1.91% | |
| Net investment income (loss) | | | 0.43% | | | | 0.40% | | | | 0.16% | | | | 0.14% | | | | (0.01 | )% |
| Portfolio turnover rate(f) | | | 95% | | | | 89% | | | | 89% | | | | 112% | | | | 91% | |
| (a) | Calculated based on average shares outstanding during the year. |
| (b) | Less than $0.005 per share. |
| (c) | Total return does not consider the effects of sales loads. Total return is calculated assuming a purchase of a share on the first day and a sale on the last day of each year reported and includes reinvestment of dividends and distributions, if any. Total returns may reflect adjustments to conform to generally accepted accounting principles. |
| (d) | Does not include expenses of the underlying funds in which the Fund invests. |
| (e) | Effective November 1, 2017, class specific expenses include transfer agent fees and expenses and registration fees, which are charged to their respective share class. |
| (f) | The Fund’s portfolio turnover rate is calculated in accordance with regulatory requirements, without regard to transactions involving short term investments and certain derivatives. If such transactions were included, the Fund’s portfolio turnover rate may be higher. |
See Notes to Financial Statements.
| | | | | | | | | | | | | | | | | | | | |
| Class Z Shares | | | | | | | | | | | | | | | |
| | | | | | Year Ended October 31, | | | | |
| | | 2018 | | | 2017 | | | 2016 | | | 2015 | | | 2014 | |
| Per Share Operating Performance(a): | | | | | | | | | | | | | | | | | | | | |
| Net Asset Value, Beginning of Year | | | $18.78 | | | | $15.83 | | | | $16.24 | | | | $16.86 | | | | $15.49 | |
| Income (loss) from investment operations: | | | | | | | | | | | | | | | | | | | | |
| Net investment income (loss) | | | 0.25 | | | | 0.24 | | | | 0.18 | | | | 0.18 | | | | 0.16 | |
| Net realized and unrealized gain (loss) on investment transactions | | | 0.82 | | | | 3.57 | | | | 0.31 | | | | 0.55 | | | | 2.49 | |
| Total from investment operations | | | 1.07 | | | | 3.81 | | | | 0.49 | | | | 0.73 | | | | 2.65 | |
| Less Dividends and Distributions: | | | | | | | | | | | | | | | | | | | | |
| Dividends from net investment income | | | (0.22 | ) | | | (0.19 | ) | | | (0.18 | ) | | | (0.14 | ) | | | (0.16 | ) |
| Distributions from net realized gains | | | (2.43 | ) | | | (0.67 | ) | | | (0.72 | ) | | | (1.21 | ) | | | (1.12 | ) |
| Total dividends and distributions | | | (2.65 | ) | | | (0.86 | ) | | | (0.90 | ) | | | (1.35 | ) | | | (1.28 | ) |
| Net asset value, end of year | | | $17.20 | | | | $18.78 | | | | $15.83 | | | | $16.24 | | | | $16.86 | |
| Total Return(b): | | | 5.98% | | | | 24.93% | | | | 3.35% | | | | 4.41% | | | | 18.39% | |
| |
| Ratios/Supplemental Data: | | | | | | | | | | | | | | | |
| Net assets, end of year (000) | | | $61,857 | | | | $56,066 | | | | $71,506 | | | | $80,096 | | | | $42,134 | |
| Average net assets (000) | | | $62,456 | | | | $54,787 | | | | $75,803 | | | | $57,677 | | | | $38,052 | |
| Ratios to average net assets(c): | | | | | | | | | | | | | | | | | | | | |
| Expenses after waivers and/or expense reimbursement | | | 0.46% | | | | 0.54% | | | | 0.92% | | | | 0.89% | | | | 0.91% | |
| Expenses before waivers and/or expense reimbursement | | | 0.55% | (d) | | | 0.64% | | | | 0.92% | | | | 0.89% | | | | 0.91% | |
| Net investment income (loss) | | | 1.40% | | | | 1.42% | | | | 1.18% | | | | 1.12% | | | | 0.99% | |
| Portfolio turnover rate(e) | | | 95% | | | | 89% | | | | 89% | | | | 112% | | | | 91% | |
| (a) | Calculated based on average shares outstanding during the year. |
| (b) | Total return is calculated assuming a purchase of a share on the first day and a sale on the last day of each year reported and includes reinvestment of dividends and distributions, if any. Total returns may reflect adjustments to conform to generally accepted accounting principles. |
| (c) | Does not include expenses of the underlying funds in which the Fund invests. |
| (d) | Effective November 1, 2017, class specific expenses include transfer agent fees and expenses and registration fees, which are charged to their respective share class. |
| (e) | The Fund’s portfolio turnover rate is calculated in accordance with regulatory requirements, without regard to transactions involving short term investments and certain derivatives. If such transactions were included, the Fund’s portfolio turnover rate may be higher. |
See Notes to Financial Statements.
| | | | |
| PGIM QMA Large-Cap Core Equity Fund | | | 55 | |
Financial Highlights (continued)
| | | | | | | | |
| Class R6 Shares | | | | | | |
| | | Year Ended
October 31,
2018 | | | December 28,
2016(a)
through
October 31,
2017 | |
| Per Share Operating Performance(b): | | | | | | | | |
| Net Asset Value, Beginning of Period | | | $18.81 | | | | $16.06 | |
| Income (loss) from investment operations: | | | | | | | | |
| Net investment income (loss) | | | 0.27 | | | | 0.21 | |
| Net realized and unrealized gain (loss) on investment transactions | | | 0.82 | | | | 2.54 | |
| Total from investment operations | | | 1.09 | | | | 2.75 | |
| Less Dividends and Distributions: | | | | | | | | |
| Dividends from net investment income | | | (0.24 | ) | | | - | |
| Distributions from net realized gains | | | (2.43 | ) | | | - | |
| Total dividends and distributions | | | (2.67 | ) | | | - | |
| Net asset value, end of period | | | $17.23 | | | | $18.81 | |
| Total Return(c): | | | 6.10% | | | | 17.12% | |
| |
| Ratios/Supplemental Data: | | | | | | |
| Net assets, end of period (000) | | | $76,551 | | | | $58,304 | |
| Average net assets (000) | | | $71,390 | | | | $40,448 | |
| Ratios to average net assets(d): | | | | | | | | |
| Expenses after waivers and/or expense reimbursement | | | 0.35% | | | | 0.35% | (e) |
| Expenses before waivers and/or expense reimbursement | | | 0.44% | (f) | | | 0.47% | (e) |
| Net investment income (loss) | | | 1.51% | | | | 1.44% | (e) |
| Portfolio turnover rate(g) | | | 95% | | | | 89% | |
| (a) | Commencement of offering. |
| (b) | Calculated based on average shares outstanding during the period. |
| (c) | Total return is calculated assuming a purchase of a share on the first day and a sale on the last day of each period reported and includes reinvestment of dividends and distributions, if any. Total returns may reflect adjustments to conform to generally accepted accounting principles. Total returns for periods less than one full year are not annualized. |
| (d) | Does not include expenses of the underlying funds in which the Fund invests. |
| (f) | Effective November 1, 2017, class specific expenses include transfer agent fees and expenses and registration fees, which are charged to their respective share class. |
| (g) | The Fund’s portfolio turnover rate is calculated in accordance with regulatory requirements, without regard to transactions involving short term investments and certain derivatives. If such transactions were included, the Fund’s portfolio turnover rate may be higher. |
See Notes to Financial Statements.
Report of Independent Registered Public Accounting Firm
The Board of Trustees and Shareholders
Prudential Investment Portfolios 9:
Opinion on the Financial Statements
We have audited the accompanying statement of assets and liabilities of PGIM QMA Large-Cap Core Equity Fund (formerly Prudential QMA Large-Cap Core Equity Fund) (the “Fund”), a series of Prudential Investment Portfolios 9, including the schedule of investments, as of October 31, 2018, the related statement of operations for the year then ended, the statements of changes in net assets for each of the years in the two-year period then ended, and the related notes (collectively, the financial statements) and the financial highlights for the years or periods indicated therein. In our opinion, the financial statements and financial highlights present fairly, in all material respects, the financial position of the Fund as of October 31, 2018, the results of its operations for the year then ended, the changes in its net assets for each of the years in the two-year period then ended, and the financial highlights for the years or periods indicated therein, in conformity with U.S. generally accepted accounting principles.
Basis for Opinion
These financial statements and financial highlights are the responsibility of the Fund’s management. Our responsibility is to express an opinion on these financial statements and financial highlights based on our audits. We are a public accounting firm registered with the Public Company Accounting Oversight Board (United States) (“PCAOB”) and are required to be independent with respect to the Fund in accordance with the U.S. federal securities laws and the applicable rules and regulations of the Securities and Exchange Commission and the PCAOB.
We conducted our audits in accordance with the standards of the PCAOB. Those standards require that we plan and perform the audit to obtain reasonable assurance about whether the financial statements and financial highlights are free of material misstatement, whether due to error or fraud. Our audits included performing procedures to assess the risks of material misstatement of the financial statements and financial highlights, whether due to error or fraud, and performing procedures that respond to those risks. Such procedures included examining, on a test basis, evidence regarding the amounts and disclosures in the financial statements and financial highlights. Such procedures also included confirmation of securities owned as of October 31, 2018, by correspondence with the custodians, transfer agents and brokers or by other appropriate auditing procedures when replies from brokers were not received. Our audits also included evaluating the accounting principles used and significant estimates made by management, as well as evaluating the overall presentation of the financial statements and financial highlights. We believe that our audits provide a reasonable basis for our opinion.

We have served as the auditor of one or more PGIM and/or Prudential Retail investment companies since 2003.
New York, New York
December 19, 2018
| | | | |
| PGIM QMA Large-Cap Core Equity Fund | | | 57 | |
Federal Income Tax Information (unaudited)
We are advising you that during the fiscal year ended October 31, 2018, the Fund reports the maximum amount allowed per share but not less than $2.32 for Class A, B, C, Z and R6 shares as a capital gain distribution in accordance with Section 852(b)(3)(C) of the Internal Revenue Code.
For the year ended October 31, 2018, the Fund reports the maximum amount allowable under Section 854 of the Internal Revenue Code, but not less than, the following percentages of the ordinary income dividends paid as 1) qualified dividend income (QDI); and 2) eligible for corporate dividends received deduction (DRD):
| | | | | | | | |
| | | QDI | | | DRD | |
PGIM QMA Large-Cap Core Equity Fund | | | 93.55 | % | | | 90.82 | % |
In January 2019, you will be advised on IRS Form 1099-DIV or substitute 1099-DIV, as to the federal tax status of dividends and distributions received by you in calendar year 2018.
INFORMATION ABOUT BOARD MEMBERS AND OFFICERS (unaudited)
Information about Board Members and Officers of the Fund is set forth below. Board Members who are not deemed to be “interested persons” of the Fund, as defined in the 1940 Act, are referred to as “Independent Board Members.” Board Members who are deemed to be “interested persons” of the Fund are referred to as “Interested Board Members.” The Board Members are responsible for the overall supervision of the operations of the Fund and perform the various duties imposed on the directors of investment companies by the 1940 Act. The Board in turn elects the Officers, who are responsible for administering the day-to-day operations of the Fund.
| | | | | | |
| Independent Board Members | | | | |
| | | | |
Name, Address, Age Position(s) Portfolios Overseen | | Principal Occupation(s) During Past Five Years | | Other Directorships Held During Past Five Years | | Length of Board Service |
| | | | |
Ellen S. Alberding (60) Board Member Portfolios Overseen: 93 | | President and Board Member, The Joyce Foundation (charitable foundation) (since 2002); Vice Chair, City Colleges of Chicago (community college system) (2011-2015); Trustee, National Park Foundation (charitable foundation for national park system) (2009-2018); Trustee, Economic Club of Chicago (since 2009); Trustee, Loyola University (since 2018). | | None. | | Since September 2013 |
| | | | |
Kevin J. Bannon (66) Board Member Portfolios Overseen: 93 | | Retired; Managing Director (April 2008-May 2015) and Chief Investment Officer (October 2008-November 2013) of Highmount Capital LLC (registered investment adviser); formerly Executive Vice President and Chief Investment Officer (April 1993-August 2007) of Bank of New York Company; President (May 2003-May 2007) of BNY Hamilton Family of Mutual Funds. | | Director of Urstadt Biddle Properties (equity real estate investment trust) (since September 2008). | | Since July 2008 |
| | | | |
Linda W. Bynoe (66) Board Member Portfolios Overseen: 93 | | President and Chief Executive Officer (since March 1995) and formerly Chief Operating Officer (December 1989-February 1995) of Telemat Ltd. (management consulting); formerly Vice President (January 1985-June 1989) at Morgan Stanley & Co. (broker-dealer). | | Director of Anixter International, Inc. (communication products distributor) (since January 2006); Director of Northern Trust Corporation (financial services) (since April 2006); Trustee of Equity Residential (residential real estate) (since December 2009). | | Since March 2005 |
PGIM QMA Large-Cap Core Equity Fund
| | | | | | |
Independent Board Members | | | | |
| | | | |
Name, Address, Age Position(s) Portfolios Overseen | | Principal Occupation(s) During Past Five Years | | Other Directorships Held During Past Five Years | | Length of Board Service |
| | | | |
Barry H. Evans (58) Board Member Portfolios Overseen: 92 | | Retired; formerly President (2005 – 2016), Global Chief Operating Officer (2014– 2016), Chief Investment Officer – Global Head of Fixed Income (1998-2014), and various portfolio manager roles (1986-2006), Manulife Asset Management U.S. | | Director, Manulife Trust Company (since 2011); formerly Director, Manulife Asset Management Limited (2015-2017); formerly Chairman of the Board of Directors of Manulife Asset Management U.S. (2005-2016); formerly Chairman of the Board, Declaration Investment Management and Research (2008-2016). | | Since September 2017 |
| | | | |
Keith F. Hartstein (62) Board Member & Independent Chair Portfolios Overseen: 93 | | Retired; Member (since November 2014) of the Governing Council of the Independent Directors Council (organization of independent mutual fund directors); formerly President and Chief Executive Officer (2005-2012), Senior Vice President (2004-2005), Senior Vice President of Sales and Marketing (1997-2004), and various executive management positions (1990-1997), John Hancock Funds, LLC (asset management); Chairman, Investment Company Institute’s Sales Force Marketing Committee (2003-2008). | | None. | | Since September 2013 |
Visit our website at pgiminvestments.com
| | | | | | |
| Independent Board Members | | | | |
| | | | |
Name, Address, Age Position(s) Portfolios Overseen | | Principal Occupation(s) During Past Five Years | | Other Directorships Held During Past Five Years | | Length of Board Service |
| | | | |
Laurie Simon Hodrick (56) Board Member Portfolios Overseen: 92 | | A. Barton Hepburn Professor Emerita of Economics in the Faculty of Business, Columbia Business School (since 2018); Visiting Professor of Law, Stanford Law School (since 2015); Visiting Fellow at the Hoover Institution, Stanford University (since 2015); Sole Member, ReidCourt LLC (since 2008) (a consulting firm); formerly A. Barton Hepburn Professor of Economics in the Faculty of Business, Columbia Business School (1996-2017); formerly Managing Director, Global Head of Alternative Investment Strategies, Deutsche Bank (2006-2008). | | Independent Director, Corporate Capital Trust (since April 2017) (a business development company); Independent Director, Kabbage, Inc. (since July 2018) (financial services). | | Since September 2017 |
| | | | |
Michael S. Hyland, CFA (73) Board Member Portfolios Overseen: 93 | | Retired (since February 2005); formerly Senior Managing Director (July 2001-February 2005) of Bear Stearns & Co, Inc.; Global Partner, INVESCO (1999-2001); Managing Director and President of Salomon Brothers Asset Management (1989-1999). | | None. | | Since July 2008 |
| | | | |
Richard A. Redeker (75) Board Member Portfolios Overseen: 93 | | Retired Mutual Fund Senior Executive (50 years); Management Consultant; Director, Mutual Fund Directors Forum (since 2014); Independent Directors Council (organization of independent mutual fund directors)-Executive Committee, Chair of Policy Steering Committee, Governing Council. | | None. | | Since October 1993 |
PGIM QMA Large-Cap Core Equity Fund
| | | | | | |
| Independent Board Members | | | | |
| | | | |
Name, Address, Age Position(s) Portfolios Overseen | | Principal Occupation(s) During Past Five Years | | Other Directorships Held During Past Five Years | | Length of Board Service |
| | | | |
Brian K. Reid (56)# Board Member Portfolios Overseen: 92 | | Retired; formerly Chief Economist for the Investment Company Institute (ICI) (2005-2017); formerly Senior Economist and Director of Industry and Financial Analysis at the ICI (1998-2004); formerly Senior Economist, Industry and Financial Analysis at the ICI (1996-1998); formerly Staff Economist at the Federal Reserve Board (1989-1996); Director, ICI Mutual Insurance Company (2012-2017). | | None. | | Since March 2018 |
| # | Mr. Reid joined the Board effective as of March 1, 2018. |
| | | | | | |
| Interested Board Members | | | | |
| | | | |
Name, Address, Age Position(s) Portfolios Overseen | | Principal Occupation(s) During Past Five Years | | Other Directorships Held During Past Five Years | | Length of
Board Service |
| | | | |
Stuart S. Parker (56) Board Member & President Portfolios Overseen: 93 | | President of PGIM Investments LLC (formerly known as Prudential Investments LLC) (since January 2012); Executive Vice President of Prudential Investment Management Services LLC (since December 2012); formerly Executive Vice President of Jennison Associates LLC and Head of Retail Distribution of PGIM Investments LLC (June 2005-December 2011). | | None. | | Since January 2012 |
Visit our website at pgiminvestments.com
| | | | | | |
| Interested Board Members | | | | |
| | | | |
Name, Address, Age Position(s) Portfolios Overseen | | Principal Occupation(s) During Past Five Years | | Other Directorships Held During Past Five Years | | Length of Board Service |
| | | | |
Scott E. Benjamin (45) Board Member & Vice President Portfolios Overseen:93 | | Executive Vice President (since June 2009) of PGIM Investments LLC; Executive Vice President (June 2009-June 2012) and Vice President (since June 2012) of Prudential Investment Management Services LLC; Executive Vice President (since September 2009) of AST Investment Services, Inc.; Senior Vice President of Product Development and Marketing, PGIM Investments (since February 2006); formerly Vice President of Product Development and Product Management, PGIM Investments LLC (2003-2006). | | None. | | Since March 2010 |
| | | | |
Grace C. Torres* (59) Board Member Portfolios Overseen: 92 | | Retired; formerly Treasurer and Principal Financial and Accounting Officer of the PGIM Funds, Target Funds, Advanced Series Trust, Prudential Variable Contract Accounts and The Prudential Series Fund (1998-June 2014); Assistant Treasurer (March 1999-June 2014) and Senior Vice President (September 1999-June 2014) of PGIM Investments LLC; Assistant Treasurer (May 2003-June 2014) and Vice President (June 2005-June 2014) of AST Investment Services, Inc.; Senior Vice President and Assistant Treasurer (May 2003-June 2014) of Prudential Annuities Advisory Services, Inc. | | Formerly Director (July 2015-January 2018) of Sun Bancorp, Inc. N.A. and Sun National Bank; Director (since January 2018) of OceanFirst Financial Corp. and OceanFirst Bank. | | Since November 2014 |
* Note: Prior to her retirement in 2014, Ms. Torres was employed by PGIM Investments LLC. Due to her prior employment, she is considered to be an “interested person” under the 1940 Act. Ms. Torres is a Non-Management Interested Board Member.
PGIM QMA Large-Cap Core Equity Fund
| | | | |
| Fund Officers(a) | | | | |
| | | |
Name, Address and Age Position with Fund | | Principal Occupation(s) During Past Five Years | | Length of Service as Fund Officer |
| | | |
Raymond A. O’Hara (63) Chief Legal Officer | | Vice President and Corporate Counsel (since July 2010) of Prudential Insurance Company of America (Prudential); Vice President (March 2011-Present) of Pruco Life Insurance Company and Pruco Life Insurance Company of New Jersey; Vice President and Corporate Counsel (March 2011-Present) of Prudential Annuities Life Assurance Corporation; Chief Legal Officer of PGIM Investments LLC (since June 2012); Chief Legal Officer of Prudential Mutual Fund Services LLC (since June 2012) and Corporate Counsel of AST Investment Services, Inc. (since June 2012); formerly Assistant Vice President and Corporate Counsel (September 2008-July 2010) of The Hartford Financial Services Group, Inc.; formerly Associate (September 1980-December 1987) and Partner (January 1988–August 2008) of Blazzard & Hasenauer, P.C. (formerly, Blazzard, Grodd & Hasenauer, P.C.). | | Since June 2012 |
| | | |
Chad A. Earnst (43) Chief Compliance Officer | | Chief Compliance Officer (September 2014-Present) of PGIM Investments LLC; Chief Compliance Officer (September 2014-Present) of the PGIM Funds, Target Funds, Advanced Series Trust, The Prudential Series Fund, Prudential’s Gibraltar Fund, Inc., PGIM Global Short Duration High Yield Income Fund, Inc., PGIM Short Duration High Yield Fund, Inc. and PGIM Jennison MLP Income Fund, Inc.; formerly Assistant Director (March 2010-August 2014) of the Asset Management Unit, Division of Enforcement, US Securities & Exchange Commission; Assistant Regional Director (January 2010-August 2014), Branch Chief (June 2006–December 2009) and Senior Counsel (April 2003-May 2006) of the Miami Regional Office, Division of Enforcement, US Securities & Exchange Commission. | | Since September 2014 |
| | | |
Dino Capasso (44) Deputy Chief Compliance Officer | | Vice President and Deputy Chief Compliance Officer (June 2017-Present) of PGIM Investments LLC; formerly, Senior Vice President and Senior Counsel (January 2016-June 2017), and Vice President and Counsel (February 2012-December 2015) of Pacific Investment Management Company LLC. | | Since March 2018 |
| | | |
Andrew R. French (56) Secretary | | Vice President and Corporate Counsel (since February 2010) of Prudential; formerly Director and Corporate Counsel (2006-2010) of Prudential; Vice President and Assistant Secretary (since January 2007) of PGIM Investments LLC; Vice President and Assistant Secretary (since January 2007) of Prudential Mutual Fund Services LLC. | | Since October 2006 |
Visit our website at pgiminvestments.com
| | | | |
| Fund Officers(a) | | | | |
| | | |
Name, Address and Age Position with Fund | | Principal Occupation(s) During Past Five Years | | Length of Service as Fund Officer |
| | | |
Jonathan D. Shain (60) Assistant Secretary | | Vice President and Corporate Counsel (since August 1998) of Prudential; Vice President and Assistant Secretary (since May 2001) of PGIM Investments LLC; Vice President and Assistant Secretary (since February 2001) of Prudential Mutual Fund Services LLC; formerly Vice President and Assistant Secretary (May 2003-June 2005) of AST Investment Services, Inc. | | Since May 2005 |
| | | |
Claudia DiGiacomo (44) Assistant Secretary | | Vice President and Corporate Counsel (since January 2005) of Prudential; Vice President and Assistant Secretary of PGIM Investments LLC (since December 2005); formerly Associate at Sidley Austin Brown & Wood LLP (1999-2004). | | Since December 2005 |
| | | |
Charles H. Smith (45) Anti-Money Laundering Compliance Officer | | Vice President, Corporate Compliance, Anti-Money Laundering Unit (since January 2015) of Prudential; committee member of the American Council of Life Insurers Anti-Money Laundering and Critical Infrastructure Committee (since January 2016); formerly Global Head of Economic Sanctions Compliance at AIG Property Casualty (February 2007 – December 2014); Assistant Attorney General at the New York State Attorney General’s Office, Division of Public Advocacy. (August 1998 —January 2007). | | Since January 2017 |
| | | |
Brian D. Nee (52) Treasurer and Principal Financial and Accounting Officer | | Vice President and Head of Finance of PGIM Investments LLC (since August 2015) and PGIM Global Partners (since February 2017); formerly, Vice President, Treasurer’s Department of Prudential (September 2007-August 2015). | | Since July 2018 |
| | | |
Peter Parrella (60) Assistant Treasurer | | Vice President (since 2007) and Director (2004-2007) within Prudential Mutual Fund Administration; formerly Tax Manager at SSB Citi Fund Management LLC (1997-2004). | | Since June 2007 |
| | | |
Lana Lomuti (51) Assistant Treasurer | | Vice President (since 2007) and Director (2005-2007), within Prudential Mutual Fund Administration; formerly Assistant Treasurer (December 2007-February 2014) of The Greater China Fund, Inc. | | Since April 2014 |
| | | |
Linda McMullin (57) Assistant Treasurer | | Vice President (since 2011) and Director (2008-2011) within Prudential Mutual Fund Administration. | | Since April 2014 |
| | | |
Kelly A. Coyne (50) Assistant Treasurer | | Director, Investment Operations of Prudential Mutual Fund Services LLC (since 2010). | | Since March 2015 |
(a) Excludes Mr. Parker and Mr. Benjamin, interested Board Members who also serve as President and Vice President, respectively.
Explanatory Notes to Tables:
| ∎ | | Board Members are deemed to be “Interested,” as defined in the 1940 Act, by reason of their affiliation with PGIM Investments LLC and/or an affiliate of PGIM Investments LLC. |
| ∎ | | Unless otherwise noted, the address of all Board Members and Officers is c/o PGIM Investments LLC, 655 Broad Street, Newark, New Jersey 07102-4410. |
| ∎ | | There is no set term of office for Board Members or Officers. The Board Members have adopted a retirement policy, which calls for the retirement of Board Members on December 31 of the year in which they reach the age of 75. |
PGIM QMA Large-Cap Core Equity Fund
| ∎ | | “Other Directorships Held” includes only directorships of companies required to register or file reports with the SEC under the 1934 Act (that is, “public companies”) or other investment companies registered under the 1940 Act. |
| ∎ | | “Portfolios Overseen” includes all investment companies managed by PGIM Investments LLC. The investment companies for which PGIM Investments LLC serves as manager include the PGIM Funds, The Prudential Variable Contract Accounts, PGIM ETF Trust, PGIM Short Duration High Yield Fund, Inc., PGIM Global Short Duration High Yield Fund, Inc., The Prudential Series Fund, Prudential’s Gibraltar Fund, Inc. and the Advanced Series Trust. |
Visit our website at pgiminvestments.com
Approval of Advisory Agreements (unaudited)
The Fund’s Board of Trustees
The Board of Trustees (the “Board”) of PGIM QMA Large-Cap Core Equity Fund (the “Fund”)1 consists of twelve individuals, nine of whom are not “interested persons” of the Fund, as defined in the Investment Company Act of 1940, as amended (the “1940 Act”) (the “Independent Trustees”). The Board is responsible for the oversight of the Fund and its operations, and performs the various duties imposed on the directors of investment companies by the 1940 Act. The Independent Trustees have retained independent legal counsel to assist them in connection with their duties. The Chair of the Board is an Independent Trustee. The Board has established four standing committees: the Audit Committee, the Nominating and Governance Committee, and two Investment Committees. Each committee is chaired by, and composed of, Independent Trustees.
Annual Approval of the Fund’s Advisory Agreements
As required under the 1940 Act, the Board determines annually whether to renew the Fund’s management agreement with PGIM Investments LLC (“PGIM Investments”) and the Fund’s subadvisory agreement with Quantitative Management Associates LLC (“QMA”). In considering the renewal of the agreements, the Board, including all of the Independent Trustees, met on June 7, 2018 and on June 19-21, 2018 and approved the renewal of the agreements through July 31, 2019, after concluding that the renewal of the agreements was in the best interests of the Fund and its shareholders.
In advance of the meetings, the Board received materials relating to the agreements, and had the opportunity to ask questions and request further information in connection with its consideration. Among other things, the Board considered comparative fee information from PGIM Investments and QMA. Also, the Board considered comparisons with other mutual funds in relevant Peer Universes and Peer Groups, as is further discussed below.
In approving the agreements, the Board, including the Independent Trustees advised by independent legal counsel, considered the factors it deemed relevant, including the nature, quality and extent of services provided by PGIM Investments and the subadviser, the performance of the Fund, the profitability of PGIM Investments and its affiliates, expenses and fees, and the potential for economies of scale that may be shared with the Fund and its shareholders as the Fund’s assets grow. In their deliberations, the Trustees did not identify any single factor which alone was responsible for the Board’s decision to approve the agreements with respect to the Fund. In connection with its deliberations, the Board considered information provided by PGIM Investments throughout the year at regular Board meetings, presentations from portfolio managers and other information, as well as information furnished at or in advance of the meetings on June 7, 2018 and on June 19-21, 2018.
| 1 | PGIM QMA Large-Cap Core Equity Fund is a series of Prudential Investment Portfolios 9. |
| | |
| PGIM QMA Large-Cap Core Equity Fund |
Approval of Advisory Agreements (continued)
The Trustees determined that the overall arrangements between the Fund and PGIM Investments, which serves as the Fund’s investment manager pursuant to a management agreement, and between PGIM Investments and QMA, which serves as the Fund’s subadviser pursuant to the terms of a subadvisory agreement with PGIM Investments, are in the best interests of the Fund and its shareholders in light of the services performed, fees charged and such other matters as the Trustees considered relevant in the exercise of their business judgment.
The material factors and conclusions that formed the basis for the Trustees’ reaching their determinations to approve the continuance of the agreements are separately discussed below.
Nature, Quality and Extent of Services
The Board received and considered information regarding the nature, quality and extent of services provided to the Fund by PGIM Investments and QMA. The Board considered the services provided by PGIM Investments, including but not limited to the oversight of the subadviser for the Fund, as well as the provision of fund recordkeeping, compliance, and other services to the Fund. With respect to PGIM Investments’ oversight of the subadviser, the Board noted that PGIM Investments’ Strategic Investment Research Group (“SIRG”), which is a business unit of PGIM Investments, is responsible for monitoring and reporting to PGIM Investments’ senior management on the performance and operations of the subadviser. The Board also considered that PGIM Investments pays the salaries of all of the officers and interested Trustees of the Fund who are part of Fund management. The Board also considered the investment subadvisory services provided by QMA, including investment research and security selection, as well as adherence to the Fund’s investment restrictions and compliance with applicable Fund policies and procedures. The Board considered PGIM Investments’ evaluation of the subadviser, as well as PGIM Investments’ recommendation, based on its review of the subadviser, to renew the subadvisory agreement.
The Board considered the qualifications, backgrounds and responsibilities of PGIM Investments’ senior management responsible for the oversight of the Fund and QMA, and also considered the qualifications, backgrounds and responsibilities of QMA’s portfolio managers who are responsible for the day-to-day management of the Fund’s portfolio. The Board was provided with information pertaining to PGIM Investments’ and QMA’s organizational structure, senior management, investment operations, and other relevant information pertaining to both PGIM Investments and QMA. The Board also noted that it received favorable compliance reports from the Fund’s Chief Compliance Officer (“CCO”) as to both PGIM Investments and QMA. The Board noted that QMA is affiliated with PGIM Investments.
| | |
| Visit our website at pgiminvestments.com | | |
The Board concluded that it was satisfied with the nature, extent and quality of the investment management services provided by PGIM Investments and the subadvisory services provided to the Fund by QMA, and that there was a reasonable basis on which to conclude that the Fund benefits from the services provided by PGIM Investments and QMA under the management and subadvisory agreements.
Costs of Services and Profits Realized by PGIM Investments
The Board was provided with information on the profitability of PGIM Investments and its affiliates in serving as the Fund’s investment manager. The Board discussed with PGIM Investments the methodology utilized in assembling the information regarding profitability and considered its reasonableness. The Board recognized that it is difficult to make comparisons of profitability from fund management contracts because comparative information is not generally publicly available and is affected by numerous factors, including the structure of the particular adviser, the types of funds it manages, its business mix, numerous assumptions regarding allocations and the adviser’s capital structure and cost of capital. However, the Board considered that the cost of services provided by PGIM Investments during the year ended December 31, 2017 exceeded the management fees paid by the Fund, resulting in an operating loss to PGIM Investments. Taking these factors into account, the Board concluded that the profitability of PGIM Investments and its affiliates in relation to the services rendered was not unreasonable.
Economies of Scale
The Board received and discussed information concerning economies of scale that PGIM Investments may realize as the Fund’s assets grow beyond current levels. The Board noted that the management fee schedule for the Fund includes breakpoints, which have the effect of decreasing the fee rate as assets increase. During the course of time, the Board has considered information regarding the launch date of the Fund, the management fees of the Fund compared to those of similarly managed funds and PGIM Investments’ investment in the Fund over time. The Board noted that economies of scale can be shared with the Fund in other ways, including low management fees from inception, additional technological and personnel investments to enhance shareholder services, and maintaining existing expense structures in the face of a rising cost environment. The Board also considered PGIM Investments’ assertion that it continually evaluates the management fee schedule of the Fund and the potential to share economies of scale through breakpoints or fee waivers as asset levels increase.
The Board recognized the inherent limitations of any analysis of economies of scale, stemming largely from the Board’s understanding that most of PGIM Investments’ costs are not specific to individual funds, but rather are incurred across a variety of products and services.
| | |
| PGIM QMA Large-Cap Core Equity Fund |
Approval of Advisory Agreements (continued)
Other Benefits to PGIM Investments and QMA
The Board considered potential ancillary benefits that might be received by PGIM Investments, QMA and their affiliates as a result of their relationship with the Fund. The Board concluded that potential benefits to be derived by PGIM Investments included transfer agency fees received by the Fund’s transfer agent (which is affiliated with PGIM Investments), and benefits to its reputation as well as other intangible benefits resulting from PGIM Investments’ association with the Fund. The Board concluded that the potential benefits to be derived by QMA included its ability to use soft dollar credits, as well as the potential benefits consistent with those generally resulting from an increase in assets under management, specifically, potential access to additional research resources and benefits to its reputation. The Board concluded that the benefits derived by PGIM Investments and QMA were consistent with the types of benefits generally derived by investment managers and subadvisers to mutual funds.
Performance of the Fund / Fees and Expenses
The Board considered certain additional specific factors and made related conclusions relating to the historical performance of the Fund for the one-, three-, five- and ten-year periods ended December 31, 2017.
The Board also considered the Fund’s actual management fee, as well as the Fund’s net total expense ratio, for the fiscal year ended October 31, 2017. The Board considered the management fee for the Fund as compared to the management fee charged by PGIM Investments to other funds and the fee charged by other advisers to comparable mutual funds in a Peer Group. The actual management fee represents the fee rate actually paid by Fund shareholders and includes any fee waivers or reimbursements. The net total expense ratio for the Fund represents the actual expense ratio incurred by Fund shareholders.
The mutual funds included in the Peer Universe, which was used to consider performance, and the Peer Group, which was used to consider expenses and fees, were objectively determined by Broadridge, an independent provider of mutual fund data. In certain circumstances, PGIM Investments also may have provided supplemental Peer Universe or Peer Group information for reasons addressed with the Board. The comparisons placed the Fund in various quartiles, with the first quartile being the best 25% of the mutual funds (for performance, the best performing mutual funds and, for expenses, the lowest cost mutual funds).
The section below summarizes key factors considered by the Board and the Board’s conclusions regarding the Fund’s performance, fees and overall expenses. The table sets forth gross performance comparisons (which do not reflect the impact on performance of fund expenses, or any subsidies, expense caps or waivers that may be applicable) with the
| | |
| Visit our website at pgiminvestments.com | | |
Peer Universe, actual management fees with the Peer Group (which reflect the impact of any subsidies or fee waivers), and net total expenses with the Peer Group, each of which were key factors considered by the Board.
| | | | | | | | |
Gross
Performance | | 1 Year | | 3 Years | | 5 Years | | 10 Years |
| | 2nd Quartile | | 1st Quartile | | 1st Quartile | | 2nd Quartile |
| Actual Management Fees: 1st Quartile |
| Net Total Expenses: 1st Quartile |
| | • | | The Board noted that the Fund outperformed its benchmark index over all periods. |
| | • | | The Board and PGIM Investments agreed to retain the existing contractual expense cap, which (exclusive of certain fees and expenses) caps the Fund’s net annual operating expenses at 0.35% for each class of the Fund’s shares through February 28, 2019. |
| | • | | The Board concluded that, in light of the above, it would be in the best interests of the Fund and its shareholders to renew the agreements. |
| | • | | The Board concluded that the management fees (including subadvisory fees) and total expenses were reasonable in light of the services provided. |
* * *
After full consideration of these factors, the Board concluded that the approval of the agreements was in the best interests of the Fund and its shareholders.
| | |
| PGIM QMA Large-Cap Core Equity Fund |
| | | | |
| ∎ MAIL | | ∎ TELEPHONE | | ∎ WEBSITE |
655 Broad Street Newark, NJ 07102 | | (800) 225-1852 | | www.pgiminvestments.com |
|
| PROXY VOTING |
| The Board of Trustees of the Fund has delegated to the Fund’s subadviser the responsibility for voting any proxies and maintaining proxy recordkeeping with respect to the Fund. A description of these proxy voting policies and procedures is available without charge, upon request, by calling (800) 225-1852. Information regarding how the Fund voted proxies relating to portfolio securities during the most recent 12-month period ended June 30 is available on the Fund’s website and on the Securities and Exchange Commission’s website. |
|
| TRUSTEES |
| Ellen S. Alberding • Kevin J. Bannon • Scott E. Benjamin • Linda W. Bynoe • Barry H. Evans • Keith F. Hartstein • Laurie Simon Hodrick • Michael S. Hyland • Stuart S. Parker • Richard A. Redeker • Brian K. Reid • Grace C. Torres |
|
| OFFICERS |
| Stuart S. Parker, President • Scott E. Benjamin, Vice President • Brian D. Nee, Treasurer and Principal Financial and Accounting Officer • Raymond A. O’Hara, Chief Legal Officer • Andrew R. French, Secretary • Chad A. Earnst, Chief Compliance Officer • Dino Capasso, Vice President and Deputy Chief Compliance Officer • Charles H. Smith, Anti-Money Laundering Compliance Officer • Jonathan D. Shain, Assistant Secretary • Claudia DiGiacomo, Assistant Secretary • Peter Parrella, Assistant Treasurer • Lana Lomuti, Assistant Treasurer • Linda McMullin, Assistant Treasurer • Kelly A. Coyne, Assistant Treasurer |
| | | | |
| MANAGER | | PGIM Investments LLC | | 655 Broad Street Newark, NJ 07102 |
|
| SUBADVISER | | Quantitative Management Associates LLC | | Gateway Center Two
100 Mulberry Street
Newark, NJ 07102 |
|
| DISTRIBUTOR | | Prudential Investment
Management Services LLC | | 655 Broad Street Newark, NJ 07102 |
|
| CUSTODIAN | | The Bank of New York Mellon | | 225 Liberty Street
New York, NY 10286 |
|
| TRANSFER AGENT | | Prudential Mutual Fund
Services LLC | | PO Box 9658
Providence, RI 02940 |
|
INDEPENDENT REGISTERED
PUBLIC ACCOUNTING FIRM | | KPMG LLP | | 345 Park Avenue
New York, NY 10154 |
|
| FUND COUNSEL | | Willkie Farr & Gallagher LLP | | 787 Seventh Avenue
New York, NY 10019 |
|
|
| An investor should consider the investment objectives, risks, charges, and expenses of the Fund carefully before investing. The prospectus and summary prospectus contain this and other information about the Fund. An investor may obtain a prospectus and summary prospectus by visiting our website at www.pgiminvestments.com or by calling (800) 225-1852. The prospectus and summary prospectus should be read carefully before investing. |
|
| E-DELIVERY |
| To receive your mutual fund documents online, go to www.pgiminvestments.com/edelivery and enroll. Instead of receiving printed documents by mail, you will receive notification via email when new materials are available. You can cancel your enrollment or change your email address at any time by visiting the website address above. |
|
| SHAREHOLDER COMMUNICATIONS WITH TRUSTEES |
| Shareholders can communicate directly with the Board of Trustees by writing to the Chair of the Board, PGIM QMA Large-Cap Core Equity Fund, PGIM Investments, Attn: Board of Trustees, 655 Broad Street, Newark, NJ 07102. Shareholders can communicate directly with an individual Trustee by writing to the same address. Communications are not screened before being delivered to the addressee. |
|
| AVAILABILITY OF PORTFOLIO SCHEDULE |
| The Fund files its complete schedule of portfolio holdings with the Securities and Exchange Commission for the first and third quarters of each fiscal year on Form N-Q. The Fund’s Forms N-Q are available on the Commission’s website at www.sec.gov. The Fund’s schedule of portfolio holdings is also available on the Fund’s website as of the end of each month no sooner than 15 days after the end of the month. |
|
| The Fund’s Statement of Additional Information contains additional information about the Fund’s Trustees and is available without charge, upon request, by calling (800) 225-1852. |
Mutual Funds:
| | | | |
ARE NOT INSURED BY THE FDIC OR ANY
FEDERAL GOVERNMENT AGENCY | | MAY LOSE VALUE | | ARE NOT A DEPOSIT OF OR GUARANTEED
BY ANY BANK OR ANY BANK AFFILIATE |
PGIM QMA LARGE-CAP CORE EQUITY FUND
| | | | | | | | | | |
| SHARE CLASS | | A | | B | | C | | Z | | R6* |
| NASDAQ | | PTMAX | | PTMBX | | PTMCX | | PTEZX | | PTMQX |
| CUSIP | | 74441J100 | | 74441J209 | | 74441J308 | | 74441J407 | | 74441J688 |
*Formerly known as Class Q shares.
MF187E

PGIM REAL ESTATE INCOME FUND
(Formerly known as Prudential Real Estate Income Fund)
ANNUAL REPORT
OCTOBER 31, 2018
COMING SOON: PAPERLESS SHAREHOLDER REPORTS
Beginning on January 1, 2021, as permitted by regulations adopted by the Securities and Exchange Commission, paper copies of the Fund’s annual and semi-annual shareholder reports will no longer be sent by mail, unless you specifically request paper copies of the reports. Instead, the reports will be made available on the Fund’s website (www.pgiminvestments.com), and you will be notified by mail each time a report is posted and provided with a website link to access the report.
If you already elected to receive shareholder reports electronically, you will not be affected by this change and you need not take any action. You may elect to receive shareholder reports and other communications from the Fund electronically anytime by contacting your financial intermediary (such as a broker-dealer or bank) or, if you are a direct investor, by calling 1-800-225-1852 or by sending an e-mail request to PGIM Investments at shareholderreports@pgim.com.
Beginning on January 1, 2019, you may elect to receive all future reports in paper free of charge. If you invest through a financial intermediary, you can contact your financial intermediary or follow instructions included with this notice to elect to continue to receive paper copies of your shareholder reports. If you invest directly with the Fund, you can call 1-800-225-1852 or send an email request to shareholderreports@pgim.com to let the Fund know you wish to continue receiving paper copies of your shareholder reports. Your election to receive reports in paper will apply to all funds held in your account if you invest through your financial intermediary or all funds held with the fund complex if you invest directly with the Fund.

To enroll in e-delivery, go to pgiminvestments.com/edelivery
|
| Objective: To seek income and capital appreciation |
Highlights (unaudited)
| • | | While stock selection was modestly positive, asset allocation drove the Fund’s underperformance during the reporting period. On a regional basis, Asia and Europe underperformed while North America outperformed. |
| • | | Within North America, the US health care sector drove the region’s outperformance. Stock selection was notably strong, although the Fund’s significant overweight allocation to health care stocks was a drag on relative performance. |
| • | | The US office and hotel sectors also performed well on a relative basis. Conversely, stock selection in malls and triple net leases was negative. |
| • | | The majority of Europe’s relative underperformance was derived from two countries—the UK and Germany. |
| • | | Similarly, Asia underperformed due to weak showings in three countries—Singapore, Australia, and Japan. Australia also had negative relative performance for the period. Only Hong Kong outperformed during the period in this region. |
This report is not authorized for distribution to prospective investors unless preceded or accompanied by a current prospectus.
The views expressed in this report and information about the Fund’s portfolio holdings are for the period covered by this report and are subject to change thereafter.
Mutual funds are distributed by Prudential Investment Management Services LLC (PIMS). PGIM Real Estate is a unit of PGIM, Inc. (PGIM), a registered investment adviser. PIMS and PGIM are Prudential Financial companies. © 2018 Prudential Financial, Inc. and its related entities. PGIM Real Estate, PGIM, and the PGIM logo are service marks of Prudential Financial, Inc. and its related entities, registered in many jurisdictions worldwide.
| | |
| 2 | | Visit our website at pgiminvestments.com |
PGIM FUNDS — UPDATE
The Board of Directors/Trustees for the Fund has approved the implementation of an automatic conversion feature for Class C shares, effective as of April 1, 2019. To reflect these changes, effective April 1, 2019, the section of the Fund’s Prospectus entitled “How to Buy, Sell and Exchange Fund Shares—How to Exchange Your Shares—Frequent Purchases and Redemptions of Fund Shares” is restated to read as follows:
This supplement should be read in conjunction with your Summary Prospectus, Statutory Prospectus and Statement of Additional Information, be retained for future reference and is in addition to any existing Fund supplements.
| | 1. | In each Fund’s Statutory Prospectus, the following is added at the end of the section entitled “Fund Distributions And Tax Issues—If You Sell or Exchange Your Shares”: |
Automatic Conversion of Class C Shares
The conversion of Class C shares into Class A shares—which happens automatically approximately 10 years after purchase—is not a taxable event for federal income tax purposes. For more information about the automatic conversion of Class C shares, see Class C Shares Automatically Convert to Class A Shares in How to Buy, Sell and Exchange Fund Shares.
| | 2. | In each Fund’s Statutory Prospectus, the following sentence is added at the end of the section entitled “How to Buy, Sell and Exchange Shares—Closure of Certain Share Classes to New Group Retirement Plans”: |
Shareholders owning Class C shares may continue to hold their Class C shares until the shares automatically convert to Class A shares under the conversion schedule, or until the shareholder redeems their Class C shares.
| | 3. | In each Fund’s Statutory Prospectus, the following disclosure is added immediately following the section entitled “How to Buy, Sell and Exchange Shares—How to Buy Shares—Class B Shares Automatically Convert to Class A Shares”: |
Class C Shares Automatically Convert to Class A Shares
Starting on or about April 1, 2019 (the “Effective Date”), Class C shares will be eligible for automatic conversion into Class A shares on a monthly basis approximately ten years after the original date of purchase (the “Conversion Date”). Conversion will take place based on the relative NAV of the two classes, without the imposition of any sales load, fee or other charge. All such automatic conversions of Class C shares will constitute tax-free exchanges for federal income tax purposes.
For shareholders investing in Class C shares through retirement plans or omnibus accounts, and in certain other instances, the Fund and its agents may not have
| | | | |
| PGIM Real Estate Income Fund | | | 3 | |
transparency into how long a shareholder has held Class C shares for purposes of determining whether such Class C shares are eligible for automatic conversion into Class A shares, and the relevant financial intermediary may not have the ability to track purchases in order to credit individual shareholders’ holding periods. In these circumstances, the Fund will not be able to automatically convert Class C shares into Class A shares as described above. In order to determine eligibility for conversion in these circumstances, it is the responsibility of the financial intermediary to notify the Fund that the shareholder is eligible for the conversion of Class C shares to Class A shares, and the financial intermediary may be required to maintain and provide the Fund with records that substantiate the holding period of Class C shares. It is the financial intermediary’s (and not the Fund’s) responsibility to keep records of transactions made in accounts it holds and to ensure that the shareholder is credited with the proper holding period based on such records or those provided to the financial intermediary by the shareholder. Please consult with your financial intermediary for the applicability of this conversion feature to your shares.
A financial intermediary may sponsor and/or control accounts, programs or platforms that impose a different conversion schedule or different eligibility requirements for the exchange of Class C shares for Class A shares (see Appendix A: Waivers and Discounts Available From Certain Financial Intermediaries of the Prospectus). Please consult with your financial intermediary if you have any questions regarding your shares’ conversion from Class C shares to Class A shares.
| | 4. | In Part II of each Fund’s Statement of Additional Information, the following disclosure is added immediately following the section entitled “Purchase, Redemption and Pricing of Fund Shares—Share Classes—Automatic Conversion of Class B Shares”: |
AUTOMATIC CONVERSION OF CLASS C SHARES. Starting on or about April 1, 2019 (the “Effective Date”), Class C shares will be eligible for automatic conversion into Class A shares on a monthly basis approximately ten years after the original date of purchase (the “Conversion Date”). Conversion will take place based on the relative NAV of the two classes, without the imposition of any sales load, fee or other charge. Class C shares of a Fund acquired through automatic reinvestment of dividends or distributions will convert to Class A shares of the Fund on the Conversion Date pro rata with the converting Class C shares of the Fund that were not acquired through reinvestment of dividends or distributions. All such automatic conversions of Class C shares will constitute tax-free exchanges for federal income tax purposes.
For shareholders investing in Class C shares through retirement plans or omnibus accounts, and in certain other instances, the Fund and its agents may not have transparency into how long a shareholder has held Class C shares for purposes of determining whether such Class C shares are eligible for automatic conversion into Class A shares, and the relevant financial intermediary may not have the ability to track purchases in order to credit individual shareholders’ holding periods. In these circumstances, the
| | |
| 4 | | Visit our website at pgiminvestments.com |
Fund will not be able to automatically convert Class C shares into Class A shares as described above. In order to determine eligibility for conversion in these circumstances, it is the responsibility of the financial intermediary to notify the Fund that the shareholder is eligible for the conversion of Class C shares to Class A shares, and the financial intermediary may be required to maintain and provide the Fund with records that substantiate the holding period of Class C shares. It is the financial intermediary’s (and not the Fund’s) responsibility to keep records of transactions made in accounts it holds and to ensure that the shareholder is credited with the proper holding period based on such records or those provided to the financial intermediary by the shareholder. Please consult with your financial intermediary for the applicability of this conversion feature to your shares.
Class C shares were generally closed to investments by new group retirement plans effective June 1, 2018. Group retirement plans (and their successor, related and affiliated plans) that have Class C shares of the Fund available to participants on or before the Effective Date may continue to open accounts for new participants in such share class and purchase additional shares in existing participant accounts.
The Fund has no responsibility for monitoring or implementing a financial intermediary’s process for determining whether a shareholder meets the required holding period for conversion. A financial intermediary may sponsor and/or control accounts, programs or platforms that impose a different conversion schedule or different eligibility requirements for the exchange of Class C shares for Class A shares, as set forth on Appendix A: Waivers and Discounts Available From Certain Financial Intermediaries of the Prospectus. In these cases, Class C shareholders may have their shares exchanged for Class A shares under the policies of the financial intermediary. Financial intermediaries will be responsible for making such exchanges in those circumstances. Please consult with your financial intermediary if you have any questions regarding your shares’ conversion from Class C shares to Class A shares.
LR1094
- Not part of the Annual Report -
| | | | |
| PGIM Real Estate Income Fund | | | 5 | |
Table of Contents
| | |
| 6 | | Visit our website at pgiminvestments.com |
Letter from the President

Dear Shareholder:
We hope you find the annual report for PGIM Real Estate Income Fund informative and useful. The report covers performance for the 12-month period that ended October 31, 2018.
We have important information to share with you. Effective June 11, 2018, Prudential Mutual Funds were renamed PGIM Funds. This renaming is part of our ongoing effort to further build our reputation and establish our global brand, which began when our firm adopted PGIM Investments as its name in April 2017. Please note that only the Fund’s name has changed. Your Fund’s management and operation, along with its symbols, remained the same.*
During the reporting period, the global economy continued to grow, and central banks gradually tightened monetary policy. In the US, the economy expanded and employment increased. In September, the Federal Reserve hiked interest rates for the eighth time since 2015, based on confidence in the economy.
Equity returns on the whole were strong, due to optimistic earnings expectations and investor sentiment. Global equities, including emerging markets, generally posted positive returns. However, they trailed the performance of US equities, which rose on higher corporate profits, new regulatory policies, and tax reform benefits. Volatility spiked briefly early in the period on inflation concerns, rising interest rates, and a potential global trade war, and again late in the period on worries that profit growth might slow in 2019.
The overall bond market declined modestly during the period, as measured by the Bloomberg Barclays US Aggregate Bond Index. The best performance came from higher-yielding, economically sensitive sectors, such as high yield bonds and bank loans, which posted small gains. US investment-grade corporate bonds and US Treasury bonds both finished the period with negative returns. A major trend during the period was the flattening of the US Treasury yield curve, which increased the yield on fixed income investments with shorter maturities and made them more attractive to investors.
Regarding your investments with PGIM, we believe it is important to maintain a diversified portfolio of funds consistent with your tolerance for risk, time horizon, and financial goals. Your financial advisor can help you create a diversified investment plan that may include funds covering all the basic asset classes and that reflects your personal investor profile and risk tolerance. However, diversification and asset allocation strategies do not assure a profit or protect against loss in declining markets.
At PGIM Investments, we consider it a great privilege and responsibility to help investors participate in opportunities across global markets while meeting their toughest investment challenges. PGIM is a top-10 global investment manager with more than $1 trillion in assets under management. This investment expertise allows us to deliver actively managed funds and strategies to meet the needs of investors around the globe.
Thank you for choosing our family of funds.
Sincerely,

Stuart S. Parker, President
PGIM Real Estate Income Fund
December 14, 2018
*The Prudential Day One Funds did not change their names.
| | | | |
| PGIM Real Estate Income Fund | | | 7 | |
Your Fund’s Performance (unaudited)
Performance data quoted represents past performance. Past performance does not guarantee future results. The investment return and principal value of an investment will fluctuate, so that an investor’s shares, when redeemed, may be worth more or less than their original cost. Current performance may be lower or higher than the past performance data quoted. An investor may obtain performance data as of the most recent month-end by visiting our website at www.pgiminvestments.com or by calling (800) 225-1852.
| | | | | | |
| | | Average Annual Total Returns as of 10/31/18 (with sales charges) | |
| | | One Year (%) | | Since Inception (%) | |
| Class A | | –8.48 | | | –0.08 (6/3/15) | |
| Class C | | –4.76 | | | 0.86 (6/3/15) | |
| Class Z | | –2.70 | | | 1.90 (6/3/15) | |
| Class R6* | | –2.81 | | | 2.37 (12/28/16) | |
| Custom Blend Index | | | | | | |
| | –0.14 | | | — | |
| Lipper Global Real Estate Funds Average | |
| | | –0.12 | | | — | |
| | | | | | |
| | | Average Annual Total Returns as of 10/31/18
(without sales charges) | |
| | | One Year (%) | | Since Inception (%) | |
| Class A | | –3.15 | | | 1.59 (6/3/15) | |
| Class C | | –3.85 | | | 0.86 (6/3/15) | |
| Class Z | | –2.70 | | | 1.90 (6/3/15) | |
| Class R6* | | –2.81 | | | 2.37 (12/28/16) | |
| Custom Blend Index | | | | | | |
| | –0.14 | | | — | |
| Lipper Global Real Estate Funds Average | | | | | | |
| | | –0.12 | | | — | |
| | |
| 8 | | Visit our website at pgiminvestments.com |
Growth of a $10,000 Investment (unaudited)
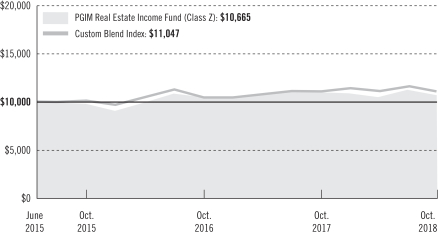
The graph compares a $10,000 investment in the Fund’s Class Z shares with a similar investment in the Custom Blend Index by portraying the initial account values at the commencement of operations for Class Z shares (June 3, 2015) and the account values at the end of the current fiscal year (October 31, 2018) as measured on a quarterly basis. For purposes of the graph, and unless otherwise indicated, it has been assumed that (a) all recurring fees (including management fees) were deducted; and (b) all dividends and distributions were reinvested. The line graph provides information for Class Z shares only. As indicated in the tables provided earlier, performance for other share classes will vary due to the differing charges and expenses applicable to each share class (as indicated in the following paragraphs). Without waiver of fees and/or expense reimbursements, if any, the returns would have been lower.
Past performance does not predict future performance. Total returns and the ending account values in the graph include changes in share price and reinvestment of dividends and capital gains distributions in a hypothetical investment for the periods shown. The Fund’s total returns do not reflect the deduction of income taxes on an individual’s investment. Taxes may reduce your actual investment returns on income or gains paid by the Fund or any gains you may realize if you sell your shares.
Source: PGIM Investments LLC and Lipper Inc.
*Formerly known as Class Q shares.
Since Inception returns are provided since the Fund has less than 10 fiscal years of returns. Since Inception returns for the Index and the Lipper Average are measured from the closest month-end to each class’ inception date.
| | | | |
| PGIM Real Estate Income Fund | | | 9 | |
Your Fund’s Performance (continued)
The returns in the tables do not reflect the deduction of taxes that a shareholder would pay on Fund distributions or following the redemption of Fund shares. The average annual total returns take into account applicable sales charges, which are described for each share class in the table below.
| | | | | | | | |
| | | Class A | | Class C | | Class Z | | Class R6* |
| Maximum initial sales charge | | 5.50% of the public offering price | | None | | None | | None |
| Contingent deferred sales charge (CDSC) (as a percentage of the lower of original purchase price or net asset value at redemption) | | 1.00% on sales of $1 million or more made within 12 months of purchase | | 1.00% on sales made within 12 months of purchase | | None | | None |
| Annual distribution and service (12b-1) fees (shown as a percentage of average daily net assets) | | 0.30% (0.25% currently) | | 1.00% | | None | | None |
*Formerly known as Class Q shares.
Benchmark Definitions
Custom Blend Index—The Custom Blend Index is a model portfolio consisting of the FTSE EPRA/NAREIT Developed Index (80%), which is an unmanaged index and reflects the stock performance of companies engaged in specific aspects of the major real estate markets/regions of the world; and the ICE BofA Merrill Lynch 7% Constrained REIT Preferred Securities Index (20%), which is an unmanaged index that is a subset of the ICE BofA Merrill Lynch Fixed Rate Preferred Securities Index including all REIT-issued preferred securities. The average annual total returns for the Custom Blend Index measured from the month-end closest to the inception date of the Fund’s Class A, Class C, and Class Z shares are 2.96% and 3.74% for Class R6 shares.
Lipper Global Real Estate Funds Average—The Lipper Global Real Estate Funds Average includes funds that invest at least 25% but less than 75% of their equity portfolios in shares of companies engaged in the real estate industry that are strictly outside of the US or whose securities are principally traded outside of the US. The average annual total returns for the Lipper Average measured from the month-end closest to the inception date of the Fund’s Class A, Class C, and Class Z shares are 2.27% and 3.83% for Class R6 shares.
Investors cannot invest directly in an index or average. The returns for the Index would be lower if they included the effects of sales charges, operating expenses of a mutual fund, or taxes. Returns for the Lipper Average reflect the deduction of operating expenses of a mutual fund, but not sales charges or taxes.
| | |
| 10 | | Visit our website at pgiminvestments.com |
Presentation of Fund Holdings
| | | | |
Five Largest Holdings expressed as a
percentage of net assets as of 10/31/18 (%) | |
MGM Growth Properties LLC, Hotel & Resort REITs | | | 5.4 | |
Columbia Property Trust, Inc., Office REITs | | | 5.3 | |
Sabra Health Care REIT, Inc., Health Care REITs | | | 5.2 | |
| Welltower, Inc., Health Care REITs | | | 5.0 | |
MedEquities Realty Trust, Inc., Health Care REITs | | | 4.7 | |
Holdings reflect only long-term investments and are subject to change.
| | | | |
Five Largest Industries expressed as a
percentage of net assets as of 10/31/18 (%) | |
Health Care | | | 19.8 | |
Office | | | 16.8 | |
| Retail | | | 15.9 | |
| Industrial | | | 15.1 | |
| Hotel & Resort | | | 9.3 | |
Industry weightings reflect only long-term investments and are subject to change.
| | | | |
| PGIM Real Estate Income Fund | | | 11 | |
Strategy and Performance Overview (unaudited)
How did the Fund perform?
The PGIM Real Estate Income Fund’s Class Z shares returned –2.70% in the 12-month reporting period that ended October 31, 2018, underperforming the –0.14% return of the Custom Blend Index (the Index) and the –0.12% return of the Lipper Global Real Estate Funds Average.
What were conditions like in the global real estate securities market?
| • | | Conditions in the US real estate investment trust (REIT) market over the reporting period were balanced as investors weighed both positive and negative factors. Headwinds to the market included a dramatic increase in bond yields, with the 10-year Treasury note climbing about 80 basis points (bps) from 2.37% to 3.14% during the period (one bps equals 0.01%). On the positive side, the fundamentals in the commercial real estate markets were strong, with peak occupancies in multiple property types and steady rent growth. In addition, the US market saw a spike in merger-and-acquisition (M&A) activity, with eight private deals totaling over $50 billion in volume. Against the backdrop of these countervailing forces, the US REIT market was relatively flat over the period. That said, performance among certain sectors varied, with secular growth industries—such as manufactured housing—performing well. In addition, the market saw several underperformers from 2017 bounce back in 2018 as challenged fundamentals were more than offset by attractive valuations in property areas like malls and self-storage. At period end, the US REIT market was trading at about a 5% discount to net asset value (NAV). PGIM Real Estate believes that if the recent spike in market volatility continues, REITs may benefit from investors interested in this discount and in assets that historically have been more defensive in nature than most equity classes. |
| • | | Europe’s total return during the period was basically flat. Political risk was a major worry across Europe, especially in Italy and the United Kingdom (the UK). Italy was the second-worst-performing country in Europe with a total return of –10.5% during the period as concerns grew over the populist coalition government that came into power in April 2018. The new government’s lack of fiscal control unnerved markets and pushed Italian bond yield spreads to near-record levels. The UK market performance of –2.1% during the period reflected the absence of progress in reaching a Brexit deal with the European Union (EU) as the UK’s March 2019 deadline for leaving the EU approaches. France was the worst-performing market in Europe, returning –15.9% during the period. The source of these country returns is the Financial Times Stock Exchange (FTSE) and FactSet; the FTSE data is uploaded to FactSet, which then generates returns for specific countries and regions. The French index is heavily dominated by retail real estate companies that saw share prices under consistently heavy pressure due to a structural shift from in-store sales to online retail sales. While interest rates moved up during the period to counter inflationary pressures in the UK, the low-rate environment has persisted in the eurozone longer than investors originally anticipated, creating downward pressure on capitalization |
| | |
| 12 | | Visit our website at pgiminvestments.com |
| | rates across the region. Still, foreign investor demand in real estate and rental growth momentum were robust across major continental markets during the period. |
| • | | Asia Pacific real estate equities witnessed heightened volatility during the period, driven by considerable risks from multiple macro headwinds: an escalating trade war between the US and China, economic deceleration in China, and rising interest rates. The region’s REIT markets reflected a preference for income stability amid macro concerns. Across the region, the Fund saw robust market fundamentals in the Class-A office sector underpinned by healthy occupier demand and the lack of meaningful supply. Japanese REITs (J-REITs) were outperformers in the region helped by the Bank of Japan’s accommodative monetary policy, which kept Japan’s interest rates at global lows. Despite healthy condominium sales and positive office rental reversions, Japanese developers underperformed the J-REITs market due to macro concerns. Japanese developers, however, outperformed Hong Kong and Singapore developers. In Hong Kong, private home prices weakened amid rising mortgage costs, and bank appraisals of residential units in the city’s 10 major private housing estates declined for the first time in two years. In Singapore, residential cooling measures and a weaker external environment negatively impacted developer share prices. In contrast, Hong Kong commercial landlords performed well on the back of income stability, proactive capital management, and asset disposals. On a relative basis, Australian REITs were the second-best-performing sector in the region on the back of stable Reserve Bank of Australia monetary policy and positive industrial fundamentals. |
What worked and didn’t work?
| • | | While stock selection was modestly positive, asset allocation drove the Fund’s underperformance during the period. On a regional basis, Asia and Europe underperformed while North America outperformed. |
| • | | Within North America, the US health care sector drove the region’s outperformance. Stock selection was notably strong, although the Fund’s significant overweight allocation to health care stocks was a drag on relative performance. The US office and hotel sectors also performed well on a relative basis. Conversely, stock selection in malls and triple net leases was negative. |
| • | | The majority of Europe’s relative underperformance was derived from two countries—the UK and Germany. Stock selection was negative in the UK while an overweight allocation to Germany unfavorably impacted relative results. |
| • | | Similarly, Asia underperformed due to weak showings in three countries—Singapore, Australia, and Japan. Only Hong Kong outperformed during the period in this region. |
| | | | |
| PGIM Real Estate Income Fund | | | 13 | |
Strategy and Performance Overview (continued)
Current outlook
| • | | In North America, PGIM Real Estate believes that REITs will continue posting stable operating fundamentals, with 2%-3% same-store net operating income growth resulting in 5%-7% cash flow and dividend growth in the next year. US REITs offer a valuable combination of income and growth in a volatile market. The increased M&A activity mentioned earlier highlights the desirable attributes of most public equity REIT portfolios. Private equity currently has over $270 billion in committed capital on the sidelines, up over 15% from 2017. As a result, M&A activity may continue if discounts to NAV are not reconciled in the public market. PGIM Real Estate believes the best opportunities may lie with companies that deliver cash flow growth at attractive valuations. It’s a stock picker’s market; and given economic volatility and M&A activity, 2018 remains a good environment for active investment management. The Fund added slightly to its West Coast office overweight based on attractive valuations and continued strong fundamentals. The Fund maintained its overweight to Sunbelt office companies and are overweight in cities that were leading candidates for Amazon.com’s second headquarters. PGIM Real Estate remains cautious on the retail and self-storage markets. While demand has remained resilient in storage, construction starts have not slowed and supply may weigh on results through 2019. The Fund is also overweight in industrial and manufactured housing based on sector-leading cash flow growth and limited supply additions. |
| • | | The outlook for continental Europe’s real estate sector is generally positive. Eurozone economic indicators have stabilized after a period of improvement, and the monetary policy backdrop remains loose even as quantitative easing is gradually withdrawn. The European Central Bank has said it will consider interest rate increases after the middle of next year as inflation in the eurozone looks largely under control. While gross domestic product (GDP) growth forecasts are solid across the eurozone, Ireland, Spain, and the Nordic region stand out as offering the best near-term growth outlooks. The exception to this benign macroeconomic environment is the UK, where the process of the country’s exit from the EU is still uncertain. The March 2019 deadline for the UK’s withdrawal from the EU is moving closer while little progress has been made up to this point. The unofficial deadline for reaching a deal by October 2018 has come and gone. The UK government’s negotiating position is further undermined by its internal political weakness. Brexit macro uncertainty is reflected by a weaker sterling. European real estate stocks continue to offer meaningful discounts to private market values. |
| • | | Notwithstanding current headwinds on trade and interest rates, Asia offers some of the best risk-adjusted real estate returns globally, reflected by capital inflow into the region’s real estate assets. The biggest risk is trade conflict that could derail economic momentum and inject heightened volatility to equity markets. Rising inflationary expectations in the US could, on the other hand, exert pressure on the Federal Reserve (the Fed) to hike interest rates quicker than expected. PGIM Real Estate thinks the |
| | |
| 14 | | Visit our website at pgiminvestments.com |
| | following themes may be pertinent in the coming months: (1) trade war outcome between the US and China, (2) rising bond yield impact on REITs, (3) rising short rates on mortgages (Hong Kong/Singapore residential), (4) lack of quality supply (Singapore/Hong Kong office), (4) accommodative monetary policy (J-REITs), and (5) interest rate differential driving weaker yen (Japanese developers). In the near term, PGIM Real Estate expects markets to remain volatile, subject to the intensity and outcome of the trade conflict as well as the level of Fed hawkishness. With more Fed rate hikes expected, rising inflationary expectations in the US could present upside risk. Within the Fund’s individual sectors, a sharper rise in sovereign bond yields could negatively impact regional REIT valuations. A weaker US dollar versus a stronger yen could negatively impact economic momentum in Japan and underlying demand for condos and office space. On the other hand, reduced expectations of Fed hikes could be positive for Hong Kong and Singapore real estate developers. |
The percentage points shown in the tables below identify each security’s positive or negative contribution to the Fund’s return relative to the benchmark, which is the sum of all contributions by individual holdings.
| | | | | | |
| Top Contributors (%) | | Top Detractors (%) |
| Sabra Health Care REIT Inc. | | 1.90 | | NewRiver REIT plc | | –0.53 |
| Welltower Inc. | | 0.81 | | Washington Prime Group Inc. | | –0.71 |
| Community Healthcare Trust Inc. | | 0.52 | | Cache Logistics Trust | | –0.84 |
| Forest City Realty Trust Inc. Class A | | 0.51 | | EPR Properties | | –0.87 |
| Four Corners Property Trust Inc. | | 0.37 | | MedEquities Realty Trust Inc. | | –1.33 |
| | | | |
| PGIM Real Estate Income Fund | | | 15 | |
Comments on Largest Holdings (unaudited)
| 5.4% | MGM Growth Properties LLC, Hotel & Resort REITs |
MGM Growth Properties operates as a real estate investment trust. The company engages in the acquisition, ownership, and leasing of destination entertainment and leisure resorts, including casino gaming, hotel, convention, dining, retail, and entertainment properties.
| 5.3% | Columbia Property Trust, Inc., Office REITs |
Columbia Property Trust operates as a real estate investment trust. The company focuses on the acquisition, development, ownership, leasing, and operation of office properties. The company serves clients throughout the US.
| 5.2% | Sabra Health Care REIT, Inc., Health care REITs |
Sabra Health Care REIT operates a real estate investment trust. The company owns nursing homes, rehabilitation centers, assisted living facilities, and independent living centers.
| 5.0% | Welltower, Inc., Health care REITs |
Welltower operates as a real estate investment trust, investing in senior housing and health care real estate properties. The company serves customers in the US.
| 4.7% | MedEquities Realty Trust, Inc., Health care REITs |
MedEquities operates as a real estate investment trust. The company focuses on investment in a diversified mix of health care properties and health care-related real estate debt investments. It owns, develops, operates, leases, and disposes of health care properties and portfolios.
| | |
| 16 | | Visit our website at pgiminvestments.com |
Fees and Expenses (unaudited)
As a shareholder of the Fund, you incur two types of costs: (1) transaction costs, including sales charges (loads) on purchase payments and redemptions, as applicable, and (2) ongoing costs, including management fees, distribution and/or service (12b-1) fees, and other Fund expenses, as applicable. This example is intended to help you understand your ongoing costs (in dollars) of investing in the Fund and to compare these costs with the ongoing costs of investing in other mutual funds.
The example is based on an investment of $1,000 held through the six-month period ended October 31, 2018. The example is for illustrative purposes only; you should consult the Prospectus for information on initial and subsequent minimum investment requirements.
Actual Expenses
The first line for each share class in the table on the following page provides information about actual account values and actual expenses. You may use the information on this line, together with the amount you invested, to estimate the expenses that you paid over the period. Simply divide your account value by $1,000 (for example, an $8,600 account value ÷ $1,000 = 8.6), then multiply the result by the number on the first line under the heading “Expenses Paid During the Six-Month Period” to estimate the expenses you paid on your account during this period.
Hypothetical Example for Comparison Purposes
The second line for each share class in the table on the following page provides information about hypothetical account values and hypothetical expenses based on the Fund’s actual expense ratio and an assumed rate of return of 5% per year before expenses, which is not the Fund’s actual return. The hypothetical account values and expenses may not be used to estimate the actual ending account balance or expenses you paid for the period. You may use this information to compare the ongoing costs of investing in the Fund and other funds. To do so, compare this 5% hypothetical example with the 5% hypothetical examples that appear in the shareholder reports of the other funds.
The Fund’s transfer agent may charge additional fees to holders of certain accounts that are not included in the expenses shown in the table on the following page. These fees apply to individual retirement accounts (IRAs) and Section 403(b) accounts. As of the close of the six-month period covered by the table, IRA fees included an annual maintenance fee of $15 per account (subject to a maximum annual maintenance fee of $25 for all accounts held by the same shareholder). Section 403(b) accounts are charged an annual $25 fiduciary maintenance fee. Some of the fees may vary in amount, or may be waived, based on your total account balance or the number of PGIM funds, including the Fund, that you own. You should consider the additional fees that were charged to your Fund account over the six-month period when you estimate the total ongoing expenses paid over the
| | | | |
| PGIM Real Estate Income Fund | | | 17 | |
Fees and Expenses (continued)
period and the impact of these fees on your ending account value, as these additional expenses are not reflected in the information provided in the expense table. Additional fees have the effect of reducing investment returns.
Please note that the expenses shown in the table are meant to highlight your ongoing costs only and do not reflect any transactional costs such as sales charges (loads). Therefore, the second line for each share class in the table is useful in comparing ongoing costs only and will not help you determine the relative total costs of owning different funds. In addition, if these transactional costs were included, your costs would have been higher.
| | | | | | | | | | | | | | | | | | |
PGIM Real Estate
Income Fund | | Beginning Account
Value
May 1, 2018 | | | Ending Account
Value
October 31, 2018 | | | Annualized
Expense Ratio
Based on the
Six-Month Period | | | Expenses Paid
During the
Six-Month Period* | |
| Class A | | Actual | | $ | 1,000.00 | | | $ | 1,016.60 | | | | 1.36 | % | | $ | 6.91 | |
| | Hypothetical | | $ | 1,000.00 | | | $ | 1,018.35 | | | | 1.36 | % | | $ | 6.92 | |
| Class C | | Actual | | $ | 1,000.00 | | | $ | 1,012.70 | | | | 2.11 | % | | $ | 10.70 | |
| | Hypothetical | | $ | 1,000.00 | | | $ | 1,014.57 | | | | 2.11 | % | | $ | 10.71 | |
| Class Z | | Actual | | $ | 1,000.00 | | | $ | 1,019.10 | | | | 0.84 | % | | $ | 4.27 | |
| | Hypothetical | | $ | 1,000.00 | | | $ | 1,020.97 | | | | 0.84 | % | | $ | 4.28 | |
| Class R6** | | Actual | | $ | 1,000.00 | | | $ | 1,017.90 | | | | 1.10 | % | | $ | 5.59 | |
| | | Hypothetical | | $ | 1,000.00 | | | $ | 1,019.66 | | | | 1.10 | % | | $ | 5.60 | |
*Fund expenses (net of fee waivers or subsidies, if any) for each share class are equal to the annualized expense ratio for each share class (provided in the table), multiplied by the average account value over the period, multiplied by the 184 days in the six-month period ended October 31, 2018, and divided by the 365 days in the Fund’s fiscal year ended October 31, 2018 (to reflect the six-month period). Expenses presented in the table include the expenses of any underlying portfolios in which the Fund may invest.
**Formerly known as Class Q shares.
| | |
| 18 | | Visit our website at pgiminvestments.com |
Schedule of Investments
as of October 31, 2018
| | | | | | | | |
| Description | | Shares | | | Value | |
LONG-TERM INVESTMENTS 99.4% | | | | | | | | |
| | |
COMMON STOCKS 78.9% | | | | | | | | |
| | |
Diversified Real Estate Activities 1.2% | | | | | | | | |
Henderson Land Development Co. Ltd. (Hong Kong) | | | 15,341 | | | $ | 71,564 | |
Sun Hung Kai Properties Ltd. (Hong Kong) | | | 2,000 | | | | 26,058 | |
| | | | | | | | |
| | | | | | | 97,622 | |
| | |
Diversified REITs 5.5% | | | | | | | | |
AEW UK REIT PLC (United Kingdom) | | | 117,904 | | | | 143,617 | |
Stockland (Australia) | | | 45,344 | | | | 115,750 | |
Suntec Real Estate Investment Trust (Singapore) | | | 138,045 | | | | 176,563 | |
| | | | | | | | |
| | | | | | | 435,930 | |
| | |
Health Care REITs 19.8% | | | | | | | | |
Community Healthcare Trust, Inc. | | | 10,045 | | | | 298,538 | |
MedEquities Realty Trust, Inc. | | | 45,694 | | | | 377,890 | |
Omega Healthcare Investors, Inc. | | | 2,635 | | | | 87,877 | |
Sabra Health Care REIT, Inc. | | | 19,302 | | | | 417,888 | |
Welltower, Inc. | | | 5,991 | | | | 395,825 | |
| | | | | | | | |
| | | | | | | 1,578,018 | |
| | |
Hotel & Resort REITs 7.9% | | | | | | | | |
DiamondRock Hospitality Co. | | | 12,277 | | | | 128,295 | |
Japan Hotel REIT Investment Corp. (Japan) | | | 108 | | | | 76,878 | |
MGM Growth Properties LLC | | | 15,129 | | | | 427,999 | |
| | | | | | | | |
| | | | | | | 633,172 | |
| | |
Industrial REITs 11.9% | | | | | | | | |
Americold Realty Trust | | | 8,586 | | | | 212,504 | |
Frasers Logistics & Industrial Trust (Singapore) | | | 110,810 | | | | 81,739 | |
LaSalle Logiport REIT (Japan) | | | 98 | | | | 90,195 | |
Prologis Property Mexico SA de CV (Mexico) | | | 44,793 | | | | 78,943 | |
STAG Industrial, Inc. | | | 11,363 | | | | 300,665 | |
Warehouse REIT PLC (United Kingdom) | | | 148,524 | | | | 183,700 | |
| | | | | | | | |
| | | | | | | 947,746 | |
| | |
Office REITs 14.2% | | | | | | | | |
Alstria office REIT-AG (Germany) | | | 5,306 | | | | 76,425 | |
Columbia Property Trust, Inc. | | | 18,884 | | | | 423,946 | |
Easterly Government Properties, Inc. | | | 16,435 | | | | 298,624 | |
See Notes to Financial Statements.
| | | | |
| PGIM Real Estate Income Fund | | | 19 | |
Schedule of Investments (continued)
as of October 31, 2018
| | | | | | | | |
| Description | | Shares | | | Value | |
COMMON STOCKS (Continued) | | | | | | | | |
| | |
Office REITs (cont’d.) | | | | | | | | |
JBG SMITH Properties | | | 5,177 | | | $ | 194,034 | |
Keppel REIT (Singapore) | | | 167,176 | | | | 136,530 | |
| | | | | | | | |
| | | | | | | 1,129,559 | |
| | |
Real Estate Operating Companies 2.2% | | | | | | | | |
Cibus Nordic Real Estate AB (Sweden) | | | 15,398 | | | | 178,502 | |
| | |
Retail REITs 12.8% | | | | | | | | |
Kenedix Retail REIT Corp. (Japan) | | | 88 | | | | 187,530 | |
Klepierre SA (France) | | | 4,010 | | | | 136,383 | |
Macerich Co. (The) | | | 5,533 | | | | 285,614 | |
Starhill Global REIT (Singapore) | | | 3 | | | | 1 | |
Unibail-Rodamco-Westfield (France) | | | 1,525 | | | | 276,315 | |
Vicinity Centres (Australia) | | | 70,777 | | | | 132,618 | |
| | | | | | | | |
| | | | | | | 1,018,461 | |
| | |
Specialized REITs 3.4% | | | | | | | | |
CoreSite Realty Corp. | | | 740 | | | | 69,456 | |
Crown Castle International Corp. | | | 682 | | | | 74,161 | |
Extra Space Storage, Inc. | | | 395 | | | | 35,574 | |
Four Corners Property Trust, Inc. | | | 3,686 | | | | 96,131 | |
| | | | | | | | |
| | | | | | | 275,322 | |
| | | | | | | | |
TOTAL COMMON STOCKS
(cost $6,253,611) | | | | | | | 6,294,332 | |
| | | | | | | | |
| | |
PREFERRED STOCKS 20.5% | | | | | | | | |
| | |
Hotel & Resort REITs 1.4% | | | | | | | | |
Pebblebrook Hotel Trust | | | 4,648 | | | | 113,156 | |
| | |
Industrial REITs 3.2% | | | | | | | | |
Monmouth Real Estate Investment Corp. | | | 7,125 | | | | 171,000 | |
Rexford Industrial Realty, Inc. | | | 3,550 | | | | 82,537 | |
| | | | | | | | |
| | | | | | | 253,537 | |
| | |
Office REITs 2.6% | | | | | | | | |
Vornado Realty Trust | | | 9,379 | | | | 205,588 | |
| | |
Residential REITs 6.0% | | | | | | | | |
American Homes 4 Rent | | | 8,830 | | | | 195,320 | |
See Notes to Financial Statements.
| | | | | | | | |
| Description | | Shares | | | Value | |
PREFERRED STOCKS (Continued) | | | | | | | | |
| | |
Residential REITs (cont’d.) | | | | | | | | |
Investors Real Estate Trust | | | 5,300 | | | $ | 129,187 | |
UMH Properties, Inc. | | | 6,710 | | | | 153,793 | |
| | | | | | | | |
| | | | | | | 478,300 | |
| | |
Retail REITs 3.1% | | | | | | | | |
Pennsylvania Real Estate Investment Trust | | | 5,550 | | | | 124,542 | |
Urstadt Biddle Properties, Inc. (Class H Stock) | | | 5,208 | | | | 120,565 | |
| | | | | | | | |
| | | | | | | 245,107 | |
| | |
Specialized REITs 4.2% | | | | | | | | |
EPR Properties (Class G Stock) | | | 9,000 | | | | 206,550 | |
Jernigan Capital, Inc. (Class B Stock) | | | 5,400 | | | | 130,410 | |
| | | | | | | | |
| | | | | | | 336,960 | |
| | | | | | | | |
TOTAL PREFERRED STOCKS
(cost $1,753,509) | | | | | | | 1,632,648 | |
| | | | | | | | |
TOTAL LONG-TERM INVESTMENTS
(cost $8,007,120) | | | | | | | 7,926,980 | |
| | | | | | | | |
| | |
SHORT-TERM INVESTMENTS 0.4% | | | | | | | | |
| | |
AFFILIATED MUTUAL FUNDS | | | | | | | | |
PGIM Core Ultra Short Bond Fund(w) | | | 34,101 | | | | 34,101 | |
PGIM Institutional Money Market Fund(w) | | | 4 | | | | 4 | |
| | | | | | | | |
TOTAL SHORT-TERM INVESTMENTS
(cost $34,105) | | | | | | | 34,105 | |
| | | | | | | | |
TOTAL INVESTMENTS 99.8%
(cost $8,041,225) | | | | | | | 7,961,085 | |
Other assets in excess of liabilities 0.2% | | | | | | | 18,221 | |
| | | | | | | | |
NET ASSETS 100.0% | | | | | | $ | 7,979,306 | |
| | | | | | | | |
The following abbreviation is used in the annual report:
REITs—Real Estate Investment Trusts
| (w) | PGIM Investments LLC, the manager of the Fund, also serves as manager of the PGIM Core Ultra Short Bond Fund and PGIM Institutional Money Market Fund. |
Fair Value Measurements:
Various inputs are used in determining the value of the Fund’s investments. These inputs are summarized in the three broad levels listed below.
See Notes to Financial Statements.
| | | | |
| PGIM Real Estate Income Fund | | | 21 | |
Schedule of Investments (continued)
as of October 31, 2018
Level 1—unadjusted quoted prices generally in active markets for identical securities.
Level 2—quoted prices for similar securities, interest rates and yield curves, prepayment speeds, foreign currency exchange rates and other observable inputs.
Level 3—unobservable inputs for securities valued in accordance with Board approved fair valuation procedures.
The following is a summary of the inputs used as of October 31, 2018 in valuing such portfolio securities:
| | | | | | | | | | | | |
| | | Level 1 | | | Level 2 | | | Level 3 | |
Investments in Securities | | | | | | | | | | | | |
Common Stocks | | | | | | | | | | | | |
Diversified Real Estate Activities | | $ | — | | | $ | 97,622 | | | $ | — | |
Diversified REITs | | | — | | | | 435,930 | | | | — | |
Health Care REITs | | | 1,578,018 | | | | — | | | | — | |
Hotel & Resort REITs | | | 556,294 | | | | 76,878 | | | | — | |
Industrial REITs | | | 592,112 | | | | 355,634 | | | | — | |
Office REITs | | | 916,604 | | | | 212,955 | | | | — | |
Real Estate Operating Companies | | | — | | | | 178,502 | | | | — | |
Retail REITs | | | 285,614 | | | | 732,847 | | | | — | |
Specialized REITs | | | 275,322 | | | | — | | | | — | |
Preferred Stocks | | | | | | | | | | | | |
Hotel & Resort REITs | | | 113,156 | | | | — | | | | — | |
Industrial REITs | | | 253,537 | | | | — | | | | — | |
Office REITs | | | 205,588 | | | | — | | | | — | |
Residential REITs | | | 478,300 | | | | — | | | | — | |
Retail REITs | | | 245,107 | | | | — | | | | — | |
Specialized REITs | | | 336,960 | | | | — | | | | — | |
Affiliated Mutual Funds | | | 34,105 | | | | — | | | | — | |
| | | | | | | | | | | | |
Total | | $ | 5,870,717 | | | $ | 2,090,368 | | | $ | — | |
| | | | | | | | | | | | |
Industry Classification:
The industry classification of investments and other assets in excess of liabilities shown as a percentage of net assets as of October 31, 2018 were as follows (unaudited):
| | | | |
Health Care REITs | | | 19.8 | % |
Office REITs | | | 16.8 | |
Retail REITs | | | 15.9 | |
Industrial REITs | | | 15.1 | |
Hotel & Resort REITs | | | 9.3 | |
Specialized REITs | | | 7.6 | |
Residential REITs | | | 6.0 | |
Diversified REITs | | | 5.5 | |
Real Estate Operating Companies | | | 2.2 | % |
Diversified Real Estate Activities | | | 1.2 | |
Affiliated Mutual Funds | | | 0.4 | |
| | | | |
| | | 99.8 | |
Other assets in excess of liabilities | | | 0.2 | |
| | | | |
| | | 100.0 | % |
| | | | |
See Notes to Financial Statements.
Statement of Assets & Liabilities
as of October 31, 2018
| | | | |
Assets | | | | |
Investments at value: | | | | |
Unaffiliated investments (cost $8,007,120) | | $ | 7,926,980 | |
Affiliated investments (cost $34,105) | | | 34,105 | |
Due from Manager | | | 32,909 | |
Dividends receivable | | | 13,298 | |
Tax reclaim receivable | | | 4,307 | |
Receivable for Fund shares sold | | | 2,165 | |
Prepaid expenses and other assets | | | 849 | |
| | | | |
Total Assets | | | 8,014,613 | |
| | | | |
| |
Liabilities | | | | |
Custodian and accounting fees payable | | | 17,467 | |
Shareholders’ reports payable | | | 7,083 | |
Legal fees and expenses payable | | | 5,588 | |
Payable for Fund shares reacquired | | | 3,764 | |
Accrued expenses and other liabilities | | | 758 | |
Distribution fee payable | | | 419 | |
Affiliated transfer agent fee payable | | | 208 | |
Payable to custodian | | | 20 | |
| | | | |
Total Liabilities | | | 35,307 | |
| | | | |
| |
Net Assets | | $ | 7,979,306 | |
| | | | |
| | | | | |
Net assets were comprised of: | | | | |
Shares of beneficial interest, at par | | $ | 909 | |
Paid-in capital in excess of par | | | 8,815,403 | |
Total distributable earnings (loss) | | | (837,006 | ) |
| | | | |
Net assets, October 31, 2018 | | $ | 7,979,306 | |
| | | | |
See Notes to Financial Statements.
| | | | |
| PGIM Real Estate Income Fund | | | 23 | |
Statement of Assets & Liabilities
as of October 31, 2018
| | | | |
Class A | | | | |
Net asset value and redemption price per share,
($621,242 ÷ 70,956 shares of beneficial interest issued and outstanding) | | $ | 8.76 | |
Maximum sales charge (5.50% of offering price) | | | 0.51 | |
| | | | |
Maximum offering price to public | | $ | 9.27 | |
| | | | |
| |
Class C | | | | |
Net asset value, offering price and redemption price per share,
($336,392 ÷ 38,418 shares of beneficial interest issued and outstanding) | | $ | 8.76 | |
| | | | |
| |
Class Z | | | | |
Net asset value, offering price and redemption price per share,
($6,951,446 ÷ 792,029 shares of beneficial interest issued and outstanding) | | $ | 8.78 | |
| | | | |
| |
Class R6 | | | | |
Net asset value, offering price and redemption price per share,
($70,226 ÷ 8,013 shares of beneficial interest issued and outstanding) | | $ | 8.76 | |
| | | | |
See Notes to Financial Statements.
Statement of Operations
Year Ended October 31, 2018
| | | | |
Net Investment Income (Loss) | | | | |
Income | | | | |
Unaffiliated dividend income (net of $20,557 foreign withholding tax) | | $ | 510,078 | |
Affiliated dividend income | | | 1,307 | |
Income from securities lending, net (including affiliated income of $23) | | | 1,285 | |
| | | | |
Total income | | | 512,670 | |
| | | | |
| |
Expenses | | | | |
Management fee | | | 78,729 | |
Distribution fee(a) | | | 5,778 | |
Registration fees(a) | | | 63,699 | |
Custodian and accounting fees | | | 61,216 | |
Audit fee | | | 31,937 | |
Shareholders’ reports | | | 26,073 | |
Legal fees and expenses | | | 21,541 | |
Trustees’ fees | | | 12,443 | |
Transfer agent’s fees and expenses (including affiliated expense of $954)(a) | | | 8,042 | |
Miscellaneous | | | 18,959 | |
| | | | |
Total expenses | | | 328,417 | |
Less: Fee waiver and/or expense reimbursement(a) | | | (224,572 | ) |
Distribution fee waiver(a) | | | (439 | ) |
| | | | |
Net expenses | | | 103,406 | |
| | | | |
Net investment income (loss) | | | 409,264 | |
| | | | |
| |
Realized And Unrealized Gain (Loss) On Investment And Foreign Currency Transactions | | | | |
Net realized gain (loss) on: | | | | |
Investment transactions (including affiliated of $2) | | | (139,391 | ) |
Foreign currency transactions | | | (6,056 | ) |
| | | | |
| | | (145,447 | ) |
| | | | |
Net change in unrealized appreciation (depreciation) on: | | | | |
Investments | | | (445,427 | ) |
Foreign currencies | | | 95 | |
| | | | |
| | | (445,332 | ) |
| | | | |
Net gain (loss) on investment and foreign currency transactions | | | (590,779 | ) |
| | | | |
Net Increase (Decrease) In Net Assets Resulting From Operations | | $ | (181,515 | ) |
| | | | |
| (a) | Class specific expenses and waivers were as follows: |
| | | | | | | | | | | | | | | | |
| | | Class A | | | Class C | | | Class Z | | | Class R6 | |
Distribution fee | | | 2,633 | | | | 3,145 | | | | — | | | | — | |
Registration fees | | | 16,224 | | | | 15,928 | | | | 16,576 | | | | 14,971 | |
Transfer agent’s fees and expenses | | | 1,452 | | | | 545 | | | | 6,010 | | | | 35 | |
Fee waiver and/or expense reimbursement | | | (30,261 | ) | | | (21,190 | ) | | | (157,807 | ) | | | (15,314 | ) |
Distribution fee waiver | | | (439 | ) | | | — | | | | — | | | | — | |
See Notes to Financial Statements.
| | | | |
| PGIM Real Estate Income Fund | | | 25 | |
Statements of Changes in Net Assets
| | | | | | | | |
| | | Year Ended October 31, | |
| | | 2018 | | | 2017 | |
Increase (Decrease) in Net Assets | | | | | | | | |
Operations | | | | | | | | |
Net investment income (loss) | | $ | 409,264 | | | $ | 414,335 | |
Net realized gain (loss) on investment and foreign currency transactions | | | (145,447 | ) | | | (235,051 | ) |
Net change in unrealized appreciation (depreciation) on investments and foreign currencies | | | (445,332 | ) | | | 397,997 | |
| | | | | | | | |
Net increase (decrease) in net assets resulting from operations | | | (181,515 | ) | | | 577,281 | |
| | | | | | | | |
| | |
Dividends and Distributions | | | | | | | | |
Distributions from distributable earnings* | | | | | | | | |
Class A | | | (48,178 | ) | | | — | |
Class C | | | (15,295 | ) | | | — | |
Class Z | | | (483,553 | ) | | | — | |
Class R6 | | | (1,218 | ) | | | — | |
| | | | | | | | |
| | | (548,244 | ) | | | — | |
| | | | | | | | |
Tax return of capital distributions | | | | | | | | |
Class A | | | (6,561 | ) | | | — | |
Class C | | | (2,083 | ) | | | — | |
Class Z | | | (65,851 | ) | | | — | |
Class R6 | | | (166 | ) | | | — | |
| | | | | | | | |
| | | (74,661 | ) | | | — | |
| | | | | | | | |
Dividends from net investment income | | | | | | | | |
Class A | | | | | | | (37,709 | ) |
Class C | | | | | | | (12,902 | ) |
Class Z | | | | | | | (475,529 | ) |
Class R6 | | | | | | | (438 | ) |
| | | | | | | | |
| | | * | | | | (526,578 | ) |
| | | | | | | | |
| | |
Fund share transactions (Net of share conversions) | | | | | | | | |
Net proceeds from shares sold | | | 1,327,086 | | | | 6,003,066 | |
Net asset value of shares issued in reinvestment of dividends and distributions | | | 614,269 | | | | 524,023 | |
Cost of shares reacquired | | | (5,056,067 | ) | | | (1,149,313 | ) |
| | | | | | | | |
Net increase (decrease) in net assets from Fund share transactions | | | (3,114,712 | ) | | | 5,377,776 | |
| | | | | | | | |
Total increase (decrease) | | | (3,919,132 | ) | | | 5,428,479 | |
| | |
Net Assets: | | | | | | | | |
Beginning of year | | | 11,898,438 | | | | 6,469,959 | |
| | | | | | | | |
End of year(a) | | $ | 7,979,306 | | | $ | 11,898,438 | |
| | | | | | | | |
(a) Includes undistributed/(distributions in excess of) net investment income of: | | $ | * | | | $ | 26,927 | |
| | | | | | | | |
| * | For the year ended October 31, 2018, the Fund has adopted amendments to Regulation S-X (refer to Note 9). |
See Notes to Financial Statements.
Notes to Financial Statements
Prudential Investment Portfolios 9 (the “Trust”) is registered under the Investment Company Act of 1940, as amended (“1940 Act”), as an open-end management investment company. The Trust was established as a Delaware business trust on September 18, 1998. The Trust currently consists of five funds: PGIM Absolute Return Bond Fund and PGIM QMA Large-Cap Core Equity Fund, each of which are diversified funds and PGIM International Bond Fund, PGIM Select Real Estate Fund and PGIM Real Estate Income Fund, each of which are non-diversified funds for purposes of the 1940 Act. These financial statements relate only to the PGIM Real Estate Income Fund (the “Fund”). Effective June 11, 2018, the names of the Fund and the other funds which comprise the Trust were changed by replacing “Prudential” with “PGIM” and each fund’s Class Q shares were renamed Class R6 shares.
The investment objective of the Fund is to seek income and capital appreciation.
1. Accounting Policies
The Fund follows the investment company accounting and reporting guidance of the Financial Accounting Standards Board (“FASB”) Accounting Standard Codification (“ASC”) Topic 946 Financial Services—Investment Companies. The following accounting policies conform to U.S. generally accepted accounting principles. The Fund consistently follows such policies in the preparation of its financial statements.
Securities Valuation: The Fund holds securities and other assets and liabilities that are fair valued at the close of each day (generally, 4:00 PM Eastern time) the New York Stock Exchange (“NYSE”) is open for trading. Fair value is the price that would be received to sell an asset or paid to transfer a liability in an orderly transaction between market participants on the measurement date. The Trust’s Board of Trustees (the “Board”) has adopted valuation procedures for security valuation under which fair valuation responsibilities have been delegated to PGIM Investments LLC (“PGIM Investments” or the “Manager”). Pursuant to the Board’s delegation, a Valuation Committee has been established as two persons, being one or more officers of the Trust, including: the Trust’s Treasurer (or the Treasurer’s direct reports); and the Trust’s Chief or Deputy Chief Compliance Officer (or Vice-President-level direct reports of the Chief or Deputy Chief Compliance Officer). Under the current valuation procedures, the Valuation Committee of the Board is responsible for supervising the valuation of portfolio securities and other assets and liabilities. The valuation procedures permit the Fund to utilize independent pricing vendor services, quotations from market makers, and alternative valuation methods when market quotations are either not readily available or not deemed representative of fair value. A record of the Valuation Committee’s actions is subject to the Board’s review, approval, and ratification at its next regularly scheduled quarterly meeting.
| | | | |
| PGIM Real Estate Income Fund | | | 27 | |
Notes to Financial Statements (continued)
For the fiscal reporting period-end, securities and other assets and liabilities were fair valued at the close of the last U.S. business day. Trading in certain foreign securities may occur when the NYSE is closed (including weekends and holidays). Because such foreign securities trade in markets that are open on weekends and U.S. holidays, the values of some of the Fund’s foreign investments may change on days when investors cannot purchase or redeem Fund shares.
Various inputs determine how the Fund’s investments are valued, all of which are categorized according to the three broad levels (Level 1, 2, or 3) detailed in the Schedule of Investments and referred to herein as the “fair value hierarchy” in accordance with FASB ASC Topic 820—Fair Value Measurements and Disclosures.
Common and preferred stocks, exchange-traded funds, and derivative instruments, such as futures or options, that are traded on a national securities exchange are valued at the last sale price as of the close of trading on the applicable exchange where the security principally trades. Securities traded via NASDAQ are valued at the NASDAQ official closing price. To the extent these securities are valued at the last sale price or NASDAQ official closing price, they are classified as Level 1 in the fair value hierarchy. In the event that no sale or official closing price on valuation date exists, these securities are generally valued at the mean between the last reported bid and ask prices, or at the last bid price in the absence of an ask price. These securities are classified as Level 2 in the fair value hierarchy.
Foreign equities traded on foreign securities exchanges are generally valued using pricing vendor services that provide model prices derived using adjustment factors based on information such as local closing price, relevant general and sector indices, currency fluctuations, depositary receipts, and futures, as applicable. Securities valued using such model prices are classified as Level 2 in the fair value hierarchy. The models generate an evaluated adjustment factor for each security, which is applied to the local closing price to adjust it for post closing market movements up to the time the Fund is valued. Utilizing that evaluated adjustment factor, the vendor provides an evaluated price for each security. If the vendor does not provide an evaluated price, securities are valued in accordance with exchange-traded common and preferred stock valuation policies discussed above.
Investments in open-end, non-exchange-traded mutual funds are valued at their net asset values as of the close of the NYSE on the date of valuation. These securities are classified as Level 1 in the fair value hierarchy since they may be purchased or sold at their net asset values on the date of valuation.
Securities and other assets that cannot be priced according to the methods described above are valued based on pricing methodologies approved by the Board. In the event that
unobservable inputs are used when determining such valuations, the securities will be classified as Level 3 in the fair value hierarchy.
When determining the fair value of securities, some of the factors influencing the valuation include: the nature of any restrictions on disposition of the securities; assessment of the general liquidity of the securities; the issuer’s financial condition and the markets in which it does business; the cost of the investment; the size of the holding and the capitalization of the issuer; the prices of any recent transactions or bids/offers for such securities or any comparable securities; any available analyst media or other reports or information deemed reliable by the Manager regarding the issuer or the markets or industry in which it operates. Using fair value to price securities may result in a value that is different from a security’s most recent closing price and from the price used by other unaffiliated mutual funds to calculate their net asset values.
Restricted and Illiquid Securities: Subject to guidelines adopted by the Board, the Fund may invest up to 15% of its net assets in illiquid securities, including those which are restricted as to disposition under securities law (“restricted securities”). Restricted securities are valued pursuant to the valuation procedures noted above. Illiquid securities are those that, because of the absence of a readily available market or due to legal or contractual restrictions on resale, cannot be sold within seven days in the ordinary course of business at approximately the amount at which the Fund has valued the investment. Therefore, the Fund may find it difficult to sell illiquid securities at the time considered most advantageous by its subadviser and may incur transaction costs that would not be incurred in the sale of securities that were freely marketable. Certain securities that would otherwise be considered illiquid because of legal restrictions on resale to the general public may be traded among qualified institutional buyers under Rule 144A of the Securities Act of 1933. These Rule 144A securities, as well as commercial paper that is sold in private placements under Section 4(2) of the Securities Act, may be deemed liquid by the Fund’s subadviser under the guidelines adopted by the Trustees of the Trust. However, the liquidity of the Fund’s investments in Rule 144A securities could be impaired if trading does not develop or declines.
Foreign Currency Translation: The books and records of the Fund are maintained in U.S. dollars. Foreign currency amounts are translated into U.S. dollars on the following basis:
(i) market value of investment securities, other assets and liabilities—at the current rates of exchange;
(ii) purchases and sales of investment securities, income and expenses—at the rates of exchange prevailing on the respective dates of such transactions.
Although the net assets of the Fund are presented at the foreign exchange rates and market values at the close of the period, the Fund does not generally isolate that portion of the results of operations arising as a result of changes in the foreign exchange rates from the fluctuations arising from changes in the market prices of long-term portfolio securities held
| | | | |
| PGIM Real Estate Income Fund | | | 29 | |
Notes to Financial Statements (continued)
at the end of the period. Similarly, the Fund does not isolate the effect of changes in foreign exchange rates from the fluctuations arising from changes in the market prices of long-term portfolio securities sold during the period. Accordingly, holding period realized foreign currency gains (losses) are included in the reported net realized gains (losses) on investment transactions.
Net realized gains (losses) on foreign currency transactions represent net foreign exchange gains (losses) from the disposition of holdings of foreign currencies, currency gains (losses) realized between the trade and settlement dates on securities transactions, and the difference between the amounts of interest, dividends and foreign withholding taxes recorded on the Fund’s books and the U.S. dollar equivalent amounts actually received or paid. Net unrealized currency gains (losses) arise from valuing foreign currency denominated assets and liabilities (other than investments) at period end exchange rates.
Master Netting Arrangements: The Trust, on behalf of the Fund, is subject to various Master Agreements, or netting arrangements, with select counterparties. These are agreements which a subadviser may have negotiated and entered into on behalf of the Fund. A master netting arrangement between the Fund and the counterparty permits the Fund to offset amounts payable by the Fund to the same counterparty against amounts to be received; and by the receipt of collateral from the counterparty by the Fund to cover the Fund’s exposure to the counterparty. However, there is no assurance that such mitigating factors are easily enforceable. In addition to master netting arrangements, the right to set-off exists when all the conditions are met such that each of the parties owes the other determinable amounts, the reporting party has the right to set-off the amount owed with the amount owed by the other party, the reporting party intends to set-off and the right of set-off is enforceable by law. During the reporting period, there was no intention to settle on a net basis and all amounts are presented on a gross basis on the Statement of Assets and Liabilities.
Securities Lending: The Fund lends its portfolio securities to banks and broker-dealers. The loans are secured by collateral at least equal to the market value of the securities loaned. Collateral pledged by each borrower is invested in an affiliated money market fund and is marked to market daily, based on the previous day’s market value, such that the value of the collateral exceeds the value of the loaned securities. In the event of significant appreciation in value of securities on loan on the last business day of the reporting period, the financial statements may reflect a collateral value that is less than the market value of the loaned securities. Such shortfall is remedied as described above. Loans are subject to termination at the option of the borrower or the Fund. Upon termination of the loan, the borrower will return to the Fund securities identical to the loaned securities. Should the borrower of the securities fail financially, the Fund has the right to repurchase the securities in the open market using the collateral.
The Fund recognizes income, net of any rebate and securities lending agent fees, for lending its securities in the form of fees or interest on the investment of any cash received as collateral. The borrower receives all interest and dividends from the securities loaned and such payments are passed back to the lender in amounts equivalent thereto. The Fund also continues to recognize any unrealized gain (loss) in the market price of the securities loaned and on the change in the value of the collateral invested that may occur during the term of the loan. In addition, realized gain (loss) is recognized on changes in the value of the collateral invested upon liquidation of the collateral. Net earnings from securities lending are disclosed on the Statement of Operations as “Income from securities lending, net”.
Equity and Mortgage Real Estate Investment Trusts (collectively equity REITs): The Fund invests in equity REITs, which report information on the source of their distributions annually. Based on current and historical information, a portion of distributions received from equity REITs during the period is estimated to be dividend income, capital gain or return of capital and recorded accordingly. When material, these estimates are adjusted periodically when the actual source of distributions is disclosed by the equity REITs.
Securities Transactions and Net Investment Income: Securities transactions are recorded on the trade date. Realized gains (losses) from investment and currency transactions are calculated on the specific identification method. Dividend income is recorded on the ex-date. Expenses are recorded on an accrual basis, which may require the use of certain estimates by management that may differ from actual. Net investment income or loss (other than class specific expenses and waivers, which are allocated as noted below) and unrealized and realized gains (losses) are allocated daily to each class of shares based upon the relative proportion of adjusted net assets of each class at the beginning of the day. Class specific expenses and waivers, where applicable, are charged to the respective share classes. Class specific expenses include distribution fees and distribution fee waivers, shareholder servicing fees, transfer agent’s fees and expenses, registration fees and fee waivers and/or expense reimbursements, as applicable.
Taxes: It is the Fund’s policy to continue to meet the requirements of the Internal Revenue Code applicable to regulated investment companies and to distribute all of its taxable net investment income and capital gains, if any, to its shareholders. Therefore, no federal income tax provision is required. Withholding taxes on foreign dividends, interest and capital gains, if any, are recorded, net of reclaimable amounts, at the time the related income is earned.
Dividends and Distributions: The Fund expects to pay dividends from net investment income quarterly. Distributions from net realized capital and currency gains, if any, are declared and paid annually. Dividends and distributions to shareholders, which are determined in accordance with federal income tax regulations and which may differ from generally accepted accounting principles, are recorded on the ex-date. Permanent book/tax differences relating to income and gain (loss) are reclassified amongst total distributable earnings (loss) and paid-in capital in excess of par, as appropriate.
| | | | |
| PGIM Real Estate Income Fund | | | 31 | |
Notes to Financial Statements (continued)
Estimates: The preparation of financial statements requires management to make estimates and assumptions that affect the reported amounts and disclosures in the financial statements. Actual results could differ from those estimates.
2. Agreements
The Trust, on behalf of the Fund, has a management agreement with PGIM Investments. Pursuant to this agreement, PGIM Investments has responsibility for all investment advisory services and supervises the subadviser’s performance of such services. In addition, under the management agreement, PGIM Investments provides all of the administrative functions necessary for the organization, operation and management of the Fund. PGIM Investments administers the corporate affairs of the Fund and, in connection therewith, furnishes the Fund with office facilities, together with those ordinary clerical and bookkeeping services which are not being furnished by the Fund’s custodian and the Fund’s transfer agent. PGIM Investments is also responsible for the staffing and management of dedicated groups of legal, marketing, compliance and related personnel necessary for the operation of the Fund. The legal, marketing, compliance and related personnel are also responsible for the management and oversight of the various service providers to the Fund, including, but not limited to, the custodian, transfer agent, and accounting agent.
PGIM Investments has entered into a subadvisory agreement with PGIM, Inc., which provides subadvisory services to the Fund through its PGIM Real Estate unit. The subadvisory agreement provides that PGIM Real Estate will furnish investment advisory services in connection with the management of the Fund. In connection therewith, PGIM Real Estate is obligated to keep certain books and records of the Fund. PGIM Investments pays for the services of PGIM Real Estate, the cost of compensation of officers of the Fund, occupancy and certain clerical and bookkeeping costs of the Fund. The Fund bears all other costs and expenses.
The management fee paid to PGIM Investments is accrued daily and payable monthly at an annual rate of 0.800% of the Fund’s average daily net assets up to and including $1 billion, 0.78% of the next $2 billion, 0.76% of the next $2 billion, 0.75% of the next $5 billion and 0.740% of the Fund’s average daily net assets in excess of $10 billion. The effective management fee rate before any waivers and/or expense reimbursements was 0.800% for the year ended October 31, 2018.
PGIM Investments has contractually agreed, through February 28, 2019, to limit total annual operating expenses after fee waivers and/or expense reimbursements to 1.35% of average daily net assets for Class A shares, 2.10% of average daily net assets for Class C shares, 1.10% of average daily net assets for Class Z shares, and 1.10% of average daily net assets for Class R6 shares. This contractual waiver excludes interest, brokerage, taxes (such
as income and foreign withholding taxes, stamp duty and deferred tax expenses), acquired fund fees and expenses, extraordinary expenses, and certain other Fund expenses such as dividend and interest expense and broker charges on short sales. Expenses waived/reimbursed by the Manager in accordance with this agreement may be recouped by the Manager within the same fiscal year during which such waiver/reimbursement is made if such recoupment can be realized without exceeding the expense limit in effect at the time of the recoupment for that fiscal year. Effective November 1, 2018 this waiver agreement was extended through February 29, 2020.
Where applicable, PGIM Investments voluntarily agreed through October 31, 2018, to waive management fees or shared operating expenses on any share class to the same extent that it waives similar expenses on any other share class. Effective November 1, 2018 this voluntary agreement became part of the Fund’s contractual waiver agreement through February 29, 2020 and is subject to recoupment by the Manager within the same fiscal year during which such wavier/reimbursement is made if such recoupment can be realized without exceeding the expense limit in effect at the time of the recoupment for that fiscal year. In addition, total annual operating expenses for Class R6 shares will not exceed total annual operating expenses for Class Z shares.
The Trust, on behalf of the Fund, has a distribution agreement with Prudential Investment Management Services LLC (“PIMS”), which acts as the distributor of the Class A, Class C, Class Z and Class R6 shares of the Fund. The Fund compensates PIMS for distributing and servicing the Fund’s Class A and Class C shares, pursuant to the plans of distribution (the “Distribution Plans”), regardless of expenses actually incurred by PIMS. The distribution fees are accrued daily and payable monthly. No distribution or service fees are paid to PIMS as distributor of the Class Z and Class R6 shares of the Fund.
Pursuant to the Distribution Plans, the Fund compensates PIMS for distribution related activities at an annual rate of up to 0.30% and 1% of the average daily net assets of the Class A and Class C shares, respectively. PIMS has contractually agreed through February 29, 2020 to limit such fees to 0.25% of the average daily net assets of Class A shares.
PIMS has advised the Fund that it received $1,270 in front-end sales charges resulting from sales of Class A shares during the year ended October 31, 2018. From these fees, PIMS paid such sales charges to broker-dealers, who in turn paid commissions to salespersons and incurred other distribution costs.
PIMS has advised the Fund that for the year ended October 31, 2018, it received $17 in contingent deferred sales charges imposed upon redemptions by certain Class C shareholders.
PGIM Investments, PGIM, Inc. and PIMS are indirect, wholly-owned subsidiaries of Prudential Financial, Inc. (“Prudential”).
| | | | |
| PGIM Real Estate Income Fund | | | 33 | |
Notes to Financial Statements (continued)
3. Other Transactions with Affiliates
Prudential Mutual Fund Services LLC (“PMFS”), an affiliate of PGIM Investments and an indirect, wholly-owned subsidiary of Prudential, serves as the Fund’s transfer agent. Transfer agent’s fees and expenses in the Statement of Operations include certain out-of-pocket expenses paid to non-affiliates, where applicable.
The Fund may enter into certain securities purchase or sale transactions under Board approved Rule 17a-7 procedures. Rule 17a-7 is an exemptive rule under the 1940 Act, that, subject to certain conditions, permits purchase and sale transactions among affiliated investment companies, or between an investment company and a person that is affiliated solely by reason of having a common (or affiliated) investment adviser, common directors, and/or common officers. Such transactions are subject to ratification by the Board. For the reporting period ended October 31, 2018, no such transactions were entered into by the Fund.
The Fund may invest its overnight sweep cash in the PGIM Core Ultra Short Bond Fund (the “Core Fund”), and its securities lending cash collateral in the PGIM Institutional Money Market Fund (the “Money Market Fund”), each a series of Prudential Investment Portfolios 2, registered under the 1940 Act and managed by PGIM Investments. For the reporting period ended October 31, 2018, PGIM, Inc. was compensated $33 by PGIM Investments for managing the Fund’s securities lending cash collateral as subadviser to the Money Market Fund. Earnings from the Core Fund and Money Market Fund are disclosed on the Statement of Operations as “Affiliated dividend income” and “Income from securities lending, net”, respectively.
4. Portfolio Securities
The aggregate cost of purchases and proceeds from sales of portfolio securities (excluding short-term investments and U.S. Government securities) for the year ended October 31, 2018, were $14,930,688 and $18,160,850, respectively.
A summary of the cost of purchases and proceeds from sales of shares of affiliated mutual funds for the year ended October 31, 2018, is presented as follows:
| | | | | | | | | | | | | | | | | | | | | | | | | | | | |
Value,
Beginning
of Year | | Cost of
Purchases | | | Proceeds
from Sales | | | Change in
Unrealized
Gain
(Loss) | | | Realized
Gain
(Loss) | | | Value,
End of
Year | | | Shares,
End of
Year | | | Income | |
PGIM Core Ultra Short Bond Fund* | | | | | | | | | |
| $ 6,055 | | $ | 4,056,179 | | | $ | 4,028,133 | | | $ | — | | | $ | — | | | $ | 34,101 | | | | 34,101 | | | $ | 1,307 | |
| | |
PGIM Institutional Money Market Fund* | | | | | | | | | |
| 39,585 | | | 574,809 | | | | 614,392 | | | | — | | | | 2 | | | | 4 | | | | 4 | | | | 23 | ** |
| | | | | | | | | | | | | | | | | | | | | | | | | | | | |
| $ 45,640 | | $ | 4,630,988 | | | $ | 4,642,525 | | | $ | — | | | $ | 2 | | | $ | 34,105 | | | | | | | $ | 1,330 | |
| | | | | | | | | | | | | | | | | | | | | | | | | | | | |
| * | The Fund did not have any capital gain distributions during the reporting period. |
| ** | This amount is included in “Income from securities lending, net” on the Statement of Operations. |
5. Distributions and Tax Information
Distributions to shareholders, which are determined in accordance with federal income tax regulations and which may differ from generally accepted accounting principles, are recorded on the ex-date.
For the year ended October 31, 2018, the tax character of dividends paid by the Fund were $548,244 of ordinary income and $74,661 of tax return of capital. For the year ended October 31, 2017, the tax character of dividends paid by the Fund was $526,578 of ordinary income.
As of October 31, 2018, the Fund had no accumulated undistributed earnings on a tax basis.
The United States federal income tax basis of the Fund’s investments and the net unrealized depreciation as of October 31, 2018 were as follows:
| | | | | | |
Tax Basis | | Gross Unrealized
Appreciation | | Gross Unrealized
Depreciation | | Net Unrealized
Depreciation |
| $8,154,579 | | $403,329 | | $(596,823) | | $(193,494) |
The book basis differs from tax basis primarily due to deferred losses on wash sales and book/tax differences in the treatment of passive foreign investment companies.
For federal income tax purposes, the Fund had a capital loss carryforward as of October 31, 2018 of approximately $640,000 which can be carried forward for an unlimited period. No capital gains distributions are expected to be paid to shareholders until net gains have been realized in excess of such losses.
Management has analyzed the Fund’s tax positions taken on federal, state and local income tax returns for all open tax years and has concluded that no provision for income tax is required in the Fund’s financial statements for the current reporting period. The Fund’s federal, state and local income and federal excise tax returns for tax years for which the applicable statutes of limitations have not expired are subject to examination by the Internal Revenue Service and state departments of revenue.
| | | | |
| PGIM Real Estate Income Fund | | | 35 | |
Notes to Financial Statements (continued)
6. Capital and Ownership
The Fund offers Class A, Class C, Class Z and Class R6 shares. Class A shares are sold with a maximum front-end sales charge of 5.50%. Investors who purchase $1 million or more of Class A shares and sell these shares within 12 months of purchase are subject to a contingent deferred sales charge (“CDSC”) of 1%, although they are not subject to an initial sales charge. The Class A CDSC is waived for certain retirement and/or benefit plans. A special exchange privilege is also available for shareholders who qualified to purchase Class A shares at net asset value. Class C shares are sold with a CDSC of 1% on sales made within 12 months of purchase. Class Z and Class R6 shares are not subject to any sales or redemption charge and are available exclusively for sale to a limited group of investors.
Under certain circumstances, an exchange may be made from specified share classes of the Fund to one or more other share classes of the Fund as presented in the table of transactions in shares of beneficial interest.
The Trust has authorized an unlimited number of shares of beneficial interest at $0.001 par value per share, divided four into classes, designated Class A, Class C, Class Z and Class R6.
As of October 31, 2018, Prudential, through its affiliated entities, including affiliated funds (if applicable), owned 1,175 Class C shares, 607,351 Class Z shares and 1,191 Class R6 shares of the Fund. At reporting period end, four shareholders of record held 92% of the Fund’s outstanding shares on behalf of multiple beneficial owners, of which 67% were held by an affiliate of Prudential.
Transactions in shares of beneficial interest were as follows:
| | | | | | | | |
Class A | | Shares | | | Amount | |
Year ended October 31, 2018: | | | | | | | | |
Shares sold | | | 62,102 | | | $ | 563,140 | |
Shares issued in reinvestment of dividends and distributions | | | 5,192 | | | | 47,838 | |
Shares reacquired | | | (91,370 | ) | | | (847,176 | ) |
| | | | | | | | |
Net increase (decrease) in shares outstanding | | | (24,076 | ) | | $ | (236,198 | ) |
| | | | | | | | |
Year ended October 31, 2017: | | | | | | | | |
Shares sold | | | 57,202 | | | $ | 553,052 | |
Shares issued in reinvestment of dividends and distributions | | | 3,754 | | | | 36,283 | |
Shares reacquired† | | | (31,815 | ) | | | (307,255 | ) |
| | | | | | | | |
Net increase (decrease) in shares outstanding | | | 29,141 | | | $ | 282,080 | |
| | | | | | | | |
| | | | | | | | |
Class C | | Shares | | | Amount | |
Year ended October 31, 2018: | | | | | | | | |
Shares sold | | | 13,698 | | | $ | 123,497 | |
Shares issued in reinvestment of dividends and distributions | | | 1,895 | | | | 17,378 | |
Shares reacquired | | | (7,429 | ) | | | (69,546 | ) |
| | | | | | | | |
Net increase (decrease) in shares outstanding before conversion | | | 8,164 | | | | 71,329 | |
Shares reacquired upon conversion into other share class(es) | | | (212 | ) | | | (1,877 | ) |
| | | | | | | | |
Net increase (decrease) in shares outstanding | | | 7,952 | | | $ | 69,452 | |
| | | | | | | | |
Year ended October 31, 2017: | | | | | | | | |
Shares sold | | | 11,112 | | | $ | 104,326 | |
Shares issued in reinvestment of dividends and distributions | | | 1,336 | | | | 12,902 | |
Shares reacquired | | | (14,228 | ) | | | (136,422 | ) |
| | | | | | | | |
Net increase (decrease) in shares outstanding before conversion | | | (1,780 | ) | | | (19,194 | ) |
Shares reacquired upon conversion into other share class(es) | | | (1,001 | ) | | | (9,843 | ) |
| | | | | | | | |
Net increase (decrease) in shares outstanding | | | (2,781 | ) | | $ | (29,037 | ) |
| | | | | | | | |
Class Z | | | | | | |
Year ended October 31, 2018: | | | | | | | | |
Shares sold | | | 61,945 | | | $ | 577,934 | |
Shares issued in reinvestment of dividends and distributions | | | 59,580 | | | | 547,669 | |
Shares reacquired | | | (439,676 | ) | | | (4,139,345 | ) |
| | | | | | | | |
Net increase (decrease) in shares outstanding before conversion | | | (318,151 | ) | | | (3,013,742 | ) |
Shares issued upon conversion from other share class(es) | | | 212 | | | | 1,877 | |
| | | | | | | | |
Net increase (decrease) in shares outstanding | | | (317,939 | ) | | $ | (3,011,865 | ) |
| | | | | | | | |
Year ended October 31, 2017: | | | | | | | | |
Shares sold | | | 562,232 | | | $ | 5,335,688 | |
Shares issued in reinvestment of dividends and distributions | | | 49,025 | | | | 474,400 | |
Shares reacquired† | | | (72,695 | ) | | | (705,636 | ) |
| | | | | | | | |
Net increase (decrease) in shares outstanding before conversion | | | 538,562 | | | | 5,104,452 | |
Shares issued upon conversion from other share class(es) | | | 999 | | | | 9,843 | |
| | | | | | | | |
Net increase (decrease) in shares outstanding | | | 539,561 | | | $ | 5,114,295 | |
| | | | | | | | |
Class R6 | | | | | | |
Year ended October 31, 2018: | | | | | | | | |
Shares sold | | | 6,742 | | | $ | 62,515 | |
Shares issued in reinvestment of dividends and distributions | | | 154 | | | | 1,384 | |
| | | | | | | | |
Net increase (decrease) in shares outstanding | | | 6,896 | | | $ | 63,899 | |
| | | | | | | | |
Period ended October 31, 2017*: | | | | | | | | |
Shares sold | | | 1,072 | | | $ | 10,000 | |
Shares issued in reinvestment of dividends and distributions | | | 45 | | | | 438 | |
| | | | | | | | |
Net increase (decrease) in shares outstanding | | | 1,117 | | | $ | 10,438 | |
| | | | | | | | |
| † | Includes affiliated redemption of 1,123 and 1,129 shares with a value of $10,836 and $10,892 for Class A and Z shares, respectively. |
| * | Commencement of offering was December 28, 2016. |
7. Borrowings
The Trust, on behalf of the Fund, along with other affiliated registered investment companies (the “Funds”), is a party to a Syndicated Credit Agreement (“SCA”) with a group of banks. The purpose of the SCA is to provide an alternative source of temporary funding for capital
| | | | |
| PGIM Real Estate Income Fund | | | 37 | |
Notes to Financial Statements (continued)
share redemptions. The SCA provides for a commitment of $900 million for the period October 4, 2018 through October 3, 2019. The Funds pay an annualized commitment fee of 0.15% of the unused portion of the SCA. The Fund’s portion of the commitment fee for the unused amount, allocated based upon a method approved by the Board, is accrued daily and paid quarterly. Prior to October 4, 2018, the Funds had another SCA that provided a commitment of $900 million and the Funds paid an annualized commitment fee of 0.15% of the unused portion of the SCA. The interest on borrowings under both SCAs is paid monthly and at a per annum interest rate based upon a contractual spread plus the higher of (1) the effective federal funds rate, (2) the 1-month LIBOR rate or (3) zero percent.
Other affiliated registered investment companies that are parties to the SCA include portfolios that are subject to a predetermined mathematical formula used to manage certain benefit guarantees offered under variable annuity contracts. The formula may result in large scale asset flows into and out of these portfolios. Consequently, these portfolios may be more likely to utilize the SCA for purposes of funding redemptions. It may be possible for those portfolios to fully exhaust the committed amount of the SCA, thereby requiring the Manager to allocate available funding per a Board-approved methodology designed to treat the Funds in the SCA equitably.
The Fund utilized the SCA during the reporting period ended October 31, 2018. The average daily balance for the 29 days that the Fund had loans outstanding during the period was $251,138 borrowed at a weighted average interest rate of 3.11%. The maximum loan balance outstanding during the period was $761,000. At October 31, 2018, the Fund did not have an outstanding loan balance.
8. Risks of Investing in the Fund
The Fund’s risks include, but are not limited to, some or all of the risks discussed below:
Equity and Equity-Related Securities Risks: The value of a particular security could go down and you could lose money. In addition to an individual security losing value, the value of the equity markets or a sector in which the Fund invests could go down. The Fund’s holdings can vary significantly from broad market indexes and the performance of the Fund can deviate from the performance of these indexes. Different parts of a market can react differently to adverse issuer, market, regulatory, political and economic developments.
Foreign Securities Risk: The Fund’s investments in securities of foreign issuers or issuers with significant exposure to foreign markets involve additional risk. Foreign countries in which the Fund may invest may have markets that are less liquid, less regulated and more volatile than US markets. The value of the Fund’s investments may decline because of
factors affecting the particular issuer as well as foreign markets and issuers generally, such as unfavorable government actions, and political or financial instability.
Non-diversification Risk: The Fund is non-diversified, meaning that the Fund may invest a greater percentage of its assets in the securities of a single company or industry than a diversified fund. Investing in a non-diversified fund involves greater risk than investing in a diversified fund because a loss resulting from the decline in value of any one security may represent a greater portion of the total assets of a non-diversified fund.
Risks of Investing in Equity and Mortgage Real Estate Investment Trusts (collectively equity REITs): Real estate securities are subject to similar risks as direct investments in real estate and mortgages, and their value will depend on the value of the underlying properties or the underlying loans or interests. The underlying loans may be subject to the risks of default or of payments that occur earlier or later than expected, and such loans may also include so-called “subprime” mortgages. The value of these securities will rise and fall in response to many factors, Including economic conditions, the demand for rental property and interest rates. In particular, the value of these securities may decline when interest rates rise and will also be affected by the real estate market and by the management of the underlying properties.
In addition, investing in equity REITs involves certain unique risks in addition to those risks associated with investing in the real estate industry in general. Equity REITs may be affected by changes in the value of the underlying property owned by the equity REITs, while mortgage equity REITs may be affected by the quality of any credit extended. Equity REITs are dependent upon management skills, may not be diversified geographically or by property/mortgage asset type, and are subject to heavy cash flow dependency, default by borrowers and self-liquidation. Since equity REITs are relatively smaller in size when compared to the broader market, and smaller companies tend to be more volatile than larger companies, they may be more volatile and/or more illiquid than other types of equity securities. Equity REITs are subject to interest rate risks. Equity REITs may incur significant amounts of leverage. The Fund will indirectly bear a portion of the expenses, including management fees, paid by each equity REIT in which it invests, in addition to the expenses of the Fund.
9. Recent Accounting Pronouncements and Reporting Updates
In August 2018, the Securities and Exchange Commission (the “SEC”) adopted amendments to Regulation S-X to update and simplify the disclosure requirements for registered investment companies by eliminating requirements that are redundant or duplicative of US GAAP requirements or other SEC disclosure requirements. The new amendments require the presentation of the total, rather than the components, of distributable earnings on the Statement of Assets and Liabilities and the total, rather than the components, of dividends from net investment income and distributions from net realized gains on the Statements of Changes in Net Assets. The amendments also removed the requirement for the parenthetical disclosure of undistributed net investment income on
| | | | |
| PGIM Real Estate Income Fund | | | 39 | |
Notes to Financial Statements (continued)
the Statements of Changes in Net Assets and certain tax adjustments that were reflected in the Notes to Financial Statements. All of these have been reflected in the Fund’s financial statements.
In August 2018, the FASB issued Accounting Standards Update (“ASU”) No. 2018-13, which changes certain fair value measurement disclosure requirements. The new ASU, in addition to other modifications and additions, removes the requirement to disclose the amount and reasons for transfers between Level 1 and Level 2 of the fair value hierarchy, and the Fund’s policy for the timing of transfers between levels. The amendments are effective for financial statements issued for fiscal years beginning after December 15, 2019, and interim periods within those fiscal years. Management has evaluated the implications of certain provisions of the ASU and has determined to early adopt aspects related to the removal and modification of certain fair value measurement disclosures under the ASU effective immediately. At this time, management is evaluating the implications of certain other provisions of the ASU related to new disclosure requirements and any impact on the financial statement disclosures has not yet been determined.
Financial Highlights
| | | | | | | | | | | | | | | | | | | | |
| Class A Shares | |
| | | Year Ended October 31, | | | | | | June 3,
2015(a)
through
October 31,
| |
| | | 2018 | | | 2017 | | | 2016 | | | 2015 | |
| Per Share Operating Performance(b): | | | | | | | | | | | | | | | | | | | | |
| Net Asset Value, Beginning of Period | | | $9.62 | | | | $9.66 | | | | $9.59 | | | | | | | | $10.00 | |
| Income (loss) from investment operations: | | | | | | | | | | | | | | | | | | | | |
| Net investment income (loss) | | | 0.34 | | | | 0.39 | | | | 0.24 | | | | | | | | 0.13 | |
| Net realized and unrealized gain (loss) on investment and foreign currency transactions | | | (0.63 | ) | | | 0.05 | | | | 0.39 | | | | | | | | (0.38 | ) |
| Total from investment operations | | | (0.29 | ) | | | 0.44 | | | | 0.63 | | | | | | | | (0.25 | ) |
| Less Dividends and Distributions: | | | | | | | | | | | | | | | | | | | | |
| Dividends from net investment income | | | (0.50 | ) | | | (0.48 | ) | | | (0.56 | ) | | | | | | | (0.16 | ) |
| Tax return of capital distributions | | | (0.07 | ) | | | - | | | | - | | | | | | | | - | |
| Total dividends and distributions | | | (0.57 | ) | | | (0.48 | ) | | | (0.56 | ) | | | | | | | (0.16 | ) |
| Net asset value, end of period | | | $8.76 | | | | $9.62 | | | | $9.66 | | | | | | | | $9.59 | |
| Total Return(c): | | | (3.15)% | | | | 4.60% | | | | 6.92% | | | | | | | | (2.55)% | |
| |
| Ratios/Supplemental Data: | |
| Net assets, end of period (000) | | | $621 | | | | $914 | | | | $637 | | | | | | | | $33 | |
| Average net assets (000) | | | $878 | | | | $744 | | | | $186 | | | | | | | | $24 | |
| Ratios to average net assets(d): | | | | | | | | | | | | | | | | | | | | |
| Expenses after waivers and/or expense reimbursement | | | 1.36% | | | | 1.35% | | | | 1.35% | | | | | | | | 1.36% | (e) |
| Expenses before waivers and/or expense reimbursement | | | 4.85% | (f) | | | 3.30% | | | | 3.37% | | | | | | | | 9.50% | (e) |
| Net investment income (loss) | | | 3.73% | | | | 4.00% | | | | 2.45% | | | | | | | | 3.15% | (e) |
| Portfolio turnover rate(g) | | | 153% | | | | 137% | | | | 113% | | | | | | | | 98% | |
| (a) | Commencement of operations. |
| (b) | Calculated based on average shares outstanding during the period. |
| (c) | Total return does not consider the effects of sales loads. Total return is calculated assuming a purchase of a share on the first day and a sale on the last day of each period reported and includes reinvestment of dividends and distributions, if any. Total returns may reflect adjustments to conform to generally accepted accounting principles. Total returns for periods less than one full year are not annualized. |
| (d) | Does not include expenses of the underlying funds in which the Fund invests. |
| (f) | Effective November 1, 2017, class specific expenses include transfer agent fees and expenses and registration fees, which are charged to their respective share class. |
| (g) | The Fund’s portfolio turnover rate is calculated in accordance with regulatory requirements, without regard to transactions involving short term investments and certain derivatives. If such transactions were included, the Fund’s portfolio turnover rate may be higher. |
See Notes to Financial Statements.
| | | | |
| PGIM Real Estate Income Fund | | | 41 | |
Financial Highlights (continued)
| | | | | | | | | | | | | | | | | | | | |
| Class C Shares | |
| | | Year Ended October 31, | | | | | | June 3,
2015(a)
through
October 31, | |
| | | 2018 | | | 2017 | | | 2016 | | | 2015 | |
| Per Share Operating Performance(b): | | | | | | | | | | | | | | | | | | | | |
| Net Asset Value, Beginning of Period | | | $9.62 | | | | $9.66 | | | | $9.58 | | | | | | | | $10.00 | |
| Income (loss) from investment operations: | | | | | | | | | | | | | | | | | | | | |
| Net investment income (loss) | | | 0.27 | | | | 0.32 | | | | 0.19 | | | | | | | | 0.11 | |
| Net realized and unrealized gain (loss) on investment and foreign currency transactions | | | (0.63 | ) | | | 0.05 | | | | 0.38 | | | | | | | | (0.40 | ) |
| Total from investment operations | | | (0.36 | ) | | | 0.37 | | | | 0.57 | | | | | | | | (0.29 | ) |
| Less Dividends and Distributions: | | | | | | | | | | | | | | | | | | | | |
| Dividends from net investment income | | | (0.44 | ) | | | (0.41 | ) | | | (0.49 | ) | | | | | | | (0.13 | ) |
| Tax return of capital distributions | | | (0.06 | ) | | | - | | | | - | | | | | | | | - | |
| Total dividends and distributions | | | (0.50 | ) | | | (0.41 | ) | | | (0.49 | ) | | | | | | | (0.13 | ) |
| Net asset value, end of period | | | $8.76 | | | | $9.62 | | | | $9.66 | | | | | | | | $9.58 | |
| Total Return(c): | | | (3.85)% | | | | 3.83% | | | | 6.22% | | | | | | | | (2.91)% | |
| |
| Ratios/Supplemental Data: | |
| Net assets, end of period (000) | | | $336 | | | | $293 | | | | $321 | | | | | | | | $13 | |
| Average net assets (000) | | | $314 | | | | $309 | | | | $151 | | | | | | | | $11 | |
| Ratios to average net assets(d): | | | | | | | | | | | | | | | | | | | | |
| Expenses after waivers and/or expense reimbursement | | | 2.11% | | | | 2.10% | | | | 2.10% | | | | | | | | 2.13% | (e) |
| Expenses before waivers and/or expense reimbursement | | | 8.85% | (f) | | | 4.00% | | | | 4.78% | | | | | | | | 10.11% | (e) |
| Net investment income (loss) | | | 2.98% | | | | 3.29% | | | | 1.98% | | | | | | | | 2.87% | (e) |
| Portfolio turnover rate(g) | | | 153% | | | | 137% | | | | 113% | | | | | | | | 98% | |
| (a) | Commencement of operations. |
| (b) | Calculated based on average shares outstanding during the period. |
| (c) | Total return does not consider the effects of sales loads. Total return is calculated assuming a purchase of a share on the first day and a sale on the last day of each period reported and includes reinvestment of dividends and distributions, if any. Total returns may reflect adjustments to conform to generally accepted accounting principles. Total returns for periods less than one full year are not annualized. |
| (d) | Does not include expenses of the underlying funds in which the Fund invests. |
| (f) | Effective November 1, 2017, class specific expenses include transfer agent fees and expenses and registration fees, which are charged to their respective share class. |
| (g) | The Fund’s portfolio turnover rate is calculated in accordance with regulatory requirements, without regard to transactions involving short term investments and certain derivatives. If such transactions were included, the Fund’s portfolio turnover rate may be higher. |
See Notes to Financial Statements.
| | | | | | | | | | | | | | | | | | | | |
| Class Z Shares | |
| | | Year Ended October 31, | | | | | | June 3,
2015(a)
through
October 31, | |
| | | 2018 | | | 2017 | | | 2016 | | | 2015 | |
| Per Share Operating Performance(b): | | | | | | | | | | | | | | | | | | | | |
| Net Asset Value, Beginning of Period | | | $9.62 | | | | $9.66 | | | | $9.59 | | | | | | | | $10.00 | |
| Income (loss) from investment operations: | | | | | | | | | | | | | | | | | | | | |
| Net investment income (loss) | | | 0.39 | | | | 0.40 | | | | 0.38 | | | | | | | | 0.16 | |
| Net realized and unrealized gain (loss) on investment and foreign currency transactions | | | (0.64 | ) | | | 0.06 | | | | 0.28 | | | | | | | | (0.41 | ) |
| Total from investment operations | | | (0.25 | ) | | | 0.46 | | | | 0.66 | | | | | | | | (0.25 | ) |
| Less Dividends and Distributions: | | | | | | | | | | | | | | | | | | | | |
| Dividends from net investment income | | | (0.52 | ) | | | (0.50 | ) | | | (0.59 | ) | | | | | | | (0.16 | ) |
| Tax return of capital distributions | | | (0.07 | ) | | | - | | | | - | | | | | | | | - | |
| Total dividends and distributions | | | (0.59 | ) | | | (0.50 | ) | | | (0.59 | ) | | | | | | | (0.16 | ) |
| Net asset value, end of period | | | $8.78 | | | | $9.62 | | | | $9.66 | | | | | | | | $9.59 | |
| Total Return(c): | | | (2.70)% | | | | 4.85% | | | | 7.19% | | | | | | | | (2.47)% | |
| |
| Ratios/Supplemental Data: | |
| Net assets, end of period (000) | | | $6,951 | | | | $10,681 | | | | $5,512 | | | | | | | | $4,886 | |
| Average net assets (000) | | | $8,632 | | | | $8,961 | | | | $5,008 | | | | | | | | $4,868 | |
| Ratios to average net assets(d): | | | | | | | | | | | | | | | | | | | | |
| Expenses after waivers and/or expense reimbursement | | | 0.98% | | | | 1.10% | | | | 1.10% | | | | | | | | 1.10% | (e) |
| Expenses before waivers and/or expense reimbursement | | | 2.81% | (f) | | | 2.96% | | | | 4.85% | | | | | | | | 8.98% | (e) |
| Net investment income (loss) | | | 4.25% | | | | 4.17% | | | | 3.98% | | | | | | | | 4.08% | (e) |
| Portfolio turnover rate(g) | | | 153% | | | | 137% | | | | 113% | | | | | | | | 98% | |
| (a) | Commencement of operations. |
| (b) | Calculated based on average shares outstanding during the period. |
| (c) | Total return is calculated assuming a purchase of a share on the first day and a sale on the last day of each period reported and includes reinvestment of dividends and distributions, if any. Total returns may reflect adjustments to conform to generally accepted accounting principles. Total returns for periods less than one full year are not annualized. |
| (d) | Does not include expenses of the underlying funds in which the Fund invests. |
| (f) | Effective November 1, 2017, class specific expenses include transfer agent fees and expenses and registration fees, which are charged to their respective share class. |
| (g) | The Fund’s portfolio turnover rate is calculated in accordance with regulatory requirements, without regard to transactions involving short term investments and certain derivatives. If such transactions were included, the Fund’s portfolio turnover rate may be higher. |
See Notes to Financial Statements.
| | | | |
| PGIM Real Estate Income Fund | | | 43 | |
Financial Highlights (continued)
| | | | | | | | | | | | |
| Class R6 Shares | | | | | | | | | |
| | | Year Ended
October 31,
2018 | | | | | | December 28,
2016(a)
through
October 31,
2017 | |
| Per Share Operating Performance(b): | | | | | | | | | | | | |
| Net Asset Value, Beginning of Period | | | $9.62 | | | | | | | | $9.33 | |
| Income (loss) from investment operations: | | | | | | | | | | | | |
| Net investment income (loss) | | | 0.25 | | | | | | | | 0.31 | |
| Net realized and unrealized gain (loss) on investment and foreign currency transactions | | | (0.52 | ) | | | | | | | 0.38 | |
| Total from investment operations | | | (0.27 | ) | | | | | | | 0.69 | |
| Less Dividends and Distributions: | | | | | | | | | | | | |
| Dividends from net investment income | | | (0.50 | ) | | | | | | | (0.40 | ) |
| Tax return of capital distributions | | | (0.09 | ) | | | | | | | - | |
| Total dividends and distributions | | | (0.59 | ) | | | | | | | (0.40 | ) |
| Net asset value, end of period | | | $8.76 | | | | | | | | $9.62 | |
| Total Return(c): | | | (2.92)% | | | | | | | | 7.43% | |
| |
| Ratios/Supplemental Data: | | | | | | | | | |
| Net assets, end of period (000) | | | $70 | | | | | | | | $11 | |
| Average net assets (000) | | | $17 | | | | | | | | $11 | |
| Ratios to average net assets(d): | | | | | | | | | | | | |
| Expenses after waivers and/or expense reimbursement | | | 1.10% | | | | | | | | 1.10% | (e) |
| Expenses before waivers and/or expense reimbursement | | | 91.97% | (f) | | | | | | | 2.79% | (e) |
| Net investment income (loss) | | | 2.70% | | | | | | | | 3.78% | (e) |
| Portfolio turnover rate(g) | | | 153% | | | | | | | | 137% | |
| (a) | Commencement of offering. |
| (b) | Calculated based on average shares outstanding during the period. |
| (c) | Total return is calculated assuming a purchase of a share on the first day and a sale on the last day of each period reported and includes reinvestment of dividends and distributions, if any. Total returns may reflect adjustments to conform to generally accepted accounting principles. Total returns for periods less than one full year are not annualized. |
| (d) | Does not include expenses of the underlying funds in which the Fund invests. |
| (f) | Effective November 1, 2017, class specific expenses include transfer agent fees and expenses and registration fees, which are charged to their respective share class. |
| (g) | The Fund’s portfolio turnover rate is calculated in accordance with regulatory requirements, without regard to transactions involving short term investments and certain derivatives. If such transactions were included, the Fund’s portfolio turnover rate may be higher. |
See Notes to Financial Statements.
Report of Independent Registered Public Accounting Firm
The Board of Trustees and Shareholders
Prudential Investment Portfolios 9:
Opinion on the Financial Statements
We have audited the accompanying statement of assets and liabilities of PGIM Real Estate Income Fund (formerly Prudential Real Estate Income Fund) (the “Fund”), a series of Prudential Investment Portfolios 9, including the schedule of investments, as of October 31, 2018, the related statement of operations for the year then ended, the statements of changes in net assets for each of the years in the two-year period then ended, and the related notes (collectively, the financial statements) and the financial highlights for the years or periods indicated therein. In our opinion, the financial statements and financial highlights present fairly, in all material respects, the financial position of the Fund as of October 31, 2018, the results of its operations for the year then ended, the changes in its net assets for each of the years in the two-year period then ended, and the financial highlights for the years or periods indicated therein, in conformity with U.S. generally accepted accounting principles.
Basis for Opinion
These financial statements and financial highlights are the responsibility of the Fund’s management. Our responsibility is to express an opinion on these financial statements and financial highlights based on our audits. We are a public accounting firm registered with the Public Company Accounting Oversight Board (United States) (“PCAOB”) and are required to be independent with respect to the Fund in accordance with the U.S. federal securities laws and the applicable rules and regulations of the Securities and Exchange Commission and the PCAOB.
We conducted our audits in accordance with the standards of the PCAOB. Those standards require that we plan and perform the audit to obtain reasonable assurance about whether the financial statements and financial highlights are free of material misstatement, whether due to error or fraud. Our audits included performing procedures to assess the risks of material misstatement of the financial statements and financial highlights, whether due to error or fraud, and performing procedures that respond to those risks. Such procedures included examining, on a test basis, evidence regarding the amounts and disclosures in the financial statements and financial highlights. Such procedures also included confirmation of securities owned as of October 31, 2018, by correspondence with the custodians, transfer agents and brokers or by other appropriate auditing procedures when replies from brokers were not received. Our audits also included evaluating the accounting principles used and significant estimates made by management, as well as evaluating the overall presentation of the financial statements and financial highlights. We believe that our audits provide a reasonable basis for our opinion.

We have served as the auditor of one or more PGIM and/or Prudential Retail investment companies since 2003.
New York, New York
December 17, 2018
| | | | |
| PGIM Real Estate Income Fund | | | 45 | |
Federal Income Tax Information (unaudited)
For the year ended October 31, 2018, the Fund reports the maximum amount allowable, but not less than 11.29% of the ordinary income dividends paid during the year as qualified dividend income in accordance with Section 854 of the Internal Revenue Code.
In January 2019, you will be advised on IRS Form 1099-DIV or substitute 1099-DIV as to the federal tax status of the dividends received by you in calendar year 2018.
INFORMATION ABOUT BOARD MEMBERS AND OFFICERS (unaudited)
Information about Board Members and Officers of the Fund is set forth below. Board Members who are not deemed to be “interested persons” of the Fund, as defined in the 1940 Act, are referred to as “Independent Board Members.” Board Members who are deemed to be “interested persons” of the Fund are referred to as “Interested Board Members.” The Board Members are responsible for the overall supervision of the operations of the Fund and perform the various duties imposed on the directors of investment companies by the 1940 Act. The Board in turn elects the Officers, who are responsible for administering the day-to-day operations of the Fund.
| | | | | | |
| Independent Board Members | | | | |
| | | | |
Name, Address, Age Position(s) Portfolios Overseen | | Principal Occupation(s) During Past Five Years | | Other Directorships Held During Past Five Years | | Length of Board Service |
| | | | |
Ellen S. Alberding (60) Board Member Portfolios Overseen: 93 | | President and Board Member, The Joyce Foundation (charitable foundation) (since 2002); Vice Chair, City Colleges of Chicago (community college system) (2011-2015); Trustee, National Park Foundation (charitable foundation for national park system) (2009-2018); Trustee, Economic Club of Chicago (since 2009); Trustee, Loyola University (since 2018). | | None. | | Since September 2013 |
| | | | |
Kevin J. Bannon (66) Board Member Portfolios Overseen: 93 | | Retired; Managing Director (April 2008-May 2015) and Chief Investment Officer (October 2008-November 2013) of Highmount Capital LLC (registered investment adviser); formerly Executive Vice President and Chief Investment Officer (April 1993-August 2007) of Bank of New York Company; President (May 2003-May 2007) of BNY Hamilton Family of Mutual Funds. | | Director of Urstadt Biddle Properties (equity real estate investment trust) (since September 2008). | | Since July 2008 |
| | | | |
Linda W. Bynoe (66) Board Member Portfolios Overseen: 93 | | President and Chief Executive Officer (since March 1995) and formerly Chief Operating Officer (December 1989-February 1995) of Telemat Ltd. (management consulting); formerly Vice President (January 1985-June 1989) at Morgan Stanley & Co. (broker-dealer). | | Director of Anixter International, Inc. (communication products distributor) (since January 2006); Director of Northern Trust Corporation (financial services) (since April 2006); Trustee of Equity Residential (residential real estate) (since December 2009). | | Since March 2005 |
PGIM Real Estate Income Fund
| | | | | | |
Independent Board Members | | | | |
| | | | |
Name, Address, Age Position(s) Portfolios Overseen | | Principal Occupation(s) During Past Five Years | | Other Directorships Held During Past Five Years | | Length of Board Service |
| | | | |
Barry H. Evans (58) Board Member Portfolios Overseen: 92 | | Retired; formerly President (2005 – 2016), Global Chief Operating Officer (2014– 2016), Chief Investment Officer – Global Head of Fixed Income (1998-2014), and various portfolio manager roles (1986-2006), Manulife Asset Management U.S. | | Director, Manulife Trust Company (since 2011); formerly Director, Manulife Asset Management Limited (2015-2017); formerly Chairman of the Board of Directors of Manulife Asset Management U.S. (2005-2016); formerly Chairman of the Board, Declaration Investment Management and Research (2008-2016). | | Since September 2017 |
| | | | |
Keith F. Hartstein (62) Board Member & Independent Chair Portfolios Overseen: 93 | | Retired; Member (since November 2014) of the Governing Council of the Independent Directors Council (organization of independent mutual fund directors); formerly President and Chief Executive Officer (2005-2012), Senior Vice President (2004-2005), Senior Vice President of Sales and Marketing (1997-2004), and various executive management positions (1990-1997), John Hancock Funds, LLC (asset management); Chairman, Investment Company Institute’s Sales Force Marketing Committee (2003-2008). | | None. | | Since September 2013 |
Visit our website at pgiminvestments.com
| | | | | | |
| Independent Board Members | | | | |
| | | | |
Name, Address, Age Position(s) Portfolios Overseen | | Principal Occupation(s) During Past Five Years | | Other Directorships Held During Past Five Years | | Length of Board Service |
| | | | |
Laurie Simon Hodrick (56) Board Member Portfolios Overseen: 92 | | A. Barton Hepburn Professor Emerita of Economics in the Faculty of Business, Columbia Business School (since 2018); Visiting Professor of Law, Stanford Law School (since 2015); Visiting Fellow at the Hoover Institution, Stanford University (since 2015); Sole Member, ReidCourt LLC (since 2008) (a consulting firm); formerly A. Barton Hepburn Professor of Economics in the Faculty of Business, Columbia Business School (1996-2017); formerly Managing Director, Global Head of Alternative Investment Strategies, Deutsche Bank (2006-2008). | | Independent Director, Corporate Capital Trust (since April 2017) (a business development company); Independent Director, Kabbage, Inc. (since July 2018) (financial services). | | Since September 2017 |
| | | | |
Michael S. Hyland, CFA (73) Board Member Portfolios Overseen: 93 | | Retired (since February 2005); formerly Senior Managing Director (July 2001-February 2005) of Bear Stearns & Co, Inc.; Global Partner, INVESCO (1999-2001); Managing Director and President of Salomon Brothers Asset Management (1989-1999). | | None. | | Since July 2008 |
| | | | |
Richard A. Redeker (75) Board Member Portfolios Overseen: 93 | | Retired Mutual Fund Senior Executive (50 years); Management Consultant; Director, Mutual Fund Directors Forum (since 2014); Independent Directors Council (organization of independent mutual fund directors)-Executive Committee, Chair of Policy Steering Committee, Governing Council. | | None. | | Since October 1993 |
PGIM Real Estate Income Fund
| | | | | | |
| Independent Board Members | | | | |
| | | | |
Name, Address, Age Position(s) Portfolios Overseen | | Principal Occupation(s) During Past Five Years | | Other Directorships Held During Past Five Years | | Length of Board Service |
| | | | |
Brian K. Reid (56)# Board Member Portfolios Overseen: 92 | | Retired; formerly Chief Economist for the Investment Company Institute (ICI) (2005-2017); formerly Senior Economist and Director of Industry and Financial Analysis at the ICI (1998-2004); formerly Senior Economist, Industry and Financial Analysis at the ICI (1996-1998); formerly Staff Economist at the Federal Reserve Board (1989-1996); Director, ICI Mutual Insurance Company (2012-2017). | | None. | | Since March 2018 |
| # | Mr. Reid joined the Board effective as of March 1, 2018. |
| | | | | | |
| Interested Board Members | | | | |
| | | | |
Name, Address, Age Position(s) Portfolios Overseen | | Principal Occupation(s) During Past Five Years | | Other Directorships Held During Past Five Years | | Length of
Board Service |
| | | | |
Stuart S. Parker (56) Board Member & President Portfolios Overseen: 93 | | President of PGIM Investments LLC (formerly known as Prudential Investments LLC) (since January 2012); Executive Vice President of Prudential Investment Management Services LLC (since December 2012); formerly Executive Vice President of Jennison Associates LLC and Head of Retail Distribution of PGIM Investments LLC (June 2005-December 2011). | | None. | | Since January 2012 |
Visit our website at pgiminvestments.com
| | | | | | |
| Interested Board Members | | | | |
| | | | |
Name, Address, Age Position(s) Portfolios Overseen | | Principal Occupation(s) During Past Five Years | | Other Directorships Held During Past Five Years | | Length of Board Service |
| | | | |
Scott E. Benjamin (45) Board Member & Vice President Portfolios Overseen:93 | | Executive Vice President (since June 2009) of PGIM Investments LLC; Executive Vice President (June 2009-June 2012) and Vice President (since June 2012) of Prudential Investment Management Services LLC; Executive Vice President (since September 2009) of AST Investment Services, Inc.; Senior Vice President of Product Development and Marketing, PGIM Investments (since February 2006); formerly Vice President of Product Development and Product Management, PGIM Investments LLC (2003-2006). | | None. | | Since March 2010 |
| | | | |
Grace C. Torres* (59) Board Member Portfolios Overseen: 92 | | Retired; formerly Treasurer and Principal Financial and Accounting Officer of the PGIM Funds, Target Funds, Advanced Series Trust, Prudential Variable Contract Accounts and The Prudential Series Fund (1998-June 2014); Assistant Treasurer (March 1999-June 2014) and Senior Vice President (September 1999-June 2014) of PGIM Investments LLC; Assistant Treasurer (May 2003-June 2014) and Vice President (June 2005-June 2014) of AST Investment Services, Inc.; Senior Vice President and Assistant Treasurer (May 2003-June 2014) of Prudential Annuities Advisory Services, Inc. | | Formerly Director (July 2015-January 2018) of Sun Bancorp, Inc. N.A. and Sun National Bank; Director (since January 2018) of OceanFirst Financial Corp. and OceanFirst Bank. | | Since November 2014 |
* Note: Prior to her retirement in 2014, Ms. Torres was employed by PGIM Investments LLC. Due to her prior employment, she is considered to be an “interested person” under the 1940 Act. Ms. Torres is a Non-Management Interested Board Member.
PGIM Real Estate Income Fund
| | | | |
| Fund Officers(a) | | | | |
| | | |
Name, Address and Age Position with Fund | | Principal Occupation(s) During Past Five Years | | Length of Service as Fund Officer |
| | | |
Raymond A. O’Hara (63) Chief Legal Officer | | Vice President and Corporate Counsel (since July 2010) of Prudential Insurance Company of America (Prudential); Vice President (March 2011-Present) of Pruco Life Insurance Company and Pruco Life Insurance Company of New Jersey; Vice President and Corporate Counsel (March 2011-Present) of Prudential Annuities Life Assurance Corporation; Chief Legal Officer of PGIM Investments LLC (since June 2012); Chief Legal Officer of Prudential Mutual Fund Services LLC (since June 2012) and Corporate Counsel of AST Investment Services, Inc. (since June 2012); formerly Assistant Vice President and Corporate Counsel (September 2008-July 2010) of The Hartford Financial Services Group, Inc.; formerly Associate (September 1980-December 1987) and Partner (January 1988–August 2008) of Blazzard & Hasenauer, P.C. (formerly, Blazzard, Grodd & Hasenauer, P.C.). | | Since June 2012 |
| | | |
Chad A. Earnst (43) Chief Compliance Officer | | Chief Compliance Officer (September 2014-Present) of PGIM Investments LLC; Chief Compliance Officer (September 2014-Present) of the PGIM Funds, Target Funds, Advanced Series Trust, The Prudential Series Fund, Prudential’s Gibraltar Fund, Inc., PGIM Global Short Duration High Yield Income Fund, Inc., PGIM Short Duration High Yield Fund, Inc. and PGIM Jennison MLP Income Fund, Inc.; formerly Assistant Director (March 2010-August 2014) of the Asset Management Unit, Division of Enforcement, US Securities & Exchange Commission; Assistant Regional Director (January 2010-August 2014), Branch Chief (June 2006–December 2009) and Senior Counsel (April 2003-May 2006) of the Miami Regional Office, Division of Enforcement, US Securities & Exchange Commission. | | Since September 2014 |
| | | |
Dino Capasso (44) Deputy Chief Compliance Officer | | Vice President and Deputy Chief Compliance Officer (June 2017-Present) of PGIM Investments LLC; formerly, Senior Vice President and Senior Counsel (January 2016-June 2017), and Vice President and Counsel (February 2012-December 2015) of Pacific Investment Management Company LLC. | | Since March 2018 |
| | | |
Andrew R. French (56) Secretary | | Vice President and Corporate Counsel (since February 2010) of Prudential; formerly Director and Corporate Counsel (2006-2010) of Prudential; Vice President and Assistant Secretary (since January 2007) of PGIM Investments LLC; Vice President and Assistant Secretary (since January 2007) of Prudential Mutual Fund Services LLC. | | Since October 2006 |
Visit our website at pgiminvestments.com
| | | | |
| Fund Officers(a) | | | | |
| | | |
Name, Address and Age Position with Fund | | Principal Occupation(s) During Past Five Years | | Length of Service as Fund Officer |
| | | |
Jonathan D. Shain (60) Assistant Secretary | | Vice President and Corporate Counsel (since August 1998) of Prudential; Vice President and Assistant Secretary (since May 2001) of PGIM Investments LLC; Vice President and Assistant Secretary (since February 2001) of Prudential Mutual Fund Services LLC; formerly Vice President and Assistant Secretary (May 2003-June 2005) of AST Investment Services, Inc. | | Since May 2005 |
| | | |
Claudia DiGiacomo (44) Assistant Secretary | | Vice President and Corporate Counsel (since January 2005) of Prudential; Vice President and Assistant Secretary of PGIM Investments LLC (since December 2005); formerly Associate at Sidley Austin Brown & Wood LLP (1999-2004). | | Since December 2005 |
| | | |
Charles H. Smith (45) Anti-Money Laundering Compliance Officer | | Vice President, Corporate Compliance, Anti-Money Laundering Unit (since January 2015) of Prudential; committee member of the American Council of Life Insurers Anti-Money Laundering and Critical Infrastructure Committee (since January 2016); formerly Global Head of Economic Sanctions Compliance at AIG Property Casualty (February 2007 – December 2014); Assistant Attorney General at the New York State Attorney General’s Office, Division of Public Advocacy. (August 1998 —January 2007). | | Since January 2017 |
| | | |
Brian D. Nee (52) Treasurer and Principal Financial and Accounting Officer | | Vice President and Head of Finance of PGIM Investments LLC (since August 2015) and PGIM Global Partners (since February 2017); formerly, Vice President, Treasurer’s Department of Prudential (September 2007-August 2015). | | Since July 2018 |
| | | |
Peter Parrella (60) Assistant Treasurer | | Vice President (since 2007) and Director (2004-2007) within Prudential Mutual Fund Administration; formerly Tax Manager at SSB Citi Fund Management LLC (1997-2004). | | Since June 2007 |
| | | |
Lana Lomuti (51) Assistant Treasurer | | Vice President (since 2007) and Director (2005-2007), within Prudential Mutual Fund Administration; formerly Assistant Treasurer (December 2007-February 2014) of The Greater China Fund, Inc. | | Since April 2014 |
| | | |
Linda McMullin (57) Assistant Treasurer | | Vice President (since 2011) and Director (2008-2011) within Prudential Mutual Fund Administration. | | Since April 2014 |
| | | |
Kelly A. Coyne (50) Assistant Treasurer | | Director, Investment Operations of Prudential Mutual Fund Services LLC (since 2010). | | Since March 2015 |
(a) Excludes Mr. Parker and Mr. Benjamin, interested Board Members who also serve as President and Vice President, respectively.
Explanatory Notes to Tables:
| ∎ | | Board Members are deemed to be “Interested,” as defined in the 1940 Act, by reason of their affiliation with PGIM Investments LLC and/or an affiliate of PGIM Investments LLC. |
| ∎ | | Unless otherwise noted, the address of all Board Members and Officers is c/o PGIM Investments LLC, 655 Broad Street, Newark, New Jersey 07102-4410. |
| ∎ | | There is no set term of office for Board Members or Officers. The Board Members have adopted a retirement policy, which calls for the retirement of Board Members on December 31 of the year in which they reach the age of 75. |
PGIM Real Estate Income Fund
| ∎ | | “Other Directorships Held” includes only directorships of companies required to register or file reports with the SEC under the 1934 Act (that is, “public companies”) or other investment companies registered under the 1940 Act. |
| ∎ | | “Portfolios Overseen” includes all investment companies managed by PGIM Investments LLC. The investment companies for which PGIM Investments LLC serves as manager include the PGIM Funds, The Prudential Variable Contract Accounts, PGIM ETF Trust, PGIM Short Duration High Yield Fund, Inc., PGIM Global Short Duration High Yield Fund, Inc., The Prudential Series Fund, Prudential’s Gibraltar Fund, Inc. and the Advanced Series Trust. |
Visit our website at pgiminvestments.com
Approval of Advisory Agreements (unaudited)
The Fund’s Board of Trustees
The Board of Trustees (the “Board”) of PGIM Real Estate Income Fund (the “Fund”)1 consists of twelve individuals, nine of whom are not “interested persons” of the Fund, as defined in the Investment Company Act of 1940, as amended (the “1940 Act”) (the “Independent Trustees”). The Board is responsible for the oversight of the Fund and its operations, and performs the various duties imposed on the directors of investment companies by the 1940 Act. The Independent Trustees have retained independent legal counsel to assist them in connection with their duties. The Chair of the Board is an Independent Trustee. The Board has established four standing committees: the Audit Committee, the Nominating and Governance Committee, and two Investment Committees. Each committee is chaired by, and composed of, Independent Trustees.
Annual Approval of the Fund’s Advisory Agreements
As required under the 1940 Act, the Board determines annually whether to renew the Fund’s management agreement with PGIM Investments LLC (“PGIM Investments”) and the Fund’s subadvisory agreement with PGIM, Inc. (“PGIM”) on behalf of its PGIM Real Estate unit. In considering the renewal of the agreements, the Board, including all of the Independent Trustees, met on June 7, 2018 and on June 19-21, 2018 and approved the renewal of the agreements through July 31, 2019, after concluding that the renewal of the agreements was in the best interests of the Fund and its shareholders.
In advance of the meetings, the Board requested and received materials relating to the agreements, and had the opportunity to ask questions and request further information in connection with its consideration. Among other things, the Board considered comparative fee information from PGIM Investments and PGIM. Also, the Board considered comparisons with other mutual funds in relevant Peer Universes and Peer Groups, as is further discussed below.
In approving the agreements, the Board, including the Independent Trustees advised by independent legal counsel, considered the factors it deemed relevant, including the nature, quality and extent of services provided by PGIM Investments and the subadviser, the performance of the Fund, the profitability of PGIM Investments and its affiliates, expenses and fees, and the potential for economies of scale that may be shared with the Fund and its shareholders as the Fund’s assets grow. In their deliberations, the Trustees did not identify any single factor which alone was responsible for the Board’s decision to approve the
agreements with respect to the Fund. In connection with its deliberations, the Board considered information provided by PGIM Investments throughout the year at regular Board
| 1 | PGIM Real Estate Income Fund is a series of Prudential Investment Portfolios 9. |
| | |
| PGIM Real Estate Income Fund |
Approval of Advisory Agreements (continued)
meetings, presentations from portfolio managers and other information, as well as information furnished at or in advance of the meetings on June 7, 2018 and on June 19-21, 2018.
The Trustees determined that the overall arrangements between the Fund and PGIM Investments, which serves as the Fund’s investment manager pursuant to a management agreement, and between PGIM Investments and PGIM, which, through its PGIM Real Estate unit, serves as the Fund’s subadviser pursuant to the terms of a subadvisory agreement with PGIM Investments, are in the best interests of the Fund and its shareholders in light of the services performed, fees charged and such other matters as the Trustees considered relevant in the exercise of their business judgment.
The material factors and conclusions that formed the basis for the Trustees’ reaching their determinations to approve the continuance of the agreements are separately discussed below.
Nature, Quality and Extent of Services
The Board received and considered information regarding the nature, quality and extent of services provided to the Fund by PGIM Investments and PGIM Real Estate. The Board considered the services provided by PGIM Investments, including but not limited to the oversight of the subadviser for the Fund, as well as the provision of fund recordkeeping, compliance, and other services to the Fund. With respect to PGIM Investments’ oversight of the subadviser, the Board noted that PGIM Investments’ Strategic Investment Research Group (“SIRG”), which is a business unit of PGIM Investments, is responsible for monitoring and reporting to PGIM Investments’ senior management on the performance and operations of the subadviser. The Board also considered that PGIM Investments pays the salaries of all of the officers and interested Trustees of the Fund who are part of Fund management. The Board also considered the investment subadvisory services provided by PGIM Real Estate, including investment research and security selection, as well as adherence to the Fund’s investment restrictions and compliance with applicable Fund policies and procedures. The Board considered PGIM Investments’ evaluation of the subadviser, as well as PGIM Investments’ recommendation, based on its review of the subadviser, to renew the subadvisory agreement.
The Board considered the qualifications, backgrounds and responsibilities of PGIM Investments’ senior management responsible for the oversight of the Fund and PGIM Real Estate, and also considered the qualifications, backgrounds and responsibilities of PGIM Real Estate’s portfolio managers who are responsible for the day-to-day management of the Fund’s portfolio. The Board was provided with information pertaining to PGIM Investments’, PGIM Real Estate’s, and PGIM’s organizational structure, senior management, investment operations, and other relevant information pertaining to PGIM Investments, PGIM Real
| | |
| Visit our website at pgiminvestments.com | | |
Estate, and PGIM. The Board also noted that it received favorable compliance reports from the Fund’s Chief Compliance Officer (“CCO”) as to PGIM Investments, PGIM Real Estate, and PGIM. The Board noted that PGIM Real Estate is affiliated with PGIM Investments.
The Board concluded that it was satisfied with the nature, extent and quality of the investment management services provided by PGIM Investments and the subadvisory services provided to the Fund by PGIM Real Estate, and that there was a reasonable basis on which to conclude that the Fund benefits from the services provided by PGIM Investments and PGIM Real Estate under the management and subadvisory agreements.
Costs of Services and Profits Realized by PGIM Investments
The Board was provided with information on the profitability of PGIM Investments and its affiliates in serving as the Fund’s investment manager. The Board discussed with PGIM Investments the methodology utilized in assembling the information regarding profitability and considered its reasonableness. The Board recognized that it is difficult to make comparisons of profitability from fund management contracts because comparative information is not generally publicly available and is affected by numerous factors, including the structure of the particular adviser, the types of funds it manages, its business mix, numerous assumptions regarding allocations and the adviser’s capital structure and cost of capital. However, the Board considered that the cost of services provided by PGIM Investments to the Fund during the year ended December 31, 2017 exceeded the management fees paid by the Fund, resulting in an operating loss to PGIM Investments. Taking these factors into account, the Board concluded that the profitability of PGIM Investments and its affiliates in relation to the services rendered was not unreasonable.
Economies of Scale
The Board received and discussed information concerning economies of scale that PGIM Investments may realize as the Fund’s assets grow beyond current levels. The Board noted that the management fee schedule for the Fund includes breakpoints, which have the effect of decreasing the fee rate as assets increase. During the course of time, the Board has considered information regarding the launch date of the Fund, the management fees of the Fund compared to those of similarly managed funds and PGIM Investments’ investment in the Fund over time. The Board noted that economies of scale can be shared with the Fund in other ways, including low management fees from inception, additional technological and personnel investments to enhance shareholder services, and maintaining existing expense structures in the face of a rising cost environment. The Board also considered PGIM Investments’ assertion that it continually evaluates the management fee schedule of the Fund and the potential to share economies of scale through breakpoints or fee waivers as asset levels increase.
| | |
| PGIM Real Estate Income Fund |
Approval of Advisory Agreements (continued)
The Board recognized the inherent limitations of any analysis of economies of scale, stemming largely from the Board’s understanding that most of PGIM Investments’ costs are not specific to individual funds, but rather are incurred across a variety of products and services.
Other Benefits to PGIM Investments and PGIM Real Estate
The Board considered potential ancillary benefits that might be received by PGIM Investments, PGIM Real Estate and their affiliates as a result of their relationship with the Fund. The Board concluded that potential benefits to be derived by PGIM Investments included transfer agency fees received by the Fund’s transfer agent (which is affiliated with PGIM Investments), and benefits to its reputation as well as other intangible benefits resulting from PGIM Investments’ association with the Fund. The Board concluded that the potential benefits to be derived by PGIM Real Estate included its ability to use soft dollar credits, as well as the potential benefits consistent with those generally resulting from an increase in assets under management, specifically, potential access to additional research resources and benefits to its reputation. The Board concluded that the benefits derived by PGIM Investments and PGIM Real Estate were consistent with the types of benefits generally derived by investment managers and subadvisers to mutual funds.
Performance of the Fund / Fees and Expenses
The Board considered certain additional specific factors and made related conclusions relating to the historical performance of the Fund for the one-year period ended December 31, 2017. The Board considered that the Fund commenced operations on June 3, 2015 and that longer-term performance was not yet available.
The Board also considered the Fund’s actual management fee, as well as the Fund’s net total expense ratio, for the fiscal year ended October 31, 2017. The Board considered the management fee for the Fund as compared to the management fee charged by PGIM Investments to other funds and the fee charged by other advisers to comparable mutual funds in a Peer Group. The actual management fee represents the fee rate actually paid by Fund shareholders and includes any fee waivers or reimbursements. The net total expense ratio for the Fund represents the actual expense ratio incurred by Fund shareholders.
The mutual funds included in the Peer Universe (the Lipper Global Real Estate Funds Performance Universe), which was used to consider performance, and the Peer Group, which was used to consider expenses and fees, were objectively determined by Broadridge, an independent provider of mutual fund data. In certain circumstances, PGIM Investments also may have provided supplemental Peer Universe or Peer Group information for reasons addressed with the Board. The comparisons placed the Fund in various quartiles, with the
| | |
| Visit our website at pgiminvestments.com | | |
first quartile being the best 25% of the mutual funds (for performance, the best performing mutual funds and, for expenses, the lowest cost mutual funds).
The section below summarizes key factors considered by the Board and the Board’s conclusions regarding the Fund’s performance, fees and overall expenses. The table sets forth gross performance comparisons (which do not reflect the impact on performance of fund expenses, or any subsidies, expense caps or waivers that may be applicable) with the Peer Universe, actual management fees with the Peer Group (which reflect the impact of any subsidies or fee waivers), and net total expenses with the Peer Group, each of which were key factors considered by the Board.
| | | | | | | | |
Gross
Performance | | 1 Year | | 3 Years | | 5 Years | | 10 Years |
| | 4th Quartile | | N/A | | N/A | | N/A |
| Actual Management Fees: 1st Quartile |
| Net Total Expenses: 2nd Quartile |
| | • | | The Board noted that the Fund underperformed its benchmark over the one-year period. |
| | • | | The Board noted that the Fund does not yet have a three-year performance record and that, therefore, the subadviser should have more time to develop that record. |
| | • | | The Board and PGIM Investments agreed to retain the Fund’s existing contractual expense cap, which (exclusive of certain fees and expenses) caps the Fund’s annual operating expenses at 1.35% for Class A shares, 2.10% for Class C shares, 1.10% for Class R6 shares, and 1.10% for Class Z shares through February 28, 2019. |
| | • | | The Board concluded that in light of the above, it would be in the best interests of the Fund and its shareholders to continue to allow the Fund to create a performance record, and to renew the agreements. |
| | • | | The Board concluded that the management fees (including subadvisory fees) and total expenses were reasonable in light of the services provided. |
* * *
After full consideration of these factors, the Board concluded that the approval of the agreements was in the best interests of the Fund and its shareholders.
| | |
| PGIM Real Estate Income Fund |
| | | | |
| ∎ MAIL | | ∎ TELEPHONE | | ∎ WEBSITE |
655 Broad Street Newark, NJ 07102 | | (800) 225-1852 | | www.pgiminvestments.com |
|
| PROXY VOTING |
| The Board of Trustees of the Fund has delegated to the Fund’s subadviser the responsibility for voting any proxies and maintaining proxy recordkeeping with respect to the Fund. A description of these proxy voting policies and procedures is available without charge, upon request, by calling (800) 225-1852. Information regarding how the Fund voted proxies relating to portfolio securities during the most recent 12-month period ended June 30 is available on the Fund’s website and on the Securities and Exchange Commission’s website. |
|
| TRUSTEES |
| Ellen S. Alberding • Kevin J. Bannon • Scott E. Benjamin • Linda W. Bynoe • Barry H. Evans • Keith F. Hartstein • Laurie Simon Hodrick • Michael S. Hyland • Stuart S. Parker • Richard A. Redeker • Brian K. Reid • Grace C. Torres |
|
| OFFICERS |
| Stuart S. Parker, President • Scott E. Benjamin, Vice President • Brian D. Nee, Treasurer and Principal Financial and Accounting Officer • Raymond A. O’Hara, Chief Legal Officer • Andrew R. French, Secretary • Chad A. Earnst, Chief Compliance Officer • Dino Capasso, Vice President and Deputy Chief Compliance Officer • Charles H. Smith, Anti-Money Laundering Compliance Officer • Jonathan D. Shain, Assistant Secretary • Claudia DiGiacomo, Assistant Secretary • Peter Parrella, Assistant Treasurer • Lana Lomuti, Assistant Treasurer • Linda McMullin, Assistant Treasurer • Kelly A. Coyne, Assistant Treasurer |
| | | | |
| MANAGER | | PGIM Investments LLC | | 655 Broad Street
Newark, NJ 07102 |
|
| SUBADVISER | | PGIM Real Estate | | 7 Giralda Farms
Madison, NJ 07940 |
|
| DISTRIBUTOR | | Prudential Investment
Management Services LLC | | 655 Broad Street
Newark, NJ 07102 |
|
| CUSTODIAN | | The Bank of New York Mellon | | 225 Liberty Street
New York, NY 10286 |
|
| TRANSFER AGENT | | Prudential Mutual Fund
Services LLC | | PO Box 9658
Providence, RI 02940 |
|
INDEPENDENT REGISTERED
PUBLIC ACCOUNTING FIRM | | KPMG LLP | | 345 Park Avenue
New York, NY 10154 |
|
| FUND COUNSEL | | Willkie Farr & Gallagher LLP | | 787 Seventh Avenue
New York, NY 10019 |
|
|
| An investor should consider the investment objectives, risks, charges, and expenses of the Fund carefully before investing. The prospectus and summary prospectus contain this and other information about the Fund. An investor may obtain a prospectus and summary prospectus by visiting our website at www.pgiminvestments.com or by calling (800) 225-1852. The prospectus and summary prospectus should be read carefully before investing. |
|
| E-DELIVERY |
| To receive your mutual fund documents online, go to www.pgiminvestments.com/edelivery and enroll. Instead of receiving printed documents by mail, you will receive notification via email when new materials are available. You can cancel your enrollment or change your email address at any time by visiting the website address above. |
|
| SHAREHOLDER COMMUNICATIONS WITH TRUSTEES |
| Shareholders can communicate directly with the Board of Trustees by writing to the Chair of the Board, PGIM Real Estate Income Fund, PGIM Investments, Attn: Board of Trustees, 655 Broad Street, Newark, NJ 07102. Shareholders can communicate directly with an individual Trustee by writing to the same address. Communications are not screened before being delivered to the addressee. |
|
| AVAILABILITY OF PORTFOLIO SCHEDULE |
| The Fund files its complete schedule of portfolio holdings with the Securities and Exchange Commission for the first and third quarters of each fiscal year on Form N-Q. The Fund’s Forms N-Q are available on the Commission’s website at www.sec.gov. The Fund’s schedule of portfolio holdings is also available on the Fund’s website as of the end of each month. |
|
| The Fund’s Statement of Additional Information contains additional information about the Fund’s Trustees and is available without charge, upon request, by calling (800) 225-1852. |
Mutual Funds:
| | | | |
ARE NOT INSURED BY THE FDIC OR ANY
FEDERAL GOVERNMENT AGENCY | | MAY LOSE VALUE | | ARE NOT A DEPOSIT OF OR GUARANTEED
BY ANY BANK OR ANY BANK AFFILIATE |
PGIM REAL ESTATE INCOME FUND
| | | | | | | | |
| SHARE CLASS | | A | | C | | Z | | R6* |
| NASDAQ | | PRKAX | | PRKCX | | PRKZX | | PRKQX |
| CUSIP | | 74441J761 | | 74441J753 | | 74441J746 | | 74441J670 |
*Formerly known as Class Q shares.
MF228E

PGIM SELECT REAL ESTATE FUND
(Formerly known as Prudential Select Real Estate Fund)
ANNUAL REPORT
OCTOBER 31, 2018
COMING SOON: PAPERLESS SHAREHOLDER REPORTS
Beginning on January 1, 2021, as permitted by regulations adopted by the Securities and Exchange Commission, paper copies of the Fund’s annual and semi-annual shareholder reports will no longer be sent by mail, unless you specifically request paper copies of the reports. Instead, the reports will be made available on the Fund’s website (www.pgiminvestments.com), and you will be notified by mail each time a report is posted and provided with a website link to access the report.
If you already elected to receive shareholder reports electronically, you will not be affected by this change and you need not take any action. You may elect to receive shareholder reports and other communications from the Fund electronically anytime by contacting your financial intermediary (such as a broker-dealer or bank) or, if you are a direct investor, by calling 1-800-225-1852 or by sending an e-mail request to PGIM Investments at shareholderreports@pgim.com.
Beginning on January 1, 2019, you may elect to receive all future reports in paper free of charge. If you invest through a financial intermediary, you can contact your financial intermediary or follow instructions included with this notice to elect to continue to receive paper copies of your shareholder reports. If you invest directly with the Fund, you can call 1-800-225-1852 or send an email request to shareholderreports@pgim.com to let the Fund know you wish to continue receiving paper copies of your shareholder reports. Your election to receive reports in paper will apply to all funds held in your account if you invest through your financial intermediary or all funds held with the fund complex if you invest directly with the Fund.

To enroll in e-delivery, go to pgiminvestments.com/edelivery
|
| Objective: Capital appreciation and income |
Highlights (unaudited)
| • | | Security selection drove outperformance during the reporting period, although asset allocation also had a positive impact. North America and Asia performed well, and Europe lagged. |
| • | | In the US, the industrial sector was the standout performer. Stock selection was positive, and an overweight allocation to the sector boosted relative performance. |
| • | | The majority of countries in Europe lagged, and underperformance came from a combination of unfavorable asset allocation positions and weak security selections. The largest detractors were Ireland and the UK. Germany and Finland also dragged on returns. |
| • | | Asia outperformed during the period. Stock selection was positive in Hong Kong and Japan, while no individual country in Asia had a meaningful negative effect on results. |
This report is not authorized for distribution to prospective investors unless preceded or accompanied by a current prospectus.
The views expressed in this report and information about the Fund’s portfolio holdings are for the period covered by this report and are subject to change thereafter.
Mutual funds are distributed by Prudential Investment Management Services LLC (PIMS). PGIM Real Estate is a unit of PGIM, Inc. (PGIM), a registered investment adviser. PIMS and PGIM are Prudential Financial companies. © 2018 Prudential Financial, Inc. and its related entities. PGIM Real Estate, PGIM, and the PGIM logo are service marks of Prudential Financial, Inc. and its related entities, registered in many jurisdictions worldwide.
| | |
| 2 | | Visit our website at pgiminvestments.com |
PGIM FUNDS — UPDATE
The Board of Directors/Trustees for the Fund has approved the implementation of an automatic conversion feature for Class C shares, effective as of April 1, 2019. To reflect these changes, effective April 1, 2019, the section of the Fund’s Prospectus entitled “How to Buy, Sell and Exchange Fund Shares—How to Exchange Your Shares—Frequent Purchases and Redemptions of Fund Shares” is restated to read as follows:
This supplement should be read in conjunction with your Summary Prospectus, Statutory Prospectus and Statement of Additional Information, be retained for future reference and is in addition to any existing Fund supplements.
| | 1. | In each Fund’s Statutory Prospectus, the following is added at the end of the section entitled “Fund Distributions And Tax Issues—If You Sell or Exchange Your Shares”: |
Automatic Conversion of Class C Shares
The conversion of Class C shares into Class A shares—which happens automatically approximately 10 years after purchase—is not a taxable event for federal income tax purposes. For more information about the automatic conversion of Class C shares, see Class C Shares Automatically Convert to Class A Shares in How to Buy, Sell and Exchange Fund Shares.
| | 2. | In each Fund’s Statutory Prospectus, the following sentence is added at the end of the section entitled “How to Buy, Sell and Exchange Shares—Closure of Certain Share Classes to New Group Retirement Plans”: |
Shareholders owning Class C shares may continue to hold their Class C shares until the shares automatically convert to Class A shares under the conversion schedule, or until the shareholder redeems their Class C shares.
| | 3. | In each Fund’s Statutory Prospectus, the following disclosure is added immediately following the section entitled “How to Buy, Sell and Exchange Shares—How to Buy Shares—Class B Shares Automatically Convert to Class A Shares”: |
Class C Shares Automatically Convert to Class A Shares
Starting on or about April 1, 2019 (the “Effective Date”), Class C shares will be eligible for automatic conversion into Class A shares on a monthly basis approximately ten years after the original date of purchase (the “Conversion Date”). Conversion will take place based on the relative NAV of the two classes, without the imposition of any sales load, fee or other charge. All such automatic conversions of Class C shares will constitute tax-free exchanges for federal income tax purposes.
For shareholders investing in Class C shares through retirement plans or omnibus accounts, and in certain other instances, the Fund and its agents may not have
| | | | |
| PGIM Select Real Estate Fund | | | 3 | |
transparency into how long a shareholder has held Class C shares for purposes of determining whether such Class C shares are eligible for automatic conversion into Class A shares, and the relevant financial intermediary may not have the ability to track purchases in order to credit individual shareholders’ holding periods. In these circumstances, the Fund will not be able to automatically convert Class C shares into Class A shares as described above. In order to determine eligibility for conversion in these circumstances, it is the responsibility of the financial intermediary to notify the Fund that the shareholder is eligible for the conversion of Class C shares to Class A shares, and the financial intermediary may be required to maintain and provide the Fund with records that substantiate the holding period of Class C shares. It is the financial intermediary’s (and not the Fund’s) responsibility to keep records of transactions made in accounts it holds and to ensure that the shareholder is credited with the proper holding period based on such records or those provided to the financial intermediary by the shareholder. Please consult with your financial intermediary for the applicability of this conversion feature to your shares.
A financial intermediary may sponsor and/or control accounts, programs or platforms that impose a different conversion schedule or different eligibility requirements for the exchange of Class C shares for Class A shares (see Appendix A: Waivers and Discounts Available From Certain Financial Intermediaries of the Prospectus). Please consult with your financial intermediary if you have any questions regarding your shares’ conversion from Class C shares to Class A shares.
| | 4. | In Part II of each Fund’s Statement of Additional Information, the following disclosure is added immediately following the section entitled “Purchase, Redemption and Pricing of Fund Shares—Share Classes—Automatic Conversion of Class B Shares”: |
AUTOMATIC CONVERSION OF CLASS C SHARES. Starting on or about April 1, 2019 (the “Effective Date”), Class C shares will be eligible for automatic conversion into Class A shares on a monthly basis approximately ten years after the original date of purchase (the “Conversion Date”). Conversion will take place based on the relative NAV of the two classes, without the imposition of any sales load, fee or other charge. Class C shares of a Fund acquired through automatic reinvestment of dividends or distributions will convert to Class A shares of the Fund on the Conversion Date pro rata with the converting Class C shares of the Fund that were not acquired through reinvestment of dividends or distributions. All such automatic conversions of Class C shares will constitute tax-free exchanges for federal income tax purposes.
For shareholders investing in Class C shares through retirement plans or omnibus accounts, and in certain other instances, the Fund and its agents may not have transparency into how long a shareholder has held Class C shares for purposes of determining whether such Class C shares are eligible for automatic conversion into Class A shares, and the relevant financial intermediary may not have the ability to track purchases in order to credit individual shareholders’ holding periods. In these circumstances, the
| | |
| 4 | | Visit our website at pgiminvestments.com |
Fund will not be able to automatically convert Class C shares into Class A shares as described above. In order to determine eligibility for conversion in these circumstances, it is the responsibility of the financial intermediary to notify the Fund that the shareholder is eligible for the conversion of Class C shares to Class A shares, and the financial intermediary may be required to maintain and provide the Fund with records that substantiate the holding period of Class C shares. It is the financial intermediary’s (and not the Fund’s) responsibility to keep records of transactions made in accounts it holds and to ensure that the shareholder is credited with the proper holding period based on such records or those provided to the financial intermediary by the shareholder. Please consult with your financial intermediary for the applicability of this conversion feature to your shares.
Class C shares were generally closed to investments by new group retirement plans effective June 1, 2018. Group retirement plans (and their successor, related and affiliated plans) that have Class C shares of the Fund available to participants on or before the Effective Date may continue to open accounts for new participants in such share class and purchase additional shares in existing participant accounts.
The Fund has no responsibility for monitoring or implementing a financial intermediary’s process for determining whether a shareholder meets the required holding period for conversion. A financial intermediary may sponsor and/or control accounts, programs or platforms that impose a different conversion schedule or different eligibility requirements for the exchange of Class C shares for Class A shares, as set forth on Appendix A: Waivers and Discounts Available From Certain Financial Intermediaries of the Prospectus. In these cases, Class C shareholders may have their shares exchanged for Class A shares under the policies of the financial intermediary. Financial intermediaries will be responsible for making such exchanges in those circumstances. Please consult with your financial intermediary if you have any questions regarding your shares’ conversion from Class C shares to Class A shares.
LR1094
- Not part of the Annual Report -
| | | | |
| PGIM Select Real Estate Fund | | | 5 | |
Table of Contents
| | |
| 6 | | Visit our website at pgiminvestments.com |
Letter from the President

Dear Shareholder:
We hope you find the annual report for PGIM Select Real Estate Fund informative and useful. The report covers performance for the 12-month period that ended October 31, 2018.
We have important information to share with you. Effective June 11, 2018, Prudential Mutual Funds were renamed PGIM Funds. This renaming is part of our ongoing effort to further build our reputation and establish our global brand, which began when our firm adopted PGIM Investments as its name in April 2017. Please note that only the Fund’s name has changed. Your Fund’s management and operation, along with its symbols, remained the same.*
During the reporting period, the global economy continued to grow, and central banks gradually tightened monetary policy. In the US, the economy expanded and employment increased. In September, the Federal Reserve hiked interest rates for the eighth time since 2015, based on confidence in the economy.
Equity returns on the whole were strong, due to optimistic earnings expectations and investor sentiment. Global equities, including emerging markets, generally posted positive returns. However, they trailed the performance of US equities, which rose on higher corporate profits, new regulatory policies, and tax reform benefits. Volatility spiked briefly early in the period on inflation concerns, rising interest rates, and a potential global trade war, and again late in the period on worries that profit growth might slow in 2019.
The overall bond market declined modestly during the period, as measured by the Bloomberg Barclays US Aggregate Bond Index. The best performance came from higher-yielding, economically sensitive sectors, such as high yield bonds and bank loans, which posted small gains. US investment-grade corporate bonds and US Treasury bonds both finished the period with negative returns. A major trend during the period was the flattening of the US Treasury yield curve, which increased the yield on fixed income investments with shorter maturities and made them more attractive to investors.
Regarding your investments with PGIM, we believe it is important to maintain a diversified portfolio of funds consistent with your tolerance for risk, time horizon, and financial goals. Your financial advisor can help you create a diversified investment plan that may include funds covering all the basic asset classes and that reflects your personal investor profile and risk tolerance. However, diversification and asset allocation strategies do not assure a profit or protect against loss in declining markets.
At PGIM Investments, we consider it a great privilege and responsibility to help investors participate in opportunities across global markets while meeting their toughest investment challenges. PGIM is a top-10 global investment manager with more than $1 trillion in assets under management. This investment expertise allows us to deliver actively managed funds and strategies to meet the needs of investors around the globe.
Thank you for choosing our family of funds.
Sincerely,

Stuart S. Parker, President
PGIM Select Real Estate Fund
December 14, 2018
*The Prudential Day One Funds did not change their names.
| | | | |
| PGIM Select Real Estate Fund | | | 7 | |
Your Fund’s Performance (unaudited)
Performance data quoted represents past performance. Past performance does not guarantee future results. The investment return and principal value of an investment will fluctuate, so that an investor’s shares, when redeemed, may be worth more or less than their original cost. Current performance may be lower or higher than the past performance data quoted. An investor may obtain performance data as of the most recent month-end by visiting our website at www.pgiminvestments.com or by calling (800) 225-1852.
| | | | | | |
| | | Average Annual Total Returns as of 10/31/18
(with sales charges) | |
| | | One Year (%) | | Since Inception (%) | |
| Class A | | –5.15 | | | 2.65 (8/1/14) | |
| Class C | | –1.32 | | | 3.22 (8/1/14) | |
| Class Z | | 0.51 | | | 4.26 (8/1/14) | |
| Class R6* | | 0.62 | | | 4.25 (8/1/14) | |
| FTSE EPRA/NAREIT Developed Index | |
| | 0.30 | | | 2.84 | |
| S&P 500 Index | |
| | 7.35 | | | 10.56 | |
| Lipper Global Real Estate Funds Average | |
| | | –0.12 | | | 2.71 | |
| | | | | | |
| | | Average Annual Total Returns as of 10/31/18
(without sales charges) | |
| | | One Year (%) | | Since Inception (%) | |
| Class A | | 0.37 | | | 4.02 (8/1/14) | |
| Class C | | –0.34 | | | 3.22 (8/1/14) | |
| Class Z | | 0.51 | | | 4.26 (8/1/14) | |
| Class R6* | | 0.62 | | | 4.25 (8/1/14) | |
| FTSE EPRA/NAREIT Developed Index | | | | | | |
| | 0.30 | | | 2.84 | |
| S&P 500 Index | | | | | | |
| | 7.35 | | | 10.56 | |
| Lipper Global Real Estate Funds Average | | | | | | |
| | | –0.12 | | | 2.71 | |
| | |
| 8 | | Visit our website at pgiminvestments.com |
Growth of a $10,000 Investment (unaudited)
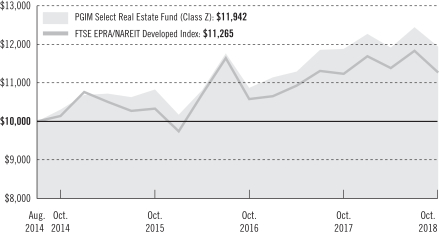
The graph compares a $10,000 investment in the Fund’s Class Z shares with a similar investment in the FTSE EPRA/NAREIT Developed Index, by portraying the initial account values at the commencement of operations for Class Z shares (August 1, 2014) and the account values at the end of the current fiscal year (October 31, 2018) as measured on a quarterly basis. For purposes of the graph, and unless otherwise indicated, it has been assumed that (a) all recurring fees (including management fees) were deducted; and (b) all dividends and distributions were reinvested. The line graph provides information for Class Z shares only. As indicated in the tables provided earlier, performance for other share classes will vary due to the differing charges and expenses applicable to each share class (as indicated in the following paragraphs). Without waiver of fees and/or expense reimbursements, if any, the Fund’s returns would have been lower.
Past performance does not predict future performance. Total returns and the ending account values in the graph include changes in share price and reinvestment of dividends and capital gains distributions in a hypothetical investment for the periods shown. The Fund’s total returns do not reflect the deduction of income taxes on an individual’s investment. Taxes may reduce your actual investment returns on income or gains paid by the Fund or any gains you may realize if you sell your shares.
Source: PGIM Investments LLC and Lipper Inc.
*Formerly known as Class Q shares.
Since Inception returns are provided since the Fund has less than 10 fiscal years of returns. Since Inception returns for the Indexes and the Lipper Average are measured from the closest month-end to the Fund’s inception date.
| | | | |
| PGIM Select Real Estate Fund | | | 9 | |
Your Fund’s Performance (continued)
The returns in the tables do not reflect the deduction of taxes that a shareholder would pay on Fund distributions or following the redemption of Fund shares. The average annual total returns take into account applicable sales charges, which are described for each share class in the table below.
| | | | | | | | |
| | | Class A | | Class C | | Class Z | | Class R6* |
| Maximum initial sales charge | | 5.50% of the public offering price | | None | | None | | None |
| Contingent deferred sales charge (CDSC) (as a percentage of the lower of original purchase price or net asset value at redemption) | | 1.00% on sales of $1 million or more made within 12 months of purchase | | 1.00% on sales made within 12 months of purchase | | None | | None |
| Annual distribution and service (12b-1) fees (shown as a percentage of average daily net assets) | | 0.30% (0.25% currently) | | 1.00% | | None | | None |
*Formerly known as Class Q shares.
Benchmark Definitions
FTSE EPRA/NAREIT Developed Index—The Financial Times Stock Exchange European Public Real Estate Association/National Association of Real Estate Investment Trusts (FTSE EPRA/NAREIT) Developed Index reflects the stock performance of companies engaged in specific aspects of the major real estate markets/regions of the world.
S&P 500 Index—The S&P 500 Index is an unmanaged index of over 500 stocks of large US public companies. It gives a broad look at how stock prices in the United States have performed.
Lipper Global Real Estate Funds Average—The Lipper Global Real Estate Funds Average (Lipper Average) includes funds that invest at least 25% but less than 75% of their equity portfolios in shares of companies engaged in the real estate industry that are strictly outside of the US or whose securities are principally traded outside of the US.
Investors cannot invest directly in an index or average. The returns for the Indexes would be lower if they included the effects of sales charges, operating expenses of a mutual fund, or taxes. Returns for the Lipper Average reflect the deduction of operating expenses of a mutual fund, but not sales charges or taxes.
| | |
| 10 | | Visit our website at pgiminvestments.com |
Presentation of Fund Holdings
| | | | |
Five Largest Holdings expressed as a
percentage of net assets as of 10/31/18 (%) | |
| Prologis, Inc., Industrial REITs | | | 6.4 | |
| Link REIT, Retail REITs | | | 4.8 | |
| Americold Realty Trust, Industrial REITs | | | 4.8 | |
| Vonovia SE, Real Estate Operating Companies | | | 4.4 | |
Equity LifeStyle Properties, Inc.,
Residential REITs | | | 4.0 | |
Holdings reflect only long-term investments and are subject to change.
| | | | |
Five Largest Industries expressed as a
percentage of net assets as of 10/31/18 (%) | |
| Office REITs | | | 30.6 | |
| Industrial REITs | | | 22.9 | |
| Diversified REITs | | | 10.6 | |
| Residential REITs | | | 10.5 | |
| Diversified Real Estate Activities | | | 7.1 | |
Industry weightings reflect only long-term investments and are subject to change.
| | | | |
| PGIM Select Real Estate Fund | | | 11 | |
Strategy and Performance Overview (unaudited)
How did the Fund perform?
The PGIM Select Real Estate Fund’s Class Z shares rose 0.51% in the 12-month reporting period that ended October 31, 2018, outperforming the 0.30% return of the FTSE EPRA/NAREIT Developed Index (the Index) and the –0.12% return of the Lipper Global Real Estate Funds Average.
What were conditions like in the global real estate securities market?
| • | | Conditions in the US real estate investment trust (REIT) market over the reporting period were balanced as investors weighed both positive and negative factors. Headwinds to the market included a dramatic increase in bond yields, with the 10-year Treasury note climbing about 80 basis points (bps) from 2.37% to 3.14% during the period (one bps equals 0.01%). On the positive side, the fundamentals in the commercial real estate markets were strong, with peak occupancies in multiple property types and steady rent growth. In addition, the US market saw a spike in merger-and-acquisition (M&A) activity, with eight private deals totaling over $50 billion in volume. Against the backdrop of these countervailing forces, the US REIT market was relatively flat over the period. That said, performance among certain sectors varied, with secular growth industries—such as manufactured housing—performing well. In addition, the market saw several underperformers from 2017 bounce back in 2018 as challenged fundamentals were more than offset by attractive valuations in property areas like malls and self-storage. At period end, the US REIT market was trading at about a 5% discount to net asset value (NAV). PGIM Real Estate believes that if the recent spike in market volatility continues, REITs may benefit from investors interested in this discount and in assets that historically have been more defensive in nature than most equity classes. |
| • | | Europe’s total return during the period was basically flat. Political risk was a major worry across Europe, especially in Italy and the United Kingdom (the UK). Italy was the second-worst-performing country in Europe with a total return of -10.5% during the period as concerns grew over the populist coalition government that came into power in April 2018. The new government’s lack of fiscal control unnerved markets and pushed Italian bond yield spreads to near-record levels. The UK market performance of -2.1% during the period reflected the absence of progress in reaching a Brexit deal with the European Union (EU) as the UK’s March 2019 deadline for leaving the EU approaches. France was the worst-performing market in Europe, returning -15.9% during the period. The source of these country returns is the Financial Times Stock Exchange (FTSE) and FactSet; the FTSE data is uploaded to FactSet, which then generates returns for specific countries and regions. The French index is heavily dominated by retail real estate companies that saw share prices under consistently heavy pressure due to a structural shift from in-store sales to online retail sales. While interest rates moved up during the period to counter inflationary pressures in the UK, the low-rate environment has persisted in the eurozone longer than investors originally anticipated, creating downward pressure on capitalization |
| | |
| 12 | | Visit our website at pgiminvestments.com |
| | rates across the region. Still, foreign investor demand in real estate and rental growth momentum were robust across major continental markets during the period. |
| • | | Asia Pacific real estate equities witnessed heightened volatility during the period, driven by considerable risks from multiple macro headwinds: an escalating trade war between the US and China, economic deceleration in China, and rising interest rates. The region’s REIT markets reflected a preference for income stability amid macro concerns. Across the region, the Fund saw robust market fundamentals in the Class-A office sector underpinned by healthy occupier demand and the lack of meaningful supply. Japanese REITs (J-REITs) were outperformers in the region helped by the Bank of Japan’s accommodative monetary policy, which kept Japan’s interest rates at global lows. Despite healthy condominium sales and positive office rental reversions, Japanese developers underperformed the J-REITs market due to macro concerns. Japanese developers, however, outperformed Hong Kong and Singapore developers. In Hong Kong, private home prices weakened amid rising mortgage costs, and bank appraisals of residential units in the city’s 10 major private housing estates declined for the first time in two years. In Singapore, residential cooling measures and a weaker external environment negatively impacted developer share prices. In contrast, Hong Kong commercial landlords performed well on the back of income stability, proactive capital management, and asset disposals. On a relative basis, Australian REITs were the second-best-performing sector in the region on the back of stable Reserve Bank of Australia monetary policy and positive industrial fundamentals. |
What worked and didn’t work?
| • | | Security selection drove outperformance during the reporting period, although asset allocation also had a positive impact. North America and Asia performed well, and Europe lagged. |
| • | | In the US, the industrial sector was the standout performer during the period. Stock selection was positive, and an overweight allocation to the sector boosted relative performance. The majority of property types in the US outperformed, including but not limited to office, residential, shopping centers, and data centers. Malls and triple net leases were the largest detractors. |
| • | | The majority of countries in Europe lagged, and underperformance came from a combination of unfavorable asset allocation positions and weak security selections. The largest detractors were Ireland and the UK. Germany and Finland also dragged on returns. |
| • | | Asia outperformed during the period. Stock selection was positive in Hong Kong and Japan, while no individual country in Asia had a meaningful negative effect on results. |
| | | | |
| PGIM Select Real Estate Fund | | | 13 | |
Strategy and Performance Overview (continued)
Current outlook
| • | | In North America, PGIM Real Estate believes that REITs will continue posting stable operating fundamentals, with 2%-3% same-store net operating income growth resulting in 5%-7% cash flow and dividend growth in the next year. US REITs offer a valuable combination of income and growth in a volatile market. The increased M&A activity mentioned earlier highlights the desirable attributes of most public equity REIT portfolios. Private equity currently has over $270 billion in committed capital on the sidelines, up over 15% from 2017. As a result, M&A activity may continue if discounts to NAV are not reconciled in the public market. PGIM Real Estate believes the best opportunities may lie with companies that deliver cash flow growth at attractive valuations. It’s a stock picker’s market; and given economic volatility and M&A activity, 2018 remains a good environment for active investment management. The Fund added slightly to its West Coast office overweight based on attractive valuations and continued strong fundamentals. The Fund maintained its overweight to Sunbelt office companies and are overweight in cities that were leading candidates for Amazon.com’s second headquarters. PGIM Real Estate remains cautious on the retail and self-storage markets. While demand has remained resilient in storage, construction starts have not slowed and supply may weigh on results through 2019. The Fund is also overweight in industrial and manufactured housing based on sector-leading cash flow growth and limited supply additions. |
| • | | The outlook for continental Europe’s real estate sector is generally positive. Eurozone economic indicators have stabilized after a period of improvement, and the monetary policy backdrop remains loose even as quantitative easing is gradually withdrawn. The European Central Bank has said it will consider interest rate increases after the middle of next year as inflation in the eurozone looks largely under control. While gross domestic product (GDP) growth forecasts are solid across the eurozone, Ireland, Spain, and the Nordic region stand out as offering the best near-term growth outlooks. The exception to this benign macroeconomic environment is the UK, where the process of the country’s exit from the EU is still uncertain. The March 2019 deadline for the UK’s withdrawal from the EU is moving closer while little progress has been made up to this point. The unofficial deadline for reaching a deal by October 2018 has come and gone. The UK government’s negotiating position is further undermined by its internal political weakness. Brexit macro uncertainty is reflected by a weaker sterling. European real estate stocks continue to offer meaningful discounts to private market values. |
| • | | Notwithstanding current headwinds on trade and interest rates, Asia offers some of the best risk-adjusted real estate returns globally, reflected by capital inflow into the region’s real estate assets. The biggest risk is trade conflict that could derail economic momentum and inject heightened volatility to equity markets. Rising inflationary expectations in the US could, on the other hand, exert pressure on the Federal Reserve (the Fed) to hike interest rates quicker than expected. PGIM Real Estate thinks the |
| | |
| 14 | | Visit our website at pgiminvestments.com |
| | following themes may be pertinent in the coming months: (1) trade war outcome between the US and China, (2) rising bond yield impact on REITs, (3) rising short rates on mortgages (Hong Kong/Singapore residential), (4) lack of quality supply (Singapore/Hong Kong office), (4) accommodative monetary policy (J-REITs), and (5) interest rate differential driving weaker yen (Japanese developers). In the near term, PGIM Real Estate expects markets to remain volatile, subject to the intensity and outcome of the trade conflict as well as the level of Fed hawkishness. With more Fed rate hikes expected, rising inflationary expectations in the US could present upside risk. Within the Fund’s individual sectors, a sharper rise in sovereign bond yields could negatively impact regional REIT valuations. A weaker US dollar versus a stronger yen could negatively impact economic momentum in Japan and underlying demand for condos and office space. On the other hand, reduced expectations of Fed hikes could be positive for Hong Kong and Singapore real estate developers. |
The percentage points shown in the tables below identify each security’s positive or negative contribution to the Fund’s return relative to the benchmark, which is the sum of all contributions by individual holdings.
| | | | | | |
| Top Contributors (%) | | Top Detractors (%) |
| Americold Realty Trust | | 0.63 | | Macerich Co. (The) | | –0.32 |
| JBG Smith Properties | | 0.46 | | NewRiver REIT PLC | | –0.40 |
| Hammerson PLC | | 0.38 | | Link REIT | | –0.41 |
| Equinix, Inc. | | 0.34 | | Empire State Realty Trust, Inc. (Class A) | | –0.42 |
| UDR, Inc. | | 0.34 | | CoreSite Realty Corp. | | –0.43 |
| | | | |
| PGIM Select Real Estate Fund | | | 15 | |
Comments on Largest Holdings (unaudited)
| 6.4% | Prologis, Inc., Industrial REITs |
Prologis is an owner, operator, and developer of industrial real estate, focused on global and regional markets across the Americas, Europe, and Asia. The company also leases modern distribution facilities to commercial customers, including manufacturers, retailers, transportation companies, third-party logistics providers, and other enterprises.
| 4.8% | Link REIT, Retail REITs |
Link REIT is a REIT in Hong Kong. The trust owns and operates shopping centers, parking space facilities, and real estate retail space.
| 4.8% | Americold Realty Trust, Industrial REITs |
Americold Realty Trust provides temperature-controlled food distribution services. The company offers warehousing, consolidation programs, shipment management, multi-vendor consolidation, and logistics solutions. It serves food producers, processors, distributors, wholesalers, retailers, and restaurants worldwide.
| 4.4% | Vonovia SE, Real Estate Operating Companies |
Vonovia provides real estate services and manages, leases, and sells apartments. The company offers residential real estate to customers throughout Germany.
| 4.0% | Equity Lifestyle Properties Inc., Residential REITs |
Equity Lifestyle Properties owns an interest in communities in the US and western Canada. The company acquires properties such as camping grounds and seasonal resort communities.
| | |
| 16 | | Visit our website at pgiminvestments.com |
Fees and Expenses (unaudited)
As a shareholder of the Fund, you incur two types of costs: (1) transaction costs, including sales charges (loads) on purchase payments and redemptions, as applicable, and (2) ongoing costs, including management fees, distribution, and/or service (12b-1) fees, and other Fund expenses, as applicable. This example is intended to help you understand your ongoing costs (in dollars) of investing in the Fund and to compare these costs with the ongoing costs of investing in other mutual funds.
The example is based on an investment of $1,000 held through the six-month period ended October 31, 2018. The example is for illustrative purposes only; you should consult the Prospectus for information on initial and subsequent minimum investment requirements.
Actual Expenses
The first line for each share class in the table on the following page provides information about actual account values and actual expenses. You may use the information on this line, together with the amount you invested, to estimate the expenses that you paid over the period. Simply divide your account value by $1,000 (for example, an $8,600 account value ÷ $1,000 = 8.6), then multiply the result by the number on the first line under the heading “Expenses Paid During the Six-Month Period” to estimate the expenses you paid on your account during this period.
Hypothetical Example for Comparison Purposes
The second line for each share class in the table on the following page provides information about hypothetical account values and hypothetical expenses based on the Fund’s actual expense ratio and an assumed rate of return of 5% per year before expenses, which is not the Fund’s actual return. The hypothetical account values and expenses may not be used to estimate the actual ending account balance or expenses you paid for the period. You may use this information to compare the ongoing costs of investing in the Fund and other funds. To do so, compare this 5% hypothetical example with the 5% hypothetical examples that appear in the shareholder reports of the other funds.
The Fund’s transfer agent may charge additional fees to holders of certain accounts that are not included in the expenses shown in the table on the following page. These fees apply to individual retirement accounts (IRAs) and Section 403(b) accounts. As of the close of the period covered by the table, IRA fees included an annual maintenance fee of $15 per account (subject to a maximum annual maintenance fee of $25 for all accounts held by the same shareholder). Section 403(b) accounts are charged an annual $25 fiduciary maintenance fee. Some of the fees may vary in amount, or may be waived, based on your total account balance or the number of PGIM funds, including the Fund, that you own. You should consider the additional fees that were charged to your Fund account over the six-month period when you estimate the total ongoing expenses paid over the period and the impact of these fees on your ending account value, as these additional expenses are not
| | | | |
| PGIM Select Real Estate Fund | | | 17 | |
Fees and Expenses (continued)
reflected in the information provided in the expense table. Additional fees have the effect of reducing investment returns.
Please note that the expenses shown in the table are meant to highlight your ongoing costs only and do not reflect any transactional costs such as sales charges (loads). Therefore, the second line for each share class in the table is useful in comparing ongoing costs only and will not help you determine the relative total costs of owning different funds. In addition, if these transactional costs were included, your costs would have been higher.
| | | | | | | | | | | | | | | | | | |
PGIM Select
Real Estate Fund | | Beginning Account
Value
May 1, 2018 | | | Ending Account
Value
October 31, 2018 | | | Annualized
Expense Ratio
Based on the
Six-Month Period | | | Expenses Paid
During the
Six-Month Period* | |
| Class A | | Actual | | $ | 1,000.00 | | | $ | 1,002.30 | | | | 1.30 | % | | $ | 6.56 | |
| | Hypothetical | | $ | 1,000.00 | | | $ | 1,018.65 | | | | 1.30 | % | | $ | 6.61 | |
| Class C | | Actual | | $ | 1,000.00 | | | $ | 999.40 | | | | 2.05 | % | | $ | 10.33 | |
| | Hypothetical | | $ | 1,000.00 | | | $ | 1,014.87 | | | | 2.05 | % | | $ | 10.41 | |
| Class Z | | Actual | | $ | 1,000.00 | | | $ | 1,002.60 | | | | 1.05 | % | | $ | 5.30 | |
| | Hypothetical | | $ | 1,000.00 | | | $ | 1,019.91 | | | | 1.05 | % | | $ | 5.35 | |
| Class R6** | | Actual | | $ | 1,000.00 | | | $ | 1,003.60 | | | | 1.05 | % | | $ | 5.30 | |
| | | Hypothetical | | $ | 1,000.00 | | | $ | 1,019.91 | | | | 1.05 | % | | $ | 5.35 | |
* Fund expenses (net of fee waivers or subsidies, if any) for each share class are equal to the annualized expense ratio for each share class (provided in the table), multiplied by the average account value over the period, multiplied by the 184 days in the six-month period ended October 31, 2018, and divided by the 365 days in the Fund's fiscal year ended October 31, 2018 (to reflect the six-month period). Expenses presented in the table include the expenses of any underlying portfolios in which the Fund may invest.
**Formerly known as Class Q shares.
| | |
| 18 | | Visit our website at pgiminvestments.com |
Schedule of Investments
as of October 31, 2018
| | | | | | | | |
| Description | | Shares | | | Value | |
LONG-TERM INVESTMENTS 99.5% | | | | | | | | |
| | |
COMMON STOCKS | | | | | | | | |
| | |
Diversified Real Estate Activities 7.1% | | | | | | | | |
Mitsui Fudosan Co. Ltd. (Japan) | | | 14,900 | | | $ | 336,796 | |
Sumitomo Realty & Development Co. Ltd. (Japan) | | | 8,248 | | | | 284,214 | |
| | | | | | | | |
| | | | | | | 621,010 | |
| | |
Diversified REITs 10.6% | | | | | | | | |
American Assets Trust, Inc. | | | 4,145 | | | | 159,002 | |
Covivio (France) | | | 1,990 | | | | 199,892 | |
Empire State Realty Trust, Inc. (Class A Stock) | | | 11,542 | | | | 183,056 | |
Stockland (Australia) | | | 77,448 | | | | 197,702 | |
Suntec Real Estate Investment Trust (Singapore) | | | 142,407 | | | | 182,142 | |
| | | | | | | | |
| | | | | | | 921,794 | |
| | |
Hotel & Resort REITs 2.8% | | | | | | | | |
DiamondRock Hospitality Co. | | | 5,908 | | | | 61,738 | |
MGM Growth Properties LLC (Class A Stock) | | | 6,300 | | | | 178,227 | |
| | | | | | | | |
| | | | | | | 239,965 | |
| | |
Industrial REITs 22.9% | | | | | | | | |
Americold Realty Trust | | | 16,722 | | | | 413,869 | |
Goodman Group (Australia) | | | 30,833 | | | | 226,282 | |
Prologis, Inc. | | | 8,680 | | | | 559,600 | |
Rexford Industrial Realty, Inc. | | | 10,396 | | | | 329,241 | |
Segro PLC (United Kingdom) | | | 39,175 | | | | 307,679 | |
STAG Industrial, Inc. | | | 5,770 | | | | 152,674 | |
| | | | | | | | |
| | | | | | | 1,989,345 | |
| | |
Office REITs 30.6% | | | | | | | | |
Allied Properties Real Estate Investment Trust (Canada) | | | 5,300 | | | | 170,299 | |
Boston Properties, Inc. | | | 1,100 | | | | 132,836 | |
Columbia Property Trust, Inc. | | | 6,562 | | | | 147,317 | |
Daiwa Office Investment Corp. (Japan) | | | 35 | | | | 213,779 | |
Dexus (Australia) | | | 25,007 | | | | 180,605 | |
Easterly Government Properties, Inc. | | | 5,974 | | | | 108,548 | |
Green REIT PLC (Ireland) | | | 125,916 | | | | 207,883 | |
Hibernia REIT PLC (Ireland) | | | 186,826 | | | | 294,211 | |
Inmobiliaria Colonial Socimi SA (Spain) | | | 30,892 | | | | 310,222 | |
Japan Real Estate Investment Corp. (Japan) | | | 26 | | | | 134,179 | |
JBG SMITH Properties | | | 8,052 | | | | 301,789 | |
See Notes to Financial Statements.
| | | | |
| PGIM Select Real Estate Fund | | | 19 | |
Schedule of Investments (continued)
as of October 31, 2018
| | | | | | | | |
| Description | | Shares | | | Value | |
COMMON STOCKS (Continued) | | | | | | | | |
| | |
Office REITs (cont’d.) | | | | | | | | |
Kilroy Realty Corp. | | | 3,696 | | | $ | 254,580 | |
Tier REIT, Inc. | | | 9,719 | | | | 210,611 | |
| | | | | | | | |
| | | | | | | 2,666,859 | |
| | |
Real Estate Operating Companies 4.4% | | | | | | | | |
Vonovia SE (Germany) | | | 8,286 | | | | 379,638 | |
| | |
Residential REITs 10.5% | | | | | | | | |
AvalonBay Communities, Inc. | | | 1,893 | | | | 331,994 | |
Equity LifeStyle Properties, Inc. | | | 3,647 | | | | 345,335 | |
UDR, Inc. | | | 6,110 | | | | 239,451 | |
| | | | | | | | |
| | | | | | | 916,780 | |
| | |
Retail REITs 6.7% | | | | | | | | |
Link REIT (Hong Kong) | | | 47,000 | | | | 417,044 | |
Macerich Co. (The) | | | 3,153 | | | | 162,758 | |
| | | | | | | | |
| | | | | | | 579,802 | |
| | |
Specialized REITs 3.9% | | | | | | | | |
CoreSite Realty Corp. | | | 1,621 | | | | 152,147 | |
Crown Castle International Corp. | | | 1,758 | | | | 191,165 | |
| | | | | | | | |
| | | | | | | 343,312 | |
| | | | | | | | |
TOTAL LONG-TERM INVESTMENTS
(cost $8,722,209) | | | | | | | 8,658,505 | |
| | | | | | | | |
| | |
SHORT-TERM INVESTMENT 1.4% | | | | | | | | |
| | |
AFFILIATED MUTUAL FUND | | | | | | | | |
PGIM Core Ultra Short Bond Fund
(cost $125,211)(w) | | | 125,211 | | | | 125,211 | |
| | | | | | | | |
TOTAL INVESTMENTS 100.9%
(cost $8,847,420) | | | | | | | 8,783,716 | |
Liabilities in excess of other assets (0.9)% | | | | | | | (81,025 | ) |
| | | | | | | | |
NET ASSETS 100.0% | | | | | | $ | 8,702,691 | |
| | | | | | | | |
The following abbreviations are used in the annual report:
LIBOR—London Interbank Offered Rate
REITs—Real Estate Investment Trusts
| (w) | PGIM Investments LLC, the manager of the Fund, also serves as manager of the PGIM Core Ultra Short Bond Fund. |
See Notes to Financial Statements.
Fair Value Measurements:
Various inputs are used in determining the value of the Fund’s investments. These inputs are summarized in the three broad levels listed below.
Level 1—unadjusted quoted prices generally in active markets for identical securities.
Level 2—quoted prices for similar securities, interest rates and yield curves, prepayment speeds, foreign currency exchange rates and other observable inputs.
Level 3—unobservable inputs for securities valued in accordance with Board approved fair valuation procedures.
The following is a summary of the inputs used as of October 31, 2018 in valuing such portfolio securities:
| | | | | | | | | | | | |
| | | Level 1 | | | Level 2 | | | Level 3 | |
Investments in Securities | | | | | | | | | | | | |
Common Stocks | | | | | | | | | | | | |
Diversified Real Estate Activities | | $ | — | | | $ | 621,010 | | | $ | — | |
Diversified REITs | | | 342,058 | | | | 579,736 | | | | — | |
Hotel & Resort REITs | | | 239,965 | | | | — | | | | — | |
Industrial REITs | | | 1,455,384 | | | | 533,961 | | | | — | |
Office REITs | | | 1,325,980 | | | | 1,340,879 | | | | — | |
Real Estate Operating Companies | | | — | | | | 379,638 | | | | — | |
Residential REITs | | | 916,780 | | | | — | | | | — | |
Retail REITs | | | 162,758 | | | | 417,044 | | | | — | |
Specialized REITs | | | 343,312 | | | | — | | | | — | |
Affiliated Mutual Fund | | | 125,211 | | | | — | | | | — | |
| | | | | | | | | | | | |
Total | | $ | 4,911,448 | | | $ | 3,872,268 | | | $ | — | |
| | | | | | | | | | | | |
Industry Classification:
The industry classification of investments and liabilities in excess of other assets shown as a percentage of net assets as of October 31, 2018 were as follows (unaudited):
| | | | |
Office REITs | | | 30.6 | % |
Industrial REITs | | | 22.9 | |
Diversified REITs | | | 10.6 | |
Residential REITs | | | 10.5 | |
Diversified Real Estate Activities | | | 7.1 | |
Retail REITs | | | 6.7 | |
Real Estate Operating Companies | | | 4.4 | |
Specialized REITs | | | 3.9 | |
Hotel & Resort REITs | | | 2.8 | % |
Affiliated Mutual Fund | | | 1.4 | |
| | | | |
| | | 100.9 | |
Liabilities in excess of other assets | | | (0.9 | ) |
| | | | |
| | | 100.0 | % |
| | | | |
See Notes to Financial Statements.
| | | | |
| PGIM Select Real Estate Fund | | | 21 | |
Statement of Assets & Liabilities
as of October 31, 2018
| | | | |
Assets | | | | |
Investments at value: | | | | |
Unaffiliated investments (cost $8,722,209) | | $ | 8,658,505 | |
Affiliated investments (cost $125,211) | | | 125,211 | |
Receivable for investments sold | | | 52,352 | |
Due from Manager | | | 19,369 | |
Dividends receivable | | | 7,925 | |
Tax reclaim receivable | | | 1,626 | |
Receivable for Fund shares sold | | | 172 | |
Prepaid expenses | | | 844 | |
| | | | |
Total Assets | | | 8,866,004 | |
| | | | |
| |
Liabilities | | | | |
Payable for investments purchased | | | 131,307 | |
Custodian and accounting fees payable | | | 16,986 | |
Accrued expenses and other liabilities | | | 13,729 | |
Affiliated transfer agent fee payable | | | 673 | |
Distribution fee payable | | | 602 | |
Payable to custodian | | | 16 | |
| | | | |
Total Liabilities | | | 163,313 | |
| | | | |
| |
Net Assets | | $ | 8,702,691 | |
| | | | |
| | | | | |
Net assets were comprised of: | | | | |
Shares of beneficial interest, at par | | $ | 850 | |
Paid-in capital in excess of par | | | 8,569,553 | |
Total distributable earnings (loss) | | | 132,288 | |
| | | | |
Net assets, October 31, 2018 | | $ | 8,702,691 | |
| | | | |
See Notes to Financial Statements.
| | | | |
Class A | | | | |
Net asset value and redemption price per share,
($2,611,862 ÷ 252,886 shares of beneficial interest issued and outstanding) | | $ | 10.33 | |
Maximum sales charge (5.50% of offering price) | | | 0.60 | |
| | | | |
Maximum offering price to public | | $ | 10.93 | |
| | | | |
| |
Class C | | | | |
Net asset value, offering price and redemption price per share,
($56,274 ÷ 5,502 shares of beneficial interest issued and outstanding) | | $ | 10.23 | |
| | | | |
| |
Class Z | | | | |
Net asset value, offering price and redemption price per share,
($64,927 ÷ 6,277 shares of beneficial interest issued and outstanding) | | $ | 10.34 | |
| | | | |
| |
Class R6 | | | | |
Net asset value, offering price and redemption price per share,
($5,969,628 ÷ 585,686 shares of beneficial interest issued and outstanding) | | $ | 10.19 | |
| | | | |
See Notes to Financial Statements.
| | | | |
| PGIM Select Real Estate Fund | | | 23 | |
Statement of Operations
Year Ended October 31, 2018
| | | | |
Net Investment Income (Loss) | | | | |
Income | | | | |
Unaffiliated dividend income (net of $7,407 foreign withholding tax) | | $ | 219,758 | |
Affiliated dividend income | | | 4,367 | |
| | | | |
Total income | | | 224,125 | |
| | | | |
| |
Expenses | | | | |
Management fee | | | 63,135 | |
Distribution fee(a) | | | 5,573 | |
Registration fees(a) | | | 64,139 | |
Custodian and accounting fees | | | 56,469 | |
Audit fee | | | 34,530 | |
Legal fees and expenses | | | 19,848 | |
Trustees’ fees | | | 12,433 | |
Shareholders’ reports | | | 12,020 | |
Transfer agent’s fees and expenses (including affiliated expense of $2,489)(a) | | | 3,095 | |
Miscellaneous | | | 19,271 | |
| | | | |
Total expenses | | | 290,513 | |
Less: Fee waiver and/or expense reimbursement(a) | | | (202,041 | ) |
Distribution fee waiver(a) | | | (822 | ) |
| | | | |
Net expenses | | | 87,650 | |
| | | | |
Net investment income (loss) | | | 136,475 | |
| | | | |
| |
Realized And Unrealized Gain (Loss) On Investment And Foreign Currency Transactions | | | | |
Net realized gain (loss) on: | | | | |
Investment transactions | | | 337,076 | |
Foreign currency transactions | | | (3,025 | ) |
| | | | |
| | | 334,051 | |
| | | | |
Net change in unrealized appreciation (depreciation) on: | | | | |
Investments | | | (381,036 | ) |
Foreign currencies | | | 46 | |
| | | | |
| | | (380,990 | ) |
| | | | |
Net gain (loss) on investment and foreign currency transactions | | | (46,939 | ) |
| | | | |
Net Increase (Decrease) In Net Assets Resulting From Operations | | $ | 89,536 | |
| | | | |
| (a) | Class specific expenses and waivers were as follows: |
| | | | | | | | | | | | | | | | |
| | | Class A | | | Class C | | | Class Z | | | Class R6 | |
Distribution fee | | | 4,934 | | | | 639 | | | | — | | | | — | |
Registration fees | | | 16,034 | | | | 16,034 | | | | 16,037 | | | | 16,034 | |
Transfer agent’s fees and expenses | | | 2,574 | | | | 110 | | | | 383 | | | | 28 | |
Fee waiver and/or expense reimbursement | | | (43,928 | ) | | | (17,279 | ) | | | (18,969 | ) | | | (121,865 | ) |
Distribution fee waiver | | | (822 | ) | | | — | | | | — | | | | — | |
See Notes to Financial Statements.
Statements of Changes in Net Assets
| | | | | | | | |
| | | Year Ended October 31, | |
| | | 2018 | | | 2017 | |
Increase (Decrease) in Net Assets | | | | | | | | |
Operations | | | | | | | | |
Net investment income (loss) | | $ | 136,475 | | | $ | 85,888 | |
Net realized gain (loss) on investment and foreign currency transactions | | | 334,051 | | | | (24,278 | ) |
Net change in unrealized appreciation (depreciation) on investments and foreign currencies | | | (380,990 | ) | | | 480,306 | |
| | | | | | | | |
Net increase (decrease) in net assets resulting from operations | | | 89,536 | | | | 541,916 | |
| | | | | | | | |
| | |
Dividends and Distributions | | | | | | | | |
Distributions from distributable earnings* | | | | | | | | |
Class A | | | (31,115 | ) | | | — | |
Class C | | | (1,166 | ) | | | — | |
Class Z | | | (3,847 | ) | | | — | |
Class R6 | | | (160,410 | ) | | | — | |
| | | | | | | | |
| | | (196,538 | ) | | | — | |
| | | | | | | | |
Dividends from net investment income | | | | | | | | |
Class A | | | | | | | (2,718 | ) |
Class C | | | | | | | (368 | ) |
Class Z | | | | | | | (2,014 | ) |
Class R6 | | | | | | | (79,212 | ) |
| | | | | | | | |
| | | * | | | | (84,312 | ) |
| | | | | | | | |
Distributions from net realized gains | | | | | | | | |
Class A | | | | | | | (4,612 | ) |
Class C | | | | | | | (1,220 | ) |
Class Z | | | | | | | (3,060 | ) |
Class R6 | | | | | | | (125,625 | ) |
| | | | | | | | |
| | | * | | | | (134,517 | ) |
| | | | | | | | |
| | |
Fund share transactions (Net of share conversions) | | | | | | | | |
Net proceeds from shares sold | | | 2,829,409 | | | | 145,782 | |
Net asset value of shares issued in reinvestment of dividends and distributions | | | 196,537 | | | | 218,829 | |
Cost of shares reacquired | | | (628,179 | ) | | | (99,213 | ) |
| | | | | | | | |
Net increase (decrease) in net assets from Fund share transactions | | | 2,397,767 | | | | 265,398 | |
| | | | | | | | |
Total increase (decrease) | | | 2,290,765 | | | | 588,485 | |
| | |
Net Assets: | | | | | | | | |
Beginning of year | | | 6,411,926 | | | | 5,823,441 | |
| | | | | | | | |
End of year(a) | | $ | 8,702,691 | | | $ | 6,411,926 | |
| | | | | | | | |
(a) Includes undistributed/(distributions in excess of) net investment income of: | | $ | * | | | $ | 24,151 | |
| | | | | | | | |
| * | For the year ended October 31, 2018, the Fund has adopted amendments to Regulation S-X (refer to Note 9). |
See Notes to Financial Statements.
| | | | |
| PGIM Select Real Estate Fund | | | 25 | |
Notes to Financial Statements
Prudential Investment Portfolios 9 (the “Trust”) is registered under the Investment Company Act of 1940, as amended (“1940 Act”), as an open-end management investment company. The Trust was established as a Delaware business trust on September 18, 1998. The Trust currently consists of five funds: PGIM Absolute Return Bond Fund and PGIM QMA Large-Cap Core Equity Fund, each of which are diversified funds and PGIM International Bond Fund, PGIM Select Real Estate Fund and PGIM Real Estate Income Fund, each of which are non-diversified funds for purposes of the 1940 Act. These financial statements relate only to the PGIM Select Real Estate Fund (the “Fund”). Effective June 11, 2018, the names of the Fund and the other funds which comprise the Trust were changed by replacing “Prudential” with “PGIM” and each fund’s Class Q shares were renamed Class R6 shares.
The investment objective of the Fund is to seek income and capital appreciation.
1. Accounting Policies
The Fund follows the investment company accounting and reporting guidance of the Financial Accounting Standards Board (“FASB”) Accounting Standard Codification (“ASC”) Topic 946 Financial Services—Investment Companies. The following accounting policies conform to U.S. generally accepted accounting principles. The Fund consistently follows such policies in the preparation of its financial statements.
Securities Valuation: The Fund holds securities and other assets and liabilities that are fair valued at the close of each day (generally, 4:00 PM Eastern time) the New York Stock Exchange (“NYSE”) is open for trading. Fair value is the price that would be received to sell an asset or paid to transfer a liability in an orderly transaction between market participants on the measurement date. The Trust’s Board of Trustees (the “Board”) has adopted valuation procedures for security valuation under which fair valuation responsibilities have been delegated to PGIM Investments LLC (“PGIM Investments” or the “Manager”). Pursuant to the Board’s delegation, a Valuation Committee has been established as two persons, being one or more officers of the Trust, including: the Trust’s Treasurer (or the Treasurer’s direct reports); and the Trust’s Chief or Deputy Chief Compliance Officer (or Vice-President-level direct reports of the Chief or Deputy Chief Compliance Officer). Under the current valuation procedures, the Valuation Committee of the Board is responsible for supervising the valuation of portfolio securities and other assets and liabilities. The valuation procedures permit the Fund to utilize independent pricing vendor services, quotations from market makers, and alternative valuation methods when market quotations are either not readily available or not deemed representative of fair value. A record of the Valuation Committee’s actions is subject to the Board’s review, approval, and ratification at its next regularly scheduled quarterly meeting.
For the fiscal reporting period-end, securities and other assets and liabilities were fair valued at the close of the last U.S. business day. Trading in certain foreign securities may occur when the NYSE is closed (including weekends and holidays). Because such foreign securities trade in markets that are open on weekends and U.S. holidays, the values of some of the Fund’s foreign investments may change on days when investors cannot purchase or redeem Fund shares.
Various inputs determine how the Fund’s investments are valued, all of which are categorized according to the three broad levels (Level 1, 2, or 3) detailed in the Schedule of Investments and referred to herein as the “fair value hierarchy” in accordance with FASB ASC Topic 820—Fair Value Measurements and Disclosures.
Common and preferred stocks, exchange-traded funds, and derivative instruments, such as futures or options, that are traded on a national securities exchange are valued at the last sale price as of the close of trading on the applicable exchange where the security principally trades. Securities traded via NASDAQ are valued at the NASDAQ official closing price. To the extent these securities are valued at the last sale price or NASDAQ official closing price, they are classified as Level 1 in the fair value hierarchy. In the event that no sale or official closing price on valuation date exists, these securities are generally valued at the mean between the last reported bid and ask prices, or at the last bid price in the absence of an ask price. These securities are classified as Level 2 in the fair value hierarchy.
Foreign equities traded on foreign securities exchanges are generally valued using pricing vendor services that provide model prices derived using adjustment factors based on information such as local closing price, relevant general and sector indices, currency fluctuations, depositary receipts, and futures, as applicable. Securities valued using such model prices are classified as Level 2 in the fair value hierarchy. The models generate an evaluated adjustment factor for each security, which is applied to the local closing price to adjust it for post closing market movements up to the time the Fund is valued. Utilizing that evaluated adjustment factor, the vendor provides an evaluated price for each security. If the vendor does not provide an evaluated price, securities are valued in accordance with exchange-traded common and preferred stock valuation policies discussed above.
Investments in open-end, non-exchange-traded mutual funds are valued at their net asset values as of the close of the NYSE on the date of valuation. These securities are classified as Level 1 in the fair value hierarchy since they may be purchased or sold at their net asset values on the date of valuation.
Securities and other assets that cannot be priced according to the methods described above are valued based on pricing methodologies approved by the Board. In the event that unobservable inputs are used when determining such valuations, the securities will be classified as Level 3 in the fair value hierarchy.
When determining the fair value of securities, some of the factors influencing the valuation include: the nature of any restrictions on disposition of the securities; assessment of the
| | | | |
| PGIM Select Real Estate Fund | | | 27 | |
Notes to Financial Statements (continued)
general liquidity of the securities; the issuer’s financial condition and the markets in which it does business; the cost of the investment; the size of the holding and the capitalization of the issuer; the prices of any recent transactions or bids/offers for such securities or any comparable securities; any available analyst media or other reports or information deemed reliable by the Manager regarding the issuer or the markets or industry in which it operates. Using fair value to price securities may result in a value that is different from a security’s most recent closing price and from the price used by other unaffiliated mutual funds to calculate their net asset values.
Restricted and Illiquid Securities: Subject to guidelines adopted by the Board, the Fund may invest up to 15% of its net assets in illiquid securities, including those which are restricted as to disposition under securities law (“restricted securities”). Restricted securities are valued pursuant to the valuation procedures noted above. Illiquid securities are those that, because of the absence of a readily available market or due to legal or contractual restrictions on resale, cannot be sold within seven days in the ordinary course of business at approximately the amount at which the Fund has valued the investment. Therefore, the Fund may find it difficult to sell illiquid securities at the time considered most advantageous by its subadviser and may incur transaction costs that would not be incurred in the sale of securities that were freely marketable. Certain securities that would otherwise be considered illiquid because of legal restrictions on resale to the general public may be traded among qualified institutional buyers under Rule 144A of the Securities Act of 1933. These Rule 144A securities, as well as commercial paper that is sold in private placements under Section 4(2) of the Securities Act, may be deemed liquid by the Fund’s subadviser under the guidelines adopted by the Trustees of the Trust. However, the liquidity of the Fund’s investments in Rule 144A securities could be impaired if trading does not develop or declines.
Foreign Currency Translation: The books and records of the Fund are maintained in U.S. dollars. Foreign currency amounts are translated into U.S. dollars on the following basis:
(i) market value of investment securities, other assets and liabilities—at the current rates of exchange;
(ii) purchases and sales of investment securities, income and expenses—at the rates of exchange prevailing on the respective dates of such transactions.
Although the net assets of the Fund are presented at the foreign exchange rates and market values at the close of the period, the Fund does not generally isolate that portion of the results of operations arising as a result of changes in the foreign exchange rates from the fluctuations arising from changes in the market prices of long-term portfolio securities held at the end of the period. Similarly, the Fund does not isolate the effect of changes in foreign
exchange rates from the fluctuations arising from changes in the market prices of long-term portfolio securities sold during the period. Accordingly, holding period realized foreign currency gains (losses) are included in the reported net realized gains (losses) on investment transactions.
Net realized gains (losses) on foreign currency transactions represent net foreign exchange gains (losses) from the disposition of holdings of foreign currencies, currency gains (losses) realized between the trade and settlement dates on securities transactions, and the difference between the amounts of interest, dividends and foreign withholding taxes recorded on the Fund’s books and the U.S. dollar equivalent amounts actually received or paid. Net unrealized currency gains (losses) arise from valuing foreign currency denominated assets and liabilities (other than investments) at period end exchange rates.
Master Netting Arrangements: The Fund is subject to various Master Agreements, or netting arrangements, with select counterparties. These are agreements which a subadviser may have negotiated and entered into on behalf of the Fund. A master netting arrangement between the Fund and the counterparty permits the Fund to offset amounts payable by the Fund to the same counterparty against amounts to be received; and by the receipt of collateral from the counterparty by the Fund to cover the Fund’s exposure to the counterparty. However, there is no assurance that such mitigating factors are easily enforceable. In addition to master netting arrangements, the right to set-off exists when all the conditions are met such that each of the parties owes the other determinable amounts, the reporting party has the right to set-off the amount owed with the amount owed by the other party, the reporting party intends to set-off and the right of set-off is enforceable by law. During the reporting period, there was no intention to settle on a net basis and all amounts are presented on a gross basis on the Statement of Assets and Liabilities.
Securities Lending: The Fund lends its portfolio securities to banks and broker-dealers. The loans are secured by collateral at least equal to the market value of the securities loaned. Collateral pledged by each borrower is invested in an affiliated money market fund and is marked to market daily, based on the previous day’s market value, such that the value of the collateral exceeds the value of the loaned securities. In the event of significant appreciation in value of securities on loan on the last business day of the reporting period, the financial statements may reflect a collateral value that is less than the market value of the loaned securities. Such shortfall is remedied as described above. Loans are subject to termination at the option of the borrower or the Fund. Upon termination of the loan, the borrower will return to the Fund securities identical to the loaned securities. Should the borrower of the securities fail financially, the Fund has the right to repurchase the securities in the open market using the collateral.
The Fund recognizes income, net of any rebate and securities lending agent fees, for lending its securities in the form of fees or interest on the investment of any cash received as collateral. The borrower receives all interest and dividends from the securities loaned and such payments are passed back to the lender in amounts equivalent thereto. The Fund also continues to recognize any unrealized gain (loss) in the market price of the securities loaned
| | | | |
| PGIM Select Real Estate Fund | | | 29 | |
Notes to Financial Statements (continued)
and on the change in the value of the collateral invested that may occur during the term of the loan. In addition, realized gain (loss) is recognized on changes in the value of the collateral invested upon liquidation of the collateral. Net earnings from securities lending are disclosed on the Statement of Operations as “Income from securities lending, net”.
Equity and Mortgage Real Estate Investment Trusts (collectively equity REITs): The Fund invests in equity REITs, which report information on the source of their distributions annually. Based on current and historical information, a portion of distributions received from equity REITs during the period is estimated to be dividend income, capital gain or return of capital and recorded accordingly. When material, these estimates are adjusted periodically when the actual source of distributions is disclosed by the equity REITs.
Securities Transactions and Net Investment Income: Securities transactions are recorded on the trade date. Realized gains (losses) from investment and currency transactions are calculated on the specific identification method. Dividend income is recorded on the ex-date. Expenses are recorded on an accrual basis, which may require the use of certain estimates by management that may differ from actual. Net investment income or loss (other than class specific expenses and waivers, which are allocated as noted below) and unrealized and realized gains (losses) are allocated daily to each class of shares based upon the relative proportion of adjusted net assets of each class at the beginning of the day. Class specific expenses and waivers, where applicable, are charged to the respective share classes. Class specific expenses include distribution fees and distribution fee waivers, shareholder servicing fees, transfer agent’s fees and expenses, registration fees and fee waivers and/or expense reimbursements, as applicable.
Taxes: It is the Fund’s policy to continue to meet the requirements of the Internal Revenue Code applicable to regulated investment companies and to distribute all of its taxable net investment income and capital gains, if any, to its shareholders. Therefore, no federal income tax provision is required. Withholding taxes on foreign dividends, interest and capital gains, if any, are recorded, net of reclaimable amounts, at the time the related income is earned.
Dividends and Distributions: The Fund expects to pay dividends from net investment income quarterly. Distributions from net realized capital and currency gains, if any, are declared and paid annually. Dividends and distributions to shareholders, which are determined in accordance with federal income tax regulations and which may differ from generally accepted accounting principles, are recorded on the ex-date. Permanent book/tax differences relating to income and gain (loss) are reclassified amongst total distributable earnings (loss) and paid-in capital in excess of par, as appropriate.
Estimates: The preparation of financial statements requires management to make estimates and assumptions that affect the reported amounts and disclosures in the financial statements. Actual results could differ from those estimates.
2. Agreements
The Trust, on behalf of the Fund, has a management agreement with PGIM Investments. Pursuant to this agreement, PGIM Investments has responsibility for all investment advisory services and supervises the subadviser’s performance of such services. In addition, under the management agreement, PGIM Investments provides all of the administrative functions necessary for the organization, operation and management of the Fund. PGIM Investments administers the corporate affairs of the Fund and, in connection therewith, furnishes the Fund with office facilities, together with those ordinary clerical and bookkeeping services which are not being furnished by the Fund’s custodian and the Fund’s transfer agent. PGIM Investments is also responsible for the staffing and management of dedicated groups of legal, marketing, compliance and related personnel necessary for the operation of the Fund. The legal, marketing, compliance and related personnel are also responsible for the management and oversight of the various service providers to the Fund, including, but not limited to, the custodian, transfer agent, and accounting agent.
PGIM Investments has entered into a subadvisory agreement with PGIM, Inc., which provides subadvisory services to the Fund through its PGIM Real Estate unit. The subadvisory agreement provides that PGIM Real Estate will furnish investment advisory services in connection with the management of the Fund. In connection therewith, PGIM Real Estate is obligated to keep certain books and records of the Fund. PGIM Investments pays for the services of PGIM Real Estate, the cost of compensation of officers of the Fund, occupancy and certain clerical and bookkeeping costs of the Fund. The Fund bears all other costs and expenses.
The management fee paid to PGIM Investments is accrued daily and payable monthly at an annual rate of 0.800% of the Fund’s average daily net assets up to and including $1 billion, 0.780% of the next $2 billion, 0.760% of the next $2 billion, 0.750% of the next $5 billion and 0.740% of the Fund’s average daily net assets in excess of $10 billion. The effective management fee rate before any waivers and/or expense reimbursements was 0.800% for the year ended October 31, 2018.
PGIM Investments has contractually agreed, through February 28, 2019, to limit total annual operating expenses after fee waivers and/or expense reimbursements to 1.30% of average daily net assets for Class A shares, 2.05% of average daily net assets for Class C shares, 1.05% of average daily net assets for Class Z shares, and 1.05% of average daily net assets for Class R6 shares. This contractual waiver excludes interest, brokerage, taxes (such as income and foreign withholding taxes, stamp duty and deferred tax expenses), acquired fund fees and expenses, extraordinary expenses, and certain other Fund expenses such as dividend and interest expense and broker charges on short sales. Expenses waived/reimbursed by the Manager in accordance with this agreement may be recouped by
| | | | |
| PGIM Select Real Estate Fund | | | 31 | |
Notes to Financial Statements (continued)
the Manager within the same fiscal year during which such waiver/reimbursement is made if such recoupment can be realized without exceeding the expense limit in effect at the time of the recoupment for that fiscal year. Effective November 1, 2018 this waiver agreement was extended through February 29, 2020.
Where applicable, PGIM Investments voluntarily agreed through October 31, 2018, to waive management fees or shared operating expenses on any share class to the same extent that it waives similar expenses on any other share class and, in addition, total annual operating expenses for Class R6 shares will not exceed total annual operating expenses for Class Z shares. Effective November 1, 2018 this voluntary agreement became part of the Fund’s contractual waiver agreement through February 29, 2020 and is subject to recoupment by the Manager within the same fiscal year during which such wavier/reimbursement is made if such recoupment can be realized without exceeding the expense limit in effect at the time of the recoupment for that fiscal year.
The Trust, on behalf of the Fund, has a distribution agreement with Prudential Investment Management Services LLC (“PIMS”), which acts as the distributor of the Class A, Class C, Class Z and Class R6 shares of the Fund. The Fund compensates PIMS for distributing and servicing the Fund’s Class A and Class C shares, pursuant to the plans of distribution (the “Distribution Plans”), regardless of expenses actually incurred by PIMS. The distribution fees are accrued daily and payable monthly. No distribution or service fees are paid to PIMS as distributor of the Class Z or Class R6 shares of the Fund.
Pursuant to the Distribution Plans, the Fund compensates PIMS for distribution related activities at an annual rate of up to 0.30% and 1% of the average daily net assets of the Class A and Class C shares, respectively. PIMS has contractually agreed through February 29, 2020 to limit such fees to 0.25% of the average daily net assets of the Class A shares.
PIMS has advised the Fund that it received $164 in front-end sales charges resulting from sales of Class A shares during the year ended October 31, 2018. From these fees, PIMS paid such sales charges to broker-dealers, who in turn paid commissions to salespersons and incurred other distribution costs.
PIMS has advised the Fund that for the year ended October 31, 2018, it did not receive any contingent deferred sales charges imposed upon redemptions by certain Class A and Class C shareholders.
PGIM Investments, PGIM, Inc., and PIMS are indirect, wholly-owned subsidiaries of Prudential Financial, Inc. (“Prudential”).
3. Other Transactions with Affiliates
Prudential Mutual Fund Services LLC (“PMFS”), an affiliate of PGIM Investments and an indirect, wholly-owned subsidiary of Prudential, serves as the Fund’s transfer agent. Transfer agent’s fees and expenses in the Statement of Operations include certain out-of-pocket expenses paid to non-affiliates, where applicable.
The Fund may enter into certain securities purchase or sale transactions under Board approved Rule 17a-7 procedures. Rule 17a-7 is an exemptive rule under the 1940 Act, that, subject to certain conditions, permits purchase and sale transactions among affiliated investment companies, or between an investment company and a person that is affiliated solely by reason of having a common (or affiliated) investment adviser, common directors, and/or common officers. Such transactions are subject to ratification by the Board. For the reporting period ended October 31, 2018, no such transactions were entered into by the Fund.
The Fund may invest its overnight sweep cash in the PGIM Core Ultra Short Bond Fund (the “Core Fund”) and its securities lending cash collateral in the PGIM Institutional Money Market Fund (the “Money Market Fund”), a series of Prudential Investment Portfolios 2, registered under the 1940 Act and managed by PGIM Investments. Earnings from the Core Fund are disclosed on the Statement of Operations as “Affiliated dividend income”.
4. Portfolio Securities
The aggregate cost of purchases and proceeds from sales of portfolio securities (excluding short-term investments and U.S. Government securities) for the year ended October 31, 2018, were $17,984,306 and $15,391,169, respectively.
A summary of the cost of purchases and proceeds from sales of shares of affiliated mutual funds for the year ended October 31, 2018, is presented as follows:
| | | | | | | | | | | | | | | | | | | | | | | | | | | | |
Value,
Beginning
of Year | | Cost of
Purchases | | | Proceeds
from Sales | | | Change in
Unrealized
Gain
(Loss) | | | Realized
Gain
(Loss) | | | Value,
End of
Year | | | Shares,
End of
Year | | | Income | |
PGIM Core Ultra Short Bond Fund* | | | | | | | | | | | | | |
| $ 398,187 | | $ | 110,576,040 | | | $ | 110,849,016 | | | $ | — | | | $ | — | | | $ | 125,211 | | | | 125,211 | | | $ | 4,367 | |
| | |
PGIM Institutional Money Market Fund* | | | | | | | | | |
| — | | | 139,240 | | | | 139,240 | | | | — | | | | — | | | | — | | | | — | | | | — | |
| | | | | | | | | | | | | | | | | | | | | | | | | | | | |
| $ 398,187 | | $ | 110,715,280 | | | $ | 110,988,256 | | | $ | — | | | $ | — | | | $ | 125,211 | | | | | | | $ | 4,367 | |
| | | | | | | | | | | | | | | | | | | | | | | | | | | | |
| * | The Fund did not have any capital gain distributions during the reporting period. |
| | | | |
| PGIM Select Real Estate Fund | | | 33 | |
Notes to Financial Statements (continued)
5. Distributions and Tax Information
Distributions to shareholders, which are determined in accordance with federal income tax regulations and which may differ from generally accepted accounting principles, are recorded on the ex-date.
For the year ended October 31, 2018, the tax character of dividends paid by the Fund was $196,538 of ordinary income. For the year ended October 31, 2017, the tax character of dividends paid by the Fund was $218,829 of ordinary income.
As of October 31, 2018, the accumulated undistributed earnings on a tax basis were $119,295 of ordinary income and $105,635 of long-term capital gains.
The United States federal income tax basis of the Fund’s investments and the net unrealized depreciation as of October 31, 2018 were as follows:
| | | | | | |
Tax Basis | | Gross Unrealized Appreciation | | Gross Unrealized Depreciation | | Net Unrealized Depreciation |
| $8,876,358 | | $199,306 | | $(291,948) | | $(92,642) |
The book basis differs from tax basis primarily due to deferred losses on wash sales, investments in passive foreign investment companies and other cost basis differences between financial and tax accounting.
The Fund utilized approximately $100,000 of its capital loss carryforward during the year ended October 31, 2018.
Management has analyzed the Fund’s tax positions taken on federal, state and local income tax returns for all open tax years and has concluded that no provision for income tax is required in the Fund’s financial statements for the current reporting period. The Fund’s federal, state and local income and federal excise tax returns for tax years for which the applicable statutes of limitations have not expired are subject to examination by the Internal Revenue Service and state departments of revenue.
6. Capital and Ownership
The Fund offers Class A, Class C, Class Z and Class R6 shares. Class A shares are sold with a maximum front-end sales charge of 5.50%. Investors who purchase $1 million or more of Class A shares and sell these shares within 12 months of purchase are subject to a contingent deferred sales charge (“CDSC”) of 1%, although they are not subject to an initial sales charge. The Class A CDSC is waived for certain retirement and/or benefit plans. A special exchange privilege is also available for shareholders who qualified to purchase
Class A shares at net asset value. Class C shares are sold with a CDSC of 1% on sales made within 12 months of purchase. Class Z and Class R6 shares are not subject to any sales or redemption charge and are available exclusively for sale to a limited group of investors.
Under certain circumstances, an exchange may be made from specified share classes of the Fund to one or more other share classes of the Fund as presented in the table of transactions in shares of beneficial interest.
The Trust has authorized an unlimited number of shares of beneficial interest at $0.001 par value per share, divided into four classes, designated Class A, Class C, Class Z and Class R6.
As of October 31, 2018, Prudential, through its affiliated entities, including affiliated funds (if applicable), owned 1,145 Class A shares, 1,119 Class C shares, 1,155 Class Z shares and 585,686 Class R6 shares of the Fund. At reporting period end, two shareholders of record held 96% of the Fund’s outstanding shares on behalf of multiple beneficial owners, of which 96% were held by an affiliate of Prudential.
Transactions in shares of beneficial interest were as follows:
| | | | | | | | |
Class A | | Shares | | | Amount | |
Year ended October 31, 2018: | | | | | | | | |
Shares sold | | | 270,402 | | | $ | 2,782,141 | |
Shares issued in reinvestment of dividends and distributions | | | 2,972 | | | | 31,114 | |
Shares reacquired | | | (43,052 | ) | | | (457,139 | ) |
| | | | | | | | |
Net increase (decrease) in shares outstanding before conversion | | | 230,322 | | | | 2,356,116 | |
Shares reacquired upon conversion into other share class(es) | | | (1,701 | ) | | | (17,508 | ) |
| | | | | | | | |
Net increase (decrease) in shares outstanding | | | 228,621 | | | $ | 2,338,608 | |
| | | | | | | | |
Year ended October 31, 2017: | | | | | | | | |
Shares sold | | | 9,285 | | | $ | 93,616 | |
Shares issued in reinvestment of dividends and distributions | | | 736 | | | | 7,330 | |
Shares reacquired | | | (4,230 | ) | | | (43,679 | ) |
| | | | | | | | |
Net increase (decrease) in shares outstanding | | | 5,791 | | | $ | 57,267 | |
| | | | | | | | |
Class C | | | | | | |
Year ended October 31, 2018: | | | | | | | | |
Shares issued in reinvestment of dividends and distributions | | | 111 | | | $ | 1,166 | |
Shares reacquired | | | (1,265 | ) | | | (13,090 | ) |
| | | | | | | | |
Net increase (decrease) in shares outstanding | | | (1,154 | ) | | $ | (11,924 | ) |
| | | | | | | | |
Year ended October 31, 2017: | | | | | | | | |
Shares sold | | | 3,437 | | | $ | 34,300 | |
Shares issued in reinvestment of dividends and distributions | | | 162 | | | | 1,588 | |
Shares reacquired | | | (2,880 | ) | | | (28,902 | ) |
| | | | | | | | |
Net increase (decrease) in shares outstanding | | | 719 | | | $ | 6,986 | |
| | | | | | | | |
| | | | |
| PGIM Select Real Estate Fund | | | 35 | |
Notes to Financial Statements (continued)
| | | | | | | | |
Class Z | | Shares | | | Amount | |
Year ended October 31, 2018: | | | | | | | | |
Shares sold | | | 4,491 | | | $ | 47,268 | |
Shares issued in reinvestment of dividends and distributions | | | 362 | | | | 3,847 | |
Shares reacquired | | | (14,907 | ) | | | (157,950 | ) |
| | | | | | | | |
Net increase (decrease) in shares outstanding before conversion | | | (10,054 | ) | | | (106,835 | ) |
Shares issued upon conversion from other share class(es) | | | 1,698 | | | | 17,508 | |
| | | | | | | | |
Net increase (decrease) in shares outstanding | | | (8,356 | ) | | $ | (89,327 | ) |
| | | | | | | | |
Year ended October 31, 2017: | | | | | | | | |
Shares sold | | | 1,761 | | | $ | 17,866 | |
Shares issued in reinvestment of dividends and distributions | | | 508 | | | | 5,074 | |
Shares reacquired | | | (1,446 | ) | | | (14,843 | ) |
| | | | | | | | |
Net increase (decrease) in shares outstanding | | | 823 | | | $ | 8,097 | |
| | | | | | | | |
Class R6 | | | | | | |
Year ended October 31, 2018: | | | | | | | | |
Shares issued in reinvestment of dividends and distributions | | | 15,341 | | | $ | 160,410 | |
| | | | | | | | |
Net increase (decrease) in shares outstanding | | | 15,341 | | | $ | 160,410 | |
| | | | | | | | |
Year ended October 31, 2017: | | | | | | | | |
Shares issued in reinvestment of dividends and distributions | | | 20,831 | | | $ | 204,837 | |
Shares reacquired | | | (1,137 | ) | | | (11,789 | ) |
| | | | | | | | |
Net increase (decrease) in shares outstanding | | | 19,694 | | | $ | 193,048 | |
| | | | | | | | |
7. Borrowings
The Trust, on behalf of the Fund, along with other affiliated registered investment companies (the “Funds”), is a party to a Syndicated Credit Agreement (“SCA”) with a group of banks. The purpose of the SCA is to provide an alternative source of temporary funding for capital share redemptions. The SCA provides for a commitment of $900 million for the period October 4, 2018 through October 3, 2019. The Funds pay an annualized commitment fee of 0.15% of the unused portion of the SCA. The Fund’s portion of the commitment fee for the unused amount, allocated based upon a method approved by the Board, is accrued daily and paid quarterly. Prior to October 4, 2018, the Funds had another SCA that provided a commitment of $900 million and the Funds paid an annualized commitment fee of 0.15% of the unused portion of the SCA. The interest on borrowings under both SCAs is paid monthly and at a per annum interest rate based upon a contractual spread plus the higher of (1) the effective federal funds rate, (2) the 1-month LIBOR rate or (3) zero percent.
Other affiliated registered investment companies that are parties to the SCA include portfolios that are subject to a predetermined mathematical formula used to manage certain benefit guarantees offered under variable annuity contracts. The formula may result in large scale asset flows into and out of these portfolios. Consequently, these portfolios may be more likely to utilize the SCA for purposes of funding redemptions. It may be possible for those portfolios to fully exhaust the committed amount of the SCA, thereby requiring the Manager
to allocate available funding per a Board-approved methodology designed to treat the Funds in the SCA equitably.
The Fund utilized the SCA during the reporting period ended October 31, 2018. The average daily balance for the 3 days that the Fund had loans outstanding during the period was $126,000 borrowed at a weighted average interest rate of 3.31%. The maximum loan balance outstanding during the period was $126,000. At October 31, 2018, the Fund did not have an outstanding loan balance.
8. Risks of Investing in the Fund
The Fund’s risks include, but are not limited to, some or all of the risks discussed below:
Equity and Equity-Related Securities Risks: The value of a particular security could go down and you could lose money. In addition to an individual security losing value, the value of the equity markets or a sector in which the Fund invests could go down. The Fund’s holdings can vary significantly from broad market indexes and the performance of the Fund can deviate from the performance of these indexes. Different parts of a market can react differently to adverse issuer, market, regulatory, political and economic developments.
Foreign Securities Risk: The Fund’s investments in securities of foreign issuers or issuers with significant exposure to foreign markets involve additional risk. Foreign countries in which the Fund may invest may have markets that are less liquid, less regulated and more volatile than US markets. The value of the Fund’s investments may decline because of factors affecting the particular issuer as well as foreign markets and issuers generally, such as unfavorable government actions, and political or financial instability.
Non-diversification Risk: The Fund is non-diversified, meaning that the Fund may invest a greater percentage of its assets in the securities of a single company or industry than a diversified fund. Investing in a non-diversified fund involves greater risk than investing in a diversified fund because a loss resulting from the decline in value of any one security may represent a greater portion of the total assets of a non-diversified fund.
Risks of Investing in Equity and Mortgage Real Estate Investment Trusts (collectively equity REITs): Real estate securities are subject to similar risks as direct investments in real estate and mortgages, and their value will depend on the value of the underlying properties or the underlying loans or interests. The underlying loans may be subject to the risks of default or of payments that occur earlier or later than expected, and such loans may also include so-called “subprime” mortgages. The value of these securities will rise and fall in response to many factors, Including economic conditions, the demand for rental property and interest rates. In particular, the value of these securities may decline when interest rates rise and will also be affected by the real estate market and by the management of the underlying properties.
| | | | |
| PGIM Select Real Estate Fund | | | 37 | |
Notes to Financial Statements (continued)
In addition, investing in equity REITs involves certain unique risks in addition to those risks associated with investing in the real estate industry in general. Equity REITs may be affected by changes in the value of the underlying property owned by the equity REITs, while mortgage equity REITs may be affected by the quality of any credit extended. Equity REITs are dependent upon management skills, may not be diversified geographically or by property/mortgage asset type, and are subject to heavy cash flow dependency, default by borrowers and self-liquidation. Since equity REITs are relatively smaller in size when compared to the broader market, and smaller companies tend to be more volatile than larger companies, they may be more volatile and/or more illiquid than other types of equity securities. Equity REITs are subject to interest rate risks. Equity REITs may incur significant amounts of leverage. The Fund will indirectly bear a portion of the expenses, including management fees, paid by each equity REIT in which it invests, in addition to the expenses of the Fund.
9. Recent Accounting Pronouncements and Reporting Updates
In August 2018, the Securities and Exchange Commission (the “SEC”) adopted amendments to Regulation S-X to update and simplify the disclosure requirements for registered investment companies by eliminating requirements that are redundant or duplicative of US GAAP requirements or other SEC disclosure requirements. The new amendments require the presentation of the total, rather than the components, of distributable earnings on the Statement of Assets and Liabilities and the total, rather than the components, of dividends from net investment income and distributions from net realized gains on the Statements of Changes in Net Assets. The amendments also removed the requirement for the parenthetical disclosure of undistributed net investment income on the Statements of Changes in Net Assets and certain tax adjustments that were reflected in the Notes to Financial Statements. All of these have been reflected in the Fund’s financial statements.
In August 2018, the FASB issued Accounting Standards Update (“ASU”) No. 2018-13, which changes certain fair value measurement disclosure requirements. The new ASU, in addition to other modifications and additions, removes the requirement to disclose the amount and reasons for transfers between Level 1 and Level 2 of the fair value hierarchy, and the Fund’s policy for the timing of transfers between levels. The amendments are effective for financial statements issued for fiscal years beginning after December 15, 2019, and interim periods within those fiscal years. Management has evaluated the implications of certain provisions of the ASU and has determined to early adopt aspects related to the removal and modification of certain fair value measurement disclosures under the ASU effective immediately. At this time, management is evaluating the implications of certain other provisions of the ASU related to new disclosure requirements and any impact on the financial statement disclosures has not yet been determined.
Financial Highlights
| | | | | | | | | | | | | | | | | | | | | | | | |
| Class A Shares | | | | | | | | | | | | | | | | | | |
| | | Year Ended October 31, | | | | | | August 1,
2014(a)
through
October 31, | |
| | | 2018 | | | 2017 | | | 2016 | | | 2015 | | | | | | 2014 | |
| Per Share Operating Performance(b): | | | | | | | | | | | | | | | | | | | | | | | | |
| Net Asset Value, Beginning of Period | | | $10.54 | | | | $10.00 | | | | $10.71 | | | | $10.30 | | | | | | | | $10.00 | |
| Income (loss) from investment operations: | | | | | | | | | | | | | | | | | | | | | | | | |
| Net investment income (loss) | | | 0.12 | | | | 0.12 | | | | 0.17 | | | | 0.09 | | | | | | | | 0.01 | |
| Net realized and unrealized gain (loss) on investment and foreign currency transactions | | | (0.08 | ) | | | 0.76 | | | | (0.18 | ) | | | 0.41 | | | | | | | | 0.29 | |
| Total from investment operations | | | 0.04 | | | | 0.88 | | | | (0.01 | ) | | | 0.50 | | | | | | | | 0.30 | |
| Less Dividends and Distributions: | | | | | | | | | | | | | | | | | | | | | | | | |
| Dividends from net investment income | | | (0.25 | ) | | | (0.11 | ) | | | (0.28 | ) | | | - | | | | | | | | - | |
| Distributions from net realized gains | | | - | | | | (0.23 | ) | | | (0.42 | ) | | | (0.09 | ) | | | | | | | - | |
| Total dividends and distributions | | | (0.25 | ) | | | (0.34 | ) | | | (0.70 | ) | | | (0.09 | ) | | | | | | | - | |
| Net asset value, end of period | | | $10.33 | | | | $10.54 | | | | $10.00 | | | | $10.71 | | | | | | | | $10.30 | |
| Total Return(c): | | | 0.37% | | | | 9.08% | | | | 0.01% | | | | 4.85% | | | | | | | | 3.00% | |
| |
| Ratios/Supplemental Data: | | | | | | | | | | | | | | | | | | |
| Net assets, end of period (000) | | | $2,612 | | | | $256 | | | | $185 | | | | $62 | | | | | | | | $18 | |
| Average net assets (000) | | | $1,645 | | | | $242 | | | | $119 | | | | $27 | | | | | | | | $15 | |
| Ratios to average net assets(d): | | | | | | | | | | | | | | | | | | | | | | | | |
| Expenses after waivers and/or expense reimbursement | | | 1.30% | | | | 1.30% | | | | 1.33% | | | | 1.35% | | | | | | | | 1.35% | (e) |
| Expenses before waivers and/or expense reimbursement | | | 4.02% | (f) | | | 4.63% | | | | 4.81% | | | | 5.16% | | | | | | | | 20.58% | (e) |
| Net investment income (loss) | | | 1.14% | | | | 1.15% | | | | 1.70% | | | | 0.86% | | | | | | | | 0.46% | (e) |
| Portfolio turnover rate(g) | | | 202% | | | | 142% | | | | 158% | | | | 150% | | | | | | | | 18% | |
| (a) | Commencement of operations. |
| (b) | Calculated based on average shares outstanding during the period. |
| (c) | Total return does not consider the effects of sales loads. Total return is calculated assuming a purchase of a share on the first day and a sale on the last day of each period reported and includes reinvestment of dividends and distributions, if any. Total returns may reflect adjustments to conform to generally accepted accounting principles. Total returns for periods less than one full year are not annualized. |
| (d) | Does not include expenses of the underlying funds in which the Fund invests. |
| (f) | Effective November 1, 2017, class specific expenses include transfer agent fees and expenses and registration fees, which are charged to their respective share class. |
| (g) | The Fund’s portfolio turnover rate is calculated in accordance with regulatory requirements, without regard to transactions involving short term investments and certain derivatives. If such transactions were included, the Fund’s portfolio turnover rate may be higher. |
See Notes to Financial Statements.
| | | | |
| PGIM Select Real Estate Fund | | | 39 | |
Financial Highlights (continued)
| | | | | | | | | | | | | | | | | | | | | | | | |
| Class C Shares | | | | | | | | | | | | | | | | | | |
| | | Year Ended October 31, | | | | | | August 1,
2014(a)
through
October 31, | |
| | | 2018 | | | 2017 | | | 2016 | | | 2015 | | | | | | 2014 | |
| Per Share Operating Performance(b): | | | | | | | | | | | | | | | | | | | | | | | | |
| Net Asset Value, Beginning of Period | | | $10.44 | | | | $9.94 | | | | $10.60 | | | | $10.28 | | | | | | | | $10.00 | |
| Income (loss) from investment operations: | | | | | | | | | | | | | | | | | | | | | | | | |
| Net investment income (loss) | | | 0.09 | | | | 0.04 | | | | 0.11 | | | | (0.03) | | | | | | | | (0.01) | |
| Net realized and unrealized gain (loss) on investment and foreign currency transactions | | | (0.12) | | | | 0.75 | | | | (0.18) | | | | 0.44 | | | | | | | | 0.29 | |
| Total from investment operations | | | (0.03) | | | | 0.79 | | | | (0.07) | | | | 0.41 | | | | | | | | 0.28 | |
| Less Dividends and Distributions: | | | | | | | | | | | | | | | | | | | | | | | | |
| Dividends from net investment income | | | (0.18) | | | | (0.06) | | | | (0.17) | | | | - | | | | | | | | - | |
| Distributions from net realized gains | | | - | | | | (0.23) | | | | (0.42) | | | | (0.09) | | | | | | | | - | |
| Total dividends and distributions | | | (0.18) | | | | (0.29) | | | | (0.59) | | | | (0.09) | | | | | | | | - | |
| Net asset value, end of period | | | $10.23 | | | | $10.44 | | | | $9.94 | | | | $10.60 | | | | | | | | $10.28 | |
| Total Return(c): | | | (0.34)% | | | | 8.11% | | | | (0.63)% | | | | 3.98% | | | | | | | | 2.80% | |
| |
| Ratios/Supplemental Data: | |
| Net assets, end of period (000) | | | $56 | | | | $69 | | | | $59 | | | | $36 | | | | | | | | $10 | |
| Average net assets (000) | | | $64 | | | | $70 | | | | $48 | | | | $46 | | | | | | | | $10 | |
| Ratios to average net assets(d): | | | | | | | | | | | | | | | | | | | | | | | | |
| Expenses after waivers and/or expense reimbursement | | | 2.05% | | | | 2.05% | | | | 2.08% | | | | 2.10% | | | | | | | | 2.10% | (e) |
| Expenses before waivers and/or expense reimbursement | | | 29.08% | (f) | | | 5.33% | | | | 5.64% | | | | 5.54% | | | | | | | | 20.42% | (e) |
| Net investment income (loss) | | | 0.91% | | | | 0.36% | | | | 1.08% | | | | (0.30)% | | | | | | | | (0.26)% | (e) |
| Portfolio turnover rate(g) | | | 202% | | | | 142% | | | | 158% | | | | 150% | | | | | | | | 18% | |
| (a) | Commencement of operations. |
| (b) | Calculated based on average shares outstanding during the period. |
| (c) | Total return does not consider the effects of sales loads. Total return is calculated assuming a purchase of a share on the first day and a sale on the last day of each period reported and includes reinvestment of dividends and distributions, if any. Total returns may reflect adjustments to conform to generally accepted accounting principles. Total returns for periods less than one full year are not annualized. |
| (d) | Does not include expenses of the underlying funds in which the Fund invests. |
| (f) | Effective November 1, 2017, class specific expenses include transfer agent fees and expenses and registration fees, which are charged to their respective share class. |
| (g) | The Fund’s portfolio turnover rate is calculated in accordance with regulatory requirements, without regard to transactions involving short term investments and certain derivatives. If such transactions were included, the Fund’s portfolio turnover rate may be higher. |
See Notes to Financial Statements.
| | | | | | | | | | | | | | | | | | | | | | | | |
| Class Z Shares | | | | | | | | | | | | | | | | | | |
| | | Year Ended October 31, | | | | | | August 1,
2014(a)
through
October 31, | |
| | | 2018 | | | 2017 | | | 2016 | | | 2015 | | | | | | 2014 | |
| Per Share Operating Performance(b): | | | | | | | | | | | | | | | | | | | | | | | | |
| Net Asset Value, Beginning of Period | | | $10.56 | | | | $10.02 | | | | $10.74 | | | | $10.31 | | | | | | | | $10.00 | |
| Income (loss) from investment operations: | | | | | | | | | | | | | | | | | | | | | | | | |
| Net investment income (loss) | | | 0.22 | | | | 0.15 | | | | 0.21 | | | | 0.10 | | | | | | | | 0.02 | |
| Net realized and unrealized gain (loss) on investment and foreign currency transactions | | | (0.16 | ) | | | 0.76 | | | | (0.18 | ) | | | 0.42 | | | | | | | | 0.29 | |
| Total from investment operations | | | 0.06 | | | | 0.91 | | | | 0.03 | | | | 0.52 | | | | | | | | 0.31 | |
| Less Dividends and Distributions: | | | | | | | | | | | | | | | | | | | | | | | | |
| Dividends from net investment income | | | (0.28 | ) | | | (0.14 | ) | | | (0.33 | ) | | | - | | | | | | | | - | |
| Distributions from net realized gains | | | - | | | | (0.23 | ) | | | (0.42 | ) | | | (0.09 | ) | | | | | | | - | |
| Total dividends and distributions | | | (0.28 | ) | | | (0.37 | ) | | | (0.75 | ) | | | (0.09 | ) | | | | | | | - | |
| Net asset value, end of period | | | $10.34 | | | | $10.56 | | | | $10.02 | | | | $10.74 | | | | | | | | $10.31 | |
| Total Return(c): | | | 0.51% | | | | 9.32% | | | | 0.36% | | | | 5.04% | | | | | | | | 3.10% | |
| |
| Ratios/Supplemental Data: | | | | | | | | | | | | | | | | | | |
| Net assets, end of period (000) | | | $65 | | | | $154 | | | | $138 | | | | $107 | | | | | | | | $10 | |
| Average net assets (000) | | | $145 | | | | $148 | | | | $139 | | | | $39 | | | | | | | | $10 | |
| Ratios to average net assets(d): | | | | | | | | | | | | | | | | | | | | | | | | |
| Expenses after waivers and/or expense reimbursement | | | 1.05% | | | | 1.05% | | | | 1.08% | | | | 1.10% | | | | | | | | 1.10% | (e) |
| Expenses before waivers and/or expense reimbursement | | | 14.17% | (f) | | | 4.35% | | | | 4.82% | | | | 5.16% | | | | | | | | 19.50% | (e) |
| Net investment income (loss) | | | 2.07% | | | | 1.43% | | | | 2.09% | | | | 0.98% | | | | | | | | 0.77% | (e) |
| Portfolio turnover rate(g) | | | 202% | | | | 142% | | | | 158% | | | | 150% | | | | | | | | 18% | |
| (a) | Commencement of operations. |
| (b) | Calculated based on average shares outstanding during the period. |
| (c) | Total return is calculated assuming a purchase of a share on the first day and a sale on the last day of each period reported and includes reinvestment of dividends and distributions, if any. Total returns may reflect adjustments to conform to generally accepted accounting principles. Total returns for periods less than one full year are not annualized. |
| (d) | Does not include expenses of the underlying funds in which the Fund invests. |
| (f) | Effective November 1, 2017, class specific expenses include transfer agent fees and expenses and registration fees, which are charged to their respective share class. |
| (g) | The Fund’s portfolio turnover rate is calculated in accordance with regulatory requirements, without regard to transactions involving short term investments and certain derivatives. If such transactions were included, the Fund’s portfolio turnover rate may be higher. |
See Notes to Financial Statements.
| | | | |
| PGIM Select Real Estate Fund | | | 41 | |
Financial Highlights (continued)
| | | | | | | | | | | | | | | | | | | | | | | | |
| Class R6 Shares | | | | | | | | | | | | | | | | | | |
| | | Year Ended October 31, | | | | | | August 1,
2014(a)
through
October 31, | |
| | | 2018 | | | 2017 | | | 2016 | | | 2015 | | | | | | 2014 | |
| Per Share Operating Performance(b): | | | | | | | | | | | | | | | | | | | | | | | | |
| Net Asset Value, Beginning of Period | | | $10.40 | | | | $9.88 | | | | $10.63 | | | | $10.31 | | | | | | | | $10.00 | |
| Income (loss) from investment operations: | | | | | | | | | | | | | | | | | | | | | | | | |
| Net investment income (loss) | | | 0.20 | | | | 0.14 | | | | 0.22 | | | | 0.10 | | | | | | | | 0.02 | |
| Net realized and unrealized gain (loss) on investment and foreign currency transactions | | | (0.13 | ) | | | 0.75 | | | | (0.20 | ) | | | 0.41 | | | | | | | | 0.29 | |
| Total from investment operations | | | 0.07 | | | | 0.89 | | | | 0.02 | | | | 0.51 | | | | | | | | 0.31 | |
| Less Dividends and Distributions: | | | | | | | | | | | | | | | | | | | | | | | | |
| Dividends from net investment income | | | (0.28 | ) | | | (0.14 | ) | | | (0.35 | ) | | | (0.10 | ) | | | | | | | - | |
| Distributions from net realized gains | | | - | | | | (0.23 | ) | | | (0.42 | ) | | | (0.09 | ) | | | | | | | - | |
| Total dividends and distributions | | | (0.28 | ) | | | (0.37 | ) | | | (0.77 | ) | | | (0.19 | ) | | | | | | | - | |
| Net asset value, end of period | | | $10.19 | | | | $10.40 | | | | $9.88 | | | | $10.63 | | | | | | | | $10.31 | |
| Total Return(c): | | | 0.62% | | | | 9.25% | | | | 0.30% | | | | 5.01% | | | | | | | | 3.10% | |
| |
| Ratios/Supplemental Data: | | | | | | | | | | | | | | | | | | |
| Net assets, end of period (000) | | | $5,970 | | | | $5,932 | | | | $5,441 | | | | $5,423 | | | | | | | | $5,165 | |
| Average net assets (000) | | | $6,039 | | | | $5,687 | | | | $5,413 | | | | $5,288 | | | | | | | | $4,983 | |
| Ratios to average net assets(d): | | | | | | | | | | | | | | | | | | | | | | | | |
| Expenses after waivers and/or expense reimbursement | | | 1.05% | | | | 1.05% | | | | 1.08% | | | | 1.10% | | | | | | | | 1.10% | (e) |
| Expenses before waivers and/or expense reimbursement | | | 3.07% | (f) | | | 4.02% | | | | 4.40% | | | | 4.51% | | | | | | | | 14.06% | (e) |
| Net investment income (loss) | | | 1.89% | | | | 1.42% | | | | 2.18% | | | | 0.96% | | | | | | | | 0.75% | (e) |
| Portfolio turnover rate(g) | | | 202% | | | | 142% | | | | 158% | | | | 150% | | | | | | | | 18% | |
| (a) | Commencement of operations. |
| (b) | Calculated based on average shares outstanding during the period. |
| (c) | Total return is calculated assuming a purchase of a share on the first day and a sale on the last day of each period reported and includes reinvestment of dividends and distributions, if any. Total returns may reflect adjustments to conform to generally accepted accounting principles. Total returns for periods less than one full year are not annualized. |
| (d) | Does not include expenses of the underlying funds in which the Fund invests. |
| (f) | Effective November 1, 2017, class specific expenses include transfer agent fees and expenses and registration fees, which are charged to their respective share class. |
| (g) | The Fund’s portfolio turnover rate is calculated in accordance with regulatory requirements, without regard to transactions involving short term investments and certain derivatives. If such transactions were included, the Fund’s portfolio turnover rate may be higher. |
See Notes to Financial Statements.
Report of Independent Registered Public Accounting Firm
The Board of Trustees and Shareholders
Prudential Investment Portfolios 9:
Opinion on the Financial Statements
We have audited the accompanying statement of assets and liabilities of PGIM Select Real Estate Fund (formerly Prudential Select Real Estate Fund) (the “Fund”), a series of Prudential Investment Portfolios 9, including the schedule of investments, as of October 31, 2018, the related statement of operations for the year then ended, the statements of changes in net assets for each of the years in the two-year period then ended, and the related notes (collectively, the financial statements) and the financial highlights for the years or periods indicated therein. In our opinion, the financial statements and financial highlights present fairly, in all material respects, the financial position of the Fund as of October 31, 2018, the results of its operations for the year then ended, the changes in its net assets for each of the years in the two-year period then ended, and the financial highlights for the years or periods indicated therein, in conformity with U.S. generally accepted accounting principles.
Basis for Opinion
These financial statements and financial highlights are the responsibility of the Fund’s management. Our responsibility is to express an opinion on these financial statements and financial highlights based on our audits. We are a public accounting firm registered with the Public Company Accounting Oversight Board (United States) (“PCAOB”) and are required to be independent with respect to the Fund in accordance with the U.S. federal securities laws and the applicable rules and regulations of the Securities and Exchange Commission and the PCAOB.
We conducted our audits in accordance with the standards of the PCAOB. Those standards require that we plan and perform the audit to obtain reasonable assurance about whether the financial statements and financial highlights are free of material misstatement, whether due to error or fraud. Our audits included performing procedures to assess the risks of material misstatement of the financial statements and financial highlights, whether due to error or fraud, and performing procedures that respond to those risks. Such procedures included examining, on a test basis, evidence regarding the amounts and disclosures in the financial statements and financial highlights. Such procedures also included confirmation of securities owned as of October 31, 2018, by correspondence with the custodians, transfer agents and brokers or by other appropriate auditing procedures when replies from brokers were not received. Our audits also included evaluating the accounting principles used and significant estimates made by management, as well as evaluating the overall presentation of the financial statements and financial highlights. We believe that our audits provide a reasonable basis for our opinion.

We have served as the auditor of one or more PGIM and/or Prudential Retail investment companies since 2003.
New York, New York
December 17, 2018
| | | | |
| PGIM Select Real Estate Fund | | | 43 | |
Federal Income Tax Information (unaudited)
For the year ended October 31, 2018, the Fund reports the maximum amount allowable under Section 854 of the Internal Revenue Code, but not less than 9.04% of the ordinary income dividends paid during the year as qualified dividend income.
In January 2019, you will be advised on IRS Form 1099-DIV or substitute 1099-DIV as to the federal tax status of the distributions received by you in calendar year 2018.
INFORMATION ABOUT BOARD MEMBERS AND OFFICERS (unaudited)
Information about Board Members and Officers of the Fund is set forth below. Board Members who are not deemed to be “interested persons” of the Fund, as defined in the 1940 Act, are referred to as “Independent Board Members.” Board Members who are deemed to be “interested persons” of the Fund are referred to as “Interested Board Members.” The Board Members are responsible for the overall supervision of the operations of the Fund and perform the various duties imposed on the directors of investment companies by the 1940 Act. The Board in turn elects the Officers, who are responsible for administering the day-to-day operations of the Fund.
| | | | | | |
| Independent Board Members | | | | |
| | | | |
Name, Address, Age Position(s) Portfolios Overseen | | Principal Occupation(s) During Past Five Years | | Other Directorships Held During Past Five Years | | Length of Board Service |
| | | | |
Ellen S. Alberding (60) Board Member Portfolios Overseen: 93 | | President and Board Member, The Joyce Foundation (charitable foundation) (since 2002); Vice Chair, City Colleges of Chicago (community college system) (2011-2015); Trustee, National Park Foundation (charitable foundation for national park system) (2009-2018); Trustee, Economic Club of Chicago (since 2009); Trustee, Loyola University (since 2018). | | None. | | Since September 2013 |
| | | | |
Kevin J. Bannon (66) Board Member Portfolios Overseen: 93 | | Retired; Managing Director (April 2008-May 2015) and Chief Investment Officer (October 2008-November 2013) of Highmount Capital LLC (registered investment adviser); formerly Executive Vice President and Chief Investment Officer (April 1993-August 2007) of Bank of New York Company; President (May 2003-May 2007) of BNY Hamilton Family of Mutual Funds. | | Director of Urstadt Biddle Properties (equity real estate investment trust) (since September 2008). | | Since July 2008 |
| | | | |
Linda W. Bynoe (66) Board Member Portfolios Overseen: 93 | | President and Chief Executive Officer (since March 1995) and formerly Chief Operating Officer (December 1989-February 1995) of Telemat Ltd. (management consulting); formerly Vice President (January 1985-June 1989) at Morgan Stanley & Co. (broker-dealer). | | Director of Anixter International, Inc. (communication products distributor) (since January 2006); Director of Northern Trust Corporation (financial services) (since April 2006); Trustee of Equity Residential (residential real estate) (since December 2009). | | Since March 2005 |
PGIM Select Real Estate Fund
| | | | | | |
Independent Board Members | | | | |
| | | | |
Name, Address, Age Position(s) Portfolios Overseen | | Principal Occupation(s) During Past Five Years | | Other Directorships Held During Past Five Years | | Length of Board Service |
| | | | |
Barry H. Evans (58) Board Member Portfolios Overseen: 92 | | Retired; formerly President (2005 – 2016), Global Chief Operating Officer (2014– 2016), Chief Investment Officer – Global Head of Fixed Income (1998-2014), and various portfolio manager roles (1986-2006), Manulife Asset Management U.S. | | Director, Manulife Trust Company (since 2011); formerly Director, Manulife Asset Management Limited (2015-2017); formerly Chairman of the Board of Directors of Manulife Asset Management U.S. (2005-2016); formerly Chairman of the Board, Declaration Investment Management and Research (2008-2016). | | Since September 2017 |
| | | | |
Keith F. Hartstein (62) Board Member & Independent Chair Portfolios Overseen: 93 | | Retired; Member (since November 2014) of the Governing Council of the Independent Directors Council (organization of independent mutual fund directors); formerly President and Chief Executive Officer (2005-2012), Senior Vice President (2004-2005), Senior Vice President of Sales and Marketing (1997-2004), and various executive management positions (1990-1997), John Hancock Funds, LLC (asset management); Chairman, Investment Company Institute’s Sales Force Marketing Committee (2003-2008). | | None. | | Since September 2013 |
Visit our website at pgiminvestments.com
| | | | | | |
| Independent Board Members | | | | |
| | | | |
Name, Address, Age Position(s) Portfolios Overseen | | Principal Occupation(s) During Past Five Years | | Other Directorships Held During Past Five Years | | Length of Board Service |
| | | | |
Laurie Simon Hodrick (56) Board Member Portfolios Overseen: 92 | | A. Barton Hepburn Professor Emerita of Economics in the Faculty of Business, Columbia Business School (since 2018); Visiting Professor of Law, Stanford Law School (since 2015); Visiting Fellow at the Hoover Institution, Stanford University (since 2015); Sole Member, ReidCourt LLC (since 2008) (a consulting firm); formerly A. Barton Hepburn Professor of Economics in the Faculty of Business, Columbia Business School (1996-2017); formerly Managing Director, Global Head of Alternative Investment Strategies, Deutsche Bank (2006-2008). | | Independent Director, Corporate Capital Trust (since April 2017) (a business development company); Independent Director, Kabbage, Inc. (since July 2018) (financial services). | | Since September 2017 |
| | | | |
Michael S. Hyland, CFA (73) Board Member Portfolios Overseen: 93 | | Retired (since February 2005); formerly Senior Managing Director (July 2001-February 2005) of Bear Stearns & Co, Inc.; Global Partner, INVESCO (1999-2001); Managing Director and President of Salomon Brothers Asset Management (1989-1999). | | None. | | Since July 2008 |
| | | | |
Richard A. Redeker (75) Board Member Portfolios Overseen: 93 | | Retired Mutual Fund Senior Executive (50 years); Management Consultant; Director, Mutual Fund Directors Forum (since 2014); Independent Directors Council (organization of independent mutual fund directors)-Executive Committee, Chair of Policy Steering Committee, Governing Council. | | None. | | Since October 1993 |
PGIM Select Real Estate Fund
| | | | | | |
| Independent Board Members | | | | |
| | | | |
Name, Address, Age Position(s) Portfolios Overseen | | Principal Occupation(s) During Past Five Years | | Other Directorships Held During Past Five Years | | Length of Board Service |
| | | | |
Brian K. Reid (56)# Board Member Portfolios Overseen: 92 | | Retired; formerly Chief Economist for the Investment Company Institute (ICI) (2005-2017); formerly Senior Economist and Director of Industry and Financial Analysis at the ICI (1998-2004); formerly Senior Economist, Industry and Financial Analysis at the ICI (1996-1998); formerly Staff Economist at the Federal Reserve Board (1989-1996); Director, ICI Mutual Insurance Company (2012-2017). | | None. | | Since March 2018 |
| # | Mr. Reid joined the Board effective as of March 1, 2018. |
| | | | | | |
| Interested Board Members | | | | |
| | | | |
Name, Address, Age Position(s) Portfolios Overseen | | Principal Occupation(s) During Past Five Years | | Other Directorships Held During Past Five Years | | Length of
Board Service |
| | | | |
Stuart S. Parker (56) Board Member & President Portfolios Overseen: 93 | | President of PGIM Investments LLC (formerly known as Prudential Investments LLC) (since January 2012); Executive Vice President of Prudential Investment Management Services LLC (since December 2012); formerly Executive Vice President of Jennison Associates LLC and Head of Retail Distribution of PGIM Investments LLC (June 2005-December 2011). | | None. | | Since January 2012 |
Visit our website at pgiminvestments.com
| | | | | | |
| Interested Board Members | | | | |
| | | | |
Name, Address, Age Position(s) Portfolios Overseen | | Principal Occupation(s) During Past Five Years | | Other Directorships Held During Past Five Years | | Length of Board Service |
| | | | |
Scott E. Benjamin (45) Board Member & Vice President Portfolios Overseen:93 | | Executive Vice President (since June 2009) of PGIM Investments LLC; Executive Vice President (June 2009-June 2012) and Vice President (since June 2012) of Prudential Investment Management Services LLC; Executive Vice President (since September 2009) of AST Investment Services, Inc.; Senior Vice President of Product Development and Marketing, PGIM Investments (since February 2006); formerly Vice President of Product Development and Product Management, PGIM Investments LLC (2003-2006). | | None. | | Since March 2010 |
| | | | |
Grace C. Torres* (59) Board Member Portfolios Overseen: 92 | | Retired; formerly Treasurer and Principal Financial and Accounting Officer of the PGIM Funds, Target Funds, Advanced Series Trust, Prudential Variable Contract Accounts and The Prudential Series Fund (1998-June 2014); Assistant Treasurer (March 1999-June 2014) and Senior Vice President (September 1999-June 2014) of PGIM Investments LLC; Assistant Treasurer (May 2003-June 2014) and Vice President (June 2005-June 2014) of AST Investment Services, Inc.; Senior Vice President and Assistant Treasurer (May 2003-June 2014) of Prudential Annuities Advisory Services, Inc. | | Formerly Director (July 2015-January 2018) of Sun Bancorp, Inc. N.A. and Sun National Bank; Director (since January 2018) of OceanFirst Financial Corp. and OceanFirst Bank. | | Since November 2014 |
* Note: Prior to her retirement in 2014, Ms. Torres was employed by PGIM Investments LLC. Due to her prior employment, she is considered to be an “interested person” under the 1940 Act. Ms. Torres is a Non-Management Interested Board Member.
PGIM Select Real Estate Fund
| | | | |
| Fund Officers(a) | | | | |
| | | |
Name, Address and Age Position with Fund | | Principal Occupation(s) During Past Five Years | | Length of Service as Fund Officer |
| | | |
Raymond A. O’Hara (63) Chief Legal Officer | | Vice President and Corporate Counsel (since July 2010) of Prudential Insurance Company of America (Prudential); Vice President (March 2011-Present) of Pruco Life Insurance Company and Pruco Life Insurance Company of New Jersey; Vice President and Corporate Counsel (March 2011-Present) of Prudential Annuities Life Assurance Corporation; Chief Legal Officer of PGIM Investments LLC (since June 2012); Chief Legal Officer of Prudential Mutual Fund Services LLC (since June 2012) and Corporate Counsel of AST Investment Services, Inc. (since June 2012); formerly Assistant Vice President and Corporate Counsel (September 2008-July 2010) of The Hartford Financial Services Group, Inc.; formerly Associate (September 1980-December 1987) and Partner (January 1988–August 2008) of Blazzard & Hasenauer, P.C. (formerly, Blazzard, Grodd & Hasenauer, P.C.). | | Since June 2012 |
| | | |
Chad A. Earnst (43) Chief Compliance Officer | | Chief Compliance Officer (September 2014-Present) of PGIM Investments LLC; Chief Compliance Officer (September 2014-Present) of the PGIM Funds, Target Funds, Advanced Series Trust, The Prudential Series Fund, Prudential’s Gibraltar Fund, Inc., PGIM Global Short Duration High Yield Income Fund, Inc., PGIM Short Duration High Yield Fund, Inc. and PGIM Jennison MLP Income Fund, Inc.; formerly Assistant Director (March 2010-August 2014) of the Asset Management Unit, Division of Enforcement, US Securities & Exchange Commission; Assistant Regional Director (January 2010-August 2014), Branch Chief (June 2006–December 2009) and Senior Counsel (April 2003-May 2006) of the Miami Regional Office, Division of Enforcement, US Securities & Exchange Commission. | | Since September 2014 |
| | | |
Dino Capasso (44) Deputy Chief Compliance Officer | | Vice President and Deputy Chief Compliance Officer (June 2017-Present) of PGIM Investments LLC; formerly, Senior Vice President and Senior Counsel (January 2016-June 2017), and Vice President and Counsel (February 2012-December 2015) of Pacific Investment Management Company LLC. | | Since March 2018 |
| | | |
Andrew R. French (56) Secretary | | Vice President and Corporate Counsel (since February 2010) of Prudential; formerly Director and Corporate Counsel (2006-2010) of Prudential; Vice President and Assistant Secretary (since January 2007) of PGIM Investments LLC; Vice President and Assistant Secretary (since January 2007) of Prudential Mutual Fund Services LLC. | | Since October 2006 |
Visit our website at pgiminvestments.com
| | | | |
| Fund Officers(a) | | | | |
| | | |
Name, Address and Age Position with Fund | | Principal Occupation(s) During Past Five Years | | Length of Service as Fund Officer |
| | | |
Jonathan D. Shain (60) Assistant Secretary | | Vice President and Corporate Counsel (since August 1998) of Prudential; Vice President and Assistant Secretary (since May 2001) of PGIM Investments LLC; Vice President and Assistant Secretary (since February 2001) of Prudential Mutual Fund Services LLC; formerly Vice President and Assistant Secretary (May 2003-June 2005) of AST Investment Services, Inc. | | Since May 2005 |
| | | |
Claudia DiGiacomo (44) Assistant Secretary | | Vice President and Corporate Counsel (since January 2005) of Prudential; Vice President and Assistant Secretary of PGIM Investments LLC (since December 2005); formerly Associate at Sidley Austin Brown & Wood LLP (1999-2004). | | Since December 2005 |
| | | |
Charles H. Smith (45) Anti-Money Laundering Compliance Officer | | Vice President, Corporate Compliance, Anti-Money Laundering Unit (since January 2015) of Prudential; committee member of the American Council of Life Insurers Anti-Money Laundering and Critical Infrastructure Committee (since January 2016); formerly Global Head of Economic Sanctions Compliance at AIG Property Casualty (February 2007 – December 2014); Assistant Attorney General at the New York State Attorney General’s Office, Division of Public Advocacy. (August 1998 —January 2007). | | Since January 2017 |
| | | |
Brian D. Nee (52) Treasurer and Principal Financial and Accounting Officer | | Vice President and Head of Finance of PGIM Investments LLC (since August 2015) and PGIM Global Partners (since February 2017); formerly, Vice President, Treasurer’s Department of Prudential (September 2007-August 2015). | | Since July 2018 |
| | | |
Peter Parrella (60) Assistant Treasurer | | Vice President (since 2007) and Director (2004-2007) within Prudential Mutual Fund Administration; formerly Tax Manager at SSB Citi Fund Management LLC (1997-2004). | | Since June 2007 |
| | | |
Lana Lomuti (51) Assistant Treasurer | | Vice President (since 2007) and Director (2005-2007), within Prudential Mutual Fund Administration; formerly Assistant Treasurer (December 2007-February 2014) of The Greater China Fund, Inc. | | Since April 2014 |
| | | |
Linda McMullin (57) Assistant Treasurer | | Vice President (since 2011) and Director (2008-2011) within Prudential Mutual Fund Administration. | | Since April 2014 |
| | | |
Kelly A. Coyne (50) Assistant Treasurer | | Director, Investment Operations of Prudential Mutual Fund Services LLC (since 2010). | | Since March 2015 |
(a) Excludes Mr. Parker and Mr. Benjamin, interested Board Members who also serve as President and Vice President, respectively.
Explanatory Notes to Tables:
| ∎ | | Board Members are deemed to be “Interested,” as defined in the 1940 Act, by reason of their affiliation with PGIM Investments LLC and/or an affiliate of PGIM Investments LLC. |
| ∎ | | Unless otherwise noted, the address of all Board Members and Officers is c/o PGIM Investments LLC, 655 Broad Street, Newark, New Jersey 07102-4410. |
| ∎ | | There is no set term of office for Board Members or Officers. The Board Members have adopted a retirement policy, which calls for the retirement of Board Members on December 31 of the year in which they reach the age of 75. |
PGIM Select Real Estate Fund
| ∎ | | “Other Directorships Held” includes only directorships of companies required to register or file reports with the SEC under the 1934 Act (that is, “public companies”) or other investment companies registered under the 1940 Act. |
| ∎ | | “Portfolios Overseen” includes all investment companies managed by PGIM Investments LLC. The investment companies for which PGIM Investments LLC serves as manager include the PGIM Funds, The Prudential Variable Contract Accounts, PGIM ETF Trust, PGIM Short Duration High Yield Fund, Inc., PGIM Global Short Duration High Yield Fund, Inc., The Prudential Series Fund, Prudential’s Gibraltar Fund, Inc. and the Advanced Series Trust. |
Visit our website at pgiminvestments.com
Approval of Advisory Agreements (unaudited)
The Fund’s Board of Trustees
The Board of Trustees (the “Board”) of PGIM Select Real Estate Fund (the “Fund”)1 consists of twelve individuals, nine of whom are not “interested persons” of the Fund, as defined in the Investment Company Act of 1940, as amended (the “1940 Act”) (the “Independent Trustees”). The Board is responsible for the oversight of the Fund and its operations, and performs the various duties imposed on the directors of investment companies by the 1940 Act. The Independent Trustees have retained independent legal counsel to assist them in connection with their duties. The Chair of the Board is an Independent Trustee. The Board has established four standing committees: the Audit Committee, the Nominating and Governance Committee, and two Investment Committees. Each committee is chaired by, and composed of, Independent Trustees.
Annual Approval of the Fund’s Advisory Agreements
As required under the 1940 Act, the Board determines annually whether to renew the Fund’s management agreement with PGIM Investments LLC (“PGIM Investments”) and the Fund’s subadvisory agreement with PGIM, Inc. (“PGIM”) on behalf of its PGIM Real Estate unit. In considering the renewal of the agreements, the Board, including all of the Independent Trustees, met on June 7, 2018 and on June 19-21, 2018 and approved the renewal of the agreements through July 31, 2019, after concluding that the renewal of the agreements was in the best interests of the Fund and its shareholders.
In advance of the meetings, the Board requested and received materials relating to the agreements, and had the opportunity to ask questions and request further information in connection with its consideration. Among other things, the Board considered comparative fee information from PGIM Investments and PGIM. Also, the Board considered comparisons with other mutual funds in relevant Peer Universes and Peer Groups, as is further discussed below.
In approving the agreements, the Board, including the Independent Trustees advised by independent legal counsel, considered the factors it deemed relevant, including the nature, quality and extent of services provided by PGIM Investments and the subadviser, the performance of the Fund, the profitability of PGIM Investments and its affiliates, expenses and fees, and the potential for economies of scale that may be shared with the Fund and its shareholders as the Fund’s assets grow. In their deliberations, the Trustees did not identify any single factor which alone was responsible for the Board’s decision to approve the agreements with respect to the Fund. In connection with its deliberations, the Board considered information provided by PGIM Investments throughout the year at regular Board
| 1 | PGIM Select Real Estate Fund is a series of Prudential Investment Portfolios 9. |
| | |
| PGIM Select Real Estate Fund |
Approval of Advisory Agreements (continued)
meetings, presentations from portfolio managers and other information, as well as information furnished at or in advance of the meetings on June 7, 2018 and on June 19-21, 2018.
The Trustees determined that the overall arrangements between the Fund and PGIM Investments, which serves as the Fund’s investment manager pursuant to a management agreement, and between PGIM Investments and PGIM, which, through its PGIM Real Estate unit, serves as the Fund’s subadviser pursuant to the terms of a subadvisory agreement with PGIM Investments, are in the best interests of the Fund and its shareholders in light of the services performed, fees charged and such other matters as the Trustees considered relevant in the exercise of their business judgment.
The material factors and conclusions that formed the basis for the Trustees’ reaching their determinations to approve the continuance of the agreements are separately discussed below.
Nature, Quality and Extent of Services
The Board received and considered information regarding the nature, quality and extent of services provided to the Fund by PGIM Investments and PGIM Real Estate. The Board considered the services provided by PGIM Investments, including but not limited to the oversight of the subadviser for the Fund, as well as the provision of fund recordkeeping, compliance, and other services to the Fund. With respect to PGIM Investments’ oversight of the subadviser, the Board noted that PGIM Investments’ Strategic Investment Research Group (“SIRG”), which is a business unit of PGIM Investments, is responsible for monitoring and reporting to PGIM Investments’ senior management on the performance and operations of the subadviser. The Board also considered that PGIM Investments pays the salaries of all of the officers and interested Trustees of the Fund who are part of Fund management. The Board also considered the investment subadvisory services provided by PGIM Real Estate, including investment research and security selection, as well as adherence to the Fund’s investment restrictions and compliance with applicable Fund policies and procedures. The Board considered PGIM Investments’ evaluation of the subadviser, as well as PGIM Investments’ recommendation, based on its review of the subadviser, to renew the subadvisory agreement.
The Board considered the qualifications, backgrounds and responsibilities of PGIM Investments’ senior management responsible for the oversight of the Fund and PGIM Real Estate, and also considered the qualifications, backgrounds and responsibilities of PGIM Real Estate’s portfolio managers who are responsible for the day-to-day management of the Fund’s portfolio. The Board was provided with information pertaining to PGIM Investments’, PGIM Real Estate’s, and PGIM’s organizational structure, senior management, investment operations, and other relevant information pertaining to PGIM Investments, PGIM Real Estate, and PGIM. The Board also noted that it received favorable compliance reports from
| | |
| Visit our website at pgiminvestments.com | | |
the Fund’s Chief Compliance Officer (“CCO”) as to PGIM Investments, PGIM Real Estate, and PGIM. The Board noted that PGIM Real Estate is affiliated with PGIM Investments.
The Board concluded that it was satisfied with the nature, extent and quality of the investment management services provided by PGIM Investments and the subadvisory services provided to the Fund by PGIM Real Estate, and that there was a reasonable basis on which to conclude that the Fund benefits from the services provided by PGIM Investments and PGIM Real Estate under the management and subadvisory agreements.
Costs of Services and Profits Realized by PGIM Investments
The Board was provided with information on the profitability of PGIM Investments and its affiliates in serving as the Fund’s investment manager. The Board discussed with PGIM Investments the methodology utilized in assembling the information regarding profitability and considered its reasonableness. The Board recognized that it is difficult to make comparisons of profitability from fund management contracts because comparative information is not generally publicly available and is affected by numerous factors, including the structure of the particular adviser, the types of funds it manages, its business mix, numerous assumptions regarding allocations and the adviser’s capital structure and cost of capital. However, the Board considered that the cost of services provided by PGIM Investments to the Fund during the year ended December 31, 2017 exceeded the management fees paid by the Fund, resulting in an operating loss to PGIM Investments. Taking these factors into account, the Board concluded that the profitability of PGIM Investments and its affiliates in relation to the services rendered was not unreasonable.
Economies of Scale
The Board received and discussed information concerning economies of scale that PGIM Investments may realize as the Fund’s assets grow beyond current levels. The Board noted that the management fee schedule for the Fund includes breakpoints, which have the effect of decreasing the fee rate as assets increase. During the course of time, the Board has considered information regarding the launch date of the Fund, the management fees of the Fund compared to those of similarly managed funds and PGIM Investments’ investment in the Fund over time. The Board noted that economies of scale, can be shared with the Fund in other ways, including low management fees from inception, additional technological and personnel investments to enhance shareholder services, and maintaining existing expense structures in the face of a rising cost environment. The Board considered PGIM Investments’ assertion that it continually evaluates the management fee schedule of the Fund and the potential to share economies of scale through breakpoints or fee waivers as asset levels increase.
| | |
| PGIM Select Real Estate Fund |
Approval of Advisory Agreements (continued)
The Board recognized the inherent limitations of any analysis of economies of scale, stemming largely from the Board’s understanding that most of PGIM Investments’ costs are not specific to individual funds, but rather are incurred across a variety of products and services.
Other Benefits to PGIM Investments and PGIM Real Estate
The Board considered potential ancillary benefits that might be received by PGIM Investments, PGIM Real Estate and their affiliates as a result of their relationship with the Fund. The Board concluded that potential benefits to be derived by PGIM Investments included transfer agency fees received by the Fund’s transfer agent (which is affiliated with PGIM Investments), and benefits to its reputation as well as other intangible benefits resulting from PGIM Investments’ association with the Fund. The Board concluded that the potential benefits to be derived by PGIM Real Estate included its ability to use soft dollar credits, as well as the potential benefits consistent with those generally resulting from an increase in assets under management, specifically, potential access to additional research resources and benefits to its reputation. The Board concluded that the benefits derived by PGIM Investments and PGIM Real Estate were consistent with the types of benefits generally derived by investment managers and subadvisers to mutual funds.
Performance of the Fund / Fees and Expenses
The Board considered certain additional specific factors and made related conclusions relating to the historical performance of the Fund for the one- and three-year periods ended December 31, 2017. The Board considered that the Fund commenced investment operations on August 1, 2014 and that longer-term performance was not yet available.
The Board also considered the Fund’s actual management fee, as well as the Fund’s net total expense ratio, for the fiscal year ended October 31, 2017. The Board considered the management fee for the Fund as compared to the management fee charged by PGIM Investments to other funds and the fee charged by other advisers to comparable mutual funds in a Peer Group. The actual management fee represents the fee rate actually paid by Fund shareholders and includes any fee waivers or reimbursements. The net total expense ratio for the Fund represents the actual expense ratio incurred by Fund shareholders.
The mutual funds included in the Peer Universe, which was used to consider performance, and the Peer Group, which was used to consider expenses and fees, were objectively determined by Broadridge, an independent provider of mutual fund data. In certain circumstances, PGIM Investments also may have provided supplemental Peer Universe or Peer Group information for reasons addressed with the Board. The comparisons placed the Fund in various quartiles, with the first quartile being the best 25% of the mutual funds (for performance, the best performing mutual funds and, for expenses, the lowest cost mutual funds).
| | |
| Visit our website at pgiminvestments.com | | |
The section below summarizes key factors considered by the Board and the Board’s conclusions regarding the Fund’s performance, fees and overall expenses. The table sets forth gross performance comparisons (which do not reflect the impact on performance of fund expenses, or any subsidies, expense caps or waivers that may be applicable) with the Peer Universe, actual management fees with the Peer Group (which reflect the impact of any subsidies or fee waivers), and net total expenses with the Peer Group, each of which were key factors considered by the Board.
| | | | | | | | |
Gross
Performance | | 1 Year | | 3 Years | | 5 Years | | 10 Years |
| | 3rd Quartile | | 1st Quartile | | N/A | | N/A |
| Actual Management Fees: 1st Quartile |
| Net Total Expenses: 1st Quartile |
| | • | | The Board noted that the Fund outperformed its benchmark index over all periods. |
| | • | | The Board and PGIM Investments agreed to retain the Fund’s existing contractual expense cap, which (exclusive of certain fees and expenses) caps the Fund’s annual operating expenses at 1.30% for Class A shares, 2.05% for Class C shares, 1.05% for Class R6 shares, and 1.05% for Class Z shares through February 28, 2019. |
| | • | | The Board concluded that in light of the above, it would be in the best interests of the Fund and its shareholders to renew the agreements. |
| | • | | The Board concluded that the management fees (including subadvisory fees) and total expenses were reasonable in light of the services provided. |
* * *
After full consideration of these factors, the Board concluded that the approval of the agreements was in the best interests of the Fund and its shareholders.
| | |
| PGIM Select Real Estate Fund |
| | | | |
| ∎ MAIL | | ∎ TELEPHONE | | ∎ WEBSITE |
655 Broad Street
Newark, NJ 07102 | | (800) 225-1852 | | www.pgiminvestments.com |
|
| PROXY VOTING |
| The Board of Trustees of the Fund has delegated to the Fund’s subadviser the responsibility for voting any proxies and maintaining proxy recordkeeping with respect to the Fund. A description of these proxy voting policies and procedures is available without charge, upon request, by calling (800) 225-1852. Information regarding how the Fund voted proxies relating to portfolio securities during the most recent 12-month period ended June 30 is available on the Fund’s website and on the Securities and Exchange Commission’s website. |
|
| TRUSTEES |
| Ellen S. Alberding • Kevin J. Bannon • Scott E. Benjamin • Linda W. Bynoe • Barry H. Evans • Keith F. Hartstein • Laurie Simon Hodrick • Michael S. Hyland • Stuart S. Parker • Richard A. Redeker • Brian K. Reid • Grace C. Torres |
|
| OFFICERS |
| Stuart S. Parker, President • Scott E. Benjamin, Vice President • Brian D. Nee, Treasurer and Principal Financial and Accounting Officer • Raymond A. O’Hara, Chief Legal Officer • Chad A. Earnst, Chief Compliance Officer • Andrew R. French, Secretary • Dino Capasso, Vice President and Deputy Chief Compliance Officer • Charles H. Smith, Anti-Money Laundering Compliance Officer • Jonathan D. Shain, Assistant Secretary • Claudia DiGiacomo, Assistant Secretary • Peter Parrella, Assistant Treasurer • Lana Lomuti, Assistant Treasurer • Linda McMullin, Assistant Treasurer • Kelly A. Coyne, Assistant Treasurer |
| | | | |
| MANAGER | | PGIM Investments LLC | | 655 Broad Street
Newark, NJ 07102 |
|
| SUBADVISER | | PGIM Real Estate | | 7 Giralda Farms
Madison, NJ 07940 |
|
| DISTRIBUTOR | | Prudential Investment
Management Services LLC | | 655 Broad Street
Newark, NJ 07102 |
|
| CUSTODIAN | | The Bank of New York Mellon | | 225 Liberty Street
New York, NY 10286 |
|
| TRANSFER AGENT | | Prudential Mutual Fund
Services LLC | | PO Box 9658
Providence, RI 02940 |
|
| INDEPENDENT REGISTERED PUBLIC ACCOUNTING FIRM | | KPMG LLP | | 345 Park Avenue New York, NY 10154 |
|
| FUND COUNSEL | | Willkie Farr & Gallagher LLP | | 787 Seventh Avenue
New York, NY 10019 |
|
|
| An investor should consider the investment objectives, risks, charges, and expenses of the Fund carefully before investing. The prospectus and summary prospectus contain this and other information about the Fund. An investor may obtain a prospectus and summary prospectus by visiting our website at www.pgiminvestments.com or by calling (800) 225-1852. The prospectus and summary prospectus should be read carefully before investing. |
|
| E-DELIVERY |
| To receive your mutual fund documents online, go to www.pgiminvestments.com/edelivery and enroll. Instead of receiving printed documents by mail, you will receive notification via email when new materials are available. You can cancel your enrollment or change your email address at any time by visiting the website address above. |
|
| SHAREHOLDER COMMUNICATIONS WITH TRUSTEES |
| Shareholders can communicate directly with the Board of Trustees by writing to the Chair of the Board, PGIM Select Real Estate Fund, PGIM Investments, Attn: Board of Trustees, 655 Broad Street, Newark, NJ 07102. Shareholders can communicate directly with an individual Director by writing to the same address. Communications are not screened before being delivered to the addressee. |
|
| AVAILABILITY OF PORTFOLIO SCHEDULE |
| The Fund files its complete schedule of portfolio holdings with the Securities and Exchange Commission for the first and third quarters of each fiscal year on Form N-Q. The Fund’s Forms N-Q are available on the Commission’s website at www.sec.gov. The Fund’s schedule of portfolio holdings is also available on the Fund’s website as of the end of each month no sooner than 15 days after the end of the month. |
|
| The Fund’s Statement of Additional Information contains additional information about the Fund’s Trustees and is available without charge, upon request, by calling (800) 225-1852. |
Mutual Funds:
| | | | |
| ARE NOT INSURED BY THE FDIC OR ANY FEDERAL GOVERNMENT AGENCY | | MAY LOSE VALUE | | ARE NOT A DEPOSIT OF OR GUARANTEED BY ANY BANK OR ANY BANK AFFILIATE |
PGIM SELECT REAL ESTATE FUND
| | | | | | | | |
| SHARE CLASS | | A | | C | | Z | | R6* |
| NASDAQ | | SREAX | | SRECX | | SREZX | | SREQX |
| CUSIP | | 74441J811 | | 74441J795 | | 74441J779 | | 74441J787 |
*Formerly known as Class Q shares.
MF223E

PGIM INTERNATIONAL BOND FUND
(Formerly known as Prudential International Bond Fund)
ANNUAL REPORT
OCTOBER 31, 2018
COMING SOON: PAPERLESS SHAREHOLDER REPORTS
Beginning on January 1, 2021, as permitted by regulations adopted by the Securities and Exchange Commission, paper copies of the Fund’s annual and semi-annual shareholder reports will no longer be sent by mail, unless you specifically request paper copies of the reports. Instead, the reports will be made available on the Fund’s website (www.pgiminvestments.com), and you will be notified by mail each time a report is posted and provided with a website link to access the report.
If you already elected to receive shareholder reports electronically, you will not be affected by this change and you need not take any action. You may elect to receive shareholder reports and other communications from the Fund electronically anytime by contacting your financial intermediary (such as a broker-dealer or bank) or, if you are a direct investor, by calling 1-800-225-1852 or by sending an e-mail request to PGIM Investments at shareholderreports@pgim.com.
Beginning on January 1, 2019, you may elect to receive all future reports in paper free of charge. If you invest through a financial intermediary, you can contact your financial intermediary or follow instructions included with this notice to elect to continue to receive paper copies of your shareholder reports. If you invest directly with the Fund, you can call 1-800-225-1852 or send an email request to shareholderreports@pgim.com to let the Fund know you wish to continue receiving paper copies of your shareholder reports. Your election to receive reports in paper will apply to all funds held in your account if you invest through your financial intermediary or all funds held with the fund complex if you invest directly with the Fund.

To enroll in e-delivery, go to pgiminvestments.com/edelivery
|
| Objective: Total return, made up of current income and capital appreciation |
Highlights (unaudited)
| • | | Strong sector and issuer selection of sovereign debt in developed markets, debt of European peripheral issuers, high yield corporates, and high-quality structured products added to performance. Positioning in emerging market sovereign debt hurt performance. |
| • | | In developed market rates, a yield curve flattener in the US and long-duration positioning in Norwegian rates limited results. |
| • | | Currency positioning detracted from performance. Overweights in the Indian rupee, Brazilian real, Russian ruble, and Indonesian rupiah were the largest detractors. |
This report is not authorized for distribution to prospective investors unless preceded or accompanied by a current prospectus.
The views expressed in this report and information about the Fund’s portfolio holdings are for the period covered by this report and are subject to change thereafter.
Mutual funds are distributed by Prudential Investment Management Services LLC (PIMS), member SIPC. PGIM Fixed Income is a unit of PGIM, Inc. (PGIM), a registered investment adviser. PIMS and PGIM are Prudential Financial companies. © 2018 Prudential Financial, Inc. and its related entities. PGIM and the PGIM logo are service marks of Prudential Financial, Inc. and its related entities, registered in many jurisdictions worldwide.
| | |
| 2 | | Visit our website at pgiminvestments.com |
PGIM FUNDS — UPDATE
The Board of Directors/Trustees for the Fund has approved the implementation of an automatic conversion feature for Class C shares, effective as of April 1, 2019. To reflect these changes, effective April 1, 2019, the section of the Fund’s Prospectus entitled “How to Buy, Sell and Exchange Fund Shares—How to Exchange Your Shares—Frequent Purchases and Redemptions of Fund Shares” is restated to read as follows:
This supplement should be read in conjunction with your Summary Prospectus, Statutory Prospectus and Statement of Additional Information, be retained for future reference and is in addition to any existing Fund supplements.
| | 1. | In each Fund’s Statutory Prospectus, the following is added at the end of the section entitled “Fund Distributions And Tax Issues—If You Sell or Exchange Your Shares”: |
Automatic Conversion of Class C Shares
The conversion of Class C shares into Class A shares—which happens automatically approximately 10 years after purchase—is not a taxable event for federal income tax purposes. For more information about the automatic conversion of Class C shares, see Class C Shares Automatically Convert to Class A Shares in How to Buy, Sell and Exchange Fund Shares.
| | 2. | In each Fund’s Statutory Prospectus, the following sentence is added at the end of the section entitled “How to Buy, Sell and Exchange Shares—Closure of Certain Share Classes to New Group Retirement Plans”: |
Shareholders owning Class C shares may continue to hold their Class C shares until the shares automatically convert to Class A shares under the conversion schedule, or until the shareholder redeems their Class C shares.
| | 3. | In each Fund’s Statutory Prospectus, the following disclosure is added immediately following the section entitled “How to Buy, Sell and Exchange Shares—How to Buy Shares—Class B Shares Automatically Convert to Class A Shares”: |
Class C Shares Automatically Convert to Class A Shares
Starting on or about April 1, 2019 (the “Effective Date”), Class C shares will be eligible for automatic conversion into Class A shares on a monthly basis approximately ten years after the original date of purchase (the “Conversion Date”). Conversion will take place based on the relative NAV of the two classes, without the imposition of any sales load, fee or other charge. All such automatic conversions of Class C shares will constitute tax-free exchanges for federal income tax purposes.
For shareholders investing in Class C shares through retirement plans or omnibus accounts, and in certain other instances, the Fund and its agents may not have
| | | | |
| PGIM International Bond Fund | | | 3 | |
transparency into how long a shareholder has held Class C shares for purposes of determining whether such Class C shares are eligible for automatic conversion into Class A shares, and the relevant financial intermediary may not have the ability to track purchases in order to credit individual shareholders’ holding periods. In these circumstances, the Fund will not be able to automatically convert Class C shares into Class A shares as described above. In order to determine eligibility for conversion in these circumstances, it is the responsibility of the financial intermediary to notify the Fund that the shareholder is eligible for the conversion of Class C shares to Class A shares, and the financial intermediary may be required to maintain and provide the Fund with records that substantiate the holding period of Class C shares. It is the financial intermediary’s (and not the Fund’s) responsibility to keep records of transactions made in accounts it holds and to ensure that the shareholder is credited with the proper holding period based on such records or those provided to the financial intermediary by the shareholder. Please consult with your financial intermediary for the applicability of this conversion feature to your shares.
A financial intermediary may sponsor and/or control accounts, programs or platforms that impose a different conversion schedule or different eligibility requirements for the exchange of Class C shares for Class A shares (see Appendix A: Waivers and Discounts Available From Certain Financial Intermediaries of the Prospectus). Please consult with your financial intermediary if you have any questions regarding your shares’ conversion from Class C shares to Class A shares.
| | 4. | In Part II of each Fund’s Statement of Additional Information, the following disclosure is added immediately following the section entitled “Purchase, Redemption and Pricing of Fund Shares—Share Classes—Automatic Conversion of Class B Shares”: |
AUTOMATIC CONVERSION OF CLASS C SHARES. Starting on or about April 1, 2019 (the “Effective Date”), Class C shares will be eligible for automatic conversion into Class A shares on a monthly basis approximately ten years after the original date of purchase (the “Conversion Date”). Conversion will take place based on the relative NAV of the two classes, without the imposition of any sales load, fee or other charge. Class C shares of a Fund acquired through automatic reinvestment of dividends or distributions will convert to Class A shares of the Fund on the Conversion Date pro rata with the converting Class C shares of the Fund that were not acquired through reinvestment of dividends or distributions. All such automatic conversions of Class C shares will constitute tax-free exchanges for federal income tax purposes.
For shareholders investing in Class C shares through retirement plans or omnibus accounts, and in certain other instances, the Fund and its agents may not have transparency into how long a shareholder has held Class C shares for purposes of determining whether such Class C shares are eligible for automatic conversion into Class A shares, and the relevant financial intermediary may not have the ability to track purchases in order to credit individual shareholders’ holding periods. In these circumstances, the
| | |
| 4 | | Visit our website at pgiminvestments.com |
Fund will not be able to automatically convert Class C shares into Class A shares as described above. In order to determine eligibility for conversion in these circumstances, it is the responsibility of the financial intermediary to notify the Fund that the shareholder is eligible for the conversion of Class C shares to Class A shares, and the financial intermediary may be required to maintain and provide the Fund with records that substantiate the holding period of Class C shares. It is the financial intermediary’s (and not the Fund’s) responsibility to keep records of transactions made in accounts it holds and to ensure that the shareholder is credited with the proper holding period based on such records or those provided to the financial intermediary by the shareholder. Please consult with your financial intermediary for the applicability of this conversion feature to your shares.
Class C shares were generally closed to investments by new group retirement plans effective June 1, 2018. Group retirement plans (and their successor, related and affiliated plans) that have Class C shares of the Fund available to participants on or before the Effective Date may continue to open accounts for new participants in such share class and purchase additional shares in existing participant accounts.
The Fund has no responsibility for monitoring or implementing a financial intermediary’s process for determining whether a shareholder meets the required holding period for conversion. A financial intermediary may sponsor and/or control accounts, programs or platforms that impose a different conversion schedule or different eligibility requirements for the exchange of Class C shares for Class A shares, as set forth on Appendix A: Waivers and Discounts Available From Certain Financial Intermediaries of the Prospectus. In these cases, Class C shareholders may have their shares exchanged for Class A shares under the policies of the financial intermediary. Financial intermediaries will be responsible for making such exchanges in those circumstances. Please consult with your financial intermediary if you have any questions regarding your shares’ conversion from Class C shares to Class A shares.
LR1094
- Not part of the Annual Report -
| | | | |
| PGIM International Bond Fund | | | 5 | |
Table of Contents
| | |
| 6 | | Visit our website at pgiminvestments.com |
Letter from the President

Dear Shareholder:
We hope you find the annual report for PGIM International Bond Fund informative and useful. The report covers performance for the 12-month period that ended October 31, 2018.
We have important information to share with you. Effective June 11, 2018, Prudential Mutual Funds were renamed PGIM Funds. This renaming is part of our ongoing effort to further build our reputation and establish our global brand, which began when our firm adopted PGIM Investments as its name in April 2017. Please note that only the Fund’s name has changed. Your Fund’s management and operation, along with its symbols, remained the same.*
During the reporting period, the global economy continued to grow, and central banks gradually tightened monetary policy. In the US, the economy expanded and employment increased. In September, the Federal Reserve hiked interest rates for the eighth time since 2015, based on confidence in the economy.
Equity returns on the whole were strong, due to optimistic earnings expectations and investor sentiment. Global equities, including emerging markets, generally posted positive returns. However, they trailed the performance of US equities, which rose on higher corporate profits, new regulatory policies, and tax reform benefits. Volatility spiked briefly early in the period on inflation concerns, rising interest rates, and a potential global trade war, and again late in the period on worries that profit growth might slow in 2019.
The overall bond market declined modestly during the period, as measured by the Bloomberg Barclays US Aggregate Bond Index. The best performance came from higher-yielding, economically sensitive sectors, such as high yield bonds and bank loans, which posted small gains. US investment-grade corporate bonds and US Treasury bonds both finished the period with negative returns. A major trend during the period was the flattening of the US Treasury yield curve, which increased the yield on fixed income investments with shorter maturities and made them more attractive to investors.
Regarding your investments with PGIM, we believe it is important to maintain a diversified portfolio of funds consistent with your tolerance for risk, time horizon, and financial goals. Your financial advisor can help you create a diversified investment plan that may include funds covering all the basic asset classes and that reflects your personal investor profile and risk tolerance. However, diversification and asset allocation strategies do not assure a profit or protect against loss in declining markets.
At PGIM Investments, we consider it a great privilege and responsibility to help investors participate in opportunities across global markets while meeting their toughest investment challenges. PGIM is a top-10 global investment manager with more than $1 trillion in assets under management. This investment expertise allows us to deliver actively managed funds and strategies to meet the needs of investors around the globe.
Thank you for choosing our family of funds.
Sincerely,

Stuart S. Parker, President
PGIM International Bond Fund
December 14, 2018
*The Prudential Day One Funds did not change their names.
| | | | |
| PGIM International Bond Fund | | | 7 | |
Your Fund’s Performance (unaudited)
Performance data quoted represents past performance. Past performance does not guarantee future results. The investment return and principal value of an investment will fluctuate, so that an investor’s shares, when redeemed, may be worth more or less than their original cost. Current performance may be lower or higher than the past performance data quoted. An investor may obtain performance data as of the most recent month-end by visiting our website at www.pgiminvestments.com or by calling (800) 225-1852.
| | | | | | |
| | | Average Annual Total Returns as of 10/31/18 (with sales charges) | |
| | | One Year (%) | | Since Inception (%) | |
| Class A | | –4.02 | | | 1.13 (12/14/16) | |
| Class C | | –1.32 | | | 2.82 (12/14/16) | |
| Class Z | | 0.75 | | | 3.90 (12/14/16) | |
| Class R6* | | 0.75 | | | 3.89 (12/14/16) | |
| Bloomberg Barclays Global Aggregate ex USD (USD Hedged) Index | | | | |
| | 1.98 | | | 2.30 | |
| Lipper International Income Funds Average | | | | | | |
| | | –2.23 | | | 2.34 | |
| | | | | | |
| | | Average Annual Total Returns as of 10/31/18
(without sales charges) | |
| | | One Year (%) | | Since Inception (%) | |
| Class A | | 0.50 | | | 3.64 (12/14/16) | |
| Class C | | –0.34 | | | 2.82 (12/14/16) | |
| Class Z | | 0.75 | | | 3.90 (12/14/16) | |
| Class R6* | | 0.75 | | | 3.89 (12/14/16) | |
| Bloomberg Barclays Global Aggregate ex USD (USD Hedged) Index | | | | |
| | 1.98 | | | 2.30 | |
| Lipper International Income Funds Average | | | | | | |
| | | –2.23 | | | 2.34 | |
| | |
| 8 | | Visit our website at pgiminvestments.com |
Growth of a $10,000 Investment (unaudited)

The graph compares a $10,000 investment in the Fund’s Class Z shares with a similar investment in the Bloomberg Barclays Global Aggregate ex USD (USD Hedged) Index by portraying the initial account values at the commencement of operations for Class Z shares (December 14, 2016) and the account values at the end of the current fiscal year (October 31, 2018) as measured on a quarterly basis. For purposes of the graph, and unless otherwise indicated, it has been assumed that (a) all recurring fees (including management fees) were deducted; and (b) all dividends and distributions were reinvested. The line graph provides information for Class Z shares only. As indicated in the tables provided earlier, performance for other share classes will vary due to the differing charges and expenses applicable to each share class (as indicated in the following paragraphs). Without waiver of fees and/or expense reimbursements, if any, the returns would have been lower.
Past performance does not predict future performance. Total returns and the ending account values in the graph include changes in share price and reinvestment of dividends and capital gains distributions in a hypothetical investment for the periods shown. The Fund’s total returns do not reflect the deduction of income taxes on an individual’s investment. Taxes may reduce your actual investment returns on income or gains paid by the Fund or any gains you may realize if you sell your shares.
Source: PGIM Investments LLC and Lipper Inc.
*Formerly known as Class Q shares.
Since Inception returns are provided since the fund has less than 10 fiscal years of returns. Since Inception returns for the Index and the Lipper Average are measured from the closest month-end to the Fund’s inception date.
| | | | |
| PGIM International Bond Fund | | | 9 | |
Your Fund’s Performance (continued)
The returns in the tables do not reflect the deduction of taxes that a shareholder would pay on Fund distributions or following the redemption of Fund shares. The average annual total returns take into account applicable sales charges, which are described for each share class in the table below.
| | | | | | | | |
| | | Class A | | Class C | | Class Z | | Class R6* |
| Maximum initial sales charge | | 4.50% of the public offering
price | | None | | None | | None |
| Contingent deferred sales charge (CDSC) (as a percentage of the lower of original purchase price or net asset value at redemption) | | 1.00% on sales of $1 million or more made within 12 months of purchase | | 1.00% on sales made within 12 months of purchase | | None | | None |
| Annual distribution and service (12b-1) fees (shown as a percentage of average daily net assets) | | 0.25%
| | 1.00% | | None | | None |
*Formerly known as Class Q shares.
Benchmark Definitions
Bloomberg Barclays Global Aggregate ex USD (USD Hedged) Index—Provides a broad-based measure of the global investment-grade fixed income markets. The Index includes government, government agency, corporate, and securitized non-US investment-grade fixed income investments, all issued in currencies other than the US dollar and with maturities of more than one year. The Index is US dollar hedged.
Lipper International Income Funds Average—Funds in the Lipper International Income Funds Average invest primarily in non-US dollar and US dollar debt securities of issuers located in at least three countries, excluding the US, except in periods of market weakness.
Investors cannot invest directly in an index or average. The returns for the Index would be lower if they included the effects of sales charges, operating expenses of a mutual fund, or taxes. Returns for the Lipper Average reflect the deduction of operating expenses of a mutual fund, but not sales charges or taxes.
| | |
| 10 | | Visit our website at pgiminvestments.com |
| | | | | | |
| Distributions and Yields as of 10/31/18 | | | | | | |
| | Total Distributions
Paid for
12 Months ($) | | SEC 30-Day
Subsidized
Yield* (%) | | SEC 30-Day
Unsubsidized
Yield** (%) |
| Class A | | 0.26 | | 1.34 | | –40.47 |
| Class C | | 0.19 | | 0.55 | | –177.23 |
| Class Z | | 0.29 | | 1.65 | | –27.88 |
| Class R6*** | | 0.29 | | 1.65 | | –0.09 |
*SEC 30-Day Subsidized Yield (%)—A standardized yield calculation created by the Securities and Exchange Commission, it reflects the income earned during a 30-day period, after the deduction of the Fund’s net expenses (net of any expense waivers or reimbursements).
**SEC 30-Day Unsubsidized Yield (%)—A standardized yield calculation created by the Securities and Exchange Commission, it reflects the income earned during a 30-day period, after the deduction of the Fund’s gross expenses. The investor experience is represented by the SEC 30-Day Subsidized Yield.
***Formerly known as Class Q shares.
| | | | |
| Credit Quality expressed as a percentage of total investments as of 10/31/18 (%) | | | |
| AAA | | | 15.4 | |
| AA | | | 10.3 | |
| A | | | 15.4 | |
| BBB | | | 27.5 | |
| BB | | | 14.6 | |
| B | | | 3.3 | |
| Not Rated | | | 2.8 | |
| Cash/Cash Equivalents | | | 10.6 | |
| Total Investments | | | 100.0 | |
Source: PGIM Fixed Income
Credit ratings reflect the highest rating assigned by a nationally recognized statistical rating organization (NRSRO) such as Moody’s Investors Service, Inc. (Moody’s), S&P Global Ratings (S&P), or Fitch, Inc. (Fitch). Credit ratings reflect the common nomenclature used by both S&P and Fitch. Where applicable, ratings are converted to the comparable S&P/Fitch rating tier nomenclature. These rating agencies are independent and are widely used. The Not Rated category consists of securities that have not been rated by an NRSRO. Credit ratings are subject to change. Values may not sum to 100.0% due to rounding.
| | | | |
| PGIM International Bond Fund | | | 11 | |
Strategy and Performance Overview (unaudited)
How did the Fund perform?
The PGIM International Bond Fund’s Class Z shares returned 0.75% in the 12-month reporting period that ended October 31, 2018, underperforming the 1.98% return of the Bloomberg Barclays Global Aggregate ex USD (USD Hedged) Index (the Index) and outperforming the –2.23% return of the Lipper International Income Funds Average.
What were market conditions?
| • | | At the beginning of the reporting period, the newly passed US tax law package was expected to continue to pressure future budget deficits, which would heighten the need for international deficit financing via increased Treasury issuance. Some thought that this could offset the positive effects of potential regulatory reform and pause the widening in long-dated swap spreads. In Europe, market expectations of diminished asset purchases by the European Central Bank (ECB) improved access to lending channels, and slightly larger bank balance sheets were thought to contribute to higher euro rates, especially in Germany. |
| • | | Long-term interest rates in developed markets continued their ascent in the first quarter of 2018 amid further signs of synchronized global growth and the expected effects of US fiscal stimulus. While the increase in rates was notable for its breadth, the scale of the sell-off created numerous opportunities in developed markets as the second quarter got underway. In the US, yields rose across the curve on hawkish Federal Reserve (Fed) rhetoric, anticipated fiscal stimulus from the recently passed tax law and budget deals, and increased Treasury supply, particularly at the front (short-term) end of the yield curve. In Europe, the ECB’s continued quantitative easing (QE) asset purchases meant there would be zero net issuance. That said, the ECB tapered its monthly QE purchases from $60 billion to $30 billion in the first quarter. Many expected it could have announced a conclusion to the purchases in September 2018, albeit with reinvestments likely to continue. PGIM Fixed Income believes the ECB’s first rate hike could emerge by the second quarter of 2019. |
| • | | In the second quarter of 2018, US rates diverged from other developed-market interest rates. With inflation on target, unemployment down, and the Fed continuing its cautious rate-hiking cycle, US long-term yields finished the quarter relatively unchanged. In contrast, the ECB emphasized downside risks in the economy, primarily stemming from trade, indicating the likely need for low rates through the summer of 2019. Similarly, the Bank of Japan (BoJ) signaled easy policy for the long haul as it delayed and lowered its expected path for rising inflation. In line with the central banks’ reading, long-term rates in Japan and Europe ended the second quarter at lows for the year. In China, rates rallied substantially, with yields falling to three-year lows as its central bank eased policy in an effort to support growth. |
| | |
| 12 | | Visit our website at pgiminvestments.com |
| • | | In the third quarter and October 2018, while the markets were volatile, the underlying causes were more or less constant with minor variations. After a decade of balance sheet expansion, the G3 (US, Japan, and eurozone) central banks are finally—at least in aggregate—turning off the liquidity spigot. The Fed is in the lead, hiking rates and implementing its roll-off of securities from its balance sheet at an accelerating pace. The ECB is in the final months of its asset-purchase program, which undoubtedly will be followed by rising anxiety surrounding the timing and pace of eventual rate hikes, in PGIM Fixed Income’s view. Meanwhile, the BoJ is sending mixed messages. Realizing it is taking longer than initially expected to hit its 2% inflation target, the BoJ is trying to improve its long-term policy effectiveness. It has taken steps, such as reducing its amounts of bond purchases and widening its target range for the 10-year Japanese government bond (JGB) yield, with the intent of reducing its stranglehold on the market and steepening the yield curve. These policy changes have tipped the scales, switching the G3 central bank balance sheets from aggressive growth to a path of stasis. The switch from “net buy” to “net hold” means the market’s primary source of steady capital injections over the last decade is more or less gone, leaving open markets to adjust to supply and demand on their own. |
What worked?
| • | | During the reporting period, the Fund’s sector allocation emphasized global spread sectors rather than government bond sectors. |
| • | | Strong sector and issuer selection of sovereign debt in developed markets, high yield corporates, and high-quality structured products added to performance. |
| • | | Yield curve and duration positioning helped performance. In developed market rates, a yield curve flattener positioning in the euro was the largest contributor. In emerging markets, long-duration positioning in Brazilian rates was a strong contributor. |
| • | | Although overall currency positioning hurt performance, underweights in the Chilean peso, Chinese yuan, and Swiss franc helped offset some of the losses. |
What didn’t work?
| • | | Positioning in emerging market sovereign debt negatively impacted performance. |
| • | | In developed market rates, a yield curve flattener in the US and long-duration positioning in Norwegian rates limited results. |
| • | | Currency positioning hurt performance. Overweights in the Indian rupee, Brazilian real, Russian ruble, and Indonesian rupiah were the largest detractors. |
Did the Fund hold derivatives, and how did they affect performance
| • | | The Fund used interest rate futures and swaps to implement its investment strategy as well as to help manage duration and yield curve exposure. The use of interest rate futures and swaps had a positive impact on the Fund’s performance. |
| | | | |
| PGIM International Bond Fund | | | 13 | |
Strategy and Performance Overview (continued)
| • | | To implement most currency strategies, the Fund employed foreign exchange derivatives, which negatively impacted performance. |
Current outlook
| • | | As of the end of the period, PGIM Fixed Income maintained its positive view of fundamentals in the credit sectors, and the Fund held positions in spread sectors including high yield, emerging market (EM), and structured product sectors such as collateralized loan obligations (CLOs), non-agency mortgage-backed securities, and asset-backed securities (ABS). |
| • | | The Fund ended the period with an underweight in investment-grade corporates and overweight debt of European peripheral countries as well as a select group of emerging market issuers (mostly sovereign debt). Relative to its benchmark, the Fund held an underweight in the Swiss Franc and the euro while maintaining an overweight in the US dollar. The Fund maintained a select set of small underweights and overweights within emerging market and “commodity” currencies. Examples include overweights in the Peruvian nuevo sol, Thai baht, and Indian rupee, while taking underweights in the Chinese yuan, Hungarian forint, and South Africa rand. |
| • | | In investment-grade corporates, PGIM Fixed Income continues to favor higher-quality financials and electric utilities over industrials that are subject to event risk. Within industrials, the Fund is focusing on select issuers where an “event” has passed as higher-quality corporates continue to lever up and merger-and-acquisition (M&A) activity remains a concern. |
| • | | A combination of solid fundamentals (strong earnings and low defaults) and favorable technicals (limited net supply and persistent institutional demand from Asia) has led PGIM Fixed Income to have a modestly positive view on US high yield in the near term. However, concerns over current valuations, risk appetite on recent lower-quality M&A transactions that is reminiscent of 2007, as well as broader concerns about trade wars and the timing of the next recession have prompted PGIM Fixed Income to take a cautious view longer term. |
| • | | Within commercial mortgage-backed securities (CMBS), PGIM Fixed Income continues to find value in high-quality securities of new-issue conduit deals. In ABS, the Fund has maintained a fundamentally driven, up-in-quality focus, favoring select securitizations from originators of unsecured consumer, subprime auto, and private refinance student loans that practice strong underwriting and display robust structural features. |
| • | | The Fund has a very small allocation to government-related sectors, including Treasuries and agencies, as PGIM Fixed Income finds more compelling value in the aforementioned sectors. |
| | |
| 14 | | Visit our website at pgiminvestments.com |
Fees and Expenses (unaudited)
As a shareholder of the Fund, you incur two types of costs: (1) transaction costs, including sales charges (loads) on purchase payments and redemptions, as applicable, and (2) ongoing costs, including management fees, distribution and/or service (12b-1) fees, and other Fund expenses, as applicable. This example is intended to help you understand your ongoing costs (in dollars) of investing in the Fund and to compare these costs with the ongoing costs of investing in other mutual funds.
The example is based on an investment of $1,000 held through the six-month period ended October 31, 2018. The example is for illustrative purposes only; you should consult the Prospectus for information on initial and subsequent minimum investment requirements.
Actual Expenses
The first line for each share class in the table on the following page provides information about actual account values and actual expenses. You may use the information on this line, together with the amount you invested, to estimate the expenses that you paid over the period. Simply divide your account value by $1,000 (for example, an $8,600 account value ÷ $1,000 = 8.6), then multiply the result by the number on the first line under the heading “Expenses Paid During the Six-Month Period” to estimate the expenses you paid on your account during this period.
Hypothetical Example for Comparison Purposes
The second line for each share class in the table on the following page provides information about hypothetical account values and hypothetical expenses based on the Fund’s actual expense ratio and an assumed rate of return of 5% per year before expenses, which is not the Fund’s actual return. The hypothetical account values and expenses may not be used to estimate the actual ending account balance or expenses you paid for the period. You may use this information to compare the ongoing costs of investing in the Fund and other funds. To do so, compare this 5% hypothetical example with the 5% hypothetical examples that appear in the shareholder reports of the other funds.
The Fund’s transfer agent may charge additional fees to holders of certain accounts that are not included in the expenses shown in the table on the following page. These fees apply to individual retirement accounts (IRAs) and Section 403(b) accounts. As of the close of the six-month period covered by the table, IRA fees included an annual maintenance fee of $15 per account (subject to a maximum annual maintenance fee of $25 for all accounts held by the same shareholder). Section 403(b) accounts are charged an annual $25 fiduciary maintenance fee. Some of the fees may vary in amount, or may be waived, based on your total account balance or the number of PGIM funds, including the Fund, that you own. You should consider the additional fees that were charged to your Fund account over the six-month period when you estimate the total ongoing expenses paid over the period
| | | | |
| PGIM International Bond Fund | | | 15 | |
Fees and Expenses (continued)
and the impact of these fees on your ending account value, as these additional expenses are not reflected in the information provided in the expense table. Additional fees have the effect of reducing investment returns.
Please note that the expenses shown in the table are meant to highlight your ongoing costs only and do not reflect any transactional costs such as sales charges (loads). Therefore, the second line for each share class in the table is useful in comparing ongoing costs only and will not help you determine the relative total costs of owning different funds. In addition, if these transactional costs were included, your costs would have been higher.
| | | | | | | | | | | | | | | | | | |
PGIM International
Bond Fund | | Beginning Account
Value
May 1, 2018 | | | Ending Account
Value
October 31, 2018 | | | Annualized
Expense Ratio
Based on the
Six-Month Period | | | Expenses Paid
During the
Six-Month Period* | |
| Class A | | Actual | | $ | 1,000.00 | | | $ | 985.80 | | | | 0.99 | % | | $ | 4.96 | |
| | Hypothetical | | $ | 1,000.00 | | | $ | 1,020.21 | | | | 0.99 | % | | $ | 5.04 | |
| Class C | | Actual | | $ | 1,000.00 | | | $ | 981.90 | | | | 1.74 | % | | $ | 8.69 | |
| | Hypothetical | | $ | 1,000.00 | | | $ | 1,016.43 | | | | 1.74 | % | | $ | 8.84 | |
| Class Z | | Actual | | $ | 1,000.00 | | | $ | 987.00 | | | | 0.74 | % | | $ | 3.71 | |
| | Hypothetical | | $ | 1,000.00 | | | $ | 1,021.48 | | | | 0.74 | % | | $ | 3.77 | |
| Class R6** | | Actual | | $ | 1,000.00 | | | $ | 987.00 | | | | 0.74 | % | | $ | 3.71 | |
| | | Hypothetical | | $ | 1,000.00 | | | $ | 1,021.48 | | | | 0.74 | % | | $ | 3.77 | |
*Fund expenses (net of fee waivers or subsidies, if any) for each share class are equal to the annualized expense ratio for each share class (provided in the table), multiplied by the average account value over the period, multiplied by the 184 days in the six-month period ended October 31, 2018, and divided by the 365 days in the Fund’s fiscal year ended October 31, 2018 (to reflect the six-month period). Expenses presented in the table include the expenses of any underlying portfolios in which the Fund may invest.
**Formerly known as Class Q shares.
| | |
| 16 | | Visit our website at pgiminvestments.com |
Schedule of Investments
as of October 31, 2018
| | | | | | | | | | | | | | | | |
| Description | | Interest
Rate | | | Maturity
Date | | | Principal
Amount (000)# | | | Value | |
LONG-TERM INVESTMENTS 87.0% | |
|
ASSET-BACKED SECURITIES 10.0% | |
| | | | |
Cayman Islands 0.9% | | | | | | | | | | | | | | | | |
Silver Creek CLO Ltd., Series 2014-01A, Class AR, 144A, 3 Month LIBOR + 1.240% | | | 3.709 | %(c) | | | 07/20/30 | | | | 250 | | | $ | 250,347 | |
| | | | |
Ireland 3.1% | | | | | | | | | | | | | | | | |
Carlyle Global Markets Strategies Euro CLO Ltd., Series 2014-02A, Class A2BR, 144A | | | 2.250 | | | | 08/15/27 | | | EUR | 750 | | | | 849,491 | |
| | | | |
Netherlands 5.2% | | | | | | | | | | | | | | | | |
Babson Euro CLO BV, Series 2015-01A, Class A2R, 144A | | | 1.100 | | | | 10/25/29 | | | EUR | 250 | | | | 282,730 | |
Jubilee CLO BV, Series 2017-19A, Class A1, 144A, 3 Month EURIBOR + 0.800% | | | 0.800 | (c) | | | 07/15/30 | | | EUR | 250 | | | | 280,976 | |
North Westerly CLO BV, Series IV-A, Class A2R, 144A | | | 1.250 | | | | 01/15/26 | | | EUR | 249 | | | | 281,941 | |
St Paul’s CLO DAC, Series 7A, Class B2R, 144A | | | 2.400 | | | | 04/30/30 | | | EUR | 500 | | | | 570,011 | |
| | | | | | | | | | | | | | | | |
| | | | | | | | | | | | | | | 1,415,658 | |
| | | | |
United States 0.8% | | | | | | | | | | | | | | | | |
OneMain Direct Auto Receivables Trust, Series 2017-01A, Class C, 144A | | | 3.910 | | | | 08/16/21 | | | | 100 | | | | 100,320 | |
PNMAC GMSR Issuer Trust, Series 2018-GT02, Class A, 144A, 1 Month LIBOR + 2.650% | | | 4.931 | (c) | | | 08/25/25 | | | | 100 | | | | 100,699 | |
| | | | | | | | | | | | | | | | |
| | | | | | | | | | | | | | | 201,019 | |
| | | | | | | | | | | | | | | | |
TOTAL ASSET-BACKED SECURITIES
(cost $2,713,254) | | | | | | | | | | | | | | | 2,716,515 | |
| | | | | | | | | | | | | | | | |
|
CORPORATE BONDS 22.6% | |
| | | | |
Australia 0.4% | | | | | | | | | | | | | | | | |
Transurban Finance Co. Pty Ltd., Sr. Sec’d. Notes, EMTN | | | 2.000 | | | | 08/28/25 | | | EUR | 100 | | | | 117,760 | |
See Notes to Financial Statements.
| | | | |
| PGIM International Bond Fund | | | 17 | |
Schedule of Investments (continued)
as of October 31, 2018
| | | | | | | | | | | | | | | | |
| Description | | Interest
Rate | | | Maturity
Date | | | Principal
Amount (000)# | | | Value | |
CORPORATE BONDS (Continued) | |
|
China 1.3% | |
CNAC HK Finbridge Co. Ltd., Gtd. Notes | | | 1.750 | % | | | 06/14/22 | | | EUR | 100 | | | $ | 112,641 | |
State Grid Europe Development PLC, Gtd. Notes, Ser. A | | | 1.500 | | | | 01/26/22 | | | EUR | 200 | | | | 232,135 | |
| | | | | | | | | | | | | | | | |
| | | | | | | | | | | | | | | 344,776 | |
|
Germany 2.7% | |
Allianz SE, Sub. Notes | | | 5.625 | | | | 10/17/42 | | | EUR | 200 | | | | 262,780 | |
Commerzbank AG, Sub. Notes, EMTN | | | 7.750 | | | | 03/16/21 | | | EUR | 100 | | | | 131,387 | |
IHO Verwaltungs GmbH, Sr. Sec’d. Notes, Cash coupon 3.750% or PIK 4.500% | | | 3.750 | | | | 09/15/26 | | | EUR | 100 | | | | 112,279 | |
Nidda Healthcare Holding GmbH, Sr. Sec’d. Notes, 144A | | | 3.500 | | | | 09/30/24 | | | EUR | 100 | | | | 111,565 | |
Unitymedia Hessen GmbH & Co. KG/Unitymedia NRW GmbH, Sr. Sec’d. Notes | | | 4.000 | | | | 01/15/25 | | | EUR | 100 | | | | 118,757 | |
| | | | | | | | | | | | | | | | |
| | | | | | | | | | | | | | | 736,768 | |
|
Ireland 0.4% | |
Smurfit Kappa Acquisitions, Gtd. Notes | | | 2.750 | | | | 02/01/25 | | | EUR | 100 | | | | 117,456 | |
|
Italy 0.9% | |
Assicurazioni Generali SpA, Sub. Notes, EMTN | | | 5.500 | | | | 10/27/47 | | | EUR | 100 | | | | 117,548 | |
Telecom Italia SpA, Sr. Unsec’d. Notes, EMTN | | | 3.250 | | | | 01/16/23 | | | EUR | 100 | | | | 116,296 | |
| | | | | | | | | | | | | | | | |
| | | | | | | | | | | | | | | 233,844 | |
|
Kazakhstan 0.2% | |
Kazakhstan Temir Zholy National Co. JSC, Gtd. Notes | | | 3.638 | | | | 06/20/22 | | | CHF | 50 | | | | 51,637 | |
|
Mexico 1.6% | |
Petroleos Mexicanos, Gtd. Notes | | | 3.625 | | | | 11/24/25 | | | EUR | 400 | | | | 437,200 | |
See Notes to Financial Statements.
| | | | | | | | | | | | | | | | |
| Description | | Interest
Rate | | | Maturity
Date | | | Principal
Amount (000)# | | | Value | |
CORPORATE BONDS (Continued) | |
| | | | |
Netherlands 1.4% | | | | | | | | | | | | | | | | |
Nederlandse Waterschapsbank NV, Sr. Unsec’d. Notes, EMTN | | | 5.200 | % | | | 03/31/25 | | | CAD | 200 | | | $ | 168,497 | |
UPCB Finance IV Ltd., Sr. Sec’d. Notes | | | 4.000 | | | | 01/15/27 | | | EUR | 90 | | | | 105,469 | |
Ziggo BV, Sr. Sec’d. Notes | | | 3.750 | | | | 01/15/25 | | | EUR | 100 | | | | 113,112 | |
| | | | | | | | | | | | | | | | |
| | | | | | | | | | | | | | | 387,078 | |
| | | | |
Russia 0.4% | | | | | | | | | | | | | | | | |
Gazprom OAO Via Gaz Capital SA, Sr. Unsec’d. Notes, EMTN | | | 3.389 | | | | 03/20/20 | | | EUR | 100 | | | | 117,325 | |
| | | | |
Spain 0.5% | | | | | | | | | | | | | | | | |
Merlin Properties Socimi SA, Sr. Unsec’d. Notes, EMTN | | | 2.375 | | | | 05/23/22 | | | EUR | 100 | | | | 118,606 | |
| | | | |
Supranational Bank 0.5% | | | | | | | | | | | | | | | | |
European Bank for Reconstruction & Development, Sr. Unsec’d. Notes, GMTN | | | 6.450 | | | | 12/13/22 | | | IDR | 408,000 | | | | 24,763 | |
European Investment Bank, Sr. Unsec’d. Notes, EMTN | | | 0.500 | | | | 10/26/23 | | | AUD | 160 | | | | 100,625 | |
| | | | | | | | | | | | | | | | |
| | | | | | | | | | | | | | | 125,388 | |
| | | | |
United Kingdom 4.2% | | | | | | | | | | | | | | | | |
B&M European Value Retail SA, Sr. Sec’d. Notes, 144A, MTN | | | 4.125 | | | | 02/01/22 | | | GBP | 100 | | | | 127,903 | |
Barclays PLC, Sub. Notes, EMTN | | | 2.000 | | | | 02/07/28 | | | EUR | 100 | | | | 108,020 | |
CPUK Finance Ltd., Sec’d. Notes, 144A | | | 4.250 | | | | 02/28/47 | | | GBP | 100 | | | | 128,295 | |
EI Group PLC, First Mortgage | | | 6.375 | | | | 02/15/22 | | | GBP | 100 | | | | 132,011 | |
FCE Bank PLC, Sr. Unsec’d. Notes, EMTN | | | 1.615 | | | | 05/11/23 | | | EUR | 150 | | | | 167,161 | |
Royal Bank of Scotland Group PLC, Sr. Unsec’d. Notes, EMTN | | | 2.000 | | | | 03/08/23 | | | EUR | 100 | | | | 115,637 | |
Tesco PLC, Sr. Unsec’d. Notes, EMTN | | | 5.000 | | | | 03/24/23 | | | GBP | 80 | | | | 113,261 | |
See Notes to Financial Statements.
| | | | |
| PGIM International Bond Fund | | | 19 | |
Schedule of Investments (continued)
as of October 31, 2018
| | | | | | | | | | | | | | | | |
| Description | | Interest
Rate | | | Maturity
Date | | | Principal
Amount (000)# | | | Value | |
CORPORATE BONDS (Continued) | |
|
United Kingdom (cont’d.) | |
Virgin Media Secured Finance PLC, Sr. Sec’d. Notes | | | 5.500 | % | | | 01/15/25 | | | GBP | 90 | | | $ | 117,253 | |
William Hill PLC, Gtd. Notes | | | 4.875 | | | | 09/07/23 | | | GBP | 100 | | | | 131,974 | |
| | | | | | | | | | | | | | | | |
| | | | | | | | | | | | | | | 1,141,515 | |
| | | | |
United States 8.1% | | | | | | | | | | | | | | | | |
Adient Global Holdings Ltd., Gtd. Notes | | | 3.500 | | | | 08/15/24 | | | EUR | 100 | | | | 99,180 | |
American International Group, Inc., Sr. Unsec’d. Notes | | | 1.875 | | | | 06/21/27 | | | EUR | 100 | | | | 112,198 | |
Ball Corp., Gtd. Notes | | | 4.375 | | | | 12/15/23 | | | EUR | 100 | | | | 126,263 | |
Becton, Dickinson and Co., Sr. Unsec’d. Notes | | | 0.368 | | | | 06/06/19 | | | EUR | 100 | | | | 113,491 | |
Belden, Inc., Gtd. Notes | | | 4.125 | | | | 10/15/26 | | | EUR | 100 | | | | 116,851 | |
Catalent Pharma Solutions, Inc., Gtd. Notes | | | 4.750 | | | | 12/15/24 | | | EUR | 100 | | | | 118,358 | |
Chubb INA Holdings, Inc., Gtd. Notes | | | 1.550 | | | | 03/15/28 | | | EUR | 100 | | | | 112,677 | |
Discovery Communications LLC, Gtd. Notes | | | 2.500 | | | | 09/20/24 | | | GBP | 100 | | | | 125,334 | |
Fidelity National Information Services, Inc., Sr. Unsec’d. Notes | | | 1.100 | | | | 07/15/24 | | | EUR | 100 | | | | 112,515 | |
International Game Technology PLC, Sr. Sec’d. Notes | | | 4.750 | | | | 02/15/23 | | | EUR | 100 | | | | 120,935 | |
IQVIA, Inc., Gtd. Notes | | | 3.500 | | | | 10/15/24 | | | EUR | 100 | | | | 116,272 | |
Kraft Heinz Foods Co., Gtd. Notes | | | 2.250 | | | | 05/25/28 | | | EUR | 100 | | | | 112,982 | |
LKQ Italia Bondco SpA, Gtd. Notes | | | 3.875 | | | | 04/01/24 | | | EUR | 100 | | | | 117,615 | |
Morgan Stanley, Sr. Unsec’d. Notes, GMTN | | | 1.000 | | | | 12/02/22 | | | EUR | 100 | | | | 114,654 | |
PerkinElmer, Inc., Sr. Unsec’d. Notes | | | 0.600 | | | | 04/09/21 | | | EUR | 100 | | | | 113,985 | |
Spectrum Brands, Inc., Gtd. Notes | | | 4.000 | | | | 10/01/26 | | | EUR | 100 | | | | 113,822 | |
Thermo Fisher Scientific, Inc., Sr. Unsec’d. Notes | | | 1.400 | | | | 01/23/26 | | | EUR | 100 | | | | 112,707 | |
See Notes to Financial Statements.
| | | | | | | | | | | | | | | | |
| Description | | Interest
Rate | | | Maturity
Date | | | Principal
Amount (000)# | | | Value | |
CORPORATE BONDS (Continued) | |
|
United States (cont’d.) | |
Zimmer Biomet Holdings, Inc., | | | | | | | | | | | | | | | | |
Sr. Unsec’d. Notes | | | 1.414 | % | | | 12/13/22 | | | EUR | 100 | | | $ | 115,441 | |
Sr. Unsec’d. Notes | | | 2.425 | | | | 12/13/26 | | | EUR | 100 | | | | 116,715 | |
| | | | | | | | | | | | | | | | |
| | | | | | | | | | | | | | | 2,191,995 | |
| | | | | | | | | | | | | | | | |
TOTAL CORPORATE BONDS
(cost $6,005,708) | | | | | | | | | | | | | | | 6,121,348 | |
| | | | | | | | | | | | | | | | |
|
RESIDENTIAL MORTGAGE-BACKED SECURITIES 3.6% | |
| | | | |
Bermuda 0.6% | | | | | | | | | | | | | | | | |
Bellemeade Re Ltd., Series 2018-01A, Class M1B, 144A, 1 Month LIBOR + 1.600% | | | 3.881 | (c) | | | 04/25/28 | | | | 167 | | | | 167,871 | |
| | | | |
United Kingdom 2.4% | | | | | | | | | | | | | | | | |
Alba PLC, Series 2007-01, Class B, 3 Month GBP LIBOR + 0.240% | | | 1.037 | (c) | | | 03/17/39 | | | GBP | 80 | | | | 94,897 | |
Newgate Funding PLC, | | | | | | | | | | | | | | | | |
Series 2006-02, Class M, 3 Month GBP LIBOR + 0.220% | | | 1.019 | (c) | | | 12/01/50 | | | GBP | 147 | | | | 176,904 | |
Series 2007-02X, Class A3, 3 Month GBP LIBOR + 0.160% | | | 0.957 | (c) | | | 12/15/50 | | | GBP | 100 | | | | 117,204 | |
Paragon Mortgages PLC, | | | | | | | | | | | | | | | | |
Series 10X, Class B1A, 3 Month GBP LIBOR + 0.540% | | | 1.337 | (c) | | | 06/15/41 | | | GBP | 103 | | | | 126,994 | |
Series 12X, Class B1A, 3 Month GBP LIBOR + 0.480% | | | 1.282 | (c) | | | 11/15/38 | | | GBP | 97 | | | | 119,486 | |
| | | | | | | | | | | | | | | | |
| | | | | | | | | | | | | | | 635,485 | |
See Notes to Financial Statements.
| | | | |
| PGIM International Bond Fund | | | 21 | |
Schedule of Investments (continued)
as of October 31, 2018
| | | | | | | | | | | | | | | | |
| Description | | Interest
Rate | | | Maturity
Date | | | Principal
Amount (000)# | | | Value | |
RESIDENTIAL MORTGAGE-BACKED SECURITIES (Continued) | |
|
United States 0.6% | |
CIM Trust, Series 2017-03, Class A1, 144A, 1 Month LIBOR + 2.000% | | | 4.256 | %(c) | | | 01/25/57 | | | | 71 | | | $ | 72,005 | |
LSTAR Securities Investment Trust, Series 2018-02, Class A1, 144A, 1 Month LIBOR + 1.500% | | | 3.756 | (c) | | | 04/01/23 | | | | 96 | | | | 96,678 | |
| | | | | | | | | | | | | | | | |
| | | | | | | | | | | | | | | 168,683 | |
| | | | | | | | | | | | | | | | |
TOTAL RESIDENTIAL MORTGAGE-BACKED SECURITIES
(cost $963,640) | | | | | | | | | | | | | | | 972,039 | |
| | | | | | | | | | | | | | | | |
|
SOVEREIGN BONDS 50.6% | |
|
Argentina 2.3% | |
Argentine Republic Government International Bond, | | | | | | | | | | | | | | | | |
Sr. Unsec’d. Notes | | | 5.250 | | | | 01/15/28 | | | EUR | 100 | | | | 86,930 | |
Sr. Unsec’d. Notes | | | 7.820 | | | | 12/31/33 | | | EUR | 275 | | | | 281,502 | |
Sr. Unsec’d. Notes | | | 7.820 | | | | 12/31/33 | | | EUR | 69 | | | | 70,139 | |
Unsec’d. Notes | | | 5.000 | | | | 01/15/27 | | | EUR | 100 | | | | 87,223 | |
Provincia de Buenos Aires, Sr. Unsec’d. Notes | | | 5.375 | | | | 01/20/23 | | | EUR | 100 | | | | 92,822 | |
| | | | | | | | | | | | | | | | |
| | | | | | | | | | | | | | | 618,616 | |
| | | | |
Belgium 2.9% | | | | | | | | | | | | | | | | |
Kingdom of Belgium Government Bond, Unsec’d. Notes | | | 4.000 | | | | 03/28/22 | | | EUR | 600 | | | | 779,662 | |
| | | | |
Brazil 1.3% | | | | | | | | | | | | | | | | |
Brazil Letras do Tesouro Nacional, Bills | | | 10.424 | (s) | | | 01/01/22 | | | BRL | 50 | | | | 10,283 | |
Brazilian Government International Bond, Sr. Unsec’d. Notes | | | 2.875 | | | | 04/01/21 | | | EUR | 300 | | | | 351,421 | |
| | | | | | | | | | | | | | | | |
| | | | | | | | | | | | | | | 361,704 | |
| | | | |
Bulgaria 0.5% | | | | | | | | | | | | | | | | |
Bulgaria Government International Bond, Unsec’d. Notes, GMTN | | | 3.125 | | | | 03/26/35 | | | EUR | 115 | | | | 138,069 | |
See Notes to Financial Statements.
| | | | | | | | | | | | | | | | |
| Description | | Interest
Rate | | | Maturity
Date | | | Principal
Amount (000)# | | | Value | |
SOVEREIGN BONDS (Continued) | |
|
Canada 0.7% | |
Province of British Columbia, Unsec’d. Notes | | | 7.875 | % | | | 11/30/23 | | | CAD | 200 | | | $ | 184,703 | |
|
Colombia 1.9% | |
Colombia Government International Bond, Sr. Unsec’d. Notes, EMTN | | | 3.875 | | | | 03/22/26 | | | EUR | 400 | | | | 509,690 | |
|
Croatia 0.8% | |
Croatia Government International Bond, Sr. Unsec’d. Notes | | | 2.700 | | | | 06/15/28 | | | EUR | 200 | | | | 227,480 | |
|
Cyprus 2.3% | |
Cyprus Government International Bond, Sr. Unsec’d. Notes, EMTN | | | 3.750 | | | | 07/26/23 | | | EUR | 500 | | | | 627,809 | |
|
France 2.0% | |
French Republic Government Bond OAT, Bonds | | | 2.750 | | | | 10/25/27 | | | EUR | 400 | | | | 539,320 | |
|
Greece 3.8% | |
Hellenic Republic Government Bond, | | | | | | | | | | | | | | | | |
Bonds | | | 0.000 | (cc) | | | 10/15/42 | | | EUR | 6,000 | | | | 20,388 | |
Bonds | | | 3.000 | (cc) | | | 02/24/23 | | | EUR | 50 | | | | 56,129 | |
Bonds | | | 3.000 | (cc) | | | 02/24/24 | | | EUR | 75 | | | | 83,594 | |
Bonds | | | 3.000 | (cc) | | | 02/24/25 | | | EUR | 85 | | | | 93,103 | |
Bonds | | | 3.000 | (cc) | | | 02/24/26 | | | EUR | 95 | | | | 103,830 | |
Bonds | | | 3.000 | (cc) | | | 02/24/27 | | | EUR | 195 | | | | 210,463 | |
Bonds | | | 3.000 | (cc) | | | 02/24/28 | | | EUR | 60 | | | | 63,967 | |
Bonds | | | 3.000 | (cc) | | | 02/24/29 | | | EUR | 50 | | | | 52,682 | |
Bonds | | | 3.000 | (cc) | | | 02/24/31 | | | EUR | 140 | | | | 143,447 | |
Bonds | | | 4.200 | | | | 01/30/42 | | | EUR | 140 | | | | 137,639 | |
Hellenic Republic Government International Bond, Sr. Unsec’d. Notes | | | 5.200 | | | | 07/17/34 | | | EUR | 60 | | | | 67,768 | |
| | | | | | | | | | | | | | | | |
| | | | | | | | | | | | | | | 1,033,010 | |
|
Indonesia 1.5% | |
Indonesia Government International Bond, | | | | | | | | | | | | | | | | |
Sr. Unsec’d. Notes, 144A, MTN | | | 2.150 | | | | 07/18/24 | | | EUR | 140 | | | | 158,764 | |
Sr. Unsec’d. Notes, EMTN | | | 3.750 | | | | 06/14/28 | | | EUR | 200 | | | | 244,150 | |
| | | | | | | | | | | | | | | | |
| | | | | | | | | | | | | | | 402,914 | |
See Notes to Financial Statements.
| | | | |
| PGIM International Bond Fund | | | 23 | |
Schedule of Investments (continued)
as of October 31, 2018
| | | | | | | | | | | | | | | | |
| Description | | Interest
Rate | | | Maturity
Date | | | Principal
Amount (000)# | | | Value | |
SOVEREIGN BONDS (Continued) | |
|
Ireland 0.7% | |
Ireland Government Bond, Bonds | | | 2.400 | % | | | 05/15/30 | | | EUR | 150 | | | $ | 192,385 | |
|
Israel 0.4% | |
Israel Government International Bond, Sr. Unsec’d. Notes, EMTN | | | 1.500 | | | | 01/18/27 | | | EUR | 100 | | | | 114,741 | |
|
Italy 7.5% | |
Italy Buoni Poliennali del Tesoro, | | | | | | | | | | | | | | | | |
Bonds | | | 2.050 | | | | 08/01/27 | | | EUR | 140 | | | | 144,398 | |
Bonds | | | 3.750 | | | | 09/01/24 | | | EUR | 640 | | | | 757,344 | |
Sr. Unsec’d. Notes, 144A | | | 4.750 | | | | 09/01/28 | | | EUR | 455 | | | | 575,701 | |
Unsec’d. Notes | | | 4.500 | | | | 03/01/26 | | | EUR | 455 | | | | 562,959 | |
| | | | | | | | | | | | | | | | |
| | | | | | | | | | | | | | | 2,040,402 | |
|
Japan 0.2% | |
Japan Government Twenty Year Bond, Sr. Unsec’d. Notes | | | 0.500 | | | | 06/20/38 | | | JPY | 8,000 | | | | 69,077 | |
|
Lithuania 0.8% | |
Lithuania Government International Bond, Sr. Unsec’d. Notes | | | 6.125 | | | | 03/09/21 | | | | 200 | | | | 211,705 | |
|
Mexico 0.8% | |
Mexico Government International Bond, Sr. Unsec’d. Notes, GMTN | | | 1.625 | | | | 03/06/24 | | | EUR | 185 | | | | 210,294 | |
|
Peru 1.0% | |
Peruvian Government International Bond, Sr. Unsec’d. Notes | | | 3.750 | | | | 03/01/30 | | | EUR | 200 | | | | 268,036 | |
|
Portugal 3.4% | |
Portugal Obrigacoes do Tesouro OT, | | | | | | | | | | | | | | | | |
Sr. Unsec’d. Notes, 144A | | | 3.875 | | | | 02/15/30 | | | EUR | 560 | | | | 744,265 | |
Sr. Unsec’d. Notes, 144A | | | 4.100 | | | | 04/15/37 | | | EUR | 130 | | | | 177,874 | |
| | | | | | | | | | | | | | | | |
| | | | | | | | | | | | | | | 922,139 | |
See Notes to Financial Statements.
| | | | | | | | | | | | | | | | |
| Description | | Interest
Rate | | | Maturity
Date | | | Principal
Amount (000)# | | | Value | |
SOVEREIGN BONDS (Continued) | |
|
Romania 0.8% | |
Romanian Government International Bond, | | | | | | | | | | | | | | | | |
Sr. Unsec’d. Notes, 144A, MTN | | | 2.500 | % | | | 02/08/30 | | | EUR | 100 | | | $ | 106,129 | |
Sr. Unsec’d. Notes, EMTN | | | 3.875 | | | | 10/29/35 | | | EUR | 100 | | | | 112,301 | |
| | | | | | | | | | | | | | | | |
| | | | | | | | | | | | | | | 218,430 | |
|
Senegal 0.4% | |
Senegal Government International Bond, | | | | | | | | | | | | | | | | |
Sr. Unsec’d. Notes, 144A | | | 4.750 | | | | 03/13/28 | | | EUR | 100 | | | | 105,574 | |
|
South Korea 1.3% | |
Export-Import Bank of Korea, | | | | | | | | | | | | | | | | |
Sr. Unsec’d. Notes, EMTN | | | 2.000 | | | | 04/30/20 | | | EUR | 100 | | | | 116,694 | |
Sr. Unsec’d. Notes, EMTN^ | | | 4.460 | | | | 09/26/19 | | | NZD | 200 | | | | 132,180 | |
Sr. Unsec’d. Notes, MTN | | | 3.500 | | | | 07/28/21 | | | NZD | 150 | | | | 98,753 | |
| | | | | | | | | | | | | �� | | | |
| | | | | | | | | | | | | | | 347,627 | |
|
Spain 7.4% | |
Instituto de Credito Oficial, | | | | | | | | | | | | | | | | |
Gov’t. Gtd. Notes, EMTN | | | 5.000 | | | | 03/31/20 | | | CAD | 160 | | | | 124,835 | |
Gov’t. Gtd. Notes, GMTN | | | 0.963 | | | | 09/22/22 | | | SEK | 1,000 | | | | 109,548 | |
Spain Government Bond, | | | | | | | | | | | | | | | | |
Bonds, 144A | | | 5.150 | | | | 10/31/28 | | | EUR | 120 | | | | 180,952 | |
Sr. Unsec’d. Notes, 144A | | | 1.400 | | | | 04/30/28 | | | EUR | 70 | | | | 78,671 | |
Sr. Unsec’d. Notes, 144A | | | 1.450 | | | | 10/31/27 | | | EUR | 265 | | | | 300,697 | |
Sr. Unsec’d. Notes, 144A | | | 4.650 | | | | 07/30/25 | | | EUR | 870 | | | | 1,220,276 | |
| | | | | | | | | | | | | | | | |
| | | | | | | | | | | | | | | 2,014,979 | |
|
Turkey 0.7% | |
Turkey Government Bond, Bonds | | | 8.000 | | | | 03/12/25 | | | TRY | 100 | | | | 11,271 | |
Turkey Government International Bond, Sr. Unsec’d. Notes | | | 4.125 | | | | 04/11/23 | | | EUR | 155 | | | | 173,728 | |
| | | | | | | | | | | | | | | | |
| | | | | | | | | | | | | | | 184,999 | |
See Notes to Financial Statements.
| | | | |
| PGIM International Bond Fund | | | 25 | |
Schedule of Investments (continued)
as of October 31, 2018
| | | | | | | | | | | | | | | | |
| Description | | Interest
Rate | | | Maturity
Date | | | Principal
Amount (000)# | | | Value | |
SOVEREIGN BONDS (Continued) | |
|
United Kingdom 5.2% | |
United Kingdom Gilt, Bonds(k) | | | 4.250 | % | | | 03/07/36 | | | GBP | 800 | | | $ | 1,404,435 | |
| | | | | | | | | | | | | | | | |
TOTAL SOVEREIGN BONDS
(cost $13,704,373) | | | | | | | | | | | | | | | 13,727,800 | |
| | | | | | | | | | | | | | | | |
| | | |
U.S. GOVERNMENT AGENCY OBLIGATION 0.0% | | | | | | | | | | | | | |
Indonesia Government USAID Bond Gov’t. Gtd. Notes
(cost $16,381) | | | 8.900 | | | | 06/01/21 | | | | 15 | | | | 16,414 | |
| | | | | | | | | | | | | | | | |
| | | |
U.S. TREASURY OBLIGATION 0.2% | | | | | | | | | | | | | |
U.S. Treasury Notes
(cost $59,850) | | | 2.875 | | | | 10/31/23 | | | | 60 | | | | 59,688 | |
| | | | | | | | | | | | | | | | |
TOTAL LONG-TERM INVESTMENTS
(cost $23,463,206) | | | | | | | | | | | | | | | 23,613,804 | |
| | | | | | | | | | | | | | | | |
| | | | |
| | | | | | | | | Shares | | | | |
| | | |
SHORT-TERM INVESTMENTS 9.1% | | | | | | | | | | | | | |
| | | |
AFFILIATED MUTUAL FUND 8.7% | | | | | | | | | | | | | |
PGIM Core Ultra Short Bond Fund
(cost $2,346,703)(w) | | | | | | | | | | | 2,346,703 | | | | 2,346,703 | |
| | | | | | | | | | | | | | | | |
| | | | |
OPTIONS PURCHASED*~ 0.4%
(cost $40,518) | | | | | | | | | | | | | | | 109,677 | |
| | | | | | | | | | | | | | | | |
TOTAL SHORT-TERM INVESTMENTS
(cost $2,387,221) | | | | | | | | | | | | | | | 2,456,380 | |
| | | | | | | | | | | | | | | | |
TOTAL INVESTMENTS, BEFORE OPTIONS WRITTEN 96.1%
(cost $25,850,427) | | | | | | | | | | | | | | | 26,070,184 | |
| | | | | | | | | | | | | | | | |
| | | | |
OPTIONS WRITTEN*~ (0.4)%
(premiums received $34,624) | | | | | | | | | | | | | | | (102,843 | ) |
| | | | | | | | | | | | | | | | |
| | | | |
TOTAL INVESTMENTS, NET OF OPTIONS WRITTEN 95.7%
(cost $25,815,803) | | | | | | | | | | | | | | | 25,967,341 | |
Other assets in excess of liabilities(z) 4.3% | | | | | | | | | | | | | | | 1,162,070 | |
| | | | | | | | | | | | | | | | |
NET ASSETS 100.0% | | | | | | | | | | | | | | $ | 27,129,411 | |
| | | | | | | | | | | | | | | | |
See Notes to Financial Statements.
The following abbreviations are used in the annual report:
144A—Security was purchased pursuant to Rule 144A under the Securities Act of 1933 and may not be resold subject to that rule except to qualified institutional buyers. Unless otherwise noted, 144A securities are deemed to be liquid.
A—Annual payment frequency for swaps
BBR—New Zealand Bank Bill Rate
BBSW—Australian Bank Bill Swap Reference Rate
BIBOR—Bangkok Interbank Offered Rate
BROIS—Brazil Overnight Index Swap
BUBOR—Budapest Interbank Offered Rate
CDX—Credit Derivative Index
CLO—Collateralized Loan Obligation
CLOIS—Sinacofi Chile Interbank Rate Average
CMBX—Commercial Mortgage-Backed Index
CMS—Constant Maturity Swap
COOIS—Colombia Overnight Interbank Reference Rate
EIBOR—Emirates Interbank Offered Rate
EMTN—Euro Medium Term Note
EONIA—Euro Overnight Index Average
EURIBOR—Euro Interbank Offered Rate
GMTN—Global Medium Term Note
iTraxx—International Credit Derivative Index
JIBAR—Johannesburg Interbank Agreed Rate
KWCDC—Korean Won Certificate of Deposit
LIBOR—London Interbank Offered Rate
M—Monthly payment frequency for swaps
MIBOR—Mumbai Interbank Offered Rate
MTN—Medium Term Note
NIBOR—Norwegian Interbank Offered Rate
OAT—Obligations Assimilables du Tresor
OTC—Over-the-counter
PIK—Payment-in-Kind
PRIBOR—Prague Interbank Offered Rate
Q—Quarterly payment frequency for swaps
S—Semiannual payment frequency for swaps
SAIBOR—Saudi Arabian Interbank Offered Rate
SIBOR—Singapore Interbank Offered Rate
STIBOR—Stockholm Interbank Offered Rate
T—Swap payment upon termination
TELBOR—Tel Aviv Interbank Offered Rate
USAID—United States Agency for International Development
USOIS—United States Overnight Index Swap
WIBOR—Warsaw Interbank Offered Rate
AED—United Arab Emirates Dirham
ARS—Argentine Peso
AUD—Australian Dollar
BRL—Brazilian Real
CAD—Canadian Dollar
CHF—Swiss Franc
CLP—Chilean Peso
CNH—Chinese Renminbi
COP—Colombian Peso
See Notes to Financial Statements.
| | | | |
| PGIM International Bond Fund | | | 27 | |
Schedule of Investments (continued)
as of October 31, 2018
CZK—Czech Koruna
EUR—Euro
GBP—British Pound
HUF—Hungarian Forint
IDR—Indonesian Rupiah
ILS—Israeli Shekel
INR—Indian Rupee
JPY—Japanese Yen
KRW—South Korean Won
MXN—Mexican Peso
MYR—Malaysian Ringgit
NOK—Norwegian Krone
NZD—New Zealand Dollar
PEN—Peruvian Nuevo Sol
PHP—Philippine Peso
PLN—Polish Zloty
RUB—Russian Ruble
SAR—Saudi Arabian Riyal
SEK—Swedish Krona
SGD—Singapore Dollar
THB—Thai Baht
TRY—Turkish Lira
TWD—New Taiwanese Dollar
USD—US Dollar
ZAR—South African Rand
| * | Non-income producing security. |
| # | Principal or notional amount is shown in U.S. dollars unless otherwise stated. |
| ~ | See tables subsequent to the Schedule of Investments for options detail. |
| ^ | Indicates a Level 3 security. The aggregate value of Level 3 securities is $130,758 and 0.5% of net assets. |
| (c) | Variable rate instrument. The interest rate shown reflects the rate in effect at October 31, 2018. |
| (cc) | Variable rate instrument. The rate shown is based on the latest available information as of October 31, 2018. Certain variable rate securities are not based on a published reference rate and spread but are determined by the issuer or agent and are based on current market conditions. These securities do not indicate a reference rate and spread in their description. |
| (k) | Represents security, or a portion thereof, segregated as collateral for centrally cleared/exchange-traded derivatives. |
| (s) | Represents zero coupon bond or principal only security. Rate represents yield to maturity at purchase date. |
| (w) | PGIM Investments LLC, the manager of the Fund, also serves as manager of the PGIM Core Ultra Short Bond Fund. |
| (z) | Includes net unrealized appreciation/(depreciation) and/or market value of the below holdings which are excluded from the Schedule of Investments: |
Options Purchased:
OTC Traded
| | | | | | | | | | | | | | | | | | | | | | | | |
Description | | Call/
Put | | Counterparty | | Expiration
Date | | | Strike | | | Contracts | | | Notional
Amount
(000)# | | | Value | |
2- Year 10 CMS Curve CAP | | Call | | Barclays Bank PLC | | | 07/12/21 | | | | 0.11 | % | | | — | | | | 355 | | | $ | 333 | |
2- Year 10 CMS Curve CAP | | Call | | Barclays Bank PLC | | | 07/13/21 | | | | 0.11 | % | | | — | | | | 345 | | | | 324 | |
2- Year 10 CMS Curve CAP | | Call | | Bank of America | | | 08/16/21 | | | | 0.15 | % | | | — | | | | 860 | | | | 793 | |
2- Year 10 CMS Curve CAP | | Call | | Bank of America | | | 08/20/21 | | | | 0.15 | % | | | — | | | | 1,710 | | | | 4,909 | |
2- Year 10 CMS Curve CAP | | Call | | Bank of America | | | 09/13/21 | | | | 0.14 | % | | | — | | | | 1,700 | | | | 1,830 | |
See Notes to Financial Statements.
Options Purchased (continued):
OTC Traded
| | | | | | | | | | | | | | | | | | | | | | | | |
Description | | Call/
Put | | Counterparty | | Expiration
Date | | | Strike | | | Contracts | | | Notional
Amount
(000)# | | | Value | |
Currency Option EUR vs TRY | | Call | | Citibank NA | | | 04/26/19 | | | | 6.00 | | | | — | | | EUR | 500 | | | $ | 94,912 | |
Currency Option USD vs BRL | | Call | | JPMorgan Chase | | | 04/26/19 | | | | 5.00 | | | | — | | | | 500 | | | | 1,107 | |
| | | | | | | | | | | | | | | | | | | | | | | | |
Total OTC Traded (cost $38,241) | | | $ | 104,208 | |
| | | | | | | | | | | | | | | | | | | | | | | | |
OTC Swaptions
| | | | | | | | | | | | | | | | | | | | | | | | |
Description | | Call/
Put | | Counterparty | | Expiration
Date | | | Strike | | | Receive | | Pay | | Notional
Amount
(000)# | | | Value | |
CDX.NA.HY.31.V1, 12/20/23 | | Call | | Deutsche Bank AG | | | 03/20/19 | | | $ | 107.50 | | | 5.00%(Q) | | CDX.NA.HY. 31.V1(Q) | | | 195 | | | $ | 183 | |
CDX.NA.HY.31.V1, 12/20/23 | | Call | | Bank of America | | | 03/20/19 | | | $ | 107.50 | | | 5.00%(Q) | | CDX.NA.HY. 31.V1(Q) | | | 205 | | | | 192 | |
CDX.NA.HY.31.V1, 12/20/23 | | Call | | Bank of America | | | 03/20/19 | | | $ | 106.50 | | | 5.00%(Q) | | CDX.NA.HY. 31.V1(Q) | | | 180 | | | | 407 | |
iTraxx.XO.29.V1, 06/20/23 | | Call | | BNP Paribas | | | 12/19/18 | | | | 275.00 | | | 5.00%(Q) | | iTraxx.XO. 29.V1(Q) | | EUR | 450 | | | | 808 | |
10- Year Interest Rate Swap, 11/19/37 | | Put | | Morgan Stanley | | | 11/17/27 | | | | 1.25 | % | | 6 Month JPY
LIBOR(S) | | 1.25%(S) | | JPY | 15,000 | | | | 3,879 | |
| | | | | | | | | | | | | | | | | | | | | | | | |
Total OTC Swaptions (cost $2,277) | | | | | | $ | 5,469 | |
| | | | | | | | | | | | | | | | | | | | | | | | |
Total Options Purchased (cost $40,518) | | | | | | $ | 109,677 | |
| | | | | | | | | | | | | | | | | | | | | | | | |
Options Written:
OTC Traded
| | | | | | | | | | | | | | | | | | | | | | | | |
Description | | Call/
Put | | Counterparty | | Expiration
Date | | | Strike | | | Contracts | | | Notional
Amount
(000)# | | | Value | |
Currency Option EUR vs TRY | | Call | | BNP Paribas | | | 04/26/19 | | | | 6.00 | | | | — | | | EUR | 500 | | | $ | (94,913 | ) |
Currency Option USD vs BRL | | Call | | Hong Kong & Shanghai Bank | | | 04/26/19 | | | | 5.00 | | | | — | | | | 500 | | | | (1,107 | ) |
Lebanese Republic, 8.25%, 04/12/21^ | | Put | | Deutsche Bank AG | | | 04/08/19 | | | $ | 66.00 | | | | — | | | | 80 | | | | (93 | ) |
| | | | | | | | | | | | | | | | | | | | | | | | |
Total OTC Traded (premiums received $28,007) | | | | | | | | | | | | | | | | | | $ | (96,113 | ) |
| | | | | | | | | | | | | | | | | | | | | | | | |
See Notes to Financial Statements.
| | | | |
| PGIM International Bond Fund | | | 29 | |
Schedule of Investments (continued)
as of October 31, 2018
Options Written (continued):
OTC Swaptions
| | | | | | | | | | | | | | | | | | | | | | | | |
Description | | Call/
Put | | Counterparty | | Expiration
Date | | | Strike | | | Receive | | Pay | | Notional
Amount
(000)# | | | Value | |
10- Year Interest Rate Swap, 11/19/37 | | Put | | Morgan Stanley | | | 11/17/27 | | | | 1.25 | % | | 1.25%(S) | | 6 Month JPY LIBOR(S) | | JPY | 15,000 | | | $ | (3,879 | ) |
CDX.NA.HY.31.V1, 12/20/23 | | Put | | Deutsche Bank AG | | | 03/20/19 | | | $ | 98.00 | | | 5.00%(Q) | | CDX.NA.HY. 31.V1(Q) | | | 195 | | | | (1,173 | ) |
CDX.NA.HY.31.V1, 12/20/23 | | Put | | Bank of America | | | 03/20/19 | | | $ | 98.00 | | | 5.00%(Q) | | CDX.NA.HY. 31.V1(Q) | | | 205 | | | | (1,234 | ) |
iTraxx.XO.29.V1, 06/20/23 | | Put | | BNP Paribas | | | 12/19/18 | | | | 400.00 | | | 5.00%(Q) | | iTraxx.XO. 29.V1(Q) EUR 450 | | | | | | | (444 | ) |
| | | | | | | | | | | | | | | | | | | | | | | | |
Total OTC Swaptions (premiums received $6,617) | | | | | | $ | (6,730 | ) |
| | | | | | | | | | | | | | | | | | | | | | | | |
Total Options Written (premiums received $34,624) | | | | | | $ | (102,843 | ) |
| | | | | | | | | | | | | | | | | | | | | | | | |
Futures contracts outstanding at October 31, 2018:
| | | | | | | | | | | | | | | | |
Number of
Contracts | | | Type | | Expiration
Date | | | Current
Notional
Amount | | | Value /
Unrealized
Appreciation
(Depreciation) | |
| | Long Positions: | | | | | | | | | | | | |
| | 4 | | | 90 Day Euro Dollar | | | Dec. 2020 | | | $ | 967,950 | | | $ | (2,575 | ) |
| | 89 | | | 5 Year U.S. Treasury Notes | | | Dec. 2018 | | | | 10,002,070 | | | | (71,875 | ) |
| | 4 | | | 10 Year U.K. Gilt | | | Dec. 2018 | | | | 625,858 | | | | 588 | |
| | 71 | | | 10 Year U.S. Treasury Notes | | | Dec. 2018 | | | | 8,409,063 | | | | (58,133 | ) |
| | 2 | | | 30 Year Euro Buxl | | | Dec. 2018 | | | | 400,730 | | | | (498 | ) |
| | 6 | | | 30 Year U.S. Ultra Treasury Bonds | | | Dec. 2018 | | | | 895,313 | | | | (42,767 | ) |
| | | | | | | | | | | | | | | | |
| | | | | | | | | | | | | | | (175,260 | ) |
| | | | | | | | | | | | | | | | |
| | Short Positions: | | | | | | | | | | | | |
| | 4 | | | 90 Day Euro Dollar | | | Dec. 2021 | | | | 968,300 | | | | 1,950 | |
| | 28 | | | 2 Year U.S. Treasury Notes | | | Dec. 2018 | | | | 5,898,375 | | | | 6,662 | |
| | 27 | | | 5 Year Euro-Bobl | | | Dec. 2018 | | | | 4,019,617 | | | | (736 | ) |
| | 20 | | | 10 Year Euro-Bund | | | Dec. 2018 | | | | 3,630,350 | | | | 7,011 | |
| | 1 | | | 20 Year U.S. Treasury Bonds | | | Dec. 2018 | | | | 138,125 | | | | — | |
| | 45 | | | Euro Schatz. DUA Index | | | Dec. 2018 | | | | 5,707,251 | | | | (1,784 | ) |
| | | | | | | | | | | | | | | | |
| | | | | 13,103 | |
| | | | | | | | | | | | | | | | |
| | | | $ | (162,157 | ) |
| | | | | | | | | | | | | | | | |
See Notes to Financial Statements.
Forward foreign currency exchange contracts outstanding at October 31, 2018:
| | | | | | | | | | | | | | | | | | | | | | |
Purchase Contracts | | Counterparty | | Notional
Amount
(000) | | | Value at
Settlement
Date | | | Current
Value | | | Unrealized
Appreciation | | | Unrealized
Depreciation | |
OTC Forward Foreign Currency Exchange Contracts: | |
Argentine Peso, | |
Expiring 11/30/18 | | BNP Paribas | | ARS | 470 | | | $ | 12,301 | | | $ | 12,614 | | | $ | 313 | | | $ | — | |
Expiring 11/30/18 | | BNP Paribas | | ARS | 468 | | | | 12,274 | | | | 12,554 | | | | 280 | | | | — | |
Australian Dollar, | |
Expiring 01/18/19 | | Toronto Dominion | | AUD | 143 | | | | 102,000 | | | | 101,427 | | | | — | | | | (573 | ) |
Expiring 01/18/19 | | Toronto Dominion | | AUD | 98 | | | | 70,000 | | | | 69,489 | | | | — | | | | (511 | ) |
Brazilian Real, | |
Expiring 02/25/19 | | Citibank NA | | BRL | 429 | | | | 126,998 | | | | 114,133 | | | | — | | | | (12,865 | ) |
Expiring 04/30/19 | | JPMorgan Chase | | BRL | 98 | | | | 28,206 | | | | 25,953 | | | | — | | | | (2,253 | ) |
Expiring 04/30/19 | | JPMorgan Chase | | BRL | 95 | | | | 28,000 | | | | 25,222 | | | | — | | | | (2,778 | ) |
British Pound, | |
Expiring 01/25/19 | | Toronto Dominion | | GBP | 55 | | | | 71,000 | | | | 70,868 | | | | — | | | | (132 | ) |
Canadian Dollar, | |
Expiring 01/18/19 | | Citibank NA | | CAD | 161 | | | | 123,900 | | | | 122,787 | | | | — | | | | (1,113 | ) |
Expiring 01/18/19 | | Goldman Sachs International | | CAD | 151 | | | | 115,400 | | | | 114,856 | | | | — | | | | (544 | ) |
Expiring 01/18/19 | | Toronto Dominion | | CAD | 130 | | | | 99,000 | | | | 98,619 | | | | — | | | | (381 | ) |
Expiring 01/18/19 | | Toronto Dominion | | CAD | 120 | | | | 92,000 | | | | 91,573 | | | | — | | | | (427 | ) |
Chilean Peso, | |
Expiring 12/19/18 | | JPMorgan Chase | | CLP | 63,610 | | | | 95,250 | | | | 91,463 | | | | — | | | | (3,787 | ) |
Colombian Peso, | |
Expiring 12/14/18 | | Citibank NA | | COP | 203,598 | | | | 64,450 | | | | 63,117 | | | | — | | | | (1,333 | ) |
Expiring 12/14/18 | | JPMorgan Chase | | COP | 200,389 | | | | 62,634 | | | | 62,122 | | | | — | | | | (512 | ) |
Czech Koruna, | |
Expiring 01/25/19 | | UBS AG | | CZK | 2,054 | | | | 92,000 | | | | 90,441 | | | | — | | | | (1,559 | ) |
Euro, | |
Expiring 01/25/19 | | Deutsche Bank AG | | EUR | 44 | | | | 51,090 | | | | 50,829 | | | | — | | | | (261 | ) |
Expiring 02/25/19 | | Citibank NA | | EUR | 25 | | | | 29,615 | | | | 28,629 | | | | — | | | | (986 | ) |
Expiring 04/30/19 | | Citibank NA | | EUR | 23 | | | | 29,590 | | | | 26,485 | | | | — | | | | (3,105 | ) |
Indian Rupee, | |
Expiring 01/11/19 | | Goldman Sachs International | | INR | 7,042 | | | | 94,011 | | | | 94,413 | | | | 402 | | | | — | |
Expiring 01/11/19 | | Goldman Sachs International | | INR | 6,732 | | | | 90,375 | | | | 90,259 | | | | — | | | | (116 | ) |
Expiring 01/11/19 | | JPMorgan Chase | | INR | 26,212 | | | | 351,882 | | | | 351,406 | | | | — | | | | (476 | ) |
Expiring 01/11/19 | | JPMorgan Chase | | INR | 21,127 | | | | 280,853 | | | | 283,240 | | | | 2,387 | | | | — | |
Indonesian Rupiah, | |
Expiring 12/19/18 | | Barclays Bank PLC | | IDR | 4,821,132 | | | | 316,237 | | | | 315,016 | | | | — | | | | (1,221 | ) |
Expiring 12/19/18 | | Barclays Bank PLC | | IDR | 3,404,961 | | | | 224,958 | | | | 222,483 | | | | — | | | | (2,475 | ) |
Expiring 12/19/18 | | Barclays Bank PLC | | IDR | 1,532,200 | | | | 100,000 | | | | 100,115 | | | | 115 | | | | — | |
Expiring 12/19/18 | | JPMorgan Chase | | IDR | 2,805,245 | | | | 184,749 | | | | 183,297 | | | | — | | | | (1,452 | ) |
Expiring 12/19/18 | | JPMorgan Chase | | IDR | 640,689 | | | | 41,999 | | | | 41,863 | | | | — | | | | (136 | ) |
See Notes to Financial Statements.
| | | | |
| PGIM International Bond Fund | | | 31 | |
Schedule of Investments (continued)
as of October 31, 2018
Forward foreign currency exchange contracts outstanding at October 31, 2018 (continued):
| | | | | | | | | | | | | | | | | | | | | | |
Purchase Contracts | | Counterparty | | Notional
Amount
(000) | | | Value at
Settlement
Date | | | Current
Value | | | Unrealized
Appreciation | | | Unrealized
Depreciation | |
OTC Forward Foreign Currency Exchange Contracts (cont’d.): | |
Israeli Shekel, | |
Expiring 01/28/19 | | Barclays Bank PLC | | ILS | 140 | | | $ | 37,900 | | | $ | 37,895 | | | $ | — | | | $ | (5 | ) |
Japanese Yen, | |
Expiring 01/25/19 | | Toronto Dominion | | JPY | 8,394 | | | | 75,000 | | | | 74,978 | | | | — | | | | (22 | ) |
Expiring 01/25/19 | | UBS AG | | JPY | 1,033 | | | | 9,255 | | | | 9,231 | | | | — | | | | (24 | ) |
Malaysian Ringgit, | |
Expiring 12/05/18 | | Barclays Bank PLC | | MYR | 384 | | | | 92,921 | | | | 91,810 | | | | — | | | | (1,111 | ) |
Mexican Peso, | |
Expiring 01/29/19 | | UBS AG | | MXN | 2,075 | | | | 105,000 | | | | 100,633 | | | | — | | | | (4,367 | ) |
Expiring 01/29/19 | | UBS AG | | MXN | 1,879 | | | | 95,000 | | | | 91,111 | | | | — | | | | (3,889 | ) |
New Taiwanese Dollar, | |
Expiring 01/11/19 | | Citibank NA | | TWD | 2,365 | | | | 77,000 | | | | 76,886 | | | | — | | | | (114 | ) |
Expiring 01/11/19 | | JPMorgan Chase | | TWD | 2,488 | | | | 81,000 | | | | 80,893 | | | | — | | | | (107 | ) |
Expiring 01/11/19 | | JPMorgan Chase | | TWD | 2,412 | | | | 78,000 | | | | 78,427 | | | | 427 | | | | — | |
Expiring 01/11/19 | | Morgan Stanley | | TWD | 2,967 | | | | 96,000 | | | | 96,472 | | | | 472 | | | | — | |
New Zealand Dollar, | |
Expiring 01/18/19 | | Toronto Dominion | | NZD | 127 | | | | 84,000 | | | | 83,108 | | | | — | | | | (892 | ) |
Expiring 01/18/19 | | UBS AG | | NZD | 119 | | | | 78,000 | | | | 77,528 | | | | — | | | | (472 | ) |
Norwegian Krone, | |
Expiring 01/25/19 | | Bank of America | | NOK | 1,318 | | | | 160,403 | | | | 157,023 | | | | — | | | | (3,380 | ) |
Peruvian Nuevo Sol, | |
Expiring 12/19/18 | | Barclays Bank PLC | | PEN | 126 | | | | 37,800 | | | | 37,376 | | | | — | | | | (424 | ) |
Expiring 12/19/18 | | BNP Paribas | | PEN | 1,048 | | | | 316,801 | | | | 310,186 | | | | — | | | | (6,615 | ) |
Expiring 12/19/18 | | Citibank NA | | PEN | 601 | | | | 180,497 | | | | 177,904 | | | | — | | | | (2,593 | ) |
Expiring 12/19/18 | | JPMorgan Chase | | PEN | 308 | | | | 92,670 | | | | 91,053 | | | | — | | | | (1,617 | ) |
Expiring 12/19/18 | | JPMorgan Chase | | PEN | 306 | | | | 92,462 | | | | 90,715 | | | | — | | | | (1,747 | ) |
Expiring 12/19/18 | | UBS AG | | PEN | 244 | | | | 73,000 | | | | 72,243 | | | | — | | | | (757 | ) |
Philippine Peso, | |
Expiring 12/14/18 | | Barclays Bank PLC | | PHP | 5,351 | | | | 98,000 | | | | 99,711 | | | | 1,711 | | | | — | |
Expiring 12/14/18 | | Barclays Bank PLC | | PHP | 4,145 | | | | 76,000 | | | | 77,238 | | | | 1,238 | | | | — | |
Expiring 12/14/18 | | Barclays Bank PLC | | PHP | 3,767 | | | | 69,000 | | | | 70,188 | | | | 1,188 | | | | — | |
Expiring 12/14/18 | | Barclays Bank PLC | | PHP | 3,757 | | | | 69,000 | | | | 70,015 | | | | 1,015 | | | | — | |
Expiring 12/14/18 | | Citibank NA | | PHP | 3,957 | | | | 73,000 | | | | 73,727 | | | | 727 | | | | — | |
Expiring 12/14/18 | | JPMorgan Chase | | PHP | 4,888 | | | | 90,000 | | | | 91,081 | | | | 1,081 | | | | — | |
Expiring 12/14/18 | | JPMorgan Chase | | PHP | 3,942 | | | | 73,000 | | | | 73,455 | | | | 455 | | | | — | |
Expiring 12/14/18 | | JPMorgan Chase | | PHP | 2,025 | | | | 37,900 | | | | 37,729 | | | | — | | | | (171 | ) |
Expiring 12/14/18 | | Morgan Stanley | | PHP | 7,061 | | | | 130,000 | | | | 131,566 | | | | 1,566 | | | | — | |
Expiring 12/14/18 | | Morgan Stanley | | PHP | 6,863 | | | | 126,000 | | | | 127,888 | | | | 1,888 | | | | — | |
Expiring 12/14/18 | | Morgan Stanley | | PHP | 4,934 | | | | 90,000 | | | | 91,936 | | | | 1,936 | | | | — | |
Russian Ruble, | |
Expiring 12/19/18 | | Barclays Bank PLC | | RUB | 5,868 | | | | 89,000 | | | | 88,525 | | | | — | | | | (475 | ) |
Expiring 12/19/18 | | Barclays Bank PLC | | RUB | 4,834 | | | | 72,000 | | | | 72,929 | | | | 929 | | | | — | |
See Notes to Financial Statements.
Forward foreign currency exchange contracts outstanding at October 31, 2018 (continued):
| | | | | | | | | | | | | | | | | | | | | | |
Purchase Contracts | | Counterparty | | Notional
Amount
(000) | | | Value at
Settlement
Date | | | Current
Value | | | Unrealized
Appreciation | | | Unrealized
Depreciation | |
OTC Forward Foreign Currency Exchange Contracts (cont’d.): | |
Singapore Dollar, | |
Expiring 11/09/18 | | Citibank NA | | SGD | 126 | | | $ | 92,000 | | | $ | 90,709 | | | $ | — | | | $ | (1,291 | ) |
Expiring 11/09/18 | | Deutsche Bank AG | | SGD | 207 | | | | 151,000 | | | | 149,367 | | | | — | | | | (1,633 | ) |
Expiring 11/09/18 | | JPMorgan Chase | | SGD | 110 | | | | 81,000 | | | | 79,590 | | | | — | | | | (1,410 | ) |
Expiring 11/09/18 | | UBS AG | | SGD | 138 | | | | 101,000 | | | | 99,476 | | | | — | | | | (1,524 | ) |
Expiring 11/09/18 | | UBS AG | | SGD | 128 | | | | 94,000 | | | | 92,663 | | | | — | | | | (1,337 | ) |
South African Rand, | |
Expiring 12/07/18 | | Deutsche Bank AG | | ZAR | 1,234 | | | | 84,000 | | | | 83,260 | | | | — | | | | (740 | ) |
Expiring 12/07/18 | | UBS AG | | ZAR | 1,222 | | | | 85,000 | | | | 82,421 | | | | — | | | | (2,579 | ) |
Expiring 12/07/18 | | UBS AG | | ZAR | 1,110 | | | | 77,000 | | | | 74,872 | | | | — | | | | (2,128 | ) |
South Korean Won, | |
Expiring 01/16/19 | | JPMorgan Chase | | KRW | 109,895 | | | | 97,399 | | | | 96,706 | | | | — | | | | (693 | ) |
Swiss Franc, | |
Expiring 01/25/19 | | Toronto Dominion | | CHF | 72 | | | | 73,000 | | | | 72,125 | | | | — | | | | (875 | ) |
Thai Baht, | |
Expiring 11/09/18 | | Citibank NA | | THB | 4,058 | | | | 124,000 | | | | 122,434 | | | | — | | | | (1,566 | ) |
Expiring 11/09/18 | | Citibank NA | | THB | 3,964 | | | | 122,780 | | | | 119,592 | | | | — | | | | (3,188 | ) |
Expiring 11/09/18 | | Citibank NA | | THB | 3,730 | | | | 115,000 | | | | 112,547 | | | | — | | | | (2,453 | ) |
Expiring 11/09/18 | | Citibank NA | | THB | 3,598 | | | | 110,000 | | | | 108,556 | | | | — | | | | (1,444 | ) |
Expiring 11/09/18 | | Citibank NA | | THB | 3,069 | | | | 95,000 | | | | 92,608 | | | | — | | | | (2,392 | ) |
Expiring 11/09/18 | | Citibank NA | | THB | 3,004 | | | | 91,000 | | | | 90,649 | | | | — | | | | (351 | ) |
Expiring 11/09/18 | | Citibank NA | | THB | 2,217 | | | | 68,000 | | | | 66,896 | | | | — | | | | (1,104 | ) |
Turkish Lira, | |
Expiring 12/07/18 | | Barclays Bank PLC | | TRY | 485 | | | | 84,000 | | | | 84,752 | | | | 752 | | | | — | |
Expiring 12/07/18 | | JPMorgan Chase | | TRY | 383 | | | | 61,271 | | | | 66,947 | | | | 5,676 | | | | — | |
Expiring 12/07/18 | | Morgan Stanley | | TRY | 452 | | | | 70,000 | | | | 78,960 | | | | 8,960 | | | | — | |
Expiring 12/07/18 | | Toronto Dominion | | TRY | 484 | | | | 76,000 | | | | 84,542 | | | | 8,542 | | | | — | |
| | | | | | | | | | | | | | | | | | | | | | |
| | | | | | | | $ | 7,898,831 | | | $ | 7,846,405 | | | | 42,060 | | | | (94,486 | ) |
| | | | | | | | | | | | | | | | | | | | | | |
| | | | | | | | | | | | | | | | | | | | | | |
Sale Contracts | | Counterparty | | Notional
Amount
(000) | | | Value at
Settlement
Date | | | Current
Value | | | Unrealized
Appreciation | | | Unrealized
Depreciation | |
OTC Forward Foreign Currency Exchange Contracts: | |
| Australian Dollar, | | | | | | | | | | | | | | | | | | | | | | |
Expiring 01/18/19 | | Bank of America | | AUD | 86 | | | $ | 61,235 | | | $ | 61,290 | | | $ | — | | | $ | (55 | ) |
Expiring 01/18/19 | | Morgan Stanley | | AUD | 119 | | | | 84,000 | | | | 84,048 | | | | — | | | | (48 | ) |
Expiring 01/18/19 | | Toronto Dominion | | AUD | 308 | | | | 219,322 | | | | 218,445 | | | | 877 | | | | — | |
| Brazilian Real, | | | | | | | | | | | | | | | | | | | | | | |
Expiring 12/04/18 | | Goldman Sachs International | | BRL | 376 | | | | 92,670 | | | | 100,809 | | | | — | | | | (8,139 | ) |
See Notes to Financial Statements.
| | | | |
| PGIM International Bond Fund | | | 33 | |
Schedule of Investments (continued)
as of October 31, 2018
Forward foreign currency exchange contracts outstanding at October 31, 2018 (continued):
| | | | | | | | | | | | | | | | | | | | | | |
Sale Contracts | | Counterparty | | Notional
Amount
(000) | | | Value at
Settlement
Date | | | Current
Value | | | Unrealized
Appreciation | | | Unrealized
Depreciation | |
OTC Forward Foreign Currency Exchange Contracts (cont’d.): | |
| Brazilian Real (cont’d.), | | | | | | | | | | | | | | | | | | | | |
Expiring 12/04/18 | | Goldman Sachs International | | BRL | 157 | | | $ | 42,114 | | | $ | 41,959 | | | $ | 155 | | | $ | — | |
Expiring 12/04/18 | | JPMorgan Chase | | BRL | 224 | | | | 60,094 | | | | 60,114 | | | | — | | | | (20 | ) |
Expiring 02/25/19 | | Citibank NA | | BRL | 116 | | | | 29,520 | | | | 30,862 | | | | — | | | | (1,342 | ) |
Expiring 04/30/19 | | Hong Kong & Shanghai Bank | | BRL | 211 | | | | 58,000 | | | | 55,770 | | | | 2,230 | | | | — | |
| British Pound, | | | | | | | | | | | | | | | | | | | | |
Expiring 12/19/18 | | Bank of America | | GBP | 2,798 | | | | 3,627,745 | | | | 3,586,278 | | | | 41,467 | | | | — | |
Expiring 01/25/19 | | UBS AG | | GBP | 23 | | | | 30,133 | | | | 30,153 | | | | — | | | | (20 | ) |
| Canadian Dollar, | | | | | | | | | | | | | | | | | | | | |
Expiring 01/18/19 | | Deutsche Bank AG | | CAD | 474 | | | | 364,101 | | | | 360,881 | | | | 3,220 | | | | — | |
Expiring 01/18/19 | | Goldman Sachs International | | CAD | 159 | | | | 122,166 | | | | 120,660 | | | | 1,506 | | | | — | |
Expiring 01/18/19 | | Toronto Dominion | | CAD | 104 | | | | 80,000 | | | | 78,997 | | | | 1,003 | | | | — | |
| Chilean Peso, | | | | | | | | | | | | | | | | | | | | |
Expiring 12/19/18 | | BNP Paribas | | CLP | 300,830 | | | | 447,117 | | | | 432,555 | | | | 14,562 | | | | — | |
| Chinese Renminbi, | | | | | | | | | | | | | | | | | | | | |
Expiring 01/28/19 | | Deutsche Bank AG | | CNH | 1,228 | | | | 176,000 | | | | 175,254 | | | | 746 | | | | — | |
Expiring 01/28/19 | | Morgan Stanley | | CNH | 5,332 | | | | 764,439 | | | | 760,845 | | | | 3,594 | | | | — | |
| Colombian Peso, | | | | | | | | | | | | | | | | | | | | |
Expiring 12/14/18 | | Barclays Bank PLC | | COP | 250,628 | | | | 83,000 | | | | 77,697 | | | | 5,303 | | | | — | |
Expiring 12/14/18 | | Barclays Bank PLC | | COP | 228,629 | | | | 76,000 | | | | 70,877 | | | | 5,123 | | | | — | |
Expiring 12/14/18 | | Citibank NA | | COP | 582,746 | | | | 186,703 | | | | 180,656 | | | | 6,047 | | | | — | |
| Czech Koruna, | | | | | | | | | | | | | | | | | | | | |
Expiring 01/25/19 | | Citibank NA | | CZK | 6,311 | | | | 280,490 | | | | 277,821 | | | | 2,669 | | | | — | |
Expiring 01/25/19 | | Deutsche Bank AG | | CZK | 6,311 | | | | 282,171 | | | | 277,821 | | | | 4,350 | | | | — | |
| Euro, | | | | | | | | | | | | | | | | | | | | |
Expiring 12/19/18 | | UBS AG | | EUR | 16,374 | | | | 18,727,129 | | | | 18,631,151 | | | | 95,978 | | | | — | |
Expiring 01/25/19 | | Morgan Stanley | | EUR | 100 | | | | 114,857 | | | | 114,206 | | | | 651 | | | | — | |
Expiring 01/25/19 | | Toronto Dominion | | EUR | 70 | | | | 80,000 | | | | 79,583 | | | | 417 | | | | — | |
Expiring 01/25/19 | | Toronto Dominion | | EUR | 62 | | | | 71,000 | | | | 71,018 | | | | — | | | | (18 | ) |
Expiring 01/25/19 | | UBS AG | | EUR | 33 | | | | 37,800 | | | | 37,720 | | | | 80 | | | | — | |
Expiring 01/25/19 | | UBS AG | | EUR | 13 | | | | 15,262 | | | | 15,264 | | | | — | | | | (2 | ) |
Expiring 02/25/19 | | Citibank NA | | EUR | 100 | | | | 126,865 | | | | 114,515 | | | | 12,350 | | | | — | |
| Hungarian Forint, | | | | | | | | | | | | | | | | | | | | |
Expiring 01/25/19 | | JPMorgan Chase | | HUF | 58,619 | | | | 211,354 | | | | 206,059 | | | | 5,295 | | | | — | |
Expiring 01/25/19 | | Toronto Dominion | | HUF | 79,740 | | | | 285,920 | | | | 280,304 | | | | 5,616 | | | | — | |
Expiring 01/25/19 | | Toronto Dominion | | HUF | 39,275 | | | | 141,063 | | | | 138,059 | | | | 3,004 | | | | — | |
Expiring 01/25/19 | | UBS AG | | HUF | 22,641 | | | | 80,000 | | | | 79,588 | | | | 412 | | | | — | |
| Indian Rupee, | | | | | | | | | | | | | | | | | | | | |
Expiring 01/11/19 | | JPMorgan Chase | | INR | 5,565 | | | | 75,000 | | | | 74,603 | | | | 397 | | | | — | |
Expiring 01/11/19 | | JPMorgan Chase | | INR | 5,038 | | | | 68,000 | | | | 67,543 | | | | 457 | | | | — | |
See Notes to Financial Statements.
Forward foreign currency exchange contracts outstanding at October 31, 2018 (continued):
| | | | | | | | | | | | | | | | | | | | | | |
Sale Contracts | | Counterparty | | Notional
Amount
(000) | | | Value at
Settlement
Date | | | Current
Value | | | Unrealized
Appreciation | | | Unrealized
Depreciation | |
OTC Forward Foreign Currency Exchange Contracts (cont’d.): | |
| Indian Rupee (cont’d.), | | | | | | | | | | | | | | | | | | | | | | |
Expiring 01/11/19 | | JPMorgan Chase | | INR | 2,832 | | | $ | 37,900 | | | $ | 37,965 | | | $ | — | | | $ | (65 | ) |
| Indonesian Rupiah, | | | | | | | | | | | | | | | | | | | | | | |
Expiring 12/19/18 | | Barclays Bank PLC | | IDR | 2,394,054 | | | | 156,000 | | | | 156,429 | | | | — | | | | (429 | ) |
Expiring 12/19/18 | | Barclays Bank PLC | | IDR | 1,480,241 | | | | 98,000 | | | | 96,720 | | | | 1,280 | | | | — | |
Expiring 12/19/18 | | Barclays Bank PLC | | IDR | 1,426,417 | | | | 94,000 | | | | 93,203 | | | | 797 | | | | — | |
Expiring 12/19/18 | | JPMorgan Chase | | IDR | 1,801,987 | | | | 119,000 | | | | 117,743 | | | | 1,257 | | | | — | |
Expiring 12/19/18 | | JPMorgan Chase | | IDR | 1,736,245 | | | | 113,000 | | | | 113,448 | | | | — | | | | (448 | ) |
Expiring 12/19/18 | | JPMorgan Chase | | IDR | 1,702,252 | | | | 113,000 | | | | 111,226 | | | | 1,774 | | | | — | |
Expiring 12/19/18 | | JPMorgan Chase | | IDR | 1,631,210 | | | | 108,000 | | | | 106,584 | | | | 1,416 | | | | — | |
Expiring 12/19/18 | | JPMorgan Chase | | IDR | 1,625,223 | | | | 107,000 | | | | 106,193 | | | | 807 | | | | — | |
Expiring 12/19/18 | | JPMorgan Chase | | IDR | 1,128,150 | | | | 75,000 | | | | 73,714 | | | | 1,286 | | | | — | |
Expiring 12/19/18 | | JPMorgan Chase | | IDR | 847,741 | | | | 55,975 | | | | 55,392 | | | | 583 | | | | — | |
Expiring 12/19/18 | | JPMorgan Chase | | IDR | 660,850 | | | | 43,025 | | | | 43,180 | | | | — | | | | (155 | ) |
Expiring 12/19/18 | | JPMorgan Chase | | IDR | 201,984 | | | | 13,372 | | | | 13,198 | | | | 174 | | | | — | |
Expiring 12/19/18 | | Morgan Stanley | | IDR | 929,690 | | | | 61,305 | | | | 60,747 | | | | 558 | | | | — | |
| Israeli Shekel, | | | | | | | | | | | | | | | | | | | | | | |
Expiring 01/28/19 | | Citibank NA | | ILS | 871 | | | | 237,763 | | | | 235,832 | | | | 1,931 | | | | — | |
| Japanese Yen, | | | | | | | | | | | | | | | | | | | | | | |
Expiring 01/25/19 | | UBS AG | | JPY | 4,035 | | | | 36,017 | | | | 36,041 | | | | — | | | | (24 | ) |
| Mexican Peso, | | | | | | | | | | | | | | | | | | | | | | |
Expiring 12/19/18 | | JPMorgan Chase | | MXN | 1,606 | | | | 84,000 | | | | 78,426 | | | | 5,574 | | | | — | |
Expiring 12/19/18 | | JPMorgan Chase | | MXN | 547 | | | | 28,510 | | | | 26,725 | | | | 1,785 | | | | — | |
Expiring 12/19/18 | | UBS AG | | MXN | 4,321 | | | | 228,115 | | | | 210,956 | | | | 17,159 | | | | — | |
Expiring 01/29/19 | | UBS AG | | MXN | 1,859 | | | | 95,000 | | | | 90,137 | | | | 4,863 | | | | — | |
| New Taiwanese Dollar, | | | | | | | | | | | | | | | | | | | | | | |
Expiring 01/11/19 | | JPMorgan Chase | | TWD | 2,401 | | | | 78,000 | | | | 78,062 | | | | — | | | | (62 | ) |
Expiring 01/11/19 | | UBS AG | | TWD | 4,532 | | | | 148,935 | | | | 147,358 | | | | 1,577 | | | | — | |
| New Zealand Dollar, | | | | | | | | | | | | | | | | | | | | | | |
Expiring 01/18/19 | | Toronto Dominion | | NZD | 376 | | | | 244,752 | | | | 245,515 | | | | — | | | | (763 | ) |
Expiring 01/18/19 | | Toronto Dominion | | NZD | 106 | | | | 69,000 | | | | 68,969 | | | | 31 | | | | — | |
| Peruvian Nuevo Sol, | | | | | | | | | | | | | | | | | | | | | | |
Expiring 12/19/18 | | JPMorgan Chase | | PEN | 273 | | | | 82,000 | | | | 80,779 | | | | 1,221 | | | | — | |
Expiring 12/19/18 | | Morgan Stanley | | PEN | 236 | | | | 71,000 | | | | 69,728 | | | | 1,272 | | | | — | |
| Philippine Peso, | | | | | | | | | | | | | | | | | | | | | | |
Expiring 12/14/18 | | Barclays Bank PLC | | PHP | 4,000 | | | | 73,800 | | | | 74,535 | | | | — | | | | (735 | ) |
Expiring 12/14/18 | | JPMorgan Chase | | PHP | 7,275 | | | | 133,000 | | | | 135,571 | | | | — | | | | (2,571 | ) |
Expiring 12/14/18 | | JPMorgan Chase | | PHP | 3,838 | | | | 71,000 | | | | 71,521 | | | | — | | | | (521 | ) |
Expiring 12/14/18 | | JPMorgan Chase | | PHP | 3,675 | | | | 68,000 | | | | 68,481 | | | | — | | | | (481 | ) |
Expiring 12/14/18 | | JPMorgan Chase | | PHP | 3,557 | | | | 66,200 | | | | 66,286 | | | | — | | | | (86 | ) |
Expiring 12/14/18 | | Morgan Stanley | | PHP | 6,028 | | | | 110,437 | | | | 112,329 | | | | — | | | | (1,892 | ) |
See Notes to Financial Statements.
| | | | |
| PGIM International Bond Fund | | | 35 | |
Schedule of Investments (continued)
as of October 31, 2018
Forward foreign currency exchange contracts outstanding at October 31, 2018 (continued):
| | | | | | | | | | | | | | | | | | | | | | |
Sale Contracts | | Counterparty | | Notional
Amount
(000) | | | Value at
Settlement
Date | | | Current
Value | | | Unrealized
Appreciation | | | Unrealized
Depreciation | |
OTC Forward Foreign Currency Exchange Contracts (cont’d.): | |
| Polish Zloty, | | | | | | | | | | | | | | | | | | | | | | |
Expiring 01/25/19 | | Goldman Sachs International | | PLN | 1,814 | | | $ | 485,963 | | | $ | 473,943 | | | $ | 12,020 | | | $ | — | |
| Russian Ruble, | | | | | | | | | | | | | | | | | | | | | | |
Expiring 12/19/18 | | JPMorgan Chase | | RUB | 9,341 | | | | 139,049 | | | | 140,915 | | | | — | | | | (1,866 | ) |
Expiring 12/19/18 | | JPMorgan Chase | | RUB | 3,513 | | | | 52,054 | | | | 53,003 | | | | — | | | | (949 | ) |
| Singapore Dollar, | | | | | | | | | | | | | | | | | | | | | | |
Expiring 11/09/18 | | Citibank NA | | SGD | 269 | | | | 197,154 | | | | 194,554 | | | | 2,600 | | | | — | |
Expiring 11/09/18 | | Citibank NA | | SGD | 101 | | | | 74,032 | | | | 72,957 | | | | 1,075 | | | | — | |
Expiring 11/09/18 | | Deutsche Bank AG | | SGD | 111 | | | | 80,000 | | | | 79,988 | | | | 12 | | | | — | |
Expiring 11/09/18 | | Deutsche Bank AG | | SGD | 108 | | | | 78,000 | | | | 78,034 | | | | — | | | | (34 | ) |
Expiring 11/09/18 | | JPMorgan Chase | | SGD | 149 | | | | 109,000 | | | | 107,849 | | | | 1,151 | | | | — | |
Expiring 11/09/18 | | UBS AG | | SGD | 120 | | | | 87,000 | | | | 86,833 | | | | 167 | | | | — | |
| South African Rand, | | | | | | | | | | | | | | | | | | | | | | |
Expiring 11/09/18 | | Citibank NA | | ZAR | 1,090 | | | | 75,767 | | | | 73,790 | | | | 1,977 | | | | — | |
Expiring 12/07/18 | | Barclays Bank PLC | | ZAR | 2,297 | | | | 150,205 | | | | 154,974 | | | | — | | | | (4,769 | ) |
Expiring 12/07/18 | | Barclays Bank PLC | | ZAR | 2,297 | | | | 150,205 | | | | 154,974 | | | | — | | | | (4,769 | ) |
Expiring 12/07/18 | | Citibank NA | | ZAR | 877 | | | | 61,436 | | | | 59,168 | | | | 2,268 | | | | — | |
Expiring 12/07/18 | | Citibank NA | | ZAR | 674 | | | | 46,797 | | | | 45,443 | | | | 1,354 | | | | — | |
Expiring 12/07/18 | | Citibank NA | | ZAR | 424 | | | | 29,198 | | | | 28,594 | | | | 604 | | | | — | |
Expiring 12/07/18 | | Citibank NA | | ZAR | 290 | | | | 19,929 | | | | 19,554 | | | | 375 | | | | — | |
Expiring 12/07/18 | | Goldman Sachs International | | ZAR | 755 | | | | 48,804 | | | | 50,942 | | | | — | | | | (2,138 | ) |
Expiring 12/07/18 | | JPMorgan Chase | | ZAR | 1,137 | | | | 73,000 | | | | 76,689 | | | | — | | | | (3,689 | ) |
Expiring 12/07/18 | | JPMorgan Chase | | ZAR | 738 | | | | 49,119 | | | | 49,803 | | | | — | | | | (684 | ) |
| South Korean Won, | | | | | | | | | | | | | | | | | | | | | | |
Expiring 01/16/19 | | Barclays Bank PLC | | KRW | 144,514 | | | | 127,212 | | | | 127,170 | | | | 42 | | | | — | |
Expiring 01/16/19 | | Barclays Bank PLC | | KRW | 68,771 | | | | 61,271 | | | | 60,517 | | | | 754 | | | | — | |
Expiring 01/16/19 | | JPMorgan Chase | | KRW | 102,362 | | | | 90,000 | | | | 90,076 | | | | — | | | | (76 | ) |
Expiring 01/16/19 | | JPMorgan Chase | | KRW | 100,944 | | | | 90,000 | | | | 88,829 | | | | 1,171 | | | | — | |
Expiring 01/16/19 | | Morgan Stanley | | KRW | 107,759 | | | | 95,000 | | | | 94,826 | | | | 174 | | | | — | |
| Swedish Krona, | | | | | | | | | | | | | | | | | | | | | | |
Expiring 01/25/19 | | Goldman Sachs International | | SEK | 2,738 | | | | 307,098 | | | | 301,818 | | | | 5,280 | | | | — | |
| Swiss Franc, | | | | | | | | | | | | | | | | | | | | | | |
Expiring 01/25/19 | | BNP Paribas | | CHF | 473 | | | | 478,113 | | | | 473,577 | | | | 4,536 | | | | — | |
Expiring 01/25/19 | | Toronto Dominion | | CHF | 473 | | | | 478,573 | | | | 473,577 | | | | 4,996 | | | | — | |
Expiring 01/25/19 | | Toronto Dominion | | CHF | 87 | | | | 87,000 | | | | 86,950 | | | | 50 | | | | — | |
| Thai Baht, | | | | | | | | | | | | | | | | | | | | | | |
Expiring 11/09/18 | | Citibank NA | | THB | 2,597 | | | | 78,000 | | | | 78,347 | | | | — | | | | (347 | ) |
Expiring 11/09/18 | | Citibank NA | | THB | 2,551 | | | | 77,000 | | | | 76,982 | | | | 18 | | | | — | |
| Turkish Lira, | | | | | | | | | | | | | | | | | | | | | | |
Expiring 12/07/18 | | Citibank NA | | TRY | 83 | | | | 12,316 | | | | 14,564 | | | | — | | | | (2,248 | ) |
See Notes to Financial Statements.
Forward foreign currency exchange contracts outstanding at October 31, 2018 (continued):
| | | | | | | | | | | | | | | | | | | | | | |
Sale Contracts | | Counterparty | | Notional
Amount
(000) | | | Value at
Settlement
Date | | | Current
Value | | | Unrealized
Appreciation | | | Unrealized
Depreciation | |
OTC Forward Foreign Currency Exchange Contracts (cont’d.): | |
| Turkish Lira (cont’d.), | | | | | | | | | | | | | | | | | | | | | | |
Expiring 12/07/18 | | JPMorgan Chase | | TRY | 298 | | | $ | 51,200 | | | $ | 52,065 | | | $ | — | | | $ | (865 | ) |
Expiring 12/07/18 | | JPMorgan Chase | | TRY | 72 | | | | 12,360 | | | | 12,575 | | | | — | | | | (215 | ) |
Expiring 04/30/19 | | BNP Paribas | | TRY | 108 | | | | 24,932 | | | | 17,395 | | | | 7,537 | | | | — | |
Expiring 04/30/19 | | BNP Paribas | | TRY | 23 | | | | 5,330 | | | | 3,720 | | | | 1,610 | | | | — | |
Expiring 04/30/19 | | Morgan Stanley | | TRY | 75 | | | | 16,325 | | | | 12,100 | | | | 4,225 | | | | — | |
| | | | | | | | | | | | | | | | | | | | | | |
| | | | | | | | $ | 34,419,818 | | | $ | 34,143,493 | | | | 316,850 | | | | (40,525 | ) |
| | | | | | | | | | | | | | | | | | | | | | |
| | | | | | | | | | | | | | | | $ | 358,910 | | | $ | (135,011 | ) |
| | | | | | | | | | | | | | | | | | | | | | |
Cross currency exchange contracts outstanding at October 31, 2018:
| | | | | | | | | | | | | | | | | | | | | | | | |
Settlement | | Type | | Notional
Amount
(000) | | | In Exchange
For (000) | | | Unrealized
Appreciation | | | Unrealized
Depreciation | | | Counterparty |
OTC Cross Currency Exchange Contracts: |
01/25/19 | | Buy | | CHF | 80 | | | | EUR | | | | 70 | | | $ | — | | | $ | (34 | ) | | Toronto Dominion |
04/30/19 | | Buy | | EUR | 107 | | | | TRY | | | | 520 | | | | 39,691 | | | | — | | | BNP Paribas |
04/30/19 | | Buy | | TRY | 725 | | | | EUR | | | | 130 | | | | — | | | | (33,158 | ) | | Citibank NA |
| | | | | | | | | | | | | | | | | | | | | | | | |
| | | $ | 39,691 | | | $ | (33,192 | ) | | |
| | | | | | | | | | | | | | | | | | | | | | | | |
Credit default swap agreements outstanding at October 31, 2018:
| | | | | | | | | | | | | | | | | | | | | | | | | | |
Reference
Entity/
Obligation | | Termination
Date | | | Fixed
Rate | | | Notional
Amount
(000)#(3) | | | Fair
Value | | | Upfront
Premiums
Paid
(Received) | | | Unrealized
Appreciation
(Depreciation) | | | Counterparty |
OTC Credit Default Swap Agreements on corporate and/or sovereign issues—Buy Protection(1): |
Assicurazioni Generali SpA | | | 06/20/23 | | | | 1.000%(Q) | | | EUR | 100 | | | $ | 7,067 | | | $ | 6,597 | | | $ | 470 | | | Barclays Bank PLC |
Kingdom of Spain | | | 06/20/23 | | | | 1.000%(Q) | | | | 100 | | | | (2,146 | ) | | | (2,474 | ) | | | 328 | | | Bank of America |
Republic of Argentina | | | 03/20/19 | | | | 5.000%(Q) | | | | 200 | | | | (2,852 | ) | | | (1,119 | ) | | | (1,733 | ) | | Hong Kong & Shanghai Bank |
Republic of Italy | | | 06/20/23 | | | | 1.000%(Q) | | | | 230 | | | | 5,096 | | | | 3,309 | | | | 1,787 | | | Citibank NA |
Republic of Italy | | | 06/20/23 | | | | 1.000%(Q) | | | EUR | 210 | | | | 12,026 | | | | 3,023 | | | | 9,003 | | | Barclays Bank PLC |
Republic of Italy | | | 06/20/28 | | | | 1.000%(Q) | | | EUR | 105 | | | | 13,594 | | | | 6,523 | | | | 7,071 | | | Barclays Bank PLC |
Republic of Turkey | | | 06/20/19 | | | | 1.000%(Q) | | | | 80 | | | | 927 | | | | 2,315 | | | | (1,388 | ) | | BNP Paribas |
Republic of Turkey | | | 06/20/19 | | | | 1.000%(Q) | | | | 40 | | | | 463 | | | | 932 | | | | (469 | ) | | BNP Paribas |
| | | | | | | | | | | | | | | | | | | | | | | | | | |
| | | | | | | | | | | | | | $ | 34,175 | | | $ | 19,106 | | | $ | 15,069 | | | |
| | | | | | | | | | | | | | | | | | | | | | | | | | |
See Notes to Financial Statements.
| | | | |
| PGIM International Bond Fund | | | 37 | |
Schedule of Investments (continued)
as of October 31, 2018
Credit default swap agreements outstanding at October 31, 2018 (continued):
| | | | | | | | | | | | | | | | | | | | | | | | | | | | | | |
Reference
Entity/
Obligation | | Termination
Date | | | Fixed
Rate | | | Notional
Amount
(000)#(3) | | | Implied
Credit
Spread at
October 31,
2018(4) | | | Fair
Value | | | Upfront
Premiums
Paid
(Received) | | | Unrealized
Appreciation
(Depreciation) | | | Counterparty |
OTC Credit Default Swap Agreements on corporate and/or sovereign issues—Sell Protection(2): |
Arab Republic of Egypt | | | 06/20/19 | | | | 1.000%(Q) | | | | 70 | | | | 1.882 | % | | $ | (308 | ) | | $ | (209 | ) | | $ | (99 | ) | | Citibank NA |
Generalitat de Cataluna | | | 12/20/22 | | | | 1.000%(Q) | | | | 110 | | | | 2.520 | % | | | (5,936 | ) | | | (16,415 | ) | | | 10,479 | | | Citibank NA |
Kingdom of Spain | | | 06/20/23 | | | | 1.000%(Q) | | | | 100 | | | | 0.773 | % | | | 1,085 | | | | 1,515 | | | | (430 | ) | | Bank of America |
Kingdom of Spain | | | 06/20/23 | | | | 1.000%(Q) | | | | 830 | | | | 0.773 | % | | | 9,001 | | | | 8,739 | | | | 262 | | | Bank of America |
Republic of Hungary | | | 06/20/22 | | | | 1.000%(Q) | | | | 450 | | | | 0.580 | % | | | 7,039 | | | | (2,888 | ) | | | 9,927 | | | Citibank NA |
Republic of Indonesia | | | 06/20/23 | | | | 1.000%(Q) | | | | 220 | | | | 1.440 | % | | | (3,805 | ) | | | (1,391 | ) | | | (2,414 | ) | | Citibank NA |
Republic of Ireland | | | 06/20/27 | | | | 1.000%(Q) | | | | 100 | | | | 0.056 | % | | | 3,392 | | | | 2,524 | | | | 868 | | | Morgan Stanley |
Republic of Italy | | | 06/20/23 | | | | 1.000%(Q) | | | | 350 | | | | 2.605 | % | | | (22,099 | ) | | | (19,820 | ) | | | (2,279 | ) | | Bank of America |
Republic of Italy | | | 06/20/23 | | | | 1.000%(Q) | | | | 230 | | | | 2.605 | % | | | (14,522 | ) | | | (12,007 | ) | | | (2,515 | ) | | Citibank NA |
Republic of Italy | | | 06/20/23 | | | | 1.000%(Q) | | | | 375 | | | | 2.605 | % | | | (23,678 | ) | | | (15,251 | ) | | | (8,427 | ) | | Morgan Stanley |
Republic of Kazakhstan | | | 06/20/23 | | | | 1.000%(Q) | | | | 115 | | | | 0.688 | % | | | 1,681 | | | | — | | | | 1,681 | | | Citibank NA |
Republic of Panama | | | 06/20/22 | | | | 1.000%(Q) | | | | 100 | | | | 0.443 | % | | | 2,039 | | | | 852 | | | | 1,187 | | | Citibank NA |
Republic of Portugal | | | 06/20/23 | | | | 1.000%(Q) | | | | 640 | | | | 0.927 | % | | | 2,723 | | | | (2,428 | ) | | | 5,151 | | | Goldman Sachs International |
Republic of Portugal | | | 12/20/23 | | | | 1.000%(Q) | | | | 100 | | | | 0.993 | % | | | 149 | | | | (57 | ) | | | 206 | | | Morgan Stanley |
Republic of Turkey | | | 06/20/23 | | | | 1.000%(Q) | | | | 40 | | | | 3.775 | % | | | (4,311 | ) | | | (5,231 | ) | | | 920 | | | BNP Paribas |
Republic of Turkey | | | 06/20/23 | | | | 1.000%(Q) | | | | 80 | | | | 3.775 | % | | | (8,623 | ) | | | (10,983 | ) | | | 2,360 | | | BNP Paribas |
Russian Federation | | | 12/20/22 | | | | 1.000%(Q) | | | | 50 | | | | 1.272 | % | | | (460 | ) | | | (125 | ) | | | (335 | ) | | Citibank NA |
Russian Federation | | | 06/20/23 | | | | 1.000%(Q) | | | | 60 | | | | 1.380 | % | | | (892 | ) | | | (1,176 | ) | | | 284 | | | BNP Paribas |
Russian Federation | | | 06/20/23 | | | | 1.000%(Q) | | | | 150 | | | | 1.380 | % | | | (2,229 | ) | | | (2,497 | ) | | | 268 | | | Morgan Stanley |
Russian Federation | | | 06/20/23 | | | | 1.000%(Q) | | | | 200 | | | | 1.380 | % | | | (2,972 | ) | | | (3,983 | ) | | | 1,011 | | | Morgan Stanley |
Russian Federation | | | 12/20/26 | | | | 1.000%(Q) | | | | 100 | | | | 1.857 | % | | | (5,637 | ) | | | (10,974 | ) | | | 5,337 | | | Barclays Bank PLC |
See Notes to Financial Statements.
Credit default swap agreements outstanding at October 31, 2018 (continued):
| | | | | | | | | | | | | | | | | | | | | | | | | | | | | | |
Reference
Entity/
Obligation | | Termination
Date | | | Fixed
Rate | | | Notional
Amount
(000)#(3) | | | Implied
Credit
Spread at
October 31,
2018(4) | | | Fair
Value | | | Upfront
Premiums
Paid
(Received) | | | Unrealized
Appreciation
(Depreciation) | | | Counterparty |
OTC Credit Default Swap Agreements on corporate and/or sovereign issues—Sell Protection(2)(cont’d.): |
State of Illinois | | | 12/20/22 | | | | 1.000%(Q) | | | | 100 | | | | 1.562 | % | | $ | (1,971 | ) | | $ | (4,071 | ) | | $ | 2,100 | | | Citibank NA |
State of Illinois | | | 12/20/24 | | | | 1.000%(Q) | | | | 100 | | | | 2.095 | % | | | (5,414 | ) | | | (6,999 | ) | | | 1,585 | | | Goldman Sachs International |
| | | | | | | | | | | | | | | | | | | | | | | | | | | | | | |
| | | | | | | | | | | | | | | | | | $ | (75,748 | ) | | $ | (102,875 | ) | | $ | 27,127 | | | |
| | | | | | | | | | | | | | | | | | | | | | | | | | | | | | |
| | | | | | | | | | | | | | | | | | | | | | | | |
Reference
Entity/
Obligation | | Termination
Date | | | Fixed
Rate | | | Notional
Amount
(000)#(3) | | | Value at
Trade
Date | | | Value at
October 31,
2018 | | | Unrealized
Appreciation
(Depreciation) | |
Centrally Cleared Credit Default Swap Agreements on credit indices—Buy Protection(1): | |
CDX.NA.IG.30.V1 | | | 06/20/28 | | | | 1.000%(Q) | | | | 238 | | | $ | 716 | | | $ | 1,802 | | | $ | 1,086 | |
CDX.NA.IG.31.V1 | | | 12/20/23 | | | | 1.000%(Q) | | | | 2,000 | | | | (37,566 | ) | | | (31,817 | ) | | | 5,749 | |
iTraxx.EUR.28.V1 | | | 12/20/27 | | | | 1.000%(Q) | | | EUR | 204 | | | | (682 | ) | | | 573 | | | | 1,255 | |
| | | | | | | | | | | | | | | | | | | | | | | | |
| | | | | | | | | | | | | | $ | (37,532 | ) | | $ | (29,442 | ) | | $ | 8,090 | |
| | | | | | | | | | | | | | | | | | | | | | | | |
| | | | | | | | | | | | | | | | | | | | | | | | | | | | |
Reference
Entity/
Obligation | | Termination
Date | | | Fixed
Rate | | | Notional
Amount
(000)#(3) | | | Implied
Credit
Spread at
October 31,
2018(4) | | | Value at
Trade
Date | | | Value at
October 31,
2018 | | | Unrealized
Appreciation
(Depreciation) | |
Centrally Cleared Credit Default Swap Agreement on credit indices—Sell Protection(2): | |
CDX.NA.HY.30.V1 | | | 06/20/23 | | | | 5.000%(Q) | | | | 67 | | | | 3.457 | % | | $ | 4,939 | | | $ | 4,412 | | | $ | (527 | ) |
| | | | | | | | | | | | | | | | | | | | | | | | | | | | |
| | | | | | | | | | | | | | | | | | | | | | | | | | | | | | |
Reference
Entity/
Obligation | | Termination
Date | | | Fixed
Rate | | | Notional
Amount
(000)#(3) | | | Implied
Credit
Spread at
October 31,
2018(4) | | | Fair
Value | | | Upfront
Premiums
Paid
(Received) | | | Unrealized
Appreciation
(Depreciation) | | | Counterparty |
OTC Credit Default Swap Agreements on credit indices—Sell Protection(2): |
CDX.EM.27.V2 | | | 06/20/22 | | | | 1.000%(Q) | | | | 485 | | | | 1.611 | % | | $ | (9,345 | ) | | $ | (20,957 | ) | | $ | 11,612 | | | Citibank NA |
CMBX.NA.6.AA | | | 05/11/63 | | | | 1.500%(M) | | | | 200 | | | | * | | | | 1,687 | | | | (1,136 | ) | | | 2,823 | | | JPMorgan Securities |
| | | | | | | | | | | | | | | | | | | | | | | | | | | | | | |
| | | | | | | | | | | | | | | | | | $ | (7,658 | ) | | $ | (22,093 | ) | | $ | 14,435 | | | |
| | | | | | | | | | | | | | | | | | | | | | | | | | | | | | |
The Fund entered into credit default swaps (“CDS”) to provide a measure of protection against defaults or to take an active long or short position with respect to the likelihood of a particular issuer’s default or the reference entity’s credit soundness. CDS contracts generally trade based on a spread which represents the cost a protection buyer has to pay the protection seller. The protection buyer is said to be short the credit as the value of the contract rises the more the credit deteriorates. The value of the CDS contract increases for the protection buyer if the spread increases.
See Notes to Financial Statements.
| | | | |
| PGIM International Bond Fund | | | 39 | |
Schedule of Investments (continued)
as of October 31, 2018
| (1) | If the Fund is a buyer of protection, it pays the fixed rate. When a credit event occurs, as defined under the terms of that particular swap agreement, the Fund will either (i) receive from the seller of protection an amount equal to the notional amount of the swap and make delivery of the referenced obligation or underlying securities comprising the referenced index or (ii) receive a net settlement amount in the form of cash or securities equal to the notional amount of the swap less the recovery value of the referenced obligation or underlying securities comprising the referenced index. |
| (2) | If the Fund is a seller of protection, it receives the fixed rate. When a credit event occurs, as defined under the terms of that particular swap agreement, the Fund will either (i) pay to the buyer of protection an amount equal to the notional amount of the swap and take delivery of the referenced obligation or underlying securities comprising the referenced index or (ii) pay a net settlement amount in the form of cash or securities equal to the notional amount of the swap less the recovery value of the referenced obligation or underlying securities comprising the referenced index. |
| (3) | Notional amount represents the maximum potential amount the Fund could be required to pay as a seller of credit protection or receive as a buyer of credit protection if a credit event occurs as defined under the terms of that particular swap agreement. |
| (4) | Implied credit spreads, represented in absolute terms, utilized in determining the fair value of credit default swap agreements where the Fund is the seller of protection as of the reporting date serve as an indicator of the current status of the payment/ performance risk and represent the likelihood of risk of default for the credit derivative. The implied credit spread of a particular referenced entity reflects the cost of buying/selling protection and may include up-front payments required to be made to enter into the agreement. Wider credit spreads represent a deterioration of the referenced entity’s credit soundness and a greater likelihood of risk of default or other credit event occurring as defined under the terms of the agreement. |
| * | When an implied credit spread is not available, reference the fair value of credit default swap agreements on credit indices and asset-backed securities. Where the Fund is the seller of protection, it serves as an indicator of the current status of the payment/performance risk and represents the likelihood of an expected liability (or profit) for the credit derivative should the notional amount of the swap agreement be closed/sold as of the reporting date. Increasing fair value in absolute terms, when compared to the notional amount of the swap, represents a deterioration of the referenced entity’s credit soundness and a greater likelihood of risk of default or other credit event occurring as defined under the terms of the agreement. |
Forward rate agreements outstanding at October 31, 2018:
| | | | | | | | | | | | | | | | | | | | | | | | | | |
Notional
Amount
(000)# | | Termination
Date | | | Fixed
Rate | | | Floating Rate | | | Fair
Value | | | Upfront
Premiums
Paid
(Received) | | | Unrealized
Appreciation
(Depreciation) | | | Counterparty |
OTC Forward Rate Agreements^: |
| 275 | | | 07/16/19 | | | | 2.180%(T) | | |
| CM MUNI 5
Year(1)(T) |
| | $ | 3,861 | | | $ | — | | | $ | 3,861 | | | Citigroup Global Markets |
| 275 | | | 07/16/19 | | | | 3.145%(T) | | |
| CM MUNI 30
Year(2)(T) |
| | | (5,190 | ) | | | — | | | | (5,190 | ) | | Citigroup Global Markets |
| | | | | | | | | | | | | | | | | | | | | | | | | | |
| | | | | | | | | | | | | | $ | (1,329 | ) | | $ | — | | | $ | (1,329 | ) | | |
| | | | | | | | | | | | | | | | | | | | | | | | | | |
| (1) | The Fund pays the fixed rate and receives the floating rate. |
See Notes to Financial Statements.
| (2) | The Fund pays the floating rate and receives the fixed rate. |
Inflation swap agreements outstanding at October 31, 2018:
| | | | | | | | | | | | | | | | | | | | | | | | |
Notional
Amount
(000)# | | | Termination
Date | | | Fixed
Rate | | | Floating Rate | | Value at
Trade
Date | | | Value at
October 31,
2018 | | | Unrealized
Appreciation
(Depreciation) | |
| Centrally Cleared Inflation Swap Agreements: | |
| EUR | 90 | | | | 08/15/22 | | | | 1.240%(T) | | | Eurostat Eurozone HICP ex Tobacco(2)(T) | | $ | — | | | $ | (1,490 | ) | | $ | (1,490 | ) |
| EUR | 310 | | | | 09/15/22 | | | | 1.260%(T) | | | Eurostat Eurozone HICP ex Tobacco(2)(T) | | | — | | | | (4,897 | ) | | | (4,897 | ) |
| EUR | 325 | | | | 03/15/23 | | | | 1.345%(T) | | | Eurostat Eurozone HICP ex Tobacco(2)(T) | | | — | | | | (2,964 | ) | | | (2,964 | ) |
| EUR | 200 | | | | 05/15/23 | | | | 1.485%(T) | | | France CPI ex Tobacco Household(1)(T) | | | — | | | | (595 | ) | | | (595 | ) |
| EUR | 200 | | | | 05/15/23 | | | | 1.510%(T) | | | Eurostat Eurozone HICP ex Tobacco(2)(T) | | | — | | | | (168 | ) | | | (168 | ) |
| EUR | 45 | | | | 08/15/27 | | | | 1.415%(T) | | | Eurostat Eurozone HICP ex Tobacco(1)(T) | | | — | | | | 785 | | | | 785 | |
| EUR | 150 | | | | 09/15/27 | | | | 1.438%(T) | | | Eurostat Eurozone HICP ex Tobacco(1)(T) | | | — | | | | 2,317 | | | | 2,317 | |
| EUR | 160 | | | | 03/15/28 | | | | 1.512%(T) | | | Eurostat Eurozone HICP ex Tobacco(1)(T) | | | — | | | | 1,042 | | | | 1,042 | |
| GBP | 20 | | | | 08/15/42 | | | | 3.520%(T) | | | U.K. Retail Price Index(2)(T) | | | — | | | | (1,060 | ) | | | (1,060 | ) |
| GBP | 15 | | | | 08/15/47 | | | | 3.469%(T) | | | U.K. Retail Price Index(1)(T) | | | — | | | | 1,227 | | | | 1,227 | |
| GBP | 5 | | | | 10/15/47 | | | | 3.535%(T) | | | U.K. Retail Price Index(2)(T) | | | — | | | | (122 | ) | | | (122 | ) |
| GBP | 5 | | | | 10/15/57 | | | | 3.418%(T) | | | U.K. Retail Price Index(1)(T) | | | — | | | | 332 | | | | 332 | |
| | | | | | | | | | | | | | | | | | | | | | | | |
| | | $ | — | | | $ | (5,593 | ) | | $ | (5,593 | ) |
| | | | | | | | | | | | | | | | | | | | | | | | |
| (1) | The Fund pays the fixed rate and receives the floating rate. |
| (2) | The Fund pays the floating rate and receives the fixed rate. |
Interest rate swap agreements outstanding at October 31, 2018:
| | | | | | | | | | | | | | | | | | | | | | |
Notional
Amount
(000)# | | | Termination
Date | | | Fixed
Rate | | Floating Rate | | Value at
Trade
Date | | | Value at
October 31,
2018 | | | Unrealized
Appreciaton
(Depreciation) | |
| Centrally Cleared Interest Rate Swap Agreements: | |
| AUD | 560 | | | | 09/25/22 | | | 2.958%(S) | | 6 Month BBSW(2)(S) | | $ | — | | | $ | 3,359 | | | $ | 3,359 | |
| AUD | 1,000 | | | | 06/21/23 | | | 2.532%(S) | | 6 Month BBSW(1)(S) | | | (1,508 | ) | | | (4,613 | ) | | | (3,105 | ) |
| AUD | 150 | | | | 05/09/32 | | | 3.140%(S) | | 6 Month BBSW(2)(S) | | | (4 | ) | | | 2,719 | | | | 2,723 | |
| AUD | 165 | | | | 07/19/32 | | | 3.130%(S) | | 6 Month BBSW(2)(S) | | | (5 | ) | | | 2,555 | | | | 2,560 | |
| BRL | 657 | | | | 01/02/25 | | | 9.475%(T) | | 1 Day BROIS(2)(T) | | | — | | | | 907 | | | | 907 | |
| BRL | 724 | | | | 01/02/25 | | | 9.943%(T) | | 1 Day BROIS(2)(T) | | | — | | | | 9,348 | | | | 9,348 | |
| BRL | 305 | | | | 01/02/25 | | | 11.080%(T) | | 1 Day BROIS(2)(T) | | | — | | | | 8,571 | | | | 8,571 | |
| BRL | 98 | | | | 01/02/25 | | | 12.090%(T) | | 1 Day BROIS(2)(T) | | | — | | | | 4,291 | | | | 4,291 | |
| BRL | 196 | | | | 01/04/27 | | | 12.040%(T) | | 1 Day BROIS(2)(T) | | | — | | | | 9,862 | | | | 9,862 | |
See Notes to Financial Statements.
| | | | |
| PGIM International Bond Fund | | | 41 | |
Schedule of Investments (continued)
as of October 31, 2018
Interest rate swap agreements outstanding at October 31, 2018 (continued):
| | | | | | | | | | | | | | | | | | | | | | |
Notional
Amount
(000)# | | | Termination
Date | | | Fixed
Rate | | Floating Rate | | Value at
Trade
Date | | | Value at
October 31,
2018 | | | Unrealized
Appreciaton
(Depreciation) | |
| Centrally Cleared Interest Rate Swap Agreements (cont’d.): | |
| CAD | 3,500 | | | | 12/22/18 | | | 1.178%(S) | | 3 Month Canadian Banker’s Acceptance(2)(S) | | $ | — | | | $ | (8,268 | ) | | $ | (8,268 | ) |
| CAD | 195 | | | | 06/20/19 | | | 1.265%(S) | | 3 Month Canadian Banker’s Acceptance(2)(S) | | | — | | | | (1,275 | ) | | | (1,275 | ) |
| CAD | 2,935 | | | | 07/26/19 | | | 1.605%(S) | | 3 Month Canadian Banker’s Acceptance(2)(S) | | | (2,306 | ) | | | (15,064 | ) | | | (12,758 | ) |
| CAD | 615 | | | | 01/09/20 | | | 1.716%(S) | | 3 Month Canadian Banker’s Acceptance(2)(S) | | | (667 | ) | | | (4,686 | ) | | | (4,019 | ) |
| CAD | 330 | | | | 04/05/22 | | | 1.445%(S) | | 3 Month Canadian Banker’s Acceptance(1)(S) | | | 3 | | | | 10,890 | | | | 10,887 | |
| CAD | 110 | | | | 05/30/37 | | | 2.240%(S) | | 3 Month Canadian Banker’s Acceptance(2)(S) | | | (82 | ) | | | (9,716 | ) | | | (9,634 | ) |
| CAD | 50 | | | | 01/09/38 | | | 2.720%(S) | | 3 Month Canadian Banker’s Acceptance(2)(S) | | | — | | | | (1,706 | ) | | | (1,706 | ) |
| CAD | 150 | | | | 05/30/47 | | | 2.240%(S) | | 3 Month Canadian Banker’s Acceptance(2)(S) | | | (8,007 | ) | | | (17,113 | ) | | | (9,106 | ) |
| CAD | 40 | | | | 01/09/48 | | | 2.640%(S) | | 3 Month Canadian Banker’s Acceptance(1)(S) | | | — | | | | 2,125 | | | | 2,125 | |
| CHF | 80 | | | | 04/03/28 | | | 0.410%(A) | | 6 Month CHF LIBOR(2)(S) | | | — | | | | (36 | ) | | | (36 | ) |
| CHF | 40 | | | | 04/03/33 | | | 0.687%(A) | | 6 Month CHF LIBOR(2)(S) | | | — | | | | (354 | ) | | | (354 | ) |
| CHF | 160 | | | | 10/05/37 | | | —(3) | | —(3) | | | — | | | | 302 | | | | 302 | |
| COP | 559,000 | | | | 07/27/28 | | | 6.200%(Q) | | 1 Day COOIS(2)(Q) | | | 330 | | | | (3,954 | ) | | | (4,284 | ) |
| CZK | 6,000 | | | | 11/17/22 | | | 1.505%(A) | | 6 Month PRIBOR(2)(S) | | | (16 | ) | | | (7,695 | ) | | | (7,679 | ) |
| EUR | 9,950 | | | | 08/11/19 | | | (0.238)%(A) | | 3 Month EURIBOR(2)(Q) | | | 1,544 | | | | 8,346 | | | | 6,802 | |
| EUR | 624 | | | | 09/08/19 | | | (0.195)%(A) | | 6 Month EURIBOR(2)(S) | | | — | | | | 681 | | | | 681 | |
| EUR | 1,165 | | | | 05/11/22 | | | 0.156%(A) | | 6 Month EURIBOR(1)(S) | | | (1,093 | ) | | | (2,566 | ) | | | (1,473 | ) |
| EUR | 500 | | | | 09/08/22 | | | 0.140%(A) | | 6 Month EURIBOR(1)(S) | | | — | | | | 640 | | | | 640 | |
See Notes to Financial Statements.
Interest rate swap agreements outstanding at October 31, 2018 (continued):
| | | | | | | | | | | | | | | | | | | | | | |
Notional
Amount
(000)# | | | Termination
Date | | | Fixed
Rate | | Floating Rate | | Value at
Trade
Date | | | Value at
October 31,
2018 | | | Unrealized
Appreciaton
(Depreciation) | |
| Centrally Cleared Interest Rate Swap Agreements (cont’d.): | |
| EUR | 960 | | | | 05/11/23 | | | 0.390%(A) | | 6 Month EURIBOR(1)(S) | | $ | (2,371 | ) | | $ | (7,494 | ) | | $ | (5,123 | ) |
| EUR | 390 | | | | 05/15/23 | | | 0.221%(A) | | 6 Month EURIBOR(2)(S) | | | — | | | | (1,066 | ) | | | (1,066 | ) |
| EUR | 500 | | | | 05/15/23 | | | 0.266%(A) | | 6 Month EURIBOR(2)(S) | | | — | | | | (170 | ) | | | (170 | ) |
| EUR | 510 | | | | 08/15/23 | | | 0.390%(A) | | 6 Month EURIBOR(2)(S) | | | (678 | ) | | | 1,539 | | | | 2,217 | |
| EUR | 127 | | | | 09/08/27 | | | 0.770%(A) | | 6 Month EURIBOR(2)(S) | | | — | | | | (695 | ) | | | (695 | ) |
| EUR | 1,335 | | | | 06/28/32 | | | 0.785%(A) | | 6 Month EURIBOR(2)(S) | | | (89,832 | ) | | | (82,169 | ) | | | 7,663 | |
| EUR | 160 | | | | 10/04/32 | | | 2.000%(A) | | 1 Day EONIA(2)(A) | | | — | | | | 934 | | | | 934 | |
| EUR | 160 | | | | 10/04/32 | | | 2.080%(A) | | 3 Month EURIBOR(1)(Q) | | | — | | | | (1,023 | ) | | | (1,023 | ) |
| EUR | 305 | | | | 10/30/32 | | | 1.302%(A) | | 6 Month EURIBOR(2)(S) | | | — | | | | 2,478 | | | | 2,478 | |
| EUR | 50 | | | | 05/11/33 | | | 1.000%(A) | | 6 Month EURIBOR(2)(S) | | | (2,308 | ) | | | (1,872 | ) | | | 436 | |
| EUR | 550 | | | | 08/24/37 | | | 1.960%(A) | | 1 Day EONIA(2)(A) | | | — | | | | 2,693 | | | | 2,693 | |
| EUR | 550 | | | | 08/24/37 | | | 2.033%(A) | | 3 Month EURIBOR(1)(Q) | | | (137 | ) | | | (3,377 | ) | | | (3,240 | ) |
| EUR | 170 | | | | 10/25/37 | | | 2.085%(A) | | 3 Month EURIBOR(2)(Q) | | | — | | | | 1,363 | | | | 1,363 | |
| EUR | 170 | | | | 10/25/37 | | | 2.114%(A) | | 6 Month EURIBOR(1)(S) | | | — | | | | (1,226 | ) | | | (1,226 | ) |
| EUR | 45 | | | | 12/05/47 | | | 1.442%(A) | | 6 Month EURIBOR(1)(S) | | | — | | | | 99 | | | | 99 | |
| EUR | 160 | | | | 01/26/48 | | | 1.853%(A) | | 3 Month EURIBOR(2)(Q) | | | — | | | | 1,355 | | | | 1,355 | |
| EUR | 160 | | | | 01/26/48 | | | 1.863%(A) | | 6 Month EURIBOR(1)(S) | | | — | | | | (1,180 | ) | | | (1,180 | ) |
| EUR | 100 | | | | 03/19/48 | | | 1.650%(A) | | 3 Month EURIBOR(2)(Q) | | | — | | | | (26 | ) | | | (26 | ) |
| EUR | 100 | | | | 03/19/48 | | | 1.658%(A) | | 6 Month EURIBOR(1)(S) | | | — | | | | 78 | | | | 78 | |
| GBP | 280 | | | | 10/24/23 | | | 1.365%(S) | | 6 Month GBP LIBOR(1)(S) | | | 111 | | | | 204 | | | | 93 | |
| GBP | 320 | | | | 02/27/32 | | | 1.374%(S) | | 6 Month GBP LIBOR(2)(S) | | | (1,845 | ) | | | (14,370 | ) | | | (12,525 | ) |
| GBP | 125 | | | | 05/08/32 | | | 1.323%(S) | | 6 Month GBP LIBOR(2)(S) | | | (4,423 | ) | | | (6,476 | ) | | | (2,053 | ) |
See Notes to Financial Statements.
| | | | |
| PGIM International Bond Fund | | | 43 | |
Schedule of Investments (continued)
as of October 31, 2018
Interest rate swap agreements outstanding at October 31, 2018 (continued):
| | | | | | | | | | | | | | | | | | | | | | |
Notional
Amount
(000)# | | | Termination
Date | | | Fixed
Rate | | Floating Rate | | Value at
Trade
Date | | | Value at
October 31,
2018 | | | Unrealized
Appreciaton
(Depreciation) | |
| Centrally Cleared Interest Rate Swap Agreements (cont’d.): | |
| GBP | 40 | | | | 10/30/32 | | | 1.633%(S) | | 6 Month GBP LIBOR(2)(S) | | $ | 730 | | | $ | (293 | ) | | $ | (1,023 | ) |
| GBP | 165 | | | | 12/13/46 | | | 1.615%(S) | | 6 Month GBP LIBOR(1)(S) | | | (8,280 | ) | | | 3,855 | | | | 12,135 | |
| GBP | 25 | | | | 10/30/47 | | | 1.680%(S) | | 6 Month GBP LIBOR(1)(S) | | | (920 | ) | | | 194 | | | | 1,114 | |
| HUF | 177,300 | | | | 07/02/20 | | | 1.065%(A) | | 6 Month BUBOR(2)(S) | | | (301 | ) | | | 2,208 | | | | 2,509 | |
| HUF | 95,000 | | | | 01/12/27 | | | 4.150%(A) | | 6 Month BUBOR(2)(S) | | | — | | | | 4,306 | | | | 4,306 | |
| HUF | 99,345 | | | | 06/12/28 | | | 3.750%(A) | | 6 Month BUBOR(2)(S) | | | — | | | | (5,933 | ) | | | (5,933 | ) |
| INR | 7,000 | | | | 12/05/22 | | | 6.550%(S) | | 1 Day MIBOR(2)(S) | | | (2 | ) | | | (2,026 | ) | | | (2,024 | ) |
| INR | 10,000 | | | | 05/09/23 | | | 6.820%(S) | | 1 Day MIBOR(2)(S) | | | (28 | ) | | | 2,677 | | | | 2,705 | |
| INR | 6,000 | | | | 05/16/23 | | | 7.020%(S) | | 1 Day MIBOR(2)(S) | | | (17 | ) | | | (320 | ) | | | (303 | ) |
| JPY | 27,000 | | | | 01/04/23 | | | 0.115%(S) | | 6 Month JPY LIBOR(2)(S) | | | — | | | | 184 | | | | 184 | |
| JPY | 71,000 | | | | 05/11/23 | | | 0.130%(S) | | 6 Month JPY LIBOR(1)(S) | | | (112 | ) | | | (743 | ) | | | (631 | ) |
| JPY | 301,250 | | | | 12/20/24 | | | 0.126%(S) | | 6 Month JPY LIBOR(2)(S) | | | (6,292 | ) | | | (6,212 | ) | | | 80 | |
| JPY | 16,500 | | | | 07/04/28 | | | 0.282%(S) | | 6 Month JPY LIBOR(2)(S) | | | — | | | | (474 | ) | | | (474 | ) |
| JPY | 180,000 | | | | 12/22/36 | | | 0.641%(S) | | 6 Month JPY LIBOR(2)(S) | | | — | | | | (13,550 | ) | | | (13,550 | ) |
| JPY | 18,500 | | | | 02/28/37 | | | 0.681%(S) | | 6 Month JPY LIBOR(2)(S) | | | — | | | | (621 | ) | | | (621 | ) |
| JPY | 95,000 | | | | 07/26/37 | | | 0.676%(S) | | 6 Month JPY LIBOR(2)(S) | | | — | | | | (5,797 | ) | | | (5,797 | ) |
| JPY | 9,150 | | | | 01/04/38 | | | 0.757%(S) | | 6 Month JPY LIBOR(2)(S) | | | — | | | | 462 | | | | 462 | |
| JPY | 45,000 | | | | 12/22/41 | | | 0.731%(S) | | 6 Month JPY LIBOR(2)(S) | | | — | | | | (9,162 | ) | | | (9,162 | ) |
| JPY | 6,200 | | | | 04/07/42 | | | 0.803%(S) | | 6 Month JPY LIBOR(2)(S) | | | — | | | | (602 | ) | | | (602 | ) |
| JPY | 7,400 | | | | 07/04/43 | | | 0.763%(S) | | 6 Month JPY LIBOR(2)(S) | | | — | | | | (1,620 | ) | | | (1,620 | ) |
| JPY | 25,000 | | | | 11/24/47 | | | 0.888%(S) | | 6 Month JPY LIBOR(2)(S) | | | — | | | | (2,852 | ) | | | (2,852 | ) |
| MXN | 2,080 | | | | 06/11/27 | | | 7.210%(M) | | 28 Day Mexican Interbank Rate(2)(M) | | | 506 | | | | (11,348 | ) | | | (11,854 | ) |
See Notes to Financial Statements.
Interest rate swap agreements outstanding at October 31, 2018 (continued):
| | | | | | | | | | | | | | | | | | | | | | |
Notional
Amount
(000)# | | | Termination
Date | | | Fixed
Rate | | Floating Rate | | Value at
Trade
Date | | | Value at
October 31,
2018 | | | Unrealized
Appreciaton
(Depreciation) | |
| Centrally Cleared Interest Rate Swap Agreements (cont’d.): | |
| MXN | 4,000 | | | | 06/30/28 | | | 8.065%(M) | | 28 Day Mexican Interbank Rate(2)(M) | | $ | — | | | $ | (13,253 | ) | | $ | (13,253 | ) |
| NOK | 12,900 | | | | 05/23/23 | | | 1.895%(A) | | 6 Month NIBOR(2)(S) | | | 613 | | | | 3,324 | | | | 2,711 | |
| NZD | 300 | | | | 05/01/20 | | | 3.628%(S) | | 3 Month BBR(2)(Q) | | | 8,462 | | | | 7,474 | | | | (988 | ) |
| NZD | 1,100 | | | | 07/18/23 | | | 2.513%(S) | | 3 Month BBR(1)(Q) | | | (5,935 | ) | | | (8,095 | ) | | | (2,160 | ) |
| NZD | 470 | | | | 01/10/27 | | | 3.420%(S) | | 3 Month BBR(2)(Q) | | | — | | | | 19,639 | | | | 19,639 | |
| PLN | 700 | | | | 06/13/22 | | | 2.220%(A) | | 6 Month WIBOR(2)(S) | | | 57 | | | | (330 | ) | | | (387 | ) |
| PLN | 200 | | | | 05/24/23 | | | 2.520%(A) | | 6 Month WIBOR(2)(S) | | | — | | | | 330 | | | | 330 | |
| PLN | 1,120 | | | | 08/24/23 | | | 2.390%(A) | | 6 Month WIBOR(2)(S) | | | — | | | | (962 | ) | | | (962 | ) |
| PLN | 1,000 | | | | 01/10/27 | | | 3.030%(A) | | 6 Month WIBOR(2)(S) | | | — | | | | 10,561 | | | | 10,561 | |
| PLN | 620 | | | | 06/12/28 | | | 3.070%(A) | | 6 Month WIBOR(1)(S) | | | — | | | | (3,154 | ) | | | (3,154 | ) |
| SEK | 12,900 | | | | 09/12/23 | | | 0.497%(A) | | 3 Month STIBOR(2)(Q) | | | (4,780 | ) | | | (3,620 | ) | | | 1,160 | |
| SEK | 2,500 | | | | 12/30/26 | | | 1.106%(A) | | 3 Month STIBOR(2)(Q) | | | — | | | | 3,795 | | | | 3,795 | |
| SGD | 380 | | | | 05/21/23 | | | 2.030%(S) | | 6 Month SIBOR(1)(S) | | | — | | | | 3,056 | | | | 3,056 | |
| SGD | 200 | | | | 05/21/28 | | | 2.436%(S) | | 6 Month SIBOR(2)(S) | | | — | | | | (1,937 | ) | | | (1,937 | ) |
| | 2,190 | | | | 02/15/19 | | | 1.820%(T) | | 1 Day USOIS(1)(T) | | | — | | | | 3,779 | | | | 3,779 | |
| | 215 | | | | 06/30/19 | | | 1.502%(A) | | 1 Day USOIS(1)(A) | | | (311 | ) | | | 1,497 | | | | 1,808 | |
| | 11,900 | | | | 08/04/19 | | | 1.372%(A) | | 1 Day USOIS(1)(A) | | | (1,915 | ) | | | 120,506 | | | | 122,421 | |
| | 1,495 | | | | 09/30/19 | | | 1.707%(A) | | 1 Day USOIS(1)(A) | | | 448 | | | | 11,989 | | | | 11,541 | |
| | 3,885 | | | | 12/31/19 | | | 1.840%(A) | | 1 Day USOIS(1)(A) | | | 10,938 | | | | 36,118 | | | | 25,180 | |
| | 1,695 | | | | 12/31/19 | | | 1.950%(A) | | 1 Day USOIS(1)(A) | | | 618 | | | | 12,526 | | | | 11,908 | |
| | 845 | | | | 12/31/19 | | | 2.040%(A) | | 1 Day USOIS(1)(A) | | | 8 | | | | 4,930 | | | | 4,922 | |
| | 855 | | | | 12/31/19 | | | 2.107%(A) | | 1 Day USOIS(1)(A) | | | (3 | ) | | | 3,634 | | | | 3,637 | |
| | 3,315 | | | | 03/31/20 | | | 2.369%(A) | | 1 Day USOIS(1)(A) | | | — | | | | 9,589 | | | | 9,589 | |
| | 720 | | | | 04/24/20 | | | 2.311%(A) | | 1 Day USOIS(1)(A) | | | — | | | | 2,387 | | | | 2,387 | |
| | 230 | | | | 05/31/22 | | | 2.353%(A) | | 1 Day USOIS(1)(A) | | | — | | | | 2,775 | | | | 2,775 | |
| | 185 | | | | 09/27/22 | | | 2.360%(A) | | 1 Day USOIS(1)(A) | | | 2 | | | | 2,829 | | | | 2,827 | |
| | 280 | | | | 05/21/23 | | | 2.215%(S) | | 3 Month LIBOR(2)(Q) | | | — | | | | (9,382 | ) | | | (9,382 | ) |
| | 390 | | | | 06/22/23 | | | 2.911%(S) | | 3 Month LIBOR(2)(Q) | | | (3,861 | ) | | | (529 | ) | | | 3,332 | |
See Notes to Financial Statements.
| | | | |
| PGIM International Bond Fund | | | 45 | |
Schedule of Investments (continued)
as of October 31, 2018
Interest rate swap agreements outstanding at October 31, 2018 (continued):
| | | | | | | | | | | | | | | | | | | | | | |
Notional
Amount
(000)# | | | Termination
Date | | | Fixed
Rate | | Floating Rate | | Value at
Trade
Date | | | Value at
October 31,
2018 | | | Unrealized
Appreciaton
(Depreciation) | |
| Centrally Cleared Interest Rate Swap Agreements (cont’d.): | |
| | 300 | | | | 07/17/24 | | | 2.926%(S) | | 3 Month LIBOR(2)(Q) | | $ | �� | | | $ | (3,665 | ) | | $ | (3,665 | ) |
| | 500 | | | | 08/15/24 | | | 2.168%(S) | | 3 Month LIBOR(1)(Q) | | | — | | | | 26,150 | | | | 26,150 | |
| | 4,435 | | | | 08/15/24 | | | 2.170%(S) | | 3 Month LIBOR(1)(Q) | | | 16,556 | | | | 231,544 | | | | 214,988 | |
| | 490 | | | | 08/15/24 | | | 2.176%(S) | | 3 Month LIBOR(1)(Q) | | | 895 | | | | 25,432 | | | | 24,537 | |
| | 1,230 | | | | 11/15/24 | | | 2.334%(S) | | 3 Month LIBOR(1)(Q) | | | 4,442 | | | | 48,290 | | | | 43,848 | |
| | 1,185 | | | | 02/28/25 | | | 2.454%(A) | | 1 Day USOIS(1)(A) | | | 1,354 | | | | 22,018 | | | | 20,664 | |
| | 480 | | | | 05/31/25 | | | 2.998%(S) | | 3 Month LIBOR(1)(Q) | | | (319 | ) | | | 4,173 | | | | 4,492 | |
| | 830 | | | | 07/31/25 | | | 2.802%(A) | | 1 Day USOIS(1)(A) | | | — | | | | 933 | | | | 933 | |
| | 1,190 | | | | 07/31/25 | | | 3.105%(S) | | 3 Month LIBOR(1)(Q) | | | 939 | | | | 4,911 | | | | 3,972 | |
| | 589 | | | | 07/31/25 | | | 3.109%(S) | | 3 Month LIBOR(1)(Q) | | | 31 | | | | 2,276 | | | | 2,245 | |
| | 130 | | | | 05/15/27 | | | 2.295%(S) | | 3 Month LIBOR(1)(Q) | | | — | | | | 8,084 | | | | 8,084 | |
| | 150 | | | | 05/21/28 | | | 2.421%(S) | | 3 Month LIBOR(1)(Q) | | | — | | | | 8,976 | | | | 8,976 | |
| | 70 | | | | 10/04/42 | | | 2.527%(S) | | 3 Month LIBOR(2)(Q) | | | — | | | | (9,305 | ) | | | (9,305 | ) |
| | 60 | | | | 10/04/47 | | | 2.536%(S) | | 3 Month LIBOR(1)(Q) | | | — | | | | 8,850 | | | | 8,850 | |
| | 65 | | | | 07/17/49 | | | 2.914%(S) | | 3 Month LIBOR(1)(Q) | | | — | | | | 4,999 | | | | 4,999 | |
| ZAR | 3,800 | | | | 09/23/22 | | | 7.430%(Q) | | 3 Month JIBAR(2)(Q) | | | — | | | | (4,813 | ) | | | (4,813 | ) |
| ZAR | 2,035 | | | | 06/30/27 | | | 8.015%(Q) | | 3 Month JIBAR(2)(Q) | | | (13 | ) | | | (4,649 | ) | | | (4,636 | ) |
| ZAR | 1,700 | | | | 11/07/27 | | | 8.360%(Q) | | 3 Month JIBAR(2)(Q) | | | (34 | ) | | | (1,431 | ) | | | (1,397 | ) |
| ZAR | 3,500 | | | | 07/16/28 | | | 8.170%(Q) | | 3 Month JIBAR(2)(Q) | | | 6 | | | | (7,458 | ) | | | (7,464 | ) |
| | | | | | | | | | | | | | | | | | | | | | |
| | | | | | | | | | | | $ | (99,812 | ) | | $ | 414,273 | | | $ | 514,085 | |
| | | | | | | | | | | | | | | | | | | | | | |
| | | | | | | | | | | | | | | | | | | | | | | | |
Notional
Amount
(000)# | | | Termination
Date | | | Fixed
Rate | | Floating Rate | | Fair
Value | | | Upfront
Premiums
Paid
(Received) | | | Unrealized
Appreciation
(Depreciation) | | | Counterparty |
| OTC Interest Rate Swap Agreements: | | | |
| AED | 1,700 | | | | 04/05/21 | | | 3.005%(A) | | 3 Month EIBOR(1)(Q) | | $ | (2,721 | ) | | $ | — | | | $ | (2,721 | ) | | BNP Paribas |
| CLP | 85,000 | | | | 11/15/27 | | | 4.130%(S) | | 1 Day CLOIS(2)(S) | | | (1,919 | ) | | | — | | | | (1,919 | ) | | Morgan Stanley |
| CLP | 55,000 | | | | 12/20/27 | | | 4.260%(S) | | 1 Day CLOIS(2)(S) | | | (386 | ) | | | — | | | | (386 | ) | | Morgan Stanley |
See Notes to Financial Statements.
Interest rate swap agreements outstanding at October 31, 2018 (continued):
| | | | | | | | | | | | | | | | | | | | | | | | |
Notional
Amount
(000)# | | | Termination
Date | | | Fixed
Rate | | Floating Rate | | Fair
Value | | | Upfront
Premiums
Paid
(Received) | | | Unrealized
Appreciation
(Depreciation) | | | Counterparty |
| OTC Interest Rate Swap Agreements (cont’d.): | | | |
| CLP | 19,100 | | | | 01/23/28 | | | 4.245%(S) | | 1 Day CLOIS(2)(S) | | $ | (86 | ) | | $ | — | | | $ | (86 | ) | | Morgan Stanley |
| CLP | 33,000 | | | | 01/26/28 | | | 4.210%(S) | | 1 Day CLOIS(2)(S) | | | (293 | ) | | | — | | | | (293 | ) | | Morgan Stanley |
| CLP | 23,000 | | | | 05/17/28 | | | 4.270%(S) | | 1 Day CLOIS(2)(S) | | | 20 | | | | — | | | | 20 | | | Citibank NA |
| CNH | 800 | | | | 08/15/23 | | | 3.115%(Q) | | 7 Day China Fixing Repo
Rates(2)(Q) | | | 176 | | | | (2 | ) | | | 178 | | | UBS AG |
| COP | 123,000 | | | | 01/23/28 | | | 6.035%(Q) | | 1 Day COOIS(2)(Q) | | | (1,113 | ) | | | — | | | | (1,113 | ) | | Morgan Stanley |
| COP | 336,000 | | | | 01/26/28 | | | 6.000%(Q) | | 1 Day COOIS(2)(Q) | | | (3,271 | ) | | | — | | | | (3,271 | ) | | Morgan Stanley |
| COP | 263,000 | | | | 02/01/28 | | | 6.020%(Q) | | 1 Day COOIS(2)(Q) | | | (2,130 | ) | | | — | | | | (2,130 | ) | | Morgan Stanley |
| COP | 350,000 | | | | 05/17/28 | | | 5.990%(Q) | | 1 Day COOIS(2)(Q) | | | (3,513 | ) | | | — | | | | (3,513 | ) | | Citibank NA |
| ILS | 1,150 | | | | 01/12/27 | | | 1.975%(A) | | 3 Month TELBOR(2)(Q) | | | 3,653 | | | | — | | | | 3,653 | | | Citibank NA |
| ILS | 390 | | | | 07/16/28 | | | 2.045%(A) | | 3 Month TELBOR(2)(Q) | | | (1,171 | ) | | | — | | | | (1,171 | ) | | JPMorgan Chase |
| KRW | 850,000 | | | | 01/06/27 | | | 1.800%(Q) | | 3 Month KWCDC(2)(Q) | | | (13,143 | ) | | | (19 | ) | | | (13,124 | ) | | Citibank NA |
| SAR | 1,700 | | | | 04/05/21 | | | 3.020%(A) | | 3 Month SAIBOR(2)(Q) | | | 2,645 | | | | — | | | | 2,645 | | | BNP Paribas |
| SAR | 950 | | | | 11/08/22 | | | 3.090%(A) | | 3 Month SAIBOR(1)(Q) | | | (1,006 | ) | | | — | | | | (1,006 | ) | | BNP Paribas |
| SAR | 730 | | | | 04/05/25 | | | 3.480%(A) | | 3 Month SAIBOR(1)(Q) | | | 260 | | | | — | | | | 260 | | | BNP Paribas |
| THB | 20,000 | | | | 08/08/20 | | | 1.840%(S) | | 6 Month BIBOR(2)(S) | | | 1,415 | | | | — | | | | 1,415 | | | Citibank NA |
| ZAR | 3,300 | | | | 09/22/42 | | | 8.020%(Q) | | 3 Month JIBAR(2)(Q) | | | (19,430 | ) | | | (33 | ) | | | (19,397 | ) | | Deutsche Bank AG |
| ZAR | 3,100 | | | | 09/22/47 | | | 7.890%(Q) | | 3 Month JIBAR(1)(Q) | | | 19,278 | | | | 26 | | | | 19,252 | | | Deutsche Bank AG |
| | | | | | | | | | | | | | | | | | | | | | | | |
| | | | | | | | | | | | $ | (22,735 | ) | | $ | (28 | ) | | $ | (22,707 | ) | | |
| | | | | | | | | | | | | | | | | | | | | | | | |
| (1) | The Fund pays the fixed rate and receives the floating rate. |
| (2) | The Fund pays the floating rate and receives the fixed rate. |
| (3) | The Fund pays the floating rate of 3 Month CHF LIBOR plus 1.75bps quarterly and receives the floating rate of 6 Month CHF LIBOR semiannually. |
Balances Reported in the Statement of Assets and Liabilities for OTC Forward Rate and Swap Agreements:
| | | | | | | | | | | | | | | | |
| | | Premiums Paid | | | Premiums Received | | | Unrealized
Appreciation | | | Unrealized
Depreciation | |
OTC Forward Rate Agreements | | $ | — | | | $ | — | | | $ | 3,861 | | | $ | (5,190 | ) |
OTC Swap Agreements | | $ | 36,355 | | | $ | (142,245) | | | $ | 104,143 | | | $ | (70,219 | ) |
See Notes to Financial Statements.
| | | | |
| PGIM International Bond Fund | | | 47 | |
Schedule of Investments (continued)
as of October 31, 2018
Summary of Collateral for Centrally Cleared/Exchange-traded Derivatives:
Cash and securities segregated as collateral to cover requirements for open centrally cleared/exchange-traded derivatives are listed by broker as follows:
| | | | | | | | |
Broker | | Cash and/or Foreign Currency | | | Securities Market Value | |
Citigroup Global Markets | | $ | — | | | $ | 719,773 | |
JPMorgan Securities | | | 340,623 | | | | — | |
| | | | | | | | |
Total | | $ | 340,623 | | | $ | 719,773 | |
| | | | | | | | |
Fair Value Measurements:
Various inputs are used in determining the value of the Fund’s investments. These inputs are summarized in the three broad levels listed below.
Level 1—unadjusted quoted prices generally in active markets for identical securities.
Level 2—quoted prices for similar securities, interest rates and yield curves, prepayment speeds, foreign currency exchange rates and other observable inputs.
Level 3—unobservable inputs for securities valued in accordance with Board approved fair valuation procedures.
The following is a summary of the inputs used as of October 31, 2018 in valuing such portfolio securities:
| | | | | | | | | | | | |
| | | Level 1 | | | Level 2 | | | Level 3 | |
Investments in Securities | |
Asset-Backed Securities | |
Cayman Islands | | $ | — | | | $ | 250,347 | | | $ | — | |
Ireland | | | — | | | | 849,491 | | | | — | |
Netherlands | | | — | | | | 1,415,658 | | | | — | |
United States | | | — | | | | 201,019 | | | | — | |
Corporate Bonds | |
Australia | | | — | | | | 117,760 | | | | — | |
China | | | — | | | | 344,776 | | | | — | |
Germany | | | — | | | | 736,768 | | | | — | |
Ireland | | | — | | | | 117,456 | | | | — | |
Italy | | | — | | | | 233,844 | | | | — | |
Kazakhstan | | | — | | | | 51,637 | | | | — | |
Mexico | | | — | | | | 437,200 | | | | — | |
Netherlands | | | — | | | | 387,078 | | | | — | |
Russia | | | — | | | | 117,325 | | | | — | |
Spain | | | — | | | | 118,606 | | | | — | |
Supranational Bank | | | — | | | | 125,388 | | | | — | |
United Kingdom | | | — | | | | 1,141,515 | | | | — | |
United States | | | — | | | | 2,191,995 | | | | — | |
Residential Mortgage-Backed Securities | |
Bermuda | | | — | | | | 167,871 | | | | — | |
United Kingdom | | | — | | | | 635,485 | | | | — | |
United States | | | — | | | | 168,683 | | | | — | |
See Notes to Financial Statements.
| | | | | | | | | | | | |
| | | Level 1 | | | Level 2 | | | Level 3 | |
Investments in Securities (continued) | |
Sovereign Bonds | | | | | | | | | | | | |
Argentina | | $ | — | | | $ | 618,616 | | | $ | — | |
Belgium | | | — | | | | 779,662 | | | | — | |
Brazil | | | — | | | | 361,704 | | | | — | |
Bulgaria | | | — | | | | 138,069 | | | | — | |
Canada | | | — | | | | 184,703 | | | | — | |
Colombia | | | — | | | | 509,690 | | | | — | |
Croatia | | | — | | | | 227,480 | | | | — | |
Cyprus | | | — | | | | 627,809 | | | | — | |
France | | | — | | | | 539,320 | | | | — | |
Greece | | | — | | | | 1,033,010 | | | | — | |
Indonesia | | | — | | | | 402,914 | | | | — | |
Ireland | | | — | | | | 192,385 | | | | — | |
Israel | | | — | | | | 114,741 | | | | — | |
Italy | | | — | | | | 2,040,402 | | | | — | |
Japan | | | — | | | | 69,077 | | | | — | |
Lithuania | | | — | | | | 211,705 | | | | — | |
Mexico | | | — | | | | 210,294 | | | | — | |
Peru | | | — | | | | 268,036 | | | | — | |
Portugal | | | — | | | | 922,139 | | | | — | |
Romania | | | — | | | | 218,430 | | | | — | |
Senegal | | | — | | | | 105,574 | | | | — | |
South Korea | | | — | | | | 215,447 | | | | 132,180 | |
Spain | | | — | | | | 2,014,979 | | | | — | |
Turkey | | | — | | | | 184,999 | | | | — | |
United Kingdom | | | — | | | | 1,404,435 | | | | — | |
U.S. Government Agency Obligation | | | — | | | | 16,414 | | | | — | |
U.S. Treasury Obligation | | | — | | | | 59,688 | | | | — | |
Affiliated Mutual Fund | | | 2,346,703 | | | | — | | | | — | |
Options Purchased | | | — | | | | 109,677 | | | | — | |
Options Written | | | — | | | | (102,750 | ) | | | (93 | ) |
Other Financial Instruments* | |
Futures Contracts | | | (162,157 | ) | | | — | | | | — | |
OTC Forward Foreign Currency Exchange Contracts | | | — | | | | 223,899 | | | | — | |
OTC Cross Currency Exchange Contracts | | | — | | | | 6,499 | | | | — | |
Centrally Cleared Credit Default Swap Agreements | | | — | | | | 7,563 | | | | — | |
OTC Credit Default Swap Agreements | | | — | | | | (49,231 | ) | | | — | |
OTC Forward Rate Agreements | | | — | | | | — | | | | (1,329 | ) |
Centrally Cleared Inflation Swap Agreements | | | — | | | | (5,593 | ) | | | — | |
Centrally Cleared Interest Rate Swap Agreements | | | — | | | | 514,085 | | | | — | |
OTC Interest Rate Swap Agreements | | | — | | | | (22,735 | ) | | | — | |
| | | | | | | | | | | | |
Total | | $ | 2,184,546 | | | $ | 24,163,038 | | | $ | 130,758 | |
| | | | | | | | | | | | |
See Notes to Financial Statements.
| | | | |
| PGIM International Bond Fund | | | 49 | |
Schedule of Investments (continued)
as of October 31, 2018
The following is a reconciliation of assets in which unobservable inputs (Level 3) were used in determining fair value:
| | | | | | | | | | | | | | | | |
| | | Asset-Backed
Securities—
Collateralized Loan
Obligations | | | Sovereign
Bonds | | | Options
Written | | | Forward
Rate
Agreements | |
Balance as of 10/31/17 | | $ | 582,425 | | | $ | 139,604 | | | $ | — | | | $ | — | |
Realized gain (loss) | | | — | | | | — | | | | — | | | | — | |
Change in unrealized appreciation (depreciation) | | | — | | | | (6,413 | ) | | | 331 | | | | (1,329 | ) |
Purchases/Exchanges/Issuances | | | — | | | | — | | | | (424 | ) | | | — | |
Sales/Paydowns | | | — | | | | — | | | | — | | | | — | |
Accrued discount/premium | | | — | | | | (1,011 | ) | | | — | | | | — | |
Transfers into of Level 3 | | | — | | | | — | | | | — | | | | — | |
Transfers out of Level 3 | | | (582,425 | ) | | | — | | | | — | | | | — | |
| | | | | | | | | | | | | | | | |
Balance as of 10/31/18 | | $ | — | | | $ | 132,180 | | | $ | (93 | ) | | $ | (1,329 | ) |
| | | | | | | | | | | | | | | | |
Change in unrealized appreciation (depreciation) relating to securities still held at reporting period end | | $ | — | | | $ | (6,413 | ) | | $ | 331 | | | $ | (1,329 | ) |
| | | | | | | | | | | | | | | | |
| * | Other financial instruments are derivative instruments not reflected in the Schedule of Investments, such as futures, forwards and centrally cleared swap contracts, which are recorded at the unrealized appreciation (depreciation) on the instrument, and OTC swap contracts which are recorded at fair value. |
Level 3 securities as presented in the table above are being fair valued using pricing methodologies approved by Board, which contain unobservable inputs as follows:
| | | | | | | | |
Level 3 Securities | | Fair Value as of
October 31, 2018 | | | Valuation
Methodology | | Unobservable Inputs |
Sovereign Bonds | | $ | 132,180 | | | Evaluated Bid | | Comparable Security Data |
Options Written | | | (93 | ) | | Market Approach | | Single Broker Indicative Quote |
OTC Forward Rate Agreements | | | (1,329 | ) | | Model Pricing | | Forward Rate Volatility & Convexity Adjustment |
It is the Fund’s policy to recognize transfers in and transfers out at the fair value as of the beginning of period. Securities transferred levels as follows:
| | | | | | | | | | |
Investments in Securities | | Amount Transferred | | | Level Transfer | | | Logic |
Asset-Backed Securities | | | | | | | | | | |
Collateralized Loan Obligations | | $ | 582,425 | | | | L3 to L2 | | | Cost to Evaluated Bid |
Industry Classification:
The industry classification of investments and other assets in excess of liabilities shown as a percentage of net assets as of October 31, 2018 were as follows (unaudited):
| | | | |
Sovereign Bonds | | | 50.6 | % |
Collateralized Loan Obligations | | | 9.2 | |
Affiliated Mutual Fund | | | 8.7 | |
Residential Mortgage-Backed Securities | | | 3.6 | % |
Banks | | | 2.3 | |
Insurance | | | 2.3 | |
See Notes to Financial Statements.
Industry Classification (cont’d):
| | | | |
Media | | | 2.1 | % |
Oil & Gas | | | 2.0 | |
Healthcare-Products | | | 1.6 | |
Entertainment | | | 1.5 | |
Auto Parts & Equipment | | | 1.3 | |
Retail | | | 1.0 | |
Electric | | | 0.9 | |
Software | | | 0.8 | |
Foods | | | 0.8 | |
Auto Manufacturers | | | 0.6 | |
Packaging & Containers | | | 0.5 | |
Multi-National | | | 0.5 | |
Real Estate Investment Trusts (REITs) | | | 0.5 | |
Healthcare-Services | | | 0.5 | |
Commercial Services | | | 0.4 | |
Forest Products & Paper | | | 0.4 | |
Electrical Components & Equipment | | | 0.4 | |
Telecommunications | | | 0.4 | |
Electronics | | | 0.4 | |
Household Products/Wares | | | 0.4 | % |
Chemicals | | | 0.4 | |
Pharmaceuticals | | | 0.4 | |
Options Purchased | | | 0.4 | |
Consumer Loans | | | 0.4 | |
Automobiles | | | 0.4 | |
U.S. Treasury Obligation | | | 0.2 | |
Transportation | | | 0.2 | |
U.S. Government Agency Obligation | | | 0.0 | * |
| | | | |
| | | 96.1 | |
Options Written | | | (0.4 | ) |
Other assets in excess of liabilities | | | 4.3 | |
| | | | |
| | | 100.0 | % |
| | | | |
Effects of Derivative Instruments on the Financial Statements and Primary Underlying Risk Exposure:
The Fund invested in derivative instruments during the reporting period. The primary types of risk associated with these derivative instruments are credit contracts risk, foreign exchange contracts risk and interest rate contracts risk. The effect of such derivative instruments on the Fund’s financial position and financial performance as reflected in the Statement of Assets and Liabilities and Statement of Operations is presented in the summary below.
Fair values of derivative instruments as of October 31, 2018 as presented in the Statement of Assets and Liabilities:
| | | | | | | | | | | | |
Derivatives not accounted for
as hedging instruments,
carried at fair value | | Asset Derivatives | | | Liability Derivatives | |
| | Statement of
Assets and
Liabilities Location | | Fair
Value | | | Statement of
Assets and
Liabilities Location | | Fair
Value | |
| Credit contracts | | Due from/to broker—variation margin swaps | | $ | 8,090 | * | | Due from/to broker—variation margin swaps | | $ | 527 | * |
| Credit contracts | | Premiums paid for OTC swap agreements | | | 36,329 | | | Premiums received for OTC swap agreements | | | 142,191 | |
| Credit contracts | | Unaffiliated investments | | | 1,590 | | | Options written outstanding, at value | | | 2,851 | |
| Credit contracts | | Unrealized appreciation on OTC swap agreements | | | 76,720 | | | Unrealized depreciation on OTC swap agreements | | | 20,089 | |
| Foreign exchange contracts | | Unaffiliated investments | | | 96,019 | | | Options written outstanding, at value | | | 96,020 | |
See Notes to Financial Statements.
| | | | |
| PGIM International Bond Fund | | | 51 | |
Schedule of Investments (continued)
as of October 31, 2018
| | | | | | | | | | | | |
Derivatives not accounted for
as hedging instruments,
carried at fair value | | Asset Derivatives | | | Liability Derivatives | |
| | Statement of
Assets and
Liabilities Location | | Fair
Value | | | Statement of
Assets and
Liabilities Location | | Fair
Value | |
| Foreign exchange contracts | | Unrealized appreciation on OTC cross currency exchange contracts | | $ | 39,691 | | | Unrealized depreciation on OTC cross currency exchange contracts | | $ | 33,192 | |
| Foreign exchange contracts | | Unrealized appreciation on OTC forward foreign currency exchange contracts | | | 358,910 | | | Unrealized depreciation on OTC forward foreign currency exchange contracts | | | 135,011 | |
| Interest rate contracts | | Due from/to broker—variation margin futures | | | 16,211 | * | | Due from/to broker—variation margin futures | | | 178,368 | * |
| Interest rate contracts | | Due from/to broker—variation margin swaps | | | 731,761 | * | | Due from/to broker—variation margin swaps | | | 223,269 | * |
| Interest rate contracts | | Premiums paid for OTC swap agreements | | | 26 | | | Premiums received for OTC swap agreements | | | 54 | |
| Interest rate contracts | | Unaffiliated investments | | | 12,068 | | | Options written outstanding, at value | | | 3,972 | |
| Interest rate contracts | | Unrealized appreciation on OTC forward rate agreements | | | 3,861 | | | Unrealized depreciation on OTC forward rate agreements | | | 5,190 | |
| Interest rate contracts | | Unrealized appreciation on OTC swap agreements | | | 27,423 | | | Unrealized depreciation on OTC swap agreements | | | 50,130 | |
| | | | | | | | | | | | |
| | | | $ | 1,408,699 | | | | | $ | 890,864 | |
| | | | | | | | | | | | |
| * | Includes cumulative appreciation (depreciation) as reported in the schedule of open futures and centrally cleared swap contracts. Only unsettled variation margin receivable (payable) is reported within the Statement of Assets and Liabilities. |
The effects of derivative instruments on the Statement of Operations for the year ended October 31, 2018 are as follows:
| | | | | | | | | | | | | | | | | | | | |
Amount of Realized Gain (Loss) on Derivatives Recognized in Income | |
Derivatives not accounted
for as hedging instruments,
carried at fair value | | Options
Purchased(1) | | | Options
Written | | | Futures | | | Forward & Cross
Currency
Exchange
Contracts | | | Swaps | |
Credit contracts | | $ | (20,883 | ) | | $ | 33,825 | | | $ | — | | | $ | — | | | $ | 75,939 | |
Foreign exchange contracts | | | (24,163 | ) | | | 39,169 | | | | — | | | | 1,049,098 | | | | — | |
Interest rate contracts | | | (6,613 | ) | | | 7,778 | | | | (401,384 | ) | | | — | | | | 111,258 | |
| | | | | | | | | | | | | | | | | | | | |
Total | | $ | (51,659 | ) | | $ | 80,772 | | | $ | (401,384 | ) | | $ | 1,049,098 | | | $ | 187,197 | |
| | | | | | | | | | | | | | | | | | | | |
| (1) | Included in net realized gain (loss) on investment transactions in the Statement of Operations. |
See Notes to Financial Statements.
| | | | | | | | | | | | | | | | | | | | | | | | |
Change in Unrealized Appreciation (Depreciation) on Derivatives Recognized in Income | |
Derivatives not accounted
for as hedging instruments,
carried at fair value | | Options
Purchased(2) | | | Options
Written | | | Futures | | | Forward
& Cross
Currency
Exchange
Contracts | | | Forward
Rate
Agreements | | | Swaps | |
Credit contracts | | $ | 8,398 | | | $ | 4,028 | | | $ | — | | | $ | — | | | $ | — | | | $ | 22,073 | |
Foreign exchange contracts | | | 68,814 | | | | (85,372 | ) | | | — | | | | (32,498 | ) | | | — | | | | — | |
Interest rate contracts | | | 8,568 | | | | (4,237 | ) | | | (165,027 | ) | | | — | | | | (1,329 | ) | | | 394,512 | |
| | | | | | | | | | | | | | | | | | | | | | | | |
Total | | $ | 85,780 | | | $ | (85,581 | ) | | $ | (165,027 | ) | | $ | (32,498 | ) | | $ | (1,329 | ) | | $ | 416,585 | |
| | | | | | | | | | | | | | | | | | | | | | | | |
| (2) | Included in net change in unrealized appreciation (depreciation) on investments in the Statement of Operations. |
For the year ended October 31, 2018, the Fund’s average volume of derivative activities is as follows:
| | | | | | | | | | | | | | | | | | |
Options
Purchased(1) | | | Options
Written(2) | | | Futures
Contracts—
Long
Positions(2) | | | Futures
Contracts—
Short
Positions(2) | | | Forward
Foreign
Currency
Exchange
Contracts—
Purchased(3) | |
| $ | 65,362 | | | $ | 24,108,858 | | | $ | 19,734,181 | | | $ | 20,380,678 | | | $ | 7,831,735 | |
| | | | | | | | | | | | | | | | | | |
Forward
Foreign
Currency
Exchange
Contracts—
Sold(3) | | | Cross
Currency
Exchange
Contracts(4) | | | Forward
Rate
Agreements(2) | | | Interest
Rate
Swap
Agreements(2) | | | Credit
Default
Swap
Agreements—
Buy
Protection(2) | |
| $ | 31,490,818 | | | $ | 813,208 | | | $ | 220,000 | | | $ | 91,577,745 | | | $ | 1,974,227 | |
| | | | | | | | | | |
Credit
Default
Swap
Agreements—
Sell
Protection(2) | | | Currency
Swap
Agreements(2) | | | Inflation
Swap
Agreements(2) | |
| $ | 5,338,712 | | | $ | 195,600 | | | $ | 1,692,166 | |
| (2) | Notional Amount in USD. |
| (3) | Value at Settlement Date. |
Financial Instruments/Transactions—Summary of Offsetting and Netting Arrangements:
The Fund invested in OTC derivatives during the reporting period that are either offset in accordance with current requirements or are subject to enforceable master netting arrangements or similar agreements that permit offsetting. The information about offsetting and related netting arrangements for OTC derivatives where the legal right to set-off exists, is presented in the summary below.
Offsetting of OTC derivative assets and liabilities:
See Notes to Financial Statements.
| | | | |
| PGIM International Bond Fund | | | 53 | |
Schedule of Investments (continued)
as of October 31, 2018
| | | | | | | | | | | | | | | | | | | | |
Counterparty | | Gross
Amounts of
Recognized
Assets(1) | | | Gross
Amounts of
Recognized
Liabilities(1) | | | Net
Amounts of
Recognized
Assets/
(Liabilities) | | | Collateral
Pledged/
(Received)(2) | | | Net
Amount | |
Bank of America | | $ | 60,442 | | | $ | (29,672 | ) | | $ | 30,770 | | | $ | — | | | $ | 30,770 | |
Barclays Bank PLC | | | 58,928 | | | | (27,387 | ) | | | 31,541 | | | | — | | | | 31,541 | |
BNP Paribas | | | 79,053 | | | | (124,946 | ) | | | (45,893 | ) | | | — | | | | (45,893 | ) |
Citibank NA | | | 176,929 | | | | (153,075 | ) | | | 23,854 | | | | — | | | | 23,854 | |
Citigroup Global Markets | | | 3,861 | | | | (5,190 | ) | | | (1,329 | ) | | | — | | | | (1,329 | ) |
Deutsche Bank AG | | | 27,789 | | | | (23,364 | ) | | | 4,425 | | | | — | | | | 4,425 | |
Goldman Sachs International | | | 26,099 | | | | (20,364 | ) | | | 5,735 | | | | — | | | | 5,735 | |
Hong Kong & Shanghai Bank | | | 2,230 | | | | (3,959 | ) | | | (1,729 | ) | | | — | | | | (1,729 | ) |
JPMorgan Chase | | | 35,481 | | | | (31,063 | ) | | | 4,418 | | | | — | | | | 4,418 | |
JPMorgan Securities | | | 2,823 | | | | (1,136 | ) | | | 1,687 | | | | — | | | | 1,687 | |
Morgan Stanley | | | 34,052 | | | | (45,232 | ) | | | (11,180 | ) | | | — | | | | (11,180 | ) |
Toronto Dominion | | | 24,536 | | | | (4,628 | ) | | | 19,908 | | | | — | | | | 19,908 | |
UBS AG | | | 120,414 | | | | (18,684 | ) | | | 101,730 | | | | — | | | | 101,730 | |
| | | | | | | | | | | | | | | | | | | | |
| | $ | 652,637 | | | $ | (488,700 | ) | | $ | 163,937 | | | $ | — | | | $ | 163,937 | |
| | | | | | | | | | | | | | | | | | | | |
| (1) | Includes unrealized appreciation/(depreciation) on swaps and forwards, premiums paid/(received) on swap agreements and market value of purchased and written options, as represented on the Statement of Assets and Liabilities. |
| (2) | Collateral amount disclosed by the Fund is limited to the Fund’s OTC derivative exposure by counterparty. |
See Notes to Financial Statements.
Statement of Assets & Liabilities
as of October 31, 2018
| | | | |
Assets | |
Investments at value: | |
Unaffiliated investments (cost $23,503,724) | | $ | 23,723,481 | |
Affiliated investments (cost $2,346,703) | | | 2,346,703 | |
Cash | | | 672 | |
Foreign currency, at value (cost $448,727) | | | 443,569 | |
Unrealized appreciation on OTC forward foreign currency exchange contracts | | | 358,910 | |
Deposit with broker for centrally cleared/exchange-traded derivatives | | | 340,623 | |
Dividends and interest receivable | | | 257,464 | |
Unrealized appreciation on OTC swap agreements | | | 104,143 | |
Due from Manager | | | 40,161 | |
Unrealized appreciation on OTC cross currency exchange contracts | | | 39,691 | |
Premiums paid for OTC swap agreements | | | 36,355 | |
Due from broker—variation margin swaps | | | 16,328 | |
Receivable for Fund shares sold | | | 5,136 | |
Unrealized appreciation on OTC forward rate agreements | | | 3,861 | |
Prepaid expenses | | | 844 | |
| | | | |
Total Assets | | | 27,717,941 | |
| | | | |
|
Liabilities | |
Premiums received for OTC swap agreements | | | 142,245 | |
Unrealized depreciation on OTC forward foreign currency exchange contracts | | | 135,011 | |
Options written outstanding, at value (proceeds received $34,624) | | | 102,843 | |
Unrealized depreciation on OTC swap agreements | | | 70,219 | |
Due to broker—variation margin futures | | | 41,509 | |
Custodian and accounting fees payable | | | 38,995 | |
Unrealized depreciation on OTC cross currency exchange contracts | | | 33,192 | |
Accrued expenses and other liabilities | | | 18,992 | |
Unrealized depreciation on OTC forward rate agreements | | | 5,190 | |
Payable for Fund shares reacquired | | | 218 | |
Affiliated transfer agent fee payable | | | 82 | |
Distribution fee payable | | | 34 | |
| | | | |
Total Liabilities | | | 588,530 | |
| | | | |
| |
Net Assets | | $ | 27,129,411 | |
| | | | |
| | | | | |
Net assets were comprised of: | |
Shares of beneficial interest, at par | | $ | 2,653 | |
Paid-in capital in excess of par | | | 25,597,118 | |
Total distributable earnings (loss) | | | 1,529,640 | |
| | | | |
Net assets, October 31, 2018 | | $ | 27,129,411 | |
| | | | |
See Notes to Financial Statements.
| | | | |
| PGIM International Bond Fund | | | 55 | |
Statement of Assets & Liabilities
as of October 31, 2018
| | | | |
Class A | | | | |
Net asset value and redemption price per share, | | | | |
($103,168 ÷ 10,091 shares of beneficial interest issued and outstanding) | | $ | 10.22 | |
Maximum sales charge (4.50% of offering price) | | | 0.48 | |
| | | | |
Maximum offering price to public | | $ | 10.70 | |
| | | | |
| |
Class C | | | | |
Net asset value, offering price and redemption price per share, | | | | |
($15,672 ÷ 1,534 shares of beneficial interest issued and outstanding) | | $ | 10.22 | |
| | | | |
|
Class Z | |
Net asset value, offering price and redemption price per share, | | | | |
($160,178 ÷ 15,660 shares of beneficial interest issued and outstanding) | | $ | 10.23 | |
| | | | |
|
Class R6 | |
Net asset value, offering price and redemption price per share, | | | | |
($26,850,393 ÷ 2,625,871 shares of beneficial interest issued and outstanding) | | $ | 10.23 | |
| | | | |
See Notes to Financial Statements.
Statement of Operations
Year Ended October 31, 2018
| | | | |
Net Investment Income (Loss) | |
Income | |
Interest income | | $ | 554,887 | |
Affiliated dividend income | | | 21,722 | |
| | | | |
Total income | | | 576,609 | |
| | | | |
|
Expenses | |
Management fee | | | 135,526 | |
Distribution fee(a) | | | 372 | |
Custodian and accounting fees | | | 133,807 | |
Registration fees(a) | | | 61,048 | |
Audit fee | | | 50,500 | |
Shareholders’ reports | | | 38,260 | |
Legal fees and expenses | | | 19,391 | |
Trustees’ fees | | | 12,543 | |
Transfer agent’s fees and expenses (including affiliated expense of $304)(a) | | | 434 | |
Miscellaneous | | | 15,400 | |
| | | | |
Total expenses | | | 467,281 | |
Less: Fee waiver and/or expense reimbursement(a) | | | (266,329 | ) |
| | | | |
Net expenses | | | 200,952 | |
| | | | |
Net investment income (loss) | | | 375,657 | |
| | | | |
|
Realized And Unrealized Gain (Loss) On Investment And Foreign Currency Transactions | |
Net realized gain (loss) on: | |
Investment transactions | | | 109,659 | |
Futures transactions | | | (401,384 | ) |
Forward and cross currency contract transactions | | | 1,049,098 | |
Options written transactions | | | 80,772 | |
Swap agreement transactions | | | 187,197 | |
Foreign currency transactions | | | 690,022 | |
| | | | |
| | | 1,715,364 | |
| | | | |
Net change in unrealized appreciation (depreciation) on: | |
Investments | | | (2,006,005 | ) |
Futures | | | (165,027 | ) |
Forward rate agreements | | | (1,329 | ) |
Forward and cross currency contracts | | | (32,498 | ) |
Options written | | | (85,581 | ) |
Swap agreements | | | 416,585 | |
Foreign currencies | | | (21,456 | ) |
| | | | |
| | | (1,895,311 | ) |
| | | | |
Net gain (loss) on investment and foreign currency transactions | | | (179,947 | ) |
| | | | |
Net Increase (Decrease) In Net Assets Resulting From Operations | | $ | 195,710 | |
| | | | |
See Notes to Financial Statements.
| | | | |
| PGIM International Bond Fund | | | 57 | |
Statement of Operations
Year Ended October 31, 2018
| (a) | Class specific expenses and waivers were as follows: |
| | | | | | | | | | | | | | | | |
| | | Class A | | | Class C | | | Class Z | | | Class R6 | |
Distribution fee | | | 247 | | | | 125 | | | | — | | | | — | |
Registration fees | | | 15,262 | | | | 15,262 | | | | 15,262 | | | | 15,262 | |
Transfer agent’s fees and expenses | | | 231 | | | | 55 | | | | 109 | | | | 39 | |
Fee waiver and/or expense reimbursement | | | (16,243 | ) | | | (15,408 | ) | | | (16,446 | ) | | | (218,232 | ) |
See Notes to Financial Statements.
Statements of Changes in Net Assets
| | | | | | | | |
| | | Year
Ended
October 31, 2018 | | | December 14, 2016**
through
October 31, 2017 | |
Increase (Decrease) in Net Assets | |
Operations | |
Net investment income (loss) | | $ | 375,657 | | | $ | 233,253 | |
Net realized gain (loss) on investment and foreign currency transactions | | | 1,715,364 | | | | (1,223,741 | ) |
Net change in unrealized appreciation (depreciation) on investments and foreign currencies | | | (1,895,311 | ) | | | 2,649,158 | |
| | | | | | | | |
Net increase (decrease) in net assets resulting from operations | | | 195,710 | | | | 1,658,670 | |
| | | | | | | | |
|
Dividends and Distributions | |
Distributions from distributable earnings* | |
Class A | | | (2,519 | ) | | | — | |
Class C | | | (231 | ) | | | — | |
Class Z | | | (4,071 | ) | | | — | |
Class R6 | | | (746,248 | ) | | | — | |
| | | | | | | | |
| | | (753,069 | ) | | | — | |
| | | | | | | | |
Tax return of capital distributions | |
Class A | | | — | | | | (771 | ) |
Class C | | | — | | | | (130 | ) |
Class Z | | | — | | | | (223 | ) |
Class R6 | | | — | | | | (553,162 | ) |
| | | | | | | | |
| | | — | | | | (554,286 | ) |
| | | | | | | | |
|
Fund share transactions | |
Net proceeds from shares sold | | | 176,212 | | | | 25,119,515 | |
Net asset value of shares issued in reinvestment of dividends and distributions | | | 753,071 | | | | 554,265 | |
Cost of shares reacquired | | | (9,576 | ) | | | (11,101 | ) |
| | | | | | | | |
Net increase (decrease) in net assets from Fund share transactions | | | 919,707 | | | | 25,662,679 | |
| | | | | | | | |
Total increase (decrease) | | | 362,348 | | | | 26,767,063 | |
|
Net Assets: | |
Beginning of period | | | 26,767,063 | | | | — | |
| | | | | | | | |
End of period(a) | | $ | 27,129,411 | | | $ | 26,767,063 | |
| | | | | | | | |
(a) Includes undistributed/(distributions in excess of) net investment income of: | | $ | * | | | $ | (318,233 | ) |
| | | | | | | | |
| * | For the year ended October 31, 2018, the Fund has adopted amendments to Regulation S-X (refer to Note 9). |
| ** | Commencement of operations. |
See Notes to Financial Statements.
| | | | |
| PGIM International Bond Fund | | | 59 | |
Notes to Financial Statements
Prudential Investment Portfolios 9 (the “Trust”) is registered under the Investment Company Act of 1940, as amended (“1940 Act”), as an open-end management investment company. The Trust was established as a Delaware business trust on September 18, 1998. The Trust currently consists of five funds: PGIM Absolute Return Bond Fund and PGIM QMA Large-Cap Core Equity Fund, each of which are diversified funds and PGIM International Bond Fund, PGIM Select Real Estate Fund and PGIM Real Estate Income Fund, each of which are non-diversified funds for purposes of the 1940 Act. These financial statements relate only to the PGIM International Bond Fund (the “Fund”). Effective June 11, 2018, the names of the Fund and the other funds which comprise the Trust were changed by replacing “Prudential” with “PGIM” and each funds’ Class Q shares were renamed Class R6 shares.
The investment objective of the Fund is to seek total return, made up of current income and capital appreciation.
1. Accounting Policies
The Fund follows the investment company accounting and reporting guidance of the Financial Accounting Standards Board (“FASB”) Accounting Standard Codification (“ASC”) Topic 946 Financial Services—Investment Companies. The following accounting policies conform to U.S. generally accepted accounting principles. The Fund consistently follows such policies in the preparation of its financial statements.
Securities Valuation: The Fund holds securities and other assets and liabilities that are fair valued at the close of each day (generally, 4:00 PM Eastern time) the New York Stock Exchange (“NYSE”) is open for trading. Fair value is the price that would be received to sell an asset or paid to transfer a liability in an orderly transaction between market participants on the measurement date. The Trust’s Board of Trustees (the “Board”) has adopted valuation procedures for security valuation under which fair valuation responsibilities have been delegated to PGIM Investments LLC (“PGIM Investments” or the “Manager”). Pursuant to the Board’s delegation, a Valuation Committee has been established as two persons, being one or more officers of the Trust, including: the Trust’s Treasurer (or the Treasurer’s direct reports); and the Trust’s Chief or Deputy Chief Compliance Officer (or Vice-President-level direct reports of the Chief or Deputy Chief Compliance Officer). Under the current valuation procedures, the Valuation Committee of the Board is responsible for supervising the valuation of portfolio securities and other assets and liabilities. The valuation procedures permit the Fund to utilize independent pricing vendor services, quotations from market makers, and alternative valuation methods when market quotations are either not readily available or not deemed representative of fair value. A record of the Valuation Committee’s actions is subject to the Board’s review, approval, and ratification at its next regularly scheduled quarterly meeting.
For the fiscal reporting period-end, securities and other assets and liabilities were fair valued at the close of the last U.S. business day. Trading in certain foreign securities may occur when the NYSE is closed (including weekends and holidays). Because such foreign securities trade in markets that are open on weekends and U.S. holidays, the values of some of the Fund’s foreign investments may change on days when investors cannot purchase or redeem Fund shares.
Various inputs determine how the Fund’s investments are valued, all of which are categorized according to the three broad levels (Level 1, 2, or 3) detailed in the Schedule of Investments and referred to herein as the “fair value hierarchy” in accordance with FASB ASC Topic 820—Fair Value Measurements and Disclosures.
Derivative instruments, such as futures or options, that are traded on a national securities exchange are valued at the last sale price as of the close of trading on the applicable exchange where the security principally trades. Securities traded via NASDAQ are valued at the NASDAQ official closing price. To the extent these securities are valued at the last sale price or NASDAQ official closing price, they are classified as Level 1 in the fair value hierarchy.
Investments in open-end, non-exchange-traded mutual funds are valued at their net asset values as of the close of the NYSE on the date of valuation. These securities are classified as Level 1 in the fair value hierarchy since they may be purchased or sold at their net asset values on the date of valuation.
Fixed income securities traded in the OTC market are generally classified as Level 2 in the fair value hierarchy. Such fixed income securities are typically valued using the market approach which generally involves obtaining data from an approved independent third-party vendor source. The Fund utilizes the market approach as the primary method to value securities when market prices of identical or comparable instruments are available. The third-party vendors’ valuation techniques used to derive the evaluated bid price are based on evaluating observable inputs, including but not limited to, yield curves, yield spreads, credit ratings, deal terms, tranche level attributes, default rates, cash flows, prepayment speeds, broker/dealer quotations and reported trades. Certain Level 3 securities are also valued using the market approach when obtaining a single broker quote or when utilizing transaction prices for identical securities that have been used in excess of five business days. During the reporting period, there were no changes to report with respect to the valuation approach and/or valuation techniques discussed above.
��
OTC derivative instruments are generally classified as Level 2 in the fair value hierarchy. Such derivative instruments are typically valued using the market approach and/or income approach which generally involves obtaining data from an approved independent third-party vendor source. The Fund utilizes the market approach when quoted prices in broker-dealer markets are available but also includes consideration of alternative valuation approaches, including the income approach. In the absence of reliable market quotations, the income approach is typically utilized for purposes of valuing OTC derivatives such as interest rate
| | | | |
| PGIM International Bond Fund | | | 61 | |
Notes to Financial Statements (continued)
swaps based on a discounted cash flow analysis whereby the value of the instrument is equal to the present value of its future cash inflows or outflows. Such analysis includes projecting future cash flows and determining the discount rate (including the present value factors that affect the discount rate) used to discount the future cash flows. In addition, the third-party vendors’ valuation techniques used to derive the evaluated OTC derivative price is based on evaluating observable inputs, including but not limited to, underlying asset prices, indices, spreads, interest rates and exchange rates. Certain OTC derivatives may be classified as Level 3 when valued using the market approach by obtaining a single broker quote or when utilizing unobservable inputs in the income approach. During the reporting period, there were no changes to report with respect to the valuation approach and/or valuation techniques discussed above.
Centrally cleared swaps listed or traded on a multilateral or trade facility platform, such as a registered exchange, are generally valued at the daily settlement price determined by the respective exchange. These securities are classified as Level 2 in the fair value hierarchy, as the daily settlement price is not public.
Securities and other assets that cannot be priced according to the methods described above are valued based on pricing methodologies approved by the Board. In the event that unobservable inputs are used when determining such valuations, the securities will be classified as Level 3 in the fair value hierarchy.
When determining the fair value of securities, some of the factors influencing the valuation include: the nature of any restrictions on disposition of the securities; assessment of the general liquidity of the securities; the issuer’s financial condition and the markets in which it does business; the cost of the investment; the size of the holding and the capitalization of the issuer; the prices of any recent transactions or bids/offers for such securities or any comparable securities; any available analyst media or other reports or information deemed reliable by the Manager regarding the issuer or the markets or industry in which it operates. Using fair value to price securities may result in a value that is different from a security’s most recent closing price and from the price used by other unaffiliated mutual funds to calculate their net asset values.
Foreign Currency Translation: The books and records of the Fund are maintained in U.S. dollars. Foreign currency amounts are translated into U.S. dollars on the following basis:
(i) market value of investment securities, other assets and liabilities—at the current rates of exchange;
(ii) purchases and sales of investment securities, income and expenses—at the rates of exchange prevailing on the respective dates of such transactions.
Although the net assets of the Fund are presented at the foreign exchange rates and market values at the close of the period, the Fund does not generally isolate that portion of the results of operations arising as a result of changes in the foreign exchange rates from the fluctuations arising from changes in the market prices of long-term portfolio securities held at the end of the period. Similarly, the Fund does not isolate the effect of changes in foreign exchange rates from the fluctuations arising from changes in the market prices of long-term portfolio securities sold during the period. Accordingly, holding period realized foreign currency gains (losses) are included in the reported net realized gains (losses) on investment transactions. Notwithstanding the above, the Fund does isolate the effect of fluctuations in foreign currency exchange rates when determining the gain (loss) upon the sale or maturity of foreign currency denominated debt obligations; such amounts are included in net realized gains (losses) on foreign currency transactions.
Additionally, net realized gains (losses) on foreign currency transactions represent net foreign exchange gains (losses) from the disposition of holdings of foreign currencies, currency gains (losses) realized between the trade and settlement dates on securities transactions, and the difference between the amounts of interest, dividends and foreign withholding taxes recorded on the Fund’s books and the U.S. dollar equivalent amounts actually received or paid. Net unrealized currency gains (losses) arise from valuing foreign currency denominated assets and liabilities (other than investments) at period end exchange rates.
Forward and Cross Currency Contracts: A forward currency contract is a commitment to purchase or sell a foreign currency at a future date at a negotiated forward rate. The Fund enters into forward currency contracts in order to hedge its exposure to changes in foreign currency exchange rates on its foreign portfolio holdings or specific receivables and payables denominated in a foreign currency and to gain exposure to certain currencies. The contracts are valued daily at current forward exchange rates and any unrealized gain (loss) is included in net unrealized appreciation (depreciation) on investments and foreign currencies. Gain (loss) is realized on the settlement date of the contract equal to the difference between the settlement value of the original and negotiated forward contracts. This gain (loss), if any, is included in net realized gain (loss) on forward and cross currency contract transactions. Risks may arise upon entering into these contracts from the potential inability of the counterparties to meet the terms of their contracts. Forward currency contracts involve risks from currency exchange rate and credit risk in excess of the amounts reflected on the Statement of Assets and Liabilities. The Fund’s maximum risk of loss from counterparty credit risk is the net value of the cash flows to be received from the counterparty at the end of the contract’s life. A cross currency contract is a forward contract where a specified amount of one foreign currency will be exchanged for a specified amount of another foreign currency.
Options: The Fund purchased or wrote options in order to hedge against adverse market movements or fluctuations in value caused by changes in prevailing interest rates, value of equities or foreign currency exchange rates with respect to securities or financial instruments which the Fund currently owns or intends to purchase. The Fund may also use
| | | | |
| PGIM International Bond Fund | | | 63 | |
Notes to Financial Statements (continued)
options to gain additional market exposure. The Fund’s principal reason for writing options is to realize, through receipt of premiums, a greater current return than would be realized on the underlying security alone. When the Fund purchases an option, it pays a premium and an amount equal to that premium is recorded as an asset. When the Fund writes an option, it receives a premium and an amount equal to that premium is recorded as a liability. The asset or liability is adjusted daily to reflect the current market value of the option. If an option expires unexercised, the Fund realizes a gain (loss) to the extent of the premium received or paid. If an option is exercised, the premium received or paid is recorded as an adjustment to the proceeds from the sale or the cost of the purchase in determining whether the Fund has realized a gain (loss). The difference between the premium and the amount received or paid at the closing of a purchase or sale transaction is also treated as a realized gain (loss). Gain (loss) on purchased options is included in net realized gain (loss) on investment transactions. Gain (loss) on written options is presented separately as net realized gain (loss) on options written transactions.
The Fund, as writer of an option, may have no control over whether the underlying securities or financial instruments may be sold (called) or purchased (put). As a result, the Fund bears the market risk of an unfavorable change in the price of the security or financial instrument underlying the written option. The Fund, as purchaser of an OTC option, bears the risk of the potential inability of the counterparties to meet the terms of their contracts. With exchange-traded options contracts, there is minimal counterparty credit risk to the Fund since the exchanges’ clearinghouse acts as counterparty to all exchange-traded options and guarantees the options contracts against default.
When the Fund writes an option on a swap, an amount equal to any premium received by the Fund is recorded as a liability and is subsequently adjusted to the current market value of the written option on the swap. If a call option on a swap is exercised, the Fund becomes obligated to pay a fixed interest rate (noted as the strike price) and receive a variable interest rate on a notional amount. If a put option on a swap is exercised, the Fund becomes obligated to pay a variable interest rate and receive a fixed interest rate (noted as the strike price) on a notional amount. Premiums received from writing options on swaps that expire or are exercised are treated as realized gains upon the expiration or exercise of such options on swaps. The risk associated with writing put and call options on swaps is that the Fund will be obligated to be party to a swap agreement if an option on a swap is exercised.
Financial Futures Contracts: A financial futures contract is an agreement to purchase (long) or sell (short) an agreed amount of securities at a set price for delivery on a future date. Upon entering into a financial futures contract, the Fund is required to pledge to the broker an amount of cash and/or other assets equal to a certain percentage of the contract amount. This amount is known as the “initial margin.” Subsequent payments, known as “variation margin,” are made or received by the Fund each day, depending on the daily fluctuations in
the value of the underlying security. Such variation margin is recorded for financial statement purposes on a daily basis as unrealized gain (loss). When the contract expires or is closed, the gain (loss) is realized and is presented in the Statement of Operations as net realized gain (loss) on futures transactions.
The Fund invested in financial futures contracts in order to hedge its existing portfolio securities, or securities the Fund intends to purchase, against fluctuations in value caused by changes in prevailing interest rates. Should interest rates move unexpectedly, the Fund may not achieve the anticipated benefits of the financial futures contracts and may realize a loss. The use of futures transactions involves the risk of imperfect correlation in movements in the price of futures contracts, interest rates and the underlying hedged assets. Since futures contracts are exchange-traded, there is minimal counterparty credit risk to the Fund since the exchanges’ clearinghouse acts as counterparty to all exchange-traded futures and guarantees the futures contracts against default.
Forward Rate Agreements: Forward rate agreements represent an agreement between counterparties to exchange cash flows based on the difference between two interest rates, applied to a notional principal amount on a fixed future date. The Fund entered into forward rate agreements to gain yield exposure based on anticipated market conditions at the specified termination date of the agreement.
Swap Agreements: The Fund may enter into credit default, interest rate and other types of swap agreements. A swap agreement is an agreement to exchange the return generated by one instrument for the return generated by another instrument. Swap agreements are negotiated in the OTC market and may be executed either directly with counterparty (“OTC-traded”) or through a central clearing facility, such as a registered exchange. Swap agreements are valued daily at current market value and any change in value is included in the net unrealized appreciation (depreciation) on swap agreements. Centrally cleared swaps pay or receive an amount known as “variation margin”, based on daily changes in the valuation of the swap contract. Any upfront premiums paid and received are shown as swap premiums paid and swap premiums received in the Statement of Assets and Liabilities. Risk of loss may exceed amounts recognized on the Statement of Assets and Liabilities. Swap agreements outstanding at period end, if any, are listed on the Schedule of Investments.
Interest Rate Swaps: Interest rate swaps represent an agreement between counterparties to exchange cash flows based on the difference between two interest rates, applied to a notional principal amount for a specified period. The Fund is subject to interest rate risk exposure in the normal course of pursuing its investment objective. The Fund used interest rate swaps to maintain its ability to generate steady cash flow by receiving a stream of fixed-rate payments and to increase exposure to prevailing market rates by receiving floating rate payments. The Fund’s maximum risk of loss from counterparty credit risk is the discounted net present value of the cash flows to be received from the counterparty over the contract’s remaining life.
| | | | |
| PGIM International Bond Fund | | | 65 | |
Notes to Financial Statements (continued)
Inflation Swaps: The Fund entered into inflation swap agreements to protect against fluctuations in inflation rates. Inflation swaps are characterized by one party paying a fixed rate in exchange for a floating rate that is derived from an inflation index, such as the Consumer Price Index or UK Retail Price Index. Inflation swaps subject the Fund to interest rate risk.
Credit Default Swaps (“CDS”): CDS involve one party (the protection buyer) making a stream of payments to another party (the protection seller) in exchange for the right to receive a specified payment in the event of a default or as a result of a default (collectively a “credit event”) for the referenced entity (typically corporate issues or sovereign issues of an emerging country) on its obligation; or in the event of a write-down, principal shortfall, interest shortfall or default of all or part of the referenced entities comprising a credit index.
The Fund is subject to credit risk in the normal course of pursuing its investment objectives, and as such, has entered into CDS contracts to provide a measure of protection against defaults or to take an active long or short position with respect to the likelihood of a particular issuer’s default or the reference entity’s credit soundness. CDS contracts generally trade based on a spread which represents the cost a protection buyer has to pay the protection seller. The protection buyer is said to be short the credit as the value of the contract rises the more the credit deteriorates. The value of the CDS contract increases for the protection buyer if the spread increases. The Fund’s maximum risk of loss from counterparty credit risk for purchased CDS is the inability of the counterparty to honor the contract up to the notional value due to a credit event.
As a seller of protection on credit default swap agreements, the Fund generally receives an agreed upon payment from the buyer of protection throughout the term of the swap, provided no credit event occurs. As the seller, the Fund effectively increases its investment risk because, in addition to its total net assets, the Fund may be subject to investment exposure on the notional amount of the swap.
The maximum amount of the payment that the Fund, as a seller of protection, could be required to make under a credit default swap agreement would be equal to the notional amount of the underlying security or index contract as a result of a credit event. This potential amount will be partially offset by any recovery values of the respective referenced obligations, or net amounts received from the settlement of buy protection credit default swap agreements which the Fund entered into for the same referenced entity or index. As a buyer of protection, the Fund generally receives an amount up to the notional value of the swap if a credit event occurs.
Implied credit spreads, represented in absolute terms, utilized in determining the market value of credit default swap agreements where the Fund is the seller of protection as of
period end are disclosed in the footnotes to the Schedule of Investments, if applicable. These spreads serve as indicators of the current status of the payment/performance risk and represent the likelihood of default risk for the credit derivative. The implied credit spread of a particular referenced entity reflects the cost of buying/selling protection and may include upfront payments required to enter into the agreement. Wider credit spreads and increased market value in absolute terms, when compared to the notional amount of the swap, represent a deterioration of the referenced entity’s credit soundness and a greater likelihood of risk of default or other credit event occurring as defined under the terms of the agreement.
Currency Swaps: The Fund entered into currency swap agreements primarily to gain yield exposure on foreign bonds. Currency swap agreements involve two parties exchanging two different currencies with an agreement to reverse the exchange at a later date at specified exchange rates.
Master Netting Arrangements: The Trust, on behalf of the Fund, is subject to various Master Agreements, or netting arrangements, with select counterparties. These are agreements which a subadviser may have negotiated and entered into on behalf of the Fund. A master netting arrangement between the Fund and the counterparty permits the Fund to offset amounts payable by the Fund to the same counterparty against amounts to be received; and by the receipt of collateral from the counterparty by the Fund to cover the Fund’s exposure to the counterparty. However, there is no assurance that such mitigating factors are easily enforceable. In addition to master netting arrangements, the right to set-off exists when all the conditions are met such that each of the parties owes the other determinable amounts, the reporting party has the right to set-off the amount owed with the amount owed by the other party, the reporting party intends to set-off and the right of set-off is enforceable by law. During the reporting period, there was no intention to settle on a net basis and all amounts are presented on a gross basis on the Statement of Assets and Liabilities.
The Trust, on behalf of the Fund, is a party to International Swaps and Derivatives
Association, Inc. (“ISDA”) Master Agreements with certain counterparties that govern OTC derivative and foreign exchange contracts entered into from time to time. The Master Agreements may contain provisions regarding, among other things, the parties’ general obligations, representations, agreements, collateral requirements, events of default and early termination. With respect to certain counterparties, in accordance with the terms of the Master Agreements, collateral posted to the Fund is held in a segregated account by the Fund’s custodian and with respect to those amounts which can be sold or re-pledged, is presented in the Schedule of Investments. Collateral pledged by the Fund is segregated by the Fund’s custodian and identified in the Schedule of Investments. Collateral can be in the form of cash or debt securities issued by the U.S. Government or related agencies or other securities as agreed to by the Fund and the applicable counterparty. Collateral requirements are determined based on the Fund’s net position with each counterparty. Termination events applicable to the Fund may occur upon a decline in the Fund’s net assets below a specified threshold over a certain period of time. Termination events applicable to counterparties may occur upon a decline in the counterparty’s long-term and short-term credit ratings below a
| | | | |
| PGIM International Bond Fund | | | 67 | |
Notes to Financial Statements (continued)
specified level. In each case, upon occurrence, the other party may elect to terminate early and cause settlement of all derivative and foreign exchange contracts outstanding, including the payment of any losses and costs resulting from such early termination, as reasonably determined by the terminating party. Any decision by one or more of the Fund’s counterparties to elect early termination could impact the Fund’s future derivative activity.
In addition to each instrument’s primary underlying risk exposure (e.g. interest rate, credit, equity or foreign exchange, etc.), swap agreements involve, to varying degrees, elements of credit, market and documentation risk. Such risks involve the possibility that no liquid market for these agreements will exist, the counterparty to the agreement may default on its obligation to perform or disagree on the contractual terms of the agreement, and changes in net interest rates will be unfavorable. In connection with these agreements, securities in the portfolio may be identified or received as collateral from the counterparty in accordance with the terms of the respective swap agreements to provide or receive assets of value and to serve as recourse in the event of default or bankruptcy/insolvency of either party. Such OTC derivative agreements include conditions which, when materialized, give the counterparty the right to cause an early termination of the transactions under those agreements. Any election by the counterparty for early termination of the contract(s) may impact the amounts reported on financial statements.
As of October 31, 2018, the Fund has not met conditions under such agreements which give the counterparty the right to call for an early termination.
Forward currency contracts, forward rate agreements, written options, short sales, swaps and financial futures contracts involve elements of both market and credit risk in excess of the amounts reflected on the Statement of Assets and Liabilities. Such risks may be mitigated by engaging in master netting arrangements.
Securities Transactions and Net Investment Income: Securities transactions are recorded on the trade date. Realized gains (losses) from investment and currency transactions are calculated on the specific identification method. Dividend income is recorded on the ex-date. Interest income, including amortization of premium and accretion of discount on debt securities, as required, is recorded on the accrual basis. Expenses are recorded on an accrual basis, which may require the use of certain estimates by management that may differ from actual. Net investment income or loss (other than class specific expenses and waivers, which are allocated as noted below) and unrealized and realized gains (losses) are allocated daily to each class of shares based upon the relative proportion of adjusted net assets of each class at the beginning of the day. Class specific expenses and waivers, where applicable, are charged to the respective share classes. Class specific expenses include distribution fees and distribution fee waivers, shareholder servicing fees, transfer agent’s fees and expenses, registration fees and fee waivers and/or expense reimbursements, as applicable.
Taxes: It is the Fund’s policy to continue to meet the requirements of the Internal Revenue Code applicable to regulated investment companies and to distribute all of its taxable net investment income and capital gains, if any, to its shareholders. Therefore, no federal income tax provision is required. Withholding taxes on foreign dividends, interest and capital gains, if any, are recorded, net of reclaimable amounts, at the time the related income is earned.
Dividends and Distributions: The Fund expects to declare dividends of its net investment income daily and pay such dividends monthly. Distributions of net realized capital and currency gains, if any, are declared and paid at least annually. Dividends and distributions to shareholders, which are determined in accordance with federal income tax regulations and which may differ from generally accepted accounting principles, are recorded on the ex-date. Permanent book/tax differences relating to income and gain (loss) are reclassified amongst total distributable earnings (loss) and paid-in capital in excess of par, as appropriate.
Estimates: The preparation of financial statements requires management to make estimates and assumptions that affect the reported amounts and disclosures in the financial statements. Actual results could differ from those estimates.
2. Agreements
The Trust, on behalf of the Fund, has a management agreement with PGIM Investments. Pursuant to this agreement, PGIM Investments has responsibility for all investment advisory services and supervises the subadviser’s performance of such services. In addition, under the management agreement, PGIM Investments provides all of the administrative functions necessary for the organization, operation and management of the Fund. PGIM Investments administers the corporate affairs of the Fund and, in connection therewith, furnishes the Fund with office facilities, together with those ordinary clerical and bookkeeping services which are not being furnished by the Fund’s custodian and the Fund’s transfer agent. PGIM Investments is also responsible for the staffing and management of dedicated groups of legal, marketing, compliance and related personnel necessary for the operation of the Fund. The legal, marketing, compliance and related personnel are also responsible for the management and oversight of the various service providers to the Fund, including, but not limited to, the custodian, transfer agent, and accounting agent.
PGIM Investments has entered into a subadvisory agreement with PGIM, Inc., which provides subadvisory services to the Fund through its PGIM Fixed Income unit. The subadvisory agreement provides that PGIM, Inc. will furnish investment advisory services in connection with the management of the Fund. In connection therewith, PGIM, Inc. is obligated to keep certain books and records of the Fund. PGIM Investments pays for the services of PGIM, Inc., the cost of compensation of officers of the Fund, occupancy and certain clerical and bookkeeping costs of the Fund. The Fund bears all other costs and expenses.
| | | | |
| PGIM International Bond Fund | | | 69 | |
Notes to Financial Statements (continued)
The management fee paid to PGIM Investments is accrued daily and payable monthly at an annual rate of 0.500% of the Fund’s average daily net assets up to $2 billion and 0.485% of such assets in excess of $2 billion. The effective management fee rate before any waivers and/or expense reimbursements was 0.500% for the year ended October 31, 2018.
PGIM Investments has contractually agreed, through February 28, 2019, to limit total annual operating expenses after fee waivers and/or expense reimbursements to 0.99% of average daily net assets for Class A shares, 1.74% of average daily net assets for Class C shares, 0.74% of average daily net assets for Class Z shares, and 0.74% of average daily net assets for Class R6 shares. This contractual waiver excludes interest, brokerage, taxes (such as income and foreign withholding taxes, stamp duty and deferred tax expenses), acquired fund fees and expenses, extraordinary expenses, and certain other Fund expenses such as dividend and interest expense and broker charges on short sales. Expenses waived/reimbursed by the Manager in accordance with this agreement may be recouped by the Manager within the same fiscal year during which such waiver/reimbursement is made if such recoupment can be realized without exceeding the expense limit in effect at the time of the recoupment for that fiscal year. Effective November 1, 2018 this waiver agreement was extended through February 29, 2020.
Where applicable, PGIM Investments voluntarily agreed through October 31, 2018, to waive management fees or shared operating expenses on any share class to the same extent that it waives similar expenses on any other share class and, in addition, total annual operating expenses for Class R6 shares will not exceed total annual operating expenses for Class Z shares. Effective November 1, 2018 this voluntary agreement became part of the Fund’s contractual waiver agreement through February 29, 2020 and is subject to recoupment by the Manager within the same fiscal year during which such wavier/reimbursement is made if such recoupment can be realized without exceeding the expense limit in effect at the time of the recoupment for that fiscal year.
The Trust, on behalf of the Fund, has a distribution agreement with Prudential Investment Management Services LLC (“PIMS”), which acts as the distributor of the Class A, Class C, Class Z and Class R6 shares of the Fund. The Fund compensates PIMS for distributing and servicing the Fund’s Class A and Class C shares, pursuant to the plans of distribution (the “Distribution Plans”), regardless of expenses actually incurred by PIMS. The distribution fees are accrued daily and payable monthly. No distribution or service fees are paid to PIMS as distributor of the Class Z or Class R6 shares of the Fund.
Pursuant to the Distribution Plans, the Fund compensates PIMS for distribution related activities at an annual rate of up to 0.25% and 1% of the average daily net assets of the Class A and Class C shares, respectively.
PIMS has advised the Fund that it has not received front-end sales charges resulting from sales of Class A shares during the year ended October 31, 2018. From these fees, PIMS paid such sales charges to broker-dealers, who in turn paid commissions to salespersons and incurred other distribution costs.
PIMS has advised the Fund that for the year ended October 31, 2018, it has not received any contingent deferred sales charges imposed upon redemptions by certain Class A and Class C shareholders, respectively.
PGIM Investments, PGIM, Inc. and PIMS are indirect, wholly-owned subsidiaries of Prudential Financial, Inc. (“Prudential”).
3. Other Transactions with Affiliates
Prudential Mutual Fund Services LLC (“PMFS”), an affiliate of PGIM Investments and an indirect, wholly-owned subsidiary of Prudential, serves as the Fund’s transfer agent. Transfer agent’s fees and expenses in the Statement of Operations include certain out-of-pocket expenses paid to non-affiliates, where applicable.
The Fund may enter into certain securities purchase or sale transactions under Board approved Rule 17a-7 procedures. Rule 17a-7 is an exemptive rule under the 1940 Act, that subject to certain conditions, permits purchase and sale transactions among affiliated investment companies, or between an investment company and a person that is affiliated solely by reason of having a common (or affiliated) investment adviser, common directors, and/or common officers. Such transactions are subject to ratification by the Board. For the reporting period ended October 31, 2018, no such transactions were entered into by the Fund.
The Fund may invest its overnight sweep cash in the PGIM Core Ultra Short Bond Fund (the “Core Fund”), a series of Prudential Investment Portfolios 2, registered under the 1940 Act and managed by PGIM Investments. Earnings from the Core Fund are disclosed on the Statement of Operations as “Affiliated dividend income”.
4. Portfolio Securities
The aggregate cost of purchases and proceeds from sales of portfolio securities (excluding short-term investments and U.S. Government securities) for the year ended October 31, 2018, were $8,455,562 and $9,048,265, respectively.
A summary of the cost of purchases and proceeds from sales of shares of an affiliated mutual fund for the year ended October 31, 2018, is presented as follows:
| | | | |
| PGIM International Bond Fund | | | 71 | |
Notes to Financial Statements (continued)
| | | | | | | | | | | | | | | | | | | | | | | | | | | | | | |
Value,
Beginning
of Year | | | Cost of
Purchases | | | Proceeds
from Sales | | | Change in
Unrealized
Gain
(Loss) | | | Realized
Gain
(Loss) | | | Value,
End of
Year | | | Shares,
End of
Year | | | Income | |
| | PGIM Core Ultra Short Bond Fund* | |
| $ | 212,885 | | | $ | 9,181,405 | | | $ | 7,047,587 | | | $ | — | | | $ | — | | | $ | 2,346,703 | | | | 2,346,703 | | | $ | 21,722 | |
| | | | | | | | | | | | | | | | | | | | | | | | | | | | | | |
| * | The Fund did not have any capital gain distributions during the reporting period. |
5. Distributions and Tax Information
Distributions to shareholders, which are determined in accordance with federal income tax regulations and which may differ from generally accepted accounting principles, are recorded on the ex-date.
For the year ended October 31, 2018, the tax character of dividends paid by the Fund was $753,069 of ordinary income. For the period ended October 31, 2017, the tax character of dividends paid by the Fund was $554,286 of tax return of capital.
As of October 31, 2018, the accumulated undistributed earnings on a tax basis was $1,701,354 of ordinary income.
The United States federal income tax basis of the Fund’s investments and the net unrealized appreciation as of October 31, 2018 were as follows:
| | | | | | |
Tax Basis | | Gross
Unrealized
Appreciation | | Gross
Unrealized
Depreciation | | Net
Unrealized
Appreciation |
| $26,239,847 | | $1,409,090 | | $(1,170,595) | | $238,495 |
The differences between book basis and tax basis were primarily attributable to deferred losses on wash sales, straddles, premium on bonds and other cost basis differences between financial and tax accounting.
For federal income tax purposes, the Fund had a capital loss carryforward as of October 31, 2018 of approximately $410,000 which can be carried forward for an unlimited period. No capital gains distributions are expected to be paid to shareholders until net gains have been realized in excess of such losses.
Management has analyzed the Fund’s tax positions taken on federal, state and local income tax returns for all open tax years and has concluded that no provision for income tax is required in the Fund’s financial statements for the current reporting period. The Fund’s
federal, state and local income and federal excise tax returns for tax years for which the applicable statutes of limitations have not expired are subject to examination by the Internal Revenue Service and state departments of revenue.
6. Capital and Ownership
The Fund offers Class A, Class C, Class Z and Class R6 shares. Class A shares are sold with a maximum front-end sales charge of 4.50%. Investors who purchase $1 million or more of Class A shares and sell these shares within 12 months of purchase are subject to a contingent deferred sales charge (“CDSC”) of 1%, although they are not subject to an initial sales charge. The Class A CDSC is waived for certain retirement and/or benefit plans. A special exchange privilege is also available for shareholders who qualified to purchase Class A shares at net asset value. Class C shares are sold with a CDSC of 1% on sales made within 12 months of purchase. Class Z and Class R6 shares are not subject to any sales or redemption charge and are available exclusively for sale to a limited group of investors.
Under certain circumstances, an exchange may be made from specified share classes of the Fund to one or more other share classes of the Fund as presented in the table of transactions in shares of beneficial interest.
The Trust has authorized an unlimited number of shares of beneficial interest at $0.001 par value per share, divided into four classes, designated Class A, Class C, Class Z and Class R6.
As of October 31, 2018, Prudential, through its affiliated entities, including affiliated funds (if applicable), owned 1,045 Class A shares, 1,031 Class C shares, 1,051 Class Z shares and 2,625,871 Class R6 shares of the Fund. At reporting period end, one shareholder of record held 99% of the Fund’s outstanding shares on behalf of multiple beneficial owners, of which 99% were held by an affiliate of Prudential.
Transactions in shares of beneficial interest were as follows:
| | | | | | | | |
Class A | | Shares | | | Amount | |
Year ended October 31, 2018: | |
Shares sold | | | 1,269 | | | $ | 13,169 | |
Shares issued in reinvestment of dividends and distributions | | | 243 | | | | 2,520 | |
Shares reacquired | | | (188 | ) | | | (1,949 | ) |
| | | | | | | | |
Net increase (decrease) in shares outstanding | | | 1,324 | | | $ | 13,740 | |
| | | | | | | | |
Period ended October 31, 2017*: | |
Shares sold | | | 8,745 | | | $ | 89,467 | |
Shares issued in reinvestment of dividends and distributions | | | 74 | | | | 771 | |
Shares reacquired | | | (52 | ) | | | (546 | ) |
| | | | | | | | |
Net increase (decrease) in shares outstanding | | | 8,767 | | | $ | 89,692 | |
| | | | | | | | |
| | | | |
| PGIM International Bond Fund | | | 73 | |
Notes to Financial Statements (continued)
| | | | | | | | |
Class C | | Shares | | | Amount | |
Year ended October 31, 2018: | | | | | | | | |
Shares sold | | | 1,253 | | | $ | 12,940 | |
Shares issued in reinvestment of dividends and distributions | | | 22 | | | | 223 | |
Shares reacquired | | | (754 | ) | | | (7,627 | ) |
| | | | | | | | |
Net increase (decrease) in shares outstanding | | | 521 | | | $ | 5,536 | |
| | | | | | | | |
Period ended October 31, 2017*: | | | | | | | | |
Shares sold | | | 1,000 | | | $ | 10,000 | |
Shares issued in reinvestment of dividends and distributions | | | 13 | | | | 130 | |
| | | | | | | | |
Net increase (decrease) in shares outstanding | | | 1,013 | | | $ | 10,130 | |
| | | | | | | | |
Class Z | |
Year ended October 31, 2018: | | | | | | | | |
Shares sold | | | 14,241 | | | $ | 150,103 | |
Shares issued in reinvestment of dividends and distributions | | | 393 | | | | 4,071 | |
| | | | | | | | |
Net increase (decrease) in shares outstanding | | | 14,634 | | | $ | 154,174 | |
| | | | | | | | |
Period ended October 31, 2017*: | | | | | | | | |
Shares sold | | | 1,005 | | | $ | 10,048 | |
Shares issued in reinvestment of dividends and distributions | | | 21 | | | | 223 | |
| | | | | | | | |
Net increase (decrease) in shares outstanding | | | 1,026 | | | $ | 10,271 | |
| | | | | | | | |
Class R6 | |
Year ended October 31, 2018: | | | | | | | | |
Shares issued in reinvestment of dividends and distributions | | | 71,921 | | | $ | 746,257 | |
| | | | | | | | |
Net increase (decrease) in shares outstanding | | | 71,921 | | | $ | 746,257 | |
| | | | | | | | |
Period ended October 31, 2017*: | | | | | | | | |
Shares sold | | | 2,501,000 | | | $ | 25,010,000 | |
Shares issued in reinvestment of dividends and distributions | | | 53,965 | | | | 553,141 | |
Shares reacquired† | | | (1,015 | ) | | | (10,555 | ) |
| | | | | | | | |
Net increase (decrease) in shares outstanding | | | 2,553,950 | | | $ | 25,552,586 | |
| | | | | | | | |
| * | Commencement of operations was December 14, 2016. |
| † | Includes affiliated redemptions of 1,015 Class R6 shares with a value of $10,555. |
7. Borrowings
The Trust, on behalf of the Fund, along with other affiliated registered investment companies (the “Funds”), is a party to a Syndicated Credit Agreement (“SCA”) with a group of banks. The purpose of the SCA is to provide an alternative source of temporary funding for capital share redemptions. The SCA provides for a commitment of $900 million for the period October 4, 2018 through October 3, 2019. The Funds pay an annualized commitment fee of 0.15% of the unused portion of the SCA. The Fund’s portion of the commitment fee for the unused amount, allocated based upon a method approved by the Board, is accrued daily and paid quarterly. Prior to October 4, 2018, the Funds had another SCA that provided a commitment of $900 million and the Funds paid an annualized commitment fee of 0.15% of the unused portion of the SCA. The interest on borrowings under both SCAs is paid
monthly and at a per annum interest rate based upon a contractual spread plus the higher of (1) the effective federal funds rate, (2) the 1-month LIBOR rate or (3) zero percent.
Other affiliated registered investment companies that are parties to the SCA include portfolios that are subject to a predetermined mathematical formula used to manage certain benefit guarantees offered under variable annuity contracts. The formula may result in large scale asset flows into and out of these portfolios. Consequently, these portfolios may be more likely to utilize the SCA for purposes of funding redemptions. It may be possible for those portfolios to fully exhaust the committed amount of the SCA, thereby requiring the Manager to allocate available funding per a Board-approved methodology designed to treat the Funds in the SCA equitably.
The Fund did not utilize the SCA during the reporting period ended October 31, 2018.
8. Risks of Investing in the Fund
The Fund’s risks include, but are not limited to, some or all of the risks discussed below:
Bond Obligations Risk: The Fund’s holdings, share price, yield and total return may fluctuate in response to bond market movements. The value of bonds may decline for issuer-related reasons, including management performance, financial leverage and reduced demand for the issuer’s goods and services. Certain types of fixed-income obligations also may be subject to “call and redemption risk,” which is the risk that the issuer may call a bond held by the Fund for redemption before it matures and the Fund may not be able to reinvest at the same level and therefore would earn less income.
Derivatives Risk: Derivatives involve special risks and costs and may result in losses to the Fund. The successful use of derivatives requires sophisticated management, and, to the extent that derivatives are used, the Fund will depend on the subadviser’s ability to analyze and manage derivative transactions. The prices of derivatives may move in unexpected ways, especially in abnormal market conditions. Some derivatives are “leveraged” and therefore may magnify or otherwise increase investment losses to the Fund. The Fund’s use of derivatives may also increase the amount of taxes payable by shareholders. Other risks arise from the potential inability to terminate or sell derivatives positions. A liquid secondary market may not always exist for the Fund’s derivatives positions. In fact, many OTC derivative instruments will not have liquidity beyond the counterparty to the instrument. OTC derivative instruments also involve the risk that the other party will not meet its obligations to the Fund.
Foreign Securities Risk: The Fund’s investments in securities of foreign issuers or issuers with significant exposure to foreign markets involve additional risk. Foreign countries in which the Fund may invest may have markets that are less liquid, less regulated and more volatile than US markets. The value of the Fund’s investments may decline because of factors affecting the particular issuer as well as foreign markets and issuers generally, such as unfavorable government actions, and political or financial instability.
| | | | |
| PGIM International Bond Fund | | | 75 | |
Notes to Financial Statements (continued)
Interest Rate Risk: The value of an investment may go down when interest rates rise. A rise in rates tends to have a greater impact on the prices of longer term or duration securities. When interest rates fall, the issuers of debt obligations may prepay principal more quickly than expected, and the Fund may be required to reinvest the proceeds at a lower interest rate. This is referred to as “prepayment risk.” When interest rates rise, debt obligations may be repaid more slowly than expected, and the value of the Fund’s holdings may fall sharply. This is referred to as “extension risk. The Fund may face a heightened level of interest rate risk as a result of the US Federal Reserve Board’s policies. The Fund’s investments may lose value if short-term or long-term interest rates rise sharply or in a manner not anticipated by the subadviser.
Liquidity Risk: The Fund may invest in instruments that trade in lower volumes and are less liquid than other investments. Liquidity risk exists when particular investments made by the Fund are difficult to purchase or sell. Liquidity risk includes the risk that the Fund may make investments that may become less liquid in response to market developments or adverse investor perceptions. Investments that are illiquid or that trade in lower volumes may be more difficult to value. If the Fund is forced to sell these investments to pay redemption proceeds or for other reasons, the Fund may lose money. In addition, when there is no willing buyer and investments cannot be readily sold at the desired time or price, the Fund may have to accept a lower price or may not be able to sell the instrument at all. The reduction in dealer market-making capacity in the fixed-income markets that has occurred in recent years also has the potential to reduce liquidity. An inability to sell a portfolio position can adversely affect the Fund’s value or prevent the Fund from being able to take advantage of other investment opportunities.
Non-diversification Risk: The Fund is non-diversified, meaning that the Fund may invest a greater percentage of its assets in the securities of a single company or industry than a diversified fund. Investing in a non-diversified fund involves greater risk than investing in a diversified fund because a loss resulting from the decline in value of any one security may represent a greater portion of the total assets of a non-diversified fund.
9. Recent Accounting Pronouncements and Reporting Updates
In August 2018, the Securities and Exchange Commission (the “SEC”) adopted amendments to Regulation S-X to update and simplify the disclosure requirements for registered investment companies by eliminating requirements that are redundant or duplicative of US GAAP requirements or other SEC disclosure requirements. The new amendments require the presentation of the total, rather than the components, of distributable earnings on the Statement of Assets and Liabilities and the total, rather than the components, of dividends from net investment income and distributions from net realized gains on the Statements of Changes in Net Assets. The amendments also removed
the requirement for the parenthetical disclosure of undistributed net investment income on the Statements of Changes in Net Assets and certain tax adjustments that were reflected in the Notes to Financial Statements. All of these have been reflected in the Fund’s financial statements.
In August 2018, the FASB issued Accounting Standards Update (“ASU”) No. 2018-13, which changes certain fair value measurement disclosure requirements. The new ASU, in addition to other modifications and additions, removes the requirement to disclose the amount and reasons for transfers between Level 1 and Level 2 of the fair value hierarchy, and the Fund’s policy for the timing of transfers between levels. The amendments are effective for financial statements issued for fiscal years beginning after December 15, 2019, and interim periods within those fiscal years. Management has evaluated the implications of certain provisions of the ASU and has determined to early adopt aspects related to the removal and modification of certain fair value measurement disclosures under the ASU effective immediately. At this time, management is evaluating the implications of certain other provisions of the ASU related to new disclosure requirements and any impact on the financial statement disclosures has not yet been determined.
| | | | |
| PGIM International Bond Fund | | | 77 | |
Financial Highlights
| | | | | | | | | | | | |
| Class A Shares | |
| | | Year
Ended
October 31,
2018 | | | | | | December 14,
2016(a)
through
October 31,
2017 | |
| Per Share Operating Performance(b): | | | | | | | | | | | | |
| Net Asset Value, Beginning of Period | | | $10.44 | | | | | | | | $10.00 | |
| Income (loss) from investment operations: | | | | | | | | | | | | |
| Net investment income (loss) | | | 0.12 | | | | | | | | 0.07 | |
| Net realized and unrealized gain (loss) on investment and foreign currency transactions | | | (0.08 | ) | | | | | | | 0.57 | |
| Total from investment operations | | | 0.04 | | | | | | | | 0.64 | |
| Less Dividends and Distributions: | | | | | | | | | | | | |
| Dividends from net investment income | | | (0.26 | ) | | | | | | | - | |
| Tax return of capital distributions | | | - | | | | | | | | (0.20 | ) |
| Total dividends and distributions | | | (0.26 | ) | | | | | | | (0.20 | ) |
| Net asset value, end of period | | | $10.22 | | | | | | | | $10.44 | |
| Total Return(c): | | | 0.40% | | | | | | | | 6.42% | |
| Ratios/Supplemental Data: | |
| Net assets, end of period (000) | | | $103 | | | | | | | | $91 | |
| Average net assets (000) | | | $99 | | | | | | | | $38 | |
| Ratios to average net assets(d): | | | | | | | | | | | | |
| Expenses after waivers and/or expense reimbursement | | | 0.99% | | | | | | | | 0.99% | (e) |
| Expenses before waivers and/or expense reimbursement | | | 17.44% | (f) | | | | | | | 3.39% | (e) |
| Net investment income (loss) | | | 1.14% | | | | | | | | 0.85% | (e) |
| Portfolio turnover rate(g) | | | 35% | | | | | | | | 66% | |
| (a) | Commencement of operations. |
| (b) | Calculated based on average shares outstanding during the period. |
| (c) | Total return does not consider the effects of sales loads. Total return is calculated assuming a purchase of a share on the first day and a sale on the last day of each period reported and includes reinvestment of dividends and distributions, if any. Total returns may reflect adjustments to conform to generally accepted accounting principles. Total returns for periods less than one full year are not annualized. |
| (d) | Does not include expenses of the underlying funds in which the Fund invests. |
| (f) | Effective November 1, 2017, class specific expenses include transfer agent fees and expenses and registration fees, which are charged to their respective share class. |
| (g) | The Fund’s portfolio turnover rate is calculated in accordance with regulatory requirements, without regard to transactions involving short term investments and certain derivatives. If such transactions were included, the Fund’s portfolio turnover rate may be higher. |
See Notes to Financial Statements.
| | | | | | | | | | | | |
| Class C Shares | | | | |
| | | Year
Ended
October 31,
2018 | | | | | | December 14,
2016(a)
through
October 31,
2017 | |
| Per Share Operating Performance(b): | | | | | | | | | | | | |
| Net Asset Value, Beginning of Period | | | $10.44 | | | | | | | | $10.00 | |
| Income (loss) from investment operations: | | | | | | | | | | | | |
| Net investment income (loss) | | | 0.04 | | | | | | | | - | |
| Net realized and unrealized gain (loss) on investment and foreign currency transactions | | | (0.07 | ) | | | | | | | 0.57 | |
| Total from investment operations | | | (0.03 | ) | | | | | | | 0.57 | |
| Less Dividends and Distributions: | | | | | | | | | | | | |
| Dividends from net investment income | | | (0.19 | ) | | | | | | | - | |
| Tax return of capital distributions | | | - | | | | | | | | (0.13 | ) |
| Total dividends and distributions | | | (0.19 | ) | | | | | | | (0.13 | ) |
| Net asset value, end of period | | | $10.22 | | | | | | | | $10.44 | |
| Total Return(c): | | | (0.34 | )% | | | | | | | 5.73% | |
| Ratios/Supplemental Data: | | | | |
| Net assets, end of period (000) | | | $16 | | | | | | | | $11 | |
| Average net assets (000) | | | $13 | | | | | | | | $10 | |
| Ratios to average net assets(d): | | | | | | | | | | | | |
| Expenses after waivers and/or expense reimbursement | | | 1.74% | | | | | | | | 1.74%(e) | |
| Expenses before waivers and/or expense reimbursement | | | 124.78% | (f) | | | | | | | 3.26%(e) | |
| Net investment income (loss) | | | 0.41% | | | | | | | | 0.06%(e) | |
| Portfolio turnover rate(g) | | | 35% | | | | | | | | 66% | |
| (a) | Commencement of operations. |
| (b) | Calculated based on average shares outstanding during the period. |
| (c) | Total return does not consider the effects of sales loads. Total return is calculated assuming a purchase of a share on the first day and a sale on the last day of each period reported and includes reinvestment of dividends and distributions, if any. Total returns may reflect adjustments to conform to generally accepted accounting principles. Total returns for periods less than one full year are not annualized. |
| (d) | Does not include expenses of the underlying funds in which the Fund invests. |
| (f) | Effective November 1, 2017, class specific expenses include transfer agent fees and expenses and registration fees, which are charged to their respective share class. |
| (g) | The Fund’s portfolio turnover rate is calculated in accordance with regulatory requirements, without regard to transactions involving short term investments and certain derivatives. If such transactions were included, the Fund’s portfolio turnover rate may be higher. |
See Notes to Financial Statements.
| | | | |
| PGIM International Bond Fund | | | 79 | |
Financial Highlights (continued)
| | | | | | | | | | | | |
| Class Z Shares | | | | |
| | | Year
Ended
October 31,
2018 | | | | | | December 14,
2016(a)
through
October 31,
2017 | |
| Per Share Operating Performance(b): | | | | | | | | | | | | |
| Net Asset Value, Beginning of Period | | | $10.44 | | | | | | | | $10.00 | |
| Income (loss) from investment operations: | | | | | | | | | | | | |
| Net investment income (loss) | | | 0.15 | | | | | | | | 0.09 | |
| Net realized and unrealized gain (loss) on investment and foreign currency transactions | | | (0.07 | ) | | | | | | | 0.57 | |
| Total from investment operations | | | 0.08 | | | | | | | | 0.66 | |
| Less Dividends and Distributions: | | | | | | | | | | | | |
| Dividends from net investment income | | | (0.29 | ) | | | | | | | - | |
| Tax return of capital distributions | | | - | | | | | | | | (0.22 | ) |
| Total dividends and distributions | | | (0.29 | ) | | | | | | | (0.22 | ) |
| Net asset value, end of period | | | $10.23 | | | | | | | | $10.44 | |
| Total Return(c): | | | 0.75% | | | | | | | | 6.67% | |
| Ratios/Supplemental Data: | | | | | | | | | |
| Net assets, end of period (000) | | | $160 | | | | | | | | $11 | |
| Average net assets (000) | | | $140 | | | | | | | | $10 | |
| Ratios to average net assets(d): | | | | | | | | | | | | |
| Expenses after waivers and/or expense reimbursement | | | 0.74% | | | | | | | | 0.74% | (e) |
| Expenses before waivers and/or expense reimbursement | | | 12.47% | (f) | | | | | | | 2.24% | (e) |
| Net investment income (loss) | | | 1.43% | | | | | | | | 1.09% | (e) |
| Portfolio turnover rate(g) | | | 35% | | | | | | | | 66% | |
| (a) | Commencement of operations. |
| (b) | Calculated based on average shares outstanding during the period. |
| (c) | Total return is calculated assuming a purchase of a share on the first day and a sale on the last day of each period reported and includes reinvestment of dividends and distributions, if any. Total returns may reflect adjustments to conform to generally accepted accounting principles. Total returns for periods less than one full year are not annualized. |
| (d) | Does not include expenses of the underlying funds in which the Fund invests. |
| (f) | Effective November 1, 2017, class specific expenses include transfer agent fees and expenses and registration fees, which are charged to their respective share class. |
| (g) | The Fund’s portfolio turnover rate is calculated in accordance with regulatory requirements, without regard to transactions involving short term investments and certain derivatives. If such transactions were included, the Fund’s portfolio turnover rate may be higher. |
See Notes to Financial Statements.
| | | | | | | | | | | | |
| Class R6 Shares | | | | |
| | | Year
Ended
October 31,
2018 | | | | | | December 14,
2016(a)
through
October 31,
2017 | |
| Per Share Operating Performance(b): | | | | | | | | | | | | |
| Net Asset Value, Beginning of Period | | | $10.44 | | | | | | | | $10.00 | |
| Income (loss) from investment operations: | | | | | | | | | | | | |
| Net investment income (loss) | | | 0.14 | | | | | | | | 0.09 | |
| Net realized and unrealized gain (loss) on investment and foreign currency transactions | | | (0.06 | ) | | | | | | | 0.57 | |
| Total from investment operations | | | 0.08 | | | | | | | | 0.66 | |
| Less Dividends and Distributions: | | | | | | | | | | | | |
| Dividends from net investment income | | | (0.29 | ) | | | | | | | - | |
| Tax return of capital distributions | | | - | | | | | | | | (0.22 | ) |
| Total dividends and distributions | | | (0.29 | ) | | | | | | | (0.22 | ) |
| Net asset value, end of period | | | $10.23 | | | | | | | | $10.44 | |
| Total Return(c): | | | 0.75% | | | | | | | | 6.65% | |
| Ratios/Supplemental Data: | | | | | | | | | |
| Net assets, end of period (000) | | | $26,850 | | | | | | | | $26,654 | |
| Average net assets (000) | | | $26,854 | | | | | | | | $25,767 | |
| Ratios to average net assets(d): | | | | | | | | | | | | |
| Expenses after waivers and/or expense reimbursement | | | 0.74% | | | | | | | | 0.74% | (e) |
| Expenses before waivers and/or expense reimbursement | | | 1.55% | (f) | | | | | | | 1.99% | (e) |
| Net investment income (loss) | | | 1.39% | | | | | | | | 1.07% | (e) |
| Portfolio turnover rate(g) | | | 35% | | | | | | | | 66% | |
| (a) | Commencement of operations. |
| (b) | Calculated based on average shares outstanding during the period. |
| (c) | Total return is calculated assuming a purchase of a share on the first day and a sale on the last day of each period reported and includes reinvestment of dividends and distributions, if any. Total returns may reflect adjustments to conform to generally accepted accounting principles. Total returns for periods less than one full year are not annualized. |
| (d) | Does not include expenses of the underlying funds in which the Fund invests. |
| (f) | Effective November 1, 2017, class specific expenses include transfer agent fees and expenses and registration fees, which are charged to their respective share class. |
| (g) | The Fund’s portfolio turnover rate is calculated in accordance with regulatory requirements, without regard to transactions involving short term investments and certain derivatives. If such transactions were included, the Fund’s portfolio turnover rate may be higher. |
See Notes to Financial Statements.
| | | | |
| PGIM International Bond Fund | | | 81 | |
Report of Independent Registered Public Accounting Firm
The Board of Trustees and Shareholders
Prudential Investment Portfolios 9:
Opinion on the Financial Statements
We have audited the accompanying statement of assets and liabilities of PGIM International Bond Fund (formerly Prudential International Bond Fund) (the “Fund”), a series of Prudential Investment Portfolios 9, including the schedule of investments, as of October 31, 2018, the related statement of operations for the year then ended, the statements of changes in net assets for the year ended October 31, 2018 and the period from December 14, 2016 (commencement of operations) through October 31, 2017, and the related notes (collectively, the financial statements) and the financial highlights for the year or period indicated therein. In our opinion, the financial statements and financial highlights present fairly, in all material respects, the financial position of the Fund as of October 31, 2018, the results of its operations for the year then ended, the changes in its net assets for the year ended October 31, 2018 and the period from December 14, 2016 (commencement of operations) through October 31, 2017, and the financial highlights for the year or period indicated therein, in conformity with U.S. generally accepted accounting principles.
Basis for Opinion
These financial statements and financial highlights are the responsibility of the Fund’s management. Our responsibility is to express an opinion on these financial statements and financial highlights based on our audits. We are a public accounting firm registered with the Public Company Accounting Oversight Board (United States) (“PCAOB”) and are required to be independent with respect to the Fund in accordance with the U.S. federal securities laws and the applicable rules and regulations of the Securities and Exchange Commission and the PCAOB.
We conducted our audits in accordance with the standards of the PCAOB. Those standards require that we plan and perform the audit to obtain reasonable assurance about whether the financial statements and financial highlights are free of material misstatement, whether due to error or fraud. Our audits included performing procedures to assess the risks of material misstatement of the financial statements and financial highlights, whether due to error or fraud, and performing procedures that respond to those risks. Such procedures included examining, on a test basis, evidence regarding the amounts and disclosures in the financial statements and financial highlights. Such procedures also included confirmation of securities owned as of October 31, 2018, by correspondence with the custodians, transfer agents and brokers or by other appropriate auditing procedures when replies from brokers were not received. Our audits also included evaluating the accounting principles used and significant estimates made by management, as well as evaluating the overall presentation of the financial statements and financial highlights. We believe that our audits provide a reasonable basis for our opinion.

We have served as the auditor of one or more PGIM and/or Prudential Retail investment companies since 2003.
New York, New York
December 17, 2018
INFORMATION ABOUT BOARD MEMBERS AND OFFICERS (unaudited)
Information about Board Members and Officers of the Fund is set forth below. Board Members who are not deemed to be “interested persons” of the Fund, as defined in the 1940 Act, are referred to as “Independent Board Members.” Board Members who are deemed to be “interested persons” of the Fund are referred to as “Interested Board Members.” The Board Members are responsible for the overall supervision of the operations of the Fund and perform the various duties imposed on the directors of investment companies by the 1940 Act. The Board in turn elects the Officers, who are responsible for administering the day-to-day operations of the Fund.
| | | | | | |
| Independent Board Members | | | | |
| | | | |
Name, Address, Age Position(s) Portfolios Overseen | | Principal Occupation(s) During Past Five Years | | Other Directorships Held During Past Five Years | | Length of Board Service |
| | | | |
Ellen S. Alberding (60) Board Member Portfolios Overseen: 93 | | President and Board Member, The Joyce Foundation (charitable foundation) (since 2002); Vice Chair, City Colleges of Chicago (community college system) (2011-2015); Trustee, National Park Foundation (charitable foundation for national park system) (2009-2018); Trustee, Economic Club of Chicago (since 2009); Trustee, Loyola University (since 2018). | | None. | | Since September 2013 |
| | | | |
Kevin J. Bannon (66) Board Member Portfolios Overseen: 93 | | Retired; Managing Director (April 2008-May 2015) and Chief Investment Officer (October 2008-November 2013) of Highmount Capital LLC (registered investment adviser); formerly Executive Vice President and Chief Investment Officer (April 1993-August 2007) of Bank of New York Company; President (May 2003-May 2007) of BNY Hamilton Family of Mutual Funds. | | Director of Urstadt Biddle Properties (equity real estate investment trust) (since September 2008). | | Since July 2008 |
| | | | |
Linda W. Bynoe (66) Board Member Portfolios Overseen: 93 | | President and Chief Executive Officer (since March 1995) and formerly Chief Operating Officer (December 1989-February 1995) of Telemat Ltd. (management consulting); formerly Vice President (January 1985-June 1989) at Morgan Stanley & Co. (broker-dealer). | | Director of Anixter International, Inc. (communication products distributor) (since January 2006); Director of Northern Trust Corporation (financial services) (since April 2006); Trustee of Equity Residential (residential real estate) (since December 2009). | | Since March 2005 |
PGIM International Bond Fund
| | | | | | |
Independent Board Members | | | | |
| | | | |
Name, Address, Age Position(s) Portfolios Overseen | | Principal Occupation(s) During Past Five Years | | Other Directorships Held During Past Five Years | | Length of Board Service |
| | | | |
Barry H. Evans (58) Board Member Portfolios Overseen: 92 | | Retired; formerly President (2005 – 2016), Global Chief Operating Officer (2014– 2016), Chief Investment Officer – Global Head of Fixed Income (1998-2014), and various portfolio manager roles (1986-2006), Manulife Asset Management U.S. | | Director, Manulife Trust Company (since 2011); formerly Director, Manulife Asset Management Limited (2015-2017); formerly Chairman of the Board of Directors of Manulife Asset Management U.S. (2005-2016); formerly Chairman of the Board, Declaration Investment Management and Research (2008-2016). | | Since September 2017 |
| | | | |
Keith F. Hartstein (62) Board Member & Independent Chair Portfolios Overseen: 93 | | Retired; Member (since November 2014) of the Governing Council of the Independent Directors Council (organization of independent mutual fund directors); formerly President and Chief Executive Officer (2005-2012), Senior Vice President (2004-2005), Senior Vice President of Sales and Marketing (1997-2004), and various executive management positions (1990-1997), John Hancock Funds, LLC (asset management); Chairman, Investment Company Institute’s Sales Force Marketing Committee (2003-2008). | | None. | | Since September 2013 |
Visit our website at pgiminvestments.com
| | | | | | |
| Independent Board Members | | | | |
| | | | |
Name, Address, Age Position(s) Portfolios Overseen | | Principal Occupation(s) During Past Five Years | | Other Directorships Held During Past Five Years | | Length of Board Service |
| | | | |
Laurie Simon Hodrick (56) Board Member Portfolios Overseen: 92 | | A. Barton Hepburn Professor Emerita of Economics in the Faculty of Business, Columbia Business School (since 2018); Visiting Professor of Law, Stanford Law School (since 2015); Visiting Fellow at the Hoover Institution, Stanford University (since 2015); Sole Member, ReidCourt LLC (since 2008) (a consulting firm); formerly A. Barton Hepburn Professor of Economics in the Faculty of Business, Columbia Business School (1996-2017); formerly Managing Director, Global Head of Alternative Investment Strategies, Deutsche Bank (2006-2008). | | Independent Director, Corporate Capital Trust (since April 2017) (a business development company); Independent Director, Kabbage, Inc. (since July 2018) (financial services). | | Since September 2017 |
| | | | |
Michael S. Hyland, CFA (73) Board Member Portfolios Overseen: 93 | | Retired (since February 2005); formerly Senior Managing Director (July 2001-February 2005) of Bear Stearns & Co, Inc.; Global Partner, INVESCO (1999-2001); Managing Director and President of Salomon Brothers Asset Management (1989-1999). | | None. | | Since July 2008 |
| | | | |
Richard A. Redeker (75) Board Member Portfolios Overseen: 93 | | Retired Mutual Fund Senior Executive (50 years); Management Consultant; Director, Mutual Fund Directors Forum (since 2014); Independent Directors Council (organization of independent mutual fund directors)-Executive Committee, Chair of Policy Steering Committee, Governing Council. | | None. | | Since October 1993 |
PGIM International Bond Fund
| | | | | | |
| Independent Board Members | | | | |
| | | | |
Name, Address, Age Position(s) Portfolios Overseen | | Principal Occupation(s) During Past Five Years | | Other Directorships Held During Past Five Years | | Length of Board Service |
| | | | |
Brian K. Reid (56)# Board Member Portfolios Overseen: 92 | | Retired; formerly Chief Economist for the Investment Company Institute (ICI) (2005-2017); formerly Senior Economist and Director of Industry and Financial Analysis at the ICI (1998-2004); formerly Senior Economist, Industry and Financial Analysis at the ICI (1996-1998); formerly Staff Economist at the Federal Reserve Board (1989-1996); Director, ICI Mutual Insurance Company (2012-2017). | | None. | | Since March 2018 |
| # | Mr. Reid joined the Board effective as of March 1, 2018. |
| | | | | | |
| Interested Board Members | | | | |
| | | | |
Name, Address, Age Position(s) Portfolios Overseen | | Principal Occupation(s) During Past Five Years | | Other Directorships Held During Past Five Years | | Length of
Board Service |
| | | | |
Stuart S. Parker (56) Board Member & President Portfolios Overseen: 93 | | President of PGIM Investments LLC (formerly known as Prudential Investments LLC) (since January 2012); Executive Vice President of Prudential Investment Management Services LLC (since December 2012); formerly Executive Vice President of Jennison Associates LLC and Head of Retail Distribution of PGIM Investments LLC (June 2005-December 2011). | | None. | | Since January 2012 |
Visit our website at pgiminvestments.com
| | | | | | |
| Interested Board Members | | | | |
| | | | |
Name, Address, Age Position(s) Portfolios Overseen | | Principal Occupation(s) During Past Five Years | | Other Directorships Held During Past Five Years | | Length of Board Service |
| | | | |
Scott E. Benjamin (45) Board Member & Vice President Portfolios Overseen:93 | | Executive Vice President (since June 2009) of PGIM Investments LLC; Executive Vice President (June 2009-June 2012) and Vice President (since June 2012) of Prudential Investment Management Services LLC; Executive Vice President (since September 2009) of AST Investment Services, Inc.; Senior Vice President of Product Development and Marketing, PGIM Investments (since February 2006); formerly Vice President of Product Development and Product Management, PGIM Investments LLC (2003-2006). | | None. | | Since March 2010 |
| | | | |
Grace C. Torres* (59) Board Member Portfolios Overseen: 92 | | Retired; formerly Treasurer and Principal Financial and Accounting Officer of the PGIM Funds, Target Funds, Advanced Series Trust, Prudential Variable Contract Accounts and The Prudential Series Fund (1998-June 2014); Assistant Treasurer (March 1999-June 2014) and Senior Vice President (September 1999-June 2014) of PGIM Investments LLC; Assistant Treasurer (May 2003-June 2014) and Vice President (June 2005-June 2014) of AST Investment Services, Inc.; Senior Vice President and Assistant Treasurer (May 2003-June 2014) of Prudential Annuities Advisory Services, Inc. | | Formerly Director (July 2015-January 2018) of Sun Bancorp, Inc. N.A. and Sun National Bank; Director (since January 2018) of OceanFirst Financial Corp. and OceanFirst Bank. | | Since November 2014 |
* Note: Prior to her retirement in 2014, Ms. Torres was employed by PGIM Investments LLC. Due to her prior employment, she is considered to be an “interested person” under the 1940 Act. Ms. Torres is a Non-Management Interested Board Member.
PGIM International Bond Fund
| | | | |
| Fund Officers(a) | | | | |
| | | |
Name, Address and Age Position with Fund | | Principal Occupation(s) During Past Five Years | | Length of Service as Fund Officer |
| | | |
Raymond A. O’Hara (63) Chief Legal Officer | | Vice President and Corporate Counsel (since July 2010) of Prudential Insurance Company of America (Prudential); Vice President (March 2011-Present) of Pruco Life Insurance Company and Pruco Life Insurance Company of New Jersey; Vice President and Corporate Counsel (March 2011-Present) of Prudential Annuities Life Assurance Corporation; Chief Legal Officer of PGIM Investments LLC (since June 2012); Chief Legal Officer of Prudential Mutual Fund Services LLC (since June 2012) and Corporate Counsel of AST Investment Services, Inc. (since June 2012); formerly Assistant Vice President and Corporate Counsel (September 2008-July 2010) of The Hartford Financial Services Group, Inc.; formerly Associate (September 1980-December 1987) and Partner (January 1988–August 2008) of Blazzard & Hasenauer, P.C. (formerly, Blazzard, Grodd & Hasenauer, P.C.). | | Since June 2012 |
| | | |
Chad A. Earnst (43) Chief Compliance Officer | | Chief Compliance Officer (September 2014-Present) of PGIM Investments LLC; Chief Compliance Officer (September 2014-Present) of the PGIM Funds, Target Funds, Advanced Series Trust, The Prudential Series Fund, Prudential’s Gibraltar Fund, Inc., PGIM Global Short Duration High Yield Income Fund, Inc., PGIM Short Duration High Yield Fund, Inc. and PGIM Jennison MLP Income Fund, Inc.; formerly Assistant Director (March 2010-August 2014) of the Asset Management Unit, Division of Enforcement, US Securities & Exchange Commission; Assistant Regional Director (January 2010-August 2014), Branch Chief (June 2006–December 2009) and Senior Counsel (April 2003-May 2006) of the Miami Regional Office, Division of Enforcement, US Securities & Exchange Commission. | | Since September 2014 |
| | | |
Dino Capasso (44) Deputy Chief Compliance Officer | | Vice President and Deputy Chief Compliance Officer (June 2017-Present) of PGIM Investments LLC; formerly, Senior Vice President and Senior Counsel (January 2016-June 2017), and Vice President and Counsel (February 2012-December 2015) of Pacific Investment Management Company LLC. | | Since March 2018 |
| | | |
Andrew R. French (56) Secretary | | Vice President and Corporate Counsel (since February 2010) of Prudential; formerly Director and Corporate Counsel (2006-2010) of Prudential; Vice President and Assistant Secretary (since January 2007) of PGIM Investments LLC; Vice President and Assistant Secretary (since January 2007) of Prudential Mutual Fund Services LLC. | | Since October 2006 |
Visit our website at pgiminvestments.com
| | | | |
| Fund Officers(a) | | | | |
| | | |
Name, Address and Age Position with Fund | | Principal Occupation(s) During Past Five Years | | Length of Service as Fund Officer |
| | | |
Jonathan D. Shain (60) Assistant Secretary | | Vice President and Corporate Counsel (since August 1998) of Prudential; Vice President and Assistant Secretary (since May 2001) of PGIM Investments LLC; Vice President and Assistant Secretary (since February 2001) of Prudential Mutual Fund Services LLC; formerly Vice President and Assistant Secretary (May 2003-June 2005) of AST Investment Services, Inc. | | Since May 2005 |
| | | |
Claudia DiGiacomo (44) Assistant Secretary | | Vice President and Corporate Counsel (since January 2005) of Prudential; Vice President and Assistant Secretary of PGIM Investments LLC (since December 2005); formerly Associate at Sidley Austin Brown & Wood LLP (1999-2004). | | Since December 2005 |
| | | |
Charles H. Smith (45) Anti-Money Laundering Compliance Officer | | Vice President, Corporate Compliance, Anti-Money Laundering Unit (since January 2015) of Prudential; committee member of the American Council of Life Insurers Anti-Money Laundering and Critical Infrastructure Committee (since January 2016); formerly Global Head of Economic Sanctions Compliance at AIG Property Casualty (February 2007 – December 2014); Assistant Attorney General at the New York State Attorney General’s Office, Division of Public Advocacy. (August 1998 —January 2007). | | Since January 2017 |
| | | |
Brian D. Nee (52) Treasurer and Principal Financial and Accounting Officer | | Vice President and Head of Finance of PGIM Investments LLC (since August 2015) and PGIM Global Partners (since February 2017); formerly, Vice President, Treasurer’s Department of Prudential (September 2007-August 2015). | | Since July 2018 |
| | | |
Peter Parrella (60) Assistant Treasurer | | Vice President (since 2007) and Director (2004-2007) within Prudential Mutual Fund Administration; formerly Tax Manager at SSB Citi Fund Management LLC (1997-2004). | | Since June 2007 |
| | | |
Lana Lomuti (51) Assistant Treasurer | | Vice President (since 2007) and Director (2005-2007), within Prudential Mutual Fund Administration; formerly Assistant Treasurer (December 2007-February 2014) of The Greater China Fund, Inc. | | Since April 2014 |
| | | |
Linda McMullin (57) Assistant Treasurer | | Vice President (since 2011) and Director (2008-2011) within Prudential Mutual Fund Administration. | | Since April 2014 |
| | | |
Kelly A. Coyne (50) Assistant Treasurer | | Director, Investment Operations of Prudential Mutual Fund Services LLC (since 2010). | | Since March 2015 |
(a) Excludes Mr. Parker and Mr. Benjamin, interested Board Members who also serve as President and Vice President, respectively.
Explanatory Notes to Tables:
| ∎ | | Board Members are deemed to be “Interested,” as defined in the 1940 Act, by reason of their affiliation with PGIM Investments LLC and/or an affiliate of PGIM Investments LLC. |
| ∎ | | Unless otherwise noted, the address of all Board Members and Officers is c/o PGIM Investments LLC, 655 Broad Street, Newark, New Jersey 07102-4410. |
| ∎ | | There is no set term of office for Board Members or Officers. The Board Members have adopted a retirement policy, which calls for the retirement of Board Members on December 31 of the year in which they reach the age of 75. |
PGIM International Bond Fund
| ∎ | | “Other Directorships Held” includes only directorships of companies required to register or file reports with the SEC under the 1934 Act (that is, “public companies”) or other investment companies registered under the 1940 Act. |
| ∎ | | “Portfolios Overseen” includes all investment companies managed by PGIM Investments LLC. The investment companies for which PGIM Investments LLC serves as manager include the PGIM Funds, The Prudential Variable Contract Accounts, PGIM ETF Trust, PGIM Short Duration High Yield Fund, Inc., PGIM Global Short Duration High Yield Fund, Inc., The Prudential Series Fund, Prudential’s Gibraltar Fund, Inc. and the Advanced Series Trust. |
Visit our website at pgiminvestments.com
Approval of Advisory Agreements (unaudited)
The Fund’s Board of Trustees
The Board of Trustees (the “Board”) of PGIM International Bond Fund (the “Fund”)1 consists of twelve individuals, nine of whom are not “interested persons” of the Fund, as defined in the Investment Company Act of 1940, as amended (the “1940 Act”) (the “Independent Trustees”). The Board is responsible for the oversight of the Fund and its operations, and performs the various duties imposed on the directors of investment companies by the 1940 Act. The Independent Trustees have retained independent legal counsel to assist them in connection with their duties. The Chair of the Board is an Independent Trustee. The Board has established four standing committees: the Audit Committee, the Nominating and Governance Committee, and two Investment Committees. Each committee is chaired by, and composed of, Independent Trustees.
Annual Approval of the Fund’s Advisory Agreements
As required under the 1940 Act, the Board determines annually whether to renew the Fund’s management agreement with PGIM Investments LLC (“PGIM Investments”) and the Fund’s subadvisory agreements with each of PGIM, Inc. (“PGIM”) on behalf of its PGIM Fixed Income unit and PGIM Limited (“PGIML”). In considering the renewal of the agreements, the Board, including all of the Independent Trustees, met on June 7, 2018 and on June 19-21, 2018 and approved the renewal of the agreements through July 31, 2019, after concluding that the renewal of the agreements was in the best interests of the Fund and its shareholders.
In advance of the meetings, the Board requested and received materials relating to the agreements, and had the opportunity to ask questions and request further information in connection with its consideration. Among other things, the Board considered comparative fee information from PGIM Investments, PGIM and PGIML. Also, the Board considered comparisons with other mutual funds in relevant Peer Universes and Peer Groups, as is further discussed below.
In approving the agreements, the Board, including the Independent Trustees advised by independent legal counsel, considered the factors it deemed relevant, including the nature, quality and extent of services provided by PGIM Investments and the subadvisers, the performance of the Fund, the profitability of PGIM Investments and its affiliates, expenses and fees, and the potential for economies of scale that may be shared with the Fund and its shareholders as the Fund’s assets grow. In their deliberations, the Trustees did not identify any single factor which alone was responsible for the Board’s decision to approve the agreements with respect to the Fund. In connection with its deliberations, the Board considered information provided by PGIM Investments throughout the year at regular Board
| | |
| PGIM International Bond Fund |
| 1 | PGIM International Bond Fund is a series of Prudential Investment Portfolios 9. |
Approval of Advisory Agreements (continued)
meetings, presentations from portfolio managers and other information, as well as information furnished at or in advance of the meetings on June 7, 2018 and on June 19-21, 2018.
The Trustees determined that the overall arrangements between the Fund and PGIM Investments, which serves as the Fund’s investment manager pursuant to a management agreement, and between each of PGIM Investments and PGIM, which, through its PGIM Fixed Income unit, and PGIML, which serve as the Fund’s subadvisers pursuant to the terms of subadvisory agreements with PGIM Investments, are in the best interests of the Fund and its shareholders in light of the services performed, fees charged and such other matters as the Trustees considered relevant in the exercise of their business judgment.
The material factors and conclusions that formed the basis for the Trustees’ reaching their determinations to approve the continuance of the agreements are separately discussed below.
Nature, Quality and Extent of Services
The Board received and considered information regarding the nature, quality and extent of services provided to the Fund by PGIM Investments, PGIM Fixed Income, and PGIML. The Board considered the services provided by PGIM Investments, including but not limited to the oversight of the subadvisers for the Fund, as well as the provision of fund recordkeeping, compliance, and other services to the Fund. With respect to PGIM Investments’ oversight of the subadvisers, the Board noted that PGIM Investments’ Strategic Investment Research Group (“SIRG”), which is a business unit of PGIM Investments, is responsible for monitoring and reporting to PGIM Investments senior management on the performance and operations of the subadvisers. The Board also considered that PGIM Investments pays the salaries of all of the officers and interested Trustees of the Fund who are part of Fund management. The Board also considered the investment subadvisory services provided by PGIM Fixed Income and PGIML, including investment research and security selection, as well as adherence to the Fund’s investment restrictions and compliance with applicable Fund policies and procedures. The Board considered PGIM Investments’ evaluation of the subadvisers, as well as PGIM Investments’ recommendation, based on its review of the subadvisers, to renew the subadvisory agreements.
The Board considered the qualifications, backgrounds and responsibilities of PGIM Investments’ senior management responsible for the oversight of the Fund, PGIM Fixed Income, and PGIML, and also considered the qualifications, backgrounds and responsibilities of PGIM Fixed Income’s portfolio managers who are responsible for the day-to-day management of the Fund’s portfolio. The Board was provided with information pertaining to PGIM Investments’, PGIM Fixed Income’s, and PGIML’s organizational structure, senior management, investment operations, and other relevant information
| | |
| Visit our website at pgiminvestments.com | | |
pertaining to PGIM Investments, PGIM Fixed Income, and PGIML. The Board also noted that it received favorable compliance reports from the Fund’s Chief Compliance Officer (“CCO”) as to PGIM Investments, PGIM Fixed Income, and PGIML. The Board noted that PGIM Fixed Income and PGIML are affiliated with PGIM Investments.
The Board concluded that it was satisfied with the nature, extent and quality of the investment management services provided by PGIM Investments, the subadvisory services provided to the Fund by PGIM Fixed Income and PGIML, and that there was a reasonable basis on which to conclude that the Fund benefits from the services provided by PGIM Investments, PGIM Fixed Income, and PGIML under the management and subadvisory agreements.
Costs of Services and Profits Realized by PGIM Investments
The Board was provided with information on the profitability of PGIM Investments and its affiliates in serving as the Fund’s investment manager. The Board discussed with PGIM Investments the methodology utilized in assembling the information regarding profitability and considered its reasonableness. The Board recognized that it is difficult to make comparisons of profitability from fund management contracts because comparative information is not generally publicly available and is affected by numerous factors, including the structure of the particular adviser, the types of funds it manages, its business mix, numerous assumptions regarding allocations and the adviser’s capital structure and cost of capital. Taking these factors into account, the Board concluded that the profitability of PGIM Investments and its affiliates in relation to the services rendered was not unreasonable.
Economies of Scale
The Board received and discussed information concerning economies of scale that PGIM Investments may realize as the Fund’s assets grow beyond current levels. The Board noted that the management fee schedule for the Fund includes breakpoints, which have the effect of decreasing the fee rate as assets increase. During the course of time, the Board has considered information regarding the launch date of the Fund, the management fees of the Fund compared to those of similarly managed funds and PGIM Investments’ investment in the Fund over time. The Board noted that economies of scale can be shared with the Fund in other ways, including low management fees from inception, additional technological and personnel investments to enhance shareholder services, and maintaining existing expense structures in the face of a rising cost environment. The Board also considered PGIM Investments’ assertion that it continually evaluates the management fee schedule of the Fund and the potential to share economies of scale through breakpoints or fee waivers as asset levels increase.
| | |
| PGIM International Bond Fund |
Approval of Advisory Agreements (continued)
The Board recognized the inherent limitations of any analysis of economies of scale, stemming largely from the Board’s understanding that most of PGIM Investments’ costs are not specific to individual funds, but rather are incurred across a variety of products and services.
Other Benefits to PGIM Investments, PGIM Fixed Income, and PGIML
The Board considered potential ancillary benefits that might be received by PGIM Investments, PGIM Fixed Income, PGIML and their affiliates as a result of their relationship with the Fund. The Board concluded that potential benefits to be derived by PGIM Investments included transfer agency fees received by the Fund’s transfer agent (which is affiliated with PGIM Investments), as well as benefits to its reputation or other intangible benefits resulting from PGIM Investments’ association with the Fund. The Board concluded that the potential benefits to be derived by PGIM Fixed Income and PGIML included the ability to use soft dollar credits, as well as the potential benefits consistent with those generally resulting from an increase in assets under management, specifically, potential access to additional research resources and benefits to their reputations. The Board concluded that the benefits derived by PGIM Investments, PGIM Fixed Income, and PGIML were consistent with the types of benefits generally derived by investment managers and subadvisers to mutual funds.
Performance of the Fund / Fees and Expenses
The Board considered certain additional specific factors and made related conclusions relating to the historical performance of the Fund for the one-year period ended December 31, 2017. The Board considered that the Fund commenced operations on December 14, 2016 and that longer-term performance was not yet available.
The Board also considered the Fund’s actual management fee, as well as the Fund’s net total expense ratio, for the fiscal period ended October 31, 2017. The Board considered the management fee for the Fund as compared to the management fee charged by PGIM Investments to other funds and the fee charged by other advisers to comparable mutual funds in a Peer Group. The actual management fee represents the fee rate actually paid by Fund shareholders and includes any fee waivers or reimbursements. The net total expense ratio for the Fund represents the actual expense ratio incurred by Fund shareholders.
The mutual funds included in the Peer Universe, which was used to consider performance, and the Peer Group, which was used to consider expenses and fees, were objectively determined by Broadridge, an independent provider of mutual fund data. In certain circumstances, PGIM Investments also may have provided supplemental Peer Universe or Peer Group information, for reasons addressed with the Board. The comparisons placed
| | |
| Visit our website at pgiminvestments.com | | |
the Fund in various quartiles, with the first quartile being the best 25% of the mutual funds (for performance, the best performing mutual funds and, for expenses, the lowest cost mutual funds).
The section below summarizes key factors considered by the Board and the Board’s conclusions regarding the Fund’s performance, fees and overall expenses. The table sets forth gross performance comparisons (which do not reflect the impact on performance of fund expenses, or any subsidies, expense caps or waivers that may be applicable) with the Peer Universe, actual management fees with the Peer Group (which reflect the impact of any subsidies or fee waivers), and net total expenses with the Peer Group, each of which were key factors considered by the Board.
| | | | | | | | |
Gross
Performance | | 1 Year | | 3 Years | | 5 Years | | 10 Years |
| | | 3rd Quartile | | N/A | | N/A | | N/A |
| Actual Management Fees: 1st Quartile |
| Net Total Expenses: 2nd Quartile |
| | • | | The Board noted that the Fund outperformed its benchmark index over the one-year period. |
| | • | | The Board noted that the Fund does not yet have a three-year performance record and that, therefore, the subadviser should have more time to develop that record. |
| | • | | The Board and PGIM Investments agreed to retain the existing contractual expense cap, which (exclusive of certain fees and expenses) caps the Fund’s annual operating expenses at 0.99% for Class A shares, 1.74% for Class C shares, 0.74% for Class R6 shares, and 0.74% for Class Z shares through February 28, 2019. |
| | • | | The Board concluded that in light of the above, it would be in the best interests of the Fund and its shareholders to continue to allow the Fund to create a performance record, and to renew the agreements. |
| | • | | The Board concluded that the management fees (including subadvisory fees) and total expenses were reasonable in light of the services provided. |
* * *
After full consideration of these factors, the Board concluded that the approval of the agreements was in the best interests of the Fund and its shareholders.
| | |
| PGIM International Bond Fund |
| | | | |
| ∎ MAIL | | ∎ TELEPHONE | | ∎ WEBSITE |
655 Broad Street
Newark, NJ 07102 | | (800) 225-1852 | | www.pgiminvestments.com |
|
| PROXY VOTING |
| The Board of Trustees of the Fund has delegated to the Fund’s subadviser the responsibility for voting any proxies and maintaining proxy recordkeeping with respect to the Fund. A description of these proxy voting policies and procedures is available without charge, upon request, by calling (800) 225-1852. Information regarding how the Fund voted proxies relating to portfolio securities during the most recent 12-month period ended June 30 is available on the Fund’s website and on the Securities and Exchange Commission’s website. |
|
| TRUSTEES |
| Ellen S. Alberding • Kevin J. Bannon • Scott E. Benjamin • Linda W. Bynoe • Barry H. Evans • Keith F. Hartstein • Laurie Simon Hodrick • Michael S. Hyland • Stuart S. Parker • Richard A. Redeker • Brian K. Reid • Grace C. Torres |
|
| OFFICERS |
| Stuart S. Parker, President • Scott E. Benjamin, Vice President • Brian D. Nee, Treasurer and Principal Financial and Accounting Officer • Raymond A. O’Hara, Chief Legal Officer • Andrew R. French, Secretary • Chad A. Earnst, Chief Compliance Officer • Dino Capasso, Vice President and Deputy Chief Compliance Officer • Charles H. Smith, Anti-Money Laundering Compliance Officer • Jonathan D. Shain, Assistant Secretary • Claudia DiGiacomo, Assistant Secretary • Peter Parrella, Assistant Treasurer • Lana Lomuti, Assistant Treasurer • Linda McMullin, Assistant Treasurer • Kelly A. Coyne, Assistant Treasurer |
| | | | |
| MANAGER | | PGIM Investments LLC | | 655 Broad Street
Newark, NJ 07102 |
|
| SUBADVISER | | PGIM Fixed Income | | 655 Broad Street
Newark, NJ 07102 |
|
| DISTRIBUTOR | | Prudential Investment
Management Services LLC | | 655 Broad Street
Newark, NJ 07102 |
|
| CUSTODIAN | | The Bank of New York Mellon | | 225 Liberty Street
New York, NY 10286 |
|
| TRANSFER AGENT | | Prudential Mutual Fund
Services LLC | | PO Box 9658
Providence, RI 02940 |
|
INDEPENDENT REGISTERED
PUBLIC ACCOUNTING FIRM | | KPMG LLP | | 345 Park Avenue
New York, NY 10154 |
|
| FUND COUNSEL | | Willkie Farr & Gallagher LLP | | 787 Seventh Avenue
New York, NY 10019 |
|
|
| An investor should consider the investment objectives, risks, charges, and expenses of the Fund carefully before investing. The prospectus and summary prospectus contain this and other information about the Fund. An investor may obtain a prospectus and summary prospectus by visiting our website at www.pgiminvestments.com or by calling (800) 225-1852. The prospectus and summary prospectus should be read carefully before investing. |
|
| E-DELIVERY |
| To receive your mutual fund documents online, go to www.pgiminvestments.com/edelivery and enroll. Instead of receiving printed documents by mail, you will receive notification via email when new materials are available. You can cancel your enrollment or change your email address at any time by visiting the website address above. |
|
| SHAREHOLDER COMMUNICATIONS WITH TRUSTEES |
| Shareholders can communicate directly with the Board of Trustees by writing to the Chair of the Board, PGIM International Bond Fund, PGIM Investments, Attn: Board of Trustees, 655 Broad Street, Newark, NJ 07102. Shareholders can communicate directly with an individual Trustee by writing to the same address. Communications are not screened before being delivered to the addressee. |
|
| AVAILABILITY OF PORTFOLIO SCHEDULE |
| The Fund files its complete schedule of portfolio holdings with the Securities and Exchange Commission for the first and third quarters of each fiscal year on Form N-Q. The Fund’s Forms N-Q are available on the Commission’s website at www.sec.gov. The Fund’s schedule of portfolio holdings is also available on the Fund’s website as of the end of each month no sooner than 15 days after the end of the month. |
|
| The Fund’s Statement of Additional Information contains additional information about the Fund’s Trustees and is available without charge, upon request, by calling (800) 225-1852. |
Mutual Funds:
| | | | |
ARE NOT INSURED BY THE FDIC OR ANY
FEDERAL GOVERNMENT AGENCY | | MAY LOSE VALUE | | ARE NOT A DEPOSIT OF OR GUARANTEED
BY ANY BANK OR ANY BANK AFFILIATE |
PGIM INTERNATIONAL BOND FUND
| | | | | | | | |
| SHARE CLASS | | A | | C | | Z | | R6* |
| NASDAQ | | PXBAX | | PXBCX | | PXBZX | | PXBQX |
| CUSIP | | 74441J738 | | 74441J720 | | 74441J696 | | 74441J712 |
| *Formerly | known as Class Q shares. |
MF234E
Item 2 – Code of Ethics – – See Exhibit (a)
As of the end of the period covered by this report, the registrant has adopted a code of ethics (the “Section 406 Standards for Investment Companies – Ethical Standards for Principal Executive and Financial Officers”) that applies to the registrant’s Principal Executive Officer and Principal Financial Officer; the registrant’s Principal Financial Officer also serves as the Principal Accounting Officer.
The registrant hereby undertakes to provide any person, without charge, upon request, a copy of the code of ethics. To request a copy of the code of ethics, contact the registrant 800-225-1852, and ask for a copy of the Section 406 Standards for Investment Companies - Ethical Standards for Principal Executive and Financial Officers.
Item 3 – Audit Committee Financial Expert –
The registrant’s Board has determined that Mr. Kevin J. Bannon, member of the Board’s Audit Committee is an “audit committee financial expert,” and that he is “independent,” for purposes of this Item.
Item 4 – Principal Accountant Fees and Services –
(a) Audit Fees
For the fiscal years ended October 31, 2018 and October 31, 2017, KPMG LLP (“KPMG”), the Registrant’s principal accountant, billed the Registrant $206,556 and $190,011 respectively, for professional services rendered for the audit of the Registrant’s annual financial statements or services that are normally provided in connection with statutory and regulatory filings.
(b) Audit-Related Fees
For the fiscal years ended October 31, 2018 and October 31, 2017: none.
(c) Tax Fees
For the fiscal years ended October 31, 2018 and October 31, 2017: none.
(d) All Other Fees
For the fiscal years ended October 31, 2018 and October 31, 2017: none.
(e) (1) Audit Committee Pre-Approval Policies and Procedures
THE PRUDENTIAL MUTUAL FUNDS
AUDIT COMMITTEE POLICY
on
Pre-Approval of Services Provided by the Independent Accountants
The Audit Committee of each Prudential Mutual Fund is charged with the responsibility to monitor the independence of the Fund’s independent accountants. As part of this responsibility, the Audit Committee must pre-approve the independent accounting firm’s engagement to render audit and/or permissible non-audit services, as required by law. In evaluating a proposed engagement of the independent accountants, the Audit Committee will assess the effect that the engagement might reasonably be expected to have on the accountant’s independence. The Committee’s evaluation will be based on:
| | • | | a review of the nature of the professional services expected to be provided, |
| | • | | a review of the safeguards put into place by the accounting firm to safeguard independence, and |
| | • | | periodic meetings with the accounting firm. |
Policy for Audit and Non-Audit Services Provided to the Funds
On an annual basis, the scope of audits for each Fund, audit fees and expenses, and audit-related and non-audit services (and fees proposed in respect thereof) proposed to be performed by the Fund’s independent accountants will be presented by the Treasurer and the independent accountants to the Audit Committee for review and, as appropriate, approval prior to the initiation of such services. Such presentation shall be accompanied by confirmation by both the Treasurer and the independent accountants that the proposed non-audit services will not adversely affect the independence of the independent accountants. Such proposed non-audit services shall be described in sufficient detail to enable the Audit Committee to assess the appropriateness of such services and fees, and the compatibility of the provision of such services with the auditor’s independence. The Committee shall receive periodic reports on the progress of the audit and other services which are approved by the Committee or by the Committee Chair pursuant to authority delegated in this Policy.
The categories of services enumerated under “Audit Services”, “Audit-related Services”, and “Tax Services” are intended to provide guidance to the Treasurer and the independent accountants as to those categories of services which the Committee believes are generally consistent with the independence of the independent accountants and which the Committee (or the Committee Chair) would expect upon the presentation of specific proposals to pre-approve. The enumerated categories are not intended as an exclusive list of audit, audit-related or tax services, which the Committee (or the Committee Chair) would consider for pre-approval.
Audit Services
The following categories of audit services are considered to be consistent with the role of the Fund’s independent accountants:
| | ➣ | Annual Fund financial statement audits |
| | ➣ | Seed audits (related to new product filings, as required) |
| | ➣ | SEC and regulatory filings and consents |
Audit-related Services
The following categories of audit-related services are considered to be consistent with the role of the Fund’s independent accountants:
| | ➣ | Accounting consultations |
| | ➣ | Fund merger support services |
| | ➣ | Agreed Upon Procedure Reports |
| | ➣ | Other Internal Control Reports |
Individual audit-related services that fall within one of these categories (except for fund merger support services) and are not presented to the Audit Committee as part of the annual pre-approval process are subject to an authorized pre-approval by the Audit Committee so long as the estimated fee for those services does not exceed $30,000. Any services provided under such pre-approval will be reported to the Audit Committee at its next regular meeting. Should the amount of such services exceed $30,000 any additional fees will be subject to pre-approval by the Committee Chair (or any other Committee member on whom this responsibility has been delegated). Fees related to fund merger support services are subject to a separate authorized pre-approval by the Audit Committee with fees determined on a per occurrence and merger complexity basis.
Tax Services
The following categories of tax services are considered to be consistent with the role of the Fund’s independent accountants:
| | ➣ | Tax compliance services related to the filing or amendment of the following: |
| | ◾ | Federal, state and local income tax compliance; and, |
| | ◾ | Sales and use tax compliance |
| | ➣ | Timely RIC qualification reviews |
| | ➣ | Tax distribution analysis and planning |
| | ➣ | Tax authority examination services |
| | ➣ | Tax appeals support services |
| | ➣ | Accounting methods studies |
| | ➣ | Fund merger support services |
| | ➣ | Tax consulting services and related projects |
Individual tax services that fall within one of these categories and are not presented to the Audit Committee as part of the annual pre-approval process are subject to an authorized pre-approval by the Audit Committee so long as the estimated fee for those services does not exceed $30,000. Any services provided under such pre-approval will be reported to the Audit Committee at its next regular meeting. Should the amount of such services exceed $30,000 any additional fees will be subject to pre-approval by the Committee Chair (or any other Committee member on whom this responsibility has been delegated).
Other Non-Audit Services
Certain non-audit services that the independent accountants are legally permitted to render will be subject to pre-approval by the Committee or by one or more Committee members to whom the Committee has delegated this authority and who will report to the full Committee any pre-approval decisions made pursuant to this Policy. Non-audit services presented for pre-approval pursuant to this paragraph will be accompanied by a confirmation from both the Treasurer and the independent accountants that the proposed services will not adversely affect the independence of the independent accountants.
Proscribed Services
The Fund’s independent accountants will not render services in the following categories of non-audit services:
➣ Bookkeeping or other services related to the accounting records or financial statements of the Fund
➣ Financial information systems design and implementation
➣ Appraisal or valuation services, fairness opinions, or contribution-in-kind reports
➣ Actuarial services
➣ Internal audit outsourcing services
➣ Management functions or human resources
➣ Broker or dealer, investment adviser, or investment banking services
➣ Legal services and expert services unrelated to the audit
➣ Any other service that the Public Company Accounting Oversight Board determines, by regulation, is impermissible.
Pre-approval of Non-Audit Services Provided to Other Entities Within the Prudential Fund Complex
Certain non-audit services provided to PGIM Investments LLC or any of its affiliates that also provide ongoing services to the Prudential Mutual Funds will be subject to pre-approval by the Audit Committee. The only non-audit services provided to these entities that will require pre-approval are those related directly to the operations and financial reporting of the Funds. Individual projects that are not presented to the Audit Committee as part of the annual pre-approval process will be subject to pre-approval by the Committee Chair (or any other Committee member on whom this responsibility has been delegated) so long as the estimated fee for those services does not exceed $30,000. Services presented for pre-approval pursuant to this paragraph will be accompanied by a confirmation from both the Treasurer and the independent accountants that the proposed services will not adversely affect the independence of the independent accountants.
Although the Audit Committee will not pre-approve all services provided to PGIM Investments LLC and its affiliates, the Committee will receive an annual report from the Fund’s independent accounting firm showing the aggregate fees for all services provided to PGIM Investments and its affiliates.
(e) (2) Percentage of services referred to in 4(b) – 4(d) that were approved by the audit committee –
For the fiscal years ended October 31, 2018 and October 31, 2017: none.
(f) Percentage of hours expended attributable to work performed by other than full time employees of principal accountant if greater than 50%.
The percentage of hours expended on the principal accountant’s engagement to audit the registrant’s financial statements for the most recent fiscal year that were attributed to work performed by persons other than the principal accountant’s full-time, permanent employees was 0%.
(g) Non-Audit Fees
The aggregate non-audit fees billed by KPMG for services rendered to the registrant’s investment adviser and any entity controlling, controlled by, or under common control with the investment adviser that provides ongoing services to the registrant for the fiscal years ended October 31, 2018 and October 31, 2017 was $0 and $0, respectively.
(h) Principal Accountant’s Independence
Not applicable as KPMG has not provided non-audit services to the registrant’s investment adviser and any entity controlling, controlled by, or under common control with the investment adviser that provides ongoing services to the registrant that were not pre-approved pursuant to Rule 2-01(c)(7)(ii) of Regulation S-X.
| | |
Item 5 – | | Audit Committee of Listed Registrants – Not applicable. |
| |
Item 6 – | | Schedule of Investments – The schedule is included as part of the report to shareholders filed under Item 1 of this Form. |
| |
Item 7 – | | Disclosure of Proxy Voting Policies and Procedures for Closed-End Management Investment Companies – Not applicable. |
| |
Item 8 – | | Portfolio Managers of Closed-End Management Investment Companies – Not applicable. |
| |
Item 9 – | | Purchases of Equity Securities by Closed-End Management Investment Company and Affiliated Purchasers – Not applicable. |
| | |
| |
Item 10 – | | Submission of Matters to a Vote of Security Holders – Not applicable. |
| |
Item 11 – | | Controls and Procedures |
| | (a) | It is the conclusion of the registrant’s principal executive officer and principal financial officer that the effectiveness of the registrant’s current disclosure controls and procedures (such disclosure controls and procedures having been evaluated within 90 days of the date of this filing) provide reasonable assurance that the information required to be disclosed by the registrant has been recorded, processed, summarized and reported within the time period specified in the Commission’s rules and forms and that the information required to be disclosed by the registrant has been accumulated and communicated to the registrant’s principal executive officer and principal financial officer in order to allow timely decisions regarding required disclosure. |
| | (b) | There has been no significant change in the registrant’s internal control over financial reporting that occurred during the registrant’s most recent fiscal quarter of the period covered by this report that has materially affected, or is likely to materially affect, the registrant’s internal control over financial reporting. |
| | | | |
| Item 12 – Exhibits |
| | |
| | (a) | | (1) Code of Ethics – Attached hereto as Exhibit EX-99.CODE-ETH |
| | |
| | | | (2) Certifications pursuant to Section 302 of the Sarbanes-Oxley Act – Attached hereto as Exhibit EX-99.CERT. |
| | |
| | | | (3) Any written solicitation to purchase securities under Rule 23c-1. – Not applicable. |
| | |
| | (b) | | Certifications pursuant to Section 906 of the Sarbanes-Oxley Act – Attached hereto as Exhibit EX-99.906CERT. |
SIGNATURES
Pursuant to the requirements of the Securities Exchange Act of 1934 and the Investment Company Act of 1940, the registrant has duly caused this report to be signed on its behalf by the undersigned, thereunto duly authorized.
| | |
| Registrant: | | Prudential Investment Portfolios 9 |
| |
| By: | | /s/ Andrew R. French |
| | Andrew R. French |
| | Secretary |
| |
| Date: | | December 19, 2018 |
Pursuant to the requirements of the Securities Exchange Act of 1934 and the Investment Company Act of 1940, this report has been signed below by the following persons on behalf of the registrant and in the capacities and on the dates indicated.
| | |
| By: | | /s/ Stuart S. Parker |
| | Stuart S. Parker |
| | President and Principal Executive Officer |
| |
| Date: | | December 19, 2018 |
| |
| By: | | /s/ Brian D. Nee |
| | Brian D. Nee |
| | Treasurer and Principal Financial and Accounting Officer |
| |
| Date: | | December 19, 2018 |