UNITED STATES
SECURITIES AND EXCHANGE COMMISSION
Washington, D.C. 20549
FORMN-CSR
CERTIFIED SHAREHOLDER REPORT OF REGISTERED MANAGEMENT INVESTMENT COMPANIES
| | |
| Investment Company Act file number: | | 811- 09101 |
| |
| Exact name of registrant as specified in charter: | | Prudential Investment Portfolios 9 |
| |
| Address of principal executive offices: | | 655 Broad Street, 17th Floor |
| | Newark, New Jersey 07102 |
| |
| Name and address of agent for service: | | Andrew R. French |
| | 655 Broad Street, 17th Floor |
| | Newark, New Jersey 07102 |
| |
| Registrant’s telephone number, including area code: | | 800-225-1852 |
| |
| Date of fiscal year end: | | 10/31/2019 |
| |
| Date of reporting period: | | 10/31/2019 |
Item 1 – Reports to Stockholders

PGIM ABSOLUTE RETURN BOND FUND
ANNUAL REPORT
OCTOBER 31, 2019
COMING SOON: PAPERLESS SHAREHOLDER REPORTS
Beginning on January 1, 2021, as permitted by regulations adopted by the Securities and Exchange Commission, paper copies of the Fund’s annual and semiannual shareholder reports will no longer be sent by mail, unless you specifically request paper copies of the reports. Instead, the reports will be made available on the Fund’s website (pgiminvestments.com), and you will be notified by mail each time a report is posted and provided with a website link to access the report.
If you already elected to receive shareholder reports electronically, you will not be affected by this change and you need not take any action. You may elect to receive shareholder reports and other communications from the Fund electronically anytime by contacting your financial intermediary (such as a broker-dealer or bank) or, if you are a direct investor, by calling 1-800-225-1852 or by sending an email request to PGIM Investments at shareholderreports@pgim.com.
You may elect to receive all future reports in paper free of charge. If you invest through a financial intermediary, you can contact your financial intermediary or follow instructions included with this notice to elect to continue to receive paper copies of your shareholder reports. If you invest directly with the Fund, you can call 1-800-225-1852 or send an email request to shareholderreports@pgim.com to let the Fund know you wish to continue receiving paper copies of your shareholder reports. Your election to receive reports in paper will apply to all funds held in your account if you invest through your financial intermediary or all funds held with the fund complex if you invest directly with the Fund.

To enroll in e-delivery, go to pgiminvestments.com/edelivery
|
Objective:To seek positive returns over the long term, regardless of market
conditions |
Highlights(unaudited)
| • | | The Fund outperformed the ICE BofAML US Dollar 3-Month Deposit Offered Rate Constant Maturity Index over the reporting period, highlighted by strong duration positioning, sector allocation, security selection, and yield curve positioning. Currency selection hurt performance. |
| • | | In sector allocation, positions in high yield bonds, collateralized loan obligations, and emerging markets debt were positive contributors. Security selection was a strong contributor to performance, led by positioning in sovereign and high yield bonds,non-agency mortgages, and commercial mortgage-backed securities. |
| • | | Although overall security selection contributed to the Fund’s performance, positioning in interest-rate swaps, CLOs, and Treasuries limited results. |
| • | | Within corporates, security selection in the upstream-energy and aerospace & defense sectors hurt performance. Detractors in upstream-energy included overweights in Antero Resources and Frontera Energy. Within aerospace & defense, a position in Bombardier was negative. |
| • | | An overweight to Argentina was the largest detractor from performance. |
This report is not authorized for distribution to prospective investors unless preceded or accompanied by a current prospectus.
The views expressed in this report and information about the Fund’s portfolio holdings are for the period covered by this report and are subject to change thereafter.
Mutual funds are distributed by Prudential Investment Management Services LLC (PIMS), member SIPC. PGIM Fixed Income is a unit of PGIM, Inc. (PGIM), a registered investment adviser. PIMS and PGIM are Prudential Financial companies.© 2019 Prudential Financial, Inc. and its related entities. PGIM and the PGIM logo are service marks of Prudential Financial, Inc. and its related entities, registered in many jurisdictions worldwide.
| | |
| 2 | | Visit our website at pgiminvestments.com |
Table of Contents
| | | | |
| PGIM Absolute Return Bond Fund | | | 3 | |
This Page Intentionally Left Blank
Letter from the President

Dear Shareholder:
We hope you find the annual report for the PGIM Absolute Return Bond Fund informative and useful. The report covers performance for the12-month period that ended October 31, 2019.
While the US economy remained healthy, with rising corporate profits and strong job growth, the Federal Reserve cut interest rates three times in the latter half of the period. The cuts were a proactive attempt by the Fed to extend the longest domestic economic expansion on record as growth in many regions weakened. China in particular showed signs of slowing amid trade tensions with the US, and turmoil in the United Kingdom continued as it negotiates an exit from the European Union.
The interest-rate cuts helped boost the performance of stocks globally. For the period overall, large-cap US equities along with stocks in developed and emerging foreign markets all rose by double digits. Small-cap US stocks posted a single-digit gain. This positive performance came despite significant volatility early in the period. Equities plunged at the end of 2018 on concerns about China’s economy, a potential global trade war, higher interest rates, and worries that profit growth might slow. Stocks reversed course early in 2019, rising sharply after the Fed moderated its position on additional rate hikes for the remainder of the year.
The overall US bond market posted strong returns during the period on a significant rally in interest rates that saw the 10-year US Treasury yield decline from over 3% to under 2%. Investment-grade corporate bonds led the way with a double-digit gain, while corporate high yield and municipal bonds each had a return in the high single digits. Globally, bonds in developed markets delivered strong returns, and emerging markets debt rose by double digits.
Regarding your investments with PGIM, we believe it is important to maintain a diversified portfolio of funds consistent with your tolerance for risk, time horizon, and financial goals. Your financial advisor can help you create a diversified investment plan that may include funds covering all the basic asset classes and that reflects your personal investor profile and risk tolerance. However, diversification and asset allocation strategies do not assure a profit or protect against loss in declining markets.
At PGIM Investments, we consider it a great privilege and responsibility to help investors participate in opportunities across global markets while meeting their toughest investment challenges. PGIM is a top-10 global investment manager with more than $1 trillion in assets under management. This scale and investment expertise allow us to deliver actively managed funds and strategies to meet the needs of investors around the globe.
Thank you for choosing our family of funds.
Sincerely,

Stuart S. Parker, President
PGIM Absolute Return Bond Fund
December 16, 2019
| | | | |
| PGIM Absolute Return Bond Fund | | | 5 | |
Your Fund’s Performance(unaudited)
Performance data quoted represents past performance. Past performance does not guarantee future results. The investment return and principal value of an investment will fluctuate, so that an investor’s shares, when redeemed, may be worth more or less than their original cost. Current performance may be lower or higher than the past performance data quoted. An investor may obtain performance data as of the most recent month-end by visiting our website atpgiminvestments.com or by calling (800) 225-1852.
| | | | | | | | | | |
| |
| | | Average Annual Total Returns as of 10/31/19
(with sales charges) | |
| | | One Year (%) | | Five Years (%) | | | Since Inception (%) | |
| Class A | | 1.30 | | | 2.38 | | | | 2.40 (3/30/11) | |
| Class C | | 2.81 | | | 2.27 | | | | 2.03 (3/30/11) | |
| Class Z | | 5.00 | | | 3.32 | | | | 3.07 (3/30/11) | |
| Class R6 | | 4.94 | | | 3.34 | | | | 3.10 (3/30/11) | |
| ICE BofAML US Dollar 3-Month Deposit Offered Rate Constant Maturity Index | |
| | 2.68 | | | 1.27 | | | | 0.88 | |
| Bloomberg Barclays US Aggregate Bond Index | |
| | | 11.51 | | | 3.24 | | | | 3.57 | |
| | | | | | | | | | |
| |
| | | Average Annual Total Returns as of 10/31/19
(without sales charges) | |
| | | One Year (%) | | Five Years (%) | | | Since Inception (%) | |
| Class A | | 4.71 | | | 3.06 | | | | 2.80 (3/30/11) | |
| Class C | | 3.80 | | | 2.27 | | | | 2.03 (3/30/11) | |
| Class Z | | 5.00 | | | 3.32 | | | | 3.07 (3/30/11) | |
| Class R6 | | 4.94 | | | 3.34 | | | | 3.10 (3/30/11) | |
| ICE BofAML US Dollar 3-Month Deposit Offered Rate Constant Maturity Index | | | | | |
| | 2.68 | | | 1.27 | | | | 0.88 | |
| Bloomberg Barclays US Aggregate Bond Index | | | | | | | | | | |
| | | 11.51 | | | 3.24 | | | | 3.57 | |
| | |
| 6 | | Visit our website at pgiminvestments.com |
Growth of a $10,000 Investment(unaudited)
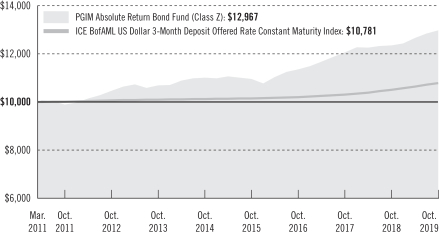
The graph compares a $10,000 investment in the Fund’s Class Z shares with a similar investment in the ICE BofAML US Dollar 3-Month Deposit Offered Rate Constant Maturity Index by portraying the initial account values at the commencement of operations for Class Z shares (March 30, 2011) and the account values at the end of the current fiscal year (October 31, 2019) as measured on a quarterly basis. For purposes of the graph, and unless otherwise indicated, it has been assumed that (a) all recurring fees (including management fees) were deducted; and (b) all dividends and distributions were reinvested. The line graph provides information for Class Z shares only. As indicated in the tables provided earlier, performance for other share classes will vary due to the differing charges and expenses applicable to each share class (as indicated in the following paragraphs). Without waiver of fees and/or expense reimbursements, if any, the Fund’s returns would have been lower.
Past performance does not predict future performance. Total returns and the ending account values in the graph include changes in share price and reinvestment of dividends and capital gains distributions in a hypothetical investment for the periods shown. The Fund’s total returns do not reflect the deduction of income taxes on an individual’s investment. Taxes may reduce your actual investment returns on income or gains paid by the Fund or any gains you may realize if you sell your shares.
Source: PGIM Investments LLC and Lipper Inc.
Since Inception returns are provided since the Fund has less than 10 fiscal years of returns. Since Inception returns for the Index are measured from the closest month-end to the Fund’s inception date.
| | | | |
| PGIM Absolute Return Bond Fund | | | 7 | |
Your Fund’s Performance(continued)
The returns in the tables do not reflect the deduction of taxes that a shareholder would pay on Fund distributions or following the redemption of Fund shares. The average annual total returns take into account applicable sales charges, which are described for each share class in the table below.
| | | | | | | | |
| | | | | |
| | | Class A | | Class C | | Class Z | | Class R6 |
| Maximum initial sales charge | | For purchases on or after July 15, 2019: 3.25% of the public offering price. For purchases prior to July 15, 2019: 4.50% of the public offering price | | None | | None | | None |
| Contingent deferred sales charge (CDSC) (as a percentage of the lower of the original purchase price or the net asset value at redemption) | | For purchases on or after July 15, 2019: 1.00% on sales of $500,000 or more made within 12 months of purchase. For purchases prior to July 15, 2019: 1.00% on sales of $1 million or more made within 12 months of purchase. | | 1.00% on sales made within 12 months of purchase | | None | | None |
Annual distribution and service
(12b-1) fees (shown as a percentage of average daily net assets) | | 0.25%
| | 1.00% | | None | | None |
Benchmark Definitions
ICE BofAML US Dollar 3-Month Deposit Offered Rate Constant Maturity Index—The ICE BofAML US Dollar3-Month Deposit Offered Rate Constant Maturity Index is an unmanaged index that tracks the performance of a synthetic asset paying LIBOR to a stated maturity. The Index is based on the assumed purchase at par of a synthetic instrument having exactly its stated maturity and with a coupon equal to that current day fixing rate. That issue is assumed to be sold the following business day (priced at a yield equal to the current day fixing rate) and rolled into a new instrument.
Bloomberg Barclays US Aggregate Bond Index—The Bloomberg Barclays US Aggregate Bond Index is unmanaged and represents securities that are taxable and dollar denominated. It covers the US investment-grade fixed rate bond market, with index components for government and corporate securities, mortgage pass-through securities, and asset-backed securities.
Investors cannot invest directly in an index or average. The returns for the Index would be lower if they included the effects of sales charges, operating expenses of a mutual fund, or taxes.
| | |
| 8 | | Visit our website at pgiminvestments.com |
| | | | | | |
| | |
| Distributions and Yields as of 10/31/19 | | | | |
| | Total Distributions
Paid for
12 Months ($) | | SEC 30-Day
Subsidized
Yield* (%) | | SEC30-Day
Unsubsidized
Yield** (%) |
| Class A | | 0.53 | | 3.04 | | 3.04 |
| Class C | | 0.46 | | 2.41 | | 2.41 |
| Class Z | | 0.56 | | 3.42 | | 3.39 |
| Class R6 | | 0.57 | | 3.45 | | 3.47 |
*SEC 30-Day Subsidized Yield (%)—A standardized yield calculation created by the Securities and Exchange Commission, it reflects the income earned during a 30-day period, after the deduction of the Fund’s net expenses (net of any expense waivers or reimbursements). The investor experience is represented by the SEC 30-Day Subsidized Yield.
**SEC 30-Day Unsubsidized Yield (%)—A standardized yield calculation created by the Securities and Exchange Commission, it reflects the income earned during a 30-day period, after the deduction of the Fund’s gross expenses. The investor experience is represented by the SEC 30-Day Subsidized Yield.
| | | | |
| |
| Credit Quality expressed as a percentage of total investments as of 10/31/19 (%) | | | |
| AAA | | | 21.1 | |
| AA | | | 7.4 | |
| A | | | 4.9 | |
| BBB | | | 13.1 | |
| BB | | | 18.0 | |
| B | | | 14.8 | |
| CCC | | | 1.3 | |
| CC | | | 0.1 | |
| C | | | 0.1 | |
| Not Rated | | | 3.3 | |
| Cash/Cash Equivalents | | | 15.9 | |
| Total Investments | | | 100.0 | |
Source: PGIM Fixed Income
Credit ratings reflect the highest rating assigned by a nationally recognized statistical rating organization (NRSRO) such as Moody’s Investors Service, Inc. (Moody’s), S&P Global Ratings (S&P), or Fitch, Inc. (Fitch). Credit ratings reflect the common nomenclature used by both S&P and Fitch. Where applicable, ratings are converted to the comparable S&P/Fitch rating tier nomenclature. These rating agencies are independent and are widely used. The Not Rated category consists of securities that have not been rated by a NRSRO. Credit ratings are subject to change.
| | | | |
| PGIM Absolute Return Bond Fund | | | 9 | |
Strategy and Performance Overview
How did the Fund Perform?
ThePGIM Absolute Return Bond Fund’s Class Z shares returned 5.00% in the12-month reporting period that ended October 31, 2019, outperforming the 2.68% return of the ICE BofAML US Dollar 3-Month Deposit Offered Rate Constant Maturity Index (the Index).
What were the market conditions?
| • | | The fourth quarter of 2018 represented a major shift in market sentiment across global asset classes. Interest rates peaked in early October and aggressively rallied as Brexit worries, fears of an escalating trade war, weaker economic data, and a hawkish Federal Reserve (Fed) punished risk assets, sending developed-market interest rates to yearly lows. As the fourth quarter concluded, the yield on10-year German government bunds and Japanese government bonds (JGBs) plummeted to depths not seen in years, while the10-year US Treasury note yield ended the quarter just above its low from early in 2018. Additionally, after beginning the quarter higher, the yield on Italy’s10-year BTP government bond declined below 3% for the first time since September 2018 as Italy slowly moved its 2019 budget target closer to the European Commission’s suggestion. With signs of slowing global growth, the fourth quarter also brought the potential for further headwinds as Democrats won control of the US House of Representatives—thus mitigating the probability of further fiscal stimulus as a “fiscal cliff” approaches in 2020—and trade tensions with China intensified. Against this macro backdrop, Fed Chairman Jerome Powell and Vice Chairman Richard Clarida struck a more balanced tone prior to December’s Federal Open Market Committee (FOMC) meeting. In addition to the expected25-basis point (bp) hike in its nominal federal funds target range, the FOMC decreased its median projection for additional hikes going forward by 25 bps. (One basis point is 0.01%.) |
| • | | As the fourth quarter of 2018 concluded, the global economy and markets were on the ropes. Spreads were rising sharply, equity markets were falling, and the prospects for global growth seemed in serious jeopardy. Global real gross domestic product (GDP) growth in the first quarter of 2019 sagged to 3%, its weakest performance sincemid-2016. The slowdown was broad-based and included the US, United Kingdom, Canada, China, Turkey, and Poland. In addition, global trade growth retreated, and other key measures of activity also showed weakness. |
| • | | The 2019 second-quarter collapse in developed-market government bond yields seemingly confirmed a trend of mounting economic disappointment where growth and inflation simply remain too low. As the G3 (United States, European Union, and Japan) rate markets fell for the third consecutive quarter and pointed to the need for more central bank accommodation, the actual tipping points for the G3 institutions varied: The European Central Bank (ECB) was struck by the market’s drop in inflation expectations, while the Fed and Bank of Japan (BOJ) moved to easing biases asUS-China trade |
| | |
| 10 | | Visit our website at pgiminvestments.com |
| | tensions flared. Although no G3 central bank actually moved rates, the ECB and the Fed certainly appeared poised to act over the balance of the year, if not in the third quarter. WhileUS-China trade tensions led to a pronounced hiccup in the risk markets in May 2019, these markets recovered byquarter-end, leaving returns for equities and riskier fixed income sectors in positive territory and even stronger year to date thanks to a banner first quarter. The return bounty certainly belied what many considered to be low levels of yields and spreads at the beginning of the year. |
| • | | Positive total returns continued to accrue across the fixed income sectors in the third quarter, leading to someeye-popping double-digit gains in 2019 through the end of the reporting period. Yet, if bonds have managed to thrive in the current environment of economic and policy uncertainty, one only needs to recall a year earlier—the fourth quarter of 2018—for a reminder of how quickly market sentiment can change. Developed-market rates took another leg down in the third quarter of 2019 as central banks collectively eased policies to counter signs of mounting global economic weakness and uncertainty. It was the second consecutive quarter of double-digit basis point declines for US and German10-year yields (down 35 bps and 25 bps to 1.67% and –0.57%, respectively), while the Japanese10-year yield also fell deeper into negative territory (down 10 bps to –0.22%). |
| • | | In October 2019, the trend of global monetary easing continued unabated, while some of the downside risks to the global outlook seemed to have lessened. In particular, risks of a hard Brexit seemed on the decline, and there seemed to be some intention for reaching some kind of an interim deal in theUS-China trade war, although many of the more complex issues seemed to be excluded from the discussions. Although the global manufacturing sector and trade volumes remained in the doldrums, continued (albeit easing) resilience in the service sector prevented a sharper deceleration in global growth. Case in point: US real GDP growth eased only a tad to 1.9% in the third quarter (year over year), and euro-area growth came in at 1.1%, both somewhat better than expected. As was widely expected, the Fed cut its target range for the federal funds rate another 25 bp to1.50%-1.75% at its meeting on October29-30, 2019, citing the global backdrop and below-target inflation as reasons for the easing. It was the Fed’s third rate cut in 2019, effectively and quickly unwinding the lion’s share of last year’s 100 bps of hikes. Also as expected, the Fed appeared to shift to await-and-see mode, indicating that it will continue to “assess” the appropriate policy path going forward, which is a change from its stance in September that it “will act” as appropriate to sustain the expansion. |
What worked?
| • | | The Fund outperformed the Index over the reporting period, highlighted by strong duration positioning, sector allocation, security selection, and yield curve positioning. Currency selection hurt performance. The Index does not include any bonds but closely |
| | | | |
| PGIM Absolute Return Bond Fund | | | 11 | |
Strategy and Performance Overview(continued)
| | tracks the Bank of America Merrill Lynch US Dollar LIBOR3-Month Constant Maturity Index (LIBOR), the most widely used benchmark for short-term interest rates. |
| • | | The Fund employs an absolute return strategy that seeks to mitigate (or even eliminate) interest-rate risk when appropriate. During the period, the Fund’s strategy to manage duration was a significant contributor to performance. Duration is a measure of the interest-rate sensitivity of a bond portfolio or debt securities that is expressed as a number of years. The Fund’s long-duration positioning added to performance, asUS-dollar (USD) rates were lower during the period. The Fund’s active duration positioning ranged from 0.4 years short to 1.2 years long during the period, ending it at the middle end of the range at +0.3 years. |
| • | | In sector allocation, positions in high yield bonds, collateralized loan obligations (CLOs), and emerging markets debt were positive contributors. |
| • | | Security selection was a strong contributor to performance, led by positioning in sovereign and high yield bonds,non-agency mortgages, and commercial mortgage-backed securities (CMBS). |
| • | | Corporate positioning in the building materials & home construction sector and the foreignnon-corporates sector added value. Within building materials & home construction, overweights toWilliam Lyon Homes andBeazer Homes USA were positive. Contributors in foreignnon-corporates included positions in Greece and Ukraine. |
| • | | Also contributing positively was the Fund’s yield curve flattener positioning as the curve flattened over the period. |
What didn’t work?
| • | | Although overall security selection contributed to the Fund’s performance, positioning in interest-rate swaps, CLOs, and Treasuries limited results. |
| • | | Within corporates, security selection in the upstream-energy and aerospace & defense sectors hurt performance. Detractors in upstream-energy included overweights inAntero Resources Corp. andFrontera Energy Corp. Within aerospace & defense, a position inBombardier Inc. was negative. |
| • | | An overweight to Argentina was the largest detractor from performance. |
| • | | The Fund occasionally features a modest notional exposure tonon-USD currencies across a diversified basket of currencies in faster-growing emerging and developed countries. The Fund’s foreign-exchange currency market (FX) positioning hurt performance, with positions in the Norwegian krone, South African rand, and euro among the largest detractors. |
| | |
| 12 | | Visit our website at pgiminvestments.com |
Did the Fund use derivatives?
The Fund uses derivatives when they facilitate implementation of the overall investment approach. During the reporting period, the Fund used interest-rate futures, options, and swaps to help manage duration positioning and yield curve exposure. Over the period, futures and swaps hurt performance while options added value. Credit default swaps and credit default swap index (CDX) positions were used to either add risk exposure to certain issuers or to hedge credit risk imposed by certain issuers. Overall, credit derivative exposure added value during the period. In addition, the Fund traded foreign-exchange derivatives, which had a negative impact on performance during the period.
Current outlook
| • | | PGIM Fixed Income’s base case assumes that the Fed will pause from adjusting rates for the foreseeable future as the impact of its rate cuts in 2019 continues to filter through the economy and the FOMC takes time to assess developments across the global economy. |
| • | | PGIM Fixed Income maintains its positive view of fundamentals in the credit sectors of fixed income. As of the end of the reporting period, the Fund was overweight structured products, which include CMBS, CLOs, and asset-backed securities (ABS); emerging market debt; and high yield bonds. Within CMBS, PGIM Fixed Income continues to find value in high-quality securities ofnew-issue conduit deals. In ABS, the Fund is maintaining anup-in-quality focus (with some exceptions) as capital stack/issuer valuations remain compressed. PGIM Fixed Income is constructive on US high yield and continues to like independent power producers and US consumer-related names. PGIM Fixed Income remains cautious on commodities but is looking at unique opportunities in natural gas and health care. Within investment-grade corporates, as we enter the later stage of the credit cycle, PGIM Fixed Income continues to favor better-quality financials and electric utilities over industrials. |
| | | | |
| PGIM Absolute Return Bond Fund | | | 13 | |
Fees and Expenses(unaudited)
As a shareholder of the Fund, you incur two types of costs: (1) transaction costs, including sales charges (loads) on purchase payments and redemptions, as applicable, and (2) ongoing costs, including management fees, distribution and/or service (12b-1) fees, and other Fund expenses, as applicable. This example is intended to help you understand your ongoing costs (in dollars) of investing in the Fund and to compare these costs with the ongoing costs of investing in other mutual funds.
The example is based on an investment of $1,000 held through the six-month period ended October 31, 2019. The example is for illustrative purposes only; you should consult the Prospectus for information on initial and subsequent minimum investment requirements.
Actual Expenses
The first line for each share class in the table on the following page provides information about actual account values and actual expenses. You may use the information on this line, together with the amount you invested, to estimate the expenses that you paid over the period. Simply divide your account value by $1,000 (for example, an $8,600 account value ÷ $1,000 = 8.6), then multiply the result by the number on the first line under the heading “Expenses Paid During the Six-Month Period” to estimate the expenses you paid on your account during this period.
Hypothetical Example for Comparison Purposes
The second line for each share class in the table on the following page provides information about hypothetical account values and hypothetical expenses based on the Fund’s actual expense ratio and an assumed rate of return of 5% per year before expenses, which is not the Fund’s actual return. The hypothetical account values and expenses may not be used to estimate the actual ending account balance or expenses you paid for the period. You may use this information to compare the ongoing costs of investing in the Fund and other funds. To do so, compare this 5% hypothetical example with the 5% hypothetical examples that appear in the shareholder reports of the other funds.
The Fund’s transfer agent may charge additional fees to holders of certain accounts that are not included in the expenses shown in the table on the following page. These fees apply to individual retirement accounts (IRAs) and Section 403(b) accounts. As of the close of the six-month period covered by the table, IRA fees included an annual maintenance fee of $15 per account (subject to a maximum annual maintenance fee of $25 for all accounts held by the same shareholder). Section 403(b) accounts are charged an annual $25 fiduciary maintenance fee. Some of the fees may vary in amount, or may be waived, based on your total account balance or the number of PGIM funds, including the Fund, that you own. You should consider the additional fees that were charged to your Fund account over the six-month period when you estimate the total ongoing expenses paid over the period
| | |
| 14 | | Visit our website at pgiminvestments.com |
and the impact of these fees on your ending account value, as these additional expenses are not reflected in the information provided in the expense table. Additional fees have the effect of reducing investment returns.
Please note that the expenses shown in the table are meant to highlight your ongoing costs only and do not reflect any transactional costs such as sales charges (loads). Therefore, the second line for each share class in the table is useful in comparing ongoing costs only and will not help you determine the relative total costs of owning different funds. In addition, if these transactional costs were included, your costs would have been higher.
| | | | | | | | | | | | | | | | | | |
| | | | |
PGIM Absolute
Return Bond Fund | | Beginning Account
Value
May 1, 2019 | | | Ending Account
Value
October 31, 2019 | | | Annualized
Expense Ratio
Based on the
Six-Month Period | | | Expenses Paid
During the
Six-Month Period* | |
| Class A | | Actual | | $ | 1,000.00 | | | $ | 1,023.70 | | | | 1.03 | % | | $ | 5.25 | |
| | Hypothetical | | $ | 1,000.00 | | | $ | 1,020.01 | | | | 1.03 | % | | $ | 5.24 | |
| Class C | | Actual | | $ | 1,000.00 | | | $ | 1,018.80 | | | | 1.79 | % | | $ | 9.11 | |
| | Hypothetical | | $ | 1,000.00 | | | $ | 1,016.18 | | | | 1.79 | % | | $ | 9.10 | |
| Class Z | | Actual | | $ | 1,000.00 | | | $ | 1,024.20 | | | | 0.73 | % | | $ | 3.72 | |
| | Hypothetical | | $ | 1,000.00 | | | $ | 1,021.53 | | | | 0.73 | % | | $ | 3.72 | |
| Class R6 | | Actual | | $ | 1,000.00 | | | $ | 1,024.40 | | | | 0.70 | % | | $ | 3.57 | |
| | | Hypothetical | | $ | 1,000.00 | | | $ | 1,021.68 | | | | 0.70 | % | | $ | 3.57 | |
*Fund expenses (net of fee waivers or subsidies, if any) for each share class are equal to the annualized expense ratio for each share class (provided in the table), multiplied by the average account value over the period, multiplied by the 184 days in the six-month period ended October 31, 2019, and divided by the 365 days in the Fund’s fiscal year ended October 31, 2019 (to reflect the six-month period). Expenses presented in the table include the expenses of any underlying portfolios in which the Fund may invest.
| | | | |
| PGIM Absolute Return Bond Fund | | | 15 | |
Schedule of Investments
as of October 31, 2019
| | | | | | | | | | | | | | | | |
| | | | |
| Description | | Interest
Rate | | | Maturity
Date | | | Principal
Amount (000)# | | | Value | |
| | | | |
LONG-TERM INVESTMENTS 89.2% | | | | | | | | | | | | | | | | |
| | | | |
ASSET-BACKED SECURITIES 28.5% | | | | | | | | | | | | | | | | |
| | | | |
Automobiles 0.5% | | | | | | | | | | | | | | | | |
OneMain Direct Auto Receivables Trust, | | | | | | | | | | | | | | | | |
Series 2017-02A, Class E, 144A | | | 4.740 | % | | | 11/14/25 | | | | 1,200 | | | $ | 1,219,882 | |
Series 2019-01A, Class A, 144A | | | 3.630 | | | | 09/14/27 | | | | 8,300 | | | | 8,645,599 | |
Series 2019-01A, Class B, 144A | | | 3.950 | | | | 11/14/28 | | | | 1,700 | | | | 1,786,434 | |
| | | | | | | | | | | | | | | | |
| | | | | | | | | | | | | | | 11,651,915 | |
| | | | |
Collateralized Loan Obligations 19.7% | | | | | | | | | | | | | | | | |
Anchorage Capital CLO Ltd. (Cayman Islands),
Series 2015-06A, Class AR, 144A, 3 Month LIBOR + 1.270%
(Cap N/A, Floor 0.000%) | | | 3.271 | (c) | | | 07/15/30 | | | | 1,750 | | | | 1,741,369 | |
ArrowMark Colorado Holdings (Cayman Islands),
Series 2017-06A, Class A1, 144A, 3 Month LIBOR + 1.280%
(Cap N/A, Floor 0.000%) | | | 3.281 | (c) | | | 07/15/29 | | | | 2,500 | | | | 2,496,959 | |
Atlas Senior Loan Fund Ltd. (Cayman Islands),
| | | | | | | | | | | | | | | | |
Series 2014-01A, Class AR2, 144A, 3 Month LIBOR + 1.260%
(Cap N/A, Floor 0.000%) | | | 3.261 | (c) | | | 07/16/29 | | | | 2,000 | | | | 1,997,367 | |
Series 2017-08A, Class A, 144A, 3 Month LIBOR + 1.300%
(Cap N/A, Floor 0.000%) | | | 3.301 | (c) | | | 01/16/30 | | | | 4,500 | | | | 4,491,620 | |
Bain Capital Credit CLO Ltd. (Cayman Islands),
Series 2018-01A, Class A1, 144A, 3 Month LIBOR + 0.960%
(Cap N/A, Floor 0.000%) | | | 2.894 | (c) | | | 04/23/31 | | | | 5,000 | | | | 4,927,790 | |
Battalion CLO Ltd. (Cayman Islands),
Series 2015-08A, Class A1R, 144A, 3 Month LIBOR + 1.340%
(Cap N/A, Floor 0.000%) | | | 3.343 | (c) | | | 07/18/30 | | | | 2,000 | | | | 1,995,948 | |
Benefit Street Partners CLO Ltd. (Cayman Islands),
| | | | | | | | | | | | | | | | |
Series 2013-IIA, Class A1R, 144A, 3 Month LIBOR + 1.250%
(Cap N/A, Floor 0.000%) | | | 3.251 | (c) | | | 07/15/29 | | | | 3,500 | | | | 3,490,449 | |
Series 2017-12A, Class A1, 144A, 3 Month LIBOR + 1.250%
(Cap N/A, Floor 0.000%) | | | 3.251 | (c) | | | 10/15/30 | | | | 9,250 | | | | 9,206,516 | |
Brookside Mill CLO Ltd. (Cayman Islands),
Series 2013-01A, Class BR, 144A, 3 Month LIBOR + 1.350%
(Cap N/A, Floor 0.000%) | | | 3.352 | (c) | | | 01/17/28 | | | | 4,000 | | | | 3,912,502 | |
Carlyle US CLO Ltd. (Cayman Islands),
Series 2017-02A, Class A1B, 144A, 3 Month LIBOR + 1.220%
(Cap N/A, Floor 0.000%) | | | 3.186 | (c) | | | 07/20/31 | | | | 3,000 | | | | 2,984,300 | |
Catamaran CLO Ltd. (Cayman Islands),
Series 2014-01A, Class A1AR, 144A, 3 Month LIBOR + 1.260%
(Cap N/A, Floor 0.000%) | | | 3.213 | (c) | | | 04/22/30 | | | | 10,500 | | | | 10,439,778 | |
See Notes to Financial Statements.
| | | | |
| PGIM Absolute Return Bond Fund | | | 17 | |
Schedule of Investments (continued)
as of October 31, 2019
| | | | | | | | | | | | | | | | |
| | | | |
| Description | | Interest
Rate | | | Maturity
Date | | | Principal
Amount (000)# | | | Value | |
| | | | |
ASSET-BACKED SECURITIES (Continued) | | | | | | | | | | | | | | | | |
| | | | |
Collateralized Loan Obligations (cont’d.) | | | | | | | | | | | | | | | | |
CIFC Funding Ltd. (Cayman Islands),
Series 2015-01A, Class ARR, 144A, 3 Month LIBOR + 1.110% (Cap N/A, Floor 1.110%) | | | 3.063 | %(c) | | | 01/22/31 | | | | 8,000 | | | $ | 7,944,216 | |
Elevation CLO Ltd. (Cayman Islands),
Series 2017-07A, Class A, 144A, 3 Month LIBOR + 1.220% (Cap N/A, Floor 0.000%) | | | 3.221 | (c) | | | 07/15/30 | | | | 4,000 | | | | 3,972,993 | |
Ellington CLO Ltd. (Cayman Islands),
Series 2017-02A, Class A, 144A, 3 Month LIBOR + 1.700% (Cap N/A, Floor 1.700%) | | | 3.858 | (c) | | | 02/15/29 | | | | 20,000 | | | | 20,044,176 | |
Highbridge Loan Management Ltd. (Cayman Islands),
Series 2015-06A, Class A1R, 144A, 3 Month LIBOR + 1.000% (Cap N/A, Floor 0.000%) | | | 3.287 | (c) | | | 02/05/31 | | | | 15,250 | | | | 15,131,068 | |
ICG US CLO Ltd. (Cayman Islands),
Series 2017-02A, Class A1, 144A, 3 Month LIBOR + 1.280% (Cap N/A, Floor 0.000%) | | | 3.214 | (c) | | | 10/23/29 | | | | 3,000 | | | | 2,987,280 | |
Jamestown CLO Ltd. (Cayman Islands), | | | | | | | | | | | | | | | | |
Series 2019-01A, Class A1, 144A, 3 Month LIBOR + 1.470% (Cap N/A, Floor 1.470%) | | | 3.436 | (c) | | | 04/20/32 | | | | 14,750 | | | | 14,692,333 | |
Series 2019-01A, Class A2, 144A, 3 Month LIBOR + 2.150% (Cap N/A, Floor 2.150%) | | | 4.116 | (c) | | | 04/20/32 | | | | 17,000 | | | | 16,952,556 | |
KKR CLO Ltd. (Cayman Islands), | | | | | | | | | | | | | | | | |
Series 11, Class AR, 144A, 3 Month LIBOR + 1.180% (Cap N/A, Floor 0.000%) | | | 3.181 | (c) | | | 01/15/31 | | | | 8,000 | | | | 7,949,370 | |
Series 18, Class A, 144A, 3 Month LIBOR + 1.270% (Cap N/A, Floor 0.000%) | | | 3.273 | (c) | | | 07/18/30 | | | | 8,000 | | | | 7,973,498 | |
KVK CLO Ltd. (Cayman Islands),
Series 2018-01A, Class B, 144A, 3 Month LIBOR + 1.650% (Cap N/A, Floor 0.000%) | | | 3.786 | (c) | | | 05/20/29 | | | | 18,000 | | | | 17,742,866 | |
MidOcean Credit CLO (Cayman Islands), | | | | | | | | | | | | | | | | |
Series 2014-03A, Class A1R, 144A, 3 Month LIBOR + 1.120% (Cap N/A, Floor 1.120%) | | | 3.086 | (c) | | | 04/21/31 | | | | 7,500 | | | | 7,379,320 | |
Series 2014-03A, Class BR, 144A, 3 Month LIBOR + 1.800% (Cap N/A, Floor 1.800%) | | | 3.766 | (c) | | | 04/21/31 | | | | 18,000 | | | | 17,831,057 | |
Mountain View CLO Ltd. (Cayman Islands), | | | | | | | | | | | | | | | | |
Series 2015-09A, Class A2R, 144A, 3 Month LIBOR + 1.780% (Cap N/A, Floor 0.000%) | | | 3.781 | (c) | | | 07/15/31 | | | | 22,500 | | | | 22,246,378 | |
Series 2017-02A, Class A, 144A, 3 Month LIBOR + 1.210% (Cap N/A, Floor 0.000%) | | | 3.211 | (c) | | | 01/16/31 | | | | 8,000 | | | | 7,912,183 | |
Series 2019-01A, Class B, 144A, 3 Month LIBOR + 2.000% (Cap N/A, Floor 2.000%) | | | 4.009 | (c) | | | 04/15/29 | | | | 10,000 | | | | 9,959,273 | |
See Notes to Financial Statements.
| | | | | | | | | | | | | | | | |
| | | | |
| Description | | Interest
Rate | | | Maturity
Date | | | Principal
Amount (000)# | | | Value | |
| | | | |
ASSET-BACKED SECURITIES (Continued) | | | | | | | | | | | | | | | | |
| | | | |
Collateralized Loan Obligations (cont’d.) | | | | | | | | | | | | | | | | |
OCP CLO Ltd. (Cayman Islands),
Series 2017-13A, Class A1A, 144A, 3 Month LIBOR + 1.260% (Cap N/A, Floor 0.000%) | | | 3.261 | %(c) | | | 07/15/30 | | | | 5,750 | | | $ | 5,733,335 | |
OZLM Ltd. (Cayman Islands), | | | | | | | | | | | | | | | | |
Series 2014-06A, Class A2AS, 144A, 3 Month LIBOR + 1.750% (Cap N/A, Floor 0.000%) | | | 3.752 | (c) | | | 04/17/31 | | | | 4,000 | | | | 3,959,232 | |
Series 2015-11A, Class A1R, 144A, 3 Month LIBOR + 1.250% (Cap N/A, Floor 0.000%) | | | 3.186 | (c) | | | 10/30/30 | | | | 3,000 | | | | 2,984,237 | |
Series 2016-15A, Class A1, 144A, 3 Month LIBOR + 1.490% (Cap N/A, Floor 0.000%) | | | 3.456 | (c) | | | 01/20/29 | | | | 22,750 | | | | 22,722,909 | |
Series 2018-20A, Class A2, 144A, 3 Month LIBOR + 1.650% (Cap N/A, Floor 0.000%) | | | 3.616 | (c) | | | 04/20/31 | | | | 3,000 | | | | 2,949,570 | |
Palmer Square CLO Ltd. (Cayman Islands), | | | | | | | | | | | | | | | | |
Series 2014-01A, Class A1R2, 144A, 3 Month LIBOR + 1.130% (Cap N/A, Floor 1.130%) | | | 3.132 | (c) | | | 01/17/31 | | | | 10,000 | | | | 9,946,395 | |
Series 2015-02A, Class A1AR, 144A, 3 Month LIBOR + 1.270% (Cap N/A, Floor 0.000%) | | | 3.236 | (c) | | | 07/20/30 | | | | 5,750 | | | | 5,728,508 | |
Series 2018-02A, Class A1A, 144A, 3 Month LIBOR + 1.100% (Cap N/A, Floor 0.000%) | | | 3.101 | (c) | | | 07/16/31 | | | | 12,000 | | | | 11,896,345 | |
Regatta Funding Ltd. (Cayman Islands),
Series 2017-01A, Class A, 144A, 3 Month LIBOR + 1.250% (Cap N/A, Floor 0.000%) | | | 3.252 | (c) | | | 10/17/30 | | | | 4,750 | | | | 4,721,234 | |
Romark CLO Ltd. (Cayman Islands),
Series 2018-02A, Class A1, 144A, 3 Month LIBOR + 1.175% (Cap N/A, Floor 1.175%) | | | 3.115 | (c) | | | 07/25/31 | | | | 5,000 | | | | 4,944,276 | |
Romark WM-R Ltd. (Cayman Islands),
Series 2018-01A, Class A1, 144A, 3 Month LIBOR + 1.030% (Cap N/A, Floor 0.000%) | | | 2.996 | (c) | | | 04/20/31 | | | | 1,500 | | | | 1,475,426 | |
Shackleton CLO Ltd. (Cayman Islands), | | | | | | | | | | | | | | | | |
Series 2014-05RA, Class B, 144A, 3 Month LIBOR + 1.700% (Cap N/A, Floor 0.000%) | | | 3.909 | (c) | | | 05/07/31 | | | | 12,500 | | | | 12,326,564 | |
Series 2017-11A, Class A, 144A, 3 Month LIBOR + 1.270%
(Cap N/A, Floor 0.000%) | | | 3.428 | (c) | | | 08/15/30 | | | | 2,500 | | | | 2,503,495 | |
Sound Point CLO Ltd. (Cayman Islands), | | | | | | | | | | | | | | | | |
Series 2016-02A, Class AR, 144A, 3 Month LIBOR + 1.290% (Cap N/A, Floor 1.290%) | | | 3.256 | (c) | | | 10/20/28 | | | | 14,750 | | | | 14,733,928 | |
Series 2017-02A, Class A, 144A, 3 Month LIBOR + 1.280%
(Cap N/A, Floor 0.000%) | | | 3.220 | (c) | | | 07/25/30 | | | | 8,500 | | | | 8,463,433 | |
Series 2017-03A, Class A1B, 144A, 3 Month LIBOR + 1.220% (Cap N/A, Floor 0.000%) | | | 3.186 | (c) | | | 10/20/30 | | | | 8,750 | | | | 8,700,356 | |
See Notes to Financial Statements.
| | | | |
| PGIM Absolute Return Bond Fund | | | 19 | |
Schedule of Investments(continued)
as of October 31, 2019
| | | | | | | | | | | | | | | | |
| | | | |
| Description | | Interest
Rate | | | Maturity
Date | | | Principal
Amount (000)# | | | Value | |
| | | | |
ASSET-BACKED SECURITIES (Continued) | | | | | | | | | | | | | | | | |
| | | | |
Collateralized Loan Obligations (cont’d.) | | | | | | | | | | | | | | | | |
Strata CLO Ltd. (Cayman Islands),
Series 2018-01A, Class A, 144A, 3 Month LIBOR + 1.590% (Cap N/A, Floor 1.590%) | | | 3.591 | %(c) | | | 01/15/31 | | | | 19,000 | | | $ | 18,817,583 | |
TICP CLO Ltd. (Cayman Islands),
Series 2017-07A, Class AS, 144A, 3 Month LIBOR + 1.230% (Cap N/A, Floor 1.230%) | | | 3.231 | (c) | | | 07/15/29 | | | | 5,500 | | | | 5,488,510 | |
Trinitas CLO Ltd. (Cayman Islands), | | | | | | | | | | | | | | | | |
Series 2015-03A, Class BR, 144A, 3 Month LIBOR + 1.400% (Cap N/A, Floor 0.000%) | | | 3.401 | (c) | | | 07/15/27 | | | | 12,880 | | | | 12,735,144 | |
Series 2017-07A, Class A, 144A, 3 Month LIBOR + 1.210% (Cap N/A, Floor 0.000%) | | | 3.150 | (c) | | | 01/25/31 | | | | 4,500 | | | | 4,451,504 | |
Series 2017-07A, Class B, 144A, 3 Month LIBOR + 1.600% (Cap N/A, Floor 0.000%) | | | 3.540 | (c) | | | 01/25/31 | | | | 3,000 | | | | 2,940,582 | |
Tryon Park CLO Ltd. (Cayman Islands),
Series 2013-01A, Class A2R, 144A, 3 Month LIBOR + 1.500% (Cap N/A, Floor 0.000%) | | | 3.501 | (c) | | | 04/15/29 | | | | 4,000 | | | | 3,937,106 | |
Venture CLO Ltd. (Cayman Islands),
Series 2015-21A, Class AR, 144A, 3 Month LIBOR + 0.880% (Cap N/A, Floor 0.000%) | | | 2.881 | (c) | | | 07/15/27 | | | | 7,196 | | | | 7,176,002 | |
Voya CLO Ltd. (Cayman Islands), | | | | | | | | | | | | | | | | |
Series 2013-01A, Class A1AR, 144A, 3 Month LIBOR + 1.210% (Cap N/A, Floor 0.000%) | | | 3.211 | (c) | | | 10/15/30 | | | | 2,750 | | | | 2,738,327 | |
Series 2015-01A, Class A1R, 144A, 3 Month LIBOR + 0.900% (Cap N/A, Floor 0.900%) | | | 2.903 | (c) | | | 01/18/29 | | | | 9,000 | | | | 8,936,236 | |
Wellfleet CLO Ltd. (Cayman Islands), | | | | | | | | | | | | | | | | |
Series 2017-02A, Class A1, 144A, 3 Month LIBOR + 1.250% (Cap N/A, Floor 0.000%) | | | 3.216 | (c) | | | 10/20/29 | | | | 7,000 | | | | 6,982,648 | |
Series 2017-03A, Class A1, 144A, 3 Month LIBOR + 1.150% (Cap N/A, Floor 1.150%) | | | 3.152 | (c) | | | 01/17/31 | | | | 10,500 | | | | 10,384,993 | |
York CLO Ltd. (Cayman Islands),
Series 2015-01A, Class AR, 144A, 3 Month LIBOR + 1.150% (Cap N/A, Floor 0.000%) | | | 3.103 | (c) | | | 01/22/31 | | | | 3,000 | | | | 2,980,321 | |
Zais CLO Ltd. (Cayman Islands), | | | | | | | | | | | | | | | | |
Series 2015-03A, Class A2R, 144A, 3 Month LIBOR + 2.190% (Cap N/A, Floor 0.000%) | | | 4.191 | (c) | | | 07/15/31 | | | | 12,800 | | | | 12,426,839 | |
Series 2017-01A, Class A1, 144A, 3 Month LIBOR + 1.370% (Cap N/A, Floor 0.000%) | | | 3.371 | (c) | | | 07/15/29 | | | | 8,750 | | | | 8,692,677 | |
Series 2017-02A, Class A, 144A, 3 Month LIBOR + 1.290% (Cap N/A, Floor 0.000%) | | | 3.291 | (c) | | | 04/15/30 | | | | 4,750 | | | | 4,687,212 | |
| | | | | | | | | | | | | | | | |
| | | | | | | | | | | | | | | 465,568,092 | |
See Notes to Financial Statements.
| | | | | | | | | | | | | | | | |
| | | | |
| Description | | Interest
Rate | | | Maturity
Date | | | Principal
Amount (000)# | | | Value | |
| | | | |
ASSET-BACKED SECURITIES (Continued) | | | | | | | | | | | | | | | | |
| | | | |
Consumer Loans 1.7% | | | | | | | | | | | | | | | | |
Lendmark Funding Trust, | | | | | | | | | | | | | | | | |
Series 2017-02A, Class C, 144A | | | 4.330 | % | | | 05/20/26 | | | | 700 | | | $ | 701,159 | |
Series 2018-02A, Class A, 144A | | | 4.230 | | | | 04/20/27 | | | | 3,200 | | | | 3,301,101 | |
OneMain Financial Issuance Trust, | | | | | | | | | | | | | | | | |
Series 2017-01A, Class A2, 144A, 1 Month LIBOR + 0.800% (Cap N/A, Floor 0.000%) | | | 2.714 | (c) | | | 09/14/32 | | | | 4,197 | | | | 4,199,412 | |
Series 2017-01A, Class C, 144A | | | 3.350 | | | | 09/14/32 | | | | 700 | | | | 704,063 | |
Oportun Funding LLC, | | | | | | | | | | | | | | | | |
Series 2017-B, Class B, 144A | | | 4.260 | | | | 10/10/23 | | | | 7,500 | | | | 7,561,150 | |
Series 2018-B, Class A, 144A | | | 3.910 | | | | 07/08/24 | | | | 2,050 | | | | 2,082,160 | |
Series 2018-B, Class B, 144A | | | 4.500 | | | | 07/08/24 | | | | 500 | | | | 508,063 | |
Series 2018-B, Class C, 144A | | | 5.430 | | | | 07/08/24 | | | | 1,000 | | | | 1,012,609 | |
Series 2018-C, Class A, 144A | | | 4.100 | | | | 10/08/24 | | | | 3,200 | | | | 3,281,171 | |
Series 2018-C, Class B, 144A | | | 4.590 | | | | 10/08/24 | | | | 1,300 | | | | 1,332,214 | |
Series 2018-C, Class C, 144A | | | 5.520 | | | | 10/08/24 | | | | 2,000 | | | | 2,055,151 | |
Series 2018-D, Class A, 144A | | | 4.150 | | | | 12/09/24 | | | | 2,300 | | | | 2,362,920 | |
Series 2018-D, Class B, 144A | | | 4.830 | | | | 12/09/24 | | | | 1,200 | | | | 1,229,866 | |
Series 2019-A, Class B, 144A | | | 3.870 | | | | 08/08/25 | | | | 4,860 | | | | 4,896,374 | |
PNMAC GMSR Issuer Trust, | | | | | | | | | | | | | | | | |
Series 2018-GT01, Class A, 144A, 1 Month LIBOR + 2.850% (Cap N/A, Floor 2.850%) | | | 4.673 | (c) | | | 02/25/23 | | | | 1,650 | | | | 1,660,208 | |
Series 2018-GT02, Class A, 144A, 1 Month LIBOR + 2.650% (Cap N/A, Floor 0.000%) | | | 4.473 | (c) | | | 08/25/25 | | | | 3,400 | | | | 3,411,789 | |
| | | | | | | | | | | | | | | | |
| | | | | | | | | | | | | | | 40,299,410 | |
| | | | |
Home Equity Loans 1.0% | | | | | | | | | | | | | | | | |
ABFC Trust,
Series 2004-OPT05, Class A1, 1 Month LIBOR + 0.700% (Cap N/A, Floor 0.350%) | | | 2.523 | (c) | | | 06/25/34 | | | | 1,077 | | | | 1,072,274 | |
Accredited Mortgage Loan Trust,
Series 2004-03, Class 2A2, 1 Month LIBOR + 1.200% (Cap 13.000%, Floor 0.600%) | | | 3.023 | (c) | | | 10/25/34 | | | | 2,393 | | | | 2,434,540 | |
Argent Securities, Inc., Asset-Backed Pass-Through Certificates, | | | | | | | | | | | | | | | | |
Series 2003-W05, Class M1, 1 Month LIBOR + 1.050% (Cap N/A, Floor 0.700%) | | | 2.873 | (c) | | | 10/25/33 | | | | 18 | | | | 18,124 | |
Series 2004-W06, Class AF | | | 4.123 | | | | 05/25/34 | | | | 176 | | | | 185,708 | |
Series 2004-W06, Class AV5, 1 Month LIBOR + 0.800% (Cap N/A, Floor 0.400%) | | | 2.623 | (c) | | | 05/25/34 | | | | 577 | | | | 569,102 | |
Asset-Backed Securities Corp. Home Equity Loan Trust,
Series 2003-HE06, Class A2, 1 Month LIBOR + 0.680%
(Cap N/A, Floor 0.340%) | | | 2.503 | (c) | | | 11/25/33 | | | | 1,758 | | | | 1,727,749 | |
See Notes to Financial Statements.
| | | | |
| PGIM Absolute Return Bond Fund | | | 21 | |
Schedule of Investments(continued)
as of October 31, 2019
| | | | | | | | | | | | | | | | |
| | | | |
| Description | | Interest
Rate | | | Maturity
Date | | | Principal
Amount (000)# | | | Value | |
| | | | |
ASSET-BACKED SECURITIES (Continued) | | | | | | | | | | | | | | | | |
| | | | |
Home Equity Loans (cont’d.) | | | | | | | | | | | | | | | | |
Asset-Backed Securities Corp. Home Equity Loan Trust, (cont’d.) | | | | | | | | | | | | | | | | |
Series 2003-HE06, Class A3B, 1 Month LIBOR + 0.960% (Cap N/A, Floor 0.480%) | | | 2.783 | %(c) | | | 11/25/33 | | | | 3,546 | | | $ | 3,488,164 | |
Bear Stearns Asset-Backed Securities Trust, | | | | | | | | | | | | | | | | |
Series 2002-02, Class A1, 1 Month LIBOR + 0.660% (Cap 11.000%, Floor 0.330%) | | | 2.483 | (c) | | | 10/25/32 | | | | 700 | | | | 702,823 | |
Series 2003-03, Class A2, 1 Month LIBOR + 1.180% (Cap 11.000%, Floor 0.590%) | | | 3.003 | (c) | | | 06/25/43 | | | | 98 | | | | 99,138 | |
Series 2003-HE01, Class M1, 1 Month LIBOR + 1.095% (Cap N/A, Floor 0.730%) | | | 2.918 | (c) | | | 01/25/34 | | | | 2,418 | | | | 2,490,634 | |
Series 2004-HE11, Class M2, 1 Month LIBOR + 1.575% (Cap N/A, Floor 1.050%) | | | 3.398 | (c) | | | 12/25/34 | | | | 2,075 | | | | 2,097,727 | |
Home Equity Asset Trust,
Series 2004-07, Class A2, 1 Month LIBOR + 0.840%
(Cap N/A, Floor 0.420%) | | | 2.663 | (c) | | | 01/25/35 | | | | 1,051 | | | | 1,070,407 | |
MASTR Asset-Backed Securities Trust,
Series 2003-WMC02, Class M2, 1 Month LIBOR + 2.475% (Cap N/A, Floor 1.650%) | | | 4.298 | (c) | | | 08/25/33 | | | | 912 | | | | 949,430 | |
Merrill Lynch Mortgage Investors Trust,
Series 2002-HE01, Class A1, 1 Month LIBOR + 1.000%
(Cap N/A, Floor 0.500%) | | | 2.823 | (c) | | | 08/25/32 | | | | 2,360 | | | | 2,354,165 | |
Morgan Stanley ABS Capital I, Inc. Trust, | | | | | | | | | | | | | | | | |
Series 2003-HE03, Class M1, 1 Month LIBOR + 1.020% (Cap N/A, Floor 0.680%) | | | 2.843 | (c) | | | 10/25/33 | | | | 2,107 | | | | 2,111,129 | |
Series 2003-NC08, Class M1, 1 Month LIBOR + 1.050% (Cap N/A, Floor 0.700%) | | | 2.873 | (c) | | | 09/25/33 | | | | 504 | | | | 504,473 | |
Series 2003-NC10, Class M1, 1 Month LIBOR + 1.020% (Cap N/A, Floor 0.680%) | | | 2.843 | (c) | | | 10/25/33 | | | | 561 | | | | 557,624 | |
Series 2004-HE05, Class M1, 1 Month LIBOR + 0.945% (Cap N/A, Floor 0.630%) | | | 2.768 | (c) | | | 06/25/34 | | | | 670 | | | | 674,045 | |
RASC Trust,
Series 2005-KS11, Class M1, 1 Month LIBOR + 0.400% (Cap 14.000%, Floor 0.400%) | | | 2.223 | (c) | | | 12/25/35 | | | | 194 | | | | 193,936 | |
Securitized Asset-Backed Receivables LLC Trust,
Series 2004-NC01, Class M1, 1 Month LIBOR + 0.780% (Cap N/A, Floor 0.520%) | | | 2.603 | (c) | | | 02/25/34 | | | | 925 | | | | 925,123 | |
| | | | | | | | | | | | | | | | |
| | | | | | | | | | | | | | | 24,226,315 | |
See Notes to Financial Statements.
| | | | | | | | | | | | | | | | |
| | | | |
| Description | | Interest
Rate | | | Maturity
Date | | | Principal
Amount (000)# | | | Value | |
| | | | |
ASSET-BACKED SECURITIES (Continued) | | | | | | | | | | | | | | | | |
| | | | |
Other 0.1% | | | | | | | | | | | | | | | | |
PNMAC FMSR Issuer Trust,
Series 2018-FT01, Class A, 144A, 1 Month LIBOR + 2.350%
(Cap N/A, Floor 0.000%) | | | 4.173 | %(c) | | | 04/25/23 | | | | 3,200 | | | $ | 3,163,472 | |
| | | | |
Residential Mortgage-Backed Securities 3.2% | | | | | | | | | | | | | | | | |
Chase Funding Trust Series, | | | | | | | | | | | | | | | | |
Series 2002-03, Class 2A1, 1 Month LIBOR + 0.640% (Cap N/A, Floor 0.320%) | | | 2.463 | (c) | | | 08/25/32 | | | | 312 | | | | 307,308 | |
Series 2003-04, Class 1A5 | | | 5.142 | | | | 05/25/33 | | | | 603 | | | | 621,287 | |
Citigroup Mortgage Loan Trust, Inc., | | | | | | | | | | | | | | | | |
Series 2005-OPT01, Class M1, 1 Month LIBOR + 0.630% (Cap N/A, Floor 0.420%) | | | 2.453 | (c) | | | 02/25/35 | | | | 273 | | | | 271,609 | |
Series 2005-WF01, Class A5 | | | 5.010 | (cc) | | | 11/25/34 | | | | 8 | | | | 8,559 | |
Countrywide Asset-Backed Certificates, | | | | | | | | | | | | | | | | |
Series 2003-BC04, Class M1, 1 Month LIBOR + 1.050% (Cap N/A, Floor 0.700%) | | | 2.873 | (c) | | | 07/25/33 | | | | 711 | | | | 711,934 | |
Series 2004-03, Class 1A, 1 Month LIBOR + 0.420% (Cap N/A, Floor 0.210%) | | | 2.243 | (c) | | | 08/25/34 | | | | 7,769 | | | | 7,534,495 | |
Series 2004-BC04, Class M1, 1 Month LIBOR + 1.050% (Cap N/A, Floor 0.700%) | | | 2.873 | (c) | | | 11/25/34 | | | | 450 | | | | 451,217 | |
Credit Suisse Mortgage Trust, | | | | | | | | | | | | | | | | |
Series 2016-RPL01, Class A1, 144A, 1 Month LIBOR + 3.150% (Cap N/A, Floor 3.150%) | | | 5.182 | (c) | | | 12/26/46 | | | | 3,830 | | | | 3,843,139 | |
Series 2018-RPL08, Class A1, 144A | | | 4.125 | (cc) | | | 07/25/58 | | | | 7,685 | | | | 7,756,933 | |
Credit-Based Asset Servicing & Securitization LLC, | | | | | | | | | | | | | | | | |
Series 2003-CB03, Class AF1 | | | 3.379 | | | | 12/25/32 | | | | 117 | | | | 118,629 | |
Series 2003-CB05, Class M1, 1 Month LIBOR + 1.020% (Cap N/A, Floor 0.680%) | | | 2.843 | (c) | | | 11/25/33 | | | | 640 | | | | 636,056 | |
CWABS, Inc., Asset-Backed Certificates,
Series 2004-01, Class M1, 1 Month LIBOR + 0.750%
(Cap N/A, Floor 0.500%) | | | 2.573 | (c) | | | 03/25/34 | | | | 83 | | | | 83,570 | |
Finance America Mortgage Loan Trust,
Series 2003-01, Class M1, 1 Month LIBOR + 1.050%
(Cap N/A, Floor 0.700%) | | | 2.873 | (c) | | | 09/25/33 | | | | 1,665 | | | | 1,646,518 | |
First Franklin Mortgage Loan Trust,
Series 2004-FF05, Class A2, 1 Month LIBOR + 0.760%
(Cap N/A, Floor 0.530%) | | | 2.583 | (c) | | | 08/25/34 | | | | 747 | | | | 746,435 | |
Fremont Home Loan Trust,
Series 2004-04, Class M1, 1 Month LIBOR + 0.795%
(Cap N/A, Floor 0.530%) | | | 2.618 | (c) | | | 03/25/35 | | | | 2,476 | | | | 2,461,824 | |
See Notes to Financial Statements.
| | | | |
| PGIM Absolute Return Bond Fund | | | 23 | |
Schedule of Investments(continued)
as of October 31, 2019
| | | | | | | | | | | | | | | | | | | | |
| | | | |
| Description | | Interest
Rate | | | Maturity
Date | | | Principal
Amount (000)# | | | Value | |
| | | | | |
ASSET-BACKED SECURITIES (Continued) | | | | | | | | | | | | | | | | | | | | |
| | | | | |
Residential Mortgage-Backed Securities (cont’d.) | | | | | | | | | | | | | | | | | | | | |
GSAMP Trust, | | | | | | | | | | | | | | | | | | | | |
Series 2003-HE02, Class A1A, 144A, 1 Month LIBOR + 0.600%
(Cap N/A, Floor 0.300%) | | | 2.423 | %(c) | | | 08/25/33 | | | | | | | | 600 | | | $ | 591,118 | |
Series 2004-AR01, Class A2B, 1 Month LIBOR + 1.200%
(Cap N/A, Floor 0.600%) | | | 3.023 | (c) | | | 06/25/34 | | | | | | | | 1,323 | | | | 1,327,191 | |
Series 2004-NC02, Class A1B, 1 Month LIBOR + 0.900%
(Cap N/A, Floor 0.450%) | | | 2.723 | (c) | | | 10/25/34 | | | | | | | | 1,787 | | | | 1,750,232 | |
JPMorgan Mortgage Acquisition Corp.,
Series 2005-OPT02, Class M1, 1 Month LIBOR + 0.430%
(Cap N/A, Floor 0.430%) | | | 2.253 | (c) | | | 12/25/35 | | | | | | | | 7 | | | | 7,265 | |
Long Beach Mortgage Loan Trust, | | | | | | | | | | | | | | | | | | | | |
Series 2003-04, Class AV1, 1 Month LIBOR + 0.620%
(Cap N/A, Floor 0.310%) | | | 2.443 | (c) | | | 08/25/33 | | | | | | | | 1,351 | | | | 1,363,266 | |
Series 2004-02, Class A1, 1 Month LIBOR + 0.440%
(Cap N/A, Floor 0.220%) | | | 2.263 | (c) | | | 06/25/34 | | | | | | | | 925 | | | | 908,191 | |
Morgan Stanley ABS Capital I, Inc. Trust,
Series 2004-NC05, Class M1, 1 Month LIBOR + 0.900%
(Cap N/A, Floor 0.600%) | | | 2.723 | (c) | | | 05/25/34 | | | | | | | | 232 | | | | 229,596 | |
Park Place Securities, Inc., Asset-Backed Pass-Through Certificates,
Series 2005-WCH01, Class M3, 1 Month LIBOR + 0.840%
(Cap N/A, Floor 0.560%) | | | 2.663 | (c) | | | 01/25/36 | | | | | | | | 234 | | | | 234,154 | |
Specialty Underwriting & Residential Finance Trust, | | | | | | | | | | | | | | | | | | | | |
Series 2003-BC04, Class M1, 1 Month LIBOR + 0.900%
(Cap N/A, Floor 0.600%) | | | 2.723 | (c) | | | 11/25/34 | | | | | | | | 1,088 | | | | 1,076,438 | |
Series 2004-BC02, Class M1, 1 Month LIBOR + 0.825%
(Cap N/A, Floor 0.550%) | | | 2.648 | (c) | | | 05/25/35 | | | | | | | | 1,693 | | | | 1,697,323 | |
Structured Asset Investment Loan Trust, | | | | | | | | | | | | | | | | | | | | |
Series 2004-BNC01, Class A2, 1 Month LIBOR + 1.000%
(Cap N/A, Floor 0.500%) | | | 2.823 | (c) | | | 09/25/34 | | | | | | | | 2,908 | | | | 2,918,895 | |
Series 2005-03, Class M2, 1 Month LIBOR + 0.660%
(Cap N/A, Floor 0.440%) | | | 2.483 | (c) | | | 04/25/35 | | | | | | | | 510 | | | | 510,315 | |
TFS (Spain),
Series 2018-03, Class A1, 1 Month EURIBOR + 2.900% | | | 2.900 | (c) | | | 03/16/23 | | | | EUR | | | | 12,056 | | | | 13,419,391 | |
Towd Point Mortgage Trust, | | | | | | | | | | | | | | | | | | | | |
Series 2017-04, Class A1, 144A | | | 2.750 | (cc) | | | 06/25/57 | | | | | | | | 1,985 | | | | 2,008,346 | |
Series 2018-02, Class A1, 144A | | | 3.250 | (cc) | | | 03/25/58 | | | | | | | | 12,536 | | | | 12,814,833 | |
Series 2018-03, Class A1, 144A | | | 3.750 | (cc) | | | 05/25/58 | | | | | | | | 7,670 | | | | 7,968,981 | |
| | | | | | | | | | | | | | | | | | | | |
| | | | | | | | | | | | | | | | | | | 76,025,048 | |
See Notes to Financial Statements.
| | | | | | | | | | | | | | | | | | | | |
| | | | |
| Description | | Interest
Rate | | | Maturity
Date | | | Principal
Amount (000)# | | | Value | |
| | | | | |
ASSET-BACKED SECURITIES (Continued) | | | | | | | | | | | | | | | | | | | | |
| | | | | |
Student Loans 2.3% | | | | | | | | | | | | | | | | | | | | |
Laurel Road Prime Student Loan Trust, | | | | | | | | | | | | | | | | | | | | |
Series 2018-D, Class A, 144A | | | 0.000 | %(cc) | | | 11/25/43 | | | | | | | | 10,256 | | | $ | 10,656,599 | |
Series 2019-A, Class R, 144A | | | 0.000 | | | | 10/25/48 | | | | | | | | 8,200 | | | | 577,712 | |
SLM Student Loan Trust, | | | | | | | | | | | | | | | | | | | | |
Series 2004-02X, Class A6, 3 Month EURIBOR + 0.550%
(Cap N/A, Floor 0.000%) | | | 0.148 | (c) | | | 07/25/39 | | | | EUR | | | | 7,950 | | | | 8,587,811 | |
Series 2007-02, Class B, 3 Month LIBOR + 0.170%
(Cap N/A, Floor 0.000%) | | | 2.110 | (c) | | | 07/25/25 | | | | | | | | 11,503 | | | | 10,452,208 | |
SoFi Alternative Trust, | | | | | | | | | | | | | | | | | | | | |
Series 2019-B, Class PT, 144A | | | — | (p) | | | 12/15/45 | | | | | | | | 11,176 | | | | 11,572,982 | |
Series 2019-D, Class 1PT, 144A | | | 2.460 | (cc) | | | 01/16/46 | | | | | | | | 12,100 | | | | 12,499,532 | |
| | | | | | | | | | | | | | | | | | | | |
| | | | | | | | | | | | | | | | | | | 54,346,844 | |
| | | | | | | | | | | | | | | | | | | | |
TOTAL ASSET-BACKED SECURITIES
(cost $675,297,511) | | | | | | | | | | | | | | | | | | | 675,281,096 | |
| | | | | | | | | | | | | | | | | | | | |
| | | | | |
BANK LOANS 2.2% | | | | | | | | | | | | | | | | | | | | |
| | | | | |
Chemicals 0.1% | | | | | | | | | | | | | | | | | | | | |
Avantor, Inc. (United Kingdom),
Initial B-2 Euro Term Loan, 1 Month EURIBOR + 3.250% | | | 3.250 | (c) | | | 11/21/24 | | | | EUR | | | | 526 | | | | 593,414 | |
Starfruit Finco BV (Netherlands), | | | | | | | | | | | | | | | | | | | | |
Initial Dollar Term Loan, 1 Month LIBOR + 3.250% | | | 5.190 | (c) | | | 10/01/25 | | | | | | | | 485 | | | | 472,403 | |
Initial Euro Term Loan, 3 Month EURIBOR + 3.750% | | | 3.750 | (c) | | | 10/01/25 | | | | EUR | | | | 1,580 | | | | 1,757,219 | |
| | | | | | | | | | | | | | | | | | | | |
| | | | | | | | | | | | | | | | | | | 2,823,036 | |
| | | | | |
Computers 0.1% | | | | | | | | | | | | | | | | | | | | |
McAfee LLC, | | | | | | | | | | | | | | | | | | | | |
Second Lien Initial Loan, 1 Month LIBOR + 8.500% | | | 10.305 | (c) | | | 09/29/25 | | | | | | | | 1,706 | | | �� | 1,711,937 | |
Term B USD Loan, 1 Month LIBOR + 3.750% | | | 5.555 | (c) | | | 09/30/24 | | | | | | | | 1,171 | | | | 1,169,794 | |
| | | | | | | | | | | | | | | | | | | | |
| | | | | | | | | | | | | | | | | | | 2,881,731 | |
| | | | | |
Foods 0.2% | | | | | | | | | | | | | | | | | | | | |
Sigma Bidco BV (Netherlands),
Facility B-4 Loan, 1 Month GBP LIBOR + 4.000% | | | 4.714 | (c) | | | 07/02/25 | | | | GBP | | | | 3,700 | | | | 4,660,993 | |
| | | | | |
Healthcare-Products 0.1% | | | | | | | | | | | | | | | | | | | | |
Ceva Sante Animale SA (United Kingdom),
Term Loan, 3 Month EURIBOR + 4.750% | | | 4.750 | (c) | | | 04/13/26 | | | | EUR | | | | 2,125 | | | | 2,376,783 | |
See Notes to Financial Statements.
| | | | |
| PGIM Absolute Return Bond Fund | | | 25 | |
Schedule of Investments(continued)
as of October 31, 2019
| | | | | | | | | | | | | | | | | | | | |
| | | | |
| Description | | Interest
Rate | | | Maturity
Date | | | Principal
Amount (000)# | | | Value | |
| | | | | |
BANK LOANS (Continued) | | | | | | | | | | | | | | | | | | | | |
| | | | | |
Household Products/Wares 0.2% | | | | | | | | | | | | | | | | | | | | |
Diamond BC BV,
Initial Euro Term Loan, 1 - 3 Month EURIBOR + 3.250% | | | 3.250 | %(c) | | | 09/06/24 | | | | EUR | | | | 4,226 | | | $ | 4,454,123 | |
| | | | | |
Leisure Time 0.2% | | | | | | | | | | | | | | | | | | | | |
HNVR Holdco Ltd. (United Kingdom),
Facility C, 6 Month EURIBOR + 4.500% | | | 4.500 | (c) | | | 09/12/25 | | | | EUR | | | | 2,525 | | | | 2,816,133 | |
Richmond UK Bidco Ltd. (United Kingdom),
Facility B, 1 Month GBP LIBOR + 4.250% | | | 4.963 | (c) | | | 03/03/24 | | | | GBP | | | | 358 | | | | 447,087 | |
| | | | | | | | | | | | | | | | | | | | |
| | | | | | | | | | | | | | | | | | | 3,263,220 | |
| | | | | |
Pharmaceuticals 0.1% | | | | | | | | | | | | | | | | | | | | |
Nidda Healthcare Holding AG (Germany),
Facility C GBP, 3 Month GBP LIBOR + 4.500% | | | 5.264 | (c) | | | 08/21/24 | | | | GBP | | | | 1,700 | | | | 2,205,766 | |
| | | | | |
Retail 0.9% | | | | | | | | | | | | | | | | | | | | |
BBD Bidco Ltd. (United Kingdom),
Term Loan | | | — | (p) | | | 09/30/26 | | | | | | | | 2,400 | | | | 3,121,794 | |
EG America LLC (United Kingdom),
Second Lien Facility (USD), 3 Month LIBOR + 8.000% | | | 10.104 | (c) | | | 04/20/26 | | | | | | | | 746 | | | | 704,592 | |
EG Finco Ltd. (United Kingdom), | | | | | | | | | | | | | | | | | | | | |
Second Lien Term Loan, 1 - 3 Month EURIBOR + 7.750%^ | | | 8.750 | (c) | | | 04/20/26 | | | | EUR | | | | 421 | | | | 464,890 | |
Term B, 3 Month GBP LIBOR + 4.750% | | | 5.508 | (c) | | | 02/06/25 | | | | GBP | | | | 1,108 | | | | 1,373,806 | |
Term B-1, 3 Month EURIBOR + 4.000% | | | 4.000 | (c) | | | 02/07/25 | | | | EUR | | | | 2,442 | | | | 2,627,156 | |
Stonegate Pub Co. Ltd.,
Term Loan^ | | | — | (p) | | | 10/31/27 | | | | GBP | | | | 10,900 | | | | 13,836,929 | |
| | | | | | | | | | | | | | | | | | | | |
| | | | | | | | | | | | | | | | | | | 22,129,167 | |
| | | | | |
Telecommunications 0.3% | | | | | | | | | | | | | | | | | | | | |
Sprint Communications, Inc.,
Initial Term Loan, 1 Month LIBOR + 2.500% | | | 4.313 | (c) | | | 02/02/24 | | | | | | | | 3,940 | | | | 3,891,794 | |
West Corp.,
Initial Term B Loan, 1 - 3 Month LIBOR + 4.000% | | | 5.857 | (c) | | | 10/10/24 | | | | | | | | 2,743 | | | | 2,283,565 | |
| | | | | | | | | | | | | | | | | | | | |
| | | | | | | | | | | | | | | | | | | 6,175,359 | |
| | | | | | | | | | | | | | | | | | | | |
TOTAL BANK LOANS
(cost $51,533,702) | | | | | | | | | | | | | | | | | | | 50,970,178 | |
| | | | | | | | | | | | | | | | | | | | |
See Notes to Financial Statements.
| | | | | | | | | | | | | | | | |
| | | | |
| Description | | Interest
Rate | | | Maturity
Date | | | Principal
Amount (000)# | | | Value | |
| | | | |
COMMERCIAL MORTGAGE-BACKED SECURITIES 8.4% | | | | | | | | | | | | | | | | |
20 Times Square Trust, | | | | | | | | | | | | | | | | |
Series 2018-20TS, Class G, 144A | | | 3.100 | %(cc) | | | 05/15/35 | | | | 2,700 | | | $ | 2,618,087 | |
Series 2018-20TS, Class H, 144A | | | 3.100 | (cc) | | | 05/15/35 | | | | 2,700 | | | | 2,571,209 | |
BBCMS Mortgage Trust,
Series 2018-TALL, Class D, 144A, 1 Month LIBOR + 1.449% (Cap N/A, Floor 1.449%) | | | 3.362 | (c) | | | 03/15/37 | | | | 11,875 | | | | 11,867,596 | |
BX Commercial Mortgage Trust, | | | | | | | | | | | | | | | | |
Series 2018-IND, Class G, 144A, 1 Month LIBOR + 2.050% (Cap N/A, Floor 2.050%) | | | 3.964 | (c) | | | 11/15/35 | | | | 2,929 | | | | 2,941,943 | |
Series 2019-XL, Class J, 144A, 1 Month LIBOR + 2.650% (Cap N/A, Floor 2.650%) | | | 4.650 | (c) | | | 10/15/36 | | | | 14,650 | | | | 14,677,634 | |
COMM Mortgage Trust, | | | | | | | | | | | | | | | | |
Series 2012-CR01, Class XA, IO | | | 1.858 | (cc) | | | 05/15/45 | | | | 11,016 | | | | 428,954 | |
Series 2015-LC19, Class XB, IO, 144A | | | 0.262 | (cc) | | | 02/10/48 | | | | 123,049 | | | | 1,622,586 | |
Credit Suisse Mortgage Capital Certificates,
Series 2019-ICE04, Class F, 144A, 1 Month LIBOR + 2.650% (Cap N/A, Floor 2.650%) | | | 4.564 | (c) | | | 05/15/36 | | | | 15,000 | | | | 15,075,263 | |
Credit Suisse Mortgage Trust, | | | | | | | | | | | | | | | | |
Series 2017-LSTK, Class D, 144A | | | 3.331 | (cc) | | | 04/05/33 | | | | 6,850 | | | | 6,849,034 | |
Series 2017-LSTK, Class E, 144A | | | 3.331 | (cc) | | | 04/05/33 | | | | 12,575 | | | | 12,512,873 | |
CSAIL Commercial Mortgage Trust,
Series 2018-CX11, Class A3 | | | 4.095 | | | | 04/15/51 | | | | 9,000 | | | | 9,743,714 | |
DBGS Mortgage Trust, | | | | | | | | | | | | | | | | |
Series 2018-BIOD, Class E, 144A, 1 Month LIBOR + 1.700% (Cap N/A, Floor 1.700%) | | | 3.614 | (c) | | | 05/15/35 | | | | 3,365 | | | | 3,377,431 | |
Series 2018-BIOD, Class F, 144A, 1 Month LIBOR + 2.000% (Cap N/A, Floor 2.000%) | | | 3.914 | (c) | | | 05/15/35 | | | | 12,994 | | | | 13,056,389 | |
DBWF Mortgage Trust,
Series 2016-85T, Class E, 144A | | | 3.808 | (cc) | | | 12/10/36 | | | | 15,500 | | | | 15,499,003 | |
FHLMC Multifamily Structured Pass-Through Certificates, | | | | | | | | | | | | | | | | |
Series K007, Class X1, IO | | | 1.030 | (cc) | | | 04/25/20 | | | | 3,081 | | | | 5,375 | |
Series K008, Class X1, IO | | | 1.480 | (cc) | | | 06/25/20 | | | | 17,229 | | | | 94,328 | |
Series K010, Class X1, IO | | | 0.129 | (cc) | | | 10/25/20 | | | | 17,401 | | | | 19,646 | |
Series K018, Class X1, IO | | | 1.306 | (cc) | | | 01/25/22 | | | | 14,587 | | | | 325,444 | |
Series K020, Class X1, IO | | | 1.393 | (cc) | | | 05/25/22 | | | | 19,344 | | | | 578,134 | |
Series K021, Class X1, IO | | | 1.428 | (cc) | | | 06/25/22 | | | | 3,986 | | | | 128,283 | |
Series K025, Class X1, IO | | | 0.823 | (cc) | | | 10/25/22 | | | | 87,200 | | | | 1,873,522 | |
Series K055, Class X1, IO | | | 1.365 | (cc) | | | 03/25/26 | | | | 22,918 | | | | 1,699,063 | |
Series K066, Class X1, IO | | | 0.752 | (cc) | | | 06/25/27 | | | | 235,124 | | | | 11,720,580 | |
Series KC02, Class X1, IO | | | 0.374 | (cc) | | | 03/25/24 | | | | 142,181 | | | | 2,240,103 | |
GS Mortgage Securities Corp.,
Series 2013-GC10, Class XB, IO, 144A | | | 0.482 | (cc) | | | 02/10/46 | | | | 103,126 | | | | 1,626,689 | |
See Notes to Financial Statements.
| | | | |
| PGIM Absolute Return Bond Fund | | | 27 | |
Schedule of Investments(continued)
as of October 31, 2019
| | | | | | | | | | | | | | | | | | | | |
| | | | |
| Description | | Interest
Rate | | | Maturity
Date | | | Principal Amount (000)# | | | Value | |
| | | |
COMMERCIAL MORTGAGE-BACKED SECURITIES (Continued) | | | | | | | | | | | | | |
GS Mortgage Securities Trust,
Series 2014-GC20, Class XB, IO | | | 0.436 | %(cc) | | | 04/10/47 | | | | | | | | 28,307 | | | $ | 526,929 | |
Independence Plaza Trust,
Series 2018-INDP, Class E, 144A | | | 4.996 | | | | 07/10/35 | | | | | | | | 5,200 | | | | 5,529,804 | |
JPMBB Commercial Mortgage Securities Trust, | | | | | | | | | | | | | | | | | | | | |
Series 2014-C21, Class XB, IO | | | 0.317 | (cc) | | | 08/15/47 | | | | | | | | 45,056 | | | | 712,583 | |
Series 2015-C27, Class XB, IO | | | 0.444 | (cc) | | | 02/15/48 | | | | | | | | 52,766 | | | | 1,086,763 | |
JPMorgan Chase Commercial Mortgage Securities Corp.,
Series 2018-AON, Class E, 144A | | | 4.613 | (cc) | | | 07/05/31 | | | | | | | | 25,950 | | | | 27,223,089 | |
JPMorgan Chase Commercial Mortgage Securities Trust,
Series 2013-LC11, Class XB, IO | | | 0.512 | (cc) | | | 04/15/46 | | | | | | | | 34,956 | | | | 618,736 | |
Morgan Stanley Bank of America Merrill Lynch Trust, | | | | | | | | | | | | | | | | | | | | |
Series 2012-C05, Class XB, IO, 144A | | | 0.235 | (cc) | | | 08/15/45 | | | | | | | | 65,968 | | | | 473,980 | |
Series 2013-C08, Class XB, IO, 144A | | | 0.497 | (cc) | | | 12/15/48 | | | | | | | | 68,276 | | | | 923,296 | |
Salus European Loan Conduit DAC (United Kingdom),
Series 33A, Class A, 144A, 3 Month GBP LIBOR + 1.500%
(Cap 5.000%, Floor 0.000%) | | | 2.279 | (c) | | | 01/23/29 | | | | GBP | | | | 9,500 | | | | 12,347,665 | |
UBS-Barclays Commercial Mortgage Trust,
Series 2013-C06, Class XB, IO, 144A | | | 0.379 | (cc) | | | 04/10/46 | | | | | | | | 140,883 | | | | 1,826,210 | |
Wells Fargo Commercial Mortgage Trust, | | | | | | | | | | | | | | | | | | | | |
Series 2017-C39, Class A4 | | | 3.157 | | | | 09/15/50 | | | | | | | | 10,000 | | | | 10,518,723 | |
Series 2017-C40, Class A3 | | | 3.317 | | | | 10/15/50 | | | | | | | | 3,380 | | | | 3,591,650 | |
| | | | | | | | | | | | | | | | | | | | |
TOTAL COMMERCIAL MORTGAGE-BACKED SECURITIES
(cost $193,054,179) | | | | | | | | | | | | | | | | | | | 198,532,311 | |
| | | | | | | | | | | | | | | | | | | | |
| | | | | |
CORPORATE BONDS 34.1% | | | | | | | | | | | | | | | | | | | | |
| | | | | |
Advertising 0.2% | | | | | | | | | | | | | | | | | | | | |
National CineMedia LLC, | | | | | | | | | | | | | | | | | | | | |
Sr. Sec’d. Notes | | | 6.000 | | | | 04/15/22 | | | | | | | | 775 | | | | 782,828 | |
Sr. Unsec’d. Notes | | | 5.750 | | | | 08/15/26 | | | | | | | | 2,925 | | | | 2,859,187 | |
| | | | | | | | | | | | | | | | | | | | |
| | | | | | | | | | | | | | | | | | | 3,642,015 | |
| | | | | |
Aerospace & Defense 0.7% | | | | | | | | | | | | | | | | | | | | |
Bombardier, Inc. (Canada), | | | | | | | | | | | | | | | | | | | | |
Sr. Unsec’d. Notes, 144A | | | 7.500 | | | | 12/01/24 | | | | | | | | 9,325 | | | | 9,039,422 | |
Sr. Unsec’d. Notes, 144A | | | 7.875 | | | | 04/15/27 | | | | | | | | 6,750 | | | | 6,378,750 | |
| | | | | | | | | | | | | | | | | | | | |
| | | | | | | | | | | | | | | | | | | 15,418,172 | |
| | | | | |
Agriculture 0.0% | | | | | | | | | | | | | | | | | | | | |
Vector Group Ltd., | | | | | | | | | | | | | | | | | | | | |
Sr. Sec’d. Notes, 144A | | | 6.125 | | | | 02/01/25 | | | | | | | | 529 | | | | 507,840 | |
See Notes to Financial Statements.
| | | | | | | | | | | | | | | | | | | | |
| | | | |
| Description | | Interest
Rate | | | Maturity
Date | | | Principal
Amount (000)# | | | Value | |
| | | | | |
CORPORATE BONDS (Continued) | | | | | | | | | | | | | | | | | | | | |
| | | | | |
Airlines 0.2% | | | | | | | | | | | | | | | | | | | | |
American Airlines 2013-1 Class A Pass-Through Trust,
Pass-Through Certificates(a) | | | 4.000 | % | | | 01/15/27 | | | | | | | | 2,091 | | | $ | 2,214,047 | |
Continental Airlines 2007-1 Class A Pass-Through Trust,
Pass-Through Certificates | | | 5.983 | | | | 10/19/23 | | | | | | | | 790 | | | | 836,758 | |
Continental Airlines 2012-2 Class A Pass-Through Trust,
Pass-Through Certificates | | | 4.000 | | | | 04/29/26 | | | | | | | | 87 | | | | 92,495 | |
Delta Air Lines 2007-1 Class A Pass-Through Trust,
Pass-Through Certificates | | | 6.821 | | | | 02/10/24 | | | | | | | | 593 | | | | 650,068 | |
United Airlines 2013-1 Class A, Pass-Through Trust,
Pass-Through Certificates | | | 4.300 | | | | 02/15/27 | | | | | | | | 1,844 | | | | 1,988,156 | |
| | | | | | | | | | | | | | | | | | | | |
| | | | | | | | | | | | | | | | | | | 5,781,524 | |
| | | | | |
Apparel 0.1% | | | | | | | | | | | | | | | | | | | | |
PVH Corp.,
Sr. Unsec’d. Notes, 144A | | | 3.125 | | | | 12/15/27 | | | | EUR | | | | 2,175 | | | | 2,696,040 | |
| | | | | |
Auto Manufacturers 0.6% | | | | | | | | | | | | | | | | | | | | |
BMW US Capital LLC (Germany),
Gtd. Notes, 144A, 3 Month LIBOR + 0.410% | | | 2.411 | (c) | | | 04/12/21 | | | | | | | | 820 | | | | 821,271 | |
Ford Motor Credit Co. LLC,
Sr. Unsec’d. Notes | | | 3.350 | | | | 11/01/22 | | | | | | | | 5,685 | | | | 5,702,381 | |
General Motors Co.,
Sr. Unsec’d. Notes | | | 6.250 | | | | 10/02/43 | | | | | | | | 1,555 | | | | 1,720,288 | |
Volkswagen Group of America Finance LLC (Germany), | | | | | | | | | | | | | | | | | | | | |
Gtd. Notes, 144A | | | 3.875 | | | | 11/13/20 | | | | | | | | 2,150 | | | | 2,189,029 | |
Gtd. Notes, 144A | | | 4.000 | | | | 11/12/21 | | | | | | | | 2,810 | | | | 2,912,304 | |
| | | | | | | | | | | | | | | | | | | | |
| | | | | | | | | | | | | | | | | | | 13,345,273 | |
| | | | | |
Auto Parts & Equipment 0.9% | | | | | | | | | | | | | | | | | | | | |
Adient Global Holdings Ltd.,
Gtd. Notes, 144A | | | 4.875 | | | | 08/15/26 | | | | | | | | 2,700 | | | | 2,119,500 | |
Adient US LLC,
Sr. Sec’d. Notes, 144A(a) | | | 7.000 | | | | 05/15/26 | | | | | | | | 1,400 | | | | 1,473,500 | |
American Axle & Manufacturing, Inc., | | | | | | | | | | | | | | | | | | | | |
Gtd. Notes(a) | | | 6.250 | | | | 03/15/26 | | | | | | | | 3,200 | | | | 3,040,000 | |
Gtd. Notes(a) | | | 6.500 | | | | 04/01/27 | | | | | | | | 2,650 | | | | 2,510,875 | |
Cooper-Standard Automotive, Inc.,
Gtd. Notes, 144A(a) | | | 5.625 | | | | 11/15/26 | | | | | | | | 3,525 | | | | 2,996,250 | |
See Notes to Financial Statements.
| | | | |
| PGIM Absolute Return Bond Fund | | | 29 | |
Schedule of Investments(continued)
as of October 31, 2019
| | | | | | | | | | | | | | | | | | | | |
| | | | |
| Description | | Interest
Rate | | | Maturity
Date | | | Principal
Amount (000)# | | | Value | |
| | | | | |
CORPORATE BONDS (Continued) | | | | | | | | | | | | | | | | | | | | |
| | | | | |
Auto Parts & Equipment (cont’d.) | | | | | | | | | | | | | | | | | | | | |
Lear Corp.,
Sr. Unsec’d. Notes | | | 5.250 | % | | | 01/15/25 | | | | | | | | 5,375 | | | $ | 5,542,271 | |
Nemak SAB de CV (Mexico),
Sr. Unsec’d. Notes(a) | | | 4.750 | | | | 01/23/25 | | | | | | | | 2,800 | | | | 2,891,000 | |
| | | | | | | | | | | | | | | | | | | | |
| | | | | | | | | | | | | | | | | | | 20,573,396 | |
| | | | | |
Banks 4.9% | | | | | | | | | | | | | | | | | | | | |
Banco do Brasil SA (Brazil),
Gtd. Notes | | | 3.875 | | | | 10/10/22 | | | | | | | | 3,000 | | | | 3,066,750 | |
Banco Nacional de Costa Rica (Costa Rica),
Sr. Unsec’d. Notes, 144A | | | 5.875 | | | | 04/25/21 | | | | | | | | 750 | | | | 757,500 | |
Bank of America Corp., | | | | | | | | | | | | | | | | | | | | |
Jr. Sub. Notes, Series AA | | | 6.100 | (ff) | | | — | (rr) | | | | | | | 8,820 | | | | 9,761,844 | |
Sr. Unsec’d. Notes, GMTN | | | 3.593 | (ff) | | | 07/21/28 | | | | | | | | 1,555 | | | | 1,648,522 | |
Sr. Unsec’d. Notes, MTN | | | 3.824 | (ff) | | | 01/20/28 | | | | | | | | 1,905 | | | | 2,051,453 | |
Sr. Unsec’d. Notes, MTN(a) | | | 4.271 | (ff) | | | 07/23/29 | | | | | | | | 1,450 | | | | 1,611,120 | |
Banque Centrale de Tunisie International Bond (Tunisia), | | | | | | | | | | | | | | | | | | | | |
Sr. Unsec’d. Notes | | | 6.750 | | | | 10/31/23 | | | | EUR | | | | 950 | | | | 1,067,905 | |
Sr. Unsec’d. Notes, 144A | | | 6.375 | | | | 07/15/26 | | | | EUR | | | | 2,755 | | | | 2,996,757 | |
Citigroup, Inc., | | | | | | | | | | | | | | | | | | | | |
Jr. Sub. Notes, Series Q | | | 5.950 | (ff) | | | — | (rr) | | | | | | | 12,685 | | | | 12,964,070 | |
Sr. Unsec’d. Notes | | | 3.200 | | | | 10/21/26 | | | | | | | | 1,145 | | | | 1,189,586 | |
Sr. Unsec’d. Notes | | | 3.887 | (ff) | | | 01/10/28 | | | | | | | | 980 | | | | 1,054,777 | |
Sr. Unsec’d. Notes | | | 8.125 | | | | 07/15/39 | | | | | | | | 620 | | | | 1,017,940 | |
Sub. Notes | | | 4.400 | | | | 06/10/25 | | | | | | | | 405 | | | | 439,067 | |
Sub. Notes | | | 4.750 | | | | 05/18/46 | | | | | | | | 395 | | | | 465,807 | |
Credit Suisse AG (Switzerland),
Sr. Unsec’d. Notes, MTN | | | 3.625 | | | | 09/09/24 | | | | | | | | 2,375 | | | | 2,525,637 | |
Credit Suisse Group Funding Guernsey Ltd. (Switzerland),
Gtd. Notes | | | 3.750 | | | | 03/26/25 | | | | | | | | 1,200 | | | | 1,266,473 | |
Danske Bank A/S (Denmark),
Sr. Unsec’d. Notes, 144A(a) | | | 3.001 | (ff) | | | 09/20/22 | | | | | | | | 5,460 | | | | 5,511,741 | |
Development Bank of the Republic of Belarus JSC (Belarus),
Sr. Unsec’d. Notes, 144A | | | 6.750 | | | | 05/02/24 | | | | | | | | 5,495 | | | | 5,766,343 | |
Discover Bank, | | | | | | | | | | | | | | | | | | | | |
Sr. Unsec’d. Notes | | | 4.200 | | | | 08/08/23 | | | | | | | | 5,500 | | | | 5,871,276 | |
Sub. Notes(a) | | | 7.000 | | | | 04/15/20 | | | | | | | | 800 | | | | 816,976 | |
See Notes to Financial Statements.
| | | | | | | | | | | | | | | | |
| | | | |
| Description | | Interest
Rate | | | Maturity
Date | | | Principal
Amount (000)# | | | Value | |
| | | | |
CORPORATE BONDS (Continued) | | | | | | | | | | | | | | | | |
| | | | |
Banks (cont’d.) | | | | | | | | | | | | | | | | |
Goldman Sachs Group, Inc. (The), | | | | | | | | | | | | | | | | |
Jr. Sub. Notes, Series M | | | 5.375 | %(ff) | | | — | (rr) | | | 5,225 | | | $ | 5,301,128 | |
Sr. Unsec’d. Notes | | | 3.814 | (ff) | | | 04/23/29 | | | | 1,595 | | | | 1,694,335 | |
Sr. Unsec’d. Notes(h) | | | 3.850 | | | | 01/26/27 | | | | 3,940 | | | | 4,199,101 | |
Sr. Unsec’d. Notes | | | 4.223 | (ff) | | | 05/01/29 | | | | 170 | | | | 186,005 | |
JPMorgan Chase & Co., | | | | | | | | | | | | | | | | |
Jr. Sub. Notes, Series I, 3 Month LIBOR + 3.470% | | | 5.406 | (c) | | | — | (rr) | | | 64 | | | | 64,384 | |
Jr. Sub. Notes, Series Q | | | 5.150 | (ff) | | | — | (rr) | | | 3,725 | | | | 3,860,031 | |
Jr. Sub. Notes, Series R | | | 6.000 | (ff) | | | — | (rr) | | | 7,707 | | | | 8,272,077 | |
Jr. Sub. Notes, Series X | | | 6.100 | (ff) | | | — | (rr) | | | 3,400 | | | | 3,732,588 | |
Morgan Stanley, | | | | | | | | | | | | | | | | |
Jr. Sub. Notes, Series H, 3 Month LIBOR + 3.610% | | | 5.611 | (c) | | | — | (rr) | | | 13,110 | | | | 13,188,660 | |
Sr. Unsec’d. Notes(a) | | | 4.375 | | | | 01/22/47 | | | | 1,260 | | | | 1,495,794 | |
Sr. Unsec’d. Notes, GMTN | | | 3.772 | (ff) | | | 01/24/29 | | | | 1,750 | | | | 1,872,744 | |
Sr. Unsec’d. Notes, GMTN(a) | | | 3.875 | | | | 01/27/26 | | | | 605 | | | | 653,035 | |
Sr. Unsec’d. Notes, GMTN | | | 4.431 | (ff) | | | 01/23/30 | | | | 2,135 | | | | 2,396,525 | |
Sr. Unsec’d. Notes, MTN | | | 3.591 | (ff) | | | 07/22/28 | | | | 1,125 | | | | 1,189,120 | |
Sub. Notes, MTN(a) | | | 4.100 | | | | 05/22/23 | | | | 1,710 | | | | 1,812,063 | |
People’s United Bank NA,
Sub. Notes | | | 4.000 | | | | 07/15/24 | | | | 325 | | | | 340,082 | |
State Street Corp.,
Jr. Sub. Notes, Series F | | | 5.250 | (ff) | | | — | (rr) | | | 2,555 | | | | 2,617,700 | |
Turkiye Garanti Bankasi AS (Turkey),
Sr. Unsec’d. Notes, 144A | | | 5.875 | | | | 03/16/23 | | | | 2,435 | | | | 2,469,075 | |
| | | | | | | | | | | | | | | | |
| | | | | | | | | | | | | | | 117,195,991 | |
| | | | |
Beverages 0.0% | | | | | | | | | | | | | | | | |
Anheuser-Busch InBev Worldwide, Inc. (Belgium),
Gtd. Notes | | | 8.200 | | | | 01/15/39 | | | | 250 | | | | 398,254 | |
| | | | |
Biotechnology 0.1% | | | | | | | | | | | | | | | | |
Celgene Corp.,
Sr. Unsec’d. Notes | | | 4.350 | | | | 11/15/47 | | | | 2,100 | | | | 2,450,340 | |
| | | | |
Building Materials 0.3% | | | | | | | | | | | | | | | | |
Griffon Corp.,
Gtd. Notes | | | 5.250 | | | | 03/01/22 | | | | 1,975 | | | | 1,984,875 | |
U.S. Concrete, Inc.,
Gtd. Notes(a) | | | 6.375 | | | | 06/01/24 | | | | 4,725 | | | | 4,918,347 | |
| | | | | | | | | | | | | | | | |
| | | | | | | | | | | | | | | 6,903,222 | |
See Notes to Financial Statements.
| | | | |
| PGIM Absolute Return Bond Fund | | | 31 | |
Schedule of Investments(continued)
as of October 31, 2019
| | | | | | | | | | | | | | | | | | | | |
| | | | |
| Description | | Interest
Rate | | | Maturity
Date | | | Principal
Amount (000)# | | | Value | |
| | | | | |
CORPORATE BONDS (Continued) | | | | | | | | | | | | | | | | | | | | |
| | | | | |
Chemicals 2.1% | | | | | | | | | | | | | | | | | | | | |
Ashland LLC,
Gtd. Notes | | | 6.875 | % | | | 05/15/43 | | | | | | | | 4,100 | | | $ | 4,674,000 | |
Braskem Netherlands Finance BV (Brazil),
Gtd. Notes, 144A | | | 5.875 | | | | 01/31/50 | | | | | | | | 2,300 | | | | 2,287,350 | |
CF Industries, Inc., | | | | | | | | | | | | | | | | | | | | |
Gtd. Notes(a) | | | 4.950 | | | | 06/01/43 | | | | | | | | 1,765 | | | | 1,767,206 | |
Gtd. Notes | | | 5.375 | | | | 03/15/44 | | | | | | | | 1,300 | | | | 1,332,500 | |
Gtd. Notes | | | 7.125 | | | | 05/01/20 | | | | | | | | 59 | | | | 60,417 | |
Chemours Co. (The),
Gtd. Notes | | | 4.000 | | | | 05/15/26 | | | | EUR | | | | 1,500 | | | | 1,506,575 | |
CNAC HK Finbridge Co. Ltd. (China),
Gtd. Notes | | | 3.500 | | | | 07/19/22 | | | | | | | | 3,525 | | | | 3,579,046 | |
Eurochem Finance DAC (Switzerland),
Gtd. Notes, 144A | | | 5.500 | | | | 03/13/24 | | | | | | | | 5,980 | | | | 6,428,500 | |
Hexion, Inc.,
Gtd. Notes, 144A(a) | | | 7.875 | | | | 07/15/27 | | | | | | | | 1,575 | | | | 1,515,938 | |
LYB International Finance BV, | | | | | | | | | | | | | | | | | | | | |
Gtd. Notes | | | 4.875 | | | | 03/15/44 | | | | | | | | 165 | | | | 181,978 | |
Gtd. Notes | | | 5.250 | | | | 07/15/43 | | | | | | | | 10 | | | | 11,457 | |
Monitchem HoldCo 2 SA (Luxembourg),
Gtd. Notes, 144A | | | 9.500 | | | | 09/15/26 | | | | EUR | | | | 1,000 | | | | 1,104,147 | |
NOVA Chemicals Corp. (Canada),
Sr. Unsec’d. Notes, 144A | | | 5.250 | | | | 06/01/27 | | | | | | | | 4,625 | | | | 4,752,188 | |
Nutrien Ltd. (Canada), | | | | | | | | | | | | | | | | | | | | |
Sr. Unsec’d. Notes | | | 4.900 | | | | 06/01/43 | | | | | | | | 1,350 | | | | 1,503,877 | |
Sr. Unsec’d. Notes | | | 6.125 | | | | 01/15/41 | | | | | | | | 170 | | | | 211,064 | |
OCI NV (Netherlands),
Sr. Sec’d. Notes | | | 5.000 | | | | 04/15/23 | | | | EUR | | | | 700 | | | | 813,110 | |
Orbia Advance Corp. SAB de CV (Mexico),
Gtd. Notes, 144A | | | 5.500 | | | | 01/15/48 | | | | | | | | 480 | | | | 486,720 | |
Sasol Financing International Ltd. (South Africa),
Gtd. Notes | | | 4.500 | | | | 11/14/22 | | | | | | | | 5,885 | | | | 6,061,550 | |
Sherwin-Williams Co. (The),
Sr. Unsec’d. Notes(a) | | | 3.450 | | | | 08/01/25 | | | | | | | | 635 | | | | 671,319 | |
Starfruit Finco BV/Starfruit US Holdco LLC (Netherlands),
Sr. Unsec’d. Notes(a) | | | 6.500 | | | | 10/01/26 | | | | EUR | | | | 7,650 | | | | 8,606,700 | |
TPC Group, Inc.,
Sr. Sec’d. Notes, 144A | | | 10.500 | | | | 08/01/24 | | | | | | | | 1,700 | | | | 1,802,000 | |
| | | | | | | | | | | | | | | | | | | | |
| | | | | | | | | | | | | | | | | | | 49,357,642 | |
See Notes to Financial Statements.
| | | | | | | | | | | | | | | | | | | | |
| | | | |
| Description | | Interest
Rate | | | Maturity
Date | | | Principal Amount (000)# | | | Value | |
| | | | | |
CORPORATE BONDS (Continued) | | | | | | | | | | | | | | | | | | | | |
| | | | | |
Commercial Services 2.0% | | | | | | | | | | | | | | | | | | | | |
ERAC USA Finance LLC, | | | | | | | | | | | | | | | | | | | | |
Gtd. Notes, 144A | | | 6.700 | % | | | 06/01/34 | | | | | | | | 110 | | | $ | 149,590 | |
Gtd. Notes, 144A | | | 7.000 | | | | 10/15/37 | | | | | | | | 1,725 | | | | 2,444,922 | |
Laureate Education, Inc.,
Gtd. Notes, 144A | | | 8.250 | | | | 05/01/25 | | | | | | | | 6,350 | | | | 6,889,750 | |
Loxam SAS (France), | | | | | | | | | | | | | | | | | | | | |
Sr. Sec’d. Notes, 144A | | | 2.875 | | | | 04/15/26 | | | | EUR | | | | 1,400 | | | | 1,530,192 | |
Sr. Sub. Notes(a) | | | 5.750 | | | | 07/15/27 | | | | EUR | | | | 5,000 | | | | 5,378,534 | |
Sr. Sub. Notes, 144A | | | 4.500 | | | | 04/15/27 | | | | EUR | | | | 1,500 | | | | 1,543,296 | |
Nielsen Co. Luxembourg SARL (The),
Gtd. Notes, 144A(a) | | | 5.500 | | | | 10/01/21 | | | | | | | | 1,675 | | | | 1,679,187 | |
Refinitiv US Holdings, Inc., | | | | | | | | | | | | | | | | | | | | |
Sr. Sec’d. Notes | | | 4.500 | | | | 05/15/26 | | | | EUR | | | | 3,500 | | | | 4,226,569 | |
Sr. Unsec’d. Notes | | | 6.875 | | | | 11/15/26 | | | | EUR | | | | 7,700 | | | | 9,707,506 | |
Techem Verwaltungsgesellschaft 674 mbH (Germany),
Sr. Sec’d. Notes | | | 6.000 | | | | 07/30/26 | | | | EUR | | | | 2,843 | | | | 3,439,682 | |
United Rentals North America, Inc., | | | | | | | | | | | | | | | | | | | | |
Gtd. Notes | | | 4.625 | | | | 10/15/25 | | | | | | | | 2,450 | | | | 2,502,062 | |
Gtd. Notes(a) | | | 4.875 | | | | 01/15/28 | | | | | | | | 5,979 | | | | 6,173,317 | |
Gtd. Notes(a) | | | 5.250 | | | | 01/15/30 | | | | | | | | 1,050 | | | | 1,103,813 | |
Gtd. Notes(a) | | | 5.500 | | | | 05/15/27 | | | | | | | | 1,600 | | | | 1,687,000 | |
| | | | | | | | | | | | | | | | | | | | |
| | | | | | | | | | | | | | | | | | | 48,455,420 | |
| | | | | |
Computers 0.2% | | | | | | | | | | | | | | | | | | | | |
Everi Payments, Inc.,
Gtd. Notes, 144A | | | 7.500 | | | | 12/15/25 | | | | | | | | 3,575 | | | | 3,767,156 | |
| | | | | |
Diversified Financial Services 0.4% | | | | | | | | | | | | | | | | | | | | |
Avolon Holdings Funding Ltd. (Ireland),
Gtd. Notes, 144A(a) | | | 5.500 | | | | 01/15/23 | | | | | | | | 2,000 | | | | 2,158,200 | |
Jefferies Group LLC,
Sr. Unsec’d. Notes | | | 6.500 | | | | 01/20/43 | | | | | | | | 175 | | | | 206,170 | |
Nationstar Mortgage Holdings, Inc., | | | | | | | | | | | | | | | | | | | | |
Gtd. Notes, 144A(a) | | | 8.125 | | | | 07/15/23 | | | | | | | | 2,450 | | | | 2,597,000 | |
Gtd. Notes, 144A | | | 9.125 | | | | 07/15/26 | | | | | | | | 3,700 | | | | 4,051,500 | |
| | | | | | | | | | | | | | | | | | | | |
| | | | | | | | | | | | | | | | | | | 9,012,870 | |
| | | | | |
Electric 1.6% | | | | | | | | | | | | | | | | | | | | |
AES Panama SRL (Panama),
Sr. Unsec’d. Notes, 144A | | | 6.000 | | | | 06/25/22 | | | | | | | | 3,015 | | | | 3,103,973 | |
See Notes to Financial Statements.
| | | | |
| PGIM Absolute Return Bond Fund | | | 33 | |
Schedule of Investments(continued)
as of October 31, 2019
| | | | | | | | | | | | | | | | | | | | |
| | | | |
| Description | | Interest
Rate | | | Maturity
Date | | | Principal
Amount (000)# | | | Value | |
| | | | | |
CORPORATE BONDS (Continued) | | | | | | | | | | | | | | | | | | | | |
| | | | | |
Electric (cont’d.) | | | | | | | | | | | | | | | | | | | | |
Calpine Corp.,
Sr. Unsec’d. Notes(a) | | | 5.750 | % | | | 01/15/25 | | | | | | | | 10,700 | | | $ | 10,967,500 | |
Duke Energy Carolinas LLC,
First Mortgage | | | 4.000 | | | | 09/30/42 | | | | | | | | 50 | | | | 55,691 | |
Eskom Holdings SOC Ltd. (South Africa), | | | | | | | | | | | | | | | | | | | | |
Gov’t. Gtd. Notes, 144A, MTN | | | 6.350 | | | | 08/10/28 | | | | | | | | 1,225 | | | | 1,295,754 | |
Sr. Unsec’d. Notes | | | 5.750 | | | | 01/26/21 | | | | | | | | 5,755 | | | | 5,792,177 | |
Sr. Unsec’d. Notes, 144A | | | 5.750 | | | | 01/26/21 | | | | | | | | 2,900 | | | | 2,918,734 | |
Sr. Unsec’d. Notes, 144A | | | 7.125 | | | | 02/11/25 | | | | | | | | 5,635 | | | | 5,791,991 | |
Sr. Unsec’d. Notes, 144A, MTN | | | 6.750 | | | | 08/06/23 | | | | | | | | 200 | | | | 205,164 | |
FirstEnergy Transmission LLC,
Sr. Unsec’d. Notes, 144A | | | 5.450 | | | | 07/15/44 | | | | | | | | 800 | | | | 1,016,212 | |
Mong Duong Finance Holdings BV (Vietnam),
Sr. Sec’d. Notes | | | 5.125 | | | | 05/07/29 | | | | | | | | 2,150 | | | | 2,186,540 | |
NextEra Energy Capital Holdings, Inc.,
Gtd. Notes | | | 3.625 | | | | 06/15/23 | | | | | | | | 1,575 | | | | 1,646,490 | |
NRG Energy, Inc., | | | | | | | | | | | | | | | | | | | | |
Gtd. Notes | | | 6.625 | | | | 01/15/27 | | | | | | | | 175 | | | | 189,656 | |
Gtd. Notes, 144A(a) | | | 5.250 | | | | 06/15/29 | | | | | | | | 950 | | | | 1,018,875 | |
Vistra Operations Co. LLC,
Gtd. Notes, 144A | | | 5.000 | | | | 07/31/27 | | | | | | | | 1,570 | | | | 1,624,950 | |
Westar Energy, Inc.,
First Mortgage | | | 4.100 | | | | 04/01/43 | | | | | | | | 325 | | | | 366,613 | |
| | | | | | | | | | | | | | | | | | | | |
| | | | | | | | | | | | | | | | | | | 38,180,320 | |
| | | | | |
Electrical Components & Equipment 0.5% | | | | | | | | | | | | | | | | | | | | |
Energizer Gamma Acquisition BV, | | | | | | | | | | | | | | | | | | | | |
Gtd. Notes | | | 4.625 | | | | 07/15/26 | | | | EUR | | | | 6,700 | | | | 7,878,925 | |
Gtd. Notes, 144A | | | 4.625 | | | | 07/15/26 | | | | EUR | | | | 2,600 | | | | 3,057,493 | |
| | | | | | | | | | | | | | | | | | | | |
| | | | | | | | | | | | | | | | | | | 10,936,418 | |
| | | | | |
Electronics 0.3% | | | | | | | | | | | | | | | | | | | | |
Jabil, Inc., | | | | | | | | | | | | | | | | | | | | |
Sr. Unsec’d. Notes | | | 4.700 | | | | 09/15/22 | | | | | | | | 80 | | | | 84,730 | |
Sr. Unsec’d. Notes | | | 5.625 | | | | 12/15/20 | | | | | | | | 5,400 | | | | 5,608,601 | |
Sensata Technologies BV,
Gtd. Notes, 144A | | | 5.000 | | | | 10/01/25 | | | | | | | | 955 | | | | 1,029,204 | |
| | | | | | | | | | | | | | | | | | | | |
| | | | | | | | | | | | | | | | | | | 6,722,535 | |
See Notes to Financial Statements.
| | | | | | | | | | | | | | | | | | | | |
| | | | |
| Description | | Interest
Rate | | | Maturity
Date | | | Principal Amount (000)# | | | Value | |
| | | | |
CORPORATE BONDS (Continued) | | | | | | | | | | | | | | | | | |
| | | | | |
Energy-Alternate Sources 0.1% | | | | | | | | | | | | | | | | | | | | |
Neerg Energy Ltd. (Mauritius),
Sr. Sec’d. Notes | | | 6.000 | % | | | 02/13/22 | | | | | | | | 850 | | | $ | 838,518 | |
Rio Energy SA/UGEN SA/UENSA SA (Argentina),
Sr. Sec’d. Notes, 144A | | | 6.875 | | | | 02/01/25 | | | | | | | | 3,220 | | | | 1,867,632 | |
| | | | | | | | | | | | | | | | | | | | |
| | | | | | | | | | | | | | | | | | | 2,706,150 | |
| | | | | |
Engineering & Construction 0.2% | | | | | | | | | | | | | | | | | | | | |
Delhi International Airport Ltd. (India),
Sr. Sec’d. Notes, 144A | | | 6.450 | | | | 06/04/29 | | | | | | | | 1,375 | | | | 1,471,250 | |
Mexico City Airport Trust (Mexico),
Sr. Sec’d. Notes, 144A | | | 3.875 | | | | 04/30/28 | | | | | | | | 3,000 | | | | 2,998,500 | |
| | | | | | | | | | | | | | | | | | | | |
| | | | | | | | | | | | | | | | | | | 4,469,750 | |
| | | | | |
Entertainment 1.0% | | | | | | | | | | | | | | | | | | | | |
AMC Entertainment Holdings, Inc., | | | | | | | | | | | | | | | | | | | | |
Gtd. Notes(a) | | | 5.750 | | | | 06/15/25 | | | | | | | | 1,908 | | | | 1,812,791 | |
Gtd. Notes(a) | | | 5.875 | | | | 11/15/26 | | | | | | | | 1,150 | | | | 1,047,938 | |
Gtd. Notes | | | 6.375 | | | | 11/15/24 | | | | GBP | | | | 2,625 | | | | 3,249,191 | |
Caesars Resort Collection LLC/CRC Finco, Inc.,
Gtd. Notes, 144A | | | 5.250 | | | | 10/15/25 | | | | | | | | 4,025 | | | | 4,120,594 | |
Codere Finance 2 Luxembourg SA (Spain),
Sr. Sec’d. Notes | | | 6.750 | | | | 11/01/21 | | | | EUR | | | | 3,000 | | | | 2,893,735 | |
CPUK Finance Ltd. (United Kingdom), | | | | | | | | | | | | | | | | | | | | |
Sec’d. Notes, 144A | | | 4.250 | | | | 02/28/47 | | | | GBP | | | | 550 | | | | 721,364 | |
Sec’d. Notes, 144A | | | 4.875 | | | | 02/28/47 | | | | GBP | | | | 200 | | | | 265,549 | |
Eldorado Resorts, Inc.,
Gtd. Notes | | | 7.000 | | | | 08/01/23 | | | | | | | | 3,233 | | | | 3,374,444 | |
Pinewood Finance Co. Ltd. (United Kingdom),
Sr. Sec’d. Notes, 144A | | | 3.250 | | | | 09/30/25 | | | | GBP | | | | 1,900 | | | | 2,516,541 | |
Scientific Games International, Inc., | | | | | | | | | | | | | | | | | | | | |
Gtd. Notes | | | 6.250 | | | | 09/01/20 | | | | | | | | 2,500 | | | | 2,503,125 | |
Gtd. Notes | | | 10.000 | | | | 12/01/22 | | | | | | | | 875 | | | | 900,156 | |
Gtd. Notes, 144A | | | 8.250 | | | | 03/15/26 | | | | | | | | 450 | | | | 475,875 | |
| | | | | | | | | | | | | | | | | | | | |
| | | | | | | | | | | | | | | | | | | 23,881,303 | |
| | | | | |
Foods 1.1% | | | | | | | | | | | | | | | | | | | | |
Co-operative Group Holdings 2011 Ltd. (United Kingdom),
Gtd. Notes | | | 7.500 | | | | 07/08/26 | | | | GBP | | | | 3,400 | | | | 5,017,036 | |
See Notes to Financial Statements.
| | | | |
| PGIM Absolute Return Bond Fund | | | 35 | |
Schedule of Investments(continued)
as of October 31, 2019
| | | | | | | | | | | | | | | | | | | | |
| | | | |
| Description | | Interest
Rate | | | Maturity
Date | | | Principal
Amount (000)# | | | Value | |
| | | | | |
CORPORATE BONDS (Continued) | | | | | | | | | | | | | | | | | | | | |
| | | | | |
Foods (cont’d.) | | | | | | | | | | | | | | | | | | | | |
Ingles Markets, Inc.,
Sr. Unsec’d. Notes(a) | | | 5.750 | % | | | 06/15/23 | | | | | | | | 1,325 | | | $ | 1,353,156 | |
JBS USA LUX SA/JBS USA Finance, Inc.,
Gtd. Notes, 144A | | | 5.875 | | | | 07/15/24 | | | | | | | | 1,428 | | | | 1,472,625 | |
JBS USA LUX SA/JBS USA Food Co./JBS USA Finance, Inc., | | | | | | | | | | | | | | | | | | | | |
Gtd. Notes, 144A | | | 6.500 | | | | 04/15/29 | | | | | | | | 325 | | | | 361,572 | |
Sr. Unsec’d. Notes, 144A | | | 5.500 | | | | 01/15/30 | | | | | | | | 100 | | | | 107,750 | |
Kraft Heinz Foods Co., | | | | | | | | | | | | | | | | | | | | |
Gtd. Notes, 144A | | | 4.625 | | | | 10/01/39 | | | | | | | | 440 | | | | 451,356 | |
Gtd. Notes, 144A | | | 4.875 | | | | 10/01/49 | | | | | | | | 4,135 | | | | 4,262,080 | |
Mars, Inc., | | | | | | | | | | | | | | | | | | | | |
Gtd. Notes, 144A(a)(h) | | | 3.875 | | | | 04/01/39 | | | | | | | | 995 | | | | 1,115,479 | |
Gtd. Notes, 144A | | | 4.200 | | | | 04/01/59 | | | | | | | | 865 | | | | 1,005,067 | |
Picard Bondco SA (Luxembourg),
Gtd. Notes(a) | | | 5.500 | | | | 11/30/24 | | | | EUR | | | | 3,300 | | | | 3,533,270 | |
Picard Groupe SAS (France),
Sr. Sec’d. Notes, 144A, 3 Month EURIBOR + 3.000%
(Cap N/A, Floor 3.000%) | | | 3.000 | (c) | | | 11/30/23 | | | | EUR | | | | 2,075 | | | | 2,267,963 | |
Pilgrim’s Pride Corp.,
Gtd. Notes, 144A | | | 5.750 | | | | 03/15/25 | | | | | | | | 1,425 | | | | 1,478,437 | |
Post Holdings, Inc.,
Gtd. Notes, 144A(a) | | | 5.625 | | | | 01/15/28 | | | | | | | | 2,567 | | | | 2,746,690 | |
| | | | | | | | | | | | | | | | | | | | |
| | | | | | | | | | | | | | | | | | | 25,172,481 | |
| | | | | |
Forest Products & Paper 0.0% | | | | | | | | | | | | | | | | | | | | |
Georgia-Pacific LLC, | | | | | | | | | | | | | | | | | | | | |
Gtd. Notes, 144A | | | 5.400 | | | | 11/01/20 | | | | | | | | 35 | | | | 36,172 | |
Sr. Unsec’d. Notes | | | 7.375 | | | | 12/01/25 | | | | | | | | 400 | | | | 507,905 | |
| | | | | | | | | | | | | | | | | | | | |
| | | | | | | | | | | | | | | | | | | 544,077 | |
| | | | | |
Gas 0.2% | | | | | | | | | | | | | | | | | | | | |
AmeriGas Partners LP/AmeriGas Finance Corp.,
Sr. Unsec’d. Notes | | | 5.500 | | | | 05/20/25 | | | | | | | | 2,900 | | | | 3,110,540 | |
CenterPoint Energy Resources Corp.,
Sr. Unsec’d. Notes | | | 5.850 | | | | 01/15/41 | | | | | | | | 700 | | | | 907,158 | |
See Notes to Financial Statements.
| | | | | | | | | | | | | | | | |
| | | | |
| Description | | Interest
Rate | | | Maturity
Date | | | Principal
Amount (000)# | | | Value | |
| | | | |
CORPORATE BONDS (Continued) | | | | | | | | | | | | | | | | |
| | | | |
Gas (cont’d.) | | | | | | | | | | | | | | | | |
Dominion Energy Gas Holdings LLC,
Sr. Unsec’d. Notes(a) | | | 4.600 | % | | | 12/15/44 | | | | 125 | | | $ | 148,512 | |
Southern Co. Gas Capital Corp.,
Gtd. Notes(a) | | | 4.400 | | | | 06/01/43 | | | | 1,375 | | | | 1,534,388 | |
| | | | | | | | | | | | | | | | |
| | | | | | | | | | | | | | | 5,700,598 | |
| | | | |
Healthcare-Products 0.2% | | | | | | | | | | | | | | | | |
Medtronic Global Holdings SCA, | | | | | | | | | | | | | | | | |
Gtd. Notes | | | 1.625 | | | | 03/07/31 | | | EUR | 500 | | | | 617,095 | |
Gtd. Notes | | | 2.250 | | | | 03/07/39 | | | EUR | 705 | | | | 921,433 | |
Thermo Fisher Scientific, Inc., | | | | | | | | | | | | | | | | |
Sr. Unsec’d. Notes, EMTN | | | 1.500 | | | | 10/01/39 | | | EUR | 1,250 | | | | 1,352,586 | |
Sr. Unsec’d. Notes, EMTN | | | 1.875 | | | | 10/01/49 | | | EUR | 825 | | | | 875,129 | |
| | | | | | | | | | | | | | | | |
| | | | | | | | | | | | | | | 3,766,243 | |
| | | | |
Healthcare-Services 0.9% | | | | | | | | | | | | | | | | |
Aetna, Inc., | | | | | | | | | | | | | | | | |
Sr. Unsec’d. Notes | | | 2.750 | | | | 11/15/22 | | | | 450 | | | | 456,483 | |
Sr. Unsec’d. Notes | | | 4.500 | | | | 05/15/42 | | | | 530 | | | | 564,619 | |
Anthem, Inc., | | | | | | | | | | | | | | | | |
Sr. Unsec’d. Notes | | | 4.101 | | | | 03/01/28 | | | | 700 | | | | 761,176 | |
Sr. Unsec’d. Notes | | | 4.650 | | | | 01/15/43 | | | | 120 | | | | 133,021 | |
Sr. Unsec’d. Notes | | | 5.100 | | | | 01/15/44 | | | | 515 | | | | 596,781 | |
HCA, Inc.,
Gtd. Notes | | | 5.375 | | | | 02/01/25 | | | | 6,325 | | | | 6,949,594 | |
Laboratory Corp. of America Holdings,
Sr. Unsec’d. Notes | | | 3.200 | | | | 02/01/22 | | | | 25 | | | | 25,590 | |
Memorial Sloan-Kettering Cancer Center,
Sr. Unsec’d. Notes | | | 4.125 | | | | 07/01/52 | | | | 75 | | | | 89,422 | |
RegionalCare Hospital Partners Holdings, Inc./LifePoint Health, Inc.,
Gtd. Notes, 144A(a) | | | 9.750 | | | | 12/01/26 | | | | 3,700 | | | | 4,060,750 | |
Tenet Healthcare Corp., | | | | | | | | | | | | | | | | |
Sec’d. Notes, 144A(a) | | | 6.250 | | | | 02/01/27 | | | | 875 | | | | 924,219 | |
Sr. Sec’d. Notes, 144A | | | 5.125 | | | | 11/01/27 | | | | 1,500 | | | | 1,563,720 | |
Sr. Unsec’d. Notes(a) | | | 7.000 | | | | 08/01/25 | | | | 4,300 | | | | 4,439,750 | |
Sr. Unsec’d. Notes | | | 8.125 | | | | 04/01/22 | | | | 1,475 | | | | 1,596,687 | |
| | | | | | | | | | | | | | | | |
| | | | | | | | | | | | | | | 22,161,812 | |
See Notes to Financial Statements.
| | | | |
| PGIM Absolute Return Bond Fund | | | 37 | |
Schedule of Investments (continued)
as of October 31, 2019
| | | | | | | | | | | | | | | | |
| | | | |
| Description | | Interest
Rate | | | Maturity
Date | | | Principal
Amount (000)# | | | Value | |
| | | | |
CORPORATE BONDS (Continued) | | | | | | | | | | | | | | | | |
| | | | |
Home Builders 2.1% | | | | | | | | | | | | | | | | |
Beazer Homes USA, Inc.,
Sr. Unsec’d. Notes, 144A(a) | | | 7.250 | % | | | 10/15/29 | | | | 3,625 | | | $ | 3,815,313 | |
Brookfield Residential Properties, Inc./Brookfield Residential US Corp. (Canada),
Gtd. Notes, 144A(a) | | | 6.125 | | | | 07/01/22 | | | | 5,000 | | | | 5,081,250 | |
KB Home,
Gtd. Notes | | | 7.500 | | | | 09/15/22 | | | | 3,425 | | | | 3,861,688 | |
M/I Homes, Inc.,
Gtd. Notes | | | 6.750 | | | | 01/15/21 | | | | 5,850 | | | | 5,909,611 | |
Mattamy Group Corp. (Canada), | | | | | | | | | | | | | | | | |
Sr. Unsec’d. Notes, 144A | | | 6.500 | | | | 10/01/25 | | | | 2,500 | | | | 2,643,750 | |
Sr. Unsec’d. Notes, 144A | | | 6.875 | | | | 12/15/23 | | | | 4,000 | | | | 4,145,000 | |
Meritage Homes Corp., | | | | | | | | | | | | | | | | |
Gtd. Notes | | | 5.125 | | | | 06/06/27 | | | | 3,692 | | | | 3,978,130 | |
Gtd. Notes | | | 6.000 | | | | 06/01/25 | | | | 1,275 | | | | 1,424,813 | |
New Home Co., Inc. (The),
Gtd. Notes | | | 7.250 | | | | 04/01/22 | | | | 3,125 | | | | 2,958,984 | |
PulteGroup, Inc.,
Gtd. Notes | | | 5.500 | | | | 03/01/26 | | | | 4,000 | | | | 4,481,000 | |
Taylor Morrison Communities, Inc.,
Gtd. Notes, 144A | | | 5.875 | | | | 06/15/27 | | | | 2,700 | | | | 3,015,090 | |
William Lyon Homes, Inc.,
Gtd. Notes | | | 5.875 | | | | 01/31/25 | | | | 7,625 | | | | 7,758,437 | |
| | | | | | | | | | | | | | | | |
| | | | | | | | | | | | | | | 49,073,066 | |
| | | | |
Home Furnishings 0.1% | | | | | | | | | | | | | | | | |
Tempur Sealy International, Inc.,
Gtd. Notes(a) | | | 5.500 | | | | 06/15/26 | | | | 1,540 | | | | 1,611,225 | |
| | | | |
Household Products/Wares 0.3% | | | | | | | | | | | | | | | | |
Diamond BC BV,
Sr. Unsec’d. Notes(a) | | | 5.625 | | | | 08/15/25 | | | EUR | 7,760 | | | | 7,920,807 | |
| | | | |
Insurance 0.7% | | | | | | | | | | | | | | | | |
Hartford Financial Services Group, Inc. (The), | | | | | | | | | | | | | | | | |
Sr. Unsec’d. Notes(a) | | | 5.950 | | | | 10/15/36 | | | | 215 | | | | 281,693 | |
Sr. Unsec’d. Notes | | | 6.100 | | | | 10/01/41 | | | | 280 | | | | 380,176 | |
Liberty Mutual Group, Inc., | | | | | | | | | | | | | | | | |
Gtd. Notes, 144A | | | 3.951 | | | | 10/15/50 | | | | 2,530 | | | | 2,611,395 | |
Gtd. Notes, 144A | | | 4.250 | | | | 06/15/23 | | | | 436 | | | | 462,798 | |
Gtd. Notes, 144A | | | 4.569 | | | | 02/01/29 | | | | 1,614 | | | | 1,823,886 | |
See Notes to Financial Statements.
| | | | | | | | | | | | | | | | |
| | | | |
| Description | | Interest
Rate | | | Maturity
Date | | | Principal
Amount (000)# | | | Value | |
| | | | |
CORPORATE BONDS (Continued) | | | | | | | | | | | | | | | | |
| | | | |
Insurance (cont’d.) | | | | | | | | | | | | | | | | |
Lincoln National Corp.,
Sr. Unsec’d. Notes | | | 7.000 | % | | | 06/15/40 | | | | 695 | | | $ | 998,598 | |
Markel Corp., | | | | | | | | | | | | | | | | |
Sr. Unsec’d. Notes | | | 4.900 | | | | 07/01/22 | | | | 2,020 | | | | 2,157,739 | |
Sr. Unsec’d. Notes | | | 5.000 | | | | 03/30/43 | | | | 3,125 | | | | 3,443,535 | |
Principal Financial Group, Inc.,
Gtd. Notes | | | 4.350 | | | | 05/15/43 | | | | 975 | | | | 1,093,385 | |
Swiss Re Treasury US Corp. (Switzerland),
Gtd. Notes, 144A | | | 4.250 | | | | 12/06/42 | | | | 795 | | | | 912,304 | |
Teachers Insurance & Annuity Association of America, | | | | | | | | | | | | | | | | |
Sub. Notes, 144A | | | 4.270 | | | | 05/15/47 | | | | 640 | | | | 737,178 | |
Sub. Notes, 144A | | | 4.900 | | | | 09/15/44 | | | | 1,950 | | | | 2,449,007 | |
Sub. Notes, 144A | | | 6.850 | | | | 12/16/39 | | | | 54 | | | | 80,067 | |
| | | | | | | | | | | | | | | | |
| | | | | | | | | | | | | | | 17,431,761 | |
| | | | |
Lodging 0.4% | | | | | | | | | | | | | | | | |
Jack Ohio Finance LLC/Jack Ohio Finance 1 Corp.,
Sr. Sec’d. Notes, 144A(a) | | | 6.750 | | | | 11/15/21 | | | | 5,750 | | | | 5,872,187 | |
Marriott International, Inc., | | | | | | | | | | | | | | | | |
Sr. Unsec’d. Notes | | | 3.250 | | | | 09/15/22 | | | | 75 | | | | 77,290 | |
Sr. Unsec’d. Notes | | | 7.150 | | | | 12/01/19 | | | | 550 | | | | 551,947 | |
Sands China Ltd. (Macau),
Sr. Unsec’d. Notes(a) | | | 5.125 | | | | 08/08/25 | | | | 1,000 | | | | 1,102,650 | |
Studio City Co. Ltd. (Macau), | | | | | | | | | | | | | | | | |
Sr. Sec’d. Notes | | | 7.250 | | | | 11/30/21 | | | | 500 | | | | 512,600 | |
Sr. Sec’d. Notes, 144A | | | 7.250 | | | | 11/30/21 | | | | 1,200 | | | | 1,230,240 | |
| | | | | | | | | | | | | | | | |
| | | | | | | | | | | | | | | 9,346,914 | |
| | | | |
Machinery-Diversified 0.0% | | | | | | | | | | | | | | | | |
Xylem, Inc.,
Sr. Unsec’d. Notes | | | 4.875 | | | | 10/01/21 | | | | 50 | | | | 52,542 | |
| | | | |
Media 1.6% | | | | | | | | | | | | | | | | |
CCO Holdings LLC/CCO Holdings Capital Corp., | | | | | | | | | | | | | | | | |
Sr. Unsec’d. Notes, 144A | | | 4.750 | | | | 03/01/30 | | | | 1,300 | | | | 1,324,375 | |
Sr. Unsec’d. Notes, 144A | | | 5.125 | | | | 05/01/23 | | | | 2,625 | | | | 2,687,344 | |
Sr. Unsec’d. Notes, 144A | | | 5.375 | | | | 06/01/29 | | | | 2,100 | | | | 2,241,750 | |
Sr. Unsec’d. Notes, 144A(a) | | | 5.875 | | | | 05/01/27 | | | | 2,975 | | | | 3,153,500 | |
See Notes to Financial Statements.
| | | | |
| PGIM Absolute Return Bond Fund | | | 39 | |
Schedule of Investments (continued)
as of October 31, 2019
| | | | | | | | | | | | | | | | |
| | | | |
| Description | | Interest
Rate | | | Maturity
Date | | | Principal
Amount (000)# | | | Value | |
| | | | |
CORPORATE BONDS (Continued) | | | | | | | | | | | | | | | | |
| | | | |
Media (cont’d.) | | | | | | | | | | | | | | | | |
Charter Communications Operating LLC/Charter Communications Operating Capital, | | | | | | | | | | | | | | | | |
Sr. Sec’d. Notes | | | 6.384 | % | | | 10/23/35 | | | | 1,525 | | | $ | 1,873,931 | |
Sr. Sec’d. Notes | | | 6.834 | | | | 10/23/55 | | | | 485 | | | | 617,735 | |
Clear Channel Worldwide Holdings, Inc.,
Gtd. Notes, 144A(a) | | | 9.250 | | | | 02/15/24 | | | | 1,914 | | | | 2,105,400 | |
Comcast Corp., | | | | | | | | | | | | | | | | |
Gtd. Notes(h) | | | 4.150 | | | | 10/15/28 | | | | 2,605 | | | | 2,943,652 | |
Gtd. Notes | | | 4.250 | | | | 10/15/30 | | | | 890 | | | | 1,025,646 | |
Diamond Sports Group LLC/Diamond Sports Finance Co.,
Gtd. Notes, 144A(a) | | | 6.625 | | | | 08/15/27 | | | | 1,260 | | | | 1,297,800 | |
DISH DBS Corp.,
Gtd. Notes(a) | | | 7.750 | | | | 07/01/26 | | | | 7,300 | | | | 7,364,605 | |
Radiate Holdco LLC/Radiate Finance, Inc.,
Sr. Unsec’d. Notes, 144A(a) | | | 6.625 | | | | 02/15/25 | | | | 4,705 | | | | 4,752,050 | |
TEGNA, Inc.,
Gtd. Notes, 144A | | | 4.875 | | | | 09/15/21 | | | | 1,625 | | | | 1,629,063 | |
Univision Communications, Inc.,
Sr. Sec’d. Notes, 144A | | | 6.750 | | | | 09/15/22 | | | | 1,292 | | | | 1,308,150 | |
Videotron Ltd. (Canada),
Gtd. Notes | | | 5.000 | | | | 07/15/22 | | | | 3,000 | | | | 3,157,500 | |
| | | | | | | | | | | | | | | | |
| | | | | | | | | | | | | | | 37,482,501 | |
| | | | |
Mining 0.1% | | | | | | | | | | | | | | | | |
Indonesia Asahan Aluminium Persero PT (Indonesia),
Sr. Unsec’d. Notes | | | 6.530 | | | | 11/15/28 | | | | 1,650 | | | | 1,995,404 | |
| | | | |
Miscellaneous Manufacturing 0.1% | | | | | | | | | | | | | | | | |
Actuant Corp.,
Gtd. Notes(a) | | | 5.625 | | | | 06/15/22 | | | | 3,075 | | | | 3,105,750 | |
| | | | |
Oil & Gas 2.3% | | | | | | | | | | | | | | | | |
Antero Resources Corp.,
Gtd. Notes | | | 5.625 | | | | 06/01/23 | | | | 3,500 | | | | 2,454,375 | |
Ascent Resources Utica Holdings LLC/ARU Finance Corp., | | | | | | | | | | | | | | | | |
Sr. Unsec’d. Notes, 144A | | | 7.000 | | | | 11/01/26 | | | | 1,225 | | | | 937,125 | |
Sr. Unsec’d. Notes, 144A | | | 10.000 | | | | 04/01/22 | | | | 750 | | | | 709,725 | |
Cenovus Energy, Inc. (Canada),
Sr. Unsec’d. Notes(a) | | | 5.400 | | | | 06/15/47 | | | | 2,645 | | | | 2,959,087 | |
See Notes to Financial Statements.
| | | | | | | | | | | | | | | | |
| | | | |
| Description | | Interest
Rate | | | Maturity
Date | | | Principal
Amount (000)# | | | Value | |
| | | | |
CORPORATE BONDS (Continued) | | | | | | | | | | | | | | | | |
| | | | |
Oil & Gas (cont’d.) | | | | | | | | | | | | | | | | |
Citgo Holding, Inc.,
Sr. Sec’d. Notes, 144A | | | 9.250 | % | | | 08/01/24 | | | | 500 | | | $ | 521,875 | |
CNX Resources Corp., | | | | | | | | | | | | | | | | |
Gtd. Notes(a) | | | 5.875 | | | | 04/15/22 | | | | 1,304 | | | | 1,274,660 | |
Gtd. Notes, 144A | | | 7.250 | | | | 03/14/27 | | | | 2,125 | | | | 1,702,019 | |
Concho Resources, Inc.,
Gtd. Notes | | | 4.875 | | | | 10/01/47 | | | | 275 | | | | 310,415 | |
Endeavor Energy Resources LP/EER Finance, Inc.,
Sr. Unsec’d. Notes, 144A | | | 5.500 | | | | 01/30/26 | | | | 2,700 | | | | 2,781,054 | |
Gazprom OAO Via Gaz Capital SA (Russia), | | | | | | | | | | | | | | | | |
Sr. Unsec’d. Notes, 144A | | | 4.950 | | | | 07/19/22 | | | | 730 | | | | 772,089 | |
Sr. Unsec’d. Notes, 144A | | | 6.510 | | | | 03/07/22 | | | | 2,020 | | | | 2,194,047 | |
Hilcorp Energy I LP/Hilcorp Finance Co.,
Sr. Unsec’d. Notes, 144A(a) | | | 6.250 | | | | 11/01/28 | | | | 700 | | | | 591,500 | |
HPCL-Mittal Energy Ltd. (India),
Sr. Unsec’d. Notes | | | 5.250 | | | | 04/28/27 | | | | 1,478 | | | | 1,467,385 | |
MEG Energy Corp. (Canada),
Gtd. Notes, 144A | | | 7.000 | | | | 03/31/24 | | | | 3,700 | | | | 3,475,410 | |
Occidental Petroleum Corp., | | | | | | | | | | | | | | | | |
Sr. Unsec’d. Notes | | | 4.264 | (s) | | | 10/10/36 | | | | 3,000 | | | | 1,507,102 | |
Sr. Unsec’d. Notes | | | 6.450 | | | | 09/15/36 | | | | 750 | | | | 917,589 | |
Petrobras Global Finance BV (Brazil), | | | | | | | | | | | | | | | | |
Gtd. Notes | | | 4.750 | | | | 01/14/25 | | | EUR | 3,100 | | | | 4,018,917 | |
Gtd. Notes | | | 5.375 | | | | 10/01/29 | | | GBP | 800 | | | | 1,138,063 | |
Gtd. Notes | | | 5.750 | | | | 02/01/29 | | | | 1,275 | | | | 1,418,884 | |
Gtd. Notes | | | 6.625 | | | | 01/16/34 | | | GBP | 2,605 | | | | 4,013,226 | |
Gtd. Notes | | | 6.900 | | | | 03/19/49 | | | | 1,365 | | | | 1,586,539 | |
Gtd. Notes, 144A | | | 5.093 | | | | 01/15/30 | | | | 529 | | | | 561,005 | |
Petroleos Mexicanos (Mexico), | | | | | | | | | | | | | | | | |
Gtd. Notes | | | 4.750 | | | | 02/26/29 | | | EUR | 1,600 | | | | 1,853,575 | |
Gtd. Notes | | | 6.350 | | | | 02/12/48 | | | | 3,828 | | | | 3,660,525 | |
Gtd. Notes | | | 6.500 | | | | 03/13/27 | | | | 1,550 | | | | 1,643,000 | |
Gtd. Notes | | | 6.500 | | | | 01/23/29 | | | | 575 | | | | 599,725 | |
Gtd. Notes, 144A | | | 7.690 | | | | 01/23/50 | | | | 440 | | | | 479,776 | |
Gtd. Notes, EMTN | | | 4.875 | | | | 02/21/28 | | | EUR | 400 | | | | 470,099 | |
Gtd. Notes, MTN | | | 6.750 | | | | 09/21/47 | | | | 3,206 | | | | 3,197,664 | |
Transocean, Inc.,
Gtd. Notes, 144A(a) | | | 7.250 | | | | 11/01/25 | | | | 5,100 | | | | 4,500,750 | |
| | | | | | | | | | | | | | | | |
| | | | | | | | | | | | | | | 53,717,205 | |
See Notes to Financial Statements.
| | | | |
| PGIM Absolute Return Bond Fund | | | 41 | |
Schedule of Investments (continued)
as of October 31, 2019
| | | | | | | | | | | | | | | | |
| | | | |
| Description | | Interest
Rate | | | Maturity
Date | | | Principal
Amount (000)# | | | Value | |
| | | | |
CORPORATE BONDS (Continued) | | | | | | | | | | | | | | | | |
| | | | |
Oil & Gas Services 0.0% | | | | | | | | | | | | | | | | |
Cameron International Corp.,
Gtd. Notes | | | 5.950 | % | | | 06/01/41 | | | | 100 | | | $ | 125,915 | |
| | | | |
Packaging & Containers 1.2% | | | | | | | | | | | | | | | | |
ARD Finance SA (Luxembourg),
Sr. Sec’d. Notes, Cash coupon 6.625% or PIK 7.375% | | | 6.625 | | | | 09/15/23 | | | EUR | 11,200 | | | | 12,929,182 | |
Ardagh Packaging Finance PLC/Ardagh Holdings USA, Inc. (Ireland),
Gtd. Notes | | | 6.750 | | | | 05/15/24 | | | EUR | 140 | | | | 163,955 | |
Crown European Holdings SA,
Gtd. Notes, 144A | | | 2.875 | | | | 02/01/26 | | | EUR | 5,050 | | | | 6,033,564 | |
Reynolds Group Issuer, Inc./Reynolds Group Issuer LLC,
Sr. Sec’d. Notes | | | 5.750 | | | | 10/15/20 | | | | 8,334 | | | | 8,363,080 | |
WestRock RKT LLC,
Gtd. Notes | | | 4.900 | | | | 03/01/22 | | | | 1,190 | | | | 1,259,974 | |
| | | | | | | | | | | | | | | | |
| | | | | | | | | | | | | | | 28,749,755 | |
| | | | |
Pharmaceuticals 1.1% | | | | | | | | | | | | | | | | |
AbbVie, Inc.,
Sr. Unsec’d. Notes | | | 4.500 | | | | 05/14/35 | | | | 4,085 | | | | 4,399,878 | |
Allergan Funding SCS,
Gtd. Notes(a) | | | 4.550 | | | | 03/15/35 | | | | 4,155 | | | | 4,451,789 | |
Bausch Health Cos., Inc., | | | | | | | | | | | | | | | | |
Gtd. Notes, 144A(a) | | | 6.125 | | | | 04/15/25 | | | | 1,075 | | | | 1,115,984 | |
Gtd. Notes, 144A | | | 7.250 | | | | 05/30/29 | | | | 1,200 | | | | 1,321,500 | |
Bristol-Myers Squibb Co., | | | | | | | | | | | | | | | | |
Sr. Unsec’d. Notes, 144A | | | 4.125 | | | | 06/15/39 | | | | 615 | | | | 702,171 | |
Sr. Unsec’d. Notes, 144A(h) | | | 4.250 | | | | 10/26/49 | | | | 2,755 | | | | 3,226,996 | |
Cigna Corp.,
Gtd. Notes | | | 4.375 | | | | 10/15/28 | | | | 3,990 | | | | 4,398,204 | |
CVS Health Corp., | | | | | | | | | | | | | | | | |
Sr. Unsec’d. Notes | | | 4.780 | | | | 03/25/38 | | | | 130 | | | | 144,350 | |
Sr. Unsec’d. Notes | | | 5.050 | | | | 03/25/48 | | | | 690 | | | | 790,404 | |
Sr. Unsec’d. Notes(a) | | | 5.125 | | | | 07/20/45 | | | | 1,315 | | | | 1,510,562 | |
Sr. Unsec’d. Notes | | | 5.300 | | | | 12/05/43 | | | | 485 | | | | 560,784 | |
Mylan NV,
Gtd. Notes | | | 5.250 | | | | 06/15/46 | | | | 520 | | | | 557,199 | |
Rossini Sarl (Italy),
Sr. Sec’d. Notes, 144A | | | 6.750 | | | | 10/30/25 | | | EUR | 2,875 | | | | 3,544,131 | |
| | | | | | | | | | | | | | | | |
| | | | | | | | | | | | | | | 26,723,952 | |
See Notes to Financial Statements.
| | | | | | | | | | | | | | | | |
| | | | |
| Description | | Interest
Rate | | | Maturity
Date | | | Principal
Amount (000)# | | | Value | |
| | | | |
CORPORATE BONDS (Continued) | | | | | | | | | | | | | | | | |
| | | | |
Pipelines 0.5% | | | | | | | | | | | | | | | | |
DCP Midstream Operating LP,
Gtd. Notes, 144A | | | 5.350 | % | | | 03/15/20 | | | | 227 | | | $ | 228,703 | |
Energy Transfer Operating LP, | | | | | | | | | | | | | | | | |
Gtd. Notes | | | 5.150 | | | | 03/15/45 | | | | 55 | | | | 57,294 | |
Gtd. Notes | | | 5.300 | | | | 04/15/47 | | | | 125 | | | | 132,270 | |
Gtd. Notes | | | 6.250 | | | | 04/15/49 | | | | 75 | | | | 90,114 | |
Enterprise Products Operating LLC,
Gtd. Notes | | | 4.950 | | | | 10/15/54 | | | | 2,700 | | | | 3,134,058 | |
Fermaca Enterprises S de RL de CV (Mexico),
Sr. Sec’d. Notes, 144A | | | 6.375 | | | | 03/30/38 | | | | 512 | | | | 553,265 | |
Magellan Midstream Partners LP, | | | | | | | | | | | | | | | | |
Sr. Unsec’d. Notes | | | 4.200 | | | | 12/01/42 | | | | 125 | | | | 127,037 | |
Sr. Unsec’d. Notes | | | 5.150 | | | | 10/15/43 | | | | 1,350 | | | | 1,579,806 | |
MPLX LP,
Sr. Unsec’d. Notes | | | 5.200 | | | | 03/01/47 | | | | 145 | | | | 155,351 | |
NGPL PipeCo LLC, | | | | | | | | | | | | | | | | |
Sr. Unsec’d. Notes, 144A | | | 4.375 | | | | 08/15/22 | | | | 150 | | | | 155,738 | |
Sr. Unsec’d. Notes, 144A | | | 4.875 | | | | 08/15/27 | | | | 500 | | | | 537,804 | |
ONEOK, Inc.,
Gtd. Notes | | | 4.950 | | | | 07/13/47 | | | | 1,060 | | | | 1,146,840 | |
Rockies Express Pipeline LLC,
Sr. Unsec’d. Notes, 144A | | | 6.875 | | | | 04/15/40 | | | | 1,850 | | | | 1,951,935 | |
Sunoco Logistics Partners Operations LP,
Gtd. Notes | | | 5.400 | | | | 10/01/47 | | | | 60 | | | | 64,423 | |
Tallgrass Energy Partners LP/Tallgrass Energy Finance Corp.,
Gtd. Notes, 144A(a) | | | 5.500 | | | | 01/15/28 | | | | 1,875 | | | | 1,757,812 | |
Western Midstream Operating LP, | | | | | | | | | | | | | | | | |
Sr. Unsec’d. Notes | | | 4.000 | | | | 07/01/22 | | | | 75 | | | | 76,180 | |
Sr. Unsec’d. Notes | | | 5.300 | | | | 03/01/48 | | | | 910 | | | | 770,723 | |
| | | | | | | | | | | | | | | | |
| | | | | | | | | | | | | | | 12,519,353 | |
| | | | |
Real Estate 0.4% | | | | | | | | | | | | | | | | |
Five Point Operating Co. LP/Five Point Capital Corp.,
Gtd. Notes, 144A | | | 7.875 | | | | 11/15/25 | | | | 2,475 | | | | 2,339,296 | |
Greystar Real Estate Partners LLC,
Sr. Sec’d. Notes, 144A | | | 5.750 | | | | 12/01/25 | | | | 3,575 | | | | 3,726,937 | |
Hunt Cos., Inc.,
Sr. Sec’d. Notes, 144A | | | 6.250 | | | | 02/15/26 | | | | 2,425 | | | | 2,381,127 | |
| | | | | | | | | | | | | | | | |
| | | | | | | | | | | | | | | 8,447,360 | |
See Notes to Financial Statements.
| | | | |
| PGIM Absolute Return Bond Fund | | | 43 | |
Schedule of Investments (continued)
as of October 31, 2019
| | | | | | | | | | | | | | | | |
| | | | |
| Description | | Interest
Rate | | | Maturity
Date | | | Principal
Amount (000)# | | | Value | |
| | | | |
CORPORATE BONDS (Continued) | | | | | | | | | | | | | | | | |
| | | | |
Real Estate Investment Trusts (REITs) 0.2% | | | | | | | | | | | | | | | | |
MGM Growth Properties Operating Partnership LP/MGP Finance Co-Issuer, Inc.,
Gtd. Notes | | | 4.500 | % | | | 09/01/26 | | | | 675 | | | $ | 717,187 | |
MPT Operating Partnership LP/MPT Finance Corp.,
Gtd. Notes | | | 3.325 | | | | 03/24/25 | | | EUR | 3,775 | | | | 4,670,860 | |
| | | | | | | | | | | | | | | | |
| | | | | | | | | | | | | | | 5,388,047 | |
| | | | |
Retail 1.8% | | | | | | | | | | | | | | | | |
Brinker International, Inc.,
Gtd. Notes, 144A | | | 5.000 | | | | 10/01/24 | | | | 1,000 | | | | 1,060,625 | |
eG Global Finance PLC (United Kingdom),
Sr. Sec’d. Notes, 144A | | | 4.375 | | | | 02/07/25 | | | EUR | 8,700 | | | | 9,432,471 | |
Ferrellgas Partners LP/Ferrellgas Partners Finance Corp.,
Sr. Unsec’d. Notes | | | 8.625 | | | | 06/15/20 | | | | 2,975 | | | | 1,695,750 | |
Sr. Unsec’d. Notes | | | 8.625 | | | | 06/15/20 | | | | 1,703 | | | | 970,710 | |
Golden Nugget, Inc.,
Sr. Unsec’d. Notes, 144A(a) | | | 6.750 | | | | 10/15/24 | | | | 5,951 | | | | 6,130,125 | |
Grupo Unicomer Co. Ltd. (El Salvador),
Gtd. Notes, 144A | | | 7.875 | | | | 04/01/24 | | | | 942 | | | | 1,023,257 | |
L Brands, Inc.,
Gtd. Notes(a) | | | 5.625 | | | | 10/15/23 | | | | 7,430 | | | | 7,885,087 | |
Macy’s Retail Holdings, Inc.,
Gtd. Notes | | | 4.300 | | | | 02/15/43 | | | | 705 | | | | 581,698 | |
Michaels Stores, Inc.,
Gtd. Notes, 144A(a) | | | 8.000 | | | | 07/15/27 | | | | 1,650 | | | | 1,628,880 | |
PetSmart, Inc.,
Sr. Sec’d. Notes, 144A(a) | | | 5.875 | | | | 06/01/25 | | | | 1,315 | | | | 1,295,275 | |
Rite Aid Corp.,
Gtd. Notes, 144A(a) | | | 6.125 | | | | 04/01/23 | | | | 2,675 | | | | 2,277,228 | |
Sally Holdings LLC/Sally Capital, Inc., | | | | | | | | | | | | | | | | |
Gtd. Notes | | | 5.500 | | | | 11/01/23 | | | | 1,500 | | | | 1,515,000 | |
Gtd. Notes(a) | | | 5.625 | | | | 12/01/25 | | | | 5,000 | | | | 5,162,500 | |
Stonegate Pub Co. Financing PLC (United Kingdom),
Sr. Sec’d. Notes, 3 Month GBP LIBOR + 4.375% | | | 5.160 | (c) | | | 03/15/22 | | | GBP | 2,425 | | | | 3,157,432 | |
| | | | | | | | | | | | | | | | |
| | | | | | | | | | | | | | | 43,816,038 | |
| | | | |
Savings & Loans 0.0% | | | | | | | | | | | | | | | | |
People’s United Financial, Inc.,
Sr. Unsec’d. Notes | | | 3.650 | | | | 12/06/22 | | | | 325 | | | | 336,327 | |
See Notes to Financial Statements.
| | | | | | | | | | | | | | | | |
| | | | |
| Description | | Interest
Rate | | | Maturity
Date | | | Principal
Amount (000)# | | | Value | |
| | | | |
CORPORATE BONDS (Continued) | | | | | | | | | | | | | | | | |
| | | | |
Semiconductors 0.3% | | | | | | | | | | | | | | | | |
Broadcom, Inc., | | | | | | | | | | | | | | | | |
Gtd. Notes, 144A | | | 3.125 | % | | | 04/15/21 | | | | 4,105 | | | $ | 4,154,014 | |
Gtd. Notes, 144A | | | 3.125 | | | | 10/15/22 | | | | 3,155 | | | | 3,214,563 | |
| | | | | | | | | | | | | | | | |
| | | | | | | | | | | | | | | 7,368,577 | |
| | | | |
Software 0.7% | | | | | | | | | | | | | | | | |
Infor US, Inc.,
Gtd. Notes | | | 5.750 | | | | 05/15/22 | | | EUR | 5,114 | | | | 5,772,088 | |
InterXion Holding NV (Netherlands),
Gtd. Notes, 144A | | | 4.750 | | | | 06/15/25 | | | EUR | 9,600 | | | | 11,642,233 | |
| | | | | | | | | | | | | | | | |
| | | | | | | | | | | | | | | 17,414,321 | |
| | | | |
Telecommunications 1.3% | | | | | | | | | | | | | | | | |
Altice France SA (France), | | | | | | | | | | | | | | | | |
Sr. Sec’d. Notes, 144A | | | 2.500 | | | | 01/15/25 | | | EUR | 2,500 | | | | 2,797,591 | |
Sr. Sec’d. Notes, 144A | | | 3.375 | | | | 01/15/28 | | | EUR | 2,300 | | | | 2,569,936 | |
AT&T, Inc., | | | | | | | | | | | | | | | | |
Sr. Unsec’d. Notes | | | 3.800 | | | | 02/15/27 | | | | 1,350 | | | | 1,444,572 | |
Sr. Unsec’d. Notes(a) | | | 4.300 | | | | 02/15/30 | | | | 700 | | | | 770,594 | |
Sr. Unsec’d. Notes | | | 4.850 | | | | 03/01/39 | | | | 5,720 | | | | 6,479,210 | |
CenturyLink, Inc., | | | | | | | | | | | | | | | | |
Sr. Unsec’d. Notes, Series P(a) | | | 7.600 | | | | 09/15/39 | | | | 825 | | | | 839,438 | |
Sr. Unsec’d. Notes, Series V | | | 5.625 | | | | 04/01/20 | | | | 1,425 | | | | 1,442,812 | |
CommScope Technologies LLC,
Gtd. Notes, 144A(a) | | | 6.000 | | | | 06/15/25 | | | | 1,225 | | | | 1,098,212 | |
CommScope, Inc.,
Gtd. Notes, 144A | | | 5.000 | | | | 06/15/21 | | | | 547 | | | | 547,000 | |
Digicel Group One Ltd. (Jamaica),
Sr. Sec’d. Notes | | | 8.250 | | | | 12/30/22 | | | | 772 | | | | 456,445 | |
Digicel Group Two Ltd. (Jamaica),
Sr. Unsec’d. Notes | | | 8.250 | | | | 09/30/22 | | | | 728 | | | | 189,280 | |
Digicel Ltd. (Jamaica), | | | | | | | | | | | | | | | | |
Gtd. Notes, 144A | | | 6.750 | | | | 03/01/23 | | | | 2,050 | | | | 1,076,271 | |
Sr. Unsec’d. Notes, 144A(a) | | | 6.000 | | | | 04/15/21 | | | | 2,350 | | | | 1,750,773 | |
Embarq Corp.,
Sr. Unsec’d. Notes | | | 7.995 | | | | 06/01/36 | | | | 2,500 | | | | 2,475,000 | |
See Notes to Financial Statements.
| | | | |
| PGIM Absolute Return Bond Fund | | | 45 | |
Schedule of Investments (continued)
as of October 31, 2019
| | | | | | | | | | | | | | | | |
| | | | |
| Description | | Interest
Rate | | | Maturity
Date | | | Principal
Amount (000)# | | | Value | |
| | | | |
CORPORATE BONDS (Continued) | | | | | | | | | | | | | | | | |
| | | | |
Telecommunications (cont’d.) | | | | | | | | | | | | | | | | |
Sprint Capital Corp.,
Gtd. Notes(a) | | | 8.750 | % | | | 03/15/32 | | | | 3,282 | | | $ | 4,002,005 | |
West Corp.,
Gtd. Notes, 144A(a) | | | 8.500 | | | | 10/15/25 | | | | 2,700 | | | | 2,038,500 | |
| | | | | | | | | | | | | | | | |
| | | | | | | | | | | | | | | 29,977,639 | |
| | | | |
Textiles 0.0% | | | | | | | | | | | | | | | | |
Mohawk Industries, Inc.,
Sr. Unsec’d. Notes(a) | | | 3.850 | | | | 02/01/23 | | | | 104 | | | | 108,842 | |
| | | | |
Water 0.1% | | | | | | | | | | | | | | | | |
Aegea Finance Sarl (Brazil),
Gtd. Notes, 144A | | | 5.750 | | | | 10/10/24 | | | | 2,255 | | | | 2,373,410 | |
| | | | | | | | | | | | | | | | |
TOTAL CORPORATE BONDS
(cost $783,959,695) | | | | | | | | | | | | | | | 808,833,553 | |
| | | | | | | | | | | | | | | | |
| | | | |
MUNICIPAL BONDS 1.6% | | | | | | | | | | | | | | | | |
| | | | |
California 0.4% | | | | | | | | | | | | | | | | |
Bay Area Toll Authority,
BABs, Revenue Bonds, Series F2 | | | 6.263 | | | | 04/01/49 | | | | 550 | | | | 858,946 | |
Los Angeles Department of Water & Power, Power System Revenue, | | | | | | | | | | | | | | | | |
BABs, Revenue Bonds | | | 6.574 | | | | 07/01/45 | | | | 585 | | | | 914,244 | |
BABs, Taxable, Revenue Bonds, Series SY(h) | | | 6.008 | | | | 07/01/39 | | | | 3,610 | | | | 4,769,388 | |
University of California, | | | | | | | | | | | | | | | | |
BABs, Revenue Bonds | | | 5.770 | | | | 05/15/43 | | | | 390 | | | | 533,828 | |
Taxable, Revenue Bonds, Series AP | | | 3.931 | | | | 05/15/45 | | | | 625 | | | | 690,087 | |
Taxable, Revenue Bonds, Series J | | | 4.131 | | | | 05/15/45 | | | | 675 | | | | 755,345 | |
| | | | | | | | | | | | | | | | |
| | | | | | | | | | | | | | | 8,521,838 | |
| | | | |
Colorado 0.1% | | | | | | | | | | | | | | | | |
Regional Transportation District Sales Tax Revenue,
BABs, Revenue Bonds, Series 2010-B | | | 5.844 | | | | 11/01/50 | | | | 1,190 | | | | 1,792,176 | |
See Notes to Financial Statements.
| | | | | | | | | | | | | | | | |
| | | | |
| Description | | Interest
Rate | | | Maturity
Date | | | Principal
Amount (000)# | | | Value | |
| | | | |
MUNICIPAL BONDS (Continued) | | | | | | | | | | | | | | | | |
| | | | |
Illinois 0.1% | | | | | | | | | | | | | | | | |
Chicago O’Hare International Airport,
BABs, Revenue Bonds, Series B | | | 6.395 | % | | | 01/01/40 | | | | 360 | | | $ | 527,292 | |
State of Illinois,
General Obligation Unlimited, Taxable | | | 5.100 | | | | 06/01/33 | | | | 1,400 | | | | 1,513,666 | |
| | | | | | | | | | | | | | | | |
| | | | | | | | | | | | | | | 2,040,958 | |
| | | | |
New Jersey 0.1% | | | | | | | | | | | | | | | | |
New Jersey Turnpike Authority,
BABs, Revenue Bonds, Series F | | | 7.414 | | | | 01/01/40 | | | | 2,000 | | | | 3,202,680 | |
Rutgers State University of New Jersey,
BABs, Revenue Bonds | | | 5.665 | | | | 05/01/40 | | | | 200 | | | | 262,250 | |
| | | | | | | | | | | | | | | | |
| | | | | | | | | | | | | | | 3,464,930 | |
| | | | |
New York 0.0% | | | | | | | | | | | | | | | | |
New York City Water & Sewer System,
BABs, Taxable, Revenue Bonds | | | 5.882 | | | | 06/15/44 | | | | 400 | | | | 587,300 | |
| | | | |
Ohio 0.0% | | | | | | | | | | | | | | | | |
Ohio State University (The),
Taxable, Revenue Bonds, Series A | | | 4.800 | | | | 06/01/2111 | | | | 180 | | | | 235,301 | |
| | | | |
Puerto Rico 0.9% | | | | | | | | | | | | | | | | |
Puerto Rico Sales Tax Financing Corp. Sales Tax Revenue, | | | | | | | | | | | | | | | | |
Revenue Bonds, Restructured, Series A-1 | | | 4.750 | | | | 07/01/53 | | | | 9,346 | | | | 9,653,484 | |
Revenue Bonds, Restructured, Series A-1 | | | 5.000 | | | | 07/01/58 | | | | 10,104 | | | | 10,607,179 | |
| | | | | | | | | | | | | | | | |
| | | | | | | | | | | | | | | 20,260,663 | |
| | | | |
Texas 0.0% | | | | | | | | | | | | | | | | |
City of San Antonio Electric & Gas Systems Revenue,
Taxable, Revenue Bonds | | | 4.427 | | | | 02/01/42 | | | | 120 | | | | 143,000 | |
| | | | | | | | | | | | | | | | |
TOTAL MUNICIPAL BONDS
(cost $33,659,937) | | | | | | | | | | | | | | | 37,046,166 | |
| | | | | | | | | | | | | | | | |
| | | | |
RESIDENTIAL MORTGAGE-BACKED SECURITIES 5.3% | | | | | | | | | | | | | | | | |
Banc of America Funding Corp., | | | | | | | | | | | | | | | | |
Series 2015-R03, Class 1A1, 144A, 1 Month LIBOR + 0.190% | | | 2.013 | (c) | | | 03/27/36 | | | | 7,349 | | | | 7,185,619 | |
Series 2015-R03, Class 6A1, 144A, 1 Month LIBOR + 0.170%
(Cap N/A, Floor 0.170%) | | | 1.993 | (c) | | | 05/27/36 | | | | 1,283 | | | | 1,272,721 | |
See Notes to Financial Statements.
| | | | |
| PGIM Absolute Return Bond Fund | | | 47 | |
Schedule of Investments (continued)
as of October 31, 2019
| | | | | | | | | | | | | | | | |
| | | | |
| Description | | Interest
Rate | | | Maturity
Date | | | Principal
Amount (000)# | | | Value | |
| | | | |
RESIDENTIAL MORTGAGE-BACKED SECURITIES (Continued) | | | | | | | | | | | | | | | | |
Banc of America Funding Trust, | | | | | | | | | | | | | | | | |
Series 2014-R02, Class 2A1, 144A, 1 Month LIBOR + 0.210%
(Cap N/A, Floor 0.210%) | | | 2.014 | %(c) | | | 05/26/37 | | | | 1,060 | | | $ | 1,054,810 | |
Series 2014-R05, Class 1A1, 144A, 6 Month LIBOR + 1.500%
(Cap 11.000%, Floor 1.500%) | | | 3.559 | (c) | | | 09/26/45 | | | | 1,809 | | | | 1,829,436 | |
Series 2015-R04, Class 4A1, 144A | | | 3.500 | (cc) | | | 01/27/30 | | | | 889 | | | | 888,198 | |
Bellemeade Re Ltd. (Bermuda), | | | | | | | | | | | | | | | | |
Series 2017-01, Class M1, 144A, 1 Month LIBOR + 1.700%
(Cap N/A, Floor 0.000%) | | | 3.523 | (c) | | | 10/25/27 | | | | 423 | | | | 424,072 | |
Series 2018-01A, Class M1B, 144A, 1 Month LIBOR + 1.600%
(Cap N/A, Floor 0.000%) | | | 3.423 | (c) | | | 04/25/28 | | | | 1,905 | | | | 1,906,968 | |
Series 2018-02A, Class M1B, 144A, 1 Month LIBOR + 1.350%
(Cap N/A, Floor 0.000%) | | | 3.173 | (c) | | | 08/25/28 | | | | 1,200 | | | | 1,201,925 | |
Series 2018-02A, Class M1C, 144A, 1 Month LIBOR + 1.600%
(Cap N/A, Floor 0.000%) | | | 3.423 | (c) | | | 08/25/28 | | | | 1,200 | | | | 1,202,192 | |
Series 2018-03A, Class M1B, 144A, 1 Month LIBOR + 1.850%
(Cap N/A, Floor 1.850%) | | | 3.673 | (c) | | | 10/25/28 | | | | 3,290 | | | | 3,289,995 | |
BVRT Financing Trust,
Series 2019-01, Class F, 144A^ | | | 3.996 | | | | 09/15/21 | | | | 26,300 | | | | 26,300,000 | |
Central Park Funding Trust,
Series 2018-01, Class A, 144A, 1 Month LIBOR + 1.500%
(Cap N/A, Floor 1.500%) | | | 3.532 | (c) | | | 11/01/23 | | | | 17,200 | | | | 17,200,000 | |
Chase Mortgage Finance Trust,
Series 2007-A01, Class 1A3 | | | 4.698 | (cc) | | | 02/25/37 | | | | 119 | | | | 122,611 | |
CIM Trust, | | | | | | | | | | | | | | | | |
Series 2017-02, Class A1, 144A, 1 Month LIBOR + 2.000%
(Cap N/A, Floor 2.000%) | | | 4.032 | (c) | | | 12/25/57 | | | | 4,105 | | | | 4,135,056 | |
Series 2017-03, Class A1, 144A, 1 Month LIBOR + 2.000%
(Cap N/A, Floor 0.000%) | | | 4.032 | (c) | | | 01/25/57 | | | | 3,083 | | | | 3,147,533 | |
Series 2017-06, Class A1, 144A | | | 3.015 | (cc) | | | 06/25/57 | | | | 1,767 | | | | 1,777,917 | |
Series 2017-08, Class A1, 144A | | | 3.000 | (cc) | | | 12/25/65 | | | | 3,668 | | | | 3,677,776 | |
Eagle Re Ltd. (Bermuda),
Series 2018-01, Class M1, 144A, 1 Month LIBOR + 1.700%
(Cap N/A, Floor 1.700%) | | | 3.523 | (c) | | | 11/25/28 | | | | 4,528 | | | | 4,535,636 | |
Freddie Mac Structured Agency Credit Risk Debt Notes, | | | | | | | | | | | | | | | | |
Series 2015-DNA01, Class M3, 1 Month LIBOR + 3.300%
(Cap N/A, Floor 0.000%) | | | 5.123 | (c) | | | 10/25/27 | | | | 2,000 | | | | 2,125,986 | |
Series 2019-DNA01, Class M2, 144A, 1 Month LIBOR + 2.650%
(Cap N/A, Floor 0.000%) | | | 4.473 | (c) | | | 01/25/49 | | | | 790 | | | | 800,261 | |
GSMSC Resecuritization Trust, | | | | | | | | | | | | | | | | |
Series 2015-03R, Class 1A1, 144A, 1 Month LIBOR + 0.140%
(Cap N/A, Floor 0.140%) | | | 1.963 | (c) | | | 01/26/37 | | | | 826 | | | | 821,013 | |
Series 2015-03R, Class 1A2, 144A, 1 Month LIBOR + 0.140%
(Cap N/A, Floor 0.140%) | | | 1.963 | (c) | | | 01/26/37 | | | | 1,670 | | | | 1,625,078 | |
See Notes to Financial Statements.
| | | | | | | | | | | | | | | | |
| | | | |
| Description | | Interest
Rate | | | Maturity
Date | | | Principal
Amount (000)# | | | Value | |
| | | | |
RESIDENTIAL MORTGAGE-BACKED SECURITIES (Continued) | | | | | | | | | | | | | | | | |
GSMSC Resecuritization Trust, (cont’d.) | | | | | | | | | | | | | | | | |
Series 2015-03R, Class 2A1, 144A, 1 Month LIBOR + 0.140%
(Cap N/A, Floor 0.140%) | | | 1.963 | %(c) | | | 10/26/36 | | | | 2,292 | | | $ | 2,258,257 | |
Series 2015-03R, Class 2A2, 144A, 1 Month LIBOR + 0.140%
(Cap N/A, Floor 0.140%) | | | 1.963 | (c) | | | 10/26/36 | | | | 1,400 | | | | 1,309,707 | |
Home Re Ltd. (Bermuda),
Series 2018-01, Class M1, 144A, 1 Month LIBOR + 1.600%
(Cap N/A, Floor 0.000%) | | | 3.423 | (c) | | | 10/25/28 | | | | 1,471 | | | | 1,471,871 | |
JPMorgan Mortgage Trust, | | | | | | | | | | | | | | | | |
Series 2007-A01, Class 4A1 | | | 4.658 | (cc) | | | 07/25/35 | | | | 111 | | | | 114,325 | |
Series 2018-07FRB, Class A2, 144A, 1 Month LIBOR + 0.750%
(Cap N/A, Floor 0.000%) | | | 2.768 | (c) | | | 04/25/46 | | | | 2,266 | | | | 2,265,431 | |
LSTAR Securities Investment Trust,
Series 2018-02, Class A1, 144A, 1 Month LIBOR + 1.500%
(Cap N/A, Floor 0.000%) | | | 3.532 | (c) | | | 04/01/23 | | | | 3,648 | | | | 3,642,363 | |
New Residential Mortgage Loan Trust, | | | | | | | | | | | | | | | | |
Series 2018-04A, Class A1S, 144A, 1 Month LIBOR + 0.750%
(Cap N/A, Floor 0.750%) | | | 2.573 | (c) | | | 01/25/48 | | | | 4,056 | | | | 4,045,959 | |
Series 2018-RPL01, Class A1, 144A | | | 3.500 | (cc) | | | 12/25/57 | | | | 18,180 | | | | 18,913,269 | |
Oaktown Re II Ltd. (Bermuda),
Series 2018-01A, Class M1, 144A, 1 Month LIBOR + 1.550%
(Cap N/A, Floor 0.000%) | | | 3.373 | (c) | | | 07/25/28 | | | | 1,130 | | | | 1,130,599 | |
Radnor Re Ltd. (Bermuda), | | | | | | | | | | | | | | | | |
Series 2018-01, Class M1, 144A, 1 Month LIBOR + 1.400%
(Cap N/A, Floor 0.000%) | | | 3.223 | (c) | | | 03/25/28 | | | | 1,474 | | | | 1,474,150 | |
Series 2018-01, Class M2, 144A, 1 Month LIBOR + 2.700%
(Cap N/A, Floor 0.000%) | | | 4.523 | (c) | | | 03/25/28 | | | | 1,240 | | | | 1,246,021 | |
Structured Asset Securities Corp.,
Series 2003-37A, Class 3A7 | | | 4.370 | (cc) | | | 12/25/33 | | | | 471 | | | | 481,335 | |
Wells Fargo Mortgage Backed Securities Trust,
Series 2004-EE, Class 2A1 | | | 4.910 | (cc) | | | 12/25/34 | | | | 81 | | | | 84,260 | |
| | | | | | | | | | | | | | | | |
TOTAL RESIDENTIAL MORTGAGE-BACKED SECURITIES
(cost $122,800,516) | | | | | | | | | | | | | | | 124,962,350 | |
| | | | | | | | | | | | | | | | |
| | | | |
SOVEREIGN BONDS 8.0% | | | | | | | | | | | | | | | | |
Argentine Republic Government International Bond (Argentina), | | | | | | | | | | | | | | | | |
Sr. Unsec’d. Notes | | | 3.875 | | | | 01/15/22 | | | EUR | 1,000 | | | | 437,755 | |
Sr. Unsec’d. Notes | | | 4.625 | | | | 01/11/23 | | | | 2,800 | | | | 1,122,800 | |
Sr. Unsec’d. Notes | | | 5.000 | | | | 01/15/27 | | | EUR | 3,970 | | | | 1,676,431 | |
Sr. Unsec’d. Notes | | | 5.625 | | | | 01/26/22 | | | | 2,000 | | | | 848,020 | |
Sr. Unsec’d. Notes | | | 6.875 | | | | 04/22/21 | | | | 7,175 | | | | 3,228,822 | |
Sr. Unsec’d. Notes | | | 7.820 | | | | 12/31/33 | | | EUR | 1,064 | | | | 563,529 | |
See Notes to Financial Statements.
| | | | |
| PGIM Absolute Return Bond Fund | | | 49 | |
Schedule of Investments (continued)
as of October 31, 2019
| | | | | | | | | | | | | | | | |
| | | | |
| Description | | Interest
Rate | | | Maturity
Date | | | Principal
Amount (000)# | | | Value | |
| | | | |
SOVEREIGN BONDS (Continued) | | | | | | | | | | | | | | | | |
Argentine Republic Government International Bond (Argentina), (cont’d.) | | | | | | | | | | | | | | | | |
Sr. Unsec’d. Notes | | | 7.820 | % | | | 12/31/33 | | | EUR | 139 | | | $ | 72,716 | |
Brazil Loan Trust 1 (Brazil),
Gov’t. Gtd. Notes | | | 5.477 | | | | 07/24/23 | | | | 845 | | | | 877,589 | |
Brazil Minas SPE via State of Minas Gerais (Brazil),
Gov’t. Gtd. Notes | | | 5.333 | | | | 02/15/28 | | | | 6,363 | | | | 6,760,751 | |
City of Rome (Italy),
Sr. Unsec’d. Notes, EMTN | | | 5.345 | | | | 01/27/48 | | | EUR | 2,000 | | | | 3,547,135 | |
Ecuador Government International Bond (Ecuador), | | | | | | | | | | | | | | | | |
Sr. Unsec’d. Notes | | | 10.500 | | | | 03/24/20 | | | | 789 | | | | 799,857 | |
Sr. Unsec’d. Notes | | | 10.750 | | | | 03/28/22 | | | | 2,890 | | | | 3,067,041 | |
Egypt Government International Bond (Egypt), | | | | | | | | | | | | | | | | |
Sr. Unsec’d. Notes, 144A, GMTN | | | 4.750 | | | | 04/11/25 | | | EUR | 1,995 | | | | 2,301,529 | |
Sr. Unsec’d. Notes, 144A, GMTN | | | 6.375 | | | | 04/11/31 | | | EUR | 2,320 | | | | 2,687,761 | |
Sr. Unsec’d. Notes, EMTN | | | 5.625 | | | | 04/16/30 | | | EUR | 3,000 | | | | 3,352,592 | |
Export Credit Bank of Turkey (Turkey),
Sr. Unsec’d. Notes, 144A | | | 8.250 | | | | 01/24/24 | | | | 3,825 | | | | 4,079,745 | |
Hellenic Republic Government Bond (Greece), | | | | | | | | | | | | | | | | |
Bonds | | | 3.000 | (cc) | | | 02/24/23 | | | EUR | 767 | | | | 942,880 | |
Bonds | | | 3.000 | (cc) | | | 02/24/24 | | | EUR | 1,399 | | | | 1,761,416 | |
Bonds | | | 3.000 | (cc) | | | 02/24/25 | | | EUR | 533 | | | | 686,775 | |
Bonds | | | 3.000 | (cc) | | | 02/24/26 | | | EUR | 1,779 | | | | 2,343,830 | |
Bonds | | | 3.000 | (cc) | | | 02/24/27 | | | EUR | 571 | | | | 758,076 | |
Bonds | | | 3.000 | (cc) | | | 02/24/28 | | | EUR | 2,869 | | | | 3,884,509 | |
Bonds | | | 3.000 | (cc) | | | 02/24/29 | | | EUR | 1,658 | | | | 2,263,750 | |
Bonds | | | 3.000 | (cc) | | | 02/24/30 | | | EUR | 637 | | | | 876,351 | |
Bonds | | | 3.000 | (cc) | | | 02/24/31 | | | EUR | 1,831 | | | | 2,548,568 | |
Bonds | | | 3.000 | (cc) | | | 02/24/32 | | | EUR | 2,271 | | | | 3,178,177 | |
Bonds | | | 3.000 | (cc) | | | 02/24/33 | | | EUR | 539 | | | | 752,087 | |
Bonds | | | 3.000 | (cc) | | | 02/24/34 | | | EUR | 1,687 | | | | 2,370,756 | |
Bonds | | | 3.000 | (cc) | | | 02/24/35 | | | EUR | 2,383 | | | | 3,339,402 | |
Bonds | | | 3.000 | (cc) | | | 02/24/36 | | | EUR | 506 | | | | 710,061 | |
Bonds | | | 3.000 | (cc) | | | 02/24/37 | | | EUR | 601 | | | | 855,147 | |
Bonds | | | 3.000 | (cc) | | | 02/24/38 | | | EUR | 793 | | | | 1,129,864 | |
Bonds | | | 3.000 | (cc) | | | 02/24/39 | | | EUR | 1,830 | | | | 2,618,718 | |
Bonds | | | 3.000 | (cc) | | | 02/24/40 | | | EUR | 503 | | | | 721,745 | |
Bonds | | | 3.000 | (cc) | | | 02/24/41 | | | EUR | 555 | | | | 797,508 | |
Bonds | | | 3.000 | (cc) | | | 02/24/42 | | | EUR | 512 | | | | 741,612 | |
Bonds | | | 3.500 | | | | 01/30/23 | | | EUR | 3,385 | | | | 4,164,334 | |
Bonds | | | 3.750 | | | | 01/30/28 | | | EUR | 3,600 | | | | 4,864,510 | |
Bonds | | | 4.000 | | | | 01/30/37 | | | EUR | 2,500 | | | | 3,622,396 | |
Bonds | | | 4.200 | | | | 01/30/42 | | | EUR | 1,515 | | | | 2,313,678 | |
See Notes to Financial Statements.
| | | | | | | | | | | | | | | | |
| | | | |
| Description | | Interest
Rate | | | Maturity
Date | | | Principal
Amount (000)# | | | Value | |
| | | | |
SOVEREIGN BONDS (Continued) | | | | | | | | | | | | | | | | |
Hellenic Republic Government International Bond (Greece), | | | | | | | | | | | | | | | | |
Sr. Unsec’d. Notes | | | 5.200 | % | | | 07/17/34 | | | EUR | 5,485 | | | $ | 8,584,896 | |
Sr. Unsec’d. Notes | | | 6.140 | | | | 04/14/28 | | | EUR | 2,000 | | | | 3,032,469 | |
Indonesia Government International Bond (Indonesia), | | | | | | | | | | | | | | | | |
Sr. Unsec’d. Notes | | | 1.450 | | | | 09/18/26 | | | EUR | 805 | | | | 928,118 | |
Sr. Unsec’d. Notes | | | 1.750 | | | | 04/24/25 | | | EUR | 2,910 | | | | 3,398,063 | |
Sr. Unsec’d. Notes | | | 3.375 | | | | 07/30/25 | | | EUR | 2,975 | | | | 3,783,336 | |
Sr. Unsec’d. Notes, EMTN | | | 3.750 | | | | 06/14/28 | | | EUR | 775 | | | | 1,048,466 | |
Iraq International Bond (Iraq), | | | | | | | | | | | | | | | | |
Sr. Unsec’d. Notes | | | 5.800 | | | | 01/15/28 | | | | 1,500 | | | | 1,440,300 | |
Sr. Unsec’d. Notes | | | 6.752 | | | | 03/09/23 | | | | 4,715 | | | | 4,749,985 | |
Ivory Coast Government International Bond (Ivory Coast), | | | | | | | | | | | | | | | | |
Sr. Unsec’d. Notes | | | 5.125 | | | | 06/15/25 | | | EUR | 500 | | | | 603,093 | |
Sr. Unsec’d. Notes, 144A | | | 5.125 | | | | 06/15/25 | | | EUR | 2,250 | | | | 2,713,918 | |
Kenya Government International Bond (Kenya),
Sr. Unsec’d. Notes | | | 6.875 | | | | 06/24/24 | | | | 3,005 | | | | 3,188,353 | |
Provincia de Buenos Aires (Argentina), | | | | | | | | | | | | | | | | |
Sr. Unsec’d. Notes, 144A | | | 6.500 | | | | 02/15/23 | | | | 600 | | | | 201,006 | |
Sr. Unsec’d. Notes, 144A | | | 9.950 | | | | 06/09/21 | | | | 1,650 | | | | 627,017 | |
Republic of Italy Government International Bond (Italy), | | | | | | | | | | | | | | | | |
Sr. Unsec’d. Notes | | | 6.875 | | | | 09/27/23 | | | | 12,083 | | | | 14,029,861 | |
Sr. Unsec’d. Notes, EMTN | | | 6.000 | | | | 08/04/28 | | | GBP | 3,860 | | | | 6,417,789 | |
Sr. Unsec’d. Notes, MTN | | | 5.375 | | | | 06/15/33 | | | | 2,300 | | | | 2,764,317 | |
Republic of South Africa Government International Bond (South Africa),
Sr. Unsec’d. Notes | | | 5.750 | | | | 09/30/49 | | | | 2,770 | | | | 2,680,307 | |
Romanian Government International Bond (Romania),
Sr. Unsec’d. Notes, EMTN | | | 4.125 | | | | 03/11/39 | | | EUR | 4,759 | | | | 6,396,325 | |
Saudi Government International Bond (Saudi Arabia),
Sr. Unsec’d. Notes, 144A | | | 2.000 | | | | 07/09/39 | | | EUR | 882 | | | | 1,037,798 | |
Senegal Government International Bond (Senegal),
Sr. Unsec’d. Notes, 144A | | | 4.750 | | | | 03/13/28 | | | EUR | 900 | | | | 1,037,848 | |
Serbia International Bond (Serbia),
Sr. Unsec’d. Notes, 144A | | | 1.500 | | | | 06/26/29 | | | EUR | 4,000 | | | | 4,589,683 | |
Sri Lanka Government International Bond (Sri Lanka),
Sr. Unsec’d. Notes | | | 6.250 | | | | 07/27/21 | | | | 2,100 | | | | 2,135,700 | |
Turkey Government International Bond (Turkey), | | | | | | | | | | | | | | | | |
Sr. Unsec’d. Notes | | | 5.625 | | | | 03/30/21 | | | | 1,450 | | | | 1,481,448 | |
Sr. Unsec’d. Notes | | | 6.250 | | | | 09/26/22 | | | | 3,425 | | | | 3,541,347 | |
Sr. Unsec’d. Notes | | | 6.350 | | | | 08/10/24 | | | | 4,010 | | | | 4,130,300 | |
Ukraine Government International Bond (Ukraine),
Sr. Unsec’d. Notes | | | 7.750 | | | | 09/01/20 | | | | 315 | | | | 323,348 | |
See Notes to Financial Statements.
| | | | |
| PGIM Absolute Return Bond Fund | | | 51 | |
Schedule of Investments (continued)
as of October 31, 2019
| | | | | | | | | | | | | | | | |
| | | | |
| Description | | Interest
Rate | | | Maturity
Date | | | Principal
Amount (000)# | | | Value | |
| | | | |
SOVEREIGN BONDS (Continued) | | | | | | | | | | | | | | | | |
Ukraine Government International Bond (Ukraine), (cont’d.) | | | | | | | | | | | | | | | | |
Sr. Unsec’d. Notes | | | 7.750 | % | | | 09/01/21 | | | | 350 | | | $ | 365,750 | |
Sr. Unsec’d. Notes | | | 7.750 | | | | 09/01/22 | | | | 1,000 | | | | 1,063,500 | |
Sr. Unsec’d. Notes | | | 7.750 | | | | 09/01/26 | | | | 4,760 | | | | 5,111,050 | |
Sr. Unsec’d. Notes | | | 8.994 | | | | 02/01/24 | | | | 350 | | | | 389,375 | |
Sr. Unsec’d. Notes, 144A | | | 7.750 | | | | 09/01/20 | | | | 8,173 | | | | 8,389,584 | |
Sr. Unsec’d. Notes, 144A | | | 7.750 | | | | 09/01/21 | | | | 3,650 | | | | 3,814,250 | |
Sr. Unsec’d. Notes, 144A | | | 7.750 | | | | 09/01/22 | | | | 2,060 | | | | 2,190,810 | |
Sr. Unsec’d. Notes, 144A | | | 8.994 | | | | 02/01/24 | | | | 800 | | | | 890,000 | |
| | | | | | | | | | | | | | | | |
TOTAL SOVEREIGN BONDS
(cost $184,298,726) | | | | | | | | | | | | | | | 190,749,633 | |
| | | | | | | | | | | | | | | | |
| | | | |
U.S. TREASURY OBLIGATIONS 1.1% | | | | | | | | | | | | | | | | |
U.S. Treasury Bonds(k) | | | 2.500 | | | | 02/15/45 | | | | 3,760 | | | | 3,994,559 | |
U.S. Treasury Bonds | | | 2.875 | | | | 05/15/49 | | | | 100 | | | | 115,102 | |
U.S. Treasury Bonds(h)(k) | | | 3.625 | | | | 08/15/43 | | | | 3,055 | | | | 3,890,471 | |
U.S. Treasury Notes(k) | | | 2.250 | | | | 11/15/24 | | | | 3,960 | | | | 4,094,578 | |
U.S. Treasury Notes(k) | | | 2.250 | | | | 11/15/27 | | | | 150 | | | | 156,961 | |
U.S. Treasury Notes(k) | | | 2.500 | | | | 02/28/21 | | | | 210 | | | | 212,469 | |
U.S. Treasury Strips Coupon(k) | | | 2.174 | (s) | | | 05/15/29 | | | | 4,420 | | | | 3,724,441 | |
U.S. Treasury Strips Coupon(k) | | | 2.783 | (s) | | | 08/15/29 | | | | 2,100 | | | | 1,759,926 | |
U.S. Treasury Strips Coupon(k) | | | 2.878 | (s) | | | 05/15/31 | | | | 2,100 | | | | 1,690,422 | |
U.S. Treasury Strips Coupon(k) | | | 3.042 | (s) | | | 11/15/35 | | | | 4,200 | | | | 3,014,254 | |
U.S. Treasury Strips Coupon(k) | | | 3.202 | (s) | | | 08/15/40 | | | | 4,200 | | | | 2,648,015 | |
| | | | | | | | | | | | | | | | |
TOTAL U.S. TREASURY OBLIGATIONS
(cost $23,089,103) | | | | | | | | | | | | | | | 25,301,198 | |
| | | | | | | | | | | | | | | | |
| | | | |
| | | | | | | | | Shares | | | | |
| | | | |
COMMON STOCK 0.0% | | | | | | | | | | | | | | | | |
| | | | |
Oil, Gas & Consumable Fuels | | | | | | | | | | | | | | | | |
Frontera Energy Corp. (Colombia)
(cost $2,719,465) | | | | | | | | | | | 132,434 | | | | 1,055,499 | |
| | | | | | | | | | | | | | | | |
TOTAL LONG-TERM INVESTMENTS
(cost $2,070,412,834) | | | | | | | | | | | | | | | 2,112,731,984 | |
| | | | | | | | | | | | | | | | |
See Notes to Financial Statements.
| | | | | | | | | | | | | | | | |
| Description | | | | | | | | Shares | | | Value | |
| | | | |
SHORT-TERM INVESTMENTS 16.5% | | | | | | | | | | | | | | | | |
| | | | |
AFFILIATED MUTUAL FUNDS 13.6% | | | | | | | | | | | | | | | | |
PGIM Core Ultra Short Bond Fund(w) | | | | | | | | | | | 178,177,086 | | | $ | 178,177,086 | |
PGIM Institutional Money Market Fund
(cost $144,081,042; includes $143,867,101 of cash collateral for securities on loan)(b)(w) | | | | | | | | | | | 144,080,204 | | | | 144,109,020 | |
| | | | | | | | | | | | | | | | |
TOTAL AFFILIATED MUTUAL FUNDS
(cost $322,258,128) | | | | | | | | | | | | | | | 322,286,106 | |
| | | | | | | | | | | | | | | | |
| | | | |
OPTIONS PURCHASED*~ 2.9%
(cost $131,101,456) | | | | | | | | | | | | | | | 69,614,735 | |
| | | | | | | | | | | | | | | | |
TOTAL SHORT-TERM INVESTMENTS
(cost $453,359,584) | | | | | | | | | | | | | | | 391,900,841 | |
| | | | | | | | | | | | | | | | |
| | | | |
TOTAL INVESTMENTS, BEFORE OPTIONS WRITTEN 105.7%
(cost $2,523,772,418) | | | | | | | | | | | | | | | 2,504,632,825 | |
| | | | | | | | | | | | | | | | |
| | | | |
OPTIONS WRITTEN*~ (2.5)%
(premiums received $118,132,267) | | | | | | | | | | | | | | | (58,605,480 | ) |
| | | | | | | | | | | | | | | | |
| | | | |
TOTAL INVESTMENTS, NET OF OPTIONS WRITTEN 103.2%
(cost $2,405,640,151) | | | | | | | | | | | | | | | 2,446,027,345 | |
Liabilities in excess of other assets(z) (3.2)% | | | | | | | | | | | | | | | (76,528,288 | ) |
| | | | | | | | | | | | | | | | |
NET ASSETS 100.0% | | | | | | | | | | | | | | $ | 2,369,499,057 | |
| | | | | | | | | | | | | | | | |
See the Glossary for a list of the abbreviation(s) used in the annual report:
AUD—Australian Dollar
BRL—Brazilian Real
CAD—Canadian Dollar
CHF—Swiss Franc
CLP—Chilean Peso
CNH—Chinese Renminbi
COP—Colombian Peso
CZK—Czech Koruna
EUR—Euro
GBP—British Pound
HUF—Hungarian Forint
IDR—Indonesian Rupiah
ILS—Israeli Shekel
INR—Indian Rupee
JPY—Japanese Yen
KRW—South Korean Won
MXN—Mexican Peso
NOK—Norwegian Krone
NZD—New Zealand Dollar
PEN—Peruvian Nuevo Sol
See Notes to Financial Statements.
| | | | |
| PGIM Absolute Return Bond Fund | | | 53 | |
Schedule of Investments (continued)
as of October 31, 2019
PHP—Philippine Peso
PLN—Polish Zloty
RUB—Russian Ruble
SAR—Saudi Arabian Riyal
SEK—Swedish Krona
SGD—Singapore Dollar
THB—Thai Baht
TRY—Turkish Lira
TWD—New Taiwanese Dollar
USD—US Dollar
ZAR—South African Rand
144A—Security was purchased pursuant to Rule 144A under the Securities Act of 1933 and, pursuant to the requirements of Rule 144A, may not be resold except to qualified institutional buyers.
A—Annual payment frequency for swaps
ABS—Asset-Backed Security
BABs—Build America Bonds
BROIS—Brazil Overnight Index Swap
CDX—Credit Derivative Index
CLO—Collateralized Loan Obligation
CMBX—Commercial Mortgage-Backed Index
CMS—Constant Maturity Swap
EMTN—Euro Medium Term Note
EONIA—Euro Overnight Index Average
EURIBOR—Euro Interbank Offered Rate
GMAC—General Motors Acceptance Corporation
GMTN—Global Medium Term Note
IO—Interest Only (Principal amount represents notional)
iTraxx—International Credit Derivative Index
L2—Level 2
L3—Level 3
LIBOR—London Interbank Offered Rate
M—Monthly payment frequency for swaps
MTN—Medium Term Note
MUNIPSA—Municipal Swap Weekly Yield Index
OTC—Over-the-counter
PIK—Payment-in-Kind
Q—Quarterly payment frequency for swaps
REITs—Real Estate Investment Trust
S—Semiannual payment frequency for swaps
SONIA—Sterling Overnight Index Average
Strips—Separate Trading of Registered Interest and Principal of Securities
T—Swap payment upon termination
USOIS—United States Overnight Index Swap
| * | Non-income producing security. |
| # | Principal or notional amount is shown in U.S. dollars unless otherwise stated. |
| ~ | See tables subsequent to the Schedule of Investments for options detail. |
| ^ | Indicates a Level 3 security. The aggregate value of Level 3 securities is $40,632,657 and 1.7% of net assets. |
| (a) | All or a portion of security is on loan. The aggregate market value of such securities, including those sold and pending settlement, is $140,307,590; cash collateral of $143,867,101 (included in liabilities) was received with which the Fund purchased highly liquid short-term investments. |
| (b) | Represents security purchased with cash collateral received for securities on loan and includes dividend reinvestment. |
| (c) | Variable rate instrument. The interest rate shown reflects the rate in effect at October 31, 2019. |
See Notes to Financial Statements.
| (cc) | Variable rate instrument. The rate shown is based on the latest available information as of October 31, 2019. Certain variable rate securities are not based on a published reference rate and spread but are determined by the issuer or agent and are based on current market conditions. These securities do not indicate a reference rate and spread in their description. |
| (ff) | Variable rate security. Security may be issued at a fixed coupon rate, which converts to a variable rate at a specified date. Rate shown is the rate in effect as of period end. |
| (h) | Represents security, or a portion thereof, segregated as collateral for OTC derivatives. |
| (k) | Represents security, or a portion thereof, segregated as collateral for centrally cleared/exchange-traded derivatives. |
| (p) | Interest rate not available as of October 31, 2019. |
| (rr) | Perpetual security with no stated maturity date. |
| (s) | Represents zero coupon bond or principal only security. Rate represents yield to maturity at purchase date. |
| (w) | PGIM Investments LLC, the manager of the Fund, also serves as manager of the PGIM Core Ultra Short Bond Fund and PGIM Institutional Money Market Fund. |
| (z) | Includes net unrealized appreciation/(depreciation) and/or market value of the below holdings which are excluded from the Schedule of Investments: |
Options Purchased:
OTC Traded
| | | | | | | | | | | | | | | | | | | | | | | | | | | | |
Description | | Call/
Put | | Counterparty | | Expiration
Date | | | Strike | | | Contracts | | | Notional
Amount
(000)# | | | Value | |
2-Year 10 CMS Curve CAP | | Call | | Barclays Bank PLC | | | 11/21/19 | | | | 0.12 | % | | | — | | | | | | | | 16,800 | | | $ | 6,402 | |
2-Year 10 CMS Curve CAP | | Call | | Morgan Stanley & Co. International PLC | | | 11/21/19 | | | | 0.13 | % | | | — | | | | | | | | 11,200 | | | | 2,756 | |
2-Year 10 CMS Curve CAP | | Call | | Barclays Bank PLC | | | 07/12/21 | | | | 0.11 | % | | | — | | | | | | | | 9,409 | | | | 105,361 | |
2-Year 10 CMS Curve CAP | | Call | | Bank of America, N.A. | | | 08/16/21 | | | | 0.15 | % | | | — | | | | | | | | 22,870 | | | | 239,707 | |
2-Year 10 CMS Curve CAP | | Call | | Bank of America, N.A. | | | 08/20/21 | | | | 0.15 | % | | | — | | | | | | | | 46,333 | | | | 501,238 | |
2-Year 10 CMS Curve CAP | | Call | | Bank of America, N.A. | | | 09/13/21 | | | | 0.14 | % | | | — | | | | | | | | 46,980 | | | | 532,826 | |
2-Year 10 CMS Curve CAP | | Call | | Barclays Bank PLC | | | 11/09/21 | | | | 0.21 | % | | | — | | | | | | | | 10,000 | | | | 104,735 | |
Currency Option EUR vs GBP | | Call | | Morgan Stanley & Co. International PLC | | | 01/20/20 | | | | 1.00 | | | | — | | | | EUR | | | | 30,600 | | | | 9,516 | |
Currency Option EUR vs TRY | | Call | | BNP Paribas S.A. | | | 04/28/20 | | | | 10.00 | | | | — | | | | EUR | | | | 30,000 | | | | 83,671 | |
Currency Option EUR vs TRY | | Call | | Morgan Stanley & Co. International PLC | | | 07/28/20 | | | | 12.00 | | | | — | | | | EUR | | | | 30,000 | | | | 116,718 | |
Currency Option EUR vs ZAR | | Call | | Morgan Stanley & Co. International PLC | | | 12/24/19 | | | | 24.00 | | | | — | | | | EUR | | | | 25,000 | | | | 444 | |
Currency Option EUR vs ZAR | | Call | | Goldman Sachs International | | | 08/27/20 | | | | 28.00 | | | | — | | | | EUR | | | | 34,000 | | | | 63,675 | |
Currency Option EUR vs ZAR | | Call | | Goldman Sachs International | | | 12/21/20 | | | | 21.00 | | | | — | | | | EUR | | | | 33,500 | | | | 914,446 | |
Currency Option EUR vs ZAR | | Call | | Morgan Stanley & Co. International PLC | | | 12/21/20 | | | | 25.00 | | | | — | | | | EUR | | | | 67,000 | | | | 603,376 | |
See Notes to Financial Statements.
| | | | |
| PGIM Absolute Return Bond Fund | | | 55 | |
Schedule of Investments (continued)
as of October 31, 2019
Options Purchased (continued):
OTC Traded
| | | | | | | | | | | | | | | | | | | | | | | | | | | | |
Description | | Call/
Put | | Counterparty | | Expiration
Date | | | Strike | | | Contracts | | | Notional
Amount
(000)# | | | Value | |
Currency Option USD vs BRL | | Call | | Citibank, N.A. | | | 12/19/19 | | | | 6.00 | | | | — | | | | | | | | 39,000 | | | $ | 61 | |
Currency Option USD vs BRL | | Call | | Deutsche Bank AG | | | 12/20/19 | | | | 5.00 | | | | — | | | | | | | | 30,000 | | | | 1,742 | |
Currency Option USD vs BRL | | Call | | Deutsche Bank AG | | | 03/27/20 | | | | 4.65 | | | | — | | | | | | | | 30,000 | | | | 128,292 | |
Currency Option USD vs BRL | | Call | | Morgan Stanley & Co. International PLC | | | 07/27/20 | �� | | | 6.50 | | | | — | | | | | | | | 74,000 | | | | 46,825 | |
Currency Option USD vs BRL | | Call | | Morgan Stanley & Co. International PLC | | | 08/27/20 | | | | 8.50 | | | | — | | | | | | | | 37,000 | | | | 6,830 | |
Currency Option USD vs BRL | | Call | | Citibank, N.A. | | | 12/21/20 | | | | 5.25 | | | | — | | | | | | | | 74,000 | | | | 648,208 | |
Currency Option USD vs BRL | | Call | | Morgan Stanley & Co. International PLC | | | 01/27/21 | | | | 4.00 | | | | — | | | | | | | | 39,000 | | | | 2,748,265 | |
Currency Option USD vs BRL | | Call | | Bank of America, N.A. | | | 09/28/21 | | | | 4.50 | | | | — | | | | | | | | 35,500 | | | | 1,723,231 | |
Currency Option USD vs CHF | | Call | | Goldman Sachs International | | | 10/28/20 | | | | 1.00 | | | | — | | | | | | | | 39,000 | | | | 328,096 | |
Currency Option USD vs ILS | | Call | | Citibank, N.A. | | | 02/26/20 | | | | 3.95 | | | | — | | | | | | | | 19,125 | | | | 3,927 | |
Currency Option USD vs ILS | | Call | | Bank of America, N.A. | | | 06/28/21 | | | | 3.60 | | | | — | | | | | | | | 38,250 | | | | 480,323 | |
Currency Option USD vs INR | | Call | | Bank of America, N.A. | | | 03/31/20 | | | | 88.00 | | | | — | | | | | | | | 35,500 | | | | 2,810 | |
Currency Option USD vs INR | | Call | | Goldman Sachs International | | | 10/28/20 | | | | 90.00 | | | | — | | | | | | | | 39,000 | | | | 44,668 | |
Currency Option USD vs INR | | Call | | Goldman Sachs International | | | 02/24/21 | | | | 79.00 | | | | — | | | | | | | | 39,000 | | | | 552,495 | |
Currency Option USD vs INR | | Call | | Bank of America, N.A. | | | 02/24/21 | | | | 86.00 | | | | — | | | | | | | | 78,000 | | | | 353,162 | |
Currency Option USD vs JPY | | Call | | Morgan Stanley & Co. International PLC | | | 01/27/21 | | | | 110.00 | | | | — | | | | | | | | 7,000 | | | | 76,956 | |
Currency Option USD vs JPY | | Call | | Deutsche Bank AG | | | 10/27/23 | | | | 115.00 | | | | — | | | | | | | | 39,000 | | | | 356,380 | |
Currency Option USD vs JPY | | Call | | Barclays Bank PLC | | | 10/27/23 | | | | 115.00 | | | | — | | | | | | | | 39,000 | | | | 356,380 | |
Currency Option USD vs JPY | | Call | | Goldman Sachs International | | | 10/27/23 | | | | 115.00 | | | | — | | | | | | | | 78,000 | | | | 712,760 | |
Currency Option USD vs KRW | | Call | | Goldman Sachs International | | | 12/20/19 | | | | 1,200.00 | | | | — | | | | | | | | 30,000 | | | | 66,328 | |
Currency Option USD vs KRW | | Call | | BNP Paribas S.A. | | | 12/20/19 | | | | 1,350.00 | | | | — | | | | | | | | 60,000 | | | | 868 | |
See Notes to Financial Statements.
Options Purchased (continued):
OTC Traded
| | | | | | | | | | | | | | | | | | | | | | | | | | | | |
Description | | Call/
Put | | Counterparty | | Expiration
Date | | | Strike | | | Contracts | | | Notional
Amount
(000)# | | | Value | |
Currency Option USD vs KRW | | Call | | HSBC Bank USA, N.A. | | | 01/29/20 | | | | 1,500.00 | | | | — | | | | | | | | 36,000 | | | $ | 320 | |
Currency Option USD vs KRW | | Call | | Morgan Stanley & Co. International PLC | | | 02/26/20 | | | | 1,275.00 | | | | — | | | | | | | | 36,000 | | | | 37,791 | |
Currency Option USD vs KRW | | Call | | BNP Paribas S.A. | | | 10/28/20 | | | | 1,165.00 | | | | — | | | | | | | | 19,500 | | | | 485,488 | |
Currency Option USD vs KRW | | Call | | HSBC Bank USA, N.A. | | | 07/28/21 | | | | 1,275.00 | | | | — | | | | | | | | 36,000 | | | | 468,898 | |
Currency Option USD vs MXN | | Call | | Morgan Stanley & Co. International PLC | | | 02/26/20 | | | | 30.00 | | | | — | | | | | | | | 39,000 | | | | 2,605 | |
Currency Option USD vs MXN | | Call | | Deutsche Bank AG | | | 04/28/20 | | | | 26.00 | | | | — | | | | | | | | 51,000 | | | | 37,517 | |
Currency Option USD vs MXN | | Call | | Morgan Stanley & Co. International PLC | | | 10/28/20 | | | | 31.00 | | | | — | | | | | | | | 117,000 | | | | 161,079 | |
Currency Option USD vs MXN | | Call | | Morgan Stanley & Co. International PLC | | | 01/27/21 | | | | 22.00 | | | | — | | | | | | | | 58,500 | | | | 1,601,865 | |
Currency Option USD vs MXN | | Call | | Citibank, N.A. | | | 01/27/21 | | | | 26.50 | | | | — | | | | | | | | 117,000 | | | | 821,384 | |
Currency Option USD vs MXN | | Call | | Morgan Stanley & Co. International PLC | | | 04/27/21 | | | | 22.00 | | | | — | | | | | | | | 39,000 | | | | 1,381,155 | |
Currency Option USD vs MXN | | Call | | Morgan Stanley & Co. International PLC | | | 04/26/23 | | | | 26.00 | | | | — | | | | | | | | 39,000 | | | | 2,497,196 | |
Currency Option USD vs RUB | | Call | | Citibank, N.A. | | | 12/23/19 | | | | 85.00 | | | | — | | | | | | | | 30,000 | | | | 466 | |
Currency Option USD vs RUB | | Call | | Deutsche Bank AG | | | 02/27/20 | | | | 82.00 | | | | — | | | | | | | | 35,500 | | | | 19,712 | |
Currency Option USD vs RUB | | Call | | BNP Paribas S.A. | | | 03/30/20 | | | | 95.00 | | | | — | | | | | | | | 33,000 | | | | 7,582 | |
Currency Option USD vs RUB | | Call | | Deutsche Bank AG | | | 10/29/20 | | | | 68.00 | | | | — | | | | | | | | 35,500 | | | | 1,262,028 | |
Currency Option USD vs RUB | | Call | | Goldman Sachs International | | | 12/22/20 | | | | 95.00 | | | | — | | | | | | | | 39,000 | | | | 171,282 | |
Currency Option USD vs RUB | | Call | | Goldman Sachs International | | | 04/28/21 | | | | 75.00 | | | | — | | | | | | | | 39,000 | | | | 1,101,683 | |
Currency Option USD vs RUB | | Call | | Deutsche Bank AG | | | 04/28/21 | | | | 90.00 | | | | — | | | | | | | | 78,000 | | | | 764,664 | |
Currency Option USD vs TRY | | Call | | Goldman Sachs International | | | 12/23/19 | | | | 6.00 | | | | — | | | | | | | | 30,000 | | | | 235,343 | |
Currency Option USD vs TRY | | Call | | Goldman Sachs International | | | 04/03/20 | | | | 15.00 | | | | — | | | | | | | | 31,000 | | | | 5,929 | |
Currency Option USD vs TRY | | Call | | Morgan Stanley & Co. International PLC | | | 04/29/20 | | | | 7.00 | | | | — | | | | | | | | 35,000 | | | | 364,508 | |
See Notes to Financial Statements.
| | | | |
| PGIM Absolute Return Bond Fund | | | 57 | |
Schedule of Investments(continued)
as of October 31, 2019
Options Purchased (continued):
OTC Traded
| | | | | | | | | | | | | | | | | | | | | | | | | | | | |
Description | | Call/
Put | | Counterparty | | Expiration
Date | | | Strike | | | Contracts | | | Notional
Amount
(000)# | | | Value | |
Currency Option USD vs TRY | | Call | | Deutsche Bank AG | | | 10/29/20 | | | | 9.00 | | | | — | | | | | | | | 39,000 | | | $ | 484,399 | |
Currency Option USD vs TRY | | Call | | Goldman Sachs International | | | 10/29/20 | | | | 12.00 | | | | — | | | | | | | | 78,000 | | | | 400,070 | |
Currency Option USD vs TRY | | Call | | Morgan Stanley & Co. International PLC | | | 02/25/21 | | | | 10.00 | | | | — | | | | | | | | 39,000 | | | | 628,324 | |
Currency Option USD vs TRY | | Call | | Goldman Sachs International | | | 02/25/21 | | | | 15.00 | | | | — | | | | | | | | 78,000 | | | | 468,335 | |
Currency Option USD vs TRY | | Call | | Goldman Sachs International | | | 09/29/21 | | | | 10.00 | | | | — | | | | | | | | 31,000 | | | | 969,209 | |
Currency Option USD vs ZAR | | Call | | Morgan Stanley & Co. International PLC | | | 11/20/19 | | | | 21.00 | | | | — | | | | | | | | 75,250 | | | | 89 | |
Currency Option USD vs ZAR | | Call | | Morgan Stanley & Co. International PLC | | | 12/24/19 | | | | 14.00 | | | | — | | | | | | | | 30,000 | | | | 2,406,185 | |
Currency Option USD vs ZAR | | Call | | BNP Paribas S.A. | | | 12/24/19 | | | | 17.00 | | | | — | | | | | | | | 60,000 | | | | 115,587 | |
Currency Option USD vs ZAR | | Call | | Goldman Sachs International | | | 07/27/20 | | | | 25.00 | | | | — | | | | | | | | 37,000 | | | | 47,235 | |
Currency Option USD vs ZAR | | Call | | Goldman Sachs International | | | 09/28/20 | | | | 17.00 | | | | — | | | | | | | | 39,000 | | | | 1,302,061 | |
Currency Option USD vs ZAR | | Call | | Morgan Stanley & Co. International PLC | | | 09/28/20 | | | | 21.00 | | | | — | | | | | | | | 39,750 | | | | 289,792 | |
Currency Option USD vs ZAR | | Call | | Citibank, N.A. | | | 09/28/20 | | | | 21.00 | | | | — | | | | | | | | 38,250 | | | | 278,857 | |
Currency Option USD vs ZAR | | Call | | Goldman Sachs International | | | 01/27/21 | | | | 15.00 | | | | — | | | | | | | | 37,000 | | | | 3,700,259 | |
Currency Option USD vs ZAR | | Call | | Deutsche Bank AG | | | 01/27/21 | | | | 20.00 | | | | — | | | | | | | | 74,000 | | | | 1,370,172 | |
Currency Option AUD vs JPY | | Put | | Deutsche Bank AG | | | 12/10/19 | | | | 54.00 | | | | — | | | | AUD | | | | 216,000 | | | | 228 | |
Currency Option AUD vs JPY | | Put | | Deutsche Bank AG | | | 01/29/20 | | | | 73.00 | | | | — | | | | AUD | | | | 360,000 | | | | 2,747,884 | |
Currency Option AUD vs JPY | | Put | | Morgan Stanley & Co. International PLC | | | 01/29/20 | | | | 82.00 | | | | — | | | | AUD | | | | 180,000 | | | | 13,241,353 | |
Currency Option AUD vs JPY | | Put | | Morgan Stanley & Co. International PLC | | | 05/26/21 | | | | 62.00 | | | | — | | | | AUD | | | | 216,000 | | | | 1,902,407 | |
Currency Option AUD vs JPY | | Put | | Deutsche Bank AG | | | 05/26/21 | | | | 70.00 | | | | — | | | | AUD | | | | 216,000 | | | | 5,032,386 | |
Currency Option AUD vs JPY | | Put | | Morgan Stanley & Co. International PLC | | | 07/28/21 | | | | 65.00 | | | | — | | | | AUD | | | | 108,000 | | | | 1,532,281 | |
Currency Option AUD vs USD | | Put | | Citibank, N.A. | | | 01/29/20 | | | | 0.69 | | | | — | | | | AUD | | | | 38,000 | | | | 346,539 | |
See Notes to Financial Statements.
Options Purchased (continued):
OTC Traded
| | | | | | | | | | | | | | | | | | | | | | | | | | | | |
Description | | Call/
Put | | Counterparty | | Expiration
Date | | | Strike | | | Contracts | | | Notional
Amount
(000)# | | | Value | |
Currency Option EUR vs GBP | | Put | | Morgan Stanley & Co. International PLC | | | 10/28/20 | | | | 0.80 | | | | — | | | | EUR | | | | 30,600 | | | $ | 122,583 | |
Currency Option EUR vs TRY | | Put | | Goldman Sachs International | | | 04/28/20 | | | | 6.00 | | | | — | | | | EUR | | | | 30,000 | | | | 143,697 | |
Currency Option EUR vs TRY | | Put | | BNP Paribas S.A. | | | 07/28/20 | | | | 7.00 | | | | — | | | | EUR | | | | 30,000 | | | | 2,028,326 | |
Currency Option GBP vs JPY | | Put | | Bank of America, N.A. | | | 12/10/19 | | | | 100.00 | | | | — | | | | GBP | | | | 30,300 | | | | 159 | |
Currency Option GBP vs JPY | | Put | | Bank of America, N.A. | | | 09/28/20 | | | | 125.00 | | | | — | | | | GBP | | | | 30,300 | | | | 478,078 | |
Currency Option GBP vs USD | | Put | | Morgan Stanley & Co. International PLC | | | 07/27/20 | | | | 1.23 | | | | — | | | | GBP | | | | 30,300 | | | | 468,742 | |
Currency Option GBP vs USD | | Put | | Morgan Stanley & Co. International PLC | | | 09/28/20 | | | | 1.16 | | | | — | | | | GBP | | | | 63,000 | | | | 506,333 | |
Currency Option GBP vs USD | | Put | | HSBC Bank USA, N.A. | | | 09/28/20 | | | | 1.28 | | | | — | | | | GBP | | | | 31,500 | | | | 1,015,624 | |
Currency Option USD vs BRL | | Put | | JPMorgan Chase Bank, N.A. | | | 03/27/20 | | | | 3.10 | | | | — | | | | | | | | 30,000 | | | | 1,401 | |
Currency Option USD vs BRL | | Put | | Deutsche Bank AG | | | 06/26/20 | | | | 3.50 | | | | — | | | | | | | | 36,000 | | | | 85,637 | |
Currency Option USD vs BRL | | Put | | Deutsche Bank AG | | | 06/26/20 | | | | 3.50 | | | | — | | | | | | | | 1,000 | | | | 2,379 | |
Currency Option USD vs BRL | | Put | | Morgan Stanley & Co. International PLC | | | 08/27/20 | | | | 3.25 | | | | — | | | | | | | | 37,000 | | | | 32,859 | |
Currency Option USD vs BRL | | Put | | Deutsche Bank AG | | | 08/27/20 | | | | 3.50 | | | | — | | | | | | | | 37,000 | | | | 131,627 | |
Currency Option USD vs BRL | | Put | | Citibank, N.A. | | | 03/29/21 | | | | 3.75 | | | | — | | | | | | | | 78,000 | | | | 1,560,842 | |
Currency Option USD vs INR | | Put | | BNP Paribas S.A. | | | 12/21/20 | | | | 69.00 | | | | — | | | | | | | | 19,500 | | | | 67,805 | |
Currency Option USD vs JPY | | Put | | Deutsche Bank AG | | | 11/06/19 | | | | 85.00 | | | | — | | | | | | | | 78,000 | | | | — | |
Currency Option USD vs JPY | | Put | | Citibank, N.A. | | | 11/18/19 | | | | 97.50 | | | | — | | | | | | | | 36,400 | | | | 200 | |
Currency Option USD vs JPY | | Put | | Bank of America, N.A. | | | 01/30/20 | | | | 92.00 | | | | — | | | | | | | | 71,000 | | | | 8,432 | |
Currency Option USD vs JPY | | Put | | Citibank, N.A. | | | 03/27/20 | | | | 105.50 | | | | — | | | | | | | | 36,400 | | | | 382,735 | |
Currency Option USD vs JPY | | Put | | Bank of America, N.A. | | | 01/27/21 | | | | 91.00 | | | | — | | | | | | | | 78,000 | | | | 360,685 | |
Currency Option USD vs MXN | | Put | | Citibank, N.A. | | | 04/28/20 | | | | 17.00 | | | | — | | | | | | | | 51,000 | | | | 21,535 | |
See Notes to Financial Statements.
| | | | |
| PGIM Absolute Return Bond Fund | | | 59 | |
Schedule of Investments(continued)
as of October 31, 2019
Options Purchased (continued):
OTC Traded
| | | | | | | | | | | | | | | | | | | | | | | | | | | | |
Description | | Call/
Put | | Counterparty | | Expiration
Date | | | Strike | | | Contracts | | | Notional
Amount
(000)# | | | Value | |
Currency Option USD vs MXN | | Put | | Deutsche Bank AG | | | 10/28/20 | | | | 18.00 | | | | — | | | | | | | | 39,000 | | | $ | 226,219 | |
Currency Option USD vs RUB | | Put | | BNP Paribas S.A. | | | 12/22/20 | | | | 66.00 | | | | — | | | | | | | | 39,000 | | | | 1,314,880 | |
Currency Option USD vs TRY | | Put | | Goldman Sachs International | | | 04/29/20 | | | | 4.00 | | | | — | | | | | | | | 35,000 | | | | 1,574 | |
Currency Option USD vs ZAR | | Put | | BNP Paribas S.A. | | | 07/27/20 | | | | 12.00 | | | | — | | | | | | | | 37,000 | | | | 24,394 | |
| | | | | | | | | | | | | | | | | | | | | | | | | | | | |
Total OTC Traded(cost $131,052,405) | | | | | | | | | | | | | | | | | | | | | | $ | 69,602,371 | |
| | | | | | | | | | | | | | | | | | | | | | | | | | | | |
OTC Swaptions
| | | | | | | | | | | | | | | | | | | | | | | | | | |
Description | | Call/
Put | | Counterparty | | Expiration
Date | | | Strike | | | Receive | | Pay | | Notional Amount
(000)# | | | Value | |
iTraxx.XO.31.V1, 06/20/24 | | Put | | Citibank, N.A. | | | 12/18/19 | | | | 4.00 | % | | iTraxx.XO. 31.V1(Q) | | 5.00%(Q) | | EUR | | | 22,200 | | | $ | 12,364 | |
| | | | | | | | | | | | | | | | | | | | | | | | | | |
(cost $49,051) | | | | | | | | | | | | | | | | | | | | | | |
| Total Options Purchased(cost $131,101,456) | | | | | | | | $ | 69,614,735 | |
| | | | | | | | | | | | | | | | | | | | | | | | |
Options Written:
OTC Traded
| | | | | | | | | | | | | | | | | | | | | | | | | | | | |
Description | | Call/
Put | | Counterparty | | Expiration
Date | | | Strike | | | Contracts | | | Notional
Amount
(000)# | | | Value | |
Currency Option EUR vs GBP | | Call | | Morgan Stanley & Co. International PLC | | | 10/28/20 | | | | 0.95 | | | | — | | | | EUR | | | | 30,600 | | | $ | (294,180 | ) |
Currency Option EUR vs TRY | | Call | | Goldman Sachs International | | | 04/28/20 | | | | 10.00 | | | | — | | | | EUR | | | | 30,000 | | | | (83,671 | ) |
Currency Option EUR vs TRY | | Call | | BNP Paribas S.A. | | | 07/28/20 | | | | 12.00 | | | | — | | | | EUR | | | | 30,000 | | | | (116,718 | ) |
Currency Option EUR vs ZAR | | Call | | Deutsche Bank AG | | | 12/24/19 | | | | 24.00 | | | | — | | | | EUR | | | | 25,000 | | | | (444 | ) |
Currency Option EUR vs ZAR | | Call | | Morgan Stanley & Co. International PLC | | | 08/27/20 | | | | 28.00 | | | | — | | | | EUR | | | | 34,000 | | | | (63,675 | ) |
Currency Option EUR vs ZAR | | Call | | Morgan Stanley & Co. International PLC | | | 12/21/20 | | | | 21.00 | | | | — | | | | EUR | | | | 33,500 | | | | (914,446 | ) |
Currency Option EUR vs ZAR | | Call | | Goldman Sachs International | | | 12/21/20 | | | | 25.00 | | | | — | | | | EUR | | | | 67,000 | | | | (603,376 | ) |
Currency Option USD vs BRL | | Call | | JPMorgan Chase Bank, N.A. | | | 12/20/19 | | | | 5.00 | | | | — | | | | | | | | 30,000 | | | | (1,742 | ) |
See Notes to Financial Statements.
Options Written (continued):
OTC Traded
| | | | | | | | | | | | | | | | | | | | | | | | | | | | |
Description | | Call/
Put | | Counterparty | | Expiration
Date | | | Strike | | | Contracts | | | Notional
Amount
(000)# | | | Value | |
Currency Option USD vs BRL | | Call | | Bank of America, N.A. | | | 03/27/20 | | | | 4.50 | | | | — | | | | | | | | 35,500 | | | $ | (242,902 | ) |
Currency Option USD vs BRL | | Call | | JPMorgan Chase Bank, N.A. | | | 03/27/20 | | | | 4.65 | | | | — | | | | | | | | 30,000 | | | | (128,292 | ) |
Currency Option USD vs BRL | | Call | | Deutsche Bank AG | | | 07/27/20 | | | | 6.50 | | | | — | | | | | | | | 74,000 | | | | (46,825 | ) |
Currency Option USD vs BRL | | Call | | Deutsche Bank AG | | | 08/27/20 | | | | 8.50 | | | | — | | | | | | | | 37,000 | | | | (6,830 | ) |
Currency Option USD vs BRL | | Call | | Morgan Stanley & Co. International PLC | | | 12/21/20 | | | | 5.25 | | | | — | | | | | | | | 74,000 | | | | (648,208 | ) |
Currency Option USD vs BRL | | Call | | Morgan Stanley & Co. International PLC | | | 01/27/21 | | | | 5.00 | | | | — | | | | | | | | 78,000 | | | | (1,103,899 | ) |
Currency Option USD vs CHF | | Call | | Bank of America, N.A. | | | 10/28/20 | | | | 1.00 | | | | — | | | | | | | | 39,000 | | | | (328,096 | ) |
Currency Option USD vs ILS | | Call | | Citibank, N.A. | | | 02/26/20 | | | | 3.60 | | | | — | | | | | | | | 19,125 | | | | (74,415 | ) |
Currency Option USD vs ILS | | Call | | Bank of America, N.A. | | | 06/28/21 | | | | 3.95 | | | | — | | | | | | | | 38,250 | | | | (133,783 | ) |
Currency Option USD vs INR | | Call | | HSBC Bank USA, N.A. | | | 10/28/20 | | | | 90.00 | | | | — | | | | | | | | 39,000 | | | | (44,668 | ) |
Currency Option USD vs INR | | Call | | Bank of America, N.A. | | | 02/24/21 | | | | 79.00 | | | | — | | | | | | | | 39,000 | | | | (552,495 | ) |
Currency Option USD vs INR | | Call | | Goldman Sachs International | | | 02/24/21 | | | | 86.00 | | | | — | | | | | | | | 78,000 | | | | (353,162 | ) |
Currency Option USD vs INR | | Call | | Bank of America, N.A. | | | 09/28/21 | | | | 88.00 | | | | — | | | | | | | | 35,500 | | | | (289,702 | ) |
Currency Option USD vs JPY | | Call | | Citibank, N.A. | | | 01/27/21 | | | | 110.00 | | | | — | | | | | | | | 7,000 | | | | (76,956 | ) |
Currency Option USD vs KRW | | Call | | BNP Paribas S.A. | | | 12/20/19 | | | | 1,200.00 | | | | — | | | | | | | | 30,000 | | | | (66,328 | ) |
Currency Option USD vs KRW | | Call | | Goldman Sachs International | | | 12/20/19 | | | | 1,350.00 | | | | — | | | | | | | | 60,000 | | | | (868 | ) |
Currency Option USD vs KRW | | Call | | HSBC Bank USA, N.A. | | | 02/26/20 | | | | 1,275.00 | | | | — | | | | | | | | 36,000 | | | | (37,791 | ) |
Currency Option USD vs KRW | | Call | | Morgan Stanley & Co. International PLC | | | 05/27/20 | | | | 1,250.00 | | | | — | | | | | | | | 36,000 | | | | (154,991 | ) |
Currency Option USD vs KRW | | Call | | Deutsche Bank AG | | | 10/28/20 | | | | 1,165.00 | | | | — | | | | | | | | 19,500 | | | | (485,488 | ) |
Currency Option USD vs KRW | | Call | | HSBC Bank USA, N.A. | | | 07/28/21 | | | | 1,500.00 | | | | — | | | | | | | | 36,000 | | | | (118,827 | ) |
Currency Option USD vs MXN | | Call | | Citibank, N.A. | | | 04/28/20 | | | | 26.00 | | | | — | | | | | | | | 51,000 | | | | (37,517 | ) |
See Notes to Financial Statements.
| | | | |
| PGIM Absolute Return Bond Fund | | | 61 | |
Schedule of Investments(continued)
as of October 31, 2019
Options Written (continued):
OTC Traded
| | | | | | | | | | | | | | | | | | | | | | | | | | | | |
Description | | Call/
Put | | Counterparty | | Expiration
Date | | | Strike | | | Contracts | | | Notional
Amount
(000)# | | | Value | |
Currency Option USD vs MXN | | Call | | Morgan Stanley & Co. International PLC | | | 05/27/20 | | | | 22.00 | | | | — | | | | | | | | 39,000 | | | $ | (295,217 | ) |
Currency Option USD vs MXN | | Call | | Deutsche Bank AG | | | 10/28/20 | | | | 31.00 | | | | — | | | | | | | | 117,000 | | | | (161,079 | ) |
Currency Option USD vs MXN | | Call | | Citibank, N.A. | | | 01/27/21 | | | | 22.00 | | | | — | | | | | | | | 58,500 | | | | (1,601,865 | ) |
Currency Option USD vs MXN | | Call | | Morgan Stanley & Co. International PLC | | | 01/27/21 | | | | 26.50 | | | | — | | | | | | | | 117,000 | | | | (821,384 | ) |
Currency Option USD vs MXN | | Call | | Morgan Stanley & Co. International PLC | | | 04/27/21 | | | | 26.00 | | | | — | | | | | | | | 39,000 | | | | (448,676 | ) |
Currency Option USD vs MXN | | Call | | Morgan Stanley & Co. International PLC | | | 04/27/21 | | | | 26.00 | | | | — | | | | | | | | 39,000 | | | | (448,676 | ) |
Currency Option USD vs RUB | | Call | | Goldman Sachs International | | | 12/23/19 | | | | 85.00 | | | | — | | | | | | | | 30,000 | | | | (466 | ) |
Currency Option USD vs RUB | | Call | | Citibank, N.A. | | | 03/30/20 | | | | 95.00 | | | | — | | | | | | | | 33,000 | | | | (7,582 | ) |
Currency Option USD vs RUB | | Call | | Deutsche Bank AG | | | 10/29/20 | | | | 75.00 | | | | — | | | | | | | | 71,000 | | | | (1,048,928 | ) |
Currency Option USD vs RUB | | Call | | BNP Paribas S.A. | | | 12/22/20 | | | | 95.00 | | | | — | | | | | | | | 39,000 | | | | (171,282 | ) |
Currency Option USD vs RUB | | Call | | Deutsche Bank AG | | | 04/28/21 | | | | 75.00 | | | | — | | | | | | | | 39,000 | | | | (1,101,683 | ) |
Currency Option USD vs RUB | | Call | | Goldman Sachs International | | | 04/28/21 | | | | 90.00 | | | | — | | | | | | | | 78,000 | | | | (764,664 | ) |
Currency Option USD vs TRY | | Call | | BNP Paribas S.A. | | | 12/23/19 | | | | 6.00 | | | | — | | | | | | | | 30,000 | | | | (235,343 | ) |
Currency Option USD vs TRY | | Call | | Goldman Sachs International | | | 04/29/20 | | | | 7.00 | | | | — | | | | | | | | 35,000 | | | | (364,508 | ) |
Currency Option USD vs TRY | | Call | | Goldman Sachs International | | | 10/29/20 | | | | 9.00 | | | | — | | | | | | | | 39,000 | | | | (484,399 | ) |
Currency Option USD vs TRY | | Call | | Deutsche Bank AG | | | 10/29/20 | | | | 12.00 | | | | — | | | | | | | | 78,000 | | | | (400,070 | ) |
Currency Option USD vs TRY | | Call | | Goldman Sachs International | | | 02/25/21 | | | | 10.00 | | | | — | | | | | | | | 39,000 | | | | (628,324 | ) |
Currency Option USD vs TRY | | Call | | Morgan Stanley & Co. International PLC | | | 02/25/21 | | | | 15.00 | | | | — | | | | | | | | 78,000 | | | | (468,335 | ) |
Currency Option USD vs TRY | | Call | | Goldman Sachs International | | | 09/29/21 | | | | 15.00 | | | | — | | | | | | | | 62,000 | | | | (843,421 | ) |
Currency Option USD vs ZAR | | Call | | BNP Paribas S.A. | | | 12/24/19 | | | | 14.00 | | | | — | | | | | | | | 30,000 | | | | (2,406,185 | ) |
Currency Option USD vs ZAR | | Call | | Morgan Stanley & Co. International PLC | | | 12/24/19 | | | | 17.00 | | | | — | | | | | | | | 60,000 | | | | (115,587 | ) |
See Notes to Financial Statements.
Options Written (continued):
OTC Traded
| | | | | | | | | | | | | | | | | | | | | | | | | | | | |
Description | | Call/
Put | | Counterparty | | Expiration
Date | | | Strike | | | Contracts | | | Notional
Amount
(000)# | | | Value | |
Currency Option USD vs ZAR | | Call | | BNP Paribas S.A. | | | 07/27/20 | | | | 25.00 | | | | — | | | | | | | | 37,000 | | | $ | (47,235 | ) |
Currency Option USD vs ZAR | | Call | | Morgan Stanley & Co. International PLC | | | 09/28/20 | | | | 17.00 | | | | — | | | | | | | | 39,000 | | | | (1,302,061 | ) |
Currency Option USD vs ZAR | | Call | | Goldman Sachs International | | | 09/28/20 | | | | 21.00 | | | | — | | | | | | | | 78,000 | | | | (568,649 | ) |
Currency Option USD vs ZAR | | Call | | Deutsche Bank AG | | | 01/27/21 | | | | 15.00 | | | | — | | | | | | | | 37,000 | | | | (3,700,259 | ) |
Currency Option USD vs ZAR | | Call | | Goldman Sachs International | | | 01/27/21 | | | | 20.00 | | | | — | | | | | | | | 74,000 | | | | (1,370,172 | ) |
Currency Option AUD vs JPY | | Put | | Morgan Stanley & Co. International PLC | | | 01/29/20 | | | | 73.00 | | | | — | | | | AUD | | | | 360,000 | | | | (2,747,884 | ) |
Currency Option AUD vs JPY | | Put | | Deutsche Bank AG | | | 01/29/20 | | | | 82.00 | | | | — | | | | AUD | | | | 180,000 | | | | (13,241,353 | ) |
Currency Option AUD vs JPY | | Put | | Deutsche Bank AG | | | 05/26/21 | | | | 62.00 | | | | — | | | | AUD | | | | 432,000 | | | | (3,804,814 | ) |
Currency Option AUD vs JPY | | Put | | Morgan Stanley & Co. International PLC | | | 05/26/21 | | | | 70.00 | | | | — | | | | AUD | | | | 108,000 | | | | (2,516,193 | ) |
Currency Option AUD vs JPY | | Put | | Morgan Stanley & Co. International PLC | | | 07/28/21 | | | | 56.00 | | | | — | | | | AUD | | | | 216,000 | | | | (1,132,803 | ) |
Currency Option AUD vs USD | | Put | | Morgan Stanley & Co. International PLC | | | 01/29/20 | | | | 0.69 | | | | — | | | | AUD | | | | 38,000 | | | | (346,539 | ) |
Currency Option EUR vs TRY | | Put | | Morgan Stanley & Co. International PLC | | | 04/28/20 | | | | 6.00 | | | | — | | | | EUR | | | | 30,000 | | | | (143,697 | ) |
Currency Option EUR vs TRY | | Put | | Morgan Stanley & Co. International PLC | | | 07/28/20 | | | | 7.00 | | | | — | | | | EUR | | | | 30,000 | | | | (2,028,326 | ) |
Currency Option GBP vs JPY | | Put | | Bank of America, N.A. | | | 09/28/20 | | | | 115.00 | | | | — | | | | GBP | | | | 60,600 | | | | (437,936 | ) |
Currency Option GBP vs USD | | Put | | Bank of America, N.A. | | | 07/27/20 | | | | 1.23 | | | | — | | | | GBP | | | | 30,300 | | | | (468,742 | ) |
Currency Option GBP vs USD | | Put | | HSBC Bank USA, N.A. | | | 09/28/20 | | | | 1.16 | | | | — | | | | GBP | | | | 63,000 | | | | (506,333 | ) |
Currency Option GBP vs USD | | Put | | Morgan Stanley & Co. International PLC | | | 09/28/20 | | | | 1.28 | | | | — | | | | GBP | | | | 31,500 | | | | (1,015,624 | ) |
Currency Option USD vs BRL | | Put | | Deutsche Bank AG | | | 03/27/20 | | | | 3.10 | | | | — | | | | | | | | 30,000 | | | | (1,401 | ) |
Currency Option USD vs BRL | | Put | | Citibank, N.A. | | | 06/26/20 | | | | 3.50 | | | | — | | | | | | | | 37,000 | | | | (88,015 | ) |
Currency Option USD vs BRL | | Put | | Citibank, N.A. | | | 08/27/20 | | | | 3.25 | | | | — | | | | | | | | 37,000 | | | | (32,859 | ) |
Currency Option USD vs BRL | | Put | | Morgan Stanley & Co. International PLC | | | 08/27/20 | | | | 3.50 | | | | — | | | | | | | | 37,000 | | | | (131,627 | ) |
See Notes to Financial Statements.
| | | | |
| PGIM Absolute Return Bond Fund | | | 63 | |
Schedule of Investments(continued)
as of October 31, 2019
Options Written (continued):
OTC Traded
| | | | | | | | | | | | | | | | | | | | | | | | | | | | |
Description | | Call/
Put | | Counterparty | | Expiration
Date | | | Strike | | | Contracts | | | Notional
Amount
(000)# | | | Value | |
Currency Option USD vs INR | | Put | | Goldman Sachs International | | | 12/21/20 | | | | 69.00 | | | | — | | | | | | | | 19,500 | | | $ | (67,805 | ) |
Currency Option USD vs JPY | | Put | | Citibank, N.A. | | | 03/27/20 | | | | 101.50 | | | | — | | | | | | | | 72,800 | | | | (278,305 | ) |
Currency Option USD vs JPY | | Put | | Bank of America, N.A. | | | 10/28/20 | | | | 98.00 | | | | — | | | | | | | | 71,000 | | | | (577,391 | ) |
Currency Option USD vs JPY | | Put | | Morgan Stanley & Co. International PLC | | | 01/27/21 | | | | 91.00 | | | | — | | | | | | | | 37,000 | | | | (171,094 | ) |
Currency Option USD vs JPY | | Put | | Barclays Bank PLC | | | 01/27/21 | | | | 91.00 | | | | — | | | | | | | | 41,000 | | | | (189,591 | ) |
Currency Option USD vs MXN | | Put | | Morgan Stanley & Co. International PLC | | | 04/28/20 | | | | 17.00 | | | | — | | | | | | | | 51,000 | | | | (21,535 | ) |
Currency Option USD vs MXN | | Put | | Morgan Stanley & Co. International PLC | | | 10/28/20 | | | | 18.00 | | | | — | | | | | | | | 39,000 | | | | (226,219 | ) |
Currency Option USD vs RUB | | Put | | Goldman Sachs International | | | 12/22/20 | | | | 66.00 | | | | — | | | | | | | | 39,000 | | | | (1,314,880 | ) |
Currency Option USD vs TRY | | Put | | Deutsche Bank AG | | | 04/29/20 | | | | 4.00 | | | | — | | | | | | | | 35,000 | | | | (1,574 | ) |
Currency Option USD vs ZAR | | Put | | Goldman Sachs International | | | 07/27/20 | | | | 12.00 | | | | — | | | | | | | | 37,000 | | | | (24,394 | ) |
Hellenic Republic, 3.75%, 01/30/28^ | | Put | | Deutsche Bank AG | | | 09/10/20 | | | | 87.00 | | | | — | | | | EUR | | | | 5,000 | | | | — | |
| | | | | | | | | | | | | | | | | | | | | | | | | | | | |
Total OTC Traded(premiums received $117,910,454) | | | | | | | | | | | $ | (58,333,279 | ) |
| | | | | | | | | | | | | | | | | | | | | | | | | | | | |
OTC Swaptions
| | | | | | | | | | | | | | | | | | | | | | | | | | |
Description | | Call/
Put | | Counterparty | | Expiration
Date | | | Strike | | | Receive | | Pay | | Notional Amount
(000)# | | | Value | |
CDX.NA.HY.32.V2, 06/20/24 | | Put | | Citibank, N.A. | | | 01/15/20 | | | $ | 95.00 | | | 5.00%(Q) | | CDX.NA.HY. 32.V2(Q) | | | | | 22,200 | | | $ | (4,594 | ) |
iTraxx.XO.31.V1, 06/20/24 | | Put | | Citibank, N.A. | | | 06/17/20 | | | | 4.00 | % | | 5.00%(Q) | | iTraxx.XO. 31.V1(Q) | | EUR | | | 22,200 | | | | (267,607 | ) |
| | | | | | | | | | | | | | | | | | | | | | | | | | |
Total OTC Swaptions(premiums received $221,813) | | | | | | | | | | | | | | | | | $ | (272,201 | ) |
| | | | | | | | | | | | | | | | | | | | | | | | | | |
Total Options Written(premiums received $118,132,267) | | | | | | | | | | | | | | | | | $ | (58,605,480 | ) |
| | | | | | | | | | | | | | | | | | | | | | | | | | |
See Notes to Financial Statements.
Futures contracts outstanding at October 31, 2019:
| | | | | | | | | | | | | | | | |
Number of
Contracts | | | Type | | Expiration
Date | | | Current
Notional
Amount | | | Value /
Unrealized
Appreciation
(Depreciation) | |
| | | | Long Positions: | | | | | | | | | | | | |
| | 10,236 | | | 5 Year U.S. Treasury Notes | | | Dec. 2019 | | | $ | 1,220,163,239 | | | $ | (5,148,724 | ) |
| | 4,734 | | | 10 Year U.S. Treasury Notes | | | Dec. 2019 | | | | 616,825,430 | | | | (2,270,375 | ) |
| | 2,939 | | | 10 Year U.S. Ultra Treasury Notes | | | Dec. 2019 | | | | 417,659,468 | | | | (6,535,271 | ) |
| | 903 | | | 30 Year U.S. Ultra Treasury Bonds | | | Dec. 2019 | | | | 171,344,250 | | | | (4,483,137 | ) |
| | | | | | | | | | | | | | | | |
| | | | | | | | | | | | | | | (18,437,507 | ) |
| | | | | | | | | | | | | | | | |
| | | | Short Positions: | | | | | | | | | | | | |
| | 15,741 | | | 2 Year U.S. Treasury Notes | | | Dec. 2019 | | | | 3,393,784,187 | | | | 6,117,985 | |
| | 326 | | | 5 Year Euro-Bobl | | | Dec. 2019 | | | | 48,946,190 | | | | 552,957 | |
| | 454 | | | 10 Year Euro-Bund | | | Dec. 2019 | | | | 86,970,023 | | | | 1,837,683 | |
| | 907 | | | 20 Year U.S. Treasury Bonds | | | Dec. 2019 | | | | 146,367,125 | | | | 2,796,306 | |
| | 5 | | | 30 Year Euro Buxl | | | Dec. 2019 | | | | 1,170,842 | | | | 46,013 | |
| | 224 | | | Euro Schatz Index | | | Dec. 2019 | | | | 27,998,134 | | | | 139,918 | |
| | | | | | | | | | | | | | | | |
| | | | | | | | | | | | | | | 11,490,862 | |
| | | | | | | | | | | | | | | | |
| | | | | | | | | | | | | | $ | (6,946,645 | ) |
| | | | | | | | | | | | | | | | |
Forward foreign currency exchange contracts outstanding at October 31, 2019:
| | | | | | | | | | | | | | | | | | | | | | | | | | |
Purchase Contracts | | Counterparty | | Notional
Amount
(000) | | | Value at
Settlement
Date | | | Current
Value | | | Unrealized
Appreciation | | | Unrealized
Depreciation | |
OTC Forward Foreign Currency Exchange Contracts: | | | | | |
Australian Dollar, | | | | | | | | | | | | | | | | | | | | | | | | | | |
Expiring 11/27/19 | | Bank of America, N.A. | | | AUD | | | | 1,317 | | | $ | 895,000 | | | $ | 908,296 | | | $ | 13,296 | | | $ | — | |
Expiring 11/27/19 | | Bank of America, N.A. | | | AUD | | | | 901 | | | | 619,000 | | | | 621,470 | | | | 2,470 | | | | — | |
Expiring 11/27/19 | | Citibank, N.A. | | | AUD | | | | 1,106 | | | | 749,000 | | | | 763,163 | | | | 14,163 | | | | — | |
Expiring 11/27/19 | | Citibank, N.A. | | | AUD | | | | 974 | | | | 658,000 | | | | 671,927 | | | | 13,927 | | | | — | |
Expiring 11/27/19 | | JPMorgan Chase Bank, N.A. | | | AUD | | | | 1,068 | | | | 734,000 | | | | 736,905 | | | | 2,905 | | | | — | |
Expiring 11/27/19 | | The Toronto-Dominion Bank | | | AUD | | | | 1,465 | | | | 990,000 | | | | 1,010,551 | | | | 20,551 | | | | — | |
Expiring 11/27/19 | | UBS AG | | | AUD | | | | 206 | | | | 139,746 | | | | 142,380 | | | | 2,634 | | | | — | |
Expiring 01/22/20 | | BNP Paribas S.A. | | | AUD | | | | 1,333 | | | | 917,000 | | | | 920,833 | | | | 3,833 | | | | — | |
Expiring 01/22/20 | | HSBC Bank USA, N.A. | | | AUD | | | | 1,529 | | | | 1,050,000 | | | | 1,056,328 | | | | 6,328 | | | | — | |
See Notes to Financial Statements.
| | | | |
| PGIM Absolute Return Bond Fund | | | 65 | |
Schedule of Investments(continued)
as of October 31, 2019
Forward foreign currency exchange contracts outstanding at October 31, 2019 (continued):
| | | | | | | | | | | | | | | | | | | | | | |
Purchase Contracts | | Counterparty | | Notional
Amount
(000) | | | Value at
Settlement
Date | | | Current
Value | | | Unrealized
Appreciation | | | Unrealized
Depreciation | |
OTC Forward Foreign Currency Exchange Contracts (cont’d.): | | | | | |
Australian Dollar (cont’d.), | | | | | | | | | | | | | | | | | |
Expiring 01/22/20 | | UBS AG | | AUD | 1,737 | | | $ | 1,195,000 | | | $ | 1,199,996 | | | $ | 4,996 | | | $ | — | |
Expiring 01/31/20 | | Citibank, N.A. | | AUD | 7,067 | | | | 5,269,724 | | | | 4,882,604 | | | | — | | | | (387,120 | ) |
Expiring 01/31/20 | | Citibank, N.A. | | AUD | 5,351 | | | | 4,288,398 | | | | 3,697,113 | | | | — | | | | (591,285 | ) |
Expiring 02/28/20 | | Bank of America, N.A. | | AUD | 10,799 | | | | 7,753,493 | | | | 7,464,956 | | | | — | | | | (288,537 | ) |
Expiring 02/28/20 | | Morgan Stanley & Co. International PLC | | AUD | 7,473 | | | | 5,234,273 | | | | 5,166,120 | | | | — | | | | (68,153 | ) |
Expiring 11/30/20 | | Morgan Stanley & Co. International PLC | | AUD | 8,982 | | | | 6,315,494 | | | | 6,234,453 | | | | — | | | | (81,041 | ) |
Expiring 11/30/20 | | Morgan Stanley & Co. International PLC | | AUD | 3,823 | | | | 2,744,880 | | | | 2,653,465 | | | | — | | | | (91,415 | ) |
Expiring 12/30/20 | | JPMorgan Chase Bank, N.A. | | AUD | 10,379 | | | | 7,128,123 | | | | 7,206,227 | | | | 78,104 | | | | — | |
Expiring 12/30/20 | | Morgan Stanley & Co. International PLC | | AUD | 2,196 | | | | 1,544,350 | | | | 1,524,533 | | | | — | | | | (19,817 | ) |
Expiring 05/28/21 | | JPMorgan Chase Bank, N.A. | | AUD | 6,597 | | | | 4,538,898 | | | | 4,586,446 | | | | 47,548 | | | | — | |
Expiring 10/31/23 | | JPMorgan Chase Bank, N.A. | | AUD | 3,180 | | | | 2,208,096 | | | | 2,222,066 | | | | 13,970 | | | | — | |
Brazilian Real, | | | | | | | | | | | | | | | | | | | | | | |
Expiring 11/04/19 | | BNP Paribas S.A. | | BRL | 8,597 | | | | 2,155,619 | | | | 2,143,122 | | | | — | | | | (12,497 | ) |
Expiring 11/04/19 | | Citibank, N.A. | | BRL | 1,389 | | | | 340,000 | | | | 346,352 | | | | 6,352 | | | | — | |
Expiring 11/04/19 | | HSBC Bank USA, N.A. | | BRL | 1,495 | | | | 367,000 | | | | 372,575 | | | | 5,575 | | | | — | |
Expiring 11/04/19 | | JPMorgan Chase Bank, N.A. | | BRL | 47,077 | | | | 11,562,200 | | | | 11,735,372 | | | | 173,172 | | | | — | |
Expiring 12/03/19 | | JPMorgan Chase Bank, N.A. | | BRL | 1,308 | | | | 327,000 | | | | 325,359 | | | | — | | | | (1,641 | ) |
Expiring 12/24/19 | | Bank of America, N.A. | | BRL | 5,482 | | | | 1,324,000 | | | | 1,362,746 | | | | 38,746 | | | | — | |
Expiring 12/24/19 | | Bank of America, N.A. | | BRL | 5,356 | | | | 1,288,000 | | | | 1,331,200 | | | | 43,200 | | | | — | |
Expiring 12/24/19 | | Barclays Bank PLC | | BRL | 5,393 | | | | 1,340,000 | | | | 1,340,478 | | | | 478 | | | | — | |
Expiring 12/24/19 | | Barclays Bank PLC | | BRL | 4,048 | | | | 964,000 | | | | 1,006,157 | | | | 42,157 | | | | — | |
See Notes to Financial Statements.
Forward foreign currency exchange contracts outstanding at October 31, 2019 (continued):
| | | | | | | | | | | | | | | | | | | | | | | | | | |
Purchase Contracts | | Counterparty | | Notional
Amount
(000) | | | Value at
Settlement
Date | | | Current
Value | | | Unrealized
Appreciation | | | Unrealized
Depreciation | |
OTC Forward Foreign Currency Exchange Contracts (cont’d.): | | | | | |
Brazilian Real (cont’d.), | | | | | | | | | | | | | |
Expiring 12/24/19 | | BNP Paribas S.A. | | | BRL | | | | 5,328 | | | $ | 1,293,000 | | | $ | 1,324,476 | | | $ | 31,476 | | | $ | — | |
Expiring 12/24/19 | | BNP Paribas S.A. | | | BRL | | | | 4,568 | | | | 1,092,000 | | | | 1,135,520 | | | | 43,520 | | | | — | |
Expiring 12/24/19 | | Citibank, N.A. | | | BRL | | | | 7,836 | | | | 2,004,000 | | | | 1,947,679 | | | | — | | | | (56,321 | ) |
Expiring 12/24/19 | | Deutsche Bank AG | | | BRL | | | | 22,576 | | | | 5,602,000 | | | | 5,611,655 | | | | 9,655 | | | | — | |
Expiring 12/24/19 | | Deutsche Bank AG | | | BRL | | | | 3,449 | | | | 829,000 | | | | 857,423 | | | | 28,423 | | | | — | |
Expiring 12/24/19 | | HSBC Bank USA, N.A. | | | BRL | | | | 6,342 | | | | 1,559,000 | | | | 1,576,374 | | | | 17,374 | | | | — | |
Expiring 12/24/19 | | JPMorgan Chase Bank, N.A. | | | BRL | | | | 6,587 | | | | 1,577,000 | | | | 1,637,340 | | | | 60,340 | | | | — | |
Expiring 12/24/19 | | JPMorgan Chase Bank, N.A. | | | BRL | | | | 3,494 | | | | 878,000 | | | | 868,601 | | | | — | | | | (9,399 | ) |
Expiring 12/24/19 | | Morgan Stanley & Co. International PLC | | | BRL | | | | 6,362 | | | | 1,572,000 | | | | 1,581,352 | | | | 9,352 | | | | — | |
Expiring 12/24/19 | | The Toronto-Dominion Bank | | | BRL | | | | 4,450 | | | | 1,060,000 | | | | 1,106,144 | | | | 46,144 | | | | — | |
Expiring 12/24/19 | | UBS AG | | | BRL | | | | 8,882 | | | | 2,205,000 | | | | 2,207,759 | | | | 2,759 | | | | — | |
Expiring 03/31/20 | | Citibank, N.A. | | | BRL | | | | 8,899 | | | | 2,228,603 | | | | 2,201,423 | | | | — | | | | (27,180 | ) |
Expiring 03/31/20 | | Deutsche Bank AG | | | BRL | | | | 42,866 | | | | 10,500,000 | | | | 10,604,421 | | | | 104,421 | | | | — | |
Expiring 06/30/20 | | Citibank, N.A. | | | BRL | | | | 29,119 | | | | 7,301,000 | | | | 7,167,414 | | | | — | | | | (133,586 | ) |
Expiring 06/30/20 | | Deutsche Bank AG | | | BRL | | | | 47,619 | | | | 10,804,000 | | | | 11,720,828 | | | | 916,828 | | | | — | |
Expiring 06/30/20 | | Morgan Stanley & Co. International PLC | | | BRL | | | | 3,245 | | | | 796,000 | | | | 798,795 | | | | 2,795 | | | | — | |
Expiring 06/30/20 | | Morgan Stanley & Co. International PLC | | | BRL | | | | 110 | | | | 27,243 | | | | 26,969 | | | | — | | | | (274 | ) |
Expiring 07/29/20 | | Citibank, N.A. | | | BRL | | | | 5,001 | | | | 1,240,072 | | | | 1,228,874 | | | | — | | | | (11,198 | ) |
Expiring 07/29/20 | | Deutsche Bank AG | | | BRL | | | | 13,339 | | | | 3,349,388 | | | | 3,277,581 | | | | — | | | | (71,807 | ) |
Expiring 07/29/20 | | Morgan Stanley & Co. International PLC | | | BRL | | | | 8,705 | | | | 2,232,000 | | | | 2,138,902 | | | | — | | | | (93,098 | ) |
Expiring 08/31/20 | | Citibank, N.A. | | | BRL | | | | 14,166 | | | | 3,527,000 | | | | 3,473,824 | | | | — | | | | (53,176 | ) |
See Notes to Financial Statements.
| | | | |
| PGIM Absolute Return Bond Fund | | | 67 | |
Schedule of Investments(continued)
as of October 31, 2019
Forward foreign currency exchange contracts outstanding at October 31, 2019 (continued):
| | | | | | | | | | | | | | | | | | | | | | | | | | |
Purchase Contracts | | Counterparty | | Notional
Amount
(000) | | | Value at
Settlement
Date | | | Current
Value | | | Unrealized
Appreciation | | | Unrealized
Depreciation | |
OTC Forward Foreign Currency Exchange Contracts (cont’d.): | | | | | |
Brazilian Real (cont’d.), | | | | | | | | | | | | | | | | | | | | | | | | |
Expiring 08/31/20 | | Morgan Stanley & Co. International PLC | | | BRL | | | | 14,942 | | | $ | 3,669,000 | | | $ | 3,663,977 | | | $ | — | | | $ | (5,023 | ) |
Expiring 12/23/20 | | Citibank, N.A. | | | BRL | | | | 46,304 | | | | 11,302,000 | | | | 11,264,301 | | | | — | | | | (37,699 | ) |
Expiring 01/29/21 | | Citibank, N.A. | | | BRL | | | | 21,690 | | | | 5,155,000 | | | | 5,260,731 | | | | 105,731 | | | | — | |
Expiring 01/29/21 | | Citibank, N.A. | | | BRL | | | | 15,948 | | | | 3,819,240 | | | | 3,868,116 | | | | 48,876 | | | | — | |
Expiring 01/29/21 | | Morgan Stanley & Co. International PLC | | | BRL | | | | 10,588 | | | | 2,644,000 | | | | 2,568,048 | | | | — | | | | (75,952 | ) |
Expiring 03/31/21 | | Citibank, N.A. | | | BRL | | | | 24,032 | | | | 5,817,900 | | | | 5,800,499 | | | | — | | | | (17,401 | ) |
Expiring 09/30/21 | | Bank of America, N.A. | | | BRL | | | | 66,197 | | | | 14,993,000 | | | | 15,747,875 | | | | 754,875 | | | | — | |
British Pound, | | | | | | | | | | | | | | | | | | | | | | | | | | |
Expiring 11/27/19 | | HSBC Bank USA, N.A. | | | GBP | | | | 1,642 | | | | 2,127,591 | | | | 2,129,190 | | | | 1,599 | | | | — | |
Expiring 01/17/20 | | Barclays Bank PLC | | | GBP | | | | 2,808 | | | | 3,630,381 | | | | 3,646,768 | | | | 16,387 | | | | — | |
Expiring 01/17/20 | | Barclays Bank PLC | | | GBP | | | | 703 | | | | 907,000 | | | | 912,685 | | | | 5,685 | | | | — | |
Expiring 01/17/20 | | BNP Paribas S.A. | | | GBP | | | | 1,041 | | | | 1,350,000 | | | | 1,351,532 | | | | 1,532 | | | | — | |
Expiring 01/17/20 | | Morgan Stanley & Co. International PLC | | | GBP | | | | 1,271 | | | | 1,636,000 | | | | 1,650,538 | | | | 14,538 | | | | — | |
Expiring 01/17/20 | | Morgan Stanley & Co. International PLC | | | GBP | | | | 844 | | | | 1,088,000 | | | | 1,096,260 | | | | 8,260 | | | | — | |
Expiring 07/29/20 | | HSBC Bank USA, N.A. | | | GBP | | | | 2,084 | | | | 2,717,890 | | | | 2,718,340 | | | | 450 | | | | — | |
Expiring 07/29/20 | | Morgan Stanley & Co. International PLC | | | GBP | | | | 11,666 | | | | 14,795,754 | | | | 15,216,964 | | | | 421,210 | | | | — | |
Canadian Dollar, | | | | | | | | | | | | | | | | | | | | | | | | | | |
Expiring 01/22/20 | | Barclays Bank PLC | | | CAD | | | | 1,799 | | | | 1,370,219 | | | | 1,366,386 | | | | — | | | | (3,833 | ) |
Expiring 01/22/20 | | Barclays Bank PLC | | | CAD | | | | 1,599 | | | | 1,225,000 | | | | 1,214,355 | | | | — | | | | (10,645 | ) |
Expiring 01/22/20 | | BNP Paribas S.A. | | | CAD | | | | 1,100 | | | | 842,000 | | | | 835,918 | | | | — | | | | (6,082 | ) |
Chilean Peso, | | | | | | | | | | | | | | | | | | | | | | | | | | |
Expiring 12/18/19 | | Barclays Bank PLC | | | CLP | | | | 640,144 | | | | 897,000 | | | | 864,235 | | | | — | | | | (32,765 | ) |
See Notes to Financial Statements.
Forward foreign currency exchange contracts outstanding at October 31, 2019 (continued):
| | | | | | | | | | | | | | | | | | | | | | | | | | |
Purchase Contracts | | Counterparty | | Notional
Amount
(000) | | | Value at
Settlement
Date | | | Current
Value | | | Unrealized
Appreciation | | | Unrealized
Depreciation | |
OTC Forward Foreign Currency Exchange Contracts (cont’d.): | | | | | |
Chilean Peso (cont’d.), | | | | | | | | | | | | | | | | | | | | | | | | |
Expiring 12/18/19 | | Barclays Bank PLC | | | CLP | | | | 329,883 | | | $ | 459,000 | | | $ | 445,364 | | | $ | — | | | $ | (13,636 | ) |
Expiring 12/18/19 | | BNP Paribas S.A. | | | CLP | | | | 2,908,627 | | | | 4,010,000 | | | | 3,926,833 | | | | — | | | | (83,167 | ) |
Expiring 12/18/19 | | BNP Paribas S.A. | | | CLP | | | | 1,204,656 | | | | 1,666,616 | | | | 1,626,363 | | | | — | | | | (40,253 | ) |
Expiring 12/18/19 | | BNP Paribas S.A. | | | CLP | | | | 558,094 | | | | 774,650 | | | | 753,462 | | | | — | | | | (21,188 | ) |
Expiring 12/18/19 | | Goldman Sachs International | | | CLP | | | | 1,007,868 | | | | 1,410,000 | | | | 1,360,686 | | | | — | | | | (49,314 | ) |
Expiring 12/18/19 | | Goldman Sachs International | | | CLP | | | | 392,544 | | | | 542,000 | | | | 529,959 | | | | — | | | | (12,041 | ) |
Expiring 12/18/19 | | JPMorgan Chase Bank, N.A. | | | CLP | | | | 969,586 | | | | 1,344,434 | | | | 1,309,003 | | | | — | | | | (35,431 | ) |
Expiring 12/18/19 | | JPMorgan Chase Bank, N.A. | | | CLP | | | | 525,476 | | | | 723,000 | | | | 709,427 | | | | — | | | | (13,573 | ) |
Expiring 12/18/19 | | UBS AG | | | CLP | | | | 1,708,719 | | | | 2,359,650 | | | | 2,306,880 | | | | — | | | | (52,770 | ) |
Expiring 12/18/19 | | UBS AG | | | CLP | | | | 574,452 | | | | 810,000 | | | | 775,547 | | | | — | | | | (34,453 | ) |
Chinese Renminbi, | | | | | | | | | | | | | | | | | | | | | | | | | | |
Expiring 02/14/20 | | BNP Paribas S.A. | | | CNH | | | | 40,990 | | | | 5,777,682 | | | | 5,798,952 | | | | 21,270 | | | | — | |
Expiring 02/14/20 | | BNP Paribas S.A. | | | CNH | | | | 7,404 | | | | 1,045,000 | | | | 1,047,443 | | | | 2,443 | | | | — | |
Expiring 02/14/20 | | BNP Paribas S.A. | | | CNH | | | | 6,991 | | | | 990,000 | | | | 989,072 | | | | — | | | | (928 | ) |
Expiring 02/14/20 | | Citibank, N.A. | | | CNH | | | | 6,207 | | | | 877,000 | | | | 878,144 | | | | 1,144 | | | | — | |
Expiring 02/28/20 | | Citibank, N.A. | | | CNH | | | | 10,395 | | | | 1,476,014 | | | | 1,470,022 | | | | — | | | | (5,992 | ) |
Expiring 02/28/20 | | HSBC Bank USA, N.A. | | | CNH | | | | 8,958 | | | | 1,322,502 | | | | 1,266,785 | | | | — | | | | (55,717 | ) |
Expiring 02/28/20 | | Morgan Stanley & Co. International PLC | | | CNH | | | | 52,459 | | | | 8,078,000 | | | | 7,418,717 | | | | — | | | | (659,283 | ) |
Expiring 05/14/21 | | Citibank, N.A. | | | CNH | | | | 43,724 | | | | 6,265,983 | | | | 6,106,744 | | | | — | | | | (159,239 | ) |
Colombian Peso, | | | | | | | | | | | | | | | | | | | | | | | | | | |
Expiring 12/18/19 | | Citibank, N.A. | | | COP | | | | 1,226,880 | | | | 355,000 | | | | 362,327 | | | | 7,327 | | | | — | |
See Notes to Financial Statements.
| | | | |
| PGIM Absolute Return Bond Fund | | | 69 | |
Schedule of Investments(continued)
as of October 31, 2019
Forward foreign currency exchange contracts outstanding at October 31, 2019 (continued):
| | | | | | | | | | | | | | | | | | | | | | |
Purchase Contracts | | Counterparty | | Notional
Amount
(000) | | | Value at
Settlement
Date | | | Current
Value | | | Unrealized
Appreciation | | | Unrealized
Depreciation | |
OTC Forward Foreign Currency Exchange Contracts (cont’d.): | | | | | | | | | | | | | |
Czech Koruna, | | | | | | | | | | | | | | | | | | | | | | |
Expiring 01/17/20 | | Citibank, N.A. | | CZK | 14,023 | | | $ | 612,000 | | | $ | 613,696 | | | $ | 1,696 | | | $ | — | |
Expiring 01/17/20 | | Citibank, N.A. | | CZK | 12,896 | | | | 553,000 | | | | 564,390 | | | | 11,390 | | | | — | |
Expiring 01/17/20 | | Morgan Stanley & Co. International PLC | | CZK | 27,464 | | | | 1,194,000 | | | | 1,201,943 | | | | 7,943 | | | | — | |
Expiring 01/17/20 | | Morgan Stanley & Co. International PLC | | CZK | 19,740 | | | | 844,000 | | | | 863,923 | | | | 19,923 | | | | — | |
Expiring 01/17/20 | | Morgan Stanley & Co. International PLC | | CZK | 16,812 | | | | 734,000 | | | | 735,757 | | | | 1,757 | | | | — | |
Expiring 01/17/20 | | UBS AG | | CZK | 11,414 | | | | 496,000 | | | | 499,512 | | | | 3,512 | | | | — | |
Euro, | | | | | | | | | | | | | | | | | | | | | | |
Expiring 11/27/19 | | JPMorgan Chase Bank, N.A. | | EUR | 210 | | | | 235,448 | | | | 235,145 | | | | — | | | | (303 | ) |
Expiring 01/17/20 | | Barclays Bank PLC | | EUR | 1,704 | | | | 1,910,000 | | | | 1,910,888 | | | | 888 | | | | — | |
Expiring 01/17/20 | | Barclays Bank PLC | | EUR | 1,655 | | | | 1,859,000 | | | | 1,856,486 | | | | — | | | | (2,514 | ) |
Expiring 01/17/20 | | Barclays Bank PLC | | EUR | 1,413 | | | | 1,572,000 | | | | 1,584,662 | | | | 12,662 | | | | — | |
Expiring 01/17/20 | | Barclays Bank PLC | | EUR | 567 | | | | 635,000 | | | | 636,431 | | | | 1,431 | | | | — | |
Expiring 01/17/20 | | BNP Paribas S.A. | | EUR | 477 | | | | 534,000 | | | | 534,710 | | | | 710 | | | | — | |
Expiring 01/31/20 | | Morgan Stanley & Co. International PLC | | EUR | 4,298 | | | | 5,216,482 | | | | 4,824,118 | | | | — | | | | (392,364 | ) |
Expiring 02/28/20 | | Bank of America, N.A. | | EUR | 5,226 | | | | 6,837,176 | | | | 5,875,531 | | | | — | | | | (961,645 | ) |
Expiring 02/28/20 | | Morgan Stanley & Co. International PLC | | EUR | 4,622 | | | | 5,622,447 | | | | 5,196,261 | | | | — | | | | (426,186 | ) |
Hungarian Forint, | | | | | | | | | | | | | | | | | | | | | | |
Expiring 01/17/20 | | Citibank, N.A. | | HUF | 195,515 | | | | 653,000 | | | | 666,594 | | | | 13,594 | | | | — | |
Expiring 01/17/20 | | Citibank, N.A. | | HUF | 114,948 | | | | 391,000 | | | | 391,906 | | | | 906 | | | | — | |
Expiring 01/17/20 | | JPMorgan Chase Bank, N.A. | | HUF | 221,516 | | | | 741,000 | | | | 755,245 | | | | 14,245 | | | | — | |
Indian Rupee, | | | | | | | | | | | | | | | | | | | | | | |
Expiring 11/27/19 | | Citibank, N.A. | | INR | 41,795 | | | | 589,000 | | | | 586,219 | | | | — | | | | (2,781 | ) |
See Notes to Financial Statements.
Forward foreign currency exchange contracts outstanding at October 31, 2019 (continued):
| | | | | | | | | | | | | | | | | | | | | | | | | | |
Purchase Contracts | | Counterparty | | Notional
Amount
(000) | | | Value at
Settlement
Date | | | Current
Value | | | Unrealized
Appreciation | | | Unrealized
Depreciation | |
OTC Forward Foreign Currency Exchange Contracts (cont’d.): | | | | | | | | | | | | | |
Indian Rupee (cont’d.), | | | | | | | | | | | | | | | | | | | | | | | | |
Expiring 11/27/19 | | JPMorgan Chase Bank, N.A. | | | INR | | | | 47,242 | | | $ | 649,655 | | | $ | 662,606 | | | $ | 12,951 | | | $ | — | |
Expiring 11/27/19 | | Morgan Stanley & Co. International PLC | | | INR | | | | 60,846 | | | | 841,000 | | | | 853,425 | | | | 12,425 | | | | — | |
Expiring 12/18/19 | | Barclays Bank PLC | | | INR | | | | 46,850 | | | | 658,000 | | | | 655,433 | | | | — | | | | (2,567 | ) |
Expiring 12/18/19 | | Barclays Bank PLC | | | INR | | | | 39,808 | | | | 547,000 | | | | 556,919 | | | | 9,919 | | | | — | |
Expiring 12/18/19 | | Citibank, N.A. | | | INR | | | | 408,769 | | | | 5,608,990 | | | | 5,718,743 | | | | 109,753 | | | | — | |
Expiring 12/18/19 | | Citibank, N.A. | | | INR | | | | 64,183 | | | | 889,000 | | | | 897,930 | | | | 8,930 | | | | — | |
Expiring 12/18/19 | | HSBC Bank USA, N.A. | | | INR | | | | 962,479 | | | | 13,247,256 | | | | 13,465,232 | | | | 217,976 | | | | — | |
Expiring 12/18/19 | | HSBC Bank USA, N.A. | | | INR | | | | 47,456 | | | | 666,000 | | | | 663,924 | | | | — | | | | (2,076 | ) |
Expiring 12/18/19 | | JPMorgan Chase Bank, N.A. | | | INR | | | | 79,287 | | | | 1,095,000 | | | | 1,109,241 | | | | 14,241 | | | | — | |
Expiring 12/18/19 | | JPMorgan Chase Bank, N.A. | | | INR | | | | 72,352 | | | | 1,006,000 | | | | 1,012,209 | | | | 6,209 | | | | — | |
Expiring 10/30/20 | | Goldman Sachs International | | | INR | | | | 332,853 | | | | 4,397,000 | | | | 4,489,389 | | | | 92,389 | | | | — | |
Expiring 12/23/20 | | Goldman Sachs International | | | INR | | | | 210,802 | | | | 2,761,000 | | | | 2,824,989 | | | | 63,989 | | | | — | |
Expiring 02/26/21 | | Morgan Stanley & Co. International PLC | | | INR | | | | 296,308 | | | | 3,993,909 | | | | 3,940,450 | | | | — | | | | (53,459 | ) |
Indonesian Rupiah, | | | | | | | | | | | | | | | | | | | | | | | | | | |
Expiring 12/18/19 | | BNP Paribas S.A. | | | IDR | | | | 10,014,992 | | | | 712,000 | | | | 707,414 | | | | — | | | | (4,586 | ) |
Expiring 12/18/19 | | Citibank, N.A. | | | IDR | | | | 9,740,336 | | | | 691,000 | | | | 688,013 | | | | — | | | | (2,987 | ) |
Expiring 12/18/19 | | HSBC Bank USA, N.A. | | | IDR | | | | 43,245,863 | | | | 3,065,000 | | | | 3,054,692 | | | | — | | | | (10,308 | ) |
Expiring 12/18/19 | | HSBC Bank USA, N.A. | | | IDR | | | | 9,650,820 | | | | 673,000 | | | | 681,690 | | | | 8,690 | | | | — | |
Expiring 12/18/19 | | JPMorgan Chase Bank, N.A. | | | IDR | | | | 8,761,740 | | | | 611,000 | | | | 618,890 | | | | 7,890 | | | | — | |
Israeli Shekel, | | | | | | | | | | | | | | | | | | | | | | | | | | |
Expiring 11/27/19 | | BNP Paribas S.A. | | | ILS | | | | 2,433 | | | | 699,000 | | | | 691,125 | | | | — | | | | (7,875 | ) |
Expiring 12/18/19 | | Bank of America, N.A. | | | ILS | | | | 4,793 | | | | 1,375,000 | | | | 1,363,163 | | | | — | | | | (11,837 | ) |
See Notes to Financial Statements.
| | | | |
| PGIM Absolute Return Bond Fund | | | 71 | |
Schedule of Investments(continued)
as of October 31, 2019
Forward foreign currency exchange contracts outstanding at October 31, 2019 (continued):
| | | | | | | | | | | | | | | | | | | | | | | | |
Purchase Contracts | | Counterparty | | Notional
Amount
(000) | | | Value at
Settlement
Date | | | Current
Value | | | Unrealized
Appreciation | | | Unrealized
Depreciation | |
OTC Forward Foreign Currency Exchange Contracts (cont’d.): | | | | | |
Israeli Shekel (cont’d.), | | | | | | | | | | | | | |
Expiring 12/18/19 | | Barclays Bank PLC | | ILS | | | 4,145 | | | $ | 1,184,919 | | | $ | 1,179,069 | | | $ | — | | | $ | (5,850 | ) |
Expiring 12/18/19 | | Barclays Bank PLC | | ILS | | | 3,866 | | | | 1,115,000 | | | | 1,099,598 | | | | — | | | | (15,402 | ) |
Expiring 12/18/19 | | Barclays Bank PLC | | ILS | | | 3,019 | | | | 868,000 | | | | 858,614 | | | | — | | | | (9,386 | ) |
Expiring 12/18/19 | | Barclays Bank PLC | | ILS | | | 2,477 | | | | 708,831 | | | | 704,443 | | | | — | | | | (4,388 | ) |
Expiring 12/18/19 | | Barclays Bank PLC | | ILS | | | 2,453 | | | | 708,000 | | | | 697,678 | | | | — | | | | (10,322 | ) |
Expiring 12/18/19 | | Citibank, N.A. | | ILS | | | 6,584 | | | | 1,889,900 | | | | 1,872,824 | | | | — | | | | (17,076 | ) |
Expiring 12/18/19 | | Citibank, N.A. | | ILS | | | 4,519 | | | | 1,280,000 | | | | 1,285,305 | | | | 5,305 | | | | — | |
Expiring 12/18/19 | | Citibank, N.A. | | ILS | | | 4,273 | | | | 1,224,000 | | | | 1,215,380 | | | | — | | | | (8,620 | ) |
Expiring 12/18/19 | | Citibank, N.A. | | ILS | | | 4,083 | | | | 1,160,000 | | | | 1,161,467 | | | | 1,467 | | | | — | |
Expiring 12/18/19 | | Citibank, N.A. | | ILS | | | 2,693 | | | | 768,000 | | | | 766,063 | | | | — | | | | (1,937 | ) |
Expiring 12/18/19 | | JPMorgan Chase Bank, N.A. | | ILS | | | 6,310 | | | | 1,792,665 | | | | 1,794,879 | | | | 2,214 | | | | — | |
Expiring 12/18/19 | | JPMorgan Chase Bank, N.A. | | ILS | | | 3,798 | | | | 1,081,578 | | | | 1,080,373 | | | | — | | | | (1,205 | ) |
Expiring 06/30/21 | | Bank of America, N.A. | | ILS | |
| 27,438
|
| | | 7,937,000 | | | | 8,029,778 | | | | 92,778 | | | | — | |
Japanese Yen, | | | | | | | | | | | | | | | | | | | | | | | | |
Expiring 11/27/19 | | Bank of America, N.A. | | JPY | | | 240,038 | | | | 2,277,000 | | | | 2,226,213 | | | | — | | | | (50,787 | ) |
Expiring 11/27/19 | | Bank of America, N.A. | | JPY | | | 85,205 | | | | 796,000 | | | | 790,231 | | | | — | | | | (5,769 | ) |
Expiring 11/27/19 | | Citibank, N.A. | | JPY | | | 87,020 | | | | 806,000 | | | | 807,065 | | | | 1,065 | | | | — | |
Expiring 11/27/19 | | Deutsche Bank AG | | JPY | | | 284,563 | | | | 2,720,000 | | | | 2,639,154 | | | | — | | | | (80,846 | ) |
Expiring 11/27/19 | | Deutsche Bank AG | | JPY | | | 188,577 | | | | 1,763,000 | | | | 1,748,946 | | | | — | | | | (14,054 | ) |
Expiring 11/27/19 | | HSBC Bank USA, N.A. | | JPY | | | 233,564 | | | | 2,218,000 | | | | 2,166,174 | | | | — | | | | (51,826 | ) |
Expiring 11/27/19 | | HSBC Bank USA, N.A. | | JPY | | | 85,156 | | | | 794,000 | | | | 789,769 | | | | — | | | | (4,231 | ) |
See Notes to Financial Statements.
Forward foreign currency exchange contracts outstanding at October 31, 2019 (continued):
| | | | | | | | | | | | | | | | | | | | | | | | |
Purchase Contracts | | Counterparty | | Notional
Amount
(000) | | | Value at
Settlement
Date | | | Current
Value | | | Unrealized
Appreciation | | | Unrealized
Depreciation | |
OTC Forward Foreign Currency Exchange Contracts (cont’d.): | | | | | | | | | |
Japanese Yen (cont’d.), | | | | | | | | | | | | | | | | | | | | |
Expiring 11/27/19 | | UBS AG | | JPY | | | 133,547 | | | $ | 1,249,000 | | | $ | 1,238,567 | | | $ | — | | | $ | (10,433 | ) |
Expiring 01/17/20 | | Barclays Bank PLC | | JPY | | | 121,011 | | | | 1,121,000 | | | | 1,126,615 | | | | 5,615 | | | | — | |
Expiring 01/17/20 | | BNP Paribas S.A. | | JPY | | | 56,687 | | | | 525,000 | | | | 527,754 | | | | 2,754 | | | | — | |
Expiring 01/17/20 | | Citibank, N.A. | | JPY | | | 62,130 | | | | 576,000 | | | | 578,437 | | | | 2,437 | | | | — | |
Expiring 01/17/20 | | Morgan Stanley & Co. International PLC | | JPY | | | 180,345 | | | | 1,675,330 | | | | 1,679,018 | | | | 3,688 | | | | — | |
Expiring 07/29/20 | | Deutsche Bank AG | | JPY | | | 353,913 | | | | 3,369,000 | | | | 3,331,206 | | | | — | | | | (37,794 | ) |
Expiring 10/30/20 | | Bank of America, N.A. | | JPY | | | 1,225,300 | | | | 11,507,000 | | | | 11,590,639 | | | | 83,639 | | | | — | |
Expiring 01/29/21 | | Barclays Bank PLC | | JPY | | | 726,043 | | | | 6,983,000 | | | | 6,900,961 | | | | — | | | | (82,039 | ) |
Expiring 01/29/21 | | Citibank, N.A. | | JPY | | | 748,513 | | | | 7,462,000 | | | | 7,114,534 | | | | — | | | | (347,466 | ) |
Expiring 01/29/21 | | Morgan Stanley & Co. International PLC | | JPY | | | 992,486 | | | | 9,655,000 | | | | 9,433,465 | | | | — | | | | (221,535 | ) |
Expiring 10/31/23 | | Barclays Bank PLC | | JPY | | | 487,838 | | | | 5,118,000 | | | | 4,907,180 | | | | — | | | | (210,820 | ) |
Expiring 10/31/23 | | Deutsche Bank AG | | JPY | | | 498,249 | | | | 5,220,000 | | | | 5,011,910 | | | | — | | | | (208,090 | ) |
Expiring 10/31/23 | | Goldman Sachs International | | JPY | | | 874,045 | | | | 8,971,000 | | | | 8,792,055 | | | | — | | | | (178,945 | ) |
Mexican Peso, | | | | | | | | | | | | | | | | | | | | | | | | |
Expiring 11/27/19 | | Bank of America, N.A. | | MXN | | | 37,138 | | | | 1,931,000 | | | | 1,922,364 | | | | — | | | | (8,636 | ) |
Expiring 11/27/19 | | Bank of America, N.A. | | MXN | | | 19,388 | | | | 957,000 | | | | 1,003,568 | | | | 46,568 | | | | — | |
Expiring 11/27/19 | | BNP Paribas S.A. | | MXN | | | 108,607 | | | | 5,406,487 | | | | 5,621,849 | | | | 215,362 | | | | — | |
Expiring 11/27/19 | | Goldman Sachs International | | MXN | | | 40,186 | | | | 1,999,000 | | | | 2,080,161 | | | | 81,161 | | | | — | |
Expiring 11/27/19 | | HSBC Bank USA, N.A. | | MXN | | | 16,836 | | | | 845,000 | | | | 871,498 | | | | 26,498 | | | | — | |
Expiring 11/27/19 | | HSBC Bank USA, N.A. | | MXN | | | 13,360 | | | | 669,000 | | | | 691,542 | | | | 22,542 | | | | — | |
Expiring 11/27/19 | | Morgan Stanley & Co. International PLC | | MXN | | | 75,650 | | | | 3,813,000 | | | | 3,915,892 | | | | 102,892 | | | | — | |
See Notes to Financial Statements.
| | | | |
| PGIM Absolute Return Bond Fund | | | 73 | |
Schedule of Investments(continued)
as of October 31, 2019
Forward foreign currency exchange contracts outstanding at October 31, 2019 (continued):
| | | | | | | | | | | | | | | | | | | | | | | | | | |
Purchase Contracts | | Counterparty | | Notional
Amount
(000) | | | Value at
Settlement
Date | | | Current
Value | | | Unrealized
Appreciation | | | Unrealized
Depreciation | |
OTC Forward Foreign Currency Exchange Contracts (cont’d.): | | | | | |
Mexican Peso (cont’d.), | | | | | | | | | | | | | | | | | | | | | |
Expiring 12/18/19 | | Barclays Bank PLC | | | MXN | | | | 15,272 | | | $ | 793,000 | | | $ | 787,998 | | | $ | — | | | $ | (5,002 | ) |
Expiring 12/18/19 | | Barclays Bank PLC | | | MXN | | | | 8,955 | | | | 461,000 | | | | 462,086 | | | | 1,086 | | | | — | |
Expiring 12/18/19 | | Citibank, N.A. | | | MXN | | | | 9,186 | | | | 475,000 | | | | 473,977 | | | | — | | | | (1,023 | ) |
Expiring 12/18/19 | | Goldman Sachs International | | | MXN | | | | 8,386 | | | | 431,000 | | | | 432,727 | | | | 1,727 | | | | — | |
Expiring 12/18/19 | | HSBC Bank USA, N.A. | | | MXN | | | | 13,688 | | | | 703,000 | | | | 706,296 | | | | 3,296 | | | | — | |
Expiring 12/18/19 | | JPMorgan Chase Bank, N.A. | | | MXN | | | | 168,388 | | | | 8,344,920 | | | | 8,688,598 | | | | 343,678 | | | | — | |
Expiring 12/18/19 | | Morgan Stanley & Co. International PLC | | | MXN | | | | 17,593 | | | | 911,000 | | | | 907,799 | | | | — | | | | (3,201 | ) |
Expiring 12/18/19 | | Morgan Stanley & Co. International PLC | | | MXN | | | | 11,885 | | | | 598,000 | | | | 613,226 | | | | 15,226 | | | | — | |
Expiring 12/18/19 | | UBS AG | | | MXN | | | | 15,089 | | | | 782,000 | | | | 778,577 | | | | — | | | | (3,423 | ) |
Expiring 12/24/19 | | Goldman Sachs International | | | MXN | | | | 23,280 | | | | 1,139,331 | | | | 1,200,124 | | | | 60,793 | | | | — | |
Expiring 12/24/19 | | JPMorgan Chase Bank, N.A. | | | MXN | | | | 13,271 | | | | 650,093 | | | | 684,128 | | | | 34,035 | | | | — | |
Expiring 02/28/20 | | Morgan Stanley & Co. International PLC | | | MXN | | | | 35,804 | | | | 1,838,000 | | | | 1,828,366 | | | | — | | | | (9,634 | ) |
Expiring 04/30/20 | | Citibank, N.A. | | | MXN | | | | 42,285 | | | | 2,048,669 | | | | 2,140,014 | | | | 91,345 | | | | — | |
Expiring 04/30/20 | | Deutsche Bank AG | | | MXN | | | | 252,381 | | | | 11,379,000 | | | | 12,772,940 | | | | 1,393,940 | | | | — | |
Expiring 04/30/20 | | JPMorgan Chase Bank, N.A. | | | MXN | | | | 13,553 | | | | 665,000 | | | | 685,900 | | | | 20,900 | | | | — | |
Expiring 04/30/20 | | Morgan Stanley & Co. International PLC | | | MXN | | | | 74,340 | | | | 3,602,000 | | | | 3,762,330 | | | | 160,330 | | | | — | |
Expiring 10/30/20 | | Morgan Stanley & Co. International PLC | | | MXN | | | | 306,088 | | | | 14,433,000 | | | | 15,114,319 | | | | 681,319 | | | | — | |
Expiring 01/29/21 | | Goldman Sachs International | | | MXN | | | | 94,522 | | | | 4,426,016 | | | | 4,615,835 | | | | 189,819 | | | | — | |
Expiring 01/29/21 | | Morgan Stanley & Co. International PLC | | | MXN | | | | 34,930 | | | | 1,620,000 | | | | 1,705,734 | | | | 85,734 | | | | — | |
Expiring 04/29/21 | | JPMorgan Chase Bank, N.A. | | | MXN | | | | 66,328 | | | | 3,022,811 | | | | 3,204,015 | | | | 181,204 | | | | — | |
Expiring 04/29/21 | | Morgan Stanley & Co. International PLC | | | MXN | | | | 316,200 | | | | 14,891,000 | | | | 15,274,228 | | | | 383,228 | | | | — | |
See Notes to Financial Statements.
Forward foreign currency exchange contracts outstanding at October 31, 2019 (continued):
| | | | | | | | | | | | | | | | | | | | | | | | | | |
Purchase Contracts | | Counterparty | | Notional
Amount
(000) | | | Value at
Settlement
Date | | | Current
Value | | | Unrealized
Appreciation | | | Unrealized
Depreciation | |
OTC Forward Foreign Currency Exchange Contracts (cont’d.): | | | | | |
Mexican Peso (cont’d.), | | | | | | | | | | | | | | | | | |
Expiring 04/28/23 | | JPMorgan Chase Bank, N.A. | | | MXN | | | | 72,679 | | | $ | 3,006,698 | | | $ | 3,212,464 | | | $ | 205,766 | | | $ | — | |
Expiring 04/28/23 | | Morgan Stanley & Co. International PLC | | | MXN | | | | 231,058 | | | | 9,739,000 | | | | 10,212,863 | | | | 473,863 | | | | — | |
New Taiwanese Dollar, | | | | | | | | | | | | | | | | | | | | | | | | | | |
Expiring 12/18/19 | | Barclays Bank PLC | | | TWD | | | | 48,029 | | | | 1,585,000 | | | | 1,585,758 | | | | 758 | | | | — | |
Expiring 12/18/19 | | Barclays Bank PLC | | | TWD | | | | 27,249 | | | | 902,000 | | | | 899,691 | | | | — | | | | (2,309 | ) |
Expiring 12/18/19 | | Barclays Bank PLC | | | TWD | | | | 23,161 | | | | 764,000 | | | | 764,693 | | | | 693 | | | | — | |
Expiring 12/18/19 | | Credit Suisse International TWD 58,578 | | | | | | | | | | | 1,911,000 | | | | 1,934,060 | | | | 23,060 | | | | — | |
Expiring 12/18/19 | | JPMorgan Chase Bank, N.A. | | | TWD | | | | 248,108 | | | | 8,103,080 | | | | 8,191,765 | | | | 88,685 | | | | — | |
Expiring 12/18/19 | | JPMorgan Chase Bank, N.A. | | | TWD | | | | 30,271 | | | | 983,000 | | | | 999,471 | | | | 16,471 | | | | — | |
New Zealand Dollar, | | | | | | | | | | | | | | | | | | | | | | | | |
Expiring 01/22/20 | | Barclays Bank PLC | | | NZD | | | | 1,574 | | | | 1,007,000 | | | | 1,010,600 | | | | 3,600 | | | | — | |
Expiring 01/22/20 | | BNP Paribas S.A. | | | NZD | | | | 1,407 | | | | 904,000 | | | | 903,750 | | | | — | | | | (250 | ) |
Norwegian Krone, | | | | | | | | | | | | | | | | | | | | | | | | | | |
Expiring 01/17/20 | | Bank of America, N.A. | | | NOK | | | | 101,543 | | | | 11,151,541 | | | | 11,047,401 | | | | — | | | | (104,140 | ) |
Expiring 01/17/20 | | JPMorgan Chase Bank, N.A. | | | NOK | | | | 96,512 | | | | 10,618,083 | | | | 10,500,095 | | | | — | | | | (117,988 | ) |
Peruvian Nuevo Sol, | | | | | | | | | | | | | | | | | | | | | | | | | | |
Expiring 12/18/19 | | Bank of America, N.A. | | | PEN | | | | 3,899 | | | | 1,150,000 | | | | 1,164,102 | | | | 14,102 | | | | — | |
Expiring 12/18/19 | | BNP Paribas S.A. | | | PEN | | | | 28,416 | | | | 8,406,965 | | | | 8,482,950 | | | | 75,985 | | | | — | |
Expiring 12/18/19 | | BNP Paribas S.A. | | | PEN | | | | 2,860 | | | | 846,000 | | | | 853,836 | | | | 7,836 | | | | — | |
Expiring 12/18/19 | | BNP Paribas S.A. | | | PEN | | | | 2,630 | | | | 774,000 | | | | 785,179 | | | | 11,179 | | | | — | |
Expiring 12/18/19 | | BNP Paribas S.A. | | | PEN | | | | 2,486 | | | | 730,000 | | | | 742,003 | | | | 12,003 | | | | — | |
Expiring 12/18/19 | | Citibank, N.A. | | | PEN | | | | 2,784 | | | | 823,000 | | | | 831,176 | | | | 8,176 | | | | — | |
Expiring 12/18/19 | | HSBC Bank USA, N.A. | | | PEN | | | | 2,337 | | | | 695,000 | | | | 697,568 | | | | 2,568 | | | | — | |
See Notes to Financial Statements.
| | | | |
| PGIM Absolute Return Bond Fund | | | 75 | |
Schedule of Investments (continued)
as of October 31, 2019
Forward foreign currency exchange contracts outstanding at October 31, 2019 (continued):
| | | | | | | | | | | | | | | | | | | | | | |
Purchase Contracts | | Counterparty | | Notional
Amount
(000) | | | Value at
Settlement
Date | | | Current
Value | | | Unrealized
Appreciation | | | Unrealized
Depreciation | |
OTC Forward Foreign Currency Exchange Contracts (cont’d.): | |
Philippine Peso, | | | | | | | | | | | | | | | | | | | | | | |
Expiring 12/18/19 | | Barclays Bank PLC | | PHP | 66,046 | | | $ | 1,291,000 | | | $ | 1,298,418 | | | $ | 7,418 | | | $ | — | |
Expiring 12/18/19 | | Credit Suisse International | | PHP | 54,661 | | | | 1,070,000 | | | | 1,074,592 | | | | 4,592 | | | | — | |
Expiring 12/18/19 | | Goldman Sachs
International | | PHP | 39,484 | | | | 764,000 | | | | 776,215 | | | | 12,215 | | | | — | |
Expiring 12/18/19 | | JPMorgan Chase Bank, N.A. | | PHP | 184,352 | | | | 3,529,449 | | | | 3,624,216 | | | | 94,767 | | | | — | |
Expiring 12/18/19 | | Morgan Stanley & Co.
International PLC | | PHP | 54,961 | | | | 1,053,000 | | | | 1,080,497 | | | | 27,497 | | | | — | |
Polish Zloty, | | | | | | | | | | | | | | | | | | | | | | |
Expiring 01/17/20 | | Barclays Bank PLC | | PLN | 2,679 | | | | 699,000 | | | | 701,633 | | | | 2,633 | | | | — | |
Expiring 01/17/20 | | Citibank, N.A. | | PLN | 3,751 | | | | 964,000 | | | | 982,365 | | | | 18,365 | | | | — | |
Expiring 01/17/20 | | Citibank, N.A. | | PLN | 3,013 | | | | 776,000 | | | | 789,174 | | | | 13,174 | | | | — | |
Expiring 01/17/20 | | Citibank, N.A. | | PLN | 2,138 | | | | 558,000 | | | | 559,824 | | | | 1,824 | | | | — | |
Expiring 01/17/20 | | HSBC Bank USA, N.A. | | PLN | 3,458 | | | | 900,000 | | | | 905,641 | | | | 5,641 | | | | — | |
Expiring 01/17/20 | | JPMorgan Chase Bank, N.A. | | PLN | 1,815 | | | | 471,000 | | | | 475,387 | | | | 4,387 | | | | — | |
Expiring 01/17/20 | | Morgan Stanley & Co.
International PLC | | PLN | 3,679 | | | | 961,000 | | | | 963,419 | | | | 2,419 | | | | — | |
Expiring 01/17/20 | | Morgan Stanley & Co.
International PLC | | PLN | 1,866 | | | | 485,000 | | | | 488,799 | | | | 3,799 | | | | — | |
Expiring 01/17/20 | | UBS AG | | PLN | 2,021 | | | | 526,000 | | | | 529,215 | | | | 3,215 | | | | — | |
Russian Ruble, | | | | | | | | | | | | | | | | | | | | | | |
Expiring 11/27/19 | | Barclays Bank PLC | | RUB | 45,994 | | | | 682,000 | | | | 714,460 | | | | 32,460 | | | | — | |
Expiring 11/27/19 | | Citibank, N.A. | | RUB | 160,436 | | | | 2,398,803 | | | | 2,492,164 | | | | 93,361 | | | | — | |
Expiring 12/18/19 | | Barclays Bank PLC | | RUB | 44,521 | | | | 672,000 | | | | 689,409 | | | | 17,409 | | | | — | |
Expiring 12/18/19 | | Barclays Bank PLC | | RUB | 43,318 | | | | 666,000 | | | | 670,768 | | | | 4,768 | | | | — | |
Expiring 12/18/19 | | Barclays Bank PLC | | RUB | 36,184 | | | | 557,000 | | | | 560,307 | | | | 3,307 | | | | — | |
Expiring 12/18/19 | | Barclays Bank PLC | | RUB | 34,540 | | | | 527,000 | | | | 534,853 | | | | 7,853 | | | | — | |
See Notes to Financial Statements.
Forward foreign currency exchange contracts outstanding at October 31, 2019 (continued):
| | | | | | | | | | | | | | | | | | | | | | |
Purchase Contracts | | Counterparty | | Notional
Amount
(000) | | | Value at
Settlement
Date | | | Current
Value | | | Unrealized
Appreciation | | | Unrealized
Depreciation | |
OTC Forward Foreign Currency Exchange Contracts (cont’d.): | | | | | | | | | | | | | | | | | |
Russian Ruble (cont’d.), | | | | | | | | | | | | | | | | | | | | | | |
Expiring 12/18/19 | | Barclays Bank PLC | | RUB | 30,461 | | | $ | 460,000 | | | $ | 471,684 | | | $ | 11,684 | | | $ | — | |
Expiring 12/18/19 | | Citibank, N.A. | | RUB | 61,642 | | | | 952,000 | | | | 954,518 | | | | 2,518 | | | | — | |
Expiring 12/18/19 | | Citibank, N.A. | | RUB | 42,743 | | | | 639,000 | | | | 661,865 | | | | 22,865 | | | | — | |
Expiring 12/18/19 | | Citibank, N.A. | | RUB | 30,743 | | | | 473,000 | | | | 476,046 | | | | 3,046 | | | | — | |
Expiring 12/18/19 | | Credit Suisse International | | RUB | 92,674 | | | | 1,436,689 | | | | 1,435,038 | | | | — | | | | (1,651 | ) |
Expiring 12/18/19 | | JPMorgan Chase Bank, N.A. | | RUB | 45,841 | | | | 708,300 | | | | 709,844 | | | | 1,544 | | | | — | |
Expiring 12/18/19 | | Morgan Stanley & Co. International PLC | | RUB | 498,010 | | | | 7,329,063 | | | | 7,711,614 | | | | 382,551 | | | | — | |
Expiring 12/18/19 | | Morgan Stanley & Co. International PLC | | RUB | 428,319 | | | | 6,330,000 | | | | 6,632,468 | | | | 302,468 | | | | — | |
Expiring 12/24/19 | | Citibank, N.A. | | RUB | 382,303 | | | | 5,577,000 | | | | 5,914,597 | | | | 337,597 | | | | — | |
Expiring 03/31/20 | | Barclays Bank PLC | | RUB | 303,739 | | | | 4,366,581 | | | | 4,645,872 | | | | 279,291 | | | | — | |
Expiring 03/31/20 | | BNP Paribas S.A. | | RUB | 262,318 | | | | 3,692,000 | | | | 4,012,315 | | | | 320,315 | | | | — | |
Expiring 10/30/20 | | Deutsche Bank AG | | RUB | 48,545 | | | | 730,000 | | | | 724,688 | | | | — | | | | (5,312 | ) |
Expiring 12/23/20 | | Goldman Sachs International | | RUB | 1,201,548 | | | | 17,216,000 | | | | 17,828,609 | | | | 612,609 | | | | — | |
Expiring 04/29/21 | | Goldman Sachs International | | RUB | 88,765 | | | | 1,251,000 | | | | 1,298,654 | | | | 47,654 | | | | — | |
Saudi Arabian Riyal, | | | | | | | | | | | | | | | | | | | | | | |
Expiring 11/12/19 | | Morgan Stanley & Co. International PLC | | SAR | 113,400 | | | | 30,157,168 | | | | 30,238,548 | | | | 81,380 | | | | — | |
Singapore Dollar, | | | | | | | | | | | | | | | | | | | | | | |
Expiring 12/18/19 | | Barclays Bank PLC | | SGD | 1,712 | | | | 1,257,000 | | | | 1,259,109 | | | | 2,109 | | | | — | |
Expiring 12/18/19 | | Barclays Bank PLC | | SGD | 1,112 | | | | 818,000 | | | | 818,083 | | | | 83 | | | | — | |
Expiring 12/18/19 | | Barclays Bank PLC | | SGD | 973 | | | | 706,000 | | | | 715,502 | | | | 9,502 | | | | — | |
Expiring 12/18/19 | | Citibank, N.A. | | SGD | 2,922 | | | | 2,126,269 | | | | 2,149,222 | | | | 22,953 | | | | — | |
Expiring 12/18/19 | | Citibank, N.A. | | SGD | 1,451 | | | | 1,065,000 | | | | 1,067,317 | | | | 2,317 | | | | — | |
See Notes to Financial Statements.
| | | | |
| PGIM Absolute Return Bond Fund | | | 77 | |
Schedule of Investments(continued)
as of October 31, 2019
Forward foreign currency exchange contracts outstanding at October 31, 2019 (continued):
| | | | | | | | | | | | | | | | | | | | | | |
Purchase Contracts | | Counterparty | | Notional
Amount
(000) | | | Value at
Settlement
Date | | | Current
Value | | | Unrealized
Appreciation | | | Unrealized
Depreciation | |
OTC Forward Foreign Currency Exchange Contracts (cont’d.): | | | | | | | | | | | | | |
Singapore Dollar (cont’d.), | | | | | | | | | | | | | | | | | | | | |
Expiring 12/18/19 | | Citibank, N.A. | | SGD | 1,438 | | | $ | 1,044,000 | | | $ | 1,057,362 | | | $ | 13,362 | | | $ | — | |
Expiring 12/18/19 | | Goldman Sachs International | | SGD | 10,919 | | | | 8,022,100 | | | | 8,030,311 | | | | 8,211 | | | | — | |
Expiring 12/18/19 | | Goldman Sachs International | | SGD | 1,154 | | | | 848,000 | | | | 848,829 | | | | 829 | | | | — | |
Expiring 12/18/19 | | HSBC Bank USA, N.A. | | SGD | 1,729 | | | | 1,269,000 | | | | 1,271,346 | | | | 2,346 | | | | — | |
Expiring 12/18/19 | | JPMorgan Chase Bank, N.A. | | SGD | 2,068 | | | | 1,519,000 | | | | 1,521,017 | | | | 2,017 | | | | — | |
Expiring 12/18/19 | | JPMorgan Chase Bank, N.A. | | SGD | 2,012 | | | | 1,478,000 | | | | 1,479,477 | | | | 1,477 | | | | — | |
Expiring 12/18/19 | | JPMorgan Chase Bank, N.A. | | SGD | 1,321 | | | | 971,000 | | | | 971,635 | | | | 635 | | | | — | |
Expiring 12/18/19 | | JPMorgan Chase Bank, N.A. | | SGD | 1,204 | | | | 870,000 | | | | 885,196 | | | | 15,196 | | | | — | |
Expiring 12/18/19 | | Morgan Stanley & Co. International PLC | | SGD | 2,504 | | | | 1,820,000 | | | | 1,841,333 | | | | 21,333 | | | | — | |
Expiring 12/18/19 | | Morgan Stanley & Co. International PLC | | SGD | 1,643 | | | | 1,198,000 | | | | 1,208,483 | | | | 10,483 | | | | — | |
Expiring 12/18/19 | | Morgan Stanley & Co. International PLC | | SGD | 1,270 | | | | 932,000 | | | | 933,774 | | | | 1,774 | | | | — | |
South African Rand, | | | | | | | | | | | | | | | | | | | | | | |
Expiring 11/27/19 | | Citibank, N.A. | | ZAR | 10,946 | | | | 738,000 | | | | 721,756 | | | | — | | | | (16,244 | ) |
Expiring 11/27/19 | | HSBC Bank USA, N.A. | | ZAR | 11,331 | | | | 748,000 | | | | 747,143 | | | | — | | | | (857 | ) |
Expiring 11/27/19 | | JPMorgan Chase Bank, N.A. | | ZAR | 10,377 | | | | 697,000 | | | | 684,236 | | | | — | | | | (12,764 | ) |
Expiring 12/18/19 | | Barclays Bank PLC | | ZAR | 10,265 | | | | 689,000 | | | | 674,890 | | | | — | | | | (14,110 | ) |
Expiring 12/18/19 | | Barclays Bank PLC | | ZAR | 5,019 | | | | 341,000 | | | | 329,989 | | | | — | | | | (11,011 | ) |
Expiring 12/18/19 | | Citibank, N.A. | | ZAR | 10,074 | | | | 674,000 | | | | 662,302 | | | | — | | | | (11,698 | ) |
Expiring 12/18/19 | | HSBC Bank USA, N.A. | | ZAR | 10,140 | | | | 680,000 | | | | 666,639 | | | | — | | | | (13,361 | ) |
Expiring 12/18/19 | | JPMorgan Chase Bank, N.A. | | ZAR | 22,178 | | | | 1,441,280 | | | | 1,458,129 | | | | 16,849 | | | | — | |
Expiring 12/18/19 | | JPMorgan Chase Bank, N.A. | | ZAR | 19,153 | | | | 1,261,040 | | | | 1,259,209 | | | | — | | | | (1,831 | ) |
See Notes to Financial Statements.
Forward foreign currency exchange contracts outstanding at October 31, 2019 (continued):
| | | | | | | | | | | | | | | | | | | | | | |
Purchase Contracts | | Counterparty | | Notional
Amount
(000) | | | Value at
Settlement
Date | | | Current
Value | | | Unrealized
Appreciation | | | Unrealized
Depreciation | |
OTC Forward Foreign Currency Exchange Contracts (cont’d.): | | | | | | | | | | | | | |
South African Rand (cont’d.), | | | | | | | | | | | | | | | | | | | | |
Expiring 12/18/19 | | JPMorgan Chase Bank, N.A. | | ZAR | 6,720 | | | $ | 458,000 | | | $ | 441,833 | | | $ | — | | | $ | (16,167 | ) |
Expiring 12/18/19 | | JPMorgan Chase Bank, N.A. | | ZAR | 3,936 | | | | 253,111 | | | | 258,766 | | | | 5,655 | | | | — | |
Expiring 12/18/19 | | The Toronto-Dominion Bank | | ZAR | 6,713 | | | | 455,000 | | | | 441,329 | | | | — | | | | (13,671 | ) |
Expiring 12/18/19 | | UBS AG | | ZAR | 7,601 | | | | 500,000 | | | | 499,746 | | | | — | | | | (254 | ) |
Expiring 12/30/19 | | Barclays Bank PLC | | ZAR | 38,671 | | | | 3,005,230 | | | | 2,537,795 | | | | — | | | | (467,435 | ) |
Expiring 12/30/19 | | BNP Paribas S.A. | | ZAR | 68,785 | | | | 4,346,000 | | | | 4,514,000 | | | | 168,000 | | | | — | |
Expiring 03/31/20 | | Morgan Stanley & Co. International PLC | | ZAR | 33,179 | | | | 2,285,935 | | | | 2,151,592 | | | | — | | | | (134,343 | ) |
Expiring 03/31/20 | | UBS AG | | ZAR | 29,283 | | | | 2,052,800 | | | | 1,898,945 | | | | — | | | | (153,855 | ) |
Expiring 03/31/20 | | UBS AG | | ZAR | 27,854 | | | | 1,806,000 | | | | 1,806,257 | | | | 257 | | | | — | |
Expiring 07/29/20 | | Goldman Sachs International | | ZAR | 77,690 | | | | 5,229,000 | | | | 4,957,452 | | | | — | | | | (271,548 | ) |
Expiring 07/29/20 | | Morgan Stanley & Co. International PLC | | ZAR | 50,366 | | | | 3,417,758 | | | | 3,213,881 | | | | — | | | | (203,877 | ) |
Expiring 08/31/20 | | BNP Paribas S.A. | | ZAR | 43,370 | | | | 2,909,205 | | | | 2,754,975 | | | | — | | | | (154,230 | ) |
Expiring 09/30/20 | | Barclays Bank PLC | | ZAR | 54,937 | | | | 3,653,238 | | | | 3,475,432 | | | | — | | | | (177,806 | ) |
Expiring 09/30/20 | | Citibank, N.A. | | ZAR | 81,741 | | | | 5,035,000 | | | | 5,171,055 | | | | 136,055 | | | | — | |
Expiring 01/29/21 | | Barclays Bank PLC | | ZAR | 55,472 | | | | 3,418,835 | | | | 3,450,673 | | | | 31,838 | | | | — | |
Expiring 01/29/21 | | Goldman Sachs International | | ZAR | 49,473 | | | | 3,250,000 | | | | 3,077,492 | | | | — | | | | (172,508 | ) |
Expiring 01/29/21 | | Morgan Stanley & Co. International PLC | | ZAR | 83,970 | | | | 5,628,000 | | | | 5,223,366 | | | | — | | | | (404,634 | ) |
South Korean Won, | | | | | | | | | | | | | | | | | | | | | | |
Expiring 11/27/19 | | Barclays Bank PLC | | KRW | 826,976 | | | | 688,000 | | | | 707,005 | | | | 19,005 | | | | — | |
Expiring 11/27/19 | | Barclays Bank PLC | | KRW | 644,912 | | | | 534,000 | | | | 551,353 | | | | 17,353 | | | | — | |
Expiring 11/27/19 | | JPMorgan Chase Bank, N.A. | | KRW | 761,957 | | | | 646,000 | | | | 651,419 | | | | 5,419 | | | | — | |
See Notes to Financial Statements.
| | | | |
| PGIM Absolute Return Bond Fund | | | 79 | |
Schedule of Investments(continued)
as of October 31, 2019
Forward foreign currency exchange contracts outstanding at October 31, 2019 (continued):
| | | | | | | | | | | | | | | | | | | | | | |
Purchase Contracts | | Counterparty | | Notional
Amount
(000) | | | Value at
Settlement
Date | | | Current
Value | | | Unrealized
Appreciation | | | Unrealized
Depreciation | |
OTC Forward Foreign Currency Exchange Contracts (cont’d.): | | | | | | | | | | | | | |
South Korean Won (cont’d.), | | | | | | | | | | | | | | | | | | | | |
Expiring 11/27/19 | | JPMorgan Chase Bank, N.A. | | KRW | 230,346 | | | $ | 190,898 | | | $ | 196,929 | | | $ | 6,031 | | | $ | — | |
Expiring 11/27/19 | | Morgan Stanley & Co. International PLC | | KRW | 966,251 | | | | 813,000 | | | | 826,075 | | | | 13,075 | | | | — | |
Expiring 11/27/19 | | Morgan Stanley & Co. International PLC | | KRW | 768,307 | | | | 656,000 | | | | 656,847 | | | | 847 | | | | — | |
Expiring 11/27/19 | | UBS AG | | KRW | 928,461 | | | | 788,000 | | | | 793,767 | | | | 5,767 | | | | — | |
Expiring 12/18/19 | | Barclays Bank PLC | | KRW | 1,609,123 | | | | 1,369,000 | | | | 1,376,310 | | | | 7,310 | | | | — | |
Expiring 12/18/19 | | BNP Paribas S.A. | | KRW | 1,572,519 | | | | 1,322,000 | | | | 1,345,002 | | | | 23,002 | | | | — | |
Expiring 12/18/19 | | HSBC Bank USA, N.A. | | KRW | 2,679,955 | | | | 2,255,000 | | | | 2,292,211 | | | | 37,211 | | | | — | |
Expiring 12/18/19 | | HSBC Bank USA, N.A. | | KRW | 1,908,249 | | | | 1,606,000 | | | | 1,632,158 | | | | 26,158 | | | | — | |
Expiring 12/18/19 | | HSBC Bank USA, N.A. | | KRW | 1,866,321 | | | | 1,564,000 | | | | 1,596,296 | | | | 32,296 | | | | — | |
Expiring 12/18/19 | | JPMorgan Chase Bank, N.A. | | KRW | 2,024,274 | | | | 1,734,607 | | | | 1,731,396 | | | | — | | | | (3,211 | ) |
Expiring 12/18/19 | | JPMorgan Chase Bank, N.A. | | KRW | 1,699,841 | | | | 1,430,000 | | | | 1,453,903 | | | | 23,903 | | | | — | |
Expiring 12/18/19 | | JPMorgan Chase Bank, N.A. | | KRW | 1,114,104 | | | | 946,000 | | | | 952,912 | | | | 6,912 | | | | — | |
Expiring 12/18/19 | | JPMorgan Chase Bank, N.A. | | KRW | 1,022,650 | | | | 873,000 | | | | 874,690 | | | | 1,690 | | | | — | |
Expiring 02/28/20 | | Morgan Stanley & Co. International PLC | | KRW | 2,310,660 | | | | 1,980,000 | | | | 1,980,428 | | | | 428 | | | | — | |
Expiring 10/30/20 | | BNP Paribas S.A. | | KRW | 6,645,920 | | | | 5,840,000 | | | | 5,736,255 | | | | — | | | | (103,745 | ) |
Expiring 10/30/20 | | JPMorgan Chase Bank, N.A. | | KRW | 2,035,051 | | | | 1,707,831 | | | | 1,756,502 | | | | 48,671 | | | | — | |
Expiring 07/30/21 | | HSBC Bank USA, N.A. | | KRW | 7,848,810 | | | | 6,660,000 | | | | 6,825,391 | | | | 165,391 | | | | — | |
Swedish Krona, | | | | | | | | | | | | | | | | | | | | | | |
Expiring 01/17/20 | | Barclays Bank PLC | | SEK | 12,143 | | | | 1,258,000 | | | | 1,263,492 | | | | 5,492 | | | | — | |
Expiring 01/17/20 | | Barclays Bank PLC | | SEK | 8,089 | | | | 841,000 | | | | 841,592 | | | | 592 | | | | — | |
Expiring 01/17/20 | | BNP Paribas S.A. | | SEK | 7,261 | | | | 759,000 | | | | 755,463 | | | | — | | | | (3,537 | ) |
See Notes to Financial Statements.
Forward foreign currency exchange contracts outstanding at October 31, 2019 (continued):
| | | | | | | | | | | | | | | | | | | | | | |
Purchase Contracts | | Counterparty | | Notional
Amount
(000) | | | Value at
Settlement
Date | | | Current
Value | | | Unrealized
Appreciation | | | Unrealized
Depreciation | |
OTC Forward Foreign Currency Exchange Contracts (cont’d.): | | | | | | | | | | | | | | | | | |
Swiss Franc, | | | | | | | | | | | | | | | | | | | | | | |
Expiring 01/17/20 | | BNP Paribas S.A. | | CHF | 548 | | | $ | 557,000 | | | $ | 559,527 | | | $ | 2,527 | | | $ | — | |
Expiring 01/17/20 | | BNP Paribas S.A. | | CHF | 546 | | | | 557,000 | | | | 556,580 | | | | — | | | | (420 | ) |
Expiring 01/17/20 | | Morgan Stanley & Co. International PLC | | CHF | 2,099 | | | | 2,131,800 | | | | 2,141,754 | | | | 9,954 | | | | — | |
Expiring 01/17/20 | | Morgan Stanley & Co. International PLC | | CHF | 705 | | | | 712,000 | | | | 719,345 | | | | 7,345 | | | | — | |
Expiring 10/30/20 | | Goldman Sachs International | | CHF | 8,063 | | | | 8,721,000 | | | | 8,385,538 | | | | — | | | | (335,462 | ) |
Expiring 10/30/20 | | UBS AG | | CHF | 3,112 | | | | 3,204,064 | | | | 3,236,757 | | | | 32,693 | | | | — | |
Thai Baht, | | | | | | | | | | | | | | | | | | | | | | |
Expiring 12/18/19 | | Barclays Bank PLC | | THB | 34,227 | | | | 1,110,000 | | | | 1,134,125 | | | | 24,125 | | | | — | |
Expiring 12/18/19 | | BNP Paribas S.A. | | THB | 33,357 | | | | 1,097,000 | | | | 1,105,303 | | | | 8,303 | | | | — | |
Expiring 12/18/19 | | Citibank, N.A. | | THB | 36,776 | | | | 1,203,000 | | | | 1,218,583 | | | | 15,583 | | | | — | |
Expiring 12/18/19 | | Citibank, N.A. | | THB | 29,028 | | | | 948,000 | | | | 961,850 | | | | 13,850 | | | | — | |
Expiring 12/18/19 | | Citibank, N.A. | | THB | 27,908 | | | | 911,000 | | | | 924,763 | | | | 13,763 | | | | — | |
Expiring 12/18/19 | | Credit Suisse International | | THB | 90,572 | | | | 2,944,000 | | | | 3,001,147 | | | | 57,147 | | | | — | |
Expiring 12/18/19 | | Goldman Sachs International | | THB | 53,103 | | | | 1,740,000 | | | | 1,759,581 | | | | 19,581 | | | | — | |
Expiring 12/18/19 | | HSBC Bank USA, N.A. | | THB | 65,020 | | | | 2,129,000 | | | | 2,154,461 | | | | 25,461 | | | | — | |
Expiring 12/18/19 | | HSBC Bank USA, N.A. | | THB | 25,012 | | | | 819,000 | | | | 828,795 | | | | 9,795 | | | | — | |
Expiring 12/18/19 | | JPMorgan Chase Bank, N.A. | | THB | 37,155 | | | | 1,215,000 | | | | 1,231,141 | | | | 16,141 | | | | — | |
Expiring 12/18/19 | | JPMorgan Chase Bank, N.A. | | THB | 36,091 | | | | 1,188,000 | | | | 1,195,909 | | | | 7,909 | | | | — | |
Expiring 12/18/19 | | JPMorgan Chase Bank, N.A. | | THB | 26,900 | | | | 879,000 | | | | 891,347 | | | | 12,347 | | | | — | |
Expiring 12/18/19 | | JPMorgan Chase Bank, N.A. | | THB | 22,403 | | | | 730,063 | | | | 742,350 | | | | 12,287 | | | | — | |
Expiring 12/18/19 | | Morgan Stanley & Co. International PLC | | THB | 39,279 | | | | 1,283,000 | | | | 1,301,532 | | | | 18,532 | | | | — | |
See Notes to Financial Statements.
| | | | |
| PGIM Absolute Return Bond Fund | | | 81 | |
Schedule of Investments(continued)
as of October 31, 2019
Forward foreign currency exchange contracts outstanding at October 31, 2019 (continued):
| | | | | | | | | | | | | | | | | | | | | | |
Purchase Contracts | | Counterparty | | Notional
Amount
(000) | | | Value at
Settlement
Date | | | Current
Value | | | Unrealized
Appreciation | | | Unrealized
Depreciation | |
OTC Forward Foreign Currency Exchange Contracts (cont’d.): | | | | | | | | | | | | | | | | | |
Thai Baht (cont’d.), | | | | | | | | | | | | | | | | | | | | |
Expiring 12/18/19 | | UBS AG | | THB | 27,092 | | | $ | 890,000 | | | $ | 897,695 | | | $ | 7,695 | | | $ | — | |
Turkish Lira, | | | | | | | | | | | | | | | | | | | | | | |
Expiring 11/27/19 | | HSBC Bank USA, N.A. | | TRY | 4,876 | | | | 811,000 | | | | 846,662 | | | | 35,662 | | | | — | |
Expiring 11/27/19 | | HSBC Bank USA, N.A. | | TRY | 4,381 | | | | 754,000 | | | | 760,619 | | | | 6,619 | | | | — | |
Expiring 12/18/19 | | Barclays Bank PLC | | TRY | 8,636 | | | | 1,474,650 | | | | 1,491,237 | | | | 16,587 | | | | — | |
Expiring 12/18/19 | | Barclays Bank PLC | | TRY | 8,442 | | | | 1,443,131 | | | | 1,457,714 | | | | 14,583 | | | | — | |
Expiring 12/18/19 | | Barclays Bank PLC | | TRY | 6,198 | | | | 1,067,950 | | | | 1,070,244 | | | | 2,294 | | | | — | |
Expiring 12/18/19 | | Barclays Bank PLC | | TRY | 5,946 | | | | 1,016,697 | | | | 1,026,781 | | | | 10,084 | | | | — | |
Expiring 12/18/19 | | Barclays Bank PLC | | TRY | 2,168 | | | | 368,000 | | | | 374,351 | | | | 6,351 | | | | — | |
Expiring 12/18/19 | | Barclays Bank PLC | | TRY | 1,905 | | | | 330,000 | | | | 329,028 | | | | — | | | | (972 | ) |
Expiring 12/18/19 | | Citibank, N.A. | | TRY | 2,526 | | | | 434,000 | | | | 436,177 | | | | 2,177 | | | | — | |
Expiring 12/18/19 | | Goldman Sachs International | | TRY | 8,429 | | | | 1,436,689 | | | | 1,455,454 | | | | 18,765 | | | | — | |
Expiring 12/18/19 | | Goldman Sachs International | | TRY | 5,529 | | | | 949,300 | | | | 954,798 | | | | 5,498 | | | | — | |
Expiring 12/18/19 | | UBS AG | | TRY | 2,402 | | | | 410,000 | | | | 414,697 | | | | 4,697 | | | | — | |
Expiring 12/24/19 | | Goldman Sachs International | | TRY | 55,080 | | | | 9,962,000 | | | | 9,496,431 | | | | — | | | | (465,569 | ) |
Expiring 01/31/20 | | Barclays Bank PLC | | TRY | 5,956 | | | | 907,238 | | | | 1,017,027 | | | | 109,789 | | | | — | |
Expiring 04/30/20 | | Barclays Bank PLC | | TRY | 10,830 | | | | 1,577,221 | | | | 1,807,951 | | | | 230,730 | | | | — | |
Expiring 04/30/20 | | Citibank, N.A. | | TRY | 4,397 | | | | 748,000 | | | | 733,955 | | | | — | | | | (14,045 | ) |
Expiring 04/30/20 | | Deutsche Bank AG | | TRY | 3,185 | | | | 318,000 | | | | 531,663 | | | | 213,663 | | | | — | |
Expiring 04/30/20 | | Morgan Stanley & Co. International PLC | | TRY | 77,540 | | | | 12,091,000 | | | | 12,944,406 | | | | 853,406 | | | | — | |
Expiring 06/30/20 | | Bank of America, N.A. | | TRY | 6,776 | | | | 1,017,000 | | | | 1,113,861 | | | | 96,861 | | | | — | |
See Notes to Financial Statements.
Forward foreign currency exchange contracts outstanding at October 31, 2019 (continued):
| | | | | | | | | | | | | | | | | | | | | | |
Purchase Contracts | | Counterparty | | Notional
Amount
(000) | | | Value at
Settlement
Date | | | Current
Value | | | Unrealized
Appreciation | | | Unrealized
Depreciation | |
OTC Forward Foreign Currency Exchange Contracts (cont’d.): | | | | | | | | | | | | | | | | | |
Turkish Lira (cont’d.), | | | | | | | | | | | | | | | | | | | | |
Expiring 06/30/20 | | Deutsche Bank AG | | TRY | 157,506 | | | $ | 15,218,000 | | | $ | 25,892,670 | | | $ | 10,674,670 | | | $ | — | |
Expiring 07/29/20 | | Barclays Bank PLC | | TRY | 31,312 | | | | 4,361,582 | | | | 5,110,305 | | | | 748,723 | | | | — | |
Expiring 10/30/20 | | Barclays Bank PLC | | TRY | 10,491 | | | | 1,507,883 | | | | 1,673,626 | | | | 165,743 | | | | — | |
Expiring 02/26/21 | | Barclays Bank PLC | | TRY | 24,379 | | | | 3,089,444 | | | | 3,767,156 | | | | 677,712 | | | | — | |
Expiring 02/26/21 | | Barclays Bank PLC | | TRY | 7,006 | | | | 969,000 | | | | 1,082,588 | | | | 113,588 | | | | — | |
Expiring 02/26/21 | | Barclays Bank PLC | | TRY | 3,946 | | | | 541,409 | | | | 609,743 | | | | 68,334 | | | | — | |
Expiring 02/26/21 | | Morgan Stanley & Co. International PLC | | TRY | 107,674 | | | | 12,965,000 | | | | 16,638,471 | | | | 3,673,471 | | | | — | |
Expiring 05/28/21 | | BNP Paribas S.A. | | TRY | 6,981 | | | | 897,000 | | | | 1,053,469 | | | | 156,469 | | | | — | |
Expiring 05/28/21 | | Goldman Sachs International | | TRY | 2,447 | | | | 353,510 | | | | 369,216 | | | | 15,706 | | | | — | |
| | | | | | | | | | | | | | | | | | | | | | |
| | | | | | | | $ | 911,694,207 | | | $ | 932,455,142 | | | | 31,086,908 | | | | (10,325,973 | ) |
| | | | | | | | | | | | | | | | | | | | | | |
| | | | | | |
Sale Contracts | | Counterparty | | Notional
Amount
(000) | | | Value at
Settlement
Date | | | Current
Value | | | Unrealized
Appreciation | | | Unrealized
Depreciation | |
OTC Forward Foreign Currency Exchange Contracts: | | | | | | | | | | | | | |
Australian Dollar, | | | | | | | | | | | | | | | | | | | | |
Expiring 11/27/19 | | Bank of America, N.A. | | AUD | 2,327 | | | $ | 1,581,000 | | | $ | 1,605,545 | | | $ | — | | | $ | (24,545 | ) |
Expiring 11/27/19 | | Barclays Bank PLC | | AUD | 1,032 | | | | 709,000 | | | | 712,069 | | | | — | | | | (3,069 | ) |
Expiring 11/27/19 | | HSBC Bank USA, N.A. | | AUD | 1,157 | | | | 786,000 | | | | 798,344 | | | | — | | | | (12,344 | ) |
Expiring 11/27/19 | | JPMorgan Chase Bank, N.A. | | AUD | 1,647 | | | | 1,116,000 | | | | 1,136,195 | | | | — | | | | (20,195 | ) |
Expiring 01/22/20 | | Barclays Bank PLC | | AUD | 1,389 | | | | 950,000 | | | | 959,269 | | | | — | | | | (9,269 | ) |
Expiring 01/22/20 | | BNP Paribas S.A. | | AUD | 898 | | | | 620,000 | | | | 620,445 | | | | — | | | | (445 | ) |
Expiring 01/22/20 | | HSBC Bank USA, N.A. | | AUD | 14,018 | | | | 9,597,745 | | | | 9,683,777 | | | | — | | | | (86,032 | ) |
See Notes to Financial Statements.
| | | | |
| PGIM Absolute Return Bond Fund | | | 83 | |
Schedule of Investments(continued)
as of October 31, 2019
Forward foreign currency exchange contracts outstanding at October 31, 2019 (continued):
| | | | | | | | | | | | | | | | | | | | | | |
Sale Contracts | | Counterparty | | Notional
Amount
(000) | | | Value at
Settlement
Date | | | Current
Value | | | Unrealized
Appreciation | | | Unrealized
Depreciation | |
OTC Forward Foreign Currency Exchange Contracts (cont’d.): | | | | | | | | | | | | | |
Australian Dollar (cont’d.), | | | | | | | | | | | | | | | | | | | | |
Expiring 01/31/20 | | JPMorgan Chase Bank, N.A. | | AUD | 6,128 | | | $ | 4,181,039 | | | $ | 4,233,830 | | | $ | — | | | $ | (52,791 | ) |
Expiring 01/31/20 | | Morgan Stanley & Co. International PLC | | AUD | 13,184 | | | | 9,526,099 | | | | 9,109,089 | | | | 417,010 | | | | — | |
Expiring 11/27/20 | | JPMorgan Chase Bank, N.A. | | AUD | 5,929 | | | | 4,067,946 | | | | 4,115,186 | | | | — | | | | (47,240 | ) |
Brazilian Real, | | | | | | | | | | | | | | | | | | | | | | |
Expiring 11/04/19 | | Barclays Bank PLC | | BRL | 3,801 | | | | 906,000 | | | | 947,520 | | | | — | | | | (41,520 | ) |
Expiring 11/04/19 | | JPMorgan Chase Bank, N.A. | | BRL | 1,285 | | | | 309,000 | | | | 320,411 | | | | — | | | | (11,411 | ) |
Expiring 11/04/19 | | Morgan Stanley & Co. International PLC | | BRL | 1,996 | | | | 482,000 | | | | 497,463 | | | | — | | | | (15,463 | ) |
Expiring 11/04/19 | | The Toronto-Dominion Bank | | BRL | 51,476 | | | | 12,350,534 | | | | 12,832,027 | | | | — | | | | (481,493 | ) |
Expiring 12/03/19 | | BNP Paribas S.A. | | BRL | 8,597 | | | | 2,152,165 | | | | 2,139,278 | | | | 12,887 | | | | — | |
Expiring 12/24/19 | | Bank of America, N.A. | | BRL | 7,492 | | | | 1,834,000 | | | | 1,862,234 | | | | — | | | | (28,234 | ) |
Expiring 12/24/19 | | Bank of America, N.A. | | BRL | 3,390 | | | | 812,000 | | | | 842,666 | | | | — | | | | (30,666 | ) |
Expiring 12/24/19 | | Bank of America, N.A. | | BRL | 2,733 | | | | 677,000 | | | | 679,261 | | | | — | | | | (2,261 | ) |
Expiring 12/24/19 | | Barclays Bank PLC | | BRL | 5,345 | | | | 1,310,000 | | | | 1,328,474 | | | | — | | | | (18,474 | ) |
Expiring 12/24/19 | | Barclays Bank PLC | | BRL | 3,942 | | | | 950,000 | | | | 979,761 | | | | — | | | | (29,761 | ) |
Expiring 12/24/19 | | Barclays Bank PLC | | BRL | 3,094 | | | | 751,000 | | | | 769,002 | | | | — | | | | (18,002 | ) |
Expiring 12/24/19 | | BNP Paribas S.A. | | BRL | 3,641 | | | | 900,000 | | | | 905,063 | | | | — | | | | (5,063 | ) |
Expiring 12/24/19 | | BNP Paribas S.A. | | BRL | 3,375 | | | | 838,000 | | | | 838,955 | | | | — | | | | (955 | ) |
Expiring 12/24/19 | | BNP Paribas S.A. | | BRL | 3,094 | | | | 745,000 | | | | 769,006 | | | | — | | | | (24,006 | ) |
Expiring 12/24/19 | | Citibank, N.A. | | BRL | 9,770 | | | | 2,427,000 | | | | 2,428,468 | | | | — | | | | (1,468 | ) |
Expiring 12/24/19 | | Citibank, N.A. | | BRL | 6,946 | | | | 1,675,000 | | | | 1,726,600 | | | | — | | | | (51,600 | ) |
Expiring 12/24/19 | | Citibank, N.A. | | BRL | 5,436 | | | | 1,359,000 | | | | 1,351,208 | | | | 7,792 | | | | — | |
See Notes to Financial Statements.
Forward foreign currency exchange contracts outstanding at October 31, 2019 (continued):
| | | | | | | | | | | | | | | | | | | | | | |
Sale Contracts | | Counterparty | | Notional
Amount
(000) | | | Value at
Settlement
Date | | | Current
Value | | | Unrealized
Appreciation | | | Unrealized
Depreciation | |
OTC Forward Foreign Currency Exchange Contracts (cont’d.): | | | | | | | | | | | | | |
Brazilian Real (cont’d.), | | | | | | | | | | | | | | | | | | | | |
Expiring 12/24/19 | | Citibank, N.A. | | BRL | 3,848 | | | $ | 936,000 | | | $ | 956,552 | | | $ | — | | | $ | (20,552 | ) |
Expiring 12/24/19 | | Citibank, N.A. | | BRL | 3,144 | | | | 767,000 | | | | 781,420 | | | | — | | | | (14,420 | ) |
Expiring 12/24/19 | | JPMorgan Chase Bank, N.A. | | BRL | 11,825 | | | | 3,331,000 | | | | 2,939,313 | | | | 391,687 | | | | — | |
Expiring 12/24/19 | | Morgan Stanley & Co. International PLC | | BRL | 3,983 | | | | 998,000 | | | | 989,946 | | | | 8,054 | | | | — | |
Expiring 12/24/19 | | UBS AG | | BRL | 2,906 | | | | 725,000 | | | | 722,285 | | | | 2,715 | | | | — | |
Expiring 03/31/20 | | Bank of America, N.A. | | BRL | 37,683 | | | | 8,961,000 | | | | 9,322,118 | | | | — | | | | (361,118 | ) |
Expiring 03/31/20 | | JPMorgan Chase Bank, N.A. | | BRL | 38,335 | | | | 10,714,000 | | | | 9,483,386 | | | | 1,230,614 | | | | — | |
Expiring 03/31/20 | | JPMorgan Chase Bank, N.A. | | BRL | 13,430 | | | | 3,231,951 | | | | 3,322,458 | | | | — | | | | (90,507 | ) |
Expiring 06/30/20 | | Deutsche Bank AG | | BRL | 80,093 | | | | 19,440,000 | | | | 19,714,006 | | | | — | | | | (274,006 | ) |
Expiring 07/29/20 | | Deutsche Bank AG | | BRL | 27,045 | | | | 6,116,000 | | | | 6,645,358 | | | | — | | | | (529,358 | ) |
Expiring 08/31/20 | | Citibank, N.A. | | BRL | 2,478 | | | | 612,397 | | | | 607,579 | | | | 4,818 | | | | — | |
Expiring 08/31/20 | | Deutsche Bank AG | | BRL | 26,630 | | | | 5,810,000 | | | | 6,530,222 | | | | — | | | | (720,222 | ) |
Expiring 12/23/20 | | Citibank, N.A. | | BRL | 3,696 | | | | 903,638 | | | | 899,217 | | | | 4,421 | | | | — | |
Expiring 12/23/20 | | Morgan Stanley & Co. International PLC | | BRL | 42,608 | | | | 10,702,000 | | | | 10,365,084 | | | | 336,916 | | | | — | |
Expiring 01/29/21 | | Citibank, N.A. | | BRL | 33,812 | | | | 8,259,000 | | | | 8,200,834 | | | | 58,166 | | | | — | |
Expiring 03/31/21 | | Citibank, N.A. | | BRL | 80,490 | | | | 18,979,000 | | | | 19,427,504 | | | | — | | | | (448,504 | ) |
Expiring 03/31/21 | | Morgan Stanley & Co. International PLC | | BRL | 15,067 | | | | 3,716,625 | | | | 3,636,704 | | | | 79,921 | | | | — | |
British Pound, | | | | | | | | | | | | | | | | | | | | | | |
Expiring 11/27/19 | | HSBC Bank USA, N.A. | | GBP | 564 | | | | 725,000 | | | | 730,848 | | | | — | | | | (5,848 | ) |
Expiring 01/17/20 | | Barclays Bank PLC | | GBP | 1,589 | | | | 2,048,000 | | | | 2,063,597 | | | | — | | | | (15,597 | ) |
Expiring 01/17/20 | | Barclays Bank PLC | | GBP | 1,069 | | | | 1,375,000 | | | | 1,387,799 | | | | — | | | | (12,799 | ) |
See Notes to Financial Statements.
| | | | |
| PGIM Absolute Return Bond Fund | | | 85 | |
Schedule of Investments(continued)
as of October 31, 2019
Forward foreign currency exchange contracts outstanding at October 31, 2019 (continued):
| | | | | | | | | | | | | | | | | | | | | | |
Sale Contracts | | Counterparty | | Notional
Amount
(000) | | | Value at
Settlement
Date | | | Current
Value | | | Unrealized
Appreciation | | | Unrealized
Depreciation | |
OTC Forward Foreign Currency Exchange Contracts (cont’d.): | | | | | | | | | | | | | |
British Pound (cont’d.), | | | | | | | | | | | | | | | | | | | | |
Expiring 01/17/20 | | Barclays Bank PLC | | GBP | 986 | | | $ | 1,276,000 | | | $ | 1,280,779 | | | $ | — | | | $ | (4,779 | ) |
Expiring 01/17/20 | | Barclays Bank PLC | | GBP | 805 | | | | 1,050,000 | | | | 1,045,962 | | | | 4,038 | | | | — | |
Expiring 01/17/20 | | Barclays Bank PLC | | GBP | 319 | | | | 409,000 | | | | 414,452 | | | | — | | | | (5,452 | ) |
Expiring 01/17/20 | | Citibank, N.A. | | GBP | 16,355 | | | | 20,604,781 | | | | 21,242,093 | | | | — | | | | (637,312 | ) |
Expiring 01/17/20 | | Deutsche Bank AG | | GBP | 16,355 | | | | 20,734,317 | | | | 21,242,093 | | | | — | | | | (507,776 | ) |
Expiring 01/17/20 | | Morgan Stanley & Co. International PLC | | GBP | 1,891 | | | | 2,445,000 | | | | 2,455,568 | | | | — | | | | (10,568 | ) |
Expiring 07/29/20 | | Bank of America, N.A. | | GBP | 13,750 | | | | 17,149,962 | | | | 17,935,304 | | | | — | | | | (785,342 | ) |
Chilean Peso, | | | | | | | | | | | | | | | | | | | | | | |
Expiring 12/18/19 | | Barclays Bank PLC | | CLP | 5,270,051 | | | | 7,414,775 | | | | 7,114,906 | | | | 299,869 | | | | — | |
Expiring 12/18/19 | | JPMorgan Chase Bank, N.A. | | CLP | 10,540,102 | | | | 14,618,727 | | | | 14,229,812 | | | | 388,915 | | | | — | |
Expiring 12/18/19 | | Morgan Stanley & Co. International PLC | | CLP | 5,270,051 | | | | 7,309,363 | | | | 7,114,906 | | | | 194,457 | | | | — | |
Expiring 12/18/19 | | Morgan Stanley & Co. International PLC | | CLP | 329,369 | | | | 456,000 | | | | 444,669 | | | | 11,331 | | | | — | |
Chinese Renminbi, | | | | | | | | | | | | | | | | | | | | | | |
Expiring 02/28/20 | | Morgan Stanley & Co. International PLC | | CNH | 71,811 | | | | 10,656,000 | | | | 10,155,524 | | | | 500,476 | | | | — | |
Expiring 05/14/21 | | JPMorgan Chase Bank, N.A. | | CNH | 43,724 | | | | 6,276,146 | | | | 6,106,744 | | | | 169,402 | | | | — | |
Colombian Peso, | | | | | | | | | | | | | | | | | | | | | | |
Expiring 12/18/19 | | Barclays Bank PLC | | COP | 2,698,070 | | | | 798,000 | | | | 796,804 | | | | 1,196 | | | | — | |
Expiring 12/18/19 | | Barclays Bank PLC | | COP | 2,432,239 | | | | 718,000 | | | | 718,298 | | | | — | | | | (298 | ) |
Expiring 12/18/19 | | Barclays Bank PLC | | COP | 1,660,218 | | | | 491,000 | | | | 490,302 | | | | 698 | | | | — | |
Expiring 12/18/19 | | BNP Paribas S.A. | | COP | 1,838,275 | | | | 529,000 | | | | 542,886 | | | | — | | | | (13,886 | ) |
Expiring 12/18/19 | | BNP Paribas S.A. | | COP | 1,629,816 | | | | 472,000 | | �� | | 481,324 | | | | — | | | | (9,324 | ) |
Expiring 12/18/19 | | Goldman Sachs International | | COP | 5,881,131 | | | | 1,731,272 | | | | 1,736,838 | | | | — | | | | (5,566 | ) |
See Notes to Financial Statements.
Forward foreign currency exchange contracts outstanding at October 31, 2019 (continued):
| | | | | | | | | | | | | | | | | | | | | | |
Sale Contracts | | Counterparty | | Notional
Amount
(000) | | | Value at
Settlement
Date | | | Current
Value | | | Unrealized
Appreciation | | | Unrealized
Depreciation | |
OTC Forward Foreign Currency Exchange Contracts (cont’d.): | | | | | | | | | | | | | |
Colombian Peso (cont’d.), | | | | | | | | | | | | | | | | | | | | | | |
Expiring 12/18/19 | | Goldman Sachs International | | COP | 2,393,475 | | | $ | 705,000 | | | $ | 706,850 | | | $ | — | | | $ | (1,850 | ) |
Expiring 12/18/19 | | Goldman Sachs International | | COP | 1,155,447 | | | | 342,000 | | | | 341,231 | | | | 769 | | | | — | |
Expiring 12/18/19 | | JPMorgan Chase Bank, N.A. | | COP | 10,391,029 | | | | 3,030,780 | | | | 3,068,719 | | | | — | | | | (37,939 | ) |
Expiring 12/18/19 | | JPMorgan Chase Bank, N.A. | | COP | 4,893,591 | | | | 1,440,304 | | | | 1,445,194 | | | | — | | | | (4,890 | ) |
Expiring 12/18/19 | | JPMorgan Chase Bank, N.A. | | COP | 2,395,471 | | | | 708,300 | | | | 707,440 | | | | 860 | | | | — | |
Expiring 12/18/19 | | UBS AG | | COP | 2,564,356 | | | | 740,000 | | | | 757,316 | | | | — | | | | (17,316 | ) |
Expiring 12/18/19 | | UBS AG | | COP | 1,315,320 | | | | 388,000 | | | | 388,445 | | | | — | | | | (445 | ) |
Czech Koruna, | | | | | | | | | | | | | | | | | | | | | | |
Expiring 01/17/20 | | Barclays Bank PLC | | CZK | 34,431 | | | | 1,473,690 | | | | 1,506,880 | | | | — | | | | (33,190 | ) |
Euro, | | | | | | | | | | | | | | | | | | | | | | |
Expiring 11/27/19 | | Deutsche Bank AG | | EUR | 2,443 | | | | 2,727,432 | | | | 2,728,931 | | | | — | | | | (1,499 | ) |
Expiring 11/27/19 | | Deutsche Bank AG | | EUR | 775 | | | | 866,000 | | | | 865,996 | | | | 4 | | | | — | |
Expiring 12/30/19 | | Deutsche Bank AG | | EUR | 1,231 | | | | 1,587,473 | | | | 1,379,212 | | | | 208,261 | | | | — | |
Expiring 01/17/20 | | Barclays Bank PLC | | EUR | 545 | | | | 608,000 | | | | 611,215 | | | | — | | | | (3,215 | ) |
Expiring 01/17/20 | | BNP Paribas S.A. | | EUR | 1,192 | | | | 1,331,000 | | | | 1,336,558 | | | | — | | | | (5,558 | ) |
Expiring 01/17/20 | | BNP Paribas S.A. | | EUR | 1,080 | | | | 1,207,000 | | | | 1,211,080 | | | | — | | | | (4,080 | ) |
Expiring 01/17/20 | | BNP Paribas S.A. | | EUR | 872 | | | | 978,000 | | | | 978,033 | | | | — | | | | (33 | ) |
Expiring 01/17/20 | | HSBC Bank USA, N.A. | | EUR | 81,674 | | | | 90,666,780 | | | | 91,597,155 | | | | — | | | | (930,375 | ) |
Expiring 01/17/20 | | JPMorgan Chase Bank, N.A. | | EUR | 87,607 | | | | 97,317,259 | | | | 98,251,711 | | | | — | | | | (934,452 | ) |
Expiring 01/17/20 | | UBS AG | | EUR | 95,154 | | | | 105,419,180 | | | | 106,715,307 | | | | — | | | | (1,296,127 | ) |
Expiring 02/28/20 | | Bank of America, N.A. | | EUR | 11,032 | | | | 13,441,389 | | | | 12,403,149 | | | | 1,038,240 | | | | — | |
Expiring 07/29/20 | | The Toronto-Dominion Bank | | EUR | 2,476 | | | | 2,949,147 | | | | 2,809,224 | | | | 139,923 | | | | — | |
See Notes to Financial Statements.
| | | | |
| PGIM Absolute Return Bond Fund | | | 87 | |
Schedule of Investments(continued)
as of October 31, 2019
Forward foreign currency exchange contracts outstanding at October 31, 2019 (continued):
| | | | | | | | | | | | | | | | | | | | | | |
Sale Contracts | | Counterparty | | Notional
Amount
(000) | | | Value at
Settlement
Date | | | Current
Value | | | Unrealized
Appreciation | | | Unrealized
Depreciation | |
OTC Forward Foreign Currency Exchange Contracts (cont’d.): | | | | | | | | | | | | | |
Euro (cont’d.), | | | | | | | | | | | | | | | | | | | | | | |
Expiring 07/29/20 | | UBS AG | | EUR | 1,857 | | | $ | 2,262,267 | | | $ | 2,106,133 | | | $ | 156,134 | | | $ | — | |
Hungarian Forint, | | | | | | | | | | | | | | | | | | | | | | |
Expiring 01/17/20 | | Barclays Bank PLC | | HUF | 206,105 | | | | 700,000 | | | | 702,699 | | | | — | | | | (2,699 | ) |
Expiring 01/17/20 | | Barclays Bank PLC | | HUF | 145,525 | | | | 493,000 | | | | 496,157 | | | | — | | | | (3,157 | ) |
Expiring 01/17/20 | | Barclays Bank PLC | | HUF | 132,030 | | | | 447,000 | | | | 450,149 | | | | — | | | | (3,149 | ) |
Expiring 01/17/20 | | The Toronto-Dominion Bank | | HUF | 2,782,566 | | | | 9,322,609 | | | | 9,486,967 | | | | — | | | | (164,358 | ) |
Indian Rupee, | | | | | | | | | | | | | | | | | | | | | | |
Expiring 12/18/19 | | Bank of America, N.A. | | INR | 73,970 | | | | 1,029,000 | | | | 1,034,847 | | | | — | | | | (5,847 | ) |
Expiring 12/18/19 | | Barclays Bank PLC | | INR | 52,255 | | | | 729,000 | | | | 731,051 | | | | — | | | | (2,051 | ) |
Expiring 12/18/19 | | BNP Paribas S.A. | | INR | 41,995 | | | | 584,000 | | | | 587,523 | | | | — | | | | (3,523 | ) |
Expiring 12/18/19 | | Citibank, N.A. | | INR | 56,030 | | | | 782,000 | | | | 783,871 | | | | — | | | | (1,871 | ) |
Expiring 12/18/19 | | HSBC Bank USA, N.A. | | INR | 205,448 | | | | 2,855,634 | | | | 2,874,253 | | | | — | | | | (18,619 | ) |
Expiring 12/18/19 | | HSBC Bank USA, N.A. | | INR | 103,164 | | | | 1,436,689 | | | | 1,443,279 | | | | — | | | | (6,590 | ) |
Expiring 12/18/19 | | HSBC Bank USA, N.A. | | INR | 75,836 | | | | 1,059,000 | | | | 1,060,953 | | | | — | | | | (1,953 | ) |
Expiring 12/18/19 | | Morgan Stanley & Co. International PLC | | INR | 55,718 | | | | 779,000 | | | | 779,503 | | | | — | | | | (503 | ) |
Expiring 10/30/20 | | HSBC Bank USA, N.A. | | INR | 439,464 | | | | 5,742,000 | | | | 5,927,317 | | | | — | | | | (185,317 | ) |
Expiring 12/23/20 | | BNP Paribas S.A. | | INR | 250,803 | | | | 3,250,000 | | | | 3,361,036 | | | | — | | | | (111,036 | ) |
Expiring 02/26/21 | | Bank of America, N.A. | | INR | 179,591 | | | | 2,385,000 | | | | 2,388,282 | | | | — | | | �� | (3,282 | ) |
Expiring 02/26/21 | | Goldman Sachs International | | INR | 66,877 | | | | 870,000 | | | | 889,362 | | | | — | | | | (19,362 | ) |
Expiring 09/30/21 | | Bank of America, N.A. | | INR | 424,262 | | | | 5,480,000 | | | | 5,502,007 | | | | — | | | | (22,007 | ) |
Indonesian Rupiah, | | | | | | | | | | | | | | | | | | | | | | |
Expiring 12/18/19 | | Barclays Bank PLC | | IDR | 9,159,890 | | | | 641,000 | | | | 647,013 | | | | — | | | | (6,013 | ) |
See Notes to Financial Statements.
Forward foreign currency exchange contracts outstanding at October 31, 2019 (continued):
| | | | | | | | | | | | | | | | | | | | | | |
Sale Contracts | | Counterparty | | Notional
Amount
(000) | | | Value at
Settlement
Date | | | Current
Value | | | Unrealized
Appreciation | | | Unrealized
Depreciation | |
OTC Forward Foreign Currency Exchange Contracts (cont’d.): | | | | | | | | | | | | | |
Indonesian Rupiah (cont’d.), | | | | | | | | | | | | | | | | | | | | |
Expiring 12/18/19 | | Barclays Bank PLC | | IDR | 7,888,545 | | | $ | 553,000 | | | $ | 557,211 | | | $ | — | | | $ | (4,211 | ) |
Expiring 12/18/19 | | BNP Paribas S.A. | | IDR | 7,895,608 | | | | 554,000 | | | | 557,710 | | | | — | | | | (3,710 | ) |
Expiring 12/18/19 | | BNP Paribas S.A. | | IDR | 7,776,303 | | | | 543,000 | | | | 549,283 | | | | — | | | | (6,283 | ) |
Expiring 12/18/19 | | Citibank, N.A. | | IDR | 13,822,596 | | | | 977,000 | | | | 976,366 | | | | 634 | | | | — | |
Expiring 12/18/19 | | Citibank, N.A. | | IDR | 11,567,752 | | | | 812,000 | | | | 817,094 | | | | — | | | | (5,094 | ) |
Expiring 12/18/19 | | HSBC Bank USA, N.A. | | IDR | 164,245,000 | | | | 11,418,590 | | | | 11,601,524 | | | | — | | | | (182,934 | ) |
Expiring 12/18/19 | | HSBC Bank USA, N.A. | | IDR | 22,430,920 | | | | 1,585,000 | | | | 1,584,419 | | | | 581 | | | | — | |
Expiring 12/18/19 | | HSBC Bank USA, N.A. | | IDR | 16,004,128 | | | | 1,119,000 | | | | 1,130,459 | | | | — | | | | (11,459 | ) |
Expiring 12/18/19 | | JPMorgan Chase Bank, N.A. | | IDR | 18,274,910 | | | | 1,282,000 | | | | 1,290,857 | | | | — | | | | (8,857 | ) |
Expiring 12/18/19 | | JPMorgan Chase Bank, N.A. | | IDR | 8,857,280 | | | | 622,000 | | | | 625,638 | | | | — | | | | (3,638 | ) |
Israeli Shekel, | | | | | | | | | | | | | | | | | | | | | | |
Expiring 11/27/19 | | Bank of America, N.A. | | ILS | 4,333 | | | | 1,237,782 | | | | 1,231,117 | | | | 6,665 | | | | — | |
Expiring 12/18/19 | | Barclays Bank PLC | | ILS | 24,317 | | | | 6,935,156 | | | | 6,916,582 | | | | 18,574 | | | | — | |
Expiring 12/18/19 | | Citibank, N.A. | | ILS | 2,954 | | | | 837,000 | | | | 840,341 | | | | — | | | | (3,341 | ) |
Expiring 12/18/19 | | Citibank, N.A. | | ILS | 2,739 | | | | 775,000 | | | | 778,953 | | | | — | | | | (3,953 | ) |
Expiring 12/18/19 | | Citibank, N.A. | | ILS | 2,429 | | | | 689,000 | | | | 690,782 | | | | — | | | | (1,782 | ) |
Expiring 12/18/19 | | HSBC Bank USA, N.A. | | ILS | 2,686 | | | | 762,000 | | | | 763,854 | | | | — | | | | (1,854 | ) |
Expiring 02/28/20 | | Citibank, N.A. | | ILS | 14,712 | | | | 4,215,000 | | | | 4,201,197 | | | | 13,803 | | | | — | |
Japanese Yen, | | | | | | | | | | | | | | | | | | | | | | |
Expiring 11/27/19 | | Bank of America, N.A. | | JPY | 128,321 | | | | 1,182,000 | | | | 1,190,102 | | | | — | | | | (8,102 | ) |
Expiring 11/27/19 | | Bank of America, N.A. | | JPY | 127,526 | | | | 1,195,000 | | | | 1,182,729 | | | | 12,271 | | | | — | |
Expiring 11/27/19 | | Bank of America, N.A. | | JPY | 83,790 | | | | 787,000 | | | | 777,104 | | | | 9,896 | | | | — | |
See Notes to Financial Statements.
| | | | |
| PGIM Absolute Return Bond Fund | | | 89 | |
Schedule of Investments(continued)
as of October 31, 2019
Forward foreign currency exchange contracts outstanding at October 31, 2019 (continued):
| | | | | | | | | | | | | | | | | | | | | | |
Sale Contracts | | Counterparty | | Notional
Amount
(000) | | | Value at
Settlement
Date | | | Current
Value | | | Unrealized
Appreciation | | | Unrealized
Depreciation | |
OTC Forward Foreign Currency Exchange Contracts (cont’d.): | | | | | | | | | | | | | |
Japanese Yen (cont’d.), | | | | | | | | | | | | | | | | | | | | |
Expiring 11/27/19 | | Barclays Bank PLC | | JPY | 68,129 | | | $ | 626,000 | | | $ | 631,859 | | | $ | — | | | $ | (5,859 | ) |
Expiring 11/27/19 | | Citibank, N.A. | | JPY | 118,281 | | | | 1,126,000 | | | | 1,096,986 | | | | 29,014 | | | | — | |
Expiring 11/27/19 | | Citibank, N.A. | | JPY | 96,924 | | | | 893,000 | | | | 898,918 | | | | — | | | | (5,918 | ) |
Expiring 11/27/19 | | Citibank, N.A. | | JPY | 91,390 | | | | 844,000 | | | | 847,588 | | | | — | | | | (3,588 | ) |
Expiring 11/27/19 | | Citibank, N.A. | | JPY | 78,828 | | | | 733,000 | | | | 731,082 | | | | 1,918 | | | | — | |
Expiring 11/27/19 | | Deutsche Bank AG | | JPY | 106,620 | | | | 1,000,000 | | | | 988,842 | | | | 11,158 | | | | — | |
Expiring 11/27/19 | | Goldman Sachs International | | JPY | 167,983 | | | | 1,564,000 | | | | 1,557,945 | | | | 6,055 | | | | — | |
Expiring 11/27/19 | | Goldman Sachs International | | JPY | 102,981 | | | | 978,000 | | | | 955,092 | | | | 22,908 | | | | — | |
Expiring 11/27/19 | | HSBC Bank USA, N.A. | | JPY | 142,300 | | | | 1,335,000 | | | | 1,319,753 | | | | 15,247 | | | | — | |
Expiring 11/27/19 | | HSBC Bank USA, N.A. | | JPY | 74,157 | | | | 696,000 | | | | 687,761 | | | | 8,239 | | | | — | |
Expiring 11/27/19 | | Morgan Stanley & Co. International PLC | | JPY | 375,796 | | | | 3,553,000 | | | | 3,485,291 | | | | 67,709 | | | | — | |
Expiring 11/27/19 | | The Toronto-Dominion Bank | | JPY | 92,843 | | | | 882,000 | | | | 861,064 | | | | 20,936 | | | | — | |
Expiring 01/17/20 | | BNP Paribas S.A. | | JPY | 143,399 | | | | 1,324,000 | | | | 1,335,052 | | | | — | | | | (11,052 | ) |
Expiring 02/28/20 | | Citibank, N.A. | | JPY | 880,638 | | | | 8,296,087 | | | | 8,218,627 | | | | 77,460 | | | | — | |
Expiring 03/31/20 | | Citibank, N.A. | | JPY | 40,763 | | | | 382,000 | | | | 381,141 | | | | 859 | | | | — | |
Expiring 07/29/20 | | Deutsche Bank AG | | JPY | 387,166 | | | | 3,719,000 | | | | 3,644,200 | | | | 74,800 | | | | — | |
Expiring 11/30/20 | | JPMorgan Chase Bank, N.A. | | JPY | 819,678 | | | | 7,848,316 | | | | 7,766,341 | | | | 81,975 | | | | — | |
Expiring 12/30/20 | | Bank of America, N.A. | | JPY | 485,216 | | | | 4,679,936 | | | | 4,604,626 | | | | 75,310 | | | | — | |
Expiring 01/29/21 | | Bank of America, N.A. | | JPY | 648,854 | | | | 6,126,000 | | | | 6,167,281 | | | | — | | | | (41,281 | ) |
Expiring 01/29/21 | | Citibank, N.A. | | JPY | 934,242 | | | | 9,144,000 | | | | 8,879,870 | | | | 264,130 | | | | — | |
Expiring 01/29/21 | | Deutsche Bank AG | | JPY | 1,027,823 | | | | 9,781,808 | | | | 9,769,346 | | | | 12,462 | | | | — | |
See Notes to Financial Statements.
Forward foreign currency exchange contracts outstanding at October 31, 2019 (continued):
| | | | | | | | | | | | | | | | | | | | | | |
Sale Contracts | | Counterparty | | Notional
Amount
(000) | | | Value at
Settlement
Date | | | Current
Value | | | Unrealized
Appreciation | | | Unrealized
Depreciation | |
OTC Forward Foreign Currency Exchange Contracts (cont’d.): | | | | | | | | | | | | | |
Japanese Yen (cont’d.), | | | | | | | | | | | | | | | | | | | | |
Expiring 10/31/23 | | Citibank, N.A. | | JPY | 399,802 | | | $ | 4,148,827 | | | $ | 4,021,624 | | | $ | 127,203 | | | $ | — | |
Mexican Peso, | | | | | | | | | | | | | | | | | | | | | | |
Expiring 11/27/19 | | Goldman Sachs International | | MXN | 16,307 | | | | 849,000 | | | | 844,100 | | | | 4,900 | | | | — | |
Expiring 11/27/19 | | HSBC Bank USA, N.A. | | MXN | 22,469 | | | | 1,155,000 | | | | 1,163,054 | | | | — | | | | (8,054 | ) |
Expiring 11/27/19 | | HSBC Bank USA, N.A. | | MXN | 14,445 | | | | 738,000 | | | | 747,727 | | | | — | | | | (9,727 | ) |
Expiring 11/27/19 | | JPMorgan Chase Bank, N.A. | | MXN | 121,207 | | | | 5,960,526 | | | | 6,274,093 | | | | — | | | | (313,567 | ) |
Expiring 11/27/19 | | JPMorgan Chase Bank, N.A. | | MXN | 13,271 | | | | 652,602 | | | | 686,934 | | | | — | | | | (34,332 | ) |
Expiring 11/27/19 | | Morgan Stanley & Co. International PLC | | MXN | 146,073 | | | | 7,445,000 | | | | 7,561,232 | | | | — | | | | (116,232 | ) |
Expiring 12/18/19 | | Barclays Bank PLC | | MXN | 10,151 | | | | 517,000 | | | | 523,776 | | | | — | | | | (6,776 | ) |
Expiring 12/18/19 | | Barclays Bank PLC | | MXN | 9,146 | | | | 464,000 | | | | 471,901 | | | | — | | | | (7,901 | ) |
Expiring 12/18/19 | | Citibank, N.A. | | MXN | 33,940 | | | | 1,762,000 | | | | 1,751,277 | | | | 10,723 | | | | — | |
Expiring 12/18/19 | | JPMorgan Chase Bank, N.A. | | MXN | 30,410 | | | | 1,544,897 | | | | 1,569,127 | | | | — | | | | (24,230 | ) |
Expiring 12/18/19 | | JPMorgan Chase Bank, N.A. | | MXN | 8,083 | | | | 410,000 | | | | 417,059 | | | | — | | | | (7,059 | ) |
Expiring 12/24/19 | | Citibank, N.A. | | MXN | 32,954 | | | | 1,606,000 | | | | 1,698,855 | | | | — | | | | (92,855 | ) |
Expiring 12/24/19 | | Citibank, N.A. | | MXN | 3,596 | | | | 169,000 | | | | 185,397 | | | | — | | | | (16,397 | ) |
Expiring 02/28/20 | | Morgan Stanley & Co. International PLC | | MXN | 71,736 | | | | 3,564,000 | | | | 3,663,254 | | | | — | | | | (99,254 | ) |
Expiring 04/30/20 | | Citibank, N.A. | | MXN | 298,979 | | | | 14,344,000 | | | | 15,131,290 | | | | — | | | | (787,290 | ) |
Expiring 04/30/20 | | UBS AG | | MXN | 27,628 | | | | 1,218,000 | | | | 1,398,253 | | | | — | | | | (180,253 | ) |
Expiring 05/29/20 | | Morgan Stanley & Co. International PLC | | MXN | 120,370 | | | | 6,095,000 | | | | 6,067,330 | | | | 27,670 | | | | — | |
Expiring 10/30/20 | | Deutsche Bank AG | | MXN | 447,899 | | | | 19,592,000 | | | | 22,116,796 | | | | — | | | | (2,524,796 | ) |
Expiring 01/29/21 | | Citibank, N.A. | | MXN | 121,902 | | | | 5,800,000 | | | | 5,952,871 | | | | — | | | | (152,871 | ) |
See Notes to Financial Statements.
| | | | |
| PGIM Absolute Return Bond Fund | | | 91 | |
Schedule of Investments(continued)
as of October 31, 2019
Forward foreign currency exchange contracts outstanding at October 31, 2019 (continued):
| | | | | | | | | | | | | | | | | | | | | | |
Sale Contracts | | Counterparty | | Notional
Amount
(000) | | | Value at
Settlement
Date | | | Current
Value | | | Unrealized
Appreciation | | | Unrealized
Depreciation | |
OTC Forward Foreign Currency Exchange Contracts (cont’d.): | | | | | | | | | | | | | |
Mexican Peso (cont’d.), | | | | | | | | | | | | | | | | | | | | |
Expiring 04/29/21 | | Morgan Stanley & Co. International PLC | | MXN | 156,457 | | | $ | 7,225,000 | | | $ | 7,557,767 | | | $ | — | | | $ | (332,767 | ) |
Expiring 04/29/21 | | Morgan Stanley & Co. International PLC | | MXN | 90,716 | | | | 4,246,000 | | | | 4,382,080 | | | | — | | | | (136,080 | ) |
New Taiwanese Dollar, | | | | | | | | | | | | | | | | | | | | | | |
Expiring 12/18/19 | | Barclays Bank PLC | | TWD | 24,575 | | | | 810,000 | | | | 811,404 | | | | — | | | | (1,404 | ) |
Expiring 12/18/19 | | BNP Paribas S.A. | | TWD | 49,255 | | | | 1,597,000 | | | | 1,626,237 | | | | — | | | | (29,237 | ) |
Expiring 12/18/19 | | BNP Paribas S.A. | | TWD | 33,001 | | | | 1,077,000 | | | | 1,089,605 | | | | — | | | | (12,605 | ) |
Expiring 12/18/19 | | Credit Suisse International | | TWD | 630,747 | | | | 20,312,911 | | | | 20,825,312 | | | | — | | | | (512,401 | ) |
Expiring 12/18/19 | | Credit Suisse International | | TWD | 33,730 | | | | 1,090,000 | | | | 1,113,662 | | | | — | | | | (23,662 | ) |
Expiring 12/18/19 | | Goldman Sachs International | | TWD | 61,360 | | | | 2,020,000 | | | | 2,025,901 | | | | — | | | | (5,901 | ) |
Expiring 12/18/19 | | Goldman Sachs International | | TWD | 50,850 | | | | 1,640,000 | | | | 1,678,904 | | | | — | | | | (38,904 | ) |
Expiring 12/18/19 | | HSBC Bank USA, N.A. | | TWD | 65,291 | | | | 2,109,000 | | | | 2,155,715 | | | | — | | | | (46,715 | ) |
Expiring 12/18/19 | | HSBC Bank USA, N.A. | | TWD | 63,318 | | | | 2,069,000 | | | | 2,090,551 | | | | — | | | | (21,551 | ) |
Expiring 12/18/19 | | JPMorgan Chase Bank, N.A. | | TWD | 38,458 | | | | 1,245,000 | | | | 1,269,766 | | | | — | | | | (24,766 | ) |
Expiring 12/18/19 | | JPMorgan Chase Bank, N.A. | | TWD | 24,668 | | | | 806,000 | | | | 814,475 | | | | — | | | | (8,475 | ) |
Expiring 12/18/19 | | JPMorgan Chase Bank, N.A. | | TWD | 24,058 | | | | 783,000 | | | | 794,310 | | | | — | | | | (11,310 | ) |
Expiring 12/18/19 | | JPMorgan Chase Bank, N.A. | | TWD | 23,615 | | | | 776,000 | | | | 779,702 | | | | — | | | | (3,702 | ) |
New Zealand Dollar, | | | | | | | | | | | | | | | | | | | | | | |
Expiring 01/22/20 | | Barclays Bank PLC | | NZD | 991 | | | | 630,000 | | | | 636,610 | | | | — | | | | (6,610 | ) |
Expiring 01/22/20 | | Morgan Stanley & Co. International PLC | | NZD | 10,963 | | | | 6,957,262 | | | | 7,039,675 | | | | — | | | | (82,413 | ) |
Expiring 01/22/20 | | The Toronto-Dominion Bank | | NZD | 780 | | | | 499,000 | | | | 501,041 | | | | — | | | | (2,041 | ) |
Norwegian Krone, | | | | | | | | | | | | | | | | | | | | | | |
Expiring 01/17/20 | | Barclays Bank PLC | | NOK | 9,571 | | | | 1,044,000 | | | | 1,041,337 | | | | 2,663 | | | | — | |
See Notes to Financial Statements.
Forward foreign currency exchange contracts outstanding at October 31, 2019 (continued):
| | | | | | | | | | | | | | | | | | | | | | |
Sale Contracts | | Counterparty | | Notional
Amount
(000) | | | Value at
Settlement
Date | | | Current
Value | | | Unrealized
Appreciation | | | Unrealized
Depreciation | |
OTC Forward Foreign Currency Exchange Contracts (cont’d.): | | | | | | | | | | | | | |
Norwegian Krone (cont’d.), | | | | | | | | | | | | | | | | | | | | |
Expiring 01/17/20 | | BNP Paribas S.A. | | NOK | 8,569 | | | $ | 940,000 | | | $ | 932,275 | | | $ | 7,725 | | | $ | — | |
Peruvian Nuevo Sol, | | | | | | | | | | | | | | | | | | | | | | |
Expiring 12/18/19 | | Bank of America, N.A. | | PEN | 12,730 | | | | 3,779,800 | | | | 3,800,422 | | | | — | | | | (20,622 | ) |
Expiring 12/18/19 | | Bank of America, N.A. | | PEN | 3,893 | | | | 1,160,000 | | | | 1,162,208 | | | | — | | | | (2,208 | ) |
Expiring 12/18/19 | | Bank of America, N.A. | | PEN | 2,811 | | | | 838,000 | | | | 839,320 | | | | — | | | | (1,320 | ) |
Expiring 12/18/19 | | Barclays Bank PLC | | PEN | 2,536 | | | | 753,000 | | | | 757,108 | | | | — | | | | (4,108 | ) |
Expiring 12/18/19 | | BNP Paribas S.A. | | PEN | 2,240 | | | | 667,000 | | | | 668,658 | | | | — | | | | (1,658 | ) |
Expiring 12/18/19 | | Citibank, N.A. | | PEN | 2,971 | | | | 891,000 | | | | 886,950 | | | | 4,050 | | | | — | |
Expiring 12/18/19 | | Goldman Sachs International | | PEN | 3,144 | | | | 941,000 | | | | 938,577 | | | | 2,423 | | | | — | |
Expiring 12/18/19 | | JPMorgan Chase Bank, N.A. | | PEN | 2,994 | | | | 890,000 | | | | 893,846 | | | | — | | | | (3,846 | ) |
Expiring 12/18/19 | | JPMorgan Chase Bank, N.A. | | PEN | 2,774 | | | | 821,000 | | | | 828,053 | | | | — | | | | (7,053 | ) |
Expiring 12/18/19 | | JPMorgan Chase Bank, N.A. | | PEN | 2,652 | | | | 790,000 | | | | 791,834 | | | | — | | | | (1,834 | ) |
Philippine Peso, | | | | | | | | | | | | | | | | | | | | | | |
Expiring 12/18/19 | | Barclays Bank PLC | | PHP | 60,621 | | | | 1,163,000 | | | | 1,191,769 | | | | — | | | | (28,769 | ) |
Expiring 12/18/19 | | Goldman Sachs International | | PHP | 36,684 | | | | 706,000 | | | | 721,174 | | | | — | | | | (15,174 | ) |
Expiring 12/18/19 | | HSBC Bank USA, N.A. | | PHP | 87,840 | | | | 1,674,000 | | | | 1,726,872 | | | | — | | | | (52,872 | ) |
Expiring 12/18/19 | | HSBC Bank USA, N.A. | | PHP | 64,275 | | | | 1,224,000 | | | | 1,263,590 | | | | — | | | | (39,590 | ) |
Expiring 12/18/19 | | HSBC Bank USA, N.A. | | PHP | 61,552 | | | | 1,176,000 | | | | 1,210,061 | | | | — | | | | (34,061 | ) |
Expiring 12/18/19 | | JPMorgan Chase Bank, N.A. | | PHP | 36,004 | | | | 690,000 | | | | 707,815 | | | | — | | | | (17,815 | ) |
Expiring 12/18/19 | | Morgan Stanley & Co. International PLC | | PHP | 63,939 | | | | 1,218,000 | | | | 1,256,989 | | | | — | | | | (38,989 | ) |
Russian Ruble, | | | | | | | | | | | | | | | | | | | | | | |
Expiring 12/18/19 | | Bank of America, N.A. | | RUB | 38,812 | | | | 589,000 | | | | 601,005 | | | | — | | | | (12,005 | ) |
See Notes to Financial Statements.
| | | | |
| PGIM Absolute Return Bond Fund | | | 93 | |
Schedule of Investments(continued)
as of October 31, 2019
Forward foreign currency exchange contracts outstanding at October 31, 2019 (continued):
| | | | | | | | | | | | | | | | | | | | | | |
Sale Contracts | | Counterparty | | Notional
Amount
(000) | | | Value at
Settlement
Date | | | Current
Value | | | Unrealized
Appreciation | | | Unrealized
Depreciation | |
OTC Forward Foreign Currency Exchange Contracts (cont’d.): | | | | | | | | | | | | | |
Russian Ruble (cont’d.), | | | | | | | | | | | | | | | | | | | | |
Expiring 12/18/19 | | Barclays Bank PLC | | RUB | 56,967 | | | $ | 863,000 | | | $ | 882,134 | | | $ | — | | | $ | (19,134 | ) |
Expiring 12/18/19 | | Barclays Bank PLC | | RUB | 26,396 | | | | 405,000 | | | | 408,737 | | | | — | | | | (3,737 | ) |
Expiring 12/18/19 | | Citibank, N.A. | | RUB | 34,309 | | | | 524,000 | | | | 531,269 | | | | — | | | | (7,269 | ) |
Expiring 12/18/19 | | JPMorgan Chase Bank, N.A. | | RUB | 21,843 | | | | 336,000 | | | | 338,241 | | | | — | | | | (2,241 | ) |
Expiring 12/24/19 | | Barclays Bank PLC | | RUB | 114,712 | | | | 1,758,315 | | | | 1,774,711 | | | | — | | | | (16,396 | ) |
Expiring 12/24/19 | | Goldman Sachs International | | RUB | 207,704 | | | | 3,385,000 | | | | 3,213,373 | | | | 171,627 | | | | — | |
Expiring 12/24/19 | | JPMorgan Chase Bank, N.A. | | RUB | 59,887 | | | | 804,126 | | | | 926,513 | | | | — | | | | (122,387 | ) |
Expiring 03/31/20 | | Citibank, N.A. | | RUB | 305,303 | | | | 4,444,000 | | | | 4,669,786 | | | | — | | | | (225,786 | ) |
Expiring 03/31/20 | | JPMorgan Chase Bank, N.A. | | RUB | 311,865 | | | | 4,119,743 | | | | 4,770,151 | | | | — | | | | (650,408 | ) |
Expiring 12/23/20 | | BNP Paribas S.A. | | RUB | 1,267,728 | | | | 17,197,000 | | | | 18,810,602 | | | | — | | | | (1,613,602 | ) |
Expiring 04/29/21 | | Deutsche Bank AG | | RUB | 203,421 | | | | 3,000,000 | | | | 2,976,110 | | | | 23,890 | | | | — | |
Saudi Arabian Riyal, | | | | | | | | | | | | | | | | | | | | | | |
Expiring 11/12/19 | | Morgan Stanley & Co. International PLC | | SAR | 113,400 | | | | 30,000,000 | | | | 30,238,549 | | | | — | | | | (238,549 | ) |
Singapore Dollar, | | | | | | | | | | | | | | | | | | | | | | |
Expiring 12/18/19 | | Barclays Bank PLC | | SGD | 1,190 | | | | 865,000 | | | | 874,941 | | | | — | | | | (9,941 | ) |
Expiring 12/18/19 | | Goldman Sachs International | | SGD | 7,997 | | | | 5,746,381 | | | | 5,881,227 | | | | — | | | | (134,846 | ) |
Expiring 12/18/19 | | HSBC Bank USA, N.A. | | SGD | 1,239 | | | | 903,000 | | | | 910,859 | | | | — | | | | (7,859 | ) |
Expiring 12/18/19 | | JPMorgan Chase Bank, N.A. | | SGD | 1,103 | | | | 809,000 | | | | 810,989 | | | | — | | | | (1,989 | ) |
South African Rand, | | | | | | | | | | | | | | | | | | | | | | |
Expiring 11/27/19 | | BNP Paribas S.A. | | ZAR | 9,352 | | | | 608,948 | | | | 616,661 | | | | — | | | | (7,713 | ) |
Expiring 12/18/19 | | Barclays Bank PLC | | ZAR | 38,818 | | | | 2,589,200 | | | | 2,552,104 | | | | 37,096 | | | | — | |
Expiring 12/18/19 | | Barclays Bank PLC | | ZAR | 21,737 | | | | 1,438,318 | | | | 1,429,111 | | | | 9,207 | | | | — | |
See Notes to Financial Statements.
Forward foreign currency exchange contracts outstanding at October 31, 2019 (continued):
| | | | | | | | | | | | | | | | | | | | | | |
Sale Contracts | | Counterparty | | Notional
Amount
(000) | | | Value at
Settlement
Date | | | Current
Value | | | Unrealized
Appreciation | | | Unrealized
Depreciation | |
OTC Forward Foreign Currency Exchange Contracts (cont’d.): | | | | | | | | | | | | | |
South African Rand (cont’d.), | | | | | | | | | | | | | | | | | | | | |
Expiring 12/18/19 | | Barclays Bank PLC | | ZAR | 21,609 | | | $ | 1,433,707 | | | $ | 1,420,670 | | | $ | 13,037 | | | $ | — | |
Expiring 12/18/19 | | Barclays Bank PLC | | ZAR | 21,444 | | | | 1,436,689 | | | | 1,409,865 | | | | 26,824 | | | | — | |
Expiring 12/18/19 | | Citibank, N.A. | | ZAR | 22,034 | | | | 1,441,399 | | | | 1,448,643 | | | | — | | | | (7,244 | ) |
Expiring 12/18/19 | | Citibank, N.A. | | ZAR | 4,976 | | | | 328,000 | | | | 327,150 | | | | 850 | | | | — | |
Expiring 12/18/19 | | HSBC Bank USA, N.A. | | ZAR | 5,678 | | | | 385,620 | | | | 373,321 | | | | 12,299 | | | | — | |
Expiring 12/18/19 | | JPMorgan Chase Bank, N.A. | | ZAR | 25,646 | | | | 1,724,662 | | | | 1,686,077 | | | | 38,585 | | | | — | |
Expiring 12/30/19 | | Goldman Sachs International | | ZAR | 36,889 | | | | 2,328,000 | | | | 2,420,825 | | | | — | | | | (92,825 | ) |
Expiring 12/30/19 | | JPMorgan Chase Bank, N.A. | | ZAR | 15,685 | | | | 1,039,428 | | | | 1,029,322 | | | | 10,106 | | | | — | |
Expiring 03/31/20 | | Barclays Bank PLC | | ZAR | 25,650 | | | | 1,706,000 | | | | 1,663,323 | | | | 42,677 | | | | — | |
Expiring 03/31/20 | | Goldman Sachs International | | ZAR | 25,843 | | | | 1,633,000 | | | | 1,675,862 | | | | — | | | | (42,862 | ) |
Expiring 03/31/20 | | JPMorgan Chase Bank, N.A. | | ZAR | 57,893 | | | | 3,787,558 | | | | 3,754,212 | | | | 33,346 | | | | — | |
Expiring 07/29/20 | | BNP Paribas S.A. | | ZAR | 134,737 | | | | 8,256,000 | | | | 8,597,680 | | | | — | | | | (341,680 | ) |
Expiring 09/30/20 | | Goldman Sachs International | | ZAR | 26,420 | | | | 1,651,000 | | | | 1,671,382 | | | | — | | | | (20,382 | ) |
Expiring 09/30/20 | | Morgan Stanley & Co. International PLC | | ZAR | 89,765 | | | | 6,105,000 | | | | 5,678,677 | | | | 426,323 | | | | — | |
Expiring 01/29/21 | | Deutsche Bank AG | | ZAR | 143,766 | | | | 9,153,000 | | | | 8,943,022 | | | | 209,978 | | | | — | |
Expiring 01/29/21 | | Morgan Stanley & Co. International PLC | | ZAR | 79,569 | | | | 5,129,000 | | | | 4,949,599 | | | | 179,401 | | | | — | |
South Korean Won, | | | | | | | | | | | | | | | | | | | | | | |
Expiring 11/27/19 | | JPMorgan Chase Bank, N.A. | | KRW | 941,724 | | | | 777,000 | | | | 805,106 | | | | — | | | | (28,106 | ) |
Expiring 12/18/19 | | Citibank, N.A. | | KRW | 3,541,106 | | | | 2,946,134 | | | | 3,028,768 | | | | — | | | | (82,634 | ) |
Expiring 12/18/19 | | HSBC Bank USA, N.A. | | KRW | 1,190,069 | | | | 997,000 | | | | 1,017,886 | | | | — | | | | (20,886 | ) |
Expiring 12/18/19 | | JPMorgan Chase Bank, N.A. | | KRW | 947,052 | | | | 790,000 | | | | 810,030 | | | | — | | | | (20,030 | ) |
See Notes to Financial Statements.
| | | | |
| PGIM Absolute Return Bond Fund | | | 95 | |
Schedule of Investments(continued)
as of October 31, 2019
Forward foreign currency exchange contracts outstanding at October 31, 2019 (continued):
| | | | | | | | | | | | | | | | | | | | | | |
Sale Contracts | | Counterparty | | Notional
Amount
(000) | | | Value at
Settlement
Date | | | Current
Value | | | Unrealized
Appreciation | | | Unrealized
Depreciation | |
OTC Forward Foreign Currency Exchange Contracts (cont’d.): | | | | | | | | | | | | | |
South Korean Won (cont’d.), | | | | | | | | | | | | | | | | | | | | |
Expiring 12/18/19 | | JPMorgan Chase Bank, N.A. | | KRW | 921,262 | | | $ | 769,000 | | | $ | 787,971 | | | $ | — | | | $ | (18,971 | ) |
Expiring 12/18/19 | | The Toronto-Dominion Bank | | KRW | 612,683 | | | | 509,000 | | | | 524,038 | | | | — | | | | (15,038 | ) |
Expiring 12/24/19 | | Goldman Sachs International | | KRW | 130,134 | | | | 123,000 | | | | 111,320 | | | | 11,680 | | | | — | |
Expiring 02/28/20 | | HSBC Bank USA, N.A. | | KRW | 7,664,805 | | | | 6,390,000 | | | | 6,569,376 | | | | — | | | | (179,376 | ) |
Expiring 05/29/20 | | Morgan Stanley & Co. International PLC | | KRW | 6,250,669 | | | | 5,364,000 | | | | 5,370,530 | | | | — | | | | (6,530 | ) |
Expiring 10/30/20 | | Deutsche Bank AG | | KRW | 8,680,971 | | | | 7,503,000 | | | | 7,492,757 | | | | 10,243 | | | | — | |
Swedish Krona, | | | | | | | | | | | | | | | | | | | | | | |
Expiring 01/17/20 | | Barclays Bank PLC | | SEK | 7,831 | | | | 801,000 | | | | 814,798 | | | | — | | | | (13,798 | ) |
Expiring 01/17/20 | | BNP Paribas S.A. | | SEK | 8,125 | | | | 840,000 | | | | 845,415 | | | | — | | | | (5,415 | ) |
Expiring 01/17/20 | | Morgan Stanley & Co. International PLC | | SEK | 26,308 | | | | 2,700,745 | | | | 2,737,320 | | | | — | | | | (36,575 | ) |
Swiss Franc, | | | | | | | | | | | | | | | | | | | | | | |
Expiring 01/17/20 | | Barclays Bank PLC | | CHF | 1,139 | | | | 1,156,000 | | | | 1,161,596 | | | | — | | | | (5,596 | ) |
Expiring 01/17/20 | | Barclays Bank PLC | | CHF | 555 | | | | 562,000 | | | | 565,798 | | | | — | | | | (3,798 | ) |
Expiring 01/17/20 | | Morgan Stanley & Co. International PLC | | CHF | 1,023 | | | | 1,043,000 | | | | 1,043,713 | | | | — | | | | (713 | ) |
Expiring 01/17/20 | | UBS AG | | CHF | 14,984 | | | | 15,114,772 | | | | 15,285,650 | | | | — | | | | (170,878 | ) |
Expiring 10/30/20 | | Bank of America, N.A. | | CHF | 8,238 | | | | 8,718,000 | | | | 8,566,699 | | | | 151,301 | | | | — | |
Expiring 10/30/20 | | Morgan Stanley & Co. International PLC | | CHF | 2,938 | | | | 3,097,043 | | | | 3,055,597 | | | | 41,446 | | | | — | |
Thai Baht, | | | | | | | | | | | | | | | | | | | | | | |
Expiring 12/18/19 | | Barclays Bank PLC | | THB | 39,387 | | | | 1,279,000 | | | | 1,305,103 | | | | — | | | | (26,103 | ) |
Expiring 12/18/19 | | Barclays Bank PLC | | THB | 26,672 | | | | 882,000 | | | | 883,780 | | | | — | | | | (1,780 | ) |
Expiring 12/18/19 | | Citibank, N.A. | | THB | 30,960 | | | | 1,006,000 | | | | 1,025,865 | | | | — | | | | (19,865 | ) |
Expiring 12/18/19 | | Goldman Sachs International | | THB | 45,255 | | | | 1,471,000 | | | | 1,499,559 | | | | — | | | | (28,559 | ) |
See Notes to Financial Statements.
Forward foreign currency exchange contracts outstanding at October 31, 2019 (continued):
| | | | | | | | | | | | | | | | | | | | | | |
Sale Contracts | | Counterparty | | Notional
Amount
(000) | | | Value at
Settlement
Date | | | Current
Value | | | Unrealized
Appreciation | | | Unrealized
Depreciation | |
OTC Forward Foreign Currency Exchange Contracts (cont’d.): | | | | | | | | | |
Thai Baht (cont’d.), | | | | | | | | | | | | | | | | | | | | | | |
Expiring 12/18/19 | | HSBC Bank USA, N.A. | | THB | 38,043 | | | $ | 1,240,000 | | | $ | 1,260,582 | | | $ | — | | | $ | (20,582 | ) |
Expiring 12/18/19 | | HSBC Bank USA, N.A. | | THB | 37,646 | | | | 1,245,000 | | | | 1,247,431 | | | | — | | | | (2,431 | ) |
Expiring 12/18/19 | | JPMorgan Chase Bank, N.A. | | THB | 38,223 | | | | 1,264,000 | | | | 1,266,551 | | | | — | | | | (2,551 | ) |
Expiring 12/18/19 | | JPMorgan Chase Bank, N.A. | | THB | 25,626 | | | | 832,000 | | | | 849,118 | | | | — | | | | (17,118 | ) |
Turkish Lira, | | | | | | | | | | | | | | | | | | | | | | |
Expiring 11/27/19 | | HSBC Bank USA, N.A. | | TRY | 3,585 | | | | 600,000 | | | | 622,351 | | | | — | | | | (22,351 | ) |
Expiring 12/18/19 | | Barclays Bank PLC | | TRY | 3,396 | | | | 570,000 | | | | 586,392 | | | | — | | | | (16,392 | ) |
Expiring 12/18/19 | | Barclays Bank PLC | | TRY | 2,908 | | | | 480,000 | | | | 502,200 | | | | — | | | | (22,200 | ) |
Expiring 12/18/19 | | Barclays Bank PLC | | TRY | 2,729 | | | | 453,000 | | | | 471,151 | | | | — | | | | (18,151 | ) |
Expiring 12/18/19 | | Barclays Bank PLC | | TRY | 2,188 | | | | 367,000 | | | | 377,852 | | | | — | | | | (10,852 | ) |
Expiring 12/18/19 | | Barclays Bank PLC | | TRY | 1,378 | | | | 229,000 | | | | 238,025 | | | | — | | | | (9,025 | ) |
Expiring 12/18/19 | | JPMorgan Chase Bank, N.A. | | TRY | 20,523 | | | | 3,394,169 | | | | 3,543,823 | | | | — | | | | (149,654 | ) |
Expiring 12/18/19 | | JPMorgan Chase Bank, N.A. | | TRY | 6,989 | | | | 1,152,344 | | | | 1,206,834 | | | | — | | | | (54,490 | ) |
Expiring 12/18/19 | | JPMorgan Chase Bank, N.A. | | TRY | 3,081 | | | | 516,000 | | | | 532,015 | | | | — | | | | (16,015 | ) |
Expiring 12/18/19 | | Morgan Stanley & Co.
International PLC | | TRY | 3,722 | | | | 615,000 | | | | 642,696 | | | | — | | | | (27,696 | ) |
Expiring 12/18/19 | | Morgan Stanley & Co.
International PLC | | TRY | 2,072 | | | | 339,000 | | | | 357,840 | | | | — | | | | (18,840 | ) |
Expiring 12/24/19 | | BNP Paribas S.A. | | TRY | 23,277 | | | | 5,000,000 | | | | 4,013,146 | | | | 986,854 | | | | — | |
Expiring 12/24/19 | | JPMorgan Chase Bank, N.A. | | TRY | 31,803 | | | | 5,614,016 | | | | 5,483,285 | | | | 130,731 | | | | — | |
Expiring 01/31/20 | | JPMorgan Chase Bank, N.A. | | TRY | 41,748 | | | | 7,293,523 | | | | 7,128,207 | | | | 165,316 | | | | — | |
Expiring 04/30/20 | | Citibank, N.A. | | TRY | 36,508 | | | | 4,824,900 | | | | 6,094,555 | | | | — | | | | (1,269,655 | ) |
Expiring 04/30/20 | | Citibank, N.A. | | TRY | 14,821 | | | | 2,294,125 | | | | 2,474,240 | | | | — | | | | (180,115 | ) |
See Notes to Financial Statements.
| | | | |
| PGIM Absolute Return Bond Fund | | | 97 | |
Schedule of Investments(continued)
as of October 31, 2019
Forward foreign currency exchange contracts outstanding at October 31, 2019 (continued):
| | | | | | | | | | | | | | | | | | | | | | | | |
Sale Contracts | | Counterparty | | | Notional
Amount
(000) | | | Value at
Settlement
Date | | | Current
Value | | | Unrealized
Appreciation | | | Unrealized
Depreciation | |
OTC Forward Foreign Currency Exchange Contracts (cont’d.): | | | | | | | | | |
Turkish Lira (cont’d.), | | | | | | | | | | | | | | | | | | | | | |
Expiring 04/30/20 | | | Citibank, N.A. | | | TRY | 5,288 | | | $ | 736,000 | | | $ | 882,802 | | | $ | — | | | $ | (146,802 | ) |
Expiring 04/30/20 | | | Goldman Sachs International | | | TRY | 53,577 | | | | 9,291,000 | | | | 8,944,034 | | | | 346,966 | | | | — | |
Expiring 04/30/20 | | | JPMorgan Chase Bank, N.A. | | | TRY | 10,122 | | | | 1,566,000 | | | | 1,689,791 | | | | — | | | | (123,791 | ) |
Expiring 06/30/20 | | | Barclays Bank PLC | | | TRY | 48,559 | | | | 6,842,133 | | | | 7,982,616 | | | | — | | | | (1,140,483 | ) |
Expiring 06/30/20 | | | Citibank, N.A. | | | TRY | 16,668 | | | | 1,734,392 | | | | 2,739,994 | | | | — | | | | (1,005,602 | ) |
Expiring 06/30/20 | | | Citibank, N.A. | | | TRY | 10,788 | | | | 1,120,000 | | | | 1,773,427 | | | | — | | | | (653,427 | ) |
Expiring 06/30/20 | | | JPMorgan Chase Bank, N.A. | | | TRY | 15,609 | | | | 2,128,000 | | | | 2,565,975 | | | | — | | | | (437,975 | ) |
Expiring 06/30/20 | |
| Morgan Stanley & Co.
International PLC |
| | TRY | 72,659 | | | | 11,029,000 | | | | 11,944,518 | | | | — | | | | (915,518 | ) |
Expiring 10/30/20 | | | Deutsche Bank AG | | | TRY | 6,298 | | | | 829,000 | | | | 1,004,695 | | | | — | | | | (175,695 | ) |
Expiring 10/30/20 | | | Goldman Sachs International | | | TRY | 4,906 | | | | 707,000 | | | | 782,569 | | | | — | | | | (75,569 | ) |
Expiring 02/26/21 | | | Citibank, N.A. | | | TRY | 28,332 | | | | 3,483,000 | | | | 4,378,099 | | | | — | | | | (895,099 | ) |
Expiring 02/26/21 | | | Citibank, N.A. | | | TRY | 15,186 | | | | 1,803,614 | | | | 2,346,697 | | | | — | | | | (543,083 | ) |
Expiring 02/26/21 | | | Goldman Sachs International | | | TRY | 20,013 | | | | 3,005,000 | | | | 3,092,573 | | | | — | | | | (87,573 | ) |
Expiring 02/26/21 | | | JPMorgan Chase Bank, N.A. | | | TRY | 19,750 | | | | 2,372,386 | | | | 3,051,904 | | | | — | | | | (679,518 | ) |
Expiring 02/26/21 | |
| Morgan Stanley & Co.
International PLC |
| | TRY | 67,636 | | | | 9,365,000 | | | | 10,451,498 | | | | — | | | | (1,086,498 | ) |
Expiring 05/28/21 | | | Goldman Sachs International | | | TRY | 9,428 | | | | 1,264,000 | | | | 1,422,685 | | | | — | | | | (158,685 | ) |
| | | | | | | | | | | | | | | | | | | | | | | | |
| | | | | | | | | | | $1,203,141,305 | | | $ | 1,223,205,749 | | | | 9,769,318 | | | | (29,833,762 | ) |
| | | | | | | | | | | | | | | | | | | | | | | | |
| | | | | | | | | | | | | | | | | | $ | 40,856,226 | | | $ | (40,159,735 | ) |
| | | | | | | | | | | | | | | | | | | | | | | | |
See Notes to Financial Statements.
Cross currency exchange contracts outstanding at October 31, 2019:
| | | | | | | | | | | | | | | | | | | | | | | | | | | | | | |
Settlement | | Type | | | Notional
Amount
(000) | | | In Exchange
For (000) | | | Unrealized
Appreciation | | | Unrealized
Depreciation | | | Counterparty | |
OTC Cross Currency Exchange Contracts: | | | | | |
12/30/19 | | | Buy | | | | EUR | | | | 3,269 | | | ZAR | | | 56,766 | | | $ | — | | | $ | (62,680 | ) | | | Deutsche Bank AG | |
12/30/19 | | | Buy | | | | ZAR | | | | 33,780 | | | EUR | | | 2,038 | | | | — | | | | (66,581 | ) | | | Morgan Stanley & Co. International PLC | |
01/31/20 | | | Buy | | | | AUD | | | | 6,894 | | | JPY | | | 536,215 | | | | — | | | | (232,878 | ) | | | Deutsche Bank AG | |
01/31/20 | | | Buy | | | | EUR | | | | 3,871 | | | TRY | | | 23,609 | | | | 313,735 | | | | — | | | | Goldman Sachs International | |
01/31/20 | | | Buy | | | | TRY | | | | 59,401 | | | EUR | | | 8,169 | | | | 973,327 | | | | — | | | | Goldman Sachs International | |
02/28/20 | | | Buy | | | | JPY | | | | 1,376,795 | | | AUD | | | 18,272 | | | | 217,979 | | | | — | | | | Deutsche Bank AG | |
03/31/20 | | | Buy | | | | EUR | | | | 7,965 | | | ZAR | | | 134,569 | | | | 245,658 | | | | — | | | | Morgan Stanley & Co. International PLC | |
03/31/20 | | | Buy | | | | ZAR | | | | 153,638 | | | EUR | | | 8,269 | | | | 648,505 | | | | — | | | | Morgan Stanley & Co. International PLC | |
04/30/20 | | | Buy | | | | EUR | | | | 10,404 | | | TRY | | | 78,477 | | | | — | | | | (1,360,358 | ) | | | Goldman Sachs International | |
04/30/20 | | | Buy | | | | TRY | | | | 102,842 | | | EUR | | | 11,170 | | | | 4,563,397 | | | | — | | | | BNP Paribas S.A. | |
07/29/20 | | | Buy | | | | EUR | | | | 12,064 | | | TRY | | | 116,743 | | | | — | | | | (5,367,892 | ) | | | BNP Paribas S.A. | |
07/29/20 | | | Buy | | | | TRY | | | | 85,432 | | | EUR | | | 7,021 | | | | 5,978,381 | | | | — | | | | Morgan Stanley & Co. International PLC | |
08/31/20 | | | Buy | | | | EUR | | | | 4,722 | | | ZAR | | | 91,087 | | | | — | | | | (419,492 | ) | | | Morgan Stanley & Co. International PLC | |
08/31/20 | | | Buy | | | | ZAR | | | | 40,549 | | | EUR | | | 2,298 | | | | — | | | | (35,904 | ) | | | Goldman Sachs International | |
09/30/20 | | | Buy | | | | JPY | | | | 52,751 | | | GBP | | | 403 | | | | — | | | | (28,167 | ) | | | Bank of America, N.A. | |
10/30/20 | | | Buy | | | | EUR | | | | 8,940 | | | GBP | | | 7,848 | | | | — | | | | (61,430 | ) | | | Morgan Stanley & Co. International PLC | |
11/27/20 | | | Buy | | | | AUD | | | | 5,929 | | | JPY | | | 441,711 | | | | — | | | | (69,301 | ) | | | Morgan Stanley & Co. International PLC | |
11/30/20 | | | Buy | | | | JPY | | | | 1,016,141 | | | AUD | | | 12,805 | | | | 739,881 | | | | — | | | | Morgan Stanley & Co. International PLC | |
12/23/20 | | | Buy | | | | EUR | | | | 572 | | | ZAR | | | 10,356 | | | | 6,607 | | | | — | | | | Goldman Sachs International | |
12/23/20 | | | Buy | | | | EUR | | | | 1,187 | | | ZAR | | | 20,389 | | | | 82,623 | | | | — | | | | Morgan Stanley & Co. International PLC | |
12/30/20 | | | Buy | | | | JPY | | | | 154,422 | | | AUD | | | 2,095 | | | | 10,898 | | | | — | | | | Deutsche Bank AG | |
12/30/20 | | | Buy | | | | JPY | | | | 771,852 | | | AUD | | | 10,480 | | | | 48,551 | | | | — | | | | Deutsche Bank AG | |
05/28/21 | | | Buy | | | | AUD | | | | 3,758 | | | JPY | | | 274,221 | | | | — | | | | (10,070 | ) | | | Deutsche Bank AG | |
05/28/21 | | | Buy | | | | JPY | | | | 389,110 | | | AUD | | | 5,610 | | | | — | | | | (178,678 | ) | | | Morgan Stanley & Co. International PLC | |
07/30/21 | | | Buy | | | | AUD | | | | 7,614 | | | JPY | | | 525,556 | | | | 253,188 | | | | — | | | | Morgan Stanley & Co. International PLC | |
10/31/23 | | | Buy | | | | AUD | | | | 6,309 | | | JPY | | | 422,703 | | | | 156,507 | | | | — | | | | Deutsche Bank AG | |
10/31/23 | | | Buy | | | | JPY | | | | 648,099 | | | AUD | | | 9,489 | | | | — | | | | (111,307 | ) | | | Morgan Stanley & Co. International PLC | |
| | | | | | | | | | | | | | | | | | | | | | | | | | | | | | |
| | | | | | | | | | | | | | | | | | | | $ | 14,239,237 | | | $ | (8,004,738 | ) | | | | |
| | | | | | | | | | | | | | | | | | | | | | | | | | | | | | |
See Notes to Financial Statements.
| | | | |
| PGIM Absolute Return Bond Fund | | | 99 | |
Schedule of Investments(continued)
as of October 31, 2019
Credit default swap agreements outstanding at October 31, 2019:
| | | | | | | | | | | | | | | | | | | | | | | | | | | | | | |
Reference
Entity/
Obligation | | Termination
Date | | | Fixed
Rate | | | Notional
Amount
(000)#(3) | | | Implied
Credit
Spread at
October 31,
2019(4) | | | Fair
Value | | | Upfront
Premiums
Paid
(Received) | | | Unrealized
Appreciation
(Depreciation) | | | Counterparty |
OTC Packaged Credit Default Swap Agreements on corporate and/or sovereign issues—Sell Protection(2)*: |
Federation of Malaysia (D01) | | | 06/20/23 | | | | 1.000%(Q) | | | | 3,750 | | | | 0.354 | % | | $ | 100,072 | | | $ | (3,076 | ) | | $ | 103,148 | | | Barclays Bank PLC |
People’s Republic of China (D01) | | | 06/20/23 | | | | 1.000%(Q) | | | | 13,750 | | | | 0.300 | % | | | 388,336 | | | | (11,277 | ) | | | 399,613 | | | Barclays Bank PLC |
Republic of Argentina (D01) | | | 06/20/23 | | | | 1.000%(Q) | | | | 3,750 | | | | 113.240 | % | | | (2,372,715 | ) | | | (3,076 | ) | | | (2,369,639 | ) | | Barclays Bank PLC |
Republic of Brazil (D01) | | | 06/20/23 | | | | 1.000%(Q) | | | | 18,750 | | | | 0.855 | % | | | 117,785 | | | | (15,378 | ) | | | 133,163 | | | Barclays Bank PLC |
Republic of Chile (D01) | | | 06/20/23 | | | | 1.000%(Q) | | | | 3,750 | | | | 0.287 | % | | | 99,534 | | | | (3,076 | ) | | | 102,610 | | | Barclays Bank PLC |
Republic of Colombia (D01) | | | 06/20/23 | | | | 1.000%(Q) | | | | 5,000 | | | | 0.530 | % | | | 89,068 | | | | (4,101 | ) | | | 93,169 | | | Barclays Bank PLC |
Republic of Indonesia (D01) | | | 06/20/23 | | | | 1.000%(Q) | | | | 5,000 | | | | 0.636 | % | | | 92,835 | | | | (4,101 | ) | | | 96,936 | | | Barclays Bank PLC |
Republic of Lebanon (D01) | | | 06/20/23 | | | | 1.000%(Q) | | | | 3,750 | | | | 22.800 | % | | | (1,650,975 | ) | | | (3,076 | ) | | | (1,647,899 | ) | | Barclays Bank PLC |
Republic of Panama (D01) | | | 06/20/23 | | | | 1.000%(Q) | | | | 3,750 | | | | 0.308 | % | | | 96,725 | | | | (3,076 | ) | | | 99,801 | | | Barclays Bank PLC |
Republic of Peru (D01) | | | 06/20/23 | | | | 1.000%(Q) | | | | 3,750 | | | | 0.320 | % | | | 95,221 | | | | (3,076 | ) | | | 98,297 | | | Barclays Bank PLC |
Republic of Philippines (D01) | | | 06/20/23 | | | | 1.000%(Q) | | | | 3,750 | | | | 0.329 | % | | | 102,700 | | | | (3,076 | ) | | | 105,776 | | | Barclays Bank PLC |
Republic of South Africa (D01) | | | 06/20/23 | | | | 1.000%(Q) | | | | 11,250 | | | | 1.474 | % | | | (180,268 | ) | | | (9,227 | ) | | | (171,041 | ) | | Barclays Bank PLC |
Republic of Turkey (D01) | | | 06/20/23 | | | | 1.000%(Q) | | | | 17,500 | | | | 2.961 | % | | | (1,137,355 | ) | | | (14,353 | ) | | | (1,123,002 | ) | | Barclays Bank PLC |
Russian Federation (D01) | | | 06/20/23 | | | | 1.000%(Q) | | | | 11,250 | | | | 0.513 | % | | | 205,638 | | | | (9,227 | ) | | | 214,865 | | | Barclays Bank PLC |
United Mexican States (D01) | | | 06/20/23 | | | | 1.000%(Q) | | | | 16,250 | | | | 0.624 | % | | | 235,385 | | | | (13,328 | ) | | | 248,713 | | | Barclays Bank PLC |
See Notes to Financial Statements.
Credit default swap agreements outstanding at October 31, 2019 (continued):
| | | | | | | | | | | | | | | | | | | | | | | | | | | | | | |
Reference Entity/
Obligation | | Termination
Date | | | Fixed
Rate | | | Notional
Amount
(000)#(3) | | | Implied
Credit
Spread at
October 31,
2019(4) | | | Fair
Value | | | Upfront
Premiums
Paid
(Received) | | | Unrealized
Appreciation
(Depreciation) | | | Counterparty |
OTC Packaged Credit Default Swap Agreements on corporate and/or sovereign issues—Sell Protection(2)* (cont’d.): |
Federation of Malaysia (D02) | | | 06/20/23 | | | | 1.000%(Q) | | | | 3,000 | | | | 0.354 | % | | $ | 80,058 | | | $ | (4,359 | ) | | $ | 84,417 | | | Citibank, N.A. |
People’s Republic of China (D02) | | | 06/20/23 | | | | 1.000%(Q) | | | | 11,000 | | | | 0.300 | % | | | 310,669 | | | | (15,982 | ) | | | 326,651 | | | Citibank, N.A. |
Republic of Argentina (D02) | | | 06/20/23 | | | | 1.000%(Q) | | | | 3,000 | | | | 113.240 | % | | | (1,898,172 | ) | | | (4,359 | ) | | | (1,893,813 | ) | | Citibank, N.A. |
Republic of Brazil (D02) | | | 06/20/23 | | | | 1.000%(Q) | | | | 15,000 | | | | 0.855 | % | | | 94,228 | | | | (21,793 | ) | | | 116,021 | | | Citibank, N.A. |
Republic of Chile (D02) | | | 06/20/23 | | | | 1.000%(Q) | | | | 3,000 | | | | 0.287 | % | | | 79,628 | | | | (4,359 | ) | | | 83,987 | | | Citibank, N.A. |
Republic of Colombia (D02) | | | 06/20/23 | | | | 1.000%(Q) | | | | 4,000 | | | | 0.530 | % | | | 71,254 | | | | (5,812 | ) | | | 77,066 | | | Citibank, N.A. |
Republic of Indonesia (D02) | | | 06/20/23 | | | | 1.000%(Q) | | | | 4,000 | | | | 0.636 | % | | | 74,268 | | | | (5,812 | ) | | | 80,080 | | | Citibank, N.A. |
Republic of Lebanon (D02) | | | 06/20/23 | | | | 1.000%(Q) | | | | 3,000 | | | | 22.800 | % | | | (1,320,780 | ) | | | (4,359 | ) | | | (1,316,421 | ) | | Citibank, N.A. |
Republic of Panama (D02) | | | 06/20/23 | | | | 1.000%(Q) | | | | 3,000 | | | | 0.308 | % | | | 77,380 | | | | (4,359 | ) | | | 81,739 | | | Citibank, N.A. |
Republic of Peru (D02) | | | 06/20/23 | | | | 1.000%(Q) | | | | 3,000 | | | | 0.320 | % | | | 76,177 | | | | (4,359 | ) | | | 80,536 | | | Citibank, N.A. |
Republic of Philippines (D02) | | | 06/20/23 | | | | 1.000%(Q) | | | | 3,000 | | | | 0.329 | % | | | 82,160 | | | | (4,359 | ) | | | 86,519 | | | Citibank, N.A. |
Republic of South Africa (D02) | | | 06/20/23 | | | | 1.000%(Q) | | | | 9,000 | | | | 1.474 | % | | | (144,214 | ) | | | (13,076 | ) | | | (131,138 | ) | | Citibank, N.A. |
Republic of Turkey (D02) | | | 06/20/23 | | | | 1.000%(Q) | | | | 14,000 | | | | 2.961 | % | | | (909,884 | ) | | | (20,340 | ) | | | (889,544 | ) | | Citibank, N.A. |
Russian Federation (D02) | | | 06/20/23 | | | | 1.000%(Q) | | | | 9,000 | | | | 0.513 | % | | | 164,511 | | | | (13,076 | ) | | | 177,587 | | | Citibank, N.A. |
United Mexican States (D02) | | | 06/20/23 | | | | 1.000%(Q) | | | | 13,000 | | | | 0.624 | % | | | 188,308 | | | | (18,847 | ) | | | 207,155 | | | Citibank, N.A. |
See Notes to Financial Statements.
| | | | |
| PGIM Absolute Return Bond Fund | | | 101 | |
Schedule of Investments(continued)
as of October 31, 2019
Credit default swap agreements outstanding at October 31, 2019 (continued):
| | | | | | | | | | | | | | | | | | | | | | | | | | | | | | |
Reference
Entity/
Obligation | | Termination
Date | | | Fixed
Rate | | | Notional
Amount
(000)#(3) | | | Implied
Credit
Spread at
October 31,
2019(4) | | | Fair
Value | | | Upfront
Premiums
Paid
(Received) | | | Unrealized
Appreciation
(Depreciation) | | | Counterparty |
OTC Packaged Credit Default Swap Agreements on corporate and/or sovereign issues—Sell Protection(2)*(cont’d.): |
Emirate of Abu Dhabi (D03) | | | 12/20/24 | | | | 1.000%(Q) | | | | 1,000 | | | | 0.462 | % | | $ | 27,830 | | | $ | (356 | ) | | $ | 28,186 | | | Barclays Bank PLC |
Federation of Malaysia (D03) | | | 12/20/24 | | | | 1.000%(Q) | | | | 2,000 | | | | 0.549 | % | | | 57,855 | | | | (713 | ) | | | 58,568 | | | Barclays Bank PLC |
Kingdom of Saudi Arabia (D03) | | | 12/20/24 | | | | 1.000%(Q) | | | | 1,000 | | | | 0.705 | % | | | 15,713 | | | | (356 | ) | | | 16,069 | | | Barclays Bank PLC |
People’s Republic of China (D03) | | | 12/20/24 | | | | 1.000%(Q) | | | | 4,500 | | | | 0.510 | % | | | 137,187 | | | | (2,097 | ) | | | 139,284 | | | Barclays Bank PLC |
Republic of Argentina (D03) | | | 12/20/24 | | | | 1.000%(Q) | | | | 2,500 | | | | 103.524 | % | | | (1,605,006 | ) | | | (891 | ) | | | (1,604,115 | ) | | Barclays Bank PLC |
Republic of Brazil (D03) | | | 12/20/24 | | | | 1.000%(Q) | | | | 6,000 | | | | 1.213 | % | | | (55,102 | ) | | | (2,796 | ) | | | (52,306 | ) | | Barclays Bank PLC |
Republic of Chile (D03) | | | 12/20/24 | | | | 1.000%(Q) | | | | 1,000 | | | | 0.436 | % | | | 29,116 | | | | (356 | ) | | | 29,472 | | | Barclays Bank PLC |
Republic of Colombia (D03) | | | 12/20/24 | | | | 1.000%(Q) | | | | 2,500 | | | | 0.818 | % | | | 25,253 | | | | (891 | ) | | | 26,144 | | | Barclays Bank PLC |
Republic of Indonesia (D03) | | | 12/20/24 | | | | 1.000%(Q) | | | | 4,000 | | | | 0.957 | % | | | 50,553 | | | | (1,864 | ) | | | 52,417 | | | Barclays Bank PLC |
Republic of Lebanon (D03) | | | 12/20/24 | | | | 1.000%(Q) | | | | 1,000 | | | | 18.956 | % | | | (454,451 | ) | | | (356 | ) | | | (454,095 | ) | | Barclays Bank PLC |
Republic of Panama (D03) | | | 12/20/24 | | | | 1.000%(Q) | | | | 1,000 | | | | 0.502 | % | | | 25,826 | | | | (356 | ) | | | 26,182 | | | Barclays Bank PLC |
Republic of Peru (D03) | | | 12/20/24 | | | | 1.000%(Q) | | | | 1,000 | | | | 0.530 | % | | �� | 24,455 | | | | (356 | ) | | | 24,811 | | | Barclays Bank PLC |
Republic of Philippines (D03) | | | 12/20/24 | | | | 1.000%(Q) | | | | 1,000 | | | | 0.508 | % | | | 30,574 | | | | (356 | ) | | | 30,930 | | | Barclays Bank PLC |
Republic of South Africa (D03) | | | 12/20/24 | | | | 1.000%(Q) | | | | 4,500 | | | | 1.857 | % | | | (184,027 | ) | | | (2,097 | ) | | | (181,930 | ) | | Barclays Bank PLC |
Republic of Turkey (D03) | | | 12/20/24 | | | | 1.000%(Q) | | | | 6,000 | | | | 3.341 | % | | | (632,333 | ) | | | (2,796 | ) | | | (629,537 | ) | | Barclays Bank PLC |
See Notes to Financial Statements.
Credit default swap agreements outstanding at October 31, 2019 (continued):
| | | | | | | | | | | | | | | | | | | | | | | | | | | | | | |
Reference
Entity/
Obligation | | Termination
Date | | | Fixed
Rate | | | Notional
Amount
(000)#(3) | | | Implied
Credit
Spread at
October 31,
2019(4) | | | Fair
Value | | | Upfront
Premiums
Paid
(Received) | | | Unrealized
Appreciation
(Depreciation) | | | Counterparty |
OTC Packaged Credit Default Swap Agreements on corporate and/or sovereign issues—Sell Protection(2)* (cont’d.): |
Russian Federation (D03) | | | 12/20/24 | | | | 1.000%(Q) | | | | 4,000 | | | | 0.756 | % | | $ | 51,212 | | | $ | (1,864 | ) | | $ | 53,076 | | | Barclays Bank PLC |
State of Qatar (D03) | | | 12/20/24 | | | | 1.000%(Q) | | | | 1,000 | | | | 0.467 | % | | | 27,604 | | | | (356 | ) | | | 27,960 | | | Barclays Bank PLC |
United Mexican States (D03) | | | 12/20/24 | | | | 1.000%(Q) | | | | 6,000 | | | | 0.927 | % | | | 28,589 | | | | (2,796 | ) | | | 31,385 | | | Barclays Bank PLC |
Emirate of Abu Dhabi (D04) | | | 12/20/24 | | | | 1.000%(Q) | | | | 800 | | | | 0.462 | % | | | 22,264 | | | | (866 | ) | | | 23,130 | | | Barclays Bank PLC |
Federation of Malaysia (D04) | | | 12/20/24 | | | | 1.000%(Q) | | | | 1,600 | | | | 0.549 | % | | | 46,284 | | | | (1,732 | ) | | | 48,016 | | | Barclays Bank PLC |
Kingdom of Saudi Arabia (D04) | | | 12/20/24 | | | | 1.000%(Q) | | | | 800 | | | | 0.705 | % | | | 12,570 | | | | (866 | ) | | | 13,436 | | | Barclays Bank PLC |
People’s Republic of China (D04) | | | 12/20/24 | | | | 1.000%(Q) | | | | 3,600 | | | | 0.510 | % | | | 109,749 | | | | (3,898 | ) | | | 113,647 | | | Barclays Bank PLC |
Republic of Argentina (D04) | | | 12/20/24 | | | | 1.000%(Q) | | | | 2,000 | | | | 103.524 | % | | | (1,284,005 | ) | | | (2,166 | ) | | | (1,281,839 | ) | | Barclays Bank PLC |
Republic of Brazil (D04) | | | 12/20/24 | | | | 1.000%(Q) | | | | 4,800 | | | | 1.213 | % | | | (44,082 | ) | | | (5,197 | ) | | | (38,885 | ) | | Barclays Bank PLC |
Republic of Chile (D04) | | | 12/20/24 | | | | 1.000%(Q) | | | | 800 | | | | 0.436 | % | | | 23,293 | | | | (866 | ) | | | 24,159 | | | Barclays Bank PLC |
Republic of Colombia (D04) | | | 12/20/24 | | | | 1.000%(Q) | | | | 2,000 | | | | 0.818 | % | | | 20,202 | | | | (2,166 | ) | | | 22,368 | | | Barclays Bank PLC |
Republic of Indonesia (D04) | | | 12/20/24 | | | | 1.000%(Q) | | | | 3,200 | | | | 0.957 | % | | | 40,442 | | | | (3,465 | ) | | | 43,907 | | | Barclays Bank PLC |
Republic of Lebanon (D04) | | | 12/20/24 | | | | 1.000%(Q) | | | | 800 | | | | 18.956 | % | | | (363,561 | ) | | | (866 | ) | | | (362,695 | ) | | Barclays Bank PLC |
Republic of Panama (D04) | | | 12/20/24 | | | | 1.000%(Q) | | | | 800 | | | | 0.502 | % | | | 20,661 | | | | (866 | ) | | | 21,527 | | | Barclays Bank PLC |
Republic of Peru (D04) | | | 12/20/24 | | | | 1.000%(Q) | | | | 800 | | | | 0.530 | % | | | 19,564 | | | | (866 | ) | | | 20,430 | | | Barclays Bank PLC |
See Notes to Financial Statements.
| | | | |
| PGIM Absolute Return Bond Fund | | | 103 | |
Schedule of Investments(continued)
as of October 31, 2019
Credit default swap agreements outstanding at October 31, 2019 (continued):
| | | | | | | | | | | | | | | | | | | | | | | | | | | | | | |
Reference
Entity/
Obligation | | Termination
Date | | | Fixed
Rate | | | Notional
Amount
(000)#(3) | | | Implied
Credit
Spread at
October 31,
2019(4) | | | Fair
Value | | | Upfront
Premiums
Paid
(Received) | | | Unrealized
Appreciation
(Depreciation) | | | Counterparty |
OTC Packaged Credit Default Swap Agreements on corporate and/or sovereign issues—Sell Protection(2)* (cont’d.): |
Republic of Philippines (D04) | | | 12/20/24 | | | | 1.000%(Q) | | | | 800 | | | | 0.508 | % | | $ | 24,459 | | | $ | (866 | ) | | $ | 25,325 | | | Barclays Bank PLC |
Republic of South Africa (D04) | | | 12/20/24 | | | | 1.000%(Q) | | | | 3,600 | | | | 1.857 | % | | | (147,222 | ) | | | (3,898 | ) | | | (143,324 | ) | | Barclays Bank PLC |
Republic of Turkey (D04) | | | 12/20/24 | | | | 1.000%(Q) | | | | 4,800 | | | | 3.341 | % | | | (505,866 | ) | | | (5,197 | ) | | | (500,669 | ) | | Barclays Bank PLC |
Russian Federation (D04) | | | 12/20/24 | | | | 1.000%(Q) | | | | 3,200 | | | | 0.756 | % | | | 40,969 | | | | (3,465 | ) | | | 44,434 | | | Barclays Bank PLC |
State of Qatar (D04) | | | 12/20/24 | | | | 1.000%(Q) | | | | 800 | | | | 0.467 | % | | | 22,083 | | | | (866 | ) | | | 22,949 | | | Barclays Bank PLC |
United Mexican States (D04) | | | 12/20/24 | | | | 1.000%(Q) | | | | 4,800 | | | | 0.927 | % | | | 22,871 | | | | (5,197 | ) | | | 28,068 | | | Barclays Bank PLC |
| | | | | | | | | | | | | | | | | | | | | | | | | | | | | | |
| | | | | | | | | | | | | | | | | | $ | (11,010,900 | ) | | $ | (312,737 | ) | | $ | (10,698,163 | ) | | |
| | | | | | | | | | | | | | | | | | | | | | | | | | | | | | |
| | | | | | | | | | | | | | | | | | | | | | | | | | |
Reference Entity/ Obligation | | Termination
Date | | | Fixed
Rate | | | Notional
Amount
(000)#(3) | | | Fair
Value | | | Upfront
Premiums
Paid
(Received) | | | Unrealized
Appreciation
(Depreciation) | | | Counterparty |
OTC Packaged Credit Default Swap Agreements on credit indices—Buy Protection(1)*: |
CDX.EM.29.V1 (D01) | | | 06/20/23 | | | | 1.000%(Q) | | | | 125,000 | | | $ | 3,286,437 | | | $ | (29,191 | ) | | $ | 3,315,628 | | | Barclays Bank PLC |
CDX.EM.29.V1 (D02) | | | 06/20/23 | | | | 1.000%(Q) | | | | 100,000 | | | | 2,629,150 | | | | 1,865 | | | | 2,627,285 | | | Citibank, N.A. |
CDX.EM.32.V1 (D03) | | | 12/20/24 | | | | 1.000%(Q) | | | | 50,000 | | | | 2,261,777 | | | | (50,713 | ) | | | 2,312,490 | | | Barclays Bank PLC |
CDX.EM.32.V1 (D04) | | | 12/20/24 | | | | 1.000%(Q) | | | | 40,000 | | | | 1,809,421 | | | | (34,426 | ) | | | 1,843,847 | | | Barclays Bank PLC |
| | | | | | | | | | | | | | | | | | | | | | | | | | |
| | | | | | | | | | | | | | $ | 9,986,785 | | | $ | (112,465 | ) | | $ | 10,099,250 | | | |
| | | | | | | | | | | | | | | | | | | | | | | | | | |
| * | The Fund entered into multiple credit default swap agreements in a packaged trade consisting of two parts. The Fund bought/sold protection on an Emerging Market CDX Index and bought/sold protection on the countries which comprise the index. The up-front premium is attached to the index of the trade. Each swap is priced individually. If any of the component swaps are closed out early, the Index exposure will be reduced by an amount proportionate to the terminated swap(s). Individual packages in the tables above are denoted by the corresponding footnotes (D01—D04). |
See Notes to Financial Statements.
Credit default swap agreements outstanding at October 31, 2019 (continued):
| | | | | | | | | | | | | | | | | | | | | | | | | | | | | | |
Reference
Entity/
Obligation | | Termination
Date | | | Fixed
Rate | | | Notional
Amount
(000)#(3) | | | Implied
Credit
Spread at
October 31,
2019(4) | | | Fair
Value | | | Upfront
Premiums
Paid
(Received) | | | Unrealized
Appreciation
(Depreciation) | | | Counterparty |
OTC Credit Default Swap Agreements on asset-backed securities—Sell Protection(2)^: |
American Money Management Corporation | | | 11/26/19 | | | | 1.000%(M) | | | | 296 | | | | * | | | $ | 222 | | | $ | — | | | $ | 222 | | | Goldman Sachs International |
Anchorage CLO | | | 11/26/19 | | | | 0.500%(M) | | | EUR | 695 | | | | * | | | | 323 | | | | — | | | | 323 | | | Goldman Sachs International |
Anchorage CLO | | | 11/26/19 | | | | 1.000%(M) | | | EUR | 662 | | | | * | | | | 615 | | | | — | | | | 615 | | | Goldman Sachs International |
AXA CLO | | | 11/26/19 | | | | 0.500%(M) | | | EUR | 347 | | | | * | | | | 161 | | | | — | | | | 161 | | | Goldman Sachs International |
Bardin Hill Loan Advisors European Funding | | | 11/26/19 | | | | 1.000%(M) | | | EUR | 409 | | | | * | | | | 379 | | | | — | | | | 379 | | | Goldman Sachs International |
Barings CLO | | | 11/26/19 | | | | 1.000%(M) | | | | 48 | | | | * | | | | 36 | | | | — | | | | 36 | | | Goldman Sachs International |
Bear Stearns Asset Backed Securities Trust | | | 11/27/19 | | | | 1.250%(M) | | | | 1,316 | | | | * | | | | 1,278 | | | | — | | | | 1,278 | | | Goldman Sachs International |
Bear Stearns Asset Backed Securities Trust | | | 11/27/19 | | | | 1.250%(M) | | | | 736 | | | | * | | | | 715 | | | | — | | | | 715 | | | Goldman Sachs International |
BlueMountain CLO | | | 11/26/19 | | | | 1.000%(M) | | | | 140 | | | | * | | | | 105 | | | | — | | | | 105 | | | Goldman Sachs International |
Cairn CLO BV | | | 11/26/19 | | | | 1.000%(M) | | | EUR | 340 | | | | * | | | | 316 | | | | — | | | | 316 | | | Goldman Sachs International |
Canyon CLO | | | 11/26/19 | | | | 0.500%(M) | | | | 99 | | | | * | | | | 37 | | | | — | | | | 37 | | | Goldman Sachs International |
CIFC CLO | | | 11/26/19 | | | | 1.000%(M) | | | | 106 | | | | * | | | | 79 | | | | — | | | | 79 | | | Goldman Sachs International |
Citigroup Commercial Mortgage Trust | | | 11/26/19 | | | | 1.250%(M) | | | | 594 | | | | * | | | | 597 | | | | — | | | | 597 | | | Goldman Sachs International |
See Notes to Financial Statements.
| | | | |
| PGIM Absolute Return Bond Fund | | | 105 | |
Schedule of Investments(continued)
as of October 31, 2019
Credit default swap agreements outstanding at October 31, 2019 (continued):
| | | | | | | | | | | | | | | | | | | | | | | | | | | | | | |
Reference
Entity/
Obligation | | Termination
Date | | | Fixed
Rate | | | Notional
Amount
(000)#(3) | | | Implied
Credit
Spread at
October 31,
2019(4) | | | Fair
Value | | | Upfront
Premiums
Paid
(Received) | | | Unrealized
Appreciation
(Depreciation) | | | Counterparty |
OTC Credit Default Swap Agreements on asset-backed securities—Sell Protection(2)^ (cont’d.): |
Citigroup Commercial Mortgage Trust | | | 11/26/19 | | | | 1.250%(M) | | | | 377 | | | | 6.940 | % | | $ | 379 | | | $ | — | | | $ | 379 | | | Goldman Sachs International |
Citigroup Commercial Mortgage Trust | | | 11/26/19 | | | | 1.250%(M) | | | | 346 | | | | * | | | | 348 | | | | — | | | | 348 | | | Goldman Sachs International |
Citigroup Commercial Mortgage Trust | | | 11/26/19 | | | | 1.250%(M) | | | | 202 | | | | 4.670 | % | | | 203 | | | | — | | | | 203 | | | Goldman Sachs International |
COMM Mortgage Trust | | | 11/26/19 | | | | 1.250%(M) | | | | 692 | | | | * | | | | 696 | | | | — | | | | 696 | | | Goldman Sachs International |
COMM Mortgage Trust | | | 11/26/19 | | | | 1.250%(M) | | | | 546 | | | | 19.740 | % | | | 550 | | | | — | | | | 550 | | | Goldman Sachs International |
COMM Mortgage Trust | | | 11/26/19 | | | | 1.250%(M) | | | | 507 | | | | * | | | | 510 | | | | — | | | | 510 | | | Goldman Sachs International |
COMM Mortgage Trust | | | 11/26/19 | | | | 1.250%(M) | | | | 392 | | | | * | | | | 394 | | | | — | | | | 394 | | | Goldman Sachs International |
COMM Mortgage Trust | | | 11/26/19 | | | | 1.250%(M) | | | | 364 | | | | 6.940 | % | | | 366 | | | | — | | | | 366 | | | Goldman Sachs International |
COMM Mortgage Trust | | | 11/26/19 | | | | 1.250%(M) | | | | 246 | | | | 7.460 | % | | | 248 | | | | — | | | | 248 | | | Goldman Sachs International |
Commerzbank CLO | | | 11/26/19 | | | | 1.000%(M) | | |
| EUR
338 |
| | | * | | | | 314 | | | | — | | | | 314 | | | Goldman Sachs International |
Connecticut Avenue Securities | | | 11/27/19 | | | | 1.250%(M) | | | | 2,810 | | | | * | | | | 2,729 | | | | — | | | | 2,729 | | | Goldman Sachs International |
Connecticut Avenue Securities | | | 11/27/19 | | | | 1.250%(M) | | | | 1,858 | | | | * | | | | 1,805 | | | | — | | | | 1,805 | | | Goldman Sachs International |
CSAM CLO | | | 11/26/19 | | | | 1.000%(M) | | | | 92 | | | | * | | | | 69 | | | | — | | | | 69 | | | Goldman Sachs International |
See Notes to Financial Statements.
Credit default swap agreements outstanding at October 31, 2019 (continued):
| | | | | | | | | | | | | | | | | | | | | | | | | | | | | | |
Reference
Entity/
Obligation | | Termination
Date | | | Fixed
Rate | | | Notional
Amount
(000)#(3) | | | Implied
Credit
Spread at
October 31,
2019(4) | | | Fair
Value | | | Upfront
Premiums
Paid
(Received) | | | Unrealized
Appreciation
(Depreciation) | | | Counterparty |
OTC Credit Default Swap Agreements on asset-backed securities—Sell Protection(2)^ (cont’d.): |
DFG CLO | | | 11/26/19 | | | | 1.000%(M) | | | | 82 | | | | * | | | $ | 61 | | | $ | — | | | $ | 61 | | | Goldman Sachs International |
Ellington CLO | | | 11/26/19 | | | | 1.000%(M) | | | | 1,660 | | | | * | | | | 1,244 | | | | — | | | | 1,244 | | | Goldman Sachs International |
Equity One Home Equity | | | 11/27/19 | | | | 1.250%(M) | | | | 486 | | | | * | | | | 472 | | | | — | | | | 472 | | | Goldman Sachs International |
Fannie Mae Connecticut Avenue Securities | | | 11/27/19 | | | | 1.250%(M) | | | | 1,716 | | | | * | | | | 1,666 | | | | — | | | | 1,666 | | | Goldman Sachs International |
Fannie Mae Connecticut Avenue Securities | | | 11/27/19 | | | | 1.250%(M) | | | | 994 | | | | * | | | | 965 | | | | — | | | | 965 | | | Goldman Sachs International |
Fannie Mae Connecticut Avenue Securities | | | 11/27/19 | | | | 1.250%(M) | | | | 697 | | | | * | | | | 677 | | | | — | | | | 677 | | | Goldman Sachs International |
Fannie Mae Connecticut Avenue Securities | | | 11/27/19 | | | | 1.250%(M) | | | | 423 | | | | * | | | | 411 | | | | — | | | | 411 | | | Goldman Sachs International |
Freddie Mac | | | 11/27/19 | | | | 1.250%(M) | | | | 753 | | | | * | | | | 731 | | | | — | | | | 731 | | | Goldman Sachs International |
GMAC Home Equity | | | 11/27/19 | | | | 1.250%(M) | | | | 314 | | | | * | | | | 305 | | | | — | | | | 305 | | | Goldman Sachs International |
GMAC Home Equity | | | 11/27/19 | | | | 1.250%(M) | | | | 294 | | | | * | | | | 286 | | | | — | | | | 286 | | | Goldman Sachs International |
GS Mortgage Securities Trust | | | 11/26/19 | | | | 1.250%(M) | | | | 328 | | | | 7.460 | % | | | 330 | | | | — | | | | 330 | | | Goldman Sachs International |
GS Mortgage Securities Trust | | | 11/26/19 | | | | 1.250%(M) | | | | 317 | | | | * | | | | 318 | | | | — | | | | 318 | | | Goldman Sachs International |
GSO CLO | | | 11/26/19 | | | | 1.000%(M) | | | | 145 | | | | * | | | | 109 | | | | — | | | | 109 | | | Goldman Sachs International |
See Notes to Financial Statements.
| | | | |
| PGIM Absolute Return Bond Fund | | | 107 | |
Schedule of Investments(continued)
as of October 31, 2019
Credit default swap agreements outstanding at October 31, 2019 (continued):
| | | | | | | | | | | | | | | | | | | | | | | | | | | | | | |
Reference Entity/
Obligation | | Termination
Date | | | Fixed
Rate | | | Notional
Amount
(000)#(3) | | | Implied
Credit
Spread at
October 31,
2019(4) | | | Fair
Value | | | Upfront
Premiums
Paid
(Received) | | | Unrealized
Appreciation
(Depreciation) | | | Counterparty |
OTC Credit Default Swap Agreements on asset-backed securities—Sell Protection(2)^ (cont’d.): |
GSR Mortgage Loan Trust | | | 11/27/19 | | | | 1.250%(M) | | | | 546 | | | | * | | | $ | 530 | | | $ | — | | | $ | 530 | | | Goldman Sachs International |
ICG CLO | | | 11/26/19 | | | | 0.500%(M) | | | | 246 | | | | * | | | | 7 | | | | — | | | | 7 | | | Goldman Sachs International |
Invesco CLO | | | 11/26/19 | | | | 0.500%(M) | | | | 108 | | | | * | | | | 40 | | | | — | | | | 40 | | | Goldman Sachs International |
JPMBB Commercial Mortgage Securities Trust | | | 11/26/19 | | | | 1.250%(M) | | | | 877 | | | | 8.827 | % | | | 882 | | | | — | | | | 882 | | | Goldman Sachs International |
JPMBB Commercial Mortgage Securities Trust | | | 11/26/19 | | | | 1.250%(M) | | | | 555 | | | | * | | | | 559 | | | | — | | | | 559 | | | Goldman Sachs International |
JPMorgan Chase Commercial Mortgage Securities | | | 11/26/19 | | | | 1.250%(M) | | | | 323 | | | | * | | | | 325 | | | | — | | | | 325 | | | Goldman Sachs International |
JPMorgan Chase Commercial Mortgage Securities | | | 11/26/19 | | | | 1.250%(M) | | | | 120 | | | | * | | | | 121 | | | | — | | | | 121 | | | Goldman Sachs International |
LCM CLO | | | 11/26/19 | | | | 1.000%(M) | | | | 93 | | | | * | | | | 69 | | | | — | | | | 69 | | | Goldman Sachs International |
Lehman Home Equity | | | 11/27/19 | | | | 1.250%(M) | | | | 259 | | | | * | | | | 251 | | | | — | | | | 251 | | | Goldman Sachs International |
MJX CLO | | | 11/26/19 | | | | 0.500%(M) | | | | 115 | | | | * | | | | 43 | | | | — | | | | 43 | | | Goldman Sachs International |
Morgan Stanley Home Equity | | | 11/27/19 | | | | 1.250%(M) | | | | 297 | | | | * | | | | 288 | | | | — | | | | 288 | | | Goldman Sachs International |
Oak Hill CLO | | | 11/26/19 | | | | 1.000%(M) | | | EUR | 388 | | | | * | | | | 360 | | | | — | | | | 360 | | | Goldman Sachs International |
Och-Ziff CLO | | | 11/26/19 | | | | 0.500%(M) | | | | 305 | | | | * | | | | 114 | | | | — | | | | 114 | | | Goldman Sachs International |
See Notes to Financial Statements.
Credit default swap agreements outstanding at October 31, 2019 (continued):
| | | | | | | | | | | | | | | | | | | | | | | | | | | | | | |
Reference Entity/ Obligation | | Termination
Date | | | Fixed
Rate | | | Notional
Amount
(000)#(3) | | | Implied
Credit
Spread at
October 31,
2019(4) | | | Fair
Value | | | Upfront
Premiums
Paid
(Received) | | | Unrealized
Appreciation
(Depreciation) | | | Counterparty |
OTC Credit Default Swap Agreements on asset-backed securities—Sell Protection(2)^ (cont’d.): |
Octagon CLO | | | 11/26/19 | | | | 1.000%(M) | | | | 24 | | | | * | | | $ | 18 | | | $ | — | | | $ | 18 | | | Goldman Sachs International |
Octagon Investment Partners XV Ltd. | | | 11/26/19 | | | | 1.000%(M) | | | | 200 | | | | * | | | | 150 | | | | — | | | | 150 | | | Goldman Sachs International |
Palmer Square CLO | | | 11/26/19 | | | | 0.500%(M) | | | | 138 | | | | * | | | | 52 | | | | — | | | | 52 | | | Goldman Sachs International |
PineBridge CLO | | | 11/26/19 | | | | 0.500%(M) | | | | 83 | | | | * | | | | 31 | | | | — | | | | 31 | | | Goldman Sachs International |
Shenkman Capital | | | 11/26/19 | | | | 1.000%(M) | | | | 51 | | | | * | | | | 38 | | | | — | | | | 38 | | | Goldman Sachs International |
Sound Point CLO Ltd. | | | 11/26/19 | | | | 0.500%(M) | | | | 697 | | | | * | | | | 261 | | | | — | | | | 261 | | | Goldman Sachs International |
Sound Point CLO Ltd. | | | 11/26/19 | | | | 0.500%(M) | | | | 335 | | | | * | | | | 125 | | | | — | | | | 125 | | | Goldman Sachs International |
Sound Point CLO Ltd. | | | 11/26/19 | | | | 1.000%(M) | | | | 326 | | | | * | | | | 244 | | | | — | | | | 244 | | | Goldman Sachs International |
Sound Point CLO Ltd. | | | 11/26/19 | | | | 1.000%(M) | | | | 53 | | | | * | | | | 39 | | | | — | | | | 39 | | | Goldman Sachs International |
Steele Creek | | | 11/26/19 | | | | 1.000%(M) | | | | 249 | | | | * | | | | 187 | | | | — | | | | 187 | | | Goldman Sachs International |
Structured Agency Credit Risk | | | 11/27/19 | | | | 1.250%(M) | | | | 1,825 | | | | * | | | | 1,773 | | | | — | | | | 1,773 | | | Goldman Sachs International |
Structured Agency Credit Risk | | | 11/27/19 | | | | 1.250%(M) | | | | 908 | | | | * | | | | 882 | | | | — | | | | 882 | | | Goldman Sachs International |
Structured Agency Credit Risk | | | 11/27/19 | | | | 1.250%(M) | | | | 841 | | | | * | | | | 817 | | | | — | | | | 817 | | | Goldman Sachs International |
See Notes to Financial Statements.
| | | | |
| PGIM Absolute Return Bond Fund | | | 109 | |
Schedule of Investments(continued)
as of October 31, 2019
Credit default swap agreements outstanding at October 31, 2019 (continued):
| | | | | | | | | | | | | | | | | | | | | | | | | | | | | | |
Reference Entity/
Obligation | | Termination
Date | | | Fixed
Rate | | | Notional
Amount
(000)#(3) | | | Implied
Credit
Spread at
October 31,
2019(4) | | | Fair
Value | | | Upfront
Premiums
Paid
(Received) | | | Unrealized
Appreciation
(Depreciation) | | | Counterparty |
OTC Credit Default Swap Agreements on asset-backed securities—Sell Protection(2)^ (cont’d.): |
THL CLO | | | 11/26/19 | | | | 0.500%(M) | | | | 140 | | | | * | | | $ | 53 | | | $ | — | | | $ | 53 | | | Goldman Sachs International |
Voya CLO | | | 11/26/19 | | | | 1.000%(M) | | | | 241 | | | | * | | | | 180 | | | | — | | | | 180 | | | Goldman Sachs International |
WellFleet CLO | | | 11/26/19 | | | | 0.500%(M) | | | | 208 | | | | * | | | | 78 | | | | — | | | | 78 | | | Goldman Sachs International |
Wells Fargo Commercial Mortgage Trust | | | 11/26/19 | | | | 1.250%(M) | | | | 1,066 | | | | * | | | | 1,072 | | | | — | | | | 1,072 | | | Goldman Sachs International |
Wells Fargo Commercial Mortgage Trust | | | 11/26/19 | | | | 1.250%(M) | | | | 199 | | | | * | | | | 200 | | | | — | | | | 200 | | | Goldman Sachs International |
| | | | | | | | | | | | | | | | | | | | | | | | | | | | | | |
| | | | | | | | | | | | | | | | | | $ | 30,838 | | | $ | — | | | $ | 30,838 | | | |
| | | | | | | | | | | | | | | | | | | | | | | | | | | | | | |
| | | | | | | | | | | | | | | | | | | | | | | | | | |
Reference Entity/ Obligation | | Termination
Date | | | Fixed
Rate | | | Notional
Amount
(000)#(3) | | | Fair
Value | | | Upfront
Premiums
Paid
(Received) | | | Unrealized
Appreciation
(Depreciation) | | | Counterparty |
OTC Credit Default Swap Agreements on corporate and/or sovereign issues—Buy Protection(1): |
Hellenic Republic | | | 12/20/19 | | | | 1.000%(Q) | | | | 20,000 | | | $ | (43,070 | ) | | $ | 14,624 | | | $ | (57,694 | ) | | Bank of America, N.A. |
Hellenic Republic | | | 06/20/23 | | | | 1.000%(Q) | | | | 1,000 | | | | (1,555 | ) | | | 72,272 | | | | (73,827 | ) | | Bank of America, N.A. |
Kingdom of Spain | | | 06/20/23 | | | | 1.000%(Q) | | | | 4,400 | | | | (135,502 | ) | | | (81,397 | ) | | | (54,105 | ) | | Bank of America, N.A. |
Republic of Argentina | | | 06/20/21 | | | | 5.000%(Q) | | | | 3,315 | | | | 1,935,532 | | | | 1,275,853 | | | | 659,679 | | | Morgan Stanley & Co. International PLC |
Republic of Argentina | | | 06/20/21 | | | | 5.000%(Q) | | | | 1,450 | | | | 846,613 | | | | 570,189 | | | | 276,424 | | | Barclays Bank PLC |
Republic of Argentina | | | 06/20/22 | | | | 5.000%(Q) | | | | 1,200 | | | | 790,216 | | | | 659,412 | | | | 130,804 | | | Citibank, N.A. |
Republic of Italy | | | 06/20/23 | | | | 1.000%(Q) | | | | 4,000 | | | | (61,882 | ) | | | 45,880 | | | | (107,762 | ) | | Bank of America, N.A. |
United Mexican States | | | 06/20/23 | | | | 1.000%(Q) | | | | 1,400 | | | | (20,279 | ) | | | 6,475 | | | | (26,754 | ) | | Citibank, N.A. |
United Mexican States | | | 06/20/23 | | | | 1.000%(Q) | | | | 1,385 | | | | (20,062 | ) | | | 15,895 | | | | (35,957 | ) | | Citibank, N.A. |
United Mexican States | | | 06/20/23 | | | | 1.000%(Q) | | | | 460 | | | | (6,663 | ) | | | 5,922 | | | | (12,585 | ) | | Citibank, N.A. |
United Mexican States | | | 06/20/23 | | | | 1.000%(Q) | | | | 460 | | | | (6,664 | ) | | | 5,428 | | | | (12,092 | ) | | Citibank, N.A. |
United Mexican States | | | 06/20/23 | | | | 1.000%(Q) | | | | 455 | | | | (6,591 | ) | | | 1,956 | | | | (8,547 | ) | | Citibank, N.A. |
United Mexican States | | | 06/20/23 | | | | 1.000%(Q) | | | | 240 | | | | (3,476 | ) | | | 1,110 | | | | (4,586 | ) | | Citibank, N.A. |
United Mexican States | | | 12/20/24 | | | | 1.000%(Q) | | | | 440 | | | | (2,096 | ) | | | 3,186 | | | | (5,282 | ) | | Citibank, N.A. |
| | | | | | | | | | | | | | | | | | | | | | | | | | |
| | | | | | | | | | | | | | $ | 3,264,521 | | | $ | 2,596,805 | | | $ | 667,716 | | | |
| | | | | | | | | | | | | | | | | | | | | | | | | | |
See Notes to Financial Statements.
Credit default swap agreements outstanding at October 31, 2019 (continued):
| | | | | | | | | | | | | | | | | | | | | | | | | | | | | | |
Reference Entity/
Obligation | | Termination
Date | | | Fixed
Rate | | | Notional
Amount
(000)#(3) | | | Implied
Credit
Spread at
October 31,
2019(4) | | | Fair
Value | | | Upfront
Premiums
Paid
(Received) | | | Unrealized
Appreciation
(Depreciation) | | | Counterparty |
OTC Credit Default Swap Agreements on corporate and/or sovereign issues—Sell Protection(2): |
AT&T Inc. | | | 06/20/20 | | | | 1.000%(Q) | | | | 5,000 | | | | 0.146 | % | | $ | 33,212 | | | $ | 27,546 | | | $ | 5,666 | | | BNP Paribas S.A. |
Hellenic Republic | | | 06/20/23 | | | | 1.000%(Q) | | | | 1,000 | | | | 1.188 | % | | | (5,390 | ) | | | (90,160 | ) | | | 84,770 | | | Bank of America, N.A. |
Hellenic Republic | | | 12/20/23 | | | | 1.000%(Q) | | | | 10,000 | | | | 1.318 | % | | | (113,184 | ) | | | (1,078,723 | ) | | | 965,539 | | | Bank of America, N.A. |
Hellenic Republic | | | 06/20/24 | | | | 1.000%(Q) | | | | 1,000 | | | | 1.456 | % | | | (18,673 | ) | | | (188,814 | ) | | | 170,141 | | | Barclays Bank PLC |
Hellenic Republic | | | 12/20/25 | | | | 1.000%(Q) | | | | 10,000 | | | | 1.756 | % | | | (408,604 | ) | | | (1,631,034 | ) | | | 1,222,430 | | | Bank of America, N.A. |
Hellenic Republic | | | 12/20/25 | | | | 1.000%(Q) | | | | 3,700 | | | | 1.756 | % | | | (151,183 | ) | | | (603,698 | ) | | | 452,515 | | | Bank of America, N.A. |
Kingdom of Saudi Arabia | | | 06/20/24 | | | | 1.000%(Q) | | | | 885 | | | | 0.634 | % | | | 15,525 | | | | 3,767 | | | | 11,758 | | | Morgan Stanley &Co. International PLC |
Kingdom of Spain | | | 06/20/23 | | | | 1.000%(Q) | | | | 4,400 | | | | 0.256 | % | | | 121,648 | | | | 56,229 | | | | 65,419 | | | Bank of America, N.A. |
Petroleo Brasileiro SA | | | 03/20/20 | | | | 1.000%(Q) | | | | 2,180 | | | | 0.224 | % | | | 9,123 | | | | 5,073 | | | | 4,050 | | | Credit Suisse International |
Petroleos Mexicanos | | | 06/20/23 | | | | 1.000%(Q) | | | | 9,450 | | | | 1.918 | % | | | (289,616 | ) | | | (1,033,289 | ) | | | 743,673 | | | BNP Paribas S.A. |
Petroleos Mexicanos | | | 06/20/23 | | | | 1.000%(Q) | | | | 1,165 | | | | 1.918 | % | | | (35,704 | ) | | | (54,333 | ) | | | 18,629 | | | Citibank, N.A. |
Petroleos Mexicanos | | | 06/20/23 | | | | 1.000%(Q) | | | | 1,155 | | | | 1.918 | % | | | (35,397 | ) | | | (64,660 | ) | | | 29,263 | | | Citibank, N.A. |
Petroleos Mexicanos | | | 06/20/23 | | | | 1.000%(Q) | | | | 385 | | | | 1.918 | % | | | (11,799 | ) | | | (22,088 | ) | | | 10,289 | | | Citibank, N.A. |
Petroleos Mexicanos | | | 06/20/23 | | | | 1.000%(Q) | | | | 385 | | | | 1.918 | % | | | (11,799 | ) | | | (21,687 | ) | | | 9,888 | | | Citibank, N.A. |
Petroleos Mexicanos | | | 06/20/23 | | | | 1.000%(Q) | | | | 380 | | | | 1.918 | % | | | (11,646 | ) | | | (17,806 | ) | | | 6,160 | | | Citibank, N.A. |
Petroleos Mexicanos | | | 06/20/23 | | | | 1.000%(Q) | | | | 195 | | | | 1.918 | % | | | (5,976 | ) | | | (9,089 | ) | | | 3,113 | | | Citibank, N.A. |
Petroleos Mexicanos | | | 12/20/24 | | | | 1.000%(Q) | | | | 440 | | | | 2.529 | % | | | (31,160 | ) | | | (42,669 | ) | | | 11,509 | | | Citibank, N.A. |
Republic of Argentina | | | 06/20/24 | | | | 5.000%(Q) | | | | 3,315 | | | | 96.813 | % | | | (2,015,090 | ) | | | (1,528,021 | ) | | | (487,069 | ) | | Morgan Stanley &Co. International PLC |
See Notes to Financial Statements.
| | | | |
| PGIM Absolute Return Bond Fund | | | 111 | |
Schedule of Investments(continued)
as of October 31, 2019
Credit default swap agreements outstanding at October 31, 2019 (continued):
| | | | | | | | | | | | | | | | | | | | | | | | | | | | |
Reference Entity/ Obligation | | Termination
Date | | | Fixed
Rate | | | Notional
Amount
(000)#(3) | | | Implied
Credit
Spread at
October 31,
2019(4) | | | Fair
Value | | | Upfront
Premiums
Paid
(Received) | | | Unrealized Appreciation (Depreciation) | | Counterparty |
OTC Credit Default Swap Agreements on corporate and/or sovereign issues—Sell Protection(2)(cont’d.): |
Republic of Argentina | | | 06/20/24 | | | | 5.000%(Q) | | | | 1,450 | | | | 96.813 | % | | $ | (881,412 | | | $ | (681,903 | ) | | $(199,509) | | Barclays Bank PLC |
Republic of Argentina | | | 06/20/24 | | | | 5.000%(Q) | | | | 1,200 | | | | 106.194 | % | | | (804,686 | ) | | | (688,085 | ) | | (116,601) | | Citibank, N.A. |
Republic of Brazil | | | 12/20/19 | | | | 1.000%(Q) | | | | 2,665 | | | | 0.293 | % | | | 5,712 | | | | 2,546 | | | 3,166 | | HSBC Bank USA, N.A. |
Republic of Indonesia | | | 09/20/20 | | | | 1.000%(Q) | | | | 8,000 | | | | 0.131 | % | | | 71,340 | | | | (183,199 | ) | | 254,539 | | Barclays Bank PLC |
Republic of Italy | | | 06/20/23 | | | | 1.000%(Q) | | | | 4,000 | | | | 0.888 | % | | | 20,416 | | | | (177,893 | ) | | 198,309 | | Bank of America, N.A. |
Republic of Korea | | | 12/20/19 | | | | 1.000%(Q) | | | | 4,610 | | | | 0.118 | % | | | 11,000 | | | | 5,544 | | | 5,456 | | Citibank, N.A. |
Republic of Serbia | | | 06/20/21 | | | | 1.000%(Q) | | | | 5,000 | | | | 0.208 | % | | | 70,342 | | | | 52,624 | | | 17,718 | | BNP Paribas S.A. |
T-Mobile USA, Inc. | | | 12/20/19 | | | | 5.000%(Q) | | | | 6,585 | | | | 0.144 | % | | | 82,613 | | | | 43,342 | | | 39,271 | | Credit Suisse International |
United Mexican States | | | 12/20/20 | | | | 1.000%(Q) | | | | 7,000 | | | | 0.262 | % | | | 66,976 | | | | (77,813 | ) | | 144,789 | | Goldman Sachs International |
| | | | | | | | | | | | | | | | | | | | | | | | | | | | |
| | | | | | | | | | | | | | | | | | $ | (4,323,412 | ) | | $ | (7,998,293 | ) | | $3,674,881 | | |
| | | | | | | | | | | | | | | | | | | | | | | | | | | | |
| | | | | | | | | | | | | | | | | | | | | | | | |
Reference Entity/ Obligation | | Termination
Date | | | Fixed
Rate | | | Notional
Amount
(000)#(3) | | | Value at
Trade
Date | | | Value at
October 31,
2019 | | | Unrealized
Appreciation
(Depreciation) | |
Centrally Cleared Credit Default Swap Agreement on credit indices—Buy Protection(1): | |
CDX.NA.IG.33.V1 | | | 12/20/29 | | | | 1.000%(Q) | | | | 107,375 | | | $ | 441,302 | | | $ | 174,235 | | | $ | (267,067 | ) |
| | | | | | | | | | | | | | | | | | | | | | | | |
| | | | | | | | | | | | | | | | | | | | | | | | | | | | | | |
Reference Entity/ Obligation | | Termination
Date | | | Fixed
Rate | | | Notional
Amount
(000)#(3) | | | Implied Credit
Spread at
October 31,
2019(4) | | | Fair
Value | | | Upfront
Premiums
Paid
(Received) | | | Unrealized
Appreciation
(Depreciation) | | | Counterparty |
OTC Credit Default Swap Agreements on credit indices—Sell Protection(2): |
CMBX.NA.6.AA | | | 05/11/63 | | | | 1.500%(M) | | | | 10,000 | | | | * | | | $ | 207,358 | | | $ | 110,696 | | | $ | 96,662 | | | Deutsche Bank AG |
CMBX.NA.6.AA | | | 05/11/63 | | | | 1.500%(M) | | | | 2,000 | | | | * | | | | 41,472 | | | | (65,457 | ) | | | 106,929 | | | JPMorgan Securities LLC |
| | | | | | | | | | | | | | | | | | | | | | | | | | | | | | |
| | | | | | | | | | | | | | | | | | $ | 248,830 | | | $ | 45,239 | | | $ | 203,591 | | | |
| | | | | | | | | | | | | | | | | | | | | | | | | | | | | | |
See Notes to Financial Statements.
Credit default swap agreements outstanding at October 31, 2019 (continued):
The Fund entered into credit default swaps (“CDS”) to provide a measure of protection against defaults or to take an active long or short position with respect to the likelihood of a particular issuer’s default or the reference entity’s credit soundness. CDS contracts generally trade based on a spread which represents the cost a protection buyer has to pay the protection seller. The protection buyer is said to be short the credit as the value of the contract rises the more the credit deteriorates. The value of the CDS contract increases for the protection buyer if the spread increases.
| (1) | If the Fund is a buyer of protection, it pays the fixed rate. When a credit event occurs, as defined under the terms of that particular swap agreement, the Fund will either (i) receive from the seller of protection an amount equal to the notional amount of the swap and make delivery of the referenced obligation or underlying securities comprising the referenced index or (ii) receive a net settlement amount in the form of cash or securities equal to the notional amount of the swap less the recovery value of the referenced obligation or underlying securities comprising the referenced index. |
| (2) | If the Fund is a seller of protection, it receives the fixed rate. When a credit event occurs, as defined under the terms of that particular swap agreement, the Fund will either (i) pay to the buyer of protection an amount equal to the notional amount of the swap and take delivery of the referenced obligation or underlying securities comprising the referenced index or (ii) pay a net settlement amount in the form of cash or securities equal to the notional amount of the swap less the recovery value of the referenced obligation or underlying securities comprising the referenced index. |
| (3) | Notional amount represents the maximum potential amount the Fund could be required to pay as a seller of credit protection or receive as a buyer of credit protection if a credit event occurs as defined under the terms of that particular swap agreement. |
| (4) | Implied credit spreads, represented in absolute terms, utilized in determining the fair value of credit default swap agreements where the Fund is the seller of protection as of the reporting date serve as an indicator of the current status of the payment/ performance risk and represent the likelihood of risk of default for the credit derivative. The implied credit spread of a particular referenced entity reflects the cost of buying/selling protection and may include up-front payments required to be made to enter into the agreement. Wider credit spreads represent a deterioration of the referenced entity’s credit soundness and a greater likelihood of risk of default or other credit event occurring as defined under the terms of the agreement. |
| * | When an implied credit spread is not available, reference the fair value of credit default swap agreements on credit indices and asset-backed securities. Where the Fund is the seller of protection, it serves as an indicator of the current status of the payment/performance risk and represents the likelihood of an expected liability (or profit) for the credit derivative should the notional amount of the swap agreement be closed/sold as of the reporting date. Increasing fair value in absolute terms, when compared to the notional amount of the swap, represents a deterioration of the referenced entity’s credit soundness and a greater likelihood of risk of default or other credit event occurring as defined under the terms of the agreement. |
See Notes to Financial Statements.
| | | | |
| PGIM Absolute Return Bond Fund | | | 113 | |
Schedule of Investments(continued)
as of October 31, 2019
Interest rate swap agreements outstanding at October 31, 2019:
| | | | | | | | | | | | | | | | | | | | | | | | |
Notional Amount (000)# | | | Termination
Date | | | Fixed
Rate | | Floating Rate | | Value at
Trade
Date | | | Value at
October 31,
2019 | | | Unrealized
Appreciaton
(Depreciation) | |
Centrally Cleared Interest Rate Swap Agreements: | |
| BRL | | | 18,614 | | | | 01/02/25 | | | 6.640%(T) | | 1 Day BROIS(2)(T) | | $ | — | | | $ | 193,710 | | | $ | 193,710 | |
| BRL | | | 21,128 | | | | 01/02/25 | | | 6.670%(T) | | 1 Day BROIS(2)(T) | | | — | | | | 229,735 | | | | 229,735 | |
| BRL | | | 17,000 | | | | 01/04/27 | | | 6.912%(T) | | 1 Day BROIS(2)(T) | | | — | | | | 248,012 | | | | 248,012 | |
| CNH | | | 51,840 | | | | 06/14/24 | | | 2.900%(Q) | | 7 Day China Fixing Repo Rates(2)(Q) | | | 184 | | | | (61,930 | ) | | | (62,114 | ) |
| CNH | | | 147,000 | | | | 06/28/24 | | | 2.901%(Q) | | 7 Day China Fixing Repo Rates(2)(Q) | | | — | | | | (179,263 | ) | | | (179,263 | ) |
| CNH | | | 43,300 | | | | 09/19/24 | | | 2.940%(Q) | | 7 Day China Fixing Repo Rates(2)(Q) | | | (40 | ) | | | (46,917 | ) | | | (46,877 | ) |
| CNH | | | 37,800 | | | | 10/10/24 | | | 2.860%(Q) | | 7 Day China Fixing Repo Rates(2)(Q) | | | (23 | ) | | | (62,821 | ) | | | (62,798 | ) |
| EUR | | | 79,640 | | | | 05/11/20 | | | (0.054)%(A) | | 6 Month EURIBOR(1)(S) | | | (190,612 | ) | | | (209,308 | ) | | | (18,696 | ) |
| EUR | | | 17,665 | | | | 05/11/21 | | | 0.100%(A) | | 6 Month EURIBOR(1)(S) | | | (92,520 | ) | | | (173,354 | ) | | | (80,834 | ) |
| EUR | | | 20,545 | | | | 05/11/22 | | | 0.156%(A) | | 6 Month EURIBOR(1)(S) | | | 43,876 | | | | (342,308 | ) | | | (386,184 | ) |
| EUR | | | 15,410 | | | | 05/11/23 | | | 0.650%(A) | | 6 Month EURIBOR(1)(S) | | | (342,416 | ) | | | (671,995 | ) | | | (329,579 | ) |
| EUR | | | 6,595 | | | | 05/11/33 | | | 1.000%(A) | | 6 Month EURIBOR(1)(S) | | | 395,138 | | | | (842,108 | ) | | | (1,237,246 | ) |
| EUR | | | 3,985 | | | | 05/11/37 | | | 1.253%(A) | | 6 Month EURIBOR(1)(S) | | | 139,351 | | | | (744,004 | ) | | | (883,355 | ) |
| EUR | | | 350 | | | | 05/11/39 | | | 1.100%(A) | | 1 Day EONIA(2)(A) | | | 76,560 | | | | 69,568 | | | | (6,992 | ) |
| EUR | | | 2,955 | | | | 05/11/42 | | | 1.350%(A) | | 6 Month EURIBOR(1)(S) | | | 109,595 | | | | (710,721 | ) | | | (820,316 | ) |
| EUR | | | 475 | | | | 05/11/43 | | | 1.350%(A) | | 6 Month EURIBOR(1)(S) | | | 4,934 | | | | (118,097 | ) | | | (123,031 | ) |
| GBP | | | 3,280 | | | | 05/08/21 | | | 0.716%(S) | | 6 Month GBP LIBOR(1)(S) | | | 39,091 | | | | 8,458 | | | | (30,633 | ) |
| GBP | | | 4,050 | | | | 05/08/24 | | | 0.950%(A) | | 1 Day SONIA(1)(A) | | | (128,381 | ) | | | (108,013 | ) | | | 20,368 | |
| GBP | | | 4,000 | | | | 05/08/26 | | | 1.000%(A) | | 1 Day SONIA(1)(A) | | | (91,874 | ) | | | (167,571 | ) | | | (75,697 | ) |
| GBP | | | 4,465 | | | | 05/08/29 | | | 1.100%(A) | | 1 Day SONIA(1)(A) | | | (300,329 | ) | | | (304,509 | ) | | | (4,180 | ) |
See Notes to Financial Statements.
Interest rate swap agreements outstanding at October 31, 2019 (continued):
| | | | | | | | | | | | | | | | | | | | | | | | | | | | |
Notional Amount (000)# | | | Termination
Date | | | Fixed
Rate | | | Floating Rate | | Value at
Trade
Date | | | Value at
October 31,
2019 | | | Unrealized
Appreciaton
(Depreciation) | |
| | Centrally Cleared Interest Rate Swap Agreements (cont’d.): | | | | | |
| | GBP | | | | 1,100 | | | | 05/08/34 | | | | 1.200%(A) | | | 1 Day SONIA(1)(A) | | $ | (61,374 | ) | | $ | (118,618 | ) | | $ | (57,244 | ) |
| | JPY | | | | 7,870,930 | | | | 12/17/20 | | | | 0.015%(S) | | | 6 Month JPY LIBOR(1)(S) | | | — | | | | (78,656 | ) | | | (78,656 | ) |
| | | | | 238,735 | | | | 02/05/20 | | | | 2.350%(S) | | | 3 Month LIBOR(1)(Q) | | | 50,769 | | | | (229,397 | ) | | | (280,166 | ) |
| | | | | 94,300 | | | | 03/12/20 | | | | 2.405%(T) | | | 1 Day USOIS(2)(T) | | | 362 | | | | 380,641 | | | | 380,279 | |
| | | | | 220,620 | | | | 04/25/20 | | | | 2.328%(T) | | | 1 Day USOIS(2)(T) | | | (3,575 | ) | | | 1,018,807 | | | | 1,022,382 | |
| | | | | 2,337,600 | | | | 05/11/20 | | | | 1.763%(S) | | | 3 Month LIBOR(1)(Q) | | | 41,405,090 | | | | (6,555,209 | ) | | | (47,960,299 | ) |
| | | | | 112,800 | | | | 05/11/21 | | | | 1.600%(S) | | | 3 Month LIBOR(2)(Q) | | | (376,568 | ) | | | 271,605 | | | | 648,173 | |
| | | | | 854,183 | | | | 06/15/21 | | | | 1.830%(S) | | | 3 Month LIBOR(2)(Q) | | | — | | | | 2,846,252 | | | | 2,846,252 | |
| | | | | 250,833 | | | | 09/15/21 | | | | 1.381%(S) | | | 3 Month LIBOR(2)(Q) | | | (352,073 | ) | | | (553,176 | ) | | | (201,103 | ) |
| | | | | 540,245 | | | | 09/15/21 | | | | 1.480%(S) | | | 3 Month LIBOR(2)(Q) | | | 517,187 | | | | (308,157 | ) | | | (825,344 | ) |
| | | | | 387,600 | | | | 09/15/21 | | | | 1.604%(S) | | | 3 Month LIBOR(2)(Q) | | | 1,619,760 | | | | 582,748 | | | | (1,037,012 | ) |
| | | | | 16,120 | | | | 05/31/22 | | | | 2.353%(A) | | | 1 Day USOIS(1)(A) | | | — | | | | (452,530 | ) | | | (452,530 | ) |
| | | | | 11,430 | | | | 08/31/22 | | | | 2.550%(A) | | | 1 Day USOIS(1)(A) | | | 2,236 | | | | (429,742 | ) | | | (431,978 | ) |
| | | | | 10,635 | | | | 08/31/22 | | | | 2.552%(A) | | | 1 Day USOIS(1)(A) | | | — | | | | (400,491 | ) | | | (400,491 | ) |
| | | | | 36,155 | | | | 02/29/24 | | | | 1.520%(S) | | | 3 Month LIBOR(2)(Q) | | | — | | | | 98,257 | | | | 98,257 | |
| | | | | 173,080 | | | | 05/11/24 | | | | 2.139%(S) | | | 3 Month LIBOR(1)(Q) | | | (2,979,826 | ) | | | (5,884,415 | ) | | | (2,904,589 | ) |
| | | | | 13,615 | | | | 08/15/24 | | | | 2.168%(S) | | | 3 Month LIBOR(1)(Q) | | | — | | | | (431,702 | ) | | | (431,702 | ) |
| | | | | 291,235 | | | | 08/15/24 | | | | 2.170%(S) | | | 3 Month LIBOR(1)(Q) | | | 1,162,401 | | | | (9,257,984 | ) | | | (10,420,385 | ) |
| | | | | 89,045 | | | | 08/15/24 | | | | 2.176%(S) | | | 3 Month LIBOR(1)(Q) | | | 307,192 | | | | (2,854,692 | ) | | | (3,161,884 | ) |
| | | | | 36,550 | | | | 09/09/24 | | | | 2.558%(S) | | | 3 Month LIBOR(1)(Q) | | | (584,659 | ) | | | (1,862,676 | ) | | | (1,278,017 | ) |
| | | | | 99,875 | | | | 11/15/24 | | | | 2.334%(S) | | | 3 Month LIBOR(1)(Q) | | | 263,894 | | | | (4,739,500 | ) | | | (5,003,394 | ) |
See Notes to Financial Statements.
| | | | |
| PGIM Absolute Return Bond Fund | | | 115 | |
Schedule of Investments(continued)
as of October 31, 2019
Interest rate swap agreements outstanding at October 31, 2019 (continued):
| | | | | | | | | | | | | | | | | | | | | | | | |
Notional
Amount
(000)# | | | Termination
Date | | | Fixed
Rate | | | Floating Rate | | Value at
Trade
Date | | | Value at
October 31,
2019 | | | Unrealized
Appreciaton
(Depreciation) | |
| | Centrally Cleared Interest Rate Swap Agreements (cont’d.): | | | | | |
| | 4,300 | | | | 02/23/25 | | | | 2.232%(S) | | | 3 Month LIBOR(1)(Q) | | $ | 181 | | | $ | (163,961 | ) | | $ | (164,142 | ) |
| | 44,450 | | | | 02/25/25 | | | | 2.208%(S) | | | 3 Month LIBOR(1)(Q) | | | 453 | | | | (1,641,708 | ) | | | (1,642,161 | ) |
| | 18,415 | | | | 02/28/25 | | | | 2.454%(A) | | | 1 Day USOIS(1)(A) | | | 15,095 | | | | (1,192,032 | ) | | | (1,207,127 | ) |
| | 16,810 | | | | 02/28/25 | | | | 3.019%(S) | | | 3 Month LIBOR(1)(Q) | | | — | | | | (1,345,173 | ) | | | (1,345,173 | ) |
| | 3,370 | | | | 05/11/25 | | | | 1.900%(S) | | | 3 Month LIBOR(1)(Q) | | | 191,039 | | | | (87,416 | ) | | | (278,455 | ) |
| | 2,500 | | | | 05/11/25 | | | | 2.300%(A) | | | 1 Day USOIS(1)(A) | | | (82,382 | ) | | | (144,636 | ) | | | (62,254 | ) |
| | 330,667 | | | | 05/31/25 | | | | 2.998%(S) | | | 3 Month LIBOR(1)(Q) | | | (228,936 | ) | | | (29,768,186 | ) | | | (29,539,250 | ) |
| | 188,411 | | | | 07/31/25 | | | | 3.109%(S) | | | 3 Month LIBOR(1)(Q) | | | 132,018 | | | | (18,338,760 | ) | | | (18,470,778 | ) |
| | 8,715 | | | | 01/31/26 | | | | 2.236%(S) | | | 3 Month LIBOR(1)(Q) | | | — | | | | (433,702 | ) | | | (433,702 | ) |
| | 16,820 | | | | 01/31/26 | | | | 2.269%(A) | | | 1 Day USOIS(1)(A) | | | 24,286 | | | | (1,053,773 | ) | | | (1,078,059 | ) |
| | 14,145 | | | | 03/12/26 | | | | 2.290%(A) | | | 1 Day USOIS(1)(A) | | | 252 | | | | (912,487 | ) | | | (912,739 | ) |
| | 2,250 | | | | 04/30/26 | | | | 1.876%(S) | | | 3 Month LIBOR(1)(Q) | | | (8,196 | ) | | | (52,253 | ) | | | (44,057 | ) |
| | 52,572 | | | | 02/15/27 | | | | 1.824%(A) | | | 1 Day USOIS(1)(A) | | | 667,355 | | | | (1,886,728 | ) | | | (2,554,083 | ) |
| | 53,535 | | | | 02/15/27 | | | | 1.899%(A) | | | 1 Day USOIS(1)(A) | | | 38,163 | | | | (2,233,136 | ) | | | (2,271,299 | ) |
| | 12,575 | | | | 02/15/27 | | | | 1.965%(A) | | | 1 Day USOIS(1)(A) | | | — | | | | (588,745 | ) | | | (588,745 | ) |
| | 23,100 | | | | 02/15/27 | | | | 2.068%(A) | | | 1 Day USOIS(1)(A) | | | (15,258 | ) | | | (1,265,196 | ) | | | (1,249,938 | ) |
| | 11,080 | | | | 05/08/27 | | | | 2.309%(S) | | | 3 Month LIBOR(1)(Q) | | | — | | | | (686,450 | ) | | | (686,450 | ) |
| | 9,360 | | | | 05/15/27 | | | | 1.823%(A) | | | 1 Day USOIS(1)(A) | | | — | | | | (356,459 | ) | | | (356,459 | ) |
| | 305,886 | | | | 08/15/28 | | | | 2.579%(A) | | | 1 Day USOIS(1)(A) | | | (3,762,047 | ) | | | (32,961,757 | ) | | | (29,199,710 | ) |
| | 104,670 | | | | 08/15/28 | | | | 2.835%(S) | | | 3 Month LIBOR(1)(Q) | | | (333,232 | ) | | | (11,176,045 | ) | | | (10,842,813 | ) |
| | 127,280 | | | | 05/11/29 | | | | 2.000%(S) | | | 3 Month LIBOR(1)(Q) | | | (137,782 | ) | | | (5,278,599 | ) | | | (5,140,817 | ) |
See Notes to Financial Statements.
Interest rate swap agreements outstanding at October 31, 2019 (continued):
| | | | | | | | | | | | | | | | | | | | | | | | |
Notional
Amount
(000)# | | | Termination
Date | | | Fixed
Rate | | | Floating Rate | | Value at
Trade
Date | | | Value at
October 31,
2019 | | | Unrealized
Appreciaton
(Depreciation) | |
| | Centrally Cleared Interest Rate Swap Agreements (cont’d.): | | | | | |
| | 4,570 | | | | 08/21/44 | | | | 3.190%(S) | | | 3 Month LIBOR(1)(Q) | | $ | (315,884 | ) | | $ | (1,342,705 | ) | | $ | (1,026,821 | ) |
| | 3,755 | | | | 09/27/46 | | | | 1.380%(A) | | | 1 Day USOIS(1)(A) | | | 218 | | | | 128,996 | | | | 128,778 | |
| | 6,715 | | | | 05/11/48 | | | | 2.300%(S) | | | 3 Month LIBOR(1)(Q) | | | 1,241,571 | | | | (837,287 | ) | | | (2,078,858 | ) |
| | 34,915 | | | | 05/11/49 | | | | 2.300%(S) | | | 3 Month LIBOR(1)(Q) | | | 2,594,321 | | | | (4,466,014 | ) | | | (7,060,335 | ) |
| | 2,925 | | | | 05/11/49 | | | | 2.500%(A) | | | 1 Day USOIS(2)(A) | | | 279,376 | | | | 683,197 | | | | 403,821 | |
| | | | | | | | | | | | | | | | | | | | | | | | |
| | | | | | | | | | | | | | $ | 40,933,961 | | | $ | (150,353,086 | ) | | $ | (191,287,047 | ) |
| | | | | | | | | | | | | | | | | | | | | | | | |
| | | | | | | | | | | | | | | | | | | | | | | | | | |
Notional
Amount
(000)# | | | Termination
Date | | | Fixed
Rate | | | Floating Rate | | Fair
Value | | | Upfront
Premiums
Paid
(Received) | | | Unrealized
Appreciaton
(Depreciation) | | | Counterparty |
| | OTC Interest Rate Swap Agreement: | | | | | | | | | | | | | | |
| | 10,720 | | | | 02/22/49 | | | | 2.311%(S) | | | 1 Week MUNIPSA(1)(Q) | | $ | (2,066,445 | ) | | $ | — | | | $ | (2,066,445 | ) | | JPMorgan Chase Bank, N.A. |
| | | | | | | | | | | | | | | | | | | | | | | | | | |
| (1) | The Fund pays the fixed rate and receives the floating rate. |
| (2) | The Fund pays the floating rate and receives the fixed rate. |
Total return swap agreements outstanding at October 31, 2019:
| | | | | | | | | | | | | | | | | | | | | | | | |
Reference Entity | | Financing
Rate | | Counterparty | | Termination
Date | | | Long
(Short)
Notional
Amount
(000)#(1) | | | Fair
Value | | | Upfront
Premiums
Paid
(Received) | | | Unrealized
Appreciation
(Depreciation)(2) | |
OTC Total Return Swap Agreement: | |
IOS. FN30.450.10 Index(M) | | 1 Month LIBOR(M) | | Credit Suisse
International | | | 1/12/41 | | | | 3,832 | | | $ | (8,395 | ) | | $ | (9,728 | ) | | $ | 1,333 | |
| | | | | | | | | | | | | | | | | | | | | | | | |
| (1) | On a long total return swap, the Fund receives payments for any positive return on the reference entity (makes payments for any negative return) and pays the financing rate. On a short total return swap, the Fund makes payments for any positive return on the reference entity (receives payments for any negative return) and receives the financing rate. |
| (2) | Upfront/recurring fees or commissions, as applicable, are included in the net unrealized appreciation (depreciation). |
See Notes to Financial Statements.
| | | | |
| PGIM Absolute Return Bond Fund | | | 117 | |
Schedule of Investments(continued)
as of October 31, 2019
Balances Reported in the Statement of Assets and Liabilities for OTC Swap Agreements:
| | | | | | | | | | | | | | | | |
| | | Premiums
Paid | | | Premiums
Received | | | Unrealized
Appreciation | | | Unrealized
Depreciation | |
OTC Swap Agreements | | $ | 2,987,434 | | | $ | (8,778,613 | ) | | $ | 19,973,708 | | | $ | (18,060,707 | ) |
Summary of Collateral for Centrally Cleared/Exchange-traded Derivatives:
Cash and securities segregated as collateral, including pending settlement for closed positions, to cover requirements for centrally cleared/exchange-traded derivatives are listed by broker as follows:
| | | | | | | | |
Broker | | Cash and/or
Foreign Currency | | | Securities
Market Value | |
Citigroup Global Markets, Inc. | | $ | 63,952,000 | | | $ | 22,313,601 | |
| | | | | | | | |
Fair Value Measurements:
Various inputs are used in determining the value of the Fund’s investments. These inputs are summarized in the three broad levels listed below.
Level 1—unadjusted quoted prices generally in active markets for identical securities.
Level 2—quoted prices for similar securities, interest rates and yield curves, prepayment speeds, foreign currency exchange rates and other observable inputs.
Level 3—unobservable inputs for securities valued in accordance with Board approved fair valuation procedures.
The following is a summary of the inputs used as of October 31, 2019 in valuing such portfolio securities:
| | | | | | | | | | | | |
| | | Level 1 | | | Level 2 | | | Level 3 | |
Investments in Securities | | | | | | | | | | | | |
Assets | | | | | | | | | | | | |
Asset-Backed Securities | | | | | | | | | | | | |
Automobiles | | $ | — | | | $ | 11,651,915 | | | $ | — | |
Collateralized Loan Obligations | | | — | | | | 465,568,092 | | | | — | |
Consumer Loans | | | — | | | | 40,299,410 | | | | — | |
Home Equity Loans | | | — | | | | 24,226,315 | | | | — | |
Other | | | — | | | | 3,163,472 | | | | — | |
Residential Mortgage-Backed Securities | | | — | | | | 76,025,048 | | | | — | |
Student Loans | | | — | | | | 54,346,844 | | | | — | |
Bank Loans | | | — | | | | 36,668,359 | | | | 14,301,819 | |
Commercial Mortgage-Backed Securities | | | — | | | | 198,532,311 | | | | — | |
Corporate Bonds | | | — | | | | 808,833,553 | | | | — | |
Municipal Bonds | | | — | | | | 37,046,166 | | | | — | |
Residential Mortgage-Backed Securities | | | — | | | | 98,662,350 | | | | 26,300,000 | |
Sovereign Bonds | | | — | | | | 190,749,633 | | | | — | |
U.S. Treasury Obligations | | | — | | | | 25,301,198 | | | | — | |
Common Stock | | | 1,055,499 | | | | — | | | | — | |
See Notes to Financial Statements.
| | | | | | | | | | | | |
| | | Level 1 | | | Level 2 | | | Level 3 | |
Investments in Securities (continued) | | | | | | | | | | | | |
Assets (continued) | | | | | | | | | | | | |
Affiliated Mutual Funds | | $ | 322,286,106 | | | $ | — | | | $ | — | |
Options Purchased | | | — | | | | 69,614,735 | | | | — | |
| | | | | | | | | | | | |
Total | | $ | 323,341,605 | | | $ | 2,140,689,401 | | | $ | 40,601,819 | |
| | | | | | | | | | | | |
Liabilities | | | | | | | | | | | | |
Options Written | | $ | — | | | $ | (58,605,480 | ) | | $ | — | |
| | | | | | | | | | | | |
Other Financial Instruments* | | | | | | | | | | | | |
Assets | | | | | | | | | | | | |
Futures Contracts | | $ | 11,490,862 | | | $ | — | | | $ | — | |
OTC Forward Foreign Currency Exchange Contracts | | | — | | | | 40,856,226 | | | | — | |
OTC Cross Currency Exchange Contracts | | | — | | | | 14,239,237 | | | | — | |
OTC Packaged Credit Default Swap Agreements | | | — | | | | 13,865,903 | | | | — | |
OTC Credit Default Swap Agreements | | | — | | | | 4,329,098 | | | | 30,838 | |
Centrally Cleared Interest Rate Swap Agreements | | | — | | | | 6,219,767 | | | | — | |
| | | | | | | | | | | | |
Total | | $ | 11,490,862 | | | $ | 79,510,231 | | | $ | 30,838 | |
| | | | | | | | | | | | |
Liabilities | | | | | | | | | | | | |
Futures Contracts | | $ | (18,437,507 | ) | | $ | — | | | $ | — | |
OTC Forward Foreign Currency Exchange Contracts | | | — | | | | (40,159,735 | ) | | | — | |
OTC Cross Currency Exchange Contracts | | | — | | | | (8,004,738 | ) | | | — | |
OTC Packaged Credit Default Swap Agreements | | | — | | | | (14,890,018 | ) | | | — | |
Centrally Cleared Credit Default Swap Agreement | | | — | | | | (267,067 | ) | | | — | |
OTC Credit Default Swap Agreements | | | — | | | | (5,139,159 | ) | | | — | |
Centrally Cleared Interest Rate Swap Agreements | | | — | | | | (197,506,814 | ) | | | — | |
OTC Interest Rate Swap Agreement | | | — | | | | (2,066,445 | ) | | | — | |
OTC Total Return Swap Agreement | | | — | | | | (8,395 | ) | | | — | |
| | | | | | | | | | | | |
Total | | $ | (18,437,507 | ) | | $ | (268,042,371 | ) | | $ | — | |
| | | | | | | | | | | | |
| * | Other financial instruments are derivative instruments not reflected in the Schedule of Investments, such as futures, forwards and centrally cleared swap contracts, which are recorded at the unrealized appreciation (depreciation) on the instrument, and OTC swap contracts which are recorded at fair value. |
The following is a reconciliation of assets in which unobservable inputs (Level 3) were used in determining fair value:
| | | | | | | | | | | | |
| | | Asset-Backed
Securities—
Residential
Mortgage-Backed
Securities | | | Bank
Loans | | | Corporate
Bonds | |
Balance as of 10/31/18 | | $ | 20,813,302 | | | $ | 1,138,500 | | | $ | 1,567,956 | |
Realized gain (loss) | | | 40,856 | | | | (25,563 | ) | | | — | |
Change in unrealized appreciation (depreciation) | | | 1,121 | | | | 795,999 | | | | — | |
See Notes to Financial Statements.
| | | | |
| PGIM Absolute Return Bond Fund | | | 119 | |
Schedule of Investments(continued)
as of October 31, 2019
| | | | | | | | | | | | |
| | | Asset-Backed
Securities—
Residential
Mortgage-Backed
Securities | | | Bank
Loans | | | Corporate
Bonds | |
Purchases/Exchanges/Issuances | | $ | — | | | $ | 13,049,665 | | | $ | — | |
Sales/Paydowns | | | (20,875,930 | ) | | | (285,553 | ) | | | — | |
Accrued discount/premium | | | 20,651 | | | | 347 | | | | — | |
Transfers into of Level 3 | | | — | | | | 766,924 | | | | — | |
Transfers out of Level 3 | | | — | | | | (1,138,500 | ) | | | (1,567,956 | ) |
| | | | | | | | | | | | |
Balance as of 10/31/19 | | $ | — | | | $ | 14,301,819 | | | $ | — | |
| | | | | | | | | | | | |
Change in unrealized appreciation (depreciation) relating to securities still held at reporting period end | | $ | — | | | $ | 795,999 | | | $ | — | |
| | | | | | | | | | | | |
| | | | | | | | | | | | |
| | | Residential
Mortgage-Backed
Securities | | | Options
Written | | | Credit Default
Swap Agreements | |
Balance as of 10/31/18 | | $ | — | | | $ | (41,572 | ) | | $ | 38,374 | |
Realized gain (loss) | | | — | | | | 48,601 | | | | 37,192 | |
Change in unrealized appreciation (depreciation) | | | — | | | | (7,029 | ) | | | 30,838 | |
Purchases/Exchanges/Issuances | | | 26,300,000 | | | | — | | | | — | |
Sales/Paydowns | | | — | | | | — | | | | (75,566 | ) |
Accrued discount/premium | | | — | | | | — | | | | — | |
Transfers into of Level 3 | | | — | | | | — | | | | — | |
Transfers out of Level 3 | | | — | | | | — | | | | — | |
| | | | | | | | | | | | |
Balance as of 10/31/19 | | $ | 26,300,000 | | | $ | — | | | $ | 30,838 | |
| | | | | | | | | | | | |
Change in unrealized appreciation (depreciation) relating to securities still held at reporting period end | | $ | — | | | $ | — | | | $ | 30,838 | |
| | | | | | | | | | | | |
Level 3 securities as presented in the table above are being fair valued using pricing methodologies approved by Board, which contain unobservable inputs as follows:
| | | | | | | | | | | | |
Level 3 Securities | | Fair Value as of
October 31, 2019 | | | Valuation
Methodology | | | Unobservable Inputs | |
Bank Loans | | $ | 464,890 | | | | Market Approach | | | | Single Broker Indicative Quote | |
Bank Loans | | | 13,836,929 | | | | Pricing at Cost | | | | Unadjusted Purchase Price | |
Residential Mortgage-Backed Securities | | | 26,300,000 | | | | Pricing at Cost | | | | Unadjusted Purchase Price | |
OTC Credit Default Swap Agreements | | | 30,838 | | | | Market Approach | | | | Single Broker Indicative Quote | |
| | | | | | | | | | | | |
| | $ | 40,632,657 | | | | | | | | | |
| | | | | | | | | | | | |
See Notes to Financial Statements.
It is the Fund’s policy to recognize transfers in and transfers out at the fair value as of the beginning of period. Securities transferred levels as follows:
| | | | | | | | | | |
Investments in Securities | | Amount Transferred | | | Level Transfer | | | Logic |
Bank Loans | | $ | 766,924 | | | | L2 to L3 | | | Multiple Broker Quotes to Single Broker Indicative Quote |
Bank Loans | | $ | 1,138,500 | | | | L3 to L2 | | | Single Broker Indicative Quote to Multiple Broker Quotes |
Corporate Bonds | | $ | 1,567,956 | | | | L3 to L2 | | | Single Broker Indicative Quote to Evaluated Bid |
Industry Classification:
The industry classification of investments and liabilities in excess of other assets shown as a percentage of net assets as of October 31, 2019 were as follows (unaudited):
| | | | |
Collateralized Loan Obligations | | | 19.7 | % |
Affiliated Mutual Funds (6.1% represents investments purchased with collateral from securities on loan) | | | 13.6 | |
Residential Mortgage-Backed Securities | | | 8.5 | |
Commercial Mortgage-Backed Securities | | | 8.4 | |
Sovereign Bonds | | | 8.0 | |
Banks | | | 4.9 | |
Options Purchased | | | 2.9 | |
Retail | | | 2.7 | |
Student Loans | | | 2.3 | |
Oil & Gas | | | 2.3 | |
Chemicals | | | 2.2 | |
Home Builders | | | 2.1 | |
Commercial Services | | | 2.0 | |
Consumer Loans | | | 1.7 | |
Electric | | | 1.6 | |
Media | | | 1.6 | |
Municipal Bonds | | | 1.6 | |
Telecommunications | | | 1.6 | |
Foods | | | 1.3 | |
Pharmaceuticals | | | 1.2 | |
Packaging & Containers | | | 1.2 | |
U.S. Treasury Obligations | | | 1.1 | |
Home Equity Loans | | | 1.0 | |
Entertainment | | | 1.0 | |
Healthcare-Services | | | 0.9 | |
Auto Parts & Equipment | | | 0.9 | |
Insurance | | | 0.7 | |
Software | | | 0.7 | |
Aerospace & Defense | | | 0.7 | |
Auto Manufacturers | | | 0.6 | |
Pipelines | | | 0.5 | |
| | | | |
Household Products/Wares | | | 0.5 | % |
Automobiles | | | 0.5 | |
Electrical Components & Equipment | | | 0.5 | |
Lodging | | | 0.4 | |
Diversified Financial Services | | | 0.4 | |
Real Estate | | | 0.4 | |
Semiconductors | | | 0.3 | |
Building Materials | | | 0.3 | |
Electronics | | | 0.3 | |
Computers | | | 0.3 | |
Healthcare-Products | | | 0.3 | |
Airlines | | | 0.2 | |
Gas | | | 0.2 | |
Real Estate Investment Trusts (REITs) | | | 0.2 | |
Engineering & Construction | | | 0.2 | |
Advertising | | | 0.2 | |
Leisure Time | | | 0.2 | |
Other | | | 0.1 | |
Miscellaneous Manufacturing | | | 0.1 | |
Energy-Alternate Sources | | | 0.1 | |
Apparel | | | 0.1 | |
Biotechnology | | | 0.1 | |
Water | | | 0.1 | |
Mining | | | 0.1 | |
Home Furnishings | | | 0.1 | |
Oil, Gas & Consumable Fuels | | | 0.0 | * |
Forest Products & Paper | | | 0.0 | * |
Agriculture | | | 0.0 | * |
Beverages | | | 0.0 | * |
Savings & Loans | | | 0.0 | * |
Oil & Gas Services | | | 0.0 | * |
Textiles | | | 0.0 | * |
See Notes to Financial Statements.
| | | | |
| PGIM Absolute Return Bond Fund | | | 121 | |
Schedule of Investments(continued)
as of October 31, 2019
Industry Classification (continued):
| | | | |
Machinery-Diversified | | | 0.0 | *% |
| | | | |
| | | 105.7 | |
Options Written | | | (2.5 | ) |
Liabilities in excess of other assets | | | (3.2 | ) |
| | | | |
| | | 100.0 | % |
| | | | |
Effects of Derivative Instruments on the Financial Statements and Primary Underlying Risk Exposure:
The Fund invested in derivative instruments during the reporting period. The primary types of risk associated with these derivative instruments are credit contracts risk, foreign exchange contracts risk and interest rate contracts risk. See the Notes to Financial Statements for additional detail regarding these derivative instruments and their risks. The effect of such derivative instruments on the Fund’s financial position and financial performance as reflected in the Statement of Assets and Liabilities and Statement of Operations is presented in the summary below.
Fair values of derivative instruments as of October 31, 2019 as presented in the Statement of Assets and Liabilities:
| | | | | | | | | | | | |
Derivatives not accounted for as hedging instruments, carried at fair value | | Asset Derivatives | | | Liability Derivatives | |
| | Statement of
Assets and
Liabilities Location | | Fair
Value | | | Statement of
Assets and
Liabilities Location | | Fair
Value | |
| Credit contracts | | — | | $ | — | | | Due from/to broker-variation margin swaps | | $ | 267,067 | * |
| Credit contracts | | Premiums paid for OTC swap agreements | | | 2,987,434 | | | Premiums received for OTC swap agreements | | | 8,768,885 | |
| Credit contracts | | Unaffiliated investments | | | 12,364 | | | Options written outstanding, at value | | | 272,201 | |
| Credit contracts | | Unrealized appreciation on OTC swap agreements | | | 19,972,375 | | | Unrealized depreciation on OTC swap agreements | | | 15,994,262 | |
| Foreign exchange contracts | | Unaffiliated investments | | | 68,109,346 | | | Options written outstanding, at value | | | 58,333,279 | |
| Foreign exchange contracts | | Unrealized appreciation on OTC cross currency exchange contracts | | | 14,239,237 | | | Unrealized depreciation on OTC cross currency exchange contracts | | | 8,004,738 | |
| Foreign exchange contracts | | Unrealized appreciation on OTC forward foreign currency exchange contracts | | | 40,856,226 | | | Unrealized depreciation on OTC forward foreign currency exchange contracts | | | 40,159,735 | |
See Notes to Financial Statements.
| | | | | | | | | | | | |
Derivatives not accounted for as hedging instruments, carried at fair value | | Asset Derivatives | | | Liability Derivatives | |
| | Statement of
Assets and
Liabilities Location | | Fair
Value | | | Statement of
Assets and
Liabilities Location | | Fair
Value | |
| Interest rate contracts | | Due from/to broker-variation margin futures | | $ | 11,490,862 | * | | Due from/to broker-variation margin futures | | $ | 18,437,507 | * |
| Interest rate contracts | | Due from/to broker-variation margin swaps | | | 6,219,767 | * | | Due from/to broker-variation margin swaps | | | 197,506,814 | * |
| Interest rate contracts | | — | | | — | | | Premiums received for OTC swap agreements | | | 9,728 | |
| Interest rate contracts | | Unaffiliated investments | | | 1,493,025 | | | — | | | — | |
| Interest rate contracts | | Unrealized appreciation on OTC swap agreements | | | 1,333 | | | Unrealized depreciation on OTC swap agreements | | | 2,066,445 | |
| | | | | | | | | | | | |
| | | | $ | 165,381,969 | | | | | $ | 349,820,661 | |
| | | | | | | | | | | | |
| * | Includes cumulative appreciation (depreciation) as reported in the schedule of open futures and centrally cleared swap contracts. Only unsettled variation margin receivable (payable) is reported within the Statement of Assets and Liabilities. |
The effects of derivative instruments on the Statement of Operations for the year ended October 31, 2019 are as follows:
| | | | | | | | | | | | | | | | | | | | |
Amount of Realized Gain (Loss) on Derivatives Recognized in Income | |
Derivatives not accounted for as hedging instruments, carried at fair value | | Options
Purchased(1) | | | Options
Written | | | Futures | | | Forward
& Cross
Currency
Exchange
Contracts | | | Swaps | |
Credit contracts | | $ | (136,016 | ) | | $ | 2,421,056 | | | $ | — | | | $ | — | | | $ | 1,888,768 | |
Foreign exchange contracts | | | (20,820,666 | ) | | | 13,341,569 | | | | — | | | | 23,964,013 | | | | — | |
Interest rate contracts | | | (1,647,671 | ) | | | 684,863 | | | | 146,070,592 | | | | — | | | | 47,877,494 | |
| | | | | | | | | | | | | | | | | | | | |
Total | | $ | (22,604,353 | ) | | $ | 16,447,488 | | | $ | 146,070,592 | | | $ | 23,964,013 | | | $ | 49,766,262 | |
| | | | | | | | | | | | | | | | | | | | |
| (1) | Included in net realized gain (loss) on investment transactions in the Statement of Operations. |
| | | | | | | | | | | | | | | | | | | | |
Change in Unrealized Appreciation (Depreciation) on Derivatives Recognized in Income | |
Derivatives not accounted for as hedging instruments, carried at fair value | | Options
Purchased(2) | | | Options
Written | | | Futures | | | Forward
& Cross
Currency
Exchange
Contracts | | | Swaps | |
Credit contracts | | $ | (31,231 | ) | | $ | (46,351 | ) | | $ | — | | | $ | — | | | $ | 1,374,673 | |
See Notes to Financial Statements.
| | | | |
| PGIM Absolute Return Bond Fund | | | 123 | |
Schedule of Investments(continued)
as of October 31, 2019
| | | | | | | | | | | | | | | | | | | | |
Change in Unrealized Appreciation (Depreciation) on Derivatives Recognized in Income | |
Derivatives not accounted for as
hedging instruments,
carried at fair value | | Options
Purchased(2) | | | Options
Written | | | Futures | | | Forward
& Cross
Currency
Exchange
Contracts | | | Swaps | |
Foreign exchange contracts | | $ | (50,384,628 | ) | | $ | 60,653,262 | | | $ | — | | | $ | (13,833,198 | ) | | $ | — | |
Interest rate contracts | | | 938,521 | | | | (7,029 | ) | | | 3,065,029 | | | | — | | | | (267,644,528 | ) |
| | | | | | | | | | | | | | | | | | | | |
Total | | $ | (49,477,338 | ) | | $ | 60,599,882 | | | $ | 3,065,029 | | | $ | (13,833,198 | ) | | $ | (266,269,855 | ) |
| | | | | | | | | | | | | | | | | | | | |
| (2) | Included in net change in unrealized appreciation (depreciation) on investments in the Statement of Operations. |
For the year ended October 31, 2019, the Fund’s average volume of derivative activities is as follows:
| | | | | | | | | | | | | | | | | | |
Options
Purchased(1) | | | Options
Written(2) | | | Futures
Contracts—
Long
Positions(2) | | | Futures
Contracts—
Short
Positions(2) | | | Forward
Foreign
Currency
Exchange
Contracts—
Purchased(3) | |
| $ | 106,827,892 | | | $ | 3,450,597,607 | | | $ | 2,442,345,180 | | | $ | 1,464,605,110 | | | $ | 806,799,590 | |
| | | | | | | | | | | | | | |
Forward Foreign
Currency Exchange
Contracts—Sold(3) | | | Cross
Currency
Exchange
Contracts(4) | | | Interest Rate
Swap
Agreements(2) | | | Credit Default
Swap Agreements—
Buy Protection(2) | |
| $ | 1,181,444,938 | | | $ | 166,764,783 | | | $ | 8,298,899,719 | | | $ | 362,528,000 | |
| | | | | | | | | | |
Credit Default
Swap Agreements—
Sell Protection(2) | | | Total Return
Swap
Agreements(2) | | | Inflation Swap
Agreements(2) | |
| $ | 403,024,377 | | | $ | 6,675,200 | | | $ | 11,355,000 | |
| (2) | Notional Amount in USD. |
| (3) | Value at Settlement Date. |
Financial Instruments/Transactions—Summary of Offsetting and Netting Arrangements:
The Fund invested in OTC derivatives and entered into financial instruments/transactions during the reporting period that are either offset in accordance with current requirements or are subject to enforceable master netting arrangements or similar agreements that permit offsetting. The information about offsetting and related netting arrangements for OTC derivatives and financial instruments/transactions where the legal right toset-off exists is presented in the summary below.
Offsetting of financial instrument/transaction assets and liabilities:
See Notes to Financial Statements.
| | | | | | | | | | | | |
Description | | Gross
Market
Value of
Recognized
Assets/
(Liabilities) | | | Collateral
Pledged/
(Received)(2) | | | Net
Amount | |
Securities on Loan | | $ | 140,307,590 | | | $ | (140,307,590 | ) | | $ | — | |
| | | | | | | | | | | | |
Offsetting of OTC derivative assets and liabilities:
| | | | | | | | | | | | | | | | | | | | |
Counterparty | | Gross
Amounts of
Recognized
Assets(1) | | | Gross
Amounts of
Recognized
Liabilities(1) | | | Net
Amounts of
Recognized
Assets/
(Liabilities) | | | Collateral
Pledged/
(Received)(2) | | | Net
Amount | |
Bank of America, N.A. | | $ | 10,338,856 | | | $ | (9,795,698 | ) | | $ | 543,158 | | | $ | (543,158 | ) | | $ | — | |
Barclays Bank PLC | | | 15,214,095 | | | | (14,964,138 | ) | | | 249,957 | | | | (249,957 | ) | | | — | |
BNP Paribas S.A. | | | 11,655,210 | | | | (12,093,894 | ) | | | (438,684 | ) | | | — | | | | (438,684 | ) |
Citibank, N.A. | | | 10,810,300 | | | | (17,178,174 | ) | | | (6,367,874 | ) | | | 6,367,874 | | | | — | |
Credit Suisse International | | | 177,868 | | | | (547,442 | ) | | | (369,574 | ) | | | 312,928 | | | | (56,646 | ) |
Deutsche Bank AG | | | 27,184,955 | | | | (29,457,631 | ) | | | (2,272,676 | ) | | | 1,183,741 | | | | (1,088,935 | ) |
Goldman Sachs International | | | 14,496,715 | | | | (11,160,279 | ) | | | 3,336,436 | | | | (1,765,115 | ) | | | 1,571,321 | |
HSBC Bank USA, N.A. | | | 2,186,396 | | | | (2,755,375 | ) | | | (568,979 | ) | | | 309,081 | | | | (259,898 | ) |
JPMorgan Chase Bank, N.A. | | | 4,251,303 | | | | (6,405,145 | ) | | | (2,153,842 | ) | | | 1,898,685 | | | | (255,157 | ) |
JPMorgan Securities LLC | | | 106,929 | | | | (65,457 | ) | | | 41,472 | | | | — | | | | 41,472 | |
Morgan Stanley & Co. International PLC | | | 50,794,085 | | | | (26,589,232 | ) | | | 24,204,853 | | | | (23,203,275 | ) | | | 1,001,578 | |
The Toronto-Dominion Bank | | | 227,554 | | | | (676,601 | ) | | | (449,047 | ) | | | 441,833 | | | | (7,214 | ) |
UBS AG | | | 227,074 | | | | (1,920,207 | ) | | | (1,693,133 | ) | | | 1,494,503 | | | | (198,630 | ) |
| | | | | | | | | | | | | | | | | | | | |
| | $ | 147,671,340 | | | $ | (133,609,273 | ) | | $ | 14,062,067 | | | $ | (13,752,860 | ) | | $ | 309,207 | |
| | | | | | | | | | | | | | | | | | | | |
| (1) | Includes unrealized appreciation/(depreciation) on swaps and forwards, premiums paid/(received) on swap agreements and market value of purchased and written options, as represented on the Statement of Assets and Liabilities. |
| (2) | Collateral amount disclosed by the Fund is limited to the market value of financial instruments/transactions and the Fund’s OTC derivative exposure by counterparty. |
See Notes to Financial Statements.
| | | | |
| PGIM Absolute Return Bond Fund | | | 125 | |
Statement of Assets and Liabilities
as of October 31, 2019
| | | | |
Assets | | | | |
Investments at value, including securities on loan of $140,307,590: | | | | |
Unaffiliated investments (cost $2,201,514,290) | | $ | 2,182,346,719 | |
Affiliated investments (cost $322,258,128) | | | 322,286,106 | |
Cash | | | 14,275 | |
Foreign currency, at value (cost $2,745,743) | | | 2,755,470 | |
Cash segregated for counterparty—OTC | | | 3,981,000 | |
Deposit with broker for centrally cleared/exchange-traded derivatives | | | 63,952,000 | |
Unrealized appreciation on OTC forward foreign currency exchange contracts | | | 40,856,226 | |
Unrealized appreciation on OTC swap agreements | | | 19,973,708 | |
Dividends and interest receivable | | | 18,749,849 | |
Unrealized appreciation on OTC cross currency exchange contracts | | | 14,239,237 | |
Due from broker—variation margin futures | | | 8,413,488 | |
Receivable for Fund shares sold | | | 4,748,375 | |
Receivable for investments sold | | | 4,510,036 | |
Premiums paid for OTC swap agreements | | | 2,987,434 | |
Prepaid expenses | | | 17,506 | |
| | | | |
Total Assets | | | 2,689,831,429 | |
| | | | |
| |
Liabilities | | | | |
Payable to broker for collateral for securities on loan | | | 143,867,101 | |
Options written outstanding, at value (proceeds received $118,132,267) | | | 58,605,480 | |
Unrealized depreciation on OTC forward foreign currency exchange contracts | | | 40,159,735 | |
Payable for investments purchased | | | 20,607,187 | |
Unrealized depreciation on OTC swap agreements | | | 18,060,707 | |
Due to broker—variation margin swaps | | | 11,999,697 | |
Premiums received for OTC swap agreements | | | 8,778,613 | |
Unrealized depreciation on OTC cross currency exchange contracts | | | 8,004,738 | |
Payable for Fund shares reacquired | | | 6,381,390 | |
Accrued expenses and other liabilities | | | 1,298,711 | |
Management fee payable | | | 1,258,700 | |
Dividends payable | | | 1,185,171 | |
Distribution fee payable | | | 118,501 | |
Affiliated transfer agent fee payable | | | 6,641 | |
| | | | |
Total Liabilities | | | 320,332,372 | |
| | | | |
| |
Net Assets | | $ | 2,369,499,057 | |
| | | | |
| | | | | |
Net assets were comprised of: | | | | |
Shares of beneficial interest, at par | | $ | 242,625 | |
Paid-in capital in excess of par | | | 2,447,787,094 | |
Total distributable earnings (loss) | | | (78,530,662 | ) |
| | | | |
Net assets, October 31, 2019 | | $ | 2,369,499,057 | |
| | | | |
See Notes to Financial Statements.
| | | | |
| |
Class A | | | | |
Net asset value and redemption price per share,
($ 142,879,247 ÷ 14,686,031 shares of beneficial interest issued and outstanding) | | $ | 9.73 | |
Maximum sales charge (3.25% of offering price) | | | 0.33 | |
| | | | |
Maximum offering price to public | | $ | 10.06 | |
| | | | |
| |
Class C | | | | |
Net asset value, offering price and redemption price per share,
($ 103,132,962 ÷ 10,569,729 shares of beneficial interest issued and outstanding) | | $ | 9.76 | |
| | | | |
| |
Class Z | | | | |
Net asset value, offering price and redemption price per share,
($ 2,040,949,202 ÷ 208,882,321 shares of beneficial interest issued and outstanding) | | $ | 9.77 | |
| | | | |
| |
Class R6 | | | | |
Net asset value, offering price and redemption price per share,
($ 82,537,646 ÷ 8,487,300 shares of beneficial interest issued and outstanding) | | $ | 9.72 | |
| | | | |
See Notes to Financial Statements.
| | | | |
| PGIM Absolute Return Bond Fund | | | 127 | |
Statement of Operations
Year Ended October 31, 2019
| | | | |
Net Investment Income (Loss) | | | | |
Income | | | | |
Interest income (net of $33,479 foreign withholding tax) | | $ | 104,106,030 | |
Affiliated dividend income | | | 1,336,337 | |
Income from securities lending, net (including affiliated income of $140,530) | | | 451,911 | |
Unaffiliated dividend income (net of $21,527 foreign withholding tax) | | | 122,205 | |
| | | | |
Total income | | | 106,016,483 | |
| | | | |
| |
Expenses | | | | |
Management fee | | | 16,246,661 | |
Distribution fee(a) | | | 1,445,087 | |
Transfer agent’s fees and expenses (including affiliated expense of $42,586)(a) | | | 2,492,166 | |
Custodian and accounting fees | | | 394,455 | |
Shareholders’ reports | | | 232,413 | |
Registration fees(a) | | | 151,821 | |
Audit fee | | | 65,889 | |
Trustees’ fees | | | 56,047 | |
Legal fees and expenses | | | 31,703 | |
SEC registration fees | | | 6,966 | |
Miscellaneous | | | 84,665 | |
| | | | |
Total expenses | | | 21,207,873 | |
Less: Fee waiver and/or expense reimbursement(a) | | | (1,406,106 | ) |
| | | | |
Net expenses | | | 19,801,767 | |
| | | | |
Net investment income (loss) | | | 86,214,716 | |
| | | | |
| |
Realized And Unrealized Gain (Loss) On Investment And Foreign Currency Transactions | | | | |
Net realized gain (loss) on: | | | | |
Investment transactions (including affiliated of $(7,171)) | | | (7,479,987 | ) |
Futures transactions | | | 146,070,592 | |
Forward and cross currency contract transactions | | | 23,964,013 | |
Options written transactions | | | 16,447,488 | |
Swap agreement transactions | | | 49,766,262 | |
Foreign currency transactions | | | (14,546,884 | ) |
| | | | |
| | | 214,221,484 | |
| | | | |
Net change in unrealized appreciation (depreciation) on: | | | | |
Investments (including affiliated of $26,281) | | | 36,400,323 | |
Futures | | | 3,065,029 | |
Forward and cross currency contracts | | | (13,833,198 | ) |
Options written | | | 60,599,882 | |
Swap agreements | | | (266,269,855 | ) |
Foreign currencies | | | (1,350,612 | ) |
Unfunded loan commitments | | | 105,191 | |
| | | | |
| | | (181,283,240 | ) |
| | | | |
Net gain (loss) on investment and foreign currency transactions | | | 32,938,244 | |
| | | | |
Net Increase (Decrease) In Net Assets Resulting From Operations | | $ | 119,152,960 | |
| | | | |
See Notes to Financial Statements.
| (a) | Class specific expenses and waivers were as follows: |
| | | | | | | | | | | | | | | | |
| | | Class A | | | Class C | | | Class Z | | | Class R6 | |
Distribution fee | | | 369,029 | | | | 1,076,058 | | | | — | | | | — | |
Transfer agent’s fees and expenses | | | 100,400 | | | | 83,347 | | | | 2,300,870 | | | | 7,549 | |
Registration fees | | | 26,391 | | | | 19,858 | | | | 87,262 | | | | 18,310 | |
Fee waiver and/or expense reimbursement | | | — | | | | — | | | | (1,393,277 | ) | | | (12,829 | ) |
See Notes to Financial Statements.
| | | | |
| PGIM Absolute Return Bond Fund | | | 129 | |
Statements of Changes in Net Assets
| | | | | | | | |
| |
| | | Year Ended October 31, | |
| | |
| | | 2019 | | | 2018 | |
Increase (Decrease) in Net Assets | | | | | | | | |
Operations | | | | | | | | |
Net investment income (loss) | | $ | 86,214,716 | | | $ | 66,225,068 | |
Net realized gain (loss) on investment and foreign currency transactions | | | 214,221,484 | | | | (7,479,170 | ) |
Net change in unrealized appreciation (depreciation) on investments and foreign currencies | | | (181,283,240 | ) | | | (6,874,171 | ) |
| | | | | | | | |
Net increase (decrease) in net assets resulting from operations | | | 119,152,960 | | | | 51,871,727 | |
| | | | | | | | |
| | |
Dividends and Distributions | | | | | | | | |
Distributions from distributable earnings | | | | | | | | |
Class A | | | (8,223,808 | ) | | | (4,734,445 | ) |
Class C | | | (5,131,810 | ) | | | (2,615,351 | ) |
Class Z | | | (127,037,946 | ) | | | (60,484,857 | ) |
Class R6 | | | (5,142,914 | ) | | | (11,823,707 | ) |
| | | | | | | | |
| | | (145,536,478 | ) | | | (79,658,360 | ) |
| | | | | | | | |
| | |
Fund share transactions (Net of share conversions) | | | | | | | | |
Net proceeds from shares sold | | | 1,253,284,816 | | | | 1,576,859,957 | |
Net asset value of shares issued in reinvestment of dividends and distributions | | | 118,802,617 | | | | 62,358,791 | |
Cost of shares reacquired | | | (1,594,437,537 | ) | | | (835,611,009 | ) |
| | | | | | | | |
Net increase (decrease) in net assets from Fund share transactions | | | (222,350,104 | ) | | | 803,607,739 | |
| | | | | | | | |
Total increase (decrease) | | | (248,733,622 | ) | | | 775,821,106 | |
| | |
Net Assets: | | | | | | | | |
Beginning of year | | | 2,618,232,679 | | | | 1,842,411,573 | |
| | | | | | | | |
End of year | | $ | 2,369,499,057 | | | $ | 2,618,232,679 | |
| | | | | | | | |
See Notes to Financial Statements.
Notes to Financial Statements
Prudential Investment Portfolios 9 (the “Trust”) is registered under the Investment Company Act of 1940, as amended (“1940 Act”), as anopen-end management investment company. The Trust currently consists of five funds: PGIM Absolute Return Bond Fund and PGIM QMALarge-Cap Core Equity Fund, each of which are diversified funds and PGIM International Bond Fund, PGIM Select Real Estate Fund and PGIM Real Estate Income Fund, each of which arenon-diversified funds for purposes of the 1940 Act and may invest a greater percentage of their assets in the securities of a single company or other issuer than a diversified fund. Investing in anon-diversified fund involves greater risk than investing in a diversified fund because a loss resulting from the decline in value of any one security may represent a greater portion of the total assets of anon-diversified fund. These financial statements relate only to the PGIM Absolute Return Bond Fund (the “Fund”).
The investment objective of the Fund is seek positive returns over the long term, regardless of market conditions.
1. Accounting Policies
The Fund follows the investment company accounting and reporting guidance of the Financial Accounting Standards Board (“FASB”) Accounting Standard Codification (“ASC”) Topic 946 Financial Services—Investment Companies.The following accounting policies conform to U.S. generally accepted accounting principles. The Fund consistently follows such policies in the preparation of its financial statements.
Securities Valuation:The Fund holds securities and other assets and liabilities that are fair valued at the close of each day (generally, 4:00 PM Eastern time) the New York Stock Exchange (“NYSE”) is open for trading. Fair value is the price that would be received to sell an asset or paid to transfer a liability in an orderly transaction between market participants on the measurement date. The Trust’s Board of Trustees (the “Board”) has adopted valuation procedures for security valuation under which fair valuation responsibilities have been delegated to PGIM Investments LLC (“PGIM Investments” or the “Manager”). Pursuant to the Board’s delegation, the Manager has established a Valuation Committee responsible for supervising the fair valuation of portfolio securities and other assets and liabilities. The valuation procedures permit the Fund to utilize independent pricing vendor services, quotations from market makers, and alternative valuation methods when market quotations are either not readily available or not deemed representative of fair value. A record of the Valuation Committee’s actions is subject to the Board’s review, approval, and ratification at its next regularly scheduled quarterly meeting.
For the fiscal reportingyear-end, securities and other assets and liabilities were fair valued at the close of the last U.S. business day. Trading in certain foreign securities may occur when the NYSE is closed (including weekends and holidays). Because such foreign securities
| | | | |
| PGIM Absolute Return Bond Fund | | | 131 | |
Notes to Financial Statements(continued)
trade in markets that are open on weekends and U.S. holidays, the values of some of the Fund’s foreign investments may change on days when investors cannot purchase or redeem Fund shares.
Various inputs determine how the Fund’s investments are valued, all of which are categorized according to the three broad levels (Level 1, 2, or 3) detailed in the Schedule of Investments and referred to herein as the “fair value hierarchy” in accordance with FASB ASC Topic 820—Fair Value Measurements and Disclosures.
Derivative instruments, such as futures or options, that are traded on a national securities exchange are valued at the last sale price as of the close of trading on the applicable exchange where the security principally trades. Securities traded via NASDAQ are valued at the NASDAQ official closing price. To the extent these securities are valued at the last sale price or NASDAQ official closing price, they are classified as Level 1 in the fair value hierarchy. In the event that no sale or official closing price on valuation date exists, these securities are generally valued at the mean between the last reported bid and ask prices, or at the last bid price in the absence of an ask price. These securities are classified as Level 2 in the fair value hierarchy.
Investments inopen-end,non-exchange-traded mutual funds are valued at their net asset values as of the close of the NYSE on the date of valuation. These securities are classified as Level 1 in the fair value hierarchy since they may be purchased or sold at their net asset values on the date of valuation.
Fixed income securities traded in the OTC market are generally classified as Level 2 in the fair value hierarchy. Such fixed income securities are typically valued using the market approach which generally involves obtaining data from an approved independent third-party vendor source. The Fund utilizes the market approach as the primary method to value securities when market prices of identical or comparable instruments are available. The third-party vendors’ valuation techniques used to derive the evaluated bid price are based on evaluating observable inputs, including but not limited to, yield curves, yield spreads, credit ratings, deal terms, tranche level attributes, default rates, cash flows, prepayment speeds, broker/dealer quotations and reported trades. Certain Level 3 securities are also valued using the market approach when obtaining a single broker quote or when utilizing transaction prices for identical securities that have been used in excess of five business days. During the reporting period, there were no changes to report with respect to the valuation approach and/or valuation techniques discussed above.
Bank loans are generally valued at prices provided by approved independent pricing vendors. The pricing vendors utilize broker/dealer quotations and provide prices based on the average of such quotations. Bank loans valued using such vendor prices are generally
classified as Level 2 in the fair value hierarchy. Bank loans valued based on a single broker quote or at the original transaction price in excess of five business days are classified as Level 3 in the fair value hierarchy.
OTC and centrally cleared derivative instruments are generally classified as Level 2 in the fair value hierarchy. Such derivative instruments are typically valued using the market approach and/or income approach which generally involves obtaining data from an approved independent third-party vendor source. The Fund utilizes the market approach when quoted prices in broker-dealer markets are available but also includes consideration of alternative valuation approaches, including the income approach. In the absence of reliable market quotations, the income approach is typically utilized for purposes of valuing derivatives such as interest rate swaps based on a discounted cash flow analysis whereby the value of the instrument is equal to the present value of its future cash inflows or outflows. Such analysis includes projecting future cash flows and determining the discount rate (including the present value factors that affect the discount rate) used to discount the future cash flows. In addition, the third-party vendors’ valuation techniques used to derive the evaluated derivative price is based on evaluating observable inputs, including but not limited to, underlying asset prices, indices, spreads, interest rates and exchange rates. Certain derivatives may be classified as Level 3 when valued using the market approach by obtaining a single broker quote or when utilizing unobservable inputs in the income approach. During the reporting period, there were no changes to report with respect to the valuation approach and/or valuation techniques discussed above.
Securities and other assets that cannot be priced according to the methods described above are valued based on pricing methodologies approved by the Board. In the event that unobservable inputs are used when determining such valuations, the securities will be classified as Level 3 in the fair value hierarchy.
When determining the fair value of securities, some of the factors influencing the valuation include: the nature of any restrictions on disposition of the securities; assessment of the general liquidity of the securities; the issuer’s financial condition and the markets in which it does business; the cost of the investment; the size of the holding and the capitalization of the issuer; the prices of any recent transactions or bids/offers for such securities or any comparable securities; any available analyst media or other reports or information deemed reliable by the Manager regarding the issuer or the markets or industry in which it operates. Using fair value to price securities may result in a value that is different from a security’s most recent closing price and from the price used by other unaffiliated mutual funds to calculate their net asset values.
Illiquid Securities:Pursuant to Rule22e-4 under the 1940 Act, the Fund has adopted a Board approved Liquidity Risk Management Program (“LRMP”) that requires, among other things, that the Fund limit its illiquid investments that are assets to no more than 15% of net assets. Illiquid securities are those that, because of the absence of a readily available market or due to legal or contractual restrictions on resale, may not reasonably be expected to be sold or disposed of in current market conditions in seven calendar days or less without the
| | | | |
| PGIM Absolute Return Bond Fund | | | 133 | |
Notes to Financial Statements(continued)
sale or disposition significantly changing the market value of the investment. The Fund may find it difficult to sell illiquid securities at the time considered most advantageous by its subadviser and may incur transaction costs that would not be incurred in the sale of securities that were freely marketable.
Restricted Securities:Securities acquired in unregistered, private sales from the issuing company or from an affiliate of the issuer are considered restricted as to disposition under federal securities law (“restricted securities”). Such restricted securities are valued pursuant to the valuation procedures noted above. Restricted securities that would otherwise be considered illiquid investments pursuant to the Fund’s LRMP because of legal restrictions on resale to the general public may be traded among qualified institutional buyers under Rule 144A of the Securities Act of 1933. Therefore, these Rule 144A securities, as well as commercial paper that is sold in private placements under Section 4(2) of the Securities Act of 1933, may be classified higher than “illiquid” under the LRMP (i.e. “moderately liquid” or “less liquid” investments). However, the liquidity of the Fund’s investments in restricted securities could be impaired if trading does not develop or declines.
Connecticut Avenue Securities (CAS) and Structured Agency Credit Risk (STACR):The Fund purchased government controlled Fannie Mae and Freddie Mac securities that transfer most of the cost of defaults to private investors including the Fund. These are insurance-like products that are called CAS by Fannie Mae and STACR securities by Freddie Mac. Payments on the securities are based primarily on the performance of a reference pool of underlying mortgages. With such securities, the Fund could lose some or all of its principal if the underlying mortgages experience credit defaults.
Foreign Currency Translation:The books and records of the Fund are maintained in U.S. dollars. Foreign currency amounts are translated into U.S. dollars on the following basis:
(i) market value of investment securities, other assets and liabilities—at the current rates of exchange;
(ii) purchases and sales of investment securities, income and expenses—at the rates of exchange prevailing on the respective dates of such transactions.
Although the net assets of the Fund are presented at the foreign exchange rates and market values at the close of the period, the Fund does not generally isolate that portion of the results of operations arising as a result of changes in the foreign exchange rates from the fluctuations arising from changes in the market prices of long-term portfolio securities held at the end of the period. Similarly, the Fund does not isolate the effect of changes in foreign exchange rates from the fluctuations arising from changes in the market prices of long-term portfolio securities sold during the period. Accordingly, holding period realized foreign
currency gains (losses) are included in the reported net realized gains (losses) on investment transactions. Notwithstanding the above, the Fund does isolate the effect of fluctuations in foreign currency exchange rates when determining the gain (loss) upon the sale or maturity of foreign currency denominated debt obligations; such amounts are included in net realized gains (losses) on foreign currency transactions.
Additionally, net realized gains (losses) on foreign currency transactions represent net foreign exchange gains (losses) from the disposition of holdings of foreign currencies, currency gains (losses) realized between the trade and settlement dates on forward currency transactions, and the difference between the amounts of interest, dividends and foreign withholding taxes recorded on the Fund’s books and the U.S. dollar equivalent amounts actually received or paid. Net unrealized currency gains (losses) arise from valuing foreign currency denominated assets and liabilities (other than investments) at period end exchange rates.
Forward and Cross Currency Contracts:A forward currency contract is a commitment to purchase or sell a foreign currency at a future date at a negotiated forward rate. The Fund enters into forward currency contracts, as defined in the prospectus, in order to hedge its exposure to changes in foreign currency exchange rates on its foreign portfolio holdings or on specific receivables and payables denominated in a foreign currency and to gain exposure to certain currencies. The contracts are valued daily at current forward exchange rates and any unrealized gain (loss) is included in net unrealized appreciation (depreciation) on forward and cross currency contracts. Gain (loss) is realized on the settlement date of the contract equal to the difference between the settlement value of the original and negotiated forward contracts. This gain (loss), if any, is included in net realized gain (loss) on forward and cross currency contract transactions. Risks may arise upon entering into these contracts from the potential inability of the counterparties to meet the terms of their contracts. Forward currency contracts involve risks from currency exchange rate and credit risk in excess of the amounts reflected on the Statement of Assets and Liabilities. The Fund’s maximum risk of loss from counterparty credit risk is the net value of the cash flows to be received from the counterparty at the end of the contract’s life. A cross currency contract is a forward contract where a specified amount of one foreign currency will be exchanged for a specified amount of another foreign currency.
Options:The Fund purchased or wrote options in order to hedge against adverse market movements or fluctuations in value caused by changes in prevailing interest rates, value of equities or foreign currency exchange rates with respect to securities or financial instruments which the Fund currently owns or intends to purchase. The Fund may also use options to gain additional market exposure. The Fund’s principal reason for writing options is to realize, through receipt of premiums, a greater current return than would be realized on the underlying security alone. When the Fund purchases an option, it pays a premium and an amount equal to that premium is recorded as an asset. When the Fund writes an option, it receives a premium and an amount equal to that premium is recorded as a liability. The asset or liability is adjusted daily to reflect the current market value of the option. If an option expires unexercised, the Fund realizes a gain (loss) to the extent of the premium received or
| | | | |
| PGIM Absolute Return Bond Fund | | | 135 | |
Notes to Financial Statements(continued)
paid. If an option is exercised, the premium received or paid is recorded as an adjustment to the proceeds from the sale or the cost of the purchase in determining whether the Fund has realized a gain (loss). The difference between the premium and the amount received or paid at the closing of a purchase or sale transaction is also treated as a realized gain (loss). Gain (loss) on purchased options is included in net realized gain (loss) on investment transactions. Gain (loss) on written options is presented separately as net realized gain (loss) on options written transactions.
The Fund, as writer of an option, may have no control over whether the underlying securities or financial instruments may be sold (called) or purchased (put). As a result, the Fund bears the market risk of an unfavorable change in the price of the security or financial instrument underlying the written option. The Fund, as purchaser of an OTC option, bears the risk of the potential inability of the counterparties to meet the terms of their contracts. With exchange-traded options contracts, there is minimal counterparty credit risk to the Fund since the exchanges’ clearinghouse acts as counterparty to all exchange-traded options and guarantees the options contracts against default.
When the Fund writes an option on a swap, an amount equal to any premium received by the Fund is recorded as a liability and is subsequently adjusted to the current market value of the written option on the swap. If a call option on a swap is exercised, the Fund becomes obligated to pay a fixed interest rate (noted as the strike price) and receive a variable interest rate on a notional amount. If a put option on a swap is exercised, the Fund becomes obligated to pay a variable interest rate and receive a fixed interest rate (noted as the strike price) on a notional amount. Premiums received from writing options on swaps that expire or are exercised are treated as realized gains upon the expiration or exercise of such options on swaps. The risk associated with writing put and call options on swaps is that the Fund will be obligated to be party to a swap agreement if an option on a swap is exercised.
Financial Futures Contracts:A financial futures contract is an agreement to purchase (long) or sell (short) an agreed amount of securities at a set price for delivery on a future date. Upon entering into a financial futures contract, the Fund is required to pledge to the broker an amount of cash and/or other assets equal to a certain percentage of the contract amount. This amount is known as the “initial margin.” Subsequent payments, known as “variation margin,” are made or received by the Fund each day, depending on the daily fluctuations in the value of the underlying security. Such variation margin is recorded for financial statement purposes on a daily basis as unrealized gain (loss). When the contract expires or is closed, the gain (loss) is realized and is presented in the Statement of Operations as net realized gain (loss) on futures transactions.
The Fund invested in financial futures contracts in order to hedge its existing portfolio securities, or securities the Fund intends to purchase, against fluctuations in value caused
by changes in prevailing interest rates. Should interest rates move unexpectedly, the Fund may not achieve the anticipated benefits of the financial futures contracts and may realize a loss. The use of futures transactions involves the risk of imperfect correlation in movements in the price of futures contracts, interest rates and the underlying hedged assets. Since futures contracts are exchange-traded, there is minimal counterparty credit risk to the Fund since the exchanges’ clearinghouse acts as counterparty to all exchange-traded futures and guarantees the futures contracts against default.
Bank Loans:The Fund invested in bank loans. Bank loans include fixed and floating rate loans that are privately negotiated between a corporate borrower and one or more financial institutions, including, but not limited to, term loans, revolvers, and other instruments issued in the bank loan market. The Fund may acquire interests in loans directly (by way of assignment from the selling institution) or indirectly (by way of the purchase of a participation interest from the selling institution). Under a bank loan assignment, the Fund generally will succeed to all the rights and obligations of an assigning lending institution and becomes a lender under the loan agreement with the relevant borrower in connection with that loan. Under a bank loan participation, the Fund generally will have a contractual relationship only with the lender, not with the relevant borrower. As a result, the Fund generally will have the right to receive payments of principal, interest, and any fees to which it is entitled only from the lender selling the participation and only upon receipt by the lender of the payments from the relevant borrower. The Fund may not directly benefit from the collateral supporting the debt obligation in which it has purchased the participation. As a result, the Fund will assume the credit risk of both the borrower and the institution selling the participation to the Fund.
Swap Agreements:The Fund entered into certain types of swap agreements detailed in the disclosures below. A swap agreement is an agreement to exchange the return generated by one instrument for the return generated by another instrument. Swap agreements are negotiated in the OTC market and may be executed either directly with a counterparty(“OTC-traded”) or through a central clearing facility, such as a registered exchange. Swap agreements are valued daily at current market value and any change in value is included in the net unrealized appreciation (depreciation) on swap agreements. Centrally cleared swaps pay or receive an amount known as “variation margin”, based on daily changes in the valuation of the swap contract. Any upfront premiums paid and received are shown as swap premiums paid and swap premiums received in the Statement of Assets and Liabilities. Risk of loss may exceed amounts recognized on the Statement of Assets and Liabilities. Swap agreements outstanding at period end, if any, are listed on the Schedule of Investments.
Interest Rate Swaps:Interest rate swaps represent an agreement between counterparties to exchange cash flows based on the difference between two interest rates, applied to a notional principal amount for a specified period. The Fund is subject to interest rate risk exposure in the normal course of pursuing its investment objective. The Fund used interest rate swaps to maintain its ability to generate steady cash flow by receiving a stream of fixed rate payments or to increase exposure to prevailing market rates by receiving floating rate
| | | | |
| PGIM Absolute Return Bond Fund | | | 137 | |
Notes to Financial Statements(continued)
payments. The Fund’s maximum risk of loss from counterparty credit risk is the discounted net present value of the cash flows to be received from the counterparty over the contract’s remaining life.
Inflation Swaps:The Fund entered into inflation swap agreements to protect against fluctuations in inflation rates. Inflation swaps are characterized by one party paying a fixed rate in exchange for a floating rate that is derived from an inflation index, such as the Consumer Price Index or UK Retail Price Index. Inflation swaps subject the Fund to interest rate risk.
Credit Default Swaps (“CDS”):CDS involve one party (the protection buyer) making a stream of payments to another party (the protection seller) in exchange for the right to receive a specified payment in the event of a default or as a result of a default (collectively a “credit event”) for the referenced entity (typically corporate issues or sovereign issues of an emerging country) on its obligation; or in the event of a write-down, principal shortfall, interest shortfall or default of all or part of the referenced entities comprising a credit index.
The Fund is subject to credit risk in the normal course of pursuing its investment objectives, and as such, has entered into CDS contracts to provide a measure of protection against defaults or to take an active long or short position with respect to the likelihood of a particular issuer’s default or the reference entity’s credit soundness. CDS contracts generally trade based on a spread which represents the cost a protection buyer has to pay the protection seller. The protection buyer is said to be short the credit as the value of the contract rises the more the credit deteriorates. The value of the CDS contract increases for the protection buyer if the spread increases. The Fund’s maximum risk of loss from counterparty credit risk for purchased CDS is the inability of the counterparty to honor the contract up to the notional value due to a credit event.
As a seller of protection on credit default swap agreements, the Fund generally receives an agreed upon payment from the buyer of protection throughout the term of the swap, provided no credit event occurs. As the seller, the Fund effectively increases its investment risk because, in addition to its total net assets, the Fund may be subject to investment exposure on the notional amount of the swap.
The maximum amount of the payment that the Fund, as a seller of protection, could be required to make under a credit default swap agreement would be equal to the notional amount of the underlying security or index contract as a result of a credit event. This potential amount will be partially offset by any recovery values of the respective referenced obligations, or net amounts received from the settlement of buy protection credit default swap agreements which the Fund entered into for the same referenced entity or index. As a
buyer of protection, the Fund generally receives an amount up to the notional value of the swap if a credit event occurs.
Implied credit spreads, represented in absolute terms, utilized in determining the market value of credit default swap agreements where the Fund is the seller of protection as of period end are disclosed in the footnotes to the Schedule of Investments, if applicable. These spreads serve as indicators of the current status of the payment/performance risk and represent the likelihood of default risk for the credit derivative. The implied credit spread of a particular referenced entity reflects the cost of buying/selling protection and may include upfront payments required to enter into the agreement. Wider credit spreads and increased market value in absolute terms, when compared to the notional amount of the swap, represent a deterioration of the referenced entity’s credit soundness and a greater likelihood of risk of default or other credit event occurring as defined under the terms of the agreement.
Total Return Swaps:In a total return swap, one party receives payments based on the market value of the security or the commodity involved, or total return of a specific referenced asset, such as an equity, index or bond, and in return pays a defined amount. The Fund is subject to risk exposures associated with the referenced asset in the normal course of pursuing its investment objectives. The Fund entered into total return swaps to manage its exposure to a security or an index. The Fund’s maximum risk of loss from counterparty credit risk is the change in the value of the security, in the Fund’s favor, from the point of entering into the contract.
Master Netting Arrangements:The Trust, on behalf of the Fund, is subject to various Master Agreements, or netting arrangements, with select counterparties. These are agreements which a subadviser may have negotiated and entered into on behalf of all or a portion of the Fund. A master netting arrangement between the Fund and the counterparty permits the Fund to offset amounts payable by the Fund to the same counterparty against amounts to be received; and by the receipt of collateral from the counterparty by the Fund to cover the Fund’s exposure to the counterparty. However, there is no assurance that such mitigating factors are easily enforceable. In addition to master netting arrangements, the right to set-off exists when all the conditions are met such that each of the parties owes the other determinable amounts, the reporting party has the right to set-off the amount owed with the amount owed by the other party, the reporting party intends to set-off and the right of set-off is enforceable by law. During the reporting period, there was no intention to settle on a net basis and all amounts are presented on a gross basis on the Statement of Assets and Liabilities.
The Trust, on behalf of the Fund, is a party to International Swaps and Derivatives Association, Inc. (“ISDA”) Master Agreements with certain counterparties that govern OTC derivative and foreign exchange contracts entered into from time to time. The Master Agreements may contain provisions regarding, among other things, the parties’ general obligations, representations, agreements, collateral requirements, events of default and early termination. With respect to certain counterparties, in accordance with the terms of the
| | | | |
| PGIM Absolute Return Bond Fund | | | 139 | |
Notes to Financial Statements(continued)
Master Agreements, collateral posted to the Fund is held in a segregated account by the Fund’s custodian and with respect to those amounts which can be sold or re-pledged, is presented in the Schedule of Investments. Collateral pledged by the Fund is segregated by the Fund’s custodian and identified in the Schedule of Investments. Collateral can be in the form of cash or debt securities issued by the U.S. Government or related agencies or other securities as agreed to by the Fund and the applicable counterparty. Collateral requirements are determined based on the Fund’s net position with each counterparty. Termination events applicable to the Fund may occur upon a decline in the Fund’s net assets below a specified threshold over a certain period of time. Termination events applicable to counterparties may occur upon a decline in the counterparty’s long-term and short-term credit ratings below a specified level. In each case, upon occurrence, the other party may elect to terminate early and cause settlement of all derivative and foreign exchange contracts outstanding, including the payment of any losses and costs resulting from such early termination, as reasonably determined by the terminating party. Any decision by one or more of the Fund’s counterparties to elect early termination could impact the Fund’s future derivative activity.
In addition to each instrument’s primary underlying risk exposure (e.g. interest rate, credit, equity or foreign exchange, etc.), swap agreements involve, to varying degrees, elements of credit, market and documentation risk. Such risks involve the possibility that no liquid market for these agreements will exist, the counterparty to the agreement may default on its obligation to perform or disagree on the contractual terms of the agreement, and changes in net interest rates will be unfavorable. In connection with these agreements, securities in the portfolio may be identified or received as collateral from the counterparty in accordance with the terms of the respective swap agreements to provide or receive assets of value and to serve as recourse in the event of default or bankruptcy/insolvency of either party. Such OTC derivative agreements include conditions which, when materialized, give the counterparty the right to cause an early termination of the transactions under those agreements. Any election by the counterparty for early termination of the contract(s) may impact the amounts reported on financial statements.
As of October 31, 2019, the Fund has not met conditions under such agreements which give the counterparty the right to call for an early termination.
Forward currency contracts, forward rate agreements, written options, short sales, swaps and financial futures contracts involve elements of both market and credit risk in excess of the amounts reflected on the Statement of Assets and Liabilities. Such risks may be mitigated by engaging in master netting arrangements.
Payment-In-Kind:The Fund invested in the open market or receive pursuant to debt restructuring, securities that pay-in-kind (PIK) the interest due on such debt instruments. The PIK interest, computed at the contractual rate specified, is added to the existing
principal balance of the debt when issued bonds have same terms as the bond or recorded as a separate bond when terms are different from the existing debt, and is recorded as interest income.
Securities Lending:The Fund lends its portfolio securities to banks and broker-dealers. The loans are secured by collateral at least equal to the market value of the securities loaned. Collateral pledged by each borrower is invested in an affiliated money market fund and is marked to market daily, based on the previous day’s market value, such that the value of the collateral exceeds the value of the loaned securities. In the event of significant appreciation in value of securities on loan on the last business day of the reporting period, the financial statements may reflect a collateral value that is less than the market value of the loaned securities. Such shortfall is remedied as described above. Loans are subject to termination at the option of the borrower or the Fund. Upon termination of the loan, the borrower will return to the Fund securities identical to the loaned securities. Should the borrower of the securities fail financially, the Fund has the right to repurchase the securities in the open market using the collateral.
The Fund recognizes income, net of any rebate and securities lending agent fees, for lending its securities in the form of fees or interest on the investment of any cash received as collateral. The borrower receives all interest and dividends from the securities loaned and such payments are passed back to the lender in amounts equivalent thereto. The Fund also continues to recognize any unrealized gain (loss) in the market price of the securities loaned and on the change in the value of the collateral invested that may occur during the term of the loan. In addition, realized gain (loss) is recognized on changes in the value of the collateral invested upon liquidation of the collateral. Net earnings from securities lending are disclosed on the Statement of Operations as “Income from securities lending, net”.
Securities Transactions and Net Investment Income:Securities transactions are recorded on the trade date. Realized gains (losses) from investment and currency transactions are calculated on the specific identification method. Dividend income is recorded on the ex-date, or for certain foreign securities, when the Fund becomes aware of such dividends. Interest income, including amortization of premium and accretion of discount on debt securities, as required, is recorded on the accrual basis. Expenses are recorded on an accrual basis, which may require the use of certain estimates by management that may differ from actual. Net investment income or loss (other than class specific expenses and waivers, which are allocated as noted below) and unrealized and realized gains (losses) are allocated daily to each class of shares based upon the relative proportion of adjusted net assets of each class at the beginning of the day. Class specific expenses and waivers, where applicable, are charged to the respective share classes. Class specific expenses include distribution fees and distribution fee waivers, shareholder servicing fees, transfer agent’s fees and expenses, registration fees and fee waivers and/or expense reimbursements, as applicable.
Taxes:It is the Fund’s policy to continue to meet the requirements of the Internal Revenue Code applicable to regulated investment companies and to distribute all of its taxable net
| | | | |
| PGIM Absolute Return Bond Fund | | | 141 | |
Notes to Financial Statements(continued)
investment income and capital gains, if any, to its shareholders. Therefore, no federal income tax provision is required. Withholding taxes on foreign dividends, interest and capital gains, if any, are recorded, net of reclaimable amounts, at the time the related income is earned.
Dividends and Distributions: The Fund expects to declare dividends of its net investment income daily and pay such dividends monthly. Distributions of net realized capital and currency gains, if any, are declared and paid at least annually. Dividends and distributions to shareholders, which are determined in accordance with federal income tax regulations and which may differ from generally accepted accounting principles, are recorded on the ex-date. Permanent book/tax differences relating to income and gain (loss) are reclassified between total distributable earnings (loss) and paid-in capital in excess of par, as appropriate.
Estimates: The preparation of financial statements requires management to make estimates and assumptions that affect the reported amounts and disclosures in the financial statements. Actual results could differ from those estimates.
2. Agreements
The Trust, on behalf of the Fund, has a management agreement with the Manager. Pursuant to this agreement, the Manager has responsibility for all investment advisory services and supervises the subadviser’s performance of such services. In addition, under the management agreement, the Manager provides all of the administrative functions necessary for the organization, operation and management of the Fund. The Manager administers the corporate affairs of the Fund and, in connection therewith, furnishes the Fund with office facilities, together with those ordinary clerical and bookkeeping services which are not being furnished by the Fund’s custodian and the Fund’s transfer agent. The Manager is also responsible for the staffing and management of dedicated groups of legal, marketing, compliance and related personnel necessary for the operation of the Fund. The legal, marketing, compliance and related personnel are also responsible for the management and oversight of the various service providers to the Fund, including, but not limited to, the custodian, transfer agent, and accounting agent.
The Manager has entered into a subadvisory agreement with PGIM, Inc., which provides subadvisory services to the Fund through its PGIM Fixed Income unit. The subadvisory agreement provides that PGIM, Inc. will furnish investment advisory services in connection with the management of the Fund. In connection therewith, PGIM, Inc. is obligated to keep certain books and records of the Fund. The Manager pays for the services of PGIM, Inc., the cost of compensation of officers of the Fund, occupancy and certain clerical and bookkeeping costs of the Fund. The Fund bears all other costs and expenses.
The management fee paid to the Manager is accrued daily and payable monthly at an annual rate of 0.65% of the Fund’s average daily net assets up to and including $2.5 billion, 0.625% of the next $2.5 billion and 0.60% of the average daily net assets in excess of $5 billion. The effective management fee rate before any waivers and/or expense reimbursements was 0.65% for the year ended October 31, 2019.
The Manager has contractually agreed, through February 28, 2021, to limit total annual operating expenses after fee waivers and/or expense reimbursements to 0.73% of average daily net assets for Class Z shares and 0.70% of average daily net assets for Class R6 shares. This contractual waiver excludes interest, brokerage, taxes (such as income and foreign withholdings taxes, stamp duty and deferred tax expenses), acquired fund fees and expenses, extraordinary expenses, and certain other Fund expenses such as dividend and interest expense and broker charges on short sales. Where applicable, the Manager agrees to waive management fees or shared operating expenses an any share class to the same extent that it waives similar expenses on any other share class. In addition, total annual operating expenses for Class R6 shares will not exceed total annual operating expenses for Class Z shares. Fees and/or expenses waived and/or reimbursed by the Manager may be recouped by the Manager within the same fiscal year during which such waiver/reimbursement is made if such recoupment can be realized without exceeding the expense limit in effect at the time of the recoupment for that fiscal year.
The Trust, on behalf of the Fund, has a distribution agreement with Prudential Investment Management Services LLC (“PIMS”), which acts as the distributor of the Class A, Class C, Class Z and Class R6 shares of the Fund. The Fund compensates PIMS for distributing and servicing the Fund’s Class A and Class C shares, pursuant to the plans of distribution (the “Distribution Plans”), regardless of expenses actually incurred by PIMS. The distribution fees are accrued daily and payable monthly. No distribution or service fees are paid to PIMS as distributor of the Class Z or Class R6 shares of the Fund.
Pursuant to the Distribution Plans, the Fund compensates PIMS for distribution related activities at an annual rate of up to 0.25% and 1% of the average daily net assets of the Class A and Class C shares, respectively.
For the year ended October 31, 2019, PIMS received $237,575 in front-end sales charges resulting from sales of Class A shares. Additionally, for the year ended October 31, 2019, PIMS received $15,652 and $15,939 in contingent deferred sales charges imposed upon redemptions by certain Class A and Class C shareholders, respectively. From these fees, PIMS paid such sales charges to broker-dealers, who in turn paid commissions to salespersons and incurred other distribution costs.
PGIM Investments, PGIM, Inc. and PIMS are indirect, wholly-owned subsidiaries of Prudential Financial, Inc. (“Prudential”).
| | | | |
| PGIM Absolute Return Bond Fund | | | 143 | |
Notes to Financial Statements(continued)
3. Other Transactions with Affiliates
Prudential Mutual Fund Services LLC (“PMFS”), an affiliate of PGIM Investments and an indirect, wholly-owned subsidiary of Prudential, serves as the Trust’s transfer agent. Transfer agent’s fees and expenses in the Statement of Operations include certain out-of-pocket expenses paid to non-affiliates, where applicable.
The Fund may invest its overnight sweep cash in the PGIM Core Ultra Short Bond Fund (the “Core Fund”), and its securities lending cash collateral in the PGIM Institutional Money Market Fund (the “Money Market Fund”), each a series of Prudential Investment Portfolios 2, registered under the 1940 Act and managed by PGIM Investments. Through the Fund’s investments in the mentioned underlying funds, PGIM Investments and/or its affiliates are paid fees or reimbursed for providing their services. In addition to the realized and unrealized gains on investments in the Core Fund and Money Market Fund, earnings from such investments are disclosed on the Statement of Operations as “Affiliated dividend income” and “Income from securities lending, net”, respectively.
The Fund may enter into certain securities purchase or sale transactions under Board approved Rule 17a-7 procedures. Rule 17a-7 is an exemptive rule under the 1940 Act, that subject to certain conditions, permits purchase and sale transactions among affiliated investment companies, or between an investment company and a person that is affiliated solely by reason of having a common (or affiliated) investment adviser, common directors, and/or common officers. Pursuant to the Rule 17a-7 procedures and consistent with guidance issued by the SEC, the Trust’s Chief Compliance Officer (“CCO”) prepares a quarterly summary of all such transactions for submission to the Board, together with the CCO’s written representation that all such 17a-7 transactions were effected in accordance with the Fund’s Rule 17a-7 procedures. For the year ended October 31, 2019, no 17a-7 transactions were entered into by the Fund.
4. Portfolio Securities
The aggregate cost of purchases and proceeds from sales of portfolio securities (excluding short-term investments and U.S. Government securities) for the year ended October 31, 2019, were $1,046,809,592 and $1,189,339,040, respectively.
A summary of the cost of purchases and proceeds from sales of shares of affiliated investments for the year ended October 31, 2019, is presented as follows:
| | | | | | | | | | | | | | | | | | | | | | | | | | | | | | |
Value,
Beginning
of Year | | | Cost of
Purchases | | | Proceeds
from Sales | | | Change in
Unrealized
Gain
(Loss) | | | Realized
Gain
(Loss) | | | Value,
End of
Year | | | Shares,
End of
Year | | | Income | |
| | PGIM Core Ultra Short Bond Fund* | |
| $ | 193,786,688 | | | $ | 1,039,682,045 | | | $ | 1,055,291,647 | | | $ | — | | | $ | — | | | $ | 178,177,086 | | | | 178,177,086 | | | $ | 1,336,337 | |
| | PGIM Institutional Money Market Fund* | |
| | 80,235,942 | | | | 317,741,081 | | | | 253,887,113 | | | | 26,281 | | | | (7,171 | ) | | | 144,109,020 | | | | 144,080,204 | | | | 140,530 | ** |
| | | | | | | | | | | | | | | | | | | | | | | | | | | | | | |
| $ | 274,022,630 | | | $ | 1,357,423,126 | | | $ | 1,309,178,760 | | | $ | 26,281 | | | $ | (7,171 | ) | | $ | 322,286,106 | | | | | | | $ | 1,476,867 | |
| | | | | | | | | | | | | | | | | | | | | | | | | | | | | | |
| * | The Fund did not have any capital gain distributions during the reporting period. |
| ** | This amount is included in “Income from securities lending, net” on the Statement of Operations. |
5. Distributions and Tax Information
Distributions to shareholders, which are determined in accordance with federal income tax regulations and which may differ from generally accepted accounting principles, are recorded on the ex-date.
For the year ended October 31, 2019, the tax character of dividends paid by the Fund was $145,536,478 of ordinary income. For the year ended October 31, 2018, the tax character of dividends paid by the Fund was $79,658,360 of ordinary income.
As of October 31, 2019, the accumulated undistributed earnings on a tax basis were $21,641,548 of ordinary income and $50,211,567 of long-term capital gains.
The United States federal income tax basis of the Fund’s investments and the net unrealized depreciation as of October 31, 2019 were as follows:
| | | | | | |
Tax Basis | | Gross
Unrealized
Appreciation | | Gross
Unrealized
Depreciation | | Net
Unrealized
Depreciation |
| $2,399,776,877 | | $234,875,179 | | $(384,072,658) | | $(149,197,479) |
The differences between book basis and tax basis were primarily attributable to deferred losses on wash sales, straddle loss deferral, future and forward contracts, difference in the treatment of premium amortization and other cost basis differences between financial and tax accounting.
The Fund utilized approximately $100,645,000 of its capital loss carryforward to offset net taxable gains realized in the fiscal year ended October 31, 2019.
The Manager has analyzed the Fund’s tax positions taken on federal, state and local income tax returns for all open tax years and has concluded that no provision for income tax is required in the Fund’s financial statements for the current reporting period. Since tax
| | | | |
| PGIM Absolute Return Bond Fund | | | 145 | |
Notes to Financial Statements(continued)
authorities can examine previously filed tax returns, the Fund’s U.S. federal and state tax returns for each of the four fiscal years up to the most recent fiscal year ended October 31, 2019 are subject to such review.
6. Capital and Ownership
The Fund offers Class A, Class C, Class Z and Class R6 shares. Class A shares are sold with a maximum front-end sales charge of 3.25%. Investors who purchase $1 million or more (prior to July 15, 2019, $500,000 or more on or after July 15, 2019) of Class A shares and sell those shares within 12 months of purchase are subject to a contingent deferred sales charge (“CDSC”) of 1.00% on sales although these purchases are not subject to a front-end sales charge. The Class A CDSC is waived for certain retirement and/or benefit plans. A special exchange privilege is also available for shareholders who qualified to purchase Class A shares at net asset value. Class C shares are sold with a CDSC of 1% on sales made within 12 months of purchase. Class C shares will automatically convert to Class A shares on a monthly basis approximately 10 years after purchase. Class Z and Class R6 shares are not subject to any sales or redemption charge and are available exclusively for sale to a limited group of investors.
Under certain circumstances, an exchange may be made from specified share classes of the Fund to one or more other share classes of the Fund as presented in the table of transactions in shares of beneficial interest.
The Trust has authorized an unlimited number of shares of beneficial interest of the Fund at $0.001 par value per share, divided into four classes, designated Class A, Class C, Class Z and Class R6.
At reporting period end, nine shareholders of record, each holding greater than 5% of the Fund, held 85% of the Fund’s outstanding shares.
Transactions in shares of beneficial interest were as follows:
| | | | | | | | |
Class A | | Shares | | | Amount | |
Year ended October 31, 2019: | | | | | | | | |
Shares sold | | | 4,442,099 | | | $ | 43,073,266 | |
Shares issued in reinvestment of dividends and distributions | | | 689,827 | | | | 6,662,583 | |
Shares reacquired | | | (6,378,260 | ) | | | (61,800,433 | ) |
| | | | | | | | |
Net increase (decrease) in shares outstanding before conversion | | | (1,246,334 | ) | | | (12,064,584 | ) |
Shares issued upon conversion from other share class(es) | | | 1,689,345 | | | | 16,378,210 | |
Shares reacquired upon conversion into other share class(es) | | | (884,547 | ) | | | (8,584,142 | ) |
| | | | | | | | |
Net increase (decrease) in shares outstanding | | | (441,536 | ) | | $ | (4,270,516 | ) |
| | | | | | | | |
Year ended October 31, 2018: | | | | | | | | |
Shares sold | | | 7,737,083 | | | $ | 76,766,423 | |
Shares issued in reinvestment of dividends and distributions | | | 363,796 | | | | 3,599,637 | |
Shares reacquired | | | (3,470,620 | ) | | | (34,386,767 | ) |
| | | | | | | | |
Net increase (decrease) in shares outstanding before conversion | | | 4,630,259 | | | | 45,979,293 | |
Shares issued upon conversion from other share class(es) | | | 542,478 | | | | 5,369,357 | |
Shares reacquired upon conversion into other share class(es) | | | (2,125,033 | ) | | | (20,970,487 | ) |
| | | | | | | | |
Net increase (decrease) in shares outstanding | | | 3,047,704 | | | $ | 30,378,163 | |
| | | | | | | | |
Class C | | | | | | |
Year ended October 31, 2019: | | | | | | | | |
Shares sold | | | 2,984,321 | | | $ | 29,019,658 | |
Shares issued in reinvestment of dividends and distributions | | | 448,654 | | | | 4,344,042 | |
Shares reacquired | | | (2,673,798 | ) | | | (25,968,771 | ) |
| | | | | | | | |
Net increase (decrease) in shares outstanding before conversion | | | 759,177 | | | | 7,394,929 | |
Shares reacquired upon conversion into other share class(es) | | | (1,023,713 | ) | | | (9,963,113 | ) |
| | | | | | | | |
Net increase (decrease) in shares outstanding | | | (264,536 | ) | | $ | (2,568,184 | ) |
| | | | | | | | |
Year ended October 31, 2018: | | | | | | | | |
Shares sold | | | 3,141,833 | | | $ | 31,222,637 | |
Shares issued in reinvestment of dividends and distributions | | | 219,367 | | | | 2,176,489 | |
Shares reacquired | | | (1,939,289 | ) | | | (19,269,209 | ) |
| | | | | | | | |
Net increase (decrease) in shares outstanding before conversion | | | 1,421,911 | | | | 14,129,917 | |
Shares reacquired upon conversion into other share class(es) | | | (506,587 | ) | | | (5,024,802 | ) |
| | | | | | | | |
Net increase (decrease) in shares outstanding | | | 915,324 | | | $ | 9,105,115 | |
| | | | | | | | |
Class Z | | | | | | |
Year ended October 31, 2019: | | | | | | | | |
Shares sold | | | 119,018,503 | | | $ | 1,158,478,172 | |
Shares issued in reinvestment of dividends and distributions | | | 10,582,780 | | | | 102,671,705 | |
Shares reacquired | | | (139,843,800 | ) | | | (1,358,727,738 | ) |
| | | | | | | | |
Net increase (decrease) in shares outstanding before conversion | | | (10,242,517 | ) | | | (97,577,861 | ) |
Shares issued upon conversion from other share class(es) | | | 1,195,240 | | | | 11,644,060 | |
Shares reacquired upon conversion into other share class(es) | | | (1,001,402 | ) | | | (9,741,366 | ) |
| | | | | | | | |
Net increase (decrease) in shares outstanding | | | (10,048,679 | ) | | $ | (95,675,167 | ) |
| | | | | | | | |
Year ended October 31, 2018: | | | | | | | | |
Shares sold | | | 137,049,289 | | | $ | 1,363,011,556 | |
Shares issued in reinvestment of dividends and distributions | | | 4,728,423 | | | | 46,966,093 | |
Shares reacquired | | | (50,759,062 | ) | | | (504,637,628 | ) |
| | | | | | | | |
Net increase (decrease) in shares outstanding before conversion | | | 91,018,650 | | | | 905,340,021 | |
Shares issued upon conversion from other share class(es) | | | 2,629,628 | | | | 26,073,554 | |
Shares reacquired upon conversion into other share class(es) | | | (2,814,518 | ) | | | (27,907,422 | ) |
| | | | | | | | |
Net increase (decrease) in shares outstanding | | | 90,833,760 | | | $ | 903,506,153 | |
| | | | | | | | |
| | | | |
| PGIM Absolute Return Bond Fund | | | 147 | |
Notes to Financial Statements(continued)
| | | | | | | | |
Class R6 | | Shares | | | Amount | |
Year ended October 31, 2019: | | | | | | | | |
Shares sold | | | 2,344,839 | | | $ | 22,713,720 | |
Shares issued in reinvestment of dividends and distributions | | | 530,628 | | | | 5,124,287 | |
Shares reacquired | | | (15,116,581 | ) | | | (147,940,595 | ) |
| | | | | | | | |
Net increase (decrease) in shares outstanding before conversion | | | (12,241,114 | ) | | | (120,102,588 | ) |
Shares issued upon conversion from other share class(es) | | | 30,127 | | | | 291,306 | |
Shares reacquired upon conversion into other share class(es) | | | (2,578 | ) | | | (24,955 | ) |
| | | | | | | | |
Net increase (decrease) in shares outstanding | | | (12,213,565 | ) | | $ | (119,836,237 | ) |
| | | | | | | | |
Year ended October 31, 2018: | | | | | | | | |
Shares sold | | | 10,649,660 | | | $ | 105,859,341 | |
Shares issued in reinvestment of dividends and distributions | | | 971,802 | | | | 9,616,572 | |
Shares reacquired | | | (28,032,106 | ) | | | (277,317,405 | ) |
| | | | | | | | |
Net increase (decrease) in shares outstanding before conversion | | | (16,410,644 | ) | | | (161,841,492 | ) |
Shares issued upon conversion from other share class(es) | | | 2,284,964 | | | | 22,552,844 | |
Shares reacquired upon conversion into other share class(es) | | | (9,358 | ) | | | (93,044 | ) |
| | | | | | | | |
Net increase (decrease) in shares outstanding | | | (14,135,038 | ) | | $ | (139,381,692 | ) |
| | | | | | | | |
7. Borrowings
The Trust, on behalf of the Fund, along with other affiliated registered investment companies (the “Funds”), is a party to a Syndicated Credit Agreement (“SCA”) with a group of banks. The purpose of the SCA is to provide an alternative source of temporary funding for capital share redemptions. The table below provides details of the current SCA in effect at the reporting period-end as well as the prior SCA.
| | | | |
| | | Current SCA | | Prior SCA |
Term of Commitment | | 10/3/2019 – 10/1/2020 | | 10/4/2018 – 10/2/2019 |
Total Commitment | | $ 900 million | | $ 900 million |
Annualized Commitment Fee on the Unused Portion of the SCA | | 0.15% | | 0.15% |
Annualized Interest Rate on Borrowings | | 1.20% plus the higher of (1) the effective federal funds rate, (2) the one-month LIBOR rate or (3) zero percent | | 1.25% plus the higher of (1) the effective federal funds rate, (2) the one-month LIBOR rate or (3) zero percent |
Certain affiliated registered investment companies that are parties to the SCA include portfolios that are subject to a predetermined mathematical formula used to manage certain benefit guarantees offered under variable annuity contracts. The formula may result in large scale asset flows into and out of these portfolios. Consequently, these portfolios may be more likely to utilize the SCA for purposes of funding redemptions. It may be possible for those portfolios to fully exhaust the committed amount of the SCA, thereby requiring the Manager to allocate available funding per a Board-approved methodology designed to treat the Funds in the SCA equitably.
The Fund utilized the SCA during the year ended October 31, 2019. The average daily balance for the 35 days that the Fund had loans outstanding during the period was approximately $6,045,143, borrowed at a weighted average interest rate of 3.72%. The maximum loan outstanding amount during the period was $41,712,000. At October 31, 2019, the Fund did not have an outstanding loan amount.
8. Risks of Investing in the Fund
The Fund’s risks include, but are not limited to, some or all of the risks discussed below:
Bond Obligations Risk:The Fund’s holdings, share price, yield and total return may fluctuate in response to bond market movements. The value of bonds may decline for issuer-related reasons, including management performance, financial leverage and reduced demand for the issuer’s goods and services. Certain types of fixed-income obligations also may be subject to “call and redemption risk,” which is the risk that the issuer may call a bond held by the Fund for redemption before it matures and the Fund may not be able to reinvest at the same level and therefore would earn less income.
Derivatives Risk:Derivatives involve special risks and costs and may result in losses to the Fund. The successful use of derivatives requires sophisticated management, and, to the extent that derivatives are used, the Fund will depend on the subadviser’s ability to analyze and manage derivative transactions. The prices of derivatives may move in unexpected ways, especially in abnormal market conditions. Some derivatives are “leveraged” and therefore may magnify or otherwise increase investment losses to the Fund. Other risks arise from the potential inability to terminate or sell derivatives positions. A liquid secondary market may not always exist for the Fund’s derivatives positions. In fact, many OTC derivative instruments will not have liquidity beyond the counterparty to the instrument. OTC derivative instruments also involve the risk that the other party will not meet its obligations to the Fund.
Foreign Securities Risk:The Fund’s investments in securities of foreign issuers or issuers with significant exposure to foreign markets involve additional risk. Foreign countries in which the Fund may invest may have markets that are less liquid, less regulated and more volatile than US markets. The value of the Fund’s investments may decline because of factors affecting the particular issuer as well as foreign markets and issuers generally, such as unfavorable government actions, and political or financial instability.
Interest Rate Risk:The value of an investment may go down when interest rates rise. A rise in rates tends to have a greater impact on the prices of longer term or duration securities. When interest rates fall, the issuers of debt obligations may prepay principal more quickly than expected, and the Fund may be required to reinvest the proceeds at a lower interest rate. This is referred to as “prepayment risk.” When interest rates rise, debt obligations may be repaid more slowly than expected, and the value of the Fund’s holdings may fall sharply. This is referred to as “extension risk. The Fund may face a heightened level of interest rate risk as a result of the U.S. Federal Reserve Board’s policies. The Fund’s investments may
| | | | |
| PGIM Absolute Return Bond Fund | | | 149 | |
Notes to Financial Statements(continued)
lose value if short-term or long-term interest rates rise sharply or in a manner not anticipated by the subadviser.
Liquidity Risk:The Fund may invest in instruments that trade in lower volumes and are less liquid than other investments. Liquidity risk exists when particular investments made by the Fund are difficult to purchase or sell. Liquidity risk includes the risk that the Fund may make investments that may become less liquid in response to market developments or adverse investor perceptions. Investments that are illiquid or that trade in lower volumes may be more difficult to value. If the Fund is forced to sell these investments to pay redemption proceeds or for other reasons, the Fund may lose money. In addition, when there is no willing buyer and investments may not reasonably be expected to be sold or disposed of in current market conditions in seven calendar days or less without the sale or disposition significantly changing the market value of the investment, the Fund may incur higher transaction costs when executing trade orders of a given size. The reduction in dealer market-making capacity in the fixed-income markets that has occurred in recent years also has the potential to reduce liquidity. An inability to sell a portfolio position can adversely affect the Fund’s value or prevent the Fund from being able to take advantage of other investment opportunities.
Market and Credit Risk:Securities markets may be volatile and the market prices of the Fund’s securities may decline. Securities fluctuate in price based on changes in an issuer’s financial condition and overall market and economic conditions. If the market prices of the securities owned by the Fund fall, the value of an investment in the Fund will decline. Additionally, the Fund may also be exposed to credit risk in the event that an issuer or guarantor fails to perform or that an institution or entity with which the Fund has unsettled or open transactions defaults.
Mortgage-Backed and Other Asset-Backed Securities Risk:Mortgage-related securities are usually pass-through instruments that pay investors a share of all interest and principal payments from an underlying pool of fixed or adjustable rate mortgages. Asset-backed securities are another type of pass-through instruments that pays interest based upon the cash flow of an underlying pool of assets, such as automobile loans or credit card receivables. Asset-backed securities can also be collateralized by a portfolio of corporate bonds including junk bonds or other securities. The values of mortgage-backed and asset-backed securities vary with changes in interest rates and are particularly sensitive to prepayments (the risk is that the underlying debt instruments may be partially or wholly prepaid during periods of falling interest rates, which could require the Fund to reinvest in lower yielding debt instruments) or extensions (the risk is that rising interest rates may cause the underlying debt instruments to be repaid more slowly by the debtor, causing the value of the securities to fall). Asset-backed securities are also subject to liquidity risk.
9. Recent Accounting Pronouncements and Reporting Updates
In August 2018, the FASB issued Accounting Standards Update (“ASU”) No. 2018-13, which changes certain fair value measurement disclosure requirements. The new ASU, in addition to other modifications and additions, removes the requirement to disclose the amount and reasons for transfers between Level 1 and Level 2 of the fair value hierarchy, and the Fund’s policy for the timing of transfers between levels. The amendments are effective for financial statements issued for fiscal years beginning after December 15, 2019, and interim periods within those fiscal years. The Manager has evaluated the implications of certain provisions of the ASU and has determined to early adopt aspects related to the removal and modification of certain fair value measurement disclosures under the ASU effective immediately. The Manager continues to evaluate certain other provisions of the ASU and does not expect a material impact to financial statement disclosures.
| | | | |
| PGIM Absolute Return Bond Fund | | | 151 | |
Financial Highlights
| | | | | | | | | | | | | | | | | | | | |
| Class A Shares | |
| | | Year Ended October 31, | |
| | | 2019 | | | 2018 | | | 2017 | | | 2016 | | | 2015 | |
| Per Share Operating Performance(a): | | | | | | | | | | | | | | | | | | | | |
| Net Asset Value, Beginning of Year | | | $9.82 | | | | $9.93 | | | | $9.59 | | | | $9.48 | | | | $9.79 | |
| Income (loss) from investment operations: | | | | | | | | | | | | | | | | | | | | |
| Net investment income (loss) | | | 0.31 | | | | 0.27 | | | | 0.23 | | | | 0.25 | | | | 0.23 | |
| Net realized and unrealized gain (loss) on investment and foreign currency transactions | | | 0.13 | | | | (0.05 | ) | | | 0.33 | | | | 0.06 | | | | (0.30 | ) |
| Total from investment operations | | | 0.44 | | | | 0.22 | | | | 0.56 | | | | 0.31 | | | | (0.07 | ) |
| Less Dividends and Distributions: | | | | | | | | | | | | | | | | | | | | |
| Dividends from net investment income | | | (0.53 | ) | | | (0.33 | ) | | | (0.22 | ) | | | (0.15 | ) | | | (0.21 | ) |
| Tax return of capital distributions | | | - | | | | - | | | | - | | | | (0.05 | ) | | | (0.03 | ) |
| Total dividends and distributions | | | (0.53 | ) | | | (0.33 | ) | | | (0.22 | ) | | | (0.20 | ) | | | (0.24 | ) |
| Net asset value, end of year | | | $9.73 | | | | $9.82 | | | | $9.93 | | | | $9.59 | | | | $9.48 | |
| Total Return(b): | | | 4.71% | | | | 2.21% | | | | 5.95% | | | | 3.36% | | | | (0.78)% | |
| |
| Ratios/Supplemental Data: | | | | | |
| Net assets, end of year (000) | | | $142,879 | | | | $148,609 | | | | $119,969 | | | | $197,713 | | | | $315,214 | |
| Average net assets (000) | | | $147,612 | | | | $142,613 | | | | $145,290 | | | | $246,082 | | | | $383,950 | |
| Ratios to average net assets(c)(d)(e): | | | | | | | | | | | | | | | | | | | | |
| Expenses after waivers and/or expense reimbursement | | | 1.02% | | | | 1.03% | | | | 1.15% | | | | 1.15% | | | | 1.15% | |
| Expenses before waivers and/or expense reimbursement | | | 1.02% | | | | 1.04% | | | | 1.22% | | | | 1.24% | | | | 1.24% | |
| Net investment income (loss) | | | 3.24% | | | | 2.72% | | | | 2.31% | | | | 2.67% | | | | 2.39% | |
| Portfolio turnover rate(f) | | | 50% | | | | 52% | | | | 72% | | | | 38% | | | | 64% | |
| (a) | Calculated based on average shares outstanding during the year. |
| (b) | Total return does not consider the effects of sales loads. Total return is calculated assuming a purchase of a share on the first day and a sale on the last day of each year reported and includes reinvestment of dividends and distributions, if any. Total returns may reflect adjustments to conform to generally accepted accounting principles. |
| (c) | Does not include expenses of the underlying funds in which the Fund invests. |
| (d) | Effective March 9, 2015, the contractual distribution and service (12b-1) fees were reduced from 0.30% to 0.25% of the average daily net assets and the 0.05% contractual 12b-1 fee waiver was terminated. |
| (e) | Effective August 1, 2017, class specific expenses include transfer agent fees and expenses and registration fees, which are charged to their respective share class. |
| (f) | The Fund’s portfolio turnover rate is calculated in accordance with regulatory requirements, without regard to transactions involving short-term investments and certain derivatives. If such transactions were included, the Fund’s portfolio turnover rate may be higher. |
See Notes to Financial Statements.
| | | | | | | | | | | | | | | | | | | | |
| Class C Shares | |
| | | Year Ended October 31, | |
| | | 2019 | | | 2018 | | | 2017 | | | 2016 | | | 2015 | |
| Per Share Operating Performance(a): | | | | | | | | | | | | | | | | | | | | |
| Net Asset Value, Beginning of Year | | | $9.85 | | | | $9.96 | | | | $9.62 | | | | $9.51 | | | | $9.82 | |
| Income (loss) from investment operations: | | | | | | | | | | | | | | | | | | | | |
| Net investment income (loss) | | | 0.24 | | | | 0.19 | | | | 0.15 | | | | 0.18 | | | | 0.16 | |
| Net realized and unrealized gain (loss) on investment and foreign currency transactions | | | 0.13 | | | | (0.05 | ) | | | 0.34 | | | | 0.06 | | | | (0.31 | ) |
| Total from investment operations | | | 0.37 | | | | 0.14 | | | | 0.49 | | | | 0.24 | | | | (0.15 | ) |
| Less Dividends and Distributions: | | | | | | | | | | | | | | | | | | | | |
| Dividends from net investment income | | | (0.46 | ) | | | (0.25 | ) | | | (0.15 | ) | | | (0.10 | ) | | | (0.13 | ) |
| Tax return of capital distributions | | | - | | | | - | | | | - | | | | (0.03 | ) | | | (0.03 | ) |
| Total dividends and distributions | | | (0.46 | ) | | | (0.25 | ) | | | (0.15 | ) | | | (0.13 | ) | | | (0.16 | ) |
| Net asset value, end of year | | | $9.76 | | | | $9.85 | | | | $9.96 | | | | $9.62 | | | | $9.51 | |
| Total Return(b): | | | 3.80% | | | | 1.43% | | | | 5.16% | | | | 2.59% | | | | (1.51)% | |
| |
| Ratios/Supplemental Data: | | | | | |
| Net assets, end of year (000) | | | $103,133 | | | | $106,734 | | | | $98,789 | | | | $118,092 | | | | $161,679 | |
| Average net assets (000) | | | $107,605 | | | | $102,866 | | | | $106,174 | | | | $135,510 | | | | $183,419 | |
| Ratios to average net assets(c)(d): | | | | | | | | | | | | | | | | | | | | |
| Expenses after waivers and/or expense reimbursement | | | 1.78% | | | | 1.79% | | | | 1.90% | | | | 1.90% | | | | 1.90% | |
| Expenses before waivers and/or expense reimbursement | | | 1.78% | | | | 1.80% | | | | 1.97% | | | | 1.99% | | | | 1.97% | |
| Net investment income (loss) | | | 2.46% | | | | 1.93% | | | | 1.58% | | | | 1.91% | | | | 1.62% | |
| Portfolio turnover rate(e) | | | 50% | | | | 52% | | | | 72% | | | | 38% | | | | 64% | |
| (a) | Calculated based on average shares outstanding during the year. |
| (b) | Total return does not consider the effects of sales loads. Total return is calculated assuming a purchase of a share on the first day and a sale on the last day of each year reported and includes reinvestment of dividends and distributions, if any. Total returns may reflect adjustments to conform to generally accepted accounting principles. |
| (c) | Does not include expenses of the underlying funds in which the Fund invests. |
| (d) | Effective August 1, 2017, class specific expenses include transfer agent fees and expenses and registration fees, which are charged to their respective share class. |
| (e) | The Fund’s portfolio turnover rate is calculated in accordance with regulatory requirements, without regard to transactions involving short-term investments and certain derivatives. If such transactions were included, the Fund’s portfolio turnover rate may be higher. |
See Notes to Financial Statements.
| | | | |
| PGIM Absolute Return Bond Fund | | | 153 | |
Financial Highlights(continued)
| | | | | | | | | | | | | | | | | | | | |
| Class Z Shares | |
| | | Year Ended October 31, | |
| | | 2019 | | | 2018 | | | 2017 | | | 2016 | | | 2015 | |
| Per Share Operating Performance(a): | | | | | | | | | | | | | | | | | | | | |
| Net Asset Value, Beginning of Year | | | $9.86 | | | | $9.97 | | | | $9.64 | | | | $9.52 | | | | $9.83 | |
| Income (loss) from investment operations: | | | | | | | | | | | | | | | | | | | | |
| Net investment income (loss) | | | 0.34 | | | | 0.30 | | | | 0.25 | | | | 0.27 | | | | 0.25 | |
| Net realized and unrealized gain (loss) on investment and foreign currency transactions | | | 0.13 | | | | (0.06 | ) | | | 0.33 | | | | 0.08 | | | | (0.30 | ) |
| Total from investment operations | | | 0.47 | | | | 0.24 | | | | 0.58 | | | | 0.35 | | | | (0.05 | ) |
| Less Dividends and Distributions: | | | | | | | | | | | | | | | | | | | | |
| Dividends from net investment income | | | (0.56 | ) | | | (0.35 | ) | | | (0.25 | ) | | | (0.17 | ) | | | (0.23 | ) |
| Tax return of capital distributions | | | - | | | | - | | | | - | | | | (0.06 | ) | | | (0.03 | ) |
| Total dividends and distributions | | | (0.56 | ) | | | (0.35 | ) | | | (0.25 | ) | | | (0.23 | ) | | | (0.26 | ) |
| Net asset value, end of year | | | $9.77 | | | | $9.86 | | | | $9.97 | | | | $9.64 | | | | $9.52 | |
| Total Return(b): | | | 5.00% | | | | 2.48% | | | | 6.08% | | | | 3.71% | | | | (0.53)% | |
| |
| Ratios/Supplemental Data: | | | | | |
| Net assets, end of year (000) | | | $2,040,949 | | | | $2,159,518 | | | | $1,277,401 | | | | $1,019,254 | | | | $1,755,667 | |
| Average net assets (000) | | | $2,155,699 | | | | $1,679,461 | | | | $1,121,943 | | | | $1,396,060 | | | | $2,029,397 | |
| Ratios to average net assets(c)(d): | | | | | | | | | | | | | | | | | | | | |
| Expenses after waivers and/or expensere imbursement | | | 0.73% | | | | 0.75% | | | | 0.90% | | | | 0.90% | | | | 0.90% | |
| Expenses before waivers and/or expensere imbursement | | | 0.79% | | | | 0.81% | | | | 0.96% | | | | 0.99% | | | | 0.97% | |
| Net investment income (loss) | | | 3.51% | | | | 3.01% | | | | 2.59% | | | | 2.91% | | | | 2.61% | |
| Portfolio turnover rate(e) | | | 50% | | | | 52% | | | | 72% | | | | 38% | | | | 64% | |
| (a) | Calculated based on average shares outstanding during the year. |
| (b) | Total return is calculated assuming a purchase of a share on the first day and a sale on the last day of each year reported and includes reinvestment of dividends and distributions, if any. Total returns may reflect adjustments to conform to generally accepted accounting principles. |
| (c) | Does not include expenses of the underlying funds in which the Fund invests. |
| (d) | Effective August 1, 2017, class specific expenses include transfer agent fees and expenses and registration fees, which are charged to their respective share class. |
| (e) | The Fund’s portfolio turnover rate is calculated in accordance with regulatory requirements, without regard to transactions involving short-term investments and certain derivatives. If such transactions were included, the Fund’s portfolio turnover rate may be higher. |
See Notes to Financial Statements.
| | | | | | | | | | | | | | | | | | | | |
| Class R6 Shares | |
| | | Year Ended October 31, | |
| | | 2019 | | | 2018 | | | 2017 | | | 2016 | | | 2015 | |
| Per Share Operating Performance(a): | | | | | | | | | | | | | | | | | | | | |
| Net Asset Value, Beginning of Year | | | $9.82 | | | | $9.94 | | | | $9.61 | | | | $9.49 | | | | $9.81 | |
| Income (loss) from investment operations: | | | | | | | | | | | | | | | | | | | | |
| Net investment income (loss) | | | 0.35 | | | | 0.29 | | | | 0.26 | | | | 0.28 | | | | 0.25 | |
| Net realized and unrealized gain (loss) on investment and foreign currency transactions | | | 0.12 | | | | (0.05 | ) | | | 0.32 | | | | 0.07 | | | | (0.30 | ) |
| Total from investment operations | | | 0.47 | | | | 0.24 | | | | 0.58 | | | | 0.35 | | | | (0.05 | ) |
| Less Dividends and Distributions: | | | | | | | | | | | | | | | | | | | | |
| Dividends from net investment income | | | (0.57 | ) | | | (0.36 | ) | | | (0.25 | ) | | | (0.17 | ) | | | (0.24 | ) |
| Tax return of capital distributions | | | - | | | | - | | | | - | | | | (0.06 | ) | | | (0.03 | ) |
| Total dividends and distributions | | | (0.57 | ) | | | (0.36 | ) | | | (0.25 | ) | | | (0.23 | ) | | | (0.27 | ) |
| Net asset value, end of year | | | $9.72 | | | | $9.82 | | | | $9.94 | | | | $9.61 | | | | $9.49 | |
| Total Return(b): | | | 4.94% | | | | 2.42% | | | | 6.15% | | | | 3.81% | | | | (0.57)% | |
| |
| Ratios/Supplemental Data: | | | | | |
| Net assets, end of year (000) | | | $82,538 | | | | $203,372 | | | | $346,253 | | | | $175,887 | | | | $151,294 | |
| Average net assets (000) | | | $88,570 | | | | $329,668 | | | | $270,229 | | | | $158,967 | | | | $125,910 | |
| Ratios to average net assets(c)(d): | | | | | | | | | | | | | | | | | | | | |
| Expenses after waivers and/or expense reimbursement | | | 0.70% | | | | 0.74% | | | | 0.90% | | | | 0.84% | | | | 0.85% | |
| Expenses before waivers and/or expense reimbursement | | | 0.71% | | | | 0.75% | | | | 0.90% | | | | 0.84% | | | | 0.85% | |
| Net investment income (loss) | | | 3.59% | | | | 2.95% | | | | 2.64% | | | | 2.97% | | | | 2.61% | |
| Portfolio turnover rate(e) | | | 50% | | | | 52% | | | | 72% | | | | 38% | | | | 64% | |
| (a) | Calculated based on average shares outstanding during the year. |
| (b) | Total return is calculated assuming a purchase of a share on the first day and a sale on the last day of each year reported and includes reinvestment of dividends and distributions, if any. Total returns may reflect adjustments to conform to generally accepted accounting principles. |
| (c) | Does not include expenses of the underlying funds in which the Fund invests. |
| (d) | Effective August 1, 2017, class specific expenses include transfer agent fees and expenses and registration fees, which are charged to their respective share class. |
| (e) | The Fund’s portfolio turnover rate is calculated in accordance with regulatory requirements, without regard to transactions involving short-term investments and certain derivatives. If such transactions were included, the Fund’s portfolio turnover rate may be higher. |
See Notes to Financial Statements.
| | | | |
| PGIM Absolute Return Bond Fund | | | 155 | |
Report of Independent Registered Public Accounting Firm
To the Shareholders of PGIM Absolute Return Bond Fund and Board of Trustees Prudential Investment Portfolios 9:
Opinion on the Financial Statements
We have audited the accompanying statement of assets and liabilities of PGIM Absolute Return Bond Fund, a series of Prudential Investment Portfolios 9, (the Fund), including the schedule of investments, as of October 31, 2019, the related statement of operations for the year then ended, the statements of changes in net assets for each of the years in thetwo-year period ended October 31, 2019, and the related notes (collectively, the financial statements) and the financial highlights for the years indicated therein. In our opinion, the financial statements and financial highlights present fairly, in all material respects, the financial position of the Fund as of October 31, 2019, the results of its operations for the year then ended, the changes in its net assets for each of the years in thetwo-year period ended October 31, 2019, and the financial highlights for the years indicated therein, in conformity with U.S. generally accepted accounting principles.
Basis for Opinion
These financial statements and financial highlights are the responsibility of the Fund’s management. Our responsibility is to express an opinion on these financial statements and financial highlights based on our audits. We are a public accounting firm registered with the Public Company Accounting Oversight Board (United States) (PCAOB) and are required to be independent with respect to the Fund in accordance with the U.S. federal securities laws and the applicable rules and regulations of the Securities and Exchange Commission and the PCAOB.
We conducted our audits in accordance with the standards of the PCAOB. Those standards require that we plan and perform the audit to obtain reasonable assurance about whether the financial statements and financial highlights are free of material misstatement, whether due to error or fraud. Our audits included performing procedures to assess the risks of material misstatement of the financial statements and financial highlights, whether due to error or fraud, and performing procedures that respond to those risks. Such procedures included examining, on a test basis, evidence regarding the amounts and disclosures in the financial statements and financial highlights. Such procedures also included confirmation of securities owned as of October 31, 2019, by correspondence with the custodian, transfer agent, and brokers, or by other appropriate auditing procedures when replies were not received. Our audits also included evaluating the accounting principles used and significant estimates made by management, as well as evaluating the overall presentation of the financial statements and financial highlights. We believe that our audits provide a reasonable basis for our opinion.

We have served as the auditor of one or more PGIM and/or Prudential Retail investment companies since 2003.
New York, New York
December 19, 2019
Income Tax Information(unaudited)
For the year ended October 31, 2019, the Fund reports the maximum amount allowable but not less than 59.27% as interest related dividends in accordance with Section 871(k)(1) and 881(e)(1) of the Internal Revenue Code.
In January 2020, you will be advised on IRS Form 1099-DIV or substituteForm 1099-DIV as to the federal tax status of the distributions received by you in calendar year 2019.
We are required by Massachusetts, Missouri and Oregon to inform you that dividends which have been derived from interest on federal obligations are not taxable to shareholders providing the Mutual Fund meets certain requirements mandated by the respective state’s taxing authorities. We are pleased to report that 1.12% of the dividends paid by the Fund qualifies for such deduction.
Please consult your tax adviser or state/local authorities to properly report this information on your tax return. If you have any questions concerning the amounts listed above, please call your financial adviser.
| | | | |
| PGIM Absolute Return Bond Fund | | | 157 | |
INFORMATION ABOUT BOARD MEMBERS AND OFFICERS (unaudited)
Information about Board Members and Officers of the Fund is set forth below. Board Members who are not deemed to be “interested persons” of the Fund, as defined in the 1940 Act, are referred to as “Independent Board Members.” Board Members who are deemed to be “interested persons” of the Fund are referred to as “Interested Board Members.” The Board Members are responsible for the overall supervision of the operations of the Fund and perform the various duties imposed on the directors of investment companies by the 1940 Act. The Board in turn elects the Officers, who are responsible for administering theday-to-day operations of the Fund.
| | | | | | |
| Independent Board Members | | | | |
| | | | |
Name Date of Birth Position(s) Portfolios Overseen | | Principal Occupation(s) During Past Five Years | | Other Directorships Held During Past Five Years | | Length of
Board Service |
| | | | |
Ellen S. Alberding 3/11/58 Board Member Portfolios Overseen: 96 | | President and Board Member, The Joyce Foundation (charitable foundation) (since 2002); Vice Chair, City Colleges of Chicago (community college system) (2011-2015); Trustee, National Park Foundation (charitable foundation for national park system) (2009-2018); Trustee, Economic Club of Chicago (since 2009); Trustee, Loyola University (since 2018). | | None. | | Since September 2013 |
| | | | |
Kevin J. Bannon 7/13/52 Board Member Portfolios Overseen: 96 | | Retired; Managing Director (April2008-May 2015) and Chief Investment Officer (October 2008-November 2013) of Highmount Capital LLC (registered investment adviser); formerly Executive Vice President and Chief Investment Officer (April 1993-August 2007) of Bank of New York Company; President (May2003-May 2007) of BNY Hamilton Family of Mutual Funds. | | Director of Urstadt Biddle Properties (equity real estate investment trust) (since September 2008). | | Since July 2008 |
PGIM Absolute Return Bond Fund
| | | | | | |
Independent Board Members | | | | |
| | | | |
Name Date of Birth Position(s) Portfolios Overseen | | Principal Occupation(s) During Past Five Years | | Other Directorships Held During Past Five Years | | Length of Board Service |
| | | | |
Linda W. Bynoe 7/9/52 Board Member Portfolios Overseen: 96 | | President and Chief Executive Officer (since March 1995) and formerly Chief Operating Officer (December 1989-February 1995) of Telemat Ltd. (management consulting); formerly Vice President (January 1985-June 1989) at Morgan Stanley & Co. (broker-dealer). | | Director of Anixter International, Inc. (communication products distributor) (since January 2006); Director of Northern Trust Corporation (financial services) (since April 2006); Trustee of Equity Residential (residential real estate) (since December 2009). | | Since March 2005 |
| | | | |
Barry H. Evans 11/2/60 Board Member Portfolios Overseen: 95 | | Retired; formerly President (2005 – 2016), Global Chief Operating Officer (2014– 2016), Chief Investment Officer – Global Head of Fixed Income (1998-2014), and various portfolio manager roles (1986-2006), Manulife Asset Management U.S. | | Formerly Director, Manulife Trust Company (2011-2018); formerly Director, Manulife Asset Management Limited (2015-2017); formerly Chairman of the Board of Directors of Manulife Asset Management U.S. (2005-2016); formerly Chairman of the Board, Declaration Investment Management and Research (2008-2016). | | Since September 2017 |
| | | | |
Keith F. Hartstein 10/13/56 Board Member & Independent Chair Portfolios Overseen: 96 | | Retired; Member (since November 2014) of the Governing Council of the Independent Directors Council (organization of independent mutual fund directors); formerly President and Chief Executive Officer (2005-2012), Senior Vice President (2004-2005), Senior Vice President of Sales and Marketing (1997-2004), and various executive management positions (1990-1997), John Hancock Funds, LLC (asset management); Chairman, Investment Company Institute’s Sales Force Marketing Committee (2003-2008). | | None. | | Since September 2013 |
Visit our website at pgiminvestments.com
| | | | | | |
| Independent Board Members | | | | |
| | | | |
Name Date of Birth Position(s) Portfolios Overseen | | Principal Occupation(s) During Past Five Years | | Other Directorships Held During Past Five Years | | Length of Board Service |
| | | | |
Laurie Simon Hodrick 9/29/62 Board Member Portfolios Overseen: 95 | | A. Barton Hepburn Professor Emerita of Economics in the Faculty of Business, Columbia Business School (since 2018); Visiting Professor of Law, Stanford Law School (since 2015); Visiting Fellow at the Hoover Institution, Stanford University (since 2015); Sole Member, ReidCourt LLC (since 2008) (a consulting firm); formerly A. Barton Hepburn Professor of Economics in the Faculty of Business, Columbia Business School (1996-2017); formerly Managing Director, Global Head of Alternative Investment Strategies, Deutsche Bank (2006-2008). | | Independent Director, Synnex Corporation (since April 2019) (information technology); Independent Director, Kabbage, Inc. (since July 2018) (financial services); Independent Director, Corporate Capital Trust (2017-2018) (a business development company). | | Since September 2017 |
| | | | |
Michael S. Hyland, CFA 10/4/45 Board Member Portfolios Overseen: 96 | | Retired (since February 2005); formerly Senior Managing Director (July 2001-February 2005) of Bear Stearns & Co, Inc.; Global Partner, INVESCO (1999-2001); Managing Director and President of Salomon Brothers Asset Management (1989-1999). | | None. | | Since July 2008 |
| | | | |
Brian K. Reid 9/22/61 Board Member Portfolios Overseen: 95 | | Retired; formerly Chief Economist for the Investment Company Institute (ICI) (2005-2017); formerly Senior Economist and Director of Industry and Financial Analysis at the ICI (1998-2004); formerly Senior Economist, Industry and Financial Analysis at the ICI (1996-1998); formerly Staff Economist at the Federal Reserve Board (1989-1996); Director, ICI Mutual Insurance Company (2012-2017). | | None. | | Since March 2018 |
PGIM Absolute Return Bond Fund
| | | | | | |
| Independent Board Members | | | | |
| | | | |
Name Date of Birth Position(s) Portfolios Overseen | | Principal Occupation(s) During Past Five Years | | Other Directorships Held During Past Five Years | | Length of Board Service |
| | | | |
Grace C. Torres 6/28/59 Board Member Portfolios Overseen: 95 | | Retired; formerly Treasurer and Principal Financial and Accounting Officer of the PGIM Funds, Target Funds, Advanced Series Trust, Prudential Variable Contract Accounts and The Prudential Series Fund (1998-June 2014); Assistant Treasurer (March 1999-June 2014) and Senior Vice President (September 1999-June 2014) of PGIM Investments LLC; Assistant Treasurer (May 2003-June 2014) and Vice President (June 2005-June 2014) of AST Investment Services, Inc.; Senior Vice President and Assistant Treasurer (May 2003-June 2014) of Prudential Annuities Advisory Services, Inc. | | Formerly Director (July 2015-January 2018) of Sun Bancorp, Inc. N.A. and Sun National Bank; Director (since January 2018) of OceanFirst Financial Corp. and OceanFirst Bank. | | Since November 2014 |
| | | | | | |
| Interested Board Members | | | | |
| | | | |
Name Date of Birth Position(s) Portfolios Overseen | | Principal Occupation(s) During Past Five Years | | Other Directorships Held During Past Five Years | | Length of Board Service |
| | | | |
Stuart S. Parker 10/5/62 Board Member & President Portfolios Overseen: 96 | | President of PGIM Investments LLC (formerly known as Prudential Investments LLC) (since January 2012); Executive Vice President of Prudential Investment Management Services LLC (since December 2012); formerly Executive Vice President of Jennison Associates LLC and Head of Retail Distribution of PGIM Investments LLC (June 2005-December 2011). | | None. | | Since January 2012 |
Visit our website at pgiminvestments.com
| | | | | | |
| Interested Board Members | | | | |
| | | | |
Name Date of Birth Position(s) Portfolios Overseen | | Principal Occupation(s) During Past Five Years | | Other Directorships Held During Past Five Years | | Length of Board Service |
| | | | |
Scott E. Benjamin 5/21/73 Board Member & Vice President Portfolios Overseen: 96 | | Executive Vice President (since June 2009) of PGIM Investments LLC; Executive Vice President (June 2009-June 2012) and Vice President (since June 2012) of Prudential Investment Management Services LLC; Executive Vice President (since September 2009) of AST Investment Services, Inc.; Senior Vice President of Product Development and Marketing, PGIM Investments (since February 2006); formerly Vice President of Product Development and Product Management, PGIM Investments LLC (2003-2006). | | None. | | Since March 2010 |
| | | | |
| Fund Officers(a) | | | | |
| | | |
Name Date of Birth Fund Position | | Principal Occupation(s) During Past Five Years | | Length of Service as Fund Officer |
| | | |
Raymond A. O’Hara 9/11/55 Chief Legal Officer | | Vice President and Corporate Counsel (since July 2010) of Prudential Insurance Company of America (Prudential); Vice President (March 2011-Present) of Pruco Life Insurance Company and Pruco Life Insurance Company of New Jersey; Vice President and Corporate Counsel (March 2011-Present) of Prudential Annuities Life Assurance Corporation; Chief Legal Officer of PGIM Investments LLC (since June 2012); Chief Legal Officer of Prudential Mutual Fund Services LLC (since June 2012) and Corporate Counsel of AST Investment Services, Inc. (since June 2012); formerly Assistant Vice President and Corporate Counsel (September 2008-July 2010) of The Hartford Financial Services Group, Inc.; formerly Associate (September 1980-December 1987) and Partner (January 1988–August 2008) of Blazzard & Hasenauer, P.C. (formerly, Blazzard, Grodd & Hasenauer, P.C.). | | Since June 2012 |
PGIM Absolute Return Bond Fund
| | | | |
| Fund Officers(a) | | | | |
| | | |
Name Date of Birth Fund Position | | Principal Occupation(s) During Past Five Years | | Length of Service as Fund Officer |
| | | |
Dino Capasso 8/19/74 Chief Compliance Officer | | Chief Compliance Officer (July 2019-Present) of PGIM Investments LLC; Chief Compliance Officer (July 2019-Present) of the PGIM Funds, Target Funds, Advanced Series Trust, The Prudential Series Fund, Prudential’s Gibraltar Fund, Inc., PGIM Global High Yield Fund, Inc., and PGIM High Yield Bond Fund, Inc.; Vice President and Deputy Chief Compliance Officer (June 2017-2019) of PGIM Investments LLC; formerly, Senior Vice President and Senior Counsel (January 2016-June 2017), and Vice President and Counsel (February 2012-December 2015) of Pacific Investment Management Company LLC. | | Since March 2018 |
| | | |
Andrew R. French 12/22/62 Secretary | | Vice President of PGIM Investments LLC (December 2018-Present); formerly Vice President and Corporate Counsel (February 2010-December 2018) of Prudential; formerly Director and Corporate Counsel (2006-2010) of Prudential; Vice President and Assistant Secretary (since January 2007) of PGIM Investments LLC; Vice President and Assistant Secretary (since January 2007) of Prudential Mutual Fund Services LLC. | | Since October 2006 |
| | | |
Jonathan D. Shain 8/9/58 Assistant Secretary | | Vice President and Corporate Counsel (since August 1998) of Prudential; Vice President and Assistant Secretary (since May 2001) of PGIM Investments LLC; Vice President and Assistant Secretary (since February 2001) of Prudential Mutual Fund Services LLC; formerly Vice President and Assistant Secretary (May 2003-June 2005) of AST Investment Services, Inc. | | Since May 2005 |
| | | |
Claudia DiGiacomo 10/14/74 Assistant Secretary | | Vice President and Corporate Counsel (since January 2005) of Prudential; Vice President and Assistant Secretary of PGIM Investments LLC (since December 2005); formerly Associate at Sidley Austin Brown & Wood LLP (1999-2004). | | Since December 2005 |
| | | |
Diana N. Huffman 4/14/82 Assistant Secretary | | Vice President and Corporate Counsel (since September 2015) of Prudential; formerly Associate at Willkie Farr & Gallagher LLP (2009-2015). | | Since March 2019 |
| | | |
Kelly A. Coyne 8/8/68 Assistant Secretary | | Director, Investment Operations of Prudential Mutual Fund Services LLC (since 2010). | | Since March 2015 |
| | | |
Christian J. Kelly 5/5/75 Treasurer and Principal Financial and Accounting Officer | | Vice President, Head of Fund Administration of PGIM Investments LLC (since November 2018); formerly, Director of Fund Administration of Lord Abbett & Co. LLC (2009-2018), Treasurer and Principal Accounting Officer of the Lord Abbett Family of Funds (2017-2018); Director of Accounting, Avenue Capital Group (2008-2009); Senior Manager, Investment Management Practice of Deloitte & Touche LLP (1998-2007). | | Since January 2019 |
Visit our website at pgiminvestments.com
| | | | |
| Fund Officers(a) | | | | |
| | | |
Name Date of Birth Fund Position | | Principal Occupation(s) During Past Five Years | | Length of Service as Fund Officer |
| | | |
Lana Lomuti 6/7/67 Assistant Treasurer | | Vice President (since 2007) and Director (2005-2007), within PGIM Investments Fund Administration; formerly Assistant Treasurer (December 2007-February 2014) of The Greater China Fund, Inc. | | Since April 2014 |
| | | |
Russ Shupak 10/08/73 Assistant Treasurer | | Vice President (since 2017) and Director (2013-2017), within PGIM Investments Fund Administration. | | Since October 2019 |
| | | |
Deborah Conway 3/26/69 Assistant Treasurer | | Vice President (since 2017) and Director (2007-2017), within PGIM Investments Fund Administration. | | Since October 2019 |
| | | |
Elyse M. McLaughlin 1/20/74 Assistant Treasurer | | Vice President (since 2017) and Director (2011-2017), within PGIM Investments Fund Administration. | | Since October 2019 |
| | | |
Charles H. Smith 1/11/73 Anti-Money Laundering Compliance Officer | | Vice President, Corporate Compliance, Anti-Money Laundering Unit (since January 2015) of Prudential; committee member of the American Council of Life Insurers Anti-Money Laundering and Critical Infrastructure Committee (since January 2016); formerly Global Head of Economic Sanctions Compliance at AIG Property Casualty (February 2007-December 2014); Assistant Attorney General at the New York State Attorney General’s Office, Division of Public Advocacy. (August 1998-January 2007). | | Since January 2017 |
(a) Excludes Mr. Parker and Mr. Benjamin, interested Board Members who also serve as President and Vice President, respectively.
Explanatory Notes to Tables:
| ∎ | | Board Members are deemed to be “Interested,” as defined in the 1940 Act, by reason of their affiliation with PGIM Investments LLC and/or an affiliate of PGIM Investments LLC. |
| ∎ | | Unless otherwise noted, the address of all Board Members and Officers is c/o PGIM Investments LLC, 655 Broad Street, Newark, New Jersey 07102-4410. |
| ∎ | | There is no set term of office for Board Members or Officers. The Board Members have adopted a retirement policy, which calls for the retirement of Board Members on December 31 of the year in which they reach the age of 75. |
| ∎ | | “Other Directorships Held” includes only directorships of companies required to register or file reports with the SEC under the 1934 Act (that is, “public companies”) or other investment companies registered under the 1940 Act. |
| ∎ | | _ “Portfolios Overseen” includes all investment companies managed by PGIM Investments LLC. The investment companies for which PGIM Investments LLC serves as manager include the PGIM Funds, The Prudential Variable Contract Accounts, PGIM ETF Trust, PGIM High Yield Bond Fund, Inc., PGIM Global High Yield Fund, Inc., The Prudential Series Fund, Prudential’s Gibraltar Fund, Inc. and the Advanced Series Trust. |
PGIM Absolute Return Bond Fund
Approval of Advisory Agreements(unaudited)
The Fund’s Board of Trustees
The Board of Trustees (the “Board”) of PGIM Absolute Return Bond Fund (the “Fund”)1 consists of eleven individuals, nine of whom are not “interested persons” of the Fund, as defined in the Investment Company Act of 1940, as amended (the “1940 Act”) (the “Independent Trustees”).2 The Board is responsible for the oversight of the Fund and its operations, and performs the various duties imposed on the directors of investment companies by the 1940 Act. The Independent Trustees have retained independent legal counsel to assist them in connection with their duties. The Chair of the Board is an Independent Trustee. The Board has established four standing committees: the Audit Committee, the Nominating and Governance Committee, and two Investment Committees. Each committee is chaired by, and composed of, Independent Trustees.
Annual Approval of the Fund’s Advisory Agreements
As required under the 1940 Act, the Board determines annually whether to renew the Fund’s management agreement with PGIM Investments LLC (“PGIM Investments”), the Fund’s subadvisory agreement with PGIM, Inc. (“PGIM”) on behalf of its PGIM Fixed Income unit, and the Fund’s sub-subadvisory agreement with PGIM Limited (“PGIML”). In considering the renewal of the agreements, the Board, including all of the Independent Trustees, met on May 30, 2019 and on June11-13, 2019 and approved the renewal of the agreements through July 31, 2020, after concluding that the renewal of the agreements was in the best interests of the Fund and its shareholders.
In advance of the meetings, the Board requested and received materials relating to the agreements, and had the opportunity to ask questions and request further information in connection with its consideration. Among other things, the Board considered comparative fee information from PGIM Investments, PGIM, and where appropriate, affiliates of PGIM. Also, the Board considered comparisons with other mutual funds in relevant Peer Universes and Peer Groups, as is further discussed below.
In approving the agreements, the Board, including the Independent Trustees advised by independent legal counsel, considered the factors it deemed relevant, including the nature, quality and extent of services provided by PGIM Investments, the subadviser, and, as relevant, its affiliates, the performance of the Fund, the profitability of PGIM Investments and its affiliates, expenses and fees, and the potential for economies of scale that may be shared with the Fund and its shareholders as the Fund’s assets grow. In their deliberations, the Trustees did not identify any single factor which alone was responsible for the Board’s decision to approve the agreements with respect to the Fund. In connection with its deliberations, the Board considered information provided by PGIM Investments throughout
| 1 | PGIM Absolute Return Bond Fund is a series of Prudential Investment Portfolios 9. |
| 2 | Grace C. Torres was an Interested Trustee of the Fund at the time the Board considered and approved the renewal of the Fund’s advisory agreements, but has since become an Independent Trustee of the Fund. |
| | |
| PGIM Absolute Return Bond Fund |
Approval of Advisory Agreements(continued)
the year at regular Board meetings, presentations from portfolio managers and other information, as well as information furnished at or in advance of the meetings on May 30, 2019 and onJune 11-13, 2019.
The Trustees determined that the overall arrangements between the Fund and PGIM Investments, which serves as the Fund’s investment manager pursuant to a management agreement, between PGIM Investments and PGIM, which, through its PGIM Fixed Income unit, serves as the Fund’s subadviser pursuant to the terms of a subadvisory agreement with PGIM Investments, and between PGIM and PGIML, which serves as the Fund’s sub-subadviser pursuant to the terms of a sub-subadvisory agreement with PGIM, are in the best interests of the Fund and its shareholders in light of the services performed, fees charged and such other matters as the Trustees considered relevant in the exercise of their business judgment.
The material factors and conclusions that formed the basis for the Trustees’ reaching their determinations to approve the continuance of the agreements are separately discussed below.
Nature, Quality and Extent of Services
The Board received and considered information regarding the nature, quality and extent of services provided to the Fund by PGIM Investments, PGIM Fixed Income, and PGIML. The Board noted that PGIM Fixed Income and PGIML are affiliated with PGIM Investments. The Board considered the services provided by PGIM Investments, including but not limited to the oversight of the subadviser and sub-subadviser for the Fund, as well as the provision of fund recordkeeping, compliance and other services to the Fund, and PGIM Investments’ role as administrator for the Fund’s liquidity risk management program. With respect to PGIM Investments’ oversight of the subadviser and sub-subadviser, the Board noted that PGIM Investments’ Strategic Investment Research Group (“SIRG”), which is a business unit of PGIM Investments, is responsible for monitoring and reporting to PGIM Investments senior management on the performance and operations of the subadviser and sub-subadviser. The Board also considered that PGIM Investments pays the salaries of all of the officers and interested Trustees of the Fund who are part of Fund management. The Board also considered the investment subadvisory services provided by PGIM Fixed Income and PGIML, including investment research and security selection, as well as adherence to the Fund’s investment restrictions and compliance with applicable Fund policies and procedures. The Board considered PGIM Investments’ evaluation of the subadviser and sub-subadviser, as well as PGIM Investments’ recommendation, based on its review of the subadviser and sub-subadviser, to renew the subadvisory and sub-subadvisory agreements.
The Board considered the qualifications, backgrounds and responsibilities of PGIM Investments’ senior management responsible for the oversight of the Fund, PGIM Fixed
| | |
| Visit our website at pgiminvestments.com | | |
Income, and PGIML, and also considered the qualifications, backgrounds and responsibilities of PGIM Fixed Income’s portfolio managers who are responsible for theday-to-day management of the Fund’s portfolio. The Board was provided with information pertaining to PGIM Investments’, PGIM Fixed Income’s, and PGIML’s organizational structure, senior management, investment operations, and other relevant information pertaining to PGIM Investments, PGIM Fixed Income, and PGIML. The Board also noted that it received favorable compliance reports from the Fund’s Chief Compliance Officer (“CCO”) as to PGIM Investments, PGIM Fixed Income, and PGIML.
The Board concluded that it was satisfied with the nature, extent and quality of the investment management services provided by PGIM Investments, the subadvisory services provided to the Fund by PGIM Fixed Income, and the sub-subadvisory services provided by PGIML, and that there was a reasonable basis on which to conclude that the Fund benefits from the services provided by PGIM Investments, PGIM Fixed Income, and PGIML under the management, subadvisory and sub-subadvisory agreements.
Costs of Services and Profits Realized by PGIM Investments
The Board was provided with information on the profitability of PGIM Investments and its affiliates in serving as the Fund’s investment manager. The Board discussed with PGIM Investments the methodology utilized in assembling the information regarding profitability and considered its reasonableness. The Board recognized that it is difficult to make comparisons of profitability from fund management contracts because comparative information is not generally publicly available and is affected by numerous factors, including the structure of the particular adviser, the types of funds it manages, its business mix, numerous assumptions regarding allocations and the adviser’s capital structure and cost of capital. Taking these factors into account, the Board concluded that the profitability of PGIM Investments and its affiliates in relation to the services rendered was not unreasonable.
Economies of Scale
The Board received and discussed information concerning economies of scale that PGIM Investments may realize as the Fund’s assets grow beyond current levels. The Board noted that the management fee schedule for the Fund includes breakpoints, which have the effect of decreasing the fee rate as assets increase. During the course of time, the Board has considered information regarding the launch date of the Fund, the management fees of the Fund compared to those of similarly managed funds and PGIM Investments’ investment in the Fund over time. The Board noted that economies of scale can be shared with the Fund in other ways, including low management fees from inception, additional technological and personnel investments to enhance shareholder services, and maintaining existing expense structures in the face of a rising cost environment. The Board also
| | |
| PGIM Absolute Return Bond Fund |
Approval of Advisory Agreements(continued)
considered PGIM Investments’ assertion that it continually evaluates the management fee schedule of the Fund and the potential to share economies of scale through breakpoints or fee waivers as asset levels increase.
The Board recognized the inherent limitations of any analysis of economies of scale, stemming largely from the Board’s understanding that most of PGIM Investments’ costs are not specific to individual funds, but rather are incurred across a variety of products and services.
Other Benefits to PGIM Investments, PGIM Fixed Income, and PGIML
The Board considered potential ancillary benefits that might be received by PGIM Investments, PGIM Fixed Income, PGIML and their affiliates as a result of their relationship with the Fund. The Board concluded that potential benefits to be derived by PGIM Investments included transfer agency fees received by the Fund’s transfer agent (which is affiliated with PGIM Investments), as well as benefits to its reputation or other intangible benefits resulting from PGIM Investments’ association with the Fund. The Board concluded that the potential benefits to be derived by PGIM Fixed Income and PGIML included the ability to use soft dollar credits, as well as the potential benefits consistent with those generally resulting from an increase in assets under management, specifically, potential access to additional research resources and benefits to their reputations. The Board concluded that the benefits derived by PGIM Investments, PGIM Fixed Income, and PGIML were consistent with the types of benefits generally derived by investment managers and subadvisers to mutual funds.
Performance of the Fund / Fees and Expenses
The Board considered certain additional factors and made related conclusions relating to the historical performance of the Fund for the one, three-, and five-year periods ended December 31, 2018.
The Board also considered the Fund’s actual management fee, as well as the Fund’s net total expense ratio, for the fiscal year ended October 31, 2018. The Board considered the management fee for the Fund as compared to the management fee charged by PGIM Investments to other funds and the fee charged by other advisers to comparable mutual funds in a Peer Group. The actual management fee represents the fee rate actually paid by Fund shareholders and includes any fee waivers or reimbursements. The net total expense ratio for the Fund represents the actual expense ratio incurred by Fund shareholders.
The mutual funds included in the Peer Universe, which was used to consider performance, and the Peer Group, which was used to consider expenses and fees, were objectively determined by Broadridge, an independent provider of mutual fund data. In certain
| | |
| Visit our website at pgiminvestments.com | | |
circumstances, PGIM Investments also provided supplemental Peer Universe or Peer Group information, for reasons addressed with the Board. The comparisons placed the Fund in various quartiles over various periods, with the first quartile being the best 25% of the mutual funds (for performance, the best performing mutual funds and, for expenses, the lowest cost mutual funds).
The section below summarizes key factors considered by the Board and the Board’s conclusions regarding the Fund’s performance, fees and overall expenses. The table sets forth net performance comparisons (which reflect the impact on performance of fund expenses, or any subsidies, expense caps or waivers that may be applicable) with the Peer Universe, actual management fees with the Peer Group (which reflect the impact of any subsidies or fee waivers), and net total expenses with the Peer Group, each of which were key factors considered by the Board.
| | | | | | | | |
| Net Performance | | 1 Year | | 3 Years | | 5 Years | | 10 Years |
| | 1st Quartile | | 2nd Quartile | | 1st Quartile | | N/A |
| Actual Management Fees:3rd Quartile |
| Net Total Expenses: 3rd Quartile |
| | • | | The Board noted that the Fund outperformed its benchmark index over the three- and five-year periods, though it underperformed over theone-year period. |
| | • | | The Board and PGIM Investments agreed to retain the existing contractual expense cap which (exclusive of certain fees and expenses) caps total annual operating expenses at 0.70% for Class R6 shares, and 0.73% for Class Z shares through February 29, 2020. |
| | • | | In addition, PGIM Investments will waive management fees or shared operating expenses on any share class to the same extent that it waives such expenses on any other share class, and has agreed that total annual fund operating expenses for Class R6 shares will not exceed total annual fund operating expenses for Class Z shares. |
| | • | | The Board also noted information provided by PGIM Investments which indicated that because the Fund’s expense cap had not been in effect for the full fiscal year, the Fund’s ranking for net total expenses did not reflect the full impact of the expense cap, and that if the expense cap had been in effect for the full fiscal year, the Fund would have ranked in the second quartile of its Peer Group. |
| | • | | The Board concluded that, in light of the above, it would be in the best interests of the Fund and its shareholders to renew the agreements. |
| | • | | The Board concluded that the management fees (including subadvisory fees) and total expenses were reasonable in light of the services provided. |
* * *
After full consideration of these factors, the Board concluded that the approval of the agreements was in the best interests of the Fund and its shareholders.
| | |
| PGIM Absolute Return Bond Fund |
| | | | |
| | |
| ∎ MAIL | | ∎ TELEPHONE | | ∎ WEBSITE |
655 Broad Street
Newark, NJ 07102 | | (800) 225-1852 | | pgiminvestments.com |
|
| PROXY VOTING |
| The Board of Trustees of the Fund has delegated to the Fund’s subadviser the responsibility for voting any proxies and maintaining proxy recordkeeping with respect to the Fund. A description of these proxy voting policies and procedures is available without charge, upon request, by calling (800) 225-1852. Information regarding how the Fund voted proxies relating to portfolio securities during the most recent 12-month period ended June 30 is available on the Fund’s website and on the Securities and Exchange Commission’s website. |
|
| TRUSTEES |
| Ellen S. Alberding• Kevin J. Bannon• Scott E. Benjamin• Linda W. Bynoe• Barry H. Evans• Keith F. Hartstein • Laurie Simon Hodrick• Michael S. Hyland• Stuart S. Parker• Brian K. Reid• Grace C. Torres |
|
| OFFICERS |
| Stuart S. Parker,President• Scott E. Benjamin,Vice President• Christian J. Kelly,Treasurer and Principal Financial and Accounting Officer• Raymond A. O’Hara,Chief Legal Officer• Dino Capasso,Chief Compliance Officer• Charles H. Smith,Anti-Money Laundering Compliance Officer• Andrew R. French,Secretary• Jonathan D. Shain,Assistant Secretary• Claudia DiGiacomo,Assistant Secretary• Diana N. Huffman,Assistant Secretary• Kelly A. Coyne,Assistant Secretary• Lana Lomuti,Assistant Treasurer• Russ Shupak,Assistant Treasurer• Elyse McLaughlin,Assistant Treasurer• Deborah Conway,Assistant Treasurer |
| | | | |
| MANAGER | | PGIM Investments LLC | | 655 Broad Street
Newark, NJ 07102 |
|
| SUBADVISER | | PGIM Fixed Income | | 655 Broad Street
Newark, NJ 07102 |
|
| DISTRIBUTOR | | Prudential Investment
Management Services LLC | | 655 Broad Street
Newark, NJ 07102 |
|
| CUSTODIAN | | The Bank of New York Mellon | | 240 Greenwich Street New York, NY 10286 |
|
| TRANSFER AGENT | | Prudential Mutual Fund
Services LLC | | PO Box 9658
Providence, RI 02940 |
|
INDEPENDENT REGISTERED
PUBLIC ACCOUNTING FIRM | | KPMG LLP | | 345 Park Avenue
New York, NY 10154 |
|
| FUND COUNSEL | | Willkie Farr & Gallagher LLP | | 787 Seventh Avenue
New York, NY 10019 |
|
|
| An investor should consider the investment objectives, risks, charges, and expenses of the Fund carefully before investing. The prospectus and summary prospectus contain this and other information about the Fund. An investor may obtain the prospectus and summary prospectus by visiting our website atpgiminvestments.com or by calling(800) 225-1852. The prospectus and summary prospectus should be read carefully before investing. |
|
| E-DELIVERY |
| To receive your mutual fund documents online, go topgiminvestments.com/edelivery and enroll. Instead of receiving printed documents by mail, you will receive notification via email when new materials are available. You can cancel your enrollment or change your email address at any time by visiting the website address above. |
|
| SHAREHOLDER COMMUNICATIONS WITH TRUSTEES |
| Shareholders can communicate directly with the Board of Trustees by writing to the Chair of the Board, PGIM Absolute Return Bond Fund, PGIM Investments, Attn: Board of Trustees, 655 Broad Street, Newark, NJ 07102. Shareholders can communicate directly with an individual Trustee by writing to the same address. Communications are not screened before being delivered to the addressee. |
|
| AVAILABILITY OF PORTFOLIO HOLDINGS |
| The Fund files its complete schedule of portfolio holdings with the Securities and Exchange Commission on Form N-PORT. The Fund’s Form N-PORT filings are available on the Commission’s website at sec.gov. Form N-PORT is filed with the Commission quarterly, and each Fund’s full portfolio holdings as of the first and third fiscal quarter-ends (as of the third month of the Fund’s fiscal quarter for reporting periods on or after September 30, 2019) will be made publicly available 60 days after the end of each quarter at sec.gov. |
|
| The Fund’s Statement of Additional Information contains additional information about the Fund’s Trustees and is available without charge, upon request, by calling (800) 225-1852. |
Mutual Funds:
| | | | |
ARE NOT INSURED BY THE FDIC OR ANY
FEDERAL GOVERNMENT AGENCY | | MAY LOSE VALUE | | ARE NOT A DEPOSIT OF OR GUARANTEED
BY ANY BANK OR ANY BANK AFFILIATE |
PGIM ABSOLUTE RETURN BOND FUND
| | | | | | | | |
| SHARE CLASS | | A | | C | | Z | | R6 |
| NASDAQ | | PADAX | | PADCX | | PADZX | | PADQX |
| CUSIP | | 74441J852 | | 74441J845 | | 74441J829 | | 74441J837 |
MF213E

PGIM QMA LARGE-CAP CORE EQUITY FUND
ANNUAL REPORT
OCTOBER 31, 2019
COMING SOON: PAPERLESS SHAREHOLDER REPORTS
Beginning on January 1, 2021, as permitted by regulations adopted by the Securities and Exchange Commission, paper copies of the Fund’s annual and semiannual shareholder reports will no longer be sent by mail, unless you specifically request paper copies of the reports. Instead, the reports will be made available on the Fund’s website (pgiminvestments.com), and you will be notified by mail each time a report is posted and provided with a website link to access the report.
If you already elected to receive shareholder reports electronically, you will not be affected by this change and you need not take any action. You may elect to receive shareholder reports and other communications from the Fund electronically anytime by contacting your financial intermediary (such as a broker-dealer or bank) or, if you are a direct investor, by calling 1-800-225-1852 or by sending an email request to PGIM Investments at shareholderreports@pgim.com.
You may elect to receive all future reports in paper free of charge. If you invest through a financial intermediary, you can contact your financial intermediary or follow instructions included with this notice to elect to continue to receive paper copies of your shareholder reports. If you invest directly with the Fund, you can call 1-800-225-1852 or send an email request to shareholderreports@pgim.com to let the Fund know you wish to continue receiving paper copies of your shareholder reports. Your election to receive reports in paper will apply to all funds held in your account if you invest through your financial intermediary or all funds held with the fund complex if you invest directly with the Fund.

To enroll in e-delivery, go to pgiminvestments.com/edelivery
|
| Objective: Long-term growth of capital |
Highlights(unaudited)
| • | | Favoring companies with strong earnings quality benefited the Fund during the reporting period. |
| • | | Modestly underweighting the energy sector, which performed quite poorly during the period, helped performance. |
| • | | QMA favors stocks that are inexpensive relative to industry peers. Over the period, this relative value strategy hurt performance. |
| • | | Stock selection in the consumer discretionary and information technology sectors lagged the S&P 500 Index. QMA’s relative value strategy struggled most in these sectors. |
This report is not authorized for distribution to prospective investors unless preceded or accompanied by a current prospectus.
The views expressed in this report and information about the Fund’s portfolio holdings are for the period covered by this report and are subject to change thereafter.
Mutual funds are distributed by Prudential Investment Management Services LLC, a Prudential Financial company, member SIPC. QMA is the primary business name of QMA LLC, a wholly owned subsidiary of PGIM, Inc. (PGIM), a Prudential Financial company.© 2019 Prudential Financial, Inc. and its related entities. PGIM and the PGIM logo are service marks of Prudential Financial, Inc. and its related entities, registered in many jurisdictions worldwide.
| | |
| 2 | | Visit our website at pgiminvestments.com |
Table of Contents
| | | | |
| PGIM QMA Large-Cap Core Equity Fund | | | 3 | |
This Page Intentionally Left Blank
Letter from the President

Dear Shareholder:
We hope you find the annual report for the PGIM QMA Large-Cap Core Equity Fund informative and useful. The report covers performance for the 12-month period that ended October 31, 2019.
While the US economy remained healthy, with rising corporate profits and strong job growth, the Federal Reserve cut interest rates three times in the latter half of the period. The cuts were a proactive attempt by the Fed to extend the longest domestic economic expansion on record as growth in many regions weakened. China in particular showed signs of slowing amid trade tensions with the US, and turmoil in the United Kingdom continued as it negotiates an exit from the European Union.
The interest-rate cuts helped boost the performance of stocks globally. For the period overall, large-cap US equities along with stocks in developed and emerging foreign markets all rose by double digits. Small-cap US stocks posted a single-digit gain. This positive performance came despite significant volatility early in the period. Equities plunged at the end of 2018 on concerns about China’s economy, a potential global trade war, higher interest rates, and worries that profit growth might slow. Stocks reversed course early in 2019, rising sharply after the Fed moderated its position on additional rate hikes for the remainder of the year.
The overall US bond market posted strong returns during the period on a significant rally in interest rates that saw the 10-year US Treasury yield decline from over 3% to under 2%. Investment-grade corporate bonds led the way with a double-digit gain, while corporate high yield and municipal bonds each had a return in the high single digits. Globally, bonds in developed markets delivered strong returns, and emerging markets debt rose by double digits.
Regarding your investments with PGIM, we believe it is important to maintain a diversified portfolio of funds consistent with your tolerance for risk, time horizon, and financial goals. Your financial advisor can help you create a diversified investment plan that may include funds covering all the basic asset classes and that reflects your personal investor profile and risk tolerance. However, diversification and asset allocation strategies do not assure a profit or protect against loss in declining markets.
At PGIM Investments, we consider it a great privilege and responsibility to help investors participate in opportunities across global markets while meeting their toughest investment challenges. PGIM is a top-10 global investment manager with more than $1 trillion in assets under management. This scale and investment expertise allow us to deliver actively managed funds and strategies to meet the needs of investors around the globe.
Thank you for choosing our family of funds.
Sincerely,

Stuart S. Parker, President
PGIM QMA Large-Cap Core Equity Fund
December 16, 2019
| | | | |
| PGIM QMA Large-Cap Core Equity Fund | | | 5 | |
Your Fund’s Performance(unaudited)
Performance data quoted represents past performance. Past performance does not guarantee future results. The investment return and principal value of an investment will fluctuate, so that an investor’s shares, when redeemed, may be worth more or less than their original cost. Current performance may be lower or higher than the past performance data quoted. An investor may obtain performance data as of the most recent month-end by visiting our website atpgiminvestments.com or by calling (800) 225-1852.
| | | | | | | | | | | | | | |
| |
| | | Average Annual Total Returns as of 10/31/19
(with sales charges)
| |
| | | One Year (%) | | Five Years (%) | | | Ten Years (%) | | | Since Inception (%) | |
| Class A | | 4.53 | | | 8.14 | | | | 12.11 | | | | — | |
| Class B | | 5.22 | | | 8.36 | | | | 11.87 | | | | — | |
| Class C | | 8.89 | | | 8.56 | | | | 11.91 | | | | — | |
| Class Z | | 10.91 | | | 9.64 | | | | 13.02 | | | | — | |
| Class R6 | | 11.05 | | | N/A | | | | N/A | | | | 12.00 (12/28/16) | |
| S&P 500 Index | | | | | | | | | | | | | | |
| | | 14.31 | | | 10.77 | | | | 13.69 | | | | — | |
| | | | | | | | | | | | | | |
| |
| | | Average Annual Total Returns as of 10/31/19
(without sales charges) | |
| | | One Year (%) | | Five Years (%) | | | Ten Years (%) | | | Since Inception (%) | |
| Class A | | 10.61 | | | 9.37 | | | | 12.74 | | | | — | |
| Class B | | 9.65 | | | 8.49 | | | | 11.87 | | | | — | |
| Class C | | 9.77 | | | 8.56 | | | | 11.91 | | | | — | |
| Class Z | | 10.91 | | | 9.64 | | | | 13.02 | | | | — | |
| Class R6 | | 11.05 | | | N/A | | | | N/A | | | | 12.00 (12/28/16) | |
| S&P 500 Index | | | | | | | | | | | | | | |
| | | 14.31 | | | 10.77 | | | | 13.69 | | | | — | |
| | |
| 6 | | Visit our website at pgiminvestments.com |
Growth of a $10,000 Investment(unaudited)
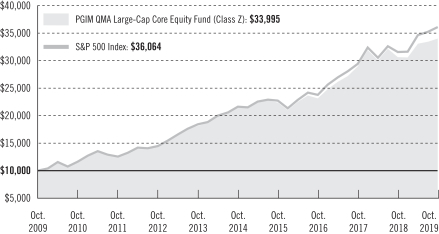
The graph compares a $10,000 investment in the Fund’s Class Z shares with a similar investment in the S&P 500 Index by portraying the initial account values at the beginning of the 10-year period for Class Z shares (October 31, 2009) and the account values at the end of the current fiscal year (October 31, 2019) as measured on a quarterly basis. For purposes of the graph, and unless otherwise indicated, it has been assumed that (a) all recurring fees (including management fees) were deducted; and (b) all dividends and distributions were reinvested. The line graph provides information for Class Z shares only. As indicated in the tables provided earlier, performance for other share classes will vary due to the differing charges and expenses applicable to each share class (as indicated in the following paragraphs). Without waiver of fees and/or expense reimbursements, if any, the Fund’s returns would have been lower.
Past performance does not predict future performance. Total returns and the ending account values in the graph include changes in share price and reinvestment of dividends and capital gains distributions in a hypothetical investment for the periods shown. The Fund’s total returns do not reflect the deduction of income taxes on an individual’s investment. Taxes may reduce your actual investment returns on income or gains paid by the Fund or any gains you may realize if you sell your shares.
Source: PGIM Investments LLC and Lipper Inc.
Since Inception returns are provided for any share class with less than 10 fiscal years of returns. Since Inception returns for the Index are measured from the closest month-end to the class’ inception date.
| | | | |
| PGIM QMA Large-Cap Core Equity Fund | | | 7 | |
Your Fund’s Performance(continued)
The returns in the tables do not reflect the deduction of taxes that a shareholder would pay on Fund distributions or following the redemption of Fund shares. The average annual total returns take into account applicable sales charges, which are described for each share class in the table below.
| | | | | | | | | | |
| | | | | | |
| | | Class A | | Class B* | | Class C | | Class Z | | Class R6 |
| Maximum initial sales charge | | 5.50% of
the public
offering price | | None | | None | | None | | None |
| Contingent deferred sales charge (CDSC) (as a percentage of the lower of the original purchase price or the net asset value at redemption) | | 1.00% on sales of $1 million or more made within 12 months of purchase | | 5.00% (Yr. 1) 4.00% (Yr. 2) 3.00% (Yr. 3) 2.00% (Yr. 4) 1.00% (Yr. 5) 1.00% (Yr. 6) 0.00% (Yr. 7) | | 1.00% on sales made within 12 months of purchase | | None | | None |
| Annual distribution and service (12b-1) fees (shown as a percentage of average daily net assets) | | 0.30% (0.25% currently) | | 1.00% | | 1.00% | | None | | None |
*Class B shares are closed to all purchase activity and no additional Class B shares may be purchased or acquired except by exchange from Class B shares of another Fund or through dividend or capital gains reinvestment.
Benchmark Definitions
S&P 500 Index—The S&P 500 Index is an unmanaged index of over 500 stocks of large US public companies. It gives a broad look at how stock prices in the United States have performed. The average annual total return for the Index measured from the month-end closest to the inception date of the Fund’s Class R6 shares is 13.58%.
Investors cannot invest directly in an index or average. The returns for the Index would be lower if they included the effects of sales charges, operating expenses of a mutual fund, or taxes.
| | |
| 8 | | Visit our website at pgiminvestments.com |
Presentation of Fund Holdingsas of 10/31/19
| | | | |
| | |
| Ten Largest Holdings | | Line of Business | | % of Net Assets |
| Microsoft Corp. | | Software | | 5.0% |
| Apple, Inc. | | Technology Hardware, Storage & Peripherals | | 4.9% |
| Facebook, Inc. (Class A Stock) | | Interactive Media & Services | | 2.4% |
| Amazon.com, Inc. | | Internet & Direct Marketing Retail | | 1.9% |
| Alphabet, Inc. (Class C Stock) | | Interactive Media & Services | | 1.8% |
| Visa, Inc. (Class A Stock) | | IT Services | | 1.8% |
| Procter & Gamble Co. (The) | | Household Products | | 1.7% |
| Bank of America Corp. | | Banks | | 1.7% |
| Intel Corp. | | Semiconductors & Semiconductor Equipment | | 1.6% |
| Alphabet, Inc. (Class A Stock) | | Interactive Media & Services | | 1.5% |
For a complete list of holdings, please refer to the Schedule of Investments section of this report. Holdings reflect only long-term Investments.
| | | | |
| PGIM QMA Large-Cap Core Equity Fund | | | 9 | |
Strategy and Performance Overview(unaudited)
How did the Fund perform?
ThePGIM QMA Large-Cap Core Equity Fund’s Class Z shares returned 10.91% in the 12-month reporting period that ended October 31, 2019, underperforming the 14.31% return of the S&P 500 Index (the Index).
What were the market conditions?
| • | | After finishing 2018 in negative territory, US equities performed quite well for the rest of the reporting period, despite headwinds from slowing global economic growth and protectionist trade policy, specifically the US-China trade war. |
| • | | In response to these concerns, the Federal Reserve has taken a more dovish stance, cutting interest rates three times during the period in an effort to stimulate growth. |
| • | | Investors favored growth stocks at the beginning of the period, while more reasonably priced stocks relative to earnings and book value trailed the market averages. |
| • | | In the latter part of the period, investors generally focused on company fundamentals and began to steer away from speculative growth stocks with little to no earnings. |
What worked?
| • | | The Fund is comprised of a diversified portfolio of stocks that QMA identifies as attractive using a proprietary quantitative model. The model evaluates stocks with regard to quality, earnings expectations, and relative value. The emphasis on these metrics varies based on the growth rate of the company under evaluation. |
| • | | Favoring companies with strong earnings quality benefited the Portfolio during the reporting period. |
| • | | The Fund’s sector weights are established from bottom-up stock selection, and limits are placed on how much these weights can differ from those of the Index. That being said, modestly underweighting the energy sector, which performed quite poorly during the period, helped performance. |
What didn’t work?
| • | | QMA favors stocks that are inexpensive relative to industry peers. Over the period, this relative value strategy hurt performance. |
| • | | Stock selection in the consumer discretionary and information technology sectors lagged the Index. QMA’s relative value strategy struggled most in these sectors. |
Did the Fund hold derivatives?
| • | | The Fund held futures contracts on the Index. QMA used these instruments primarily to manage daily cash flows, provide liquidity, and equitize cash—not as a means of adding to performance. Consequently, the effect on Fund performance was minimal. |
| | |
| 10 | | Visit our website at pgiminvestments.com |
The percentage points shown in the tables below identify each security’s positive or negative contribution to the Fund’s return relative to the Index, which is the sum of all contributions by individual holdings during the Fund’s reporting period.
| | | | | | |
| | |
| Top Contributors (%) | | | | Top Detractors (%) |
| Apple Inc. | | 0.26 | | DXC Technology Co. | | –0.44 |
| Exxon Mobil Corp. | | 0.21 | | Macy’s Inc. | | –0.34 |
| Pfizer Inc. | | 0.19 | | Qurate Retail Inc. | | –0.27 |
| QUALCOMM Inc. | | 0.17 | | Tapestry Inc. | | –0.24 |
| Arconic Inc. | | 0.16 | | Walgreens Boots Alliance Inc. | | –0.23 |
Current outlook
| • | | The equity markets experienced an extraordinary period of relative value underperformance during the reporting period. Historically, similar periods are followed by sharp reversals. Although the timing is uncertain, QMA expects such a rebound may be imminent, as value stock fundamentals had remained steady and QMA had started to see signs of a rotation from poor-quality growth stocks to high-quality value stocks in the latter part of the period. |
| | | | |
| PGIM QMA Large-Cap Core Equity Fund | | | 11 | |
Fees and Expenses(unaudited)
As a shareholder of the Fund, you incur two types of costs: (1) transaction costs, including sales charges (loads) on purchase payments and redemptions, as applicable, and (2) ongoing costs, including management fees, distribution, and/or service (12b-1) fees, and other Fund expenses, as applicable. This example is intended to help you understand your ongoing costs (in dollars) of investing in the Fund and to compare these costs with the ongoing costs of investing in other mutual funds.
The example is based on an investment of $1,000 held through the six-month period ended October 31, 2019. The example is for illustrative purposes only; you should consult the Prospectus for information on initial and subsequent minimum investment requirements.
Actual Expenses
The first line for each share class in the table on the following page provides information about actual account values and actual expenses. You may use the information on this line, together with the amount you invested, to estimate the expenses that you paid over the period. Simply divide your account value by $1,000 (for example, an $8,600 account value ÷ $1,000 = 8.6), then multiply the result by the number on the first line under the heading “Expenses Paid During the Six-Month Period” to estimate the expenses you paid on your account during this period.
Hypothetical Example for Comparison Purposes
The second line for each share class in the table on the following page provides information about hypothetical account values and hypothetical expenses based on the Fund’s actual expense ratio and an assumed rate of return of 5% per year before expenses, which is not the Fund’s actual return. The hypothetical account values and expenses may not be used to estimate the actual ending account balance or expenses you paid for the period. You may use this information to compare the ongoing costs of investing in the Fund and other funds. To do so, compare this 5% hypothetical example with the 5% hypothetical examples that appear in the shareholder reports of the other funds.
The Fund’s transfer agent may charge additional fees to holders of certain accounts that are not included in the expenses shown in the table on the following page. These fees apply to individual retirement accounts (IRAs) and Section 403(b) accounts. As of the close of the six-month period covered by the table, IRA fees included an annual maintenance fee of $15 per account (subject to a maximum annual maintenance fee of $25 for all accounts held by the same shareholder). Section 403(b) accounts are charged an annual $25 fiduciary maintenance fee. Some of the fees may vary in amount, or may be waived, based on your total account balance or the number of PGIM funds, including the Fund, that you own. You should consider the additional fees that were charged to your Fund account over the six-month period when you estimate the total ongoing expenses paid over the period
| | |
| 12 | | Visit our website at pgiminvestments.com |
and the impact of these fees on your ending account value, as these additional expenses are not reflected in the information provided in the expense table. Additional fees have the effect of reducing investment returns.
Please note that the expenses shown in the table are meant to highlight your ongoing costs only and do not reflect any transactional costs such as sales charges (loads). Therefore, the second line for each share class in the table is useful in comparing ongoing costs only and will not help you determine the relative total costs of owning different funds. In addition, if these transactional costs were included, your costs would have been higher.
| | | | | | | | | | | | | | | | | | |
| | | | |
PGIM QMA
Large-Cap Core
Equity Fund | | Beginning Account
Value
May 1, 2019 | | | Ending Account
Value
October 31, 2019 | | | Annualized
Expense Ratio
Based on the
Six-Month Period | | | Expenses Paid
During the
Six-Month Period* | |
| Class A | | Actual | | $ | 1,000.00 | | | $ | 1,026.40 | | | | 0.73 | % | | $ | 3.73 | |
| | Hypothetical | | $ | 1,000.00 | | | $ | 1,021.53 | | | | 0.73 | % | | $ | 3.72 | |
| Class B | | Actual | | $ | 1,000.00 | | | $ | 1,022.10 | | | | 1.58 | % | | $ | 8.05 | |
| | Hypothetical | | $ | 1,000.00 | | | $ | 1,017.24 | | | | 1.58 | % | | $ | 8.03 | |
| Class C | | Actual | | $ | 1,000.00 | | | $ | 1,022.80 | | | | 1.48 | % | | $ | 7.55 | |
| | Hypothetical | | $ | 1,000.00 | | | $ | 1,017.74 | | | | 1.48 | % | | $ | 7.53 | |
| Class Z | | Actual | | $ | 1,000.00 | | | $ | 1,028.30 | | | | 0.48 | % | | $ | 2.45 | |
| | Hypothetical | | $ | 1,000.00 | | | $ | 1,022.79 | | | | 0.48 | % | | $ | 2.45 | |
| Class R6 | | Actual | | $ | 1,000.00 | | | $ | 1,028.90 | | | | 0.35 | % | | $ | 1.79 | |
| | | Hypothetical | | $ | 1,000.00 | | | $ | 1,023.44 | | | | 0.35 | % | | $ | 1.79 | |
*Fund expenses (net of fee waivers or subsidies, if any) for each share class are equal to the annualized expense ratio for each share class (provided in the table), multiplied by the average account value over the period, multiplied by the 184 days in the six-month period ended October 31, 2019, and divided by the 365 days in the Fund’s fiscal year ended October 31, 2019 (to reflect the six-month period). Expenses presented in the table include the expenses of any underlying portfolios in which the Fund may invest.
| | | | |
| PGIM QMA Large-Cap Core Equity Fund | | | 13 | |
Schedule of Investments
as of October 31, 2019
| | | | | | | | |
| Description | | Shares | | | Value | |
LONG-TERM INVESTMENTS 99.0% | | | | | | | | |
| | |
COMMON STOCKS | | | | | | | | |
| | |
Aerospace & Defense 3.3% | | | | | | | | |
Arconic, Inc. | | | 143,647 | | | $ | 3,945,983 | |
General Dynamics Corp. | | | 21,820 | | | | 3,857,776 | |
L3Harris Technologies, Inc. | | | 3,100 | | | | 639,561 | |
Lockheed Martin Corp. | | | 13,933 | | | | 5,248,282 | |
Northrop Grumman Corp. | | | 3,604 | | | | 1,270,338 | |
United Technologies Corp. | | | 32,250 | | | | 4,630,455 | |
Vectrus, Inc.* | | | 5,245 | | | | 239,749 | |
| | | | | | | | |
| | | | | | | 19,832,144 | |
| | |
Air Freight & Logistics 0.4% | | | | | | | | |
Hub Group, Inc. (Class A Stock)* | | | 4,011 | | | | 183,704 | |
United Parcel Service, Inc. (Class B Stock) | | | 19,100 | | | | 2,199,747 | |
| | | | | | | | |
| | | | | | | 2,383,451 | |
| | |
Airlines 0.1% | | | | | | | | |
United Airlines Holdings, Inc.* | | | 3,400 | | | | 308,856 | |
| | |
Automobiles 0.9% | | | | | | | | |
Ford Motor Co. | | | 384,909 | | | | 3,306,368 | |
General Motors Co. | | | 55,400 | | | | 2,058,664 | |
| | | | | | | | |
| | | | | | | 5,365,032 | |
| | |
Banks 4.7% | | | | | | | | |
Bank of America Corp. | | | 316,016 | | | | 9,881,820 | |
CIT Group, Inc. | | | 16,800 | | | | 720,552 | |
Citigroup, Inc. | | | 104,178 | | | | 7,486,231 | |
Citizens Financial Group, Inc. | | | 42,300 | | | | 1,487,268 | |
Fifth Third Bancorp | | | 21,932 | | | | 637,783 | |
JPMorgan Chase & Co. | | | 37,781 | | | | 4,719,603 | |
Popular, Inc. (Puerto Rico) | | | 7,500 | | | | 408,450 | |
TCF Financial Corp. | | | 11,300 | | | | 447,367 | |
Texas Capital Bancshares, Inc.* | | | 3,900 | | | | 210,834 | |
U.S. Bancorp | | | 23,700 | | | | 1,351,374 | |
Umpqua Holdings Corp. | | | 14,400 | | | | 227,808 | |
Wells Fargo & Co. | | | 8,137 | | | | 420,113 | |
| | | | | | | | |
| | | | | | | 27,999,203 | |
See Notes to Financial Statements.
| | | | |
| PGIM QMA Large-Cap Core Equity Fund | | | 15 | |
Schedule of Investments(continued)
as of October 31, 2019
| | | | | | | | |
| Description | | Shares | | | Value | |
COMMON STOCKS (Continued) | | | | | | | | |
| | |
Beverages 1.5% | | | | | | | | |
Coca-Cola Co. (The) | | | 105,437 | | | $ | 5,738,936 | |
Keurig Dr. Pepper, Inc.(a) | | | 109,038 | | | | 3,070,510 | |
| | | | | | | | |
| | | | | | | 8,809,446 | |
| | |
Biotechnology 3.1% | | | | | | | | |
AbbVie, Inc. | | | 33,251 | | | | 2,645,117 | |
Alexion Pharmaceuticals, Inc.* | | | 4,584 | | | | 483,154 | |
Amgen, Inc. | | | 11,600 | | | | 2,473,700 | |
Biogen, Inc.* | | | 17,566 | | | | 5,247,140 | |
Gilead Sciences, Inc. | | | 74,672 | | | | 4,757,353 | |
Regeneron Pharmaceuticals, Inc.* | | | 387 | | | | 118,530 | |
Vertex Pharmaceuticals, Inc.* | | | 13,991 | | | | 2,734,961 | |
| | | | | | | | |
| | | | | | | 18,459,955 | |
| | |
Building Products 1.0% | | | | | | | | |
American Woodmark Corp.* | | | 3,600 | | | | 356,976 | |
Johnson Controls International PLC | | | 87,622 | | | | 3,796,661 | |
Universal Forest Products, Inc. | | | 31,833 | | | | 1,603,110 | |
| | | | | | | | |
| | | | | | | 5,756,747 | |
| | |
Capital Markets 2.8% | | | | | | | | |
Affiliated Managers Group, Inc. | | | 38,769 | | | | 3,096,868 | |
Ameriprise Financial, Inc. | | | 20,559 | | | | 3,102,148 | |
Goldman Sachs Group, Inc. (The) | | | 21,677 | | | | 4,625,438 | |
Invesco Ltd. | | | 23,592 | | | | 396,817 | |
LPL Financial Holdings, Inc. | | | 6,200 | | | | 501,208 | |
Morgan Stanley | | | 99,975 | | | | 4,603,849 | |
Stifel Financial Corp. | | | 2,000 | | | | 111,960 | |
| | | | | | | | |
| | | | | | | 16,438,288 | |
| | |
Chemicals 1.3% | | | | | | | | |
Corteva, Inc. | | | 13,300 | | | | 350,854 | |
DuPont de Nemours, Inc. | | | 42,953 | | | | 2,831,032 | |
Huntsman Corp. | | | 10,963 | | | | 242,611 | |
Koppers Holdings, Inc.* | | | 14,200 | | | | 455,820 | |
Sherwin-Williams Co. (The) | | | 5,957 | | | | 3,409,310 | |
Trinseo SA | | | 14,843 | | | | 630,828 | |
Westlake Chemical Corp. | | | 49 | | | | 3,096 | |
| | | | | | | | |
| | | | | | | 7,923,551 | |
See Notes to Financial Statements.
| | | | | | | | |
| Description | | Shares | | | Value | |
COMMON STOCKS (Continued) | | | | | | | | |
| | |
Commercial Services & Supplies 0.1% | | | | | | | | |
Deluxe Corp. | | | 4,800 | | | $ | 248,784 | |
Steelcase, Inc. (Class A Stock) | | | 12,100 | | | | 211,387 | |
UniFirst Corp. | | | 1,600 | | | | 321,344 | |
| | | | | | | | |
| | | | | | | 781,515 | |
| | |
Communications Equipment 1.4% | | | | | | | | |
Cisco Systems, Inc. | | | 170,982 | | | | 8,123,355 | |
| | |
Construction & Engineering 0.4% | | | | | | | | |
EMCOR Group, Inc. | | | 24,777 | | | | 2,173,191 | |
MasTec, Inc.* | | | 3,700 | | | | 232,878 | |
Quanta Services, Inc. | | | 5,283 | | | | 222,150 | |
| | | | | | | | |
| | | | | | | 2,628,219 | |
| | |
Construction Materials 0.9% | | | | | | | | |
Martin Marietta Materials, Inc. | | | 10,800 | | | | 2,828,628 | |
Vulcan Materials Co. | | | 15,655 | | | | 2,236,630 | |
| | | | | | | | |
| | | | | | | 5,065,258 | |
| | |
Consumer Finance 1.0% | | | | | | | | |
Capital One Financial Corp. | | | 43,885 | | | | 4,092,276 | |
Navient Corp. | | | 1,834 | | | | 25,254 | |
OneMain Holdings, Inc. | | | 40,912 | | | | 1,636,480 | |
| | | | | | | | |
| | | | | | | 5,754,010 | |
| | |
Containers & Packaging 0.0% | | | | | | | | |
Westrock Co. | | | 2,239 | | | | 83,671 | |
| | |
Distributors 0.2% | | | | | | | | |
Genuine Parts Co. | | | 10,157 | | | | 1,041,905 | |
LKQ Corp.* | | | 2,792 | | | | 94,900 | |
| | | | | | | | |
| | | | | | | 1,136,805 | |
| | |
Diversified Consumer Services 0.4% | | | | | | | | |
frontdoor, Inc.* | | | 52,560 | | | | 2,534,969 | |
| | |
Diversified Financial Services 0.9% | | | | | | | | |
Berkshire Hathaway, Inc. (Class B Stock)* | | | 17,074 | | | | 3,629,591 | |
See Notes to Financial Statements.
| | | | |
| PGIM QMA Large-Cap Core Equity Fund | | | 17 | |
Schedule of Investments(continued)
as of October 31, 2019
| | | | | | | | |
| Description | | Shares | | | Value | |
COMMON STOCKS (Continued) | | | | | | | | |
| | |
Diversified Financial Services (cont’d.) | | | | | | | | |
FGL Holdings | | | 56,700 | | | $ | 512,001 | |
Jefferies Financial Group, Inc. | | | 63,041 | | | | 1,176,975 | |
| | | | | | | | |
| | | | | | | 5,318,567 | |
| | |
Diversified Telecommunication Services 2.9% | | | | | | | | |
AT&T, Inc. | | | 228,035 | | | | 8,777,067 | |
CenturyLink, Inc. | | | 65,714 | | | | 850,339 | |
Verizon Communications, Inc. | | | 123,250 | | | | 7,452,928 | |
| | | | | | | | |
| | | | | | | 17,080,334 | |
| | |
Electric Utilities 1.4% | | | | | | | | |
Exelon Corp. | | | 87,945 | | | | 4,000,618 | |
FirstEnergy Corp. | | | 51,800 | | | | 2,502,976 | |
Southern Co. (The) | | | 28,220 | | | | 1,768,265 | |
| | | | | | | | |
| | | | | | | 8,271,859 | |
| | |
Electrical Equipment 0.3% | | | | | | | | |
Atkore International Group, Inc.* | | | 25,921 | | | | 899,459 | |
Hubbell, Inc. | | | 4,610 | | | | 653,237 | |
nVent Electric PLC | | | 16,000 | | | | 368,960 | |
| | | | | | | | |
| | | | | | | 1,921,656 | |
| | |
Electronic Equipment, Instruments & Components 0.4% | | | | | | | | |
Anixter International, Inc.* | | | 8,096 | | | | 669,944 | |
CDW Corp. | | | 6,812 | | | | 871,323 | |
Itron, Inc.* | | | 2,000 | | | | 152,520 | |
Keysight Technologies, Inc.* | | | 6,805 | | | | 686,692 | |
SYNNEX Corp. | | | 655 | | | | 77,120 | |
| | | | | | | | |
| | | | | | | 2,457,599 | |
| | |
Energy Equipment & Services 0.1% | | | | | | | | |
DMC Global, Inc.(a) | | | 11,200 | | | | 501,088 | |
Matrix Service Co.* | | | 15,800 | | | | 296,408 | |
| | | | | | | | |
| | | | | | | 797,496 | |
| | |
Entertainment 1.0% | | | | | | | | |
Activision Blizzard, Inc. | | | 5,900 | | | | 330,577 | |
Electronic Arts, Inc.* | | | 36,900 | | | | 3,557,160 | |
See Notes to Financial Statements.
| | | | | | | | |
| Description | | Shares | | | Value | |
COMMON STOCKS (Continued) | | | | | | | | |
| | |
Entertainment (cont’d.) | | | | | | | | |
Marcus Corp. (The) | | | 1,210 | | | $ | 43,681 | |
Viacom, Inc. (Class B Stock) | | | 98,559 | | | | 2,124,932 | |
| | | | | | | | |
| | | | | | | 6,056,350 | |
| | |
Equity Real Estate Investment Trusts (REITs) 2.7% | | | | | | | | |
American Tower Corp. | | | 25,289 | | | | 5,515,025 | |
Apartment Investment & Management Co. (Class A Stock) | | | 16,100 | | | | 883,568 | |
Apple Hospitality REIT, Inc. | | | 36,701 | | | | 604,833 | |
Brandywine Realty Trust | | | 13,532 | | | | 206,769 | |
Colony Capital, Inc. | | | 5,714 | | | | 31,998 | |
CoreCivic, Inc. | | | 14,373 | | | | 219,332 | |
Crown Castle International Corp. | | | 31,300 | | | | 4,344,127 | |
GEO Group, Inc. (The) | | | 64,952 | | | | 988,569 | |
Host Hotels & Resorts, Inc. | | | 66,620 | | | | 1,091,902 | |
Ryman Hospitality Properties, Inc. | | | 15,605 | | | | 1,313,473 | |
Senior Housing Properties Trust | | | 6,281 | | | | 62,339 | |
Sunstone Hotel Investors, Inc. | | | 16,500 | | | | 222,915 | |
Xenia Hotels & Resorts, Inc. | | | 17,243 | | | | 362,965 | |
| | | | | | | | |
| | | | | | | 15,847,815 | |
| | |
Food & Staples Retailing 1.3% | | | | | | | | |
Costco Wholesale Corp. | | | 12,300 | | | | 3,654,453 | |
Sysco Corp. | | | 2,826 | | | | 225,713 | |
Walgreens Boots Alliance, Inc. | | | 56,201 | | | | 3,078,691 | |
Walmart, Inc. | | | 6,793 | | | | 796,547 | |
| | | | | | | | |
| | | | | | | 7,755,404 | |
| | |
Food Products 1.9% | | | | | | | | |
Archer-Daniels-Midland Co. | | | 76,790 | | | | 3,228,251 | |
Bunge Ltd. | | | 35,100 | | | | 1,895,400 | |
J.M. Smucker Co. (The) | | | 2,960 | | | | 312,813 | |
Pilgrim’s Pride Corp.* | | | 60,541 | | | | 1,838,025 | |
Tyson Foods, Inc. (Class A Stock) | | | 46,387 | | | | 3,840,380 | |
| | | | | | | | |
| | | | | | | 11,114,869 | |
| | |
Gas Utilities 0.3% | | | | | | | | |
UGI Corp. | | | 32,552 | | | | 1,551,754 | |
| | |
Health Care Equipment & Supplies 3.9% | | | | | | | | |
Baxter International, Inc. | | | 28,441 | | | | 2,181,425 | |
Cooper Cos., Inc. (The) | | | 2,016 | | | | 586,656 | |
See Notes to Financial Statements.
| | | | |
| PGIM QMA Large-Cap Core Equity Fund | | | 19 | |
Schedule of Investments(continued)
as of October 31, 2019
| | | | | | | | |
| Description | | Shares | | | Value | |
COMMON STOCKS (Continued) | | | | | | | | |
| | |
Health Care Equipment & Supplies (cont’d.) | | | | | | | | |
Danaher Corp. | | | 15,471 | | | $ | 2,132,213 | |
Dentsply Sirona, Inc. | | | 57,600 | | | | 3,155,328 | |
Edwards Lifesciences Corp.* | | | 17,700 | | | | 4,219,326 | |
Hologic, Inc.* | | | 57,778 | | | | 2,791,255 | |
Medtronic PLC | | | 53,565 | | | | 5,833,228 | |
Stryker Corp. | | | 10,728 | | | | 2,320,145 | |
| | | | | | | | |
| | | | | | | 23,219,576 | |
| | |
Health Care Providers & Services 3.4% | | | | | | | | |
Anthem, Inc. | | | 4,566 | | | | 1,228,619 | |
Centene Corp.* | | | 36,000 | | | | 1,910,880 | |
Cigna Corp. | | | 27,187 | | | | 4,851,792 | |
CVS Health Corp. | | | 77,740 | | | | 5,161,158 | |
HCA Healthcare, Inc. | | | 17,157 | | | | 2,291,146 | |
UnitedHealth Group, Inc. | | | 18,144 | | | | 4,584,989 | |
Universal Health Services, Inc. (Class B Stock) | | | 1,800 | | | | 247,428 | |
| | | | | | | | |
| | | | | | | 20,276,012 | |
| | |
Hotels, Restaurants & Leisure 1.5% | | | | | | | | |
Marriott International, Inc. (Class A Stock) | | | 6,400 | | | | 809,920 | |
McDonald’s Corp. | | | 12,700 | | | | 2,498,090 | |
RCI Hospitality Holdings, Inc. | | | 6,600 | | | | 123,750 | |
Starbucks Corp. | | | 65,458 | | | | 5,535,128 | |
| | | | | | | | |
| | | | | | | 8,966,888 | |
| | |
Household Durables 0.6% | | | | | | | | |
Lennar Corp. (Class A Stock) | | | 6,600 | | | | 393,360 | |
Newell Brands, Inc. | | | 3,517 | | | | 66,718 | |
Whirlpool Corp. | | | 19,900 | | | | 3,027,188 | |
| | | | | | | | |
| | | | | | | 3,487,266 | |
| | |
Household Products 1.8% | | | | | | | | |
Colgate-Palmolive Co. | | | 2,700 | | | | 185,220 | |
Procter & Gamble Co. (The) | | | 82,986 | | | | 10,332,587 | |
Spectrum Brands Holdings, Inc. | | | 5,284 | | | | 265,310 | |
| | | | | | | | |
| | | | | | | 10,783,117 | |
| | |
Independent Power & Renewable Electricity Producers 0.8% | | | | | | | | |
AES Corp. | | | 25,817 | | | | 440,180 | |
See Notes to Financial Statements.
| | | | | | | | |
| Description | | Shares | | | Value | |
COMMON STOCKS (Continued) | | | | | | | | |
| | |
Independent Power & Renewable Electricity Producers (cont’d.) | | | | | | | | |
NRG Energy, Inc. | | | 83,808 | | | $ | 3,362,377 | |
Vistra Energy Corp. | | | 40,800 | | | | 1,102,824 | |
| | | | | | | | |
| | | | | | | 4,905,381 | |
| | |
Industrial Conglomerates 0.9% | | | | | | | | |
General Electric Co. | | | 536,971 | | | | 5,358,971 | |
| | |
Insurance 2.6% | | | | | | | | |
Aflac, Inc. | | | 14,222 | | | | 756,041 | |
Allstate Corp. (The) | | | 35,299 | | | | 3,756,519 | |
American International Group, Inc. | | | 75,958 | | | | 4,022,736 | |
MetLife, Inc. | | | 87,540 | | | | 4,095,997 | |
National General Holdings Corp. | | | 6,000 | | | | 127,920 | |
Progressive Corp. (The) | | | 36,766 | | | | 2,562,590 | |
Unum Group | | | 7,931 | | | | 218,420 | |
| | | | | | | | |
| | | | | | | 15,540,223 | |
| | |
Interactive Media & Services 5.7% | | | | | | | | |
Alphabet, Inc. (Class A Stock)* | | | 7,094 | | | | 8,929,927 | |
Alphabet, Inc. (Class C Stock)* | | | 8,468 | | | | 10,670,612 | |
Facebook, Inc. (Class A Stock)* | | | 72,580 | | | | 13,909,957 | |
| | | | | | | | |
| | | | | | | 33,510,496 | |
| | |
Internet & Direct Marketing Retail 3.5% | | | | | | | | |
Amazon.com, Inc.* | | | 6,392 | | | | 11,356,411 | |
Booking Holdings, Inc.* | | | 2,434 | | | | 4,986,706 | |
eBay, Inc. | | | 97,073 | | | | 3,421,823 | |
Qurate Retail, Inc., Series A* | | | 91,691 | | | | 874,732 | |
| | | | | | | | |
| | | | | | | 20,639,672 | |
| | |
IT Services 4.6% | | | | | | | | |
Accenture PLC (Class A Stock) | | | 31,359 | | | | 5,814,586 | |
Cognizant Technology Solutions Corp. (Class A Stock) | | | 61,400 | | | | 3,741,716 | |
DXC Technology Co. | | | 45,799 | | | | 1,267,258 | |
FleetCor Technologies, Inc.* | | | 6,800 | | | | 2,000,696 | |
International Business Machines Corp. | | | 16,430 | | | | 2,197,184 | |
Leidos Holdings, Inc. | | | 23,075 | | | | 1,989,757 | |
Perspecta, Inc. | | | 900 | | | | 23,886 | |
Visa, Inc. (Class A Stock)(a) | | | 57,825 | | | | 10,342,580 | |
| | | | | | | | |
| | | | | | | 27,377,663 | |
See Notes to Financial Statements.
| | | | |
| PGIM QMA Large-Cap Core Equity Fund | | | 21 | |
Schedule of Investments(continued)
as of October 31, 2019
| | | | | | | | |
| Description | | Shares | | | Value | |
COMMON STOCKS (Continued) | | | | | | | | |
| | |
Life Sciences Tools & Services 0.7% | | | | | | | | |
IQVIA Holdings, Inc.* | | | 16,133 | | | $ | 2,329,928 | |
Thermo Fisher Scientific, Inc. | | | 6,014 | | | | 1,816,108 | |
| | | | | | | | |
| | | | | | | 4,146,036 | |
| | |
Machinery 0.9% | | | | | | | | |
Allison Transmission Holdings, Inc. | | | 15,000 | | | | 654,150 | |
Gates Industrial Corp. PLC* | | | 43,300 | | | | 433,000 | |
Mueller Industries, Inc. | | | 5,946 | | | | 182,958 | |
Oshkosh Corp. | | | 31,451 | | | | 2,685,286 | |
PACCAR, Inc. | | | 11,258 | | | | 856,284 | |
Timken Co. (The) | | | 2,670 | | | | 130,830 | |
Wabash National Corp. | | | 32,800 | | | | 467,728 | |
| | | | | | | | |
| | | | | | | 5,410,236 | |
| | |
Media 0.7% | | | | | | | | |
CBS Corp. (Class B Stock) | | | 41,500 | | | | 1,495,660 | |
Discovery, Inc. (Class C Stock)* | | | 113,328 | | | | 2,860,399 | |
| | | | | | | | |
| | | | | | | 4,356,059 | |
| | |
Mortgage Real Estate Investment Trusts (REITs) 0.1% | | | | | | | | |
Annaly Capital Management, Inc. | | | 5,204 | | | | 46,732 | |
Ladder Capital Corp. | | | 23,024 | | | | 397,624 | |
| | | | | | | | |
| | | | | | | 444,356 | |
| | |
Multiline Retail 1.3% | | | | | | | | |
Dollar General Corp. | | | 7,900 | | | | 1,266,686 | |
Macy’s, Inc.(a) | | | 96,910 | | | | 1,469,156 | |
Target Corp. | | | 43,700 | | | | 4,671,967 | |
| | | | | | | | |
| | | | | | | 7,407,809 | |
| | |
Multi-Utilities 1.0% | | | | | | | | |
Dominion Energy, Inc. | | | 43,851 | | | | 3,619,900 | |
Sempra Energy | | | 16,100 | | | | 2,326,611 | |
| | | | | | | | |
| | | | | | | 5,946,511 | |
| | |
Oil, Gas & Consumable Fuels 3.5% | | | | | | | | |
Chevron Corp. | | | 62,350 | | | | 7,241,329 | |
ConocoPhillips | | | 42,908 | | | | 2,368,522 | |
Exxon Mobil Corp. | | | 16,961 | | | | 1,146,055 | |
See Notes to Financial Statements.
| | | | | | | | |
| Description | | Shares | | | Value | |
COMMON STOCKS (Continued) | | | | | | | | |
| | |
Oil, Gas & Consumable Fuels (cont’d.) | | | | | | | | |
HollyFrontier Corp. | | | 25,458 | | | $ | 1,398,662 | |
Kinder Morgan, Inc. | | | 190,203 | | | | 3,800,256 | |
Phillips 66 | | | 39,072 | | | | 4,564,391 | |
World Fuel Services Corp. | | | 5,567 | | | | 232,533 | |
| | | | | | | | |
| | | | | | | 20,751,748 | |
| | |
Pharmaceuticals 3.5% | | | | | | | | |
Horizon Therapeutics PLC* | | | 29,137 | | | | 842,351 | |
Jazz Pharmaceuticals PLC* | | | 5,067 | | | | 636,567 | |
Johnson & Johnson | | | 55,358 | | | | 7,309,470 | |
Merck & Co., Inc. | | | 89,727 | | | | 7,775,742 | |
Zoetis, Inc. | | | 34,800 | | | | 4,451,616 | |
| | | | | | | | |
| | | | | | | 21,015,746 | |
| | |
Professional Services 0.2% | | | | | | | | |
Barrett Business Services, Inc. | | | 2,000 | | | | 175,460 | |
Heidrick & Struggles International, Inc. | | | 4,536 | | | | 129,094 | |
Korn Ferry | | | 27,146 | | | | 995,987 | |
| | | | | | | | |
| | | | | | | 1,300,541 | |
| | |
Real Estate Management & Development 0.2% | | | | | | | | |
Jones Lang LaSalle, Inc. | | | 5,900 | | | | 864,468 | |
| | |
Road & Rail 0.2% | | | | | | | | |
CSX Corp. | | | 20,741 | | | | 1,457,470 | |
| | |
Semiconductors & Semiconductor Equipment 3.9% | | | | | | | | |
Analog Devices, Inc. | | | 14,542 | | | | 1,550,613 | |
Applied Materials, Inc. | | | 23,100 | | | | 1,253,406 | |
Broadcom, Inc. | | | 17,549 | | | | 5,139,225 | |
Diodes, Inc.* | | | 4,500 | | | | 209,925 | |
Intel Corp. | | | 165,141 | | | | 9,335,421 | |
Lam Research Corp. | | | 6,200 | | | | 1,680,448 | |
NVIDIA Corp. | | | 3,100 | | | | 623,162 | |
Texas Instruments, Inc. | | | 15,600 | | | | 1,840,644 | |
Universal Display Corp. | | | 7,400 | | | | 1,481,332 | |
| | | | | | | | |
| | | | | | | 23,114,176 | |
| | |
Software 7.3% | | | | | | | | |
Adobe, Inc.* | | | 10,983 | | | | 3,052,505 | |
Fortinet, Inc.* | | | 2,099 | | | | 171,194 | |
See Notes to Financial Statements.
| | | | |
| PGIM QMA Large-Cap Core Equity Fund | | | 23 | |
Schedule of Investments(continued)
as of October 31, 2019
| | | | | | | | |
| Description | | Shares | | | Value | |
COMMON STOCKS (Continued) | | | | | | | | |
| | |
Software (cont’d.) | | | | | | | | |
Intuit, Inc. | | | 17,602 | | | $ | 4,532,515 | |
Microsoft Corp. | | | 208,284 | | | | 29,861,677 | |
NortonLifeLock, Inc. | | | 15,200 | | | | 347,776 | |
Oracle Corp. | | | 95,579 | | | | 5,208,100 | |
| | | | | | | | |
| | | | | | | 43,173,767 | |
| | |
Specialty Retail 1.6% | | | | | | | | |
Asbury Automotive Group, Inc.* | | | 11,504 | | | | 1,186,408 | |
AutoNation, Inc.* | | | 22,636 | | | | 1,151,041 | |
Group 1 Automotive, Inc. | | | 1,461 | | | | 145,282 | |
Home Depot, Inc. (The) | | | 800 | | | | 187,664 | |
L Brands, Inc. | | | 45,072 | | | | 768,027 | |
Lowe’s Cos., Inc. | | | 43,800 | | | | 4,888,518 | |
Michaels Cos., Inc. (The)*(a) | | | 86,629 | | | | 756,271 | |
Sally Beauty Holdings, Inc.* | | | 10,371 | | | | 160,750 | |
| | | | | | | | |
| | | | | | | 9,243,961 | |
| | |
Technology Hardware, Storage & Peripherals 5.3% | | | | | | | | |
Apple, Inc. | | | 117,145 | | | | 29,140,990 | |
HP, Inc. | | | 90,873 | | | | 1,578,464 | |
Xerox Holdings Corp. | | | 21,756 | | | | 738,181 | |
| | | | | | | | |
| | | | | | | 31,457,635 | |
| | |
Textiles, Apparel & Luxury Goods 0.5% | | | | | | | | |
Capri Holdings Ltd.* | | | 38,700 | | | | 1,202,409 | |
PVH Corp. | | | 20,342 | | | | 1,773,009 | |
| | | | | | | | |
| | | | | | | 2,975,418 | |
| | |
Tobacco 1.4% | | | | | | | | |
Altria Group, Inc. | | | 115,041 | | | | 5,152,687 | |
Philip Morris International, Inc. | | | 39,503 | | | | 3,217,124 | |
| | | | | | | | |
| | | | | | | 8,369,811 | |
| | |
Trading Companies & Distributors 0.6% | | | | | | | | |
BMC Stock Holdings, Inc.* | | | 54,893 | | | | 1,481,562 | |
GMS, Inc.* | | | 18,900 | | | | 566,244 | |
WESCO International, Inc.* | | | 34,721 | | | | 1,741,258 | |
| | | | | | | | |
| | | | | | | 3,789,064 | |
See Notes to Financial Statements.
| | | | | | | | | | | | | | | | |
| | | | |
| Description | | | | | | | | Shares | | | Value | |
| | | | |
COMMON STOCKS (Continued) | | | | | | | | | | | | | | | | |
| | | | |
Water Utilities 0.1% | | | | | | | | | | | | | | | | |
SJW Group | | | | | | | | | | | 11,596 | | | $ | 838,971 | |
| | | | | | | | | | | | | | | | |
TOTAL LONG-TERM INVESTMENTS
(cost $495,017,200) | | | | | | | | | | | | | | | 587,687,226 | |
| | | | | | | | | | | | | | | | |
| | | | |
SHORT-TERM INVESTMENTS 3.7% | | | | | | | | | | | | | | | | |
| | | | |
AFFILIATED MUTUAL FUNDS 3.6% | | | | | | | | | | | | | | | | |
PGIM Core Ultra Short Bond Fund(w) | | | | | | | | | | | 6,423,846 | | | | 6,423,846 | |
PGIM Institutional Money Market Fund
(cost $14,882,138; includes $14,864,981 of cash collateral for securities on
loan)(b)(w) | | | | | | | | | | | 14,881,808 | | | | 14,884,784 | |
| | | | | | | | | | | | | | | | |
TOTAL AFFILIATED MUTUAL FUNDS
(cost $21,305,984) | | | | | | | | | | | | | | | 21,308,630 | |
| | | | | | | | | | | | | | | | |
| | | | |
| | | Interest
Rate | | | Maturity
Date | | | Principal
Amount (000)# | | | | |
| | | | |
U.S. TREASURY OBLIGATION 0.1% | | | | | | | | | | | | | | | | |
U.S. Treasury Bills(k)(n)
(cost $498,730) | | | 1.914 | % | | | 12/19/19 | | | | 500 | | | | 499,043 | |
| | | | | | | | | | | | | | | | |
TOTAL SHORT-TERM INVESTMENTS
(cost $21,804,714) | | | | | | | | | | | | | | | 21,807,673 | |
| | | | | | | | | | | | | | | | |
| | | | |
TOTAL INVESTMENTS 102.7%
(cost $516,821,914) | | | | | | | | | | | | | | | 609,494,899 | |
Liabilities in excess of other assets(z) (2.7)% | | | | | | | | | | | | | | | (15,946,056 | ) |
| | | | | | | | | | | | | | | | |
| | | | |
NET ASSETS 100.0% | | | | | | | | | | | | | | $ | 593,548,843 | |
| | | | | | | | | | | | | | | | |
Below is a list of the abbreviation(s) used in the annual report:
LIBOR—London Interbank Offered Rate
REITs—Real Estate Investment Trust
S&P—Standard & Poor’s
| * | Non-income producing security. |
| # | Principal amount is shown in U.S. dollars unless otherwise stated. |
| (a) | All or a portion of security is on loan. The aggregate market value of such securities, including those sold and pending settlement, is $14,534,567; cash collateral of $14,864,981 (included in liabilities) was received with which the Fund purchased highly liquid short-term investments. |
| (b) | Represents security purchased with cash collateral received for securities on loan and includes dividend reinvestment. |
| (k) | Represents security, or a portion thereof, segregated as collateral for centrally cleared/exchange-traded derivatives. |
| (n) | Rate shown is the effective yield at purchase date. |
See Notes to Financial Statements.
| | | | |
| PGIM QMA Large-Cap Core Equity Fund | | | 25 | |
Schedule of Investments(continued)
as of October 31, 2019
| (w) | PGIM Investments LLC, the manager of the Fund, also serves as manager of the PGIM Core Ultra Short Bond Fund and PGIM Institutional Money Market Fund. |
| (z) | Includes net unrealized appreciation/(depreciation) and/or market value of the below holdings which are excluded from the Schedule of Investments: |
Futures contracts outstanding at October 31, 2019:
| | | | | | | | | | | | | | | | |
Number of
Contracts | | | Type | | Expiration
Date | | | Current
Notional
Amount | | | Value /
Unrealized
Appreciation
(Depreciation) | |
| | | | Long Position: | | | | | | | | | | | | |
| | 46 | | | S&P 500 E-Mini Index | | | Dec. 2019 | | | $ | 6,982,340 | | | $ | 82,908 | |
| | | | | | | | | | | | | | | | |
Summary of Collateral for Centrally Cleared/Exchange-traded Derivatives:
Cash and securities segregated as collateral, including pending settlement for closed positions, to cover requirements for centrally cleared/exchange-traded derivatives are listed by broker as follows:
| | | | | | | | |
Broker | | Cash and/or
Foreign Currency | | | Securities
Market Value | |
| Goldman Sachs & Co. LLC | | $ | — | | | $ | 499,043 | |
| | | | | | | | |
Fair Value Measurements:
Various inputs are used in determining the value of the Fund’s investments. These inputs are summarized in the three broad levels listed below.
Level 1—unadjusted quoted prices generally in active markets for identical securities.
Level 2—quoted prices for similar securities, interest rates and yield curves, prepayment speeds, foreign currency exchange rates and other observable inputs.
Level 3—unobservable inputs for securities valued in accordance with Board approved fair valuation procedures.
The following is a summary of the inputs used as of October 31, 2019 in valuing such portfolio securities:
| | | | | | | | | | | | |
| | | Level 1 | | | Level 2 | | | Level 3 | |
Investments in Securities | | | | | | | | | | | | |
Assets | | | | | | | | | | | | |
Common Stocks | | | | | | | | | | | | |
Aerospace & Defense | | $ | 19,832,144 | | | $ | — | | | $ | — | |
Air Freight & Logistics | | | 2,383,451 | | | | — | | | | — | |
Airlines | | | 308,856 | | | | — | | | | — | |
Automobiles | | | 5,365,032 | | | | — | | | | — | |
Banks | | | 27,999,203 | | | | — | | | | — | |
Beverages | | | 8,809,446 | | | | — | | | | — | |
Biotechnology | | | 18,459,955 | | | | — | | | | — | |
Building Products | | | 5,756,747 | | | | — | | | | — | |
Capital Markets | | | 16,438,288 | | | | — | | | | — | |
Chemicals | | | 7,923,551 | | | | — | | | | — | |
Commercial Services & Supplies | | | 781,515 | | | | — | | | | — | |
See Notes to Financial Statements.
| | | | | | | | | | | | |
| | | Level 1 | | | Level 2 | | | Level 3 | |
Investments in Securities (continued) | | | | | | | | | | | | |
Assets (continued) | | | | | | | | | | | | |
Common Stocks (continued) | | | | | | | | | | | | |
Communications Equipment | | $ | 8,123,355 | | | $ | — | | | $ | — | |
Construction & Engineering | | | 2,628,219 | | | | — | | | | — | |
Construction Materials | | | 5,065,258 | | | | — | | | | — | |
Consumer Finance | | | 5,754,010 | | | | — | | | | — | |
Containers & Packaging | | | 83,671 | | | | — | | | | — | |
Distributors | | | 1,136,805 | | | | — | | | | — | |
Diversified Consumer Services | | | 2,534,969 | | | | — | | | | — | |
Diversified Financial Services | | | 5,318,567 | | | | — | | | | — | |
Diversified Telecommunication Services | | | 17,080,334 | | | | — | | | | — | |
Electric Utilities | | | 8,271,859 | | | | — | | | | — | |
Electrical Equipment | | | 1,921,656 | | | | — | | | | — | |
Electronic Equipment, Instruments & Components | | | 2,457,599 | | | | — | | | | — | |
Energy Equipment & Services | | | 797,496 | | | | — | | | | — | |
Entertainment | | | 6,056,350 | | | | — | | | | — | |
Equity Real Estate Investment Trusts (REITs) | | | 15,847,815 | | | | — | | | | — | |
Food & Staples Retailing | | | 7,755,404 | | | | — | | | | — | |
Food Products | | | 11,114,869 | | | | — | | | | — | |
Gas Utilities | | | 1,551,754 | | | | — | | | | — | |
Health Care Equipment & Supplies | | | 23,219,576 | | | | — | | | | — | |
Health Care Providers & Services | | | 20,276,012 | | | | — | | | | — | |
Hotels, Restaurants & Leisure | | | 8,966,888 | | | | — | | | | — | |
Household Durables | | | 3,487,266 | | | | — | | | | — | |
Household Products | | | 10,783,117 | | | | — | | | | — | |
Independent Power & Renewable Electricity Producers | | | 4,905,381 | | | | — | | | | — | |
Industrial Conglomerates | | | 5,358,971 | | | | — | | | | — | |
Insurance | | | 15,540,223 | | | | — | | | | — | |
Interactive Media & Services | | | 33,510,496 | | | | — | | | | — | |
Internet & Direct Marketing Retail | | | 20,639,672 | | | | — | | | | — | |
IT Services | | | 27,377,663 | | | | — | | | | — | |
Life Sciences Tools & Services | | | 4,146,036 | | | | — | | | | — | |
Machinery | | | 5,410,236 | | | | — | | | | — | |
Media | | | 4,356,059 | | | | — | | | | — | |
Mortgage Real Estate Investment Trusts (REITs) | | | 444,356 | | | | — | | | | — | |
Multiline Retail | | | 7,407,809 | | | | — | | | | — | |
Multi-Utilities | | | 5,946,511 | | | | — | | | | — | |
Oil, Gas & Consumable Fuels | | | 20,751,748 | | | | — | | | | — | |
Pharmaceuticals | | | 21,015,746 | | | | — | | | | — | |
Professional Services | | | 1,300,541 | | | | — | | | | — | |
Real Estate Management & Development | | | 864,468 | | | | — | | | | — | |
Road & Rail | | | 1,457,470 | | | | — | | | | — | |
Semiconductors & Semiconductor Equipment | | | 23,114,176 | | | | — | | | | — | |
Software | | | 43,173,767 | | | | — | | | | — | |
Specialty Retail | | | 9,243,961 | | | | — | | | | — | |
Technology Hardware, Storage & Peripherals | | | 31,457,635 | | | | — | | | | — | |
Textiles, Apparel & Luxury Goods | | | 2,975,418 | | | | — | | | | — | |
Tobacco | | | 8,369,811 | | | | — | | | | — | |
See Notes to Financial Statements.
| | | | |
| PGIM QMA Large-Cap Core Equity Fund | | | 27 | |
Schedule of Investments(continued)
as of October 31, 2019
| | | | | | | | | | | | |
| | | Level 1 | | | Level 2 | | | Level 3 | |
Investments in Securities (continued) | | | | | | | | | | | | |
Assets (continued) | | | | | | | | | | | | |
Common Stocks (continued) | | | | | | | | | | | | |
Trading Companies & Distributors | | $ | 3,789,064 | | | $ | — | | | $ | — | |
Water Utilities | | | 838,971 | | | | — | | | | — | |
Affiliated Mutual Funds | | | 21,308,630 | | | | — | | | | — | |
U.S. Treasury Obligation | | | — | | | | 499,043 | | | | — | |
| | | | | | | | | | | | |
Total | | $ | 608,995,856 | | | $ | 499,043 | | | $ | — | |
| | | | | | | | | | | | |
Other Financial Instruments* | | | | | | | | | | | | |
Assets | | | | | | | | | | | | |
Futures Contracts | | $ | 82,908 | | | $ | — | | | $ | — | |
| | | | | | | | | | | | |
| * | Other financial instruments are derivative instruments not reflected in the Schedule of Investments, such as futures, forwards and centrally cleared swap contracts, which are recorded at the unrealized appreciation (depreciation) on the instrument, and OTC swap contracts which are recorded at fair value. |
Industry Classification:
The industry classification of investments and liabilities in excess of other assets shown as a percentage of net assets as of October 31, 2019 were as follows (unaudited):
| | | | |
Software | | | 7.3 | % |
Interactive Media & Services | | | 5.7 | |
Technology Hardware, Storage & Peripherals | | | 5.3 | |
Banks | | | 4.7 | |
IT Services | | | 4.6 | |
Health Care Equipment & Supplies | | | 3.9 | |
Semiconductors & Semiconductor Equipment | | | 3.9 | |
Affiliated Mutual Funds (2.5% represents investments purchased with collateral from securities on loan) | | | 3.6 | |
Pharmaceuticals | | | 3.5 | |
Oil, Gas & Consumable Fuels | | | 3.5 | |
Internet & Direct Marketing Retail | | | 3.5 | |
Health Care Providers & Services | | | 3.4 | |
Aerospace & Defense | | | 3.3 | |
Biotechnology | | | 3.1 | |
Diversified Telecommunication Services | | | 2.9 | |
Capital Markets | | | 2.8 | |
Equity Real Estate Investment Trusts (REITs) | | | 2.7 | |
Insurance | | | 2.6 | |
Food Products | | | 1.9 | |
Household Products | | | 1.8 | |
Specialty Retail | | | 1.6 | |
Hotels, Restaurants & Leisure | | | 1.5 | |
| | | | |
Beverages | | | 1.5 | % |
Tobacco | | | 1.4 | |
Electric Utilities | | | 1.4 | |
Communications Equipment | | | 1.4 | |
Chemicals | | | 1.3 | |
Food & Staples Retailing | | | 1.3 | |
Multiline Retail | | | 1.3 | |
Entertainment | | | 1.0 | |
Multi-Utilities | | | 1.0 | |
Building Products | | | 1.0 | |
Consumer Finance | | | 1.0 | |
Machinery | | | 0.9 | |
Automobiles | | | 0.9 | |
Industrial Conglomerates | | | 0.9 | |
Diversified Financial Services | | | 0.9 | |
Construction Materials | | | 0.9 | |
Independent Power & Renewable Electricity Producers | | | 0.8 | |
Media | | | 0.7 | |
Life Sciences Tools & Services | | | 0.7 | |
Trading Companies & Distributors | | | 0.6 | |
Household Durables | | | 0.6 | |
Textiles, Apparel & Luxury Goods | | | 0.5 | |
Construction & Engineering | | | 0.4 | |
See Notes to Financial Statements.
| | | | |
Industry Classification (continued): | | | |
Diversified Consumer Services | | | 0.4 | % |
Electronic Equipment, Instruments & Components | | | 0.4 | |
Air Freight & Logistics | | | 0.4 | |
Electrical Equipment | | | 0.3 | |
Gas Utilities | | | 0.3 | |
Road & Rail | | | 0.2 | |
Professional Services | | | 0.2 | |
Distributors | | | 0.2 | |
Real Estate Management & Development | | | 0.2 | |
Water Utilities | | | 0.1 | |
Energy Equipment & Services | | | 0.1 | |
Commercial Services & Supplies | | | 0.1 | |
| | | | |
| | | | |
U.S. Treasury Obligation | | | 0.1 | % |
Mortgage Real Estate Investment Trusts (REITs) | | | 0.1 | |
Airlines | | | 0.1 | |
Containers & Packaging | | | 0.0 | * |
| | | | |
| | | 102.7 | |
Liabilities in excess of other assets | | | (2.7 | ) |
| | | | |
| | | 100.0 | % |
| | | | |
Effects of Derivative Instruments on the Financial Statements and Primary Underlying Risk Exposure:
The Fund invested in derivative instruments during the reporting period. The primary type of risk associated with these derivative instruments is equity contracts risk. See the Notes to Financial Statements for additional detail regarding these derivative instruments and their risks. The effect of such derivative instruments on the Fund’s financial position and financial performance as reflected in the Statement of Assets and Liabilities and Statement of Operations is presented in the summary below.
Fair values of derivative instruments as of October 31, 2019 as presented in the Statement of Assets and Liabilities:
| | | | | | | | | | | | |
Derivatives not accounted for as hedging instruments, carried at fair value | | Asset Derivatives | | | Liability Derivatives | |
| | Statement of
Assets and
Liabilities Location | | Fair
Value | | | Statement of
Assets and
Liabilities Location | | Fair
Value | |
| Equity contracts | | Due from/to broker—variation margin futures | | $ | 82,908 | * | | — | | $ | — | |
| | | | | | | | | | | | |
| * | Includes cumulative appreciation (depreciation) as reported in the schedule of open futures and centrally cleared swap contracts. Only unsettled variation margin receivable (payable) is reported within the Statement of Assets and Liabilities. |
The effects of derivative instruments on the Statement of Operations for the year ended October 31, 2019 are as follows:
| | | | |
Amount of Realized Gain (Loss) on Derivatives Recognized in Income | |
Derivatives not accounted for as hedging
instruments, carried at fair value | | Futures | |
Equity contracts | | $ | 1,895,292 | |
| | | | |
See Notes to Financial Statements.
| | | | |
| PGIM QMA Large-Cap Core Equity Fund | | | 29 | |
Schedule of Investments(continued)
as of October 31, 2019
| | | | |
Change in Unrealized Appreciation (Depreciation) on Derivatives Recognized in Income | |
Derivatives not accounted for as hedging
instruments, carried at fair value | | Futures | |
Equity contracts | | $ | 297,186 | |
| | | | |
For the year ended October 31, 2019, the Fund’s average volume of derivative activities is as follows:
| | | | |
| | | Futures
Contracts—
Long
Positions(1) | |
| | $ | 7,689,850 | |
| (1) | Notional Amount in USD. |
Financial Instruments/Transactions—Summary of Offsetting and Netting Arrangements:
The Fund entered into financial instruments/transactions during the reporting period that are either offset in accordance with current requirements or are subject to enforceable master netting arrangements or similar agreements that permit offsetting. The information about offsetting and related netting arrangements for financial instruments/transactions where the legal right toset-off exists is presented in the summary below.
Offsetting of financial instrument/transaction assets and liabilities:
| | | | | | | | | | | | |
Description | | Gross Market
Value of
Recognized
Assets/(Liabilities) | | | Collateral
Pledged/(Received)(1) | | | Net
Amount | |
Securities on Loan | | $ | 14,534,567 | | | $ | (14,534,567 | ) | | $ | — | |
| | | | | | | | | | | | |
| (1) | Collateral amount disclosed by the Fund is limited to the market value of financial instruments/transactions. |
See Notes to Financial Statements.
Statement of Assets and Liabilities
as of October 31, 2019
| | | | |
Assets | | | | |
Investments at value, including securities on loan of $14,534,567: | | | | |
Unaffiliated investments (cost $495,515,930) | | $ | 588,186,269 | |
Affiliated investments (cost $21,305,984) | | | 21,308,630 | |
Dividends receivable | | | 655,450 | |
Receivable for Fund shares sold | | | 457,619 | |
Receivable for investments sold | | | 2,184 | |
Prepaid expenses | | | 4,296 | |
| | | | |
Total Assets | | | 610,614,448 | |
| | | | |
| |
Liabilities | | | | |
Payable to broker for collateral for securities on loan | | | 14,864,981 | |
Payable for Fund shares reacquired | | | 1,649,567 | |
Management fee payable | | | 184,089 | |
Accrued expenses and other liabilities | | | 150,809 | |
Distribution fee payable | | | 112,661 | |
Affiliated transfer agent fee payable | | | 75,898 | |
Due to broker—variation margin futures | | | 27,600 | |
| | | | |
Total Liabilities | | | 17,065,605 | |
| | | | |
| |
Net Assets | | $ | 593,548,843 | |
| | | | |
| | | | | |
Net assets were comprised of: | | | | |
Shares of beneficial interest, at par | | $ | 39,099 | |
Paid-in capital in excess of par | | | 501,950,517 | |
Total distributable earnings (loss) | | | 91,559,227 | |
| | | | |
Net assets, October 31, 2019 | | $ | 593,548,843 | |
| | | | |
See Notes to Financial Statements.
| | | | |
| PGIM QMA Large-Cap Core Equity Fund | | | 31 | |
Statement of Assets and Liabilities
as of October 31, 2019
| | | | |
Class A | | | | |
Net asset value and redemption price per share,
($400,633,595 ÷ 26,415,843 shares of beneficial interest issued and outstanding) | | $ | 15.17 | |
Maximum sales charge (5.50% of offering price) | | | 0.88 | |
| | | | |
Maximum offering price to public | | $ | 16.05 | |
| | | | |
| |
Class B | | | | |
Net asset value, offering price and redemption price per share, | | | | |
($7,668,094 ÷ 570,952 shares of beneficial interest issued and outstanding) | | $ | 13.43 | |
| | | | |
| |
Class C | | | | |
Net asset value, offering price and redemption price per share, | | | | |
($27,332,980 ÷ 2,031,057 shares of beneficial interest issued and outstanding) | | $ | 13.46 | |
| | | | |
| |
Class Z | | | | |
Net asset value, offering price and redemption price per share, | | | | |
($67,192,167 ÷ 4,294,661 shares of beneficial interest issued and outstanding) | | $ | 15.65 | |
| | | | |
| |
Class R6 | | | | |
Net asset value, offering price and redemption price per share, | | | | |
($90,722,007 ÷ 5,786,727 shares of beneficial interest issued and outstanding) | | $ | 15.68 | |
| | | | |
See Notes to Financial Statements.
Statement of Operations
Year Ended October 31, 2019
| | | | |
Net Investment Income (Loss) | | | | |
Income | | | | |
Unaffiliated dividend income (net of $1,142 foreign withholding tax) | | $ | 9,883,998 | |
Affiliated dividend income | | | 194,746 | |
Interest income | | | 15,892 | |
Affiliated income from securities lending, net | | | 5,441 | |
| | | | |
Total income | | | 10,100,077 | |
| | | | |
| |
Expenses | | | | |
Management fee | | | 1,740,473 | |
Distribution fee(a) | | | 1,331,019 | |
Transfer agent’s fees and expenses (including affiliated expense of $396,091)(a) | | | 666,583 | |
Custodian and accounting fees | | | 110,051 | |
Registration fees(a) | | | 43,318 | |
Shareholders’ reports | | | 31,078 | |
Legal fees and expenses | | | 28,173 | |
Audit fee | | | 24,596 | |
Trustees’ fees | | | 19,616 | |
Miscellaneous | | | 24,067 | |
| | | | |
Total expenses | | | 4,018,974 | |
Less: Fee waiver and/or expense reimbursement(a) | | | (390,137 | ) |
Distribution fee waiver(a) | | | (151,432 | ) |
| | | | |
Net expenses | | | 3,477,405 | |
| | | | |
Net investment income (loss) | | | 6,622,672 | |
| | | | |
| |
Realized And Unrealized Gain (Loss) On Investment And Foreign Currency Transactions | | | | |
Net realized gain (loss) on: | | | | |
Investment transactions (including affiliated of $27) | | | 15,105,713 | |
Futures transactions | | | 1,895,292 | |
In-kind redemptions | | | 8,837,105 | |
Foreign currency transactions | | | (105 | ) |
| | | | |
| | | 25,838,005 | |
| | | | |
Net change in unrealized appreciation (depreciation) on: | | | | |
Investments (including affiliated of $2,646) | | | 30,588,757 | |
Futures | | | 297,186 | |
Foreign currencies | | | 95 | |
| | | | |
| | | 30,886,038 | |
| | | | |
Net gain (loss) on investment and foreign currency transactions | | | 56,724,043 | |
| | | | |
Net Increase (Decrease) In Net Assets Resulting From Operations | | $ | 63,346,715 | |
| | | | |
See Notes to Financial Statements.
| | | | |
| PGIM QMA Large-Cap Core Equity Fund | | | 33 | |
Statement of Operations
Year Ended October 31, 2019
| (a) | Class specific expenses and waivers were as follows: |
| | | | | | | | | | | | | | | | | | | | |
| | | Class A | | | Class B | | | Class C | | | Class Z | | | Class R6 | |
Distribution fee | | | 908,591 | | | | 54,304 | | | | 368,124 | | | | — | | | | — | |
Transfer agent’s fees and expenses | | | 494,117 | | | | 39,515 | | | | 46,241 | | | | 85,546 | | | | 1,164 | |
Registration fees | | | 14,037 | | | | 6,451 | | | | 7,600 | | | | 9,123 | | | | 6,107 | |
Fee waiver and/or expense reimbursement | | | (237,087 | ) | | | (35,555 | ) | | | (26,608 | ) | | | (41,783 | ) | | | (49,104 | ) |
Distribution fee waiver | | | (151,432 | ) | | | — | | | | — | | | | — | | | | — | |
See Notes to Financial Statements.
Statements of Changes in Net Assets
| | | | | | | | |
| |
| | | Year Ended October 31, | |
| | |
| | | 2019 | | | 2018 | |
Increase (Decrease) in Net Assets | | | | | | | | |
Operations | | | | | | | | |
Net investment income (loss) | | $ | 6,622,672 | | | $ | 3,373,796 | |
Net realized gain (loss) on investment and foreign currency transactions | | | 25,838,005 | | | | 45,355,078 | |
Net change in unrealized appreciation (depreciation) on investments and foreign currencies | | | 30,886,038 | | | | (32,925,093 | ) |
| | | | | | | | |
Net increase (decrease) in net assets resulting from operations | | | 63,346,715 | | | | 15,803,781 | |
| | | | | | | | |
| | |
Dividends and Distributions | | | | | | | | |
Distributions from distributable earnings | | | | | | | | |
Class A | | | (18,490,996 | ) | | | (15,856,544 | ) |
Class B | | | (302,126 | ) | | | (299,083 | ) |
Class C | | | (5,561,134 | ) | | | (4,505,168 | ) |
Class Z | | | (10,679,222 | ) | | | (8,182,105 | ) |
Class R6 | | | (13,527,645 | ) | | | (8,674,924 | ) |
| | | | | | | | |
| | | (48,561,123 | ) | | | (37,517,824 | ) |
| | | | | | | | |
| | |
Fund share transactions (Net of share conversions) | | | | | | | | |
Net proceeds from shares sold | | | 77,592,760 | | | | 69,862,792 | |
Net asset value of shares issued in reinvestment of dividends and distributions | | | 47,878,127 | | | | 36,692,050 | |
Net asset value of shares issued in merger | | | 302,901,376 | | | | — | |
Cost of shares reacquired | | | (125,442,700 | ) | | | (70,529,311 | ) |
| | | | | | | | |
Net increase (decrease) in net assets from Fund share transactions | | | 302,929,563 | | | | 36,025,531 | |
| | | | | | | | |
Total increase (decrease) | | | 317,715,155 | | | | 14,311,488 | |
| | |
Net Assets: | | | | | | | | |
Beginning of year | | | 275,833,688 | | | | 261,522,200 | |
| | | | | | | | |
End of year | | $ | 593,548,843 | | | $ | 275,833,688 | |
| | | | | | | | |
See Notes to Financial Statements.
| | | | |
| PGIM QMA Large-Cap Core Equity Fund | | | 35 | |
Notes to Financial Statements
Prudential Investment Portfolios 9 (the “Trust”) is registered under the Investment Company Act of 1940, as amended (“1940 Act”), as anopen-end management investment company. The Trust currently consists of five funds: PGIM Absolute Return Bond Fund and PGIM QMALarge-Cap Core Equity Fund, each of which are diversified funds and PGIM International Bond Fund, PGIM Select Real Estate Fund and PGIM Real Estate Income Fund, each of which arenon-diversified funds for purposes of the 1940 Act and may invest a greater percentage of their assets in the securities of a single company or other issuer than a diversified fund. Investing in anon-diversified fund involves greater risk than investing in a diversified fund because a loss resulting from the decline in value of any one security may represent a greater portion of the total assets of anon-diversified fund. These financial statements relate only to the PGIM QMALarge-Cap Core Equity Fund (the “Fund”).
The investment objective of the Fund is to seek long-term growth of capital.
1. Accounting Policies
The Fund follows the investment company accounting and reporting guidance of the Financial Accounting Standards Board (“FASB”) Accounting Standard Codification (“ASC”) Topic 946 Financial Services—Investment Companies.The following accounting policies conform to U.S. generally accepted accounting principles. The Fund consistently follows such policies in the preparation of its financial statements.
Securities Valuation:The Fund holds securities and other assets and liabilities that are fair valued at the close of each day (generally, 4:00 PM Eastern time) the New York Stock Exchange (“NYSE”) is open for trading. Fair value is the price that would be received to sell an asset or paid to transfer a liability in an orderly transaction between market participants on the measurement date. The Trust’s Board of Trustees (the “Board”) has adopted valuation procedures for security valuation under which fair valuation responsibilities have been delegated to PGIM Investments LLC (“PGIM Investments” or the “Manager”). Pursuant to the Board’s delegation, the Manager has established a Valuation Committee responsible for supervising the fair valuation of portfolio securities and other assets and liabilities. The valuation procedures permit the Fund to utilize independent pricing vendor services, quotations from market makers, and alternative valuation methods when market quotations are either not readily available or not deemed representative of fair value. A record of the Valuation Committee’s actions is subject to the Board’s review, approval, and ratification at its next regularly scheduled quarterly meeting.
For the fiscal reportingyear-end, securities and other assets and liabilities were fair valued at the close of the last U.S. business day. Trading in certain foreign securities may occur when the NYSE is closed (including weekends and holidays). Because such foreign securities
trade in markets that are open on weekends and U.S. holidays, the values of some of the Fund’s foreign investments may change on days when investors cannot purchase or redeem Fund shares.
Various inputs determine how the Fund’s investments are valued, all of which are categorized according to the three broad levels (Level 1, 2, or 3) detailed in the Schedule of Investments and referred to herein as the “fair value hierarchy” in accordance with FASB ASC Topic 820—Fair Value Measurements and Disclosures.
Common and preferred stocks, exchange-traded funds, and derivative instruments, such as futures or options, that are traded on a national securities exchange are valued at the last sale price as of the close of trading on the applicable exchange where the security principally trades. Securities traded via NASDAQ are valued at the NASDAQ official closing price. To the extent these securities are valued at the last sale price or NASDAQ official closing price, they are classified as Level 1 in the fair value hierarchy. In the event that no sale or official closing price on valuation date exists, these securities are generally valued at the mean between the last reported bid and ask prices, or at the last bid price in the absence of an ask price. These securities are classified as Level 2 in the fair value hierarchy.
Foreign equities traded on foreign securities exchanges are generally valued using pricing vendor services that provide model prices derived using adjustment factors based on information such as local closing price, relevant general and sector indices, currency fluctuations, depositary receipts, and futures, as applicable. Securities valued using such model prices are classified as Level 2 in the fair value hierarchy. The models generate an evaluated adjustment factor for each security, which is applied to the local closing price to adjust it for post closing market movements up to the time the Fund is valued. Utilizing that evaluated adjustment factor, the vendor provides an evaluated price for each security. If the vendor does not provide an evaluated price, securities are valued in accordance with exchange-traded common and preferred stock valuation policies discussed above.
Investments inopen-end,non-exchange-traded mutual funds are valued at their net asset values as of the close of the NYSE on the date of valuation. These securities are classified as Level 1 in the fair value hierarchy since they may be purchased or sold at their net asset values on the date of valuation.
Securities and other assets that cannot be priced according to the methods described above are valued based on pricing methodologies approved by the Board. In the event that unobservable inputs are used when determining such valuations, the securities will be classified as Level 3 in the fair value hierarchy.
When determining the fair value of securities, some of the factors influencing the valuation include: the nature of any restrictions on disposition of the securities; assessment of the general liquidity of the securities; the issuer’s financial condition and the markets in which it does business; the cost of the investment; the size of the holding and the capitalization of the issuer; the prices of any recent transactions or bids/offers for such securities or any
| | | | |
| PGIM QMA Large-Cap Core Equity Fund | | | 37 | |
Notes to Financial Statements(continued)
comparable securities; any available analyst media or other reports or information deemed reliable by the Manager regarding the issuer or the markets or industry in which it operates. Using fair value to price securities may result in a value that is different from a security’s most recent closing price and from the price used by other unaffiliated mutual funds to calculate their net asset values.
Illiquid Securities:Pursuant to Rule22e-4 under the 1940 Act, the Fund has adopted a Board approved Liquidity Risk Management Program (“LRMP”) that requires, among other things, that the Fund limit its illiquid investments that are assets to no more than 15% of net assets. Illiquid securities are those that, because of the absence of a readily available market or due to legal or contractual restrictions on resale, may not reasonably be expected to be sold or disposed of in current market conditions in seven calendar days or less without the sale or disposition significantly changing the market value of the investment. The Fund may find it difficult to sell illiquid securities at the time considered most advantageous by its subadviser and may incur transaction costs that would not be incurred in the sale of securities that were freely marketable.
Restricted Securities:Securities acquired in unregistered, private sales from the issuing company or from an affiliate of the issuer are considered restricted as to disposition under federal securities law (“restricted securities”). Such restricted securities are valued pursuant to the valuation procedures noted above. Restricted securities that would otherwise be considered illiquid investments pursuant to the Fund’s LRMP because of legal restrictions on resale to the general public may be traded among qualified institutional buyers under Rule 144A of the Securities Act of 1933. Therefore, these Rule 144A securities, as well as commercial paper that is sold in private placements under Section 4(2) of the Securities Act of 1933, may be classified higher than “illiquid” under the LRMP (i.e. “moderately liquid” or “less liquid” investments). However, the liquidity of the Fund’s investments in restricted securities could be impaired if trading does not develop or declines.
Financial Futures Contracts:A financial futures contract is an agreement to purchase (long) or sell (short) an agreed amount of securities at a set price for delivery on a future date. Upon entering into a financial futures contract, the Fund is required to pledge to the broker an amount of cash and/or other assets equal to a certain percentage of the contract amount. This amount is known as the “initial margin.” Subsequent payments, known as “variation margin,” are made or received by the Fund each day, depending on the daily fluctuations in the value of the underlying security. Such variation margin is recorded for financial statement purposes on a daily basis as unrealized gain (loss). When the contract expires or is closed, the gain (loss) is realized and is presented in the Statement of Operations as net realized gain (loss) on futures transactions.
The Fund invested in financial futures contracts in order to hedge its existing portfolio securities, or securities the Fund intends to purchase, against fluctuations in value caused by changes in prevailing interest rates. Should interest rates move unexpectedly, the Fund may not achieve the anticipated benefits of the financial futures contracts and may realize a loss. The use of futures transactions involves the risk of imperfect correlation in movements in the price of futures contracts and the underlying hedged assets. Since futures contracts are exchange-traded, there is minimal counterparty credit risk to the Fund since the exchanges’ clearinghouse acts as counterparty to all exchange-traded futures and guarantees the futures contracts against default.
Master Netting Arrangements:The Trust, on behalf of the Fund, is subject to various Master Agreements, or netting arrangements, with select counterparties. These are agreements which a subadviser may have negotiated and entered into on behalf of all or a portion of the Fund. A master netting arrangement between the Fund and the counterparty permits the Fund to offset amounts payable by the Fund to the same counterparty against amounts to be received; and by the receipt of collateral from the counterparty by the Fund to cover the Fund’s exposure to the counterparty. However, there is no assurance that such mitigating factors are easily enforceable. In addition to master netting arrangements, the right toset-off exists when all the conditions are met such that each of the parties owes the other determinable amounts, the reporting party has the right toset-off the amount owed with the amount owed by the other party, the reporting party intends toset-off and the right ofset-off is enforceable by law. During the reporting period, there was no intention to settle on a net basis and all amounts are presented on a gross basis on the Statement of Assets and Liabilities.
Securities Lending:The Fund lends its portfolio securities to banks and broker-dealers. The loans are secured by collateral at least equal to the market value of the securities loaned. Collateral pledged by each borrower is invested in an affiliated money market fund and is marked to market daily, based on the previous day’s market value, such that the value of the collateral exceeds the value of the loaned securities. In the event of significant appreciation in value of securities on loan on the last business day of the reporting period, the financial statements may reflect a collateral value that is less than the market value of the loaned securities. Such shortfall is remedied as described above. Loans are subject to termination at the option of the borrower or the Fund. Upon termination of the loan, the borrower will return to the Fund securities identical to the loaned securities. Should the borrower of the securities fail financially, the Fund has the right to repurchase the securities in the open market using the collateral.
The Fund recognizes income, net of any rebate and securities lending agent fees, for lending its securities in the form of fees or interest on the investment of any cash received as collateral. The borrower receives all interest and dividends from the securities loaned and such payments are passed back to the lender in amounts equivalent thereto. The Fund also continues to recognize any unrealized gain (loss) in the market price of the securities loaned and on the change in the value of the collateral invested that may occur during the term of the loan. In addition, realized gain (loss) is recognized on changes in the value of the
| | | | |
| PGIM QMA Large-Cap Core Equity Fund | | | 39 | |
Notes to Financial Statements(continued)
collateral invested upon liquidation of the collateral. Net earnings from securities lending are disclosed on the Statement of Operations as “Affiliated income from securities lending, net”.
Equity and Mortgage Real Estate Investment Trusts (collectively equity REITs):The Fund invested in equity REITs, which report information on the source of their distributions annually. Based on current and historical information, a portion of distributions received from equity REITs during the period is estimated to be dividend income, capital gain or return of capital and recorded accordingly. When material, these estimates are adjusted periodically when the actual source of distributions is disclosed by the equity REITs.
Securities Transactions and Net Investment Income:Securities transactions are recorded on the trade date. Realized gains (losses) from investment and currency transactions are calculated on the specific identification method. Dividend income is recorded on theex-date, or for certain foreign securities, when the Fund becomes aware of such dividends. Expenses are recorded on an accrual basis, which may require the use of certain estimates by management that may differ from actual. Net investment income or loss (other than class specific expenses and waivers, which are allocated as noted below) and unrealized and realized gains (losses) are allocated daily to each class of shares based upon the relative proportion of adjusted net assets of each class at the beginning of the day. Class specific expenses and waivers, where applicable, are charged to the respective share classes. Class specific expenses include distribution fees and distribution fee waivers, shareholder servicing fees, transfer agent’s fees and expenses, registration fees and fee waivers and/or expense reimbursements, as applicable.
Taxes:It is the Fund’s policy to continue to meet the requirements of the Internal Revenue Code applicable to regulated investment companies and to distribute all of its taxable net investment income and capital gains, if any, to its shareholders. Therefore, no federal income tax provision is required. Withholding taxes on foreign dividends, interest and capital gains, if any, are recorded, net of reclaimable amounts, at the time the related income is earned.
Dividends and Distributions:The Fund expects to pay dividends from net investment income and distributions from net realized capital gains, if any, annually. Dividends and distributions to shareholders, which are determined in accordance with federal income tax regulations and which may differ from generally accepted accounting principles, are recorded on theex-date. Permanent book/tax differences relating to income and gain (loss) are reclassified between total distributable earnings (loss) andpaid-in capital in excess of par, as appropriate.
Estimates:The preparation of financial statements requires management to make estimates and assumptions that affect the reported amounts and disclosures in the financial
statements. Actual results could differ from those estimates.
2. Agreements
The Trust, on behalf of the Fund, has a management agreement with the Manager. Pursuant to this agreement, the Manager has responsibility for all investment advisory services and supervises the subadviser’s performance of such services. In addition, under the management agreement, the Manager provides all of the administrative functions necessary for the organization, operation and management of the Fund. The Manager administers the corporate affairs of the Fund and, in connection therewith, furnishes the Fund with office facilities, together with those ordinary clerical and bookkeeping services which are not being furnished by the Fund’s custodian and the Fund’s transfer agent. The Manager is also responsible for the staffing and management of dedicated groups of legal, marketing, compliance and related personnel necessary for the operation of the Fund. The legal, marketing, compliance and related personnel are also responsible for the management and oversight of the various service providers to the Fund, including, but not limited to, the custodian, transfer agent, and accounting agent.
The Manager has entered into a subadvisory agreement with QMA LLC (“QMA”) (formerly known as Quantitative Management Associates, LLC). The subadvisory agreement provides that QMA will furnish investment advisory services in connection with the management of the Fund. In connection therewith, QMA is obligated to keep certain books and records of the Fund. The Manager pays for the services of QMA, the cost of compensation of officers of the Fund, occupancy and certain clerical and bookkeeping costs of the Fund. The Fund bears all other costs and expenses.
The management fee paid to the Manager is accrued daily and payable monthly at an annual rate of 0.35% of the Fund’s average daily net assets up to and including $5 billion and 0.34% of the Fund’s average daily net assets in excess of $5 billion. The effective management fee rate before any waivers and/or expense reimbursements was 0.35% for the year ended October 31, 2019.
The Manager has contractually agreed through February 28, 2021, to limit net annual Fund operating expenses, exclusive of distribution and service(12b-1) fees and transfer agency expenses (includingsub-transfer agency and networking fees), of each class of shares to 0.35% of the Fund’s average daily net assets. Separately, effective December 15, 2018 the Manager has contractually agreed, through February 28, 2021, to limit total annual operating expenses after fee waivers and/or expense reimbursements to 1.58% of average daily net assets for Class B shares. Additionally, effective June 22, 2019 the Manager has contractually agreed, through February 28, 2021, to limit total annual operating expenses after fee waivers and/or expense reimbursements to 0.72% of average daily net assets for Class A shares and 1.44% of average daily net assets for Class C shares. This contractual waiver excludes interest, brokerage, taxes (such as income and foreign withholding taxes, stamp duty and deferred tax expenses), acquired fund fees and expenses, extraordinary expenses, and certain other Fund expenses such as dividend and interest expense and
| | | | |
| PGIM QMA Large-Cap Core Equity Fund | | | 41 | |
Notes to Financial Statements(continued)
broker charges on short sales. Where applicable, the Manager agrees to waive management fees or shared operating expenses on any share class to the same extent that it waives similar expenses on any other share class. In addition, total annual operating expenses for Class R6 shares will not exceed total annual operating expenses for Class Z shares. Fees and/or expenses waived and/or reimbursed by the Manager may be recouped by the Manager within the same fiscal year during which such waiver and/or reimbursement is made if such recoupment can be realized without exceeding the expense limit in effect at the time of the recoupment for that fiscal year.
The Trust, on behalf of the Fund, has a distribution agreement with Prudential Investment Management Services LLC (“PIMS”), which acts as the distributor of the Class A, Class B, Class C, Class Z and Class R6 shares of the Fund. The Fund compensates PIMS for distributing and servicing the Fund’s Class A, Class B and Class C shares, pursuant to the plans of distribution (the “Distribution Plans”), regardless of expenses actually incurred by PIMS. The distribution fees are accrued daily and payable monthly. No distribution or service fees are paid to PIMS as distributor of the Class Z and Class R6 shares of the Fund.
Pursuant to the Distribution Plans, the Fund compensates PIMS for distribution related activities at an annual rate of up to 0.30%, 1% and 1% of the average daily net assets of the Class A, Class B and Class C shares, respectively. PIMS has contractually agreed through February 28, 2021 to limit such fees to 0.25% of the average daily net assets of the Class A shares.
For the year ended October 31, 2019, PIMS received $190,261 infront-end sales charges resulting from sales of Class A shares. Additionally, for the year ended October 31, 2019, PIMS received $2,128 and $1,588 in contingent deferred sales charges imposed upon redemptions by certain Class B and Class C shareholders, respectively. From these fees, PIMS paid such sales charges to broker-dealers, who in turn paid commissions to salespersons and incurred other distribution costs.
PGIM Investments, PIMS and QMA are indirect, wholly-owned subsidiaries of Prudential Financial, Inc. (“Prudential”).
3. Other Transactions with Affiliates
Prudential Mutual Fund Services LLC (“PMFS”), an affiliate of PGIM Investments and an indirect, wholly-owned subsidiary of Prudential, serves as the Fund’s transfer agent. Transfer agent’s fees and expenses in the Statement of Operations include certainout-of-pocket expenses paid tonon-affiliates, where applicable.
The Fund may invest its overnight sweep cash in the PGIM Core Ultra Short Bond Fund (the “Core Fund”), and its securities lending cash collateral in the PGIM Institutional Money Market Fund (the “Money Market Fund”), each a series of Prudential Investment Portfolios 2, registered under the 1940 Act and managed by PGIM Investments. Through the Fund’s investments in the mentioned underlying funds, PGIM Investments and/or its affiliates are paid fees or reimbursed for providing their services. In addition to the realized and unrealized gains on investments in the Core Fund and Money Market Fund, earnings from such investments are disclosed on the Statement of Operations as “Affiliated dividend income” and “Affiliated income from securities lending, net”, respectively.
The Fund may enter into certain securities purchase or sale transactions under Board approved Rule17a-7 procedures. Rule17a-7 is an exemptive rule under the 1940 Act, that subject to certain conditions, permits purchase and sale transactions among affiliated investment companies, or between an investment company and a person that is affiliated solely by reason of having a common (or affiliated) investment adviser, common directors, and/or common officers. Pursuant to the Rule17a-7 procedures and consistent with guidance issued by the SEC, the Trust’s Chief Compliance Officer (“CCO”) prepares a quarterly summary of all such transactions for submission to the Board, together with the CCO’s written representation that all such17a-7 transactions were effected in accordance with the Fund’s Rule17a-7 procedures. For the year ended October 31, 2019, no17a-7 transactions were entered into by the Fund.
4. Portfolio Securities
The aggregate cost of purchases and proceeds from sales of portfolio securities (excluding short-term investments,in-kind transactions and U.S. Government securities) for the year ended October 31, 2019, were $427,273,450 and $441,158,560, respectively.
A summary of the cost of purchases and proceeds from sales of shares of affiliated investments for the year ended October 31, 2019, is presented as follows:
| | | | | | | | | | | | | | | | | | | | | | | | | | | | | | |
Value,
Beginning
of Year | | | Cost of
Purchases | | | Proceeds
from Sales | | | Change in
Unrealized
Gain
(Loss) | | | Realized
Gain
(Loss) | | | Value,
End of Year | | | Shares,
End
of Year | | | Income | |
| | PGIM Core Ultra Short Bond Fund* | | | | | | | | | | | | | |
| $ | 7,609,208 | | | $ | 104,225,402 | | | $ | 105,410,764 | | | $ | — | | | $ | — | | | $ | 6,423,846 | | | | 6,423,846 | | | $ | 194,746 | |
| | PGIM Institutional Money Market Fund* | | | | | | | | | | | | | |
| | — | | | | 79,346,019 | | | | 64,463,908 | | | | 2,646 | | | | 27 | | | | 14,884,784 | | | | 14,881,808 | | | | 5,441 | ** |
| | | | | | | | | | | | | | | | | | | | | | | | | | | | | | |
| $ | 7,609,208 | | | $ | 183,571,421 | | | $ | 169,874,672 | | | $ | 2,646 | | | $ | 27 | | | $ | 21,308,630 | | | | | | | $ | 200,187 | |
| | | | | | | | | | | | | | | | | | | | | | | | | | | | | | |
| * | The Fund did not have any capital gain distributions during the reporting period. |
| ** | This amount is included in “Affliated income from securities lending, net” on the Statement of Operations. |
| | | | |
| PGIM QMA Large-Cap Core Equity Fund | | | 43 | |
Notes to Financial Statements(continued)
5. Distributions and Tax Information
Distributions to shareholders, which are determined in accordance with federal income tax regulations and which may differ from generally accepted accounting principles, are recorded on theex-date. In order to present total distributable earnings (loss) andpaid-in capital in excess of par on the Statement of Assets and Liabilities that more closely represent their tax character, certain adjustments have been made to total distributable earnings (loss) andpaid-in capital in excess of par. For the year ended October 31, 2019, the adjustments were to decrease total distributable earnings and increasepaid-in capital in excess of par by $10,544,466 primarily due to transactions relating to the redemptionin-kind and the merger. Net investment income, net realized gain (loss) on investments and foreign currency transations and net assets were not affected by this change.
For the year ended October 31, 2019, the tax character of dividends paid by the Fund were $9,764,220 of ordinary income and $38,796,903 of long-term capital gains. For the year ended October 31, 2018, the tax character of dividends paid by the Fund were $4,297,427 of ordinary income and $33,220,397 of long-term capital gains.
As of October 31, 2019, the accumulated undistributed earnings on a tax basis were $5,947,874 of ordinary income and $16,761,273 of long-term capital gains.
The United States federal income tax basis of the Fund’s investments and the net unrealized appreciation as of October 31, 2019 were as follows:
| | | | | | |
Tax Basis | | Gross Unrealized Appreciation | | Gross Unrealized Depreciation | | Net Unrealized Appreciation |
| $540,727,727 | | $82,868,112 | | $(14,018,032) | | $68,850,080 |
The difference between book basis and tax basis is primarily attributable to deferred losses on wash sales and other cost basis differences between financial and tax accounting.
The Manager has analyzed the Fund’s tax positions taken on federal, state and local income tax returns for all open tax years and has concluded that no provision for income tax is required in the Fund’s financial statements for the current reporting period. Since tax authorities can examine previously filed tax returns, the Fund’s U.S. federal and state tax returns for each of the four fiscal years up to the most recent fiscal year ended October 31, 2019 are subject to such review.
6. Capital and Ownership
The Fund offers Class A, Class B, Class C, Class Z and Class R6 shares. Class A shares are sold with a maximumfront-end sales charge of 5.50%. Investors who purchase $1 million
more of Class A shares and sell these shares within 12 months of purchase are subject to a contingent deferred sales charge (“CDSC”) of 1%, although they are not subject to an initial sales charge. The Class A CDSC is waived for certain retirement and/or benefit plans. A special exchange privilege is also available for shareholders who qualified to purchase Class A shares at net asset value. Class B shares are sold with a CDSC which declines from 5% to zero depending on the period of time the shares are held. Class B shares will automatically convert to Class A shares on a monthly basis approximately seven years after purchase. Class B shares are closed to new purchases. Class C shares are sold with a CDSC of 1% on sales made within 12 months of purchase. Class C shares will automatically convert to Class A shares on a monthly basis approximately 10 years after purchase. Class Z and Class R6 shares are not subject to any sales or redemption charge and are available exclusively for sale to a limited group of investors.
Under certain circumstances, an exchange may be made from specified share classes of the Fund to one or more other share classes of the Fund as presented in the table of transactions in shares of beneficial interest.
The Trust has authorized an unlimited number of shares of beneficial interest of the Fund at $0.001 par value per share, divided into five classes, designated Class A, Class B, Class C, Class Z and Class R6.
As of October 31, 2019, Prudential, through its affiliated entities, including affiliated funds (if applicable), owned 629 Class A shares and 5,700,728 Class R6 shares of the Fund. At reporting period end, three shareholders of record, each holding greater than 5% of the Fund, held 34% of the Fund’s outstanding shares, of which 7% were held by an affiliate of Prudential.
Transactions in shares of beneficial interest were as follows:
| | | | | | | | |
Class A | | Shares | | | Amount | |
Year ended October 31, 2019: | | | | | | | | |
Shares sold | | | 761,029 | | | $ | 10,817,244 | |
Shares issued in reinvestment of dividends and distributions | | | 1,358,711 | | | | 18,098,031 | |
Shares issued in mergers | | | 18,170,342 | | | | 246,957,022 | |
Shares reacquired | | | (3,043,542 | ) | | | (43,453,974 | ) |
| | | | | | | | |
Net increase (decrease) in shares outstanding before conversion | | | 17,246,540 | | | | 232,418,323 | |
Shares issued upon conversion from other share class(es) | | | 2,977,009 | | | | 43,297,324 | |
Shares reacquired upon conversion into other share class(es) | | | (123,103 | ) | | | (1,774,004 | ) |
| | | | | | | | |
Net increase (decrease) in shares outstanding | | | 20,100,446 | | | $ | 273,941,643 | |
| | | | | | | | |
Year ended October 31, 2018: | | | | | | | | |
Shares sold | | | 342,696 | | | $ | 5,962,112 | |
Shares issued in reinvestment of dividends and distributions | | | 935,749 | | | | 15,430,504 | |
Shares reacquired | | | (1,182,113 | ) | | | (20,369,261 | ) |
| | | | | | | | |
Net increase (decrease) in shares outstanding before conversion | | | 96,332 | | | | 1,023,355 | |
Shares issued upon conversion from other share class(es) | | | 80,033 | | | | 1,418,612 | |
Shares reacquired upon conversion into other share class(es) | | | (32,240 | ) | | | (556,387 | ) |
| | | | | | | | |
Net increase (decrease) in shares outstanding | | | 144,125 | | | $ | 1,885,580 | |
| | | | | | | | |
| | | | |
| PGIM QMA Large-Cap Core Equity Fund | | | 45 | |
Notes to Financial Statements(continued)
| | | | | | | | |
Class B | | Shares | | | Amount | |
Year ended October 31, 2019: | | | | | | | | |
Shares sold | | | 5,899 | | | $ | 74,605 | |
Shares issued in reinvestment of dividends and distributions | | | 25,098 | | | | 298,161 | |
Shares issued in mergers | | | 601,023 | | | | 7,463,434 | |
Shares reacquired | | | (77,046 | ) | | | (969,073 | ) |
| | | | | | | | |
Net increase (decrease) in shares outstanding before conversion | | | 554,974 | | | | 6,867,127 | |
Shares reacquired upon conversion into other share class(es) | | | (92,338 | ) | | | (1,183,107 | ) |
| | | | | | | | |
Net increase (decrease) in shares outstanding | | | 462,636 | | | $ | 5,684,020 | |
| | | | | | | | |
Year ended October 31, 2018: | | | | | | | | |
Shares sold | | | 9,464 | | | $ | 154,199 | |
Shares issued in reinvestment of dividends and distributions | | | 19,561 | | | | 294,007 | |
Shares reacquired | | | (14,671 | ) | | | (228,377 | ) |
| | | | | | | | |
Net increase (decrease) in shares outstanding before conversion | | | 14,354 | | | | 219,829 | |
Shares reacquired upon conversion into other share class(es) | | | (41,880 | ) | | | (688,725 | ) |
| | | | | | | | |
Net increase (decrease) in shares outstanding | | | (27,526 | ) | | $ | (468,896 | ) |
| | | | | | | | |
Class C | | | | | | |
Year ended October 31, 2019: | | | | | | | | |
Shares sold | | | 429,007 | | | $ | 4,934,902 | |
Shares issued in reinvestment of dividends and distributions | | | 453,060 | | | | 5,391,413 | |
Shares issued in mergers | | | 3,343,920 | | | | 40,253,040 | |
Shares reacquired | | | (858,841 | ) | | | (10,641,489 | ) |
| | | | | | | | |
Net increase (decrease) in shares outstanding before conversion | | | 3,367,146 | | | | 39,937,866 | |
Shares reacquired upon conversion into other share class(es) | | | (3,304,919 | ) | | | (42,825,682 | ) |
| | | | | | | | |
Net increase (decrease) in shares outstanding | | | 62,227 | | | $ | (2,887,816 | ) |
| | | | | | | | |
Year ended October 31, 2018: | | | | | | | | |
Shares sold | | | 175,337 | | | $ | 2,730,103 | |
Shares issued in reinvestment of dividends and distributions | | | 289,701 | | | | 4,359,999 | |
Shares reacquired | | | (300,244 | ) | | | (4,757,478 | ) |
| | | | | | | | |
Net increase (decrease) in shares outstanding before conversion | | | 164,794 | | | | 2,332,624 | |
Shares reacquired upon conversion into other share class(es) | | | (62,370 | ) | | | (997,024 | ) |
| | | | | | | | |
Net increase (decrease) in shares outstanding | | | 102,424 | | | $ | 1,335,600 | |
| | | | | | | | |
| | | | | | | | |
Class Z | | Shares | | | Amount | |
Year ended October 31, 2019: | | | | | | | | |
Shares sold | | | 908,083 | | | $ | 12,719,109 | |
Shares issued in reinvestment of dividends and distributions | | | 770,451 | | | | 10,562,877 | |
Shares issued in mergers | | | 539,047 | | | | 7,514,605 | |
Shares reacquired | | | (1,681,624 | ) | | | (24,493,319 | ) |
| | | | | | | | |
Net increase (decrease) in shares outstanding before conversion | | | 535,957 | | | | 6,303,272 | |
Shares issued upon conversion from other share class(es) | | | 166,429 | | | | 2,450,314 | |
Shares reacquired upon conversion into other share class(es) | | | (3,376 | ) | | | (56,957 | ) |
| | | | | | | | |
Net increase (decrease) in shares outstanding | | | 699,010 | | | $ | 8,696,629 | |
| | | | | | | | |
Year ended October 31, 2018: | | | | | | | | |
Shares sold | | | 936,671 | | | $ | 16,621,264 | |
Shares issued in reinvestment of dividends and distributions | | | 469,942 | | | | 7,932,616 | |
Shares reacquired | | | (840,971 | ) | | | (14,918,448 | ) |
| | | | | | | | |
Net increase (decrease) in shares outstanding before conversion | | | 565,642 | | | | 9,635,432 | |
Shares issued upon conversion from other share class(es) | | | 80,826 | | | | 1,445,454 | |
Shares reacquired upon conversion into other share class(es) | | | (35,726 | ) | | | (638,785 | ) |
| | | | | | | | |
Net increase (decrease) in shares outstanding | | | 610,742 | | | $ | 10,442,101 | |
| | | | | | | | |
Class R6 | | | | | | |
Year ended October 31, 2019: | | | | | | | | |
Shares sold | | | 3,400,731 | | | $ | 49,046,900 | |
Shares issued in reinvestment of dividends and distributions | | | 985,980 | | | | 13,527,645 | |
Shares issued in mergers | | | 49,044 | | | | 713,275 | |
Shares reacquired | | | (3,097,223 | ) | | | (45,884,845 | ) |
| | | | | | | | |
Net increase (decrease) in shares outstanding before conversion | | | 1,338,532 | | | | 17,402,975 | |
Shares issued upon conversion from other share class(es) | | | 6,026 | | | | 92,112 | |
| | | | | | | | |
Net increase (decrease) in shares outstanding | | | 1,344,558 | | | $ | 17,495,087 | |
| | | | | | | | |
Year ended October 31, 2018: | | | | | | | | |
Shares sold | | | 2,515,007 | | | $ | 44,395,114 | |
Shares issued in reinvestment of dividends and distributions | | | 513,613 | | | | 8,674,924 | |
Shares reacquired | | | (1,686,475 | ) | | | (30,255,747 | ) |
| | | | | | | | |
Net increase (decrease) in shares outstanding before conversion | | | 1,342,145 | | | | 22,814,291 | |
Shares issued upon conversion from other share class(es) | | | 945 | | | | 16,855 | |
| | | | | | | | |
Net increase (decrease) in shares outstanding | | | 1,343,090 | | | $ | 22,831,146 | |
| | | | | | | | |
7. Borrowings
The Trust, on behalf of the Fund, along with other affiliated registered investment companies (the “Funds”), is a party to a Syndicated Credit Agreement (“SCA”) with a group of banks. The purpose of the SCA is to provide an alternative source of temporary funding for capital share redemptions. The table below provides details of the current SCA in effect at the reportingperiod-end as well as the prior SCA.
| | | | |
| | | Current SCA | | Prior SCA |
Term of Commitment | | 10/3/2019 – 10/1/2020 | | 10/4/2018 – 10/2/2019 |
Total Commitment | | $ 900 million | | $ 900 million |
Annualized Commitment Fee on the Unused Portion of the SCA | | 0.15% | | 0.15% |
| | | | |
| PGIM QMA Large-Cap Core Equity Fund | | | 47 | |
Notes to Financial Statements(continued)
| | | | |
| | | Current SCA | | Prior SCA |
Annualized Interest Rate on Borrowings | | 1.20% plus the higher of (1) the effective federal funds rate, (2) theone-month LIBOR rate or (3) zero percent | | 1.25% plus the higher of (1) the effective federal funds rate, (2) theone-month LIBOR rate or (3) zero percent |
Certain affiliated registered investment companies that are parties to the SCA include portfolios that are subject to a predetermined mathematical formula used to manage certain benefit guarantees offered under variable annuity contracts. The formula may result in large scale asset flows into and out of these portfolios. Consequently, these portfolios may be more likely to utilize the SCA for purposes of funding redemptions. It may be possible for those portfolios to fully exhaust the committed amount of the SCA, thereby requiring the Manager to allocate available funding per a Board-approved methodology designed to treat the Funds in the SCA equitably.
The Fund utilized the SCA during the year ended October 31, 2019. The average daily balance for the 1 day that the Fund had loans outstanding during the period was approximately $307,000, borrowed at a weighted average interest rate of 3.67%. The maximum loan outstanding amount during the period was $307,000. At October 31, 2019, the Fund did not have an outstanding loan amount.
8. RedemptionIn-kind
On June 11, 2019, the Fund settled the redemption of certain fund shares by delivering to an affiliate certain portfolio securities in lieu of cash. The value of such securities was $19,857,462.In-kind redemption gains and losses are excluded from the calculation of the Fund’s taxable gain (loss) for federal income tax purposes.
9. Risks of Investing in the Fund
The Fund’s risks include, but are not limited to, some or all of the risks discussed below:
Derivatives Risk:Derivatives involve special risks and costs and may result in losses to the Fund. The successful use of derivatives requires sophisticated management, and, to the extent that derivatives are used, the Fund will depend on the subadviser’s ability to analyze and manage derivative transactions. The prices of derivatives may move in unexpected ways, especially in abnormal market conditions. Some derivatives are “leveraged” and therefore may magnify or otherwise increase investment losses to the Fund. Other risks arise from the potential inability to terminate or sell derivatives positions. A liquid secondary market may not always exist for the Fund’s derivatives positions. In fact, many OTC
derivative instruments will not have liquidity beyond the counterparty to the instrument. OTC derivative instruments also involve the risk that the other party will not meet its obligations to the Fund.
Equity and Equity-Related Securities Risks:The value of a particular security could go down and you could lose money. In addition to an individual security losing value, the value of the equity markets or a sector in which the Fund invests could go down. The Fund’s holdings can vary significantly from broad market indexes and the performance of the Fund can deviate from the performance of these indexes. Different parts of a market can react differently to adverse issuer, market, regulatory, political and economic developments.
Market and Credit Risk:Securities markets may be volatile and the market prices of the Fund’s securities may decline. Securities fluctuate in price based on changes in an issuer’s financial condition and overall market and economic conditions. If the market prices of the securities owned by the Fund fall, the value of an investment in the Fund will decline. Additionally, the Fund may also be exposed to credit risk in the event that an issuer or guarantor fails to perform or that an institution or entity with which the Fund has unsettled or open transactions defaults.
10. Reorganization
On June 19, 2018, the Board approved an Agreement and Plan of Reorganization (the “Plan”) which provided for the transfer of all the assets of PGIM QMA Defensive Equity Fund (the “Merged Fund”) for shares of PGIM QMALarge-Cap Core Equity Fund (the “Acquiring Fund”) and the assumption of the liabilities of the Merged Fund respectively. Shareholders approved the Plan at a meeting on November 16, 2018 and the reorganization took place on December 14, 2018. Upon implementation of the reorganization, PGIM Investments contractually agreed through February 29, 2020, to limit total annual operating expenses to 1.58% of average daily net assets for Class B shares of the proforma combined Fund.
On the reorganization date, the Merged Fund had the following total investment cost and value, representing the principal assets acquired by the Acquiring Fund:
| | | | | | | | |
Merged Fund | | Total Investment Value | | | Total Investment Cost | |
PGIM QMA Defensive Equity Fund | | $ | 196,953,251 | | | $ | 176,956,177 | |
The purpose of the transaction was to combine two funds with substantially similar investment objectives and policies.
| | | | |
| PGIM QMA Large-Cap Core Equity Fund | | | 49 | |
Notes to Financial Statements(continued)
The acquisition was accomplished by atax-free exchange of the following shares on December 14, 2018:
| | | | | | | | | | | | | | | | |
| Merged Fund | | | Acquiring Fund | |
PGIM QMA Defensive
Equity Fund | | | PGIM QMALarge-Cap
Core Equity Fund | |
Class | | Shares** | | | Class | | | Shares | | | Value | |
| A | | | 14,239,586 | | | | A | | | | 12,355,677 | | | $ | 161,365,147 | |
| B | | | 287,090 | | | | B | | | | 278,280 | | | | 3,241,959 | |
| C | | | 2,567,622 | | | | C | | | | 2,484,134 | | | | 28,989,842 | |
| R* | | | 382 | | | | | | | | | | | | | |
| R6 | | | 21,770 | | | | R6 | | | | 18,392 | | | | 247,369 | |
| Z | | | 453,555 | | | | Z | | | | 383,078 | | | | 5,148,558 | |
| * | Class R shares were converted to Class A shares in the reorganization. |
| ** | Balances updated due to capital stock activity that occured on the merger date. |
For financial reporting purposes, assets received and shares issued by the Acquiring Fund were recorded at fair value; however, the cost basis of the investments received from the Merged Fund were carried forward to reflect thetax-free status of the acquisition.
The net assets and net unrealized appreciation immediately before the acquisition were as follows:
| | | | | | | | | | | | | | | | |
| Merged Fund | | | | | | Acquiring Fund | |
PGIM QMA Defensive
Equity Fund | | | | | | PGIM QMALarge-Cap
Core Equity Fund | |
Class | | Net assets** | | | Unrealized Appreciation
on Investments | | | Class | | | Net assets | |
| A | | $ | 161,360,761 | | | $ | 16,169,416 | | | | A | | | $ | 97,991,911 | |
| B | | | 3,241,959 | | | | 371,064 | | | | B | | | | 1,525,457 | |
| C | | | 28,989,842 | | | | 2,914,185 | | | | C | | | | 27,863,342 | |
| R | | | 4,386 | | | | 441 | | | | | | | | | |
| R6 | | | 247,369 | | | | 24,845 | | | | R6 | | | | 73,674,073 | |
| Z | | | 5,148,558 | | | | 517,123 | | | | Z | | | | 57,822,232 | |
| ** | Balances updated due to capital stock activity that occured on the merger date. |
On December 6, 2018, the Board approved an Agreement and Plan of Reorganization (the “Plan”) which provided for the transfer of all the assets of PGIM Growth Allocation Fund (the “Merged Fund”) for shares of PGIM QMALarge-Cap Core Equity Fund (the “Acquiring Fund”) and the assumption of the liabilities of the Merged Fund respectively. Shareholders approved the Plan at a meeting on May 7, 2019 and the reorganization took place on June 21, 2019.
On the reorganization date, the Merged Fund had the following total investment cost and value, representing the principal assets acquired by the Acquiring Fund:
| | | | | | | | |
Merged Fund | | Total Investment Value | | | Total Investment Cost | |
PGIM Growth Allocation Fund | | $ | 103,285,240 | | | $ | 101,038,779 | |
The purpose of the transaction was to combine two funds with substantially similar investment objectives and policies.
The acquisition was accomplished by atax-free exchange of the following shares on June 21, 2019:
| | | | | | | | | | | | | | | | |
| Merged Fund | | | Acquiring Fund | |
PGIM Growth
Allocation Fund | | | PGIM QMALarge-Cap
Core Equity Fund | |
Class | | Shares | | | Class | | | Shares | | | Value | |
| A | | | 6,542,127 | | | | A | | | | 5,814,665 | | | $ | 85,591,875 | |
| B | | | 347,206 | | | | B | | | | 322,743 | | | | 4,221,475 | |
| C | | | 924,805 | | | | C | | | | 859,786 | | | | 11,263,198 | |
| R* | | | 3,448 | | | | | | | | | | | | | |
| R6 | | | 34,903 | | | | R6 | | | | 30,652 | | | | 465,906 | |
| Z | | | 177,146 | | | | Z | | | | 155,969 | | | | 2,366,047 | |
| * | Class R shares were converted to Class A shares in the reorganization. |
For financial reporting purposes, assets received and shares issued by the Acquiring Fund were recorded at fair value; however, the cost basis of the investments received from the Merged Fund were carried forward to reflect thetax-free status of the acquisition.
The net assets and net unrealized appreciation immediately before the acquisition were as follows:
| | | | | | | | | | | | | | | | |
| Merged Fund | | | | | | Acquiring Fund | |
PGIM Growth
Allocation Fund | | | | | | PGIM QMALarge-Cap
Core Equity Fund | |
Class | | Net assets | | | Unrealized Appreciation
on Investments | | | Class | | | Net assets | |
| A | | $ | 85,547,474 | | | $ | 1,849,179 | | | | A | | | $ | 318,962,457 | |
| B | | | 4,221,475 | | | | 91,196 | | | | B | | | | 4,297,642 | |
| C | | | 11,263,198 | | | | 243,949 | | | | C | | | | 19,072,550 | |
| R | | | 44,401 | | | | 959 | | | | | | | | | |
| R6 | | | 465,906 | | | | 10,065 | | | | R6 | | | | 81,276,224 | |
| Z | | | 2,366,047 | | | | 51,113 | | | | Z | | | | 64,334,299 | |
| | | | |
| PGIM QMA Large-Cap Core Equity Fund | | | 51 | |
Notes to Financial Statements(continued)
Assuming the acquisition had been completed on November 1, 2018, the Acquiring Fund’s unaudited pro forma results of operations for the year ended October 31, 2019 would have been as follows:
| | | | | | | | | | | | |
Acquiring Fund | | Net
Investment
income(a) | | | Net realized
and unrealized
gain/loss on
investments(b) | | | Net increase
in net assets
resulting from
operations | |
PGIM QMALarge-Cap Core Equity Fund | | $ | 8,267,062 | | | $ | 46,438,251 | | | $ | 54,705,313 | |
| (a) | Net investment income as reported in the Statement of Operations (year ended October 31, 2019) of the Acquiring Fund, plus net investment income from the Merged Fundspre-merger as follows: PGIM QMA Defensive Equity Fund $511,886 and PGIM Growth Allocation Fund $1,132,504. |
| (b) | Net realized and unrealized gain/loss on investments as reported in the Statement of Operations (year ended October 31, 2019) of the Acquiring Fund, plus net realized and unrealized gain (loss) on investments from the Merged Fundspre-merger as follows: PGIM QMA Defensive Equity Fund $(8,084,016) and PGIM Growth Allocation $(2,201,776). |
Since both the Merged Funds and the Acquiring Fund sold and redeemed shares throughout the period, it is not practicable to providepro-forma information on aper-share basis.
Since the combined investment Funds had been managed as a single integrated portfolio since the acquisition was completed, it is also not practicable to separate the amounts of revenue and earnings of the Merged Funds that have been included in the Acquiring Fund’s Statement of Operations since December 14, 2018 and June 21, 2019.
11. Recent Accounting Pronouncements and Reporting Updates
In August 2018, the FASB issued Accounting Standards Update (“ASU”)No. 2018-13, which changes certain fair value measurement disclosure requirements. The new ASU, in addition to other modifications and additions, removes the requirement to disclose the amount and reasons for transfers between Level 1 and Level 2 of the fair value hierarchy, and the Fund’s policy for the timing of transfers between levels. The amendments are effective for financial statements issued for fiscal years beginning after December 15, 2019, and interim periods within those fiscal years. The Manager has evaluated the implications of certain provisions of the ASU and has determined to early adopt aspects related to the removal and modification of certain fair value measurement disclosures under the ASU effective immediately. The Manager continues to evaluate certain other provisions of the ASU and does not expect a material impact to financial statement disclosures.
Financial Highlights
| | | | | | | | | | | | | | | | | | | | |
| Class A Shares | | | | | | | | | | | | | | | |
| | | Year Ended October 31, | |
| | | 2019 | | | 2018 | | | 2017 | | | 2016 | | | 2015 | |
| Per Share Operating Performance(a): | | | | | | | | | | | | | | | | | | | | |
| Net Asset Value, Beginning of Year | | | $16.76 | | | | $18.37 | | | | $15.49 | | | | $15.92 | | | | $16.55 | |
| Income (loss) from investment operations: | | | | | | | | | | | | | | | | | | | | |
| Net investment income (loss) | | | 0.18 | | | | 0.20 | | | | 0.19 | | | | 0.14 | | | | 0.14 | |
| Net realized and unrealized gain (loss) on investment transactions | | | 1.19 | | | | 0.80 | | | | 3.51 | | | | 0.29 | | | | 0.55 | |
| Total from investment operations | | | 1.37 | | | | 1.00 | | | | 3.70 | | | | 0.43 | | | | 0.69 | |
| Less Dividends and Distributions: | | | | | | | | | | | | | | | | | | | | |
| Dividends from net investment income | | | (0.22 | ) | | | (0.18 | ) | | | (0.15 | ) | | | (0.14 | ) | | | (0.11 | ) |
| Distributions from net realized gains | | | (2.74 | ) | | | (2.43 | ) | | | (0.67 | ) | | | (0.72 | ) | | | (1.21 | ) |
| Total dividends and distributions | | | (2.96 | ) | | | (2.61 | ) | | | (0.82 | ) | | | (0.86 | ) | | | (1.32 | ) |
| Net asset value, end of year | | | $15.17 | | | | $16.76 | | | | $18.37 | | | | $15.49 | | | | $15.92 | |
| Total Return(b): | | | 10.61% | | | | 5.67% | | | | 24.73% | | | | 3.02% | | | | 4.20% | |
| |
| Ratios/Supplemental Data: | |
| Net assets, end of year (000) | | | $400,634 | | | | $105,855 | | | | $113,343 | | | | $89,169 | | | | $88,920 | |
| Average net assets (000) | | | $302,864 | | | | $112,391 | | | | $101,852 | | | | $88,443 | | | | $90,171 | |
| Ratios to average net assets(c)(d): | | | | | | | | | | | | | | | | | | | | |
| Expenses after waivers and/or expense reimbursement | | | 0.74% | | | | 0.72% | | | | 0.77% | | | | 1.17% | | | | 1.14% | |
| Expenses before waivers and/or expense reimbursement | | | 0.87% | | | | 0.86% | | | | 0.93% | | | | 1.22% | | | | 1.19% | |
| Net investment income (loss) | | | 1.27% | | | | 1.14% | | | | 1.13% | | | | 0.91% | | | | 0.89% | |
| Portfolio turnover rate(e)(f) | | | 88% | | | | 95% | | | | 89% | | | | 89% | | | | 112% | |
| (a) | Calculated based on average shares outstanding during the year. |
| (b) | Total return does not consider the effects of sales loads. Total return is calculated assuming a purchase of a share on the first day and a sale on the last day of each year reported and includes reinvestment of dividends and distributions, if any. Total returns may reflect adjustments to conform to generally accepted accounting principles. |
| (c) | Does not include expenses of the underlying funds in which the Fund invests. |
| (d) | Effective November 1, 2017, class specific expenses include transfer agent fees and expenses and registration fees, which are charged to their respective share class. |
| (e) | The Fund’s portfolio turnover rate is calculated in accordance with regulatory requirements, without regard to transactions involving short-term investments and certain derivatives. If such transactions were included, the Fund’s portfolio turnover rate may be higher. |
| (f) | Portfolio turnover excludes the value of portfolio securities received or delivered as a result ofin-kind fund share transactions (if any). |
See Notes to Financial Statements.
| | | | |
| PGIM QMA Large-Cap Core Equity Fund | | | 53 | |
Financial Highlights(continued)
| | | | | | | | | | | | | | | | | | | | |
| Class B Shares | | | | | | | | | | | | | | | |
| | | Year Ended October 31, | |
| | | 2019 | | | 2018 | | | 2017 | | | 2016 | | | 2015 | |
| Per Share Operating Performance(a): | | | | | | | | | | | | | | | | | | | | |
| Net Asset Value, Beginning of Year | | | $15.15 | | | | $16.87 | | | | $14.30 | | | | $14.75 | | | | $15.43 | |
| Income (loss) from investment operations: | | | | | | | | | | | | | | | | | | | | |
| Net investment income (loss) | | | 0.05 | | | | 0.03 | | | | 0.06 | | | | 0.03 | | | | 0.02 | |
| Net realized and unrealized gain (loss) on investment transactions | | | 1.05 | | | | 0.74 | | | | 3.23 | | | | 0.27 | | | | 0.51 | |
| Total from investment operations | | | 1.10 | | | | 0.77 | | | | 3.29 | | | | 0.30 | | | | 0.53 | |
| Less Dividends and Distributions: | | | | | | | | | | | | | | | | | | | | |
| Dividends from net investment income | | | (0.08 | ) | | | (0.06 | ) | | | (0.05 | ) | | | (0.03 | ) | | | - | (b) |
| Distributions from net realized gains | | | (2.74 | ) | | | (2.43 | ) | | | (0.67 | ) | | | (0.72 | ) | | | (1.21 | ) |
| Total dividends and distributions | | | (2.82 | ) | | | (2.49 | ) | | | (0.72 | ) | | | (0.75 | ) | | | (1.21 | ) |
| Net asset value, end of year | | | $13.43 | | | | $15.15 | | | | $16.87 | | | | $14.30 | | | | $14.75 | |
| Total Return(c): | | | 9.65% | | | | 4.67% | | | | 23.75% | | | | 2.31% | | | | 3.42% | |
| |
| Ratios/Supplemental Data: | |
| Net assets, end of year (000) | | | $7,668 | | | | $1,641 | | | | $2,291 | | | | $2,132 | | | | $2,676 | |
| Average net assets (000) | | | $5,430 | | | | $1,953 | | | | $2,311 | | | | $2,348 | | | | $3,018 | |
| Ratios to average net assets(d)(e): | | | | | | | | | | | | | | | | | | | | |
| Expenses after waivers and/or expense reimbursement | | | 1.59% | | | | 1.67% | | | | 1.52% | | | | 1.92% | | | | 1.89% | |
| Expenses before waivers and/or expense reimbursement | | | 2.24% | | | | 2.45% | | | | 1.63% | | | | 1.92% | | | | 1.89% | |
| Net investment income (loss) | | | 0.40% | | | | 0.20% | | | | 0.40% | | | | 0.19% | | | | 0.15% | |
| Portfolio turnover rate(f)(g) | | | 88% | | | | 95% | | | | 89% | | | | 89% | | | | 112% | |
| (a) | Calculated based on average shares outstanding during the year. |
| (b) | Less than $0.005 per share. |
| (c) | Total return does not consider the effects of sales loads. Total return is calculated assuming a purchase of a share on the first day and a sale on the last day of each year reported and includes reinvestment of dividends and distributions, if any. Total returns may reflect adjustments to conform to generally accepted accounting principles. |
| (d) | Does not include expenses of the underlying funds in which the Fund invests. |
| (e) | Effective November 1, 2017, class specific expenses include transfer agent fees and expenses and registration fees, which are charged to their respective share class. |
| (f) | The Fund’s portfolio turnover rate is calculated in accordance with regulatory requirements, without regard to transactions involving short-term investments and certain derivatives. If such transactions were included, the Fund’s portfolio turnover rate may be higher. |
| (g) | Portfolio turnover excludes the value of portfolio securities received or delivered as a result ofin-kind fund share transactions (if any). |
See Notes to Financial Statements.
| | | | | | | | | | | | | | | | | | | | |
| Class C Shares | | | | | | | | | | | | | | | |
| | | Year Ended October 31, | |
| | | 2019 | | | 2018 | | | 2017 | | | 2016 | | | 2015 | |
| Per Share Operating Performance(a): | | | | | | | | | | | | | | | | | | | | |
| Net Asset Value, Beginning of Year | | | $15.20 | | | | $16.89 | | | | $14.31 | | | | $14.77 | | | | $15.45 | |
| Income (loss) from investment operations: | | | | | | | | | | | | | | | | | | | | |
| Net investment income (loss) | | | 0.08 | | | | 0.07 | | | | 0.06 | | | | 0.02 | | | | 0.02 | |
| Net realized and unrealized gain (loss) on investment transactions | | | 1.03 | | | | 0.73 | | | | 3.24 | | | | 0.27 | | | | 0.51 | |
| Total from investment operations | | | 1.11 | | | | 0.80 | | | | 3.30 | | | | 0.29 | | | | 0.53 | |
| Less Dividends and Distributions: | | | | | | | | | | | | | | | | | | | | |
| Dividends from net investment income | | | (0.11 | ) | | | (0.06 | ) | | | (0.05 | ) | | | (0.03 | ) | | | - | (b) |
| Distributions from net realized gains | | | (2.74 | ) | | | (2.43 | ) | | | (0.67 | ) | | | (0.72 | ) | | | (1.21 | ) |
| Total dividends and distributions | | | (2.85 | ) | | | (2.49 | ) | | | (0.72 | ) | | | (0.75 | ) | | | (1.21 | ) |
| Net asset value, end of year | | | $13.46 | | | | $15.20 | | | | $16.89 | | | | $14.31 | | | | $14.77 | |
| Total Return(c): | | | 9.77% | | | | 4.91% | | | | 23.80% | | | | 2.24% | | | | 3.42% | |
| |
| Ratios/Supplemental Data: | |
| Net assets, end of year (000) | | | $27,333 | | | | $29,930 | | | | $31,518 | | | | $39,218 | | | | $38,919 | |
| Average net assets (000) | | | $36,812 | | | | $31,783 | | | | $34,697 | | | | $38,344 | | | | $38,738 | |
| Ratios to average net assets(d)(e): | | | | | | | | | | | | | | | | | | | | |
| Expenses after waivers and/or expense reimbursement | | | 1.47% | | | | 1.44% | | | | 1.53% | | | | 1.92% | | | | 1.89% | |
| Expenses before waivers and/or expense reimbursement | | | 1.54% | | | | 1.55% | | | | 1.64% | | | | 1.92% | | | | 1.89% | |
| Net investment income (loss) | | | 0.59% | | | | 0.43% | | | | 0.40% | | | | 0.16% | | | | 0.14% | |
| Portfolio turnover rate(f)(g) | | | 88% | | | | 95% | | | | 89% | | | | 89% | | | | 112% | |
| (a) | Calculated based on average shares outstanding during the year. |
| (b) | Less than $0.005 per share. |
| (c) | Total return does not consider the effects of sales loads. Total return is calculated assuming a purchase of a share on the first day and a sale on the last day of each year reported and includes reinvestment of dividends and distributions, if any. Total returns may reflect adjustments to conform to generally accepted accounting principles. |
| (d) | Does not include expenses of the underlying funds in which the Fund invests. |
| (e) | Effective November 1, 2017, class specific expenses include transfer agent fees and expenses and registration fees, which are charged to their respective share class. |
| (f) | The Fund’s portfolio turnover rate is calculated in accordance with regulatory requirements, without regard to transactions involving short-term investments and certain derivatives. If such transactions were included, the Fund’s portfolio turnover rate may be higher. |
| (g) | Portfolio turnover excludes the value of portfolio securities received or delivered as a result ofin-kind fund share transactions (if any). |
See Notes to Financial Statements.
| | | | |
| PGIM QMA Large-Cap Core Equity Fund | | | 55 | |
Financial Highlights(continued)
| | | | | | | | | | | | | | | | | | | | |
| Class Z Shares | | | | | | | | | | | | | | | |
| | | Year Ended October 31, | |
| | | 2019 | | | 2018 | | | 2017 | | | 2016 | | | 2015 | |
| Per Share Operating Performance(a): | | | | | | | | | | | | | | | | | | | | |
| Net Asset Value, Beginning of Year | | | $17.20 | | | | $18.78 | | | | $15.83 | | | | $16.24 | | | | $16.86 | |
| Income (loss) from investment operations: | | | | | | | | | | | | | | | | | | | | |
| Net investment income (loss) | | | 0.24 | | | | 0.25 | | | | 0.24 | | | | 0.18 | | | | 0.18 | |
| Net realized and unrealized gain (loss) on investment transactions | | | 1.21 | | | | 0.82 | | | | 3.57 | | | | 0.31 | | | | 0.55 | |
| Total from investment operations | | | 1.45 | | | | 1.07 | | | | 3.81 | | | | 0.49 | | | | 0.73 | |
| Less Dividends and Distributions: | | | | | | | | | | | | | | | | | | | | |
| Dividends from net investment income | | | (0.26 | ) | | | (0.22 | ) | | | (0.19 | ) | | | (0.18 | ) | | | (0.14 | ) |
| Distributions from net realized gains | | | (2.74 | ) | | | (2.43 | ) | | | (0.67 | ) | | | (0.72 | ) | | | (1.21 | ) |
| Total dividends and distributions | | | (3.00 | ) | | | (2.65 | ) | | | (0.86 | ) | | | (0.90 | ) | | | (1.35 | ) |
| Net asset value, end of year | | | $15.65 | | | | $17.20 | | | | $18.78 | | | | $15.83 | | | | $16.24 | |
| Total Return(b): | | | 10.91% | | | | 5.98% | | | | 24.93% | | | | 3.35% | | | | 4.41% | |
| |
| Ratios/Supplemental Data: | |
| Net assets, end of year (000) | | | $67,192 | | | | $61,857 | | | | $56,066 | | | | $71,506 | | | | $80,096 | |
| Average net assets (000) | | | $65,923 | | | | $62,456 | | | | $54,787 | | | | $75,803 | | | | $57,677 | |
| Ratios to average net assets(c)(d): | | | | | | | | | | | | | | | | | | | | |
| Expenses after waivers and/or expense reimbursement | | | 0.48% | | | | 0.46% | | | | 0.54% | | | | 0.92% | | | | 0.89% | |
| Expenses before waivers and/or expense reimbursement | | | 0.54% | | | | 0.55% | | | | 0.64% | | | | 0.92% | | | | 0.89% | |
| Net investment income (loss) | | | 1.59% | | | | 1.40% | | | | 1.42% | | | | 1.18% | | | | 1.12% | |
| Portfolio turnover rate(e)(f) | | | 88% | | | | 95% | | | | 89% | | | | 89% | | | | 112% | |
| (a) | Calculated based on average shares outstanding during the year. |
| (b) | Total return is calculated assuming a purchase of a share on the first day and a sale on the last day of each year reported and includes reinvestment of dividends and distributions, if any. Total returns may reflect adjustments to conform to generally accepted accounting principles. |
| (c) | Does not include expenses of the underlying funds in which the Fund invests. |
| (d) | Effective November 1, 2017, class specific expenses include transfer agent fees and expenses and registration fees, which are charged to their respective share class. |
| (e) | The Fund’s portfolio turnover rate is calculated in accordance with regulatory requirements, without regard to transactions involving short-term investments and certain derivatives. If such transactions were included, the Fund’s portfolio turnover rate may be higher. |
| (f) | Portfolio turnover excludes the value of portfolio securities received or delivered as a result ofin-kind fund share transactions (if any). |
See Notes to Financial Statements.
| | | | | | | | | | | | | | | | |
| Class R6 Shares | | | | | | | | | | | | |
| | | Year Ended October 31, | | | | | | December 28,
2016(a) through
October 31, | |
| | | 2019 | | | 2018 | | | | | | 2017 | |
| Per Share Operating Performance(b): | | | | | | | | | | | | | | | | |
| Net Asset Value, Beginning of Period | | | $17.23 | | | | $18.81 | | | | | | | | $16.06 | |
| Income (loss) from investment operations: | | | | | | | | | | | | | | | | |
| Net investment income (loss) | | | 0.26 | | | | 0.27 | | | | | | | | 0.21 | |
| Net realized and unrealized gain (loss) on investment transactions | | | 1.21 | | | | 0.82 | | | | | | | | 2.54 | |
| Total from investment operations | | | 1.47 | | | | 1.09 | | | | | | | | 2.75 | |
| Less Dividends and Distributions: | | | | | | | | | | | | | | | | |
| Dividends from net investment income | | | (0.28 | ) | | | (0.24 | ) | | | | | | | - | |
| Distributions from net realized gains | | | (2.74 | ) | | | (2.43 | ) | | | | | | | - | |
| Total dividends and distributions | | | (3.02 | ) | | | (2.67 | ) | | | | | | | - | |
| Net asset value, end of period | | | $15.68 | | | | $17.23 | | | | | | | | $18.81 | |
| Total Return(c): | | | 11.05% | | | | 6.10% | | | | | | | | 17.12% | |
| |
| Ratios/Supplemental Data: | |
| Net assets, end of period (000) | | | $90,722 | | | | $76,551 | | | | | | | | $58,304 | |
| Average net assets (000) | | | $86,249 | | | | $71,390 | | | | | | | | $40,448 | |
| Ratios to average net assets(d)(e): | | | | | | | | | | | | | | | | |
| Expenses after waivers and/or expense reimbursement | | | 0.35% | | | | 0.35% | | | | | | | | 0.35% | (f) |
| Expenses before waivers and/or expense reimbursement | | | 0.41% | | | | 0.44% | | | | | | | | 0.47% | (f) |
| Net investment income (loss) | | | 1.72% | | | | 1.51% | | | | | | | | 1.44% | (f) |
| Portfolio turnover rate(g)(h) | | | 88% | | | | 95% | | | | | | | | 89% | |
| (a) | Commencement of offering. |
| (b) | Calculated based on average shares outstanding during the period. |
| (c) | Total return is calculated assuming a purchase of a share on the first day and a sale on the last day of each period reported and includes reinvestment of dividends and distributions, if any. Total returns may reflect adjustments to conform to generally accepted accounting principles. Total returns for periods less than one full year are not annualized. |
| (d) | Does not include expenses of the underlying funds in which the Fund invests. |
| (e) | Effective November 1, 2017, class specific expenses include transfer agent fees and expenses and registration fees, which are charged to their respective share class. |
| (g) | The Fund’s portfolio turnover rate is calculated in accordance with regulatory requirements, without regard to transactions involving short-term investments and certain derivatives. If such transactions were included, the Fund’s portfolio turnover rate may be higher. |
| (h) | Portfolio turnover excludes the value of portfolio securities received or delivered as a result ofin-kind fund share transactions (if any). |
See Notes to Financial Statements.
| | | | |
| PGIM QMA Large-Cap Core Equity Fund | | | 57 | |
Report of Independent Registered Public Accounting Firm
To the Shareholders of PGIM QMA Large-Cap Core Equity Fund and Board of Trustees
Prudential Investment Portfolios 9:
Opinion on the Financial Statements
We have audited the accompanying statement of assets and liabilities of PGIM QMA Large-Cap Core Equity Fund, a series of Prudential Investment Portfolios 9, (the Fund), including the schedule of investments, as of October 31, 2019, the related statement of operations for the year then ended, the statements of changes in net assets for each of the years in the two-year period ended October 31, 2019, and the related notes (collectively, the financial statements) and the financial highlights for the years or period indicated therein. In our opinion, the financial statements and financial highlights present fairly, in all material respects, the financial position of the Fund as of October 31, 2019, the results of its operations for the year then ended, the changes in its net assets for each of the years in the two-year period ended October 31, 2019, and the financial highlights for the years or period indicated therein, in conformity with U.S. generally accepted accounting principles.
Basis for Opinion
These financial statements and financial highlights are the responsibility of the Fund’s management. Our responsibility is to express an opinion on these financial statements and financial highlights based on our audits. We are a public accounting firm registered with the Public Company Accounting Oversight Board (United States) (PCAOB) and are required to be independent with respect to the Fund in accordance with the U.S. federal securities laws and the applicable rules and regulations of the Securities and Exchange Commission and the PCAOB.
We conducted our audits in accordance with the standards of the PCAOB. Those standards require that we plan and perform the audit to obtain reasonable assurance about whether the financial statements and financial highlights are free of material misstatement, whether due to error or fraud. Our audits included performing procedures to assess the risks of material misstatement of the financial statements and financial highlights, whether due to error or fraud, and performing procedures that respond to those risks. Such procedures included examining, on a test basis, evidence regarding the amounts and disclosures in the financial statements and financial highlights. Such procedures also included confirmation of securities owned as of October 31, 2019, by correspondence with the custodian, transfer agent, and brokers, or by other appropriate auditing procedures when replies were not received. Our audits also included evaluating the accounting principles used and significant estimates made by management, as well as evaluating the overall presentation of the financial statements and financial highlights. We believe that our audits provide a reasonable basis for our opinion.

We have served as the auditor of one or more PGIM and/or Prudential Retail investment companies since 2003.
New York, New York
December 19, 2019
Federal Income Tax Information(unaudited)
We are advising you that during the fiscal year ended October 31, 2019, the Fund reports the maximum amount allowed per share but not less than $2.37 for Class A, B, C, Z and R6 shares as a capital gain distribution in accordance with Section 852(b)(3)(C) of the Internal Revenue Code.
For the year ended October 31, 2019, the Fund reports the maximum amount allowable under Section 854 of the Internal Revenue Code, but not less than, the following percentages of the ordinary income dividends paid as 1) qualified dividend income (QDI); and 2) eligible for corporate dividends received deduction (DRD):
| | | | | | | | |
| | | QDI | | | DRD | |
PGIM QMA Large-Cap Core Equity Fund | | | 56.66 | % | | | 54.45 | % |
In January 2020, you will be advised on IRS Form 1099-DIV or substitute 1099-DIV, as to the federal tax status of dividends and distributions received by you in calendar year 2019.
| | | | |
| PGIM QMA Large-Cap Core Equity Fund | | | 59 | |
INFORMATION ABOUT BOARD MEMBERS AND OFFICERS(unaudited)
Information about Board Members and Officers of the Fund is set forth below. Board Members who are not deemed to be “interested persons” of the Fund, as defined in the 1940 Act, are referred to as “Independent Board Members.” Board Members who are deemed to be “interested persons” of the Fund are referred to as “Interested Board Members.” The Board Members are responsible for the overall supervision of the operations of the Fund and perform the various duties imposed on the directors of investment companies by the 1940 Act. The Board in turn elects the Officers, who are responsible for administering theday-to-day operations of the Fund.
| | | | | | |
| Independent Board Members | | | | |
| | | | |
Name
Date of Birth
Position(s)
Portfolios Overseen | | Principal Occupation(s)
During Past Five Years | | Other Directorships
Held During
Past Five Years | | Length of
Board Service |
| | | | |
Ellen S. Alberding 3/11/58 Board Member Portfolios Overseen: 96 | | President and Board Member, The Joyce Foundation (charitable foundation) (since 2002); Vice Chair, City Colleges of Chicago (community college system) (2011-2015); Trustee, National Park Foundation (charitable foundation for national park system) (2009-2018); Trustee, Economic Club of Chicago (since 2009); Trustee, Loyola University (since 2018). | | None. | | Since September 2013 |
| | | | |
Kevin J. Bannon 7/13/52 Board Member Portfolios Overseen: 96 | | Retired; Managing Director (April2008-May 2015) and Chief Investment Officer (October 2008-November 2013) of Highmount Capital LLC (registered investment adviser); formerly Executive Vice President and Chief Investment Officer (April 1993-August 2007) of Bank of New York Company; President (May2003-May 2007) of BNY Hamilton Family of Mutual Funds. | | Director of Urstadt Biddle Properties (equity real estate investment trust) (since September 2008). | | Since July 2008 |
PGIM QMA Large-Cap Core Equity Fund
| | | | | | |
| Independent Board Members | | | | |
| | | | |
Name
Date of Birth
Position(s)
Portfolios Overseen | | Principal Occupation(s)
During Past Five Years | | Other Directorships
Held During
Past Five Years | | Length of
Board Service |
| | | | |
Linda W. Bynoe 7/9/52 Board Member Portfolios Overseen: 96 | | President and Chief Executive Officer (since March 1995) and formerly Chief Operating Officer (December 1989-February 1995) of Telemat Ltd. (management consulting); formerly Vice President (January 1985-June 1989) at Morgan Stanley & Co. (broker-dealer). | | Director of Anixter International, Inc. (communication products distributor) (since January 2006); Director of Northern Trust Corporation (financial services) (since April 2006); Trustee of Equity Residential (residential real estate) (since December 2009). | | Since March 2005 |
| | | | |
Barry H. Evans 11/2/60 Board Member Portfolios Overseen: 95 | | Retired; formerly President (2005 – 2016), Global Chief Operating Officer (2014– 2016), Chief Investment Officer – Global Head of Fixed Income (1998-2014), and various portfolio manager roles (1986-2006), Manulife Asset Management U.S. | | Formerly Director, Manulife Trust Company (2011-2018); formerly Director, Manulife Asset Management Limited (2015-2017); formerly Chairman of the Board of Directors of Manulife Asset Management U.S. (2005-2016); formerly Chairman of the Board, Declaration Investment Management and Research (2008-2016). | | Since September 2017 |
| | | | |
Keith F. Hartstein 10/13/56 Board Member & Independent Chair Portfolios Overseen: 96 | | Retired; Member (since November 2014) of the Governing Council of the Independent Directors Council (organization of independent mutual fund directors); formerly President and Chief Executive Officer (2005-2012), Senior Vice President (2004-2005), Senior Vice President of Sales and Marketing (1997-2004), and various executive management positions (1990-1997), John Hancock Funds, LLC (asset management); Chairman, Investment Company Institute’s Sales Force Marketing Committee (2003-2008). | | None. | | Since September 2013 |
Visit our website at pgiminvestments.com
| | | | | | |
| Independent Board Members | | | | |
| | | | |
Name
Date of Birth Position(s) Portfolios Overseen | | Principal Occupation(s)
During Past Five Years | | Other Directorships
Held During
Past Five Years | | Length of
Board Service |
| | | | |
Laurie Simon Hodrick 9/29/62 Board Member Portfolios Overseen: 95 | | A. Barton Hepburn Professor Emerita of Economics in the Faculty of Business, Columbia Business School (since 2018); Visiting Professor of Law, Stanford Law School (since 2015); Visiting Fellow at the Hoover Institution, Stanford University (since 2015); Sole Member, ReidCourt LLC (since 2008) (a consulting firm); formerly A. Barton Hepburn Professor of Economics in the Faculty of Business, Columbia Business School (1996-2017); formerly Managing Director, Global Head of Alternative Investment Strategies, Deutsche Bank (2006-2008). | | Independent Director, Synnex Corporation (since April 2019) (information technology); Independent Director, Kabbage, Inc. (since July 2018) (financial services); Independent Director, Corporate Capital Trust (2017-2018) (a business development company). | | Since September 2017 |
| | | | |
Michael S. Hyland, CFA 10/4/45 Board Member Portfolios Overseen: 96 | | Retired (since February 2005); formerly Senior Managing Director (July 2001-February 2005) of Bear Stearns & Co, Inc.; Global Partner, INVESCO (1999-2001); Managing Director and President of Salomon Brothers Asset Management (1989-1999). | | None. | | Since July 2008 |
| | | | |
Brian K. Reid 9/22/61 Board Member Portfolios Overseen: 95 | | Retired; formerly Chief Economist for the Investment Company Institute (ICI) (2005-2017); formerly Senior Economist and Director of Industry and Financial Analysis at the ICI (1998-2004); formerly Senior Economist, Industry and Financial Analysis at the ICI (1996-1998); formerly Staff Economist at the Federal Reserve Board (1989-1996); Director, ICI Mutual Insurance Company (2012-2017). | | None. | | Since March 2018 |
PGIM QMA Large-Cap Core Equity Fund
| | | | | | |
Independent Board Members | | | | |
| | | | |
Name
Date of Birth Position(s) Portfolios Overseen | | Principal Occupation(s)
During Past Five Years | | Other Directorships
Held During Past Five Years | | Length of Board Service |
| | | | |
Grace C. Torres 6/28/59 Board Member Portfolios Overseen: 95 | | Retired; formerly Treasurer and Principal Financial and Accounting Officer of the PGIM Funds, Target Funds, Advanced Series Trust, Prudential Variable Contract Accounts and The Prudential Series Fund (1998-June 2014); Assistant Treasurer (March 1999-June 2014) and Senior Vice President (September 1999-June 2014) of PGIM Investments LLC; Assistant Treasurer (May 2003-June 2014) and Vice President (June 2005-June 2014) of AST Investment Services, Inc.; Senior Vice President and Assistant Treasurer (May 2003-June 2014) of Prudential Annuities Advisory Services, Inc. | | Formerly Director (July 2015-January 2018) of Sun Bancorp, Inc. N.A. and Sun National Bank; Director (since January 2018) of OceanFirst Financial Corp. and OceanFirst Bank. | | Since November 2014 |
| | | | | | |
Interested Board Members | | | | |
| | | | |
Name
Date of Birth
Position(s) Portfolios Overseen | | Principal Occupation(s) During Past Five Years | | Other Directorships Held During Past Five Years | | Length of Board Service |
| | | | |
Stuart S. Parker 10/5/62 Board Member & President Portfolios Overseen: 96 | | President of PGIM Investments LLC (formerly known as Prudential Investments LLC) (since January 2012); Executive Vice President of Prudential Investment Management Services LLC (since December 2012); formerly Executive Vice President of Jennison Associates LLC and Head of Retail Distribution of PGIM Investments LLC (June 2005-December 2011). | | None. | | Since January 2012 |
Visit our website at pgiminvestments.com
| | | | | | |
Interested Board Members | | | | |
| | | | |
Name Date of Birth Position(s) Portfolios Overseen | | Principal Occupation(s) During Past Five Years | | Other Directorships Held During Past Five Years | | Length of
Board Service |
| | | | |
Scott E. Benjamin 5/21/73 Board Member & Vice President Portfolios Overseen:96 | | Executive Vice President (since June 2009) of PGIM Investments LLC; Executive Vice President (June 2009-June 2012) and Vice President (since June 2012) of Prudential Investment Management Services LLC; Executive Vice President (since September 2009) of AST Investment Services, Inc.; Senior Vice President of Product Development and Marketing, PGIM Investments (since February 2006); formerly Vice President of Product Development and Product Management, PGIM Investments LLC (2003-2006). | | None. | | Since March 2010 |
| | | | |
| Fund Officers(a) | | | | |
| | | |
Name Date of Birth Fund Position | | Principal Occupation(s) During Past Five Years | | Length of Service as Fund Officer |
| | | |
Raymond A. O’Hara 9/11/55 Chief Legal Officer | | Vice President and Corporate Counsel (since July 2010) of Prudential Insurance Company of America (Prudential); Vice President (March 2011-Present) of Pruco Life Insurance Company and Pruco Life Insurance Company of New Jersey; Vice President and Corporate Counsel (March 2011-Present) of Prudential Annuities Life Assurance Corporation; Chief Legal Officer of PGIM Investments LLC (since June 2012); Chief Legal Officer of Prudential Mutual Fund Services LLC (since June 2012) and Corporate Counsel of AST Investment Services, Inc. (since June 2012); formerly Assistant Vice President and Corporate Counsel (September 2008-July 2010) of The Hartford Financial Services Group, Inc.; formerly Associate (September 1980-December 1987) and Partner (January 1988–August 2008) of Blazzard & Hasenauer, P.C. (formerly, Blazzard, Grodd & Hasenauer, P.C.). | | Since June 2012 |
PGIM QMA Large-Cap Core Equity Fund
| | | | |
| Fund Officers(a) | | | | |
| | | |
Name Date of Birth Fund Position | | Principal Occupation(s) During Past Five Years | | Length of Service as Fund Officer |
| | | |
Dino Capasso 8/19/74 Chief Compliance Officer | | Chief Compliance Officer (July 2019-Present) of PGIM Investments LLC; Chief Compliance Officer (July 2019-Present) of the PGIM Funds, Target Funds, Advanced Series Trust, The Prudential Series Fund, Prudential’s Gibraltar Fund, Inc., PGIM Global High Yield Fund, Inc., and PGIM High Yield Bond Fund, Inc.; Vice President and Deputy Chief Compliance Officer (June 2017-2019) of PGIM Investments LLC; formerly, Senior Vice President and Senior Counsel (January 2016-June 2017), and Vice President and Counsel (February 2012-December 2015) of Pacific Investment Management Company LLC. | | Since March 2018 |
| | | |
Andrew R. French 12/22/62 Secretary | | Vice President of PGIM Investments LLC (December 2018-Present); formerly Vice President and Corporate Counsel (February 2010-December 2018) of Prudential; formerly Director and Corporate Counsel (2006-2010) of Prudential; Vice President and Assistant Secretary (since January 2007) of PGIM Investments LLC; Vice President and Assistant Secretary (since January 2007) of Prudential Mutual Fund Services LLC. | | Since October 2006 |
| | | |
Jonathan D. Shain 8/9/58 Assistant Secretary | | Vice President and Corporate Counsel (since August 1998) of Prudential; Vice President and Assistant Secretary (since May 2001) of PGIM Investments LLC; Vice President and Assistant Secretary (since February 2001) of Prudential Mutual Fund Services LLC; formerly Vice President and Assistant Secretary (May 2003-June 2005) of AST Investment Services, Inc. | | Since May 2005 |
| | | |
Claudia DiGiacomo 10/14/74 Assistant Secretary | | Vice President and Corporate Counsel (since January 2005) of Prudential; Vice President and Assistant Secretary of PGIM Investments LLC (since December 2005); formerly Associate at Sidley Austin Brown & Wood LLP (1999-2004). | | Since December 2005 |
| | | |
Diana N. Huffman 4/14/82 Assistant Secretary | | Vice President and Corporate Counsel (since September 2015) of Prudential; formerly Associate at Willkie Farr & Gallagher LLP (2009-2015). | | Since March 2019 |
| | | |
Kelly A. Coyne 8/8/68 Assistant Secretary | | Director, Investment Operations of Prudential Mutual Fund Services LLC (since 2010). | | Since March 2015 |
| | | |
Christian J. Kelly 5/5/75 Treasurer and Principal Financial and Accounting Officer | | Vice President, Head of Fund Administration of PGIM Investments LLC (since November 2018); formerly, Director of Fund Administration of Lord Abbett & Co. LLC (2009-2018), Treasurer and Principal Accounting Officer of the Lord Abbett Family of Funds (2017-2018); Director of Accounting, Avenue Capital Group (2008-2009); Senior Manager, Investment Management Practice of Deloitte & Touche LLP (1998-2007). | | Since January 2019 |
Visit our website at pgiminvestments.com
| | | | |
| Fund Officers(a) | | | | |
| | | |
Name Date of Birth Fund Position | | Principal Occupation(s) During Past Five Years | | Length of Service as Fund Officer |
| | | |
Lana Lomuti 6/7/67 Assistant Treasurer | | Vice President (since 2007) and Director (2005-2007), within PGIM Investments Fund Administration; formerly Assistant Treasurer (December 2007-February 2014) of The Greater China Fund, Inc. | | Since April 2014 |
| | | |
Russ Shupak 10/08/73 Assistant Treasurer | | Vice President (since 2017) and Director (2013-2017), within PGIM Investments Fund Administration. | | Since October 2019 |
| | | |
Deborah Conway 3/26/69 Assistant Treasurer | | Vice President (since 2017) and Director (2007-2017), within PGIM Investments Fund Administration. | | Since October 2019 |
| | | |
Elyse M. McLaughlin 1/20/74 Assistant Treasurer | | Vice President (since 2017) and Director (2011-2017), within PGIM Investments Fund Administration. | | Since October 2019 |
| | | |
Charles H. Smith 1/11/73 Anti-Money Laundering Compliance Officer | | Vice President, Corporate Compliance, Anti-Money Laundering Unit (since January 2015) of Prudential; committee member of the American Council of Life Insurers Anti-Money Laundering and Critical Infrastructure Committee (since January 2016); formerly Global Head of Economic Sanctions Compliance at AIG Property Casualty (February 2007-December 2014); Assistant Attorney General at the New York State Attorney General’s Office, Division of Public Advocacy. (August 1998-January 2007). | | Since January 2017 |
(a) Excludes Mr. Parker and Mr. Benjamin, interested Board Members who also serve as President and Vice President, respectively.
Explanatory Notes to Tables:
| ∎ | | Board Members are deemed to be “Interested,” as defined in the 1940 Act, by reason of their affiliation with PGIM Investments LLC and/or an affiliate of PGIM Investments LLC. |
| ∎ | | Unless otherwise noted, the address of all Board Members and Officers is c/o PGIM Investments LLC, 655 Broad Street, Newark, New Jersey 07102-4410. |
| ∎ | | There is no set term of office for Board Members or Officers. The Board Members have adopted a retirement policy, which calls for the retirement of Board Members on December 31 of the year in which they reach the age of 75. |
| ∎ | | “Other Directorships Held” includes only directorships of companies required to register or file reports with the SEC under the 1934 Act (that is, “public companies”) or other investment companies registered under the 1940 Act. |
| ∎ | | “Portfolios Overseen” includes all investment companies managed by PGIM Investments LLC. The investment companies for which PGIM Investments LLC serves as manager include the PGIM Funds, The Prudential Variable Contract Accounts, PGIM ETF Trust, PGIM High Yield Bond Fund, Inc., PGIM Global High Yield Fund, Inc., The Prudential Series Fund, Prudential’s Gibraltar Fund, Inc. and the Advanced Series Trust. |
PGIM QMA Large-Cap Core Equity Fund
Approval of Advisory Agreements(unaudited)
The Fund’s Board of Trustees
The Board of Trustees (the “Board”) of PGIM QMALarge-Cap Core Equity Fund (the “Fund”)1 consists of eleven individuals, nine of whom are not “interested persons” of the Fund, as defined in the Investment Company Act of 1940, as amended (the “1940 Act”) (the “Independent Trustees”).2 The Board is responsible for the oversight of the Fund and its operations, and performs the various duties imposed on the directors of investment companies by the 1940 Act. The Independent Trustees have retained independent legal counsel to assist them in connection with their duties. The Chair of the Board is an Independent Trustee. The Board has established four standing committees: the Audit Committee, the Nominating and Governance Committee, and two Investment Committees. Each committee is chaired by, and composed of, Independent Trustees.
Annual Approval of the Fund’s Advisory Agreements
As required under the 1940 Act, the Board determines annually whether to renew the Fund’s management agreement with PGIM Investments LLC (“PGIM Investments”) and the Fund’s subadvisory agreement with QMA LLC (“QMA”). In considering the renewal of the agreements, the Board, including all of the Independent Trustees, met on May 30, 2019 and on June11-13, 2019 and approved the renewal of the agreements through July 31, 2020, after concluding that the renewal of the agreements was in the best interests of the Fund and its shareholders.
In advance of the meetings, the Board received materials relating to the agreements, and had the opportunity to ask questions and request further information in connection with its consideration. Among other things, the Board considered comparative fee information from PGIM Investments and QMA. Also, the Board considered comparisons with other mutual funds in relevant Peer Universes and Peer Groups, as is further discussed below.
In approving the agreements, the Board, including the Independent Trustees advised by independent legal counsel, considered the factors it deemed relevant, including the nature, quality and extent of services provided by PGIM Investments and the subadviser, the performance of the Fund, the profitability of PGIM Investments and its affiliates, expenses and fees, and the potential for economies of scale that may be shared with the Fund and its shareholders as the Fund’s assets grow. In their deliberations, the Trustees did not identify any single factor which alone was responsible for the Board’s decision to approve the agreements with respect to the Fund. In connection with its deliberations, the Board considered information
| 1 | PGIM QMALarge-Cap Core Equity Fund is a series of Prudential Investment Portfolios 9. |
| 2 | Grace C. Torres was an Interested Trustee of the Fund at the time the Board considered and approved the renewal of the Fund’s advisory agreements, but has since become an Independent Trustee of the Fund. |
| | |
| PGIM QMA Large-Cap Core Equity Fund |
Approval of Advisory Agreements(continued)
provided by PGIM Investments throughout the year at regular Board meetings, presentations from portfolio managers and other information, as well as information furnished at or in advance of the meetings on May 30, 2019 and on June11-13, 2019.
The Trustees determined that the overall arrangements between the Fund and PGIM Investments, which serves as the Fund’s investment manager pursuant to a management agreement, and between PGIM Investments and QMA, which serves as the Fund’s subadviser pursuant to the terms of a subadvisory agreement with PGIM Investments, are in the best interests of the Fund and its shareholders in light of the services performed, fees charged and such other matters as the Trustees considered relevant in the exercise of their business judgment.
The material factors and conclusions that formed the basis for the Trustees’ reaching their determinations to approve the continuance of the agreements are separately discussed below.
Nature, Quality and Extent of Services
The Board received and considered information regarding the nature, quality and extent of services provided to the Fund by PGIM Investments and QMA. The Board noted that QMA is affiliated with PGIM Investments. The Board considered the services provided by PGIM Investments, including but not limited to the oversight of the subadviser for the Fund, as well as the provision of fund recordkeeping, compliance and other services to the Fund, and PGIM Investments’ role as administrator for the Fund’s liquidity risk management program. With respect to PGIM Investments’ oversight of the subadviser, the Board noted that PGIM Investments’ Strategic Investment Research Group (“SIRG”), which is a business unit of PGIM Investments, is responsible for monitoring and reporting to PGIM Investments’ senior management on the performance and operations of the subadviser. The Board also considered that PGIM Investments pays the salaries of all of the officers and interested Trustees of the Fund who are part of Fund management. The Board also considered the investment subadvisory services provided by QMA, including investment research and security selection, as well as adherence to the Fund’s investment restrictions and compliance with applicable Fund policies and procedures. The Board considered PGIM Investments’ evaluation of the subadviser, as well as PGIM Investments’ recommendation, based on its review of the subadviser, to renew the subadvisory agreement.
The Board considered the qualifications, backgrounds and responsibilities of PGIM Investments’ senior management responsible for the oversight of the Fund and QMA, and also considered the qualifications, backgrounds and responsibilities of QMA’s portfolio managers who are responsible for theday-to-day management of the Fund’s portfolio. The Board was provided with information pertaining to PGIM Investments’ and QMA’s organizational structure, senior management, investment operations, and other relevant
| | |
| Visit our website at pgiminvestments.com | | |
information pertaining to both PGIM Investments and QMA. The Board also noted that it received favorable compliance reports from the Fund’s Chief Compliance Officer (“CCO”) as to both PGIM Investments and QMA.
The Board concluded that it was satisfied with the nature, extent and quality of the investment management services provided by PGIM Investments and the subadvisory services provided to the Fund by QMA, and that there was a reasonable basis on which to conclude that the Fund benefits from the services provided by PGIM Investments and QMA under the management and subadvisory agreements.
Costs of Services and Profits Realized by PGIM Investments
The Board was provided with information on the profitability of PGIM Investments and its affiliates in serving as the Fund’s investment manager. The Board discussed with PGIM Investments the methodology utilized in assembling the information regarding profitability and considered its reasonableness. The Board recognized that it is difficult to make comparisons of profitability from fund management contracts because comparative information is not generally publicly available and is affected by numerous factors, including the structure of the particular adviser, the types of funds it manages, its business mix, numerous assumptions regarding allocations and the adviser’s capital structure and cost of capital. However, the Board considered that the cost of services provided by PGIM Investments during the year ended December 31, 2018 exceeded the management fees paid by the Fund, resulting in an operating loss to PGIM Investments. Taking these factors into account, the Board concluded that the profitability of PGIM Investments and its affiliates in relation to the services rendered was not unreasonable.
Economies of Scale
The Board received and discussed information concerning economies of scale that PGIM Investments may realize as the Fund’s assets grow beyond current levels. The Board noted that the management fee schedule for the Fund includes breakpoints, which have the effect of decreasing the fee rate as assets increase. During the course of time, the Board has considered information regarding the launch date of the Fund, the management fees of the Fund compared to those of similarly managed funds and PGIM Investments’ investment in the Fund over time. The Board noted that economies of scale can be shared with the Fund in other ways, including low management fees from inception, additional technological and personnel investments to enhance shareholder services, and maintaining existing expense structures in the face of a rising cost environment. The Board also considered PGIM Investments’ assertion that it continually evaluates the management fee schedule of the Fund and the potential to share economies of scale through breakpoints or fee waivers as asset levels increase.
| | |
| PGIM QMA Large-Cap Core Equity Fund |
Approval of Advisory Agreements(continued)
The Board recognized the inherent limitations of any analysis of economies of scale, stemming largely from the Board’s understanding that most of PGIM Investments’ costs are not specific to individual funds, but rather are incurred across a variety of products and services.
Other Benefits to PGIM Investments and QMA
The Board considered potential ancillary benefits that might be received by PGIM Investments, QMA and their affiliates as a result of their relationship with the Fund. The Board concluded that potential benefits to be derived by PGIM Investments included transfer agency fees received by the Fund’s transfer agent (which is affiliated with PGIM Investments), and benefits to its reputation as well as other intangible benefits resulting from PGIM Investments’ association with the Fund. The Board concluded that the potential benefits to be derived by QMA included its ability to use soft dollar credits, as well as the potential benefits consistent with those generally resulting from an increase in assets under management, specifically, potential access to additional research resources and benefits to its reputation. The Board concluded that the benefits derived by PGIM Investments and QMA were consistent with the types of benefits generally derived by investment managers and subadvisers to mutual funds.
Performance of the Fund / Fees and Expenses
The Board considered certain additional factors and made related conclusions relating to the historical performance of the Fund for theone-, three-, five- andten-year periods ended December 31, 2018.
The Board also considered the Fund’s actual management fee, as well as the Fund’s net total expense ratio, for the fiscal year ended October 31, 2018. The Board considered the management fee for the Fund as compared to the management fee charged by PGIM Investments to other funds and the fee charged by other advisers to comparable mutual funds in a Peer Group. The actual management fee represents the fee rate actually paid by Fund shareholders and includes any fee waivers or reimbursements. The net total expense ratio for the Fund represents the actual expense ratio incurred by Fund shareholders.
The mutual funds included in the Peer Universe, which was used to consider performance, and the Peer Group, which was used to consider expenses and fees, were objectively determined by Broadridge, an independent provider of mutual fund data. In certain circumstances, PGIM Investments also provided supplemental Peer Universe or Peer Group information for reasons addressed with the Board. The comparisons placed the Fund in various quartiles over various periods, with the first quartile being the best 25% of the mutual funds (for performance, the best performing mutual funds and, for expenses, the lowest cost mutual funds).
| | |
| Visit our website at pgiminvestments.com | | |
The section below summarizes key factors considered by the Board and the Board’s conclusions regarding the Fund’s performance, fees and overall expenses. The table sets forth net performance comparisons (which reflect the impact on performance of fund expenses, or any subsidies, expense caps or waivers that may be applicable) with the Peer Universe, actual management fees with the Peer Group (which reflect the impact of any subsidies or fee waivers), and net total expenses with the Peer Group, each of which were key factors considered by the Board.
| | | | | | | | |
| Net Performance | | 1 Year | | 3 Years | | 5 Years | | 10 Years |
| | 4th Quartile | | 2nd Quartile | | 2nd Quartile | | 2nd Quartile |
| Actual Management Fees:1st Quartile |
| Net Total Expenses: 1st Quartile |
| | • | | The Board noted that the Fund underperformed its benchmark index over all periods. |
| | • | | The Board considered PGIM Investments’ assertion that the Fund’s underperformance was attributable to the Fund’s overweight to value stocks relative to the Peer Universe and benchmark index, at a time when value investments were not favored in the market. |
| | • | | The Board also considered that, when it evaluated performance in the prior year, as of December 31, 2017, the Fund ranked in the first quartile of its Peer Universe over theone-, three- and five-year periods and ranked in the second quartile over theten-year period and outperformed its benchmark index over theone- and five-year periods. |
| | • | | The Board and PGIM Investments agreed to retain the existing contractual expense cap, which (exclusive of certain fees and expenses) caps the Fund’s net annual operating expenses at 0.35% for each class of the Fund’s shares through February 29, 2020. |
| | • | | The Board and PGIM Investments also agreed to retain the existing contractual expense cap, which (exclusive of certain fees and expenses), limits the Fund’s total annual operating expenses to 1.58% of the average daily net assets for Class B shares. |
| | • | | In addition, PGIM Investments will waive management fees or shared operating expenses on any share class to the same extent that it waives such expenses on any other share class, and has agreed that total annual fund operating expenses for Class R6 shares will not exceed total annual fund operating expenses for Class Z shares. |
| | • | | The Board concluded that, in light of the above, it would be in the best interests of the Fund and its shareholders to renew the agreements. |
| | • | | The Board concluded that the management fees (including subadvisory fees) and total expenses were reasonable in light of the services provided. |
* * *
After full consideration of these factors, the Board concluded that the approval of the agreements was in the best interests of the Fund and its shareholders.
| | |
| PGIM QMA Large-Cap Core Equity Fund |
Supplement dated December 18, 2019
to the Currently Effective Summary Prospectus, Prospectus
and Statement of Additional Information of the Funds Listed Below
This supplement should be read in conjunction with your Summary Prospectus, Statutory Prospectus and Statement of Additional Information, be retained for future reference and is in addition to any existing Fund supplements.
The Board of Directors/Trustees for each Fund listed below has approved the conversion of all issued and outstanding Class B shares of the Funds to Class A shares of the same Fund, effective on or about June 26, 2020.
As a result, effective on or about the close of business on June 26, 2020, all of the issued and outstanding Class B shares of a Fund will be converted into Class A shares of that Fund with the same relative aggregate net asset value as the Class B shares held immediately prior to the conversion. Class A shares currently have lower total expense ratios, and equal or lower distribution fees and shareholder servicing fees payable under the Fund’s 12b-1 plan than Class B shares. No sales load, fee, or other charge will be imposed on the conversion of these shares. Class A shares are not subject to the contingent deferred sales charge (if any) currently charged on the redemption of Class B shares. Please refer to your Fund’s Prospectus for more information regarding Class A shares. The conversion is not expected to be a taxable event for federal income tax purposes and should not result in recognition of gain or loss by converting shareholders.
LR1263
The Prudential Investment Portfolios, Inc.
PGIM Balanced Fund
PGIM Jennison Focused Value Fund
PGIM Jennison Growth Fund
Prudential Investment Portfolios 3
PGIM Jennison Focused Growth Fund
PGIM QMA Large-Cap Value Fund
PGIM Real Assets Fund
Prudential Investment Portfolios 4
PGIM Muni High Income Fund
Prudential Investment Portfolios 5
PGIM Jennison Diversified Growth Fund
Prudential Investment Portfolios 6
PGIM California Muni Income Fund
Prudential Investment Portfolios 7
PGIM Jennison Value Fund
Prudential Investment Portfolios 9
PGIM QMA Large-Cap Core Equity Fund
Prudential Investment Portfolios, Inc. 10
PGIM Jennison Global Equity Income Fund
PGIM QMA Mid-Cap Value Fund
Prudential Investment Portfolios 12
PGIM Global Real Estate Fund
PGIM US Real Estate Fund
Prudential Investment Portfolios, Inc. 14
PGIM Government Income Fund
Prudential Investment Portfolios, Inc. 15
PGIM High Yield Fund
Prudential Investment Portfolios 16
PGIM Income Builder Fund
Prudential Investment Portfolios, Inc. 17
PGIM Total Return Bond Fund
Prudential Investment Portfolios 18
PGIM Jennison 20/20 Focus Fund
Prudential Global Total Return Fund, Inc.
PGIM Global Total Return Fund
Prudential Jennison Blend Fund, Inc.
PGIM Jennison Blend Fund
Prudential Jennison Mid-Cap Growth Fund, Inc.
PGIM Jennison Mid-Cap Growth Fund
Prudential Jennison Natural Resources Fund, Inc.
PGIM Jennison Natural Resources Fund
Prudential Jennison Small Company Fund, Inc.
PGIM Jennison Small Company Fund
Prudential Government Money Market Fund, Inc.
PGIM Government Money Market Fund
Prudential National Muni Fund, Inc.
PGIM National Muni Fund
Prudential Sector Funds, Inc.
PGIM Jennison Financial Services Fund
PGIM Jennison Health Sciences Fund
PGIM Jennison Utility Fund
Prudential Short-Term Corporate Bond Fund, Inc.
PGIM Short-Term Corporate Bond Fund
Prudential World Fund, Inc.
PGIM QMA International Equity Fund
| | | | |
| | |
| ∎ MAIL | | ∎ TELEPHONE | | ∎ WEBSITE |
655 Broad Street Newark, NJ 07102 | | (800) 225-1852 | | pgiminvestments.com |
|
| PROXY VOTING |
| The Board of Trustees of the Fund has delegated to the Fund’s subadviser the responsibility for voting any proxies and maintaining proxy recordkeeping with respect to the Fund. A description of these proxy voting policies and procedures is available without charge, upon request, by calling (800) 225-1852. Information regarding how the Fund voted proxies relating to portfolio securities during the most recent 12-month period ended June 30 is available on the Fund’s website and on the Securities and Exchange Commission’s website. |
|
| TRUSTEES |
| Ellen S. Alberding• Kevin J. Bannon• Scott E. Benjamin• Linda W. Bynoe• Barry H. Evans• Keith F. Hartstein• Laurie Simon Hodrick• Michael S. Hyland• Stuart S. Parker• Brian K. Reid• Grace C. Torres |
|
| OFFICERS |
| Stuart S. Parker,President• Scott E. Benjamin,Vice President• Christian J. Kelly,Treasurer and Principal Financial and Accounting Officer• Raymond A. O’Hara,Chief Legal Officer• Dino Capasso,Chief Compliance Officer• Charles H. Smith,Anti-Money Laundering Compliance Officer• Andrew R. French,Secretary• Jonathan D. Shain,Assistant Secretary• Claudia DiGiacomo,Assistant Secretary• Diana N. Huffman,Assistant Secretary• Kelly A. Coyne,Assistant Secretary• Lana Lomuti,Assistant Treasurer• Russ Shupak,Assistant Treasurer• Elyse McLaughlin,Assistant Treasurer• Deborah Conway,Assistant Treasurer |
| | | | |
| MANAGER | | PGIM Investments LLC | | 655 Broad Street Newark, NJ 07102 |
|
| SUBADVISER | | QMA LLC | | Gateway Center Two
100 Mulberry Street
Newark, NJ 07102 |
|
| DISTRIBUTOR | | Prudential Investment
Management Services LLC | | 655 Broad Street Newark, NJ 07102 |
|
| CUSTODIAN | | The Bank of New York Mellon | | 240 Greenwich Street
New York, NY 10286 |
|
| TRANSFER AGENT | | Prudential Mutual Fund
Services LLC | | PO Box 9658
Providence, RI 02940 |
|
INDEPENDENT REGISTERED
PUBLIC ACCOUNTING FIRM | | KPMG LLP | | 345 Park Avenue
New York, NY 10154 |
|
| FUND COUNSEL | | Willkie Farr & Gallagher LLP | | 787 Seventh Avenue
New York, NY 10019 |
|
|
| An investor should consider the investment objectives, risks, charges, and expenses of the Fund carefully before investing. The prospectus and summary prospectus contain this and other information about the Fund. An investor may obtain the prospectus and summary prospectus by visiting our website atpgiminvestments.com or by calling(800) 225-1852. The prospectus and summary prospectus should be read carefully before investing. |
|
| E-DELIVERY |
| To receive your mutual fund documents online, go topgiminvestments.com/edelivery and enroll. Instead of receiving printed documents by mail, you will receive notification via email when new materials are available. You can cancel your enrollment or change your email address at any time by visiting the website address above. |
|
| SHAREHOLDER COMMUNICATIONS WITH TRUSTEES |
| Shareholders can communicate directly with the Board of Trustees by writing to the Chair of the Board, PGIM QMA Large-Cap Core Equity Fund, PGIM Investments, Attn: Board of Trustees, 655 Broad Street, Newark, NJ 07102. Shareholders can communicate directly with an individual Trustee by writing to the same address. Communications are not screened before being delivered to the addressee. |
|
| AVAILABILITY OF PORTFOLIO HOLDINGS |
| The Fund files its complete schedule of portfolio holdings with the Securities and Exchange Commission on Form N-PORT. The Fund’s Form N-PORT filings are available on the Commission’s website at sec.gov. Form N-PORT is filed with the Commission quarterly, and each Fund’s full portfolio holdings as of the first and third fiscal quarter-ends (as of the third month of the Fund’s fiscal quarter for reporting periods on or after September 30, 2019) will be made publicly available 60 days after the end of each quarter at sec.gov. |
|
| The Fund’s Statement of Additional Information contains additional information about the Fund’s Trustees and is available without charge, upon request, by calling (800) 225-1852. |
Mutual Funds:
| | | | |
ARE NOT INSURED BY THE FDIC OR ANY
FEDERAL GOVERNMENT AGENCY | | MAY LOSE VALUE | | ARE NOT A DEPOSIT OF OR GUARANTEED
BY ANY BANK OR ANY BANK AFFILIATE |
PGIM QMA LARGE-CAP CORE EQUITY FUND
| | | | | | | | | | |
| SHARE CLASS | | A | | B | | C | | Z | | R6 |
| NASDAQ | | PTMAX | | PTMBX | | PTMCX | | PTEZX | | PTMQX |
| CUSIP | | 74441J100 | | 74441J209 | | 74441J308 | | 74441J407 | | 74441J688 |
MF187E

PGIM REAL ESTATE INCOME FUND
ANNUAL REPORT
OCTOBER 31, 2019
COMING SOON: PAPERLESS SHAREHOLDER REPORTS
Beginning on January 1, 2021, as permitted by regulations adopted by the Securities and Exchange Commission, paper copies of the Fund’s annual and semiannual shareholder reports will no longer be sent by mail, unless you specifically request paper copies of the reports. Instead, the reports will be made available on the Fund’s website (pgiminvestments.com), and you will be notified by mail each time a report is posted and provided with a website link to access the report.
If you already elected to receive shareholder reports electronically, you will not be affected by this change and you need not take any action. You may elect to receive shareholder reports and other communications from the Fund electronically anytime by contacting your financial intermediary (such as a broker-dealer or bank) or, if you are a direct investor, by calling 1-800-225-1852 or by sending an email request to PGIM Investments at shareholderreports@pgim.com.
You may elect to receive all future reports in paper free of charge. If you invest through a financial intermediary, you can contact your financial intermediary or follow instructions included with this notice to elect to continue to receive paper copies of your shareholder reports. If you invest directly with the Fund, you can call 1-800-225-1852 or send an email request to shareholderreports@pgim.com to let the Fund know you wish to continue receiving paper copies of your shareholder reports. Your election to receive reports in paper will apply to all funds held in your account if you invest through your financial intermediary or all funds held with the fund complex if you invest directly with the Fund.

To enroll in e-delivery, go to pgiminvestments.com/edelivery
|
| Objective:To seek income and capital appreciation |
Highlights(unaudited)
| • | | The Fund outperformed the Custom Blend Index (the Index) during the reporting period. All regions in the Fund’s portfolio (North America, Europe, and Asia) performed well, with both stock selection and asset allocation contributing positively. |
| • | | Within North America, the US health care sector saw significant relative outperformance, largely the result of favorable stock picking. An overweight position in this sector relative to the Index also benefited returns. Conversely, an underweight position in the residential sector and lack of exposure to specialty housing stocks detracted from relative performance. |
| • | | Europe performed well on a relative basis largely due to both positive stock selection and favorable asset allocation in the UK and Ireland. An underweight position in Germany also boosted relative results. |
| • | | Asia’s relative outperformance can be attributed to strong stock selection in Japan. A slight underweight position, on average for the period, was also accretive to performance. Australia modestly dragged on returns due to weak stock picking. |
This report is not authorized for distribution to prospective investors unless preceded or accompanied by a current prospectus.
The views expressed in this report and information about the Fund’s portfolio holdings are for the period covered by this report and are subject to change thereafter.
Mutual funds are distributed by Prudential Investment Management Services LLC (PIMS), member SIPC. PGIM Real Estate is a unit of PGIM, Inc. (PGIM), a registered investment adviser. PIMS and PGIM are Prudential Financial companies.© 2019 Prudential Financial, Inc. and its related entities. PGIM Real Estate, PGIM, and the PGIM logo are service marks of Prudential Financial, Inc. and its related entities, registered in many jurisdictions worldwide.
| | |
| 2 | | Visit our website at pgiminvestments.com |
Table of Contents
| | | | |
| PGIM Real Estate Income Fund | | | 3 | |
This Page Intentionally Left Blank
Letter from the President

Dear Shareholder:
We hope you find the annual report for the PGIM Real Estate Income Fund informative and useful. The report covers performance for the 12-month period that ended October 31, 2019.
While the US economy remained healthy, with rising corporate profits and strong job growth, the Federal Reserve cut interest rates three times in the latter half of the period. The cuts were a proactive attempt by the Fed to extend the longest domestic economic expansion on record as growth in many regions weakened. China in particular showed signs of slowing amid trade tensions with the US, and turmoil in the United Kingdom continued as it negotiates an exit from the European Union.
The interest-rate cuts helped boost the performance of stocks globally. For the period overall, large-cap US equities along with stocks in developed and emerging foreign markets all rose by double digits. Small-cap US stocks posted a single-digit gain. This positive performance came despite significant volatility early in the period. Equities plunged at the end of 2018 on concerns about China’s economy, a potential global trade war, higher interest rates, and worries that profit growth might slow. Stocks reversed course early in 2019, rising sharply after the Fed moderated its position on additional rate hikes for the remainder of the year.
The overall US bond market posted strong returns during the period on a significant rally in interest rates that saw the 10-year US Treasury yield decline from over 3% to under 2%. Investment-grade corporate bonds led the way with a double-digit gain, while corporate high yield and municipal bonds each had a return in the high single digits. Globally, bonds in developed markets delivered strong returns, and emerging markets debt rose by double digits.
Regarding your investments with PGIM, we believe it is important to maintain a diversified portfolio of funds consistent with your tolerance for risk, time horizon, and financial goals. Your financial advisor can help you create a diversified investment plan that may include funds covering all the basic asset classes and that reflects your personal investor profile and risk tolerance. However, diversification and asset allocation strategies do not assure a profit or protect against loss in declining markets.
At PGIM Investments, we consider it a great privilege and responsibility to help investors participate in opportunities across global markets while meeting their toughest investment challenges. PGIM is a top-10 global investment manager with more than $1 trillion in assets under management. This scale and investment expertise allow us to deliver actively managed funds and strategies to meet the needs of investors around the globe.
Thank you for choosing our family of funds.
Sincerely,

Stuart S. Parker, President
PGIM Real Estate Income Fund
December 16, 2019
| | | | |
| PGIM Real Estate Income Fund | | | 5 | |
Your Fund’s Performance (unaudited)
Performance data quoted represents past performance. Past performance does not guarantee future results. The investment return and principal value of an investment will fluctuate, so that an investor’s shares, when redeemed, may be worth more or less than their original cost. Current performance may be lower or higher than the past performance data quoted. An investor may obtain performance data as of the most recent month-end by visiting our website atpgiminvestments.com or by calling (800) 225-1852.
| | | | | | | | |
| |
| | | Average Annual Total Returns as of 10/31/19 (with sales charges) | |
| | | One Year (%) | | | Since Inception (%) | |
| Class A | | | 19.32 | | | | 5.36 (6/3/15) | |
| Class C | | | 24.34 | | | | 5.95 (6/3/15) | |
| Class Z | | | 26.62 | | | | 7.04 (6/3/15) | |
| Class R6 | | | 26.54 | | | | 10.30 (12/28/16) | |
| Custom Blend Index | | | | | | | | |
| | | 19.39 | | | | — | |
| | | | | | | | |
| |
| | | Average Annual Total Returns as of 10/31/19
(without sales charges) | |
| | | One Year (%) | | | Since Inception (%) | |
| Class A | | | 26.26 | | | | 6.72 (6/3/15) | |
| Class C | | | 25.34 | | | | 5.95 (6/3/15) | |
| Class Z | | | 26.62 | | | | 7.04(6/3/15) | |
| Class R6 | | | 26.54 | | | | 10.30 (12/28/16) | |
| Custom Blend Index | | | | | | | | |
| | | | 19.39 | | | | — | |
| | |
| 6 | | Visit our website at pgiminvestments.com |
Growth of a $10,000 Investment(unaudited)
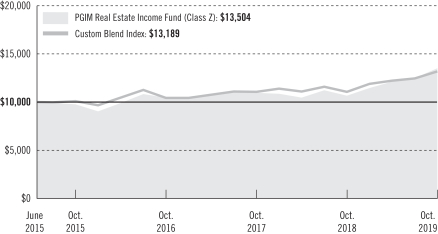
The graph compares a $10,000 investment in the Fund’s Class Z shares with a similar investment in the Custom Blend Index by portraying the initial account values at the commencement of operations for Class Z shares (June 3, 2015) and the account values at the end of the current fiscal year (October 31, 2019) as measured on a quarterly basis. For purposes of the graph, and unless otherwise indicated, it has been assumed that (a) all recurring fees (including management fees) were deducted; and (b) all dividends and distributions were reinvested. The line graph provides information for Class Z shares only. As indicated in the tables provided earlier, performance for other share classes will vary due to the differing charges and expenses applicable to each share class (as indicated in the following paragraphs). Without waiver of fees and/or expense reimbursements, if any, the returns would have been lower.
Past performance does not predict future performance. Total returns and the ending account values in the graph include changes in share price and reinvestment of dividends and capital gains distributions in a hypothetical investment for the periods shown. The Fund’s total returns do not reflect the deduction of income taxes on an individual’s investment. Taxes may reduce your actual investment returns on income or gains paid by the Fund or any gains you may realize if you sell your shares.
Source: PGIM Investments LLC and Lipper Inc.
Since Inception returns are provided since the Fund has less than 10 fiscal years of returns. Since Inception returns for the Index are measured from the closest month-end to each class’ inception date.
| | | | |
| PGIM Real Estate Income Fund | | | 7 | |
Your Fund’s Performance(continued)
The returns in the tables do not reflect the deduction of taxes that a shareholder would pay on Fund distributions or following the redemption of Fund shares. The average annual total returns take into account applicable sales charges, which are described for each share class in the table below.
| | | | | | | | |
| | | | | |
| | | Class A | | Class C | | Class Z | | Class R6 |
| Maximum initial sales charge | | 5.50% of the public offering price | | None | | None | | None |
| Contingent deferred sales charge (CDSC) (as a percentage of the lower of the original purchase price or the net asset value at redemption) | | 1.00% on sales of $1 million or more made within 12 months of purchase | | 1.00% on sales made within 12 months of purchase | | None | | None |
| Annual distribution and service (12b-1) fees (shown as a percentage of average daily net assets) | | 0.30% (0.25% currently) | | 1.00% | | None | | None |
Benchmark Definitions
Custom Blend Index—The Custom Blend Index is a model portfolio consisting of the FTSE EPRA/NAREIT Developed Index (80%), which is an unmanaged index and reflects the stock performance of companies engaged in specific aspects of the major real estate markets/regions of the world; and the ICE BofA Merrill Lynch 7% Constrained REIT Preferred Securities Index (20%), which is an unmanaged index that is a subset of the ICE BofA Merrill Lynch Fixed Rate Preferred Securities Index including all REIT-issued preferred securities. The average annual total returns for the Custom Blend Index measured from the month-end closest to the inception date of the Fund’s Class A, Class C, and Class Z shares are 6.47% and 9.01% for Class R6 shares.
Investors cannot invest directly in an index or average. The returns for the Index would be lower if they included the effects of sales charges, operating expenses of a mutual fund, or taxes.
| | |
| 8 | | Visit our website at pgiminvestments.com |
Presentation of Fund Holdingsas of 10/31/19
| | | | |
| | |
| Ten Largest Holdings | | REIT Sectors | | % of Net Assets |
| Apple Hospitality REIT, Inc. | | Hotel & Resort REITs | | 5.6% |
| Medical Properties Trust, Inc. | | Health Care REITs | | 5.5% |
| New Senior Investment Group, Inc. | | Health Care REITs | | 5.5% |
| Spirit Realty Capital, Inc. | | Retail REITs | | 5.3% |
| MGM Growth Properties LLC (Class A Stock) | | Hotel & Resort REITs | | 5.2% |
| Mapletree Logistics Trust (Singapore) | | Industrial REITs | | 4.5% |
| STAG Industrial, Inc. | | Industrial REITs | | 3.9% |
| Mapletree Commercial Trust (Singapore) | | Retail REITs | | 3.9% |
| New World Development Co. Ltd. (Hong Kong) | | Diversified Real Estate Activities | | 3.9% |
| Invincible Investment Corp. (Japan) | | Hotel & Resort REITs | | 3.6% |
For a complete list of holdings, please refer to the Schedule of Investments section of this report. Holdings reflect only long-term Investments.
| | | | |
| PGIM Real Estate Income Fund | | | 9 | |
Strategy and Performance Overview(unaudited)
How did the Fund perform?
ThePGIM Real Estate Income Fund’s Class Z shares returned 26.62% in the12-month reporting period that ended October 31, 2019, outperforming the 19.39% return of the Custom Blend Index (the Index).
What were conditions like in the global real estate securities market?
| • | | Conditions in the US real estate investment trust (REIT) market during the reporting period were highly favorable, as global economic uncertainty and persistently low long-term interest rates increased the relative attractiveness of the US REIT market as both a safe-haven asset class and reliable source of income. In addition, fundamentals in the commercial real estate markets remained strong, with peak occupancies in most property types and steady rent growth. As a result, the US REIT market produced a 24% total return during the period. Declining debt costs and improved equity valuations allowed REITs to increase equity issuances and make accretive acquisitions. Still, return dispersion remained wide, as property types best exposed to secular demand trends outperformed, specifically industrial and manufactured housing. Conversely, property types exposed to challenging demand trends and rising capital needs lagged, most notably the malls and office sectors. On average, the US REIT market was trading at an 8% premium to net asset value (NAV) at the end of the period, which PGIM Real Estate viewed as appropriate given the macroeconomic backdrop. |
| • | | The European real estate market’s total return during the period was positive. However, political risk hovered over the European region, especially in the United Kingdom (UK) where Brexit news dominated headlines as the UK continued to negotiate an exit from the European Union. Finland was the best-performing market, lifted by a strong multifamily residential sector performance. Belgium, Switzerland, Sweden, and Spain were also leading performers during the period. The UK real estate market’s return was in line with the European average. However, it underperformed for most of the period and saw a bounce only in October 2019 when a potential Brexit deal was announced. The core European real estate markets of Germany and France both lagged the European average. Germany suffered from the threat of growing regulation in the multifamily residential sector, and France was negatively impacted by the poor performance of the retail sector that dominates its index. Only the real estate market of the Netherlands showed a negative total return for the period, again as a result of the dominance of retail stocks in its index. The low interest-rate environment persisted in the eurozone longer than investors had originally anticipated, sending bond yields to record lows and maintaining pressure on capitalization rates (i.e., the rate of return expected to be generated on a real estate investment property) across the region, especially for core properties in the more liquid markets. Foreign investor demand was strong, and rental growth momentum was robust in the major continental markets, though some investor concerns were growing as capitalization rates reached new record lows in these markets late in the real estate cycle. |
| | |
| 10 | | Visit our website at pgiminvestments.com |
| • | | Asia-Pacific real estate equities walked a tightrope during the period, with global economic growth subject to the outcome of theUS-China trade conflict. This conflict has diminished trade flows, which has negatively affected consumption, exports, manufacturing, and ultimately investments. While interest-rate guidance during the latter half of the period turned dovish, markets continued to focus on potential signs of weakness in global economic growth. Amid the macro concerns, the region’s REIT markets outperformed the developers due to their defensiveness and income stability. Japanese REITs led the pack, supported by the robust class-A office sector in Tokyo and the continued accommodative monetary policy by the Bank of Japan. Similarly, investors favored Singapore REITs’ perceived defensive income payout. The numerous accretive equity raisings were well received throughout the period. Australian REITs underperformed, as economic concerns overshadowed the benefits of the cash rate cuts by the Reserve Bank of Australia. In the developer space, Singapore developers fared better than Japanese and Hong Kong developers during the period, despite cooling measures and global economic uncertainty. Japanese developers were helped by healthy condominium sales and positive office rent reversions, but performance was negatively affected by a murky economic outlook. Hong Kong developers remained in a tight spot, facing severe economic and political headwinds after months of civil unrest and the U.S.-China trade war. Residential prices fell 6.0% from their peak at the end of June 2019 through the end of the period, following an uninterruptedrun-up since 2003. |
What worked and didn’t work?
| • | | The Fund outperformed the Index during the reporting period. All regions in the Fund’s portfolio (North America, Europe, and Asia) performed well, with both stock selection and asset allocation contributing positively. |
| • | | Within North America, the US health care sector saw significant relative outperformance, largely the result of favorable stock picking. An overweight position in this sector relative to the Index also benefited returns. To a lesser degree, the triple net and shopping center sectors performed well on a relative basis from a combination of security selection and asset allocation. Conversely, an underweight position in the residential sector and lack of exposure to specialty housing stocks detracted from relative performance. |
| • | | Europe performed well on a relative basis largely due to both positive stock selection and favorable asset allocation in the UK and Ireland. An underweight position in Germany also boosted relative results. |
| • | | Asia’s relative outperformance can be attributed to strong stock selection in Japan. A slight underweight position, on average for the period, was also accretive to performance. Australia modestly dragged on returns from weak stock picking. |
| | | | |
| PGIM Real Estate Income Fund | | | 11 | |
Strategy and Performance Overview(continued)
Current outlook
| • | | Strength in US REITs during the reporting period drove the Index to anall-time high, trading at an 8% premium to NAV at the end of the period. While this premium is much richer than the 2.6% discount averaged over the trailing five years, it is more consistent with the 4.7% average premium over the last 10 years. Moreover, when looking at comparable macro environments (sub-2%10-year US Treasury yields and modest economic growth), the US REIT market has averaged double-digit NAV premiums. As such, PGIM Real Estate viewed the valuation of the REIT market at the end of the period as reasonable, with potential upside to come if current macroeconomic conditions are sustained. As mentioned earlier, declining debt costs and improved equity valuations have allowed REITs to increase equity issuances and make accretive acquisitions. The US REIT market has seen a substantial amount of secondary offerings. In addition, REITs remained active issuers of new equity through “at the market,” or ATM, programs, which provide REITs an efficient means of raising capital over time by allowing a company to tap into the existing trading market for its shares on anas-and-when-needed basis. Despite the average premium in the US, many REITs were still trading at sizable NAV discounts at the end of the period, presenting an opportunity, in PGIM Real Estate’s view, for mergers and acquisitions (M&A) through both privatizations and REIT consolidation. In addition, private equity remained highly active. PGIM Real Estate sees health care REITs as well positioned, given a growing source of demand based on demographics and a healthy external growth opportunity set. Conversely, hotel REITs are likely to see a more challenged environment as corporations look to cut back on travel budgets in the increasingly uncertain economic backdrop. In addition, PGIM Real Estate has increased the Fund’s exposure to manufactured housing based on sector-leading cash flow growth and limited supply additions. The industrial sector has continued to benefit from the secular demand shift towarde-commerce. With continued weakness in the retail sector, PGIM Real Estate expected additional tenant bankruptcies to weigh on cash flows and valuations and therefore maintained a Fund underweight to the sector. |
| • | | The outlook for the continental European real estate sector remains generally positive in terms of real estate fundamentals, but the growth outlook for the region as a whole remains subdued. Monetary policy in the eurozone remains loose, with potential interest-rate increases pushed back well into 2020 and the European Central Bank resuming quantitative easing. The discounts to private market values in Europe narrowed with the market rebound during the last two months of the period, but they still remained appealing with Europe trading overall at an average 7%one-year forward discount to NAV at the end of the period and with an averageone-year forward dividend yield of 4.2%. The valuation divergence between the UK and the continent narrowed following the progress made on Brexit negotiations, with the continent on a 6% averagediscount-to-forward NAV and the UK at a 9% average discount. PGIM Real Estate believes caution is still warranted in the UK retail and London office sectors. The potential |
| | |
| 12 | | Visit our website at pgiminvestments.com |
| | for surprises and volatility remain on the path to a Brexit agreement, and there are major structural challenges posed by the oversupply of physical retail in the UK. Investor demand for real estate from private capital remains solid, helping to support private market valuations as previous cycle peaks on both rents and values in many of the more liquid core markets are approached or exceeded. New supply, while increasing in markets and sectors where vacancy is tight and rental growth fundamentals are improving, generally remains able to be absorbed. On a sector basis, PGIM Real Estate remains cautious on the structural challenges facing retail stocks and continues to look for ways of increasing the Fund’s exposure to the booming logistics sector that is benefiting from the same structural trends favoring online retail. The retail sector in the UK especially has demonstrated an accelerating fall in rents and values, and this process is now underway throughout Europe. While retail share prices rebounded off their lows during the last two months of the period, M&A attempts have thus far failed to close the remaining significant discounts, and structural challenges have shown few signs of easing. |
| • | | Asia offers attractive, risk-adjusted real estate returns, supported by strong fundamentals and yield compression from potentially lower interest rates. With three Federal Reserve (Fed) rate cuts in the US during the period, interest-rate pressure in Singapore and Hong Kong moderated as the Fed offered guidance for a more balanced rate outlook after the third cut. In addition, the Reserve Bank of Australia has begun its path of rate cuts, while the Bank of Japan is maintaining zero interest rates. PGIM Real Estate believes the following themes could be in focus in the coming months: (1) trade war continuation, (2) lower bond yield impact on REITs, (3) supply constraints in prime Singapore/Hong Kong/Sydney offices, (4) attractive yield spread (for Japanese REITs), and (5) political developments in Hong Kong. Markets remain vulnerable, with global growth subject to the outcome of the trade conflict. Within individual sectors, a sharper rise in sovereign bond yields could negatively impact regional REIT valuations. An intensification of the trade conflict between the US and China also could materially hurt the economic prospects of the region. |
The percentage points shown in the tables below identify each security’s positive or negative contribution to the Fund’s return, which is the sum of all contributions by individual holdings during the Fund’s reporting period.
| | | | | | |
| |
| Top Contributors (%) | | Top Detractors (%) |
| MedEquities Realty Trust Inc. | | 2.85 | | Columbia Property Trust Inc. | | –0.57 |
| Invincible Investment Corp. | | 1.36 | | DiamondRock Hospitality Co. | | –0.57 |
| LaSalle LOGIPORT REIT | | 1.01 | | Easterly Government Properties Inc. | | –0.64 |
| Essential Properties Realty Trust Inc. | | 0.96 | | Sabra Health Care REIT Inc. | | –1.00 |
| Americold Realty Trust | | 0.89 | | Macerich Co. | | –1.27 |
| | | | |
| PGIM Real Estate Income Fund | | | 13 | |
Comments on Largest Holdings(unaudited)
| 5.6% | Apple Hospitality REIT, Inc.,Hotel Resort |
Apple Hospitality focuses on investments in hotels, guest rooms, and resorts in the US.
| 5.5% | Medical Properties Trust Inc.,Health Care |
Medical Properties Trust acquires and developsnet-leased health care facilities, including inpatient rehabilitation hospitals, long-term acute care hospitals, regional acute care hospitals, ambulatory surgery centers, and other single-discipline health care facilities such as heart hospitals.
| 5.5% | New Senior Investment Group, Inc.,Health Care |
New Senior Investment Group’s portfolio consists of senior housing properties in the US, including managed and triple net lease properties that are comprised of independent living and health care services.
| 5.3% | Spirit Realty Capital, Inc.,Retail |
Spirit Realty Capital invests in single-tenant and triple net basis real estate properties in the US that are engaged in retail, service, and distribution industries.
| 5.2% | MGM Growth Properties LLC,Hotel & Resort |
MGM Growth Properties acquires, owns, and leases destination entertainment and leisure resorts, including casino gaming, hotel, convention, dining, retail, and entertainment properties.
| | |
| 14 | | Visit our website at pgiminvestments.com |
Fees and Expenses (unaudited)
As a shareholder of the Fund, you incur two types of costs: (1) transaction costs, including sales charges (loads) on purchase payments and redemptions, as applicable, and (2) ongoing costs, including management fees, distribution and/or service (12b-1) fees, and other Fund expenses, as applicable. This example is intended to help you understand your ongoing costs (in dollars) of investing in the Fund and to compare these costs with the ongoing costs of investing in other mutual funds.
The example is based on an investment of $1,000 held through the six-month period ended October 31, 2019. The example is for illustrative purposes only; you should consult the Prospectus for information on initial and subsequent minimum investment requirements.
Actual Expenses
The first line for each share class in the table on the following page provides information about actual account values and actual expenses. You may use the information on this line, together with the amount you invested, to estimate the expenses that you paid over the period. Simply divide your account value by $1,000 (for example, an $8,600 account value ÷ $1,000 = 8.6), then multiply the result by the number on the first line under the heading “Expenses Paid During the Six-Month Period” to estimate the expenses you paid on your account during this period.
Hypothetical Example for Comparison Purposes
The second line for each share class in the table on the following page provides information about hypothetical account values and hypothetical expenses based on the Fund’s actual expense ratio and an assumed rate of return of 5% per year before expenses, which is not the Fund’s actual return. The hypothetical account values and expenses may not be used to estimate the actual ending account balance or expenses you paid for the period. You may use this information to compare the ongoing costs of investing in the Fund and other funds. To do so, compare this 5% hypothetical example with the 5% hypothetical examples that appear in the shareholder reports of the other funds.
The Fund’s transfer agent may charge additional fees to holders of certain accounts that are not included in the expenses shown in the table on the following page. These fees apply to individual retirement accounts (IRAs) and Section 403(b) accounts. As of the close of the six-month period covered by the table, IRA fees included an annual maintenance fee of $15 per account (subject to a maximum annual maintenance fee of $25 for all accounts held by the same shareholder). Section 403(b) accounts are charged an annual $25 fiduciary maintenance fee. Some of the fees may vary in amount, or may be waived, based on your total account balance or the number of PGIM funds, including the Fund, that you own. You should consider the additional fees that were charged to your Fund account over the six-month period when you estimate the total ongoing expenses paid over the period
| | | | |
| PGIM Real Estate Income Fund | | | 15 | |
Fees and Expenses(continued)
and the impact of these fees on your ending account value, as these additional expenses are not reflected in the information provided in the expense table. Additional fees have the effect of reducing investment returns.
Please note that the expenses shown in the table are meant to highlight your ongoing costs only and do not reflect any transactional costs such as sales charges (loads). Therefore, the second line for each share class in the table is useful in comparing ongoing costs only and will not help you determine the relative total costs of owning different funds. In addition, if these transactional costs were included, your costs would have been higher.
| | | | | | | | | | | | | | | | | | |
| | | | |
PGIM Real Estate
Income Fund | | Beginning Account
Value
May 1, 2019 | | | Ending Account
Value
October 31, 2019 | | | Annualized
Expense Ratio
Based on the
Six-Month Period | | | Expenses Paid
During the
Six-Month Period* | |
| Class A | | Actual | | $ | 1,000.00 | | | $ | 1,114.50 | | | | 1.35 | % | | $ | 7.20 | |
| | Hypothetical | | $ | 1,000.00 | | | $ | 1,018.40 | | | | 1.35 | % | | $ | 6.87 | |
| Class C | | Actual | | $ | 1,000.00 | | | $ | 1,110.30 | | | | 2.10 | % | | $ | 11.17 | |
| | Hypothetical | | $ | 1,000.00 | | | $ | 1,014.62 | | | | 2.10 | % | | $ | 10.66 | |
| Class Z | | Actual | | $ | 1,000.00 | | | $ | 1,115.50 | | | | 1.10 | % | | $ | 5.87 | |
| | Hypothetical | | $ | 1,000.00 | | | $ | 1,019.66 | | | | 1.10 | % | | $ | 5.60 | |
| Class R6 | | Actual | | $ | 1,000.00 | | | $ | 1,115.80 | | | | 1.10 | % | | $ | 5.87 | |
| | | Hypothetical | | $ | 1,000.00 | | | $ | 1,019.66 | | | | 1.10 | % | | $ | 5.60 | |
* Fund expenses (net of fee waivers or subsidies, if any) for each share class are equal to the annualized expense ratio for each share class (provided in the table), multiplied by the average account value over the period, multiplied by the 184 days in the six-month period ended October 31, 2019, and divided by the 365 days in the Fund’s fiscal year ended October 31, 2019 (to reflect the six-month period). Expenses presented in the table include the expenses of any underlying portfolios in which the Fund may invest.
| | |
| 16 | | Visit our website at pgiminvestments.com |
Schedule of Investments
as of October 31, 2019
| | | | | | | | |
| Description | | Shares | | | Value | |
LONG-TERM INVESTMENTS 99.0% | | | | | | | | |
| | |
COMMON STOCKS 79.3% | | | | | | | | |
| | |
Diversified Real Estate Activities 6.2% | | | | | | | | |
New World Development Co. Ltd. (Hong Kong) | | | 491,175 | | | $ | 699,700 | |
Sun Hung Kai Properties Ltd. (Hong Kong) | | | 28,168 | | | | 423,912 | |
| | | | | | | | |
| | | | | | | 1,123,612 | |
| | |
Diversified REITs 3.9% | | | | | | | | |
Activia Properties, Inc. (Japan) | | | 35 | | | | 184,647 | |
Essential Properties Realty Trust, Inc. | | | 8,299 | | | | 212,952 | |
STORE Capital Corp. | | | 7,829 | | | | 317,075 | |
| | | | | | | | |
| | | | | | | 714,674 | |
| | |
Health Care REITs 19.8% | | | | | | | | |
CareTrust REIT, Inc. | | | 17,109 | | | | 414,722 | |
Healthpeak Properties, Inc. | | | 11,114 | | | | 418,109 | |
Medical Properties Trust, Inc. | | | 48,337 | | | | 1,002,026 | |
New Senior Investment Group, Inc. | | | 140,645 | | | | 990,141 | |
Omega Healthcare Investors, Inc. | | | 8,199 | | | | 361,084 | |
Welltower, Inc. | | | 4,471 | | | | 405,475 | |
| | | | | | | | |
| | | | | | | 3,591,557 | |
| | |
Hotel & Resort REITs 16.2% | | | | | | | | |
Apple Hospitality REIT, Inc. | | | 61,750 | | | | 1,017,640 | |
Invincible Investment Corp. (Japan) | | | 1,046 | | | | 661,065 | |
Japan Hotel REIT Investment Corp. (Japan) | | | 394 | | | | 326,679 | |
MGM Growth Properties LLC (Class A Stock) | | | 30,258 | | | | 944,352 | |
| | | | | | | | |
| | | | | | | 2,949,736 | |
| | |
Industrial REITs 13.0% | | | | | | | | |
Frasers Logistics & Industrial Trust (Singapore) | | | 174,989 | | | | 161,878 | |
Mapletree Logistics Trust (Singapore) | | | 665,464 | | | | 820,721 | |
Prologis, Inc. | | | 421 | | | | 36,947 | |
STAG Industrial, Inc. | | | 22,697 | | | | 704,515 | |
Summit Industrial Income REIT (Canada)Sub RCT* | | | 21,533 | | | | 209,264 | |
Summit Industrial Income, REIT (Canada) | | | 10,911 | | | | 105,871 | |
Tritax Big Box REIT PLC (United Kingdom) | | | 163,986 | | | | 319,542 | |
| | | | | | | | |
| | | | | | | 2,358,738 | |
| | |
Office REITs 2.1% | | | | | | | | |
Keppel REIT (Singapore) | | | 435,326 | | | | 387,093 | |
See Notes to Financial Statements.
| | | | |
| PGIM Real Estate Income Fund | | | 17 | |
Schedule of Investments(continued)
as of October 31, 2019
| | | | | | | | |
| Description | | Shares | | | Value | |
COMMON STOCKS (Continued) | | | | | | | | |
| | |
Real Estate Operating Companies 1.9% | | | | | | | | |
LEG Immobilien AG (Germany) | | | 1,320 | | | $ | 151,517 | |
TLG Immobilien AG (Germany) | | | 6,347 | | | | 185,934 | |
| | | | | | | | |
| | | | | | | 337,451 | |
| | |
Retail REITs 15.3% | | | | | | | | |
Frasers Centrepoint Trust (Singapore) | | | 7,666 | | | | 15,489 | |
Kenedix Retail REIT Corp. (Japan) | | | 150 | | | | 413,252 | |
Lendlease Global Commercial REIT (Singapore)* | | | 428,700 | | | | 299,360 | |
Link REIT (Hong Kong) | | | 15,083 | | | | 164,214 | |
Mapletree Commercial Trust (Singapore) | | | 410,500 | | | | 702,366 | |
Realty Income Corp. | | | 2,585 | | | | 211,427 | |
Spirit Realty Capital, Inc. | | | 19,406 | | | | 967,195 | |
| | | | | | | | |
| | | | | | | 2,773,303 | |
| | |
Specialized REITs 0.9% | | | | | | | | |
Extra Space Storage, Inc. | | | 1,411 | | | | 158,413 | |
| | | | | | | | |
TOTAL COMMON STOCKS
(cost $12,981,423) | | | | | | | 14,394,577 | |
| | | | | | | | |
| | |
PREFERRED STOCKS 19.7% | | | | | | | | |
| | |
Diversified REITs 3.3% | | | | | | | | |
Gladstone Commercial Corp. | | | 12,884 | | | | 338,205 | |
PS Business Parks, Inc. | | | 10,450 | | | | 267,415 | |
| | | | | | | | |
| | | | | | | 605,620 | |
| | |
Industrial REITs 3.7% | | | | | | | | |
Monmouth Real Estate Investment Corp. | | | 14,408 | | | | 360,200 | |
Rexford Industrial Realty, Inc. | | | 12,000 | | | | 315,881 | |
| | | | | | | | |
| | | | | | | 676,081 | |
| | |
Office REITs 4.7% | | | | | | | | |
Office Properties Income Trust | | | 13,875 | | | | 361,860 | |
Vornado Realty Trust | | | 18,897 | | | | 492,456 | |
| | | | | | | | |
| | | | | | | 854,316 | |
| | |
Residential REITs 6.0% | | | | | | | | |
American Homes 4 Rent | | | 17,088 | | | | 453,687 | |
See Notes to Financial Statements.
| | | | | | | | |
| Description | | Shares | | | Value | |
PREFERRED STOCKS (Continued) | | | | | | | | |
| | |
Residential REITs (cont’d.) | | | | | | | | |
Investors Real Estate Trust | | | 12,010 | | | $ | 315,863 | |
UMH Properties, Inc. | | | 11,907 | | | | 320,298 | |
| | | | | | | | |
| | | | | | | 1,089,848 | |
| | |
Specialized REITs 2.0% | | | | | | | | |
EPR Properties(a) | | | 13,609 | | | | 357,236 | |
| | | | | | | | |
TOTAL PREFERRED STOCKS
(cost $3,401,872) | | | | | | | 3,583,101 | |
| | | | | | | | |
| | |
RIGHTS* 0.0% | | | | | | | | |
| | |
Retail REITs | | | | | | | | |
Mapletree Commercial Trust (Singapore), expiring 11/08/19
(cost $0) | | | 29,146 | | | | 1,879 | |
| | | | | | | | |
TOTAL LONG-TERM INVESTMENTS
(cost $16,383,295) | | | | | | | 17,979,557 | |
| | | | | | | | |
| | |
SHORT-TERM INVESTMENTS 6.0% | | | | | | | | |
| | |
AFFILIATED MUTUAL FUNDS | | | | | | | | |
PGIM Core Ultra Short Bond Fund(w) | | | 744,697 | | | | 744,697 | |
PGIM Institutional Money Market Fund
(cost $354,273; includes $354,253 of cash collateral for securities on loan)(b)(w) | | | 354,202 | | | | 354,273 | |
| | | | | | | | |
TOTAL SHORT-TERM INVESTMENTS
(cost $1,098,970) | | | | | | | 1,098,970 | |
| | | | | | | | |
TOTAL INVESTMENTS 105.0%
(cost $17,482,265) | | | | | | | 19,078,527 | |
Liabilities in excess of other assets (5.0)% | | | | | | | (916,224 | ) |
| | | | | | | | |
NET ASSETS 100.0% | | | | | | $ | 18,162,303 | |
| | | | | | | | |
Below is a list of the abbreviation(s) used in the annual report:
LIBOR—London Interbank Offered Rate
REITs—Real Estate Investment Trust
| * | Non-income producing security. |
| (a) | All or a portion of security is on loan. The aggregate market value of such securities, including those sold and pending settlement, is $341,250; cash collateral of $354,253 (included in liabilities) was received with which the Fund purchased highly liquid short-term investments. |
| (b) | Represents security purchased with cash collateral received for securities on loan and includes dividend reinvestment. |
See Notes to Financial Statements.
| | | | |
| PGIM Real Estate Income Fund | | | 19 | |
Schedule of Investments(continued)
as of October 31, 2019
| (w) | PGIM Investments LLC, the manager of the Fund, also serves as manager of the PGIM Core Ultra Short Bond Fund and PGIM Institutional Money Market Fund. |
Fair Value Measurements:
Various inputs are used in determining the value of the Fund’s investments. These inputs are summarized in the three broad levels listed below.
Level 1—unadjusted quoted prices generally in active markets for identical securities.
Level 2—quoted prices for similar securities, interest rates and yield curves, prepayment speeds, foreign currency exchange rates and other observable inputs.
Level 3—unobservable inputs for securities valued in accordance with Board approved fair valuation procedures.
The following is a summary of the inputs used as of October 31, 2019 in valuing such portfolio securities:
| | | | | | | | | | | | |
| | | Level 1 | | | Level 2 | | | Level 3 | |
Investments in Securities | | | | | | | | | | | | |
Assets | | | | | | | | | | | | |
Common Stocks | | | | | | | | | | | | |
Canada | | $ | 315,135 | | | $ | — | | | $ | — | |
Germany | | | — | | | | 337,451 | | | | — | |
Hong Kong | | | — | | | | 1,287,826 | | | | — | |
Japan | | | — | | | | 1,585,643 | | | | — | |
Singapore | | | 299,360 | | | | 2,087,547 | | | | — | |
United Kingdom | | | — | | | | 319,542 | | | | — | |
United States | | | 8,162,073 | | | | — | | | | — | |
Preferred Stocks | | | | | | | | | | | | |
United States | | | 3,583,101 | | | | — | | | | — | |
Rights | | | | | | | | | | | | |
Singapore | | | — | | | | 1,879 | | | | — | |
Affiliated Mutual Funds | | | 1,098,970 | | | | — | | | | — | |
| | | | | | | | | | | | |
Total | | $ | 13,458,639 | | | $ | 5,619,888 | | | $ | — | |
| | | | | | | | | | | | |
Sector Classification:
The sector classification of investments and liabilities in excess of other assets shown as a percentage of net assets as of October 31, 2019 were as follows (unaudited):
| | | | |
Health Care REITs | | | 19.8 | % |
Industrial REITs | | | 16.7 | |
Hotel & Resort REITs | | | 16.2 | |
Retail REITs | | | 15.3 | |
Diversified REITs | | | 7.2 | |
Office REITs | | | 6.8 | |
Diversified Real Estate Activities | | | 6.2 | |
Residential REITs | | | 6.0 | |
| | | | |
Affiliated Mutual Funds (2.0% represents investments purchased with collateral from securities on loan) | | | 6.0 | % |
Specialized REITs | | | 2.9 | |
Real Estate Operating Companies | | | 1.9 | |
| | | | |
| | | 105.0 | |
Liabilities in excess of other assets | | | (5.0 | ) |
| | | | |
| | | 100.0 | % |
| | | | |
See Notes to Financial Statements.
Effects of Derivative Instruments on the Financial Statements and Primary Underlying Risk Exposure:
The Fund invested in derivative instruments during the reporting period. The primary type of risk associated with these derivative instruments is equity contracts risk. See the Notes to Financial Statements for additional detail regarding these derivative instruments and their risks. The effect of such derivative instruments on the Fund’s financial position and financial performance as reflected in the Statement of Assets and Liabilities and Statement of Operations is presented in the summary below.
Fair values of derivative instruments as of October 31, 2019 as presented in the Statement of Assets and Liabilities:
| | | | | | | | | | | | |
| | | Asset Derivatives | | | Liability Derivatives | |
Derivatives not accounted
for as hedging
instruments, carried at fair
value | | Statement of
Assets and
Liabilities Location | | Fair
Value | | | Statement of
Assets and
Liabilities Location | | Fair
Value | |
| Equity contracts | | Unaffiliated investments | | $ | 1,879 | | | — | | $ | — | |
| | | | | | | | | | | | |
The effects of derivative instruments on the Statement of Operations for the year ended October 31, 2019 are as follows:
For the year ended October 31, 2019, the Fund did not have any net realized gain (loss) on derivatives in the Statement of Operations.
| | | | |
Change in Unrealized Appreciation (Depreciation) on Derivatives Recognized in Income | |
Derivatives not accounted for
as hedging instruments,
carried at fair value | | Rights(1) | |
Equity contracts | | $ | 1,879 | |
| | | | |
| (1) | Included in net change in unrealized appreciation (depreciation) on investments in the Statement of Operations. |
Financial Instruments/Transactions—Summary of Offsetting and Netting Arrangements:
The Fund entered into financial instruments/transactions during the reporting period that are either offset in accordance with current requirements or are subject to enforceable master netting arrangements or similar agreements that permit offsetting. The information about offsetting and related netting arrangements for financial instruments/transactions where the legal right toset-off exists is presented in the summary below.
Offsetting of financial instrument/transaction assets and liabilities:
| | | | | | | | | | | | |
Description | | Gross Market
Value of
Recognized
Assets/(Liabilities) | | | Collateral
Pledged/(Received)(1) | | | Net
Amount | |
Securities on Loan | | $ | 341,250 | | | $ | (341,250 | ) | | $ | — | |
| | | | | | | | | | | | |
| (1) | Collateral amount disclosed by the Fund is limited to the market value of financial instruments/transactions. |
See Notes to Financial Statements.
| | | | |
| PGIM Real Estate Income Fund | | | 21 | |
Statement of Assets and Liabilities
as of October 31, 2019
| | | | |
Assets | | | | |
Investments at value, including securities on loan of $341,250: | | | | |
Unaffiliated investments (cost $16,383,295) | | $ | 17,979,557 | |
Affiliated investments (cost $1,098,970) | | | 1,098,970 | |
Receivable for investments sold | | | 222,826 | |
Dividends receivable | | | 59,243 | |
Receivable for Fund shares sold | | | 21,502 | |
Tax reclaim receivable | | | 5,611 | |
Prepaid expenses and other assets | | | 814 | |
| | | | |
Total Assets | | | 19,388,523 | |
| | | | |
| |
Liabilities | | | | |
Payable for investments purchased | | | 809,887 | |
Payable to broker for collateral for securities on loan | | | 354,253 | |
Accrued expenses and other liabilities | | | 41,458 | |
Payable for Fund shares reacquired | | | 11,374 | |
Management fee payable | | | 8,249 | |
Distribution fee payable | | | 730 | |
Affiliated transfer agent fee payable | | | 269 | |
| | | | |
Total Liabilities | | | 1,226,220 | |
| | | | |
| |
Net Assets | | $ | 18,162,303 | |
| | | | |
| | | | | |
Net assets were comprised of: | | | | |
Shares of beneficial interest, at par | | $ | 1,700 | |
Paid-in capital in excess of par | | | 16,376,364 | |
Total distributable earnings (loss) | | | 1,784,239 | |
| | | | |
Net assets, October 31, 2019 | | $ | 18,162,303 | |
| | | | |
See Notes to Financial Statements.
| | | | |
Class A | | | | |
Net asset value and redemption price per share,
($ 914,680 ÷ 85,810 shares of beneficial interest issued and outstanding) | | $ | 10.66 | |
Maximum sales charge (5.50% of offering price) | | | 0.62 | |
| | | | |
Maximum offering price to public | | $ | 11.28 | |
| | | | |
| |
Class C | | | | |
Net asset value, offering price and redemption price per share, ($ 638,552 ÷ 59,910 shares of beneficial interest issued and outstanding) | | $ | 10.66 | |
| | | | |
| |
Class Z | | | | |
Net asset value, offering price and redemption price per share, ($ 16,450,610 ÷ 1,539,357 shares of beneficial interest issued and outstanding) | | $ | 10.69 | |
| | | | |
| |
Class R6 | | | | |
Net asset value, offering price and redemption price per share, ($ 158,461 ÷ 14,852 shares of beneficial interest issued and outstanding) | | $ | 10.67 | |
| | | | |
See Notes to Financial Statements.
| | | | |
| PGIM Real Estate Income Fund | | | 23 | |
Statement of Operations
Year Ended October 31, 2019
| | | | |
Net Investment Income (Loss) | | | | |
Income | | | | |
Unaffiliated dividend income (net of $16,744 foreign withholding tax) | | $ | 562,781 | |
Affiliated dividend income | | | 5,594 | |
Income from securities lending, net (including affiliated income of $24) | | | 2,109 | |
| | | | |
Total income | | | 570,484 | |
| | | | |
| |
Expenses | | | | |
Management fee | | | 106,902 | |
Distribution fee(a) | | | 7,130 | |
Custodian and accounting fees | | | 67,784 | |
Registration fees(a) | | | 45,852 | |
Audit fee | | | 32,256 | |
Shareholders’ reports | | | 27,159 | |
Legal fees and expenses | | | 18,668 | |
Transfer agent’s fees and expenses (including affiliated expense of $1,480)(a) | | | 11,356 | |
Trustees’ fees | | | 11,089 | |
Fund data services | | | 6,679 | |
Pricing fees | | | 651 | |
Miscellaneous | | | 14,585 | |
| | | | |
Total expenses | | | 350,111 | |
Less: Fee waiver and/or expense reimbursement(a) | | | (195,957 | ) |
Distribution fee waiver(a) | | | (339 | ) |
| | | | |
Net expenses | | | 153,815 | |
| | | | |
Net investment income (loss) | | | 416,669 | |
| | | | |
| |
Realized And Unrealized Gain (Loss) On Investment And Foreign Currency Transactions | | | | |
Net realized gain (loss) on: | | | | |
Investment transactions | | | 1,068,390 | |
Foreign currency transactions | | | (12,492 | ) |
| | | | |
| | | 1,055,898 | |
| | | | |
Net change in unrealized appreciation (depreciation) on: | | | | |
Investments | | | 1,676,402 | |
Foreign currencies | | | 52 | |
| | | | |
| | | 1,676,454 | |
| | | | |
Net gain (loss) on investment and foreign currency transactions | | | 2,732,352 | |
| | | | |
Net Increase (Decrease) In Net Assets Resulting From Operations | | $ | 3,149,021 | |
| | | | |
| (a) | Class specific expenses and waivers were as follows: |
| | | | | | | | | | | | | | | | |
| | | Class A | | | Class C | | | Class Z | | | Class R6 | |
Distribution fee | | | 2,031 | | | | 5,099 | | | | — | | | | — | |
Registration fees | | | 12,746 | | | | 12,747 | | | | 13,087 | | | | 7,272 | |
Transfer agent’s fees and expenses | | | 1,628 | | | | 732 | | | | 8,897 | | | | 99 | |
Fee waiver and/or expense reimbursement | | | (22,000 | ) | | | (19,175 | ) | | | (146,183 | ) | | | (8,599 | ) |
Distribution fee waiver | | | (339 | ) | | | — | | | | — | | | | — | |
See Notes to Financial Statements.
Statements of Changes in Net Assets
| | | | | | | | |
| |
| | | Year Ended October 31, | |
| | |
| | | 2019 | | | 2018 | |
Increase (Decrease) in Net Assets | | | | | | | | |
Operations | | | | | | | | |
Net investment income (loss) | | $ | 416,669 | | | $ | 409,264 | |
Net realized gain (loss) on investment and foreign currency transactions | | | 1,055,898 | | | | (145,447 | ) |
Net change in unrealized appreciation (depreciation) on investments and foreign currencies | | | 1,676,454 | | | | (445,332 | ) |
| | | | | | | | |
Net increase (decrease) in net assets resulting from operations | | | 3,149,021 | | | | (181,515 | ) |
| | | | | | | | |
| | |
Dividends and Distributions | | | | | | | | |
Distributions from distributable earnings | | | | | | | | |
Class A | | | (26,656 | ) | | | (48,178 | ) |
Class C | | | (15,965 | ) | | | (15,295 | ) |
Class Z | | | (480,561 | ) | | | (483,553 | ) |
Class R6 | | | (4,594 | ) | | | (1,218 | ) |
| | | | | | | | |
| | | (527,776 | ) | | | (548,244 | ) |
| | | | | | | | |
Tax return of capital distributions | | | | | | | | |
Class A | | | — | | | | (6,561 | ) |
Class C | | | — | | | | (2,083 | ) |
Class Z | | | — | | | | (65,851 | ) |
Class R6 | | | — | | | | (166 | ) |
| | | | | | | | |
| | | — | | | | (74,661 | ) |
| | | | | | | | |
| | |
Fund share transactions (Net of share conversions) | | | | | | | | |
Net proceeds from shares sold | | | 9,084,615 | | | | 1,327,086 | |
Net asset value of shares issued in reinvestment of dividends and distributions | | | 525,036 | | | | 614,269 | |
Cost of shares reacquired | | | (2,047,899 | ) | | | (5,056,067 | ) |
| | | | | | | | |
Net increase (decrease) in net assets from Fund share transactions | | | 7,561,752 | | | | (3,114,712 | ) |
| | | | | | | | |
Total increase (decrease) | | | 10,182,997 | | | | (3,919,132 | ) |
| | |
Net Assets: | | | | | | | | |
Beginning of year | | | 7,979,306 | | | | 11,898,438 | |
| | | | | | | | |
End of year | | $ | 18,162,303 | | | $ | 7,979,306 | |
| | | | | | | | |
See Notes to Financial Statements.
| | | | |
| PGIM Real Estate Income Fund | | | 25 | |
Notes to Financial Statements
Prudential Investment Portfolios 9 (the “Trust”) is registered under the Investment Company Act of 1940, as amended (“1940 Act”), as anopen-end management investment company. The Trust currently consists of five funds: PGIM Absolute Return Bond Fund and PGIM QMALarge-Cap Core Equity Fund, each of which are diversified funds and PGIM
International Bond Fund, PGIM Select Real Estate Fund and PGIM Real Estate Income Fund, each of which arenon-diversified funds for purposes of the 1940 Act. These financial statements relate only to the PGIM Real Estate Income Fund (the “Fund”).
The investment objective of the Fund is to seek income and capital appreciation.
1. Accounting Policies
The Fund follows the investment company accounting and reporting guidance of the Financial Accounting Standards Board (“FASB”) Accounting Standard Codification (“ASC”) Topic 946 Financial Services—Investment Companies.The following accounting policies conform to U.S. generally accepted accounting principles. The Fund consistently follows such policies in the preparation of its financial statements.
Securities Valuation:The Fund holds securities and other assets and liabilities that are fair valued at the close of each day (generally, 4:00 PM Eastern time) the New York Stock Exchange (“NYSE”) is open for trading. Fair value is the price that would be received to sell an asset or paid to transfer a liability in an orderly transaction between market participants on the measurement date. The Trust’s Board of Trustees (the “Board”) has adopted valuation procedures for security valuation under which fair valuation responsibilities have been delegated to PGIM Investments LLC (“PGIM Investments” or the “Manager”). Pursuant to the Board’s delegation, the Manager has established a Valuation Committee responsible for supervising the fair valuation of portfolio securities and other assets and liabilities. The valuation procedures permit the Fund to utilize independent pricing vendor services, quotations from market makers, and alternative valuation methods when market quotations are either not readily available or not deemed representative of fair value. A record of the Valuation Committee’s actions is subject to the Board’s review, approval, and ratification at its next regularly scheduled quarterly meeting.
For the fiscal reportingyear-end, securities and other assets and liabilities were fair valued at the close of the last U.S. business day. Trading in certain foreign securities may occur when the NYSE is closed (including weekends and holidays). Because such foreign securities trade in markets that are open on weekends and U.S. holidays, the values of some of the Fund’s foreign investments may change on days when investors cannot purchase or redeem Fund shares.
Various inputs determine how the Fund’s investments are valued, all of which are categorized according to the three broad levels (Level 1, 2, or 3) detailed in the Schedule of Investments and referred to herein as the “fair value hierarchy” in accordance with FASB ASC Topic 820—Fair Value Measurements and Disclosures.
Common and preferred stocks, exchange-traded funds, and derivative instruments, such as futures or options, that are traded on a national securities exchange are valued at the last sale price as of the close of trading on the applicable exchange where the security principally trades. Securities traded via NASDAQ are valued at the NASDAQ official closing price. To the extent these securities are valued at the last sale price or NASDAQ official closing price, they are classified as Level 1 in the fair value hierarchy. In the event that no sale or official closing price on valuation date exists, these securities are generally valued at the mean between the last reported bid and ask prices, or at the last bid price in the absence of an ask price. These securities are classified as Level 2 in the fair value hierarchy.
Foreign equities traded on foreign securities exchanges are generally valued using pricing vendor services that provide model prices derived using adjustment factors based on information such as local closing price, relevant general and sector indices, currency fluctuations, depositary receipts, and futures, as applicable. Securities valued using such model prices are classified as Level 2 in the fair value hierarchy. The models generate an evaluated adjustment factor for each security, which is applied to the local closing price to adjust it for post closing market movements up to the time the Fund is valued. Utilizing that evaluated adjustment factor, the vendor provides an evaluated price for each security. If the vendor does not provide an evaluated price, securities are valued in accordance with exchange-traded common and preferred stock valuation policies discussed above.
Investments inopen-end,non-exchange-traded mutual funds are valued at their net asset values as of the close of the NYSE on the date of valuation. These securities are classified as Level 1 in the fair value hierarchy since they may be purchased or sold at their net asset values on the date of valuation.
Securities and other assets that cannot be priced according to the methods described above are valued based on pricing methodologies approved by the Board. In the event that unobservable inputs are used when determining such valuations, the securities will be classified as Level 3 in the fair value hierarchy.
When determining the fair value of securities, some of the factors influencing the valuation include: the nature of any restrictions on disposition of the securities; assessment of the general liquidity of the securities; the issuer’s financial condition and the markets in which it does business; the cost of the investment; the size of the holding and the capitalization of the issuer; the prices of any recent transactions or bids/offers for such securities or any comparable securities; any available analyst media or other reports or information deemed reliable by the Manager regarding the issuer or the markets or industry in which it operates. Using fair value to price securities may result in a value that is different from a security’s
| | | | |
| PGIM Real Estate Income Fund | | | 27 | |
Notes to Financial Statements(continued)
most recent closing price and from the price used by other unaffiliated mutual funds to calculate their net asset values.
Illiquid Securities: Pursuant to Rule22e-4 under the 1940 Act, the Fund has adopted a Board approved Liquidity Risk Management Program (“LRMP”) that requires, among other things, that the Fund limit its illiquid investments that are assets to no more than 15% of net assets. Illiquid securities are those that, because of the absence of a readily available market or due to legal or contractual restrictions on resale, may not reasonably be expected to be sold or disposed of in current market conditions in seven calendar days or less without the sale or disposition significantly changing the market value of the investment. The Fund may find it difficult to sell illiquid securities at the time considered most advantageous by its subadviser and may incur transaction costs that would not be incurred in the sale of securities that were freely marketable.
Restricted Securities: Securities acquired in unregistered, private sales from the issuing company or from an affiliate of the issuer are considered restricted as to disposition under federal securities law (“restricted securities”). Such restricted securities are valued pursuant to the valuation procedures noted above. Restricted securities that would otherwise be considered illiquid investments pursuant to the Fund’s LRMP because of legal restrictions on resale to the general public may be traded among qualified institutional buyers under Rule 144A of the Securities Act of 1933. Therefore, these Rule 144A securities, as well as commercial paper that is sold in private placements under Section 4(2) of the Securities Act of 1933, may be classified higher than “illiquid” under the LRMP (i.e. “moderately liquid” or “less liquid” investments). However, the liquidity of the Fund’s investments in restricted securities could be impaired if trading does not develop or declines.
Foreign Currency Translation: The books and records of the Fund are maintained in U.S. dollars. Foreign currency amounts are translated into U.S. dollars on the following basis:
(i) market value of investment securities, other assets and liabilities—at the current rates of exchange;
(ii) purchases and sales of investment securities, income and expenses—at the rates of exchange prevailing on the respective dates of such transactions.
Although the net assets of the Fund are presented at the foreign exchange rates and market values at the close of the period, the Fund does not generally isolate that portion of the results of operations arising as a result of changes in the foreign exchange rates from the fluctuations arising from changes in the market prices of long-term portfolio securities held at the end of the period. Similarly, the Fund does not isolate the effect of changes in foreign exchange rates from the fluctuations arising from changes in the market prices of long-term
portfolio securities sold during the period. Accordingly, holding period realized foreign currency gains (losses) are included in the reported net realized gains (losses) on investment transactions.
Net realized gains (losses) on foreign currency transactions represent net foreign exchange gains (losses) from the disposition of holdings of foreign currencies, currency gains (losses) realized between the trade and settlement dates on forward currency transactions, and the difference between the amounts of interest, dividends and foreign withholding taxes recorded on the Fund’s books and the U.S. dollar equivalent amounts actually received or paid. Net unrealized currency gains (losses) arise from valuing foreign currency denominated assets and liabilities (other than investments) at period end exchange rates.
Master Netting Arrangements: The Trust, on behalf of the Fund, is subject to various Master Agreements, or netting arrangements, with select counterparties. These are agreements which a subadviser may have negotiated and entered into on behalf of all or a portion of the Fund. A master netting arrangement between the Fund and the counterparty permits the Fund to offset amounts payable by the Fund to the same counterparty against amounts to be received; and by the receipt of collateral from the counterparty by the Fund to cover the Fund’s exposure to the counterparty. However, there is no assurance that such mitigating factors are easily enforceable. In addition to master netting arrangements, the right toset-off exists when all the conditions are met such that each of the parties owes the other determinable amounts, the reporting party has the right toset-off the amount owed with the amount owed by the other party, the reporting party intends toset-off and the right ofset-off is enforceable by law. During the reporting period, there was no intention to settle on a net basis and all amounts are presented on a gross basis on the Statement of Assets and Liabilities.
Rights: The Fund held rights acquired either through a direct purchase or pursuant to corporate actions. Rights entitle the holder to buy a proportionate amount of common stock, or such other security that the issuer may specify, at a specific price and time through the expiration dates. Such rights are held as long positions by the Fund until exercised, sold or expired. Rights are valued at fair value in accordance with the Board approved fair valuation procedures.
Securities Lending:The Fund lends its portfolio securities to banks and broker-dealers. The loans are secured by collateral at least equal to the market value of the securities loaned. Collateral pledged by each borrower is invested in an affiliated money market fund and is marked to market daily, based on the previous day’s market value, such that the value of the collateral exceeds the value of the loaned securities. In the event of significant appreciation in value of securities on loan on the last business day of the reporting period, the financial statements may reflect a collateral value that is less than the market value of the loaned securities. Such shortfall is remedied as described above. Loans are subject to termination at the option of the borrower or the Fund. Upon termination of the loan, the borrower will return to the Fund securities identical to the loaned securities. Should the borrower of the
| | | | |
| PGIM Real Estate Income Fund | | | 29 | |
Notes to Financial Statements(continued)
securities fail financially, the Fund has the right to repurchase the securities in the open market using the collateral.
The Fund recognizes income, net of any rebate and securities lending agent fees, for lending its securities in the form of fees or interest on the investment of any cash received as collateral. The borrower receives all interest and dividends from the securities loaned and such payments are passed back to the lender in amounts equivalent thereto. The Fund also continues to recognize any unrealized gain (loss) in the market price of the securities loaned and on the change in the value of the collateral invested that may occur during the term of the loan. In addition, realized gain (loss) is recognized on changes in the value of the collateral invested upon liquidation of the collateral. Net earnings from securities lending are disclosed on the Statement of Operations as “Income from securities lending, net”.
Equity and Mortgage Real Estate Investment Trusts (collectively equity REITs):The Fund invested in equity REITs, which report information on the source of their distributions annually. Based on current and historical information, a portion of distributions received from equity REITs during the period is estimated to be dividend income, capital gain or return of capital and recorded accordingly. When material, these estimates are adjusted periodically when the actual source of distributions is disclosed by the equity REITs.
Securities Transactions and Net Investment Income:Securities transactions are recorded on the trade date. Realized gains (losses) from investment and currency transactions are calculated on the specific identification method. Dividend income is recorded on theex-date, or for certain foreign securities, when the Fund becomes aware of such dividends. Expenses are recorded on an accrual basis, which may require the use of certain estimates by management that may differ from actual. Net investment income or loss (other than class specific expenses and waivers, which are allocated as noted below) and unrealized and realized gains (losses) are allocated daily to each class of shares based upon the relative proportion of adjusted net assets of each class at the beginning of the day. Class specific expenses and waivers, where applicable, are charged to the respective share classes. Class specific expenses include distribution fees and distribution fee waivers, shareholder servicing fees, transfer agent’s fees and expenses, registration fees and fee waivers and/or expense reimbursements, as applicable.
Taxes:It is the Fund’s policy to continue to meet the requirements of the Internal Revenue Code applicable to regulated investment companies and to distribute all of its taxable net investment income and capital gains, if any, to its shareholders. Therefore, no federal income tax provision is required. Withholding taxes on foreign dividends, interest and capital gains, if any, are recorded, net of reclaimable amounts, at the time the related income is earned.
Tax reform legislation commonly referred to as the Tax Cuts and Jobs Act permits a direct REIT shareholder to claim a 20% “qualified business income” deduction for ordinary REIT dividends. The tax legislation did not expressly permit regulated investment companies (“RICs”) paying dividends attributable to such income to pass through this special treatment to its shareholders. On January 18, 2019, the Internal Revenue Service issued final regulations that permit RICs to pass through “qualified REIT dividends” to their shareholders.
Dividends and Distributions:The Fund expects to pay dividends from net investment income quarterly. Distributions from net realized capital and currency gains, if any, are declared and paid annually. Dividends and distributions to shareholders, which are determined in accordance with federal income tax regulations and which may differ from generally accepted accounting principles, are recorded on theex-date. Permanent book/tax differences relating to income and gain (loss) are reclassified between total distributable earnings (loss) andpaid-in capital in excess of par, as appropriate.
Estimates:The preparation of financial statements requires management to make estimates and assumptions that affect the reported amounts and disclosures in the financial statements. Actual results could differ from those estimates.
2. Agreements
The Trust, on behalf of the Fund, has a management agreement with the Manager. Pursuant to this agreement, the Manager has responsibility for all investment advisory services and supervises the subadviser’s performance of such services. In addition, under the management agreement, the Manager provides all of the administrative functions necessary for the organization, operation and management of the Fund. The Manager administers the corporate affairs of the Fund and, in connection therewith, furnishes the Fund with office facilities, together with those ordinary clerical and bookkeeping services which are not being furnished by the Fund’s custodian and the Fund’s transfer agent. The Manager is also responsible for the staffing and management of dedicated groups of legal, marketing, compliance and related personnel necessary for the operation of the Fund. The legal, marketing, compliance and related personnel are also responsible for the management and oversight of the various service providers to the Fund, including, but not limited to, the custodian, transfer agent, and accounting agent.
The Manager has entered into a subadvisory agreement with PGIM, Inc., which provides subadvisory services to the Fund through its PGIM Real Estate unit. The subadvisory agreement provides that PGIM Real Estate will furnish investment advisory services in connection with the management of the Fund. In connection therewith, PGIM Real Estate is obligated to keep certain books and records of the Fund. The Manager pays for the services of PGIM Real Estate, the cost of compensation of officers of the Fund, occupancy and certain clerical and bookkeeping costs of the Fund. The Fund bears all other costs and expenses.
| | | | |
| PGIM Real Estate Income Fund | | | 31 | |
Notes to Financial Statements(continued)
The management fee paid to the Manager is accrued daily and payable monthly at an annual rate of 0.80% of the Fund’s average daily net assets up to and including $1 billion, 0.78% of the next $2 billion, 0.76% of the next $2 billion, 0.75% of the next $5 billion and 0.74% of the Fund’s average daily net assets in excess of $10 billion. The effective management fee rate before any waivers and/or expense reimbursements was 0.80% for the year ended October 31, 2019.
The Manager has contractually agreed, through February 28, 2021, to limit total annual operating expenses after fee waivers and/or expense reimbursements to 1.35% of average daily net assets for Class A shares, 2.10% of average daily net assets for Class C shares, 1.10% of average daily net assets for Class Z shares and 1.10% of average daily net assets for Class R6 shares. This contractual waiver excludes interest, brokerage, taxes (such as income and foreign withholding taxes, stamp duty and deferred tax expenses), acquired fund fees and expenses, extraordinary expenses, and certain other Fund expenses such as dividend and interest expense and broker charges on short sales. Where applicable, the Manager agrees to waive management fees or shared operating expenses on any share class to the same extent that it waives similar expenses on any other share class and, in addition, total annual operating expenses for Class R6 shares will not exceed total annual operating expenses for Class Z shares. Fees and/or expenses waived and/or reimbursed by the Manager may be recouped by the Manager within the same fiscal year during which such waiver/reimbursement is made if such recoupment can be realized without exceeding the expense limit in effect at the time of the recoupment for that fiscal year.
The Trust, on behalf of the Fund, has a distribution agreement with Prudential Investment Management Services LLC (“PIMS”), which acts as the distributor of the Class A, Class C, Class Z and Class R6 shares of the Fund. The Fund compensates PIMS for distributing and servicing the Fund’s Class A and Class C shares, pursuant to the plans of distribution (the “Distribution Plans”), regardless of expenses actually incurred by PIMS. The distribution fees are accrued daily and payable monthly. No distribution or service fees are paid to PIMS as distributor of the Class Z Class R6 shares of the Fund.
Pursuant to the Distribution Plans, the Fund compensates PIMS for distribution related activities at an annual rate of up to 0.30% and 1% of the average daily net assets of the Class A and Class C shares, respectively. PIMS has contractually agreed through February 28, 2021 to limit such fees to 0.25% of the average daily net assets of Class A shares.
For the year ended October 31, 2019, PIMS received $12,763 infront-end sales charges resulting from sales of Class A shares. Additionally, for the year ended October 31, 2019, PIMS did not receive any contingent deferred sales charges imposed upon redemptions by certain Class A and Class C shareholders. From these fees, PIMS paid such sales charges to
broker-dealers, who in turn paid commissions to salespersons and incurred other distribution costs.
PGIM Investments, PGIM, Inc. and PIMS are indirect, wholly-owned subsidiaries of Prudential Financial, Inc. (“Prudential”).
3. Other Transactions with Affiliates
Prudential Mutual Fund Services LLC (“PMFS”), an affiliate of PGIM Investments and an indirect, wholly-owned subsidiary of Prudential, serves as the Trust’s transfer agent. Transfer agent’s fees and expenses in the Statement of Operations include certainout-of-pocket expenses paid tonon-affiliates, where applicable.
The Fund may invest its overnight sweep cash in the PGIM Core Ultra Short Bond Fund (the “Core Fund”), and its securities lending cash collateral in the PGIM Institutional Money Market Fund (the “Money Market Fund”), each a series of Prudential Investment Portfolios 2, registered under the 1940 Act and managed by PGIM Investments. Through the Fund’s investments in the mentioned underlying funds, PGIM Investments and/or its affiliates are paid fees or reimbursed for providing their services. In addition to the realized and unrealized gains on investments in the Core Fund and Money Market Fund, earnings from such investments are disclosed on the Statement of Operations as “Affiliated dividend income” and “Income from securities lending, net”, respectively.
The Fund may enter into certain securities purchase or sale transactions under Board approved Rule17a-7 procedures. Rule17a-7 is an exemptive rule under the 1940 Act, that subject to certain conditions, permits purchase and sale transactions among affiliated investment companies, or between an investment company and a person that is affiliated solely by reason of having a common (or affiliated) investment adviser, common directors, and/or common officers. Pursuant to the Rule17a-7 procedures and consistent with guidance issued by the SEC, the Trust’s Chief Compliance Officer (“CCO”) prepares a quarterly summary of all such transactions for submission to the Board, together with the CCO’s written representation that all such17a-7 transactions were effected in accordance with the Fund’s Rule17a-7 procedures. For the year ended October 31, 2019, no17a-7 transactions were entered into by the Fund.
4. Portfolio Securities
The aggregate cost of purchases and proceeds from sales of portfolio securities (excluding short-term investments and U.S. Government securities) for the year ended October 31, 2019, were $41,873,606 and $34,391,965, respectively.
A summary of the cost of purchases and proceeds from sales of shares of affiliated investments for the year ended October 31, 2019, is presented as follows:
| | | | |
| PGIM Real Estate Income Fund | | | 33 | |
Notes to Financial Statements(continued)
| | | | | | | | | | | | | | | | | | | | | | | | | | | | |
Value,
Beginning
of Year | | Cost of
Purchases | | | Proceeds
from Sales | | | Change in
Unrealized
Gain
(Loss) | | | Realized
Gain
(Loss) | | | Value,
End of
Year | | | Shares,
End of
Year | | | Income | |
PGIM Core Ultra Short Bond Fund* | | | | | | | | | |
| $ 34,101 | | $ | 16,701,584 | | | $ | 15,990,988 | | | $ | — | | | $ | — | | | $ | 744,697 | | | | 744,697 | | | $ | 5,594 | |
| | |
PGIM Institutional Money Market Fund* | | | | | | | | | |
| 4 | | | 1,000,135 | | | | 645,866 | | | | — | | | | — | | | | 354,273 | | | | 354,202 | | | | 24 | ** |
| | | | | | | | | | | | | | | | | | | | | | | | | | | | |
| $ 34,105 | | $ | 17,701,719 | | | $ | 16,636,854 | | | $ | — | | | $ | — | | | $ | 1,098,970 | | | | | | | $ | 5,618 | |
| | | | | | | | | | | | | | | | | | | | | | | | | | | | |
| * | The Fund did not have any capital gain distributions during the reporting period. |
| ** | This amount is included in “Income from securities lending, net” on the Statement of Operations. |
5. Distributions and Tax Information
Distributions to shareholders, which are determined in accordance with federal income tax regulations and which may differ from generally accepted accounting principles, are recorded on theex-date.
For the year ended October 31, 2019, the tax character of dividends paid by the Fund was $527,776 of ordinary income. For the year ended October 31, 2018, the tax character of dividends paid by the Fund was $548,244 of ordinary income $74,661 of tax return of capital.
As of October 31, 2019, the accumulated undistributed earnings on a tax basis was $737,147 of ordinary income.
The United States federal income tax basis of the Fund’s investments and the net unrealized appreciation as of October 31, 2019 were as follows:
| | | | | | |
Tax Basis | | Gross Unrealized
Appreciation | | Gross Unrealized
Depreciation | | Net Unrealized
Appreciation |
| $18,028,264 | | $1,193,588 | | $(143,325) | | $1,050,263 |
The book basis differs from tax basis primarily due to deferred losses on wash sales and book/tax differences in the treatment of passive foreign investment companies.
The Fund utilized approximately $640,000 of its capital loss carryforward to offset net taxable gains realized in the fiscal year ended October 31, 2019.
The Manager has analyzed the Fund’s tax positions taken on federal, state and local income tax returns for all open tax years and has concluded that no provision for income tax is required in the Fund’s financial statements for the current reporting period. Since tax authorities can examine previously filed tax returns, the Fund’s U.S. federal and state tax returns for each of the four fiscal years up to the most recent fiscal year ended October 31, 2019 are subject to such review.
6. Capital and Ownership
The Fund offers Class A, Class C, Class Z and Class R6 shares. Class A shares are sold with a maximumfront-end sales charge of 5.50%. Investors who purchase $1 million or more of Class A shares and sell these shares within 12 months of purchase are subject to a contingent deferred sales charge (“CDSC”) of 1%, although they are not subject to an initial sales charge. The Class A CDSC is waived for certain retirement and/or benefit plans. A special exchange privilege is also available for shareholders who qualified to purchase Class A shares at net asset value. Class C shares are sold with a CDSC of 1% on sales made within 12 months of purchase. Class C shares will automatically convert to Class A shares on a monthly basis approximately 10 years after purchase. Class Z and Class R6 shares are not subject to any sales or redemption charge and are available exclusively for sale to a limited group of investors.
Under certain circumstances, an exchange may be made from specified share classes of the Fund to one or more other share classes of the Fund as presented in the table of transactions in shares of beneficial interest.
The Trust has authorized an unlimited number of shares of beneficial interest of the Fund at $0.001 par value per share, divided four into classes, designated Class A, Class C, Class Z and Class R6.
As of October 31, 2019, Prudential, through its affiliated entities, including affiliated funds (if applicable), owned 1,211 Class C shares, 631,635 Class Z shares and 1,238 Class R6 shares of the Fund. At reporting period end, three shareholders of record, each holding greater than 5% of the Fund, held 90% of the Fund’s outstanding shares, of which 37% were held by an affiliate of Prudential.
| | | | |
| PGIM Real Estate Income Fund | | | 35 | |
Notes to Financial Statements(continued)
Transactions in shares of beneficial interest were as follows:
| | | | | | | | |
Class A | | Shares | | | Amount | |
Year ended October 31, 2019: | | | | | | | | |
Shares sold | | | 42,526 | | | $ | 417,140 | |
Shares issued in reinvestment of dividends and distributions | | | 2,679 | | | | 25,672 | |
Shares reacquired | | | (31,794 | ) | | | (294,954 | ) |
| | | | | | | | |
Net increase (decrease) in shares outstanding before conversion | | | 13,411 | | | | 147,858 | |
Shares issued upon conversion from other share class(es) | | | 1,443 | | | | 14,218 | |
| | | | | | | | |
Net increase (decrease) in shares outstanding | | | 14,854 | | | $ | 162,076 | |
| | | | | | | | |
Year ended October 31, 2018: | | | | | | | | |
Shares sold | | | 62,102 | | | $ | 563,140 | |
Shares issued in reinvestment of dividends and distributions | | | 5,192 | | | | 47,838 | |
Shares reacquired | | | (91,370 | ) | | | (847,176 | ) |
| | | | | | | | |
Net increase (decrease) in shares outstanding | | | (24,076 | ) | | $ | (236,198 | ) |
| | | | | | | | |
Class C | | | | | | |
Year ended October 31, 2019: | | | | | | | | |
Shares sold | | | 32,053 | | | $ | 291,635 | |
Shares issued in reinvestment of dividends and distributions | | | 1,676 | | | | 15,965 | |
Shares reacquired | | | (10,795 | ) | | | (94,916 | ) |
| | | | | | | | |
Net increase (decrease) in shares outstanding before conversion | | | 22,934 | | | | 212,684 | |
Shares reacquired upon conversion into other share class(es) | | | (1,442 | ) | | | (14,218 | ) |
| | | | | | | | |
Net increase (decrease) in shares outstanding | | | 21,492 | | | $ | 198,466 | |
| | | | | | | | |
Year ended October 31, 2018: | | | | | | | | |
Shares sold | | | 13,698 | | | $ | 123,497 | |
Shares issued in reinvestment of dividends and distributions | | | 1,895 | | | | 17,378 | |
Shares reacquired | | | (7,429 | ) | | | (69,546 | ) |
| | | | | | | | |
Net increase (decrease) in shares outstanding before conversion | | | 8,164 | | | | 71,329 | |
Shares reacquired upon conversion into other share class(es) | | | (212 | ) | | | (1,877 | ) |
| | | | | | | | |
Net increase (decrease) in shares outstanding | | | 7,952 | | | $ | 69,452 | |
| | | | | | | | |
Class Z | | | | | | |
Year ended October 31, 2019: | | | | | | | | |
Shares sold | | | 864,219 | | | $ | 8,266,388 | |
Shares issued in reinvestment of dividends and distributions | | | 48,986 | | | | 478,805 | |
Shares reacquired | | | (165,877 | ) | | | (1,609,190 | ) |
| | | | | | | | |
Net increase (decrease) in shares outstanding | | | 747,328 | | | $ | 7,136,003 | |
| | | | | | | | |
Year ended October 31, 2018: | | | | | | | | |
Shares sold | | | 61,945 | | | $ | 577,934 | |
Shares issued in reinvestment of dividends and distributions | | | 59,580 | | | | 547,669 | |
Shares reacquired | | | (439,676 | ) | | | (4,139,345 | ) |
| | | | | | | | |
Net increase (decrease) in shares outstanding before conversion | | | (318,151 | ) | | | (3,013,742 | ) |
Shares issued upon conversion from other share class(es) | | | 212 | | | | 1,877 | |
| | | | | | | | |
Net increase (decrease) in shares outstanding | | | (317,939 | ) | | $ | (3,011,865 | ) |
| | | | | | | | |
| | | | | | | | |
Class R6 | | Shares | | | Amount | |
Year ended October 31, 2019: | | | | | | | | |
Shares sold | | | 11,145 | | | $ | 109,452 | |
Shares issued in reinvestment of dividends and distributions | | | 474 | | | | 4,594 | |
Shares reacquired | | | (4,780 | ) | | | (48,839 | ) |
| | | | | | | | |
Net increase (decrease) in shares outstanding | | | 6,839 | | | $ | 65,207 | |
| | | | | | | | |
Year ended October 31, 2018: | | | | | | | | |
Shares sold | | | 6,742 | | | $ | 62,515 | |
Shares issued in reinvestment of dividends and distributions | | | 154 | | | | 1,384 | |
| | | | | | | | |
Net increase (decrease) in shares outstanding | | | 6,896 | | | $ | 63,899 | |
| | | | | | | | |
7. Borrowings
The Trust, on behalf of the Fund, along with other affiliated registered investment companies (the “Funds”), is a party to a Syndicated Credit Agreement (“SCA”) with a group of banks. The purpose of the SCA is to provide an alternative source of temporary funding for capital share redemptions. The table below provides details of the current SCA in effect at the reportingperiod-end as well as the prior SCA.
| | | | |
| | | Current SCA | | Prior SCA |
Term of Commitment | | 10/3/2019 – 10/1/2020 | | 10/4/2018 – 10/2/2019 |
Total Commitment | | $ 900 million | | $ 900 million |
Annualized Commitment Fee on the Unused Portion of the SCA | | 0.15% | | 0.15% |
Annualized Interest Rate on Borrowings | | 1.20% plus the higher of (1) the effective federal funds rate, (2) theone-month LIBOR rate or (3) zero percent | | 1.25% plus the higher of (1) the effective federal funds rate, (2) theone-month LIBOR rate or (3) zero percent |
Certain affiliated registered investment companies that are parties to the SCA include portfolios that are subject to a predetermined mathematical formula used to manage certain benefit guarantees offered under variable annuity contracts. The formula may result in large scale asset flows into and out of these portfolios. Consequently, these portfolios may be more likely to utilize the SCA for purposes of funding redemptions. It may be possible for those portfolios to fully exhaust the committed amount of the SCA, thereby requiring the Manager to allocate available funding per a Board-approved methodology designed to treat the Funds in the SCA equitably.
The Fund utilized the SCA during the year ended October 31, 2019. The average daily balance for the 2 days that the Fund had loans outstanding during the period was approximately $165,000, borrowed at a weighted average interest rate of 3.65%. The maximum loan outstanding amount during the period was $165,000. At October 31, 2019, the Fund did not have an outstanding loan amount.
8. Risks of Investing in the Fund
The Fund’s risks include, but are not limited to, some or all of the risks discussed below:
| | | | |
| PGIM Real Estate Income Fund | | | 37 | |
Notes to Financial Statements(continued)
Equity and Equity-Related Securities Risks: The value of a particular security could go down and you could lose money. In addition to an individual security losing value, the value of the equity markets or a sector in which the Fund invests could go down. The Fund’s holdings can vary significantly from broad market indexes and the performance of the Fund can deviate from the performance of these indexes. Different parts of a market can react differently to adverse issuer, market, regulatory, political and economic developments.
Foreign Securities Risk: The Fund’s investments in securities of foreign issuers or issuers with significant exposure to foreign markets involve additional risk. Foreign countries in which the Fund may invest may have markets that are less liquid, less regulated and more volatile than US markets. The value of the Fund’s investments may decline because of factors affecting the particular issuer as well as foreign markets and issuers generally, such as unfavorable government actions, and political or financial instability.
Market and Credit Risk: Securities markets may be volatile and the market prices of the Fund’s securities may decline. Securities fluctuate in price based on changes in an issuer’s financial condition and overall market and economic conditions. If the market prices of the securities owned by the Fund fall, the value of an investment in the Fund will decline. Additionally, the Fund may also be exposed to credit risk in the event that an issuer or guarantor fails to perform or that an institution or entity with which the Fund has unsettled or open transactions defaults.
Non-diversification Risk: Anon-diversified Fund may invest a greater percentage of its assets in the securities of a single company or industry than a diversified fund. Investing in anon-diversified fund involves greater risk than investing in a diversified fund because a loss resulting from the decline in value of any one security may represent a greater portion of the total assets of anon-diversified fund.
Risks of Investing in equity REITs: Real estate securities are subject to similar risks as direct investments in real estate and mortgages, and their value will depend on the value of the underlying properties or the underlying loans or interests. The underlying loans may be subject to the risks of default or of payments that occur earlier or later than expected, and such loans may also includeso-called “subprime” mortgages. The value of these securities will rise and fall in response to many factors, including economic conditions, the demand for rental property and interest rates. In particular, the value of these securities may decline when interest rates rise and will also be affected by the real estate market and by the management of the underlying properties.
In addition, investing in equity REITs involves certain unique risks in addition to those risks associated with investing in the real estate industry in general. Equity REITs may be affected by changes in the value of the underlying property owned by the equity REITs, while
mortgage REITs may be affected by the quality of any credit extended. Equity REITs are dependent upon management skills, may not be diversified geographically or by property/mortgage asset type, and are subject to heavy cash flow dependency, default by borrowers and self-liquidation. Since equity REITs are relatively smaller in size when compared to the broader market, and smaller companies tend to be more volatile than larger companies, they may be more volatile and/or more illiquid than other types of equity securities. Equity REITs are subject to interest rate risks. Equity REITs may incur significant amounts of leverage. The Fund will indirectly bear a portion of the expenses, including management fees, paid by each equity REIT in which it invests, in addition to the expenses of the Fund.
9. Recent Accounting Pronouncements and Reporting Updates
In August 2018, the FASB issued Accounting Standards Update (“ASU”)No. 2018-13, which changes certain fair value measurement disclosure requirements. The new ASU, in addition to other modifications and additions, removes the requirement to disclose the amount and reasons for transfers between Level 1 and Level 2 of the fair value hierarchy, and the Fund’s policy for the timing of transfers between levels. The amendments are effective for financial statements issued for fiscal years beginning after December 15, 2019, and interim periods within those fiscal years. The Manager has evaluated the implications of certain provisions of the ASU and has determined to early adopt aspects related to the removal and modification of certain fair value measurement disclosures under the ASU effective immediately. The Manager continues to evaluate certain other provisions of the ASU and does not expect a material impact to financial statement disclosures.
| | | | |
| PGIM Real Estate Income Fund | | | 39 | |
Financial Highlights
| | | | | | | | | | | | | | | | | | | | | | | | |
| Class A Shares | |
| | | Year Ended October 31, | | | | | | June 3,
2015(a) through
October 31, | |
| | | 2019 | | | 2018 | | | 2017 | | | 2016 | | | | | | 2015 | |
| Per Share Operating Performance(b): | | | | | | | | | | | | | | | | | | | | | | | | |
| Net Asset Value, Beginning of Period | | | $8.76 | | | | $9.62 | | | | $9.66 | | | | $9.59 | | | | | | | | $10.00 | |
| Income (loss) from investment operations: | | | | | | | | | | | | | | | | | | | | | | | | |
| Net investment income (loss) | | | 0.28 | | | | 0.34 | | | | 0.39 | | | | 0.24 | | | | | | | | 0.13 | |
| Net realized and unrealized gain (loss) on investment and foreign currency transactions | | | 1.97 | | | | (0.63 | ) | | | 0.05 | | | | 0.39 | | | | | | | | (0.38 | ) |
| Total from investment operations | | | 2.25 | | | | (0.29 | ) | | | 0.44 | | | | 0.63 | | | | | | | | (0.25 | ) |
| Less Dividends and Distributions: | | | | | | | | | | | | | | | | | | | | | | | | |
| Dividends from net investment income | | | (0.35 | ) | | | (0.50 | ) | | | (0.48 | ) | | | (0.56 | ) | | | | | | | (0.16 | ) |
| Tax return of capital distributions | | | - | | | | (0.07 | ) | | | - | | | | - | | | | | | | | - | |
| Total dividends and distributions | | | (0.35 | ) | | | (0.57 | ) | | | (0.48 | ) | | | (0.56 | ) | | | | | | | (0.16 | ) |
| Net asset value, end of period | | | $10.66 | | | | $8.76 | | | | $9.62 | | | | $9.66 | | | | | | | | $9.59 | |
| Total Return(c): | | | 26.26% | | | | (3.15 | )% | | | 4.60% | | | | 6.92% | | | | | | | | (2.55 | )% |
| | | | | | | | | | | | | | | | | | | | | | | | |
| Ratios/Supplemental Data: | |
| Net assets, end of period (000) | | | $915 | | | | $621 | | | | $914 | | | | $637 | | | | | | | | $33 | |
| Average net assets (000) | | | $677 | | | | $878 | | | | $744 | | | | $186 | | | | | | | | $24 | |
| Ratios to average net assets(d)(e): | | | | | | | | | | | | | | | | | | | | | | | | |
| Expenses after waivers and/or expense reimbursement | | | 1.35% | | | | 1.36% | | | | 1.35% | | | | 1.35% | | | | | | | | 1.36% | (f) |
| Expenses before waivers and/or expense reimbursement | | | 4.65% | | | | 4.85% | | | | 3.30% | | | | 3.37% | | | | | | | | 9.50% | (f) |
| Net investment income (loss) | | | 2.91% | | | | 3.73% | | | | 4.00% | | | | 2.45% | | | | | | | | 3.15% | (f) |
| Portfolio turnover rate(g) | | | 257% | | | | 153% | | | | 137% | | | | 113% | | | | | | | | 98% | |
| (a) | Commencement of operations. |
| (b) | Calculated based on average shares outstanding during the period. |
| (c) | Total return does not consider the effects of sales loads. Total return is calculated assuming a purchase of a share on the first day and a sale on the last day of each period reported and includes reinvestment of dividends and distributions, if any. Total returns may reflect adjustments to conform to generally accepted accounting principles. Total returns for periods less than one full year are not annualized. |
| (d) | Does not include expenses of the underlying funds in which the Fund invests. |
| (e) | Effective November 1, 2017, class specific expenses include transfer agent fees and expenses and registration fees, which are charged to their respective share class. |
| (g) | The Fund’s portfolio turnover rate is calculated in accordance with regulatory requirements, without regard to transactions involving short-term investments and certain derivatives. If such transactions were included, the Fund’s portfolio turnover rate may be higher. |
See Notes to Financial Statements.
| | | | | | | | | | | | | | | | | | | | | | | | |
| Class C Shares | |
| | | Year Ended October 31, | | | | | | June 3,
2015(a)
through
October 31, | |
| | | 2019 | | | 2018 | | | 2017 | | | 2016 | | | | | | 2015 | |
| Per Share Operating Performance(b): | | | | | | | | | | | | | | | | | | | | | | | | |
| Net Asset Value, Beginning of Period | | | $8.76 | | | | $9.62 | | | | $9.66 | | | | $9.58 | | | | | | | | $10.00 | |
| Income (loss) from investment operations: | | | | | | | | | | | | | | | | | | | | | | | | |
| Net investment income (loss) | | | 0.21 | | | | 0.27 | | | | 0.32 | | | | 0.19 | | | | | | | | 0.11 | |
| Net realized and unrealized gain (loss) on investment and foreign currency transactions | | | 1.97 | | | | (0.63 | ) | | | 0.05 | | | | 0.38 | | | | | | | | (0.40 | ) |
| Total from investment operations | | | 2.18 | | | | (0.36 | ) | | | 0.37 | | | | 0.57 | | | | | | | | (0.29 | ) |
| Less Dividends and Distributions: | | | | | | | | | | | | | | | | | | | | | | | | |
| Dividends from net investment income | | | (0.28 | ) | | | (0.44 | ) | | | (0.41 | ) | | | (0.49 | ) | | | | | | | (0.13 | ) |
| Tax return of capital distributions | | | - | | | | (0.06 | ) | | | - | | | | - | | | | | | | | - | |
| Total dividends and distributions | | | (0.28 | ) | | | (0.50 | ) | | | (0.41 | ) | | | (0.49 | ) | | | | | | | (0.13 | ) |
| Net asset value, end of period | | | $10.66 | | | | $8.76 | | | | $9.62 | | | | $9.66 | | | | | | | | $9.58 | |
| Total Return(c): | | | 25.34% | | | | (3.85)% | | | | 3.83% | | | | 6.22% | | | | | | | | (2.91)% | |
| | | | | | | | | | | | | | | | | | | | | | | | |
| Ratios/Supplemental Data: | |
| Net assets, end of period (000) | | | $639 | | | | $336 | | | | $293 | | | | $321 | | | | | | | | $13 | |
| Average net assets (000) | | | $510 | | | | $314 | | | | $309 | | | | $151 | | | | | | | | $11 | |
| Ratios to average net assets(d)(e): | | | | | | | | | | | | | | | | | | | | | | | | |
| Expenses after waivers and/or expense reimbursement | | | 2.10% | | | | 2.11% | | | | 2.10% | | | | 2.10% | | | | | | | | 2.13% | (f) |
| Expenses before waivers and/or expense reimbursement | | | 5.86% | | | | 8.85% | | | | 4.00% | | | | 4.78% | | | | | | | | 10.11% | (f) |
| Net investment income (loss) | | | 2.21% | | | | 2.98% | | | | 3.29% | | | | 1.98% | | | | | | | | 2.87% | (f) |
| Portfolio turnover rate(g) | | | 257% | | | | 153% | | | | 137% | | | | 113% | | | | | | | | 98% | |
| (a) | Commencement of operations. |
| (b) | Calculated based on average shares outstanding during the period. |
| (c) | Total return does not consider the effects of sales loads. Total return is calculated assuming a purchase of a share on the first day and a sale on the last day of each period reported and includes reinvestment of dividends and distributions, if any. Total returns may reflect adjustments to conform to generally accepted accounting principles. Total returns for periods less than one full year are not annualized. |
| (d) | Does not include expenses of the underlying funds in which the Fund invests. |
| (e) | Effective November 1, 2017, class specific expenses include transfer agent fees and expenses and registration fees, which are charged to their respective share class. |
| (g) | The Fund’s portfolio turnover rate is calculated in accordance with regulatory requirements, without regard to transactions involving short-term investments and certain derivatives. If such transactions were included, the Fund’s portfolio turnover rate may be higher. |
See Notes to Financial Statements.
| | | | |
| PGIM Real Estate Income Fund | | | 41 | |
Financial Highlights(continued)
| | | | | | | | | | | | | | | | | | | | | | | | |
| Class Z Shares | |
| | | Year Ended October 31, | | | | | | June 3,
2015(a)
through
October 31, | |
| | | 2019 | | | 2018 | | | 2017 | | | 2016 | | | | | | 2015 | |
| Per Share Operating Performance(b): | | | | | | | | | | | | | | | | | | | | | | | | |
| Net Asset Value, Beginning of Period | | | $8.78 | | | | $9.62 | | | | $9.66 | | | | $9.59 | | | | | | | | $10.00 | |
| Income (loss) from investment operations: | | | | | | | | | | | | | | | | | | | | | | | | |
| Net investment income (loss) | | | 0.31 | | | | 0.39 | | | | 0.40 | | | | 0.38 | | | | | | | | 0.16 | |
| Net realized and unrealized gain (loss) on investment and foreign currency transactions | | | 1.98 | | | | (0.64 | ) | | | 0.06 | | | | 0.28 | | | | | | | | (0.41 | ) |
| Total from investment operations | | | 2.29 | | | | (0.25 | ) | | | 0.46 | | | | 0.66 | | | | | | | | (0.25 | ) |
| Less Dividends and Distributions: | | | | | | | | | | | | | | | | | | | | | | | | |
| Dividends from net investment income | | | (0.38 | ) | | | (0.52 | ) | | | (0.50 | ) | | | (0.59 | ) | | | | | | | (0.16 | ) |
| Tax return of capital distributions | | | - | | | | (0.07 | ) | | | - | | | | - | | | | | | | | - | |
| Total dividends and distributions | | | (0.38 | ) | | | (0.59 | ) | | | (0.50 | ) | | | (0.59 | ) | | | | | | | (0.16 | ) |
| Net asset value, end of period | | | $10.69 | | | | $8.78 | | | | $9.62 | | | | $9.66 | | | | | | | | $9.59 | |
| Total Return(c): | | | 26.62% | | | | (2.70 | )% | | | 4.85% | | | | 7.19% | | | | | | | | (2.47 | )% |
| | | | | | | | | | | | | | | | | | | | | | | | |
| Ratios/Supplemental Data: | |
| Net assets, end of period (000) | | | $16,451 | | | | $6,951 | | | | $10,681 | | | | $5,512 | | | | | | | | $4,886 | |
| Average net assets (000) | | | $12,060 | | | | $8,632 | | | | $8,961 | | | | $5,008 | | | | | | | | $4,868 | |
| Ratios to average net assets(d)(e): | | | | | | | | | | | | | | | | | | | | | | | | |
| Expenses after waivers and/or expense reimbursement | | | 1.10% | | | | 0.98% | | | | 1.10% | | | | 1.10% | | | | | | | | 1.10% | (f) |
| Expenses before waivers and/or expense reimbursement | | | 2.31% | | | | 2.81% | | | | 2.96% | | | | 4.85% | | | | | | | | 8.98% | (f) |
| Net investment income (loss) | | | 3.17% | | | | 4.25% | | | | 4.17% | | | | 3.98% | | | | | | | | 4.08% | (f) |
| Portfolio turnover rate(g) | | | 257% | | | | 153% | | | | 137% | | | | 113% | | | | | | | | 98% | |
| (a) | Commencement of operations. |
| (b) | Calculated based on average shares outstanding during the period. |
| (c) | Total return is calculated assuming a purchase of a share on the first day and a sale on the last day of each period reported and includes reinvestment of dividends and distributions, if any. Total returns may reflect adjustments to conform to generally accepted accounting principles. Total returns for periods less than one full year are not annualized. |
| (d) | Does not include expenses of the underlying funds in which the Fund invests. |
| (e) | Effective November 1, 2017, class specific expenses include transfer agent fees and expenses and registration fees, which are charged to their respective share class. |
| (g) | The Fund’s portfolio turnover rate is calculated in accordance with regulatory requirements, without regard to transactions involving short-term investments and certain derivatives. If such transactions were included, the Fund’s portfolio turnover rate may be higher. |
See Notes to Financial Statements.
| | | | | | | | | | | | | | | | |
| Class R6 Shares | |
| | | Year Ended October 31, | | | | | | December 28,
2016(a)
through
October 31, | |
| | | 2019 | | | 2018 | | | | | | 2017 | |
| Per Share Operating Performance(b): | | | | | | | | | | | | | | | | |
| Net Asset Value, Beginning of Period | | | $8.76 | | | | $9.62 | | | | | | | | $9.33 | |
| Income (loss) from investment operations: | | | | | | | | | | | | | | | | |
| Net investment income (loss) | | | 0.31 | | | | 0.25 | | | | | | | | 0.31 | |
| Net realized and unrealized gain (loss) on investment and foreign currency transactions | | | 1.98 | | | | (0.52 | ) | | | | | | | 0.38 | |
| Total from investment operations | | | 2.29 | | | | (0.27 | ) | | | | | | | 0.69 | |
| Less Dividends and Distributions: | | | | | | | | | | | | | | | | |
| Dividends from net investment income | | | (0.38 | ) | | | (0.50 | ) | | | | | | | (0.40 | ) |
| Tax return of capital distributions | | | - | | | | (0.09 | ) | | | | | | | - | |
| Total dividends and distributions | | | (0.38 | ) | | | (0.59 | ) | | | | | | | (0.40 | ) |
| Net asset value, end of period | | | $10.67 | | | | $8.76 | | | | | | | | $9.62 | |
| Total Return(c): | | | 26.54% | | | | (2.92 | )% | | | | | | | 7.43% | |
| | | | | | | | | | | | | | | | |
| Ratios/Supplemental Data: | |
| Net assets, end of period (000) | | | $158 | | | | $70 | | | | | | | | $11 | |
| Average net assets (000) | | | $115 | | | | $17 | | | | | | | | $11 | |
| Ratios to average net assets(d)(e): | | | | | | | | | | | | | | | | |
| Expenses after waivers and/or expense reimbursement | | | 1.10% | | | | 1.10% | | | | | | | | 1.10% | (f) |
| Expenses before waivers and/or expense reimbursement | | | 8.55% | | | | 91.97% | | | | | | | | 2.79% | (f) |
| Net investment income (loss) | | | 3.15% | | | | 2.70% | | | | | | | | 3.78% | (f) |
| Portfolio turnover rate(g) | | | 257% | | | | 153% | | | | | | | | 137% | |
| (a) | Commencement of offering. |
| (b) | Calculated based on average shares outstanding during the period. |
| (c) | Total return is calculated assuming a purchase of a share on the first day and a sale on the last day of each period reported and includes reinvestment of dividends and distributions, if any. Total returns may reflect adjustments to conform to generally accepted accounting principles. Total returns for periods less than one full year are not annualized. |
| (d) | Does not include expenses of the underlying funds in which the Fund invests. |
| (e) | Effective November 1, 2017, class specific expenses include transfer agent fees and expenses and registration fees, which are charged to their respective share class. |
| (g) | The Fund’s portfolio turnover rate is calculated in accordance with regulatory requirements, without regard to transactions involving short-term investments and certain derivatives. If such transactions were included, the Fund’s portfolio turnover rate may be higher. |
See Notes to Financial Statements.
| | | | |
| PGIM Real Estate Income Fund | | | 43 | |
Report of Independent Registered Public Accounting Firm
To the Shareholders of PGIM Real Estate Income Fund and Board of Trustees
Prudential Investment Portfolios 9:
Opinion on the Financial Statements
We have audited the accompanying statement of assets and liabilities of PGIM Real Estate Income Fund, a series of Prudential Investment Portfolios 9, (the Fund), including the schedule of investments, as of October 31, 2019, the related statement of operations for the year then ended, the statements of changes in net assets for each of the years in thetwo-year period ended October 31, 2019, and the related notes (collectively, the financial statements) and the financial highlights for the years or periods indicated therein. In our opinion, the financial statements and financial highlights present fairly, in all material respects, the financial position of the Fund as of October 31, 2019, the results of its operations for the year then ended, the changes in its net assets for each of the years in thetwo-year period ended October 31, 2019, and the financial highlights for the years or periods indicated therein, in conformity with U.S. generally accepted accounting principles.
Basis for Opinion
These financial statements and financial highlights are the responsibility of the Fund’s management. Our responsibility is to express an opinion on these financial statements and financial highlights based on our audits. We are a public accounting firm registered with the Public Company Accounting Oversight Board (United States) (PCAOB) and are required to be independent with respect to the Fund in accordance with the U.S. federal securities laws and the applicable rules and regulations of the Securities and Exchange Commission and the PCAOB.
We conducted our audits in accordance with the standards of the PCAOB. Those standards require that we plan and perform the audit to obtain reasonable assurance about whether the financial statements and financial highlights are free of material misstatement, whether due to error or fraud. Our audits included performing procedures to assess the risks of material misstatement of the financial statements and financial highlights, whether due to error or fraud, and performing procedures that respond to those risks. Such procedures included examining, on a test basis, evidence regarding the amounts and disclosures in the financial statements and financial highlights. Such procedures also included confirmation of securities owned as of October 31, 2019, by correspondence with the custodian, transfer agent, and brokers, or by other appropriate auditing procedures when replies were not received. Our audits also included evaluating the accounting principles used and significant estimates made by management, as well as evaluating the overall presentation of the financial statements and financial highlights. We believe that our audits provide a reasonable basis for our opinion.

We have served as the auditor of one or more PGIM and/or Prudential Retail investment companies since 2003.
New York, New York
December 16, 2019
Federal Income Tax Information(unaudited)
For the year ended October 31, 2019, the Fund reports the maximum amount allowable, but not less than 12.20% of the ordinary income dividends paid during the year as qualified dividend income in accordance with Section 854 of the Internal Revenue Code.
In January 2020, you will be advised on IRS Form 1099-DIV or substitute 1099-DIV as to the federal tax status of the dividends received by you in calendar year 2019.
| | | | |
| PGIM Real Estate Income Fund | | | 45 | |
INFORMATION ABOUT BOARD MEMBERS AND OFFICERS (unaudited)
Information about Board Members and Officers of the Fund is set forth below. Board Members who are not deemed to be “interested persons” of the Fund, as defined in the 1940 Act, are referred to as “Independent Board Members.” Board Members who are deemed to be “interested persons” of the Fund are referred to as “Interested Board Members.” The Board Members are responsible for the overall supervision of the operations of the Fund and perform the various duties imposed on the directors of investment companies by the 1940 Act. The Board in turn elects the Officers, who are responsible for administering theday-to-day operations of the Fund.
| | | | | | |
| Independent Board Members | | | | |
| | | | |
Name Date of Birth Position(s) Portfolios Overseen | | Principal Occupation(s) During Past Five Years | | Other Directorships Held During Past Five Years | | Length of
Board Service |
| | | | |
Ellen S. Alberding 3/11/58 Board Member Portfolios Overseen: 96 | | President and Board Member, The Joyce Foundation (charitable foundation) (since 2002); Vice Chair, City Colleges of Chicago (community college system) (2011-2015); Trustee, National Park Foundation (charitable foundation for national park system) (2009-2018); Trustee, Economic Club of Chicago (since 2009); Trustee, Loyola University (since 2018). | | None. | | Since September 2013 |
| | | | |
Kevin J. Bannon 7/13/52 Board Member Portfolios Overseen: 96 | | Retired; Managing Director (April2008-May 2015) and Chief Investment Officer (October 2008-November 2013) of Highmount Capital LLC (registered investment adviser); formerly Executive Vice President and Chief Investment Officer (April 1993-August 2007) of Bank of New York Company; President (May2003-May 2007) of BNY Hamilton Family of Mutual Funds. | | Director of Urstadt Biddle Properties (equity real estate investment trust) (since September 2008). | | Since July 2008 |
PGIM Real Estate Income Fund
| | | | | | |
Independent Board Members | | | | |
| | | | |
Name Date of Birth Position(s) Portfolios Overseen | | Principal Occupation(s) During Past Five Years | | Other Directorships Held During Past Five Years | | Length of
Board Service |
| | | | |
Linda W. Bynoe 7/9/52 Board Member Portfolios Overseen: 96 | | President and Chief Executive Officer (since March 1995) and formerly Chief Operating Officer (December 1989-February 1995) of Telemat Ltd. (management consulting); formerly Vice President (January 1985-June 1989) at Morgan Stanley & Co. (broker-dealer). | | Director of Anixter International, Inc. (communication products distributor) (since January 2006); Director of Northern Trust Corporation (financial services) (since April 2006); Trustee of Equity Residential (residential real estate) (since December 2009). | | Since March 2005 |
| | | | |
Barry H. Evans 11/2/60 Board Member Portfolios Overseen: 95 | | Retired; formerly President (2005 – 2016), Global Chief Operating Officer (2014– 2016), Chief Investment Officer – Global Head of Fixed Income (1998-2014), and various portfolio manager roles (1986-2006), Manulife Asset Management U.S. | | Formerly Director, Manulife Trust Company (2011-2018); formerly Director, Manulife Asset Management Limited (2015-2017); formerly Chairman of the Board of Directors of Manulife Asset Management U.S. (2005-2016); formerly Chairman of the Board, Declaration Investment Management and Research (2008-2016). | | Since September 2017 |
| | | | |
Keith F. Hartstein 10/13/56 Board Member & Independent Chair Portfolios Overseen: 96 | | Retired; Member (since November 2014) of the Governing Council of the Independent Directors Council (organization of independent mutual fund directors); formerly President and Chief Executive Officer (2005-2012), Senior Vice President (2004-2005), Senior Vice President of Sales and Marketing (1997-2004), and various executive management positions (1990-1997), John Hancock Funds, LLC (asset management); Chairman, Investment Company Institute’s Sales Force Marketing Committee (2003-2008). | | None. | | Since September 2013 |
Visit our website at pgiminvestments.com
| | | | | | |
Independent Board Members | | | | |
| | | | |
Name Date of Birth Position(s) Portfolios Overseen | | Principal Occupation(s) During Past Five Years | | Other Directorships Held During Past Five Years | | Length of
Board Service |
| | | | |
Laurie Simon Hodrick 9/29/62 Board Member Portfolios Overseen: 95 | | A. Barton Hepburn Professor Emerita of Economics in the Faculty of Business, Columbia Business School (since 2018); Visiting Professor of Law, Stanford Law School (since 2015); Visiting Fellow at the Hoover Institution, Stanford University (since 2015); Sole Member, ReidCourt LLC (since 2008) (a consulting firm); formerly A. Barton Hepburn Professor of Economics in the Faculty of Business, Columbia Business School (1996-2017); formerly Managing Director, Global Head of Alternative Investment Strategies, Deutsche Bank (2006-2008). | | Independent Director, Synnex Corporation (since April 2019) (information technology); Independent Director, Kabbage, Inc. (since July 2018) (financial services); Independent Director, Corporate Capital Trust (2017-2018) (a business development company). | | Since September 2017 |
| | | | |
Michael S. Hyland, CFA 10/4/45 Board Member Portfolios Overseen: 96 | | Retired (since February 2005); formerly Senior Managing Director (July 2001-February 2005) of Bear Stearns & Co, Inc.; Global Partner, INVESCO (1999-2001); Managing Director and President of Salomon Brothers Asset Management (1989-1999). | | None. | | Since July 2008 |
| | | | |
Brian K. Reid 9/22/61 Board Member Portfolios Overseen: 95 | | Retired; formerly Chief Economist for the Investment Company Institute (ICI) (2005-2017); formerly Senior Economist and Director of Industry and Financial Analysis at the ICI (1998-2004); formerly Senior Economist, Industry and Financial Analysis at the ICI (1996-1998); formerly Staff Economist at the Federal Reserve Board (1989-1996); Director, ICI Mutual Insurance Company (2012-2017). | | None. | | Since March 2018 |
PGIM Real Estate Income Fund
| | | | | | |
| Independent Board Members | | | | |
| | | | |
Name Date of Birth Position(s) Portfolios Overseen | | Principal Occupation(s) During Past Five Years | | Other Directorships Held During Past Five Years | | Length of Board Service |
| | | | |
Grace C. Torres 6/28/59 Board Member Portfolios Overseen: 95 | | Retired; formerly Treasurer and Principal Financial and Accounting Officer of the PGIM Funds, Target Funds, Advanced Series Trust, Prudential Variable Contract Accounts and The Prudential Series Fund (1998-June 2014); Assistant Treasurer (March 1999-June 2014) and Senior Vice President (September 1999-June 2014) of PGIM Investments LLC; Assistant Treasurer (May 2003-June 2014) and Vice President (June 2005-June 2014) of AST Investment Services, Inc.; Senior Vice President and Assistant Treasurer (May 2003-June 2014) of Prudential Annuities Advisory Services, Inc. | | Formerly Director (July 2015-January 2018) of Sun Bancorp, Inc. N.A. and Sun National Bank; Director (since January 2018) of OceanFirst Financial Corp. and OceanFirst Bank. | | Since November 2014 |
| | | | | | |
| Interested Board Members | | | | |
| | | | |
Name Date of Birth Position(s) Portfolios Overseen | | Principal Occupation(s) During Past Five Years | | Other Directorships Held During Past Five Years | | Length of Board Service |
| | | | |
Stuart S. Parker 10/5/62 Board Member & President Portfolios Overseen: 96 | | President of PGIM Investments LLC (formerly known as Prudential Investments LLC) (since January 2012); Executive Vice President of Prudential Investment Management Services LLC (since December 2012); formerly Executive Vice President of Jennison Associates LLC and Head of Retail Distribution of PGIM Investments LLC (June 2005-December 2011). | | None. | | Since January 2012 |
Visit our website at pgiminvestments.com
| | | | | | |
| Interested Board Members | | | | |
| | | | |
Name Date of Birth Position(s) Portfolios Overseen | | Principal Occupation(s) During Past Five Years | | Other Directorships Held During Past Five Years | | Length of Board Service |
| | | | |
Scott E. Benjamin 5/21/73 Board Member & Vice President Portfolios Overseen:96 | | Executive Vice President (since June 2009) of PGIM Investments LLC; Executive Vice President (June 2009-June 2012) and Vice President (since June 2012) of Prudential Investment Management Services LLC; Executive Vice President (since September 2009) of AST Investment Services, Inc.; Senior Vice President of Product Development and Marketing, PGIM Investments (since February 2006); formerly Vice President of Product Development and Product Management, PGIM Investments LLC (2003-2006). | | None. | | Since March 2010 |
| | | | |
| Fund Officers(a) | | | | |
| | | |
Name Date of Birth Fund Position | | Principal Occupation(s) During Past Five Years | | Length of
Service as Fund
Officer |
| | | |
Raymond A. O’Hara 9/11/55 Chief Legal Officer | | Vice President and Corporate Counsel (since July 2010) of Prudential Insurance Company of America (Prudential); Vice President (March 2011-Present) of Pruco Life Insurance Company and Pruco Life Insurance Company of New Jersey; Vice President and Corporate Counsel (March 2011-Present) of Prudential Annuities Life Assurance Corporation; Chief Legal Officer of PGIM Investments LLC (since June 2012); Chief Legal Officer of Prudential Mutual Fund Services LLC (since June 2012) and Corporate Counsel of AST Investment Services, Inc. (since June 2012); formerly Assistant Vice President and Corporate Counsel (September 2008-July 2010) of The Hartford Financial Services Group, Inc.; formerly Associate (September 1980-December 1987) and Partner (January 1988–August 2008) of Blazzard & Hasenauer, P.C. (formerly, Blazzard, Grodd & Hasenauer, P.C.). | | Since June 2012 |
PGIM Real Estate Income Fund
| | | | |
| Fund Officers(a) | | | | |
| | | |
Name Date of Birth Fund Position | | Principal Occupation(s) During Past Five Years | | Length of
Service as Fund
Officer |
| | | |
Dino Capasso 8/19/74 Chief Compliance Officer | | Chief Compliance Officer (July 2019-Present) of PGIM Investments LLC; Chief Compliance Officer (July 2019-Present) of the PGIM Funds, Target Funds, Advanced Series Trust, The Prudential Series Fund, Prudential’s Gibraltar Fund, Inc., PGIM Global High Yield Fund, Inc., and PGIM High Yield Bond Fund, Inc.; Vice President and Deputy Chief Compliance Officer (June 2017-2019) of PGIM Investments LLC; formerly, Senior Vice President and Senior Counsel (January 2016-June 2017), and Vice President and Counsel (February 2012-December 2015) of Pacific Investment Management Company LLC. | | Since March 2018 |
| | | |
Andrew R. French 12/22/62 Secretary | | Vice President of PGIM Investments LLC (December 2018-Present); formerly Vice President and Corporate Counsel (February 2010-December 2018) of Prudential; formerly Director and Corporate Counsel (2006-2010) of Prudential; Vice President and Assistant Secretary (since January 2007) of PGIM Investments LLC; Vice President and Assistant Secretary (since January 2007) of Prudential Mutual Fund Services LLC. | | Since October 2006 |
| | | |
Jonathan D. Shain 8/9/58 Assistant Secretary | | Vice President and Corporate Counsel (since August 1998) of Prudential; Vice President and Assistant Secretary (since May 2001) of PGIM Investments LLC; Vice President and Assistant Secretary (since February 2001) of Prudential Mutual Fund Services LLC; formerly Vice President and Assistant Secretary (May 2003-June 2005) of AST Investment Services, Inc. | | Since May 2005 |
| | | |
Claudia DiGiacomo 10/14/74 Assistant Secretary | | Vice President and Corporate Counsel (since January 2005) of Prudential; Vice President and Assistant Secretary of PGIM Investments LLC (since December 2005); formerly Associate at Sidley Austin Brown & Wood LLP (1999-2004). | | Since December 2005 |
| | | |
Diana N. Huffman 4/14/82 Assistant Secretary | | Vice President and Corporate Counsel (since September 2015) of Prudential; formerly Associate at Willkie Farr & Gallagher LLP (2009-2015). | | Since March 2019 |
| | | |
Kelly A. Coyne 8/8/68 Assistant Secretary | | Director, Investment Operations of Prudential Mutual Fund Services LLC (since 2010). | | Since March 2015 |
| | | |
Christian J. Kelly 5/5/75 Treasurer and Principal Financial and Accounting Officer | | Vice President, Head of Fund Administration of PGIM Investments LLC (since November 2018); formerly, Director of Fund Administration of Lord Abbett & Co. LLC (2009-2018), Treasurer and Principal Accounting Officer of the Lord Abbett Family of Funds (2017-2018); Director of Accounting, Avenue Capital Group (2008-2009); Senior Manager, Investment Management Practice of Deloitte & Touche LLP (1998-2007). | | Since January 2019 |
Visit our website at pgiminvestments.com
| | | | |
| Fund Officers(a) | | | | |
| | | |
Name Date of Birth Fund Position | | Principal Occupation(s) During Past Five Years | | Length of Service as Fund Officer |
| | | |
Lana Lomuti 6/7/67 Assistant Treasurer | | Vice President (since 2007) and Director (2005-2007), within PGIM Investments Fund Administration; formerly Assistant Treasurer (December 2007-February 2014) of The Greater China Fund, Inc. | | Since April 2014 |
| | | |
Russ Shupak 10/08/73 Assistant Treasurer | | Vice President (since 2017) and Director (2013-2017), within PGIM Investments Fund Administration. | | Since October 2019 |
| | | |
Deborah Conway 3/26/69 Assistant Treasurer | | Vice President (since 2017) and Director (2007-2017), within PGIM Investments Fund Administration. | | Since October 2019 |
| | | |
Elyse M. McLaughlin 1/20/74 Assistant Treasurer | | Vice President (since 2017) and Director (2011-2017), within PGIM Investments Fund Administration. | | Since October 2019 |
| | | |
Charles H. Smith 1/11/73 Anti-Money Laundering Compliance Officer | | Vice President, Corporate Compliance, Anti-Money Laundering Unit (since January 2015) of Prudential; committee member of the American Council of Life Insurers Anti-Money Laundering and Critical Infrastructure Committee (since January 2016); formerly Global Head of Economic Sanctions Compliance at AIG Property Casualty (February 2007-December 2014); Assistant Attorney General at the New York State Attorney General’s Office, Division of Public Advocacy. (August 1998-January 2007). | | Since January 2017 |
(a) Excludes Mr. Parker and Mr. Benjamin, interested Board Members who also serve as President and Vice President, respectively.
Explanatory Notes to Tables:
| ∎ | | Board Members are deemed to be “Interested,” as defined in the 1940 Act, by reason of their affiliation with PGIM Investments LLC and/or an affiliate of PGIM Investments LLC. |
| ∎ | | Unless otherwise noted, the address of all Board Members and Officers is c/o PGIM Investments LLC, 655 Broad Street, Newark, New Jersey 07102-4410. |
| ∎ | | There is no set term of office for Board Members or Officers. The Board Members have adopted a retirement policy, which calls for the retirement of Board Members on December 31 of the year in which they reach the age of 75. |
| ∎ | | “Other Directorships Held” includes only directorships of companies required to register or file reports with the SEC under the 1934 Act (that is, “public companies”) or other investment companies registered under the 1940 Act. |
| ∎ | | “Portfolios Overseen” includes all investment companies managed by PGIM Investments LLC. The investment companies for which PGIM Investments LLC serves as manager include the PGIM Funds, The Prudential Variable Contract Accounts, PGIM ETF Trust, PGIM High Yield Bond Fund, Inc., PGIM Global High Yield Fund, Inc., The Prudential Series Fund, Prudential’s Gibraltar Fund, Inc. and the Advanced Series Trust. |
PGIM Real Estate Income Fund
Approval of Advisory Agreements(unaudited)
The Fund’s Board of Trustees
The Board of Trustees (the “Board”) of PGIM Real Estate Income Fund (the “Fund”)1 consists of eleven individuals, nine of whom are not “interested persons” of the Fund, as defined in the Investment Company Act of 1940, as amended (the “1940 Act”) (the “Independent Trustees”).2 The Board is responsible for the oversight of the Fund and its operations, and performs the various duties imposed on the directors of investment companies by the 1940 Act. The Independent Trustees have retained independent legal counsel to assist them in connection with their duties. The Chair of the Board is an Independent Trustee. The Board has established four standing committees: the Audit Committee, the Nominating and Governance Committee, and two Investment Committees. Each committee is chaired by, and composed of, Independent Trustees.
Annual Approval of the Fund’s Advisory Agreements
As required under the 1940 Act, the Board determines annually whether to renew the Fund’s management agreement with PGIM Investments LLC (“PGIM Investments”) and the Fund’s subadvisory agreement with PGIM, Inc. (“PGIM”) on behalf of its PGIM Real Estate unit. In considering the renewal of the agreements, the Board, including all of the Independent Trustees, met on May 30, 2019 and on June11-13, 2019 and approved the renewal of the agreements through July 31, 2020, after concluding that the renewal of the agreements was in the best interests of the Fund and its shareholders.
In advance of the meetings, the Board requested and received materials relating to the agreements, and had the opportunity to ask questions and request further information in connection with its consideration. Among other things, the Board considered comparative fee information from PGIM Investments and PGIM. Also, the Board considered comparisons with other mutual funds in relevant Peer Universes and Peer Groups, as is further discussed below.
In approving the agreements, the Board, including the Independent Trustees advised by independent legal counsel, considered the factors it deemed relevant, including the nature, quality and extent of services provided by PGIM Investments and the subadviser, the performance of the Fund, the profitability of PGIM Investments and its affiliates, expenses and fees, and the potential for economies of scale that may be shared with the Fund and its shareholders as the Fund’s assets grow. In their deliberations, the Trustees did not identify any single factor which alone was responsible for the Board’s decision to approve the agreements with respect to the Fund. In connection with its deliberations, the Board considered information provided by PGIM Investments throughout the year at regular Board
| 1 | PGIM Real Estate Income Fund is a series of Prudential Investment Portfolios 9. |
| 2 | Grace C. Torres was an Interested Trustee of the Fund at the time the Board considered and approved the renewal of the Fund’s advisory agreements, but has since become an Independent Trustee of the Fund. |
| | |
| PGIM Real Estate Income Fund |
Approval of Advisory Agreements(continued)
meetings, presentations from portfolio managers and other information, as well as information furnished at or in advance of the meetings on May 30, 2019 and onJune 11-13, 2019.
The Trustees determined that the overall arrangements between the Fund and PGIM Investments, which serves as the Fund’s investment manager pursuant to a management agreement, and between PGIM Investments and PGIM, which, through its PGIM Real Estate unit, serves as the Fund’s subadviser pursuant to the terms of a subadvisory agreement with PGIM Investments, are in the best interests of the Fund and its shareholders in light of the services performed, fees charged and such other matters as the Trustees considered relevant in the exercise of their business judgment.
The material factors and conclusions that formed the basis for the Trustees’ reaching their determinations to approve the continuance of the agreements are separately discussed below.
Nature, Quality and Extent of Services
The Board received and considered information regarding the nature, quality and extent of services provided to the Fund by PGIM Investments and PGIM Real Estate. The Board noted that PGIM Real Estate is affiliated with PGIM Investments. The Board considered the services provided by PGIM Investments, including but not limited to the oversight of the subadviser for the Fund, as well as the provision of fund recordkeeping, compliance and other services to the Fund and PGIM Investments’ role as the administrator for the Fund’s liquidity risk management program. With respect to PGIM Investments’ oversight of the subadviser, the Board noted that PGIM Investments’ Strategic Investment Research Group (“SIRG”), which is a business unit of PGIM Investments, is responsible for monitoring and reporting to PGIM Investments’ senior management on the performance and operations of the subadviser. The Board also considered that PGIM Investments pays the salaries of all of the officers and interested Trustees of the Fund who are part of Fund management. The Board also considered the investment subadvisory services provided by PGIM Real Estate, including investment research and security selection, as well as adherence to the Fund’s investment restrictions and compliance with applicable Fund policies and procedures. The Board considered PGIM Investments’ evaluation of the subadviser, as well as PGIM Investments’ recommendation, based on its review of the subadviser, to renew the subadvisory agreement.
The Board considered the qualifications, backgrounds and responsibilities of PGIM Investments’ senior management responsible for the oversight of the Fund and PGIM Real Estate, and also considered the qualifications, backgrounds and responsibilities of PGIM Real Estate’s portfolio managers who are responsible for theday-to-day management of the
| | |
| Visit our website at pgiminvestments.com | | |
Fund’s portfolio. The Board was provided with information pertaining to PGIM Investments’, PGIM Real Estate’s, and PGIM’s organizational structure, senior management, investment operations, and other relevant information pertaining to PGIM Investments, PGIM Real Estate, and PGIM. The Board also noted that it received favorable compliance reports from the Fund’s Chief Compliance Officer (“CCO”) as to PGIM Investments, PGIM Real Estate, and PGIM.
The Board concluded that it was satisfied with the nature, extent and quality of the investment management services provided by PGIM Investments and the subadvisory services provided to the Fund by PGIM Real Estate, and that there was a reasonable basis on which to conclude that the Fund benefits from the services provided by PGIM Investments and PGIM Real Estate under the management and subadvisory agreements.
Costs of Services and Profits Realized by PGIM Investments
The Board was provided with information on the profitability of PGIM Investments and its affiliates in serving as the Fund’s investment manager. The Board discussed with PGIM Investments the methodology utilized in assembling the information regarding profitability and considered its reasonableness. The Board recognized that it is difficult to make comparisons of profitability from fund management contracts because comparative information is not generally publicly available and is affected by numerous factors, including the structure of the particular adviser, the types of funds it manages, its business mix, numerous assumptions regarding allocations and the adviser’s capital structure and cost of capital. However, the Board considered that the cost of services provided by PGIM Investments to the Fund during the year ended December 31, 2018 exceeded the management fees paid by the Fund, resulting in an operating loss to PGIM Investments. Taking these factors into account, the Board concluded that the profitability of PGIM Investments and its affiliates in relation to the services rendered was not unreasonable.
Economies of Scale
The Board received and discussed information concerning economies of scale that PGIM Investments may realize as the Fund’s assets grow beyond current levels. The Board noted that the management fee schedule for the Fund includes breakpoints, which have the effect of decreasing the fee rate as assets increase. During the course of time, the Board has considered information regarding the launch date of the Fund, the management fees of the Fund compared to those of similarly managed funds and PGIM Investments’ investment in the Fund over time. The Board noted that economies of scale can be shared with the Fund in other ways, including low management fees from inception, additional technological and personnel investments to enhance shareholder services, and maintaining existing expense structures in the face of a rising cost environment. The Board also
| | |
| PGIM Real Estate Income Fund |
Approval of Advisory Agreements(continued)
considered PGIM Investments’ assertion that it continually evaluates the management fee schedule of the Fund and the potential to share economies of scale through breakpoints or fee waivers as asset levels increase.
The Board recognized the inherent limitations of any analysis of economies of scale, stemming largely from the Board’s understanding that most of PGIM Investments’ costs are not specific to individual funds, but rather are incurred across a variety of products and services.
Other Benefits to PGIM Investments and PGIM Real Estate
The Board considered potential ancillary benefits that might be received by PGIM Investments, PGIM Real Estate and their affiliates as a result of their relationship with the Fund. The Board concluded that potential benefits to be derived by PGIM Investments included transfer agency fees received by the Fund’s transfer agent (which is affiliated with PGIM Investments), and benefits to its reputation as well as other intangible benefits resulting from PGIM Investments’ association with the Fund. The Board concluded that the potential benefits to be derived by PGIM Real Estate included its ability to use soft dollar credits, as well as the potential benefits consistent with those generally resulting from an increase in assets under management, specifically, potential access to additional research resources and benefits to its reputation. The Board concluded that the benefits derived by PGIM Investments and PGIM Real Estate were consistent with the types of benefits generally derived by investment managers and subadvisers to mutual funds.
Performance of the Fund / Fees and Expenses
The Board considered certain additional factors and made related conclusions relating to the historical performance of the Fund for theone- and three-year periods ended December 31, 2018. The Board considered that the Fund commenced operations on June 3, 2015 and that longer-term performance was not yet available.
The Board also considered the Fund’s actual management fee, as well as the Fund’s net total expense ratio, for the fiscal year ended October 31, 2018. The Board considered the management fee for the Fund as compared to the management fee charged by PGIM Investments to other funds and the fee charged by other advisers to comparable mutual funds in a Peer Group. The actual management fee represents the fee rate actually paid by Fund shareholders and includes any fee waivers or reimbursements. The net total expense ratio for the Fund represents the actual expense ratio incurred by Fund shareholders.
The mutual funds included in the Peer Universe, which was used to consider performance, and the Peer Group, which was used to consider expenses and fees, were objectively
| | |
| Visit our website at pgiminvestments.com | | |
determined by Broadridge, an independent provider of mutual fund data. In certain circumstances, PGIM Investments also provided supplemental Peer Universe or Peer Group information for reasons addressed with the Board. The comparisons placed the Fund in various quartiles over various periods, with the first quartile being the best 25% of the mutual funds (for performance, the best performing mutual funds and, for expenses, the lowest cost mutual funds).
The section below summarizes key factors considered by the Board and the Board’s conclusions regarding the Fund’s performance, fees and overall expenses. The table sets forth net performance comparisons (which reflect the impact on performance of fund expenses, or any subsidies, expense caps or waivers that may be applicable) with the Peer Universe, actual management fees with the Peer Group (which reflect the impact of any subsidies or fee waivers), and net total expenses with the Peer Group, each of which were key factors considered by the Board.
| | | | | | | | |
| Net Performance | | 1 Year | | 3 Years | | 5 Years | | 10 Years |
| | 4th Quartile | | 3rd Quartile | | N/A | | N/A |
| Actual Management Fees:1st Quartile |
| Net Total Expenses: 1st Quartile |
| • | | The Board noted that the Fund underperformed its benchmark index over all periods. |
| • | | The Board considered PGIM Investments’ assertion that the Fund’s focus on providing an attractive yield for investors, and the Fund’s corresponding focus on higher yielding securities in comparison to the funds in the Peer Universe, rendered peer relative comparisons less useful. In this regard, the Board noted information provided by PGIM Investments indicating that the Fund’s12-month yield as of December 31, 2018 placed the Fund in the top 5% of all funds in the Peer Universe. |
| • | | The Board also considered that the Fund outperformed its benchmark index over theone- and three-year periods and ranked in the first and second quartile of its Peer Universe over theone- and three-year periods, respectively, ended March 31, 2019. |
| • | | The Board considered that the Fund commenced investment operations on June 3, 2015 and that longer-term performance was not yet available. |
| • | | The Board and PGIM Investments agreed to retain the Fund’s existing contractual expense cap, which (exclusive of certain fees and expenses) caps the Fund’s annual operating expenses at 1.35% for Class A shares, 2.10% for Class C shares, 1.10% for Class R6 shares, and 1.10% for Class Z shares through February 29, 2020. |
| • | | In addition, PGIM Investments will waive management fees or shared operating expenses on any share class to the same extent that it waives such expenses on any other share class, and has agreed that total annual fund operating expenses for Class R6 shares will not exceed total annual fund operating expenses for Class Z shares. |
| | |
| PGIM Real Estate Income Fund |
Approval of Advisory Agreements(continued)
| • | | The Board concluded that in light of the above, it would be in the best interests of the Fund and its shareholders to continue to allow the Fund to create a longer-term performance record and to renew the agreements. |
| • | | The Board concluded that the management fees (including subadvisory fees) and total expenses were reasonable in light of the services provided. |
* * *
After full consideration of these factors, the Board concluded that the approval of the agreements was in the best interests of the Fund and its shareholders.
| | |
| Visit our website at pgiminvestments.com | | |
| | | | |
| | |
| ∎ MAIL | | ∎ TELEPHONE | | ∎ WEBSITE |
655 Broad Street Newark, NJ 07102 | | (800) 225-1852 | | pgiminvestments.com |
|
| PROXY VOTING |
| The Board of Trustees of the Fund has delegated to the Fund’s subadviser the responsibility for voting any proxies and maintaining proxy recordkeeping with respect to the Fund. A description of these proxy voting policies and procedures is available without charge, upon request, by calling (800) 225-1852. Information regarding how the Fund voted proxies relating to portfolio securities during the most recent 12-month period ended June 30 is available on the Fund’s website and on the Securities and Exchange Commission’s website. |
|
| TRUSTEES |
| Ellen S. Alberding• Kevin J. Bannon• Scott E. Benjamin• Linda W. Bynoe• Barry H. Evans• Keith F. Hartstein • Laurie Simon Hodrick• Michael S. Hyland• Stuart S. Parker• Brian K. Reid• Grace C. Torres |
|
| OFFICERS |
Stuart S. Parker,President• Scott E. Benjamin,Vice President• Christian J. Kelly,Treasurer and Principal Financial and Accounting Officer• Raymond A. O’Hara,Chief Legal Officer• Dino Capasso,Chief Compliance Officer• Charles H. Smith,Anti-Money Laundering Compliance Officer• Andrew R. French,Secretary• Jonathan D. Shain,Assistant Secretary• Claudia DiGiacomo,Assistant Secretary• Diana N. Huffman,Assistant Secretary• Kelly A. Coyne,Assistant Secretary• Lana Lomuti,Assistant Treasurer• Russ Shupak,Assistant Treasurer• Elyse McLaughlin,Assistant Treasurer• Deborah Conway,Assistant Treasurer |
| | | | |
| MANAGER | | PGIM Investments LLC | | 655 Broad Street
Newark, NJ 07102 |
|
| SUBADVISER | | PGIM Real Estate | | 7 Giralda Farms
Madison, NJ 07940 |
|
| DISTRIBUTOR | | Prudential Investment
Management Services LLC | | 655 Broad Street
Newark, NJ 07102 |
|
| CUSTODIAN | | The Bank of New York Mellon | | 240 Greenwich Street
New York, NY 10286 |
|
| TRANSFER AGENT | | Prudential Mutual Fund
Services LLC | | PO Box 9658
Providence, RI 02940 |
|
INDEPENDENT REGISTERED
PUBLIC ACCOUNTING FIRM | | KPMG LLP | | 345 Park Avenue
New York, NY 10154 |
|
| FUND COUNSEL | | Willkie Farr & Gallagher LLP | | 787 Seventh Avenue
New York, NY 10019 |
|
|
| An investor should consider the investment objectives, risks, charges, and expenses of the Fund carefully before investing. The prospectus and summary prospectus contain this and other information about the Fund. An investor may obtain the prospectus and summary prospectus by visiting our website atpgiminvestments.com or by calling(800) 225-1852. The prospectus and summary prospectus should be read carefully before investing. |
|
| E-DELIVERY |
| To receive your mutual fund documents online, go topgiminvestments.com/edelivery and enroll. Instead of receiving printed documents by mail, you will receive notification via email when new materials are available. You can cancel your enrollment or change your email address at any time by visiting the website address above. |
|
| SHAREHOLDER COMMUNICATIONS WITH TRUSTEES |
| Shareholders can communicate directly with the Board of Trustees by writing to the Chair of the Board, PGIM Real Estate Income Fund, PGIM Investments, Attn: Board of Trustees, 655 Broad Street, Newark, NJ 07102. Shareholders can communicate directly with an individual Trustee by writing to the same address. Communications are not screened before being delivered to the addressee. |
|
| AVAILABILITY OF PORTFOLIO HOLDINGS |
| The Fund files its complete schedule of portfolio holdings with the Securities and Exchange Commission on Form N-PORT. The Fund’s Form N-PORT filings are available on the Commission’s website at sec.gov. Form N-PORT is filed with the Commission quarterly, and each Fund’s full portfolio holdings as of the first and third fiscal quarter-ends (as of the third month of the Fund’s fiscal quarter for reporting periods on or after September 30, 2019) will be made publicly available 60 days after the end of each quarter at sec.gov. |
|
| The Fund’s Statement of Additional Information contains additional information about the Fund’s Trustees and is available without charge, upon request, by calling (800) 225-1852. |
Mutual Funds:
| | | | |
ARE NOT INSURED BY THE FDIC OR ANY
FEDERAL GOVERNMENT AGENCY | | MAY LOSE VALUE | | ARE NOT A DEPOSIT OF OR GUARANTEED
BY ANY BANK OR ANY BANK AFFILIATE |
PGIM REAL ESTATE INCOME FUND
| | | | | | | | |
| SHARE CLASS | | A | | C | | Z | | R6 |
| NASDAQ | | PRKAX | | PRKCX | | PRKZX | | PRKQX |
| CUSIP | | 74441J761 | | 74441J753 | | 74441J746 | | 74441J670 |
MF228E

PGIM SELECT REAL ESTATE FUND
ANNUAL REPORT
OCTOBER 31, 2019
COMING SOON: PAPERLESS SHAREHOLDER REPORTS
Beginning on January 1, 2021, as permitted by regulations adopted by the Securities and Exchange Commission, paper copies of the Fund’s annual and semiannual shareholder reports will no longer be sent by mail, unless you specifically request paper copies of the reports. Instead, the reports will be made available on the Fund’s website (pgiminvestments.com), and you will be notified by mail each time a report is posted and provided with a website link to access the report.
If you already elected to receive shareholder reports electronically, you will not be affected by this change and you need not take any action. You may elect to receive shareholder reports and other communications from the Fund electronically anytime by contacting your financial intermediary (such as a broker-dealer or bank) or, if you are a direct investor, by calling 1-800-225-1852 or by sending an email request to PGIM Investments at shareholderreports@pgim.com.
You may elect to receive all future reports in paper free of charge. If you invest through a financial intermediary, you can contact your financial intermediary or follow instructions included with this notice to elect to continue to receive paper copies of your shareholder reports. If you invest directly with the Fund, you can call 1-800-225-1852 or send an email request to shareholderreports@pgim.com to let the Fund know you wish to continue receiving paper copies of your shareholder reports. Your election to receive reports in paper will apply to all funds held in your account if you invest through your financial intermediary or all funds held with the fund complex if you invest directly with the Fund.

To enroll in e-delivery, go to pgiminvestments.com/edelivery
|
| Objective:Capital appreciation and income |
Highlights(unaudited)
| | • | | The Fund outperformed the FTSE EPRA/NAREIT Developed Index during the reporting period. All three regions represented in the Fund (North America, Europe, and Asia) outperformed on a relative basis, with North America being the main driver of outperformance. Security selection across all regions was notably positive while asset allocation had a marginally favorable impact. |
| | • | | Within North America, several factors were responsible for the outperformance, including favorable security selection and an overweight position to the industrial sector, positive stock selection in health care, an underweight position to the mall sector, and favorable security selection and an underweight position to the hotels sector. The shopping center, specialty housing, office, and Triple net sectors also outperformed on a relative basis due to positive stock picking. |
| | • | | Europe performed well on a relative basis, largely due to positive stock selection in the UK and Germany. The Fund’s underweight position to France also contributed to relative performance. No individual country within the region meaningfully detracted from relative performance for the period. |
| | • | | Asia also outperformed relative to the Index. Despite unfavorable security selection in Japan, the region performed well due to the positive impact of favorable security selection in Australia, Hong Kong, and Singapore. |
This report is not authorized for distribution to prospective investors unless preceded or accompanied by a current prospectus.
The views expressed in this report and information about the Fund’s portfolio holdings are for the period covered by this report and are subject to change thereafter.
Mutual funds are distributed by Prudential Investment Management Services LLC (PIMS), member SIPC. PGIM Real Estate is a unit of PGIM, Inc. (PGIM), a registered investment adviser. PIMS and PGIM are Prudential Financial companies.© 2019 Prudential Financial, Inc. and its related entities. PGIM Real Estate, PGIM, and the PGIM logo are service marks of Prudential Financial, Inc. and its related entities, registered in many jurisdictions worldwide.
| | |
| 2 | | Visit our website at pgiminvestments.com |
Table of Contents
| | | | |
| PGIM Select Real Estate Fund | | | 3 | |
This Page Intentionally Left Blank
Letter from the President

Dear Shareholder:
We hope you find the annual report for the PGIM Select Real Estate Fund informative and useful. The report covers performance for the 12-month period that ended October 31, 2019.
While the US economy remained healthy, with rising corporate profits and strong job growth, the Federal Reserve cut interest rates three times in the latter half of the period. The cuts were a proactive attempt by the Fed to extend the longest domestic economic expansion on record as growth in many regions weakened. China in particular showed signs of slowing amid trade tensions with the US, and turmoil in the United Kingdom continued as it negotiates an exit from the European Union.
The interest-rate cuts helped boost the performance of stocks globally. For the period overall, large-cap US equities along with stocks in developed and emerging foreign markets all rose by double digits. Small-cap US stocks posted a single-digit gain. This positive performance came despite significant volatility early in the period. Equities plunged at the end of 2018 on concerns about China’s economy, a potential global trade war, higher interest rates, and worries that profit growth might slow. Stocks reversed course early in 2019, rising sharply after the Fed moderated its position on additional rate hikes for the remainder of the year.
The overall US bond market posted strong returns during the period on a significant rally in interest rates that saw the 10-year US Treasury yield decline from over 3% to under 2%. Investment-grade corporate bonds led the way with a double-digit gain, while corporate high yield and municipal bonds each had a return in the high single digits. Globally, bonds in developed markets delivered strong returns, and emerging markets debt rose by double digits.
Regarding your investments with PGIM, we believe it is important to maintain a diversified portfolio of funds consistent with your tolerance for risk, time horizon, and financial goals. Your financial advisor can help you create a diversified investment plan that may include funds covering all the basic asset classes and that reflects your personal investor profile and risk tolerance. However, diversification and asset allocation strategies do not assure a profit or protect against loss in declining markets.
At PGIM Investments, we consider it a great privilege and responsibility to help investors participate in opportunities across global markets while meeting their toughest investment challenges. PGIM is a top-10 global investment manager with more than $1 trillion in assets under management. This scale and investment expertise allow us to deliver actively managed funds and strategies to meet the needs of investors around the globe.
Thank you for choosing our family of funds.
Sincerely,

Stuart S. Parker, President
PGIM Select Real Estate Fund
December 16, 2019
| | | | |
| PGIM Select Real Estate Fund | | | 5 | |
Your Fund’s Performance(unaudited)
Performance data quoted represents past performance. Past performance does not guarantee future results. The investment return and principal value of an investment will fluctuate, so that an investor’s shares, when redeemed, may be worth more or less than their original cost. Current performance may be lower or higher than the past performance data quoted. An investor may obtain performance data as of the most recent month-end by visiting our website atpgiminvestments.com or by calling (800) 225-1852.
| | | | | | |
| |
| | | Average Annual Total Returns as of 10/31/19
(with sales charges) |
| | | One Year (%) | | Five Years (%) | | Since Inception (%) |
| Class A | | 25.34 | | 7.55 | | 7.78 (8/1/14) |
| Class C | | 30.59 | | 7.93 | | 8.11 (8/1/14) |
| Class Z | | 33.02 | | 9.03 | | 9.21 (8/1/14) |
| Class R6 | | 33.02 | | 9.02 | | 9.20 (8/1/14) |
| FTSE EPRA/NAREIT Developed Index |
| | 20.29 | | 5.97 | | 5.96 |
| S&P 500 Index | | | | | | |
| | | 14.31 | | 10.77 | | 11.27 |
| | | | | | | | |
| | | | | | | | |
| |
| | | Average Annual Total Returns as of 10/31/19
(without sales charges) | |
| | | One Year (%) | | Five Years (%) | | Since Inception (%) | |
| Class A | | 32.64 | | 8.77 | | | 8.95 (8/1/14) | |
| Class C | | 31.59 | | 7.93 | | | 8.11 (8/1/14) | |
| Class Z | | 33.02 | | 9.03 | | | 9.21 (8/1/14) | |
| Class R6 | | 33.02 | | 9.02 | | | 9.20 (8/1/14) | |
| FTSE EPRA/NAREIT Developed Index | | | | | | | | |
| | 20.29 | | 5.97 | | | 5.96 | |
| S&P 500 Index | | | | | | | | |
| | | 14.31 | | 10.77 | | | 11.27 | |
| | |
| 6 | | Visit our website at pgiminvestments.com |
Growth of a $10,000 Investment(unaudited)
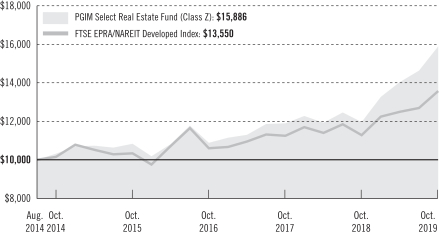
The graph compares a $10,000 investment in the Fund’s Class Z shares with a similar investment in the FTSE EPRA/NAREIT Developed Index, by portraying the initial account values at the commencement of operations for Class Z shares (August 1, 2014) and the account values at the end of the current fiscal year (October 31, 2019) as measured on a quarterly basis. For purposes of the graph, and unless otherwise indicated, it has been assumed that (a) all recurring fees (including management fees) were deducted; and (b) all dividends and distributions were reinvested. The line graph provides information for Class Z shares only. As indicated in the tables provided earlier, performance for other share classes will vary due to the differing charges and expenses applicable to each share class (as indicated in the following paragraphs). Without waiver of fees and/or expense reimbursements, if any, the Fund’s returns would have been lower.
Past performance does not predict future performance. Total returns and the ending account values in the graph include changes in share price and reinvestment of dividends and capital gains distributions in a hypothetical investment for the periods shown. The Fund’s total returns do not reflect the deduction of income taxes on an individual’s investment. Taxes may reduce your actual investment returns on income or gains paid by the Fund or any gains you may realize if you sell your shares.
Source: PGIM Investments LLC and Lipper Inc.
Since Inception returns are provided since the Fund has less than 10 fiscal years of returns. Since Inception returns for the Indexes are measured from the closest month-end to the Fund’s inception date.
| | | | |
| PGIM Select Real Estate Fund | | | 7 | |
Your Fund’s Performance(continued)
The returns in the tables do not reflect the deduction of taxes that a shareholder would pay on Fund distributions or following the redemption of Fund shares. The average annual total returns take into account applicable sales charges, which are described for each share class in the table below.
| | | | | | | | |
| | | | | |
| | | Class A | | Class C | | Class Z | | Class R6 |
| Maximum initial sales charge | | 5.50% of the public offering price | | None | | None | | None |
| Contingent deferred sales charge (CDSC) (as a percentage of the lower of the original purchase price or the net asset value at redemption) | | 1.00% on sales of $1 million or more made within 12 months of purchase | | 1.00% on sales made within 12 months of purchase | | None | | None |
| Annual distribution and service (12b-1) fees (shown as a percentage of average daily net assets) | | 0.30% (0.25% currently) | | 1.00% | | None | | None |
Benchmark Definitions
FTSE EPRA/NAREIT Developed Index—The Financial Times Stock Exchange European Public Real Estate Association/National Association of Real Estate Investment Trusts (FTSE EPRA/NAREIT) Developed Index reflects the stock performance of companies engaged in specific aspects of the major real estate markets/regions of the world.
S&P 500 Index—The S&P 500 Index is an unmanaged index of over 500 stocks of large US public companies. It gives a broad look at how stock prices in the United States have performed.
Investors cannot invest directly in an index or average. The returns for the Indexes would be lower if they included the effects of sales charges, operating expenses of a mutual fund, or taxes.
| | |
| 8 | | Visit our website at pgiminvestments.com |
Presentation of Fund Holdingsas of 10/31/19
| | | | |
| Ten Largest Holdings | | Line of Business | | % of Net Assets |
| Americold Realty Trust | | Industrial REITs | | 4.8% |
| AvalonBay Communities, Inc. | | Residential REITs | | 4.5% |
| Rexford Industrial Realty, Inc. | | Industrial REITs | | 3.9% |
| Equity LifeStyle Properties, Inc. | | Residential REITs | | 3.4% |
| Camden Property Trust | | Residential REITs | | 3.2% |
| Spirit Realty Capital, Inc. | | Retail REITs | | 3.2% |
| Goodman Group (Australia) | | Industrial REITs | | 2.9% |
| Segro PLC (United Kingdom) | | Industrial REITs | | 2.8% |
| Prologis, Inc. | | Industrial REITs | | 2.8% |
| Link REIT (Hong Kong) | | Retail REITs | | 2.7% |
For a complete list of holdings, please refer to the Schedule of Investments section of this report. Holdings reflect only long-term Investments.
| | | | |
| PGIM Select Real Estate Fund | | | 9 | |
Strategy and Performance Overview(unaudited)
How did the Fund perform?
ThePGIM Select Real Estate Fund’s Class Z shares returned 33.02% in the 12-month reporting period that ended October 31, 2019, outperforming the 20.29% return of the FTSE EPRA/NAREIT Developed Index (the Index).
What were conditions like in the global real estate securities market?
| • | | Conditions in the US real estate investment trust (REIT) market during the reporting period were highly favorable, as global economic uncertainty and persistently low long-term interest rates increased the relative attractiveness of the US REIT market as both a safe-haven asset class and reliable source of income. In addition, fundamentals in the commercial real estate markets remained strong, with peak occupancies in most property types and steady rent growth. As a result, the US REIT market produced a 24% total return during the period. Declining debt costs and improved equity valuations allowed REITs to increase equity issuances and make accretive acquisitions. Still, return dispersion remained wide, as property types best exposed to secular demand trends outperformed, specifically industrial and manufactured housing. Conversely, property types exposed to challenging demand trends and rising capital needs lagged, most notably the malls and office sectors. On average, the US REIT market was trading at an 8% premium to net asset value (NAV) at the end of the period, which PGIM Real Estate viewed as appropriate given the macroeconomic backdrop. |
| • | | The European real estate market’s total return during the period was positive. However, political risk hovered over the European region, especially in the United Kingdom (UK) where Brexit news dominated headlines as the UK continued to negotiate an exit from the European Union. Finland was the best-performing market, lifted by a strong multifamily residential sector performance. Belgium, Switzerland, Sweden, and Spain were also leading performers during the period. The UK real estate market’s return was in line with the European average. However, it underperformed for most of the period and saw a bounce only in October 2019 when a potential Brexit deal was announced. The core European real estate markets of Germany and France both lagged the European average. Germany suffered from the threat of growing regulation in the multifamily residential sector, and France was negatively impacted by the poor performance of the retail sector that dominates its index. Only the real estate market of the Netherlands showed a negative total return for the period, again as a result of the dominance of retail stocks in its index. The low interest-rate environment persisted in the eurozone longer than investors had originally anticipated, sending bond yields to record lows and maintaining pressure on capitalization rates (i.e., the rate of return expected to be generated on a real estate investment property) across the region, especially for core properties in the more liquid markets. Foreign investor demand was strong, and rental growth momentum was robust in the major continental markets, though some investor concerns were growing as capitalization rates reached new record lows in these markets late in the real estate cycle. |
| | |
| 10 | | Visit our website at pgiminvestments.com |
| • | | Asia-Pacific real estate equities walked a tightrope during the period, with global economic growth subject to the outcome of the US-China trade conflict. This conflict has diminished trade flows, which has negatively affected consumption, exports, manufacturing, and ultimately investments. While interest-rate guidance during the latter half of the period turned dovish, markets continued to focus on potential signs of weakness in global economic growth. Amid the macro concerns, the region’s REIT markets outperformed the developers due to their defensiveness and income stability. Japanese REITs led the pack, supported by the robust class-A office sector in Tokyo and the continued accommodative monetary policy by the Bank of Japan. Similarly, investors favored Singapore REITs’ perceived defensive income payout. The numerous accretive equity raisings were well received throughout the period. Australian REITs underperformed, as economic concerns overshadowed the benefits of the cash rate cuts by the Reserve Bank of Australia. In the developer space, Singapore developers fared better than Japanese and Hong Kong developers during the period, despite cooling measures and global economic uncertainty. Japanese developers were helped by healthy condominium sales and positive office rent reversions, but performance was negatively affected by a murky economic outlook. Hong Kong developers remained in a tight spot, facing severe economic and political headwinds after months of civil unrest and the U.S.-China trade war. Residential prices fell 6.0% from their peak at the end of June 2019 through the end of the period, following an uninterrupted run-up since 2003. |
What worked and didn’t work?
| • | | The Fund outperformed the Index during the reporting period. All three regions represented in the Fund (North America, Europe, and Asia) outperformed on a relative basis, with North America being the main driver of outperformance. Security selection across all regions was notably positive while asset allocation had a marginally favorable impact. |
| • | | Within North America, several factors were responsible for the outperformance, including favorable security selection and an overweight position to the industrial sector, positive stock selection in health care, an underweight position to the mall sector, and favorable security selection and an underweight position to the hotels sector. The shopping center, specialty housing, office, and Triple net sectors also outperformed on a relative basis due to positive stock picking. |
| • | | Europe performed well on a relative basis, largely due to positive stock selection in the UK and Germany. The Fund’s underweight position to France also contributed to relative performance. No individual country within the region meaningfully detracted from relative performance for the period. |
| • | | Asia also outperformed relative to the Index. Despite unfavorable security selection in Japan, the region performed well due to the positive impact of favorable security selection in Australia, Hong Kong, and Singapore. |
| | | | |
| PGIM Select Real Estate Fund | | | 11 | |
Strategy and Performance Overview(continued)
Current outlook
| • | | Strength in US REITs during the reporting period drove the Index to an all-time high, trading at an 8% premium to NAV at the end of the period. While this premium is much richer than the 2.6% discount averaged over the trailing five years, it is more consistent with the 4.7% average premium over the last 10 years. Moreover, when looking at comparable macro environments (sub-2% 10-year US Treasury yields and modest economic growth), the US REIT market has averaged double-digit NAV premiums. As such, PGIM Real Estate viewed the valuation of the REIT market at the end of the period as reasonable, with potential upside to come if current macroeconomic conditions are sustained. As mentioned earlier, declining debt costs and improved equity valuations have allowed REITs to increase equity issuances and make accretive acquisitions. The US REIT market has seen a substantial amount of secondary offerings. In addition, REITs remained active issuers of new equity through “at the market,” or ATM, programs, which provide REITs an efficient means of raising capital over time by allowing a company to tap into the existing trading market for its shares on an as-and-when-needed basis. Despite the average premium in the US, many REITs were still trading at sizable NAV discounts at the end of the period, presenting an opportunity, in PGIM Real Estate’s view, for mergers and acquisitions (M&A) through both privatizations and REIT consolidation. In addition, private equity remained highly active. PGIM Real Estate sees health care REITs as well positioned, given a growing source of demand based on demographics and a healthy external growth opportunity set. Conversely, hotel REITs are likely to see a more challenged environment as corporations look to cut back on travel budgets in the increasingly uncertain economic backdrop. In addition, PGIM Real Estate has increased the Fund’s exposure to manufactured housing based on sector-leading cash flow growth and limited supply additions. The industrial sector has continued to benefit from the secular demand shift toward e-commerce. With continued weakness in the retail sector, PGIM Real Estate expected additional tenant bankruptcies to weigh on cash flows and valuations and therefore maintained a Fund underweight to the sector. |
| • | | The outlook for the continental European real estate sector remains generally positive in terms of real estate fundamentals, but the growth outlook for the region as a whole remains subdued. Monetary policy in the eurozone remains loose, with potential interest-rate increases pushed back well into 2020 and the European Central Bank resuming quantitative easing. The discounts to private market values in Europe narrowed with the market rebound during the last two months of the period, but they still remained appealing with Europe trading overall at an average 7% one-year forward discount to NAV at the end of the period and with an average one-year forward dividend yield of 4.2%. The valuation divergence between the UK and the continent narrowed following the progress made on Brexit negotiations, with the continent on a 6% average discount-to-forward NAV and the UK at a 9% average discount. PGIM Real Estate believes caution is still warranted in the UK retail and London office sectors. The potential for surprises and |
| | |
| 12 | | Visit our website at pgiminvestments.com |
| | volatility remain on the path to a Brexit agreement, and there are major structural challenges posed by the oversupply of physical retail in the UK. Investor demand for real estate from private capital remains solid, helping to support private market valuations as previous cycle peaks on both rents and values in many of the more liquid core markets are approached or exceeded. New supply, while increasing in markets and sectors where vacancy is tight and rental growth fundamentals are improving, generally remains able to be absorbed. On a sector basis, PGIM Real Estate remains cautious on the structural challenges facing retail stocks and continues to look for ways of increasing the Fund’s exposure to the booming logistics sector that is benefiting from the same structural trends favoring online retail. The retail sector in the UK especially has demonstrated an accelerating fall in rents and values, and this process is now underway throughout Europe. While retail share prices rebounded off their lows during the last two months of the period, M&A attempts have thus far failed to close the remaining significant discounts, and structural challenges have shown few signs of easing. |
| • | | Asia offers attractive, risk-adjusted real estate returns, supported by strong fundamentals and yield compression from potentially lower interest rates. With three Federal Reserve (Fed) rate cuts in the US during the period, interest-rate pressure in Singapore and Hong Kong moderated as the Fed offered guidance for a more balanced rate outlook after the third cut. In addition, the Reserve Bank of Australia has begun its path of rate cuts, while the Bank of Japan is maintaining zero interest rates. PGIM Real Estate believes the following themes could be in focus in the coming months: (1) trade war continuation, (2) lower bond yield impact on REITs, (3) supply constraints in prime Singapore/Hong Kong/Sydney offices, (4) attractive yield spread (for Japanese REITs), and (5) political developments in Hong Kong. Markets remain vulnerable, with global growth subject to the outcome of the trade conflict. Within individual sectors, a sharper rise in sovereign bond yields could negatively impact regional REIT valuations. An intensification of the trade conflict between the US and China also could materially hurt the economic prospects of the region. |
The percentage points shown in the tables below identify each security’s positive or negative contribution to the Fund’s return, which is the sum of all contributions by individual holdings
| | | | | | |
| |
| Top Contributors (%) | | Top Detractors (%) |
| Americold Realty Trust | | 2.16 | | Covivio SA | | –0.23 |
| Simon Property Group Inc. | | 1.34 | | New World Development Co. Ltd. | | –0.25 |
| Rexford Industrial Realty Inc. | | 1.03 | | Macerich Co. | | –0.39 |
| MedEquities Realty Trust Inc. | | 0.94 | | Hibernia REIT PLC | | –0.40 |
| Equity LifeStyle Properties Inc. | | 0.90 | | Prologis Inc. | | –0.64 |
| | | | |
| PGIM Select Real Estate Fund | | | 13 | |
Comments on Largest Holdings(unaudited)
| 4.8% | Americold Realty Trust,Industrial REITs |
Americold Realty Trust provides temperature-controlled food distribution services. The company offers warehousing, consolidation programs, shipment management, multi-vendor consolidation, and logistics solutions. It serves food producers, processors, distributors, wholesalers, retailers, and restaurants worldwide.
| 4.5% | AvalonBay Communities, Inc.,Residential REITs |
AvalonBay Communities develops, redevelops, acquires, owns, and operates multifamily communities in the US.
| 3.9% | Rexford Industrial Realty, Inc.,Industrial REITs |
Rexford Industrial Realty specializes in acquiring, owning, and operating industrial properties in Southern California markets.
| 3.4% | Equity Lifestyle Properties, Inc.,Residential REITs |
Equity LifeStyle Properties owns an interest in communities in the US and western Canada, acquiring properties such as camping grounds and seasonal resort communities.
| 3.2% | Camden Property Trust,Residential REITs |
Camden Property Trust is a self-administered and self-managed REIT that owns and operates multifamily apartment communities and serves customers in the US.
| | |
| 14 | | Visit our website at pgiminvestments.com |
Fees and Expenses(unaudited)
As a shareholder of the Fund, you incur two types of costs: (1) transaction costs, including sales charges (loads) on purchase payments and redemptions, as applicable, and (2) ongoing costs, including management fees, distribution, and/or service (12b-1) fees, and other Fund expenses, as applicable. This example is intended to help you understand your ongoing costs (in dollars) of investing in the Fund and to compare these costs with the ongoing costs of investing in other mutual funds.
The example is based on an investment of $1,000 held through the six-month period ended October 31, 2019. The example is for illustrative purposes only; you should consult the Prospectus for information on initial and subsequent minimum investment requirements.
Actual Expenses
The first line for each share class in the table on the following page provides information about actual account values and actual expenses. You may use the information on this line, together with the amount you invested, to estimate the expenses that you paid over the period. Simply divide your account value by $1,000 (for example, an $8,600 account value ÷ $1,000 = 8.6), then multiply the result by the number on the first line under the heading “Expenses Paid During the Six-Month Period” to estimate the expenses you paid on your account during this period.
Hypothetical Example for Comparison Purposes
The second line for each share class in the table on the following page provides information about hypothetical account values and hypothetical expenses based on the Fund’s actual expense ratio and an assumed rate of return of 5% per year before expenses, which is not the Fund’s actual return. The hypothetical account values and expenses may not be used to estimate the actual ending account balance or expenses you paid for the period. You may use this information to compare the ongoing costs of investing in the Fund and other funds. To do so, compare this 5% hypothetical example with the 5% hypothetical examples that appear in the shareholder reports of the other funds.
The Fund’s transfer agent may charge additional fees to holders of certain accounts that are not included in the expenses shown in the table on the following page. These fees apply to individual retirement accounts (IRAs) and Section 403(b) accounts. As of the close of the period covered by the table, IRA fees included an annual maintenance fee of $15 per account (subject to a maximum annual maintenance fee of $25 for all accounts held by the same shareholder). Section 403(b) accounts are charged an annual $25 fiduciary maintenance fee. Some of the fees may vary in amount, or may be waived, based on your total account balance or the number of PGIM funds, including the Fund, that you own. You should consider the additional fees that were charged to your Fund account over the six-month period when you estimate the total ongoing expenses paid over the period and the impact of these fees on your ending account value, as these additional expenses are not
| | | | |
| PGIM Select Real Estate Fund | | | 15 | |
Fees and Expenses(continued)
reflected in the information provided in the expense table. Additional fees have the effect of reducing investment returns.
Please note that the expenses shown in the table are meant to highlight your ongoing costs only and do not reflect any transactional costs such as sales charges (loads). Therefore, the second line for each share class in the table is useful in comparing ongoing costs only and will not help you determine the relative total costs of owning different funds. In addition, if these transactional costs were included, your costs would have been higher.
| | | | | | | | | | | | | | | | | | |
| | | | |
PGIM Select
Real Estate Fund | | Beginning Account
Value
May 1, 2019 | | | Ending Account
Value
October 31, 2019 | | | Annualized
Expense Ratio
Based on the
Six-Month Period | | | Expenses Paid
During the
Six-Month Period* | |
| Class A | | Actual | | $ | 1,000.00 | | | $ | 1,131.80 | | | | 1.30 | % | | $ | 6.99 | |
| | Hypothetical | | $ | 1,000.00 | | | $ | 1,018.65 | | | | 1.30 | % | | $ | 6.61 | |
| Class C | | Actual | | $ | 1,000.00 | | | $ | 1,127.10 | | | | 2.05 | % | | $ | 10.99 | |
| | Hypothetical | | $ | 1,000.00 | | | $ | 1,014.87 | | | | 2.05 | % | | $ | 10.41 | |
| Class Z | | Actual | | $ | 1,000.00 | | | $ | 1,133.00 | | | | 1.05 | % | | $ | 5.65 | |
| | Hypothetical | | $ | 1,000.00 | | | $ | 1,019.91 | | | | 1.05 | % | | $ | 5.35 | |
| Class R6 | | Actual | | $ | 1,000.00 | | | $ | 1,133.30 | | | | 1.05 | % | | $ | 5.65 | |
| | | Hypothetical | | $ | 1,000.00 | | | $ | 1,019.91 | | | | 1.05 | % | | $ | 5.35 | |
*Fund expenses (net of fee waivers or subsidies, if any) for each share class are equal to the annualized expense ratio for each share class (provided in the table), multiplied by the average account value over the period, multiplied by the 184 days in the six-month period ended October 31, 2019, and divided by the 365 days in the Fund’s fiscal year ended October 31, 2019 (to reflect the six-month period). Expenses presented in the table include the expenses of any underlying portfolios in which the Fund may invest.
| | |
| 16 | | Visit our website at pgiminvestments.com |
Schedule of Investments
as of October 31, 2019
| | | | | | | | |
| Description | | Shares | | | Value | |
LONG-TERM INVESTMENTS 98.2% | | | | | | | | |
| | |
COMMON STOCKS 98.2% | | | | | | | | |
| | |
Diversified Real Estate Activities 6.4% | | | | | | | | |
Henderson Land Development Co. Ltd. (Hong Kong) | | | 72,000 | | | $ | 359,173 | |
Mitsubishi Estate Co. Ltd. (Japan) | | | 12,417 | | | | 240,822 | |
Mitsui Fudosan Co. Ltd. (Japan) | | | 27,918 | | | | 714,155 | |
Sun Hung Kai Properties Ltd. (Hong Kong) | | | 32,500 | | | | 489,106 | |
| | | | | | | | |
| | | | | | | 1,803,256 | |
| | |
Diversified REITs 4.7% | | | | | | | | |
American Assets Trust, Inc. | | | 11,183 | | | | 547,520 | |
Essential Properties Realty Trust, Inc. | | | 14,894 | | | | 382,180 | |
Merlin Properties Socimi SA (Spain) | | | 27,645 | | | | 406,965 | |
| | | | | | | | |
| | | | | | | 1,336,665 | |
| | |
Health Care REITs 8.9% | | | | | | | | |
CareTrust REIT, Inc. | | | 26,850 | | | | 650,844 | |
Healthpeak Properties, Inc. | | | 14,549 | | | | 547,333 | |
Medical Properties Trust, Inc. | | | 32,638 | | | | 676,586 | |
Welltower, Inc. | | | 7,022 | | | | 636,825 | |
| | | | | | | | |
| | | | | | | 2,511,588 | |
| | |
Hotel & Resort REITs 4.1% | | | | | | | | |
Invincible Investment Corp. (Japan) | | | 1,044 | | | | 659,801 | |
MGM Growth Properties LLC (Class A Stock) | | | 16,269 | | | | 507,755 | |
| | | | | | | | |
| | | | | | | 1,167,556 | |
| | |
Industrial REITs 28.3% | | | | | | | | |
Americold Realty Trust | | | 33,769 | | | | 1,353,799 | |
First Industrial Realty Trust, Inc. | | | 12,146 | | | | 511,468 | |
Goodman Group (Australia) | | | 82,332 | | | | 816,847 | |
Mapletree Logistics Trust (Singapore) | | | 468,877 | | | | 578,269 | |
Mitsui Fudosan Logistics Park, Inc. (Japan) | | | 141 | | | | 587,690 | |
Prologis, Inc. | | | 8,943 | | | | 784,838 | |
Rexford Industrial Realty, Inc. | | | 23,354 | | | | 1,123,094 | |
Segro PLC (United Kingdom) | | | 71,890 | | | | 786,402 | |
STAG Industrial, Inc. | | | 21,247 | | | | 659,507 | |
Summit Industrial Income (Canada)* | | | 34,467 | | | | 334,961 | |
Summit Industrial Income (Canada)(XTSE) | | | 49,253 | | | | 477,908 | |
| | | | | | | | |
| | | | | | | 8,014,783 | |
See Notes to Financial Statements.
| | | | |
| PGIM Select Real Estate Fund | | | 17 | |
Schedule of Investments(continued)
as of October 31, 2019
| | | | | | | | |
| Description | | Shares | | | Value | |
COMMON STOCKS (Continued) | | | | | | | | |
| | |
IT Consulting & Other Services 1.7% | | | | | | | | |
InterXion Holding NV (Netherlands)* | | | 5,498 | | | $ | 485,034 | |
| | |
Office REITs 7.5% | | | | | | | | |
Cousins Properties, Inc. | | | 12,669 | | | | 508,407 | |
Hudson Pacific Properties, Inc. | | | 14,580 | | | | 523,714 | |
JBG SMITH Properties | | | 9,247 | | | | 372,284 | |
Nippon Building Fund, Inc. (Japan) | | | 93 | | | | 704,940 | |
| | | | | | | | |
| | | | | | | 2,109,345 | |
| | |
Real Estate Operating Companies 7.2% | | | | | | | | |
Deutsche Wohnen SE (Germany) | | | 13,204 | | | | 496,214 | |
Fabege AB (Sweden) | | | 37,690 | | | | 561,638 | |
Kojamo OYJ (Finland) | | | 33,993 | | | | 575,329 | |
LEG Immobilien AG (Germany) | | | 3,595 | | | | 412,655 | |
| | | | | | | | |
| | | | | | | 2,045,836 | |
| | |
Residential REITs 17.9% | | | | | | | | |
AvalonBay Communities, Inc. | | | 5,815 | | | | 1,265,693 | |
Camden Property Trust | | | 7,876 | | | | 900,778 | |
Canadian Apartment Properties (Canada) | | | 7,987 | | | | 332,554 | |
Equity LifeStyle Properties, Inc. | | | 13,920 | | | | 973,565 | |
Ingenia Communities Group (Australia) | | | 176,420 | | | | 534,650 | |
InterRent Real Estate Investment Trust (Canada) | | | 39,363 | | | | 466,522 | |
Irish Residential Properties PLC (Ireland) | | | 296,249 | | | | 579,237 | |
| | | | | | | | |
| | | | | | | 5,052,999 | |
| | |
Retail REITs 9.7% | | | | | | | | |
Frasers Centrepoint Trust (Singapore) | | | 342,200 | | | | 691,412 | |
Link REIT (Hong Kong) | | | 70,290 | | | | 765,272 | |
Realty Income Corp. | | | 4,737 | | | | 387,439 | |
Spirit Realty Capital, Inc. | | | 18,060 | | | | 900,110 | |
| | | | | | | | |
| | | | | | | 2,744,233 | |
| | |
Specialized REITs 1.8% | | | | | | | | |
Extra Space Storage, Inc. | | | 4,566 | | | | 512,625 | |
| | | | | | | | |
TOTAL COMMON STOCKS
(cost $24,994,003) | | | | | | | 27,783,920 | |
| | | | | | | | |
See Notes to Financial Statements.
| | | | | | | | |
| Description | | Shares | | | Value | |
RIGHTS* 0.0% | | | | | | | | |
| | |
Retail REITs | | | | | | | | |
Mapletree Commercial Trust (Singapore), expiring 11/08/19
(cost $0) | | | 44,261 | | | $ | 2,854 | |
| | | | | | | | |
TOTAL LONG-TERM INVESTMENTS
(cost $24,994,003) | | | | | | | 27,786,774 | |
| | | | | | | | |
| | |
SHORT-TERM INVESTMENT 2.0% | | | | | | | | |
| | |
AFFILIATED MUTUAL FUND | | | | | | | | |
PGIM Core Ultra Short Bond Fund
(cost $560,924)(w) | | | 560,924 | | | | 560,924 | |
| | | | | | | | |
TOTAL INVESTMENTS 100.2%
(cost $25,554,927) | | | | | | | 28,347,698 | |
Liabilities in excess of other assets (0.2)% | | | | | | | (46,235 | ) |
| | | | | | | | |
NET ASSETS 100.0% | | | | | | $ | 28,301,463 | |
| | | | | | | | |
Below is a list of the abbreviation(s) used in the annual report:
LIBOR—London Interbank Offered Rate
REITs—Real Estate Investment Trust
XTSE—Toronto Stock Exchange
| * | Non-income producing security. |
| (w) | PGIM Investments LLC, the manager of the Fund, also serves as manager of the PGIM Core Ultra Short Bond Fund. |
Fair Value Measurements:
Various inputs are used in determining the value of the Fund’s investments. These inputs are summarized in the three broad levels listed below.
Level 1—unadjusted quoted prices generally in active markets for identical securities.
Level 2—quoted prices for similar securities, interest rates and yield curves, prepayment speeds, foreign currency exchange rates and other observable inputs.
Level 3—unobservable inputs for securities valued in accordance with Board approved fair valuation procedures.
The following is a summary of the inputs used as of October 31, 2019 in valuing such portfolio securities:
| | | | | | | | | | | | |
| | | Level 1 | | | Level 2 | | | Level 3 | |
Investments in Securities | | | | | | | | | | | | |
Assets | | | | | | | | | | | | |
Common Stocks | | | | | | | | | | | | |
Australia | | $ | — | | | $ | 1,351,497 | | | $ | — | |
Canada | | | 1,611,945 | | | | — | | | | — | |
Finland | | | — | | | | 575,329 | | | | — | |
Germany | | | — | | | | 908,869 | | | | — | |
See Notes to Financial Statements.
| | | | |
| PGIM Select Real Estate Fund | | | 19 | |
Schedule of Investments(continued)
as of October 31, 2019
| | | | | | | | | | | | |
| | | Level 1 | | | Level 2 | | | Level 3 | |
Investments in Securities (continued) | | | | | | | | | | | | |
Assets (continued) | | | | | | | | | | | | |
Common Stocks (continued) | | | | | | | | | | | | |
Hong Kong | | $ | — | | | $ | 1,613,551 | | | $ | — | |
Ireland | | | — | | | | 579,237 | | | | — | |
Japan | | | — | | | | 2,907,408 | | | | — | |
Netherlands | | | 485,034 | | | | — | | | | — | |
Singapore | | | — | | | | 1,269,681 | | | | — | |
Spain | | | — | | | | 406,965 | | | | — | |
Sweden | | | — | | | | 561,638 | | | | — | |
United Kingdom | | | — | | | | 786,402 | | | | — | |
United States | | | 14,726,364 | | | | — | | | | — | |
Rights | | | | | | | | | | | | |
Singapore | | | — | | | | 2,854 | | | | — | |
Affiliated Mutual Fund | | | 560,924 | | | | — | | | | — | |
| | | | | | | | | | | | |
Total | | $ | 17,384,267 | | | $ | 10,963,431 | | | $ | — | |
| | | | | | | | | | | | |
Sector Classification:
The sector classification of investments and liabilities in excess of other assets shown as a percentage of net assets as of October 31, 2019 were as follows (unaudited):
| | | | |
Industrial REITs | | | 28.3 | % |
Residential REITs | | | 17.9 | |
Retail REITs | | | 9.7 | |
Health Care REITs | | | 8.9 | |
Office REITs | | | 7.5 | |
Real Estate Operating Companies | | | 7.2 | |
Diversified Real Estate Activities | | | 6.4 | |
Diversified REITs | | | 4.7 | |
Hotel & Resort REITs | | | 4.1 | |
| | | | |
Affiliated Mutual Fund | | | 2.0 | % |
Specialized REITs | | | 1.8 | |
IT Consulting & Other Services | | | 1.7 | |
| | | | |
| | | 100.2 | |
Liabilities in excess of other assets | | | (0.2 | ) |
| | | | |
| | | 100.0 | % |
| | | | |
Effects of Derivative Instruments on the Financial Statements and Primary Underlying Risk Exposure:
The Fund invested in derivative instruments during the reporting period. The primary type of risk associated with these derivative instruments is equity contracts risk. See the Notes to Financial Statements for additional detail regarding these derivative instruments and their risks. The effect of such derivative instruments on the Fund’s financial position and financial performance as reflected in the Statement of Assets and Liabilities and Statement of Operations is presented in the summary below.
Fair values of derivative instruments as of October 31, 2019 as presented in the Statement of Assets and Liabilities:
See Notes to Financial Statements.
| | | | | | | | | | | | |
| | | Asset Derivatives | | | Liability Derivatives | |
Derivatives not accounted
for as hedging instruments,
carried at fair value | | Statement of
Assets and
Liabilities Location | | Fair
Value | | | Statement of
Assets and
Liabilities Location | | Fair
Value | |
| Equity contracts | | Unaffiliated investments | | $ | 2,854 | | | — | | $ | — | |
| | | | | | | | | | | | |
The effects of derivative instruments on the Statement of Operations for the year ended October 31, 2019 are as follows:
For the year ended October 31, 2019, the Fund did not have any net realized gain (loss) on derivatives in the Statement of Operations.
| | | | |
Change in Unrealized Appreciation (Depreciation) on Derivatives Recognized in Income | |
Derivatives not accounted for as hedging
instruments, carried at fair value | | Rights(1) | |
Equity contracts | | $ | 2,854 | |
| | | | |
| (1) | Included in net change in unrealized appreciation (depreciation) on investments in the Statement of Operations. |
See Notes to Financial Statements.
| | | | |
| PGIM Select Real Estate Fund | | | 21 | |
Statement of Assets and Liabilities
as of October 31, 2019
| | | | |
Assets | | | | |
Investments at value: | | | | |
Unaffiliated investments (cost $24,994,003) | | $ | 27,786,774 | |
Affiliated investments (cost $560,924) | | | 560,924 | |
Foreign currency, at value (cost $45,510) | | | 45,510 | |
Receivable for Fund shares sold | | | 191,819 | |
Receivable for investments sold | | | 139,216 | |
Dividends receivable | | | 42,592 | |
Tax reclaim receivable | | | 3,374 | |
Prepaid expenses | | | 808 | |
| | | | |
Total Assets | | | 28,771,017 | |
| | | | |
| |
Liabilities | | | | |
Payable for investments purchased | | | 345,747 | |
Payable for Fund shares reacquired | | | 70,462 | |
Accrued expenses and other liabilities | | | 42,310 | |
Management fee payable | | | 8,938 | |
Distribution fee payable | | | 1,147 | |
Affiliated transfer agent fee payable | | | 950 | |
| | | | |
Total Liabilities | | | 469,554 | |
| | | | |
| |
Net Assets | | $ | 28,301,463 | |
| | | | |
| | | | | |
Net assets were comprised of: | | | | |
Shares of beneficial interest, at par | | $ | 2,165 | |
Paid-in capital in excess of par | | | 24,635,256 | |
Total distributable earnings (loss) | | | 3,664,042 | |
| | | | |
Net assets, October 31, 2019 | | $ | 28,301,463 | |
| | | | |
See Notes to Financial Statements.
| | | | |
Class A | | | | |
Net asset value and redemption price per share,
($4,446,583 ÷ 337,432 shares of beneficial interest issued and outstanding) | | $ | 13.18 | |
Maximum sales charge (5.50% of offering price) | | | 0.77 | |
| | | | |
Maximum offering price to public | | $ | 13.95 | |
| | | | |
| |
Class C | | | | |
Net asset value, offering price and redemption price per share, | | | | |
($350,920 ÷ 26,923 shares of beneficial interest issued and outstanding) | | $ | 13.03 | |
| | | | |
| |
Class Z | | | | |
Net asset value, offering price and redemption price per share, | | | | |
($6,366,135 ÷ 482,329 shares of beneficial interest issued and outstanding) | | $ | 13.20 | |
| | | | |
| |
Class R6 | | | | |
Net asset value, offering price and redemption price per share, | | | | |
($17,137,825 ÷ 1,318,619 shares of beneficial interest issued and outstanding) | | $ | 13.00 | |
| | | | |
See Notes to Financial Statements.
| | | | |
| PGIM Select Real Estate Fund | | | 23 | |
Statement of Operations
Year Ended October 31, 2019
| | | | |
Net Investment Income (Loss) | | | | |
Income | | | | |
Unaffiliated dividend income (net of $18,446 foreign withholding tax) | | $ | 349,192 | |
Affiliated dividend income | | | 8,872 | |
Income from securities lending, net (including affiliated income of $70) | | | 131 | |
| | | | |
Total income | | | 358,195 | |
| | | | |
| |
Expenses | | | | |
Management fee | | | 109,708 | |
Distribution fee(a) | | | 11,100 | |
Custodian and accounting fees | | | 64,789 | |
Registration fees(a) | | | 51,728 | |
Audit fee | | | 34,875 | |
Shareholders’ reports | | | 27,752 | |
Legal fees and expenses | | | 19,079 | |
Trustees’ fees | | | 11,103 | |
Transfer agent’s fees and expenses (including affiliated expense of $4,850)(a) | | | 7,387 | |
Miscellaneous | | | 19,897 | |
| | | | |
Total expenses | | | 357,418 | |
Less: Fee waiver and/or expense reimbursement(a) | | | (202,326 | ) |
Distribution fee waiver(a) | | | (1,603 | ) |
| | | | |
Net expenses | | | 153,489 | |
| | | | |
Net investment income (loss) | | | 204,706 | |
| | | | |
| |
Realized And Unrealized Gain (Loss) On Investment And Foreign Currency Transactions | | | | |
Net realized gain (loss) on: | | | | |
Investment transactions | | | 884,750 | |
Foreign currency transactions | | | (7,055 | ) |
| | | | |
| | | 877,695 | |
| | | | |
Net change in unrealized appreciation (depreciation) on: | | | | |
Investments | | | 2,856,475 | |
Foreign currencies | | | (44 | ) |
| | | | |
| | | 2,856,431 | |
| | | | |
Net gain (loss) on investment and foreign currency transactions | | | 3,734,126 | |
| | | | |
Net Increase (Decrease) In Net Assets Resulting From Operations | | $ | 3,938,832 | |
| | | | |
| (a) | Class specific expenses and waivers were as follows: |
| | | | | | | | | | | | | | | | |
| | | Class A | | | Class C | | | Class Z | | | Class R6 | |
Distribution fee | | | 9,615 | | | | 1,485 | | | | — | | | | — | |
Registration fees | | | 12,597 | | | | 12,597 | | | | 13,937 | | | | 12,597 | |
Transfer agent’s fees and expenses | | | 4,807 | | | | 230 | | | | 2,283 | | | | 67 | |
Fee waiver and/or expense reimbursement | | | (54,246 | ) | | | (14,379 | ) | | | (29,158 | ) | | | (104,543 | ) |
Distribution fee waiver | | | (1,603 | ) | | | — | | | | — | | | | — | |
See Notes to Financial Statements.
Statements of Changes in Net Assets
| | | | | | | | |
| |
| | | Year Ended October 31, | |
| | |
| | | 2019 | | | 2018 | |
Increase (Decrease) in Net Assets | | | | | | | | |
Operations | | | | | | | | |
Net investment income (loss) | | $ | 204,706 | | | $ | 136,475 | |
Net realized gain (loss) on investment and foreign currency transactions | | | 877,695 | | | | 334,051 | |
Net change in unrealized appreciation (depreciation) on investments and foreign currencies | | | 2,856,431 | | | | (380,990 | ) |
| | | | | | | | |
Net increase (decrease) in net assets resulting from operations | | | 3,938,832 | | | | 89,536 | |
| | | | | | | | |
| | |
Dividends and Distributions | | | | | | | | |
Distributions from distributable earnings | | | | | | | | |
Class A | | | (105,398 | ) | | | (31,115 | ) |
Class C | | | (2,117 | ) | | | (1,166 | ) |
Class Z | | | (22,724 | ) | | | (3,847 | ) |
Class R6 | | | (276,839 | ) | | | (160,410 | ) |
| | | | | | | | |
| | | (407,078 | ) | | | (196,538 | ) |
| | | | | | | | |
| | |
Fund share transactions (Net of share conversions) | | | | | | | | |
Net proceeds from shares sold | | | 16,624,282 | | | | 2,829,409 | |
Net asset value of shares issued in reinvestment of dividends and distributions | | | 407,047 | | | | 196,537 | |
Cost of shares reacquired | | | (964,311 | ) | | | (628,179 | ) |
| | | | | | | | |
Net increase (decrease) in net assets from Fund share transactions | | | 16,067,018 | | | | 2,397,767 | |
| | | | | | | | |
Total increase (decrease) | | | 19,598,772 | | | | 2,290,765 | |
| | |
Net Assets: | | | | | | | | |
Beginning of year | | | 8,702,691 | | | | 6,411,926 | |
| | | | | | | | |
End of year | | $ | 28,301,463 | | | $ | 8,702,691 | |
| | | | | | | | |
See Notes to Financial Statements.
| | | | |
| PGIM Select Real Estate Fund | | | 25 | |
Notes to Financial Statements
Prudential Investment Portfolios 9 (the “Trust”) is registered under the Investment Company Act of 1940, as amended (“1940 Act”), as an open-end management investment company. The Trust currently consists of five funds: PGIM Absolute Return Bond Fund and PGIM QMA Large-Cap Core Equity Fund, each of which are diversified funds and PGIM International Bond Fund, PGIM Select Real Estate Fund and PGIM Real Estate Income Fund, each of which are non-diversified funds for purposes of the 1940 Act. These financial statements relate only to the PGIM Select Real Estate Fund (the “Fund”).
The investment objective of the Fund is to seek income and capital appreciation.
1. Accounting Policies
The Fund follows the investment company accounting and reporting guidance of the Financial Accounting Standards Board (“FASB”) Accounting Standard Codification (“ASC”) Topic 946 Financial Services—Investment Companies. The following accounting policies conform to U.S. generally accepted accounting principles. The Fund consistently follows such policies in the preparation of its financial statements.
Securities Valuation:The Fund holds securities and other assets and liabilities that are fair valued at the close of each day (generally, 4:00 PM Eastern time) the New York Stock Exchange (“NYSE”) is open for trading. Fair value is the price that would be received to sell an asset or paid to transfer a liability in an orderly transaction between market participants on the measurement date. The Trust’s Board of Trustees (the “Board”) has adopted valuation procedures for security valuation under which fair valuation responsibilities have been delegated to PGIM Investments LLC (“PGIM Investments” or the “Manager”). Pursuant to the Board’s delegation, the Manager has established a Valuation Committee responsible for supervising the fair valuation of portfolio securities and other assets and liabilities. The valuation procedures permit the Fund to utilize independent pricing vendor services, quotations from market makers, and alternative valuation methods when market quotations are either not readily available or not deemed representative of fair value. A record of the Valuation Committee’s actions is subject to the Board’s review, approval, and ratification at its next regularly scheduled quarterly meeting.
For the fiscal reporting year-end, securities and other assets and liabilities were fair valued at the close of the last U.S. business day. Trading in certain foreign securities may occur when the NYSE is closed (including weekends and holidays). Because such foreign securities trade in markets that are open on weekends and U.S. holidays, the values of some of the Fund’s foreign investments may change on days when investors cannot purchase or redeem Fund shares.
Various inputs determine how the Fund’s investments are valued, all of which are categorized according to the three broad levels (Level 1, 2, or 3) detailed in the Schedule of Investments and referred to herein as the “fair value hierarchy” in accordance with FASB ASC Topic 820—Fair Value Measurements and Disclosures.
Common and preferred stocks, exchange-traded funds, and derivative instruments, such as futures or options, that are traded on a national securities exchange are valued at the last sale price as of the close of trading on the applicable exchange where the security principally trades. Securities traded via NASDAQ are valued at the NASDAQ official closing price. To the extent these securities are valued at the last sale price or NASDAQ official closing price, they are classified as Level 1 in the fair value hierarchy. In the event that no sale or official closing price on valuation date exists, these securities are generally valued at the mean between the last reported bid and ask prices, or at the last bid price in the absence of an ask price. These securities are classified as Level 2 in the fair value hierarchy.
Foreign equities traded on foreign securities exchanges are generally valued using pricing vendor services that provide model prices derived using adjustment factors based on information such as local closing price, relevant general and sector indices, currency fluctuations, depositary receipts, and futures, as applicable. Securities valued using such model prices are classified as Level 2 in the fair value hierarchy. The models generate an evaluated adjustment factor for each security, which is applied to the local closing price to adjust it for post closing market movements up to the time the Fund is valued. Utilizing that evaluated adjustment factor, the vendor provides an evaluated price for each security. If the vendor does not provide an evaluated price, securities are valued in accordance with exchange-traded common and preferred stock valuation policies discussed above.
Investments in open-end, non-exchange-traded mutual funds are valued at their net asset values as of the close of the NYSE on the date of valuation. These securities are classified as Level 1 in the fair value hierarchy since they may be purchased or sold at their net asset values on the date of valuation.
Securities and other assets that cannot be priced according to the methods described above are valued based on pricing methodologies approved by the Board. In the event that unobservable inputs are used when determining such valuations, the securities will be classified as Level 3 in the fair value hierarchy.
When determining the fair value of securities, some of the factors influencing the valuation include: the nature of any restrictions on disposition of the securities; assessment of the general liquidity of the securities; the issuer’s financial condition and the markets in which it does business; the cost of the investment; the size of the holding and the capitalization of the issuer; the prices of any recent transactions or bids/offers for such securities or any comparable securities; any available analyst media or other reports or information deemed reliable by the Manager regarding the issuer or the markets or industry in which it operates. Using fair value to price securities may result in a value that is different from a security’s
| | | | |
| PGIM Select Real Estate Fund | | | 27 | |
Notes to Financial Statements(continued)
most recent closing price and from the price used by other unaffiliated mutual funds to calculate their net asset values.
Illiquid Securities:Pursuant to Rule 22e-4 under the 1940 Act, the Fund has adopted a Board approved Liquidity Risk Management Program (“LRMP”) that requires, among other things, that the Fund limit its illiquid investments that are assets to no more than 15% of net assets. Illiquid securities are those that, because of the absence of a readily available market or due to legal or contractual restrictions on resale, may not reasonably be expected to be sold or disposed of in current market conditions in seven calendar days or less without the sale or disposition significantly changing the market value of the investment. The Fund may find it difficult to sell illiquid securities at the time considered most advantageous by its subadviser and may incur transaction costs that would not be incurred in the sale of securities that were freely marketable.
Restricted Securities:Securities acquired in unregistered, private sales from the issuing company or from an affiliate of the issuer are considered restricted as to disposition under federal securities law (“restricted securities”). Such restricted securities are valued pursuant to the valuation procedures noted above. Restricted securities that would otherwise be considered illiquid investments pursuant to the Fund’s LRMP because of legal restrictions on resale to the general public may be traded among qualified institutional buyers under Rule 144A of the Securities Act of 1933. Therefore, these Rule 144A securities, as well as commercial paper that is sold in private placements under Section 4(2) of the Securities Act of 1933, may be classified higher than “illiquid” under the LRMP (i.e. “moderately liquid” or “less liquid” investments). However, the liquidity of the Fund’s investments in restricted securities could be impaired if trading does not develop or declines.
Foreign Currency Translation:The books and records of the Fund are maintained in U.S. dollars. Foreign currency amounts are translated into U.S. dollars on the following basis:
(i) market value of investment securities, other assets and liabilities—at the current rates of exchange;
(ii) purchases and sales of investment securities, income and expenses—at the rates of exchange prevailing on the respective dates of such transactions.
Although the net assets of the Fund are presented at the foreign exchange rates and market values at the close of the period, the Fund does not generally isolate that portion of the results of operations arising as a result of changes in the foreign exchange rates from the fluctuations arising from changes in the market prices of long-term portfolio securities held at the end of the period. Similarly, the Fund does not isolate the effect of changes in foreign exchange rates from the fluctuations arising from changes in the market prices of long-term
portfolio securities sold during the period. Accordingly, holding period realized foreign currency gains (losses) are included in the reported net realized gains (losses) on investment transactions.
Net realized gains (losses) on foreign currency transactions represent net foreign exchange gains (losses) from the disposition of holdings of foreign currencies, currency gains (losses) realized between the trade and settlement dates on forward currency transactions, and the difference between the amounts of interest, dividends and foreign withholding taxes recorded on the Fund’s books and the U.S. dollar equivalent amounts actually received or paid. Net unrealized currency gains (losses) arise from valuing foreign currency denominated assets and liabilities (other than investments) at period end exchange rates.
Master Netting Arrangements:The Fund is subject to various Master Agreements, or netting arrangements, with select counterparties. These are agreements which a subadviser may have negotiated and entered into on behalf of all or a portion of the Fund. A master netting arrangement between the Fund and the counterparty permits the Fund to offset amounts payable by the Fund to the same counterparty against amounts to be received; and by the receipt of collateral from the counterparty by the Fund to cover the Fund’s exposure to the counterparty. However, there is no assurance that such mitigating factors are easily enforceable. In addition to master netting arrangements, the right to set-off exists when all the conditions are met such that each of the parties owes the other determinable amounts, the reporting party has the right to set-off the amount owed with the amount owed by the other party, the reporting party intends to set-off and the right of set-off is enforceable by law. During the reporting period, there was no intention to settle on a net basis and all amounts are presented on a gross basis on the Statement of Assets and Liabilities.
Rights:The Fund held rights acquired either through a direct purchase or pursuant to corporate actions. Rights entitle the holder to buy a proportionate amount of common stock, or such other security that the issuer may specify, at a specific price and time through the expiration dates. Such rights are held as long positions by the Fund until exercised, sold or expired. Rights are valued at fair value in accordance with the Board approved fair valuation procedures.
Securities Lending:The Fund lends its portfolio securities to banks and broker-dealers. The loans are secured by collateral at least equal to the market value of the securities loaned. Collateral pledged by each borrower is invested in an affiliated money market fund and is marked to market daily, based on the previous day’s market value, such that the value of the collateral exceeds the value of the loaned securities. In the event of significant appreciation in value of securities on loan on the last business day of the reporting period, the financial statements may reflect a collateral value that is less than the market value of the loaned securities. Such shortfall is remedied as described above. Loans are subject to termination at the option of the borrower or the Fund. Upon termination of the loan, the borrower will return to the Fund securities identical to the loaned securities. Should the borrower of the securities fail financially, the Fund has the right to repurchase the securities in the open market using the collateral.
| | | | |
| PGIM Select Real Estate Fund | | | 29 | |
Notes to Financial Statements(continued)
The Fund recognizes income, net of any rebate and securities lending agent fees, for lending its securities in the form of fees or interest on the investment of any cash received as collateral. The borrower receives all interest and dividends from the securities loaned and such payments are passed back to the lender in amounts equivalent thereto. The Fund also continues to recognize any unrealized gain (loss) in the market price of the securities loaned and on the change in the value of the collateral invested that may occur during the term of the loan. In addition, realized gain (loss) is recognized on changes in the value of the collateral invested upon liquidation of the collateral. Net earnings from securities lending are disclosed on the Statement of Operations as “Income from securities lending, net”.
Equity and Mortgage Real Estate Investment Trusts (collectively equity REITs):The Fund invested in equity REITs, which report information on the source of their distributions annually. Based on current and historical information, a portion of distributions received from equity REITs during the period is estimated to be dividend income, capital gain or return of capital and recorded accordingly. When material, these estimates are adjusted periodically when the actual source of distributions is disclosed by the equity REITs.
Securities Transactions and Net Investment Income:Securities transactions are recorded on the trade date. Realized gains (losses) from investment and currency transactions are calculated on the specific identification method. Dividend income is recorded on the ex-date, or for certain foreign securities, when the Fund becomes aware of such dividends. Expenses are recorded on an accrual basis, which may require the use of certain estimates by management that may differ from actual. Net investment income or loss (other than class specific expenses and waivers, which are allocated as noted below) and unrealized and realized gains (losses) are allocated daily to each class of shares based upon the relative proportion of adjusted net assets of each class at the beginning of the day. Class specific expenses and waivers, where applicable, are charged to the respective share classes. Class specific expenses include distribution fees and distribution fee waivers, shareholder servicing fees, transfer agent’s fees and expenses, registration fees and fee waivers and/or expense reimbursements, as applicable.
Taxes:It is the Fund’s policy to continue to meet the requirements of the Internal Revenue Code applicable to regulated investment companies and to distribute all of its taxable net investment income and capital gains, if any, to its shareholders. Therefore, no federal income tax provision is required. Withholding taxes on foreign dividends, interest and capital gains, if any, are recorded, net of reclaimable amounts, at the time the related income is earned.
Tax reform legislation commonly referred to as the Tax Cuts and Jobs Act permits a direct REIT shareholder to claim a 20% “qualified business income” deduction for ordinary REIT dividends. The tax legislation did not expressly permit regulated investment companies
(“RICs”) paying dividends attributable to such income to pass through this special treatment to its shareholders. On January 18, 2019, the Internal Revenue Service issued final regulations that permit RICs to pass through “qualified REIT dividends” to their shareholders.
Dividends and Distributions:The Fund expects to pay dividends from net investment income quarterly. Distributions from net realized capital and currency gains, if any, are declared and paid annually. Dividends and distributions to shareholders, which are determined in accordance with federal income tax regulations and which may differ from generally accepted accounting principles, are recorded on the ex-date. Permanent book/tax differences relating to income and gain (loss) are reclassified between total distributable earnings (loss) and paid-in capital in excess of par, as appropriate.
Estimates:The preparation of financial statements requires management to make estimates and assumptions that affect the reported amounts and disclosures in the financial statements. Actual results could differ from those estimates.
2. Agreements
The Fund has a management agreement with the Manager. Pursuant to this agreement, the Manager has responsibility for all investment advisory services and supervises the subadviser’s performance of such services. In addition, under the management agreement, the Manager provides all of the administrative functions necessary for the organization, operation and management of the Fund. The Manager administers the corporate affairs of the Fund and, in connection therewith, furnishes the Fund with office facilities, together with those ordinary clerical and bookkeeping services which are not being furnished by the Fund’s custodian and the Fund’s transfer agent. The Manager is also responsible for the staffing and management of dedicated groups of legal, marketing, compliance and related personnel necessary for the operation of the Fund. The legal, marketing, compliance and related personnel are also responsible for the management and oversight of the various service providers to the Fund, including, but not limited to, the custodian, transfer agent, and accounting agent.
The Manager has entered into a subadvisory agreement with PGIM, Inc., which provides subadvisory services to the Fund through its PGIM Real Estate unit. The subadvisory agreement provides that PGIM Real Estate will furnish investment advisory services in connection with the management of the Fund. In connection therewith, PGIM Real Estate is obligated to keep certain books and records of the Fund. The Manager pays for the services of PGIM Real Estate, the cost of compensation of officers of the Fund, occupancy and certain clerical and bookkeeping costs of the Fund. The Fund bears all other costs and expenses.
The management fee paid to the Manager is accrued daily and payable monthly at an annual rate of 0.80% of the Fund’s average daily net assets up to and including $1 billion, 0.78% of the next $2 billion, 0.76% of the next $2 billion, 0.75% of the next $5 billion and
| | | | |
| PGIM Select Real Estate Fund | | | 31 | |
Notes to Financial Statements(continued)
0.74% of the Fund’s average daily net assets in excess of $10 billion. The effective management fee rate before any waivers and/or expense reimbursements was 0.80% for the year ended October 31, 2019.
The Manager has contractually agreed, through February 28, 2021, to limit total annual operating expenses after fee waivers and/or expense reimbursements to 1.30% of average daily net assets for Class A shares, 2.05% of average daily net assets for Class C shares, 1.05% of average daily net assets for Class Z shares and 1.05% of average daily net assets for Class R6 shares. This contractual waiver excludes interest, brokerage, taxes (such as income and foreign withholding taxes, stamp duty and deferred tax expenses), acquired fund fees and expenses, extraordinary expenses, and certain other Fund expenses such as dividend and interest expense and broker charges on short sales. Where applicable, the Manager agrees to waive management fees or shared operating expenses on any share class to the same extent that it waives similar expenses on any other share class. In addition, total annual operating expenses for Class R6 shares will not exceed total annual operating expenses for Class Z shares. Fees and/or expenses waived and/or reimbursed by the Manager may be recouped by the Manager within the same fiscal year during which such waiver/reimbursement is made if such recoupment can be realized without exceeding the expense limit in effect at the time of the recoupment for that fiscal year.
The Trust, on behalf of the Fund, has a distribution agreement with Prudential Investment Management Services LLC (“PIMS”), which acts as the distributor of the Class A, Class C, Class Z and Class R6 shares of the Fund. The Fund compensates PIMS for distributing and servicing the Fund’s Class A and Class C shares, pursuant to the plans of distribution (the “Distribution Plans”), regardless of expenses actually incurred by PIMS. The distribution fees are accrued daily and payable monthly. No distribution or service fees are paid to PIMS as distributor of the Class Z or Class R6 shares of the Fund.
Pursuant to the Distribution Plans, the Fund compensates PIMS for distribution related activities at an annual rate of up to 0.30% and 1% of the average daily net assets of the Class A and Class C shares, respectively. PIMS has contractually agreed through February 28, 2021 to limit such fees to 0.25% of the average daily net assets of the Class A shares.
For the year ended October 31, 2019, PIMS received $7,134 in front-end sales charges resulting from sales of Class A shares. Additionally, for the year ended October 31, 2019, PIMS did not receive any contingent deferred sales charges imposed upon redemptions by certain Class A and Class C shareholders. From these fees, PIMS paid such sales charges to broker-dealers, who in turn paid commissions to salespersons and incurred other distribution costs.
PGIM Investments, PGIM, Inc., and PIMS are indirect, wholly-owned subsidiaries of Prudential Financial, Inc. (“Prudential”).
3. Other Transactions with Affiliates
Prudential Mutual Fund Services LLC (“PMFS”), an affiliate of PGIM Investments and an indirect, wholly-owned subsidiary of Prudential, serves as the Trust’s transfer agent. Transfer agent’s fees and expenses in the Statement of Operations include certain out-of-pocket expenses paid to non-affiliates, where applicable.
The Fund may invest its overnight sweep cash in the PGIM Core Ultra Short Bond Fund (the “Core Fund”), and its securities lending cash collateral in the PGIM Institutional Money Market Fund (the “Money Market Fund”), each a series of Prudential Investment Portfolios 2, registered under the 1940 Act and managed by PGIM Investments. Through the Fund’s investments in the mentioned underlying funds, PGIM Investments and/or its affiliates are paid fees or reimbursed for providing their services. In addition to the realized and unrealized gains on investments in the Core Fund and Money Market Fund, earnings from such investments are disclosed on the Statement of Operations as “Affiliated dividend income” and “Income from securities lending, net”, respectively.
The Fund may enter into certain securities purchase or sale transactions under Board approved Rule 17a-7 procedures. Rule 17a-7 is an exemptive rule under the 1940 Act, that subject to certain conditions, permits purchase and sale transactions among affiliated investment companies, or between an investment company and a person that is affiliated solely by reason of having a common (or affiliated) investment adviser, common directors, and/or common officers. Pursuant to the Rule 17a-7 procedures and consistent with guidance issued by the SEC, the Trust’s Chief Compliance Officer (“CCO”) prepares a quarterly summary of all such transactions for submission to the Board, together with the CCO’s written representation that all such 17a-7 transactions were effected in accordance with the Fund’s Rule 17a-7 procedures. For the year ended October 31, 2019, no 17a-7 transactions were entered into by the Fund.
4. Portfolio Securities
The aggregate cost of purchases and proceeds from sales of portfolio securities (excluding short-term investments and U.S. Government securities) for the year ended October 31, 2019, were $49,062,752 and $33,607,601, respectively.
A summary of the cost of purchases and proceeds from sales of shares of affiliated investments for the year ended October 31, 2019, is presented as follows:
| | | | |
| PGIM Select Real Estate Fund | | | 33 | |
Notes to Financial Statements(continued)
| | | | | | | | | | | | | | | | | | | | | | | | | | | | | | |
Value,
Beginning
of Year | | | Cost of
Purchases | | | Proceeds
from Sales | | | Change in
Unrealized
Gain
(Loss) | | | Realized
Gain
(Loss) | | | Value,
End of
Year | | | Shares,
End of
Year | | | Income | |
| | PGIM Core Ultra Short Bond Fund* | |
| $ | 125,211 | | | $ | 20,565,747 | | | $ | 20,130,034 | | | $ | — | | | $ | — | | | $ | 560,924 | | | | 560,924 | | | $ | 8,872 | |
| | PGIM Institutional Money Market Fund* | |
| | — | | | | 752,463 | | | | 752,463 | | | | — | | | | — | | | | — | | | | — | | | | 70 | ** |
| | | | | | | | | | | | | | | | | | | | | | | | | | | | | | |
| $ | 125,211 | | | $ | 21,318,210 | | | $ | 20,882,497 | | | $ | — | | | $ | — | | | $ | 560,924 | | | | | | | $ | 8,942 | |
| | | | | | | | | | | | | | | | | | | | | | | | | | | | | | |
| * | The Fund did not have any capital gain distributions during the reporting period. |
| ** | This amount is included in “Income from securities lending, net” on the Statement of Operations. |
5. Distributions and Tax Information
Distributions to shareholders, which are determined in accordance with federal income tax regulations and which may differ from generally accepted accounting principles, are recorded on the ex-date.
For the year ended October 31, 2019, the tax character of dividends paid by the Fund were $298,962 of ordinary income and $108,116 of long-term capital gains. For the year ended October 31, 2018, the tax character of dividends paid by the Fund was $196,538 of ordinary income.
As of October 31, 2019, the accumulated undistributed earnings on a tax basis were $1,147,221 of ordinary income and $129,363 of long-term capital gains.
The United States federal income tax basis of the Fund’s investments and the net unrealized appreciation as of October 31, 2019 were as follows:
| | | | | | |
Tax Basis | | Gross
Unrealized
Appreciation | | Gross
Unrealized
Depreciation | | Net
Unrealized
Appreciation |
| $25,960,240 | | $2,505,419 | | $(117,961) | | $2,387,458 |
The book basis differs from tax basis primarily due to deferred losses on wash sales, investments in passive foreign investment companies and other cost basis differences between financial and tax accounting.
The Manager has analyzed the Fund’s tax positions taken on federal, state and local income tax returns for all open tax years and has concluded that no provision for income tax is required in the Fund’s financial statements for the current reporting period. Since tax
authorities can examine previously filed tax returns, the Fund’s U.S. federal and state tax returns for each of the four fiscal years up to the most recent fiscal year ended October 31, 2019 are subject to such review.
6. Capital and Ownership
The Fund offers Class A, Class C, Class Z and Class R6 shares. Class A shares are sold with a maximum front-end sales charge of 5.50%. Investors who purchase $1 million or more of Class A shares and sell these shares within 12 months of purchase are subject to a contingent deferred sales charge (“CDSC”) of 1%, although they are not subject to an initial sales charge. The Class A CDSC is waived for certain retirement and/or benefit plans. A special exchange privilege is also available for shareholders who qualified to purchase Class A shares at net asset value. Class C shares are sold with a CDSC of 1% on sales made within 12 months of purchase. Class C shares will automatically convert to Class A shares on a monthly basis approximately 10 years after purchase. Class Z and Class R6 shares are not subject to any sales or redemption charge and are available exclusively for sale to a limited group of investors.
Under certain circumstances, an exchange may be made from specified share classes of the Fund to one or more other share classes of the Fund as presented in the table of transactions in shares of beneficial interest.
The Trust has authorized an unlimited number of shares of beneficial interest of the Fund at $0.001 par value per share, divided into four classes, designated Class A, Class C, Class Z and Class R6.
As of October 31, 2019, Prudential, through its affiliated entities, including affiliated funds (if applicable), owned 264,546 Class A shares, 1,156 Class C shares, 1,204 Class Z shares and 1,318,348 Class R6 shares of the Fund. At reporting period end, six shareholders of record, each holding greater than 5% of the Fund, held 91% of the Fund’s outstanding shares, of which 73% were held by an affiliate of Prudential.
Transactions in shares of beneficial interest were as follows:
| | | | | | | | |
Class A | | Shares | | | Amount | |
Year ended October 31, 2019: | | | | | | | | |
Shares sold | | | 132,295 | | | $ | 1,594,096 | |
Shares issued in reinvestment of dividends and distributions | | | 9,974 | | | | 105,367 | |
Shares reacquired | | | (57,723 | ) | | | (654,383 | ) |
| | | | | | | | |
Net increase (decrease) in shares outstanding | | | 84,546 | | | $ | 1,045,080 | |
| | | | | | | | |
Year ended October 31, 2018: | | | | | | | | |
Shares sold | | | 270,402 | | | $ | 2,782,141 | |
Shares issued in reinvestment of dividends and distributions | | | 2,972 | | | | 31,114 | |
Shares reacquired | | | (43,052 | ) | | | (457,139 | ) |
| | | | | | | | |
Net increase (decrease) in shares outstanding before conversion | | | 230,322 | | | | 2,356,116 | |
Shares reacquired upon conversion into other share class(es) | | | (1,701 | ) | | | (17,508 | ) |
| | | | | | | | |
Net increase (decrease) in shares outstanding | | | 228,621 | | | $ | 2,338,608 | |
| | | | | | | | |
| | | | |
| PGIM Select Real Estate Fund | | | 35 | |
Notes to Financial Statements(continued)
| | | | | | | | |
Class C | | Shares | | | Amount | |
Year ended October 31, 2019: | | | | | | | | |
Shares sold | | | 21,221 | | | $ | 249,773 | |
Shares issued in reinvestment of dividends and distributions | | | 204 | | | | 2,117 | |
Shares reacquired | | | (4 | ) | | | (47 | ) |
| | | | | | | | |
Net increase (decrease) in shares outstanding | | | 21,421 | | | $ | 251,843 | |
| | | | | | | | |
Year ended October 31, 2018: | | | | | | | | |
Shares issued in reinvestment of dividends and distributions | | | 111 | | | $ | 1,166 | |
Shares reacquired | | | (1,265 | ) | | | (13,090 | ) |
| | | | | | | | |
Net increase (decrease) in shares outstanding | | | (1,154 | ) | | $ | (11,924 | ) |
| | | | | | | | |
Class Z | | | | | | |
Year ended October 31, 2019: | | | | | | | | |
Shares sold | | | 499,090 | | | $ | 6,150,445 | |
Shares issued in reinvestment of dividends and distributions | | | 1,847 | | | | 22,724 | |
Shares reacquired | | | (24,885 | ) | | | (309,881 | ) |
| | | | | | | | |
Net increase (decrease) in shares outstanding | | | 476,052 | | | $ | 5,863,288 | |
| | | | | | | | |
Year ended October 31, 2018: | | | | | | | | |
Shares sold | | | 4,491 | | | $ | 47,268 | |
Shares issued in reinvestment of dividends and distributions | | | 362 | | | | 3,847 | |
Shares reacquired | | | (14,907 | ) | | | (157,950 | ) |
| | | | | | | | |
Net increase (decrease) in shares outstanding before conversion | | | (10,054 | ) | | | (106,835 | ) |
Shares issued upon conversion from other share class(es) | | | 1,698 | | | | 17,508 | |
| | | | | | | | |
Net increase (decrease) in shares outstanding | | | (8,356 | ) | | $ | (89,327 | ) |
| | | | | | | | |
Class R6 | | | | | | |
Year ended October 31, 2019: | | | | | | | | |
Shares sold | | | 706,723 | | | $ | 8,629,968 | |
Shares issued in reinvestment of dividends and distributions | | | 26,210 | | | | 276,839 | |
| | | | | | | | |
Net increase (decrease) in shares outstanding | | | 732,933 | | | $ | 8,906,807 | |
| | | | | | | | |
Year ended October 31, 2018: | | | | | | | | |
Shares issued in reinvestment of dividends and distributions | | | 15,341 | | | $ | 160,410 | |
| | | | | | | | |
Net increase (decrease) in shares outstanding | | | 15,341 | | | $ | 160,410 | |
| | | | | | | | |
7. Borrowings
The Trust, on behalf of the Fund, along with other affiliated registered investment companies (the “Funds”), is a party to a Syndicated Credit Agreement (“SCA”) with a group of banks. The purpose of the SCA is to provide an alternative source of temporary funding for capital share redemptions. The table below provides details of the current SCA in effect at the reporting period-end as well as the prior SCA.
| | | | |
| | | Current SCA | | Prior SCA |
Term of Commitment | | 10/3/2019 – 10/1/2020 | | 10/4/2018 – 10/2/2019 |
Total Commitment | | $ 900 million | | $ 900 million |
Annualized Commitment Fee on the Unused Portion of the SCA | | 0.15% | | 0.15% |
| | | | |
| | | Current SCA | | Prior SCA |
Annualized Interest Rate on Borrowings | | 1.20% plus the higher of (1) the effective federal funds rate, (2) the one-month LIBOR rate or (3) zero percent | | 1.25% plus the higher of (1) the effective federal funds rate, (2) the one-month LIBOR rate or (3) zero percent |
Certain affiliated registered investment companies that are parties to the SCA include portfolios that are subject to a predetermined mathematical formula used to manage certain benefit guarantees offered under variable annuity contracts. The formula may result in large scale asset flows into and out of these portfolios. Consequently, these portfolios may be more likely to utilize the SCA for purposes of funding redemptions. It may be possible for those portfolios to fully exhaust the committed amount of the SCA, thereby requiring the Manager to allocate available funding per a Board-approved methodology designed to treat the Funds in the SCA equitably.
The Fund did not utilize the SCA during the year ended October 31, 2019.
8. Risks of Investing in the Fund
The Fund’s risks include, but are not limited to, some or all of the risks discussed below:
Equity and Equity-Related Securities Risks:The value of a particular security could go down and you could lose money. In addition to an individual security losing value, the value of the equity markets or a sector in which the Fund invests could go down. The Fund’s holdings can vary significantly from broad market indexes and the performance of the Fund can deviate from the performance of these indexes. Different parts of a market can react differently to adverse issuer, market, regulatory, political and economic developments.
Foreign Securities Risk:The Fund’s investments in securities of foreign issuers or issuers with significant exposure to foreign markets involve additional risk. Foreign countries in which the Fund may invest may have markets that are less liquid, less regulated and more volatile than US markets. The value of the Fund’s investments may decline because of factors affecting the particular issuer as well as foreign markets and issuers generally, such as unfavorable government actions, and political or financial instability.
Market and Credit Risk:Securities markets may be volatile and the market prices of the Fund’s securities may decline. Securities fluctuate in price based on changes in an issuer’s financial condition and overall market and economic conditions. If the market prices of the securities owned by the Fund fall, the value of an investment in the Fund will decline. Additionally, the Fund may also be exposed to credit risk in the event that an issuer or guarantor fails to perform or that an institution or entity with which the Fund has unsettled or open transactions defaults.
Non-diversification Risk:A non-diversified Fund may invest a greater percentage of its assets in the securities of a single company or industry than a diversified fund. Investing in a
| | | | |
| PGIM Select Real Estate Fund | | | 37 | |
Notes to Financial Statements(continued)
non-diversified fund involves greater risk than investing in a diversified fund because a loss resulting from the decline in value of any one security may represent a greater portion of the total assets of a non-diversified fund.
Risks of Investing in equity REITs:Real estate securities are subject to similar risks as direct investments in real estate and mortgages, and their value will depend on the value of the underlying properties or the underlying loans or interests. The underlying loans may be subject to the risks of default or of payments that occur earlier or later than expected, and such loans may also include so-called “subprime” mortgages. The value of these securities will rise and fall in response to many factors, including economic conditions, the demand for rental property and interest rates. In particular, the value of these securities may decline when interest rates rise and will also be affected by the real estate market and by the management of the underlying properties.
In addition, investing in equity REITs involves certain unique risks in addition to those risks associated with investing in the real estate industry in general. Equity REITs may be affected by changes in the value of the underlying property owned by the equity REITs, while mortgage REITs may be affected by the quality of any credit extended. Equity REITs are dependent upon management skills, may not be diversified geographically or by property/mortgage asset type, and are subject to heavy cash flow dependency, default by borrowers and self-liquidation. Since equity REITs are relatively smaller in size when compared to the broader market, and smaller companies tend to be more volatile than larger companies, they may be more volatile and/or more illiquid than other types of equity securities. Equity REITs are subject to interest rate risks. Equity REITs may incur significant amounts of leverage. The Fund will indirectly bear a portion of the expenses, including management fees, paid by each equity REIT in which it invests, in addition to the expenses of the Fund.
9. Recent Accounting Pronouncements and Reporting Updates
In August 2018, the FASB issued Accounting Standards Update (“ASU”) No. 2018-13, which changes certain fair value measurement disclosure requirements. The new ASU, in addition to other modifications and additions, removes the requirement to disclose the amount and reasons for transfers between Level 1 and Level 2 of the fair value hierarchy, and the Fund’s policy for the timing of transfers between levels. The amendments are effective for financial statements issued for fiscal years beginning after December 15, 2019, and interim periods within those fiscal years. The Manager has evaluated the implications of certain provisions of the ASU and has determined to early adopt aspects related to the removal and modification of certain fair value measurement disclosures under the ASU effective immediately. The Manager continues to evaluate certain other provisions of the ASU and does not expect a material impact to financial statement disclosures.
Financial Highlights
| | | | | | | | | | | | | | | | | | | | |
| Class A Shares | |
| | | Year Ended October 31, | |
| | | 2019 | | | 2018 | | | 2017 | | | 2016 | | | 2015 | |
| Per Share Operating Performance(a): | | | | | | | | | | | | | | | | | | | | |
| Net Asset Value, Beginning of Year | | | $10.33 | | | | $10.54 | | | | $10.00 | | | | $10.71 | | | | $10.30 | |
| Income (loss) from investment operations: | | | | | | | | | | | | | | | | | | | | |
| Net investment income (loss) | | | 0.16 | | | | 0.12 | | | | 0.12 | | | | 0.17 | | | | 0.09 | |
| Net realized and unrealized gain (loss) on investment and foreign currency transactions | | | 3.10 | | | | (0.08 | ) | | | 0.76 | | | | (0.18 | ) | | | 0.41 | |
| Total from investment operations | | | 3.26 | | | | 0.04 | | | | 0.88 | | | | (0.01 | ) | | | 0.50 | |
| Less Dividends and Distributions: | | | | | | | | | | | | | | | | | | | | |
| Dividends from net investment income | | | (0.21 | ) | | | (0.25 | ) | | | (0.11 | ) | | | (0.28 | ) | | | - | |
| Distributions from net realized gains | | | (0.20 | ) | | | - | | | | (0.23 | ) | | | (0.42 | ) | | | (0.09 | ) |
| Total dividends and distributions | | | (0.41 | ) | | | (0.25 | ) | | | (0.34 | ) | | | (0.70 | ) | | | (0.09 | ) |
| Net asset value, end of year | | | $13.18 | | | | $10.33 | | | | $10.54 | | | | $10.00 | | | | $10.71 | |
| Total Return(b): | | | 32.64% | | | | 0.37% | | | | 9.08% | | | | 0.01% | | | | 4.85% | |
| Ratios/Supplemental Data: | |
| Net assets, end of year (000) | | | $4,447 | | | | $2,612 | | | | $256 | | | | $185 | | | | $62 | |
| Average net assets (000) | | | $3,205 | | | | $1,645 | | | | $242 | | | | $119 | | | | $27 | |
| Ratios to average net assets(c)(d): | | | | | | | | | | | | | | | | | | | | |
| Expenses after waivers and/or expense reimbursement | | | 1.30% | | | | 1.30% | | | | 1.30% | | | | 1.33% | | | | 1.35% | |
| Expenses before waivers and/or expense reimbursement | | | 3.04% | | | | 4.02% | | | | 4.63% | | | | 4.81% | | | | 5.16% | |
| Net investment income (loss) | | | 1.36% | | | | 1.14% | | | | 1.15% | | | | 1.70% | | | | 0.86% | |
| Portfolio turnover rate(e) | | | 242% | | | | 202% | | | | 142% | | | | 158% | | | | 150% | |
| (a) | Calculated based on average shares outstanding during the year. |
| (b) | Total return does not consider the effects of sales loads. Total return is calculated assuming a purchase of a share on the first day and a sale on the last day of each year reported and includes reinvestment of dividends and distributions, if any. Total returns may reflect adjustments to conform to generally accepted accounting principles. |
| (c) | Effective November 1, 2017, class specific expenses include transfer agent fees and expenses and registration fees, which are charged to their respective share class. |
| (d) | Does not include expenses of the underlying funds in which the Fund invests. |
| (e) | The Fund’s portfolio turnover rate is calculated in accordance with regulatory requirements, without regard to transactions involving short-term investments and certain derivatives. If such transactions were included, the Fund’s portfolio turnover rate may be higher. |
See Notes to Financial Statements.
| | | | |
| PGIM Select Real Estate Fund | | | 39 | |
Financial Highlights(continued)
| | | | | | | | | | | | | | | | | | | | |
| Class C Shares | |
| | | | | | Year Ended October 31, | |
| | | 2019 | | | 2018 | | | 2017 | | | 2016 | | | 2015 | |
| Per Share Operating Performance(a): | | | | | | | | | | | | | | | | | | | | |
| Net Asset Value, Beginning of Year | | | $10.23 | | | | $10.44 | | | | $9.94 | | | | $10.60 | | | | $10.28 | |
| Income (loss) from investment operations: | | | | | | | | | | | | | | | | | | | | |
| Net investment income (loss) | | | 0.06 | | | | 0.09 | | | | 0.04 | | | | 0.11 | | | | (0.03 | ) |
| Net realized and unrealized gain (loss) on investment and foreign currency transactions | | | 3.08 | | | | (0.12 | ) | | | 0.75 | | | | (0.18 | ) | | | 0.44 | |
| Total from investment operations | | | 3.14 | | | | (0.03 | ) | | | 0.79 | | | | (0.07 | ) | | | 0.41 | |
| Less Dividends and Distributions: | | | | | | | | | | | | | | | | | | | | |
| Dividends from net investment income | | | (0.14 | ) | | | (0.18 | ) | | | (0.06 | ) | | | (0.17 | ) | | | - | |
| Distributions from net realized gains | | | (0.20 | ) | | | - | | | | (0.23 | ) | | | (0.42 | ) | | | (0.09 | ) |
| Total dividends and distributions | | | (0.34 | ) | | | (0.18 | ) | | | (0.29 | ) | | | (0.59 | ) | | | (0.09 | ) |
| Net asset value, end of year | | | $13.03 | | | | $10.23 | | | | $10.44 | | | | $9.94 | | | | $10.60 | |
| Total Return(b): | | | 31.59% | | | | (0.34 | )% | | | 8.11% | | | | (0.63 | )% | | | 3.98% | |
| Ratios/Supplemental Data: | |
| Net assets, end of year (000) | | | $351 | | | | $56 | | | | $69 | | | | $59 | | | | $36 | |
| Average net assets (000) | | | $148 | | | | $64 | | | | $70 | | | | $48 | | | | $46 | |
| Ratios to average net assets(c)(d): | | | | | | | | | | | | | | | | | | | | |
| Expenses after waivers and/or expense reimbursement | | | 2.05% | | | | 2.05% | | | | 2.05% | | | | 2.08% | | | | 2.10% | |
| Expenses before waivers and/or expense reimbursement | | | 11.73% | | | | 29.08% | | | | 5.33% | | | | 5.64% | | | | 5.54% | |
| Net investment income (loss) | | | 0.54% | | | | 0.91% | | | | 0.36% | | | | 1.08% | | | | (0.30 | )% |
| Portfolio turnover rate(e) | | | 242% | | | | 202% | | | | 142% | | | | 158% | | | | 150% | |
| (a) | Calculated based on average shares outstanding during the year. |
| (b) | Total return does not consider the effects of sales loads. Total return is calculated assuming a purchase of a share on the first day and a sale on the last day of each year reported and includes reinvestment of dividends and distributions, if any. Total returns may reflect adjustments to conform to generally accepted accounting principles. |
| (c) | Effective November 1, 2017, class specific expenses include transfer agent fees and expenses and registration fees, which are charged to their respective share class. |
| (d) | Does not include expenses of the underlying funds in which the Fund invests. |
| (e) | The Fund’s portfolio turnover rate is calculated in accordance with regulatory requirements, without regard to transactions involving short-term investments and certain derivatives. If such transactions were included, the Fund’s portfolio turnover rate may be higher. |
See Notes to Financial Statements.
| | | | | | | | | | | | | | | | | | | | |
| Class Z Shares | |
| | | | | | Year Ended October 31, | |
| | | 2019 | | | 2018 | | | 2017 | | | 2016 | | | 2015 | |
| Per Share Operating Performance(a): | | | | | | | | | | | | | | | | | | | | |
| Net Asset Value, Beginning of Year | | | $10.34 | | | | $10.56 | | | | $10.02 | | | | $10.74 | | | | $10.31 | |
| Income (loss) from investment operations: | | | | | | | | | | | | | | | | | | | | |
| Net investment income (loss) | | | 0.19 | | | | 0.22 | | | | 0.15 | | | | 0.21 | | | | 0.10 | |
| Net realized and unrealized gain (loss) on investment and foreign currency transactions | | | 3.11 | | | | (0.16 | ) | | | 0.76 | | | | (0.18 | ) | | | 0.42 | |
| Total from investment operations | | | 3.30 | | | | 0.06 | | | | 0.91 | | | | 0.03 | | | | 0.52 | |
| Less Dividends and Distributions: | | | | | | | | | | | | | | | | | | | | |
| Dividends from net investment income | | | (0.24 | ) | | | (0.28 | ) | | | (0.14 | ) | | | (0.33 | ) | | | - | |
| Distributions from net realized gains | | | (0.20 | ) | | | - | | | | (0.23 | ) | | | (0.42 | ) | | | (0.09 | ) |
| Total dividends and distributions | | | (0.44 | ) | | | (0.28 | ) | | | (0.37 | ) | | | (0.75 | ) | | | (0.09 | ) |
| Net asset value, end of year | | | $13.20 | | | | $10.34 | | | | $10.56 | | | | $10.02 | | | | $10.74 | |
| Total Return(b): | | | 33.02% | | | | 0.51% | | | | 9.32% | | | | 0.36% | | | | 5.04% | |
| Ratios/Supplemental Data: | |
| Net assets, end of year (000) | | | $6,366 | | | | $65 | | | | $154 | | | | $138 | | | | $107 | |
| Average net assets (000) | | | $1,621 | | | | $145 | | | | $148 | | | | $139 | | | | $39 | |
| Ratios to average net assets(c)(d): | | | | | | | | | | | | | | | | | | | | |
| Expenses after waivers and/or expense reimbursement | | | 1.05% | | | | 1.05% | | | | 1.05% | | | | 1.08% | | | | 1.10% | |
| Expenses before waivers and/or expense reimbursement | | | 2.85% | | | | 14.17% | | | | 4.35% | | | | 4.82% | | | | 5.16% | |
| Net investment income (loss) | | | 1.48% | | | | 2.07% | | | | 1.43% | | | | 2.09% | | | | 0.98% | |
| Portfolio turnover rate(e) | | | 242% | | | | 202% | | | | 142% | | | | 158% | | | | 150% | |
| (a) | Calculated based on average shares outstanding during the year. |
| (b) | Total return is calculated assuming a purchase of a share on the first day and a sale on the last day of each year reported and includes reinvestment of dividends and distributions, if any. Total returns may reflect adjustments to conform to generally accepted accounting principles. |
| (c) | Effective November 1, 2017, class specific expenses include transfer agent fees and expenses and registration fees, which are charged to their respective share class. |
| (d) | Does not include expenses of the underlying funds in which the Fund invests. |
| (e) | The Fund’s portfolio turnover rate is calculated in accordance with regulatory requirements, without regard to transactions involving short-term investments and certain derivatives. If such transactions were included, the Fund’s portfolio turnover rate may be higher. |
See Notes to Financial Statements.
| | | | |
| PGIM Select Real Estate Fund | | | 41 | |
Financial Highlights(continued)
| | | | | | | | | | | | | | | | | | | | |
| Class R6 Shares | |
| | | Year Ended October 31, | |
| | | 2019 | | | 2018 | | | 2017 | | | 2016 | | | 2015 | |
| Per Share Operating Performance(a): | | | | | | | | | | | | | | | | | | | | |
| Net Asset Value, Beginning of Year | | | $10.19 | | | | $10.40 | | | | $9.88 | | | | $10.63 | | | | $10.31 | |
| Income (loss) from investment operations: | | | | | | | | | | | | | | | | | | | | |
| Net investment income (loss) | | | 0.18 | | | | 0.20 | | | | 0.14 | | | | 0.22 | | | | 0.10 | |
| Net realized and unrealized gain (loss) on investment and foreign currency transactions | | | 3.07 | | | | (0.13 | ) | | | 0.75 | | | | (0.20 | ) | | | 0.41 | |
| Total from investment operations | | | 3.25 | | | | 0.07 | | | | 0.89 | | | | 0.02 | | | | 0.51 | |
| Less Dividends and Distributions: | | | | | | | | | | | | | | | | | | | | |
| Dividends from net investment income | | | (0.24 | ) | | | (0.28 | ) | | | (0.14 | ) | | | (0.35 | ) | | | (0.10 | ) |
| Distributions from net realized gains | | | (0.20 | ) | | | - | | | | (0.23 | ) | | | (0.42 | ) | | | (0.09 | ) |
| Total dividends and distributions | | | (0.44 | ) | | | (0.28 | ) | | | (0.37 | ) | | | (0.77 | ) | | | (0.19 | ) |
| Net asset value, end of year | | | $13.00 | | | | $10.19 | | | | $10.40 | | | | $9.88 | | | | $10.63 | |
| Total Return(b): | | | 33.02% | | | | 0.62% | | | | 9.25% | | | | 0.30% | | | | 5.01% | |
| Ratios/Supplemental Data: | |
| Net assets, end of year (000) | | | $17,138 | | | | $5,970 | | | | $5,932 | | | | $5,441 | | | | $5,423 | |
| Average net assets (000) | | | $8,739 | | | | $6,039 | | | | $5,687 | | | | $5,413 | | | | $5,288 | |
| Ratios to average net assets(c)(d): | | | | | | | | | | | | | | | | | | | | |
| Expenses after waivers and/or expense reimbursement | | | 1.05% | | | | 1.05% | | | | 1.05% | | | | 1.08% | | | | 1.10% | |
| Expenses before waivers and/or expense reimbursement | | | 2.25% | | | | 3.07% | | | | 4.02% | | | | 4.40% | | | | 4.51% | |
| Net investment income (loss) | | | 1.56% | | | | 1.89% | | | | 1.42% | | | | 2.18% | | | | 0.96% | |
| Portfolio turnover rate(e) | | | 242% | | | | 202% | | | | 142% | | | | 158% | | | | 150% | |
| (a) | Calculated based on average shares outstanding during the year. |
| (b) | Total return is calculated assuming a purchase of a share on the first day and a sale on the last day of each year reported and includes reinvestment of dividends and distributions, if any. Total returns may reflect adjustments to conform to generally accepted accounting principles. |
| (c) | Effective November 1, 2017, class specific expenses include transfer agent fees and expenses and registration fees, which are charged to their respective share class. |
| (d) | Does not include expenses of the underlying funds in which the Fund invests. |
| (e) | The Fund’s portfolio turnover rate is calculated in accordance with regulatory requirements, without regard to transactions involving short-term investments and certain derivatives. If such transactions were included, the Fund’s portfolio turnover rate may be higher. |
See Notes to Financial Statements.
Report of Independent Registered Public Accounting Firm
To the Shareholders of PGIM Select Real Estate Fund and Board of Trustees
Prudential Investment Portfolios 9:
Opinion on the Financial Statements
We have audited the accompanying statement of assets and liabilities of PGIM Select Real Estate Fund, a series of Prudential Investment Portfolios 9, (the Fund), including the schedule of investments, as of October 31, 2019, the related statement of operations for the year then ended, the statements of changes in net assets for each of the years in thetwo-year period ended October 31, 2019, and the related notes (collectively, the financial statements) and the financial highlights for the years indicated therein. In our opinion, the financial statements and financial highlights present fairly, in all material respects, the financial position of the Fund as of October 31, 2019, the results of its operations for the year then ended, the changes in its net assets for each of the years in the two-year period ended October 31, 2019, and the financial highlights for the years indicated therein, in conformity with U.S. generally accepted accounting principles.
Basis for Opinion
These financial statements and financial highlights are the responsibility of the Fund’s management. Our responsibility is to express an opinion on these financial statements and financial highlights based on our audits. We are a public accounting firm registered with the Public Company Accounting Oversight Board (United States) (PCAOB) and are required to be independent with respect to the Fund in accordance with the U.S. federal securities laws and the applicable rules and regulations of the Securities and Exchange Commission and the PCAOB.
We conducted our audits in accordance with the standards of the PCAOB. Those standards require that we plan and perform the audit to obtain reasonable assurance about whether the financial statements and financial highlights are free of material misstatement, whether due to error or fraud. Our audits included performing procedures to assess the risks of material misstatement of the financial statements and financial highlights, whether due to error or fraud, and performing procedures that respond to those risks. Such procedures included examining, on a test basis, evidence regarding the amounts and disclosures in the financial statements and financial highlights. Such procedures also included confirmation of securities owned as of October 31, 2019, by correspondence with the custodian, transfer agent, and brokers, or by other appropriate auditing procedures when replies were not received. Our audits also included evaluating the accounting principles used and significant estimates made by management, as well as evaluating the overall presentation of the financial statements and financial highlights. We believe that our audits provide a reasonable basis for our opinion.

We have served as the auditor of one or more PGIM and/or Prudential Retail investment companies since 2003.
New York, New York
December 19, 2019
| | | | |
| PGIM Select Real Estate Fund | | | 43 | |
Federal Income Tax Information(unaudited)
We are advising you that during the fiscal year ended October 31, 2019, the Fund reports the maximum amount allowed per share but not less than $0.13 for Class A, C, Z and R6 shares as a capital gain distribution in accordance with Section 852(b)(3)(C) of the Internal Revenue Code.
For the year ended October 31, 2019, the Fund reports the maximum amount allowable under Section 854 of the Internal Revenue Code, but not less than 23.30% of the ordinary income dividends paid during the year as qualified dividend income.
In January 2020, you will be advised on IRS Form 1099-DIV or substitute 1099-DIV as to the federal tax status of the distributions received by you in calendar year 2019.
INFORMATION ABOUT BOARD MEMBERS AND OFFICERS(unaudited)
Information about Board Members and Officers of the Fund is set forth below. Board Members who are not deemed to be “interested persons” of the Fund, as defined in the 1940 Act, are referred to as “Independent Board Members.” Board Members who are deemed to be “interested persons” of the Fund are referred to as “Interested Board Members.” The Board Members are responsible for the overall supervision of the operations of the Fund and perform the various duties imposed on the directors of investment companies by the 1940 Act. The Board in turn elects the Officers, who are responsible for administering theday-to-day operations of the Fund.
| | | | | | |
| Independent Board Members | | | | |
| | | | |
Name Date of Birth Position(s) Portfolios Overseen | | Principal Occupation(s) During Past Five Years | | Other Directorships Held During Past Five Years | | Length of Board Service |
| | | | |
Ellen S. Alberding 3/11/58 Board Member Portfolios Overseen: 96 | | President and Board Member, The Joyce Foundation (charitable foundation) (since 2002); Vice Chair, City Colleges of Chicago (community college system) (2011-2015); Trustee, National Park Foundation (charitable foundation for national park system) (2009-2018); Trustee, Economic Club of Chicago (since 2009); Trustee, Loyola University (since 2018). | | None. | | Since September 2013 |
| | | | |
Kevin J. Bannon 7/13/52 Board Member Portfolios Overseen: 96 | | Retired; Managing Director (April2008-May 2015) and Chief Investment Officer (October 2008-November 2013) of Highmount Capital LLC (registered investment adviser); formerly Executive Vice President and Chief Investment Officer (April 1993-August 2007) of Bank of New York Company; President (May2003-May 2007) of BNY Hamilton Family of Mutual Funds. | | Director of Urstadt Biddle Properties (equity real estate investment trust) (since September 2008). | | Since July 2008 |
PGIM Select Real Estate Fund
| | | | | | |
| Independent Board Members | | | | |
| | | | |
Name Date of Birth Position(s) Portfolios Overseen | | Principal Occupation(s) During Past Five Years | | Other Directorships Held During Past Five Years | | Length of Board Service |
| | | | |
Linda W. Bynoe 7/9/52 Board Member Portfolios Overseen: 96 | | President and Chief Executive Officer (since March 1995) and formerly Chief Operating Officer (December 1989-February 1995) of Telemat Ltd. (management consulting); formerly Vice President (January 1985-June 1989) at Morgan Stanley & Co. (broker-dealer). | | Director of Anixter International, Inc. (communication products distributor) (since January 2006); Director of Northern Trust Corporation (financial services) (since April 2006); Trustee of Equity Residential (residential real estate) (since December 2009). | | Since March 2005 |
| | | | |
Barry H. Evans 11/2/60 Board Member Portfolios Overseen: 95 | | Retired; formerly President (2005 – 2016), Global Chief Operating Officer (2014– 2016), Chief Investment Officer – Global Head of Fixed Income (1998-2014), and various portfolio manager roles (1986-2006), Manulife Asset Management U.S. | | Formerly Director, Manulife Trust Company (2011-2018); formerly Director, Manulife Asset Management Limited (2015-2017); formerly Chairman of the Board of Directors of Manulife Asset Management U.S. (2005-2016); formerly Chairman of the Board, Declaration Investment Management and Research (2008-2016). | | Since September 2017 |
| | | | |
Keith F. Hartstein 10/13/56 Board Member & Independent Chair Portfolios Overseen: 96 | | Retired; Member (since November 2014) of the Governing Council of the Independent Directors Council (organization of independent mutual fund directors); formerly President and Chief Executive Officer (2005-2012), Senior Vice President (2004-2005), Senior Vice President of Sales and Marketing (1997-2004), and various executive management positions (1990-1997), John Hancock Funds, LLC (asset management); Chairman, Investment Company Institute’s Sales Force Marketing Committee (2003-2008). | | None. | | Since September 2013 |
Visit our website at pgiminvestments.com
| | | | | | |
| Independent Board Members | | | | |
| | | | |
Name Date of Birth Position(s) Portfolios Overseen | | Principal Occupation(s) During Past Five Years | | Other Directorships Held During Past Five Years | | Length of Board Service |
| | | | |
Laurie Simon Hodrick 9/29/62 Board Member Portfolios Overseen: 95 | | A. Barton Hepburn Professor Emerita of Economics in the Faculty of Business, Columbia Business School (since 2018); Visiting Professor of Law, Stanford Law School (since 2015); Visiting Fellow at the Hoover Institution, Stanford University (since 2015); Sole Member, ReidCourt LLC (since 2008) (a consulting firm); formerly A. Barton Hepburn Professor of Economics in the Faculty of Business, Columbia Business School (1996-2017); formerly Managing Director, Global Head of Alternative Investment Strategies, Deutsche Bank (2006-2008). | | Independent Director, Synnex Corporation (since April 2019) (information technology); Independent Director, Kabbage, Inc. (since July 2018) (financial services); Independent Director, Corporate Capital Trust (2017-2018) (a business development company). | | Since September 2017 |
| | | | |
Michael S. Hyland, CFA 10/4/45 Board Member Portfolios Overseen: 96 | | Retired (since February 2005); formerly Senior Managing Director (July 2001-February 2005) of Bear Stearns & Co, Inc.; Global Partner, INVESCO (1999-2001); Managing Director and President of Salomon Brothers Asset Management (1989-1999). | | None. | | Since July 2008 |
| | | | |
Brian K. Reid 9/22/61 Board Member Portfolios Overseen: 95 | | Retired; formerly Chief Economist for the Investment Company Institute (ICI) (2005-2017); formerly Senior Economist and Director of Industry and Financial Analysis at the ICI (1998-2004); formerly Senior Economist, Industry and Financial Analysis at the ICI (1996-1998); formerly Staff Economist at the Federal Reserve Board (1989-1996); Director, ICI Mutual Insurance Company (2012-2017). | | None. | | Since March 2018 |
PGIM Select Real Estate Fund
| | | | | | |
Independent Board Members | | | | |
| | | | |
Name Date of Birth Position(s) Portfolios Overseen | | Principal Occupation(s) During Past Five Years | | Other Directorships Held During Past Five Years | | Length of Board Service |
| | | | |
Grace C. Torres 6/28/59 Board Member Portfolios Overseen: 95 | | Retired; formerly Treasurer and Principal Financial and Accounting Officer of the PGIM Funds, Target Funds, Advanced Series Trust, Prudential Variable Contract Accounts and The Prudential Series Fund (1998-June 2014); Assistant Treasurer (March 1999-June 2014) and Senior Vice President (September 1999-June 2014) of PGIM Investments LLC; Assistant Treasurer (May 2003-June 2014) and Vice President (June 2005-June 2014) of AST Investment Services, Inc.; Senior Vice President and Assistant Treasurer (May 2003-June 2014) of Prudential Annuities Advisory Services, Inc. | | Formerly Director (July 2015-January 2018) of Sun Bancorp, Inc. N.A. and Sun National Bank; Director (since January 2018) of OceanFirst Financial Corp. and OceanFirst Bank. | | Since November 2014 |
| | | | | | |
Interested Board Members | | | | |
| | | | |
Name Date of Birth Position(s) Portfolios Overseen | | Principal Occupation(s) During Past Five Years | | Other Directorships Held During Past Five Years | | Length of Board Service |
| | | | |
Stuart S. Parker 10/5/62 Board Member & President Portfolios Overseen: 96 | | President of PGIM Investments LLC (formerly known as Prudential Investments LLC) (since January 2012); Executive Vice President of Prudential Investment Management Services LLC (since December 2012); formerly Executive Vice President of Jennison Associates LLC and Head of Retail Distribution of PGIM Investments LLC (June 2005-December 2011). | | None. | | Since January 2012 |
Visit our website at pgiminvestments.com
| | | | | | |
Interested Board Members | | | | |
| | | | |
Name Date of Birth Position(s) Portfolios Overseen | | Principal Occupation(s) During Past Five Years | | Other Directorships Held During Past Five Years | | Length of Board Service |
| | | | |
Scott E. Benjamin 5/21/73 Board Member & Vice President Portfolios Overseen:96 | | Executive Vice President (since June 2009) of PGIM Investments LLC; Executive Vice President (June 2009-June 2012) and Vice President (since June 2012) of Prudential Investment Management Services LLC; Executive Vice President (since September 2009) of AST Investment Services, Inc.; Senior Vice President of Product Development and Marketing, PGIM Investments (since February 2006); formerly Vice President of Product Development and Product Management, PGIM Investments LLC (2003-2006). | | None. | | Since March 2010 |
| | | | |
| Fund Officers(a) | | | | |
| | | |
Name Date of Birth Fund Position | | Principal Occupation(s) During Past Five Years | | Length of
Service as Fund
Officer |
| | | |
Raymond A. O’Hara 9/11/55 Chief Legal Officer | | Vice President and Corporate Counsel (since July 2010) of Prudential Insurance Company of America (Prudential); Vice President (March 2011-Present) of Pruco Life Insurance Company and Pruco Life Insurance Company of New Jersey; Vice President and Corporate Counsel (March 2011-Present) of Prudential Annuities Life Assurance Corporation; Chief Legal Officer of PGIM Investments LLC (since June 2012); Chief Legal Officer of Prudential Mutual Fund Services LLC (since June 2012) and Corporate Counsel of AST Investment Services, Inc. (since June 2012); formerly Assistant Vice President and Corporate Counsel (September 2008-July 2010) of The Hartford Financial Services Group, Inc.; formerly Associate (September 1980-December 1987) and Partner (January 1988–August 2008) of Blazzard & Hasenauer, P.C. (formerly, Blazzard, Grodd & Hasenauer, P.C.). | | Since June 2012 |
PGIM Select Real Estate Fund
| | | | |
| Fund Officers(a) | | | | |
| | | |
Name Date of Birth Fund Position | | Principal Occupation(s) During Past Five Years | | Length of Service as Fund Officer |
| | | |
Dino Capasso 8/19/74 Chief Compliance Officer | | Chief Compliance Officer (July 2019-Present) of PGIM Investments LLC; Chief Compliance Officer (July 2019-Present) of the PGIM Funds, Target Funds, Advanced Series Trust, The Prudential Series Fund, Prudential’s Gibraltar Fund, Inc., PGIM Global High Yield Fund, Inc., and PGIM High Yield Bond Fund, Inc.; Vice President and Deputy Chief Compliance Officer (June 2017-2019) of PGIM Investments LLC; formerly, Senior Vice President and Senior Counsel (January 2016-June 2017), and Vice President and Counsel (February 2012-December 2015) of Pacific Investment Management Company LLC. | | Since March 2018 |
| | | |
Andrew R. French 12/22/62 Secretary | | Vice President of PGIM Investments LLC (December 2018-Present); formerly Vice President and Corporate Counsel (February 2010-December 2018) of Prudential; formerly Director and Corporate Counsel (2006-2010) of Prudential; Vice President and Assistant Secretary (since January 2007) of PGIM Investments LLC; Vice President and Assistant Secretary (since January 2007) of Prudential Mutual Fund Services LLC. | | Since October 2006 |
| | | |
Jonathan D. Shain 8/9/58 Assistant Secretary | | Vice President and Corporate Counsel (since August 1998) of Prudential; Vice President and Assistant Secretary (since May 2001) of PGIM Investments LLC; Vice President and Assistant Secretary (since February 2001) of Prudential Mutual Fund Services LLC; formerly Vice President and Assistant Secretary (May 2003-June 2005) of AST Investment Services, Inc. | | Since May 2005 |
| | | |
Claudia DiGiacomo 10/14/74 Assistant Secretary | | Vice President and Corporate Counsel (since January 2005) of Prudential; Vice President and Assistant Secretary of PGIM Investments LLC (since December 2005); formerly Associate at Sidley Austin Brown & Wood LLP (1999-2004). | | Since December 2005 |
| | | |
Diana N. Huffman 4/14/82 Assistant Secretary | | Vice President and Corporate Counsel (since September 2015) of Prudential; formerly Associate at Willkie Farr & Gallagher LLP (2009-2015). | | Since March 2019 |
| | | |
Kelly A. Coyne 8/8/68 Assistant Secretary | | Director, Investment Operations of Prudential Mutual Fund Services LLC (since 2010). | | Since March 2015 |
| | | |
Christian J. Kelly 5/5/75 Treasurer and Principal Financial and Accounting Officer | | Vice President, Head of Fund Administration of PGIM Investments LLC (since November 2018); formerly, Director of Fund Administration of Lord Abbett & Co. LLC (2009-2018), Treasurer and Principal Accounting Officer of the Lord Abbett Family of Funds (2017-2018); Director of Accounting, Avenue Capital Group (2008-2009); Senior Manager, Investment Management Practice of Deloitte & Touche LLP (1998-2007). | | Since January 2019 |
Visit our website at pgiminvestments.com
| | | | |
| Fund Officers(a) | | | | |
| | | |
Name Date of Birth Fund Position | | Principal Occupation(s) During Past Five Years | | Length of Service as Fund Officer |
| | | |
Lana Lomuti 6/7/67 Assistant Treasurer | | Vice President (since 2007) and Director (2005-2007), within PGIM Investments Fund Administration; formerly Assistant Treasurer (December 2007-February 2014) of The Greater China Fund, Inc. | | Since April 2014 |
| | | |
Russ Shupak 10/08/73 Assistant Treasurer | | Vice President (since 2017) and Director (2013-2017), within PGIM Investments Fund Administration. | | Since October 2019 |
| | | |
Deborah Conway 3/26/69 Assistant Treasurer | | Vice President (since 2017) and Director (2007-2017), within PGIM Investments Fund Administration. | | Since October 2019 |
| | | |
Elyse M. McLaughlin 1/20/74 Assistant Treasurer | | Vice President (since 2017) and Director (2011-2017), within PGIM Investments Fund Administration. | | Since October 2019 |
| | | |
Charles H. Smith 1/11/73 Anti-Money Laundering Compliance Officer | | Vice President, Corporate Compliance, Anti-Money Laundering Unit (since January 2015) of Prudential; committee member of the American Council of Life Insurers Anti-Money Laundering and Critical Infrastructure Committee (since January 2016); formerly Global Head of Economic Sanctions Compliance at AIG Property Casualty (February 2007-December 2014); Assistant Attorney General at the New York State Attorney General’s Office, Division of Public Advocacy. (August 1998-January 2007). | | Since January 2017 |
(a) Excludes Mr. Parker and Mr. Benjamin, interested Board Members who also serve as President and Vice President, respectively.
Explanatory Notes to Tables:
| ∎ | | Board Members are deemed to be “Interested,” as defined in the 1940 Act, by reason of their affiliation with PGIM Investments LLC and/or an affiliate of PGIM Investments LLC. |
| ∎ | | Unless otherwise noted, the address of all Board Members and Officers is c/o PGIM Investments LLC, 655 Broad Street, Newark, New Jersey 07102-4410. |
| ∎ | | There is no set term of office for Board Members or Officers. The Board Members have adopted a retirement policy, which calls for the retirement of Board Members on December 31 of the year in which they reach the age of 75. |
| ∎ | | “Other Directorships Held” includes only directorships of companies required to register or file reports with the SEC under the 1934 Act (that is, “public companies”) or other investment companies registered under the 1940 Act. |
| ∎ | | “Portfolios Overseen” includes all investment companies managed by PGIM Investments LLC. The investment companies for which PGIM Investments LLC serves as manager include the PGIM Funds, The Prudential Variable Contract Accounts, PGIM ETF Trust, PGIM High Yield Bond Fund, Inc., PGIM Global High Yield Fund, Inc., The Prudential Series Fund, Prudential’s Gibraltar Fund, Inc. and the Advanced Series Trust. |
PGIM Select Real Estate Fund
Approval of Advisory Agreements(unaudited)
The Fund’s Board of Trustees
The Board of Trustees (the “Board”) of PGIM Select Real Estate Fund (the “Fund”)1 consists of eleven individuals, nine of whom are not “interested persons” of the Fund, as defined in the Investment Company Act of 1940, as amended (the “1940 Act”) (the “Independent Trustees”).2 The Board is responsible for the oversight of the Fund and its operations, and performs the various duties imposed on the directors of investment companies by the 1940 Act. The Independent Trustees have retained independent legal counsel to assist them in connection with their duties. The Chair of the Board is an Independent Trustee. The Board has established four standing committees: the Audit Committee, the Nominating and Governance Committee, and two Investment Committees. Each committee is chaired by, and composed of, Independent Trustees.
Annual Approval of the Fund’s Advisory Agreements
As required under the 1940 Act, the Board determines annually whether to renew the Fund’s management agreement with PGIM Investments LLC (“PGIM Investments”) and the Fund’s subadvisory agreements with each of PGIM, Inc. (“PGIM”) on behalf of its PGIM Real Estate unit, and PGIM Limited (“PGIML”). In considering the renewal of the agreements, the Board, including all of the Independent Trustees, met on May 30, 2019 and on June11-13, 2019 and approved the renewal of the agreements through July 31, 2020, after concluding that the renewal of the agreements was in the best interests of the Fund and its shareholders.
In advance of the meetings, the Board requested and received materials relating to the agreements, and had the opportunity to ask questions and request further information in connection with its consideration. Among other things, the Board considered comparative fee information from PGIM Investments, PGIM and PGIML. Also, the Board considered comparisons with other mutual funds in relevant Peer Universes and Peer Groups, as is further discussed below.
In approving the agreements, the Board, including the Independent Trustees advised by independent legal counsel, considered the factors it deemed relevant, including the nature, quality and extent of services provided by PGIM Investments and the subadvisers, the performance of the Fund, the profitability of PGIM Investments and its affiliates, expenses and fees, and the potential for economies of scale that may be shared with the Fund and its shareholders as the Fund’s assets grow. In their deliberations, the Trustees did not identify any single factor which alone was responsible for the Board’s decision to approve the
| 1 | PGIM Select Real Estate Fund is a series of Prudential Investment Portfolios 9. |
| 2 | Grace C. Torres was an Interested Trustee of the Fund at the time the Board considered and approved the renewal of the Fund’s advisory agreements, but has since become an Independent Trustee of the Fund. |
| | |
| PGIM Select Real Estate Fund |
Approval of Advisory Agreements(continued)
agreements with respect to the Fund. In connection with its deliberations, the Board considered information provided by PGIM Investments throughout the year at regular Board meetings, presentations from portfolio managers and other information, as well as information furnished at or in advance of the meetings on May 30, 2019 and on June11-13, 2019.
The Trustees determined that the overall arrangements between the Fund and PGIM Investments, which serves as the Fund’s investment manager pursuant to a management agreement, and between PGIM Investments and each of PGIM, which, through its PGIM Real Estate unit, and PGIML, serve as the Fund’s subadvisers pursuant to the terms of subadvisory agreements with PGIM Investments, are in the best interests of the Fund and its shareholders in light of the services performed, fees charged and such other matters as the Trustees considered relevant in the exercise of their business judgment.
The material factors and conclusions that formed the basis for the Trustees’ reaching their determinations to approve the continuance of the agreements are separately discussed below.
Nature, Quality and Extent of Services
The Board received and considered information regarding the nature, quality and extent of services provided to the Fund by PGIM Investments, PGIM Real Estate and PGIML. The Board noted that PGIM Real Estate and PGIML are affiliated with PGIM Investments. The Board considered the services provided by PGIM Investments, including but not limited to the oversight of the subadvisers for the Fund, as well as the provision of fund recordkeeping, compliance and other services to the Fund, and PGIM Investments’ role as the administrator for the Fund’s liquidity risk management program. With respect to PGIM Investments’ oversight of the subadvisers, the Board noted that PGIM Investments’ Strategic Investment Research Group (“SIRG”), which is a business unit of PGIM Investments, is responsible for monitoring and reporting to PGIM Investments’ senior management on the performance and operations of the subadvisers. The Board also considered that PGIM Investments pays the salaries of all of the officers and interested Trustees of the Fund who are part of Fund management. The Board also considered the investment subadvisory services provided by PGIM Real Estate and PGIML, including investment research and security selection, as well as adherence to the Fund’s investment restrictions and compliance with applicable Fund policies and procedures. The Board considered PGIM Investments’ evaluation of the subadviser, as well as PGIM Investments’ recommendation, based on its review of the subadviser, to renew the subadvisory agreement.
The Board considered the qualifications, backgrounds and responsibilities of PGIM Investments’ senior management responsible for the oversight of the Fund, PGIM Real Estate and PGIML, and also considered the qualifications, backgrounds and responsibilities of PGIM Real Estate’s portfolio managers who are responsible for theday-to-day
| | |
| Visit our website at pgiminvestments.com | | |
management of the Fund’s portfolio. The Board was provided with information pertaining to PGIM Investments’, PGIM Real Estate’s, PGIM’s and PGIML’s organizational structure, senior management, investment operations, and other relevant information pertaining to PGIM Investments, PGIM Real Estate, PGIM and PGIML. The Board also noted that it received favorable compliance reports from the Fund’s Chief Compliance Officer (“CCO”) as to PGIM Investments, PGIM Real Estate, PGIM and PGIML.
The Board concluded that it was satisfied with the nature, extent and quality of the investment management services provided by PGIM Investments and the subadvisory services provided to the Fund by PGIM Real Estate, and that there was a reasonable basis on which to conclude that the Fund benefits from the services provided by PGIM Investments, PGIM Real Estate and PGIML under the management and subadvisory agreements.
Costs of Services and Profits Realized by PGIM Investments
The Board was provided with information on the profitability of PGIM Investments and its affiliates in serving as the Fund’s investment manager. The Board discussed with PGIM Investments the methodology utilized in assembling the information regarding profitability and considered its reasonableness. The Board recognized that it is difficult to make comparisons of profitability from fund management contracts because comparative information is not generally publicly available and is affected by numerous factors, including the structure of the particular adviser, the types of funds it manages, its business mix, numerous assumptions regarding allocations and the adviser’s capital structure and cost of capital. However, the Board considered that the cost of services provided by PGIM Investments to the Fund during the year ended December 31, 2018 exceeded the management fees paid by the Fund, resulting in an operating loss to PGIM Investments. Taking these factors into account, the Board concluded that the profitability of PGIM Investments and its affiliates in relation to the services rendered was not unreasonable.
Economies of Scale
The Board received and discussed information concerning economies of scale that PGIM Investments may realize as the Fund’s assets grow beyond current levels. The Board noted that the management fee schedule for the Fund includes breakpoints, which have the effect of decreasing the fee rate as assets increase. During the course of time, the Board has considered information regarding the launch date of the Fund, the management fees of the Fund compared to those of similarly managed funds and PGIM Investments’ investment in the Fund over time. The Board noted that economies of scale, can be shared with the Fund in other ways, including low management fees from inception, additional technological and personnel investments to enhance shareholder services, and maintaining existing expense structures in the face of a rising cost environment. The Board considered
| | |
| PGIM Select Real Estate Fund |
Approval of Advisory Agreements(continued)
PGIM Investments’ assertion that it continually evaluates the management fee schedule of the Fund and the potential to share economies of scale through breakpoints or fee waivers as asset levels increase.
The Board recognized the inherent limitations of any analysis of economies of scale, stemming largely from the Board’s understanding that most of PGIM Investments’ costs are not specific to individual funds, but rather are incurred across a variety of products and services.
Other Benefits to PGIM Investments, PGIM Real Estate and PGIML
The Board considered potential ancillary benefits that might be received by PGIM Investments, PGIM Real Estate, PGIML and their affiliates as a result of their relationship with the Fund. The Board concluded that potential benefits to be derived by PGIM Investments included transfer agency fees received by the Fund’s transfer agent (which is affiliated with PGIM Investments), and benefits to its reputation as well as other intangible benefits resulting from PGIM Investments’ association with the Fund. The Board concluded that the potential benefits to be derived by PGIM Real Estate and PGIML included their ability to use soft dollar credits, as well as the potential benefits consistent with those generally resulting from an increase in assets under management, specifically, potential access to additional research resources and benefits to its reputation. The Board concluded that the benefits derived by PGIM Investments, PGIM Real Estate and PGIML were consistent with the types of benefits generally derived by investment managers and subadvisers to mutual funds.
Performance of the Fund / Fees and Expenses
The Board considered certain additional factors and made related conclusions relating to the historical performance of the Fund for theone- and three-year periods ended December 31, 2018. The Board considered that the Fund commenced investment operations on August 1, 2014 and that longer-term performance was not yet available.
The Board also considered the Fund’s actual management fee, as well as the Fund’s net total expense ratio, for the fiscal year ended October 31, 2018. The Board considered the management fee for the Fund as compared to the management fee charged by PGIM Investments to other funds and the fee charged by other advisers to comparable mutual funds in a Peer Group. The actual management fee represents the fee rate actually paid by Fund shareholders and includes any fee waivers or reimbursements. The net total expense ratio for the Fund represents the actual expense ratio incurred by Fund shareholders.
The mutual funds included in the Peer Universe, which was used to consider performance, and the Peer Group, which was used to consider expenses and fees, were objectively
| | |
| Visit our website at pgiminvestments.com | | |
determined by Broadridge, an independent provider of mutual fund data. In certain circumstances, PGIM Investments also provided supplemental Peer Universe or Peer Group information for reasons addressed with the Board. The comparisons placed the Fund in various quartiles over various periods, with the first quartile being the best 25% of the mutual funds (for performance, the best performing mutual funds and, for expenses, the lowest cost mutual funds).
The section below summarizes key factors considered by the Board and the Board’s conclusions regarding the Fund’s performance, fees and overall expenses. The table sets forth net performance comparisons (which reflect the impact on performance of fund expenses, or any subsidies, expense caps or waivers that may be applicable) with the Peer Universe, actual management fees with the Peer Group (which reflect the impact of any subsidies or fee waivers), and net total expenses with the Peer Group, each of which were key factors considered by the Board.
| | | | | | | | |
| Net Performance | | 1 Year | | 3 Years | | 5 Years | | 10 Years |
| | 1st Quartile | | 1st Quartile | | N/A | | N/A |
| Actual Management Fees:1st Quartile |
| Net Total Expenses: 2nd Quartile |
| | • | | The Board noted that the Fund outperformed its benchmark index over all periods. |
| | • | | The Board considered that the Fund commenced investment operations on August 1, 2014 and that longer-term performance was not yet available. |
| | • | | The Board and PGIM Investments agreed to retain the Fund’s existing contractual expense cap, which (exclusive of certain fees and expenses) caps total annual operating expenses at 1.30% for Class A shares, 2.05% for Class C shares, 1.05% for Class R6 shares, and 1.05% for Class Z shares through February 29, 2020. |
| | • | | In addition, PGIM Investments will waive management fees or shared operating expenses on any share class to the same extent that it waives such expenses on any other share class, and has agreed that total annual fund operating expenses for Class R6 shares will not exceed total annual fund operating expenses for Class Z shares. |
| | • | | The Board concluded that in light of the above, it would be in the best interests of the Fund and its shareholders to renew the agreements. |
| | • | | The Board concluded that the management fees (including subadvisory fees) and total expenses were reasonable in light of the services provided. |
* * *
After full consideration of these factors, the Board concluded that the approval of the agreements was in the best interests of the Fund and its shareholders.
| | |
| PGIM Select Real Estate Fund |
| | | | |
| | |
| ∎ MAIL | | ∎ TELEPHONE | | ∎ WEBSITE |
655 Broad Street
Newark, NJ 07102 | | (800) 225-1852 | | pgiminvestments.com |
|
| PROXY VOTING |
| The Board of Trustees of the Fund has delegated to the Fund’s subadviser the responsibility for voting any proxies and maintaining proxy recordkeeping with respect to the Fund. A description of these proxy voting policies and procedures is available without charge, upon request, by calling (800) 225-1852. Information regarding how the Fund voted proxies relating to portfolio securities during the most recent 12-month period ended June 30 is available on the Fund’s website and on the Securities and Exchange Commission’s website. |
|
| TRUSTEES |
| Ellen S. Alberding• Kevin J. Bannon• Scott E. Benjamin• Linda W. Bynoe• Barry H. Evans• Keith F. Hartstein • Laurie Simon Hodrick• Michael S. Hyland• Stuart S. Parker• Brian K. Reid• Grace C. Torres |
|
| OFFICERS |
Stuart S. Parker,President• Scott E. Benjamin,Vice President• Christian J. Kelly,Treasurer and Principal Financial and Accounting Officer• Raymond A. O’Hara,Chief Legal Officer• Dino Capasso, Chief Compliance Officer• Charles H. Smith,Anti-Money Laundering Compliance Officer• Andrew R. French,Secretary• Jonathan D. Shain,Assistant Secretary• Claudia DiGiacomo,Assistant Secretary• Diana N. Huffman,Assistant Secretary• Kelly A. Coyne,Assistant Secretary• Lana Lomuti,Assistant Treasurer• Russ Shupak,Assistant Treasurer• Elyse McLaughlin,Assistant Treasurer• Deborah Conway,Assistant Treasurer |
| | | | |
| MANAGER | | PGIM Investments LLC | | 655 Broad Street
Newark, NJ 07102 |
|
| SUBADVISER | | PGIM Real Estate | | 7 Giralda Farms
Madison, NJ 07940 |
|
| DISTRIBUTOR | | Prudential Investment
Management Services LLC | | 655 Broad Street
Newark, NJ 07102 |
|
| CUSTODIAN | | The Bank of New York Mellon | | 240 Greenwich Street
New York, NY 10286 |
|
| TRANSFER AGENT | | Prudential Mutual Fund
Services LLC | | PO Box 9658
Providence, RI 02940 |
|
| INDEPENDENT REGISTERED PUBLIC ACCOUNTING FIRM | | KPMG LLP | | 345 Park Avenue New York, NY 10154 |
|
| FUND COUNSEL | | Willkie Farr & Gallagher LLP | | 787 Seventh Avenue
New York, NY 10019 |
|
|
| An investor should consider the investment objectives, risks, charges, and expenses of the Fund carefully before investing. The prospectus and summary prospectus contain this and other information about the Fund. An investor may obtain the prospectus and summary prospectus by visiting our website atpgiminvestments.com or by calling(800) 225-1852. The prospectus and summary prospectus should be read carefully before investing. |
|
| E-DELIVERY |
| To receive your mutual fund documents online, go topgiminvestments.com/edelivery and enroll. Instead of receiving printed documents by mail, you will receive notification via email when new materials are available. You can cancel your enrollment or change your email address at any time byvisiting the website address above. |
|
| SHAREHOLDER COMMUNICATIONS WITH TRUSTEES |
| Shareholders can communicate directly with the Board of Trustees by writing to the Chair of the Board, PGIM Select Real Estate Fund, PGIM Investments, Attn: Board of Trustees, 655 Broad Street, Newark, NJ 07102. Shareholders can communicate directly with an individual Trustee by writing to the same address. Communications are not screened before being delivered to the addressee. |
|
| AVAILABILITY OF PORTFOLIO HOLDINGS |
The Fund files its complete schedule of portfolio holdings with the Securities and Exchange Commission on Form N-PORT. The Fund’s Form N-PORT filings are available on the Commission’s website at sec.gov. Form N-PORT is filed with the Commission quarterly, and each Fund’s full portfolio holdings as of the first and third fiscal quarter-ends (as of the third month of the Fund’s fiscal quarter for reporting periods on or after September 30, 2019) will be made publicly available 60 days after the end of each quarter at sec.gov. |
|
| The Fund’s Statement of Additional Information contains additional information about the Fund’s Trustees and is available without charge, upon request, by calling (800) 225-1852. |
Mutual Funds:
| | | | |
| ARE NOT INSURED BY THE FDIC OR ANY FEDERAL GOVERNMENT AGENCY | | MAY LOSE VALUE | | ARE NOT A DEPOSIT OF OR GUARANTEED BY ANY BANK OR ANY BANK AFFILIATE |
PGIM SELECT REAL ESTATE FUND
| | | | | | | | |
| SHARE CLASS | | A | | C | | Z | | R6 |
| NASDAQ | | SREAX | | SRECX | | SREZX | | SREQX |
| CUSIP | | 74441J811 | | 74441J795 | | 74441J779 | | 74441J787 |
MF223E

PGIM INTERNATIONAL BOND FUND
ANNUAL REPORT
OCTOBER 31, 2019
COMING SOON: PAPERLESS SHAREHOLDER REPORTS
Beginning on January 1, 2021, as permitted by regulations adopted by the Securities and Exchange Commission, paper copies of the Fund’s annual and semiannual shareholder reports will no longer be sent by mail, unless you specifically request paper copies of the reports. Instead, the reports will be made available on the Fund’s website (pgiminvestments.com), and you will be notified by mail each time a report is posted and provided with a website link to access the report.
If you already elected to receive shareholder reports electronically, you will not be affected by this change and you need not take any action. You may elect to receive shareholder reports and other communications from the Fund electronically anytime by contacting your financial intermediary (such as a broker-dealer or bank) or, if you are a direct investor, by calling 1-800-225-1852 or by sending an email request to PGIM Investments at shareholderreports@pgim.com.
You may elect to receive all future reports in paper free of charge. If you invest through a financial intermediary, you can contact your financial intermediary or follow instructions included with this notice to elect to continue to receive paper copies of your shareholder reports. If you invest directly with the Fund, you can call 1-800-225-1852 or send an email request to shareholderreports@pgim.com to let the Fund know you wish to continue receiving paper copies of your shareholder reports. Your election to receive reports in paper will apply to all funds held in your account if you invest through your financial intermediary or all funds held with the fund complex if you invest directly with the Fund.

To enroll in e-delivery, go to pgiminvestments.com/edelivery
|
| Objective:Total return, made up of current income and capital appreciation |
Highlights(unaudited)
| • | | Overall, duration and yield curve positioning, as well as sector and issuer selection, were all large contributors to the Fund’s performance over the reporting period. |
| • | | Strong sector and issuer selection across developed sovereign debt, European peripheral issuers (i.e.,non-core European countries), high yield corporates, and emerging markets agencies added to performance for the period. Looking at specific issuers, overweights to Greece, Italy and Portugal, as well as an underweight to France were among the largest contributors to performance. |
| • | | Positioning in developed Treasuries hurt performance over the reporting period. |
| • | | Looking at specific issuers, overweights to Argentina and the Province of Buenos Aires were among the largest detractors from performance. |
This report is not authorized for distribution to prospective investors unless preceded or accompanied by a current prospectus.
The views expressed in this report and information about the Fund’s portfolio holdings are for the period covered by this report and are subject to change thereafter.
Mutual funds are distributed by Prudential Investment Management Services LLC (PIMS), member SIPC. PGIM Fixed Income is a unit of PGIM, Inc. (PGIM), a registered investment adviser. PIMS and PGIM are Prudential Financial companies.© 2019 Prudential Financial, Inc. and its related entities. PGIM and the PGIM logo are service marks of Prudential Financial, Inc. and its related entities, registered in many jurisdictions worldwide.
| | |
| 2 | | Visit our website at pgiminvestments.com |
Table of Contents
| | | | |
| PGIM International Bond Fund | | | 3 | |
This Page Intentionally Left Blank
Letter from the President

Dear Shareholder:
We hope you find the annual report for the PGIM International Bond Fund informative and useful. The report covers performance for the12-month period that ended October 31, 2019.
While the US economy remained healthy, with rising corporate profits and strong job growth, the Federal Reserve cut interest rates three times in the latter half of the period. The cuts were a proactive attempt by the Fed to extend the longest domestic economic expansion on record as growth in many regions weakened. China in particular showed signs of slowing amid trade tensions with the US, and turmoil in the United Kingdom continued as it negotiates an exit from the European Union.
The interest-rate cuts helped boost the performance of stocks globally. For the period overall,large-cap US equities along with stocks in developed and emerging foreign markets all rose by double digits.Small-cap US stocks posted a single-digit gain. This positive performance came despite significant volatility early in the period. Equities plunged at the end of 2018 on concerns about China’s economy, a potential global trade war, higher interest rates, and worries that profit growth might slow. Stocks reversed course early in 2019, rising sharply after the Fed moderated its position on additional rate hikes for the remainder of the year.
The overall US bond market posted strong returns during the period on a significant rally in interest rates that saw the10-year US Treasury yield decline from over 3% to under 2%. Investment-grade corporate bonds led the way with a double-digit gain, while corporate high yield and municipal bonds each had a return in the high single digits. Globally, bonds in developed markets delivered strong returns, and emerging markets debt rose by double digits.
Regarding your investments with PGIM, we believe it is important to maintain a diversified portfolio of funds consistent with your tolerance for risk, time horizon, and financial goals. Your financial advisor can help you create a diversified investment plan that may include funds covering all the basic asset classes and that reflects your personal investor profile and risk tolerance. However, diversification and asset allocation strategies do not assure a profit or protect against loss in declining markets.
At PGIM Investments, we consider it a great privilege and responsibility to help investors participate in opportunities across global markets while meeting their toughest investment challenges. PGIM is atop-10 global investment manager with more than $1 trillion in assets under management. This scale and investment expertise allow us to deliver actively managed funds and strategies to meet the needs of investors around the globe.
Thank you for choosing our family of funds.
Sincerely,

Stuart S. Parker, President
PGIM International Bond Fund
December 16, 2019
| | | | |
| PGIM International Bond Fund | | | 5 | |
Your Fund’s Performance(unaudited)
Performance data quoted represents past performance. Past performance does not guarantee future results. The investment return and principal value of an investment will fluctuate, so that an investor’s shares, when redeemed, may be worth more or less than their original cost. Current performance may be lower or higher than the past performance data quoted. An investor may obtain performance data as of the most recent month-end by visiting our website atpgiminvestments.com or by calling (800) 225-1852.
| | | | | | |
| |
| | | Average Annual Total Returns as of 10/31/19 (with sales charges) | |
| | | One Year (%) | | Since Inception (%) | |
| Class A | | 12.73 | | | 6.71 (12/14/16) | |
| Class C | | 14.65 | | | 7.10 (12/14/16) | |
| Class Z | | 16.80 | | | 8.21 (12/14/16) | |
| Class R6 | | 16.81 | | | 8.21 (12/14/16) | |
| Bloomberg Barclays Global Aggregate ex-USD (USD Hedged) Index | |
| | 9.88 | | | 4.84 | |
| | | | | | |
| |
| | | Average Annual Total Returns as of 10/31/19
(without sales charges) | |
| | | One Year (%) | | Since Inception (%) | |
| Class A | | 16.52 | | | 7.94 (12/14/16) | |
| Class C | | 15.65 | | | 7.10 (12/14/16) | |
| Class Z | | 16.80 | | | 8.21 (12/14/16) | |
| Class R6 | | 16.81 | | | 8.21 (12/14/16) | |
| Bloomberg Barclays Global Aggregate ex-USD (USD Hedged) Index | |
| | | 9.88
| | | 4.84 | |
| | |
| 6 | | Visit our website at pgiminvestments.com |
Growth of a $10,000 Investment (unaudited)
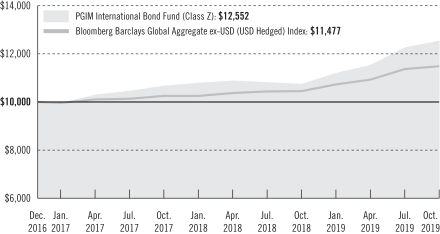
The graph compares a $10,000 investment in the Fund’s Class Z shares with a similar investment in the Bloomberg Barclays Global Aggregate ex-USD (USD Hedged) Index by portraying the initial account values at the commencement of operations for Class Z shares (December 14, 2016) and the account values at the end of the current fiscal year (October 31, 2019) as measured on a quarterly basis. For purposes of the graph, and unless otherwise indicated, it has been assumed that (a) all recurring fees (including management fees) were deducted; and (b) all dividends and distributions were reinvested. The line graph provides information for Class Z shares only. As indicated in the tables provided earlier, performance for other share classes will vary due to the differing charges and expenses applicable to each share class (as indicated in the following paragraphs). Without waiver of fees and/or expense reimbursements, if any, the returns would have been lower.
Past performance does not predict future performance. Total returns and the ending account values in the graph include changes in share price and reinvestment of dividends and capital gains distributions in a hypothetical investment for the periods shown. The Fund’s total returns do not reflect the deduction of income taxes on an individual’s investment. Taxes may reduce your actual investment returns on income or gains paid by the Fund or any gains you may realize if you sell your shares.
Source: PGIM Investments LLC and Lipper Inc.
Since Inception returns are provided since the Fund has less than 10 fiscal years of returns. Since Inception returns for the Index are measured from the closest month-end to the Fund’s inception date.
| | | | |
| PGIM International Bond Fund | | | 7 | |
Your Fund’s Performance(continued)
The returns in the tables do not reflect the deduction of taxes that a shareholder would pay on Fund distributions or following the redemption of Fund shares. The average annual total returns take into account applicable sales charges, which are described for each share class in the table below.
| | | | | | | | |
| | | | | |
| | | Class A | | Class C | | Class Z | | Class R6 |
| Maximum initial sales charge | | For purchases on or after July 15, 2019: 3.25% of the public offering price. For purchases prior to July 15, 2019: 4.50% of the public offering price | | None | | None | | None |
| Contingent deferred sales charge (CDSC) (as a percentage of the lower of the original purchase price or the net asset value at redemption) | | For purchases on or after July 15, 2019: 1.00% on sales of $500,000 or more made within 12 months of purchase. For purchases prior to July 15, 2019: 1.00% on sales of $1 million or more made within 12 months of purchase. | | 1.00% on sales made within 12 months of purchase | | None | | None |
| Annual distribution and service (12b-1) fees (shown as a percentage of average daily net assets) | | 0.25%
| | 1.00% | | None | | None |
Benchmark Definitions
Bloomberg Barclays Global Aggregate ex-USD (USD Hedged) Index—The Bloomberg Barclays Global Aggregate ex-USD (USD Hedged) Index provides a broad-based measure of the global investment-grade fixed income markets, with index components for the Pan-European Aggregate and the Asian-Pacific Aggregate excluding US dollar-denominated components.
Investors cannot invest directly in an index or average. The returns for the Index would be lower if they included the effects of sales charges, operating expenses of a mutual fund, or taxes.
| | |
| 8 | | Visit our website at pgiminvestments.com |
| | | | | | |
| | | |
| Distributions and Yields as of 10/31/19 | | | | | | |
| | Total Distributions
Paid for
12 Months ($) | | SEC 30-Day
Subsidized
Yield* (%) | | SEC 30-Day
Unsubsidized
Yield** (%) |
| Class A | | 0.96 | | 0.88 | | 6.47 |
| Class C | | 0.88 | | 0.17 | | 41.63 |
| Class Z | | 0.99 | | 1.16 | | 0.44 |
| Class R6 | | 0.99 | | 1.16 | | 0.38 |
*SEC 30-Day Subsidized Yield (%)—A standardized yield calculation created by the Securities and Exchange Commission, it reflects the income earned during a 30-day period, after the deduction of the Fund’s net expenses (net of any expense waivers or reimbursements). The investor experience is represented by the SEC 30-Day Subsidized Yield.
**SEC 30-Day Unsubsidized Yield (%)—A standardized yield calculation created by the Securities and Exchange Commission, it reflects the income earned during a 30-day period, after the deduction of the Fund’s gross expenses. The investor experience is represented by the SEC 30-Day Subsidized Yield.
| | | | |
| |
| Credit Quality expressed as a percentage of total investments as of 10/31/19 (%) | | | |
| AAA | | | 11.7 | |
| AA | | | 3.4 | |
| A | | | 22.3 | |
| BBB | | | 30.6 | |
| BB | | | 12.7 | |
| B | | | 8.3 | |
| CCC | |
| 1.2
|
|
| Not Rated | | | 6.6 | |
| Cash/Cash Equivalents | | | 3.2 | |
| Total Investments | | | 100.0 | |
Source: PGIM Fixed Income
Credit ratings reflect the highest rating assigned by a nationally recognized statistical rating organization (NRSRO) such as Moody’s Investors Service, Inc. (Moody’s), S&P Global Ratings (S&P), or Fitch, Inc. (Fitch). Credit ratings reflect the common nomenclature used by both S&P and Fitch. Where applicable, ratings are converted to the comparable S&P/Fitch rating tier nomenclature. These rating agencies are independent and are widely used. The Not Rated category consists of securities that have not been rated by an NRSRO. Credit ratings are subject to change.
| | | | |
| PGIM International Bond Fund | | | 9 | |
Strategy and Performance Overview(unaudited)
How did the Fund perform?
ThePGIM International Bond Fund’s Class Z shares returned 16.80% in the12-month reporting period that ended October 31, 2019, outperforming the 9.88% return of the Bloomberg Barclays Global Aggregate ex-USD (USD Hedged) Index (the Index).
What were the market conditions?
| • | | The fourth quarter of 2018 represented a major shift in market sentiment across global asset classes. Interest rates peaked in early October and aggressively rallied as Brexit worries, fears of an escalating trade war, weaker economic data, and a hawkish Federal Reserve (Fed) punished risk assets, sending developed-market interest rates to yearly lows. As the fourth quarter concluded, the yield on10-year German government bunds and Japanese government bonds (JGBs) plummeted to depths not seen in years, while the10-year US Treasury note yield ended the quarter just above its low from early in 2018. Additionally, after beginning the quarter higher, the yield on Italy’s10-year BTP government bond declined below 3% for the first time since September 2018 as Italy slowly moved its 2019 budget target closer to the European Commission’s suggestion. |
| • | | The decline in rates throughout most of first quarter of 2019 accelerated late in the quarter after the latest dovish pivots by the European Central Bank (ECB) and the Fed. The breadth of the decline left10-year yields in several countries at multi-year or record lows. The Fed continued its pivot into the March Federal Open Market Committee (FOMC) meeting when the median federal funds rate projections for 2019, 2020, and 2021 each fell by 50 basis points (bps). (One basis point is 0.01%.) The FOMC also indicated that the balance sheetroll-off—a policy widely viewed as a modest tightening measure—would slow in May and end in September 2019. The ongoing weakness in European economic and inflation data (e.g., the precipitous decline in Germany’s March Purchasing Managers’ Index to 44.7 from more than 62 in late 2017) led to a bull flattening along the bund yield curve. (A yield curve is a series of points that graphically shows the yields on fixed income securities that have the same credit quality but different maturities.) |
| • | | Interest rates across the G4 tumbled throughout the second quarter of 2019 (Japan: –7 bps, Germany: –25 bps, UK: –17 bps, and US Treasuries: –40 bps), driven by lackluster global economic data, lingeringUS-China trade tensions, and rising probabilities of easier global monetary policies. The Fed’s shift toward a more accommodative stance culminated in its June meeting with a drop in the median estimate of thelong-run neutral fed funds rate from 2.8% to 2.5%—the top of its target range—as the third quarter of 2019 commenced. European economic and inflation data remained soft in the second quarter, which contributed to a bull flattening of the bunds curve. |
| • | | Developed market interest rates took another leg down in the third quarter of 2019 as central banks collectively eased policies to counter signs of mounting global economic |
| | |
| 10 | | Visit our website at pgiminvestments.com |
| | weakness and uncertainty. It was the second consecutive quarter of double-digit basis point declines for US and German10-year yields (down 35 bps and 25 bps to 1.67% and –0.57%, respectively), while the Japanese10-year yield also fell deeper into negative territory (down 10 bps to –0.22%). As the fourth quarter of 2019 progresses, US Treasury yields remain elevated in a global context, particularly with nearly $15 trillion in negative-yielding debt outstanding. In Europe, the ECB’s decision to renew its asset purchases creates a supportive backdrop for rates, particularly at the7-year point of the German bund and French Oat markets. After the Bank of Japan (BoJ) mentioned the desirability of a steeper yield curve to support the banking sector, it subsequently announced reduced purchases at the back of the curve. Looking ahead, the BoJ may take additional steps in its attempt to steepen the yield curve. |
| • | | Front-end Treasury yields fell, and the curve steepened in October 2019 asUS-China trade uncertainty and weaker-than-expected US economic data drove a flight to safety. As part of the Fed’s expected25-bp reduction in the targeted federal funds range, the FOMC removed a reference to “act as appropriate” to sustain the economic expansion, signaling for many that it is done cutting rates for now. UK gilt yields rose14-16 bps as the risk of ano-deal Brexit receded, and the10-year bund yields closed 16 bps higher to –0.41%. Elsewhere, the JGB curve flattened, with the10-year JGB yield higher by 7 bps for the month. |
What worked?
| • | | Overall, duration and yield curve positioning, as well as sector and issuer selection, were all large contributors to the Fund’s performance over the reporting period. |
| • | | Strong sector and issuer selection across developed sovereign debt, European peripheral issuers (i.e.,non-core European countries), high yield corporates, and emerging markets agencies added to performance for the period. Looking at specific issuers, overweights to Greece, Italy and Portugal, as well as an underweight to France were among the largest contributors to performance. |
| • | | In developed rates, a long duration position in the US was the largest contributor to performance. In emerging markets, long-duration positioning in Brazilian rates was a strong contributor to performance. (Duration is a measure of the interest-rate sensitivity of a bond portfolio or debt securities that is expressed as a number of years.) A curve flattener in euro rates also added value. |
| • | | Although overall currency positioning hurt performance, overweights to the Russian ruble, Indian rupee, and Egyptian pound helped to offset some of the losses. |
What didn’t work?
| • | | Positioning in developed Treasuries hurt performance over the reporting period. |
| • | | Looking at specific issuers, overweights to Argentina and the Province of Buenos Aires were among the largest detractors from performance. |
| | | | |
| PGIM International Bond Fund | | | 11 | |
Strategy and Performance Overview(continued)
| • | | In developed rates, duration positioning in Canadian rates modestly hurt performance. |
| • | | Currency positioning hurt performance over the period. An overweight to the Norwegian krone and underweights to the euro and South African rand were among the largest detractors from performance. |
Did the Fund use derivatives?
| • | | The Fund used interest-rate futures and swaps to implement its investment strategy, as well as to help manage duration and yield curve exposure. The use of interest-rate futures had a negative impact on the Fund’s performance while the use of interest-rate swaps hurt performance. |
| • | | Credit derivatives, primarily in the form of credit default swap index (CDX) positions, were used to either add risk exposure to certain issuers or to hedge credit risk imposed by certain issuers. Overall, credit derivative exposure added value during the reporting period. |
| • | | In addition, to implement most currency strategies, the Fund employed foreign exchange derivatives, which negatively impacted performance. |
Current outlook
| • | | PGIM Fixed Income maintains its positive view of fundamentals in the credit sectors of fixed income with positioning in spread sectors, including high yield, emerging market, and structured product sectors such as commercial mortgage-backed securities (CMBS) and asset-backed securities (ABS). Within CMBS, PGIM Fixed Income continues to find value in high-quality securities ofnew-issue conduit deals. In ABS, the Fund is maintaining anup-in-quality focus (with some exceptions) as capital stack/issuer valuations remain compressed. PGIM Fixed Income is constructive on US high yield and continues to like independent power producers and US consumer-related names. PGIM Fixed Income remains cautious on commodities but is looking at unique opportunities in natural gas and health care. The Fund ended the period with an underweight to investment-grade corporates. As we enter the later stage of the credit cycle, PGIM Fixed Income continues to favor better-quality financials and electric utilities over industrials. |
| • | | The Fund is overweight in debt of European peripheral countries, as well as a select group of emerging market issuers, in mostly sovereign issues. The Fund has a very small allocation to government-related sectors, including Treasuries and agencies, as PGIM Fixed Income finds more compelling value in the aforementioned sectors. |
| • | | In currency positioning relative to the Index, the Fund is underweight to the US dollar, Swiss franc, and the euro while maintaining an overweight to the Japanese yen. The Fund maintains a select set of small allocations, both underweight and overweight, within emerging market and “commodity” currencies, such as overweight exposure to the Russian ruble, Norwegian krone, and Singapore dollar, while taking underweight exposures to the Taiwan dollar and Indonesian rupiah. |
| | |
| 12 | | Visit our website at pgiminvestments.com |
Fees and Expenses(unaudited)
As a shareholder of the Fund, you incur two types of costs: (1) transaction costs, including sales charges (loads) on purchase payments and redemptions, as applicable, and (2) ongoing costs, including management fees, distribution and/or service (12b-1) fees, and other Fund expenses, as applicable. This example is intended to help you understand your ongoing costs (in dollars) of investing in the Fund and to compare these costs with the ongoing costs of investing in other mutual funds.
The example is based on an investment of $1,000 held through the six-month period ended October 31, 2019. The example is for illustrative purposes only; you should consult the Prospectus for information on initial and subsequent minimum investment requirements.
Actual Expenses
The first line for each share class in the table on the following page provides information about actual account values and actual expenses. You may use the information on this line, together with the amount you invested, to estimate the expenses that you paid over the period. Simply divide your account value by $1,000 (for example, an $8,600 account value ÷ $1,000 = 8.6), then multiply the result by the number on the first line under the heading “Expenses Paid During the Six-Month Period” to estimate the expenses you paid on your account during this period.
Hypothetical Example for Comparison Purposes
The second line for each share class in the table on the following page provides information about hypothetical account values and hypothetical expenses based on the Fund’s actual expense ratio and an assumed rate of return of 5% per year before expenses, which is not the Fund’s actual return. The hypothetical account values and expenses may not be used to estimate the actual ending account balance or expenses you paid for the period. You may use this information to compare the ongoing costs of investing in the Fund and other funds. To do so, compare this 5% hypothetical example with the 5% hypothetical examples that appear in the shareholder reports of the other funds.
The Fund’s transfer agent may charge additional fees to holders of certain accounts that are not included in the expenses shown in the table on the following page. These fees apply to individual retirement accounts (IRAs) and Section 403(b) accounts. As of the close of the six-month period covered by the table, IRA fees included an annual maintenance fee of $15 per account (subject to a maximum annual maintenance fee of $25 for all accounts held by the same shareholder). Section 403(b) accounts are charged an annual $25 fiduciary maintenance fee. Some of the fees may vary in amount, or may be waived, based on your total account balance or the number of PGIM funds, including the Fund, that you own. You should consider the additional fees that were charged to your Fund account over the six-month period when you estimate the total ongoing expenses paid over the period
| | | | |
| PGIM International Bond Fund | | | 13 | |
Fees and Expenses(continued)
and the impact of these fees on your ending account value, as these additional expenses are not reflected in the information provided in the expense table. Additional fees have the effect of reducing investment returns.
Please note that the expenses shown in the table are meant to highlight your ongoing costs only and do not reflect any transactional costs such as sales charges (loads). Therefore, the second line for each share class in the table is useful in comparing ongoing costs only and will not help you determine the relative total costs of owning different funds. In addition, if these transactional costs were included, your costs would have been higher.
| | | | | | | | | | | | | | | | | | |
| | | | |
PGIM International
Bond Fund | | Beginning Account
Value
May 1, 2019 | | | Ending Account
Value
October 31, 2019 | | | Annualized
Expense Ratio
Based on the
Six-Month Period | | | Expenses Paid
During the
Six-Month Period* | |
| Class A | | Actual | | $ | 1,000.00 | | | $ | 1,086.60 | | | | 0.99 | % | | $ | 5.21 | |
| | Hypothetical | | $ | 1,000.00 | | | $ | 1,020.21 | | | | 0.99 | % | | $ | 5.04 | |
| Class C | | Actual | | $ | 1,000.00 | | | $ | 1,082.60 | | | | 1.74 | % | | $ | 9.13 | |
| | Hypothetical | | $ | 1,000.00 | | | $ | 1,016.43 | | | | 1.74 | % | | $ | 8.84 | |
| Class Z | | Actual | | $ | 1,000.00 | | | $ | 1,088.00 | | | | 0.74 | % | | $ | 3.89 | |
| | Hypothetical | | $ | 1,000.00 | | | $ | 1,021.48 | | | | 0.74 | % | | $ | 3.77 | |
| Class R6 | | Actual | | $ | 1,000.00 | | | $ | 1,088.00 | | | | 0.74 | % | | $ | 3.89 | |
| | | Hypothetical | | $ | 1,000.00 | | | $ | 1,021.48 | | | | 0.74 | % | | $ | 3.77 | |
*Fund expenses (net of fee waivers or subsidies, if any) for each share class are equal to the annualized expense ratio for each share class (provided in the table), multiplied by the average account value over the period, multiplied by the 184 days in the six-month period ended October 31, 2019, and divided by the 365 days in the Fund’s fiscal year ended October 31, 2019 (to reflect the six-month period). Expenses presented in the table include the expenses of any underlying portfolios in which the Fund may invest.
| | |
| 14 | | Visit our website at pgiminvestments.com |
Schedule of Investments
as of October 31, 2019
| | | | | | | | | | | | | | | | |
| | | | |
| Description | | Interest
Rate | | | Maturity
Date | | | Principal
Amount (000)# | | | Value | |
| | | | |
LONG-TERM INVESTMENTS 93.2% | | | | | | | | | | | | | | | | |
| | | | |
ASSET-BACKED SECURITIES 7.7% | | | | | | | | | | | | | | | | |
| | | | |
Cayman Islands 3.5% | | | | | | | | | | | | | | | | |
Anchorage Capital CLO Ltd.,
Series2019-11A, Class A, 144A, 3 Month LIBOR + 1.390% (Cap N/A, Floor 1.390%) | | | 3.534 | %(c) | | | 07/22/32 | | | | 250 | | | $ | 249,924 | |
BlueMountain CLO Ltd.,
Series2016-02A, Class A1R, 144A, 3 Month LIBOR + 1.310% (Cap N/A, Floor 1.310%) | | | 3.446 | (c) | | | 08/20/32 | | | | 250 | | | | 249,702 | |
HPS Loan Management Ltd.,
Series15A-19, Class A1, 144A, 3 Month LIBOR + 1.320% (Cap N/A, Floor 1.320%) | | | 3.486 | (c) | | | 07/22/32 | | | | 250 | | | | 249,070 | |
OZLM Ltd.,
Series2019-24A, Class A1A, 144A, 3 Month LIBOR + 1.390% (Cap N/A, Floor 0.000%) | | | 3.546 | (c) | | | 07/20/32 | | | | 250 | | | | 249,987 | |
Silver Creek CLO Ltd.,
Series2014-01A, Class AR, 144A, 3 Month LIBOR + 1.240% (Cap N/A, Floor 0.000%) | | | 3.206 | (c) | | | 07/20/30 | | | | 250 | | | | 249,662 | |
| | | | | | | | | | | | | | | | |
| | | | | | | | | | | | | | | 1,248,345 | |
| | | | |
Netherlands 2.3% | | | | | | | | | | | | | | | | |
North Westerly CLO BV,
SeriesIV-A, Class A2R, 144A | | | 1.250 | | | | 01/15/26 | | | EUR | 223 | | | | 248,412 | |
St. Paul’s CLO DAC,
Series 07A, Class B2R, 144A | | | 2.400 | | | | 04/30/30 | | | EUR | 500 | | | | 557,283 | |
| | | | | | | | | | | | | | | | |
| | | | | | | | | | | | | | | 805,695 | |
| | | | |
United States 1.9% | | | | | | | | | | | | | | | | |
OneMain Direct Auto Receivables Trust,
Series2017-01A, Class C, 144A | | | 3.910 | | | | 08/16/21 | | | | 100 | | | | 100,177 | |
Oportun Funding LLC,
Series2019-A, Class B, 144A | | | 3.870 | | | | 08/08/25 | | | | 100 | | | | 100,748 | |
PNMAC GMSR Issuer Trust,
Series 2018-GT02, Class A, 144A, 1 Month LIBOR + 2.650% (Cap N/A, Floor 0.000%) | | | 4.473 | (c) | | | 08/25/25 | | | | 100 | | | | 100,347 | |
See Notes to Financial Statements.
| | | | |
| PGIM International Bond Fund | | | 15 | |
Schedule of Investments(continued)
as of October 31, 2019
| | | | | | | | | | | | | | | | |
| | | | |
| Description | | Interest
Rate | | | Maturity
Date | | | Principal
Amount (000)# | | | Value | |
| | | | |
ASSET-BACKED SECURITIES (Continued) | | | | | | | | | | | | | | | | |
| | | | |
United States (cont’d.) | | | | | | | | | | | | | | | | |
SoFi Alternative Trust,
Series2019-D, Class 1PT, 144A | | | 2.460 | %(cc) | | | 01/16/46 | | | | 200 | | | $ | 206,604 | |
TH MSR Issuer Trust,
Series 2019-FT01, Class A, 144A, 1 Month LIBOR + 2.800% (Cap N/A, Floor 2.800%) | | | 4.623 | (c) | | | 06/25/24 | | | | 150 | | | | 149,936 | |
| | | | | | | | | | | | | | | | |
| | | | | | | | | | | | | | | 657,812 | |
| | | | | | | | | | | | | | | | |
TOTAL ASSET-BACKED SECURITIES
(cost $2,744,846) | | | | | | | | | | | | | | | 2,711,852 | |
| | | | | | | | | | | | | | | | |
| | | | |
COMMERCIAL MORTGAGE-BACKED SECURITIES 1.9% | | | | | | | | | | | | | | | | |
| | | | |
United Kingdom 0.7% | | | | | | | | | | | | | | | | |
Salus European Loan Conduit DAC,
Series 33A, Class A, 144A, 3 Month GBP LIBOR + 1.500% (Cap 5.000%, Floor 0.000%) | | | 2.299 | (c) | | | 01/23/29 | | | GBP | 200 | | | | 259,951 | |
| | | | |
United States 1.2% | | | | | | | | | | | | | | | | |
BX Commercial Mortgage Trust,
Series2019-XL, Class J, 144A, 1 Month LIBOR + 2.650% (Cap N/A, Floor 2.650%) | | | 4.650 | (c) | | | 10/15/36 | | | | 200 | | | | 200,377 | |
Credit Suisse Mortgage Capital Certificates,
Series 2019-ICE04, Class F, 144A, 1 Month LIBOR + 2.650% (Cap N/A, Floor 2.650%) | | | 4.564 | (c) | | | 05/15/36 | | | | 200 | | | | 201,004 | |
| | | | | | | | | | | | | | | | |
| | | | | | | | | | | | | | | 401,381 | |
| | | | | | | | | | | | | | | | |
TOTAL COMMERCIAL MORTGAGE-BACKED SECURITIES
(cost $655,161) | | | | | | | | | | | | | | | 661,332 | |
| | | | | | | | | | | | | | | | |
| | | | |
CORPORATE BONDS 30.6% | | | | | | | | | | | | | | | | |
| | | | |
Australia 0.3% | | | | | | | | | | | | | | | | |
Transurban Finance Co. Pty Ltd.,
Sr. Sec’d. Notes, EMTN | | | 2.000 | | | | 08/28/25 | | | EUR | 100 | | | | 121,436 | |
| | | | |
Brazil 0.4% | | | | | | | | | | | | | | | | |
Petrobras Global Finance BV,
Gtd. Notes | | | 5.375 | | | | 10/01/29 | | | GBP | 100 | | | | 142,258 | |
See Notes to Financial Statements.
| | | | | | | | | | | | | | | | |
| | | | |
| Description | | Interest
Rate | | | Maturity
Date | | | Principal
Amount (000)# | | | Value | |
| | | | |
CORPORATE BONDS (Continued) | | | | | | | | | | | | | | | | |
| | | | |
China 1.6% | | | | | | | | | | | | | | | | |
Aircraft Finance Co. Ltd.,
Sr. Sec’d. Notes, Series B | | | 4.100 | % | | | 03/29/26 | | | | 200 | | | $ | 207,000 | |
CNAC HK Finbridge Co. Ltd.,
Gtd. Notes | | | 1.750 | | | | 06/14/22 | | | EUR | 100 | | | | 114,814 | |
State Grid Europe Development 2014 PLC,
Gtd. Notes, Series A | | | 1.500 | | | | 01/26/22 | | | EUR | 200 | | | | 229,642 | |
| | | | | | | | | | | | | | | | |
| | | | | | | | | | | | | | | 551,456 | |
| | | | |
France 1.4% | | | | | | | | | | | | | | | | |
Altice France SA, | | | | | | | | | | | | | | | | |
Sr. Sec’d. Notes, 144A | | | 2.500 | | | | 01/15/25 | | | EUR | 100 | | | | 111,904 | |
Sr. Sec’d. Notes, 144A | | | 3.375 | | | | 01/15/28 | | | EUR | 100 | | | | 111,736 | |
Loxam SAS,
Sr. Sub. Notes | | | 5.750 | | | | 07/15/27 | | | EUR | 150 | | | | 161,356 | |
SNCF Reseau,
Sr. Unsec’d. Notes | | | 4.700 | | | | 06/01/35 | | | CAD | 100 | | | | 94,748 | |
| | | | | | | | | | | | | | | | |
| | | | | | | | | | | | | | | 479,744 | |
| | | | |
Germany 2.0% | | | | | | | | | | | | | | | | |
Allianz SE,
Jr. Sub. Notes | | | 3.375 | (ff) | | | — | (rr) | | EUR | 200 | | | | 246,481 | |
Commerzbank AG,
Sub. Notes, EMTN | | | 7.750 | | | | 03/16/21 | | | EUR | 100 | | | | 122,974 | |
Nidda BondCo GmbH,
Gtd. Notes | | | 5.000 | | | | 09/30/25 | | | EUR | 100 | | | | 113,760 | |
Techem Verwaltungsgesellschaft 674 mbH,
Sr. Sec’d. Notes | | | 6.000 | | | | 07/30/26 | | | EUR | 100 | | | | 120,988 | |
Volkswagen International Finance NV,
Gtd. Notes | | | 2.700 | (ff) | | | — | (rr) | | EUR | 100 | | | | 114,876 | |
| | | | | | | | | | | | | | | | |
| | | | | | | | | | | | | | | 719,079 | |
| | | | |
Indonesia 0.3% | | | | | | | | | | | | | | | | |
Perusahaan Listrik Negara PT,
Sr. Unsec’d. Notes, 144A | | | 1.875 | | | | 11/05/31 | | | EUR | 100 | | | | 110,747 | |
| | | | |
Ireland 0.3% | | | | | | | | | | | | | | | | |
Smurfit Kappa Acquisitions,
Gtd. Notes | | | 2.750 | | | | 02/01/25 | | | EUR | 100 | | | | 121,546 | |
See Notes to Financial Statements.
| | | | |
| PGIM International Bond Fund | | | 17 | |
Schedule of Investments(continued)
as of October 31, 2019
| | | | | | | | | | | | | | | | |
| | | | |
| Description | | Interest
Rate | | | Maturity
Date | | | Principal
Amount (000)# | | | Value | |
| | | | |
CORPORATE BONDS (Continued) | | | | | | | | | | | | | | | | |
| | | | |
Italy 0.7% | | | | | | | | | | | | | | | | |
Agenzia Nazionale per l’Attrazione degli Investimenti e lo Sviluppo d’Impresa,
Sr. Unsec’d. Notes | | | 1.375 | % | | | 07/20/22 | | | EUR | 100 | | | $ | 113,401 | |
Assicurazioni Generali SpA,
Sub. Notes, EMTN | | | 5.500 | (ff) | | | 10/27/47 | | | EUR | 100 | | | | 134,115 | |
| | | | | | | | | | | | | | | | |
| | | | | | | | | | | | | | | 247,516 | |
| | | | |
Kazakhstan 0.3% | | | | | | | | | | | | | | | | |
Kazakhstan Temir Zholy National Co. JSC, | | | | | | | | | | | | | | | | |
Gtd. Notes | | | 3.250 | | | | 12/05/23 | | | CHF | 50 | | | | 55,078 | |
Gtd. Notes | | | 3.638 | | | | 06/20/22 | | | CHF | 50 | | | | 54,219 | |
| | | | | | | | | | | | | | | | |
| | | | | | | | | | | | | | | 109,297 | |
| | | | |
Luxembourg 1.1% | | | | | | | | | | | | | | | | |
ARD Finance SA,
Sr. Sec’d. Notes, Cash coupon 6.625% or PIK 7.375% | | | 6.625 | | | | 09/15/23 | | | EUR | 100 | | | | 115,434 | |
Matterhorn Telecom SA,
Sr. Sec’d. Notes, 144A | | | 3.125 | | | | 09/15/26 | | | EUR | 100 | | | | 111,809 | |
Picard Bondco SA,
Gtd. Notes | | | 5.500 | | | | 11/30/24 | | | EUR | 150 | | | | 160,603 | |
| | | | | | | | | | | | | | | | |
| | | | | | | | | | | | | | | 387,846 | |
| | | | |
Mexico 1.3% | | | | | | | | | | | | | | | | |
Petroleos Mexicanos,
Gtd. Notes | | | 3.625 | | | | 11/24/25 | | | EUR | 400 | | | | 454,227 | |
| | | | |
Netherlands 2.0% | | | | | | | | | | | | | | | | |
InterXion Holding NV,
Gtd. Notes | | | 4.750 | | | | 06/15/25 | | | EUR | 100 | | | | 121,273 | |
Nederlandse Waterschapsbank NV,
Sr. Unsec’d. Notes, EMTN | | | 5.200 | | | | 03/31/25 | | | CAD | 200 | | | | 176,445 | |
Starfruit Finco BV/Starfruit US Holdco LLC,
Sr. Unsec’d. Notes | | | 6.500 | | | | 10/01/26 | | | EUR | 150 | | | | 168,759 | |
UPCB Finance IV Ltd.,
Sr. Sec’d. Notes | | | 4.000 | | | | 01/15/27 | | | EUR | 90 | | | | 105,404 | |
Ziggo Bond Co. BV,
Sr. Unsec’d. Notes | | | 4.625 | | | | 01/15/25 | | | EUR | 100 | | | | 114,777 | |
| | | | | | | | | | | | | | | | |
| | | | | | | | | | | | | | | 686,658 | |
See Notes to Financial Statements.
| | | | | | | | | | | | | | | | |
| | | | |
| Description | | Interest
Rate | | | Maturity
Date | | | Principal
Amount (000)# | | | Value | |
| | | | |
CORPORATE BONDS (Continued) | | | | | | | | | | | | | | | | |
| | | | |
Peru 0.5% | | | | | | | | | | | | | | | | |
Peru Enhanced Pass-Through Finance Ltd., Pass-Through Certificates | | | 1.963 | %(s) | | | 06/02/25 | | | | 206 | | | $ | 190,715 | |
| | | | |
Poland 0.9% | | | | | | | | | | | | | | | | |
Bank Gospodarstwa Krajowego,
Gov’t. Gtd. Notes | | | 1.625 | | | | 04/30/28 | | | EUR | 250 | | | | 310,856 | |
| | | | |
Russia 0.7% | | | | | | | | | | | | | | | | |
Gazprom OAO Via Gaz Capital SA,
Sr. Unsec’d. Notes | | | 2.500 | | | | 03/21/26 | | | EUR | 200 | | | | 238,789 | |
| | | | |
Spain 0.6% | | | | | | | | | | | | | | | | |
Codere Finance 2 Luxembourg SA,
Sr. Sec’d. Notes | | | 6.750 | | | | 11/01/21 | | | EUR | 100 | | | | 96,458 | |
Merlin Properties Socimi SA,
Sr. Unsec’d. Notes, EMTN | | | 2.375 | | | | 05/23/22 | | | EUR | 100 | | | | 117,431 | |
| | | | | | | | | | | | | | | | |
| | | | | | | | | | | | | | | 213,889 | |
| | | | |
Supranational Bank 0.4% | | | | | | | | | | | | | | | | |
European Bank for Reconstruction & Development,
Sr. Unsec’d. Notes, GMTN | | | 6.450 | | | | 12/13/22 | | | IDR | 408,000 | | | | 29,086 | |
European Investment Bank,
Sr. Unsec’d. Notes, EMTN | | | 0.500 | | | | 10/26/23 | | | AUD | 160 | | | | 106,292 | |
| | | | | | | | | | | | | | | | |
| | | | | | | | | | | | | | | 135,378 | |
| | | | |
United Arab Emirates 0.4% | | | | | | | | | | | | | | | | |
First Abu Dhabi Bank PJSC,
Sr. Unsec’d. Notes, EMTN | | | 4.800 | | | | 06/01/21 | | | CNH | 1,000 | | | | 144,150 | |
| | | | |
United Kingdom 3.2% | | | | | | | | | | | | | | | | |
Barclays PLC,
Sub. Notes, EMTN | | | 2.000 | (ff) | | | 02/07/28 | | | EUR | 100 | | | | 112,368 | |
CPUK Finance Ltd.,
Sec’d. Notes, 144A | | | 4.250 | | | | 02/28/47 | | | GBP | 100 | | | | 131,157 | |
eG Global Finance PLC,
Sr. Sec’d. Notes, 144A | | | 6.250 | | | | 10/30/25 | | | EUR | 100 | | | | 115,155 | |
EI Group PLC,
First Mortgage | | | 6.375 | | | | 02/15/22 | | | GBP | 100 | | | | 130,498 | |
Pinewood Finance Co. Ltd.,
Sr. Sec’d. Notes, 144A | | | 3.250 | | | | 09/30/25 | | | GBP | 100 | | | | 132,450 | |
See Notes to Financial Statements.
| | | | |
| PGIM International Bond Fund | | | 19 | |
Schedule of Investments(continued)
as of October 31, 2019
| | | | | | | | | | | | | | | | |
| | | | |
| Description | | Interest
Rate | | | Maturity
Date | | | Principal
Amount (000)# | | | Value | |
| | | | |
CORPORATE BONDS (Continued) | | | | | | | | | | | | | | | | |
| | | | |
United Kingdom (cont’d.) | | | | | | | | | | | | | | | | |
Royal Bank of Scotland Group PLC,
Sr. Unsec’d. Notes, EMTN | | | 2.000 | %(ff) | | | 03/08/23 | | | EUR | 100 | | | $ | 115,936 | |
Stonegate Pub Co. Financing PLC,
Sr. Sec’d. Notes, 144A, 3 Month GBP LIBOR + 6.250% | | | 7.031 | (c) | | | 03/15/22 | | | GBP | 100 | | | | 129,859 | |
Tesco PLC,
Sr. Unsec’d. Notes, EMTN | | | 5.000 | | | | 03/24/23 | | | GBP | 80 | | | | 113,855 | |
Virgin Media Secured Finance PLC,
Sr. Sec’d. Notes | | | 5.000 | | | | 04/15/27 | | | GBP | 100 | | | | 136,364 | |
| | | | | | | | | | | | | | | | |
| | | | | | | | | | | | | | | 1,117,642 | |
| | | | |
United States 12.2% | | | | | | | | | | | | | | | | |
Adient Global Holdings Ltd.,
Gtd. Notes | | | 3.500 | | | | 08/15/24 | | | EUR | 100 | | | | 93,681 | |
American International Group, Inc.,
Sr. Unsec’d. Notes | | | 1.875 | | | | 06/21/27 | | | EUR | 100 | | | | 120,551 | |
Ball Corp.,
Gtd. Notes | | | 4.375 | | | | 12/15/23 | | | EUR | 100 | | | | 129,209 | |
Bank of America Corp.,
Sr. Unsec’d. Notes, EMTN | | | 0.591 | (s) | | | 05/31/21 | | | EUR | 85 | | | | 112,788 | |
Belden, Inc.,
Gtd. Notes | | | 4.125 | | | | 10/15/26 | | | EUR | 100 | | | | 116,040 | |
DH Europe Finance II Sarl,
Gtd. Notes | | | 0.200 | | | | 03/18/26 | | | EUR | 300 | | | | 331,308 | |
Diamond BC BV,
Sr. Unsec’d. Notes | | | 5.625 | | | | 08/15/25 | | | EUR | 125 | | | | 127,590 | |
Eli Lilly & Co.,
Sr. Unsec’d. Notes | | | 0.625 | | | | 11/01/31 | | | EUR | 200 | | | | 222,855 | |
Energizer Gamma Acquisition BV,
Gtd. Notes | | | 4.625 | | | | 07/15/26 | | | EUR | 300 | | | | 352,788 | |
Fidelity National Information Services, Inc., | | | | | | | | | | | | | | | | |
Sr. Unsec’d. Notes | | | 1.100 | | | | 07/15/24 | | | EUR | 100 | | | | 115,867 | |
Sr. Unsec’d. Notes | | | 1.500 | | | | 05/21/27 | | | EUR | 100 | | | | 118,505 | |
Fiserv, Inc., | | | | | | | | | | | | | | | | |
Sr. Unsec’d. Notes | | | 0.375 | | | | 07/01/23 | | | EUR | 100 | | | | 112,323 | |
Sr. Unsec’d. Notes | | | 2.250 | | | | 07/01/25 | | | GBP | 100 | | | | 133,477 | |
Goldman Sachs Group, Inc. (The),
Sub. Notes | | | 4.750 | | | | 10/12/21 | | | EUR | 150 | | | | 181,929 | |
Kraft Heinz Foods Co.,
Gtd. Notes | | | 2.250 | | | | 05/25/28 | | | EUR | 100 | | | | 119,061 | |
Marsh & McLennan Cos., Inc.,
Sr. Unsec’d. Notes | | | 1.349 | | | | 09/21/26 | | | EUR | 100 | | | | 117,506 | |
See Notes to Financial Statements.
| | | | | | | | | | | | | | | | |
| | | | |
| Description | | Interest
Rate | | | Maturity
Date | | | Principal
Amount (000)# | | | Value | |
| | | | |
CORPORATE BONDS (Continued) | | | | | | | | | | | | | | | | |
| | | | |
United States (cont’d.) | | | | | | | | | | | | | | | | |
Medtronic Global Holdings SCA, | | | | | | | | | | | | | | | | |
Gtd. Notes | | | 1.000 | % | | | 07/02/31 | | | EUR | 100 | | | $ | 115,291 | |
Gtd. Notes | | | 1.125 | | | | 03/07/27 | | | EUR | 100 | | | | 118,135 | |
Morgan Guaranty Trust Co.,
Sr. Unsec’d. Notes | | | 1.464 | (s) | | | 01/21/27 | | | ITL | 26 | | | | 26,549 | |
Morgan Stanley, | | | | | | | | | | | | | | | | |
Sr. Unsec’d. Notes, EMTN | | | 0.637 | (ff) | | | 07/26/24 | | | EUR | 200 | | | | 226,683 | |
Sr. Unsec’d. Notes, GMTN | | | 1.000 | | | | 12/02/22 | | | EUR | 100 | | | | 114,699 | |
PerkinElmer, Inc.,
Sr. Unsec’d. Notes | | | 0.600 | | | | 04/09/21 | | | EUR | 100 | | | | 112,155 | |
Refinitiv US Holdings, Inc.,
Sr. Unsec’d. Notes | | | 6.875 | | | | 11/15/26 | | | EUR | 100 | | | | 126,071 | |
Spectrum Brands, Inc.,
Gtd. Notes | | | 4.000 | | | | 10/01/26 | | | EUR | 100 | | | | 117,454 | |
Stryker Corp.,
Sr. Unsec’d. Notes | | | 2.625 | | | | 11/30/30 | | | EUR | 100 | | | | 133,791 | |
Thermo Fisher Scientific, Inc., | | | | | | | | | | | | | | | | |
Sr. Unsec’d. Notes | | | 0.125 | | | | 03/01/25 | | | EUR | 100 | | | | 110,811 | |
Sr. Unsec’d. Notes | | | 0.500 | | | | 03/01/28 | | | EUR | 100 | | | | 110,972 | |
Sr. Unsec’d. Notes | | | 1.400 | | | | 01/23/26 | | | EUR | 100 | | | | 118,471 | |
Verizon Communications, Inc.,
Sr. Unsec’d. Notes | | | 1.250 | | | | 04/08/30 | | | EUR | 100 | | | | 117,759 | |
Zimmer Biomet Holdings, Inc., | | | | | | | | | | | | | | | | |
Sr. Unsec’d. Notes | | | 1.414 | | | | 12/13/22 | | | EUR | 100 | | | | 115,634 | |
Sr. Unsec’d. Notes | | | 2.425 | | | | 12/13/26 | | | EUR | 100 | | | | 122,989 | |
| | | | | | | | | | | | | | | | |
| | | | | | | | | | | | | | | 4,292,942 | |
| | | | | | | | | | | | | | | | |
TOTAL CORPORATE BONDS
(cost $10,493,268) | | | | | | | | | | | | | | | 10,776,171 | |
| | | | | | | | | | | | | | | | |
| | | | |
RESIDENTIAL MORTGAGE-BACKED SECURITIES 1.6% | | | | | | | | | | | | | | | | |
| | | | |
Bermuda 0.4% | | | | | | | | | | | | | | | | |
Bellemeade Re Ltd.,
Series2018-01A, Class M1B, 144A, 1 Month LIBOR + 1.600% (Cap N/A, Floor 0.000%) | | | 3.423 | (c) | | | 04/25/28 | | | | 148 | | | | 148,329 | |
| | | | |
United Kingdom 0.3% | | | | | | | | | | | | | | | | |
Paragon Mortgages PLC,
Series 10X, Class B1A, 3 Month GBP LIBOR + 0.540% (Cap N/A, Floor 0.000%) | | | 1.321 | (c) | | | 06/15/41 | | | GBP | 97 | | | | 118,104 | |
See Notes to Financial Statements.
| | | | |
| PGIM International Bond Fund | | | 21 | |
Schedule of Investments(continued)
as of October 31, 2019
| | | | | | | | | | | | | | | | |
| | | | |
| Description | | Interest
Rate | | | Maturity
Date | | | Principal
Amount (000)# | | | Value | |
| | | | |
RESIDENTIAL MORTGAGE-BACKED SECURITIES (Continued) | | | | | | | | | | | | | | | | |
| | | | |
United States 0.9% | | | | | | | | | | | | | | | | |
CIM Trust,
Series2017-03, Class A1, 144A, 1 Month LIBOR + 2.000% (Cap N/A, Floor 0.000%) | | | 4.032 | %(c) | | | 01/25/57 | | | | 57 | | | $ | 57,966 | |
Legacy Mortgage Asset Trust,
Series 2019-PR01, Class A1, 144A | | | 3.858 | | | | 09/25/59 | | | | 100 | | | | 99,998 | |
LSTAR Securities Investment Trust, | | | | | | | | | | | | | | | | |
Series2018-02, Class A1, 144A, 1 Month LIBOR + 1.500% (Cap N/A, Floor 0.000%) | | | 3.532 | (c) | | | 04/01/23 | | | | 43 | | | | 42,792 | |
Series2019-02, Class A1, 144A, 1 Month LIBOR + 1.500% (Cap N/A, Floor 0.000%) | | | 3.532 | (c) | | | 04/01/24 | | | | 98 | | | | 97,955 | |
| | | | | | | | | | | | | | | | |
| | | | | | | | | | | | | | | 298,711 | |
| | | | | | | | | | | | | | | | |
TOTAL RESIDENTIAL MORTGAGE-BACKED SECURITIES
(cost $556,159) | | | | | | | | | | | | | | | 565,144 | |
| | | | | | | | | | | | | | | | |
| | | | |
SOVEREIGN BONDS 51.1% | | | | | | | | | | | | | | | | |
| | | | |
Argentina 0.9% | | | | | | | | | | | | | | | | |
Argentine Republic Government International Bond,
Sr. Unsec’d. Notes | | | 7.820 | | | | 12/31/33 | | | EUR | 516 | | | | 269,985 | |
Provincia de Buenos Aires,
Sr. Unsec’d. Notes | | | 5.375 | | | | 01/20/23 | | | EUR | 100 | | | | 36,693 | |
| | | | | | | | | | | | | | | | |
| | | | | | | | | | | | | | | 306,678 | |
| | | | |
Brazil 2.3% | | | | | | | | | | | | | | | | |
Brazil Loan Trust 1,
Gov’t. Gtd. Notes | | | 5.477 | | | | 07/24/23 | | | | 84 | | | | 87,467 | |
Brazil Minas SPE via State of Minas Gerais,
Gov’t. Gtd. Notes | | | 5.333 | | | | 02/15/28 | | | | 360 | | | | 382,504 | |
Brazilian Government International Bond,
Sr. Unsec’d. Notes | | | 2.875 | | | | 04/01/21 | | | EUR | 300 | | | | 346,655 | |
| | | | | | | | | | | | | | | | |
| | | | | | | | | | | | | | | 816,626 | |
| | | | |
Bulgaria 0.5% | | | | | | | | | | | | | | | | |
Bulgaria Government International Bond,
Sr. Unsec’d. Notes, GMTN | | | 3.125 | | | | 03/26/35 | | | EUR | 115 | | | | 168,838 | |
| | | | |
Canada 0.5% | | | | | | | | | | | | | | | | |
Province of British Columbia,
Unsec’d. Notes | | | 7.875 | | | | 11/30/23 | | | CAD | 200 | | | | 185,846 | |
See Notes to Financial Statements.
| | | | | | | | | | | | | | | | |
| | | | |
| Description | | Interest
Rate | | | Maturity
Date | | | Principal
Amount (000)# | | | Value | |
| | | | |
SOVEREIGN BONDS (Continued) | | | | | | | | | | | | | | | | |
| | | | |
China 1.5% | | | | | | | | | | | | | | | | |
China Government Bond, | | | | | | | | | | | | | | | | |
Sr. Unsec’d. Notes | | | 3.480 | % | | | 06/29/27 | | | CNH | 500 | | | $ | 72,768 | |
Sr. Unsec’d. Notes | | | 3.900 | | | | 07/04/36 | | | CNH | 1,000 | | | | 149,945 | |
Export-Import Bank of China (The),
Sr. Unsec’d. Notes | | | 4.400 | | | | 05/14/24 | | | CNH | 2,000 | | | | 295,638 | |
| | | | | | | | | | | | | | | | |
| | | | | | | | | | | | | | | 518,351 | |
| | | | |
Colombia 1.5% | | | | | | | | | | | | | | | | |
Colombia Government International Bond,
Sr. Unsec’d. Notes, EMTN | | | 3.875 | | | | 03/22/26 | | | EUR | 400 | | | | 529,768 | |
| | | | |
Croatia 0.8% | | | | | | | | | | | | | | | | |
Croatia Government International Bond,
Sr. Unsec’d. Notes | | | 2.700 | | | | 06/15/28 | | | EUR | 200 | | | | 264,326 | |
| | | | |
Cyprus 2.9% | | | | | | | | | | | | | | | | |
Cyprus Government International Bond, | | | | | | | | | | | | | | | | |
Sr. Unsec’d. Notes, EMTN | | | 2.375 | | | | 09/25/28 | | | EUR | 200 | | | | 259,769 | |
Sr. Unsec’d. Notes, EMTN | | | 2.750 | | | | 02/26/34 | | | EUR | 100 | | | | 138,884 | |
Sr. Unsec’d. Notes, EMTN | | | 3.750 | | | | 07/26/23 | | | EUR | 500 | | | | 635,386 | |
| | | | | | | | | | | | | | | | |
| | | | | | | | | | | | | | | 1,034,039 | |
| | | | |
Greece 4.2% | | | | | | | | | | | | | | | | |
Hellenic Republic Government Bond, | | | | | | | | | | | | | | | | |
Bonds | | | 3.000 | (cc) | | | 02/24/23 | | | EUR | 150 | | | | 184,371 | |
Bonds | | | 3.000 | (cc) | | | 02/24/24 | | | EUR | 75 | | | | 94,456 | |
Bonds | | | 3.000 | (cc) | | | 02/24/25 | | | EUR | 85 | | | | 109,509 | |
Bonds | | | 3.000 | (cc) | | | 02/24/26 | | | EUR | 85 | | | | 112,006 | |
Bonds | | | 3.000 | (cc) | | | 02/24/27 | | | EUR | 195 | | | | 259,037 | |
Bonds | | | 3.000 | (cc) | | | 02/24/28 | | | EUR | 60 | | | | 81,231 | |
Bonds | | | 3.000 | (cc) | | | 02/24/29 | | | EUR | 50 | | | | 68,261 | |
Bonds | | | 3.000 | (cc) | | | 02/24/31 | | | EUR | 140 | | | | 194,850 | |
Bonds | | | 3.000 | (cc) | | | 02/24/42 | | | EUR | 5 | | | | 7,241 | |
Bonds | | | 4.200 | | | | 01/30/42 | | | EUR | 190 | | | | 290,164 | |
Hellenic Republic Government International Bond,
Sr. Unsec’d. Notes | | | 5.200 | | | | 07/17/34 | | | EUR | 60 | | | | 93,910 | |
| | | | | | | | | | | | | | | | |
| | | | | | | | | | | | | | | 1,495,036 | |
See Notes to Financial Statements.
| | | | |
| PGIM International Bond Fund | | | 23 | |
Schedule of Investments(continued)
as of October 31, 2019
| | | | | | | | | | | | | | | | |
| | | | |
| Description | | Interest
Rate | | | Maturity
Date | | | Principal
Amount (000)# | | | Value | |
| | | | |
SOVEREIGN BONDS (Continued) | | | | | | | | | | | | | | | | |
| | | | |
Hungary 0.1% | | | | | | | | | | | | | | | | |
Hungary Government International Bond,
Sr. Unsec’d. Notes | | | 4.300 | % | | | 12/19/21 | | | CNH | 200 | | | $ | 28,551 | |
| | | | |
Indonesia 1.9% | | | | | | | | | | | | | | | | |
Indonesia Government International Bond, | | | | | | | | | | | | | | | | |
Sr. Unsec’d. Notes | | | 1.750 | | | | 04/24/25 | | | EUR | 200 | | | | 233,544 | |
Sr. Unsec’d. Notes, EMTN | | | 2.150 | | | | 07/18/24 | | | EUR | 140 | | | | 166,418 | |
Sr. Unsec’d. Notes, EMTN | | | 3.750 | | | | 06/14/28 | | | EUR | 200 | | | | 270,572 | |
| | | | | | | | | | | | | | | | |
| | | | | | | | | | | | | | | 670,534 | |
| | | | |
Ireland 0.6% | | | | | | | | | | | | | | | | |
Ireland Government Bond,
Bonds | | | 2.400 | | | | 05/15/30 | | | EUR | 150 | | | | 208,191 | |
| | | | |
Israel 0.3% | | | | | | | | | | | | | | | | |
Israel Government International Bond,
Sr. Unsec’d. Notes, EMTN | | | 1.500 | | | | 01/18/27 | | | EUR | 100 | | | | 121,902 | |
| | | | |
Italy 7.7% | | | | | | | | | | | | | | | | |
City of Rome Italy,
Sr. Unsec’d. Notes, EMTN | | | 5.345 | | | | 01/27/48 | | | EUR | 50 | | | | 88,678 | |
Italy Buoni Poliennali Del Tesoro, | | | | | | | | | | | | | | | | |
Bonds, 144A | | | 2.800 | | | | 03/01/67 | | | EUR | 50 | | | | 64,342 | |
Unsec’d. Notes, 144A | | | 3.350 | | | | 03/01/35 | | | EUR | 690 | | | | 966,388 | |
Italy Certificati di Credito del Tesoro,
Bonds, Series EU, 6 Month EURIBOR + 0.550% | | | 0.142 | (c) | | | 09/15/25 | | | EUR | 130 | | | | 142,693 | |
Republic of Italy Government International Bond, | | | | | | | | | | | | | | | | |
Sr. Unsec’d. Notes | | | 2.875 | | | | 10/17/29 | | | | 200 | | | | 195,949 | |
Sr. Unsec’d. Notes, EMTN | | | 5.125 | | | | 07/31/24 | | | EUR | 675 | | | | 913,096 | |
Sr. Unsec’d. Notes, EMTN | | | 6.000 | | | | 08/04/28 | | | GBP | 205 | | | | 340,841 | |
| | | | | | | | | | | | | | | | |
| | | | | | | | | | | | | | | 2,711,987 | |
| | | | |
Japan 0.4% | | | | | | | | | | | | | | | | |
Japan Government Thirty Year Bond,
Sr. Unsec’d. Notes, Series 63 | | | 0.400 | | | | 06/20/49 | | | JPY | 6,000 | | | | 55,738 | |
Japan Government Twenty Year Bond,
Sr. Unsec’d. Notes, Series 165 | | | 0.500 | | | | 06/20/38 | | | JPY | 8,000 | | | | 78,141 | |
| | | | | | | | | | | | | | | | |
| | | | | | | | | | | | | | | 133,879 | |
See Notes to Financial Statements.
| | | | | | | | | | | | | | | | |
| | | | |
| Description | | Interest
Rate | | | Maturity
Date | | | Principal
Amount (000)# | | | Value | |
| | | | |
SOVEREIGN BONDS (Continued) | | | | | | | | | | | | | | | | |
| | | | |
Kazakhstan 0.4% | | | | | | | | | | | | | | | | |
Kazakhstan Government International Bond,
Sr. Unsec’d. Notes, 144A, MTN | | | 2.375 | % | | | 11/09/28 | | | EUR | 115 | | | $ | 144,356 | |
| | | | |
Mexico 1.6% | | | | | | | | | | | | | | | | |
Mexico Government International Bond, | | | | | | | | | | | | | | | | |
Sr. Unsec’d. Notes, EMTN | | | 1.750 | | | | 04/17/28 | | | EUR | 300 | | | | 352,574 | |
Sr. Unsec’d. Notes, GMTN | | | 1.625 | | | | 03/06/24 | | | EUR | 185 | | | | 217,448 | |
| | | | | | | | | | | | | | | | |
| | | | | | | | | | | | | | | 570,022 | |
| | | | |
Peru 0.8% | | | | | | | | | | | | | | | | |
Peruvian Government International Bond,
Sr. Unsec’d. Notes | | | 3.750 | | | | 03/01/30 | | | EUR | 200 | | | | 289,438 | |
| | | | |
Philippines 0.3% | | | | | | | | | | | | | | | | |
Philippine Government International Bond,
Sr. Unsec’d. Notes, EMTN | | | 0.875 | | | | 05/17/27 | | | EUR | 100 | | | | 114,597 | |
| | | | |
Portugal 3.6% | | | | | | | | | | | | | | | | |
Portugal Government International Bond,
Sr. Unsec’d. Notes | | | 4.090 | | | | 06/03/22 | | | CNH | 600 | | | | 85,052 | |
Portugal Obrigacoes do Tesouro OT, | | | | | | | | | | | | | | | | |
Sr. Unsec’d. Notes, 144A | | | 3.875 | | | | 02/15/30 | | | EUR | 625 | | | | 955,104 | |
Sr. Unsec’d. Notes, 144A | | | 4.100 | | | | 04/15/37 | | | EUR | 130 | | | | 224,690 | |
| | | | | | | | | | | | | | | | |
| | | | | | | | | | | | | | | 1,264,846 | |
| | | | |
Romania 0.9% | | | | | | | | | | | | | | | | |
Romanian Government International Bond, | | | | | | | | | | | | | | | | |
Sr. Unsec’d. Notes, 144A, MTN | | | 2.500 | | | | 02/08/30 | | | EUR | 100 | | | | 122,153 | |
Sr. Unsec’d. Notes, EMTN | | | 3.875 | | | | 10/29/35 | | | EUR | 100 | | | | 132,806 | |
Unsec’d. Notes, 144A, MTN | | | 2.124 | | | | 07/16/31 | | | EUR | 40 | | | | 46,173 | |
| | | | | | | | | | | | | | | | |
| | | | | | | | | | | | | | | 301,132 | |
| | | | |
Russia 0.9% | | | | | | | | | | | | | | | | |
Russian Federal Bond - OFZ,
Bonds, Series 6224 | | | 6.900 | | | | 05/23/29 | | | RUB | 3,000 | | | | 48,522 | |
Russian Foreign Bond - Eurobond,
Sr. Unsec’d. Notes | | | 2.875 | | | | 12/04/25 | | | EUR | 200 | | | | 251,480 | |
| | | | | | | | | | | | | | | | |
| | | | | | | | | | | | | | | 300,002 | |
See Notes to Financial Statements.
| | | | |
| PGIM International Bond Fund | | | 25 | |
Schedule of Investments(continued)
as of October 31, 2019
| | | | | | | | | | | | | | | | |
| | | | |
| Description | | Interest
Rate | | | Maturity
Date | | | Principal
Amount (000)# | | | Value | |
| | | | |
SOVEREIGN BONDS (Continued) | | | | | | | | | | | | | | | | |
| | | | |
Saudi Arabia 0.4% | | | | | | | | | | | | | | | | |
Saudi Government International Bond,
Sr. Unsec’d. Notes, 144A | | | 2.000 | % | | | 07/09/39 | | | EUR | 125 | | | $ | 147,080 | |
| | | | |
Senegal 0.3% | | | | | | | | | | | | | | | | |
Senegal Government International Bond,
Sr. Unsec’d. Notes, 144A | | | 4.750 | | | | 03/13/28 | | | EUR | 100 | | | | 115,316 | |
| | | | |
Serbia 0.7% | | | | | | | | | | | | | | | | |
Serbia International Bond,
Sr. Unsec’d. Notes, 144A | | | 1.500 | | | | 06/26/29 | | | EUR | 200 | | | | 229,484 | |
| | | | |
South Korea 0.7% | | | | | | | | | | | | | | | | |
Export-Import Bank of Korea, | | | | | | | | | | | | | | | | |
Sr. Unsec’d. Notes, 144A, MTN | | | 8.000 | | | | 05/15/24 | | | IDR | 600,000 | | | | 44,440 | |
Sr. Unsec’d. Notes, EMTN | | | 2.000 | | | | 04/30/20 | | | EUR | 100 | | | | 112,677 | |
Sr. Unsec’d. Notes, MTN | | | 3.500 | | | | 07/28/21 | | | NZD | 150 | | | | 98,980 | |
| | | | | | | | | | | | | | | | |
| | | | | | | | | | | | | | | 256,097 | |
| | | | |
Spain 7.7% | | | | | | | | | | | | | | | | |
Instituto de Credito Oficial, | | | | | | | | | | | | | | | | |
Gov’t. Gtd. Notes, EMTN | | | 5.000 | | | | 03/31/20 | | | CAD | 160 | | | | 122,893 | |
Gov’t. Gtd. Notes, GMTN | | | 0.963 | | | | 09/22/22 | | | SEK | 1,000 | | | | 104,942 | |
Spain Government Bond, | | | | | | | | | | | | | | | | |
Bonds, 144A | | | 5.150 | | | | 10/31/28 | | | EUR | 185 | | | | 297,974 | |
Sr. Unsec’d. Notes, 144A | | | 1.400 | | | | 04/30/28 | | | EUR | 70 | | | | 86,516 | |
Sr. Unsec’d. Notes, 144A | | | 1.450 | | | | 10/31/27 | | | EUR | 265 | | | | 327,581 | |
Sr. Unsec’d. Notes, 144A(k) | | | 4.650 | | | | 07/30/25 | | | EUR | 870 | | | | 1,235,342 | |
Spain Government International Bond,
Sr. Unsec’d. Notes, EMTN | | | 5.250 | | | | 04/06/29 | | | GBP | 315 | | | | 526,869 | |
| | | | | | | | | | | | | | | | |
| | | | | | | | | | | | | | | 2,702,117 | |
| | | | |
Turkey 1.3% | | | | | | | | | | | | | | | | |
Turkey Government International Bond, | | | | | | | | | | | | | | | | |
Sr. Unsec’d. Notes | | | 5.200 | | | | 02/16/26 | | | EUR | 200 | | | | 233,812 | |
Sr. Unsec’d. Notes | | | 7.500 | | | | 11/07/19 | | | | 100 | | | | 100,000 | |
Sr. Unsec’d. Notes, EMTN | | | 3.250 | | | | 06/14/25 | | | EUR | 100 | | | | 108,184 | |
| | | | | | | | | | | | | | | | |
| | | | | | | | | | | | | | | 441,996 | |
See Notes to Financial Statements.
| | | | | | | | | | | | | | | | |
| | | | |
| Description | | Interest
Rate | | | Maturity
Date | | | Principal
Amount (000)# | | | Value | |
| | | | |
SOVEREIGN BONDS (Continued) | | | | | | | | | | | | | | | | |
| | | | |
Ukraine 1.0% | | | | | | | | | | | | | | | | |
Ukraine Government International Bond,
Sr. Unsec’d. Notes | | | 6.750 | % | | | 06/20/26 | | | EUR | 300 | | | $ | 369,548 | |
| | | | |
United Kingdom 4.4% | | | | | | | | | | | | | | | | |
United Kingdom Gilt,
Bonds | | | 4.250 | | | | 03/07/36 | | | GBP | 800 | | | | 1,555,663 | |
| | | | | | | | | | | | | | | | |
TOTAL SOVEREIGN BONDS
(cost $16,713,105) | | | | | | | | | | | | | | | 17,996,246 | |
| | | | | | | | | | | | | | | | |
| | | | |
U.S. GOVERNMENT AGENCY OBLIGATION 0.1% | | | | | | | | | | | | | | | | |
Indonesia Government USAID Bond
Gov’t. Gtd. Notes
(cost $10,578) | | | 8.900 | | | | 06/01/21 | | | | 10 | | | | 10,949 | |
| | | | |
U.S. TREASURY OBLIGATION 0.2% | | | | | | | | | | | | | | | | |
U.S. Treasury Notes
(cost $59,513) | | | 1.500 | | | | 10/31/24 | | | | 60 | | | | 59,946 | |
| | | | | | | | | | | | | | | | |
TOTAL LONG-TERM INVESTMENTS
(cost $31,232,630) | | | | | | | | | | | | | | | 32,781,640 | |
| | | | | | | | | | | | | | | | |
| | | | |
| | | | | | | | | Shares | | | | |
| | | | |
SHORT-TERM INVESTMENTS 1.7% | | | | | | | | | | | | | | | | |
| | | | |
AFFILIATED MUTUAL FUND 1.7% | | | | | | | | | | | | | | | | |
PGIM Core Ultra Short Bond Fund
(cost $594,002)(w) | | | | | | | | | | | 594,002 | | | | 594,002 | |
| | | | |
OPTIONS PURCHASED*~ 0.0%
(cost $950) | | | | | | | | | | | | | | | 10,940 | |
| | | | | | | | | | | | | | | | |
TOTAL SHORT-TERM INVESTMENTS
(cost $594,952) | | | | | | | | | | | | | | | 604,942 | |
| | | | | | | | | | | | | | | | |
| | | | |
TOTAL INVESTMENTS 94.9%
(cost $31,827,582) | | | | | | | | | | | | | | | 33,386,582 | |
Other assets in excess of liabilities(z) 5.1% | | | | | | | | | | | | | | | 1,812,634 | |
| | | | | | | | | | | | | | | | |
| | | | |
NET ASSETS 100.0% | | | | | | | | | | | | | | $ | 35,199,216 | |
| | | | | | | | | | | | | | | | |
See Notes to Financial Statements.
| | | | |
| PGIM International Bond Fund | | | 27 | |
Schedule of Investments(continued)
as of October 31, 2019
Below is a list of the abbreviation(s) used in the annual report:
AED—United Arab Emirates Dirham
AUD—Australian Dollar
BRL—Brazilian Real
CAD—Canadian Dollar
CHF—Swiss Franc
CLP—Chilean Peso
CNH—Chinese Renminbi
COP—Colombian Peso
CZK—Czech Koruna
EGP—Egyptian Pound
EUR—Euro
GBP—British Pound
HKD—Hong Kong Dollar
HUF—Hungarian Forint
IDR—Indonesian Rupiah
ILS—Israeli Shekel
INR—Indian Rupee
ITL—Italian Lira
JPY—Japanese Yen
KRW—South Korean Won
MXN—Mexican Peso
MYR—Malaysian Ringgit
NOK—Norwegian Krone
NZD—New Zealand Dollar
PEN—Peruvian Nuevo Sol
PHP—Philippine Peso
PLN—Polish Zloty
RUB—Russian Ruble
SEK—Swedish Krona
SGD—Singapore Dollar
THB—Thai Baht
TRY—Turkish Lira
TWD—New Taiwanese Dollar
USD—US Dollar
ZAR—South African Rand
144A—Security was purchased pursuant to Rule 144A under the Securities Act of 1933 and, pursuant to the requirements of Rule 144A, may not be resold except to qualified institutional buyers.
A—Annual payment frequency for swaps
BBR—New Zealand Bank Bill Rate
BBSW—Australian Bank Bill Swap Reference Rate
BIBOR—Bangkok Interbank Offered Rate
BROIS—Brazil Overnight Index Swap
BUBOR—Budapest Interbank Offered Rate
CDX—Credit Derivative Index
CLO—Collateralized Loan Obligation
CLOIS—Sinacofi Chile Interbank Rate Average
CMBX—Commercial Mortgage-Backed Index
CMS—Constant Maturity Swap
COOIS—Colombia Overnight Interbank Reference Rate
CPI—Consumer Price Index
See Notes to Financial Statements.
EIBOR—Emirates Interbank Offered Rate
EMTN—Euro Medium Term Note
EONIA—Euro Overnight Index Average
EURIBOR—Euro Interbank Offered Rate
GMAC—General Motors Acceptance Corporation
GMTN—Global Medium Term Note
HIBOR—Hong Kong Interbank Offered Rate
HICP—Harmonised Index of Consumer Prices
JIBAR—Johannesburg Interbank Agreed Rate
KLIBOR—Kuala Lumpur Interbank Offered Rate
KWCDC—Korean Won Certificate of Deposit
LIBOR—London Interbank Offered Rate
M—Monthly payment frequency for swaps
MOSPRIME—Moscow Prime Offered Rate
MTN—Medium Term Note
NIBOR—Norwegian Interbank Offered Rate
OFZ—Obligatsyi Federal’novo Zaima (Federal Loan Obligations)
OTC—Over-the-counter
PIK—Payment-in-Kind
PJSC—Public Joint-Stock Company
PRIBOR—Prague Interbank Offered Rate
Q—Quarterly payment frequency for swaps
REITs—Real Estate Investment Trust
S—Semiannual payment frequency for swaps
SIBOR—Singapore Interbank Offered Rate
SONIA—Sterling Overnight Index Average
STIBOR—Stockholm Interbank Offered Rate
T—Swap payment upon termination
TELBOR—Tel Aviv Interbank Offered Rate
USAID—United States Agency for International Development
USOIS—United States Overnight Index Swap
WIBOR—Warsaw Interbank Offered Rate
| * | Non-income producing security. |
| # | Principal or notional amount is shown in U.S. dollars unless otherwise stated. |
| ~ | See tables subsequent to the Schedule of Investments for options detail. |
| ^ | Indicates a Level 3 security. The aggregate value of Level 3 securities is $671 and 0.0% of net assets. |
| (c) | Variable rate instrument. The interest rate shown reflects the rate in effect at October 31, 2019. |
| (cc) | Variable rate instrument. The rate shown is based on the latest available information as of October 31, 2019. Certain variable rate securities are not based on a published reference rate and spread but are determined by the issuer or agent and are based on current market conditions. These securities do not indicate a reference rate and spread in their description. |
| (ff) | Variable rate security. Security may be issued at a fixed coupon rate, which converts to a variable rate at a specified date. Rate shown is the rate in effect as of period end. |
| (k) | Represents security, or a portion thereof, segregated as collateral for centrally cleared/exchange-traded derivatives. |
| (rr) | Perpetual security with no stated maturity date. |
| (s) | Represents zero coupon bond or principal only security. Rate represents yield to maturity at purchase date. |
| (w) | PGIM Investments LLC, the manager of the Fund, also serves as manager of the PGIM Core Ultra Short Bond Fund. |
| (z) | Includes net unrealized appreciation/(depreciation) and/or market value of the below holdings which are excluded from the Schedule of Investments: |
See Notes to Financial Statements.
| | | | |
| PGIM International Bond Fund | | | 29 | |
Schedule of Investments(continued)
as of October 31, 2019
Options Purchased:
OTC Traded
| | | | | | | | | | | | | | | | | | | | | | | | | | |
Description | | Call/
Put | | Counterparty | | | Expiration
Date | | | Strike | | | Contracts | | | Notional
Amount
(000)# | | | Value | |
2-Year 10 CMS Curve CAP | | Call | |
| Barclays Bank PLC
Morgan Stanley & Co. |
| | | 11/21/19 | | | | 0.12 | % | | | — | | | | 100 | | | $ | 38 | |
2-Year 10 CMS Curve CAP | | Call | | | International PLC | | | | 11/21/19 | | | | 0.13 | % | | | — | | | | 100 | | | | 25 | |
2-Year 10 CMS Curve CAP | | Call | | | Barclays Bank PLC | | | | 07/12/21 | | | | 0.11 | % | | | — | | | | 71 | | | | 795 | |
2-Year 10 CMS Curve CAP | | Call | | | Bank of America, N.A. | | | | 08/16/21 | | | | 0.15 | % | | | — | | | | 172 | | | | 1,803 | |
2-Year 10 CMS Curve CAP | | Call | | | Bank of America, N.A. | | | | 08/20/21 | | | | 0.15 | % | | | — | | | | 342 | | | | 3,700 | |
2-Year 10 CMS Curve CAP | | Call | | | Bank of America, N.A. | | | | 09/13/21 | | | | 0.14 | % | | | — | | | | 340 | | | | 3,856 | |
2-Year 10 CMS Curve CAP | | Call | | | Barclays Bank PLC | | | | 11/09/21 | | | | 0.21 | % | | | — | | | | 69 | | | | 723 | |
| | | | | | | | | | | | | | | | | | | | | | | | | | |
Total Options Purchased (cost $950) | | | | | | | | | | | | | | | | | | | | | | $ | 10,940 | |
| | | | | | | | | | | | | | | | | | | | | | | | | | |
Futures contracts outstanding at October 31, 2019:
| | | | | | | | | | | | | | | | |
Number of
Contracts | | | Type | | Expiration
Date | | | Current
Notional
Amount | | | Value /
Unrealized
Appreciation
(Depreciation) | |
| | | | Long Positions: | | | | | | | | | | | | |
| | 116 | | | 5 Year U.S. Treasury Notes | | | Dec. 2019 | | | $ | 13,827,563 | | | $ | (65,393 | ) |
| | 1 | | | 10 Year Canadian Government Bonds | | | Dec. 2019 | | | | 107,843 | | | | (1,345 | ) |
| | 2 | | | 10 Year U.K. Gilt | | | Dec. 2019 | | | | 344,149 | | | | (1,751 | ) |
| | 48 | | | 10 Year U.S. Treasury Notes | | | Dec. 2019 | | | | 6,254,250 | | | | (27,401 | ) |
| | 3 | | | 30 Year Euro Buxl | | | Dec. 2019 | | | | 702,505 | | | | (38,012 | ) |
| | 8 | | | 30 Year U.S. Ultra Treasury Bonds | | | Dec. 2019 | | | | 1,518,000 | | | | (41,319 | ) |
| | | | | | | | | | | | | | | | |
| | | | | | | | | | | | | | | (175,221 | ) |
| | | | | | | | | | | | | | | | |
| | | | Short Positions: | | | | | | | | | | | | |
| | 107 | | | 2 Year U.S. Treasury Notes | | | Dec. 2019 | | | | 23,069,367 | | | | 48,047 | |
| | 38 | | | 5 Year Euro-Bobl | | | Dec. 2019 | | | | 5,705,384 | | | | 75,898 | |
| | 22 | | | 10 Year Euro-Bund | | | Dec. 2019 | | | | 4,214,407 | | | | 81,425 | |
| | 3 | | | 20 Year U.S. Treasury Bonds | | | Dec. 2019 | | | | 484,125 | | | | 10,652 | |
| | 42 | | | Euro Schatz Index | | | Dec. 2019 | | | | 5,249,650 | | | | 26,893 | |
| | | | | | | | | | | | | | | | |
| | | | | | | | | | | | | | | 242,915 | |
| | | | | | | | | | | | | | | | |
| | | | | | | | | | | | | | $ | 67,694 | |
| | | | | | | | | | | | | | | | |
Forward foreign currency exchange contracts outstanding at October 31, 2019:
| | | | | | | | | | | | | | | | | | | | | | |
Purchase Contracts | | Counterparty | | Notional
Amount
(000) | | | Value at
Settlement
Date | | | Current
Value | | | Unrealized
Appreciation | | | Unrealized
Depreciation | |
OTC Forward Foreign Currency Exchange Contracts: | |
Brazilian Real, | |
Expiring 11/04/19 | | BNP Paribas S.A. | | BRL | 852 | | | $ | 213,709 | | | $ | 212,470 | | | $ | — | | | $ | (1,239 | ) |
See Notes to Financial Statements.
Forward foreign currency exchange contracts outstanding at October 31, 2019 (continued):
| | | | | | | | | | | | | | | | | | | | | | |
Purchase Contracts | | Counterparty | | Notional
Amount
(000) | | | Value at
Settlement
Date | | | Current
Value | | | Unrealized
Appreciation | | | Unrealized
Depreciation | |
OTC Forward Foreign Currency Exchange Contracts (cont’d.): | | | | | |
Brazilian Real (cont’d.), | | | | | | | | | | | | | | | | | | | | |
Expiring 11/04/19 | | JPMorgan Chase
Bank, N.A. | | BRL | 484 | | | $ | 118,800 | | | $ | 120,579 | | | $ | 1,779 | | | $ | — | |
British Pound, | | | | | | | | | | | | | | | | | | | | | | |
Expiring 11/04/19 | | UBS AG | | GBP | 2,596 | | | | 3,325,055 | | | | 3,362,777 | | | | 37,722 | | | | — | |
Expiring 01/17/20 | | Barclays Bank PLC | | GBP | 68 | | | | 87,429 | | | | 87,824 | | | | 395 | | | | — | |
Expiring 01/17/20 | | Barclays Bank PLC | | GBP | 48 | | | | 62,883 | | | | 62,955 | | | | 72 | | | | — | |
Expiring 01/17/20 | | BNP Paribas S.A. | | GBP | 59 | | | | 76,000 | | | | 76,086 | | | | 86 | | | | — | |
Expiring 01/17/20 | | Morgan Stanley & Co.
International PLC | | GBP | 59 | | | | 76,000 | | | | 76,675 | | | | 675 | | | | — | |
Canadian Dollar, | | | | | | | | | | | | | | | | | | | | | | |
Expiring 01/22/20 | | Morgan Stanley & Co.
International PLC | | CAD | 112 | | | | 85,000 | | | | 85,044 | | | | 44 | | | | — | |
Chilean Peso, | | | | | | | | | | | | | | | | | | | | | | |
Expiring 12/18/19 | | BNP Paribas S.A. | | CLP | 43,347 | | | | 59,760 | | | | 58,521 | | | | — | | | | (1,239 | ) |
Expiring 12/18/19 | | BNP Paribas S.A. | | CLP | 26,616 | | | | 36,822 | | | | 35,933 | | | | — | | | | (889 | ) |
Expiring 12/18/19 | | BNP Paribas S.A. | | CLP | 22,803 | | | | 31,600 | | | | 30,785 | | | | — | | | | (815 | ) |
Expiring 12/18/19 | | BNP Paribas S.A. | | CLP | 22,730 | | | | 31,550 | | | | 30,687 | | | | — | | | | (863 | ) |
Expiring 12/18/19 | | Goldman Sachs
International | | CLP | 60,043 | | | | 84,000 | | | | 81,062 | | | | — | | | | (2,938 | ) |
Expiring 12/18/19 | | JPMorgan Chase
Bank, N.A. | | CLP | 21,421 | | | | 29,703 | | | | 28,920 | | | | — | | | | (783 | ) |
Expiring 12/18/19 | | UBS AG | | CLP | 50,617 | | | | 69,900 | | | | 68,337 | | | | — | | | | (1,563 | ) |
Chinese Renminbi, | | | | | | | | | | | | | | | | | | | | | | |
Expiring 02/14/20 | | HSBC Bank USA, N.A. | | CNH | 345 | | | | 48,746 | | | | 48,870 | | | | 124 | | | | — | |
Expiring 05/14/21 | | Citibank, N.A. | | CNH | 961 | | | | 137,666 | | | | 134,167 | | | | — | | | | (3,499 | ) |
Czech Koruna, | | | | | | | | | | | | | | | | | | | | | | |
Expiring 01/17/20 | | Citibank, N.A. | | CZK | 1,609 | | | | 69,000 | | | | 70,421 | | | | 1,421 | | | | — | |
Expiring 01/17/20 | | Citibank, N.A. | | CZK | 1,604 | | | | 70,000 | | | | 70,194 | | | | 194 | | | | — | |
See Notes to Financial Statements.
| | | | |
| PGIM International Bond Fund | | | 31 | |
Schedule of Investments(continued)
as of October 31, 2019
Forward foreign currency exchange contracts outstanding at October 31, 2019 (continued):
| | | | | | | | | | | | | | | | | | | | | | |
Purchase Contracts | | Counterparty | | Notional
Amount
(000) | | | Value at
Settlement
Date | | | Current
Value | | | Unrealized
Appreciation | | | Unrealized
Depreciation | |
OTC Forward Foreign Currency Exchange Contracts (cont’d.): | |
Egyptian Pound, | | | | | | | | | | | | | | | | | | | | | | |
Expiring 11/27/19 | | Citibank, N.A. | | EGP | 389 | | | $ | 22,535 | | | $ | 23,898 | | | $ | 1,363 | | | $ | — | |
Expiring 11/27/19 | | Citibank, N.A. | | EGP | 253 | | | | 14,670 | | | | 15,553 | | | | 883 | | | | — | |
Expiring 12/18/19 | | Citibank, N.A. | | EGP | 700 | | | | 40,314 | | | | 42,781 | | | | 2,467 | | | | — | |
Expiring 12/23/19 | | Citibank, N.A. | | EGP | 169 | | | | 10,000 | | | | 10,300 | | | | 300 | | | | — | |
Expiring 12/23/19 | | Morgan Stanley & Co.
International PLC | | EGP | 334 | | | | 19,771 | | | | 20,407 | | | | 636 | | | | — | |
Expiring 12/23/19 | | Morgan Stanley & Co.
International PLC | | EGP | 165 | | | | 9,771 | | | | 10,085 | | | | 314 | | | | — | |
Expiring 01/21/20 | | Citibank, N.A. | | EGP | 558 | | | | 31,964 | | | | 33,842 | | | | 1,878 | | | | — | |
Expiring 01/28/20 | | Citibank, N.A. | | EGP | 451 | | | | 26,573 | | | | 27,328 | | | | 755 | | | | — | |
Expiring 01/28/20 | | Citibank, N.A. | | EGP | 275 | | | | 16,085 | | | | 16,652 | | | | 567 | | | | — | |
Expiring 01/30/20 | | Citibank, N.A. | | EGP | 296 | | | | 17,010 | | | | 17,941 | | | | 931 | | | | — | |
Euro, | | | | | | | | | | | | | | | | | | | | | | |
Expiring 11/04/19 | | UBS AG | | EUR | 16,626 | | | | 18,453,379 | | | | 18,548,669 | | | | 95,290 | | | | — | |
Expiring 01/17/20 | | Barclays Bank PLC | | EUR | 110 | | | | 123,000 | | | | 122,834 | | | | — | | | | (166 | ) |
Expiring 01/17/20 | | Barclays Bank PLC | | EUR | 93 | | | | 103,000 | | | | 103,830 | | | | 830 | | | | — | |
Expiring 01/17/20 | | Goldman Sachs
International | | EUR | 133 | | | | 149,244 | | | | 149,237 | | | | — | | | | (7 | ) |
Expiring 01/17/20 | | JPMorgan Chase
Bank, N.A. | | EUR | 1,200 | | | | 1,345,317 | | | | 1,345,802 | | | | 485 | | | | — | |
Hungarian Forint, | | | | | | | | | | | | | | | | | | | | | | |
Expiring 01/17/20 | | JPMorgan Chase
Bank, N.A. | | HUF | 16,741 | | | | 56,000 | | | | 57,077 | | | | 1,077 | | | | — | |
Indian Rupee, | | | | | | | | | | | | | | | | | | | | | | |
Expiring 12/18/19 | | Citibank, N.A. | | INR | 9,287 | | | | 127,427 | | | | 129,920 | | | | 2,493 | | | | — | |
Expiring 12/18/19 | | Citibank, N.A. | | INR | 6,426 | | | | 89,000 | | | | 89,894 | | | | 894 | | | | — | |
Expiring 12/18/19 | | HSBC Bank USA, N.A. | | INR | 21,866 | | | | 300,955 | | | | 305,907 | | | | 4,952 | | | | — | |
See Notes to Financial Statements.
Forward foreign currency exchange contracts outstanding at October 31, 2019 (continued):
| | | | | | | | | | | | | | | | | | | | | | |
Purchase Contracts | | Counterparty | | Notional
Amount
(000) | | | Value at
Settlement
Date | | | Current
Value | | | Unrealized
Appreciation | | | Unrealized
Depreciation | |
OTC Forward Foreign Currency Exchange Contracts (cont’d.): | |
Indonesian Rupiah, | |
Expiring 12/18/19 | | HSBC Bank USA, N.A. | | IDR | 1,269,862 | | | $ | 90,000 | | | $ | 89,697 | | | $ | — | | | $ | (303 | ) |
Israeli Shekel, | | | | | | | | | | | | | | | | | | | | | | |
Expiring 11/29/19 | | Citibank, N.A. | | ILS | 2,543 | | | | 700,000 | | | | 722,591 | | | | 22,591 | | | | — | |
Expiring 12/18/19 | | Barclays Bank PLC | | ILS | 42 | | | | 11,920 | | | | 11,861 | | | | — | | | | (59 | ) |
Expiring 12/18/19 | | Barclays Bank PLC | | ILS | 25 | | | | 7,130 | | | | 7,086 | | | | — | | | | (44 | ) |
Expiring 12/18/19 | | Citibank, N.A. | | ILS | 61 | | | | 17,400 | | | | 17,243 | | | | — | | | | (157 | ) |
Expiring 12/18/19 | | JPMorgan Chase
Bank, N.A. | | ILS | 295 | | | | 85,000 | | | | 83,881 | | | | — | | | | (1,119 | ) |
Expiring 12/18/19 | | JPMorgan Chase
Bank, N.A. | | ILS | 290 | | | | 83,000 | | | | 82,508 | | | | — | | | | (492 | ) |
Expiring 12/18/19 | | JPMorgan Chase
Bank, N.A. | | ILS | 175 | | | | 49,622 | | | | 49,683 | | | | 61 | | | | — | |
Expiring 12/18/19 | | JPMorgan Chase
Bank, N.A. | | ILS | 105 | | | | 29,938 | | | | 29,905 | | | | — | | | | (33 | ) |
Japanese Yen, | | | | | | | | | | | | | | | | | | | | | | |
Expiring 01/17/20 | | Barclays Bank PLC | | JPY | 6,182 | | | | 57,484 | | | | 57,558 | | | | 74 | | | | — | |
Expiring 01/17/20 | | HSBC Bank USA, N.A. | | JPY | 8,417 | | | | 78,000 | | | | 78,361 | | | | 361 | | | | — | |
Mexican Peso, | | | | | | | | | | | | | | | | | | | | | | |
Expiring 12/18/19 | | JPMorgan Chase
Bank, N.A. | | MXN | 3,924 | | | | 194,441 | | | | 202,449 | | | | 8,008 | | | | — | |
Expiring 12/18/19 | | Morgan Stanley & Co.
International PLC | | MXN | 1,371 | | | | 71,000 | | | | 70,750 | | | | — | | | | (250 | ) |
New Taiwanese Dollar, | | | | | | | | | | | | | | | | | | | | | | |
Expiring 12/18/19 | | Barclays Bank PLC | | TWD | 3,545 | | | | 117,000 | | | | 117,056 | | | | 56 | | | | — | |
Expiring 12/18/19 | | JPMorgan Chase
Bank, N.A. | | TWD | 4,576 | | | | 149,440 | | | | 151,076 | | | | 1,636 | | | | — | |
Norwegian Krone, | | | | | | | | | | | | | | | | | | | | | | |
Expiring 01/17/20 | | Bank of America, N.A. | | NOK | 2,377 | | | | 261,067 | | | | 258,629 | | | | — | | | | (2,438 | ) |
Expiring 01/17/20 | | JPMorgan Chase
Bank, N.A. | | NOK | 2,259 | | | | 248,579 | | | | 245,817 | | | | — | | | | (2,762 | ) |
Peruvian Nuevo Sol, | | | | | | | | | | | | | | | | | | | | | | |
Expiring 12/18/19 | | BNP Paribas S.A. | | PEN | 513 | | | | 151,733 | | | | 153,104 | | | | 1,371 | | | | — | |
See Notes to Financial Statements.
| | | | |
| PGIM International Bond Fund | | | 33 | |
Schedule of Investments(continued)
as of October 31, 2019
Forward foreign currency exchange contracts outstanding at October 31, 2019 (continued):
| | | | | | | | | | | | | | | | | | | | | | |
Purchase Contracts | | Counterparty | | Notional
Amount
(000) | | | Value at
Settlement
Date | | | Current
Value | | | Unrealized
Appreciation | | | Unrealized
Depreciation | |
OTC Forward Foreign Currency Exchange Contracts (cont’d.): | | | | | |
Peruvian Nuevo Sol (cont’d.), | | | | | | | | | | | | | | | | | | | | |
Expiring 12/18/19 | | Citibank, N.A. | | PEN | 325 | | | $ | 96,000 | | | $ | 96,954 | | | $ | 954 | | | $ | — | |
Philippine Peso, | | | | | | | | | | | | | | | | | | | | | | |
Expiring 12/18/19 | | JPMorgan Chase
Bank, N.A. | | PHP | 3,914 | | | | 74,942 | | | | 76,954 | | | | 2,012 | | | | — | |
Polish Zloty, | | | | | | | | | | | | | | | | | | | | | | |
Expiring 01/17/20 | | Barclays Bank PLC | | PLN | 253 | | | | 66,000 | | | | 66,249 | | | | 249 | | | | — | |
Expiring 01/17/20 | | Citibank, N.A. | | PLN | 233 | | | | 60,000 | | | | 61,143 | | | | 1,143 | | | | — | |
Expiring 01/17/20 | | Morgan Stanley & Co.
International PLC | | PLN | 322 | | | | 84,000 | | | | 84,211 | | | | 211 | | | | — | |
Russian Ruble, | | | | | | | | | | | | | | | | | | | | | | |
Expiring 12/18/19 | | Barclays Bank PLC | | RUB | 3,378 | | | | 52,000 | | | | 52,309 | | | | 309 | | | | — | |
Expiring 12/18/19 | | Citibank, N.A. | | RUB | 3,705 | | | | 57,000 | | | | 57,367 | | | | 367 | | | | — | |
Expiring 12/18/19 | | Credit Suisse
International | | RUB | 2,524 | | | | 39,124 | | | | 39,079 | | | | — | | | | (45 | ) |
Expiring 12/18/19 | | JPMorgan Chase
Bank, N.A. | | RUB | 2,666 | | | | 41,200 | | | | 41,290 | | | | 90 | | | | — | |
Expiring 12/18/19 | | Morgan Stanley & Co.
International PLC | | RUB | 10,935 | | | | 160,930 | | | | 169,330 | | | | 8,400 | | | | — | |
Expiring 12/18/19 | | Morgan Stanley & Co.
International PLC | | RUB | 8,796 | | | | 130,000 | | | | 136,212 | | | | 6,212 | | | | — | |
Singapore Dollar, | | | | | | | | | | | | | | | | | | | | | | |
Expiring 12/18/19 | | Citibank, N.A. | | SGD | 157 | | | | 115,000 | | | | 115,250 | | | | 250 | | | | — | |
Expiring 12/18/19 | | Citibank, N.A. | | SGD | 122 | | | | 89,059 | | | | 90,020 | | | | 961 | | | | — | |
Expiring 12/18/19 | | Citibank, N.A. | | SGD | 99 | | | | 72,000 | | | | 72,921 | | | | 921 | | | | — | |
Expiring 12/18/19 | | Goldman Sachs
International | | SGD | 300 | | | | 220,500 | | | | 220,726 | | | | 226 | | | | — | |
Expiring 12/18/19 | | JPMorgan Chase
Bank, N.A. | | SGD | 159 | | | | 117,000 | | | | 117,155 | | | | 155 | | | | — | |
South African Rand, | | | | | | | | | | | | | | | | | | | | | | |
Expiring 12/18/19 | | Barclays Bank PLC | | ZAR | 618 | | | | 40,312 | | | | 40,638 | | | | 326 | | | | — | |
Expiring 12/18/19 | | JPMorgan Chase
Bank, N.A. | | ZAR | 620 | | | | 40,829 | | | | 40,770 | | | | — | | | | (59 | ) |
See Notes to Financial Statements.
Forward foreign currency exchange contracts outstanding at October 31, 2019 (continued):
| | | | | | | | | | | | | | | | | | | | | | |
Purchase Contracts | | Counterparty | | Notional
Amount
(000) | | | Value at
Settlement
Date | | | Current
Value | | | Unrealized
Appreciation | | | Unrealized
Depreciation | |
OTC Forward Foreign Currency Exchange Contracts (cont’d.): | |
South African Rand (cont’d.), | | | | | | | | | | | | | | | | | | | | |
Expiring 12/18/19 | | JPMorgan Chase
Bank, N.A. | | ZAR | 615 | | | $ | 39,965 | | | $ | 40,432 | | | $ | 467 | | | $ | — | |
Expiring 12/18/19 | | JPMorgan Chase
Bank, N.A. | | ZAR | 109 | | | | 6,980 | | | | 7,136 | | | | 156 | | | | — | |
South Korean Won, | | | | | | | | | | | | | | | | | | | | | | |
Expiring 12/18/19 | | HSBC Bank USA, N.A. | | KRW | 120,523 | | | | 101,000 | | | | 103,086 | | | | 2,086 | | | | — | |
Expiring 12/18/19 | | HSBC Bank USA, N.A. | | KRW | 116,468 | | | | 98,000 | | | | 99,617 | | | | 1,617 | | | | — | |
Expiring 12/18/19 | | JPMorgan Chase
Bank, N.A. | | KRW | 99,851 | | | | 84,000 | | | | 85,404 | | | | 1,404 | | | | — | |
Expiring 12/18/19 | | JPMorgan Chase
Bank, N.A. | | KRW | 55,846 | | | | 47,855 | | | | 47,766 | | | | — | | | | (89 | ) |
Swedish Krona, | | | | | | | | | | | | | | | | | | | | | | |
Expiring 01/17/20 | | BNP Paribas S.A. | | SEK | 765 | | | | 80,000 | | | | 79,627 | | | | — | | | | (373 | ) |
Swiss Franc, | | | | | | | | | | | | | | | | | | | | | | |
Expiring 01/17/20 | | Morgan Stanley & Co.
International PLC | | CHF | 17 | | | | 17,500 | | | | 17,582 | | | | 82 | | | | — | |
Thai Baht, | | | | | | | | | | | | | | | | | | | | | | |
Expiring 12/18/19 | | Citibank, N.A. | | THB | 3,431 | | | | 112,000 | | | | 113,692 | | | | 1,692 | | | | — | |
Expiring 12/18/19 | | Credit Suisse
International | | THB | 2,707 | | | | 88,000 | | | | 89,708 | | | | 1,708 | | | | — | |
Expiring 12/18/19 | | HSBC Bank USA, N.A. | | THB | 2,504 | | | | 82,000 | | | | 82,981 | | | | 981 | | | | — | |
Expiring 12/18/19 | | JPMorgan Chase
Bank, N.A. | | THB | 2,477 | | | | 81,000 | | | | 82,076 | | | | 1,076 | | | | — | |
Expiring 12/18/19 | | UBS AG | | THB | 3,134 | | | | 103,000 | | | | 103,839 | | | | 839 | | | | — | |
Turkish Lira, | | | | | | | | | | | | | | | | | | | | | | |
Expiring 12/18/19 | | Barclays Bank PLC | | TRY | 236 | | | | 40,250 | | | | 40,703 | | | | 453 | | | | — | |
Expiring 12/18/19 | | Barclays Bank PLC | | TRY | 233 | | | | 39,861 | | | | 40,264 | | | | 403 | | | | — | |
Expiring 12/18/19 | | Barclays Bank PLC | | TRY | 163 | | | | 27,819 | | | | 28,095 | | | | 276 | | | | — | |
Expiring 12/18/19 | | Barclays Bank PLC | | TRY | 163 | | | | 28,050 | | | | 28,110 | | | | 60 | | | | — | |
Expiring 12/18/19 | | Goldman Sachs
International | | TRY | 230 | | | | 39,124 | | | | 39,635 | | | | 511 | | | | — | |
See Notes to Financial Statements.
| | | | |
| PGIM International Bond Fund | | | 35 | |
Schedule of Investments(continued)
as of October 31, 2019
Forward foreign currency exchange contracts outstanding at October 31, 2019 (continued):
| | | | | | | | | | | | | | | | | | | | | | |
Purchase Contracts | | Counterparty | | Notional
Amount
(000) | | | Value at
Settlement
Date | | | Current
Value | | | Unrealized
Appreciation | | | Unrealized
Depreciation | |
OTC Forward Foreign Currency Exchange Contracts (cont’d.): | |
Turkish Lira (cont’d.), | | | | | | | | | | | | | | | | | | | | |
Expiring 12/18/19 | | Goldman Sachs International | | TRY | 164 | | | $ | 28,100 | | | $ | 28,263 | | | $ | 163 | | | $ | — | |
Expiring 12/18/19 | | UBS AG | | TRY | 217 | | | | 37,000 | | | | 37,424 | | | | 424 | | | | — | |
| | | | | | | | | | | | | | | | | | | | | | |
| | | | | | | | $ | 30,809,792 | | | $ | 31,017,537 | | | | 229,969 | | | | (22,224 | ) |
| | | | | | | | | | | | | | | | | | | | | | |
| | | | | | |
Sale Contracts | | Counterparty | | Notional
Amount
(000) | | | Value at
Settlement
Date | | | Current
Value | | | Unrealized
Appreciation | | | Unrealized
Depreciation | |
OTC Forward Foreign Currency Exchange Contracts: | |
Australian Dollar, | | | | | | | | | | | | | | | | | | | | | | |
Expiring 01/22/20 | | HSBC Bank USA, N.A. | | AUD | 607 | | | $ | 415,458 | | | $ | 419,182 | | | $ | — | | | $ | (3,724 | ) |
Brazilian Real, | | | | | | | | | | | | | | | | | | | | | | |
Expiring 11/04/19 | | Barclays Bank PLC | | BRL | 193 | | | | 46,000 | | | | 48,108 | | | | — | | | | (2,108 | ) |
Expiring 11/04/19 | | The Toronto-Dominion Bank | | BRL | 1,143 | | | | 274,249 | | | | 284,941 | | | | — | | | | (10,692 | ) |
Expiring 12/03/19 | | BNP Paribas S.A. | | BRL | 852 | | | | 213,366 | | | | 212,089 | | | | 1,277 | | | | — | |
British Pound, | | | | | | | | | | | | | | | | | | | | | | |
Expiring 11/04/19 | | Morgan Stanley & Co.
International PLC | | GBP | 2,596 | | | | 3,228,534 | | | | 3,362,777 | | | | — | | | | (134,243 | ) |
Expiring 12/03/19 | | UBS AG | | GBP | 2,596 | | | | 3,328,198 | | | | 3,365,867 | | | | — | | | | (37,669 | ) |
Expiring 01/17/20 | | Barclays Bank PLC | | GBP | 50 | | | | 64,000 | | | | 64,487 | | | | — | | | | (487 | ) |
Expiring 01/17/20 | | Barclays Bank PLC | | GBP | 50 | | | | 65,000 | | | | 65,243 | | | | — | | | | (243 | ) |
Expiring 01/17/20 | | Citibank, N.A. | | GBP | 258 | | | | 325,502 | | | | 335,570 | | | | — | | | | (10,068 | ) |
Expiring 01/17/20 | | Deutsche Bank AG | | GBP | 258 | | | | 327,550 | | | | 335,572 | | | | — | | | | (8,022 | ) |
Expiring 01/17/20 | | Morgan Stanley & Co.
International PLC | | GBP | 53 | | | | 68,000 | | | | 68,294 | | | | — | | | | (294 | ) |
Canadian Dollar, | | | | | | | | | | | | | | | | | | | | | | |
Expiring 01/22/20 | | Barclays Bank PLC | | CAD | 920 | | | | 700,773 | | | | 698,813 | | | | 1,960 | | | | — | |
See Notes to Financial Statements.
Forward foreign currency exchange contracts outstanding at October 31, 2019 (continued):
| | | | | | | | | | | | | | | | | | | | | | |
Sale Contracts | | Counterparty | | Notional
Amount
(000) | | | Value at
Settlement
Date | | | Current
Value | | | Unrealized
Appreciation | | | Unrealized
Depreciation | |
OTC Forward Foreign Currency Exchange Contracts (cont’d.): | |
Chilean Peso, | | | | | | | | | | | | | | | | | | | | | | |
Expiring 12/18/19 | | Barclays Bank PLC | | CLP | 142,714 | | | $ | 200,793 | | | $ | 192,672 | | | $ | 8,121 | | | $ | — | |
Expiring 12/18/19 | | JPMorgan Chase Bank, N.A. | | CLP | 285,427 | | | | 395,877 | | | | 385,345 | | | | 10,532 | | | | — | |
Expiring 12/18/19 | | Morgan Stanley & Co. International PLC | | CLP | 142,714 | | | | 197,938 | | | | 192,672 | | | | 5,266 | | | | — | |
Chinese Renminbi, | | | | | | | | | | | | | | | | | | | | | | |
Expiring 02/14/20 | | BNP Paribas S.A. | | CNH | 4,614 | | | | 650,337 | | | | 652,731 | | | | — | | | | (2,394 | ) |
Expiring 05/14/21 | | JPMorgan Chase Bank, N.A. | | CNH | 961 | | | | 137,889 | | | | 134,168 | | | | 3,721 | | | | — | |
Colombian Peso, | | | | | | | | | | | | | | | | | | | | | | |
Expiring 12/18/19 | | Barclays Bank PLC | | COP | 226,964 | | | | 67,000 | | | | 67,028 | | | | — | | | | (28 | ) |
Expiring 12/18/19 | | Goldman Sachs International | | COP | 179,935 | | | | 53,000 | | | | 53,139 | | | | — | | | | (139 | ) |
Expiring 12/18/19 | | Goldman Sachs International | | COP | 161,955 | | | | 47,676 | | | | 47,829 | | | | — | | | | (153 | ) |
Expiring 12/18/19 | | JPMorgan Chase Bank, N.A. | | COP | 254,443 | | | | 74,214 | | | | 75,143 | | | | — | | | | (929 | ) |
Expiring 12/18/19 | | JPMorgan Chase Bank, N.A. | | COP | 139,338 | | | | 41,200 | | | | 41,150 | | | | 50 | | | | — | |
Expiring 12/18/19 | | JPMorgan Chase Bank, N.A. | | COP | 135,113 | | | | 39,767 | | | | 39,902 | | | | — | | | | (135 | ) |
Czech Koruna, | | | | | | | | | | | | | | | | | | | | | | |
Expiring 01/17/20 | | Barclays Bank PLC | | CZK | 1,982 | | | | 84,821 | | | | 86,731 | | | | — | | | | (1,910 | ) |
Egyptian Pound, | | | | | | | | | | | | | | | | | | | | | | |
Expiring 12/23/19 | | Citibank, N.A. | | EGP | 530 | | | | 31,851 | | | | 32,369 | | | | — | | | | (518 | ) |
Expiring 12/23/19 | | Citibank, N.A. | | EGP | 138 | | | | 8,307 | | | | 8,423 | | | | — | | | | (116 | ) |
Euro, | | | | | | | | | | | | | | | | | | | | | | |
Expiring 11/04/19 | | UBS AG | | EUR | 16,626 | | | | 18,338,658 | | | | 18,548,669 | | | | — | | | | (210,011 | ) |
Expiring 12/03/19 | | UBS AG | | EUR | 16,626 | | | | 18,489,108 | | | | 18,583,791 | | | | — | | | | (94,683 | ) |
Expiring 01/17/20 | | HSBC Bank USA, N.A. | | EUR | 1,835 | | | | 2,037,224 | | | | 2,058,129 | | | | — | | | | (20,905 | ) |
Expiring 01/17/20 | | JPMorgan Chase Bank, N.A. | | EUR | 1,968 | | | | 2,186,656 | | | | 2,207,653 | | | | — | | | | (20,997 | ) |
See Notes to Financial Statements.
| | | | |
| PGIM International Bond Fund | | | 37 | |
Schedule of Investments(continued)
as of October 31, 2019
Forward foreign currency exchange contracts outstanding at October 31, 2019 (continued):
| | | | | | | | | | | | | | | | | | | | | | |
Sale Contracts | | Counterparty | | Notional
Amount
(000) | | | Value at
Settlement
Date | | | Current
Value | | | Unrealized
Appreciation | | | Unrealized
Depreciation | |
OTC Forward Foreign Currency Exchange Contracts (cont’d.): | |
Euro (cont’d.), | |
Expiring 01/17/20 | | Morgan Stanley & Co. International PLC | | EUR | 77 | | | $ | 86,000 | | | $ | 86,244 | | | $ | — | | | $ | (244 | ) |
Expiring 01/17/20 | | UBS AG | | EUR | 2,138 | | | | 2,368,702 | | | | 2,397,825 | | | | — | | | | (29,123 | ) |
Hungarian Forint, | | | | | | | | | | | | | | | | | | | | | | |
Expiring 01/17/20 | | The Toronto-Dominion Bank | | HUF | 94,279 | | | | 315,869 | | | | 321,438 | | | | — | | | | (5,569 | ) |
Indian Rupee, | | | | | | | | | | | | | | | | | | | | | | |
Expiring 12/18/19 | | Bank of America, N.A. | | INR | 5,679 | | | | 79,000 | | | | 79,449 | | | | — | | | | (449 | ) |
Expiring 12/18/19 | | HSBC Bank USA, N.A. | | INR | 2,859 | | | | 39,740 | | | | 39,999 | | | | — | | | | (259 | ) |
Expiring 12/18/19 | | HSBC Bank USA, N.A. | | INR | 2,809 | | | | 39,124 | | | | 39,303 | | | | — | | | | (179 | ) |
Expiring 12/18/19 | | Morgan Stanley & Co. International PLC | | INR | 7,081 | | | | 99,000 | | | | 99,064 | | | | — | | | | (64 | ) |
Indonesian Rupiah, | | | | | | | | | | | | | | | | | | | | | | |
Expiring 12/18/19 | | HSBC Bank USA, N.A. | | IDR | 7,536,521 | | | | 523,952 | | | | 532,346 | | | | — | | | | (8,394 | ) |
Expiring 12/18/19 | | HSBC Bank USA, N.A. | | IDR | 1,217,072 | | | | 86,000 | | | | 85,968 | | | | 32 | | | | — | |
Expiring 12/18/19 | | HSBC Bank USA, N.A. | | IDR | 1,101,267 | | | | 77,000 | | | | 77,789 | | | | — | | | | (789 | ) |
Expiring 12/18/19 | | HSBC Bank USA, N.A. | | IDR | 1,070,612 | | | | 76,000 | | | | 75,623 | | | | 377 | | | | — | |
Israeli Shekel, | | | | | | | | | | | | | | | | | | | | | | |
Expiring 11/29/19 | | Goldman Sachs International | | ILS | 2,538 | | | | 700,000 | | | | 721,000 | | | | — | | | | (21,000 | ) |
Expiring 12/18/19 | | Barclays Bank PLC | | ILS | 609 | | | | 173,775 | | | | 173,309 | | | | 466 | | | | — | |
Japanese Yen, | | | | | | | | | | | | | | | | | | | | | | |
Expiring 01/17/20 | | Morgan Stanley & Co. International PLC | | JPY | 74,972 | | | | 696,457 | | | | 697,990 | | | | — | | | | (1,533 | ) |
Mexican Peso, | | | | | | | | | | | | | | | | | | | | | | |
Expiring 12/18/19 | | Citibank, N.A. | | MXN | 848 | | | | 44,000 | | | | 43,732 | | | | 268 | | | | — | |
Expiring 12/18/19 | | JPMorgan Chase Bank, N.A. | | MXN | 831 | | | | 42,227 | | | | 42,889 | | | | — | | | | (662 | ) |
New Taiwanese Dollar, | | | | | | | | | | | | | | | | | | | | | | |
Expiring 12/18/19 | | Credit Suisse International | | TWD | 16,133 | | | | 519,540 | | | | 532,646 | | | | — | | | | (13,106 | ) |
See Notes to Financial Statements.
Forward foreign currency exchange contracts outstanding at October 31, 2019 (continued):
| | | | | | | | | | | | | | | | | | | | | | |
Sale Contracts | | Counterparty | | Notional
Amount
(000) | | | Value at
Settlement
Date | | | Current
Value | | | Unrealized
Appreciation | | | Unrealized
Depreciation | |
OTC Forward Foreign Currency Exchange Contracts (cont’d.): | |
New Taiwanese Dollar (cont’d.), | |
Expiring 12/18/19 | | HSBC Bank USA, N.A. | | TWD | 2,724 | | | $ | 88,000 | | | $ | 89,949 | | | $ | — | | | $ | (1,949 | ) |
Expiring 12/18/19 | | JPMorgan Chase Bank, N.A. | | TWD | 3,318 | | | | 108,000 | | | | 109,560 | | | | — | | | | (1,560 | ) |
Expiring 12/18/19 | | JPMorgan Chase Bank, N.A. | | TWD | 3,091 | | | | 101,000 | | | | 102,062 | | | | — | | | | (1,062 | ) |
New Zealand Dollar, | | | | | | | | | | | | | | | | | | | | | | |
Expiring 01/22/20 | | Morgan Stanley & Co. International PLC | | NZD | 495 | | | | 313,871 | | | | 317,589 | | | | — | | | | (3,718 | ) |
Peruvian Nuevo Sol, | | | | | | | | | | | | | | | | | | | | | | |
Expiring 12/18/19 | | Bank of America, N.A. | | PEN | 188 | | | | 55,800 | | | | 56,104 | | | | — | | | | (304 | ) |
Expiring 12/18/19 | | JPMorgan Chase Bank, N.A. | | PEN | 368 | | | | 109,000 | | | | 109,936 | | | | — | | | | (936 | ) |
Philippine Peso, | | | | | | | | | | | | | | | | | | | | | | |
Expiring 12/18/19 | | HSBC Bank USA, N.A. | | PHP | 7,346 | | | | 140,000 | | | | 144,422 | | | | — | | | | (4,422 | ) |
Polish Zloty, | | | | | | | | | | | | | | | | | | | | | | |
Expiring 01/17/20 | | Barclays Bank PLC | | PLN | 186 | | | | 47,879 | | | | 48,755 | | | | — | | | | (876 | ) |
Russian Ruble, | | | | | | | | | | | | | | | | | | | | | | |
Expiring 12/18/19 | | Citibank, N.A. | | RUB | 3,077 | | | | 47,000 | | | | 47,652 | | | | — | | | | (652 | ) |
Singapore Dollar, | | | | | | | | | | | | | | | | | | | | | | |
Expiring 12/18/19 | | Goldman Sachs International | | SGD | 272 | | | | 195,314 | | | | 199,897 | | | | — | | | | (4,583 | ) |
South African Rand, | | | | | | | | | | | | | | | | | | | | | | |
Expiring 12/18/19 | | Barclays Bank PLC | | ZAR | 1,042 | | | | 69,500 | | | | 68,504 | | | | 996 | | | | — | |
Expiring 12/18/19 | | Barclays Bank PLC | | ZAR | 594 | | | | 39,325 | | | | 39,073 | | | | 252 | | | | — | |
Expiring 12/18/19 | | Barclays Bank PLC | | ZAR | 584 | | | | 39,124 | | | | 38,394 | | | | 730 | | | | — | |
Expiring 12/18/19 | | Citibank, N.A. | | ZAR | 608 | | | | 39,782 | | | | 39,982 | | | | — | | | | (200 | ) |
Expiring 12/18/19 | | JPMorgan Chase Bank, N.A. | | ZAR | 702 | | | | 47,184 | | | | 46,128 | | | | 1,056 | | | | — | |
South Korean Won, | | | | | | | | | | | | | | | | | | | | | | |
Expiring 12/18/19 | | Citibank, N.A. | | KRW | 196,199 | | | | 163,234 | | | | 167,813 | | | | — | | | | (4,579 | ) |
See Notes to Financial Statements.
| | | | |
| PGIM International Bond Fund | | | 39 | |
Schedule of Investments(continued)
as of October 31, 2019
Forward foreign currency exchange contracts outstanding at October 31, 2019 (continued):
| | | | | | | | | | | | | | | | | | | | | | |
Sale Contracts | | Counterparty | | Notional
Amount
(000) | | | Value at
Settlement
Date | | | Current
Value | | | Unrealized
Appreciation | | | Unrealized
Depreciation | |
OTC Forward Foreign Currency Exchange Contracts (cont’d.): | | | | | |
Swedish Krona, | | | | | |
Expiring 01/17/20 | | Barclays Bank PLC | | SEK | 684 | | | $ | 70,000 | | | $ | 71,206 | | | $ | — | | | $ | (1,206 | ) |
Expiring 01/17/20 | | Morgan Stanley & Co. International PLC | | SEK | 1,716 | | | | 176,182 | | | | 178,569 | | | | — | | | | (2,387 | ) |
Swiss Franc, | | | | | | | | | | | | | | | | | | | | | | |
Expiring 01/17/20 | | UBS AG | | CHF | 533 | | | | 537,189 | | | | 543,262 | | | | — | | | | (6,073 | ) |
Thai Baht, | | | | | | | | | | | | | | | | | | | | | | |
Expiring 12/18/19 | | Citibank, N.A. | | THB | 2,524 | | | | 82,000 | | | | 83,619 | | | | — | | | | (1,619 | ) |
Expiring 12/18/19 | | JPMorgan Chase Bank, N.A. | | THB | 770 | | | | 25,105 | | | | 25,528 | | | | — | | | | (423 | ) |
Turkish Lira, | | | | | | | | | | | | | | | | | | | | | | |
Expiring 12/18/19 | | Barclays Bank PLC | | TRY | 36 | | | | 6,000 | | | | 6,237 | | | | — | | | | (237 | ) |
Expiring 12/18/19 | | JPMorgan Chase Bank, N.A. | | TRY | 759 | | | | 125,539 | | | | 131,074 | | | | — | | | | (5,535 | ) |
Expiring 12/18/19 | | JPMorgan Chase Bank, N.A. | | TRY | 189 | | | | 31,167 | | | | 32,641 | | | | — | | | | (1,474 | ) |
Expiring 12/18/19 | | Morgan Stanley & Co. International PLC | | TRY | 232 | | | | 38,000 | | | | 40,112 | | | | — | | | | (2,112 | ) |
| | | | | | | | | | | | | | | | | | | | | | |
| | | | | | | | $ | 60,800,527 | | | $ | 61,453,169 | | | | 35,104 | | | | (687,746 | ) |
| | | | | | | | | | | | | | | | | | | | | | |
| | | | | | | | | | | | | | | | $ | 265,073 | | | $ | (709,970 | ) |
| | | | | | | | | | | | | | | | | | | | | | |
Credit default swap agreements outstanding at October 31, 2019:
| | | | | | | | | | | | | | | | | | | | | | | | | | | | | | |
Reference
Entity/
Obligation | | Termination
Date | | | Fixed
Rate | | | Notional
Amount
(000)#(3) | | | Implied
Credit
Spread at
October 31,
2019(4) | | | Fair
Value | | | Upfront
Premiums
Paid
(Received) | | | Unrealized
Appreciation
(Depreciation) | | | Counterparty |
OTC Packaged Credit Default Swap Agreements on corporate and/or sovereign issues—Sell Protection(2)*: |
Federal Republic of Brazil | | | 12/20/22 | | | | 1.000%(Q) | | | | 600 | | | | 0.731 | % | | $ | 5,637 | | | $ | (648 | ) | | $ | 6,285 | | | Citibank, N.A. |
Government of Malaysia | | | 12/20/22 | | | | 1.000%(Q) | | | | 120 | | | | 0.280 | % | | | 3,012 | | | | (130 | ) | | | 3,142 | | | Citibank, N.A. |
People’s Republic of China | | | 12/20/22 | | | | 1.000%(Q) | | | | 400 | | | | 0.223 | % | | | 10,619 | | | | (432 | ) | | | 11,051 | | | Citibank, N.A. |
Republic of Argentina | | | 12/20/22 | | | | 1.000%(Q) | | | | 120 | | | | 117.935 | % | | | (75,460 | ) | | | (130 | ) | | | (75,330 | ) | | Citibank, N.A. |
See Notes to Financial Statements.
Credit default swap agreements outstanding at October 31, 2019 (continued):
| | | | | | | | | | | | | | | | | | | | | | | | | | | | | | |
Reference
Entity/
Obligation | | Termination
Date | | | Fixed
Rate | | | Notional
Amount
(000)#(3) | | | Implied
Credit
Spread at
October 31,
2019(4) | | | Fair
Value | | | Upfront
Premiums
Paid
(Received) | | | Unrealized
Appreciation
(Depreciation) | | | Counterparty |
OTC Packaged Credit Default Swap Agreements on corporate and/or sovereign issues—Sell Protection(2)* (cont’d.): |
Republic of Chile | | | 12/20/22 | | | | 1.000%(Q) | | | | 120 | | | | 0.245 | % | | $ | 2,938 | | | $ | (130 | ) | | $ | 3,068 | | | Citibank, N.A. |
Republic of Colombia | | | 12/20/22 | | | | 1.000%(Q) | | | | 160 | | | | 0.444 | % | | | 2,924 | | | | (173 | ) | | | 3,097 | | | Citibank, N.A. |
Republic of Indonesia | | | 12/20/22 | | | | 1.000%(Q) | | | | 160 | | | | 0.517 | % | | | 3,071 | | | | (173 | ) | | | 3,244 | | | Citibank, N.A. |
Republic of Panama | | | 12/20/22 | | | | 1.000%(Q) | | | | 120 | | | | 0.245 | % | | | 2,938 | | | | (130 | ) | | | 3,068 | | | Citibank, N.A. |
Republic of Peru | | | 12/20/22 | | | | 1.000%(Q) | | | | 120 | | | | 0.251 | % | | | 2,915 | | | | (130 | ) | | | 3,045 | | | Citibank, N.A. |
Republic of Philippines | | | 12/20/22 | | | | 1.000%(Q) | | | | 120 | | | | 0.267 | % | | | 3,052 | | | | (130 | ) | | | 3,182 | | | Citibank, N.A. |
Republic of South Africa | | | 12/20/22 | | | | 1.000%(Q) | | | | 360 | | | | 1.322 | % | | | (3,289 | ) | | | (389 | ) | | | (2,900 | ) | | Citibank, N.A. |
Republic of Turkey | | | 12/20/22 | | | | 1.000%(Q) | | | | 600 | | | | 2.780 | % | | | (30,858 | ) | | | (648 | ) | | | (30,210 | ) | | Citibank, N.A. |
Russian Federation | | | 12/20/22 | | | | 1.000%(Q) | | | | 360 | | | | 0.430 | % | | | 6,689 | | | | (389 | ) | | | 7,078 | | | Citibank, N.A. |
United Mexican States | | | 12/20/22 | | | | 1.000%(Q) | | | | 520 | | | | 0.525 | % | | | 8,196 | | | | (562 | ) | | | 8,758 | | | Citibank, N.A. |
| | | | | | | | | | | | | | | | | | | | | | | | | | | | | | |
| | | | | | | | | | | | | | | | | | $ | (57,616 | ) | | $ | (4,194 | ) | | $ | (53,422 | ) | | |
| | | | | | | | | | | | | | | | | | | | | | | | | | | | | | |
| | | | | | | | | | | | | | | | | | | | | | | | | | |
Reference
Entity/
Obligation | | Termination
Date | | | Fixed
Rate | | | Notional
Amount
(000)#(3) | | | Fair
Value | | | Upfront
Premiums
Paid
(Received) | | | Unrealized
Appreciation
(Depreciation) | | | Counterparty |
OTC Packaged Credit Default Swap Agreement on credit indices— Buy Protection(1)*: |
CDX.EM.28.V2 | | | 12/20/22 | | | | 1.000%(Q) | | | | 3,880 | | | $ | 55,034 | | | $ | (1,153 | ) | | $ | 56,187 | | | Citibank, N.A. |
| | | | | | | | | | | | | | | | | | | | | | | | | | |
| * | The Fund entered into multiple credit default swap agreements in a packaged trade consisting of two parts. The Fund bought/sold protection on an Emerging Market CDX Index and bought/sold protection on the countries which comprise the index. Theup-front premium is attached to the index of the trade. Each swap is priced individually. If any of the component swaps are closed out early, the Index exposure will be reduced by an amount proportionate to the terminated swap(s). |
See Notes to Financial Statements.
| | | | |
| PGIM International Bond Fund | | | 41 | |
Schedule of Investments(continued)
as of October 31, 2019
Credit default swap agreements outstanding at October 31, 2019 (continued):
| | | | | | | | | | | | | | | | | | | | | | | | | | | | | | |
Reference
Entity/
Obligation | | Termination
Date | | | Fixed
Rate | | | Notional
Amount
(000)#(3) | | | Implied
Credit
Spread at
October 31,
2019(4) | | | Fair
Value | | | Upfront
Premiums
Paid
(Received) | | | Unrealized
Appreciation
(Depreciation) | | | Counterparty |
OTC Credit Default Swap Agreements on asset-backed securities—Sell Protection(2)^: |
American Money Management Corporation | | | 11/26/19 | | | | 1.000%(M) | | | | 7 | | | | * | | | $ | 5 | | | $ | — | | | $ | 5 | | | Goldman Sachs International |
Anchorage CLO | | | 11/26/19 | | | | 0.500%(M) | | | EUR | 15 | | | | * | | | | 7 | | | | — | | | | 7 | | | Goldman Sachs International |
Anchorage CLO | | | 11/26/19 | | | | 1.000%(M) | | | EUR | 15 | | | | * | | | | 14 | | | | — | | | | 14 | | | Goldman Sachs International |
AXA CLO | | | 11/26/19 | | | | 0.500%(M) | | | EUR | 8 | | | | * | | | | 4 | | | | — | | | | 4 | | | Goldman Sachs International |
Bardin Hill Loan Advisors | | | 11/26/19 | | | | 1.000%(M) | | | EUR | 9 | | | | * | | | | 8 | | | | — | | | | 8 | | | Goldman Sachs International |
Barings CLO | | | 11/26/19 | | | | 1.000%(M) | | | | 1 | | | | * | | | | — | | | | — | | | | — | | | Goldman Sachs International |
Bear Stearns Asset-Backed Securities Trust | | | 11/27/19 | | | | 1.250%(M) | | | | 29 | | | | * | | | | 28 | | | | — | | | | 28 | | | Goldman Sachs International |
Bear Stearns Asset-Backed Securities Trust | | | 11/27/19 | | | | 1.250%(M) | | | | 16 | | | | * | | | | 16 | | | | — | | | | 16 | | | Goldman Sachs International |
BlueMountain CLO Ltd. | | | 11/26/19 | | | | 1.000%(M) | | | | 3 | | | | * | | | | 2 | | | | — | | | | 2 | | | Goldman Sachs International |
Cairn CLO B.V. | | | 11/26/19 | | | | 1.000%(M) | | | EUR | 8 | | | | * | | | | 7 | | | | — | | | | 7 | | | Goldman Sachs International |
Canyon CLO | | | 11/26/19 | | | | 0.500%(M) | | | | 2 | | | | * | | | | — | | | | — | | | | — | | | Goldman Sachs International |
CIFC CLO | | | 11/26/19 | | | | 1.000%(M) | | | | 2 | | | | * | | | | 2 | | | | — | | | | 2 | | | Goldman Sachs International |
Citigroup Commercial Mortgage Trust | | | 11/26/19 | | | | 1.250%(M) | | | | 13 | | | | * | | | | 13 | | | | — | | | | 13 | | | Goldman Sachs International |
See Notes to Financial Statements.
Credit default swap agreements outstanding at October 31, 2019 (continued):
| | | | | | | | | | | | | | | | | | | | | | | | | | | | | | |
Reference
Entity/
Obligation | | Termination
Date | | | Fixed
Rate | | | Notional
Amount
(000)#(3) | | | Implied
Credit
Spread at
October 31,
2019(4) | | | Fair
Value | | | Upfront
Premiums
Paid
(Received) | | | Unrealized
Appreciation
(Depreciation) | | | Counterparty |
OTC Credit Default Swap Agreements on asset-backed securities—Sell Protection(2)^ (cont’d.): |
Citigroup Commercial Mortgage Trust | | | 11/26/19 | | | | 1.250%(M) | | | | 8 | | | | 6.940 | % | | $ | 8 | | | $ | — | | | $ | 8 | | | Goldman Sachs International |
Citigroup Commercial Mortgage Trust | | | 11/26/19 | | | | 1.250%(M) | | | | 8 | | | | * | | | | 8 | | | | — | | | | 8 | | | Goldman Sachs International |
Citigroup Commercial Mortgage Trust | | | 11/26/19 | | | | 1.250%(M) | | | | 4 | | | | 4.670 | % | | | 4 | | | | — | | | | 4 | | | Goldman Sachs International |
COMM Mortgage Trust | | | 11/26/19 | | | | 1.250%(M) | | | | 15 | | | | * | | | | 15 | | | | — | | | | 15 | | | Goldman Sachs International |
COMM Mortgage Trust | | | 11/26/19 | | | | 1.250%(M) | | | | 12 | | | | 19.740 | % | | | 12 | | | | — | | | | 12 | | | Goldman Sachs International |
COMM Mortgage Trust | | | 11/26/19 | | | | 1.250%(M) | | | | 11 | | | | * | | | | 11 | | | | — | | | | 11 | | | Goldman Sachs International |
COMM Mortgage Trust | | | 11/26/19 | | | | 1.250%(M) | | | | 9 | | | | * | | | | 9 | | | | — | | | | 9 | | | Goldman Sachs International |
COMM Mortgage Trust | | | 11/26/19 | | | | 1.250%(M) | | | | 8 | | | | 6.940 | % | | | 8 | | | | — | | | | 8 | | | Goldman Sachs International |
COMM Mortgage Trust | | | 11/26/19 | | | | 1.250%(M) | | | | 5 | | | | 7.460 | % | | | 5 | | | | — | | | | 5 | | | Goldman Sachs International |
Commerzebank CLO | | | 11/26/19 | | | | 1.000%(M) | | | EUR | 7 | | | | * | | | | 7 | | | | — | | | | 7 | | | Goldman Sachs International |
Credit Suisse Asset Management CLO | | | 11/26/19 | | | | 1.000%(M) | | | | 2 | | | | * | | | | 2 | | | | — | | | | 2 | | | Goldman Sachs International |
DFG CLO | | | 11/26/19 | | | | 1.000%(M) | | | | 2 | | | | * | | | | — | | | | — | | | | — | | | Goldman Sachs International |
Ellington CLO | | | 11/26/19 | | | | 1.000%(M) | | | | 37 | | | | * | | | | 28 | | | | — | | | | 28 | | | Goldman Sachs International |
See Notes to Financial Statements.
| | | | |
| PGIM International Bond Fund | | | 43 | |
Schedule of Investments(continued)
as of October 31, 2019
Credit default swap agreements outstanding at October 31, 2019 (continued):
| | | | | | | | | | | | | | | | | | | | | | | | | | | | | | |
Reference
Entity/
Obligation | | Termination
Date | | | Fixed
Rate | | | Notional
Amount
(000)#(3) | | | Implied
Credit
Spread at
October 31,
2019(4) | | | Fair
Value | | | Upfront
Premiums
Paid
(Received) | | | Unrealized
Appreciation
(Depreciation) | | | Counterparty |
OTC Credit Default Swap Agreements on asset-backed securities—Sell Protection(2)^ (cont’d.): |
Equity One Home Equity | | | 11/27/19 | | | | 1.250%(M) | | | | 11 | | | | * | | | $ | 10 | | | $ | — | | | $ | 10 | | | Goldman Sachs International |
Fannie Mae Connecticut Avenue Securities | | | 11/27/19 | | | | 1.250%(M) | | | | 62 | | | | * | | | | 60 | | | | — | | | | 60 | | | Goldman Sachs International |
Fannie Mae Connecticut Avenue Securities | | | 11/27/19 | | | | 1.250%(M) | | | | 41 | | | | * | | | | 40 | | | | — | | | | 40 | | | Goldman Sachs International |
Fannie Mae Connecticut Avenue Securities | | | 11/27/19 | | | | 1.250%(M) | | | | 38 | | | | * | | | | 37 | | | | — | | | | 37 | | | Goldman Sachs International |
Fannie Mae Connecticut Avenue Securities | | | 11/27/19 | | | | 1.250%(M) | | | | 22 | | | | * | | | | 21 | | | | — | | | | 21 | | | Goldman Sachs International |
Fannie Mae Connecticut Avenue Securities | | | 11/27/19 | | | | 1.250%(M) | | | | 15 | | | | * | | | | 15 | | | | — | | | | 15 | | | Goldman Sachs International |
Fannie Mae Connecticut Avenue Securities | | | 11/27/19 | | | | 1.250%(M) | | | | 9 | | | | * | | | | 9 | | | | — | | | | 9 | | | Goldman Sachs International |
GMAC Home Equity | | | 11/27/19 | | | | 1.250%(M) | | | | 7 | | | | * | | | | 6 | | | | — | | | | 6 | | | Goldman Sachs International |
GMAC Home Equity | | | 11/27/19 | | | | 1.250%(M) | | | | 7 | | | | * | | | | 7 | | | | — | | | | 7 | | | Goldman Sachs International |
GS Mortgage Securities Trust | | | 11/26/19 | | | | 1.250%(M) | | | | 7 | | | | 7.460 | % | | | 7 | | | | — | | | | 7 | | | Goldman Sachs International |
GS Mortgage Securities Trust | | | 11/26/19 | | | | 1.250%(M) | | | | 7 | | | | * | | | | 7 | | | | — | | | | 7 | | | Goldman Sachs International |
GSO CLO | | | 11/26/19 | | | | 1.000%(M) | | | | 3 | | | | * | | | | 2 | | | | — | | | | 2 | | | Goldman Sachs International |
GSR Mortgage Loan Trust | | | 11/27/19 | | | | 1.250%(M) | | | | 12 | | | | * | | | | 12 | | | | — | | | | 12 | | | Goldman Sachs International |
See Notes to Financial Statements.
Credit default swap agreements outstanding at October 31, 2019 (continued):
| | | | | | | | | | | | | | | | | | | | | | | | | | | | | | |
Reference
Entity/
Obligation | | Termination
Date | | | Fixed
Rate | | | Notional
Amount
(000)#(3) | | | Implied
Credit
Spread at
October 31,
2019(4) | | | Fair
Value | | | Upfront
Premiums
Paid
(Received) | | | Unrealized
Appreciation
(Depreciation) | | | Counterparty |
OTC Credit Default Swap Agreements on asset-backed securities—Sell Protection(2)^ (cont’d.): |
ICG CLO | | | 11/26/19 | | | | 0.500%(M) | | | | 5 | | | | * | | | $ | — | | | $ | — | | | $ | — | | | Goldman Sachs International |
Invesco CLO | | | 11/26/19 | | | | 0.500%(M) | | | | 2 | | | | * | | | | — | | | | — | | | | — | | | Goldman Sachs International |
JPMBB Commercial Mortgage Securities Trust | | | 11/26/19 | | | | 1.250%(M) | | | | 19 | | | | 8.827 | % | | | 20 | | �� | | — | | | | 20 | | | Goldman Sachs International |
JPMBB Commercial Mortgage Securities Trust | | | 11/26/19 | | | | 1.250%(M) | | | | 12 | | | | * | | | | 12 | | | | — | | | | 12 | | | Goldman Sachs International |
JPMorgan Chase Commercial Mortgage Securities | | | 11/26/19 | | | | 1.250%(M) | | | | 7 | | | | * | | | | 7 | | | | — | | | | 7 | | | Goldman Sachs International |
JPMorgan Chase Commercial Mortgage Securities | | | 11/26/19 | | | | 1.250%(M) | | | | 3 | | | | * | | | | 3 | | | | — | | | | 3 | | | Goldman Sachs International |
LCM CLO | | | 11/26/19 | | | | 1.000%(M) | | | | 2 | | | | * | | | | 2 | | | | — | | | | 2 | | | Goldman Sachs International |
Lehman Home Equity | | | 11/27/19 | | | | 1.250%(M) | | | | 6 | | | | * | | | | 6 | | | | — | | | | 6 | | | Goldman Sachs International |
MJX CLO | | | 11/26/19 | | | | 0.500%(M) | | | | 3 | | | | * | | | | — | | | | — | | | | — | | | Goldman Sachs International |
Morgan Stanley Home Equity | | | 11/27/19 | | | | 1.250%(M) | | | | 7 | | | | * | | | | 6 | | | | — | | | | 6 | | | Goldman Sachs International |
Oak Hill CLO | | | 11/26/19 | | | | 1.000%(M) | | | EUR | 9 | | | | * | | | | 8 | | | | — | | | | 8 | | | Goldman Sachs International |
OCH-ZIFF CLO | | | 11/26/19 | | | | 0.500%(M) | | | | 7 | | | | * | | | | 3 | | | | — | | | | 3 | | | Goldman Sachs International |
Octagon CLO | | | 11/26/19 | | | | 1.000%(M) | | | | 1 | | | | * | | | | — | | | | — | | | | — | | | Goldman Sachs International |
See Notes to Financial Statements.
| | | | |
| PGIM International Bond Fund | | | 45 | |
Schedule of Investments(continued)
as of October 31, 2019
Credit default swap agreements outstanding at October 31, 2019 (continued):
| | | | | | | | | | | | | | | | | | | | | | | | | | | | | | |
Reference
Entity/
Obligation | | Termination
Date | | | Fixed
Rate | | | Notional
Amount
(000)#(3) | | | Implied
Credit
Spread at
October 31,
2019(4) | | | Fair
Value | | | Upfront
Premiums
Paid
(Received) | | | Unrealized
Appreciation
(Depreciation) | | | Counterparty |
OTC Credit Default Swap Agreements on asset-backed securities—Sell Protection(2)^ (cont’d.): |
Octagon Investment Partners XV Ltd. | | | 11/26/19 | | | | 1.000%(M) | | | | 4 | | | | * | | | $ | 3 | | | $ | — | | | $ | 3 | | | Goldman Sachs International |
Palmer Square CLO | | | 11/26/19 | | | | 0.500%(M) | | | | 3 | | | | * | | | | — | | | | — | | | | — | | | Goldman Sachs International |
Pinebridge CLO | | | 11/26/19 | | | | 0.500%(M) | | | | 2 | | | | * | | | | — | | | | — | | | | — | | | Goldman Sachs International |
Shenkman Capital | | | 11/26/19 | | | | 1.000%(M) | | | | 1 | | | | * | | | | — | | | | — | | | | — | | | Goldman Sachs International |
Sound Point CLO Ltd. | | | 11/26/19 | | | | 0.500%(M) | | | | 15 | | | | * | | | | 6 | | | | — | | | | 6 | | | Goldman Sachs International |
Sound Point CLO Ltd. | | | 11/26/19 | | | | 1.000%(M) | | | | 7 | | | | * | | | | 5 | | | | — | | | | 5 | | | Goldman Sachs International |
Sound Point CLO Ltd. | | | 11/26/19 | | | | 0.500%(M) | | | | 7 | | | | * | | | | 3 | | | | — | | | | 3 | | | Goldman Sachs International |
Sound Point CLO Ltd. | | | 11/26/19 | | | | 1.000%(M) | | | | 1 | | | | * | | | | — | | | | — | | | | — | | | Goldman Sachs International |
Steele Creek | | | 11/26/19 | | | | 1.000%(M) | | | | 6 | | | | * | | | | 4 | | | | — | | | | 4 | | | Goldman Sachs International |
Structured Agency Credit Risk | | | 11/27/19 | | | | 1.250%(M) | | | | 40 | | | | * | | | | 39 | | | | — | | | | 39 | | | Goldman Sachs International |
Structured Agency Credit Risk | | | 11/27/19 | | | | 1.250%(M) | | | | 20 | | | | * | | | | 20 | | | | — | | | | 20 | | | Goldman Sachs International |
Structured Agency Credit Risk | | | 11/27/19 | | | | 1.250%(M) | | | | 19 | | | | * | | | | 18 | | | | — | | | | 18 | | | Goldman Sachs International |
Structured Agency Credit Risk | | | 11/27/19 | | | | 1.250%(M) | | | | 17 | | | | * | | | | 16 | | | | — | | | | 16 | | | Goldman Sachs International |
See Notes to Financial Statements.
Credit default swap agreements outstanding at October 31, 2019 (continued):
| | | | | | | | | | | | | | | | | | | | | | | | | | | | | | |
Reference
Entity/
Obligation | | Termination
Date | | | Fixed
Rate | | | Notional
Amount
(000)#(3) | | | Implied
Credit
Spread at
October 31,
2019(4) | | | Fair
Value | | | Upfront
Premiums
Paid
(Received) | | | Unrealized
Appreciation
(Depreciation) | | | Counterparty |
OTC Credit Default Swap Agreements on asset-backed securities—Sell Protection(2)^ (cont’d.): |
THL CLO | | | 11/26/19 | | | | 0.500%(M) | | | | 3 | | | | * | | | $ | — | | | $ | — | | | $ | — | | | Goldman Sachs International |
Voya CLO | | | 11/26/19 | | | | 1.000%(M) | | | | 5 | | | | * | | | | 4 | | | | — | | | | 4 | | | Goldman Sachs International |
Wellfleet CLO | | | 11/26/19 | | | | 0.500%(M) | | | | 5 | | | | * | | | | 2 | | | | — | | | | 2 | | | Goldman Sachs International |
Wells Fargo Commercial Mortgage Trust | | | 11/26/19 | | | | 1.250%(M) | | | | 24 | | | | * | | | | 24 | | | | — | | | | 24 | | | Goldman Sachs International |
Wells Fargo Commercial Mortgage Trust | | | 11/26/19 | | | | 1.250%(M) | | | | 4 | | | | * | | | | 4 | | | | — | | | | 4 | | | Goldman Sachs International |
| | | | | | | | | | | | | | | | | | | | | | | | | | | | | | |
| | | | | | | | | | | | | | | | | | $ | 671 | | | $ | — | | | $ | 671 | | | |
| | | | | | | | | | | | | | | | | | | | | | | | | | | | | | |
| | | | | | | | | | | | | | | | | | | | | | | | | | |
Reference
Entity/
Obligation | | Termination
Date | | | Fixed
Rate | | | Notional
Amount
(000)#(3) | | | Fair
Value | | | Upfront
Premiums
Paid
(Received) | | | Unrealized
Appreciation
(Depreciation) | | | Counterparty |
OTC Credit Default Swap Agreements on corporate and/or sovereign issues—Buy Protection(1): |
Assicurazioni Generali SpA | | | 06/20/23 | | | | 1.000%(Q) | | | EUR | 100 | | | $ | (777 | ) | | $ | 4,853 | | | $ | (5,630 | ) | | Barclays Bank PLC |
Kingdom of Spain | | | 06/20/23 | | | | 1.000%(Q) | | | | 100 | | | | (3,080 | ) | | | (1,850 | ) | | | (1,230 | ) | | Bank of America, N.A. |
Petroleos Mexicanos | | | 06/20/20 | | | | 1.000%(Q) | | | | 80 | | | | (420 | ) | | | 252 | | | | (672 | ) | | Citibank, N.A. |
Petroleos Mexicanos | | | 06/20/20 | | | | 1.000%(Q) | | | | 75 | | | | (394 | ) | | | 240 | | | | (634 | ) | | Citibank, N.A. |
Republic of Argentina | | | 06/20/24 | | | | 5.000%(Q) | | | | 160 | | | | 97,259 | | | | 96,688 | | | | 571 | | | Citibank, N.A. |
Republic of Italy | | | 06/20/23 | | | | 1.000%(Q) | | | | 230 | | | | (3,558 | ) | | | 2,414 | | | | (5,972 | ) | | Citibank, N.A. |
Republic of Italy | | | 06/20/23 | | | | 1.000%(Q) | | | EUR | 210 | | | | (3,035 | ) | | | 2,198 | | | | (5,233 | ) | | Barclays Bank PLC |
Republic of Italy | | | 06/20/28 | | | | 1.000%(Q) | | | EUR | 105 | | | | 1,503 | | | | 5,627 | | | | (4,124 | ) | | Barclays Bank PLC |
| | | | | | | | | | | | | | | | | | | | | | | | | | |
| | | | | | | | | | | | | | $ | 87,498 | | | $ | 110,422 | | | $ | (22,924 | ) | | |
| | | | | | | | | | | | | | | | | | | | | | | | | | |
See Notes to Financial Statements.
| | | | |
| PGIM International Bond Fund | | | 47 | |
Schedule of Investments(continued)
as of October 31, 2019
Credit default swap agreements outstanding at October 31, 2019 (continued):
| | | | | | | | | | | | | | | | | | | | | | | | | | | | | | |
Reference
Entity/
Obligation | | Termination
Date | | | Fixed
Rate | | | Notional
Amount
(000)#(3) | | | Implied
Credit
Spread at
October 31,
2019(4) | | | Fair
Value | | | Upfront
Premiums
Paid
(Received) | | | Unrealized
Appreciation
(Depreciation) | | | Counterparty |
OTC Credit Default Swap Agreements on corporate and/or sovereign issues—Sell Protection(2): |
Generalitat de Cataluna | | | 12/20/22 | | | | 1.000%(Q) | | | | 110 | | | | 2.782 | % | | $ | (5,523 | ) | | $ | (9,913 | ) | | $ | 4,390 | | | Citibank, N.A. |
Kingdom of Spain | | | 06/20/23 | | | | 1.000%(Q) | | | | 830 | | | | 0.256 | % | | | 22,947 | | | | 6,299 | | | | 16,648 | | | Bank of America, N.A. |
Kingdom of Spain | | | 06/20/23 | | | | 1.000%(Q) | | | | 100 | | | | 0.256 | % | | | 2,765 | | | | 1,133 | | | | 1,632 | | | Bank of America, N.A. |
Republic of Argentina | | | 06/20/29 | | | | 5.000%(Q) | | | | 160 | | | | 80.552 | % | | | (98,084 | ) | | | (98,772 | ) | | | 688 | | | Citibank, N.A. |
Republic of France | | | 12/20/23 | | | | 0.250%(Q) | | | | 100 | | | | 0.143 | % | | | 461 | | | �� | (225 | ) | | | 686 | | | Barclays Bank PLC |
Republic of Hungary | | | 06/20/22 | | | | 1.000%(Q) | | | | 450 | | | | 0.361 | % | | | 8,002 | | | | (1,471 | ) | | | 9,473 | | | Citibank, N.A. |
Republic of Indonesia | | | 06/20/23 | | | | 1.000%(Q) | | | | 220 | | | | 0.509 | % | | | 4,085 | | | | (1,029 | ) | | | 5,114 | | | Citibank, N.A. |
Republic of Ireland | | | 06/20/27 | | | | 1.000%(Q) | | | | 100 | | | | 0.369 | % | | | 4,653 | | | | 1,921 | | | | 2,732 | | | Morgan Stanley & Co. International PLC |
Republic of Italy | | | 06/20/23 | | | | 1.000%(Q) | | | | 375 | | | | 0.888 | % | | | 1,914 | | | | (11,077 | ) | | | 12,991 | | | Morgan Stanley & Co. International PLC |
Republic of Italy | | | 06/20/23 | | | | 1.000%(Q) | | | | 350 | | | | 0.888 | % | | | 1,786 | | | | (14,286 | ) | | | 16,072 | | | Bank of America, N.A. |
Republic of Italy | | | 06/20/23 | | | | 1.000%(Q) | | | | 230 | | | | 0.888 | % | | | 1,174 | | | | (8,760 | ) | | | 9,934 | | | Citibank, N.A. |
Republic of Kazakhstan | | | 06/20/23 | | | | 1.000%(Q) | | | | 115 | | | | 0.411 | % | | | 2,541 | | | | — | | | | 2,541 | | | Citibank, N.A. |
Republic of Korea | | | 12/20/19 | | | | 1.000%(Q) | | | | 40 | | | | 0.118 | % | | | 95 | | | | 48 | | | | 47 | | | Citibank, N.A. |
Republic of Panama | | | 06/20/22 | | | | 1.000%(Q) | | | | 100 | | | | 0.210 | % | | | 2,174 | | | | 469 | | | | 1,705 | | | Citibank, N.A. |
Republic of Portugal | | | 12/20/23 | | | | 1.000%(Q) | | | | 100 | | | | 0.287 | % | | | 2,991 | | | | (46 | ) | | | 3,037 | | | Morgan Stanley & Co. International PLC |
Republic of South Africa | | | 12/20/23 | | | | 1.000%(Q) | | | | 400 | | | | 1.611 | % | | | (9,114 | ) | | | (17,820 | ) | | | 8,706 | | | Bank of America, N.A. |
Republic of Turkey | | | 12/20/19 | | | | 1.000%(Q) | | | | 50 | | | | 0.576 | % | | | 88 | | | | (14 | ) | | | 102 | | | Credit Suisse International |
Republic of Turkey | | | 06/20/23 | | | | 1.000%(Q) | | | | 80 | | | | 2.961 | % | | | (5,199 | ) | | | (8,395 | ) | | | 3,196 | | | BNP Paribas S.A. |
Republic of Turkey | | | 06/20/23 | | | | 1.000%(Q) | | | | 40 | | | | 2.961 | % | | | (2,600 | ) | | | (4,005 | ) | | | 1,405 | | | BNP Paribas S.A. |
Russian Federation | | | 12/20/22 | | | | 1.000%(Q) | | | | 50 | | | | 0.434 | % | | | 929 | | | | (83 | ) | | | 1,012 | | | Citibank, N.A. |
See Notes to Financial Statements.
Credit default swap agreements outstanding at October 31, 2019 (continued):
| | | | | | | | | | | | | | | | | | | | | | | | | | | | | | |
Reference
Entity/
Obligation | | Termination
Date | | | Fixed
Rate | | | Notional
Amount
(000)#(3) | | | Implied
Credit
Spread at
October 31,
2019(4) | | | Fair
Value | | | Upfront
Premiums
Paid
(Received) | | | Unrealized
Appreciation
(Depreciation) | | | Counterparty |
OTC Credit Default Swap Agreements on corporate and/or sovereign issues—Sell Protection(2) (cont’d.): |
Russian Federation | | | 06/20/23 | | | | 1.000%(Q) | | | | 200 | | | | 0.518 | % | | $ | 3,656 | | | $ | (2,798 | ) | | $ | 6,454 | | | Morgan Stanley & Co. International PLC |
Russian Federation | | | 06/20/23 | | | | 1.000%(Q) | | | | 150 | | | | 0.518 | % | | | 2,742 | | | | (1,759 | ) | | | 4,501 | | | Morgan Stanley & Co. International PLC |
Russian Federation | | | 06/20/23 | | | | 1.000%(Q) | | | | 60 | | | | 0.518 | % | | | 1,097 | | | | (826 | ) | | | 1,923 | | | BNP Paribas S.A. |
Russian Federation | | | 12/20/26 | | | | 1.000%(Q) | | | | 100 | | | | 1.084 | % | | | (442 | ) | | | (8,006 | ) | | | 7,564 | | | Barclays Bank PLC |
State of Illinois | | | 12/20/22 | | | | 1.000%(Q) | | | | 100 | | | | 1.122 | % | | | (250 | ) | | | (2,493 | ) | | | 2,243 | | | Citibank, N.A. |
State of Illinois | | | 12/20/24 | | | | 1.000%(Q) | | | | 100 | | | | 1.582 | % | | | (2,594 | ) | | | (5,103 | ) | | | 2,509 | | | Goldman Sachs International |
T-Mobile USA Inc. | | | 12/20/19 | | | | 5.000%(Q) | | | | 70 | | | | 0.144 | % | | | 878 | | | | 461 | | | | 417 | | | Credit Suisse International |
| | | | | | | | | | | | | | | | | | | | | | | | | | | | | | |
| | | | | | | | | | | | | | | | | | $ | (58,828 | ) | | $ | (186,550 | ) | | $ | 127,722 | | | |
| | | | | | | | | | | | | | | | | | | | | | | | | | | | | | |
| | | | | | | | | | | | | | | | | | | | | | | | | | | | |
Reference
Entity/
Obligation | | Termination
Date | | | Fixed
Rate | | | Notional
Amount
(000)#(3) | | | Implied
Credit
Spread at
October 31,
2019(4) | | | Value at
Trade Date | | | Value at
October 31,
2019 | | | Unrealized
Appreciation
(Depreciation) | |
Centrally Cleared Credit Default Swap Agreement on credit indices—Sell Protection(2): | |
CDX.NA.HY.33.V1 | | | 12/20/24 | | | | 5.000%(Q) | | | | 1,400 | | | | 3.391 | % | | $ | 94,111 | | | $ | 107,981 | | | $ | 13,870 | |
| | | | | | | | | | | | | | | | | | | | | | | | | | | | |
| | | | | | | | | | | | | | | | | | | | | | | | | | | | | | |
Reference
Entity/
Obligation | | Termination
Date | | | Fixed
Rate | | | Notional
Amount
(000)#(3) | | | Implied
Credit
Spread at
October 31,
2019(4) | | | Fair
Value | | | Upfront
Premiums
Paid
(Received) | | | Unrealized
Appreciation
(Depreciation) | | | Counterparty |
OTC Credit Default Swap Agreements on credit indices—Sell Protection(2): |
CDX.EM.27.V2 | | | 06/20/22 | | | | 1.000%(Q) | | | | 485 | | | | 1.535 | % | | $ | (6,026 | ) | | $ | (10,993 | ) | | $ | 4,967 | | | Citibank, N.A. |
CMBX.NA.6.AA | | | 05/11/63 | | | | 1.500%(M) | | | | 200 | | | | * | | | | 4,147 | | | | (1,093 | ) | | | 5,240 | | | JPMorgan Securities LLC |
| | | | | | | | | | | | | | | | | | | | | | | | | | | | | | |
| | | | | | | | | | | | | | | | | | $ | (1,879 | ) | | $ | (12,086 | ) | | $ | 10,207 | | | |
| | | | | | | | | | | | | | | | | | | | | | | | | | | | | | |
The Fund entered into credit default swaps (“CDS”) to provide a measure of protection against defaults or to take an active long or short position with respect to the likelihood of a particular issuer’s default or the reference entity’s credit soundness. CDS contracts generally trade based on a spread which represents the cost a protection buyer has to pay the protection seller. The protection buyer is said to be short the credit as the value of the contract rises the more the credit deteriorates. The value
See Notes to Financial Statements.
| | | | |
| PGIM International Bond Fund | | | 49 | |
Schedule of Investments(continued)
as of October 31, 2019
of the CDS contract increases for the protection buyer if the spread increases.
| (1) | If the Fund is a buyer of protection, it pays the fixed rate. When a credit event occurs, as defined under the terms of that particular swap agreement, the Fund will either (i) receive from the seller of protection an amount equal to the notional amount of the swap and make delivery of the referenced obligation or underlying securities comprising the referenced index or (ii) receive a net settlement amount in the form of cash or securities equal to the notional amount of the swap less the recovery value of the referenced obligation or underlying securities comprising the referenced index. |
| (2) | If the Fund is a seller of protection, it receives the fixed rate. When a credit event occurs, as defined under the terms of that particular swap agreement, the Fund will either (i) pay to the buyer of protection an amount equal to the notional amount of the swap and take delivery of the referenced obligation or underlying securities comprising the referenced index or (ii) pay a net settlement amount in the form of cash or securities equal to the notional amount of the swap less the recovery value of the referenced obligation or underlying securities comprising the referenced index. |
| (3) | Notional amount represents the maximum potential amount the Fund could be required to pay as a seller of credit protection or receive as a buyer of credit protection if a credit event occurs as defined under the terms of that particular swap agreement. |
| (4) | Implied credit spreads, represented in absolute terms, utilized in determining the fair value of credit default swap agreements where the Fund is the seller of protection as of the reporting date serve as an indicator of the current status of the payment/ performance risk and represent the likelihood of risk of default for the credit derivative. The implied credit spread of a particular referenced entity reflects the cost of buying/selling protection and may includeup-front payments required to be made to enter into the agreement. Wider credit spreads represent a deterioration of the referenced entity’s credit soundness and a greater likelihood of risk of default or other credit event occurring as defined under the terms of the agreement. |
| * | When an implied credit spread is not available, reference the fair value of credit default swap agreements on credit indices and asset-backed securities. Where the Fund is the seller of protection, it serves as an indicator of the current status of the payment/performance risk and represents the likelihood of an expected liability (or profit) for the credit derivative should the notional amount of the swap agreement be closed/sold as of the reporting date. Increasing fair value in absolute terms, when compared to the notional amount of the swap, represents a deterioration of the referenced entity’s credit soundness and a greater likelihood of risk of default or other credit event occurring as defined under the terms of the agreement. |
Currency swap agreement outstanding at October 31, 2019:
| | | | | | | | | | | | | | | | | | | | | | | | | | |
Notional
Amount (000)# | | Fund
Receives | | Notional
Amount
(000)# | | | Fund
Pays | | Counterparty | | Termination
Date | | | Fair
Value | | | Upfront
Premiums
Paid
(Received) | | | Unrealized
Appreciation
(Depreciation) | |
OTC Currency Swap Agreement: | |
| IDR 2,000,000 | | 8.22%(S) | | | 138 | | | 6 Month LIBOR(S) | | Citibank, N.A. | | | 11/29/23 | | | $ | 21,529 | | | $ | — | | | $ | 21,529 | |
| | | | | | | | | | | | | | | | | | | | | | | | | | |
See Notes to Financial Statements.
Inflation swap agreements outstanding at October 31, 2019:
| | | | | | | | | | | | | | | | | | | | | | | | |
Notional
Amount
(000)# | | | Termination
Date | | | Fixed
Rate | | | Floating Rate | | Value at
Trade
Date | | | Value at
October 31,
2019 | | | Unrealized
Appreciaton
(Depreciation) | |
| Centrally Cleared Inflation Swap Agreements: | |
| EUR | 200 | | | | 05/15/23 | | | | 1.485%(T) | | | France CPI ex Tobacco
Household(1)(T) | | $ | — | | | $ | (5,781 | ) | | $ | (5,781 | ) |
| EUR | 200 | | | | 05/15/23 | | | | 1.510%(T) | | | Eurostat Eurozone HICP ex
Tobacco(2)(T) | | | — | | | | 5,523 | | | | 5,523 | |
| | | | | | | | | | | | | | | | | | | | | | | | |
| | | | | | | | | | | | | | $ | — | | | $ | (258 | ) | | $ | (258 | ) |
| | | | | | | | | | | | | | | | | | | | | | | | |
| (1) | The Fund pays the fixed rate and receives the floating rate. |
| (2) | The Fund pays the floating rate and receives the fixed rate. |
Interest rate swap agreements outstanding at October 31, 2019:
| | | | | | | | | | | | | | | | | | | | | | | | |
Notional
Amount
(000)# | | | Termination
Date | | | Fixed
Rate | | | Floating Rate | | Value at
Trade
Date | | | Value at
October 31,
2019 | | | Unrealized
Appreciaton
(Depreciation) | |
| Centrally Cleared Interest Rate Swap Agreements: | |
| AUD | 560 | | | | 09/25/22 | | | | 2.958%(S) | | | 6 Month BBSW(2)(S) | | $ | — | | | $ | 15,546 | | | $ | 15,546 | |
| AUD | 380 | | | | 11/27/28 | | | | 2.847%(S) | | | 6 Month BBSW(2)(S) | | | (6 | ) | | | 38,021 | | | | 38,027 | |
| AUD | 350 | | | | 12/03/29 | | | | 2.700%(S) | | | 6 Month BBSW(2)(S) | | | 35,519 | | | | 33,731 | | | | (1,788 | ) |
| AUD | 150 | | | | 05/09/32 | | | | 3.140%(S) | | | 6 Month BBSW(2)(S) | | | (4 | ) | | | 21,534 | | | | 21,538 | |
| AUD | 165 | | | | 07/19/32 | | | | 3.130%(S) | | | 6 Month BBSW(2)(S) | | | (5 | ) | | | 23,575 | | | | 23,580 | |
| BRL | 287 | | | | 01/02/25 | | | | 6.540%(T) | | | 1 Day BROIS(2)(T) | | | — | | | | 2,570 | | | | 2,570 | |
| BRL | 1,710 | | | | 01/02/25 | | | | 6.670%(T) | | | 1 Day BROIS(2)(T) | | | — | | | | 18,465 | | | | 18,465 | |
| BRL | 657 | | | | 01/02/25 | | | | 9.475%(T) | | | 1 Day BROIS(2)(T) | | | — | | | | 46,218 | | | | 46,218 | |
| BRL | 724 | | | | 01/02/25 | | | | 9.943%(T) | | | 1 Day BROIS(2)(T) | | | — | | | | 62,110 | | | | 62,110 | |
| BRL | 305 | | | | 01/02/25 | | | | 11.080%(T) | | | 1 Day BROIS(2)(T) | | | — | | | | 31,128 | | | | 31,128 | |
| BRL | 98 | | | | 01/02/25 | | | | 12.090%(T) | | | 1 Day BROIS(2)(T) | | | — | | | | 11,793 | | | | 11,793 | |
| CAD | 615 | | | | 01/09/20 | | | | 1.716%(S) | | | 3 Month Canadian Banker’s Acceptance(2)(S) | | | (667 | ) | | | (614 | ) | | | 53 | |
| CAD | 620 | | | | 04/05/22 | | | | 1.445%(S) | | | 3 Month Canadian Banker’s Acceptance(2)(S) | | | (18,076 | ) | | | (4,098 | ) | | | 13,978 | |
| CAD | 200 | | | | 12/03/28 | | | | 2.600%(S) | | | 3 Month Canadian Banker’s Acceptance(2)(S) | | | 1,894 | | | | 10,497 | | | | 8,603 | |
| CAD | 320 | | | | 05/30/37 | | | | 2.240%(S) | | | 3 Month Canadian Banker’s Acceptance(2)(S) | | | (16,025 | ) | | | 8,836 | | | | 24,861 | |
| CAD | 50 | | | | 01/09/38 | | | | 2.720%(S) | | | 3 Month Canadian Banker’s Acceptance(2)(S) | | | — | | | | 4,280 | | | | 4,280 | |
| CAD | 150 | | | | 05/30/47 | | | | 2.240%(S) | | | 3 Month Canadian Banker’s Acceptance(2)(S) | | | (8,007 | ) | | | 5,967 | | | | 13,974 | |
See Notes to Financial Statements.
| | | | |
| PGIM International Bond Fund | | | 51 | |
Schedule of Investments(continued)
as of October 31, 2019
Interest rate swap agreements outstanding at October 31, 2019 (continued):
| | | | | | | | | | | | | | | | | | | | | | | | |
Notional
Amount
(000)# | | | Termination
Date | | | Fixed
Rate | | | Floating Rate | | Value at
Trade
Date | | | Value at
October 31,
2019 | | | Unrealized
Appreciaton
(Depreciation) | |
| Centrally Cleared Interest Rate Swap Agreements (cont’d.): | |
| CHF | 210 | | | | 04/03/28 | | | | 0.410%(A) | | | 6 Month CHF LIBOR(2)(S) | | $ | 1,810 | | | $ | 14,477 | | | $ | 12,667 | |
| CHF | 140 | | | | 01/31/29 | | | | 0.260%(A) | | | 6 Month CHF LIBOR(2)(S) | | | — | | | | 7,942 | | | | 7,942 | |
| CHF | 80 | | | | 04/03/33 | | | | 0.687%(A) | | | 6 Month CHF LIBOR(2)(S) | | | 3,339 | | | | 8,895 | | | | 5,556 | |
| CLP | 47,300 | | | | 07/12/29 | | | | 3.135%(S) | | | 1 Day CLOIS(2)(S) | | | — | | | | 1,713 | | | | 1,713 | |
| CNH | 800 | | | | 03/13/24 | | | | 2.945%(Q) | | | 7 Day China Fixing Repo
Rates(2)(Q) | | | — | | | | (630 | ) | | | (630 | ) |
| CNH | 1,400 | | | | 04/01/24 | | | | 2.923%(Q) | | | 7 Day China Fixing Repo
Rates(2)(Q) | | | — | | | | (1,319 | ) | | | (1,319 | ) |
| CNH | 2,440 | | | | 06/20/24 | | | | 2.900%(Q) | | | 7 Day China Fixing Repo
Rates(2)(Q) | | | 3 | | | | (2,951 | ) | | | (2,954 | ) |
| CNH | 2,300 | | | | 09/03/24 | | | | 2.860%(Q) | | | 7 Day China Fixing Repo
Rates(2)(Q) | | | (4 | ) | | | (3,628 | ) | | | (3,624 | ) |
| CNH | 2,600 | | | | 10/10/24 | | | | 2.860%(Q) | | | 7 Day China Fixing Repo
Rates(2)(Q) | | | (3 | ) | | | (4,321 | ) | | | (4,318 | ) |
| CNH | 1,780 | | | | 11/01/24 | | | | 3.120%(Q) | | | 7 Day China Fixing Repo
Rates(2)(Q) | | | (7 | ) | | | 6 | | | | 13 | |
| COP | 559,000 | | | | 07/27/28 | | | | 6.200%(Q) | | | 1 Day COOIS(2)(Q) | | | 330 | | | | 11,116 | | | | 10,786 | |
| CZK | 22,450 | | | | 05/31/20 | | | | 2.138%(A) | | | 3 Month PRIBOR(1)(Q) | | | — | | | | (4,944 | ) | | | (4,944 | ) |
| CZK | 6,000 | | | | 11/17/22 | | | | 1.505%(A) | | | 6 Month PRIBOR(2)(S) | | | (16 | ) | | | (2,331 | ) | | | (2,315 | ) |
| CZK | 6,700 | | | | 01/31/24 | | | | 1.930%(A) | | | 6 Month PRIBOR(1)(S) | | | — | | | | (4,150 | ) | | | (4,150 | ) |
| CZK | 7,890 | | | | 06/20/24 | | | | 1.623%(A) | | | 6 Month PRIBOR(1)(S) | | | — | | | | 3,103 | | | | 3,103 | |
| CZK | 2,200 | | | | 06/29/27 | | | | 1.175%(A) | | | 6 Month PRIBOR(1)(S) | | | 5,359 | | | | 2,663 | | | | (2,696 | ) |
| EUR | 620 | | | | 05/11/22 | | | | (0.250)%(A) | | | 1 Day EONIA(2)(A) | | | 6,255 | | | | 4,926 | | | | (1,329 | ) |
| EUR | 127 | | | | 09/08/27 | | | | 0.770%(A) | | | 6 Month EURIBOR(2)(S) | | | — | | | | 10,275 | | | | 10,275 | |
| EUR | 1,335 | | | | 06/28/32 | | | | 0.785%(A) | | | 6 Month EURIBOR(2)(S) | | | (89,832 | ) | | | 124,094 | | | | 213,926 | |
| EUR | 305 | | | | 10/30/32 | | | | 1.302%(A) | | | 6 Month EURIBOR(2)(S) | | | — | | | | 50,267 | | | | 50,267 | |
| EUR | 50 | | | | 05/11/33 | | | | 1.000%(A) | | | 6 Month EURIBOR(2)(S) | | | (2,308 | ) | | | 6,385 | | | | 8,693 | |
| EUR | 100 | | | | 03/30/46 | | | | 1.058%(A) | | | 6 Month EURIBOR(2)(S) | | | (552 | ) | | | 18,854 | | | | 19,406 | |
| EUR | 60 | | | | 05/11/49 | | | | 1.450%(A) | | | 6 Month EURIBOR(2)(S) | | | 1,732 | | | | 20,199 | | | | 18,467 | |
See Notes to Financial Statements.
Interest rate swap agreements outstanding at October 31, 2019 (continued):
| | | | | | | | | | | | | | | | | | | | | | | | |
Notional
Amount
(000)# | | | Termination
Date | | | Fixed
Rate | | | Floating Rate | | Value at
Trade
Date | | | Value at
October 31,
2019 | | | Unrealized
Appreciaton
(Depreciation) | |
| Centrally Cleared Interest Rate Swap Agreements (cont’d.): | |
| GBP | 125 | | | | 05/08/24 | | | | 0.950%(A) | | | 1 Day SONIA(1)(A) | | $ | (1,930 | ) | | $ | (3,334 | ) | | $ | (1,404 | ) |
| GBP | 50 | | | | 05/08/29 | | | | 1.100%(A) | | | 1 Day SONIA(2)(A) | | | 2,925 | | | | 3,403 | | | | 478 | |
| GBP | 125 | | | | 03/09/46 | | | | 1.648%(S) | | | 6 Month GBP LIBOR(2)(S) | | | (101 | ) | | | 28,938 | | | | 29,039 | |
| HKD | 2,390 | | | | 03/13/21 | | | | 2.138%(Q) | | | 3 Month HIBOR(2)(Q) | | | (4 | ) | | | 728 | | | | 732 | |
| HKD | 2,700 | | | | 03/13/21 | | | | 2.145%(Q) | | | 3 Month HIBOR(2)(Q) | | | (4 | ) | | | 860 | | | | 864 | |
| HKD | 1,405 | | | | 09/03/26 | | | | 1.538%(Q) | | | 3 Month HIBOR(1)(Q) | | | (8 | ) | | | 3,132 | | | | 3,140 | |
| HUF | 177,300 | | | | 07/02/20 | | | | 1.065%(A) | | | 6 Month BUBOR(2)(S) | | | (301 | ) | | | 4,682 | | | | 4,983 | |
| HUF | 95,000 | | | | 01/12/27 | | | | 4.150%(A) | | | 6 Month BUBOR(2)(S) | | | — | | | | 46,596 | | | | 46,596 | |
| HUF | 99,345 | | | | 06/12/28 | | | | 3.750%(A) | | | 6 Month BUBOR(2)(S) | | | — | | | | 36,046 | | | | 36,046 | |
| HUF | 26,000 | | | | 07/15/29 | | | | 1.650%(A) | | | 6 Month BUBOR(2)(S) | | | — | | | | 3,800 | | | | 3,800 | |
| JPY | 309,920 | | | | 12/17/20 | | | | 0.015%(S) | | | 6 Month JPY LIBOR(1)(S) | | | — | | | | (3,097 | ) | | | (3,097 | ) |
| JPY | 76,810 | | | | 01/29/21 | | | | (0.014)%(S) | | | 6 Month JPY LIBOR(1)(S) | | | — | | | | (701 | ) | | | (701 | ) |
| JPY | 301,250 | | | | 12/20/24 | | | | 0.126%(S) | | | 6 Month JPY LIBOR(2)(S) | | | (6,292 | ) | | | 35,038 | | | | 41,330 | |
| JPY | 46,500 | | | | 07/04/28 | | | | 0.282%(S) | | | 6 Month JPY LIBOR(2)(S) | | | 4,000 | | | | 12,235 | | | | 8,235 | |
| JPY | 57,765 | | | | 12/03/28 | | | | 0.200%(S) | | | 6 Month JPY LIBOR(2)(S) | | | 5,197 | | | | 11,198 | | | | 6,001 | |
| JPY | 180,000 | | | | 12/22/36 | | | | 0.641%(S) | | | 6 Month JPY LIBOR(2)(S) | | | — | | | | 139,199 | | | | 139,199 | |
| JPY | 18,500 | | | | 02/28/37 | | | | 0.681%(S) | | | 6 Month JPY LIBOR(2)(S) | | | — | | | | 15,364 | | | | 15,364 | |
| JPY | 95,000 | | | | 07/26/37 | | | | 0.676%(S) | | | 6 Month JPY LIBOR(2)(S) | | | — | | | | 79,765 | | | | 79,765 | |
| JPY | 9,150 | | | | 01/04/38 | | | | 0.757%(S) | | | 6 Month JPY LIBOR(2)(S) | | | — | | | | 9,051 | | | | 9,051 | |
| JPY | 8,000 | | | | 12/03/38 | | | | 0.600%(S) | | | 6 Month JPY LIBOR(2)(S) | | | 2,617 | | | | 5,834 | | | | 3,217 | |
| JPY | 20,000 | | | | 10/04/39 | | | | 0.203%(S) | | | 6 Month JPY LIBOR(2)(S) | | | — | | | | (296 | ) | | | (296 | ) |
| JPY | 30,000 | | | | 12/03/39 | | | | 0.650%(S) | | | 6 Month JPY LIBOR(2)(S) | | | 20,402 | | | | 25,006 | | | | 4,604 | |
See Notes to Financial Statements.
| | | | |
| PGIM International Bond Fund | | | 53 | |
Schedule of Investments(continued)
as of October 31, 2019
Interest rate swap agreements outstanding at October 31, 2019 (continued):
| | | | | | | | | | | | | | | | | | | | | | | | |
Notional
Amount
(000)# | | | Termination
Date | | | Fixed
Rate | | | Floating Rate | | Value at
Trade
Date | | | Value at
October 31,
2019 | | | Unrealized
Appreciaton
(Depreciation) | |
| Centrally Cleared Interest Rate Swap Agreements (cont’d.): | |
| JPY | 45,000 | | | | 12/22/41 | | | | 0.731%(S) | | | 6 Month JPY LIBOR(2)(S) | | $ | — | | | $ | 46,150 | | | $ | 46,150 | |
| JPY | 6,200 | | | | 04/07/42 | | | | 0.803%(S) | | | 6 Month JPY LIBOR(2)(S) | | | — | | | | 7,183 | | | | 7,183 | |
| JPY | 7,400 | | | | 07/04/43 | | | | 0.763%(S) | | | 6 Month JPY LIBOR(2)(S) | | | — | | | | 8,287 | | | | 8,287 | |
| JPY | 25,000 | | | | 11/24/47 | | | | 0.888%(S) | | | 6 Month JPY LIBOR(2)(S) | | | — | | | | 38,750 | | | | 38,750 | |
| KRW | 700,000 | | | | 01/07/21 | | | | 1.733%(Q) | | | 3 Month KWCDC(2)(Q) | | | — | | | | 2,477 | | | | 2,477 | |
| KRW | 60,000 | | | | 09/10/28 | | | | 2.043%(Q) | | | 3 Month KWCDC(1)(Q) | | | (80 | ) | | | (2,953 | ) | | | (2,873 | ) |
| KRW | 75,700 | | | | 04/17/29 | | | | 1.740%(Q) | | | 3 Month KWCDC(2)(Q) | | | — | | | | 2,150 | | | | 2,150 | |
| MXN | 2,080 | | | | 06/11/27 | | | | 7.210%(M) | | | 28 Day Mexican Interbank
Rate(2)(M) | | | 506 | | | | 4,749 | | | | 4,243 | |
| MXN | 4,020 | | | | 02/27/29 | | | | 8.260%(M) | | | 28 Day Mexican Interbank
Rate(2)(M) | | | 945 | | | | 25,129 | | | | 24,184 | |
| NOK | 1,500 | | | | 12/11/28 | | | | 2.177%(A) | | | 6 Month NIBOR(2)(S) | | | — | | | | 6,844 | | | | 6,844 | |
| NOK | 500 | | | | 02/07/29 | | | | 2.083%(A) | | | 6 Month NIBOR(2)(S) | | | 869 | | | | 1,750 | | | | 881 | |
| NZD | 300 | | | | 05/01/20 | | | | 3.628%(S) | | | 3 Month BBR(2)(Q) | | | 8,462 | | | | 5,242 | | | | (3,220 | ) |
| NZD | 470 | | | | 01/10/27 | | | | 3.420%(S) | | | 3 Month BBR(2)(Q) | | | — | | | | 48,717 | | | | 48,717 | |
| NZD | 70 | | | | 11/28/28 | | | | 2.950%(S) | | | 3 Month BBR(2)(Q) | | | 1,860 | | | | 6,651 | | | | 4,791 | |
| NZD | 90 | | | | 07/22/29 | | | | 1.768%(S) | | | 3 Month BBR(2)(Q) | | | — | | | | 2,213 | | | | 2,213 | |
| PLN | 1,120 | | | | 08/24/23 | | | | 2.390%(A) | | | 6 Month WIBOR(2)(S) | | | — | | | | 7,430 | | | | 7,430 | |
| PLN | 935 | | | | 11/13/23 | | | | 2.570%(A) | | | 6 Month WIBOR(2)(S) | | | — | | | | 12,017 | | | | 12,017 | |
| PLN | 500 | | | | 04/11/24 | | | | 2.020%(A) | | | 6 Month WIBOR(2)(S) | | | — | | | | 2,920 | | | | 2,920 | |
| PLN | 1,300 | | | | 06/21/24 | | | | 1.750%(A) | | | 6 Month WIBOR(2)(S) | | | — | | | | 177 | | | | 177 | |
| PLN | 1,000 | | | | 01/10/27 | | | | 3.030%(A) | | | 6 Month WIBOR(2)(S) | | | — | | | | 27,493 | | | | 27,493 | |
| PLN | 620 | | | | 06/12/28 | | | | 3.070%(A) | | | 6 Month WIBOR(1)(S) | | | — | | | | (17,690 | ) | | | (17,690 | ) |
| PLN | 508 | | | | 11/13/28 | | | | 2.998%(A) | | | 6 Month WIBOR(1)(S) | | | — | | | | (16,350 | ) | | | (16,350 | ) |
See Notes to Financial Statements.
Interest rate swap agreements outstanding at October 31, 2019 (continued):
| | | | | | | | | | | | | | | | | | | | | | | | |
Notional
Amount
(000)# | | | Termination
Date | | | Fixed
Rate | | | Floating Rate | | Value at
Trade
Date | | | Value at
October 31,
2019 | | | Unrealized
Appreciaton
(Depreciation) | |
| Centrally Cleared Interest Rate Swap Agreements (cont’d.): | |
| SEK | 2,500 | | | | 12/30/26 | | | | 1.106%(A) | | | 3 Month STIBOR(2)(Q) | | $ | — | | | $ | 17,469 | | | $ | 17,469 | |
| SEK | 300 | | | | 07/11/28 | | | | 1.141%(A) | | | 3 Month STIBOR(2)(Q) | | | 524 | | | | 2,190 | | | | 1,666 | |
| SEK | 990 | | | | 11/28/28 | | | | 1.188%(A) | | | 3 Month STIBOR(2)(Q) | | | — | | | | 8,525 | | | | 8,525 | |
| SEK | 1,000 | | | | 06/20/29 | | | | 0.550%(A) | | | 3 Month STIBOR(2)(Q) | | | — | | | | 1,528 | | | | 1,528 | |
| SGD | 380 | | | | 05/21/23 | | | | 2.030%(S) | | | 6 Month SIBOR(1)(S) | | | — | | | | (5,433 | ) | | | (5,433 | ) |
| SGD | 135 | | | | 03/19/24 | | | | 2.025%(S) | | | 6 Month SIBOR(2)(S) | | | — | | | | 2,187 | | | | 2,187 | |
| SGD | 200 | | | | 05/21/28 | | | | 2.436%(S) | | | 6 Month SIBOR(2)(S) | | | — | | | | 9,703 | | | | 9,703 | |
| SGD | 90 | | | | 02/14/29 | | | | 2.285%(S) | | | 6 Month SIBOR(2)(S) | | | — | | | | 3,586 | | | | 3,586 | |
| | 4,640 | | | | 03/12/20 | | | | 2.405%(T) | | | 1 Day USOIS(2)(T) | | | — | | | | 18,729 | | | | 18,729 | |
| | 1,740 | | | | 04/25/20 | | | | 2.328%(T) | | | 1 Day USOIS(2)(T) | | | (28 | ) | | | 8,035 | | | | 8,063 | |
| | 2,142 | | | | 06/15/21 | | | | 1.830%(S) | | | 3 Month LIBOR(2)(Q) | | | — | | | | 7,137 | | | | 7,137 | |
| | 1,505 | | | | 09/15/21 | | | | 1.381%(S) | | | 3 Month LIBOR(2)(Q) | | | (278 | ) | | | (3,319 | ) | | | (3,041 | ) |
| | 3,005 | | | | 09/15/21 | | | | 1.480%(S) | | | 3 Month LIBOR(2)(Q) | | | 2,067 | | | | (1,714 | ) | | | (3,781 | ) |
| | 1,505 | | | | 09/15/21 | | | | 1.604%(S) | | | 3 Month LIBOR(2)(Q) | | | 7,043 | | | | 2,263 | | | | (4,780 | ) |
| | 230 | | | | 05/31/22 | | | | 2.353%(A) | | | 1 Day USOIS(1)(A) | | | — | | | | (6,457 | ) | | | (6,457 | ) |
| | 185 | | | | 09/27/22 | | | | 2.360%(A) | | | 1 Day USOIS(1)(A) | | | 2 | | | | (6,034 | ) | | | (6,036 | ) |
| | 280 | | | | 05/21/23 | | | | 2.215%(S) | | | 3 Month LIBOR(2)(Q) | | | — | | | | 8,580 | | | | 8,580 | |
| | 350 | | | | 02/29/24 | | | | 1.520%(S) | | | 3 Month LIBOR(2)(Q) | | | — | | | | 951 | | | | 951 | |
| | 500 | | | | 08/15/24 | | | | 2.168%(S) | | | 3 Month LIBOR(1)(Q) | | | — | | | | (15,854 | ) | | | (15,854 | ) |
| | 4,435 | | | | 08/15/24 | | | | 2.170%(S) | | | 3 Month LIBOR(1)(Q) | | | 16,556 | | | | (140,983 | ) | | | (157,539 | ) |
| | 490 | | | | 08/15/24 | �� | | | 2.176%(S) | | | 3 Month LIBOR(1)(Q) | | | 895 | | | | (15,709 | ) | | | (16,604 | ) |
| | 1,230 | | | | 11/15/24 | | | | 2.334%(S) | | | 3 Month LIBOR(1)(Q) | | | 4,442 | | | | (58,371 | ) | | | (62,813 | ) |
| | 1,185 | | | | 02/28/25 | | | | 2.454%(A) | | | 1 Day USOIS(1)(A) | | | 1,354 | | | | (76,707 | ) | | | (78,061 | ) |
| | 480 | | | | 05/31/25 | | | | 2.998%(S) | | | 3 Month LIBOR(1)(Q) | | | (319 | ) | | | (43,212 | ) | | | (42,893 | ) |
See Notes to Financial Statements.
| | | | |
| PGIM International Bond Fund | | | 55 | |
Schedule of Investments(continued)
as of October 31, 2019
Interest rate swap agreements outstanding at October 31, 2019 (continued):
| | | | | | | | | | | | | | | | | | | | | | | | |
Notional
Amount
(000)# | | | Termination
Date | | | Fixed
Rate | | | Floating Rate | | Value at
Trade
Date | | | Value at
October 31,
2019 | | | Unrealized
Appreciaton
(Depreciation) | |
| Centrally Cleared Interest Rate Swap Agreements (cont’d.): | |
| | 830 | | | | 07/31/25 | | | | 2.802%(A) | | | 1 Day USOIS(1)(A) | | $ | — | | | $ | (74,287 | ) | | $ | (74,287 | ) |
| | 1,190 | | | | 07/31/25 | | | | 3.105%(S) | | | 3 Month LIBOR(1)(Q) | | | 939 | | | | (115,523 | ) | | | (116,462 | ) |
| | 589 | | | | 07/31/25 | | | | 3.109%(S) | | | 3 Month LIBOR(1)(Q) | | | 31 | | | | (57,330 | ) | | | (57,361 | ) |
| | 125 | | | | 01/31/26 | | | | 2.236%(S) | | | 3 Month LIBOR(1)(Q) | | | — | | | | (6,221 | ) | | | (6,221 | ) |
| | 605 | | | | 01/31/26 | | | | 2.269%(A) | | | 1 Day USOIS(1)(A) | | | (7,082 | ) | | | (37,903 | ) | | | (30,821 | ) |
| | 1,110 | | | | 01/31/26 | | | | 2.406%(S) | | | 3 Month LIBOR(1)(Q) | | | (1,980 | ) | | | (67,023 | ) | | | (65,043 | ) |
| | 725 | | | | 03/12/26 | | | | 2.290%(A) | | | 1 Day USOIS(1)(A) | | | 33 | | | | (46,769 | ) | | | (46,802 | ) |
| | 1,002 | | | | 04/30/26 | | | | 1.876%(S) | | | 3 Month LIBOR(1)(Q) | | | (3,555 | ) | | | (23,270 | ) | | | (19,715 | ) |
| | 130 | | | | 05/15/27 | | | | 2.295%(S) | | | 3 Month LIBOR(1)(Q) | | | — | | | | (7,925 | ) | | | (7,925 | ) |
| | 150 | | | | 05/21/28 | | | | 2.421%(S) | | | 3 Month LIBOR(1)(Q) | | | — | | | | (11,450 | ) | | | (11,450 | ) |
| | 150 | | | | 08/15/44 | | | | 2.392%(A) | | | 1 Day USOIS(1)(A) | | | — | | | | (27,288 | ) | | | (27,288 | ) |
| ZAR | 10,560 | | | | 03/13/21 | | | | 7.180%(Q) | | | 3 Month JIBAR(2)(Q) | | | — | | | | 4,736 | | | | 4,736 | |
| ZAR | 9,480 | | | | 03/13/24 | | | | 7.500%(Q) | | | 3 Month JIBAR(1)(Q) | | | 10 | | | | (11,905 | ) | | | (11,915 | ) |
| ZAR | 2,035 | | | | 06/30/27 | | | | 8.015%(Q) | | | 3 Month JIBAR(2)(Q) | | | (13 | ) | | | 4,195 | | | | 4,208 | |
| ZAR | 1,700 | | | | 11/07/27 | | | | 8.360%(Q) | | | 3 Month JIBAR(2)(Q) | | | (34 | ) | | | 5,942 | | | | 5,976 | |
| ZAR | 3,500 | | | | 07/16/28 | | | | 8.170%(Q) | | | 3 Month JIBAR(2)(Q) | | | 6 | | | | 8,050 | | | | 8,044 | |
| ZAR | 2,820 | | | | 03/13/29 | | | | 8.055%(Q) | | | 3 Month JIBAR(2)(Q) | | | (9 | ) | | | 4,492 | | | | 4,501 | |
| ZAR | 2,000 | | | | 10/03/29 | | | | 7.580%(Q) | | | 3 Month JIBAR(2)(Q) | | | — | | | | (1,886 | ) | | | (1,886 | ) |
| | | | | | | | | | | | | | | | | | | | | | | | |
| | | | | | | | | | | | | | $ | (19,604 | ) | | $ | 518,708 | | | $ | 538,312 | |
| | | | | | | | | | | | | | | | | | | | | | | | |
| | | | | | | | | | | | | | | | | | | | | | | | | | |
Notional
Amount
(000)# | | | Termination
Date | | | Fixed
Rate | | | Floating Rate | | Fair
Value | | | Upfront
Premiums
Paid(Received) | | | Unrealized
Appreciaton
(Depreciation) | | | Counterparty |
| OTC Interest Rate Swap Agreements: |
| AED | 570 | | | | 02/25/29 | | | | 3.750%(A) | | | 3 Month EIBOR(2)(Q) | | $ | 17,778 | | | $ | — | | | $ | 17,778 | | | HSBC Bank USA, N.A. |
| CLP | 85,000 | | | | 11/15/27 | | | | 4.130%(S) | | | 1 Day CLOIS(2)(S) | | | 13,355 | | | | — | | | | 13,355 | | | Morgan Stanley & Co. International PLC |
| CLP | 55,000 | | | | 12/20/27 | | | | 4.260%(S) | | | 1 Day CLOIS(2)(S) | | | 8,952 | | | | — | | | | 8,952 | | | Morgan Stanley & Co. International PLC |
| CLP | 19,100 | | | | 01/23/28 | | | | 4.245%(S) | | | 1 Day CLOIS(2)(S) | | | 3,122 | | | | — | | | | 3,122 | | | Morgan Stanley & Co. International PLC |
See Notes to Financial Statements.
Interest rate swap agreements outstanding at October 31, 2019 (continued):
| | | | | | | | | | | | | | | | | | | | | | | | | | |
Notional
Amount
(000)# | | | Termination
Date | | | Fixed
Rate | | | Floating Rate | | Fair
Value | | | Upfront
Premiums
Paid
(Received) | | | Unrealized
Appreciaton
(Depreciation) | | | Counterparty |
| OTC Interest Rate Swap Agreements (cont’d.): |
| CLP | 33,000 | | | | 01/26/28 | | | | 4.210%(S) | | | 1 Day CLOIS(2)(S) | | $ | 5,344 | | | $ | — | | | $ | 5,344 | | | Morgan Stanley & Co. International PLC |
| CLP | 23,000 | | | | 05/17/28 | | | | 4.270%(S) | | | 1 Day CLOIS(2)(S) | | | 3,986 | | | | — | | | | 3,986 | | | Citibank, N.A. |
| CNH | 800 | | | | 08/15/23 | | | | 3.115%(Q) | | | 7 Day China Fixing Repo Rates(2)(Q) | | | 342 | | | | (3 | ) | | | 345 | | | UBS AG |
| CNH | 500 | | | | 04/02/26 | | | | 3.120%(Q) | | | 7 Day China Fixing Repo Rates(2)(Q) | | | (366 | ) | | | — | | | | (366 | ) | | Citibank, N.A. |
| COP | 123,000 | | | | 01/23/28 | | | | 6.035%(Q) | | | 1 Day COOIS(2)(Q) | | | 2,116 | | | | — | | | | 2,116 | | | Morgan Stanley & Co. International PLC |
| COP | 336,000 | | | | 01/26/28 | | | | 6.000%(Q) | | | 1 Day COOIS(2)(Q) | | | 5,435 | | | | — | | | | 5,435 | | | Morgan Stanley & Co. International PLC |
| COP | 263,000 | | | | 02/01/28 | | | | 6.020%(Q) | | | 1 Day COOIS(2)(Q) | | | 4,774 | | | | — | | | | 4,774 | | | Morgan Stanley & Co. International PLC |
| COP | 350,000 | | | | 05/17/28 | | | | 5.990%(Q) | | | 1 Day COOIS(2)(Q) | | | 5,877 | | | | — | | | | 5,877 | | | Citibank, N.A. |
| COP | 118,000 | | | | 07/12/29 | | | | 5.165%(Q) | | | 1 Day COOIS(2)(Q) | | | (525 | ) | | | — | | | | (525 | ) | | Morgan Stanley & Co. International PLC |
| ILS | 1,150 | | | | 01/12/27 | | | | 1.975%(A) | | | 3 Month TELBOR(2)(Q) | | | 36,427 | | | | — | | | | 36,427 | | | Citibank, N.A. |
| ILS | 390 | | | | 07/16/28 | | | | 2.045%(A) | | | 3 Month TELBOR(2)(Q) | | | 12,608 | | | | — | | | | 12,608 | | | JPMorgan Chase Bank, N.A. |
| ILS | 115 | | | | 02/07/29 | | | | 1.965%(A) | | | 3 Month TELBOR(2)(Q) | | | 3,785 | | | | — | | | | 3,785 | | | JPMorgan Chase Bank, N.A. |
| KRW | 850,000 | | | | 01/06/27 | | | | 1.800%(Q) | | | 3 Month KWCDC(2)(Q) | | | 22,762 | | | | (17 | ) | | | 22,779 | | | Citibank, N.A. |
| MYR | 1,000 | | | | 11/27/23 | | | | 3.900%(Q) | | | 3 Month KLIBOR(2)(Q) | | | 5,892 | | | | (2 | ) | | | 5,894 | | | Citibank, N.A. |
| RUB | 13,000 | | | | 05/17/24 | | | | 8.660%(A) | | | 3 Month MOSPRIME(2)(Q) | | | 9,626 | | | | — | | | | 9,626 | | | Goldman Sachs International |
| RUB | 13,000 | | | | 05/20/24 | | | | 8.700%(A) | | | 3 Month MOSPRIME(2)(Q) | | | 9,815 | | | | — | | | | 9,815 | | | Goldman Sachs International |
| RUB | 10,000 | | | | 06/20/29 | | | | 9.580%(A) | | | 3 Month MOSPRIME(2)(Q) | | | 12,152 | | | | — | | | | 12,152 | | | Goldman Sachs International |
| THB | 20,000 | | | | 08/08/20 | | | | 1.840%(S) | | | 6 Month BIBOR(2)(S) | | | 2,472 | | | | — | | | | 2,472 | | | Citibank, N.A. |
| THB | 3,500 | | | | 02/14/29 | | | | 2.180%(S) | | | 6 Month THBFIX(2)(S) | | | 6,701 | | | | — | | | | 6,701 | | | Citibank, N.A. |
See Notes to Financial Statements.
| | | | |
| PGIM International Bond Fund | | | 57 | |
Schedule of Investments(continued)
as of October 31, 2019
Interest rate swap agreements outstanding at October 31, 2019 (continued):
| | | | | | | | | | | | | | | | | | | | | | | | | | |
Notional
Amount
(000)# | | | Termination
Date | | | Fixed
Rate | | | Floating Rate | | Fair
Value | | | Upfront
Premiums
Paid
(Received) | | | Unrealized
Appreciaton
(Depreciation) | | | Counterparty |
| OTC Interest Rate Swap Agreements (cont’d.): |
| ZAR | 3,300 | | | | 09/22/42 | | | | 8.020%(Q) | | | 3 Month JIBAR(2)(Q) | | $ | (3,869 | ) | | $ | (31 | ) | | $ | (3,838 | ) | | Deutsche Bank AG |
| ZAR | 3,100 | | | | 09/22/47 | | | | 7.890%(Q) | | | 3 Month JIBAR(1)(Q) | | | 4,869 | | | | 26 | | | | 4,843 | | | Deutsche Bank AG |
| | | | | | | | | | | | | | | | | | | | | | | | | | |
| | | | | | | | | | | | | | $ | 193,430 | | | $ | (27 | ) | | $ | 193,457 | | | |
| | | | | | | | | | | | | | | | | | | | | | | | | | |
| (1) | The Fund pays the fixed rate and receives the floating rate. |
| (2) | The Fund pays the floating rate and receives the fixed rate. |
Balances Reported in the Statement of Assets and Liabilities for OTC Swap Agreements:
| | | | | | | | | | | | | | | | |
| | | Premiums Paid | | | Premiums Received | | | Unrealized
Appreciation | | | Unrealized
Depreciation | |
OTC Swap Agreements | | $ | 122,629 | | | $ | (216,217) | | | $ | 470,091 | | | $ | (136,664 | ) |
Summary of Collateral for Centrally Cleared/Exchange-traded Derivatives:
Cash and securities segregated as collateral, including pending settlement for closed positions, to cover requirements for centrally cleared/exchange-traded derivatives are listed by broker as follows:
| | | | | | | | |
Broker | | Cash and/or Foreign Currency | | | Securities Market Value | |
Citigroup Global Markets, Inc. | | $ | — | | | $ | 748,305 | |
J.P. Morgan Securities LLC | | | 340,000 | | | | — | |
| | | | | | | | |
Total | | $ | 340,000 | | | $ | 748,305 | |
| | | | | | | | |
Fair Value Measurements:
Various inputs are used in determining the value of the Fund’s investments. These inputs are summarized in the three broad levels listed below.
Level 1—unadjusted quoted prices generally in active markets for identical securities.
Level 2—quoted prices for similar securities, interest rates and yield curves, prepayment speeds, foreign currency exchange rates and other observable inputs.
Level 3—unobservable inputs for securities valued in accordance with Board approved fair valuation procedures.
The following is a summary of the inputs used as of October 31, 2019 in valuing such portfolio securities:
| | | | | | | | | | | | |
| | | Level 1 | | | Level 2 | | | Level 3 | |
Investments in Securities | | | | | | | | | | | | |
Assets | | | | | | | | | | | | |
Asset-Backed Securities | | | | | | | | | | | | |
Cayman Islands | | $ | — | | | $ | 1,248,345 | | | $ | — | |
See Notes to Financial Statements.
| | | | | | | | | | | | |
| | | Level 1 | | | Level 2 | | | Level 3 | |
Investments in Securities (continued) | | | | | | | | | | | | |
Assets (continued) | | | | | | | | | | | | |
Asset-Backed Securities (continued) | | | | | | | | | | | | |
Netherlands | | $ | — | | | $ | 805,695 | | | $ | — | |
United States | | | — | | | | 657,812 | | | | — | |
Commercial Mortgage-Backed Securities | | | | | | | | | | | | |
United Kingdom | | | — | | | | 259,951 | | | | — | |
United States | | | — | | | | 401,381 | | | | — | |
Corporate Bonds | | | | | | | | | | | | |
Australia | | | — | | | | 121,436 | | | | — | |
Brazil | | | — | | | | 142,258 | | | | — | |
China | | | — | | | | 551,456 | | | | — | |
France | | | — | | | | 479,744 | | | | — | |
Germany | | | — | | | | 719,079 | | | | — | |
Indonesia | | | — | | | | 110,747 | | | | — | |
Ireland | | | — | | | | 121,546 | | | | — | |
Italy | | | — | | | | 247,516 | | | | — | |
Kazakhstan | | | — | | | | 109,297 | | | | — | |
Luxembourg | | | — | | | | 387,846 | | | | — | |
Mexico | | | — | | | | 454,227 | | | | — | |
Netherlands | | | — | | | | 686,658 | | | | — | |
Peru | | | — | | | | 190,715 | | | | — | |
Poland | | | — | | | | 310,856 | | | | — | |
Russia | | | — | | | | 238,789 | | | | — | |
Spain | | | — | | | | 213,889 | | | | — | |
Supranational Bank | | | — | | | | 135,378 | | | | — | |
United Arab Emirates | | | — | | | | 144,150 | | | | — | |
United Kingdom | | | — | | | | 1,117,642 | | | | — | |
United States | | | — | | | | 4,292,942 | | | | — | |
Residential Mortgage-Backed Securities | | | | | | | | | | | | |
Bermuda | | | — | | | | 148,329 | | | | — | |
United Kingdom | | | — | | | | 118,104 | | | | — | |
United States | | | — | | | | 298,711 | | | | — | |
Sovereign Bonds | | | | | | | | | | | | |
Argentina | | | — | | | | 306,678 | | | | — | |
Brazil | | | — | | | | 816,626 | | | | — | |
Bulgaria | | | — | | | | 168,838 | | | | — | |
Canada | | | — | | | | 185,846 | | | | — | |
China | | | — | | | | 518,351 | | | | — | |
Colombia | | | — | | | | 529,768 | | | | — | |
Croatia | | | — | | | | 264,326 | | | | — | |
Cyprus | | | — | | | | 1,034,039 | | | | — | |
Greece | | | — | | | | 1,495,036 | | | | — | |
Hungary | | | — | | | | 28,551 | | | | — | |
Indonesia | | | — | | | | 670,534 | | | | — | |
Ireland | | | — | | | | 208,191 | | | | — | |
Israel | | | — | | | | 121,902 | | | | — | |
Italy | | | — | | | | 2,711,987 | | | | — | |
Japan | | | — | | | | 133,879 | | | | — | |
See Notes to Financial Statements.
| | | | |
| PGIM International Bond Fund | | | 59 | |
Schedule of Investments(continued)
as of October 31, 2019
| | | | | | | | | | | | |
| | | Level 1 | | | Level 2 | | | Level 3 | |
Investments in Securities (continued) | | | | | | | | | | | | |
Assets (continued) | | | | | | | | | | | | |
Sovereign Bonds (continued) | | | | | | | | | | | | |
Kazakhstan | | $ | — | | | $ | 144,356 | | | $ | — | |
Mexico | | | — | | | | 570,022 | | | | — | |
Peru | | | — | | | | 289,438 | | | | — | |
Philippines | | | — | | | | 114,597 | | | | — | |
Portugal | | | — | | | | 1,264,846 | | | | — | |
Romania | | | — | | | | 301,132 | | | | — | |
Russia | | | — | | | | 300,002 | | | | — | |
Saudi Arabia | | | — | | | | 147,080 | | | | — | |
Senegal | | | — | | | | 115,316 | | | | — | |
Serbia | | | — | | | | 229,484 | | | | — | |
South Korea | | | — | | | | 256,097 | | | | — | |
Spain | | | — | | | | 2,702,117 | | | | — | |
Turkey | | | — | | | | 441,996 | | | | — | |
Ukraine | | | — | | | | 369,548 | | | | — | |
United Kingdom | | | — | | | | 1,555,663 | | | | — | |
U.S. Government Agency Obligation | | | — | | | | 10,949 | | | | — | |
U.S. Treasury Obligation | | | — | | | | 59,946 | | | | — | |
Affiliated Mutual Fund | | | 594,002 | | | | — | | | | — | |
Options Purchased | | | — | | | | 10,940 | | | | — | |
| | | | | | | | | | | | |
Total | | $ | 594,002 | | | $ | 32,792,580 | | | $ | — | |
| | | | | | | | | | | | |
Other Financial Instruments* | | | | | | | | | | | | |
Assets | | | | | | | | | | | | |
Futures Contracts | | $ | 242,915 | | | $ | — | | | $ | — | |
OTC Forward Foreign Currency Exchange Contracts | | | — | | | | 265,073 | | | | — | |
OTC Packaged Credit Default Swap Agreements | | | — | | | | 107,025 | | | | — | |
Centrally Cleared Credit Default Swap Agreement | | | — | | | | 13,870 | | | | — | |
OTC Credit Default Swap Agreements | | | — | | | | 167,887 | | | | 671 | |
OTC Currency Swap Agreement | | | — | | | | 21,529 | | | | — | |
Centrally Cleared Inflation Swap Agreement | | | — | | | | 5,523 | | | | — | |
Centrally Cleared Interest Rate Swap Agreements | | | — | | | | 1,494,478 | | | | — | |
OTC Interest Rate Swap Agreements | | | — | | | | 198,190 | | | | — | |
| | | | | | | | | | | | |
Total | | $ | 242,915 | | | $ | 2,273,575 | | | $ | 671 | |
| | | | | | | | | | | | |
Liabilities | | | | | | | | | | | | |
Futures Contracts | | $ | (175,221 | ) | | $ | — | | | $ | — | |
OTC Forward Foreign Currency Exchange Contracts | | | — | | | | (709,970 | ) | | | — | |
OTC Packaged Credit Default Swap Agreements | | | — | | | | (109,607 | ) | | | — | |
OTC Credit Default Swap Agreements | | | — | | | | (141,096 | ) | | | — | |
Centrally Cleared Inflation Swap Agreement | | | — | | | | (5,781 | ) | | | — | |
See Notes to Financial Statements.
| | | | | | | | | | | | |
| | | Level 1 | | | Level 2 | | | Level 3 | |
Other Financial Instruments* (continued) | | | | | | | | | | | | |
Liabilities (continued) | | | | | | | | | | | | |
Centrally Cleared Interest Rate Swap Agreements | | $ | — | | | $ | (956,166 | ) | | $ | — | |
OTC Interest Rate Swap Agreements | | | — | | | | (4,760 | ) | | | — | |
| | | | | | | | | | | | |
Total | | $ | (175,221 | ) | | $ | (1,927,380 | ) | | $ | — | |
| | | | | | | | | | | | |
| * | Other financial instruments are derivative instruments not reflected in the Schedule of Investments, such as futures, forwards and centrally cleared swap contracts, which are recorded at the unrealized appreciation (depreciation) on the instrument, and OTC swap contracts which are recorded at fair value. |
Industry Classification:
The industry classification of investments and other assets in excess of liabilities shown as a percentage of net assets as of October 31, 2019 were as follows (unaudited):
| | | | |
Sovereign Bonds | | | 51.1 | % |
Collateralized Loan Obligations | | | 5.8 | |
Banks | | | 4.7 | |
Healthcare-Products | | | 3.6 | |
Oil & Gas | | | 2.4 | |
Commercial Mortgage-Backed Securities | | | 1.9 | |
Insurance | | | 1.8 | |
Software | | | 1.7 | |
Affiliated Mutual Fund | | | 1.7 | |
Residential Mortgage-Backed Securities | | | 1.6 | |
Commercial Services | | | 1.5 | |
Diversified Financial Services | | | 1.4 | |
Electrical Components & Equipment | | | 1.3 | |
Telecommunications | | | 1.2 | |
Foods | | | 1.2 | |
Retail | | | 1.1 | |
Entertainment | | | 1.1 | |
Media | | | 1.0 | |
Electric | | | 1.0 | |
Pharmaceuticals | | | 0.9 | |
Chemicals | | | 0.8 | |
Household Products/Wares | | | 0.7 | |
Packaging & Containers | | | 0.7 | |
Student Loan | | | 0.6 | % |
Transportation | | | 0.6 | |
Consumer Loans | | | 0.6 | |
Other | | | 0.4 | |
Multi-National | | | 0.4 | |
Forest Products & Paper | | | 0.3 | |
Real Estate Investment Trusts (REITs) | | | 0.3 | |
Auto Manufacturers | | | 0.3 | |
Electronics | | | 0.3 | |
Automobiles | | | 0.3 | |
Auto Parts & Equipment | | | 0.3 | |
U.S. Treasury Obligation | | | 0.2 | |
U.S. Government Agency Obligation | | | 0.1 | |
Options Purchased | | | 0.0 | * |
| | | | |
| | | 94.9 | |
Other assets in excess of liabilities | | | 5.1 | |
| | | | |
| | | 100.0 | % |
| | | | |
Effects of Derivative Instruments on the Financial Statements and Primary Underlying Risk Exposure:
The Fund invested in derivative instruments during the reporting period. The primary types of risk associated with these derivative instruments are credit contracts risk, foreign exchange contracts risk and interest rate contracts risk. See the Notes to Financial Statements for additional detail regarding these derivative instruments and their risks. The effect of such derivative instruments on the Fund’s financial position and financial performance as reflected in the Statement of Assets
See Notes to Financial Statements.
| | | | |
| PGIM International Bond Fund | | | 61 | |
Schedule of Investments(continued)
as of October 31, 2019
and Liabilities and Statement of Operations is presented in the summary below.
Fair values of derivative instruments as of October 31, 2019 as presented in the Statement of Assets and Liabilities:
| | | | | | | | | | | | |
| | | Asset Derivatives | | | Liability Derivatives | |
Derivatives not accounted
for as hedging instruments,
carried at fair value | | Statement of
Assets and
Liabilities Location | | Fair
Value | | | Statement of
Assets and
Liabilities Location | | Fair
Value | |
| Credit contracts | | Due from/to broker-variation margin swaps | | $ | 13,870 | * | | — | | $ | — | |
| Credit contracts | | Premiums paid for OTC swap agreements | | | 122,603 | | | Premiums received for OTC swap agreements | | | 216,164 | |
| Credit contracts | | Unrealized appreciation on OTC swap agreements | | | 250,376 | | | Unrealized depreciation on OTC swap agreements | | | 131,935 | |
| Foreign exchange contracts | | Unrealized appreciation on OTC forward foreign currency exchange contracts | | | 265,073 | | | Unrealized depreciation on OTC forward foreign currency exchange contracts | | | 709,970 | |
| Interest rate contracts | | Due from/to broker-variation margin futures | | | 242,915 | * | | Due from/to broker-variation margin futures | | | 175,221 | * |
| Interest rate contracts | | Due from/to broker-variation margin swaps | | | 1,500,001 | * | | Due from/to broker-variation margin swaps | | | 961,947 | * |
| Interest rate contracts | | Premiums paid for OTC swap agreements | | | 26 | | | Premiums received for OTC swap agreements | | | 53 | |
| Interest rate contracts | | Unaffiliated investments | | | 10,940 | | | — | | | — | |
| Interest rate contracts | | Unrealized appreciation on OTC swap agreements | | | 219,715 | | | Unrealized depreciation on OTC swap agreements | | | 4,729 | |
| | | | | | | | | | | | |
| | | | $ | 2,625,519 | | | | | $ | 2,200,019 | |
| | | | | | | | | | | | |
| * | Includes cumulative appreciation (depreciation) as reported in the schedule of open futures and centrally cleared swap contracts. Only unsettled variation margin receivable (payable) is reported within the Statement of Assets and Liabilities. |
See Notes to Financial Statements.
The effects of derivative instruments on the Statement of Operations for the year ended October 31, 2019 are as follows:
| | | | | | | | | | | | | | | | | | | | |
Amount of Realized Gain (Loss) on Derivatives Recognized in Income | |
Derivatives not accounted
for as hedging instruments,
carried at fair value | �� | Options
Purchased(1) | | | Options
Written | | | Futures | | | Forward & Cross
Currency
Exchange
Contracts | | | Swaps | |
Credit contracts | | $ | (21,687 | ) | | $ | 28,995 | | | $ | — | | | $ | — | | | $ | 284,285 | |
Foreign exchange contracts | | | (33,145 | ) | | | 27,723 | | | | — | | | | 1,630,740 | | | | — | |
Interest rate contracts | | | (15,980 | ) | | | 7,707 | | | | 777,736 | | | | — | | | | 195,618 | |
| | | | | | | | | | | | | | | | | | | | |
Total | | $ | (70,812 | ) | | $ | 64,425 | | | $ | 777,736 | | | $ | 1,630,740 | | | $ | 479,903 | |
| | | | | | | | | | | | | | | | | | | | |
| (1) | Included in net realized gain (loss) on investment transactions in the Statement of Operations. |
| | | | | | | | | | | | | | | | | | | | | | | | |
Change in Unrealized Appreciation (Depreciation) on Derivatives Recognized in Income | |
Derivatives not accounted
for as hedging instruments, carried at fair value | | Options
Purchased(2) | | | Options
Written | | | Futures | | | Forward
& Cross
Currency
Exchange
Contracts | | | Forward
Rate
Agreements | | | Swaps | |
| Credit contracts | | $ | 687 | | | $ | (3,366 | ) | | $ | — | | | $ | — | | | $ | — | | | $ | 68,117 | |
| Foreign exchange contracts | | | (62,874 | ) | | | 68,437 | | | | — | | | | (675,295 | ) | | | — | | | | — | |
| Interest rate contracts | | | 3,018 | | | | 3,148 | | | | 229,851 | | | | — | | | | 1,329 | | | | 267,255 | |
| | | | | | | | | | | | | | | | | | | | | | | | |
Total | | $ | (59,169 | ) | | $ | 68,219 | | | $ | 229,851 | | | $ | (675,295 | ) | | $ | 1,329 | | | $ | 335,372 | |
| | | | | | | | | | | | | | | | | | | | | | | | |
| (2) | Included in net change in unrealized appreciation (depreciation) on investments in the Statement of Operations. |
For the year ended October 31, 2019, the Fund’s average volume of derivative activities is as follows:
| | | | | | | | | | | | | | | | | | |
Options
Purchased(1) | | | Options
Written(2) | | | Futures
Contracts—
Long
Positions(2) | | | Futures
Contracts—
Short
Positions(2) | | | Forward
Foreign
Currency
Exchange
Contracts—
Purchased(3) | |
| $ | 23,492 | | | $ | 2,860,003 | | | $ | 22,865,724 | | | $ | 28,599,333 | | | $ | 25,273,641 | |
| | | | |
Forward
Foreign Currency Exchange
Contracts— Sold(3) | | | Cross
Currency
Exchange
Contracts(4) | | | Forward
Rate
Agreements(2) | | | Interest
Rate
Swap
Agreements(2) | | | Credit
Default
Swap
Agreements—
Buy
Protection(2) | |
| $ | 52,589,953 | | | $ | 281,188 | | | $ | 220,000 | | | $ | 72,826,075 | | | $ | 4,225,377 | |
| | | | |
Credit Default Swap
Agreements—
Sell
Protection(2) | | | | | | Currency
Swap
Agreements(2) | | | | | | Inflation
Swap
Agreements(2) | |
| $ | 10,100,323 | | | | | | | $ | 110,400 | | | | | | | $ | 800,669 | |
See Notes to Financial Statements.
| | | | |
| PGIM International Bond Fund | | | 63 | |
Schedule of Investments(continued)
as of October 31, 2019
| (2) | Notional Amount in USD. |
| (3) | Value at Settlement Date. |
Financial Instruments/Transactions—Summary of Offsetting and Netting Arrangements:
The Fund invested in OTC derivatives during the reporting period that are either offset in accordance with current requirements or are subject to enforceable master netting arrangements or similar agreements that permit offsetting. The information about offsetting and related netting arrangements for OTC derivatives where the legal right toset-off exists is presented in the summary below.
Offsetting of OTC derivative assets and liabilities:
| | | | | | | | | | | | | | | | | | | | |
Counterparty | | Gross
Amounts of
Recognized
Assets(1) | | | Gross
Amounts of
Recognized
Liabilities(1) | | | Net
Amounts of
Recognized
Assets/
(Liabilities) | | | Collateral
Pledged/
(Received)(2) | | | Net
Amount | |
Bank of America, N.A. | | $ | 59,849 | | | $ | (38,377 | ) | | $ | 21,472 | | | $ | — | | | $ | 21,472 | |
Barclays Bank PLC | | | 38,512 | | | | (30,582 | ) | | | 7,930 | | | | — | | | | 7,930 | |
BNP Paribas S.A. | | | 9,258 | | | | (21,038 | ) | | | (11,780 | ) | | | — | | | | (11,780 | ) |
Citibank, N.A. | | | 402,959 | | | | (276,372 | ) | | | 126,587 | | | | — | | | | 126,587 | |
Credit Suisse International | | | 2,688 | | | | (13,165 | ) | | | (10,477 | ) | | | — | | | | (10,477 | ) |
Deutsche Bank AG | | | 4,869 | | | | (11,891 | ) | | | (7,022 | ) | | | — | | | | (7,022 | ) |
Goldman Sachs International | | | 35,673 | | | | (33,923 | ) | | | 1,750 | | | | — | | | | 1,750 | |
HSBC Bank USA, N.A. | | | 28,308 | | | | (40,924 | ) | | | (12,616 | ) | | | — | | | | (12,616 | ) |
JPMorgan Chase Bank, N.A. | | | 50,158 | | | | (39,050 | ) | | | 11,108 | | | | — | | | | 11,108 | |
JPMorgan Securities LLC | | | 5,240 | | | | (1,093 | ) | | | 4,147 | | | | — | | | | 4,147 | |
Morgan Stanley & Co. International PLC | | | 96,599 | | | | (161,050 | ) | | | (64,451 | ) | | | — | | | | (64,451 | ) |
The Toronto-Dominion Bank | | | — | | | | (16,261 | ) | | | (16,261 | ) | | | — | | | | (16,261 | ) |
UBS AG | | | 134,620 | | | | (379,125 | ) | | | (244,505 | ) | | | — | | | | (244,505 | ) |
| | | | | | | | | | | | | | | | | | | | |
| | $ | 868,733 | | | $ | (1,062,851 | ) | | $ | (194,118 | ) | | $ | — | | | $ | (194,118 | ) |
| | | | | | | | | | | | | | | | | | | | |
| (1) | Includes unrealized appreciation/(depreciation) on swaps and forwards, premiums paid/(received) on swap agreements and market value of purchased and written options, as represented on the Statement of Assets and Liabilities. |
| (2) | Collateral amount disclosed by the Fund is limited to the market value of financial instruments/transactions and the Fund’s OTC derivative exposure by counterparty. |
See Notes to Financial Statements.
Statement of Assets and Liabilities
as of October 31, 2019
| | | | |
Assets | | | | |
Investments at value: | | | | |
Unaffiliated investments (cost $31,233,580) | | $ | 32,792,580 | |
Affiliated investments (cost $594,002) | | | 594,002 | |
Cash | | | 32,298 | |
Foreign currency, at value (cost $1,669,945) | | | 1,678,216 | |
Unrealized appreciation on OTC swap agreements | | | 470,091 | |
Dividends and interest receivable | | | 359,685 | |
Deposit with broker for centrally cleared/exchange-traded derivatives | | | 340,000 | |
Unrealized appreciation on OTC forward foreign currency exchange contracts | | | 265,073 | |
Premiums paid for OTC swap agreements | | | 122,629 | |
Due from broker—variation margin futures | | | 90,758 | |
Due from Manager | | | 5,391 | |
Prepaid expenses | | | 808 | |
| | | | |
Total Assets | | | 36,751,531 | |
| | | | |
| |
Liabilities | | | | |
Unrealized depreciation on OTC forward foreign currency exchange contracts | | | 709,970 | |
Payable for investments purchased | | | 332,245 | |
Premiums received for OTC swap agreements | | | 216,217 | |
Unrealized depreciation on OTC swap agreements | | | 136,664 | |
Accrued expenses and other liabilities | | | 110,372 | |
Due to broker—variation margin swaps | | | 46,297 | |
Payable for Fund shares reacquired | | | 347 | |
Distribution fee payable | | | 93 | |
Affiliated transfer agent fee payable | | | 90 | |
Dividends payable | | | 20 | |
| | | | |
Total Liabilities | | | 1,552,315 | |
| | | | |
| |
Net Assets | | $ | 35,199,216 | |
| | | | |
| | | | | |
Net assets were comprised of: | | | | |
Shares of beneficial interest, at par | | $ | 3,249 | |
Paid-in capital in excess of par | | | 31,601,475 | |
Total distributable earnings (loss) | | | 3,594,492 | |
| | | | |
Net assets, October 31, 2019 | | $ | 35,199,216 | |
| | | | |
See Notes to Financial Statements.
| | | | |
| PGIM International Bond Fund | | | 65 | |
Statement of Assets and Liabilities
as of October 31, 2019
| | | | |
Class A | | | | |
Net asset value and redemption price per share,
($267,309 ÷ 24,674 shares of beneficial interest issued and outstanding) | | $ | 10.83 | |
Maximum sales charge (3.25% of offering price) | | | 0.36 | |
| | | | |
Maximum offering price to public | | $ | 11.19 | |
| | | | |
| |
Class C | | | | |
Net asset value, offering price and redemption price per share,
($45,220 ÷ 4,176 shares of beneficial interest issued and outstanding) | | $ | 10.83 | |
| | | | |
| |
Class Z | | | | |
Net asset value, offering price and redemption price per share,
($3,465,730 ÷ 319,908 shares of beneficial interest issued and outstanding) | | $ | 10.83 | |
| | | | |
| |
Class R6 | | | | |
Net asset value, offering price and redemption price per share,
($31,420,957 ÷ 2,899,911 shares of beneficial interest issued and outstanding) | | $ | 10.84 | |
| | | | |
See Notes to Financial Statements.
Statement of Operations
Year Ended October 31, 2019
| | | | |
Net Investment Income (Loss) | | | | |
Income | | | | |
Interest income | | $ | 714,447 | |
Affiliated dividend income | | | 49,431 | |
| | | | |
Total income | | | 763,878 | |
| | | | |
| |
Expenses | | | | |
Management fee | | | 155,305 | |
Distribution fee(a) | | | 716 | |
Custodian and accounting fees | | | 128,471 | |
Audit fee | | | 51,005 | |
Registration fees(a) | | | 50,096 | |
Shareholders’ reports | | | 39,762 | |
Legal fees and expenses | | | 19,304 | |
Trustees’ fees | | | 11,220 | |
Transfer agent’s fees and expenses (including affiliated expense of $556)(a) | | | 3,327 | |
Miscellaneous | | | 16,485 | |
| | | | |
Total expenses | | | 475,691 | |
Less: Fee waiver and/or expense reimbursement(a) | | | (245,124 | ) |
| | | | |
Net expenses | | | 230,567 | |
| | | | |
Net investment income (loss) | | | 533,311 | |
| | | | |
| |
Realized And Unrealized Gain (Loss) On Investment And Foreign Currency Transactions | | | | |
Net realized gain (loss) on: | | | | |
Investment transactions | | | (30,017 | ) |
Futures transactions | | | 777,736 | |
Forward and cross currency contract transactions | | | 1,630,740 | |
Options written transactions | | | 64,425 | |
Swap agreement transactions | | | 479,903 | |
Foreign currency transactions | | | 38,048 | |
| | | | |
| | | 2,960,835 | |
| | | | |
Net change in unrealized appreciation (depreciation) on: | | | | |
Investments | | | 1,339,243 | |
Futures | | | 229,851 | |
Forward rate agreements | | | 1,329 | |
Forward and cross currency contracts | | | (675,295 | ) |
Options written | | | 68,219 | |
Swap agreements | | | 335,372 | |
Foreign currencies | | | 16,920 | |
| | | | |
| | | 1,315,639 | |
| | | | |
Net gain (loss) on investment and foreign currency transactions | | | 4,276,474 | |
| | | | |
Net Increase (Decrease) In Net Assets Resulting From Operations | | $ | 4,809,785 | |
| | | | |
See Notes to Financial Statements.
| | | | |
| PGIM International Bond Fund | | | 67 | |
Statement of Operations
Year Ended October 31, 2019
| (a) | Class specific expenses and waivers were as follows: |
| | | | | | | | | | | | | | | | |
| | | Class A | | | Class C | | | Class Z | | | Class R6 | |
Distribution fee | | | 409 | | | | 307 | | | | — | | | | — | |
Registration fees | | | 12,524 | | | | 12,524 | | | | 12,524 | | | | 12,524 | |
Transfer agent’s fees and expenses | | | 600 | | | | 110 | | | | 2,540 | | | | 77 | |
Fee waiver and/or expense reimbursement | | | (14,119 | ) | | | (12,816 | ) | | | (25,117 | ) | | | (193,072 | ) |
See Notes to Financial Statements.
Statements of Changes in Net Assets
| | | | | | | | |
| |
| | | Year Ended October 31, | |
| | |
| | | 2019 | | | 2018 | |
Increase (Decrease) in Net Assets | | | | | | | | |
Operations | | | | | | | | |
Net investment income (loss) | | $ | 533,311 | | | $ | 375,657 | |
Net realized gain (loss) on investment and foreign currency transactions | | | 2,960,835 | | | | 1,715,364 | |
Net change in unrealized appreciation (depreciation) on investments and foreign currencies | | | 1,315,639 | | | | (1,895,311 | ) |
| | | | | | | | |
Net increase (decrease) in net assets resulting from operations | | | 4,809,785 | | | | 195,710 | |
| | | | | | | | |
| | |
Dividends and Distributions | | | | | | | | |
Distributions from distributable earnings | | | | | | | | |
Class A | | | (11,478 | ) | | | (2,519 | ) |
Class C | | | (1,697 | ) | | | (231 | ) |
Class Z | | | (67,729 | ) | | | (4,071 | ) |
Class R6 | | | (2,664,029 | ) | | | (746,248 | ) |
| | | | | | | | |
| | | (2,744,933 | ) | | | (753,069 | ) |
| | | | | | | | |
| | |
Fund share transactions | | | | | | | | |
Net proceeds from shares sold | | | 3,412,549 | | | | 176,212 | |
Net asset value of shares issued in reinvestment of dividends and distributions | | | 2,744,737 | | | | 753,071 | |
Cost of shares reacquired | | | (152,333 | ) | | | (9,576 | ) |
| | | | | | | | |
Net increase (decrease) in net assets from Fund share transactions | | | 6,004,953 | | | | 919,707 | |
| | | | | | | | |
Total increase (decrease) | | | 8,069,805 | | | | 362,348 | |
| | |
Net Assets: | | | | | | | | |
Beginning of year | | | 27,129,411 | | | | 26,767,063 | |
| | | | | | | | |
End of year | | $ | 35,199,216 | | | $ | 27,129,411 | |
| | | | | | | | |
See Notes to Financial Statements.
| | | | |
| PGIM International Bond Fund | | | 69 | |
Notes to Financial Statements
Prudential Investment Portfolios 9 (the “Trust”) is registered under the Investment Company Act of 1940, as amended (“1940 Act”), as anopen-end management investment company. The Trust currently consists of five funds: PGIM Absolute Return Bond Fund and PGIM QMALarge-Cap Core Equity Fund, each of which are diversified funds and PGIM International Bond Fund, PGIM Select Real Estate Fund and PGIM Real Estate Income Fund, each of which arenon-diversified funds for purposes of the 1940 Act. These financial statements relate only to the PGIM International Bond Fund (the “Fund”).
The investment objective of the Fund is to seek total return, made up of current income and capital appreciation.
1. Accounting Policies
The Fund follows the investment company accounting and reporting guidance of the Financial Accounting Standards Board (“FASB”) Accounting Standard Codification (“ASC”) Topic 946 Financial Services—Investment Companies. The following accounting policies conform to U.S. generally accepted accounting principles. The Fund consistently follows such policies in the preparation of its financial statements.
Securities Valuation:The Fund holds securities and other assets and liabilities that are fair valued at the close of each day (generally, 4:00 PM Eastern time) the New York Stock Exchange (“NYSE”) is open for trading. Fair value is the price that would be received to sell an asset or paid to transfer a liability in an orderly transaction between market participants on the measurement date. The Trust’s Board of Trustees (the “Board”) has adopted valuation procedures for security valuation under which fair valuation responsibilities have been delegated to PGIM Investments LLC (“PGIM Investments” or the “Manager”). Pursuant to the Board’s delegation, the Manager has established a Valuation Committee responsible for supervising the fair valuation of portfolio securities and other assets and liabilities. The valuation procedures permit the Fund to utilize independent pricing vendor services, quotations from market makers, and alternative valuation methods when market quotations are either not readily available or not deemed representative of fair value. A record of the Valuation Committee’s actions is subject to the Board’s review, approval, and ratification at its next regularly scheduled quarterly meeting.
For the fiscal reportingyear-end, securities and other assets and liabilities were fair valued at the close of the last U.S. business day. Trading in certain foreign securities may occur when the NYSE is closed (including weekends and holidays). Because such foreign securities trade in markets that are open on weekends and U.S. holidays, the values of some of the Fund’s foreign investments may change on days when investors cannot purchase or redeem Fund shares.
Various inputs determine how the Fund’s investments are valued, all of which are categorized according to the three broad levels (Level 1, 2, or 3) detailed in the Schedule of Investments and referred to herein as the “fair value hierarchy” in accordance with FASB ASC Topic 820—Fair Value Measurements and Disclosures.
Derivative instruments, such as futures or options, that are traded on a national securities exchange are valued at the last sale price as of the close of trading on the applicable exchange where the security principally trades. Securities traded via NASDAQ are valued at the NASDAQ official closing price. To the extent these securities are valued at the last sale price or NASDAQ official closing price, they are classified as Level 1 in the fair value hierarchy. In the event that no sale or official closing price on valuation date exists, these securities are generally valued at the mean between the last reported bid and ask prices, or at the last bid price in the absence of an ask price. These securities are classified as Level 2 in the fair value hierarchy.
Investments inopen-end,non-exchange-traded mutual funds are valued at their net asset values as of the close of the NYSE on the date of valuation. These securities are classified as Level 1 in the fair value hierarchy since they may be purchased or sold at their net asset values on the date of valuation.
Fixed income securities traded in the OTC market are generally classified as Level 2 in the fair value hierarchy. Such fixed income securities are typically valued using the market approach which generally involves obtaining data from an approved independent third-party vendor source. The Fund utilizes the market approach as the primary method to value securities when market prices of identical or comparable instruments are available. The third-party vendors’ valuation techniques used to derive the evaluated bid price are based on evaluating observable inputs, including but not limited to, yield curves, yield spreads, credit ratings, deal terms, tranche level attributes, default rates, cash flows, prepayment speeds, broker/dealer quotations and reported trades. Certain Level 3 securities are also valued using the market approach when obtaining a single broker quote or when utilizing transaction prices for identical securities that have been used in excess of five business days. During the reporting period, there were no changes to report with respect to the valuation approach and/or valuation techniques discussed above.
OTC and centrally cleared derivative instruments are generally classified as Level 2 in the fair value hierarchy. Such derivative instruments are typically valued using the market approach and/or income approach which generally involves obtaining data from an approved independent third-party vendor source. The Fund utilizes the market approach when quoted prices in broker-dealer markets are available but also includes consideration of alternative valuation approaches, including the income approach. In the absence of reliable market quotations, the income approach is typically utilized for purposes of valuing derivatives such as interest rate swaps based on a discounted cash flow analysis whereby the value of the instrument is equal to the present value of its future cash inflows or outflows. Such analysis includes projecting future cash flows and determining the discount rate (including the present value factors that affect the discount rate) used to discount the future
| | | | |
| PGIM International Bond Fund | | | 71 | |
Notes to Financial Statements(continued)
cash flows. In addition, the third-party vendors’ valuation techniques used to derive the evaluated derivative price is based on evaluating observable inputs, including but not limited to, underlying asset prices, indices, spreads, interest rates and exchange rates. Certain derivatives may be classified as Level 3 when valued using the market approach by obtaining a single broker quote or when utilizing unobservable inputs in the income approach. During the reporting period, there were no changes to report with respect to the valuation approach and/or valuation techniques discussed above.
Securities and other assets that cannot be priced according to the methods described above are valued based on pricing methodologies approved by the Board. In the event that unobservable inputs are used when determining such valuations, the securities will be classified as Level 3 in the fair value hierarchy.
When determining the fair value of securities, some of the factors influencing the valuation include: the nature of any restrictions on disposition of the securities; assessment of the general liquidity of the securities; the issuer’s financial condition and the markets in which it does business; the cost of the investment; the size of the holding and the capitalization of the issuer; the prices of any recent transactions or bids/offers for such securities or any comparable securities; any available analyst media or other reports or information deemed reliable by the Manager regarding the issuer or the markets or industry in which it operates. Using fair value to price securities may result in a value that is different from a security’s most recent closing price and from the price used by other unaffiliated mutual funds to calculate their net asset values.
Illiquid Securities:Pursuant to Rule22e-4 under the 1940 Act, the Fund has adopted a Board approved Liquidity Risk Management Program (“LRMP”) that requires, among other things, that the Fund limit its illiquid investments that are assets to no more than 15% of net assets. Illiquid securities are those that, because of the absence of a readily available market or due to legal or contractual restrictions on resale, may not reasonably be expected to be sold or disposed of in current market conditions in seven calendar days or less without the sale or disposition significantly changing the market value of the investment. The Fund may find it difficult to sell illiquid securities at the time considered most advantageous by its subadviser and may incur transaction costs that would not be incurred in the sale of securities that were freely marketable.
Restricted Securities:Securities acquired in unregistered, private sales from the issuing company or from an affiliate of the issuer are considered restricted as to disposition under federal securities law (“restricted securities”). Such restricted securities are valued pursuant to the valuation procedures noted above. Restricted securities that would otherwise be considered illiquid investments pursuant to the Fund’s LRMP because of legal restrictions on resale to the general public may be traded among qualified institutional buyers under
Rule 144A of the Securities Act of 1933. Therefore, these Rule 144A securities, as well as commercial paper that is sold in private placements under Section 4(2) of the Securities Act of 1933, may be classified higher than “illiquid” under the LRMP (i.e. “moderately liquid” or “less liquid” investments). However, the liquidity of the Fund’s investments in restricted securities could be impaired if trading does not develop or declines.
Foreign Currency Translation:The books and records of the Fund are maintained in U.S. dollars. Foreign currency amounts are translated into U.S. dollars on the following basis:
(i) market value of investment securities, other assets and liabilities—at the current rates of exchange;
(ii) purchases and sales of investment securities, income and expenses—at the rates of exchange prevailing on the respective dates of such transactions.
Although the net assets of the Fund are presented at the foreign exchange rates and market values at the close of the period, the Fund does not generally isolate that portion of the results of operations arising as a result of changes in the foreign exchange rates from the fluctuations arising from changes in the market prices of long-term portfolio securities held at the end of the period. Similarly, the Fund does not isolate the effect of changes in foreign exchange rates from the fluctuations arising from changes in the market prices of long-term portfolio securities sold during the period. Accordingly, holding period realized foreign currency gains (losses) are included in the reported net realized gains (losses) on investment transactions. Notwithstanding the above, the Fund does isolate the effect of fluctuations in foreign currency exchange rates when determining the gain (loss) upon the sale or maturity of foreign currency denominated debt obligations; such amounts are included in net realized gains (losses) on foreign currency transactions.
Additionally, net realized gains (losses) on foreign currency transactions represent net foreign exchange gains (losses) from the disposition of holdings of foreign currencies, currency gains (losses) realized between the trade and settlement dates on forward currency transactions, and the difference between the amounts of interest, dividends and foreign withholding taxes recorded on the Fund’s books and the U.S. dollar equivalent amounts actually received or paid. Net unrealized currency gains (losses) arise from valuing foreign currency denominated assets and liabilities (other than investments) at period end exchange rates.
Forward and Cross Currency Contracts:A forward currency contract is a commitment to purchase or sell a foreign currency at a future date at a negotiated forward rate. The Fund enters into forward currency contracts, as defined in the prospectus, in order to hedge its exposure to changes in foreign currency exchange rates on its foreign portfolio holdings or on specific receivables and payables denominated in a foreign currency and to gain exposure to certain currencies. The contracts are valued daily at current forward exchange rates and any unrealized gain (loss) is included in net unrealized appreciation (depreciation) on forward and cross currency contracts. Gain (loss) is realized on the settlement date of the
| | | | |
| PGIM International Bond Fund | | | 73 | |
Notes to Financial Statements(continued)
contract equal to the difference between the settlement value of the original and negotiated forward contracts. This gain (loss), if any, is included in net realized gain (loss) on forward and cross currency contract transactions. Risks may arise upon entering into these contracts from the potential inability of the counterparties to meet the terms of their contracts. Forward currency contracts involve risks from currency exchange rate and credit risk in excess of the amounts reflected on the Statement of Assets and Liabilities. The Fund’s maximum risk of loss from counterparty credit risk is the net value of the cash flows to be received from the counterparty at the end of the contract’s life. A cross currency contract is a forward contract where a specified amount of one foreign currency will be exchanged for a specified amount of another foreign currency.
Options:The Fund purchased or wrote options in order to hedge against adverse market movements or fluctuations in value caused by changes in prevailing interest rates, value of equities or foreign currency exchange rates with respect to securities or financial instruments which the Fund currently owns or intends to purchase. The Fund may also use options to gain additional market exposure. The Fund’s principal reason for writing options is to realize, through receipt of premiums, a greater current return than would be realized on the underlying security alone. When the Fund purchases an option, it pays a premium and an amount equal to that premium is recorded as an asset. When the Fund writes an option, it receives a premium and an amount equal to that premium is recorded as a liability. The asset or liability is adjusted daily to reflect the current market value of the option. If an option expires unexercised, the Fund realizes a gain (loss) to the extent of the premium received or paid. If an option is exercised, the premium received or paid is recorded as an adjustment to the proceeds from the sale or the cost of the purchase in determining whether the Fund has realized a gain (loss). The difference between the premium and the amount received or paid at the closing of a purchase or sale transaction is also treated as a realized gain (loss). Gain (loss) on purchased options is included in net realized gain (loss) on investment transactions. Gain (loss) on written options is presented separately as net realized gain (loss) on options written transactions.
The Fund, as writer of an option, may have no control over whether the underlying securities or financial instruments may be sold (called) or purchased (put). As a result, the Fund bears the market risk of an unfavorable change in the price of the security or financial instrument underlying the written option. The Fund, as purchaser of an OTC option, bears the risk of the potential inability of the counterparties to meet the terms of their contracts. With exchange-traded options contracts, there is minimal counterparty credit risk to the Fund since the exchanges’ clearinghouse acts as counterparty to all exchange-traded options and guarantees the options contracts against default.
When the Fund writes an option on a swap, an amount equal to any premium received by the Fund is recorded as a liability and is subsequently adjusted to the current market value
of the written option on the swap. If a call option on a swap is exercised, the Fund becomes obligated to pay a fixed interest rate (noted as the strike price) and receive a variable interest rate on a notional amount. If a put option on a swap is exercised, the Fund becomes obligated to pay a variable interest rate and receive a fixed interest rate (noted as the strike price) on a notional amount. Premiums received from writing options on swaps that expire or are exercised are treated as realized gains upon the expiration or exercise of such options on swaps. The risk associated with writing put and call options on swaps is that the Fund will be obligated to be party to a swap agreement if an option on a swap is exercised.
Financial Futures Contracts:A financial futures contract is an agreement to purchase (long) or sell (short) an agreed amount of securities at a set price for delivery on a future date. Upon entering into a financial futures contract, the Fund is required to pledge to the broker an amount of cash and/or other assets equal to a certain percentage of the contract amount. This amount is known as the “initial margin.” Subsequent payments, known as “variation margin,” are made or received by the Fund each day, depending on the daily fluctuations in the value of the underlying security. Such variation margin is recorded for financial statement purposes on a daily basis as unrealized gain (loss). When the contract expires or is closed, the gain (loss) is realized and is presented in the Statement of Operations as net realized gain (loss) on futures transactions.
The Fund invested in financial futures contracts in order to hedge its existing portfolio securities, or securities the Fund intends to purchase, against fluctuations in value caused by changes in prevailing interest rates. Should interest rates move unexpectedly, the Fund may not achieve the anticipated benefits of the financial futures contracts and may realize a loss. The use of futures transactions involves the risk of imperfect correlation in movements in the price of futures contracts, interest rates and the underlying hedged assets. Since futures contracts are exchange-traded, there is minimal counterparty credit risk to the Fund since the exchanges’ clearinghouse acts as counterparty to all exchange-traded futures and guarantees the futures contracts against default.
Forward Rate Agreements:Forward rate agreements represent an agreement between counterparties to exchange cash flows based on the difference between two interest rates, applied to a notional principal amount on a fixed future date. The Fund entered into forward rate agreements to gain yield exposure based on anticipated market conditions at the specified termination date of the agreement.
Swap Agreements:The Fund entered into certain types of swap agreements detailed in the disclosures below. A swap agreement is an agreement to exchange the return generated by one instrument for the return generated by another instrument. Swap agreements are negotiated in the OTC market and may be executed either directly with a counterparty(“OTC-traded”) or through a central clearing facility, such as a registered exchange. Swap agreements are valued daily at current market value and any change in value is included in the net unrealized appreciation (depreciation) on swap agreements. Centrally cleared swaps pay or receive an amount known as “variation margin”, based on daily changes in the valuation of the swap contract. Any upfront premiums paid and received are shown as swap
| | | | |
| PGIM International Bond Fund | | | 75 | |
Notes to Financial Statements(continued)
premiums paid and swap premiums received in the Statement of Assets and Liabilities. Risk of loss may exceed amounts recognized on the Statement of Assets and Liabilities. Swap agreements outstanding at period end, if any, are listed on the Schedule of Investments.
Interest Rate Swaps:Interest rate swaps represent an agreement between counterparties to exchange cash flows based on the difference between two interest rates, applied to a notional principal amount for a specified period. The Fund is subject to interest rate risk exposure in the normal course of pursuing its investment objective. The Fund used interest rate swaps to maintain its ability to generate steady cash flow by receiving a stream of fixed rate payments or to increase exposure to prevailing market rates by receiving floating rate payments. The Fund’s maximum risk of loss from counterparty credit risk is the discounted net present value of the cash flows to be received from the counterparty over the contract’s remaining life.
Inflation Swaps:The Fund entered into inflation swap agreements to protect against fluctuations in inflation rates. Inflation swaps are characterized by one party paying a fixed rate in exchange for a floating rate that is derived from an inflation index, such as the Consumer Price Index or UK Retail Price Index. Inflation swaps subject the Fund to interest rate risk.
Credit Default Swaps (“CDS”):CDS involve one party (the protection buyer) making a stream of payments to another party (the protection seller) in exchange for the right to receive a specified payment in the event of a default or as a result of a default (collectively a “credit event”) for the referenced entity (typically corporate issues or sovereign issues of an emerging country) on its obligation; or in the event of a write-down, principal shortfall, interest shortfall or default of all or part of the referenced entities comprising a credit index.
The Fund is subject to credit risk in the normal course of pursuing its investment objectives, and as such, has entered into CDS contracts to provide a measure of protection against defaults or to take an active long or short position with respect to the likelihood of a particular issuer’s default or the reference entity’s credit soundness. CDS contracts generally trade based on a spread which represents the cost a protection buyer has to pay the protection seller. The protection buyer is said to be short the credit as the value of the contract rises the more the credit deteriorates. The value of the CDS contract increases for the protection buyer if the spread increases. The Fund’s maximum risk of loss from counterparty credit risk for purchased CDS is the inability of the counterparty to honor the contract up to the notional value due to a credit event.
As a seller of protection on credit default swap agreements, the Fund generally receives an agreed upon payment from the buyer of protection throughout the term of the swap, provided no credit event occurs. As the seller, the Fund effectively increases its investment
risk because, in addition to its total net assets, the Fund may be subject to investment exposure on the notional amount of the swap.
The maximum amount of the payment that the Fund, as a seller of protection, could be required to make under a credit default swap agreement would be equal to the notional amount of the underlying security or index contract as a result of a credit event. This potential amount will be partially offset by any recovery values of the respective referenced obligations, or net amounts received from the settlement of buy protection credit default swap agreements which the Fund entered into for the same referenced entity or index. As a buyer of protection, the Fund generally receives an amount up to the notional value of the swap if a credit event occurs.
Implied credit spreads, represented in absolute terms, utilized in determining the market value of credit default swap agreements where the Fund is the seller of protection as of period end are disclosed in the footnotes to the Schedule of Investments, if applicable. These spreads serve as indicators of the current status of the payment/performance risk and represent the likelihood of default risk for the credit derivative. The implied credit spread of a particular referenced entity reflects the cost of buying/selling protection and may include upfront payments required to enter into the agreement. Wider credit spreads and increased market value in absolute terms, when compared to the notional amount of the swap, represent a deterioration of the referenced entity’s credit soundness and a greater likelihood of risk of default or other credit event occurring as defined under the terms of the agreement.
Currency Swaps:The Fund entered into currency swap agreements primarily to gain yield exposure on foreign bonds. Currency swap agreements involve two parties exchanging two different currencies with an agreement to reverse the exchange at a later date at specified exchange rates.
Master Netting Arrangements:The Trust, on behalf of the Fund, is subject to various Master Agreements, or netting arrangements, with select counterparties. These are agreements which a subadviser may have negotiated and entered into on behalf of all or a portion of the Fund. A master netting arrangement between the Fund and the counterparty permits the Fund to offset amounts payable by the Fund to the same counterparty against amounts to be received; and by the receipt of collateral from the counterparty by the Fund to cover the Fund’s exposure to the counterparty. However, there is no assurance that such mitigating factors are easily enforceable. In addition to master netting arrangements, the right toset-off exists when all the conditions are met such that each of the parties owes the other determinable amounts, the reporting party has the right toset-off the amount owed with the amount owed by the other party, the reporting party intends toset-off and the right ofset-off is enforceable by law. During the reporting period, there was no intention to settle on a net basis and all amounts are presented on a gross basis on the Statement of Assets and Liabilities.
| | | | |
| PGIM International Bond Fund | | | 77 | |
Notes to Financial Statements(continued)
The Trust, on behalf of the Fund, is a party to International Swaps and Derivatives Association, Inc. (“ISDA”) Master Agreements with certain counterparties that govern OTC derivative and foreign exchange contracts entered into from time to time. The Master Agreements may contain provisions regarding, among other things, the parties’ general obligations, representations, agreements, collateral requirements, events of default and early termination. With respect to certain counterparties, in accordance with the terms of the Master Agreements, collateral posted to the Fund is held in a segregated account by the Fund’s custodian and with respect to those amounts which can be sold orre-pledged, is presented in the Schedule of Investments. Collateral pledged by the Fund is segregated by the Fund’s custodian and identified in the Schedule of Investments. Collateral can be in the form of cash or debt securities issued by the U.S. Government or related agencies or other securities as agreed to by the Fund and the applicable counterparty. Collateral requirements are determined based on the Fund’s net position with each counterparty. Termination events applicable to the Fund may occur upon a decline in the Fund’s net assets below a specified threshold over a certain period of time. Termination events applicable to counterparties may occur upon a decline in the counterparty’s long-term and short-term credit ratings below a specified level. In each case, upon occurrence, the other party may elect to terminate early and cause settlement of all derivative and foreign exchange contracts outstanding, including the payment of any losses and costs resulting from such early termination, as reasonably determined by the terminating party. Any decision by one or more of the Fund’s counterparties to elect early termination could impact the Fund’s future derivative activity.
In addition to each instrument’s primary underlying risk exposure (e.g. interest rate, credit, equity or foreign exchange, etc.), swap agreements involve, to varying degrees, elements of credit, market and documentation risk. Such risks involve the possibility that no liquid market for these agreements will exist, the counterparty to the agreement may default on its obligation to perform or disagree on the contractual terms of the agreement, and changes in net interest rates will be unfavorable. In connection with these agreements, securities in the portfolio may be identified or received as collateral from the counterparty in accordance with the terms of the respective swap agreements to provide or receive assets of value and to serve as recourse in the event of default or bankruptcy/insolvency of either party. Such OTC derivative agreements include conditions which, when materialized, give the counterparty the right to cause an early termination of the transactions under those agreements. Any election by the counterparty for early termination of the contract(s) may impact the amounts reported on financial statements.
As of October 31, 2019, the Fund has not met conditions under such agreements which give the counterparty the right to call for an early termination.
Forward currency contracts, forward rate agreements, written options, short sales, swaps and financial futures contracts involve elements of both market and credit risk in excess of
the amounts reflected on the Statement of Assets and Liabilities. Such risks may be mitigated by engaging in master netting arrangements.
Securities Transactions and Net Investment Income:Securities transactions are recorded on the trade date. Realized gains (losses) from investment and currency transactions are calculated on the specific identification method. Dividend income is recorded on theex-date, or for certain foreign securities, when the Fund becomes aware of such dividends. Interest income, including amortization of premium and accretion of discount on debt securities, as required, is recorded on the accrual basis. Expenses are recorded on an accrual basis, which may require the use of certain estimates by management that may differ from actual. Net investment income or loss (other than class specific expenses and waivers, which are allocated as noted below) and unrealized and realized gains (losses) are allocated daily to each class of shares based upon the relative proportion of adjusted net assets of each class at the beginning of the day. Class specific expenses and waivers, where applicable, are charged to the respective share classes. Class specific expenses include distribution fees and distribution fee waivers, shareholder servicing fees, transfer agent’s fees and expenses, registration fees and fee waivers and/or expense reimbursements, as applicable.
Taxes:It is the Fund’s policy to continue to meet the requirements of the Internal Revenue Code applicable to regulated investment companies and to distribute all of its taxable net investment income and capital gains, if any, to its shareholders. Therefore, no federal income tax provision is required. Withholding taxes on foreign dividends, interest and capital gains, if any, are recorded, net of reclaimable amounts, at the time the related income is earned.
Dividends and Distributions:The Fund expects to declare dividends of its net investment income daily and pay such dividends monthly. Distributions of net realized capital and currency gains, if any, are declared and paid at least annually. Dividends and distributions to shareholders, which are determined in accordance with federal income tax regulations and which may differ from generally accepted accounting principles, are recorded on theex-date. Permanent book/tax differences relating to income and gain (loss) are reclassified between total distributable earnings (loss) andpaid-in capital in excess of par, as appropriate.
Estimates:The preparation of financial statements requires management to make estimates and assumptions that affect the reported amounts and disclosures in the financial statements. Actual results could differ from those estimates.
2. Agreements
The Trust, on behalf of the Fund, has a management agreement with the Manager. Pursuant to this agreement, the Manager has responsibility for all investment advisory services and supervises the subadviser’s performance of such services. In addition, under the management agreement, the Manager provides all of the administrative functions necessary
| | | | |
| PGIM International Bond Fund | | | 79 | |
Notes to Financial Statements(continued)
for the organization, operation and management of the Fund. The Manager administers the corporate affairs of the Fund and, in connection therewith, furnishes the Fund with office facilities, together with those ordinary clerical and bookkeeping services which are not being furnished by the Fund’s custodian and the Fund’s transfer agent. The Manager is also responsible for the staffing and management of dedicated groups of legal, marketing, compliance and related personnel necessary for the operation of the Fund. The legal, marketing, compliance and related personnel are also responsible for the management and oversight of the various service providers to the Fund, including, but not limited to, the custodian, transfer agent, and accounting agent.
The Manager has entered into a subadvisory agreement with PGIM, Inc., which provides subadvisory services to the Fund through its PGIM Fixed Income unit. The subadvisory agreement provides that PGIM, Inc. will furnish investment advisory services in connection with the management of the Fund. In connection therewith, PGIM, Inc. is obligated to keep certain books and records of the Fund. The Manager pays for the services of PGIM, Inc., the cost of compensation of officers of the Fund, occupancy and certain clerical and bookkeeping costs of the Fund. The Fund bears all other costs and expenses.
The management fee paid to the Manager is accrued daily and payable monthly at an annual rate of 0.50% of the Fund’s average daily net assets up to $2 billion and 0.485% of such assets in excess of $2 billion. The effective management fee rate before any waivers and/or expense reimbursements was 0.50% for the year ended October 31, 2019.
The Manager has contractually agreed, through February 29, 2020, to limit total annual operating expenses after fee waivers and/or expense reimbursements to 0.99% of average daily net assets for Class A shares, 1.74% of average daily net assets for Class C shares, 0.74% of average daily net assets for Class Z shares and 0.74% of average daily net assets for Class R6 shares. This contractual waiver excludes interest, brokerage, taxes (such as income and foreign withholding taxes, stamp duty and deferred tax expenses), acquired fund fees and expenses, extraordinary expenses, and certain other Fund expenses such as dividend and interest expense and broker charges on short sales. Where applicable, the Manager agrees to waive management fees or shared operating expenses on any share class to the same extent that it waives similar expenses on any other share class. In addition, total annual operating expenses for Class R6 shares will not exceed total annual operating expenses for Class Z shares. Fees and/or expenses waived and/or reimbursed by the Manager may be recouped by the Manager within the same fiscal year during which such waiver and/or reimbursement is made if such recoupment can be realized without exceeding the expense limit in effect at the time of the recoupment for the fiscal year.
The Trust, on behalf of the Fund, has a distribution agreement with Prudential Investment Management Services LLC (“PIMS”), which acts as the distributor of the Class A, Class C,
Class Z and Class R6 shares of the Fund. The Fund compensates PIMS for distributing and servicing the Fund’s Class A and Class C shares, pursuant to the plans of distribution (the “Distribution Plans”), regardless of expenses actually incurred by PIMS. The distribution fees are accrued daily and payable monthly. No distribution or service fees are paid to PIMS as distributor of the Class Z or Class R6 shares of the Fund.
Pursuant to the Distribution Plans, the Fund compensates PIMS for distribution related activities at an annual rate of up to 0.25% and 1% of the average daily net assets of the Class A and Class C shares, respectively.
For the year ended October 31, 2019, PIMS has not receivedfront-end sales charges resulting from sales of Class A shares. Additionally, for the year ended October 31, 2019, PIMS did not receive any contingent deferred sales charges imposed upon redemptions by certain Class A and Class C shareholders, respectively. From these fees, PIMS paid such sales charges to broker-dealers, who in turn paid commissions to salespersons and incurred other distribution costs.
PGIM Investments, PGIM, Inc. and PIMS are indirect, wholly-owned subsidiaries of Prudential Financial, Inc. (“Prudential”).
3. Other Transactions with Affiliates
Prudential Mutual Fund Services LLC (“PMFS”), an affiliate of PGIM Investments and an indirect, wholly-owned subsidiary of Prudential, serves as the Trust’s transfer agent. Transfer agent’s fees and expenses in the Statement of Operations include certainout-of-pocket expenses paid tonon-affiliates, where applicable.
The Fund may invest its overnight sweep cash in the PGIM Core Ultra Short Bond Fund (the “Core Fund”), a series of Prudential Investment Portfolios 2, registered under the 1940 Act and managed by PGIM Investments. Through the Fund’s investments in the mentioned underlying funds, PGIM Investments and/or its affiliates are paid fees or reimbursed for providing their services. In addition to the realized and unrealized gains on investments in the Core Fund, earnings from such investments are disclosed on the Statement of Operations as “Affiliated dividend income”.
The Fund may enter into certain securities purchase or sale transactions under Board approvedRule 17a-7 procedures.Rule 17a-7 is an exemptive rule under the 1940 Act, that subject to certain conditions, permits purchase and sale transactions among affiliated investment companies, or between an investment company and a person that is affiliated solely by reason of having a common (or affiliated) investment adviser, common directors, and/or common officers. Pursuant to theRule 17a-7 procedures and consistent with guidance issued by the SEC, the Trust’s Chief Compliance Officer (“CCO”) prepares a quarterly summary of all such transactions for submission to the Board, together with the CCO’s written representation that all such17a-7 transactions were effected in accordance with the Fund’sRule 17a-7 procedures. For the year ended October 31, 2019, no17a-7
| | | | |
| PGIM International Bond Fund | | | 81 | |
Notes to Financial Statements(continued)
transactions were entered into by the Fund.
4. Portfolio Securities
The aggregate cost of purchases and proceeds from sales of portfolio securities (excluding short-term investments and U.S. Government securities) for the year ended October 31, 2019, were $20,563,489 and $12,820,245, respectively.
A summary of the cost of purchases and proceeds from sales of shares of an affiliated investment for the year ended October 31, 2019, is presented as follows:
| | | | | | | | | | | | | | | | | | | | | | | | | | | | |
Value,
Beginning
of Year | | | Cost of
Purchases | | | Proceeds
from Sales | | | Change in
Unrealized
Gain
(Loss) | | Realized
Gain
(Loss) | | | Value,
End of
Year | | | Shares,
End of
Year | | | Income | |
| | PGIM Core Ultra Short Bond Fund* | |
| $ | 2,346,703 | | | $ | 9,779,675 | | | $ | 11,532,376 | | | $— | | $ | — | | | $ | 594,002 | | | | 594,002 | | | $ | 49,431 | |
| | | | | | | | | | | | | | | | | | | | | | | | | | | | |
| * | The Fund did not have any capital gain distributions during the reporting period. |
5. Distributions and Tax Information
Distributions to shareholders, which are determined in accordance with federal income tax regulations and which may differ from generally accepted accounting principles, are recorded on theex-date.
For the year ended October 31, 2019, the tax character of dividends paid by the Fund was $2,744,933 of ordinary income. For the year ended October 31, 2018, the tax character of dividends paid by the Fund was $753,069 of ordinary income.
As of October 31, 2019, the accumulated undistributed earnings on a tax basis were $1,914,182 of ordinary income and $122,527 of long-term capital gains.
The United States federal income tax basis of the Fund’s investments and the net unrealized appreciation as of October 31, 2019 were as follows:
| | | | | | |
Tax Basis | | Gross
Unrealized
Appreciation | | Gross
Unrealized
Depreciation | | Net
Unrealized
Appreciation |
| $32,243,339 | | $4,118,423 | | $(2,560,620) | | $1,557,803 |
The differences between book basis and tax basis were primarily attributable to forward foreign currency exchange contracts, straddles, premium on bonds and other cost basis differences between financial and tax accounting.
The Fund utilized approximately $410,000 of its capital loss carryforward to offset net taxable gains realized in the fiscal year ended October 31, 2019.
The Manager has analyzed the Fund’s tax positions taken on federal, state and local income tax returns for all open tax years and has concluded that no provision for income tax is required in the Fund’s financial statements for the current reporting period. Since tax authorities can examine previously filed tax returns, the Fund’s U.S. federal and state tax returns for each of the three fiscal years up to the most recent fiscal year ended October 31, 2019 are subject to such review.
6. Capital and Ownership
The Fund offers Class A, Class C, Class Z and Class R6 shares. Class A shares are sold with a maximumfront-end sales charge of 3.25%. Investors who purchase $1 million or more (prior to July 15, 2019, $500,000 or more on or after July 15, 2019) of Class A shares and sell those shares within 12 months of purchase are subject to a contingent deferred sales charge (“CDSC”) of 1.00% on sales although these purchases are not subject to afront-end sales charge. The Class A CDSC is waived for certain retirement and/or benefit plans. A special exchange privilege is also available for shareholders who qualified to purchase Class A shares at net asset value. Class C shares are sold with a CDSC of 1% on sales made within 12 months of purchase. Class C shares will automatically convert to Class A shares on a monthly basis approximately 10 years after purchase. Class Z and Class R6 shares are not subject to any sales or redemption charge and are available exclusively for sale to a limited group of investors.
Under certain circumstances, an exchange may be made from specified share classes of the Fund to one or more other share classes of the Fund as presented in the table of transactions in shares of beneficial interest.
The Trust has authorized an unlimited number of shares of beneficial interest of the Fund at $0.001 par value per share, divided into four classes, designated Class A, Class C, Class Z and Class R6.
As of October 31, 2019, Prudential, through its affiliated entities, including affiliated funds (if applicable), owned 1,149 Class A shares, 1,125 Class C shares, 1,158 Class Z shares, and 2,894,297 Class R6 shares of the Fund. At reporting period end, two shareholders of record, each holding greater than 5% of the Fund, held 99% of the Fund’s outstanding shares, of which 89% were held by an affiliate of Prudential.
| | | | |
| PGIM International Bond Fund | | | 83 | |
Notes to Financial Statements(continued)
Transactions in shares of beneficial interest were as follows:
| | | | | | | | |
Class A | | Shares | | | Amount | |
Year ended October 31, 2019: | | | | | | | | |
Shares sold | | | 14,370 | | | $ | 149,593 | |
Shares issued in reinvestment of dividends and distributions | | | 1,130 | | | | 11,282 | |
Shares reacquired | | | (917 | ) | | | (9,195 | ) |
| | | | | | | | |
Net increase (decrease) in shares outstanding | | | 14,583 | | | $ | 151,680 | |
| | | | | | | | |
Year ended October 31, 2018: | | | | | | | | |
Shares sold | | | 1,269 | | | $ | 13,169 | |
Shares issued in reinvestment of dividends and distributions | | | 243 | | | | 2,520 | |
Shares reacquired | | | (188 | ) | | | (1,949 | ) |
| | | | | | | | |
Net increase (decrease) in shares outstanding | | | 1,324 | | | $ | 13,740 | |
| | | | | | | | |
Class C | | | | | | |
Year ended October 31, 2019: | | | | | | | | |
Shares sold | | | 2,472 | | | $ | 25,000 | |
Shares issued in reinvestment of dividends and distributions | | | 170 | | | | 1,697 | |
| | | | | | | | |
Net increase (decrease) in shares outstanding | | | 2,642 | | | $ | 26,697 | |
| | | | | | | | |
Year ended October 31, 2018: | | | | | | | | |
Shares sold | | | 1,253 | | | $ | 12,940 | |
Shares issued in reinvestment of dividends and distributions | | | 22 | | | | 223 | |
Shares reacquired | | | (754 | ) | | | (7,627 | ) |
| | | | | | | | |
Net increase (decrease) in shares outstanding | | | 521 | | | $ | 5,536 | |
| | | | | | | | |
Class Z | | | | | | |
Year ended October 31, 2019: | | | | | | | | |
Shares sold | | | 309,343 | | | $ | 3,161,755 | |
Shares issued in reinvestment of dividends and distributions | | | 6,505 | | | | 67,729 | |
Shares reacquired | | | (11,600 | ) | | | (122,988 | ) |
| | | | | | | | |
Net increase (decrease) in shares outstanding | | | 304,248 | | | $ | 3,106,496 | |
| | | | | | | | |
Year ended October 31, 2018: | | | | | | | | |
Shares sold | | | 14,241 | | | $ | 150,103 | |
Shares issued in reinvestment of dividends and distributions | | | 393 | | | | 4,071 | |
| | | | | | | | |
Net increase (decrease) in shares outstanding | | | 14,634 | | | $ | 154,174 | |
| | | | | | | | |
Class R6 | | | | | | |
Year ended October 31, 2019: | | | | | | | | |
Shares sold | | | 7,485 | | | $ | 76,201 | |
Shares issued in reinvestment of dividends and distributions | | | 268,505 | | | | 2,664,029 | |
Shares reacquired | | | (1,950 | ) | | | (20,150 | ) |
| | | | | | | | |
Net increase (decrease) in shares outstanding | | | 274,040 | | | $ | 2,720,080 | |
| | | | | | | | |
Year ended October 31, 2018: | | | | | | | | |
Shares issued in reinvestment of dividends and distributions | | | 71,921 | | | $ | 746,257 | |
| | | | | | | | |
Net increase (decrease) in shares outstanding | | | 71,921 | | | $ | 746,257 | |
| | | | | | | | |
7. Borrowings
The Trust, on behalf of the Fund, along with other affiliated registered investment companies (the “Funds”), is a party to a Syndicated Credit Agreement (“SCA”) with a group of banks. The purpose of the SCA is to provide an alternative source of temporary funding for capital share redemptions. The table below provides details of the current SCA in effect at the reportingperiod-end as well as the prior SCA.
| | | | |
| | | Current SCA | | Prior SCA |
Term of Commitment | | 10/3/2019 – 10/1/2020 | | 10/4/2018 – 10/2/2019 |
Total Commitment | | $900 million | | $900 million |
Annualized Commitment Fee on the Unused Portion of the SCA | | 0.15% | | 0.15% |
Annualized Interest Rate on Borrowings | | 1.20% plus the higher of (1) the effective federal funds rate, (2) theone-month LIBOR rate or (3) zero percent | | 1.25% plus the higher of (1) the effective federal funds rate, (2) theone-month LIBOR rate or (3) zero percent |
Certain affiliated registered investment companies that are parties to the SCA include portfolios that are subject to a predetermined mathematical formula used to manage certain benefit guarantees offered under variable annuity contracts. The formula may result in large scale asset flows into and out of these portfolios. Consequently, these portfolios may be more likely to utilize the SCA for purposes of funding redemptions. It may be possible for those portfolios to fully exhaust the committed amount of the SCA, thereby requiring the Manager to allocate available funding per a Board-approved methodology designed to treat the Funds in the SCA equitably.
The Fund did not utilize the SCA during the year ended October 31, 2019.
8. Risks of Investing in the Fund
The Fund’s risks include, but are not limited to, some or all of the risks discussed below:
Bond Obligations Risk:The Fund’s holdings, share price, yield and total return may fluctuate in response to bond market movements. The value of bonds may decline for issuer-related reasons, including management performance, financial leverage and reduced demand for the issuer’s goods and services. Certain types of fixed-income obligations also may be subject to “call and redemption risk,” which is the risk that the issuer may call a bond held by the Fund for redemption before it matures and the Fund may not be able to reinvest at the same level and therefore would earn less income.
Derivatives Risk:Derivatives involve special risks and costs and may result in losses to the Fund. The successful use of derivatives requires sophisticated management, and, to the extent that derivatives are used, the Fund will depend on the subadviser’s ability to analyze and manage derivative transactions. The prices of derivatives may move in unexpected ways, especially in abnormal market conditions. Some derivatives are “leveraged” and therefore may magnify or otherwise increase investment losses to the Fund. Other risks arise
| | | | |
| PGIM International Bond Fund | | | 85 | |
Notes to Financial Statements(continued)
from the potential inability to terminate or sell derivatives positions. A liquid secondary market may not always exist for the Fund’s derivatives positions. In fact, many OTC derivative instruments will not have liquidity beyond the counterparty to the instrument. OTC derivative instruments also involve the risk that the other party will not meet its obligations to the Fund.
Foreign Securities Risk:The Fund’s investments in securities of foreign issuers or issuers with significant exposure to foreign markets involve additional risk. Foreign countries in which the Fund may invest may have markets that are less liquid, less regulated and more volatile than US markets. The value of the Fund’s investments may decline because of factors affecting the particular issuer as well as foreign markets and issuers generally, such as unfavorable government actions, and political or financial instability.
Interest Rate Risk:The value of an investment may go down when interest rates rise. A rise in rates tends to have a greater impact on the prices of longer term or duration securities. When interest rates fall, the issuers of debt obligations may prepay principal more quickly than expected, and the Fund may be required to reinvest the proceeds at a lower interest rate. This is referred to as “prepayment risk.” When interest rates rise, debt obligations may be repaid more slowly than expected, and the value of the Fund’s holdings may fall sharply. This is referred to as “extension risk. The Fund may face a heightened level of interest rate risk as a result of the U.S. Federal Reserve Board’s policies. The Fund’s investments may lose value if short-term or long-term interest rates rise sharply or in a manner not anticipated by the subadviser.
Liquidity Risk:The Fund may invest in instruments that trade in lower volumes and are less liquid than other investments. Liquidity risk exists when particular investments made by the Fund are difficult to purchase or sell. Liquidity risk includes the risk that the Fund may make investments that may become less liquid in response to market developments or adverse investor perceptions. Investments that are illiquid or that trade in lower volumes may be more difficult to value. If the Fund is forced to sell these investments to pay redemption proceeds or for other reasons, the Fund may lose money. In addition, when there is no willing buyer and investments may not reasonably be expected to be sold or disposed of in current market conditions in seven calendar days or less without the sale or disposition significantly changing the market value of the investment, the Fund may incur higher transaction costs when executing trade orders of a given size. The reduction in dealer market-making capacity in the fixed-income markets that has occurred in recent years also has the potential to reduce liquidity. An inability to sell a portfolio position can adversely affect the Fund’s value or prevent the Fund from being able to take advantage of other investment opportunities.
Market and Credit Risk:Securities markets may be volatile and the market prices of the Fund’s securities may decline. Securities fluctuate in price based on changes in an issuer’s financial condition and overall market and economic conditions. If the market prices of the securities owned by the Fund fall, the value of an investment in the Fund will decline. Additionally, the Fund may also be exposed to credit risk in the event that an issuer or guarantor fails to perform or that an institution or entity with which the Fund has unsettled or open transactions defaults.
Non-diversification Risk:Anon-diversified Fund may invest a greater percentage of its assets in the securities of a single company or industry than a diversified fund. Investing in anon-diversified fund involves greater risk than investing in a diversified fund because a loss resulting from the decline in value of any one security may represent a greater portion of the total assets of anon-diversified fund.
9. Recent Accounting Pronouncements and Reporting Updates
In August 2018, the FASB issued Accounting Standards Update (“ASU”)No. 2018-13, which changes certain fair value measurement disclosure requirements. The new ASU, in addition to other modifications and additions, removes the requirement to disclose the amount and reasons for transfers between Level 1 and Level 2 of the fair value hierarchy, and the Fund’s policy for the timing of transfers between levels. The amendments are effective for financial statements issued for fiscal years beginning after December 15, 2019, and interim periods within those fiscal years. The Manager has evaluated the implications of certain provisions of the ASU and has determined to early adopt aspects related to the removal and modification of certain fair value measurement disclosures under the ASU effective immediately. The Manager continues to evaluate certain other provisions of the ASU and does not expect a material impact to financial statement disclosures.
| | | | |
| PGIM International Bond Fund | | | 87 | |
Financial Highlights
| | | | | | | | | | | | | | | | |
| Class A Shares | | | | |
| | | Year Ended
October 31, | | | | | | December 14,
2016(a)
through
October 31, | |
| | | 2019 | | | 2018 | | | | | | 2017 | |
| Per Share Operating Performance(b): | | | | | | | | | | | | | | | | |
| Net Asset Value, Beginning of Period | | | $10.22 | | | | $10.44 | | | | | | | | $10.00 | |
| Income (loss) from investment operations: | | | | | | | | | | | | | | | | |
| Net investment income (loss) | | | 0.14 | | | | 0.12 | | | | | | | | 0.07 | |
| Net realized and unrealized gain (loss) on investment and foreign currency transactions | | | 1.43 | | | | (0.08 | ) | | | | | | | 0.57 | |
| Total from investment operations | | | 1.57 | | | | 0.04 | | | | | | | | 0.64 | |
| Less Dividends and Distributions: | | | | | | | | | | | | | | | | |
| Dividends from net investment income | | | (0.96 | ) | | | (0.26 | ) | | | | | | | - | |
| Tax return of capital distributions | | | - | | | | - | | | | | | | | (0.20 | ) |
| Total dividends and distributions | | | (0.96 | ) | | | (0.26 | ) | | | | | | | (0.20 | ) |
| Net asset value, end of period | | | $10.83 | | | | $10.22 | | | | | | | | $10.44 | |
| Total Return(c): | | | 16.52% | | | | 0.40% | | | | | | | | 6.42% | |
| |
| Ratios/Supplemental Data: | | | | | | | | | | | | |
| Net assets, end of period (000) | | | $267 | | | | $103 | | | | | | | | $91 | |
| Average net assets (000) | | | $163 | | | | $99 | | | | | | | | $38 | |
| Ratios to average net assets(d)(e): | | | | | | | | | | | | | | | | |
| Expenses after waivers and/or expense reimbursement | | | 0.99% | | | | 0.99% | | | | | | | | 0.99% | (f) |
| Expenses before waivers and/or expense reimbursement | | | 9.63% | | | | 17.44% | | | | | | | | 3.39% | (f) |
| Net investment income (loss) | | | 1.35% | | | | 1.14% | | | | | | | | 0.85% | (f) |
| Portfolio turnover rate(g) | | | 49% | | | | 35% | | | | | | | | 66% | |
| (a) | Commencement of operations. |
| (b) | Calculated based on average shares outstanding during the period. |
| (c) | Total return does not consider the effects of sales loads. Total return is calculated assuming a purchase of a share on the first day and a sale on the last day of each period reported and includes reinvestment of dividends and distributions, if any. Total returns may reflect adjustments to conform to generally accepted accounting principles. Total returns for periods less than one full year are not annualized. |
| (d) | Does not include expenses of the underlying funds in which the Fund invests. |
| (e) | Effective November 1, 2017, class specific expenses include transfer agent fees and expenses and registration fees, which are charged to their respective share class. |
| (g) | The Fund’s portfolio turnover rate is calculated in accordance with regulatory requirements, without regard to transactions involving short-term investments and certain derivatives. If such transactions were included, the Fund’s portfolio turnover rate may be higher. |
See Notes to Financial Statements.
| | | | | | | | | | | | | | | | |
| Class C Shares | | | | |
| | | Year Ended
October 31, | | | | | | December 14,
2016(a)
through
October 31, | |
| | | 2019 | | | 2018 | | | | | | 2017 | |
| Per Share Operating Performance(b): | | | | | | | | | | | | | | | | |
| Net Asset Value, Beginning of Period | | | $10.22 | | | | $10.44 | | | | | | | | $10.00 | |
| Income (loss) from investment operations: | | | | | | | | | | | | | | | | |
| Net investment income (loss) | | | 0.03 | | | | 0.04 | | | | | | | | - | |
| Net realized and unrealized gain (loss) on investment and foreign currency transactions | | | 1.46 | | | | (0.07 | ) | | | | | | | 0.57 | |
| Total from investment operations | | | 1.49 | | | | (0.03 | ) | | | | | | | 0.57 | |
| Less Dividends and Distributions: | | | | | | | | | | | | | | | | |
| Dividends from net investment income | | | (0.88 | ) | | | (0.19 | ) | | | | | | | - | |
| Tax return of capital distributions | | | - | | | | - | | | | | | | | (0.13 | ) |
| Total dividends and distributions | | | (0.88 | ) | | | (0.19 | ) | | | | | | | (0.13 | ) |
| Net asset value, end of period | | | $10.83 | | | | $10.22 | | | | | | | | $10.44 | |
| Total Return(c): | | | 15.65% | | | | (0.34)% | | | | | | | | 5.73% | |
| |
| Ratios/Supplemental Data: | | | | | | | | | | | | |
| Net assets, end of period (000) | | | $45 | | | | $16 | | | | | | | | $11 | |
| Average net assets (000) | | | $31 | | | | $13 | | | | | | | | $10 | |
| Ratios to average net assets(d)(e): | | | | | | | | | | | | | | | | |
| Expenses after waivers and/or expense reimbursement | | | 1.74% | | | | 1.74% | | | | | | | | 1.74% | (f) |
| Expenses before waivers and/or expense reimbursement | | | 43.49% | | | | 124.78% | | | | | | | | 3.26% | (f) |
| Net investment income (loss) | | | 0.33% | | | | 0.41% | | | | | | | | 0.06% | (f) |
| Portfolio turnover rate(g) | | | 49% | | | | 35% | | | | | | | | 66% | |
| (a) | Commencement of operations. |
| (b) | Calculated based on average shares outstanding during the period. |
| (c) | Total return does not consider the effects of sales loads. Total return is calculated assuming a purchase of a share on the first day and a sale on the last day of each period reported and includes reinvestment of dividends and distributions, if any. Total returns may reflect adjustments to conform to generally accepted accounting principles. Total returns for periods less than one full year are not annualized. |
| (d) | Does not include expenses of the underlying funds in which the Fund invests. |
| (e) | Effective November 1, 2017, class specific expenses include transfer agent fees and expenses and registration fees, which are charged to their respective share class. |
| (g) | The Fund’s portfolio turnover rate is calculated in accordance with regulatory requirements, without regard to transactions involving short-term investments and certain derivatives. If such transactions were included, the Fund’s portfolio turnover rate may be higher. |
See Notes to Financial Statements.
| | | | |
| PGIM International Bond Fund | | | 89 | |
Financial Highlights(continued)
| | | | | | | | | | | | | | | | |
| Class Z Shares | | | | |
| | | Year Ended
October 31, | | | | | | December 14,
2016(a)
through
October 31, | |
| | | 2019 | | | 2018 | | | | | | 2017 | |
| Per Share Operating Performance(b): | | | | | | | | | | | | | | | | |
| Net Asset Value, Beginning of Period | | | $10.23 | | | | $10.44 | | | | | | | | $10.00 | |
| Income (loss) from investment operations: | | | | | | | | | | | | | | | | |
| Net investment income (loss) | | | 0.14 | | | | 0.15 | | | | | | | | 0.09 | |
| Net realized and unrealized gain (loss) on investment and foreign currency transactions | | | 1.45 | | | | (0.07 | ) | | | | | | | 0.57 | |
| Total from investment operations | | | 1.59 | | | | 0.08 | | | | | | | | 0.66 | |
| Less Dividends and Distributions: | | | | | | | | | | | | | | | | |
| Dividends from net investment income | | | (0.99 | ) | | | (0.29 | ) | | | | | | | - | |
| Tax return of capital distributions | | | - | | | | - | | | | | | | | (0.22 | ) |
| Total dividends and distributions | | | (0.99 | ) | | | (0.29 | ) | | | | | | | (0.22 | ) |
| Net asset value, end of period | | | $ 10.83 | | | | $10.23 | | | | | | | | $10.44 | |
| Total Return(c): | | | 16.80% | | | | 0.75% | | | | | | | | 6.67% | |
| |
| Ratios/Supplemental Data: | |
| Net assets, end of period (000) | | | $3,466 | | | | $160 | | | | | | | | $11 | |
| Average net assets (000) | | | $1,763 | | | | $140 | | | | | | | | $10 | |
| Ratios to average net assets(d)(e): | | | | | | | | | | | | | | | | |
| Expenses after waivers and/or expense reimbursement | | | 0.74% | | | | 0.74% | | | | | | | | 0.74% | (f) |
| Expenses before waivers and/or expense reimbursement | | | 2.16% | | | | 12.47% | | | | | | | | 2.24% | (f) |
| Net investment income (loss) | | | 1.28% | | | | 1.43% | | | | | | | | 1.09% | (f) |
| Portfolio turnover rate(g) | | | 49% | | | | 35% | | | | | | | | 66% | |
| (a) | Commencement of operations. |
| (b) | Calculated based on average shares outstanding during the period. |
| (c) | Total return is calculated assuming a purchase of a share on the first day and a sale on the last day of each period reported and includes reinvestment of dividends and distributions, if any. Total returns may reflect adjustments to conform to generally accepted accounting principles. Total returns for periods less than one full year are not annualized. |
| (d) | Does not include expenses of the underlying funds in which the Fund invests. |
| (e) | Effective November 1, 2017, class specific expenses include transfer agent fees and expenses and registration fees, which are charged to their respective share class. |
| (g) | The Fund’s portfolio turnover rate is calculated in accordance with regulatory requirements, without regard to transactions involving short-term investments and certain derivatives. If such transactions were included, the Fund’s portfolio turnover rate may be higher. |
See Notes to Financial Statements.
| | | | | | | | | | | | | | | | |
| Class R6 Shares | | | | |
| | | Year Ended
October 31, | | | | | | December 14,
2016(a)
through
October 31,
| |
| | | 2019 | | | 2018 | | | 2017 | |
| Per Share Operating Performance(b): | | | | | | | | | | | | | | | | |
| Net Asset Value, Beginning of Period | | | $10.23 | | | | $10.44 | | | | | | | | $10.00 | |
| Income (loss) from investment operations: | | | | | | | | | | | | | | | | |
| Net investment income (loss) | | | 0.18 | | | | 0.14 | | | | | | | | 0.09 | |
| Net realized and unrealized gain (loss) on investment and foreign currency transactions | | | 1.42 | | | | (0.06 | ) | | | | | | | 0.57 | |
| Total from investment operations | | | 1.60 | | | | 0.08 | | | | | | | | 0.66 | |
| Less Dividends and Distributions: | | | | | | | | | | | | | | | | |
| Dividends from net investment income | | | (0.99 | ) | | | (0.29 | ) | | | | | | | - | |
| Tax return of capital distributions | | | - | | | | - | | | | | | | | (0.22 | ) |
| Total dividends and distributions | | | (0.99 | ) | | | (0.29 | ) | | | | | | | (0.22 | ) |
| Net asset value, end of period | | | $10.84 | | | | $10.23 | | | | | | | | $10.44 | |
| Total Return(c): | | | 16.81% | | | | 0.75% | | | | | | | | 6.65% | |
| |
| Ratios/Supplemental Data: | |
| Net assets, end of period (000) | | | $31,421 | | | | $26,850 | | | | | | | | $26,654 | |
| Average net assets (000) | | | $29,104 | | | | $26,854 | | | | | | | | $25,767 | |
| Ratios to average net assets(d)(e): | | | | | | | | | | | | | | | | |
| Expenses after waivers and/or expense reimbursement | | | 0.74% | | | | 0.74% | | | | | | | | 0.74% | (f) |
| Expenses before waivers and/or expense reimbursement | | | 1.40% | | | | 1.55% | | | | | | | | 1.99% | (f) |
| Net investment income (loss) | | | 1.75% | | | | 1.39% | | | | | | | | 1.07% | (f) |
| Portfolio turnover rate(g) | | | 49% | | | | 35% | | | | | | | | 66% | |
| (a) | Commencement of operations. |
| (b) | Calculated based on average shares outstanding during the period. |
| (c) | Total return is calculated assuming a purchase of a share on the first day and a sale on the last day of each period reported and includes reinvestment of dividends and distributions, if any. Total returns may reflect adjustments to conform to generally accepted accounting principles. Total returns for periods less than one full year are not annualized. |
| (d) | Does not include expenses of the underlying funds in which the Fund invests. |
| (e) | Effective November 1, 2017, class specific expenses include transfer agent fees and expenses and registration fees, which are charged to their respective share class. |
| (g) | The Fund’s portfolio turnover rate is calculated in accordance with regulatory requirements, without regard to transactions involving short-term investments and certain derivatives. If such transactions were included, the Fund’s portfolio turnover rate may be higher. |
See Notes to Financial Statements.
| | | | |
| PGIM International Bond Fund | | | 91 | |
Report of Independent Registered Public Accounting Firm
To the Shareholders of PGIM International Bond Fund and Board of Trustees
Prudential Investment Portfolios 9:
Opinion on the Financial Statements
We have audited the accompanying statement of assets and liabilities of PGIM International Bond Fund, a series of Prudential Investment Portfolios 9, (the Fund), including the schedule of investments, as of October 31, 2019, the related statement of operations for the year then ended, the statements of changes in net assets for each of the years in the two-year period ended October 31, 2019, and the related notes (collectively, the financial statements) and the financial highlights for the years or period indicated therein. In our opinion, the financial statements and financial highlights present fairly, in all material respects, the financial position of the Fund as of October 31, 2019, the results of its operations for the year then ended, the changes in its net assets for each of the years in the two-year period ended October 31, 2019, and the financial highlights for the years or period indicated therein, in conformity with U.S. generally accepted accounting principles.
Basis for Opinion
These financial statements and financial highlights are the responsibility of the Fund’s management. Our responsibility is to express an opinion on these financial statements and financial highlights based on our audits. We are a public accounting firm registered with the Public Company Accounting Oversight Board (United States) (PCAOB) and are required to be independent with respect to the Fund in accordance with the U.S. federal securities laws and the applicable rules and regulations of the Securities and Exchange Commission and the PCAOB.
We conducted our audits in accordance with the standards of the PCAOB. Those standards require that we plan and perform the audit to obtain reasonable assurance about whether the financial statements and financial highlights are free of material misstatement, whether due to error or fraud. Our audits included performing procedures to assess the risks of material misstatement of the financial statements and financial highlights, whether due to error or fraud, and performing procedures that respond to those risks. Such procedures included examining, on a test basis, evidence regarding the amounts and disclosures in the financial statements and financial highlights. Such procedures also included confirmation of securities owned as of October 31, 2019, by correspondence with the custodian, transfer agent, and brokers, or by other appropriate auditing procedures when replies were not received. Our audits also included evaluating the accounting principles used and significant estimates made by management, as well as evaluating the overall presentation of the financial statements and financial highlights. We believe that our audits provide a reasonable basis for our opinion.

We have served as the auditor of one or more PGIM and/or Prudential Retail investment companies since 2003.
New York, New York
December 19, 2019
INFORMATION ABOUT BOARD MEMBERS AND OFFICERS(unaudited)
Information about Board Members and Officers of the Fund is set forth below. Board Members who are not deemed to be “interested persons” of the Fund, as defined in the 1940 Act, are referred to as “Independent Board Members.” Board Members who are deemed to be “interested persons” of the Fund are referred to as “Interested Board Members.” The Board Members are responsible for the overall supervision of the operations of the Fund and perform the various duties imposed on the directors of investment companies by the 1940 Act. The Board in turn elects the Officers, who are responsible for administering theday-to-day operations of the Fund.
| | | | | | |
| Independent Board Members | | | | |
| | | | |
Name Date of Birth Position(s) Portfolios Overseen | | Principal Occupation(s) During Past Five Years | | Other Directorships
Held During
Past Five Years | | Length of Board Service |
| | | | |
Ellen S. Alberding 3/11/58 Board Member Portfolios Overseen: 96 | | President and Board Member, The Joyce Foundation (charitable foundation) (since 2002); Vice Chair, City Colleges of Chicago (community college system) (2011-2015); Trustee, National Park Foundation (charitable foundation for national park system) (2009-2018); Trustee, Economic Club of Chicago (since 2009); Trustee, Loyola University (since 2018). | | None. | | Since September 2013 |
| | | | |
Kevin J. Bannon 7/13/52 Board Member Portfolios Overseen: 96 | | Retired; Managing Director (April2008-May 2015) and Chief Investment Officer (October 2008-November 2013) of Highmount Capital LLC (registered investment adviser); formerly Executive Vice President and Chief Investment Officer (April 1993-August 2007) of Bank of New York Company; President (May2003-May 2007) of BNY Hamilton Family of Mutual Funds. | | Director of Urstadt Biddle Properties (equity real estate investment trust) (since September 2008). | | Since July 2008 |
PGIM International Bond Fund
| | | | | | |
| Independent Board Members | | | | |
| | | | |
Name Date of Birth Position(s) Portfolios Overseen | | Principal Occupation(s) During Past Five Years | | Other Directorships
Held During Past Five Years | | Length of
Board Service |
| | | | |
Linda W. Bynoe 7/9/52 Board Member Portfolios Overseen: 96 | | President and Chief Executive Officer (since March 1995) and formerly Chief Operating Officer (December 1989-February 1995) of Telemat Ltd. (management consulting); formerly Vice President (January 1985-June 1989) at Morgan Stanley & Co. (broker-dealer). | | Director of Anixter International, Inc. (communication products distributor) (since January 2006); Director of Northern Trust Corporation (financial services) (since April 2006); Trustee of Equity Residential (residential real estate) (since December 2009). | | Since March 2005 |
| | | | |
Barry H. Evans 11/2/60 Board Member Portfolios Overseen: 95 | | Retired; formerly President (2005 – 2016), Global Chief Operating Officer (2014– 2016), Chief Investment Officer – Global Head of Fixed Income (1998-2014), and various portfolio manager roles (1986-2006), Manulife Asset Management U.S. | | Formerly Director, Manulife Trust Company (2011-2018); formerly Director, Manulife Asset Management Limited (2015-2017); formerly Chairman of the Board of Directors of Manulife Asset Management U.S. (2005-2016); formerly Chairman of the Board, Declaration Investment Management and Research (2008-2016). | | Since September 2017 |
| | | | |
Keith F. Hartstein 10/13/56 Board Member & Independent Chair Portfolios Overseen: 96 | | Retired; Member (since November 2014) of the Governing Council of the Independent Directors Council (organization of independent mutual fund directors); formerly President and Chief Executive Officer (2005-2012), Senior Vice President (2004-2005), Senior Vice President of Sales and Marketing (1997-2004), and various executive management positions (1990-1997), John Hancock Funds, LLC (asset management); Chairman, Investment Company Institute’s Sales Force Marketing Committee (2003-2008). | | None. | | Since September 2013 |
Visit our website at pgiminvestments.com
| | | | | | |
| Independent Board Members | | | | |
| | | | |
Name Date of Birth Position(s) Portfolios Overseen | | Principal Occupation(s) During Past Five Years | | Other Directorships Held During Past Five Years | | Length of Board Service |
| | | | |
Laurie Simon Hodrick 9/29/62 Board Member Portfolios Overseen: 95 | | A. Barton Hepburn Professor Emerita of Economics in the Faculty of Business, Columbia Business School (since 2018); Visiting Professor of Law, Stanford Law School (since 2015); Visiting Fellow at the Hoover Institution, Stanford University (since 2015); Sole Member, ReidCourt LLC (since 2008) (a consulting firm); formerly A. Barton Hepburn Professor of Economics in the Faculty of Business, Columbia Business School (1996-2017); formerly Managing Director, Global Head of Alternative Investment Strategies, Deutsche Bank (2006-2008). | | Independent Director, Synnex Corporation (since April 2019) (information technology); Independent Director, Kabbage, Inc. (since July 2018) (financial services); Independent Director, Corporate Capital Trust (2017-2018) (a business development company). | | Since September 2017 |
| | | | |
Michael S. Hyland, CFA 10/4/45 Board Member Portfolios Overseen: 96 | | Retired (since February 2005); formerly Senior Managing Director (July 2001-February 2005) of Bear Stearns & Co, Inc.; Global Partner, INVESCO (1999-2001); Managing Director and President of Salomon Brothers Asset Management (1989-1999). | | None. | | Since July 2008 |
| | | | |
Brian K. Reid 9/22/61 Board Member Portfolios Overseen: 95 | | Retired; formerly Chief Economist for the Investment Company Institute (ICI) (2005-2017); formerly Senior Economist and Director of Industry and Financial Analysis at the ICI (1998-2004); formerly Senior Economist, Industry and Financial Analysis at the ICI (1996-1998); formerly Staff Economist at the Federal Reserve Board (1989-1996); Director, ICI Mutual Insurance Company (2012-2017). | | None. | | Since March 2018 |
PGIM International Bond Fund
| | | | | | |
Independent Board Members | | | | |
| | | | |
Name Date of Birth Position(s) Portfolios Overseen | | Principal Occupation(s) During Past Five Years | | Other Directorships Held During Past Five Years | | Length of Board Service |
| | | | |
Grace C. Torres 6/28/59 Board Member Portfolios Overseen: 95 | | Retired; formerly Treasurer and Principal Financial and Accounting Officer of the PGIM Funds, Target Funds, Advanced Series Trust, Prudential Variable Contract Accounts and The Prudential Series Fund (1998-June 2014); Assistant Treasurer (March 1999-June 2014) and Senior Vice President (September 1999-June 2014) of PGIM Investments LLC; Assistant Treasurer (May 2003-June 2014) and Vice President (June 2005-June 2014) of AST Investment Services, Inc.; Senior Vice President and Assistant Treasurer (May 2003-June 2014) of Prudential Annuities Advisory Services, Inc. | | Formerly Director (July 2015-January 2018) of Sun Bancorp, Inc. N.A. and Sun National Bank; Director (since January 2018) of OceanFirst Financial Corp. and OceanFirst Bank. | | Since November 2014 |
| | | | | | |
Interested Board Members | | | | |
| | | | |
Name Date of Birth Position(s) Portfolios Overseen | | Principal Occupation(s) During Past Five Years | | Other Directorships Held During Past Five Years | | Length of Board Service |
| | | | |
Stuart S. Parker 10/5/62 Board Member & President Portfolios Overseen: 96 | | President of PGIM Investments LLC (formerly known as Prudential Investments LLC) (since January 2012); Executive Vice President of Prudential Investment Management Services LLC (since December 2012); formerly Executive Vice President of Jennison Associates LLC and Head of Retail Distribution of PGIM Investments LLC (June 2005-December 2011). | | None. | | Since January 2012 |
Visit our website at pgiminvestments.com
| | | | | | |
Interested Board Members | | | | |
| | | | |
Name Date of Birth Position(s) Portfolios Overseen | | Principal Occupation(s) During Past Five Years | | Other Directorships Held During Past Five Years | | Length of
Board Service |
| | | | |
Scott E. Benjamin 5/21/73 Board Member & Vice President Portfolios Overseen:96 | | Executive Vice President (since June 2009) of PGIM Investments LLC; Executive Vice President (June 2009-June 2012) and Vice President (since June 2012) of Prudential Investment Management Services LLC; Executive Vice President (since September 2009) of AST Investment Services, Inc.; Senior Vice President of Product Development and Marketing, PGIM Investments (since February 2006); formerly Vice President of Product Development and Product Management, PGIM Investments LLC (2003-2006). | | None. | | Since March 2010 |
| | | | |
| Fund Officers(a) | | | | |
| | | |
Name Date of Birth Fund Position | | Principal Occupation(s) During Past Five Years | | Length of
Service as Fund Officer |
| | | |
Raymond A. O’Hara 9/11/55 Chief Legal Officer | | Vice President and Corporate Counsel (since July 2010) of Prudential Insurance Company of America (Prudential); Vice President (March 2011-Present) of Pruco Life Insurance Company and Pruco Life Insurance Company of New Jersey; Vice President and Corporate Counsel (March 2011-Present) of Prudential Annuities Life Assurance Corporation; Chief Legal Officer of PGIM Investments LLC (since June 2012); Chief Legal Officer of Prudential Mutual Fund Services LLC (since June 2012) and Corporate Counsel of AST Investment Services, Inc. (since June 2012); formerly Assistant Vice President and Corporate Counsel (September 2008-July 2010) of The Hartford Financial Services Group, Inc.; formerly Associate (September 1980-December 1987) and Partner (January 1988–August 2008) of Blazzard & Hasenauer, P.C. (formerly, Blazzard, Grodd & Hasenauer, P.C.). | | Since June 2012 |
PGIM International Bond Fund
| | | | |
| Fund Officers(a) | | | | |
| | | |
Name Date of Birth Fund Position | | Principal Occupation(s) During Past Five Years | | Length of Service as Fund Officer |
| | | |
Dino Capasso 8/19/74 Chief Compliance Officer | | Chief Compliance Officer (July 2019-Present) of PGIM Investments LLC; Chief Compliance Officer (July 2019-Present) of the PGIM Funds, Target Funds, Advanced Series Trust, The Prudential Series Fund, Prudential’s Gibraltar Fund, Inc., PGIM Global High Yield Fund, Inc., and PGIM High Yield Bond Fund, Inc.; Vice President and Deputy Chief Compliance Officer (June 2017-2019) of PGIM Investments LLC; formerly, Senior Vice President and Senior Counsel (January 2016-June 2017), and Vice President and Counsel (February 2012-December 2015) of Pacific Investment Management Company LLC. | | Since March 2018 |
| | | |
Andrew R. French 12/22/62 Secretary | | Vice President of PGIM Investments LLC (December 2018-Present); formerly Vice President and Corporate Counsel (February 2010-December 2018) of Prudential; formerly Director and Corporate Counsel (2006-2010) of Prudential; Vice President and Assistant Secretary (since January 2007) of PGIM Investments LLC; Vice President and Assistant Secretary (since January 2007) of Prudential Mutual Fund Services LLC. | | Since October 2006 |
| | | |
Jonathan D. Shain 8/9/58 Assistant Secretary | | Vice President and Corporate Counsel (since August 1998) of Prudential; Vice President and Assistant Secretary (since May 2001) of PGIM Investments LLC; Vice President and Assistant Secretary (since February 2001) of Prudential Mutual Fund Services LLC; formerly Vice President and Assistant Secretary (May 2003-June 2005) of AST Investment Services, Inc. | | Since May 2005 |
| | | |
Claudia DiGiacomo 10/14/74 Assistant Secretary | | Vice President and Corporate Counsel (since January 2005) of Prudential; Vice President and Assistant Secretary of PGIM Investments LLC (since December 2005); formerly Associate at Sidley Austin Brown & Wood LLP (1999-2004). | | Since December 2005 |
| | | |
Diana N. Huffman 4/14/82 Assistant Secretary | | Vice President and Corporate Counsel (since September 2015) of Prudential; formerly Associate at Willkie Farr & Gallagher LLP (2009-2015). | | Since March 2019 |
| | | |
Kelly A. Coyne 8/8/68 Assistant Secretary | | Director, Investment Operations of Prudential Mutual Fund Services LLC (since 2010). | | Since March 2015 |
| | | |
Christian J. Kelly 5/5/75 Treasurer and Principal Financial and Accounting Officer | | Vice President, Head of Fund Administration of PGIM Investments LLC (since November 2018); formerly, Director of Fund Administration of Lord Abbett & Co. LLC (2009-2018), Treasurer and Principal Accounting Officer of the Lord Abbett Family of Funds (2017-2018); Director of Accounting, Avenue Capital Group (2008-2009); Senior Manager, Investment Management Practice of Deloitte & Touche LLP (1998-2007). | | Since January 2019 |
Visit our website at pgiminvestments.com
| | | | |
| Fund Officers(a) | | | | |
| | | |
Name Date of Birth Fund Position | | Principal Occupation(s) During Past Five Years | | Length of Service as Fund Officer |
| | | |
Lana Lomuti 6/7/67 Assistant Treasurer | | Vice President (since 2007) and Director (2005-2007), within PGIM Investments Fund Administration; formerly Assistant Treasurer (December 2007-February 2014) of The Greater China Fund, Inc. | | Since April 2014 |
| | | |
Russ Shupak 10/08/73 Assistant Treasurer | | Vice President (since 2017) and Director (2013-2017), within PGIM Investments Fund Administration. | | Since October 2019 |
| | | |
Deborah Conway 3/26/69 Assistant Treasurer | | Vice President (since 2017) and Director (2007-2017), within PGIM Investments Fund Administration. | | Since October 2019 |
| | | |
Elyse M. McLaughlin 1/20/74 Assistant Treasurer | | Vice President (since 2017) and Director (2011-2017), within PGIM Investments Fund Administration. | | Since October 2019 |
| | | |
Charles H. Smith 1/11/73 Anti-Money Laundering Compliance Officer | | Vice President, Corporate Compliance, Anti-Money Laundering Unit (since January 2015) of Prudential; committee member of the American Council of Life Insurers Anti-Money Laundering and Critical Infrastructure Committee (since January 2016); formerly Global Head of Economic Sanctions Compliance at AIG Property Casualty (February 2007-December 2014); Assistant Attorney General at the New York State Attorney General’s Office, Division of Public Advocacy. (August 1998-January 2007). | | Since January 2017 |
(a) Excludes Mr. Parker and Mr. Benjamin, interested Board Members who also serve as President and Vice President, respectively.
Explanatory Notes to Tables:
| ∎ | | Board Members are deemed to be “Interested,” as defined in the 1940 Act, by reason of their affiliation with PGIM Investments LLC and/or an affiliate of PGIM Investments LLC. |
| ∎ | | Unless otherwise noted, the address of all Board Members and Officers is c/o PGIM Investments LLC, 655 Broad Street, Newark, New Jersey 07102-4410. |
| ∎ | | There is no set term of office for Board Members or Officers. The Board Members have adopted a retirement policy, which calls for the retirement of Board Members on December 31 of the year in which they reach the age of 75. |
| ∎ | | “Other Directorships Held” includes only directorships of companies required to register or file reports with the SEC under the 1934 Act (that is, “public companies”) or other investment companies registered under the 1940 Act. |
| ∎ | | “Portfolios Overseen” includes all investment companies managed by PGIM Investments LLC. The investment companies for which PGIM Investments LLC serves as manager include the PGIM Funds, The Prudential Variable Contract Accounts, PGIM ETF Trust, PGIM High Yield Bond Fund, Inc., PGIM Global High Yield Fund, Inc., The Prudential Series Fund, Prudential’s Gibraltar Fund, Inc. and the Advanced Series Trust. |
PGIM International Bond Fund
Approval of Advisory Agreements(unaudited)
The Fund’s Board of Trustees
The Board of Trustees (the “Board”) of PGIM International Bond Fund (the “Fund”)1 consists of eleven individuals, nine of whom are not “interested persons” of the Fund, as defined in the Investment Company Act of 1940, as amended (the “1940 Act”) (the “Independent Trustees”).2 The Board is responsible for the oversight of the Fund and its operations, and performs the various duties imposed on the directors of investment companies by the 1940 Act. The Independent Trustees have retained independent legal counsel to assist them in connection with their duties. The Chair of the Board is an Independent Trustee. The Board has established four standing committees: the Audit Committee, the Nominating and Governance Committee, and two Investment Committees. Each committee is chaired by, and composed of, Independent Trustees.
Annual Approval of the Fund’s Advisory Agreements
As required under the 1940 Act, the Board determines annually whether to renew the Fund’s management agreement with PGIM Investments LLC (“PGIM Investments”) and the Fund’s subadvisory agreements with each of PGIM, Inc. (“PGIM”) on behalf of its PGIM Fixed Income unit and PGIM Limited (“PGIML”). In considering the renewal of the agreements, the Board, including all of the Independent Trustees, met on May 30, 2019 and on June11-13, 2019 and approved the renewal of the agreements through July 31, 2020, after concluding that the renewal of the agreements was in the best interests of the Fund and its shareholders.
In advance of the meetings, the Board requested and received materials relating to the agreements, and had the opportunity to ask questions and request further information in connection with its consideration. Among other things, the Board considered comparative fee information from PGIM Investments, PGIM and PGIML. Also, the Board considered comparisons with other mutual funds in relevant Peer Universes and Peer Groups, as is further discussed below.
In approving the agreements, the Board, including the Independent Trustees advised by independent legal counsel, considered the factors it deemed relevant, including the nature, quality and extent of services provided by PGIM Investments and the subadvisers, the performance of the Fund, the profitability of PGIM Investments and its affiliates, expenses and fees, and the potential for economies of scale that may be shared with the Fund and its shareholders as the Fund’s assets grow. In their deliberations, the Trustees did not identify any single factor which alone was responsible for the Board’s decision to approve the agreements with respect to the Fund. In connection with its deliberations, the Board considered information
| 1 | PGIM International Bond Fund is a series of Prudential Investment Portfolios 9. |
| 2 | Grace C. Torres was an Interested Trustee of the Fund at the time the Board considered and approved the renewal of the Fund’s advisory agreements, but has since become an Independent Trustee of the Fund. |
| | |
| PGIM International Bond Fund |
Approval of Advisory Agreements(continued)
provided by PGIM Investments throughout the year at regular Board meetings, presentations from portfolio managers and other information, as well as information furnished at or in advance of the meetings on May 30, 2019 and on June11-13, 2019.
The Trustees determined that the overall arrangements between the Fund and PGIM Investments, which serves as the Fund’s investment manager pursuant to a management agreement, and between each of PGIM Investments and PGIM, which, through its PGIM Fixed Income unit, and PGIML, which serve as the Fund’s subadvisers pursuant to the terms of subadvisory agreements with PGIM Investments, are in the best interests of the Fund and its shareholders in light of the services performed, fees charged and such other matters as the Trustees considered relevant in the exercise of their business judgment.
The material factors and conclusions that formed the basis for the Trustees’ reaching their determinations to approve the continuance of the agreements are separately discussed below.
Nature, Quality and Extent of Services
The Board received and considered information regarding the nature, quality and extent of services provided to the Fund by PGIM Investments, PGIM Fixed Income, and PGIML. The Board noted that PGIM Fixed Income and PGIML are affiliated with PGIM Investments. The Board considered the services provided by PGIM Investments, including but not limited to the oversight of the subadvisers for the Fund, as well as the provision of fund recordkeeping, compliance and other services to the Fund, and PGIM Investments’ role as administrator for the Fund’s liquidity risk management program. With respect to PGIM Investments’ oversight of the subadvisers, the Board noted that PGIM Investments’ Strategic Investment Research Group (“SIRG”), which is a business unit of PGIM Investments, is responsible for monitoring and reporting to PGIM Investments senior management on the performance and operations of the subadvisers. The Board also considered that PGIM Investments pays the salaries of all of the officers and interested Trustees of the Fund who are part of Fund management. The Board also considered the investment subadvisory services provided by PGIM Fixed Income and PGIML, including investment research and security selection, as well as adherence to the Fund’s investment restrictions and compliance with applicable Fund policies and procedures. The Board considered PGIM Investments’ evaluation of the subadvisers, as well as PGIM Investments’ recommendation, based on its review of the subadvisers, to renew the subadvisory agreements.
The Board considered the qualifications, backgrounds and responsibilities of PGIM Investments’ senior management responsible for the oversight of the Fund, PGIM Fixed Income, and PGIML, and also considered the qualifications, backgrounds and responsibilities of PGIM Fixed Income’s portfolio managers who are responsible for theday-to-day management of the Fund’s portfolio. The Board was provided with information pertaining to PGIM Investments’, PGIM Fixed Income’s, and PGIML’s organizational
| | |
| Visit our website at pgiminvestments.com | | |
structure, senior management, investment operations, and other relevant information pertaining to PGIM Investments, PGIM Fixed Income, and PGIML. The Board also noted that it received favorable compliance reports from the Fund’s Chief Compliance Officer (“CCO”) as to PGIM Investments, PGIM Fixed Income, and PGIML.
The Board concluded that it was satisfied with the nature, extent and quality of the investment management services provided by PGIM Investments, the subadvisory services provided to the Fund by PGIM Fixed Income and PGIML, and that there was a reasonable basis on which to conclude that the Fund benefits from the services provided by PGIM Investments, PGIM Fixed Income, and PGIML under the management and subadvisory agreements.
Costs of Services and Profits Realized by PGIM Investments
The Board was provided with information on the profitability of PGIM Investments and its affiliates in serving as the Fund’s investment manager. The Board discussed with PGIM Investments the methodology utilized in assembling the information regarding profitability and considered its reasonableness. The Board recognized that it is difficult to make comparisons of profitability from fund management contracts because comparative information is not generally publicly available and is affected by numerous factors, including the structure of the particular adviser, the types of funds it manages, its business mix, numerous assumptions regarding allocations and the adviser’s capital structure and cost of capital. Taking these factors into account, the Board concluded that the profitability of PGIM Investments and its affiliates in relation to the services rendered was not unreasonable.
Economies of Scale
The Board received and discussed information concerning economies of scale that PGIM Investments may realize as the Fund’s assets grow beyond current levels. The Board noted that the management fee schedule for the Fund includes breakpoints, which have the effect of decreasing the fee rate as assets increase. During the course of time, the Board has considered information regarding the launch date of the Fund, the management fees of the Fund compared to those of similarly managed funds and PGIM Investments’ investment in the Fund over time. The Board noted that economies of scale can be shared with the Fund in other ways, including low management fees from inception, additional technological and personnel investments to enhance shareholder services, and maintaining existing expense structures in the face of a rising cost environment. The Board also considered PGIM Investments’ assertion that it continually evaluates the management fee schedule of the Fund and the potential to share economies of scale through breakpoints or fee waivers as asset levels increase.
The Board recognized the inherent limitations of any analysis of economies of scale, stemming largely from the Board’s understanding that most of PGIM Investments’ costs are not specific to individual funds, but rather are incurred across a variety of products and services.
| | |
| PGIM International Bond Fund |
Approval of Advisory Agreements(continued)
Other Benefits to PGIM Investments, PGIM Fixed Income, and PGIML
The Board considered potential ancillary benefits that might be received by PGIM Investments, PGIM Fixed Income, PGIML and their affiliates as a result of their relationship with the Fund. The Board concluded that potential benefits to be derived by PGIM Investments included transfer agency fees received by the Fund’s transfer agent (which is affiliated with PGIM Investments), as well as benefits to its reputation or other intangible benefits resulting from PGIM Investments’ association with the Fund. The Board concluded that the potential benefits to be derived by PGIM Fixed Income and PGIML included the ability to use soft dollar credits, as well as the potential benefits consistent with those generally resulting from an increase in assets under management, specifically, potential access to additional research resources and benefits to their reputations. The Board concluded that the benefits derived by PGIM Investments, PGIM Fixed Income, and PGIML were consistent with the types of benefits generally derived by investment managers and subadvisers to mutual funds.
Performance of the Fund / Fees and Expenses
The Board considered certain additional factors and made related conclusions relating to the historical performance of the Fund for theone-year period ended December 31, 2018. The Board considered that the Fund commenced operations on December 14, 2016 and that longer-term performance was not yet available.
The Board also considered the Fund’s actual management fee, as well as the Fund’s net total expense ratio, for the fiscal year ended October 31, 2018. The Board considered the management fee for the Fund as compared to the management fee charged by PGIM Investments to other funds and the fee charged by other advisers to comparable mutual funds in a Peer Group. The actual management fee represents the fee rate actually paid by Fund shareholders and includes any fee waivers or reimbursements. The net total expense ratio for the Fund represents the actual expense ratio incurred by Fund shareholders.
The mutual funds included in the Peer Universe, which was used to consider performance, and the Peer Group, which was used to consider expenses and fees, were objectively determined by Broadridge, an independent provider of mutual fund data. In certain circumstances, PGIM Investments also provided supplemental Peer Universe or Peer Group information, for reasons addressed with the Board. The comparisons placed the Fund in various quartiles over various periods, with the first quartile being the best 25% of the mutual funds (for performance, the best performing mutual funds and, for expenses, the lowest cost mutual funds).
The section below summarizes key factors considered by the Board and the Board’s conclusions regarding the Fund’s performance, fees and overall expenses. The table sets forth net performance comparisons (which reflect the impact on performance of fund
| | |
| Visit our website at pgiminvestments.com | | |
expenses, or any subsidies, expense caps or waivers that may be applicable) with the Peer Universe, actual management fees with the Peer Group (which reflect the impact of any subsidies or fee waivers), and net total expenses with the Peer Group, each of which were key factors considered by the Board.
| | | | | | | | |
| Net Performance | | 1 Year | | 3 Years | | 5 Years | | 10 Years |
| | | 1st Quartile | | N/A | | N/A | | N/A |
| Actual Management Fees: 1st Quartile |
| Net Total Expenses: 1st Quartile |
| | • | | The Board noted that the Fund underperformed its benchmark index over theone-year period. |
| | • | | The Board noted that the Fund does not yet have a three-year performance record and that, therefore, the subadviser should have more time to develop that record. |
| | • | | The Board and PGIM Investments agreed to retain the existing contractual expense cap which (exclusive of certain fees and expenses) caps total annual operating expenses at 0.99% for Class A shares, 1.74% for Class C shares, 0.74% for Class R6 shares, and 0.74% for Class Z shares through February 29, 2020. |
| | • | | In addition, PGIM Investments will waive management fees or shared operating expenses on any share class to the same extent that it waives such expenses on any other share class, and has agreed that total annual fund operating expenses for Class R6 shares will not exceed total annual fund operating expenses for Class Z shares. |
| | • | | The Board concluded that in light of the above, it would be in the best interests of the Fund and its shareholders to continue to allow the Fund to create a longer-term performance record, and to renew the agreements. |
| | • | | The Board concluded that the management fees (including subadvisory fees) and total expenses were reasonable in light of the services provided. |
* * *
After full consideration of these factors, the Board concluded that the approval of the agreements was in the best interests of the Fund and its shareholders.
| | |
| PGIM International Bond Fund |
| | | | |
| | |
| ∎ MAIL | | ∎ TELEPHONE | | ∎ WEBSITE |
655 Broad Street
Newark, NJ 07102 | | (800) 225-1852 | | pgiminvestments.com |
|
| PROXY VOTING |
| The Board of Trustees of the Fund has delegated to the Fund’s subadviser the responsibility for voting any proxies and maintaining proxy recordkeeping with respect to the Fund. A description of these proxy voting policies and procedures is available without charge, upon request, by calling (800) 225-1852. Information regarding how the Fund voted proxies relating to portfolio securities during the most recent 12-month period ended June 30 is available on the Fund’s website and on the Securities and Exchange Commission’s website. |
|
| TRUSTEES |
| Ellen S. Alberding• Kevin J. Bannon• Scott E. Benjamin• Linda W. Bynoe• Barry H. Evans • Keith F. Hartstein • Laurie Simon Hodrick• Michael S. Hyland• Stuart S. Parker• Brian K. Reid • Grace C. Torres |
|
| OFFICERS |
Stuart S. Parker,President• Scott E. Benjamin,Vice President• Christian J. Kelly,Treasurer and Principal Financial and Accounting Officer• Raymond A. O’Hara,Chief Legal Officer• Dino Capasso,Chief Compliance Officer• Charles H. Smith,Anti-Money Laundering Compliance Officer• Andrew R. French,Secretary• Jonathan D. Shain,Assistant Secretary• Claudia DiGiacomo, Assistant Secretary• Diana N. Huffman,Assistant Secretary• Kelly A. Coyne,Assistant Secretary• Lana Lomuti,Assistant Treasurer• Russ Shupak,Assistant Treasurer• Elyse McLaughlin,Assistant Treasurer• Deborah Conway,Assistant Treasurer |
| | | | |
| MANAGER | | PGIM Investments LLC | | 655 Broad Street
Newark, NJ 07102 |
|
| SUBADVISER | | PGIM Fixed Income | | 655 Broad Street
Newark, NJ 07102 |
|
| DISTRIBUTOR | | Prudential Investment
Management Services LLC | | 655 Broad Street
Newark, NJ 07102 |
|
| CUSTODIAN | | The Bank of New York Mellon | | 240 Greenwich Street
New York, NY 10286 |
|
| TRANSFER AGENT | | Prudential Mutual Fund
Services LLC | | PO Box 9658
Providence, RI 02940 |
|
INDEPENDENT REGISTERED
PUBLIC ACCOUNTING FIRM | | KPMG LLP | | 345 Park Avenue
New York, NY 10154 |
|
| FUND COUNSEL | | Willkie Farr & Gallagher LLP | | 787 Seventh Avenue
New York, NY 10019 |
|
|
| An investor should consider the investment objectives, risks, charges, and expenses of the Fund carefully before investing. The prospectus and summary prospectus contain this and other information about the Fund. An investor may obtain the prospectus and summary prospectus by visiting our website atpgiminvestments.com or by calling(800) 225-1852. The prospectus and summary prospectus should be read carefully before investing. |
|
| E-DELIVERY |
| To receive your mutual fund documents online, go topgiminvestments.com/edelivery and enroll. Instead of receiving printed documents by mail, you will receive notification via email when new materials are available. You can cancel your enrollment or change your email address at any time by visiting the website address above. |
|
| SHAREHOLDER COMMUNICATIONS WITH TRUSTEES |
| Shareholders can communicate directly with the Board of Trustees by writing to the Chair of the Board, PGIM International Bond Fund, PGIM Investments, Attn: Board of Trustees, 655 Broad Street, Newark, NJ 07102. Shareholders can communicate directly with an individual Trustee by writing to the same address. Communications are not screened before being delivered to the addressee. |
|
| AVAILABILITY OF PORTFOLIO HOLDINGS |
The Fund files its complete schedule of portfolio holdings with the Securities and Exchange Commission on Form N-PORT. The Fund’s Form N-PORT filings are available on the Commission’s website at sec.gov. Form N-PORT is filed with the Commission quarterly, and each Fund’s full portfolio holdings as of the first and third fiscal quarter-ends (as of the third month of the Fund’s fiscal quarter for reporting periods on or after September 30, 2019) will be made publicly available 60 days after the end of each quarter at sec.gov. |
|
| The Fund’s Statement of Additional Information contains additional information about the Fund’s Trustees and is available without charge, upon request, by calling (800) 225-1852. |
Mutual Funds:
| | | | |
ARE NOT INSURED BY THE FDIC OR ANY
FEDERAL GOVERNMENT AGENCY | | MAY LOSE VALUE | | ARE NOT A DEPOSIT OF OR GUARANTEED
BY ANY BANK OR ANY BANK AFFILIATE |
PGIM INTERNATIONAL BOND FUND
| | | | | | | | |
| SHARE CLASS | | A | | C | | Z | | R6 |
| NASDAQ | | PXBAX | | PXBCX | | PXBZX | | PXBQX |
| CUSIP | | 74441J738 | | 74441J720 | | 74441J696 | | 74441J712 |
MF234E
Item 2 – Code of Ethics — See Exhibit (a)
As of the end of the period covered by this report, the registrant has adopted a code of ethics (the “Section 406 Standards for Investment Companies – Ethical Standards for Principal Executive and Financial Officers”) that applies to the registrant’s Principal Executive Officer and Principal Financial Officer; the registrant’s Principal Financial Officer also serves as the Principal Accounting Officer.
The registrant hereby undertakes to provide any person, without charge, upon request, a copy of the code of ethics. To request a copy of the code of ethics, contact the registrant800-225-1852, and ask for a copy of the Section 406 Standards for Investment Companies - Ethical Standards for Principal Executive and Financial Officers.
Item 3 – Audit Committee Financial Expert –
The registrant’s Board has determined that Mr. Kevin J. Bannon, member of the Board’s Audit Committee is an “audit committee financial expert,” and that he is “independent,” for purposes of this Item.
Item 4 – Principal Accountant Fees and Services – (a) Audit Fees
For the fiscal years ended October 31, 2019 and October 31, 2018, KPMG LLP (“KPMG”), the Registrant’s principal accountant, billed the Registrant $208,621 and $206,556 respectively, for professional services rendered for the audit of the Registrant’s annual financial statements or services that are normally provided in connection with statutory and regulatory filings.
(b) Audit-Related Fees
For the fiscal year ended October 31, 2019, fees of $7,090 were billed to the Registrant for services rendered by KPMG in connection with an accounting system conversion and were paid by The Bank of New York Mellon. For the fiscal year ended October 31, 2018, there are no fees to report.
(c)Tax Fees
For the fiscal years ended October 31, 2019 and October 31, 2018: none.
(d)All Other Fees
For the fiscal years ended October 31, 2019 and October 31, 2018: none.
(e) (1)Audit CommitteePre-Approval Policies and Procedures
THE PGIM MUTUAL FUNDS
AUDIT COMMITTEE POLICY
on
Pre-Approval of Services Provided by the Independent Accountants
The Audit Committee of each PGIM Mutual Fund is charged with the responsibility to monitor the independence of the Fund’s independent accountants. As part of this responsibility, the Audit Committee mustpre-approve the independent accounting firm’s engagement to render audit and/or permissiblenon-audit services, as required by law. In evaluating a proposed engagement of the independent accountants, the Audit Committee will assess the effect that the engagement might reasonably be expected to have on the accountant’s independence. The Committee’s evaluation will be based on:
| | • | | a review of the nature of the professional services expected to be provided, |
| | • | | a review of the safeguards put into place by the accounting firm to safeguard independence, and |
| | • | | periodic meetings with the accounting firm. |
Policy for Audit andNon-Audit Services Provided to the Funds
On an annual basis, the scope of audits for each Fund, audit fees and expenses, and audit-related andnon-audit services (and fees proposed in respect thereof) proposed to be performed by the Fund’s independent accountants will be presented by the Treasurer and the independent accountants to the Audit Committee for review and, as appropriate, approval prior to the initiation of such services.
Such presentation shall be accompanied by confirmation by both the Treasurer and the independent accountants that the proposednon-audit services will not adversely affect the independence of the independent accountants. Such proposednon-audit services shall be described in sufficient detail to enable the Audit Committee to assess the appropriateness of such services and fees, and the compatibility of the provision of such services with the auditor’s independence. The Committee shall receive periodic reports on the progress of the audit and other services which are approved by the Committee or by the Committee Chair pursuant to authority delegated in this Policy.
The categories of services enumerated under “Audit Services”, “Audit-related Services”, and “Tax Services” are intended to provide guidance to the Treasurer and the independent accountants as to those categories of services which the Committee believes are generally consistent with the independence of the independent accountants and which the Committee (or the Committee Chair) would expect upon the presentation of specific proposals topre-approve. The enumerated categories are not intended as an exclusive list of audit, audit-related or tax services, which the Committee (or the Committee Chair) would consider forpre-approval.
Audit Services
The following categories of audit services are considered to be consistent with the role of the Fund’s independent accountants:
| | • | | Annual Fund financial statement audits |
| | • | | Seed audits (related to new product filings, as required) |
| | • | | SEC and regulatory filings and consents |
Audit-related Services
The following categories of audit-related services are considered to be consistent with the role of the Fund’s independent accountants:
| | • | | Accounting consultations |
| | • | | Fund merger support services |
| | • | | Agreed Upon Procedure Reports |
| | • | | Other Internal Control Reports |
Individual audit-related services that fall within one of these categories (except for fund merger support services) and are not presented to the Audit Committee as part of the annualpre-approval process are subject to an authorizedpre-approval by the Audit Committee so long as the estimated fee for those services does not exceed $30,000. Any services provided under suchpre-approval will be reported to the Audit Committee at its next regular meeting. Should the amount of such services exceed $30,000 any additional fees will be subject topre-approval by the Committee Chair (or any other Committee member on whom this responsibility has been delegated). Fees related to fund merger support services are subject to a separate authorizedpre-approval by the Audit Committee with fees determined on a per occurrence and merger complexity basis.
Tax Services
The following categories of tax services are considered to be consistent with the role of the Fund’s independent accountants:
| | • | | Tax compliance services related to the filing or amendment of the following: |
| | • | | Federal, state and local income tax compliance; and, |
| | • | | Sales and use tax compliance |
| | • | | Timely RIC qualification reviews |
| | • | | Tax distribution analysis and planning |
| | • | | Tax authority examination services |
| | • | | Tax appeals support services |
| | • | | Accounting methods studies |
| | • | | Fund merger support services |
| | • | | Tax consulting services and related projects |
Individual tax services that fall within one of these categories and are not presented to the Audit Committee as part of the annualpre-approval process are subject to an authorizedpre-approval by the Audit Committee so long as the estimated fee for those services does not exceed $30,000. Any services provided under suchpre-approval will be reported to the Audit Committee at its next regular meeting. Should the amount of such services exceed $30,000 any additional fees will be subject topre-approval by the Committee Chair (or any other Committee member on whom this responsibility has been delegated).
OtherNon-Audit Services
Certainnon-audit services that the independent accountants are legally permitted to render will be subject topre-approval by the Committee or by one or more Committee members to whom the Committee has delegated this authority and who will report to the full Committee anypre-approval decisions made pursuant to this Policy.Non-audit services presented forpre-approval pursuant to this paragraph will be accompanied by a confirmation from both the Treasurer and the independent accountants that the proposed services will not adversely affect the independence of the independent accountants.
Proscribed Services
The Fund’s independent accountants will not render services in the following categories ofnon-audit services:
| | • | | Bookkeeping or other services related to the accounting records or financial statements of the Fund |
| | • | | Financial information systems design and implementation |
| | • | | Appraisal or valuation services, fairness opinions, orcontribution-in-kind reports |
| | • | | Internal audit outsourcing services |
| | • | | Management functions or human resources |
| | • | | Broker or dealer, investment adviser, or investment banking services |
| | • | | Legal services and expert services unrelated to the audit |
| | • | | Any other service that the Public Company Accounting Oversight Board determines, by regulation, is impermissible. |
Pre-approval ofNon-Audit Services Provided to Other Entities Within the PGIM Fund Complex
Certainnon-audit services provided to PGIM Investments LLC or any of its affiliates that also provide ongoing services to the PGIM Mutual Funds will be subject topre-approval by the Audit Committee. The onlynon-audit services provided to these entities that will requirepre-approval are thoserelated directly to the operations and financial reporting of the Funds. Individual projects that are not presented to the Audit Committee as part of the annualpre-approval process will be subject topre-approval by the Committee Chair (or any other Committee member on whom this responsibility has been delegated) so long as the estimated fee for those services does not exceed $30,000. Services presented forpre-approval pursuant to this
paragraph will be accompanied by a confirmation from both the Treasurer and the independent accountants that the proposed services will not adversely affect the independence of the independent accountants.
Although the Audit Committee will notpre-approve all services provided to PGIM Investments LLC and its affiliates, the Committee will receive an annual report from the Fund’s independent accounting firm showing the aggregate fees for all services provided to PGIM Investments and its affiliates.
(e) (2)Percentageofservicesreferredtoin4(b)–4(d)thatwereapprovedbytheauditcommittee– For the fiscal year ended October 31, 2019, 100% of the services referred to in Item 4(b) was approved by the audit committee. For the fiscal year ended October 31, 2018: none.
(f)Percentage of hours expended attributable to work performed by other than full time employees of principal accountant if greaterthan 50%.
The percentage of hours expended on the principal accountant’s engagement to audit the registrant’s financial statements for the most recent fiscal year that were attributed to work performed by persons other than the principal accountant’s full-time, permanent employees was 0%.
(g)Non-Audit Fees
The aggregatenon-audit fees billed by KPMG for services rendered to the registrant’s investment adviser and any entity controlling, controlled by, or under common control with the investment adviser that provides ongoing services to the registrant for the fiscal years ended October 31, 2019 and October 31, 2018 was $0 and $0, respectively.
(h)Principal Accountant’s Independence
Not applicable as KPMG has not providednon-audit services to the registrant’s investment adviser and any entity controlling, controlled by, or under common control with the investment adviser that provides ongoing services to the registrant that were notpre-approved pursuant to Rule2-01(c)(7)(ii) of RegulationS-X.
Item 5 – Audit Committee of Listed Registrants –
The registrant has a separately designated standing audit committee (the “Audit Committee”) established in accordance with Section 3(a)(58)(A) of the Securities Exchange Act of 1934. The members of the Audit Committee are Kevin J. Bannon (chair), Laurie Simon Hodrick, Michael S. Hyland, CFA, Brian K. Reid, and Keith F. Hartstein(ex-officio).
Item 6 – Schedule of Investments – The schedule is included as part of the report to shareholders filed under Item 1 of this Form.
Item 7 – Disclosure of Proxy Voting Policies and Procedures forClosed-End Management Investment Companies – Not applicable.
Item 8 – Portfolio Managers ofClosed-End Management Investment Companies – Not applicable.
Item 9 – Purchases of Equity Securities byClosed-End Management Investment Company and Affiliated Purchasers – Not applicable.
Item 10 – Submission of Matters to a Vote of Security Holders – There have been no material changes to these procedures.
Item 11 – Controls and Procedures
| | (a) | It is the conclusion of the registrant’s principal executive officer and principal financial officer that the effectiveness of the registrant’s current disclosure controls and procedures (such disclosure controls and procedures having been evaluated within 90 days of the date of this filing) provide reasonable assurance that the information required to be disclosed by the registrant has been recorded, processed, summarized and |
| | reported within the time period specified in the Commission’s rules and forms and that the information required to be disclosed by the registrant has been accumulated and communicated to the registrant’s principal executive officer and principal financial officer in order to allow timely decisions regarding required disclosure. |
| | (b) | There has been no significant change in the registrant’s internal control over financial reporting that occurred during the registrant’s most recent fiscal quarter of the period covered by this report that has materially affected, or is likely to materially affect, the registrant’s internal control over financial reporting. |
Item 12 – Controls and Procedures - Disclosure of Securities Lending Activities forClosed-End Management Investment Companies – Not applicable.
Item 13 – Exhibits
| | (a) | (1) Code of Ethics – Attached hereto as ExhibitEX-99.CODE-ETH |
(2) Certifications pursuant to Section 302 of the Sarbanes-Oxley Act – Attached hereto as ExhibitEX-99.CERT.
(3) Any written solicitation to purchase securities under Rule23c-1. – Not applicable.
| | (b) | Certifications pursuant to Section 906 of the Sarbanes-Oxley Act – Attached hereto as ExhibitEX-99.906CERT. |
SIGNATURES
Pursuant to the requirements of the Securities Exchange Act of 1934 and the Investment Company Act of 1940, the registrant has duly caused this report to be signed on its behalf by the undersigned, thereunto duly authorized.
| | |
| Registrant: | | Prudential Investment Portfolios 9 |
| |
| By: | | /s/ Andrew R. French |
| | Andrew R. French |
| | Secretary |
| |
| Date: | | December 19, 2019 |
Pursuant to the requirements of the Securities Exchange Act of 1934 and the Investment Company Act of 1940, this report has been signed below by the following persons on behalf of the registrant and in the capacities and on the dates indicated.
| | |
| By: | | /s/ Stuart S. Parker |
| | Stuart S. Parker |
| | President and Principal Executive Officer |
| |
| Date: | | December 19, 2019 |
| |
| By: | | /s/ Christian J. Kelly |
| | Christian J. Kelly |
| | Treasurer and Principal Financial and Accounting Officer |
| |
| Date: | | December 19, 2019 |