UNITED STATES
SECURITIES AND EXCHANGE COMMISSION
Washington, D.C. 20549
FORM N-CSR
CERTIFIED SHAREHOLDER REPORT OF REGISTERED MANAGEMENT INVESTMENT
COMPANIES
| | |
| Investment Company Act file number: | | 811-09101 |
| |
| Exact name of registrant as specified in charter: | | Prudential Investment Portfolios 9 |
| |
| Address of principal executive offices: | | 655 Broad Street, 6th Floor |
| | | Newark, New Jersey 07102 |
| |
| Name and address of agent for service: | | Andrew R. French |
| | | 655 Broad Street, 6th Floor |
| | | Newark, New Jersey 07102 |
| |
| Registrant’s telephone number, including area code: | | 800-225-1852 |
| |
| Date of fiscal year end: | | 10/31/2022 |
| |
| Date of reporting period: | | 10/31/2022 |
Item 1 – Reports to Stockholders

PGIM ABSOLUTE RETURN BOND FUND
ANNUAL REPORT
OCTOBER 31, 2022

To enroll in e-delivery, go to pgim.com/investments/resource/edelivery
Table of Contents
This report is not authorized for distribution to prospective investors unless preceded or accompanied by a current prospectus.
The views expressed in this report and information about the Fund’s portfolio holdings are for the period covered by this report and are subject to change thereafter.
Mutual funds are distributed by Prudential Investment Management Services LLC (PIMS), member SIPC. PGIM Fixed Income is a unit of PGIM, Inc. (PGIM), a registered investment adviser. PIMS and PGIM are Prudential Financial companies. © 2022 Prudential Financial, Inc. and its related entities. PGIM and the PGIM logo are service marks of Prudential Financial, Inc. and its related entities, registered in many jurisdictions worldwide.
2 Visit our website at pgim.com/investments
Letter from the President
| | |
 | | Dear Shareholder: We hope you find the annual report for the PGIM Absolute Return Bond Fund informative and useful. The report covers performance for the 12-month period that ended October 31, 2022. The attention of the global economy and financial markets pivoted during the period from the COVID-19 pandemic to the challenge of rapidly rising inflation. While job growth remained strong, prices for a wide range of goods and services rose in response to economic re-openings, supply-chain disruptions, governmental stimulus, and Russia’s invasion of Ukraine. With inflation surging to a 40-year high, the Federal Reserve and other central banks aggressively hiked interest rates, prompting recession concerns. |
After rising to record levels at the end of 2021, stocks have fallen sharply in 2022 as investors worried about higher prices, slowing economic growth, geopolitical uncertainty, and new COVID-19 outbreaks. Equities rallied for a time during the summer but began falling again in late August on fears that the Fed would keep raising rates to tame inflation. For the entire 12-month period, equities suffered a broad-based global decline, although large-cap US stocks outperformed their small-cap counterparts. International developed and emerging markets trailed the US market during this time.
Rising rates and economic uncertainty drove fixed income prices broadly lower as well. US and global investment-grade bonds, along with US high yield corporate bonds and emerging market debt, all posted negative returns during the period.
Regarding your investments with PGIM, we believe it is important to maintain a diversified portfolio of funds consistent with your tolerance for risk, time horizon, and financial goals. Your financial advisor can help you create a diversified investment plan that may include funds covering all the basic asset classes and that reflects your personal investor profile and risk tolerance. However, diversification and asset allocation strategies do not assure a profit or protect against loss in declining markets.
At PGIM Investments, we provide access to active investment strategies across the global markets in the pursuit of consistent outperformance for investors. PGIM is the world’s 11th-largest investment manager with more than $1.5 trillion in assets under management. Our scale and investment expertise allow us to deliver a diversified suite of actively managed solutions across a broad spectrum of asset classes and investment styles.
Thank you for choosing our family of funds.
Sincerely,

Stuart S. Parker, President
PGIM Absolute Return Bond Fund
December 15, 2022
PGIM Absolute Return Bond Fund 3
Your Fund’s Performance (unaudited)
Performance data quoted represent past performance. Past performance does not guarantee future results. The investment return and principal value of an investment will fluctuate so that an investor’s shares, when redeemed, may be worth more or less than their original cost. Current performance may be lower or higher than the past performance data quoted. An investor may obtain performance data as of the most recent month-end by visiting our website at pgim.com/investments or by calling (800) 225-1852.
| | | | | | |
| |
| | | Average Annual Total Returns as of 10/31/22 |
| | One Year (%) | | Five Years (%) | | Ten Years (%) |
| | | |
Class A | | | | | | |
| | | |
(with sales charges) | | -5.48 | | 0.95 | | 1.77 |
| | | |
(without sales charges) | | -2.30 | | 1.62 | | 2.11 |
| | | |
Class C | | | | | | |
| | | |
(with sales charges) | | -4.00 | | 0.85 | | 1.35 |
| | | |
(without sales charges) | | -3.04 | | 0.85 | | 1.35 |
| | | |
Class Z | | | | | | |
| | | |
(without sales charges) | | -2.03 | | 1.89 | | 2.38 |
| | | |
Class R6 | | | | | | |
| | | |
(without sales charges) | | -1.87 | | 1.92 | | 2.41 |
| | | |
ICE BofA US 3-Month Treasury Bill Index | | 0.78 | | 1.16 | | 0.70 |
| | |
ICE BofA US Dollar 3-Month Deposit Offered Rate Constant Maturity Index | | | | |
| | | |
| | | 0.64 | | 1.34 | | 0.91 |
4 Visit our website at pgim.com/investments
Growth of a $10,000 Investment (unaudited)
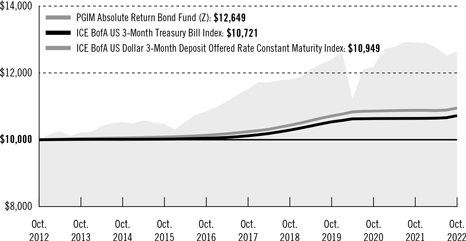
The graph compares a $10,000 investment in the Fund’s Class Z shares with a similar investment in the ICE BofA US 3-Month Treasury Bill Index and ICE BofA US Dollar 3-Month Deposit Offered Rate Constant Maturity Index by portraying the initial account values at the beginning of the 10-year period for Class Z shares (October 31, 2012) and the account values at the end of the current fiscal year (October 31, 2022), as measured on a quarterly basis. For purposes of the graph, and unless otherwise indicated, it has been assumed that (a) all recurring fees (including management fees) were deducted and (b) all dividends and distributions were reinvested. The line graph provides information for Class Z shares only. As indicated in the tables provided earlier, performance for other share classes will vary due to the differing fees and expenses applicable to each share class (as indicated in the following paragraphs). Without waiver of fees and/or expense reimbursements, if any, the returns would have been lower.
Past performance does not predict future performance. Total returns and the ending account values in the graphs include changes in share price and reinvestment of dividends and capital gains distributions in a hypothetical investment for the periods shown. The Fund’s total returns do not reflect the deduction of income taxes on an individual’s investment. Taxes may reduce your actual investment returns on income or gains paid by the Fund or any gains you may realize if you sell your shares.
PGIM Absolute Return Bond Fund 5
Your Fund’s Performance (continued)
The returns in the tables do not reflect the deduction of taxes that a shareholder would pay on Fund distributions or following the redemption of Fund shares. The average annual total returns take into account applicable sales charges, which are described for each share class in the table below.
| | | | | | | | |
| | | | | |
| | | Class A | | Class C | | Class Z | | Class R6 |
Maximum initial sales charge | | 3.25% of the public offering price | | None | | None | | None |
| Contingent deferred sales charge (CDSC) (as a percentage of the lower of the original purchase price or the net asset value at redemption) | | 1.00% on sales of $500,000 or more made within 12 months of purchase | | 1.00% on sales made within 12 months of purchase | | None | | None |
| | | | | |
| Annual distribution and service (12b-1)fees (shown as a percentage of average daily net assets) | | 0.25% | | 1.00% | | None | | None |
Benchmark Definitions
ICE BofA US 3-Month Treasury Bill Index*—The ICE BofA US 3-Month Treasury Bill Index tracks the performance of US dollar-denominated US Treasury bills publicly issued in the US domestic market with a remaining term to final maturity of 3 months.
*ICE BofA US 3-Month Treasury Bill Index has replaced ICE BofA US Dollar 3-Month Deposit Offered Rate Constant Maturity Index as the Fund’s primary benchmark due to the pending discontinuation of LIBOR.
ICE BofA US Dollar 3-Month Deposit Offered Rate Constant Maturity Index—The ICE BofA US Dollar 3-Month Deposit Offered Rate Constant Maturity Index is an unmanaged index which tracks the performance of a synthetic asset paying LIBOR to a stated maturity. The Index is based on the assumed purchase at par of a synthetic instrument having exactly its stated maturity and with a coupon equal to that day’s fixing rate. That issue is assumed to be sold the following business day (priced at a yield equal to the current day fixing rate) and rolled into a new instrument.
Source: ICE BofA, used with permission.
Investors cannot invest directly in an index. The returns for the Indexes would be lower if they included the effects of sales charges, operating expenses of a mutual fund, or taxes that may be paid by an investor.
6 Visit our website at pgim.com/investments
| | | | |
|
| Credit Quality expressed as a percentage of total investments as of 10/31/22 (%) | |
| |
AAA | | | 55.4 | |
| |
AA | | | 7.8 | |
| |
A | | | 3.1 | |
| |
BBB | | | 9.8 | |
| |
BB | | | 10.8 | |
| |
B | | | 4.3 | |
| |
CCC | | | 1.7 | |
| |
CC | | | 0.1 | |
| |
C | | | 0.1 | |
| |
Not Rated | | | 1.4 | |
| |
Cash/Cash Equivalents | | | 5.5 | |
| | |
Total | | | 100.0 | |
Credit ratings reflect the highest rating assigned by a nationally recognized statistical rating organization (NRSRO) such as Moody’s Investors Service, Inc. (Moody’s), S&P Global Ratings (S&P), or Fitch, Inc. (Fitch). Credit ratings reflect the common nomenclature used by both S&P and Fitch. Where applicable, ratings are converted to the comparable S&P/Fitch rating tier nomenclature. These rating agencies are independent and are widely used. The Not Rated category consists of securities that have not been rated by an NRSRO. Credit ratings are subject to change.
| | | | | | |
| | | |
| Distributions and Yields as of 10/31/22 | | | | | | |
| | | |
| | | Total Distributions Paid for One Year ($) | | SEC 30-Day Subsidized Yield* (%) | | SEC 30-Day Unsubsidized Yield** (%) |
| | | |
Class A | | 0.22 | | 5.09 | | 5.09 |
| | | |
Class C | | 0.15 | | 4.43 | | 4.43 |
| | | |
Class Z | | 0.24 | | 5.47 | | 5.47 |
| | | |
Class R6 | | 0.25 | | 5.58 | | 5.58 |
*SEC 30-Day Subsidized Yield (%)—A standardized yield calculation created by the Securities and Exchange Commission, it reflects the income earned during a 30-day period, after the deduction of the Fund’s net expenses (net of any expense waivers or reimbursements). The investor experience is represented by the SEC 30-Day Subsidized Yield.
**SEC 30-Day Unsubsidized Yield (%)—A standardized yield calculation created by the Securities and Exchange Commission, it reflects the income earned during a 30-day period, after the deduction of the Fund’s gross expenses. The investor experience is represented by the SEC 30-Day Subsidized Yield.
PGIM Absolute Return Bond Fund 7
Strategy and Performance Overview* (unaudited)
How did the Fund perform?
The PGIM Absolute Return Bond Fund’s Class Z shares returned –2.03% in the 12-month reporting period that ended October 31, 2022, underperforming the 0.78% return of the ICE BofA US 3-Month Treasury Bill Index (the Index).
What were the market conditions?
| ● | From a starting point of low yields, tight spreads, and high equity multiples, the shift in fundamentals—most notably, high inflation—drove a wholesale repricing of markets during the reporting period. Concerns about central bank tightening, hard economic landings, and the war in Ukraine led global credit spreads to be notably wider, while rate volatility increased as markets first began pricing in more aggressive Federal Open Market Committee policy tightening and then later began to price in a hard economic landing. |
| ● | Against the backdrop of historic lows in unemployment and generational highs in inflation, central banks signaled an increased willingness to accept more economic and market pain than they had been over the prior decade of low inflation. A succession of federal funds rate hikes—including outsized 75 basis-point (bp) hikes in June, July, and September—confirmed to markets that the Federal Reserve (the Fed) is fully focused on tackling inflation. (One basis point equals 0.01%.) |
| ● | At the August Jackson Hole symposium, Fed Chairman Jerome Powell’s speech was successful in lifting rate-hike expectations for 2022 and removing market pricing for rate cuts in 2023. While long-run inflation expectations remain relatively subdued at this point, Powell expressed the need to exercise vigilance about the trajectory of market expectations to avoid a self-fulfilling inflation spiral. Underpinning this escalation in rhetoric was the reality that Fed officials do not know how high they will ultimately take the fed funds rate in order to tame inflation. |
| ● | As a result, enormous volatility continued to be priced into US Treasuries, with sharply higher front-end rates and lower long-dated yields forming a substantially flatter US Treasury yield curve before the curve finally inverted during the last three months of the period. The 10-year/2-year Treasury spread declined from 1.10% on October 31, 2021 to –0.44% by the end of the period. |
| ● | Beginning the period at 1.55%, US 10-year Treasury yields ended the period at 4.05%. Meanwhile, the yield on the 2-year Treasury note ended the period at 4.49%, a rise of 404 bps since the beginning of the period. |
| ● | US investment-grade corporate spreads widened significantly as corporates were challenged by elevated inflationary pressures, a slower growth outlook, and higher event and geopolitical risk. US high yield bonds posted significant declines through much of 2022 as rate-hike concerns, high and persistent inflation, and recession fears overshadowed the strength of earnings and credit fundamentals. Securitized credit spreads widened, with collateralized loan obligation (CLO) and commercial mortgage-backed securities (CMBS) spreads trading well above their recent tights by the end of the period. The emerging markets sector posted negative total returns, and |
8 Visit our website at pgim.com/investments
| | spreads widened as markets were pressured by tightening financial conditions and slowing growth in China and Europe. Meanwhile, agency mortgage-backed securities (MBS) underperformed Treasuries on concerns that the Fed may begin selling MBS if officials need to step up their inflation fight. |
What worked?
| ● | The Fund’s yield curve positioning, particularly along the US Treasury curve, contributed to performance during the reporting period. |
| ● | While overall security selection detracted during the period, selection in high yield bonds, CLOs, and municipal bonds contributed to performance. |
| ● | While overall sector allocation detracted from returns, allocations to investment-grade corporate bonds and CMBS contributed. |
| ● | Within credit, positioning in the upstream energy, midstream energy, downstream energy, and aerospace & defense sectors contributed to returns. |
| ● | In individual security selection, the Fund benefited from positioning in Chesapeake Energy Corp. (upstream energy), Bombardier Inc. (aerospace & defense), and JP Morgan Chase & Co. (banking). |
| ● | The Fund occasionally features a modest notional exposure to non-US dollar currencies across a diversified basket of currencies in faster-growing emerging and developed countries. The Fund’s foreign-exchange currency market (FX) positioning contributed to performance for the period. |
What didn’t work?
| ● | During the period, the Fund’s long duration bias, in both developed market and emerging market rates, detracted from returns. (Duration measures the sensitivity of the price—the value of principal—of a bond to a change in interest rates.) |
| ● | Within security selection, positions in emerging markets, investment-grade corporate bonds, CMBS, and Treasuries detracted the most. |
| ● | Within sector allocation, allocations to CLOs, high yield bonds, and emerging markets detracted from performance. |
| ● | Within credit, positioning in foreign non-corporate bonds as well as the telecommunications and media & entertainment sectors detracted from performance. |
| ● | In individual security selection, positioning in Ukraine, the Republic of Belarus, and Digicel Group Ltd. (telecom) detracted from performance. |
Did the Fund use derivatives?
The Fund uses derivatives when they facilitate implementation of the overall investment approach. During the reporting period, the Fund held positions in Russia combined with the use of derivatives designed to offset the decline in value of certain Russian securities. The Fund also used interest rate futures and swaps during the period to help manage duration positioning and yield curve exposure, which detracted from
PGIM Absolute Return Bond Fund 9
Strategy and Performance Overview* (continued)
performance. Credit default swaps and credit default swap index (CDX) positions were used to either add risk exposure to certain issuers or to hedge credit risk imposed by certain issuers. Overall, credit derivative exposure detracted during the period. In addition, the Fund traded foreign-exchange derivatives, which had a positive impact on performance over the period.
Current outlook
| ● | PGIM Fixed Income maintains that it will likely take another quarter to see a material downtrend in the key categories of services inflation. Such relief would come from a combination of a slowdown in labor demand, in line with other slowing measures of aggregate demand, and incremental gains in labor supply as workers with lower balances of savings are drawn back into the workforce. |
| ● | Based on its review of inflation and other macroeconomic data, PGIM Fixed Income believes the Fed is unlikely to soon stop raising rates and, as a result, recently raised its terminal rate projection to 4.75% by January—assuming 50-bp and 25-bp rate hikes in December and January, respectively. This would likely be followed by precautionary rate cuts by the end of the second quarter of 2023, as the downturn takes hold amid a negative fiscal impulse, mounting external shocks, and tighter financial conditions. |
| ● | Beyond the progression of events over the next few quarters or years, PGIM Fixed Income expects economic conditions to eventually return to a configuration more like pre-COVID-19 conditions, as an aging demographic and high debt burdens are likely to drive a return to moderate growth and inflation, which may lead to a lower interest rate environment. |
| ● | PGIM Fixed Income maintains its positive view of spread sectors over the medium to long term and holds allocations to structured products (CLOs, CMBS), investment-grade corporate bonds, high yield bonds, and emerging markets. Relative to the Index, the Fund is underweight MBS in favor of more attractive opportunities across spread sectors. |
| ● | In terms of calling the peak in long-term rates, given the economic strength and level of inflation, PGIM Fixed income believes it’s too early to preclude the possibility of higher highs. Yet, from a long-term perspective, exposure to developed market duration is becoming more compelling after the broad repricing and with the looming moderation in global growth. While acknowledging the immediate trajectory of inflation is going to dictate market volatility and the path of the US Treasury 10-year yield, PGIM Fixed Income’s base case is that implied volatility will ultimately decline, and the 10-year yield will stay below the terminal rate of this interest rate hiking cycle when it is eventually reached. In the meantime, the best course will be to focus on the micro-alpha opportunities within and across sectors, in PGIM Fixed Income’s view. |
*This strategy and performance overview, which discusses what strategies or holdings (including derivatives, if applicable) affected the Fund’s performance, is compiled based on how the Fund performed relative to the Fund’s benchmark index and is viewed for
10 Visit our website at pgim.com/investments
performance attribution purposes at the aggregate Fund level, which in most instances will not directly correlate to the amounts disclosed in the Statement of Operations which conform to US generally accepted accounting principles.
PGIM Absolute Return Bond Fund 11
Fees and Expenses (unaudited)
As a shareholder of the Fund, you incur two types of costs: (1) transaction costs, including sales charges (loads) on purchase payments and redemptions, as applicable, and (2) ongoing costs, including management fees, distribution and/or service (12b-1) fees, and other Fund expenses, as applicable. This example is intended to help you understand your ongoing costs (in dollars) of investing in the Fund and to compare these costs with the ongoing costs of investing in other mutual funds.
The example is based on an investment of $1,000 held through the six-month period ended October 31, 2022. The example is for illustrative purposes only; you should consult the Prospectus for information on initial and subsequent minimum investment requirements.
Actual Expenses
The first line for each share class in the table on the following page provides information about actual account values and actual expenses. You may use the information on this line, together with the amount you invested, to estimate the expenses that you paid over the period. Simply divide your account value by $1,000 (for example, an $8,600 account value ÷ $1,000 = 8.6), then multiply the result by the number on the first line under the heading “Expenses Paid During the Six-Month Period” to estimate the expenses you paid on your account during this period.
Hypothetical Example for Comparison Purposes
The second line for each share class in the table on the following page provides information about hypothetical account values and hypothetical expenses based on the Fund’s actual expense ratio and an assumed rate of return of 5% per year before expenses, which is not the Fund’s actual return. The hypothetical account values and expenses may not be used to estimate the actual ending account balance or expenses you paid for the period. You may use this information to compare the ongoing costs of investing in the Fund and other funds. To do so, compare this 5% hypothetical example with the 5% hypothetical examples that appear in the shareholder reports of the other funds.
The Fund’s transfer agent may charge additional fees to holders of certain accounts that are not included in the expenses shown in the table on the following page. These fees apply to individual retirement accounts (IRAs) and Section 403(b) accounts. As of the close of the six-month period covered by the table, IRA fees included an annual maintenance fee of $15 per account (subject to a maximum annual maintenance fee of $25 for all accounts held by the same shareholder). Section 403(b) accounts are charged an annual $25 fiduciary maintenance fee. Some of the fees may vary in amount, or may be waived, based on your total account balance or the number of PGIM funds, including the Fund, that you own. You should consider the additional fees that were charged to your Fund account over the six-month period when you estimate the total ongoing expenses paid over the period and the impact of these fees on your ending account value, as these additional expenses are not reflected in the information
12 Visit our website at pgim.com/investments
provided in the expense table. Additional fees have the effect of reducing investment returns.
Please note that the expenses shown in the table are meant to highlight your ongoing costs only and do not reflect any transactional costs such as sales charges (loads). Therefore, the second line for each share class in the table is useful in comparing ongoing costs only and will not help you determine the relative total costs of owning different funds. In addition, if these transactional costs were included, your costs would have been higher.
| | | | | | | | | | |
| | | | | |
| PGIM Absolute Return Bond Fund | | Beginning Account Value
May 1, 2022 | | Ending Account Value October 31, 2022 | | Annualized Expense Ratio Based on the
Six-Month Period | | Expenses Paid
During the
Six-Month Period* |
| | | | | |
Class A | | Actual | | $1,000.00 | | $ 990.00 | | 0.99% | | $4.97 |
| | | | | |
| | Hypothetical | | $1,000.00 | | $1,020.21 | | 0.99% | | $5.04 |
| | | | | |
Class C | | Actual | | $1,000.00 | | $ 986.20 | | 1.77% | | $8.86 |
| | | | | |
| | Hypothetical | | $1,000.00 | | $1,016.28 | | 1.77% | | $9.00 |
| | | | | |
Class Z | | Actual | | $1,000.00 | | $ 991.40 | | 0.73% | | $3.66 |
| | | | | |
| | Hypothetical | | $1,000.00 | | $1,021.53 | | 0.73% | | $3.72 |
| | | | | |
Class R6 | | Actual | | $1,000.00 | | $ 992.70 | | 0.67% | | $3.37 |
| | | | | |
| | | Hypothetical | | $1,000.00 | | $1,021.83 | | 0.67% | | $3.41 |
*Fund expenses (net of fee waivers or subsidies, if any) for each share class are equal to the annualized expense ratio for each share class (provided in the table), multiplied by the average account value over the period, multiplied by the 184 days in the six-month period ended October 31, 2022, and divided by the 365 days in the Fund’s fiscal year ended October 31, 2022 (to reflect the six-month period). Expenses presented in the table include the expenses of any underlying portfolios in which the Fund may invest.
PGIM Absolute Return Bond Fund 13
Schedule of Investments
as of October 31, 2022
| | | | | | | | | | | | | | |
| | | | |
| Description | | Interest
Rate | | Maturity
Date | | Principal Amount (000)# | | | Value | |
| | | | |
LONG-TERM INVESTMENTS 93.4% | | | | | | | | | | | | | | |
| | | | |
ASSET-BACKED SECURITIES 23.8% | | | | | | | | | | | | | | |
| | | | |
Automobiles 0.2% | | | | | | | | | | | | | | |
| | | | |
Hertz Vehicle Financing III LP, | | | | | | | | | | | | | | |
Series 2021-02A, Class B, 144A | | | 2.120% | | | 12/27/27 | | | 200 | | | $ | 168,026 | |
| | | | |
OneMain Direct Auto Receivables Trust, | | | | | | | | | | | | | | |
Series 2019-01A, Class B, 144A | | | 3.950 | | | 11/14/28 | | | 1,700 | | | | 1,579,145 | |
| | | | |
Santander Bank Auto Credit-Linked Notes, | | | | | | | | | | | | | | |
Series 2022-A, Class C, 144A | | | 7.375 | | | 05/15/32 | | | 623 | | | | 602,558 | |
| | | | | | | | | | | | | | |
| | | | |
| | | | | | | | | | | | | 2,349,729 | |
| | | | |
Collateralized Loan Obligations 20.8% | | | | | | | | | | | | | | |
| | | | |
AlbaCore EURO CLO DAC (Ireland), | | | | | | | | | | | | | | |
Series 02A, Class B, 144A, 3 Month EURIBOR + 1.650% (Cap N/A, Floor 1.650%) | | | 2.650(c) | | | 06/15/34 | | EUR | 1,000 | | | | 872,273 | |
Series 02X, Class B, 3 Month EURIBOR + 1.650% (Cap N/A, Floor 1.650%) | | | 2.650(c) | | | 06/15/34 | | EUR | 4,000 | | | | 3,489,090 | |
| | | | |
Anchorage Capital Europe CLO DAC (Ireland), | | | | | | | | | | | | | | |
Series 06A, Class B2, 144A | | | 6.000 | | | 08/25/34 | | EUR | 4,000 | | | | 3,802,829 | |
| | | | |
Ares European CLO DAC (Ireland), | | | | | | | | | | | | | | |
Series 2013-06A, Class B1RR, 144A, 3 Month EURIBOR + 1.250% (Cap N/A, Floor 1.250%) | | | 2.628(c) | | | 04/15/30 | | EUR | 2,500 | | | | 2,301,842 | |
| | | | |
Atlas Static Senior Loan Fund Ltd. (Cayman Islands), | | | | | | | | | | | | | | |
Series 2022-01A, Class A, 144A, 3 Month SOFR + 2.600% (Cap N/A, Floor 2.600%) | | | 5.100(c) | | | 07/15/30 | | | 10,000 | | | | 9,861,606 | |
| | | | |
Bain Capital Credit CLO Ltd. (Cayman Islands), | | | | | | | | | | | | | | |
Series 2019-02A, Class AR, 144A, 3 Month LIBOR + 1.100% (Cap N/A, Floor 1.100%) | | | 5.179(c) | | | 10/17/32 | | | 8,500 | | | | 8,195,203 | |
Series 2022-01A, Class A1, 144A, 3 Month SOFR + 1.320% (Cap N/A, Floor 1.320%) | | | 5.249(c) | | | 04/18/35 | | | 9,750 | | | | 9,264,023 | |
| | | | |
Barings Euro CLO DAC (Ireland), | | | | | | | | | | | | | | |
Series 2020-01A, Class AR, 144A, 3 Month EURIBOR + 0.980% (Cap N/A, Floor 0.980%) | | | 2.442(c) | | | 10/21/34 | | EUR | 3,000 | | | | 2,802,931 | |
| | | | |
Carlyle Euro CLO DAC (Ireland), | | | | | | | | | | | | | | |
Series 2019-01A, Class A1R, 144A, 3 Month EURIBOR + 0.750% (Cap N/A, Floor 0.750%) | | | 1.750(c) | | | 03/15/32 | | EUR | 1,750 | | | | 1,664,260 | |
Series 2019-01A, Class A2RB, 144A | | | 2.100 | | | 03/15/32 | | EUR | 6,500 | | | | 5,426,842 | |
| | | | |
Carlyle Global Market Strategies CLO Ltd. (Cayman Islands), | | | | | | | | | | | | | | |
Series 2015-05A, Class A1RR, 144A, 3 Month LIBOR + 1.080% (Cap N/A, Floor 1.080%) | | | 5.323(c) | | | 01/20/32 | | | 6,250 | | | | 6,087,714 | |
See Notes to Financial Statements.
PGIM Absolute Return Bond Fund 15
Schedule of Investments (continued)
as of October 31, 2022
| | | | | | | | | | | | | | |
| | | | |
| Description | | Interest
Rate | | Maturity
Date | | Principal Amount (000)# | | | Value | |
| | | | |
ASSET-BACKED SECURITIES (Continued) | | | | | | | | | | | | | | |
| | | | |
Collateralized Loan Obligations (cont’d.) | | | | | | | | | | | | | | |
| | | | |
CIFC Funding Ltd. (Cayman Islands), | | | | | | | | | | | | | | |
Series 2015-01A, Class ARR, 144A, 3 Month LIBOR + 1.110% (Cap N/A, Floor 1.110%) | | | 5.435%(c) | | | 01/22/31 | | | 7,000 | | | $ | 6,816,249 | |
Crown City CLO (Cayman Islands), | | | | | | | | | | | | | | |
Series 2020-02A, Class A1AR, 144A, 3 Month SOFR + 1.340% (Cap N/A, Floor 1.340%) | | | 5.303(c) | | | 04/20/35 | | | 2,750 | | | | 2,621,934 | |
Elevation CLO Ltd. (Cayman Islands), | | | | | | | | | | | | | | |
Series 2017-06A, Class A1, 144A, 3 Month LIBOR + 1.280% (Cap N/A, Floor 1.280%) | | | 5.359(c) | | | 07/15/29 | | | 2,073 | | | | 2,041,723 | |
Ellington CLO Ltd. (Cayman Islands), | | | | | | | | | | | | | | |
Series 2017-02A, Class A, 144A, 3 Month LIBOR + 1.700% (Cap N/A, Floor 1.700%) | | | 4.605(c) | | | 02/15/29 | | | 9,490 | | | | 9,393,484 | |
Elmwood CLO Ltd. (Cayman Islands), | | | | | | | | | | | | | | |
Series 2021-03A, Class A, 144A, 3 Month LIBOR + 1.040% (Cap N/A, Floor 1.040%) | | | 5.283(c) | | | 10/20/34 | | | 4,250 | | | | 4,085,627 | |
Generate CLO Ltd. (Cayman Islands), | | | | | | | | | | | | | | |
Series 02A, Class AR, 144A, 3 Month LIBOR + 1.150% (Cap N/A, Floor 1.150%) | | | 5.475(c) | | | 01/22/31 | | | 3,000 | | | | 2,940,128 | |
KKR CLO Ltd. (Cayman Islands), | | | | | | | | | | | | | | |
Series 11, Class AR, 144A, 3 Month LIBOR + 1.180% (Cap N/A, Floor 1.180%) | | | 5.259(c) | | | 01/15/31 | | | 8,000 | | | | 7,857,797 | |
Series 32A, Class A1, 144A, 3 Month LIBOR + 1.320% (Cap N/A, Floor 1.320%) | | | 5.399(c) | | | 01/15/32 | | | 5,000 | | | | 4,905,294 | |
Madison Park Funding Ltd. (Cayman Islands), | | | | | | | | | | | | | | |
Series 2019-33A, Class AR, 144A, 3 Month SOFR + 1.290% (Cap N/A, Floor 1.290%) | | | 5.154(c) | | | 10/15/32 | | | 5,500 | | | | 5,356,143 | |
Series 2021-59A, Class A, 144A, 3 Month LIBOR + 1.140% (Cap N/A, Floor 1.140%) | | | 5.334(c) | | | 01/18/34 | | | 9,500 | | | | 9,198,470 | |
Medalist Partners Corporate Finance CLO Ltd. (Cayman Islands), | | | | | | | | | | | | | | |
Series 2021-01A, Class A1A, 144A, 3 Month LIBOR + 1.230% (Cap N/A, Floor 1.230%) | | | 5.473(c) | | | 10/20/34 | | | 5,000 | | | | 4,772,437 | |
MidOcean Credit CLO (Cayman Islands), | | | | | | | | | | | | | | |
Series 2014-03A, Class A1R, 144A, 3 Month LIBOR + 1.120% (Cap N/A, Floor 1.120%) | | | 5.398(c) | | | 04/21/31 | | | 7,411 | | | | 7,166,684 | |
Series 2014-03A, Class BR, 144A, 3 Month LIBOR + 1.800% (Cap N/A, Floor 1.800%) | | | 6.078(c) | | | 04/21/31 | | | 18,000 | | | | 16,681,064 | |
Oaktree CLO Ltd. (Cayman Islands), | | | | | | | | | | | | | | |
Series 2022-02A, Class A1, 144A, 3 Month SOFR + 2.000% (Cap N/A, Floor 2.000%) | | | 4.825(c) | | | 07/15/33 | | | 6,500 | | | | 6,291,410 | |
See Notes to Financial Statements.
16
| | | | | | | | | | | | |
| | | | |
| Description | | Interest Rate | | Maturity Date | | Principal Amount (000)# | | | Value | |
| | | | |
ASSET-BACKED SECURITIES (Continued) | | | | | | | | | | | | |
| | | | |
Collateralized Loan Obligations (cont’d.) | | | | | | | | | | | | |
| | | | |
OFSI BSL Ltd. (Cayman Islands), | | | | | | | | | | | | |
Series 2022-11A, Class A1, 144A, 3 Month SOFR + 2.100% (Cap N/A, Floor 2.100%) | | 6.029%(c) | | 07/18/31 | | | 10,000 | | | $ | 9,745,599 | |
OZLM Ltd. (Cayman Islands), | | | | | | | | | | | | |
Series 2014-06A, Class A2AS, 144A, 3 Month LIBOR + 1.750% (Cap N/A, Floor 0.000%) | | 5.829(c) | | 04/17/31 | | | 4,000 | | | | 3,753,004 | |
Palmer Square CLO Ltd. (Cayman Islands), | | | | | | | | | | | | |
Series 2014-01A, Class A1R2, 144A, 3 Month LIBOR + 1.130% (Cap N/A, Floor 1.130%) | | 5.209(c) | | 01/17/31 | | | 5,000 | | | | 4,909,829 | |
Series 2018-02A, Class A1A, 144A, 3 Month LIBOR + 1.100% (Cap N/A, Floor 0.000%) | | 5.179(c) | | 07/16/31 | | | 6,750 | | | | 6,586,402 | |
Palmer Square Loan Funding Ltd. (Cayman Islands), | | | | | | | | | | | | |
Series 2022-03A, Class A2, 144A, 3 Month SOFR + 3.000% (Cap N/A, Floor 3.000%) | | 0.000(c) | | 04/15/31 | | | 13,000 | | | | 12,988,911 | |
Penta CLO DAC (Ireland), | | | | | | | | | | | | |
Series 2018-05A, Class B1R, 144A, 3 Month EURIBOR + 1.550% (Cap N/A, Floor 1.550%) | | 3.006(c) | | 04/20/35 | | EUR | 10,000 | | | | 8,998,910 | |
Rockford Tower CLO Ltd., | | | | | | | | | | | | |
Series 2022-02A, Class A1, 144A, 3 Month SOFR + 2.000% (Cap N/A, Floor 2.000%) | | 4.328(c) | | 07/20/33 | | | 11,500 | | | | 11,249,222 | |
Romark CLO Ltd. (Cayman Islands), | | | | | | | | | | | | |
Series 2018-02A, Class A1, 144A, 3 Month LIBOR + 1.175% (Cap N/A, Floor 1.175%) | | 5.533(c) | | 07/25/31 | | | 5,000 | | | | 4,857,149 | |
Romark WM-R Ltd. (Cayman Islands), | | | | | | | | | | | | |
Series 2018-01A, Class A1, 144A, 3 Month LIBOR + 1.030% (Cap N/A, Floor 0.000%) | | 5.273(c) | | 04/20/31 | | | 1,484 | | | | 1,453,719 | |
Silver Rock CLO Ltd. (Cayman Islands), | | | | | | | | | | | | |
Series 2021-02A, Class A, 144A, 3 Month LIBOR + 1.190% (Cap N/A, Floor 1.190%) | | 5.433(c) | | 01/20/35 | | | 10,000 | | | | 9,520,718 | |
St. Pauls CLO DAC (Ireland), | | | | | | | | | | | | |
Series 02A, Class AR4, 144A, 3 Month EURIBOR + 0.980% (Cap N/A, Floor 0.980%) | | 2.523(c) | | 10/25/35 | | EUR | 8,000 | | | | 7,422,596 | |
Strata CLO Ltd. (Cayman Islands), | | | | | | | | | | | | |
Series 2018-01A, Class A, 144A, 3 Month LIBOR + 1.590% (Cap N/A, Floor 1.590%) | | 5.669(c) | | 01/15/31 | | | 19,000 | | | | 18,723,366 | |
Wellfleet CLO Ltd., | | | | | | | | | | | | |
Series 2017-03A, Class A1, 144A, 3 Month LIBOR + 1.150% (Cap N/A, Floor 1.150%) | | 5.229(c) | | 01/17/31 | | | 10,500 | | | | 10,262,577 | |
See Notes to Financial Statements.
PGIM Absolute Return Bond Fund 17
Schedule of Investments (continued)
as of October 31, 2022
| | | | | | | | | | | | |
| | | | |
| Description | | Interest Rate | | Maturity Date | | Principal Amount (000)# | | | Value | |
| | | | |
ASSET-BACKED SECURITIES (Continued) | | | | | | | | | | | | |
| | | | |
Collateralized Loan Obligations (cont’d.) | | | | | | | | | | | | |
| | | | |
Zais CLO Ltd. (Cayman Islands), | | | | | | | | | | | | |
Series 2015-03A, Class A2R, 144A, 3 Month LIBOR + 2.190% (Cap N/A, Floor 0.000%) | | 6.269%(c) | | 07/15/31 | | | 11,300 | | | $ | 10,554,567 | |
Series 2017-02A, Class A, 144A, 3 Month LIBOR + 1.290% (Cap N/A, Floor 0.000%) | | 5.369(c) | | 04/15/30 | | | 4,220 | | | | 4,139,666 | |
| | | | | | | | | | | | |
| | | | |
| | | | | | | | | | | 269,063,292 | |
| | | | |
Consumer Loans 0.5% | | | | | | | | | | | | |
| | | | |
Lendmark Funding Trust, | | | | | | | | | | | | |
Series 2021-01A, Class C, 144A | | 3.410 | | 11/20/31 | | | 200 | | | | 154,762 | |
Oportun Funding XIII LLC, | | | | | | | | | | | | |
Series 2019-A, Class B, 144A | | 3.870 | | 08/08/25 | | | 4,165 | | | | 4,028,597 | |
Oportun Issuance Trust, | | | | | | | | | | | | |
Series 2022-02, Class A, 144A | | 5.940 | | 10/09/29 | | | 2,798 | | | | 2,772,095 | |
| | | | | | | | | | | | |
| | | | |
| | | | | | | | | | | 6,955,454 | |
| | | | |
Home Equity Loans 0.8% | | | | | | | | | | | | |
| | | | |
Accredited Mortgage Loan Trust, | | | | | | | | | | | | |
Series 2004-03, Class 2A2, 1 Month LIBOR + 1.200% (Cap 13.000%, Floor 1.200%) | | 4.786(c) | | 10/25/34 | | | 911 | | | | 885,779 | |
Asset-Backed Securities Corp. Home Equity Loan Trust, | | | | | | | | | | | | |
Series 2003-HE06, Class A2, 1 Month LIBOR + 0.680% (Cap N/A, Floor 0.680%) | | 4.266(c) | | 11/25/33 | | | 1,388 | | | | 1,357,442 | |
Series 2003-HE06, Class A3B, 1 Month LIBOR + 0.960% (Cap N/A, Floor 0.960%) | | 4.546(c) | | 11/25/33 | | | 3,422 | | | | 3,226,270 | |
Bear Stearns Asset-Backed Securities Trust, | | | | | | | | | | | | |
Series 2002-02, Class A1, 1 Month LIBOR + 0.660% (Cap 11.000%, Floor 0.660%) | | 4.246(c) | | 10/25/32 | | �� | 335 | | | | 327,958 | |
Series 2003-03, Class A2, 1 Month LIBOR + 1.180% (Cap 11.000%, Floor 1.180%) | | 4.766(c) | | 06/25/43 | | | 76 | | | | 71,521 | |
Series 2003-HE01, Class M1, 1 Month LIBOR + 1.095% (Cap N/A, Floor 1.095%) | | 4.681(c) | | 01/25/34 | | | 1,912 | | | | 1,849,790 | |
Home Equity Asset Trust, | | | | | | | | | | | | |
Series 2004-07, Class A2, 1 Month LIBOR + 0.840% (Cap N/A, Floor 0.840%) | | 4.426(c) | | 01/25/35 | | | 1,050 | | | | 999,384 | |
MASTR Asset-Backed Securities Trust, | | | | | | | | | | | | |
Series 2003-WMC02, Class M2, 1 Month LIBOR + 2.475% (Cap N/A, Floor 2.475%) | | 4.263(c) | | 08/25/33 | | | 610 | | | | 598,047 | |
See Notes to Financial Statements.
18
| | | | | | | | | | | | | | | | |
| | | | |
| Description | | Interest
Rate | | | Maturity
Date | | | Principal Amount (000)# | | | Value | |
| | | | |
ASSET-BACKED SECURITIES (Continued) | | | | | | | | | | | | | | | | |
| | | | |
Home Equity Loans (cont’d.) | | | | | | | | | | | | | | | | |
| | | | |
Morgan Stanley ABS Capital I, Inc. Trust, | | | | | | | | | | | | | | | | |
Series 2003-HE03, Class M1, 1 Month LIBOR + 1.020% (Cap N/A, Floor 1.020%) | | | 4.606%(c) | | | | 10/25/33 | | | | 633 | | | $ | 616,785 | |
Series 2003-NC08, Class M1, 1 Month LIBOR + 1.050% (Cap N/A, Floor 1.050%) | | | 4.636(c) | | | | 09/25/33 | | | | 261 | | | | 254,852 | |
Series 2003-NC10, Class M1, 1 Month LIBOR + 1.020% (Cap N/A, Floor 1.020%) | | | 4.606(c) | | | | 10/25/33 | | | | 276 | | | | 268,167 | |
| | | | | | | | | | | | | | | | |
| | | | |
| | | | | | | | | | | | | | | 10,455,995 | |
| | | | |
Other 0.2% | | | | | | | | | | | | | | | | |
PNMAC FMSR Issuer Trust, | | | | | | | | | | | | | | | | |
Series 2018-FT01, Class A, 144A, 1 Month LIBOR + 2.350% (Cap N/A, Floor 0.000%) | | | 5.936(c) | | | | 04/25/23 | | | | 3,200 | | | | 3,043,710 | |
| | | | |
Residential Mortgage-Backed Securities 1.0% | | | | | | | | | | | | | | | | |
| | | | |
Chase Funding Trust, | | | | | | | | | | | | | | | | |
Series 2002-03, Class 2A1, 1 Month LIBOR + 0.640% (Cap N/A, Floor 0.640%) | | | 4.226(c) | | | | 08/25/32 | | | | 245 | | | | 226,627 | |
Series 2003-04, Class 1A5 | | | 4.893 | | | | 05/25/33 | | | | 323 | | | | 300,564 | |
Citigroup Mortgage Loan Trust, Inc., | | | | | | | | | | | | | | | | |
Series 2005-OPT01, Class M1, 1 Month LIBOR + 0.630% (Cap N/A, Floor 0.630%) | | | 4.216(c) | | | | 02/25/35 | | | | 179 | | | | 163,041 | |
Series 2005-WF01, Class A5 | | | 5.010(cc) | | | | 11/25/34 | | | | —(r | ) | | | 53 | |
Countrywide Asset-Backed Certificates, | | | | | | | | | | | | | | | | |
Series 2003-BC04, Class M1, 1 Month LIBOR + 1.050% (Cap N/A, Floor 1.050%) | | | 4.636(c) | | | | 07/25/33 | | | | 364 | | | | 354,048 | |
Series 2004-01, Class M1, 1 Month LIBOR + 0.750% (Cap N/A, Floor 0.750%) | | | 4.336(c) | | | | 03/25/34 | | | | 17 | | | | 16,902 | |
Countrywide Asset-Backed Certificates Trust, | | | | | | | | | | | | | | | | |
Series 2004-BC04, Class M1, 1 Month LIBOR + 1.050% (Cap N/A, Floor 1.050%) | | | 4.636(c) | | | | 11/25/34 | | | | 145 | | | | 142,488 | |
Credit-Based Asset Servicing & Securitization LLC, | | | | | | | | | | | | | | | | |
Series 2003-CB03, Class AF1 | | | 3.379 | | | | 12/25/32 | | | | 78 | | | | 70,655 | |
Finance America Mortgage Loan Trust, | | | | | | | | | | | | | | | | |
Series 2003-01, Class M1, 1 Month LIBOR + 1.050% (Cap N/A, Floor 1.050%) | | | 4.636(c) | | | | 09/25/33 | | | | 1,090 | | | | 1,023,523 | |
First Franklin Mortgage Loan Trust, | | | | | | | | | | | | | | | | |
Series 2004-FF05, Class A2, 1 Month LIBOR + 0.760% (Cap N/A, Floor 0.760%) | | | 4.346(c) | | | | 08/25/34 | | | | 493 | | | | 465,550 | |
See Notes to Financial Statements.
PGIM Absolute Return Bond Fund 19
Schedule of Investments (continued)
as of October 31, 2022
| | | | | | | | | | | | | | | | |
| | | | |
| Description | | Interest
Rate | | | Maturity
Date | | | Principal
Amount (000)# | | | Value | |
| | | | |
ASSET-BACKED SECURITIES (Continued) | | | | | | | | | | | | | | | | |
| | | | |
Residential Mortgage-Backed Securities (cont’d.) | | | | | | | | | | | | | | | | |
| | | | |
Fremont Home Loan Trust, | | | | | | | | | | | | | | | | |
Series 2004-04, Class M1, 1 Month LIBOR + 0.795% (Cap N/A, Floor 0.795%) | | | 4.381%(c) | | | | 03/25/35 | | | | 1,657 | | | $ | 1,532,807 | |
Long Beach Mortgage Loan Trust, | | | | | | | | | | | | | | | | |
Series 2004-02, Class A1, 1 Month LIBOR + 0.440% (Cap N/A, Floor 0.440%) | | | 4.026(c) | | | | 06/25/34 | | | | 604 | | | | 558,894 | |
Morgan Stanley ABS Capital I, Inc. Trust, | | | | | | | | | | | | | | | | |
Series 2004-NC05, Class M1, 1 Month LIBOR + 0.900% (Cap N/A, Floor 0.900%) | | | 4.486(c) | | | | 05/25/34 | | | | 170 | | | | 156,497 | |
Rathlin Residential DAC (Ireland), | | | | | | | | | | | | | | | | |
Series 2021-01A, Class A, 144A, 1 Month EURIBOR + 2.000% | | | 2.698(c) | | | | 09/27/75 | | | EUR | 1,373 | | | | 1,293,405 | |
Structured Asset Investment Loan Trust, | | | | | | | | | | | | | | | | |
Series 2004-BNC01, Class A2, 1 Month LIBOR + 1.000% (Cap N/A, Floor 1.000%) | | | 4.084(c) | | | | 09/25/34 | | | | 1,881 | | | | 1,757,662 | |
TFS (Spain), | | | | | | | | | | | | | | | | |
Series 2018-03^ | | | 0.000(s) | | | | 04/16/40 | | | EUR | —(r | ) | | | 6,513 | |
Series 2018-03, Class A1, 1 Month EURIBOR + 3.000%^ | | | 3.845(c) | | | | 04/16/23 | | | EUR | 5,637 | | | | 5,297,435 | |
| | | | | | | | | | | | | | | | |
| | | | |
| | | | | | | | | | | | | | | 13,366,664 | |
| | | | |
Student Loans 0.3% | | | | | | | | | | | | | | | | |
Laurel Road Prime Student Loan Trust, | | | | | | | | | | | | | | | | |
Series 2018-D, Class A, 144A | | | 0.000(cc) | | | | 11/25/43 | | | | 2,694 | | | | 2,500,083 | |
Series 2019-A, Class R, 144A | | | 0.000 | | | | 10/25/48 | | | | 2,149 | | | | 506,135 | |
SoFi RR Funding II Trust, | | | | | | | | | | | | | | | | |
Series 2019-01, Class A, 144A, 1 Month LIBOR + 1.250% (Cap N/A, Floor 1.250%) | | | 4.334(c) | | | | 11/29/24 | | | | 801 | | | | 800,959 | |
| | | | | | | | | | | | | | | | |
| | | | |
| | | | | | | | | | | | | | | 3,807,177 | |
| | | | | | | | | | | | | | | | |
TOTAL ASSET-BACKED SECURITIES
(cost $326,710,386) | | | | | | | | | | | | | | | 309,042,021 | |
| | | | | | | | | | | | | | | | |
| | | | |
COMMERCIAL MORTGAGE-BACKED SECURITIES 4.5% | | | | | | | | | | | | | | | | |
| | | | |
20 Times Square Trust, | | | | | | | | | | | | | | | | |
Series 2018-20TS, Class G, 144A (original cost $2,454,600; purchased 05/09/18)(f) | | | 3.100(cc) | | | | 05/15/35 | | | | 2,700 | | | | 2,122,512 | |
Series 2018-20TS, Class H, 144A (original cost $2,389,640; purchased 05/09/18)(f) | | | 3.100(cc) | | | | 05/15/35 | | | | 2,700 | | | | 1,973,850 | |
See Notes to Financial Statements.
20
| | | | | | | | | | | | | | |
| | | | |
| Description | | Interest
Rate | | Maturity
Date | | | Principal
Amount (000)# | | | Value | |
| | |
COMMERCIAL MORTGAGE-BACKED SECURITIES (Continued) | | | | | | | | | |
BPR Trust, | | | | | | | | | | | | | | |
Series 2021-TY, Class C, 144A, 1 Month LIBOR + 1.700% (Cap N/A, Floor 1.700%) | | 5.112%(c) | | | 09/15/38 | | | | 2,024 | | | $ | 1,874,812 | |
BX Commercial Mortgage Trust, | | | | | | | | | | | | | | |
Series 2019-XL, Class J, 144A, 1 Month LIBOR + 2.650% (Cap N/A, Floor 2.650%) | | 6.062(c) | | | 10/15/36 | | | | 5,653 | | | | 5,401,361 | |
Commercial Mortgage Trust, | | | | | | | | | | | | | | |
Series 2015-LC19, Class XB, IO, 144A | | 0.240(cc) | | | 02/10/48 | | | | 123,049 | | | | 592,481 | |
Credit Suisse Mortgage Capital Certificates, | | | | | | | | | | | | | | |
Series 2019-ICE04, Class F, 144A, 1 Month LIBOR + 2.650% (Cap N/A, Floor 2.650%) | | 6.062(c) | | | 05/15/36 | | | | 5,680 | | | | 5,448,034 | |
DBWF Mortgage Trust, | | | | | | | | | | | | | | |
Series 2016-85T, Class E, 144A | | 3.808(cc) | | | 12/10/36 | | | | 15,500 | | | | 12,321,928 | |
FHLMC Multifamily Structured Pass-Through Certificates, | | | | | | | | | | | | | | |
Series K055, Class X1, IO | | 1.347(cc) | | | 03/25/26 | | | | 21,583 | | | | 784,464 | |
Series KC02, Class X1, IO | | 0.381(cc) | | | 03/25/24 | | | | 121,726 | | | | 561,767 | |
GS Mortgage Securities Corp., | | | | | | | | | | | | | | |
Series 2013-GC10, Class XB, IO, 144A | | 0.468(cc) | | | 02/10/46 | | | | 103,126 | | | | 1,031 | |
GS Mortgage Securities Trust, | | | | | | | | | | | | | | |
Series 2014-GC20, Class XB, IO | | 0.472(cc) | | | 04/10/47 | | | | 28,307 | | | | 155,035 | |
Independence Plaza Trust, | | | | | | | | | | | | | | |
Series 2018-INDP, Class E, 144A | | 4.996 | | | 07/10/35 | | | | 5,200 | | | | 4,558,974 | |
JPMBB Commercial Mortgage Securities Trust, | | | | | | | | | | | | | | |
Series 2014-C21, Class XB, IO | | 0.299(cc) | | | 08/15/47 | | | | 45,056 | | | | 248,524 | |
Series 2015-C27, Class XB, IO | | 0.408(cc) | | | 02/15/48 | | | | 52,766 | | | | 437,573 | |
JPMorgan Chase Commercial Mortgage Securities Trust, | | | | | | | | | | | | | | |
Series 2013-LC11, Class XB, IO | | 0.508(cc) | | | 04/15/46 | | | | 34,956 | | | | 83,972 | |
Series 2018-AON, Class E, 144A | | 4.613(cc) | | | 07/05/31 | | | | 7,950 | | | | 6,452,369 | |
Morgan Stanley Bank of America Merrill Lynch Trust, | | | | | | | | | | | | | | |
Series 2013-C08, Class XB, IO, 144A | | 0.497(cc) | | | 12/15/48 | | | | 68,276 | | | | 2,711 | |
Morgan Stanley Capital I Trust, | | | | | | | | | | | | | | |
Series 2019-MEAD, Class C, 144A | | 3.177(cc) | | | 11/10/36 | | | | 2,020 | | | | 1,750,724 | |
Series 2019-MEAD, Class E, 144A | | 3.177(cc) | | | 11/10/36 | | | | 2,505 | | | | 2,063,445 | |
Salus European Loan Conduit DAC (United Kingdom), | | | | | | | | | | | | | | |
Series 33A, Class A, 144A, SONIA + 1.619% (Cap 6.500%, Floor 1.500%) | | 3.809(c) | | | 01/23/29 | | | GBP | 9,500 | | | | 10,833,797 | |
UBS-Barclays Commercial Mortgage Trust, | | | | | | | | | | | | | | |
Series 2013-C06, Class XB, IO, 144A | | 0.383(cc) | | | 04/10/46 | | | | 140,883 | | | | 156,338 | |
| | | | | | | | | | | | | | |
TOTAL COMMERCIAL MORTGAGE-BACKED SECURITIES
(cost $65,178,301) | | | | | | | | | | | | | 57,825,702 | |
| | | | | | | | | | | | | | |
See Notes to Financial Statements.
PGIM Absolute Return Bond Fund 21
Schedule of Investments (continued)
as of October 31, 2022
| | | | | | | | | | | | | | | | |
| | | | |
| Description | | Interest
Rate | | | Maturity
Date | | | Principal
Amount (000)# | | | Value | |
| | | | |
CONVERTIBLE BOND 0.0% | | | | | | | | | | | | | | | | |
| | | | |
Telecommunications | | | | | | | | | | | | | | | | |
Digicel Group Holdings Ltd. (Jamaica), | | | | | | | | | | | | | | | | |
Sub. Notes, 144A, Cash coupon 7.000% or PIK N/A | | | | | | | | | | | | | | | | |
(cost $7,306) | | | 7.000% | | | | 11/17/22(oo) | | | | 45 | | | $ | 3,158 | |
| | | | | | | | | | | | | | | | |
| | | | |
CORPORATE BONDS 20.4% | | | | | | | | | | | | | | | | |
| | | | |
Aerospace & Defense 0.8% | | | | | | | | | | | | | | | | |
Bombardier, Inc. (Canada), | | | | | | | | | | | | | | | | |
Sr. Unsec’d. Notes, 144A | | | 7.500 | | | | 12/01/24 | | | | 4,771 | | | | 4,766,229 | |
Sr. Unsec’d. Notes, 144A(a) | | | 7.875 | | | | 04/15/27 | | | | 5,675 | | | | 5,382,170 | |
| | | | | | | | | | | | | | | | |
| | | | |
| | | | | | | | | | | | | | | 10,148,399 | |
| | | | |
Agriculture 0.0% | | | | | | | | | | | | | | | | |
Vector Group Ltd.,
| | | | | | | | | | | | | | | | |
Sr. Sec’d. Notes, 144A | | | 5.750 | | | | 02/01/29 | | | | 475 | | | | 415,899 | |
| | | | |
Airlines 0.3% | | | | | | | | | | | | | | | | |
American Airlines 2013-1 Class A Pass-Through Trust, | | | | | | | | | | | | | | | | |
Pass-Through Certificates | | | 4.000 | | | | 01/15/27 | | | | 1,567 | | | | 1,333,590 | |
Continental Airlines 2012-2 Class A Pass-Through Trust, | | | | | | | | | | | | | | | | |
Pass-Through Certificates | | | 4.000 | | | | 04/29/26 | | | | 69 | | | | 64,356 | |
United Airlines 2013-1 Class A Pass-Through Trust, Pass-Through Certificates | | | 4.300 | | | | 02/15/27 | | | | 1,478 | | | | 1,370,384 | |
United Airlines, Inc., | | | | | | | | | | | | | | | | |
Sr. Sec’d. Notes, 144A | | | 4.375 | | | | 04/15/26 | | | | 645 | | | | 590,145 | |
Sr. Sec’d. Notes, 144A | | | 4.625 | | | | 04/15/29 | | | | 170 | | | | 145,948 | |
| | | | | | | | | | | | | | | | |
| | | | |
| | | | | | | | | | | | | | | 3,504,423 | |
| | | | |
Auto Manufacturers 0.1% | | | | | | | | | | | | | | | | |
General Motors Co., | | | | | | | | | | | | | | | | |
Sr. Unsec’d. Notes | | | 6.250 | | | | 10/02/43 | | | | 1,555 | | | | 1,362,934 | |
| | | | |
Auto Parts & Equipment 0.3% | | | | | | | | | | | | | | | | |
Adient Global Holdings Ltd., | | | | | | | | | | | | | | | | |
Gtd. Notes, 144A(a) | | | 4.875 | | | | 08/15/26 | | | | 1,900 | | | | 1,695,750 | |
American Axle & Manufacturing, Inc., | | | | | | | | | | | | | | | | |
Gtd. Notes(a) | | | 6.250 | | | | 03/15/26 | | | | 515 | | | | 489,252 | |
See Notes to Financial Statements.
22
| | | | | | | | | | | | | | | | |
| | | | |
| Description | | Interest
Rate | | | Maturity
Date | | | Principal
Amount (000)# | | | Value | |
| | | | |
CORPORATE BONDS (Continued) | | | | | | | | | | | | | | | | |
| | | | |
Auto Parts & Equipment (cont’d.) | | | | | | | | | | | | | | | | |
Cooper-Standard Automotive, Inc., | | | | | | | | | | | | | | | | |
Gtd. Notes, 144A(a) | | | 5.625% | | | | 11/15/26 | | | | 1,050 | | | $ | 394,898 | |
Dana, Inc., | | | | | | | | | | | | | | | | |
Sr. Unsec’d. Notes | | | 4.500 | | | | 02/15/32 | | | | 800 | | | | 608,969 | |
Nemak SAB de CV (Mexico), | | | | | | | | | | | | | | | | |
Sr. Unsec’d. Notes, 144A | | | 3.625 | | | | 06/28/31 | | | | 350 | | | | 252,875 | |
| | | | | | | | | | | | | | | | |
| | | | |
| | | | | | | | | | | | | | | 3,441,744 | |
| | | | |
Banks 5.5% | | | | | | | | | | | | | | | | |
Banco de Credito del Peru S.A. (Peru), | | | | | | | | | | | | | | | | |
Sub. Notes, 144A, MTN | | | 3.250(ff) | | | | 09/30/31 | | | | 1,055 | | | | 879,342 | |
Banco Mercantil del Norte SA (Mexico), | | | | | | | | | | | | | | | | |
Jr. Sub. Notes, 144A | | | 6.625(ff) | | | | 01/24/32 | (oo) | | | 1,110 | | | | 824,175 | |
Bangkok Bank PCL (Thailand), | | | | | | | | | | | | | | | | |
Sub. Notes, 144A | | | 3.466(ff) | | | | 09/23/36 | | | | 945 | | | | 645,284 | |
Bank of America Corp., | | | | | | | | | | | | | | | | |
Jr. Sub. Notes, Series JJ | | | 5.125(ff) | | | | 06/20/24 | (oo) | | | 6,850 | | | | 6,438,878 | |
Jr. Sub. Notes, Series MM | | | 4.300(ff) | | | | 01/28/25 | (oo) | | | 5,545 | | | | 4,547,645 | |
Sr. Unsec’d. Notes, MTN | | | 4.271(ff) | | | | 07/23/29 | | | | 1,450 | | | | 1,317,304 | |
Barclays PLC (United Kingdom), | | | | | | | | | | | | | | | | |
Sr. Unsec’d. Notes | | | 7.437(ff) | | | | 11/02/33 | | | | 3,810 | | | | 3,796,274 | |
Citigroup, Inc., | | | | | | | | | | | | | | | | |
Sr. Unsec’d. Notes | | | 2.976(ff) | | | | 11/05/30 | | | | 870 | | | | 709,916 | |
Sr. Unsec’d. Notes | | | 3.200 | | | | 10/21/26 | | | | 1,145 | | | | 1,043,700 | |
Sr. Unsec’d. Notes | | | 3.785(ff) | | | | 03/17/33 | | | | 1,240 | | | | 1,026,021 | |
Sr. Unsec’d. Notes | | | 3.887(ff) | | | | 01/10/28 | | | | 980 | | | | 897,462 | |
Sub. Notes | | | 4.400 | | | | 06/10/25 | | | | 405 | | | | 392,250 | |
Credit Suisse Group AG (Switzerland), | | | | | | | | | | | | | | | | |
Sr. Unsec’d. Notes | | | 3.750 | | | | 03/26/25 | | | | 1,200 | | | | 1,078,034 | |
Sr. Unsec’d. Notes, 144A | | | 6.537(ff) | | | | 08/12/33 | | | | 2,350 | | | | 2,023,763 | |
Development Bank of the Republic of Belarus JSC (Belarus), | | | | | | | | | | | | | | | | |
Sr. Unsec’d. Notes, 144A(a) | | | 6.750 | | | | 05/02/24 | (d) | | | 1,155 | | | | 184,800 | |
Goldman Sachs Group, Inc. (The), | | | | | | | | | | | | | | | | |
Sr. Unsec’d. Notes | | | 3.814(ff) | | | | 04/23/29 | | | | 35 | | | | 31,054 | |
Sr. Unsec’d. Notes | | | 3.850 | | | | 01/26/27 | | | | 3,940 | | | | 3,656,310 | |
Sr. Unsec’d. Notes | | | 4.223(ff) | | | | 05/01/29 | | | | 135 | | | | 122,162 | |
Grupo Aval Ltd. (Colombia), | | | | | | | | | | | | | | | | |
Gtd. Notes, 144A | | | 4.375 | | | | 02/04/30 | | | | 2,170 | | | | 1,497,707 | |
JPMorgan Chase & Co., | | | | | | | | | | | | | | | | |
Jr. Sub. Notes, Series FF | | | 5.000(ff) | | | | 08/01/24 | (oo) | | | 1,500 | | | | 1,372,946 | |
See Notes to Financial Statements.
PGIM Absolute Return Bond Fund 23
Schedule of Investments (continued)
as of October 31, 2022
| | | | | | | | | | | | | | | | |
| | | | |
| Description | | Interest
Rate | | | Maturity
Date | | | Principal
Amount (000)# | | | Value | |
| | | | |
CORPORATE BONDS (Continued) | | | | | | | | | | | | | | | | |
| | | | |
Banks (cont’d.) | | | | | | | | | | | | | | | | |
JPMorgan Chase & Co., (cont’d.) | | | | | | | | | | | | | | | | |
Jr. Sub. Notes, Series HH | | | 4.600%(ff) | | | | 02/01/25(oo) | | | | 15,325 | | | $ | 13,606,404 | |
M&T Bank Corp., | | | | | | | | | | | | | | | | |
Sub. Notes | | | 4.000 | | | | 07/15/24 | | | | 325 | | | | 318,448 | |
Mizrahi Tefahot Bank Ltd. (Israel), | | | | | | | | | | | | | | | | |
Sub. Notes, 144A | | | 3.077(ff) | | | | 04/07/31 | | | | 1,555 | | | | 1,294,537 | |
Morgan Stanley, | | | | | | | | | | | | | | | | |
Sr. Unsec’d. Notes | | | 3.217(ff) | | | | 04/22/42 | | | | 1,690 | | | | 1,151,125 | |
Sr. Unsec’d. Notes | | | 6.342(ff) | | | | 10/18/33 | | | | 1,625 | | | | 1,648,892 | |
Sr. Unsec’d. Notes, GMTN | | | 3.772(ff) | | | | 01/24/29 | | | | 1,750 | | | | 1,561,193 | |
Sr. Unsec’d. Notes, GMTN | | | 3.875 | | | | 01/27/26 | | | | 605 | | | | 572,973 | |
Societe Generale SA (France), | | | | | | | | | | | | | | | | |
Sub. Notes, 144A | | | 6.221(ff) | | | | 06/15/33 | | | | 7,380 | | | | 6,334,864 | |
State Street Corp., | | | | | | | | | | | | | | | | |
Sr. Unsec’d. Notes | | | 4.164(ff) | | | | 08/04/33 | | | | 3,675 | | | | 3,256,458 | |
UBS Group AG (Switzerland), | | | | | | | | | | | | | | | | |
Sr. Unsec’d. Notes, 144A, SOFR + 1.580% | | | 4.263(c) | | | | 05/12/26 | | | | 1,925 | | | | 1,903,553 | |
Sr. Unsec’d. Notes, 144A | | | 4.488(ff) | | | | 05/12/26 | | | | 615 | | | | 584,077 | |
Wells Fargo & Co., | | | | | | | | | | | | | | | | |
Sr. Unsec’d. Notes, MTN | | | 4.808(ff) | | | | 07/25/28 | | | | 6,475 | | | | 6,140,522 | |
| | | | | | | | | | | | | | | | |
| | | | |
| | | | | | | | | | | | | | | 70,858,073 | |
| | | | |
Beverages 0.0% | | | | | | | | | | | | | | | | |
Anheuser-Busch InBev Worldwide, Inc. (Belgium), | | | | | | | | | | | | | | | | |
Gtd. Notes | | | 8.200 | | | | 01/15/39 | | | | 250 | | | | 297,307 | |
| | | | |
Building Materials 0.1% | | | | | | | | | | | | | | | | |
Cemex SAB de CV (Mexico), | | | | | | | | | | | | | | | | |
Gtd. Notes, 144A | | | 5.450 | | | | 11/19/29 | | | | 1,180 | | | | 1,027,249 | |
Mohawk Industries, Inc., | | | | | | | | | | | | | | | | |
Sr. Unsec’d. Notes | | | 3.850 | | | | 02/01/23 | | | | 104 | | | | 104,000 | |
| | | | | | | | | | | | | | | | |
| | | | |
| | | | | | | | | | | | | | | 1,131,249 | |
| | | | |
Chemicals 0.9% | | | | | | | | | | | | | | | | |
Ashland LLC, | | | | | | | | | | | | | | | | |
Gtd. Notes | | | 6.875 | | | | 05/15/43 | | | | 4,100 | | | | 3,876,770 | |
Ashland Services BV, | | | | | | | | | | | | | | | | |
Gtd. Notes | | | 2.000 | | | | 01/30/28 | | | EUR | 1,200 | | | | 967,960 | |
Braskem Netherlands Finance BV (Brazil), | | | | | | | | | | | | | | | | |
Gtd. Notes, 144A | | | 4.500 | | | | 01/10/28 | | | | 1,630 | | | | 1,406,690 | |
See Notes to Financial Statements.
24
| | | | | | | | | | | | | | |
| | | | |
| Description | | Interest
Rate | | | Maturity
Date | | Principal
Amount (000)# | | | Value | |
| | | | |
CORPORATE BONDS (Continued) | | | | | | | | | | | | | | |
| | | | |
Chemicals (cont’d.) | | | | | | | | | | | | | | |
| | | | |
LYB International Finance BV, | | | | | | | | | | | | | | |
Gtd. Notes | | | 5.250% | | | 07/15/43 | | | 175 | | | $ | 142,960 | |
Nutrien Ltd. (Canada), | | | | | | | | | | | | | | |
Sr. Unsec’d. Notes | | | 4.900 | | | 06/01/43 | | | 1,350 | | | | 1,127,221 | |
Sasol Financing International Ltd. (South Africa), | | | | | | | | | | | | | | |
Gtd. Notes | | | 4.500 | | | 11/14/22 | | | 2,415 | | | | 2,405,823 | |
Sasol Financing USA LLC (South Africa), | | | | | | | | | | | | | | |
Gtd. Notes | | | 4.375 | | | 09/18/26 | | | 350 | | | | 306,468 | |
TPC Group, Inc., | | | | | | | | | | | | | | |
Sr. Sec’d. Notes, 144A | | | 10.500 | | | 08/01/24(d) | | | 1,700 | | | | 929,506 | |
Sr. Sec’d. Notes, 144A | | | 10.875 | | | 08/01/24(d) | | | 419 | | | | 402,434 | |
| | | | | | | | | | | | | | |
| | | | |
| | | | | | | | | | | | | 11,565,832 | |
| | | | |
Commercial Services 0.5% | | | | | | | | | | | | | | |
ERAC USA Finance LLC, | | | | | | | | | | | | | | |
Gtd. Notes, 144A | | | 6.700 | | | 06/01/34 | | | 110 | | | | 110,194 | |
Gtd. Notes, 144A | | | 7.000 | | | 10/15/37 | | | 1,725 | | | | 1,758,948 | |
Nexi SpA (Italy), | | | | | | | | | | | | | | |
Sr. Unsec’d. Notes(a) | | | 2.125 | | | 04/30/29 | | EUR | 4,060 | | | | 3,192,669 | |
United Rentals North America, Inc., | | | | | | | | | | | | | | |
Gtd. Notes | | | 3.750 | | | 01/15/32 | | | 325 | | | | 262,919 | |
Gtd. Notes | | | 5.250 | | | 01/15/30 | | | 1,200 | | | | 1,112,719 | |
| | | | | | | | | | | | | | |
| | | | |
| | | | | | | | | | | | | 6,437,449 | |
| | | | |
Computers 0.0% | | | | | | | | | | | | | | |
| | | | |
CA Magnum Holdings (India), | | | | | | | | | | | | | | |
Sr. Sec’d. Notes, 144A | | | 5.375 | | | 10/31/26 | | | 515 | | | | 431,313 | |
| | | | |
Diversified Financial Services 0.3% | | | | | | | | | | | | | | |
Blackstone Private Credit Fund, | | | | | | | | | | | | | | |
Sr. Sec’d. Notes^ | | | 5.610 | | | 05/03/27 | | | 950 | | | | 853,675 | |
Jefferies Finance LLC/JFIN Co-Issuer Corp., | | | | | | | | | | | | | | |
Sr. Unsec’d. Notes, 144A | | | 5.000 | | | 08/15/28 | | | 1,025 | | | | 805,556 | |
Jefferies Group LLC, | | | | | | | | | | | | | | |
Sr. Unsec’d. Notes | | | 6.500 | | | 01/20/43 | | | 175 | | | | 160,699 | |
OneMain Finance Corp., | | | | | | | | | | | | | | |
Gtd. Notes | | | 3.875 | | | 09/15/28 | | | 1,200 | | | | 936,940 | |
Power Finance Corp. Ltd. (India), | | | | | | | | | | | | | | |
Sr. Unsec’d. Notes, EMTN | | | 5.250 | | | 08/10/28 | | | 1,100 | | | | 1,015,644 | |
| | | | | | | | | | | | | | |
| | | | |
| | | | | | | | | | | | | 3,772,514 | |
See Notes to Financial Statements.
PGIM Absolute Return Bond Fund 25
Schedule of Investments (continued)
as of October 31, 2022
| | | | | | | | | | | | | | | | |
| | | | |
| Description | | Interest
Rate | | | Maturity
Date | | | Principal
Amount (000)# | | | Value | |
| | | | |
CORPORATE BONDS (Continued) | | | | | | | | | | | | | | | | |
| | | | |
Electric 1.0% | | | | | | | | | | | | | | | | |
| | | | |
AES Panama Generation Holdings SRL (Panama), | | | | | | | | | | | | | | | | |
Sr. Sec’d. Notes, 144A | | | 4.375% | | | | 05/31/30 | | | | 1,065 | | | $ | 837,223 | |
Calpine Corp., | | | | | | | | | | | | | | | | |
Sr. Unsec’d. Notes, 144A | | | 4.625 | | | | 02/01/29 | | | | 1,500 | | | | 1,274,623 | |
Sr. Unsec’d. Notes, 144A | | | 5.000 | | | | 02/01/31 | | | | 2,275 | | | | 1,925,331 | |
Clean Renewable Power Mauritius Pte Ltd. (India), | | | | | | | | | | | | | | | | |
Sr. Sec’d. Notes, 144A | | | 4.250 | | | | 03/25/27 | | | | 454 | | | | 349,291 | |
Duke Energy Carolinas LLC, | | | | | | | | | | | | | | | | |
First Ref. Mortgage(h) | | | 4.000 | | | | 09/30/42 | | | | 50 | | | | 38,816 | |
Eskom Holdings SOC Ltd. (South Africa), | | | | | | | | | | | | | | | | |
Sr. Unsec’d. Notes, 144A | | | 7.125 | | | | 02/11/25 | | | | 2,145 | | | | 1,996,593 | |
Sr. Unsec’d. Notes, 144A, MTN | | | 6.750 | | | | 08/06/23 | | | | 200 | | | | 195,125 | |
Evergy Kansas Central, Inc., | | | | | | | | | | | | | | | | |
First Mortgage(h) | | | 4.100 | | | | 04/01/43 | | | | 325 | | | | 249,412 | |
FEL Energy VI Sarl (Mexico), | | | | | | | | | | | | | | | | |
Sr. Sec’d. Notes, 144A | | | 5.750 | | | | 12/01/40 | | | | 1,766 | | | | 1,182,475 | |
Mong Duong Finance Holdings BV (Vietnam), | | | | | | | | | | | | | | | | |
Sr. Sec’d. Notes | | | 5.125 | | | | 05/07/29 | | | | 1,295 | | | | 897,435 | |
NRG Energy, Inc., | | | | | | | | | | | | | | | | |
Gtd. Notes, 144A | | | 3.625 | | | | 02/15/31 | | | | 1,475 | | | | 1,173,907 | |
Gtd. Notes, 144A | | | 3.875 | | | | 02/15/32 | | | | 1,050 | | | | 828,991 | |
Vistra Corp., | | | | | | | | | | | | | | | | |
Jr. Sub. Notes, 144A | | | 7.000(ff) | | | | 12/15/26(oo) | | | | 450 | | | | 399,918 | |
Jr. Sub. Notes, 144A | | | 8.000(ff) | | | | 10/15/26(oo) | | | | 1,575 | | | | 1,495,934 | |
| | | | | | | | | | | | | | | | |
| | | | |
| | | | | | | | | | | | | | | 12,845,074 | |
| | | | |
Energy-Alternate Sources 0.0% | | | | | | | | | | | | | | | | |
| | | | |
Aydem Yenilenebilir Enerji A/S (Turkey), | | | | | | | | | | | | | | | | |
Sr. Sec’d. Notes, 144A | | | 7.750 | | | | 02/02/27 | | | | 830 | | | | 611,243 | |
| | | | |
Engineering & Construction 0.3% | | | | | | | | | | | | | | | | |
Cellnex Finance Co. SA (Spain), | | | | | | | | | | | | | | | | |
Gtd. Notes, EMTN | | | 2.000 | | | | 02/15/33 | | | EUR | 1,100 | | | | 751,150 | |
Cellnex Telecom SA (Spain), | | | | | | | | | | | | | | | | |
Sr. Unsec’d. Notes, EMTN | | | 1.750 | | | | 10/23/30 | | | EUR | 700 | | | | 512,019 | |
IHS Holding Ltd. (Nigeria), | | | | | | | | | | | | | | | | |
Gtd. Notes, 144A | | | 6.250 | | | | 11/29/28 | | | | 850 | | | | 607,910 | |
Mexico City Airport Trust (Mexico), | | | | | | | | | | | | | | | | |
Sr. Sec’d. Notes, 144A | | | 3.875 | | | | 04/30/28 | | | | 2,000 | | | | 1,670,000 | |
| | | | | | | | | | | | | | | | |
| | | | |
| | | | | | | | | | | | | | | 3,541,079 | |
See Notes to Financial Statements.
26
| | | | | | | | | | | | | | | | |
| | | | |
| Description | | Interest
Rate | | | Maturity
Date | | | Principal Amount (000)# | | | Value | |
| | | | |
CORPORATE BONDS (Continued) | | | | | | | | | | | | | | | | |
| | | | |
Entertainment 0.3% | | | | | | | | | | | | | | | | |
| | | | |
AMC Entertainment Holdings, Inc., | | | | | | | | | | | | | | | | |
Sec’d. Notes, 144A, Cash coupon 10.000% or PIK 12.000% or Cash coupon 5.000% and PIK 6.000% | | | 10.000% | | | | 06/15/26 | | | | 480 | | | $ | 254,880 | |
| | | | |
Codere Finance 2 Luxembourg SA (Spain), | | | | | | | | | | | | | | | | |
Sr. Sec’d. Notes, Cash coupon 2.000% and PIK 10.750% (original cost $726,973; purchased 04/03/19 - 04/30/22)(f) | | | 12.750 | | | | 11/30/27(d) | | | EUR | 654 | | | | 538,213 | |
Sr. Sec’d. Notes, 144A, Cash coupon 8.000% and PIK 3.000% (original cost $2,299,299; purchased 07/24/20 - 09/30/22)(f) | | | 11.000 | | | | 09/30/26(d) | | | EUR | 2,008 | | | | 1,845,531 | |
| | | | |
Codere New Holdco SA (Luxembourg), | | | | | | | | | | | | | | | | |
Sr. Sec’d. Notes, 144A, Cash coupon N/A or PIK 7.500% (original cost $1,069,406; purchased 11/19/21 - 04/30/22)(f) | | | 7.500 | | | | 11/30/27(d) | | | EUR | 810 | | | | 429,732 | |
| | | | |
Premier Entertainment Sub LLC/Premier Entertainment Finance Corp., | | | | | | | | | | | | | | | | |
Gtd. Notes, 144A | | | 5.875 | | | | 09/01/31 | | | | 700 | | | | 496,790 | |
| | | | | | | | | | | | | | | | |
| | | | |
| | | | | | | | | | | | | | | 3,565,146 | |
| | | | |
Foods 0.7% | | | | | | | | | | | | | | | | |
Bellis Finco PLC (United Kingdom), | | | | | | | | | | | | | | | | |
Gtd. Notes(a) | | | 4.000 | | | | 02/16/27 | | | GBP | 2,700 | | | | 2,150,536 | |
Kraft Heinz Foods Co., | | | | | | | | | | | | | | | | |
Gtd. Notes | | | 4.625 | | | | 10/01/39 | | | | 440 | | | | 364,436 | |
Gtd. Notes | | | 5.200 | | | | 07/15/45 | | | | 3,105 | | | | 2,713,947 | |
Lamb Weston Holdings, Inc., | | | | | | | | | | | | | | | | |
Gtd. Notes, 144A | | | 4.125 | | | | 01/31/30 | | | | 250 | | | | 218,583 | |
Gtd. Notes, 144A | | | 4.375 | | | | 01/31/32 | | | | 350 | | | | 301,533 | |
Market Bidco Finco PLC (United Kingdom), | | | | | | | | | | | | | | | | |
Sr. Sec’d. Notes, 144A | | | 5.500 | | | | 11/04/27 | | | GBP
|
4,400 |
| | | 3,816,229 | |
| | | | | | | | | | | | | | | | |
| | | | |
| | | | | | | | | | | | | | | 9,565,264 | |
| | | | |
Forest Products & Paper 0.1% | | | | | | | | | | | | | | | | |
| | | | |
Georgia-Pacific LLC, | | | | | | | | | | | | | | | | |
Sr. Unsec’d. Notes(h) | | | 7.375 | | | | 12/01/25 | | | | 400 | | | | 422,932 | |
| | | | |
Suzano Austria GmbH (Brazil), | | | | | | | | | | | | | | | | |
Gtd. Notes | | | 6.000 | | | | 01/15/29 | | | | 1,000 | | | | 949,125 | |
| | | | | | | | | | | | | | | | |
| | | | |
| | | | | | | | | | | | | | | 1,372,057 | |
See Notes to Financial Statements.
PGIM Absolute Return Bond Fund 27
Schedule of Investments (continued)
as of October 31, 2022
| | | | | | | | | | | | | | | | |
| | | | |
| Description | | Interest
Rate | | | Maturity
Date | | | Principal
Amount (000)# | | | Value | |
| | | | |
CORPORATE BONDS (Continued) | | | | | | | | | | | | | | | | |
| | | | |
Gas 0.4% | | | | | | | | | | | | | | | | |
| | | | |
AmeriGas Partners LP/AmeriGas Finance Corp., | | | | | | | | | | | | | | | | |
Sr. Unsec’d. Notes | | | 5.500% | | | | 05/20/25 | | | | 2,425 | | | $ | 2,319,490 | |
| | | | |
CenterPoint Energy Resources Corp., | | | | | | | | | | | | | | | | |
Sr. Unsec’d. Notes | | | 5.850 | | | | 01/15/41 | | | | 700 | | | | 664,721 | |
| | | | |
ENN Clean Energy International Investment Ltd. (China), | | | | | | | | | | | | | | | | |
Gtd. Notes, 144A | | | 3.375 | | | | 05/12/26 | | | | 1,350 | | | | 1,052,409 | |
Southern Co. Gas Capital Corp., | | | | | | | | | | | | | | | | |
Gtd. Notes | | | 4.400 | | | | 06/01/43 | | | | 1,375 | | | | 1,048,599 | |
| | | | | | | | | | | | | | | | |
| | | | |
| | | | | | | | | | | | | | | 5,085,219 | |
| | | | |
Healthcare-Products 0.2% | | | | | | | | | | | | | | | | |
Medline Borrower LP, | | | | | | | | | | | | | | | | |
Sr. Sec’d. Notes, 144A | | | 3.875 | | | | 04/01/29 | | | | 250 | | | | 204,199 | |
Sr. Unsec’d. Notes, 144A | | | 5.250 | | | | 10/01/29 | | | | 150 | | | | 116,922 | |
Medtronic Global Holdings SCA, | | | | | | | | | | | | | | | | |
Gtd. Notes | | | 1.625 | | | | 03/07/31 | | | EUR | 160 | | | | 136,035 | |
Gtd. Notes | | | 2.250 | | | | 03/07/39 | | | EUR | 705 | | | | 534,178 | |
Thermo Fisher Scientific, Inc., | | | | | | | | | | | | | | | | |
Sr. Unsec’d. Notes, EMTN | | | 1.500 | | | | 10/01/39 | | | EUR | 1,250 | | | | 825,146 | |
Sr. Unsec’d. Notes, EMTN | | | 1.875 | | | | 10/01/49 | | | EUR | 825 | | | | 514,054 | |
| | | | | | | | | | | | | | | | |
| | | | |
| | | | | | | | | | | | | | | 2,330,534 | |
| | | | |
Healthcare-Services 0.2% | | | | | | | | | | | | | | | | |
| | | | |
Aetna, Inc., | | | | | | | | | | | | | | | | |
Sr. Unsec’d. Notes | | | 4.500 | | | | 05/15/42 | | | | 530 | | | | 421,898 | |
Elevance Health, Inc., | | | | | | | | | | | | | | | | |
Sr. Unsec’d. Notes | | | 4.101 | | | | 03/01/28 | | | | 700 | | | | 657,366 | |
Sr. Unsec’d. Notes | | | 4.650 | | | | 01/15/43 | | | | 120 | | | | 101,380 | |
Sr. Unsec’d. Notes | | | 5.100 | | | | 01/15/44 | | | | 515 | | | | 455,753 | |
Memorial Sloan-Kettering Cancer Center, | | | | | | | | | | | | | | | | |
Sr. Unsec’d. Notes | | | 4.125 | | | | 07/01/52 | | | | 75 | | | | 57,753 | |
Tenet Healthcare Corp., | | | | | | | | | | | | | | | | |
Gtd. Notes, 144A | | | 6.125 | | | | 10/01/28 | | | | 125 | | | | 108,377 | |
Sr. Unsec’d. Notes(a) | | | 6.875 | | | | 11/15/31 | | | | 1,200 | | | | 1,021,002 | |
| | | | | | | | | | | | | | | | |
| | | | |
| | | | | | | | | | | | | | | 2,823,529 | |
| | | | |
Home Builders 0.4% | | | | | | | | | | | | | | | | |
| | | | |
Beazer Homes USA, Inc., | | | | | | | | | | | | | | | | |
Gtd. Notes | | | 5.875 | | | | 10/15/27 | | | | 150 | | | | 125,945 | |
See Notes to Financial Statements.
28
| | | | | | | | | | | | | | | | |
| | | | |
| Description | | Interest
Rate | | | Maturity
Date | | | Principal
Amount (000)# | | | Value | |
| | | | |
CORPORATE BONDS (Continued) | | | | | | | | | | | | | | | | |
| | | | |
Home Builders (cont’d.) | | | | | | | | | | | | | | | | |
| | | | |
Beazer Homes USA, Inc., (cont’d.) | | | | | | | | | | | | | | | | |
Gtd. Notes(a) | | | 7.250% | | | | 10/15/29 | | | | 3,475 | | | $ | 2,875,682 | |
Taylor Morrison Communities, Inc., | | | | | | | | | | | | | | | | |
Gtd. Notes, 144A | | | 5.875 | | | | 06/15/27 | | | | 2,560 | | | | 2,407,326 | |
| | | | | | | | | | | | | | | | |
| | | | |
| | | | | | | | | | | | | | | 5,408,953 | |
| | | | |
Housewares 0.0% | | | | | | | | | | | | | | | | |
| | | | |
SWF Escrow Issuer Corp., | | | | | | | | | | | | | | | | |
Sr. Unsec’d. Notes, 144A | | | 6.500 | | | | 10/01/29 | | | | 325 | | | | 186,759 | |
| | | | |
Insurance 0.6% | | | | | | | | | | | | | | | | |
| | | | |
Hartford Financial Services Group, Inc. (The), | | | | | | | | | | | | | | | | |
Sr. Unsec’d. Notes | | | 5.950 | | | | 10/15/36 | | | | 215 | | | | 206,096 | |
Sr. Unsec’d. Notes | | | 6.100 | | | | 10/01/41 | | | | 280 | | | | 267,822 | |
Liberty Mutual Group, Inc., | | | | | | | | | | | | | | | | |
Gtd. Notes, 144A | | | 4.250 | | | | 06/15/23 | | | | 436 | | | | 431,489 | |
Gtd. Notes, 144A | | | 4.569 | | | | 02/01/29 | | | | 1,614 | | | | 1,448,882 | |
Lincoln National Corp., | | | | | | | | | | | | | | | | |
Sr. Unsec’d. Notes | | | 7.000 | | | | 06/15/40 | | | | 695 | | | | 703,970 | |
Markel Corp., | | | | | | | | | | | | | | | | |
Sr. Unsec’d. Notes | | | 5.000 | | | | 03/30/43 | | | | 3,125 | | | | 2,602,785 | |
Principal Financial Group, Inc., | | | | | | | | | | | | | | | | |
Gtd. Notes | | | 4.350 | | | | 05/15/43 | | | | 245 | | | | 190,195 | |
Teachers Insurance & Annuity Association of America, | | | | | | | | | | | | | | | | |
Sub. Notes, 144A(h) | | | 4.900 | | | | 09/15/44 | | | | 1,950 | | | | 1,665,969 | |
Sub. Notes, 144A(h) | | | 6.850 | | | | 12/16/39 | | | | 54 | | | | 56,469 | |
| | | | | | | | | | | | | | | | |
| | | | |
| | | | | | | | | | | | | | | 7,573,677 | |
| | | | |
Internet 0.1% | | | | | | | | | | | | | | | | |
| | | | |
Prosus NV (China), | | | | | | | | | | | | | | | | |
Sr. Unsec’d. Notes, 144A | | | 4.193 | | | | 01/19/32 | | | | 1,250 | | | | 888,913 | |
| | | | |
Lodging 0.2% | | | | | | | | | | | | | | | | |
| | | | |
Gohl Capital Ltd. (Malaysia), | | | | | | | | | | | | | | | | |
Gtd. Notes | | | 4.250 | | | | 01/24/27 | | | | 1,510 | | | | 1,117,400 | |
See Notes to Financial Statements.
PGIM Absolute Return Bond Fund 29
Schedule of Investments (continued)
as of October 31, 2022
| | | | | | | | | | | | | | | | |
| | | | |
| Description | | Interest
Rate | | | Maturity
Date | | | Principal
Amount
(000)# | | | Value | |
| | | | |
CORPORATE BONDS (Continued) | | | | | | | | | | | | | | | | |
| | | | |
Lodging (cont’d.) | | | | | | | | | | | | | | | | |
| | | | |
MGM China Holdings Ltd. (Macau), | | | | | | | | | | | | | | | | |
Sr. Unsec’d. Notes, 144A | | | 4.750% | | | | 02/01/27 | | | | 700 | | | $ | 518,000 | |
Sands China Ltd. (Macau), | | | | | | | | | | | | | | | | |
Sr. Unsec’d. Notes | | | 5.625 | | | | 08/08/25 | | | | 1,000 | | | | 877,500 | |
| | | | | | | | | | | | | | | | |
| | | | |
| | | | | | | | | | | | | | | 2,512,900 | |
| | | | |
Media 0.6% | | | | | | | | | | | | | | | | |
| | | | |
CCO Holdings LLC/CCO Holdings Capital Corp., | | | | | | | | | | | | | | | | |
Sr. Unsec’d. Notes, 144A(a) | | | 4.750 | | | | 03/01/30 | | | | 1,300 | | | | 1,083,130 | |
Charter Communications Operating LLC/Charter Communications Operating Capital, | | | | | | | | | | | | | | | | |
Sr. Sec’d. Notes | | | 6.384 | | | | 10/23/35 | | | | 2,640 | | | | 2,415,573 | |
Sr. Sec’d. Notes | | | 6.484 | | | | 10/23/45 | | | | 585 | | | | 517,158 | |
CSC Holdings LLC, | | | | | | | | | | | | | | | | |
Gtd. Notes, 144A(a) | | | 5.500 | | | | 04/15/27 | | | | 1,500 | | | | 1,412,792 | |
Diamond Sports Group LLC/Diamond Sports Finance Co., | | | | | | | | | | | | | | | | |
Gtd. Notes, 144A | | | 6.625 | | | | 08/15/27 | | | | 2,785 | | | | 142,053 | |
DISH DBS Corp., | | | | | | | | | | | | | | | | |
Gtd. Notes | | | 5.000 | | | | 03/15/23 | | | | 200 | | | | 197,498 | |
Virgin Media Secured Finance PLC (United Kingdom), | | | | | | | | | | | | | | | | |
Sr. Sec’d. Notes | | | 4.125 | | | | 08/15/30 | | | GBP | 700 | | | | 620,849 | |
Sr. Sec’d. Notes | | | 4.250 | | | | 01/15/30 | | | GBP | 600 | | | | 545,404 | |
Ziggo BV (Netherlands), | | | | | | | | | | | | | | | | |
Sr. Sec’d. Notes | | | 2.875 | | | | 01/15/30 | | | EUR | 1,270 | | | | 975,791 | |
| | | | | | | | | | | | | | | | |
| | | | |
| | | | | | | | | | | | | | | 7,910,248 | |
| | | | |
Mining 0.3% | | | | | | | | | | | | | | | | |
AngloGold Ashanti Holdings PLC (South Africa), | | | | | | | | | | | | | | | | |
Gtd. Notes | | | 3.375 | | | | 11/01/28 | | | | 730 | | | | 580,259 | |
Freeport Indonesia PT (Indonesia), | | | | | | | | | | | | | | | | |
Sr. Unsec’d. Notes, 144A, MTN | | | 5.315 | | | | 04/14/32 | | | | 600 | | | | 500,250 | |
Indonesia Asahan Aluminium Persero PT (Indonesia), | | | | | | | | | | | | | | | | |
Sr. Unsec’d. Notes | | | 6.530 | | | | 11/15/28 | | | | 1,650 | | | | 1,599,778 | |
Vedanta Resources Finance II PLC (India), | | | | | | | | | | | | | | | | |
Gtd. Notes | | | 13.875 | | | | 01/21/24 | | | | 1,425 | | | | 1,188,806 | |
| | | | | | | | | | | | | | | | |
| | | | |
| | | | | | | | | | | | | | | 3,869,093 | |
See Notes to Financial Statements.
30
| | | | | | | | | | | | | | | | |
| | | | |
| Description | | Interest Rate | | | Maturity Date | | | Principal Amount (000)# | | | Value | |
| | | | |
CORPORATE BONDS (Continued) | | | | | | | | | | | | | | | | |
| | | | |
Oil & Gas 1.6% | | | | | | | | | | | | | | | | |
| | | | |
Aker BP ASA (Norway), | | | | | | | | | | | | | | | | |
Gtd. Notes, 144A | | | 2.000% | | | | 07/15/26 | | | | 3,635 | | | $ | 3,121,511 | |
Sr. Unsec’d. Notes, 144A | | | 3.000 | | | | 01/15/25 | | | | 1,000 | | | | 933,203 | |
Ascent Resources Utica Holdings LLC/ARU Finance Corp., | | | | | | | | | | | | | | | | |
Gtd. Notes, 144A | | | 7.000 | | | | 11/01/26 | | | | 1,225 | | | | 1,206,867 | |
Gtd. Notes, 144A | | | 9.000 | | | | 11/01/27 | | | | 899 | | | | 1,093,051 | |
Cenovus Energy, Inc. (Canada), | | | | | | | | | | | | | | | | |
Sr. Unsec’d. Notes | | | 5.400 | | | | 06/15/47 | | | | 1,835 | | | | 1,558,640 | |
Citgo Holding, Inc., | | | | | | | | | | | | | | | | |
Sr. Sec’d. Notes, 144A(a) | | | 9.250 | | | | 08/01/24 | | | | 75 | | | | 75,104 | |
Energean Israel Finance Ltd. (Israel), | | | | | | | | | | | | | | | | |
Sr. Sec’d. Notes, 144A | | | 4.875 | | | | 03/30/26 | | | | 1,135 | | | | 1,021,500 | |
Sr. Sec’d. Notes, 144A | | | 5.375 | | | | 03/30/28 | | | | 770 | | | | 675,675 | |
Gazprom PJSC Via Gaz Capital SA (Russia), | | | | | | | | | | | | | | | | |
Sr. Unsec’d. Notes | | | 1.450 | | | | 03/06/23(d) | | | CHF | 1,500 | | | | 823,888 | |
Hilcorp Energy I LP/Hilcorp Finance Co., | | | | | | | | | | | | | | | | |
Sr. Unsec’d. Notes, 144A | | | 6.250 | | | | 11/01/28 | | | | 700 | | | | 659,172 | |
Leviathan Bond Ltd. (Israel), | | | | | | | | | | | | | | | | |
Sr. Sec’d. Notes, 144A | | | 6.750 | | | | 06/30/30 | | | | 2,020 | | | | 1,793,129 | |
Petrobras Global Finance BV (Brazil), | | | | | | | | | | | | | | | | |
Gtd. Notes | | | 5.375 | | | | 10/01/29 | | | GBP | 800 | | | | 765,374 | |
Petroleos Mexicanos (Mexico), | | | | | | | | | | | | | | | | |
Gtd. Notes | | | 4.750 | | | | 02/26/29 | | | EUR | 795 | | | | 575,397 | |
Gtd. Notes | | | 6.500 | | | | 03/13/27 | | | | 260 | | | | 226,590 | |
Gtd. Notes, EMTN | | | 4.875 | | | | 02/21/28 | | | EUR | 250 | | | | 190,670 | |
Preem Holdings AB (Sweden), | | | | | | | | | | | | | | | | |
Sr. Unsec’d. Notes, 144A | | | 12.000 | | | | 06/30/27 | | | EUR | 2,200 | | | | 2,282,858 | |
Transocean, Inc., | | | | | | | | | | | | | | | | |
Gtd. Notes, 144A | | | 7.250 | | | | 11/01/25 | | | | 3,025 | | | | 2,669,562 | |
Tullow Oil PLC (Ghana), | | | | | | | | | | | | | | | | |
Sr. Sec’d. Notes, 144A | | | 10.250 | | | | 05/15/26 | | | | 1,405 | | | | 1,197,763 | |
| | | | | | | | | | | | | | | | |
| | | | |
| | | | | | | | | | | | | | | 20,869,954 | |
| | | | |
Oil & Gas Services 0.0% | | | | | | | | | | | | | | | | |
| | | | |
Cameron International Corp., | | | | | | | | | | | | | | | | |
Gtd. Notes | | | 5.950 | | | | 06/01/41 | | | | 100 | | | | 87,965 | |
See Notes to Financial Statements.
PGIM Absolute Return Bond Fund 31
Schedule of Investments (continued)
as of October 31, 2022
| | | | | | | | | | | | | | | | |
| | | | |
| Description | | Interest
Rate | | | Maturity
Date | | | Principal
Amount
(000)# | | | Value | |
| | | | |
CORPORATE BONDS (Continued) | | | | | | | | | | | | | | | | |
| | | | |
Packaging & Containers 0.2% | | | | | | | | | | | | | | | | |
| | | | |
ARD Finance SA (Luxembourg), | | | | | | | | | | | | | | | | |
Sr. Sec’d. Notes, 144A, Cash coupon 5.000% or PIK 5.750% | | | 5.000% | | | | 06/30/27 | | | EUR | 2,203 | | | $ | 1,477,225 | |
Verallia SA (France), | | | | | | | | | | | | | | | | |
Gtd. Notes(a) | | | 1.625 | | | | 05/14/28 | | | EUR | 1,900 | | | | 1,552,377 | |
| | | | | | | | | | | | | | | | |
| | | | |
| | | | | | | | | | | | | | | 3,029,602 | |
| | | | |
Pharmaceuticals 1.0% | | | | | | | | | | | | | | | | |
| | | | |
AbbVie, Inc., | | | | | | | | | | | | | | | | |
Sr. Unsec’d. Notes | | | 4.050 | | | | 11/21/39 | | | | 905 | | | | 728,972 | |
Sr. Unsec’d. Notes | | | 4.550 | | | | 03/15/35 | | | | 4,155 | | | | 3,697,697 | |
Bausch Health Cos., Inc., | | | | | | | | | | | | | | | | |
Gtd. Notes, 144A | | | 5.000 | | | | 01/30/28 | | | | 400 | | | | 154,276 | |
Gtd. Notes, 144A | | | 6.250 | | | | 02/15/29 | | | | 1,200 | | | | 468,000 | |
Bristol-Myers Squibb Co., | | | | | | | | | | | | | | | | |
Sr. Unsec’d. Notes(h) | | | 4.125 | | | | 06/15/39 | | | | 615 | | | | 522,867 | |
Cigna Corp., | | | | | | | | | | | | | | | | |
Gtd. Notes(h) | | | 4.375 | | | | 10/15/28 | | | | 3,990 | | | | 3,750,116 | |
CVS Health Corp., | | | | | | | | | | | | | | | | |
Sr. Unsec’d. Notes | | | 5.125 | | | | 07/20/45 | | | | 1,315 | | | | 1,128,154 | |
Sr. Unsec’d. Notes | | | 5.300 | | | | 12/05/43 | | | | 485 | | | | 428,238 | |
Utah Acquisition Sub, Inc., | | | | | | | | | | | | | | | | |
Gtd. Notes | | | 5.250 | | | | 06/15/46 | | | | 520 | | | | 359,386 | |
Viatris, Inc., | | | | | | | | | | | | | | | | |
Gtd. Notes | | | 4.000 | | | | 06/22/50 | | | | 2,190 | | | | 1,275,073 | |
| | | | | | | | | | | | | | | | |
| | | | |
| | | | | | | | | | | | | | | 12,512,779 | |
| | | | |
Pipelines 1.2% | | | | | | | | | | | | | | | | |
| | | | |
AI Candelaria Spain SA (Colombia), | | | | | | | | | | | | | | | | |
Sr. Sec’d. Notes, 144A (original cost $920,000;purchased 05/10/21)(f) | | | 5.750 | | | | 06/15/33 | | | | 920 | | | | 593,400 | |
Antero Midstream Partners LP/Antero Midstream Finance Corp., | | | | | | | | | | | | | | | | |
Gtd. Notes, 144A | | | 7.875 | | | | 05/15/26 | | | | 900 | | | | 917,540 | |
Eastern Gas Transmission & Storage, Inc., | | | | | | | | | | | | | | | | |
Sr. Unsec’d. Notes(h) | | | 4.600 | | | | 12/15/44 | | | | 125 | | | | 97,090 | |
Energy Transfer LP, | | | | | | | | | | | | | | | | |
Jr. Sub. Notes, Series G | | | 7.125(ff) | | | | 05/15/30(oo) | | | | 3,360 | | | | 2,781,962 | |
Sr. Unsec’d. Notes | | | 5.150 | | | | 03/15/45 | | | | 55 | | | | 42,821 | |
Sr. Unsec’d. Notes | | | 5.300 | | | | 04/15/47 | | | | 125 | | | | 98,166 | |
Sr. Unsec’d. Notes | | | 5.400 | | | | 10/01/47 | | | | 60 | | | | 47,651 | |
See Notes to Financial Statements.
32
| | | | | | | | | | | | | | | | |
| | | | |
Description | | Interest
Rate | | | Maturity
Date | | | Principal
Amount
(000)# | | | Value | |
| | | | |
CORPORATE BONDS (Continued) | | | | | | | | | | | | | | | | |
| | | | |
Pipelines (cont’d.) | | | | | | | | | | | | | | | | |
| | | | |
Energy Transfer LP, (cont’d.) | | | | | | | | | | | | | | | | |
Sr. Unsec’d. Notes | | | 6.250% | | | | 04/15/49 | | | | 75 | | | $ | 65,465 | |
Enterprise Products Operating LLC, | | | | | | | | | | | | | | | | |
Gtd. Notes | | | 4.900 | | | | 05/15/46 | | | | 1,025 | | | | 840,458 | |
Gtd. Notes | | | 4.950 | | | | 10/15/54 | | | | 800 | | | | 628,678 | |
Kinder Morgan, Inc., | | | | | | | | | | | | | | | | |
Gtd. Notes | | | 5.450 | | | | 08/01/52 | | | | 2,340 | | | | 1,979,326 | |
Magellan Midstream Partners LP, | | | | | | | | | | | | | | | | |
Sr. Unsec’d. Notes | | | 4.200 | | | | 12/01/42 | | | | 125 | | | | 85,667 | |
Sr. Unsec’d. Notes | | | 5.150 | | | | 10/15/43 | | | | 1,350 | | | | 1,099,406 | |
MPLX LP, | | | | | | | | | | | | | | | | |
Sr. Unsec’d. Notes | | | 5.200 | | | | 03/01/47 | | | | 145 | | | | 115,890 | |
NGPL PipeCo LLC, | | | | | | | | | | | | | | | | |
Sr. Unsec’d. Notes, 144A | | | 4.875 | | | | 08/15/27 | | | | 500 | | | | 465,048 | |
ONEOK, Inc., | | | | | | | | | | | | | | | | |
Gtd. Notes | | | 4.950 | | | | 07/13/47 | | | | 1,060 | | | | 804,672 | |
Rockies Express Pipeline LLC, | | | | | | | | | | | | | | | | |
Sr. Unsec’d. Notes, 144A | | | 3.600 | | | | 05/15/25 | | | | 775 | | | | 718,996 | |
Sr. Unsec’d. Notes, 144A | | | 6.875 | | | | 04/15/40 | | | | 1,850 | | | | 1,523,354 | |
Tallgrass Energy Partners LP/Tallgrass Energy Finance Corp., | | | | | | | | | | | | | | | | |
Gtd. Notes, 144A | | | 5.500 | | | | 01/15/28 | | | | 1,000 | | | | 895,768 | |
Gtd. Notes, 144A | | | 7.500 | | | | 10/01/25 | | | | 125 | | | | 126,610 | |
Venture Global Calcasieu Pass LLC, | | | | | | | | | | | | | | | | |
Sr. Sec’d. Notes, 144A | | | 3.875 | | | | 08/15/29 | | | | 75 | | | | 64,886 | |
Sr. Sec’d. Notes, 144A | | | 4.125 | | | | 08/15/31 | | | | 75 | | | | 64,119 | |
Western Midstream Operating LP, | | | | | | | | | | | | | | | | |
Sr. Unsec’d. Notes | | | 5.300 | | | | 03/01/48 | | | | 910 | | | | 727,448 | |
Williams Cos., Inc. (The), | | | | | | | | | | | | | | | | |
Sr. Unsec’d. Notes | | | 5.300 | | | | 08/15/52 | | | | 765 | | | | 645,461 | |
| | | | | | | | | | | | | | | | |
| | | | |
| | | | | | | | | | | | | | | 15,429,882 | |
| | | | |
Real Estate 0.3% | | | | | | | | | | | | | | | | |
| | | | |
Arabian Centres Sukuk Ltd. (Saudi Arabia), | | | | | | | | | | | | | | | | |
Gtd. Notes, 144A | | | 5.375 | | | | 11/26/24 | | | | 995 | | | | 913,908 | |
Greystar Real Estate Partners LLC, | | | | | | | | | | | | | | | | |
Sr. Sec’d. Notes, 144A | | | 5.750 | | | | 12/01/25 | | | | 3,575 | | | | 3,464,562 | |
| | | | | | | | | | | | | | | | |
| | | | |
| | | | | | | | | | | | | | | 4,378,470 | |
See Notes to Financial Statements.
PGIM Absolute Return Bond Fund 33
Schedule of Investments (continued)
as of October 31, 2022
| | | | | | | | | | | | | | | | |
| | | | |
| Description | | Interest
Rate | | Maturity
Date | | | Principal
Amount
(000)# | | | Value | |
| | | | |
CORPORATE BONDS (Continued) | | | | | | | | | | | | | | | | |
| | | | |
Real Estate Investment Trusts (REITs) 0.1% | | | | | | | | | | | | | | | | |
| | | | |
Diversified Healthcare Trust, | | | | | | | | | | | | | | | | |
Gtd. Notes | | | 4.375 | % | | | 03/01/31 | | | | 1,000 | | | $ | 665,934 | |
Uniti Group LP/Uniti Fiber Holdings, Inc./CSL Capital LLC, | | | | | | | | | | | | | | | | |
Sr. Sec’d. Notes, 144A | | | 7.875 | | | | 02/15/25 | | | | 500 | | | | 495,427 | |
| | | | | | | | | | | | | | | | |
| | | | |
| | | | | | | | | | | | | | | 1,161,361 | |
| | | | |
Retail 0.7% | | | | | | | | | | | | | | | | |
| | | | |
AutoZone, Inc., | | | | | | | | | | | | | | | | |
Sr. Unsec’d. Notes | | | 4.750 | | | | 08/01/32 | | | | 1,305 | | | | 1,216,876 | |
Brinker International, Inc., | | | | | | | | | | | | | | | | |
Gtd. Notes, 144A | | | 5.000 | | | | 10/01/24 | | | | 500 | | | | 483,357 | |
eG Global Finance PLC (United Kingdom), | | | | | | | | | | | | | | | | |
Sr. Sec’d. Notes | | | 6.250 | | | | 10/30/25 | | | EUR | 250 | | | | 212,910 | |
Sr. Sec’d. Notes, 144A | | | 4.375 | | | | 02/07/25 | | | EUR | 4,700 | | | | 3,973,814 | |
Falabella SA (Chile), | | | | | | | | | | | | | | | | |
Sr. Unsec’d. Notes, 144A | | | 3.375 | | | | 01/15/32 | | | | 1,200 | | | | 852,000 | |
JSM Global Sarl (Brazil), | | | | | | | | | | | | | | | | |
Gtd. Notes, 144A | | | 4.750 | | | | 10/20/30 | | | | 1,800 | | | | 1,243,462 | |
Macy’s Retail Holdings LLC, | | | | | | | | | | | | | | | | |
Gtd. Notes | | | 4.300 | | | | 02/15/43 | | | | 705 | | | | 418,293 | |
| | | | | | | | | | | | | | | | |
| | | | |
| | | | | | | | | | | | | | | 8,400,712 | |
| | | | |
Telecommunications 1.1% | | | | | | | | | | | | | | | | |
| | | | |
AT&T, Inc., | | | | | | | | | | | | | | | | |
Sr. Unsec’d. Notes | | | 2.550 | | | | 12/01/33 | | | | 727 | | | | 536,331 | |
Sr. Unsec’d. Notes | | | 3.500 | | | | 09/15/53 | | | | 929 | | | | 597,124 | |
Sr. Unsec’d. Notes | | | 3.650 | | | | 09/15/59 | | | | 318 | | | | 201,407 | |
Sr. Unsec’d. Notes | | | 4.500 | | | | 05/15/35 | | | | 695 | | | | 600,017 | |
CT Trust (Guatemala), | | | | | | | | | | | | | | | | |
Sr. Sec’d. Notes, 144A | | | 5.125 | | | | 02/03/32 | | | | 760 | | | | 605,055 | |
Digicel Group Holdings Ltd. (Jamaica), | | | | | | | | | | | | | | | | |
Sr. Unsec’d. Notes, 144A, Cash coupon 5.000% and PIK 3.000% | | | 8.000 | | | | 04/01/25 | | | | 259 | | | | 88,013 | |
Digicel International Finance Ltd./Digicel International Holdings Ltd. (Jamaica), | | | | | | | | | | | | | | | | |
Gtd. Notes, 144A | | | 8.000 | | | | 12/31/26 | | | | 454 | | | | 265,238 | |
Gtd. Notes, 144A, Cash coupon 6.000% and PIK 7.000% | | | 13.000 | | | | 12/31/25 | | | | 669 | | | | 448,230 | |
Sr. Sec’d. Notes, 144A | | | 8.750 | | | | 05/25/24 | | | | 1,138 | | | | 964,112 | |
See Notes to Financial Statements.
34
| | | | | | | | | | | | | | | | |
| | | | |
| Description | | Interest
Rate | | | Maturity
Date | | | Principal
Amount
(000)# | | | Value | |
| | | | |
CORPORATE BONDS (Continued) | | | | | | | | | | | | | | | | |
| | | | |
Telecommunications (cont’d.) | | | | | | | | | | | | | | | | |
Digicel Ltd. (Jamaica), | | | | | | | | | | | | | | | | |
Gtd. Notes, 144A | | | 6.750% | | | | 03/01/23 | | | | 2,050 | | | $ | 1,086,500 | |
Intelsat Jackson Holdings SA (Luxembourg), | | | | | | | | | | | | | | | | |
Gtd. Notes^ | | | 5.500 | | | | 08/01/23(d) | | | | 2,000 | | | | 2 | |
Gtd. Notes, 144A^ | | | 8.500 | | | | 10/15/24(d) | | | | 50 | | | | — | |
Gtd. Notes, 144A^ | | | 9.750 | | | | 07/15/25(d) | | | | 50 | | | | — | |
Sr. Sec’d. Notes, 144A(a) | | | 6.500 | | | | 03/15/30 | | | | 1,400 | | | | 1,283,996 | |
Kaixo Bondco Telecom SA (Spain), | | | | | | | | | | | | | | | | |
Sr. Sec’d. Notes, 144A | | | 5.125 | | | | 09/30/29 | | | EUR | 2,600 | | | | 2,062,523 | |
Level 3 Financing, Inc., | | | | | | | | | | | | | | | | |
Sr. Sec’d. Notes, 144A | | | 3.400 | | | | 03/01/27 | | | | 465 | | | | 400,852 | |
Lumen Technologies, Inc., | | | | | | | | | | | | | | | | |
Sr. Unsec’d. Notes, Series P | | | 7.600 | | | | 09/15/39 | | | | 525 | | | | 362,777 | |
Millicom International Cellular SA (Colombia), | | | | | | | | | | | | | | | | |
Sr. Unsec’d. Notes, 144A | | | 4.500 | | | | 04/27/31 | | | | 515 | | | | 385,220 | |
Sprint Corp., | | | | | | | | | | | | | | | | |
Gtd. Notes | | | 7.125 | | | | 06/15/24 | | | | 2,000 | | | | 2,031,256 | |
Gtd. Notes | | | 7.625 | | | | 02/15/25 | | | | 1,150 | | | | 1,187,428 | |
Total Play Telecomunicaciones SA de CV (Mexico), | | | | | | | | | | | | | | | | |
Gtd. Notes, 144A | | | 6.375 | | | | 09/20/28 | | | | 480 | | | | 330,990 | |
Verizon Communications, Inc., | | | | | | | | | | | | | | | | |
Sr. Unsec’d. Notes | | | 3.400 | | | | 03/22/41 | | | | 1,575 | | | | 1,117,040 | |
| | | | | | | | | | | | | | | | |
| | | | |
| | | | | | | | | | | | | | | 14,554,111 | |
| | | | |
Transportation 0.0% | | | | | | | | | | | | | | | | |
| | | | |
Burlington Northern Santa Fe LLC, | | | | | | | | | | | | | | | | |
Sr. Unsec’d. Notes(h) | | | 4.450 | | | | 01/15/53 | | | | 225 | | | | 188,914 | |
| | | | |
Indian Railway Finance Corp. Ltd. (India), | | | | | | | | | | | | | | | | |
Sr. Unsec’d. Notes, 144A, MTN | | | 3.570 | | | | 01/21/32 | | | | 360 | | | | 280,305 | |
| | | | | | | | | | | | | | | | |
| | | | |
| | | | | | | | | | | | | | | 469,219 | |
| | | | | | | | | | | | | | | | |
| | | | |
TOTAL CORPORATE BONDS | | | | | | | | | | | | | | | | |
(cost $321,407,663) | | | | | | | | | | | | | | | 264,350,879 | |
| | | | | | | | | | | | | | | | |
| | | | |
FLOATING RATE AND OTHER LOANS 1.2% | | | | | | | | | | | | | | | | |
| | | | |
Airlines 0.0% | | | | | | | | | | | | | | | | |
| | | | |
United Airlines, Inc., | | | | | | | | | | | | | | | | |
Class B Term Loan, 3 Month LIBOR + 3.750% | | | 8.108(c) | | | | 04/21/28 | | | | 494 | | | | 481,446 | |
See Notes to Financial Statements.
PGIM Absolute Return Bond Fund 35
Schedule of Investments (continued)
as of October 31, 2022
| | | | | | | | | | | | | | | | |
| | | | |
| Description | | Interest
Rate | | | Maturity
Date | | | Principal
Amount
(000)# | | | Value | |
| | | | |
FLOATING RATE AND OTHER LOANS (Continued) | | | | | | | | | | | | | | | | |
| | | | |
Chemicals 0.0% | | | | | | | | | | | | | | | | |
| | | | |
TPC Group, Inc., | | | | | | | | | | | | | | | | |
Term Loan DIP Facility, 1 - 3 Month SOFR + 10.114%^ | | | 13.383%(c) | | | | 03/01/23 | | | | 165 | | | $ | 165,211 | |
| | | | |
Computers 0.1% | | | | | | | | | | | | | | | | |
| | | | |
McAfee Corp., | | | | | | | | | | | | | | | | |
Tranche B-1 Term Loan, 1 Month SOFR + 3.750% | | | 6.870(c) | | | | 03/01/29 | | | | 1,022 | | | | 929,992 | |
| | | | |
Internet 0.1% | | | | | | | | | | | | | | | | |
| | | | |
Speedster Bidco GmbH (Germany), | | | | | | | | | | | | | | | | |
Second Lien Term Loan, 3 Month EURIBOR + 6.250% | | | 8.108(c) | | | | 03/31/28 | | | EUR | 2,400 | | | | 1,943,394 | |
| | | | |
Investment Companies 0.2% | | | | | | | | | | | | | | | | |
| | | | |
Rainbow Midco Ltd. (United Kingdom), | | | | | | | | | | | | | | | | |
Term Loan, 3 Month EURIBOR + 7.750%^ | | | 7.750(c) | | | | 02/22/30 | | | | 2,500 | | | | 2,322,387 | |
| | | | |
Media 0.0% | | | | | | | | | | | | | | | | |
| | | | |
Diamond Sports Group LLC, | | | | | | | | | | | | | | | | |
First Lien Term Loan, 1 Month SOFR + 8.100% | | | 11.208(c) | | | | 05/25/26 | | | | 41 | | | | 38,862 | |
Second Lien Term Loan, 1 Month SOFR + 3.350% | | | 6.458(c) | | | | 08/24/26 | | | | 2,070 | | | | 397,613 | |
| | | | | | | | | | | | | | | | |
| | | | |
| | | | | | | | | | | | | | | 436,475 | |
| | | | |
Metal Fabricate/Hardware 0.1% | | | | | | | | | | | | | | | | |
| | | | |
Tank Holding Corp., | | | | | | | | | | | | | | | | |
Initial Term Loan, 1 Month SOFR + 5.850% | | | 9.579(c) | | | | 03/31/28 | | | | 1,147 | | | | 1,095,026 | |
| | | | |
Oil & Gas 0.2% | | | | | | | | | | | | | | | | |
| | | | |
Ascent Resources Utica Holdings LLC, | | | | | | | | | | | | | | | | |
Second Lien Term Loan, 3 Month LIBOR + 9.000% | | | 12.941(c) | | | | 11/01/25 | | | | 1,858 | | | | 1,947,803 | |
| | | | |
Retail 0.3% | | | | | | | | | | | | | | | | |
| | | | |
CD&R Firefly Bidco Ltd. (United Kingdom), | | | | | | | | | | | | | | | | |
Initial Term Loan, SONIA + 8.356% | | | 9.546(c) | | | | 06/19/26 | | | GBP | 3,300 | | | | 3,311,385 | |
| | | | |
Constellation Automotive Group Ltd. (United Kingdom), | | | | | | | | | | | | | | | | |
Facility 1 Loan, SONIA + 7.500% | | | 9.190(c) | | | | 07/27/29 | | | GBP | 1,025 | | | | 658,263 | |
| | | | | | | | | | | | | | | | |
| | | | |
| | | | | | | | | | | | | | | 3,969,648 | |
See Notes to Financial Statements.
36
| | | | | | | | | | | | | | | | |
| | | | |
| Description | | Interest
Rate | | | Maturity
Date | | | Principal
Amount
(000)# | | | Value | |
| | | | |
FLOATING RATE AND OTHER LOANS (Continued) | | | | | | | | | | | | | | | | |
| | | | |
Telecommunications 0.2% | | | | | | | | | | | | | | | | |
| | | | |
West Corp., | | | | | | | | | | | | | | | | |
Initial Term B Loan, 3 Month LIBOR + 4.000% | | | 8.415%(c) | | | | 10/10/24 | | | | 2,359 | | | $ | 2,065,121 | |
| | | | | | | | | | | | | | | | |
| | | | |
TOTAL FLOATING RATE AND OTHER LOANS | | | | | | | | | | | | | | | | |
(cost $18,916,272) | | | | | | | | | | | | | | | 15,356,503 | |
| | | | | | | | | | | | | | | | |
| | | | |
MUNICIPAL BONDS 1.4% | | | | | | | | | | | | | | | | |
| | | | |
California 0.3% | | | | | | | | | | | | | | | | |
| | | | |
Bay Area Toll Authority, | | | | | | | | | | | | | | | | |
Revenue Bonds, BABs, Series F2 | | | 6.263 | | | | 04/01/49 | | | | 550 | | | | 593,601 | |
Los Angeles Department of Water & Power, Water System Revenue, | | | | | | | | | | | | | | | | |
Taxable, Revenue Bonds, BABs, Series C | | | 6.008 | | | | 07/01/39 | | | | 1,730 | | | | 1,790,935 | |
University of California, | | | | | | | | | | | | | | | | |
Taxable, Revenue Bonds, Series AP | | | 3.931 | | | | 05/15/45 | | | | 625 | | | | 535,220 | |
Taxable, Revenue Bonds, Series J | | | 4.131 | | | | 05/15/45 | | | | 675 | | | | 567,964 | |
| | | | | | | | | | | | | | | | |
| | | | |
| | | | | | | | | | | | | | | 3,487,720 | |
| | | | |
Colorado 0.1% | | | | | | | | | | | | | | | | |
| | | | |
Regional Transportation District Sales Tax Revenue, | | | | | | | | | | | | | | | | |
Revenue Bonds, BABs, Series B | | | 5.844 | | | | 11/01/50 | | | | 1,190 | | | | 1,234,847 | |
| | | | |
Illinois 0.1% | | | | | | | | | | | | | | | | |
| | | | |
State of Illinois, | | | | | | | | | | | | | | | | |
General Obligation Unlimited, Taxable | | | 5.100 | | | | 06/01/33 | | | | 865 | | | | 804,189 | |
| | | | |
New Jersey 0.2% | | | | | | | | | | | | | | | | |
| | | | |
New Jersey Turnpike Authority, | | | | | | | | | | | | | | | | |
Taxable, Revenue Bonds, BABs, Series F | | | 7.414 | | | | 01/01/40 | | | | 2,000 | | | | 2,346,244 | |
Rutgers The State University of New Jersey, | | | | | | | | | | | | | | | | |
Taxable, Revenue Bonds, BABs, Series H | | | 5.665 | | | | 05/01/40 | | | | 200 | | | | 197,897 | |
| | | | | | | | | | | | | | | | |
| | | | |
| | | | | | | | | | | | | | | 2,544,141 | |
| | | | |
Ohio 0.0% | | | | | | | | | | | | | | | | |
| | | | |
Ohio State University (The), | | | | | | | | | | | | | | | | |
Taxable, Revenue Bonds, Series A | | | 4.800 | | | | 06/01/2111 | | | | 180 | | | | 143,331 | |
See Notes to Financial Statements.
PGIM Absolute Return Bond Fund 37
Schedule of Investments (continued)
as of October 31, 2022
| | | | | | | | | | | | | | | | |
| | | | |
| Description | | Interest
Rate | | | Maturity
Date | | | Principal
Amount
(000)# | | | Value | |
| | | | |
MUNICIPAL BONDS (Continued) | | | | | | | | | | | | | | | | |
| | | | |
Puerto Rico 0.7% | | | | | | | | | | | | | | | | |
| | | | |
Commonwealth of Puerto Rico, | | | | | | | | | | | | | | | | |
General Obligation, Sub-Series C | | | 0.000%(cc) | | | | 11/01/43 | | | | 9,167 | | | $ | 4,288,093 | |
Puerto Rico Sales Tax Financing Corp. Sales Tax Revenue, | | | | | | | | | | | | | | | | |
Revenue Bonds, Restructured, Series A-1 | | | 4.750 | | | | 07/01/53 | | | | 5,846 | | | | 4,890,413 | |
| | | | | | | | | | | | | | | | |
| | | | | | | | | | | | | | | 9,178,506 | |
| | | | |
Texas 0.0% | | | | | | | | | | | | | | | | |
| | | | |
City of San Antonio Electric & Gas Systems Revenue, | | | | | | | | | | | | | | | | |
Taxable, Revenue Bonds | | | 4.427 | | | | 02/01/42 | | | | 120 | | | | 107,656 | |
| | | | | | | | | | | | | | | | |
| | | | |
TOTAL MUNICIPAL BONDS | | | | | | | | | | | | | | | | |
(cost $20,376,806) | | | | | | | | | | | | | | | 17,500,390 | |
| | | | | | | | | | | | | | | | |
| | | | |
RESIDENTIAL MORTGAGE-BACKED SECURITIES 2.2% | | | | | | | | | | | | | | | | |
| | | | |
Banc of America Funding Trust, | | | | | | | | | | | | | | | | |
Series 2014-R05, Class 1A1, 144A, 6 Month LIBOR + 1.500% (Cap 11.000%, Floor 1.500%) | | | 5.683(c) | | | | 09/26/45 | | | | 31 | | | | 31,270 | |
Bellemeade Re Ltd., | | | | | | | | | | | | | | | | |
Series 2018-03A, Class M1B, 144A, 1 Month LIBOR + 1.850% (Cap N/A, Floor 1.850%) | | | 5.436(c) | | | | 10/25/28 | | | | 474 | | | | 472,794 | |
Series 2021-01A, Class M1C, 144A, 30 Day Average SOFR + 2.950% (Cap N/A, Floor 2.950%) | | | 5.947(c) | | | | 03/25/31 | | | | 960 | | | | 928,975 | |
Chase Mortgage Finance Trust, | | | | | | | | | | | | | | | | |
Series 2007-A01, Class 1A3 | | | 3.139(cc) | | | | 02/25/37 | | | | 41 | | | | 38,972 | |
Connecticut Avenue Securities Trust, | | | | | | | | | | | | | | | | |
Series 2020-R01, Class 1M2, 144A, 1 Month LIBOR + 2.050% (Cap N/A, Floor 2.050%) | | | 5.636(c) | | | | 01/25/40 | | | | 61 | | | | 60,096 | |
Series 2021-R01, Class 1B1, 144A, 30 Day Average SOFR + 3.100% (Cap N/A, Floor 0.000%) | | | 6.097(c) | | | | 10/25/41 | | | | 990 | | | | 894,241 | |
Series 2022-R01, Class 1B1, 144A, 30 Day Average SOFR + 3.150% (Cap N/A, Floor 0.000%) | | | 6.147(c) | | | | 12/25/41 | | | | 1,718 | | | | 1,526,085 | |
Series 2022-R02, Class 2B1, 144A, 30 Day Average SOFR + 4.500% (Cap N/A, Floor 0.000%) | | | 7.497(c) | | | | 01/25/42 | | | | 440 | | | | 394,350 | |
Series 2022-R04, Class 1B1, 144A, 30 Day Average SOFR + 5.250% (Cap N/A, Floor 0.000%) | | | 8.247(c) | | | | 03/25/42 | | | | 290 | | | | 273,320 | |
See Notes to Financial Statements.
38
| | | | | | | | | | | | | | | | |
| | | | |
| Description | | Interest
Rate | | | Maturity
Date | | | Principal
Amount
(000)# | | | Value | |
| | | | |
RESIDENTIAL MORTGAGE-BACKED SECURITIES (Continued) | | | | | | | | | | | | | | | | |
Connecticut Avenue Securities Trust, (cont’d.) | | | | | | | | | | | | | | | | |
Series 2022-R08, Class 1B1, 144A, 30 Day Average SOFR + 5.600% (Cap N/A, Floor 5.600%) | | | 8.597%(c) | | | | 07/25/42 | | | | 1,520 | | | $ | 1,441,984 | |
Eagle Re Ltd., | | | | | | | | | | | | | | | | |
Series 2018-01, Class M1, 144A, 1 Month LIBOR + 1.700% (Cap N/A, Floor 1.700%) | | | 5.286(c) | | | | 11/25/28 | | | | 1,893 | | | | 1,878,041 | |
Series 2021-02, Class M1C, 144A, 30 Day Average SOFR + 3.450% (Cap N/A, Floor 3.450%) | | | 6.447(c) | | | | 04/25/34 | | | | 910 | | | | 879,949 | |
FHLMC Structured Agency Credit Risk Debt Notes, | | | | | | | | | | | | | | | | |
Series 2021-DNA02, Class B1, 144A, 30 Day Average SOFR + 3.400% (Cap N/A, Floor 0.000%) | | | 6.397(c) | | | | 08/25/33 | | | | 3,260 | | | | 2,810,996 | |
FHLMC Structured Agency Credit Risk REMIC Trust, | | | | | | | | | | | | | | | | |
Series 2021-DNA05, Class B1, 144A, 30 Day Average SOFR + 3.050% (Cap N/A, Floor 0.000%) | | | 6.047(c) | | | | 01/25/34 | | | | 600 | | | | 521,552 | |
Series 2021-DNA07, Class B1, 144A, 30 Day Average SOFR + 3.650% (Cap N/A, Floor 0.000%) | | | 6.647(c) | | | | 11/25/41 | | | | 695 | | | | 611,221 | |
Series 2021-HQA03, Class B1, 144A, 30 Day Average SOFR + 3.350% (Cap N/A, Floor 0.000%) | | | 6.347(c) | | | | 09/25/41 | | | | 570 | | | | 487,200 | |
Series 2022-DNA03, Class M1B, 144A, 30 Day Average SOFR + 2.900% (Cap N/A, Floor 0.000%) | | | 5.897(c) | | | | 04/25/42 | | | | 1,920 | | | | 1,780,802 | |
Series 2022-HQA03, Class M2, 144A, 30 Day Average SOFR + 5.350% (Cap N/A, Floor 0.000%) | | | 8.347(c) | | | | 08/25/42 | | | | 2,500 | | | | 2,335,315 | |
GSMSC Resecuritization Trust, | | | | | | | | | | | | | | | | |
Series 2015-03R, Class 2A2, 144A, 1 Month LIBOR + 0.140% (Cap N/A, Floor 0.140%) | | | 3.726(c) | | | | 10/26/36 | | | | 764 | | | | 752,847 | |
JPMorgan Mortgage Trust, | | | | | | | | | | | | | | | | |
Series 2007-A01, Class 4A1 | | | 3.940(cc) | | | | 07/25/35 | | | | 25 | | | | 24,133 | |
New Residential Mortgage Loan Trust, | | | | | | | | | | | | | | | | |
Series 2018-04A, Class A1S, 144A, 1 Month LIBOR + 0.750% (Cap N/A, Floor 0.750%) | | | 4.336(c) | | | | 01/25/48 | | | | 1,474 | | | | 1,419,993 | |
Oaktown Re II Ltd., | | | | | | | | | | | | | | | | |
Series 2018-01A, Class M1, 144A, 1 Month LIBOR + 1.550% (Cap N/A, Floor 0.000%) | | | 5.136(c) | | | | 07/25/28 | | | | 310 | | | | 309,432 | |
See Notes to Financial Statements.
PGIM Absolute Return Bond Fund 39
Schedule of Investments (continued)
as of October 31, 2022
| | | | | | | | | | | | | | | | |
| | | | |
| Description | | Interest
Rate | | | Maturity
Date | | | Principal
Amount
(000)# | | | Value | |
| | | | |
RESIDENTIAL MORTGAGE-BACKED SECURITIES (Continued) | | | | | | | | | | | | | | | | |
Oaktown Re VII Ltd., | | | | | | | | | | | | | | | | |
Series 2021-02, Class M1B, 144A, 30 Day Average SOFR + 2.900% (Cap N/A, Floor 2.900%) | | | 5.897%(c) | | | | 04/25/34 | | | | 1,000 | | | $ | 933,754 | |
PNMAC GMSR Issuer Trust, | | | | | | | | | | | | | | | | |
Series 2018-GT01, Class A, 144A, 1 Month LIBOR + 2.850% (Cap N/A, Floor 2.850%) | | | 6.436(c) | | | | 02/25/23 | | | | 1,650 | | | | 1,628,275 | |
Series 2018-GT02, Class A, 144A, 1 Month LIBOR + 2.650% (Cap N/A, Floor 0.000%) | | | 6.236(c) | | | | 08/25/25 | | | | 3,400 | | | | 3,330,799 | |
Radnor Re Ltd., | | | | | | | | | | | | | | | | |
Series 2018-01, Class M1, 144A, 1 Month LIBOR + 1.400% (Cap N/A, Floor 0.000%) | | | 4.986(c) | | | | 03/25/28 | | | | 92 | | | | 92,239 | |
Series 2018-01, Class M2, 144A, 1 Month LIBOR + 2.700% (Cap N/A, Floor 0.000%) | | | 6.286(c) | | | | 03/25/28 | | | | 1,240 | | | | 1,232,293 | |
Series 2021-02, Class M1B, 144A, 30 Day Average SOFR + 3.700% (Cap N/A, Floor 3.700%) | | | 6.697(c) | | | | 11/25/31 | | | | 1,000 | | | | 939,138 | |
Retiro Mortgage Securities DAC (Spain), | | | | | | | | | | | | | | | | |
Series 01A, Class A1, 144A, 3 Month EURIBOR + 2.000% (Cap 5.000%, Floor 0.000%) | | | 3.578(c) | | | | 07/30/75 | | | EUR | 845 | | | | 822,601 | |
Structured Asset Securities Corp. Mortgage Pass-Through Certificates, | | | | | | | | | | | | | | | | |
Series 2003-37A, Class 3A7 | | | 3.397(cc) | | | | 12/25/33 | | | | 254 | | | | 241,559 | |
| | | | | | | | | | | | | | | | |
| | | | |
TOTAL RESIDENTIAL MORTGAGE-BACKED SECURITIES | | | | | | | | | | | | | | | | |
(cost $30,949,476) | | | | | | | | | | | | | | | 29,094,226 | |
| | | | | | | | | | | | | | | | |
| | | | |
SOVEREIGN BONDS 1.8% | | | | | | | | | | | | | | | | |
1MDB Global Investments Ltd. (Malaysia), | | | | | | | | | | | | | | | | |
Sr. Unsec’d. Notes | | | 4.400 | | | | 03/09/23 | | | | 1,000 | | | | 977,500 | |
Bermuda Government International Bond (Bermuda), | | | | | | | | | | | | | | | | |
Sr. Unsec’d. Notes, 144A(a) | | | 2.375 | | | | 08/20/30 | | | | 685 | | | | 537,211 | |
Brazil Loan Trust 1 (Brazil), | | | | | | | | | | | | | | | | |
Gov’t. Gtd. Notes | | | 5.477 | | | | 07/24/23 | | | | 161 | | | | 159,228 | |
Brazil Minas SPE via State of Minas Gerais (Brazil), | | | | | | | | | | | | | | | | |
Gov’t. Gtd. Notes | | | 5.333 | | | | 02/15/28 | | | | 1,974 | | | | 1,892,943 | |
Dominican Republic International Bond (Dominican Republic), | | | | | | | | | | | | | | | | |
Sr. Unsec’d. Notes | | | 5.500 | | | | 02/22/29 | | | | 261 | | | | 226,874 | |
Sr. Unsec’d. Notes, 144A | | | 5.500 | | | | 02/22/29 | | | | 1,915 | | | | 1,664,614 | |
Sr. Unsec’d. Notes, 144A | | | 5.950 | | | | 01/25/27 | | | | 1,570 | | | | 1,461,866 | |
Hellenic Republic Government International Bond (Greece), | | | | | | | | | | | | | | | | |
Sr. Unsec’d. Notes | | | 5.200 | | | | 07/17/34 | | | EUR | 5,485 | | | | 5,374,422 | |
See Notes to Financial Statements.
40
| | | | | | | | | | | | | | | | |
| | | | |
| Description | | Interest
Rate | | | Maturity
Date | | | Principal
Amount
(000)# | | | Value | |
| | | | |
SOVEREIGN BONDS (Continued) | | | | | | | | | | | | | | | | |
Hellenic Republic Government International Bond (Greece), (cont’d.) | | | | | | | | | | | | | | | | |
Sr. Unsec’d. Notes | | | 6.140% | | | | 04/14/28 | | | EUR | 2,000 | | | $ | 2,115,883 | |
Indonesia Government International Bond (Indonesia), | | | | | | | | | | | | | | | | |
Sr. Unsec’d. Notes | | | 1.100 | | | | 03/12/33 | | | EUR | 410 | | | | 265,370 | |
Sr. Unsec’d. Notes | | | 1.450 | | | | 09/18/26 | | | EUR | 805 | | | | 696,248 | |
Sr. Unsec’d. Notes | | | 3.375 | | | | 07/30/25 | | | EUR | 2,655 | | | | 2,542,302 | |
Ivory Coast Government International Bond (Ivory Coast), | | | | | | | | | | | | | | | | |
Sr. Unsec’d. Notes(a) | | | 5.125 | | | | 06/15/25 | | | EUR | 500 | | | | 458,085 | |
Sr. Unsec’d. Notes, 144A | | | 5.125 | | | | 06/15/25 | | | EUR | 1,650 | | | | 1,511,680 | |
Serbia International Bond (Serbia), | | | | | | | | | | | | | | | | |
Sr. Unsec’d. Notes | | | 1.500 | | | | 06/26/29 | | | EUR | 366 | | | | 253,257 | |
Sr. Unsec’d. Notes | | | 3.125 | | | | 05/15/27 | | | EUR | 1,844 | | | | 1,549,325 | |
Sr. Unsec’d. Notes, 144A | | | 1.500 | | | | 06/26/29 | | | EUR | 1,660 | | | | 1,148,654 | |
Ukraine Government International Bond (Ukraine), | | | | | | | | | | | | | | | | |
Sr. Unsec’d. Notes | | | 4.375 | | | | 01/27/32(d) | | | EUR | 1,866 | | | | 276,611 | |
Sr. Unsec’d. Notes | | | 8.994 | | | | 02/01/26(d) | | | | 350 | | | | 64,269 | |
Sr. Unsec’d. Notes, 144A | | | 4.375 | | | | 01/27/32(d) | | | EUR | 1,265 | | | | 187,520 | |
Sr. Unsec’d. Notes, 144A | | | 7.750 | | | | 09/01/24(d) | | | | 1,560 | | | | 384,930 | |
Sr. Unsec’d. Notes, 144A | | | 8.994 | | | | 02/01/26(d) | | | | 800 | | | | 146,900 | |
| | | | | | | | | | | | | | | | |
| | | | |
TOTAL SOVEREIGN BONDS | | | | | | | | | | | | | | | | |
(cost $31,457,992) | | | | | | | | | | | | | | | 23,895,692 | |
| | | | | | | | | | | | | | | | |
| | | | |
U.S. GOVERNMENT AGENCY OBLIGATIONS 6.0% | | | | | | | | | | | | | | | | |
Federal National Mortgage Assoc. | | | 3.500 | | | | TBA(tt) | | | | 6,000 | | | | 5,272,907 | |
Federal National Mortgage Assoc. | | | 3.500 | | | | TBA | | | | 7,000 | | | | 6,148,716 | |
Federal National Mortgage Assoc. | | | 5.000 | | | | TBA(tt) | | | | 18,500 | | | | 17,838,770 | |
Federal National Mortgage Assoc. | | | 5.000 | | | | TBA | | | | 39,000 | | | | 37,561,875 | |
Federal National Mortgage Assoc. | | | 5.500 | | | | TBA | | | | 10,000 | | | | 9,842,524 | |
Government National Mortgage Assoc. | | | 3.500 | | | | TBA | | | | 500 | | | | 447,221 | |
Government National Mortgage Assoc. | | | 3.500 | | | | TBA(tt) | | | | 1,500 | | | | 1,342,367 | |
| | | | | | | | | | | | | | | | |
| | | | |
TOTAL U.S. GOVERNMENT AGENCY OBLIGATIONS | | | | | | | | | | | | | | | | |
(cost $78,223,574) | | | | | | | | | | | | | | | 78,454,380 | |
| | | | | | | | | | | | | | | | |
| | | | |
U.S. TREASURY OBLIGATIONS 31.8% | | | | | | | | | | | | | | | | |
U.S. Treasury Bonds(h)(k) | | | 1.375 | | | | 11/15/40 | | | | 15,930 | | | | 9,839,264 | |
U.S. Treasury Bonds(h)(k) | | | 2.250 | | | | 05/15/41 | | | | 94,925 | | | | 68,464,656 | |
U.S. Treasury Bonds | | | 2.375 | | | | 02/15/42 | | | | 951 | | | | 694,527 | |
U.S. Treasury Bonds(h)(k) | | | 2.500 | | | | 02/15/45 | | | | 3,505 | | | | 2,521,957 | |
U.S. Treasury Bonds | | | 2.875 | | | | 05/15/52 | | | | 36,330 | | | | 28,212,516 | |
U.S. Treasury Bonds(k) | | | 3.625 | | | | 08/15/43 | | | | 11,120 | | | | 9,858,575 | |
U.S. Treasury Notes | | | 0.375 | | | | 01/31/26 | | | | 110,970 | | | | 97,497,548 | |
See Notes to Financial Statements.
PGIM Absolute Return Bond Fund 41
Schedule of Investments (continued)
as of October 31, 2022
| | | | | | | | | | | | | | | | |
| | | | |
| Description | | Interest
Rate | | | Maturity
Date | | | Principal
Amount
(000)# | | | Value | |
| | | | |
U.S. TREASURY OBLIGATIONS(Continued) | | | | | | | | | | | | | | | | |
U.S. Treasury Notes | | | 1.375% | | | | 01/31/25 | | | | 20,645 | | | $ | 19,295,011 | |
U.S. Treasury Notes(k) | | | 1.500 | | | | 11/30/28 | | | | 19,740 | | | | 16,854,567 | |
U.S. Treasury Notes(k) | | | 2.250 | | | | 11/15/24 | | | | 60,395 | | | | 57,757,437 | |
U.S. Treasury Notes | | | 2.250 | | | | 11/15/27 | | | | 150 | | | | 136,313 | |
U.S. Treasury Notes | | | 2.375 | | | | 03/31/29 | | | | 24,875 | | | | 22,286,445 | |
U.S. Treasury Notes | | | 3.125 | | | | 08/31/29 | | | | 72,080 | | | | 67,563,738 | |
U.S. Treasury Strips Coupon | | | 2.415(s) | | | | 11/15/40 | | | | 1,035 | | | | 458,756 | |
U.S. Treasury Strips Coupon | | | 3.019(s) | | | | 11/15/35 | | | | 870 | | | | 491,550 | |
U.S. Treasury Strips Coupon | | | 3.507(s) | | | | 11/15/41 | | | | 24,000 | | | | 10,066,875 | |
U.S. Treasury Strips Coupon | | | 3.575(s) | | | | 08/15/41 | | | | 165 | | | | 70,654 | |
| | | | | | | | | | | | | | | | |
| | | | |
TOTAL U.S. TREASURY OBLIGATIONS | | | | | | | | | | | | | | | | |
(cost $456,294,042) | | | | | | | | | | | | | | | 412,070,389 | |
| | | | | | | | | | | | | | | | |
| | | | |
| | | | | | | | | | | Shares | | | | | |
| | | | |
COMMON STOCKS 0.3% | | | | | | | | | | | | | | | | |
| | | | |
Gas Utilities 0.1% | | | | | | | | | | | | | | | | |
| | | | |
Ferrellgas Partners LP (Class B Stock) (original cost $1,794,337; | | | | | | | | | | | | | | | | |
purchased 10/25/19)^(f) | | | | | | | | | | | 6,534 | | | | 1,362,600 | |
| | | | |
Hotels, Restaurants & Leisure 0.0% | | | | | | | | | | | | | | | | |
| | | | |
Codere New Topco SA (Spain) (original cost $0; purchased 11/19/21)^(f) | | | | | | | | | | | 29,207 | | | | — | |
| | | | |
Oil, Gas & Consumable Fuels 0.2% | | | | | | | | | | | | | | | | |
| | | | |
Chesapeake Energy Corp. | | | | | | | | | | | 16,760 | | | | 1,714,045 | |
| | | | |
Chesapeake Energy Corp. Backstop Commitment | | | | | | | | | | | 1,449 | | | | 148,190 | |
| | | | | | | | | | | | | | | | |
| | | | |
| | | | | | | | | | | | | | | 1,862,235 | |
| | | | |
Wireless Telecommunication Services 0.0% | | | | | | | | | | | | | | | | |
| | | | |
Intelsat Emergence SA (Luxembourg)* | | | | | | | | | | | 19,659 | | | | 522,929 | |
| | | | | | | | | | | | | | | | |
| | | | |
TOTAL COMMON STOCKS | | | | | | | | | | | | | | | | |
(cost $1,964,040) | | | | | | | | | | | | | | | 3,747,764 | |
| | | | | | | | | | | | | | | | |
| | | | |
| | | | | | | | | | | Units | | | | | |
| | | | |
RIGHTS* 0.0% | | | | | | | | | | | | | | | | |
| | | | |
Wireless Telecommunication Services | | | | | | | | | | | | | | | | |
| | | | |
Intelsat Jackson Holdings SA, Series A (Luxembourg), CVR, expiring 12/05/25^ | | | | | | | | | | | 2,057 | | | | 19,605 | |
See Notes to Financial Statements.
42
| | | | | | | | |
| | |
| Description | | Units | | | Value | |
| | |
RIGHTS* (Continued) | | | | | | | | |
| | |
Wireless Telecommunication Services (cont’d.) | | | | | | | | |
| | |
Intelsat Jackson Holdings SA, Series B (Luxembourg), CVR, expiring 12/05/25^ | | | 2,057 | | | $ | 4,072 | |
| | | | | | | | |
| | |
TOTAL RIGHTS | | | | | | | | |
(cost $0) | | | | | | | 23,677 | |
| | | | | | | | |
| | |
WARRANTS* 0.0% | | | | | | | | |
| | |
Chemicals | | | | | | | | |
| | |
TPC Group, Inc., expiring 08/01/24^ | | | | | | | | |
(cost $0) | | | 1,190,967 | | | | 119 | |
| | | | | | | | |
| | |
TOTAL LONG-TERM INVESTMENTS | | | | | | | | |
(cost $1,351,485,858) | | | | | | | 1,211,364,900 | |
| | | | | | | | |
| | |
| | | Shares | | | | |
| | |
SHORT-TERM INVESTMENTS 14.5% | | | | | | | | |
| | |
AFFILIATED MUTUAL FUNDS 10.3% | | | | | | | | |
| | |
PGIM Core Short-Term Bond Fund(wc) | | | 12,040,788 | | | | 109,571,168 | |
| | |
PGIM Institutional Money Market Fund | | | | | | | | |
(cost $24,327,130; includes $24,264,779 of cash collateral for securities on loan)(b)(wc) | | | 24,358,169 | | | | 24,336,247 | |
| | | | | | | | |
| | |
TOTAL AFFILIATED MUTUAL FUNDS | | | | | | | | |
(cost $133,996,372) | | | | | | | 133,907,415 | |
| | | | | | | | |
| | |
UNAFFILIATED FUND 3.6% | | | | | | | | |
| | |
Dreyfus Government Cash Management (Institutional Shares) | | | | | | | | |
(cost $46,674,293) | | | 46,674,293 | | | | 46,674,293 | |
| | | | | | | | |
| | |
OPTIONS PURCHASED*~ 0.6% | | | | | | | | |
(cost $1,790,157) | | | | | | | 7,385,358 | |
| | | | | | | | |
| | |
TOTAL SHORT-TERM INVESTMENTS | | | | | | | | |
(cost $182,460,822) | | | | | | | 187,967,066 | |
| | | | | | | | |
| | |
TOTAL INVESTMENTS, BEFORE OPTIONS WRITTEN 107.9% | | | | | | | | |
(cost $1,533,946,680) | | | | | | | 1,399,331,966 | |
| | | | | | | | |
See Notes to Financial Statements.
PGIM Absolute Return Bond Fund 43
Schedule of Investments (continued)
as of October 31, 2022
| | | | | | | | |
| | |
| Description | | | | | Value | |
| | |
OPTIONS WRITTEN*~ (0.6)% | | | | | | | | |
(premiums received $1,861,279) | | | | | | $ | (7,272,841 | ) |
| | | | | | | | |
| | |
TOTAL INVESTMENTS, NET OF OPTIONS WRITTEN 107.3% | | | | | | | | |
(cost $1,532,085,401) | | | | | | | 1,392,059,125 | |
| | |
Liabilities in excess of other assets(z) (7.3)% | | | | | | | (95,073,015 | ) |
| | | | | | | | |
| | |
NET ASSETS 100.0% | | | | | | $ | 1,296,986,110 | |
| | | | | | | | |
Below is a list of the abbreviation(s) used in the annual report:
AUD—Australian Dollar
BRL—Brazilian Real
CAD—Canadian Dollar
CHF—Swiss Franc
CLP—Chilean Peso
CNH—Chinese Renminbi
COP—Colombian Peso
CZK—Czech Koruna
EUR—Euro
GBP—British Pound
HUF—Hungarian Forint
IDR—Indonesian Rupiah
ILS—Israeli Shekel
INR—Indian Rupee
JPY—Japanese Yen
KRW—South Korean Won
MXN—Mexican Peso
PEN—Peruvian Nuevo Sol
PHP—Philippine Peso
PLN—Polish Zloty
SGD—Singapore Dollar
THB—Thai Baht
TRY—Turkish Lira
TWD—New Taiwanese Dollar
USD—US Dollar
ZAR—South African Rand
144A—Security was purchased pursuant to Rule 144A under the Securities Act of 1933 and, pursuant to the requirements of Rule 144A, may not be resold except to qualified institutional buyers.
A—Annual payment frequency for swaps
ABS—Asset-Backed Security
BABs—Build America Bonds
BARC—Barclays Bank PLC
BNP—BNP Paribas S.A.
BOA—Bank of America, N.A.
CDX—Credit Derivative Index
CIGM—Citigroup Global Markets, Inc.
CITI—Citibank, N.A.
CLO—Collateralized Loan Obligation
CMBX—Commercial Mortgage-Backed Index
CME—Chicago Mercantile Exchange
See Notes to Financial Statements.
44
CSI—Credit Suisse International
CVR—Contingent Value Rights
DB—Deutsche Bank AG
DIP—Debtor-In-Possession
EMTN—Euro Medium Term Note
EURIBOR—Euro Interbank Offered Rate
FHLMC—Federal Home Loan Mortgage Corporation
GMTN—Global Medium Term Note
GSI—Goldman Sachs International
HSBC—HSBC Bank PLC
IO—Interest Only (Principal amount represents notional)
JPM—JPMorgan Chase Bank N.A.
LIBOR—London Interbank Offered Rate
LP—Limited Partnership
M—Monthly payment frequency for swaps
MASTR—Morgan Stanley Structured Asset Security
MSI—Morgan Stanley & Co International PLC
MTN—Medium Term Note
OTC—Over-the-counter
PIK—Payment-in-Kind
PJSC—Public Joint-Stock Company
Q—Quarterly payment frequency for swaps
REITs—Real Estate Investment Trust
REMIC—Real Estate Mortgage Investment Conduit
S—Semiannual payment frequency for swaps
SCB—Standard Chartered Bank
SOFR—Secured Overnight Financing Rate
SONIA—Sterling Overnight Index Average
STRIPs—Separate Trading of Registered Interest and Principal of Securities
T—Swap payment upon termination
TBA—To Be Announced
TD—The Toronto-Dominion Bank
UAG—UBS AG
USOIS—United States Overnight Index Swap
| * | Non-income producing security. |
| # | Principal or notional amount is shown in U.S. dollars unless otherwise stated. |
| ~ | See tables subsequent to the Schedule of Investments for options detail. Excludes centrally cleared swaptions. |
| ^ | Indicates a Level 3 instrument. The aggregate value of Level 3 instruments is $10,035,703 and 0.8% of net assets. |
| (a) | All or a portion of security is on loan. The aggregate market value of such securities, including those sold and pending settlement, is $23,516,253; cash collateral of $24,264,779 (included in liabilities) was received with which the Fund purchased highly liquid short-term investments. In the event of significant appreciation in value of securities on loan on the last business day of the reporting period, the Fund may reflect a collateral value that is less than the market value of the loaned securities and such shortfall is remedied the following business day. |
| (b) | Represents security, or portion thereof, purchased with cash collateral received for securities on loan and includes dividend reinvestment. |
| (c) | Variable rate instrument. The interest rate shown reflects the rate in effect at October 31, 2022. |
| (cc) | Variable rate instrument. The rate shown is based on the latest available information as of October 31, 2022. Certain variable rate securities are not based on a published reference rate and spread but are determined by the issuer or agent and are based on current market conditions. These securities do not indicate a reference rate and spread in their description. |
| (d) | Represents issuer in default on interest payments and/or principal repayment. Non-income producing security. Such securities may be post-maturity. |
See Notes to Financial Statements.
PGIM Absolute Return Bond Fund 45
Schedule of Investments (continued)
as of October 31, 2022
| (f) | Indicates a restricted security that is acquired in unregistered, private sales from the issuing company or from an affiliate of the issuer and is considered restricted as to disposition under federal securities law; the aggregate original cost of such securities is $11,654,255. The aggregate value of $8,865,838 is 0.7% of net assets. |
| (ff) | Variable rate security. Security may be issued at a fixed coupon rate, which converts to a variable rate at a specified date. Rate shown is the rate in effect as of period end. |
| (h) | Represents security, or a portion thereof, segregated as collateral for OTC derivatives. |
| (k) | Represents security, or a portion thereof, segregated as collateral for centrally cleared/exchange-traded derivatives. |
| (oo) | Perpetual security. Maturity date represents next call date. |
| (r) | Principal or notional amount is less than $500 par. |
| (s) | Represents zero coupon bond or principal only security. Rate represents yield to maturity at purchase date. |
| (tt) | All or partial principal amount represents “TBA” mortgage dollar rolls. The aggregate mortgage dollar roll principal amount of 26,000,000 is 2.0% of net assets. |
| (wc) | PGIM Investments LLC, the manager of the Fund, also serves as manager of the PGIM Core Short-Term Bond Fund, PGIM Core Ultra Short Bond Fund and PGIM Institutional Money Market Fund, if applicable. |
| (z) | Includes net unrealized appreciation/(depreciation) and/or market value of the below holdings which are excluded from the Schedule of Investments: |
Options Purchased:
OTC Traded
| | | | | | | | | | | | | | | | | | |
Description | | Call/
Put | | Counterparty | | Expiration
Date | | Strike | | Contracts | | Notional
Amount
(000)# | | | Value | |
| | | | | | | |
Currency Option USD vs JPY | | Call | | BARC | | 10/27/23 | | 115.00 | | — | | | 39,000 | | | $ | 7,015,589 | |
| | | | | | | | | | | | | | | | | | |
| | | | | | | |
(cost $493,823) | | | | | | | | | | | | | | | | | | |
OTC Swaptions
| | | | | | | | | | | | | | | | | | | | | | | | |
Description | | Call/
Put | | Counterparty | | Expiration
Date | | Strike | | Receive | | | Pay | | | Notional
Amount
(000)# | | | Value | |
CDX.NA.IG.38.V1, 06/20/27 | | Call | | BOA | | 11/16/22 | | 0.35% | | | 1.00%(Q) | | |
| CDX.NA.IG.38.
V1(Q) |
| | | 46,390 | | | $ | 114 | |
CDX.NA.IG.38.V1, 06/20/27 | | Call | | CITI | | 11/16/22 | | 0.35% | | | 1.00%(Q) | | |
| CDX.NA.IG.38.
V1(Q) |
| | | 46,410 | | | | 114 | |
CDX.NA.IG.38.V1, 06/20/27 | | Call | | GSI | | 11/16/22 | | 0.35% | | | 1.00%(Q) | | |
| CDX.NA.IG.38.
V1(Q) |
| | | 46,390 | | | | 114 | |
CDX.NA.IG.38.V1, 06/20/27 | | Call | | MSI | | 11/16/22 | | 0.35% | | | 1.00%(Q) | | |
| CDX.NA.IG.38.
V1(Q) |
| | | 64,380 | | | | 158 | |
CDX.NA.IG.38.V1, 06/20/27 | | Call | | MSI | | 11/16/22 | | 0.35% | | | 1.00%(Q) | | |
| CDX.NA.IG.38.
V1(Q) |
| | | 64,380 | | | | 159 | |
CDX.NA.HY.38.V2, 06/20/27 | | Put | | DB | | 11/16/22 | | $100.50 | |
| CDX.NA.HY.38.
V2(Q) |
| | | 5.00%(Q) | | | | 15,200 | | | | 126,034 | |
CDX.NA.IG.38.V1, 06/20/27 | | Put | | MSI | | 11/16/22 | | 0.85% | |
| CDX.NA.IG.38.
V1(Q) |
| | | 1.00%(Q) | | | | 64,380 | | | | 86,348 | |
CDX.NA.IG.38.V1, 06/20/27 | | Put | | MSI | | 11/16/22 | | 0.88% | |
| CDX.NA.IG.38.
V1(Q) |
| | | 1.00%(Q) | | | | 64,380 | | | | 65,834 | |
CDX.NA.IG.38.V1, 06/20/27 | | Put | | BOA | | 11/16/22 | | 0.90% | |
| CDX.NA.IG.38.
V1(Q) |
| | | 1.00%(Q) | | | | 46,390 | | | | 36,054 | |
See Notes to Financial Statements.
46
| | | | | | | | | | | | | | | | | | | | | | | | |
OTC Swaptions | | | | | | | | | | | | | | | | | | | | |
Description | | Call/
Put | | Counterparty | | Expiration
Date | | Strike | | | Receive | | | Pay | | | Notional
Amount
(000)# | | Value | |
CDX.NA.IG.38.V1, 06/20/27 | | Put | | CITI | | 11/16/22 | | | 0.93% | | |
| CDX.NA.IG.38.
V1(Q) |
| | | 1.00%(Q) | | | 46,410 | | $ | 27,426 | |
CDX.NA.IG.38.V1, 06/20/27 | | Put | | GSI | | 11/16/22 | | | 0.93% | | |
| CDX.NA.IG.38.
V1(Q) |
| | | 1.00%(Q) | | | 46,390 | | | 27,414 | |
| | | | | | | | | | | | | | | | | | | | | | | | |
| | | | |
Total OTC Swaptions (cost $1,296,334) | | | | | | | | | | | | | $ | 369,769 | |
| | | | | | | | | | | | | | | | | | | | | | | | |
| | | | |
Total Options Purchased (cost $1,790,157) | | | | | | | | | | | | | $ | 7,385,358 | |
| | | | | | | | | | | | | | | | | | | | | | | | |
Options Written:
OTC Traded
| | | | | | | | | | | | | | | | | | | | | | | | | | | | |
Description | | Call/
Put | | | Counterparty | | | Expiration
Date | | | Strike | | | Contracts | | | Notional
Amount
(000)# | | | Value | |
| | | | | | | |
Currency Option USD vs JPY | | | Call | | | | BOA | | | | 10/27/23 | | | | 115.00 | | | | — | | | | 39,000 | | | $ | (7,015,590) | |
| | | | | | | | | | | | | | | | | | | | | | | | | | | | |
(premiums received $539,994) | | | | | | | | | | | | | | | | | | | | | | | | | | | | |
OTC Swaptions
| | | | | | | | | | | | | | | | | | | | | | | | |
Description | | Call/
Put | | Counterparty | | Expiration
Date | | Strike | | | Receive | | | Pay | | | Notional
Amount
(000)# | | Value | |
CDX.NA.HY.38.V2, 06/20/27 | | Call | | DB | | 11/16/22 | | $ | 102.00 | | |
| CDX.NA.HY.38.
V2(Q) |
| | | 5.00%(Q) | | | 15,200 | | $ | (39,378 | ) |
CDX.NA.IG.38.V1, 06/20/27 | | Call | | MSI | | 11/16/22 | | | 0.75% | | |
| CDX.NA.IG.38.
V1(Q) |
| | | 1.00%(Q) | | | 64,380 | | | (27,638 | ) |
CDX.NA.IG.38.V1, 06/20/27 | | Call | | MSI | | 11/16/22 | | | 0.75% | | |
| CDX.NA.IG.38.
V1(Q) |
| | | 1.00%(Q) | | | 64,380 | | | (27,638 | ) |
CDX.NA.IG.38.V1, 06/20/27 | | Call | | BOA | | 11/16/22 | | | 0.78% | | |
| CDX.NA.IG.38.
V1(Q) |
| | | 1.00%(Q) | | | 46,390 | | | (33,715 | ) |
CDX.NA.IG.38.V1, 06/20/27 | | Call | | GSI | | 11/16/22 | | | 0.78% | | |
| CDX.NA.IG.38.
V1(Q) |
| | | 1.00%(Q) | | | 46,390 | | | (33,715 | ) |
CDX.NA.IG.38.V1, 06/20/27 | | Call | | CITI | | 11/16/22 | | | 0.80% | | |
| CDX.NA.IG.38.
V1(Q) |
| | | 1.00%(Q) | | | 46,410 | | | (52,636 | ) |
CDX.NA.HY.38.V2, 06/20/27 | | Put | | DB | | 11/16/22 | | | $96.00 | | | | 5.00%(Q) | | |
| CDX.NA.HY.38.
V2(Q) |
| | 15,200 | | | (16,634 | ) |
CDX.NA.IG.38.V1, 06/20/27 | | Put | | MSI | | 11/16/22 | | | 1.15% | | | | 1.00%(Q) | | |
| CDX.NA.IG.38.
V1(Q) |
| | 64,380 | | | (5,822 | ) |
CDX.NA.IG.38.V1, 06/20/27 | | Put | | MSI | | 11/16/22 | | | 1.20% | | | | 1.00%(Q) | | |
| CDX.NA.IG.38.
V1(Q) |
| | 64,380 | | | (4,741 | ) |
CDX.NA.IG.38.V1, 06/20/27 | | Put | | BOA | | 11/16/22 | | | 1.23% | | | | 1.00%(Q) | | |
| CDX.NA.IG.38.
V1(Q) |
| | 46,390 | | | (3,151 | ) |
CDX.NA.IG.38.V1, 06/20/27 | | Put | | GSI | | 11/16/22 | | | 1.25% | | | | 1.00%(Q) | | |
| CDX.NA.IG.38.
V1(Q) |
| | 46,390 | | | (2,940 | ) |
CDX.NA.IG.38.V1, 06/20/27 | | Put | | CITI | | 11/16/22 | | | 1.28% | | | | 1.00%(Q) | | |
| CDX.NA.IG.38.
V1(Q) |
| | 46,410 | | | (2,770 | ) |
See Notes to Financial Statements.
PGIM Absolute Return Bond Fund 47
Schedule of Investments (continued)
as of October 31, 2022
Options Written (continued):
| | | | | | | | | | | | | | | | | | | | | | | | | | |
OTC Swaptions | | | | | | | | | | | | | | | | | | | | | |
Description | | Call/
Put | | Counterparty | | Expiration
Date | | Strike | | | Receive | | | Pay | | | Notional
Amount
(000)# | | | Value | |
CDX.NA.IG.38.V1, 06/20/27 | | Put | | GSI | | 01/18/23 | | | 3.00% | | | | 1.00%(Q) | | |
| CDX.NA.IG.38.
V1(Q) |
| | | 46,610 | | | $ | (3,661) | |
CDX.NA.IG.39.V1, 12/20/27 | | Put | | BNP | | 11/16/22 | | | 1.38% | | | | 1.00%(Q) | | |
| CDX.NA.IG.39.
V1(Q) |
| | | 29,690 | | | | (2,333) | |
GS_21-PJA†† ^ | | Put | | GSI | | 06/17/24 | | | 0.25% | | | | 0.25%(M) | | | | GS_21-PJA(M) | | | | 16,440 | | | | (314) | |
GS_21-PJA^ | | Put | | GSI | | 11/15/24 | | | 0.50% | | | | 0.50%(S) | | | | GS_21-PJA(Q) | | | | 8,530 | | | | (165) | |
| | | | | | | | | | | | | | | | | | | | | | | | | | |
| | | | |
Total OTC Swaptions (premiums received $1,321,285) | | | | | | | | | | | | | | | $ | (257,251 | ) |
| | | | | | | | | | | | | | | | | | | | | | | | | | |
| | | | |
Total Options Written (premiums received $1,861,279) | | | | | | | | | | | | | | | $ | (7,272,841 | ) |
| | | | | | | | | | | | | | | | | | | | | | | | | | |
| †† | The value of the contract, GS_21-PJA is derived from the aggregate credit performance of a pool of senior prime jumbo mortgages. The pool of prime jumbo mortgages is reset monthly |
Options Purchased:
Centrally Cleared Swaptions
| | | | | | | | | | | | | | | | | | | | | | | | |
Description | | Call/
Put | | Expiration
Date | | Strike | | Receive | | | Pay | | | Notional Amount (000)# | | Value at
October 31,
2022 | | | Unrealized
Appreciation
(Depreciation) | |
CDX.NA.HY.39.V1, 12/20/27 | | Put | | 11/16/22 | | $85.00 | |
| CDX.NA.HY.39.
V1(Q) |
| | | 5.00%(Q) | | | 2,650 | | | 1,021 | | | | $ (6,515) | |
CDX.NA.IG.38.V1, 06/20/27 | | Put | | 12/21/22 | | 0.93% | |
| CDX.NA.IG.38.
V1(Q) |
| | | 1.00%(Q) | | | 64,040 | | | 128,433 | | | | (147,523) | |
CDX.NA.IG.39.V1, 12/20/27 | | Put | | 12/21/22 | | 1.00% | |
| CDX.NA.IG.39.
V1(Q) |
| | | 1.00%(Q) | | | 61,585 | | | 151,337 | | | | (101,161) | |
CDX.NA.IG.39.V1, 12/20/27 | | Put | | 12/21/22 | | 1.03% | |
| CDX.NA.IG.39.
V1(Q) |
| | | 1.00%(Q) | | | 53,000 | | | 115,648 | | | | (102,712) | |
CDX.NA.IG.39.V1, 12/20/27 | | Put | | 12/21/22 | | 1.05% | |
| CDX.NA.IG.39.
V1(Q) |
| | | 1.00%(Q) | | | 61,585 | | | 119,539 | | | | (89,850) | |
CDX.NA.IG.39.V1, 12/20/27 | | Put | | 01/18/23 | | 1.00% | |
| CDX.NA.IG.39.
V1(Q) |
| | | 1.00%(Q) | | | 65,320 | | | 227,758 | | | | (89,697) | |
CDX.NA.IG.39.V1, 12/20/27 | | Put | | 01/18/23 | | 1.03% | |
| CDX.NA.IG.39.
V1(Q) |
| | | 1.00%(Q) | | | 53,000 | | | 169,028 | | | | (90,672) | |
CDX.NA.IG.39.V1, 12/20/27 | | Put | | 01/18/23 | | 1.08% | |
| CDX.NA.IG.39.
V1(Q) |
| | | 1.00%(Q) | | | 48,190 | | | 129,121 | | | | (153,280) | |
CDX.NA.IG.39.V1, 12/20/27 | | Put | | 01/18/23 | | 1.10% | |
| CDX.NA.IG.39.
V1(Q) |
| | | 1.00%(Q) | | | 48,190 | | | 118,620 | | | | (151,244) | |
| | | | | | | | | | | | | | | | | | | | | | | | |
| | | | | |
Total Centrally Cleared Swaptions (cost $2,093,159) | | | | | | | | | | | | | $1,160,505 | | | | $(932,654) | |
| | | | | | | | | | | | | | | | | | | | | | | | |
See Notes to Financial Statements.
48
Options Written:
| | | | | | | | | | | | | | | | | | | | | | | | | | |
| Centrally Cleared Swaptions | | | | | | | | | | | | | | | | | | | | | |
Description | | Call/
Put | | Expiration
Date | | Strike | | Receive | | | Pay | | | Notional
Amount
(000)# | | | Value at
October 31,
2022 | | | Unrealized
Appreciation
(Depreciation) | |
CDX.NA.IG.38.V1, 06/20/27 | | Call | | 12/21/22 | | 0.83% | |
| CDX.NA.IG.38.
V1(Q) |
| | | 1.00%(Q) | | | | 64,040 | | | | (157,399) | | | $ | (17,095 | ) |
CDX.NA.IG.39.V1, 12/20/27 | | Call | | 12/21/22 | | 0.90% | |
| CDX.NA.IG.39.
V1(Q) |
| | | 1.00%(Q) | | | | 61,585 | | | | (164,320) | | | | (52,851 | ) |
CDX.NA.IG.39.V1, 12/20/27 | | Call | | 12/21/22 | | 0.93% | |
| CDX.NA.IG.39.
V1(Q) |
| | | 1.00%(Q) | | | | 114,585 | | | | (376,630) | | | | (108,945 | ) |
CDX.NA.IG.39.V1, 12/20/27 | | Call | | 01/18/23 | | 0.90% | |
| CDX.NA.IG.39.
V1(Q) |
| | | 1.00%(Q) | | | | 53,000 | | | | (160,717) | | | | (49,417 | ) |
CDX.NA.IG.39.V1, 12/20/27 | | Call | | 01/18/23 | | 0.93% | |
| CDX.NA.IG.39.
V1(Q) |
| | | 1.00%(Q) | | | | 65,320 | | | | (237,751) | | | | (54,855 | ) |
CDX.NA.IG.39.V1, 12/20/27 | | Call | | 01/18/23 | | 0.95% | |
| CDX.NA.IG.39.
V1(Q) |
| | | 1.00%(Q) | | | | 96,380 | | | | (413,494) | | | | (163,395 | ) |
CDX.NA.HY.38.V2, 06/20/27 | | Put | | 12/21/22 | | $91.00 | | | 5.00%(Q) | | |
| CDX.NA.HY.38.
V2(Q) |
| | | 11,980 | | | | (27,404) | | | | 132,517 | |
CDX.NA.HY.39.V1, 12/20/27 | | Put | | 01/18/23 | | $90.00 | | | 5.00%(Q) | | |
| CDX.NA.HY.39.
V1(Q) |
| | | 5,300 | | | | (26,314) | | | | 69,484 | |
CDX.NA.IG.38.V1, 06/20/27 | | Put | | 12/21/22 | | 1.20% | | | 1.00%(Q) | | |
| CDX.NA.IG.38.
V1(Q) |
| | | 64,040 | | | | (37,967) | | | | 89,529 | |
CDX.NA.IG.39.V1, 12/20/27 | | Put | | 12/21/22 | | 1.25% | | | 1.00%(Q) | | |
| CDX.NA.IG.39.
V1(Q) |
| | | 61,585 | | | | (50,936) | | | | 52,835 | |
CDX.NA.IG.39.V1, 12/20/27 | | Put | | 12/21/22 | | 1.28% | | | 1.00%(Q) | | |
| CDX.NA.IG.39.
V1(Q) |
| | | 53,000 | | | | (39,852) | | | | 50,778 | |
CDX.NA.IG.39.V1, 12/20/27 | | Put | | 12/21/22 | | 1.30% | | | 1.00%(Q) | | |
| CDX.NA.IG.39.
V1(Q) |
| | | 61,585 | | | | (42,205) | | | | 50,172 | |
CDX.NA.IG.39.V1, 12/20/27 | | Put | | 12/21/22 | | 1.50% | | | 1.00%(Q) | | |
| CDX.NA.IG.39.
V1(Q) |
| | | 59,380 | | | | (21,167) | | | | 146,916 | |
CDX.NA.IG.39.V1, 12/20/27 | | Put | | 01/18/23 | | 1.30% | | | 1.00%(Q) | | |
| CDX.NA.IG.39.
V1(Q) |
| | | 53,000 | | | | (69,740) | | | | 54,810 | |
CDX.NA.IG.39.V1, 12/20/27 | | Put | | 01/18/23 | | 1.33% | | | 1.00%(Q) | | |
| CDX.NA.IG.39.
V1(Q) |
| | | 65,320 | | | | (79,989) | | | | 47,385 | |
CDX.NA.IG.39.V1, 12/20/27 | | Put | | 01/18/23 | | 1.35% | | | 1.00%(Q) | | |
| CDX.NA.IG.39.
V1(Q) |
| | | 48,190 | | | | (54,988) | | | | 91,502 | |
CDX.NA.IG.39.V1, 12/20/27 | | Put | | 01/18/23 | | 1.40% | | | 1.00%(Q) | | |
| CDX.NA.IG.39.
V1(Q) |
| | | 48,190 | | | | (47,930) | | | | 74,954 | |
| | | | | | | | | | | | | | | | | | | | | | | | | | |
| | | | |
Total Centrally Cleared Swaptions (premiums received $2,423,127) | | | | | | | | | | | $ | (2,008,803) | | | $ | 414,324 | |
| | | | | | | | | | | | | | | | | | | | | | | | | | |
Futures contracts outstanding at October 31, 2022:
| | | | | | | | | | | | | | | | |
Number of Contracts | | | Type | | Expiration
Date | | | Current
Notional
Amount | | | Value /
Unrealized
Appreciation
(Depreciation) | |
| | | |
| | Short Positions: | | | | | | | | | | | | |
| | 228 | | | 2 Year U.S. Treasury Notes | | | Dec. 2022 | | | $ | 46,599,281 | | | $ | 424,232 | |
See Notes to Financial Statements.
PGIM Absolute Return Bond Fund 49
Schedule of Investments (continued)
as of October 31, 2022
Futures contracts outstanding at October 31, 2022 (continued):
| | | | | | | | | | | | | | | | | | | | |
Number
of
Contracts | | | Type | | Expiration
Date | | | Current
Notional
Amount | | | | | | Value /
Unrealized
Appreciation
(Depreciation) | |
| | | | |
| | Short Positions (cont’d): | | | | | | | | | | | | | | | | |
| | 145 | | | 5 Year Euro-Bobl | | | Dec. 2022 | | | $ | 17,148,262 | | | | | | | $ | 459,520 | |
| | 1,707 | | | 5 Year U.S.Treasury Notes | | | Dec. 2022 | | | | 181,955,531 | | | | | | | | 7,550,657 | |
| | 130 | | | 10 Year Euro-Bund | | | Dec. 2022 | | | | 17,785,733 | | | | | | | | 914,267 | |
| | 1,529 | | | 10 Year U.S. Treasury Notes | | | Dec. 2022 | | | | 169,097,844 | | | | | | | | 1,964,084 | |
| | 242 | | | 10 Year U.S. Ultra Treasury Notes | | | Dec. 2022 | | | | 28,068,220 | | | | | | | | 2,449,717 | |
| | 1,483 | | | 20 Year U.S. Treasury Bonds | | | Dec. 2022 | | | | 178,701,500 | | | | | | | | 21,150,614 | |
| | 48 | | | 30 Year U.S. Ultra Treasury Bonds | | | Dec. 2022 | | | | 6,127,500 | | | | | | | | 881,149 | |
| | 59 | | | Euro Schatz Index | | | Dec. 2022 | | | | 6,235,032 | | | | | | | | 69,083 | |
| | | | | | | | | | | | | | | | | | | | |
| | | | | | | | | | | | | | | | | | $ | 35,863,323 | |
| | | | | | | | | | | | | | | | | | | | |
Forward foreign currency exchange contracts outstanding at October 31, 2022:
| | | | | | | | | | | | | | | | | | | | | | | | | | |
Purchase Contracts | | Counterparty | | Notional
Amount
(000) | | | Value at
Settlement
Date | | | Current
Value | | | Unrealized
Appreciation | | | Unrealized
Depreciation | |
|
OTC Forward Foreign Currency Exchange Contracts: | |
Australian Dollar, | | | | | | | | | | | | | | | | | | | | | | | | | | |
Expiring 01/19/23 | | BNP | | | AUD | | | | 1,242 | | | $ | 797,000 | | | $ | 796,794 | | | $ | — | | | $ | (206 | ) |
Expiring 01/19/23 | | JPM | | | AUD | | | | 1,252 | | | | 799,000 | | | | 802,764 | | | | 3,764 | | | | — | |
Expiring 01/19/23 | | MSI | | | AUD | | | | 2,537 | | | | 1,603,283 | | | | 1,627,246 | | | | 23,963 | | | | — | |
Expiring 10/31/23 | | JPM | | | AUD | | | | 3,180 | | | | 2,208,097 | | | | 2,054,376 | | | | — | | | | (153,721 | ) |
Brazilian Real, | | | | | | | | | | | | | | | | | | | | | | | | | | |
Expiring 11/03/22 | | CITI | | | BRL | | | | 4,317 | | | | 814,000 | | | | 835,141 | | | | 21,141 | | | | — | |
Expiring 11/03/22 | | GSI | | | BRL | | | | 7,351 | | | | 1,384,000 | | | | 1,421,967 | | | | 37,967 | | | | — | |
Expiring 11/03/22 | | GSI | | | BRL | | | | 3,777 | | | | 724,533 | | | | 730,575 | | | | 6,042 | | | | — | |
Expiring 12/02/22 | | CITI | | | BRL | | | | 13,544 | | | | 2,513,775 | | | | 2,603,214 | | | | 89,439 | | | | — | |
Canadian Dollar, | | | | | | | | | | | | | | | | | | | | | | | | | | |
Expiring 01/19/23 | | HSBC | | | CAD | | | | 3,363 | | | | 2,436,549 | | | | 2,471,001 | | | | 34,452 | | | | — | |
Chilean Peso, | | | | | | | | | | | | | | | | | | | | | | | | | | |
Expiring 12/21/22 | | BARC | | | CLP | | | | 907,180 | | | | 930,453 | | | | 953,086 | | | | 22,633 | | | | — | |
Expiring 12/21/22 | | BARC | | | CLP | | | | 665,889 | | | | 676,547 | | | | 699,584 | | | | 23,037 | | | | — | |
Chinese Renminbi, | | | | | | | | | | | | | | | | | | | | | | | | | | |
Expiring 11/23/22 | | BOA | | | CNH | | | | 26,490 | | | | 3,837,000 | | | | 3,615,563 | | | | — | | | | (221,437 | ) |
Expiring 11/23/22 | | BOA | | | CNH | | | | 24,961 | | | | 3,620,000 | | | | 3,406,862 | | | | — | | | | (213,138 | ) |
Expiring 11/23/22 | | BOA | | | CNH | | | | 22,740 | | | | 3,110,000 | | | | 3,103,704 | | | | — | | | | (6,296 | ) |
Expiring 11/23/22 | | CITI | | | CNH | | | | 23,230 | | | | 3,208,000 | | | | 3,170,638 | | | | — | | | | (37,362 | ) |
Expiring 11/23/22 | | GSI | | | CNH | | | | 23,474 | | | | 3,280,000 | | | | 3,203,932 | | | | — | | | | (76,068 | ) |
Expiring 11/23/22 | | GSI | | | CNH | | | | 20,218 | | | | 2,866,000 | | | | 2,759,487 | | | | — | | | | (106,513 | ) |
Expiring 11/23/22 | | HSBC | | | CNH | | | | 25,846 | | | | 3,626,000 | | | | 3,527,579 | | | | — | | | | (98,421 | ) |
Expiring 11/23/22 | | HSBC | | | CNH | | | | 19,807 | | | | 2,871,000 | | | | 2,703,337 | | | | — | | | | (167,663 | ) |
Expiring 11/23/22 | | JPM | | | CNH | | | | 26,261 | | | | 3,771,000 | | | | 3,584,217 | | | | — | | | | (186,783 | ) |
Expiring 11/23/22 | | JPM | | | CNH | | | | 25,473 | | | | 3,658,000 | | | | 3,476,740 | | | | — | | | | (181,260 | ) |
See Notes to Financial Statements.
50
Forward foreign currency exchange contracts outstanding at October 31, 2022 (continued):
| | | | | | | | | | | | | | | | | | | | | | | | | | |
Purchase
Contracts | | Counterparty | | Notional
Amount
(000) | | | Value at
Settlement
Date | | | Current
Value | | | Unrealized
Appreciation | | | Unrealized
Depreciation | |
|
OTC Forward Foreign Currency Exchange Contracts (cont’d.): | |
Chinese Renminbi (cont’d.), | | | | | | | | | | | | | | | | | | | | | | | | | | |
Expiring 11/23/22 | | JPM | | | CNH | | | | 5,568 | | | $ | 800,600 | | | $ | 759,916 | | | $ | — | | | $ | (40,684 | ) |
Colombian Peso, | | | | | | | | | | | | | | | | | | | | | | | | | | |
Expiring 12/21/22 | | BARC | | | COP | | | | 2,140,438 | | | | 470,344 | | | | 429,532 | | | | — | | | | (40,812 | ) |
Expiring 12/21/22 | | BNP | | | COP | | | | 1,849,412 | | | | 401,000 | | | | 371,130 | | | | — | | | | (29,870 | ) |
Expiring 12/21/22 | | CITI | | | COP | | | | 7,624,344 | | | | 1,570,000 | | | | 1,530,013 | | | | — | | | | (39,987 | ) |
Expiring 12/21/22 | | MSI | | | COP | | | | 7,121,656 | | | | 1,446,999 | | | | 1,429,137 | | | | — | | | | (17,862 | ) |
Expiring 12/21/22 | | UAG | | | COP | | | | 14,576,994 | | | | 2,989,000 | | | | 2,925,235 | | | | — | | | | (63,765 | ) |
Euro, | | | | | | | | | | | | | | | | | | | | | | | | | | |
Expiring 01/19/23 | | MSI | | | EUR | | | | 2,009 | | | | 2,011,665 | | | | 1,998,355 | | | | — | | | | (13,310 | ) |
Expiring 01/19/23 | | MSI | | | EUR | | | | 1,425 | | | | 1,441,107 | | | | 1,417,703 | | | | — | | | | (23,404 | ) |
Hungarian Forint, | | | | | | | | | | | | | | | | | | | | | | | | | | |
Expiring 12/21/22 | | MSI | | | HUF | | | | 1,871,083 | | | | 4,316,223 | | | | 4,449,779 | | | | 133,556 | | | | — | |
Expiring 01/19/23 | | BARC | | | HUF | | | | 512,183 | | | | 1,180,800 | | | | 1,207,526 | | | | 26,726 | | | | — | |
Expiring 01/19/23 | | GSI | | | HUF | | | | 578,296 | | | | 1,344,000 | | | | 1,363,396 | | | | 19,396 | | | | — | |
Expiring 01/19/23 | | MSI | | | HUF | | | | 3,338,315 | | | | 7,600,779 | | | | 7,870,438 | | | | 269,659 | | | | — | |
Expiring 01/19/23 | | MSI | | | HUF | | | | 2,674,584 | | | | 5,856,326 | | | | 6,305,620 | | | | 449,294 | | | | — | |
Indian Rupee, | | | | | | | | | | | | | | | | | | | | | | | | | | |
Expiring 12/21/22 | | MSI | | | INR | | | | 262,619 | | | | 3,191,000 | | | | 3,152,926 | | | | — | | | | (38,074 | ) |
Expiring 12/21/22 | | TD | | | INR | | | | 441,157 | | | | 5,525,169 | | | | 5,296,396 | | | | — | | | | (228,773 | ) |
Indonesian Rupiah, | | | | | | | | | | | | | | | | | | | | | | | | | | |
Expiring 12/21/22 | | BOA | | | IDR | | | | 38,053,740 | | | | 2,495,000 | | | | 2,431,093 | | | | — | | | | (63,907 | ) |
Expiring 12/21/22 | | HSBC | | | IDR | | | | 68,342,430 | | | | 4,485,000 | | | | 4,366,109 | | | | — | | | | (118,891 | ) |
Expiring 12/21/22 | | HSBC | | | IDR | | | | 46,049,887 | | | | 3,029,000 | | | | 2,941,933 | | | | — | | | | (87,067 | ) |
Expiring 12/21/22 | | JPM | | | IDR | | | | 50,612,619 | | | | 3,266,911 | | | | 3,233,427 | | | | — | | | | (33,484 | ) |
Expiring 12/21/22 | | SCB | | | IDR | | | | 59,476,166 | | | | 3,865,000 | | | | 3,799,681 | | | | — | | | | (65,319 | ) |
Expiring 12/21/22 | | SCB | | | IDR | | | | 37,548,781 | | | | 2,461,000 | | | | 2,398,833 | | | | — | | | | (62,167 | ) |
Israeli Shekel, | | | | | | | | | | | | | | | | | | | | | | | | | | |
Expiring 12/21/22 | | BARC | | | ILS | | | | 13,103 | | | | 3,756,000 | | | | 3,724,233 | | | | — | | | | (31,767 | ) |
Expiring 12/21/22 | | CITI | | | ILS | | | | 6,072 | | | | 1,733,581 | | | | 1,725,817 | | | | — | | | | (7,764 | ) |
Japanese Yen, | | | | | | | | | | | | | | | | | | | | | | | | | | |
Expiring 10/31/23 | | BARC | | | JPY | | | | 487,838 | | | | 5,118,000 | | | | 3,459,075 | | | | — | | | | (1,658,925 | ) |
Expiring 10/31/23 | | DB | | | JPY | | | | 498,249 | | | | 5,220,000 | | | | 3,532,899 | | | | — | | | | (1,687,101 | ) |
Expiring 10/31/23 | | GSI | | | JPY | | | | 874,045 | | | | 8,971,000 | | | | 6,197,526 | | | | — | | | | (2,773,474 | ) |
Expiring 10/31/23 | | MSI | | | JPY | | | | 855,296 | | | | 8,262,958 | | | | 6,064,587 | | | | — | | | | (2,198,371 | ) |
Mexican Peso, | | | | | | | | | | | | | | | | | | | | | | | | | | |
Expiring 04/28/23 | | JPM | | | MXN | | | | 72,679 | | | | 3,006,698 | | | | 3,547,618 | | | | 540,920 | | | | — | |
Expiring 04/28/23 | | MSI | | | MXN | | | | 231,058 | | | | 9,739,000 | | | | 11,278,363 | | | | 1,539,363 | | | | — | |
New Taiwanese Dollar, | | | | | | | | | | | | | | | | | | | | | | | | | | |
Expiring 12/21/22 | | BOA | | | TWD | | | | 132,131 | | | | 4,183,000 | | | | 4,099,338 | | | | — | | | | (83,662 | ) |
Expiring 12/21/22 | | JPM | | | TWD | | | | 147,511 | | | | 4,655,000 | | | | 4,576,513 | | | | — | | | | (78,487 | ) |
Expiring 12/21/22 | | MSI | | | TWD | | | | 107,927 | | | | 3,449,000 | | | | 3,348,420 | | | | — | | | | (100,580 | ) |
| | | | | | | | | | | | | | | | | | | | | | | | | | |
See Notes to Financial Statements.
PGIM Absolute Return Bond Fund 51
Schedule of Investments (continued)
as of October 31, 2022
Forward foreign currency exchange contracts outstanding at October 31, 2022 (continued):
| | | | | | | | | | | | | | | | | | | | | | | | | | |
Purchase
Contracts | | Counterparty | | Notional
Amount
(000) | | | Value at
Settlement
Date | | | Current
Value | | | Unrealized
Appreciation | | | Unrealized
Depreciation | |
|
OTC Forward Foreign Currency Exchange Contracts (cont’d.): | |
Peruvian Nuevo Sol, | | | | | | | | | | | | | | | | | | | | | | | | | | |
Expiring 12/21/22 | | BARC | | | PEN | | | | 4,768 | | | $ | 1,196,470 | | | $ | 1,189,739 | | | $ | — | | | $ | (6,731 | ) |
Expiring 12/21/22 | | BARC | | | PEN | | | | 1,772 | | | | 442,530 | | | | 442,091 | | | | — | | | | (439 | ) |
Expiring 12/21/22 | | BNP | | | PEN | | | | 6,665 | | | | 1,693,693 | | | | 1,663,105 | | | | — | | | | (30,588 | ) |
Philippine Peso, | | | | | | | | | | | | | | | | | | | | | | | | | | |
Expiring 12/21/22 | | CITI | | | PHP | | | | 187,851 | | | | 3,157,000 | | | | 3,220,032 | | | | 63,032 | | | | — | |
Polish Zloty, | | | | | | | | | | | | | | | | | | | | | | | | | | |
Expiring 01/19/23 | | HSBC | | | PLN | | | | 11,546 | | | | 2,267,392 | | | | 2,382,591 | | | | 115,199 | | | | — | |
Expiring 01/19/23 | | JPM | | | PLN | | | | 14,129 | | | | 2,813,000 | | | | 2,915,514 | | | | 102,514 | | | | — | |
Expiring 01/19/23 | | JPM | | | PLN | | | | 8,952 | | | | 1,763,000 | | | | 1,847,298 | | | | 84,298 | | | | — | |
Expiring 01/19/23 | | MSI | | | PLN | | | | 9,062 | | | | 1,784,000 | | | | 1,869,938 | | | | 85,938 | | | | — | |
Singapore Dollar, | | | | | | | | | | | | | | | | | | | | | | | | | | |
Expiring 12/21/22 | | JPM | | | SGD | | | | 5,581 | | | | 3,888,000 | | | | 3,943,659 | | | | 55,659 | | | | — | |
South African Rand, | | | | | | | | | | | | | | | | | | | | | | | | | | |
Expiring 12/21/22 | | GSI | | | ZAR | | | | 29,291 | | | | 1,597,000 | | | | 1,588,266 | | | | — | | | | (8,734 | ) |
Expiring 12/21/22 | | JPM | | | ZAR | | | | 36,428 | | | | 2,000,000 | | | | 1,975,278 | | | | — | | | | (24,722 | ) |
Expiring 12/21/22 | | JPM | | | ZAR | | | | 29,907 | | | | 1,614,000 | | | | 1,621,664 | | | | 7,664 | | | | — | |
Expiring 12/21/22 | | JPM | | | ZAR | | | | 29,870 | | | | 1,695,000 | | | | 1,619,663 | | | | — | | | | (75,337 | ) |
Expiring 12/21/22 | | JPM | | | ZAR | | | | 23,829 | | | | 1,308,000 | | | | 1,292,088 | | | | — | | | �� | (15,912 | ) |
Expiring 12/21/22 | | MSI | | | ZAR | | | | 33,429 | | | | 1,836,000 | | | | 1,812,632 | | | | — | | | | (23,368 | ) |
Expiring 12/21/22 | | MSI | | | ZAR | | | | 29,303 | | | | 1,630,000 | | | | 1,588,948 | | | | — | | | | (41,052 | ) |
Expiring 12/21/22 | | MSI | | | ZAR | | | | 28,832 | | | | 1,584,000 | | | | 1,563,398 | | | | — | | | | (20,602 | ) |
Expiring 12/21/22 | | MSI | | | ZAR | | | | 24,475 | | | | 1,371,000 | | | | 1,327,127 | | | | — | | | | (43,873 | ) |
South Korean Won, | | | | | | | | | | | | | | | | | | | | | | | | | | |
Expiring 12/21/22 | | BOA | | | KRW | | | | 4,702,104 | | | | 3,385,000 | | | | 3,297,740 | | | | — | | | | (87,260 | ) |
Expiring 12/21/22 | | CITI | | | KRW | | | | 2,282,624 | | | | 1,597,000 | | | | 1,600,879 | | | | 3,879 | | | | — | |
Expiring 12/21/22 | | JPM | | | KRW | | | | 4,321,725 | | | | 3,055,000 | | | | 3,030,968 | | | | — | | | | (24,032 | ) |
Expiring 12/21/22 | | JPM | | | KRW | | | | 3,649,946 | | | | 2,664,000 | | | | 2,559,827 | | | | — | | | | (104,173 | ) |
Expiring 12/21/22 | | JPM | | | KRW | | | | 3,205,719 | | | | 2,325,000 | | | | 2,248,276 | | | | — | | | | (76,724 | ) |
Thai Baht, | | | | | | | | | | | | | | | | | | | | | | | | | | |
Expiring 12/21/22 | | BOA | | | THB | | | | 30,089 | | | | 797,000 | | | | 794,280 | | | | — | | | | (2,720 | ) |
Expiring 12/21/22 | | GSI | | | THB | | | | 159,803 | | | | 4,217,000 | | | | 4,218,409 | | | | 1,409 | | | | — | |
Expiring 12/21/22 | | GSI | | | THB | | | | 147,190 | | | | 3,890,000 | | | | 3,885,447 | | | | — | | | | (4,553 | ) |
Expiring 12/21/22 | | HSBC | | | THB | | | | 150,086 | | | | 4,107,000 | | | | 3,961,904 | | | | — | | | | (145,096 | ) |
Expiring 12/21/22 | | JPM | | | THB | | | | 97,225 | | | | 2,617,000 | | | | 2,566,498 | | | | — | | | | (50,502 | ) |
Expiring 12/21/22 | | JPM | | | THB | | | | 30,016 | | | | 797,000 | | | | 792,339 | | | | — | | | | (4,661 | ) |
Expiring 12/21/22 | | SCB | | | THB | | | | 98,030 | | | | 2,623,000 | | | | 2,587,761 | | | | — | | | | (35,239 | ) |
| | | | | | | | | | | | | | | | | | | | | | | | | | |
| | | | | | | | | | | | $ | 232,289,482 | | | $ | 224,187,733 | | | | 3,760,944 | | | | (11,862,693 | ) |
| | | | | | | | | | | | | | | | | | | | | | | | | | |
See Notes to Financial Statements.
52
Forward foreign currency exchange contracts outstanding at October 31, 2022 (continued):
| | | | | | | | | | | | | | | | | | | | | | | | | | |
Sale
Contracts | | Counterparty | | Notional
Amount
(000) | | | Value at
Settlement
Date | | | Current
Value | | | Unrealized
Appreciation | | | Unrealized
Depreciation | |
|
OTC Forward Foreign Currency Exchange Contracts: | |
Australian Dollar, | | | | | | | | | | | | | | | | | | | | | | | | | | |
Expiring 01/19/23 | | HSBC | | | AUD | | | | 1,681 | | | $ | 1,055,809 | | | $ | 1,078,269 | | | $ | — | | | $ | (22,460 | ) |
Brazilian Real, | | | | | | | | | | | | | | | | | | | | | | | | | | |
Expiring 11/03/22 | | CITI | | | BRL | | | | 13,544 | | | | 2,529,738 | | | | 2,620,129 | | | | — | | | | (90,391 | ) |
Expiring 11/03/22 | | CITI | | | BRL | | | | 1,900 | | | | 368,379 | | | | 367,553 | | | | 826 | | | | — | |
British Pound, | | | | | | | | | | | | | | | | | | | | | | | | | | |
Expiring 01/19/23 | | TD | | | GBP | | | | 23,175 | | | | 25,808,049 | | | | 26,651,311 | | | | — | | | | (843,262 | ) |
Chilean Peso, | | | | | | | | | | | | | | | | | | | | | | | | | | |
Expiring 12/21/22 | | BNP | | | CLP | | | | 1,560,104 | | | | 1,643,000 | | | | 1,639,049 | | | | 3,951 | | | | — | |
Expiring 12/21/22 | | MSI | | | CLP | | | | 1,359,313 | | | | 1,391,000 | | | | 1,428,098 | | | | — | | | | (37,098 | ) |
Expiring 12/21/22 | | MSI | | | CLP | | | | 1,131,911 | | | | 1,234,000 | | | | 1,189,189 | | | | 44,811 | | | | — | |
Expiring 12/21/22 | | TD | | | CLP | | | | 1,307,187 | | | | 1,442,000 | | | | 1,373,334 | | | | 68,666 | | | | — | |
Expiring 12/21/22 | | UAG | | | CLP | | | | 1,405,156 | | | | 1,421,000 | | | | 1,476,260 | | | | — | | | | (55,260 | ) |
Expiring 12/21/22 | | UAG | | | CLP | | | | 1,380,508 | | | | 1,522,177 | | | | 1,450,365 | | | | 71,812 | | | | — | |
Chinese Renminbi, | | | | | | | | | | | | | | | | | | | | | | | | | | |
Expiring 11/23/22 | | CITI | | | CNH | | | | 20,936 | | | | 3,063,000 | | | | 2,857,427 | | | | 205,573 | | | | — | |
Expiring 11/23/22 | | GSI | | | CNH | | | | 243,553 | | | | 35,874,673 | | | | 33,241,715 | | | | 2,632,958 | | | | — | |
Expiring 11/23/22 | | GSI | | | CNH | | | | 25,737 | | | | 3,549,000 | | | | 3,512,752 | | | | 36,248 | | | | — | |
Expiring 11/23/22 | | GSI | | | CNH | | | | 24,928 | | | | 3,457,000 | | | | 3,402,370 | | | | 54,630 | | | | — | |
Expiring 11/23/22 | | JPM | | | CNH | | | | 24,277 | | | | 3,345,000 | | | | 3,313,515 | | | | 31,485 | | | | — | |
Expiring 11/23/22 | | JPM | | | CNH | | | | 24,275 | | | | 3,383,000 | | | | 3,313,259 | | | | 69,741 | | | | — | |
Expiring 11/23/22 | | JPM | | | CNH | | | | 20,433 | | | | 2,838,000 | | | | 2,788,813 | | | | 49,187 | | | | — | |
Expiring 11/23/22 | | JPM | | | CNH | | | | 19,749 | | | | 2,747,000 | | | | 2,695,484 | | | | 51,516 | | | | — | |
Expiring 11/23/22 | | SCB | | | CNH | | | | 16,282 | | | | 2,302,000 | | | | 2,222,286 | | | | 79,714 | | | | — | |
Expiring 11/23/22 | | UAG | | | CNH | | | | 20,427 | | | | 2,834,000 | | | | 2,788,054 | | | | 45,946 | | | | — | |
Colombian Peso, | | | | | | | | | | | | | | | | | | | | | | | | | | |
Expiring 12/21/22 | | BARC | | | COP | | | | 5,304,933 | | | | 1,134,352 | | | | 1,064,566 | | | | 69,786 | | | | — | |
Expiring 12/21/22 | | BARC | | | COP | | | | 2,364,579 | | | | 504,648 | | | | 474,511 | | | | 30,137 | | | | — | |
Czech Koruna, | | | | | | | | | | | | | | | | | | | | | | | | | | |
Expiring 01/19/23 | | BARC | | | CZK | | | | 86,331 | | | | 3,391,000 | | | | 3,468,919 | | | | — | | | | (77,919 | ) |
Expiring 01/19/23 | | BOA | | | CZK | | | | 161,687 | | | | 6,352,003 | | | | 6,496,812 | | | | — | | | | (144,809 | ) |
Expiring 01/19/23 | | GSI | | | CZK | | | | 208,317 | | | | 8,189,265 | | | | 8,370,463 | | | | — | | | | (181,198 | ) |
Expiring 01/19/23 | | HSBC | | | CZK | | | | 194,882 | | | | 7,653,105 | | | | 7,830,629 | | | | — | | | | (177,524 | ) |
Euro, | | | | | | | | | | | | | | | | | | | | | | | | | | |
Expiring 01/19/23 | | BNP | | | EUR | | | | 50,632 | | | | 49,727,259 | | | | 50,376,071 | | | | — | | | | (648,812 | ) |
Expiring 01/19/23 | | SCB | | | EUR | | | | 34,607 | | | | 33,685,336 | | | | 34,432,130 | | | | — | | | | (746,794 | ) |
Hungarian Forint, | | | | | | | | | | | | | | | | | | | | | | | | | | |
Expiring 12/21/22 | | MSI | | | HUF | | | | 823,686 | | | | 1,955,710 | | | | 1,958,877 | | | | — | | | | (3,167 | ) |
Expiring 12/21/22 | | MSI | | | HUF | | | | 588,234 | | | | 1,419,313 | | | | 1,398,929 | | | | 20,384 | | | | — | |
Indian Rupee, | | | | | | | | | | | | | | | | | | | | | | | | | | |
Expiring 12/21/22 | | BOA | | | INR | | | | 229,218 | | | | 2,760,000 | | | | 2,751,920 | | | | 8,080 | | | | — | |
Expiring 12/21/22 | | HSBC | | | INR | | | | 67,675 | | | | 816,000 | | | | 812,485 | | | | 3,515 | | | | — | |
Expiring 12/21/22 | | JPM | | | INR | | | | 249,352 | | | | 3,108,000 | | | | 2,993,640 | | | | 114,360 | | | | — | |
See Notes to Financial Statements.
PGIM Absolute Return Bond Fund 53
Schedule of Investments (continued)
as of October 31, 2022
Forward foreign currency exchange contracts outstanding at October 31, 2022 (continued):
| | | | | | | | | | | | | | | | | | | | | | | | | | |
Sale
Contracts | | Counterparty | | Notional
Amount
(000) | | | Value at
Settlement
Date | | | Current
Value | | | Unrealized
Appreciation | | | Unrealized
Depreciation | |
|
OTC Forward Foreign Currency Exchange Contracts (cont’d.): | |
Indian Rupee (cont’d.), | | | | | | | | | | | | | | | | | | | | | | | | | | |
Expiring 12/21/22 | | JPM | | | INR | | | | 229,600 | | | $ | 2,753,718 | | | $ | 2,756,507 | | | $ | — | | | $ | (2,789 | ) |
Expiring 12/21/22 | | MSI | | | INR | | | | 152,591 | | | | 1,836,000 | | | | 1,831,957 | | | | 4,043 | | | | — | |
Expiring 12/21/22 | | SCB | | | INR | | | | 68,178 | | | | 819,000 | | | | 818,520 | | | | 480 | | | | — | |
Indonesian Rupiah, | | | | | | | | | | | | | | | | | | | | | | | | | | |
Expiring 12/21/22 | | MSI | | | IDR | | | | 56,078,896 | | | | 3,598,000 | | | | 3,582,643 | | | | 15,357 | | | | — | |
Expiring 12/21/22 | | SCB | | | IDR | | | | 15,903,922 | | | | 1,061,394 | | | | 1,016,035 | | | | 45,359 | | | | — | |
Israeli Shekel, | | | | | | | | | | | | | | | | | | | | | | | | | | |
Expiring 12/21/22 | | BARC | | | ILS | | | | 10,288 | | | | 2,995,000 | | | | 2,924,117 | | | | 70,883 | | | | — | |
Expiring 12/21/22 | | BARC | | | ILS | | | | 8,597 | | | | 2,450,000 | | | | 2,443,596 | | | | 6,404 | | | | — | |
Expiring 12/21/22 | | BOA | | | ILS | | | | 8,363 | | | | 2,345,000 | | | | 2,376,922 | | | | — | | | | (31,922 | ) |
Expiring 12/21/22 | | CITI | | | ILS | | | | 9,576 | | | | 2,719,000 | | | | 2,721,738 | | | | — | | | | (2,738 | ) |
Expiring 12/21/22 | | CITI | | | ILS | | | | 8,231 | | | | 2,321,000 | | | | 2,339,434 | | | | — | | | | (18,434 | ) |
Expiring 12/21/22 | | CITI | | | ILS | | | | 4,921 | | | | 1,444,843 | | | | 1,398,742 | | | | 46,101 | | | | — | |
Expiring 12/21/22 | | CITI | | | ILS | | | | 4,420 | | | | 1,293,157 | | | | 1,256,417 | | | | 36,740 | | | | — | |
Expiring 12/21/22 | | CITI | | | ILS | | | | 2,351 | | | | 689,706 | | | | 668,288 | | | | 21,418 | | | | — | |
Japanese Yen, | | | | | | | | | | | | | | | | | | | | | | | | | | |
Expiring 10/31/23 | | BOA | | | JPY | | | | 1,325,555 | | | | 12,988,000 | | | | 9,399,021 | | | | 3,588,979 | | | | — | |
Expiring 10/31/23 | | BOA | | | JPY | | | | 1,168,753 | | | | 11,585,000 | | | | 8,287,193 | | | | 3,297,807 | | | | — | |
Expiring 10/31/23 | | CITI | | | JPY | | | | 399,802 | | | | 4,148,827 | | | | 2,834,846 | | | | 1,313,981 | | | | — | |
Expiring 10/31/23 | | CITI | | | JPY | | | | 46,713 | | | | 447,401 | | | | 331,226 | | | | 116,175 | | | | — | |
Mexican Peso, | | | | | | | | | | | | | | | | | | | | | | | | | | |
Expiring 12/21/22 | | BOA | | | MXN | | | | 60,719 | | | | 2,975,000 | | | | 3,036,487 | | | | — | | | | (61,487 | ) |
Expiring 12/21/22 | | HSBC | | | MXN | | | | 49,805 | | | | 2,430,513 | | | | 2,490,699 | | | | — | | | | (60,186 | ) |
Expiring 12/21/22 | | JPM | | | MXN | | | | 53,373 | | | | 2,596,000 | | | | 2,669,121 | | | | — | | | | (73,121 | ) |
Expiring 12/21/22 | | JPM | | | MXN | | | | 36,725 | | | | 1,797,000 | | | | 1,836,573 | | | | — | | | | (39,573 | ) |
Expiring 04/28/23 | | MSI | | | MXN | | | | 303,737 | | | | 13,188,761 | | | | 14,825,980 | | | | — | | | | (1,637,219 | ) |
New Taiwanese Dollar, | | | | | | | | | | | | | | | | | | | | | | | | | | |
Expiring 12/21/22 | | JPM | | | TWD | | | | 369,998 | | | | 12,071,719 | | | | 11,479,162 | | | | 592,557 | | | | — | |
Peruvian Nuevo Sol, | | | | | | | | | | | | | | | | | | | | | | | | | | |
Expiring 12/21/22 | | BARC | | | PEN | | | | 6,811 | | | | 1,736,546 | | | | 1,699,378 | | | | 37,168 | | | | — | |
Expiring 12/21/22 | | BARC | | | PEN | | | | 3,790 | | | | 960,169 | | | | 945,718 | | | | 14,451 | | | | — | |
Expiring 12/21/22 | | CITI | | | PEN | | | | 3,150 | | | | 785,000 | | | | 785,886 | | | | — | | | | (886 | ) |
Philippine Peso, | | | | | | | | | | | | | | | | | | | | | | | | | | |
Expiring 12/21/22 | | HSBC | | | PHP | | | | 152,056 | | | | 2,646,069 | | | | 2,606,462 | | | | 39,607 | | | | — | |
Expiring 12/21/22 | | MSI | | | PHP | | | | 47,528 | | | | 797,000 | | | | 814,689 | | | | — | | | | (17,689 | ) |
Expiring 12/21/22 | | SCB | | | PHP | | | | 196,797 | | | | 3,391,000 | | | | 3,373,375 | | | | 17,625 | | | | — | |
Singapore Dollar, | | | | | | | | | | | | | | | | | | | | | | | | | | |
Expiring 12/21/22 | | DB | | | SGD | | | | 4,804 | | | | 3,415,000 | | | | 3,394,992 | | | | 20,008 | | | | — | |
Expiring 12/21/22 | | GSI | | | SGD | | | | 5,523 | | | | 3,858,000 | | | | 3,902,897 | | | | — | | | | (44,897 | ) |
Expiring 12/21/22 | | SCB | | | SGD | | | | 5,098 | | | | 3,609,000 | | | | 3,602,545 | | | | 6,455 | | | | — | |
South African Rand, | | | | | | | | | | | | | | | | | | | | | | | | | | |
Expiring 12/21/22 | | MSI | | | ZAR | | | | 87,585 | | | | 5,014,332 | | | | 4,749,188 | | | | 265,144 | | | | — | |
See Notes to Financial Statements.
54
Forward foreign currency exchange contracts outstanding at October 31, 2022 (continued):
| | | | | | | | | | | | | | | | | | | | | | | | | | |
Sale Contracts | | Counterparty | | Notional
Amount
(000) | | | Value at
Settlement
Date | | | Current
Value | | | Unrealized
Appreciation | | | Unrealized
Depreciation | |
|
OTC Forward Foreign Currency Exchange Contracts (cont’d.): | |
South Korean Won, | | | | | | | | | | | | | | | | | | | | | | | | | | |
Expiring 12/21/22 | | GSI | | | KRW | | | | 4,972,676 | | | $ | 3,480,000 | | | $ | 3,487,501 | | | $ | — | | | $ | (7,501 | ) |
Expiring 12/21/22 | | JPM | | | KRW | | | | 9,809,593 | | | | 7,108,349 | | | | 6,879,790 | | | | 228,559 | | | | — | |
Expiring 12/21/22 | | JPM | | | KRW | | | | 1,082,626 | | | | 784,000 | | | | 759,281 | | | | 24,719 | | | | — | |
Swiss Franc, | | | | | | | | | | | | | | | | | | | | | | | | | | |
Expiring 01/19/23 | | CITI | | | CHF | | | | 606 | | | | 615,140 | | | | 611,018 | | | | 4,122 | | | | — | |
Thai Baht, | | | | | | | | | | | | | | | | | | | | | | | | | | |
Expiring 12/21/22 | | GSI | | | THB | | | | 129,260 | | | | 3,569,000 | | | | 3,412,151 | | | | 156,849 | | | | — | |
Expiring 12/21/22 | | GSI | | | THB | | | | 88,645 | | | | 2,447,000 | | | | 2,340,009 | | | | 106,991 | | | | — | |
Expiring 12/21/22 | | HSBC | | | THB | | | | 117,353 | | | | 3,214,000 | | | | 3,097,823 | | | | 116,177 | | | | — | |
Expiring 12/21/22 | | JPM | | | THB | | | | 713,406 | | | | 19,580,770 | | | | 18,832,147 | | | | 748,623 | | | | — | |
Turkish Lira, | | | | | | | | | | | | | | | | | | | | | | | | | | |
Expiring 12/21/22 | | GSI | | | TRY | | | | 16,675 | | | | 848,616 | | | | 860,501 | | | | — | | | | (11,885 | ) |
| | | | | | | | | | | | | | | | | | | | | | | | | | |
| | | | | | | | | | | | $ | 380,916,846 | | | $ | 371,319,759 | | | | 14,636,108 | | | | (5,039,021 | ) |
| | | | | | | | | | | | | | | | | | | | | | | | | | |
| | | | | | | | | | | | | | | | | | | | $ | 18,397,052 | | | $ | (16,901,714 | ) |
| | | | | | | | | | | | | | | | | | | | | | | | | | |
Cross currency exchange contracts outstanding at October 31, 2022:
| | | | | | | | | | | | | | | | | | | | | | | | | | | | | | |
Settlement | | Type | | | Notional
Amount
(000) | | | In Exchange
For (000) | | | Unrealized
Appreciation | | | Unrealized
Depreciation | | | Counterparty |
| | | | | | | | | | | | | | | | | | |
| | | | | |
OTC Cross Currency Exchange Contracts: | | | | | | | | | | | | | | | | | | | |
01/19/23 | | | Buy | | | | AUD | | | | 1,225 | | | | EUR | | | | 789 | | | $ | 444 | | | $ | — | | | JPM |
01/19/23 | | | Buy | | | | CZK | | | | 77,364 | | | | EUR | | | | 3,124 | | | | 572 | | | | — | | | GSI |
01/19/23 | | | Buy | | | | HUF | | | | 587,513 | | | | EUR | | | | 1,388 | | | | 4,037 | | | | — | | | BOA |
01/19/23 | | | Buy | | | | HUF | | | | 763,192 | | | | EUR | | | | 1,794 | | | | 14,269 | | | | — | | | MSI |
01/19/23 | | | Buy | | | | PLN | | | | 7,358 | | | | EUR | | | | 1,528 | | | | — | | | | (1,574 | ) | | BOA |
01/19/23 | | | Buy | | | | PLN | | | | 13,626 | | | | EUR | | | | 2,799 | | | | 27,197 | | | | — | | | BOA |
10/31/23 | | | Buy | | | | AUD | | | | 6,309 | | | | JPY | | | | 422,703 | | | | 1,078,573 | | | | — | | | DB |
10/31/23 | | | Buy | | | | JPY | | | | 648,099 | | | | AUD | | | | 9,489 | | | | — | | | | (1,534,751 | ) | | MSI |
| | | | | | | | | | | | | | | | | | | | | | | | | | | | | | |
| | | | | | | | | | | | | | | | | | | | | | $ | 1,125,092 | | | $ | (1,536,325 | ) | | |
| | | | | | | | | | | | | | | | | | | | | | | | | | | | | | |
Credit default swap agreements outstanding at October 31, 2022:
| | | | | | | | | | | | | | | | | | | | | | | | | | | | |
Reference Entity/ Obligation | | Termination
Date | | | Fixed
Rate | | | Notional
Amount
(000)#(3) | | | Fair
Value | | | Upfront
Premiums
Paid
(Received) | | | Unrealized
Appreciation
(Depreciation) | | | Counterparty | |
| | | | | | | | | | | | | | | | | | | | | | |
OTC Packaged Credit Default Swap Agreements on corporate and/or sovereign issues - Buy Protection(1)**: | |
Arab Republic of Egypt (D01) | | | 12/20/27 | | | | 1.000%(Q) | | | | 1,000 | | | $ | 329,166 | | | $ | 27 | | | $ | 329,139 | | | | MSI | |
See Notes to Financial Statements.
PGIM Absolute Return Bond Fund 55
Schedule of Investments (continued)
as of October 31, 2022
Credit default swap agreements outstanding at October 31, 2022 (continued):
| | | | | | | | | | | | | | | | | | | | | | | | | | |
Reference Entity/ Obligation | | Termination
Date | | | Fixed
Rate | | | Notional
Amount
(000)#(3) | | | Fair
Value | | | Upfront
Premiums
Paid
(Received) | | | Unrealized
Appreciation
(Depreciation) | | | Counterparty |
| | | | | | | | | | | | | | | | | | | | | |
|
OTC Packaged Credit Default Swap Agreements on corporate and/or sovereign issues - Buy Protection(1)**(cont’d.): |
Emirate of Abu Dhabi (D01) | | | 12/20/27 | | | | 1.000%(Q) | | | | 1,000 | | | $ | (19,415 | ) | | $ | 27 | | | $ | (19,442 | ) | | MSI |
Federation of Malaysia (D01) | | | 12/20/27 | | | | 1.000%(Q) | | | | 1,500 | | | | 3,294 | | | | 41 | | | | 3,253 | | | MSI |
Federative Republic of Brazil (D01) | | | 12/20/27 | | | | 1.000%(Q) | | | | 6,000 | | | | 448,567 | | | | 163 | | | | 448,404 | | | MSI |
Kingdom of Saudi Arabia (D01) | | | 12/20/27 | | | | 1.000%(Q) | | | | 1,000 | | | | (15,124 | ) | | | 27 | | | | (15,151 | ) | | MSI |
People’s Republic of China (D01) | | | 12/20/27 | | | | 1.000%(Q) | | | | 6,000 | | | | 55,722 | | | | 163 | | | | 55,559 | | | MSI |
Republic of Argentina (D01) | | | 12/20/27 | | | | 1.000%(Q) | | | | 1,000 | | | | 784,733 | | | | 27 | | | | 784,706 | | | MSI |
Republic of Chile (D01) | | | 12/20/27 | | | | 1.000%(Q) | | | | 1,500 | | | | 33,701 | | | | 41 | | | | 33,660 | | | MSI |
Republic of Colombia (D01) | | | 12/20/27 | | | | 1.000%(Q) | | | | 3,000 | | | | 315,539 | | | | 82 | | | | 315,457 | | | MSI |
Republic of Indonesia (D01) | | | 12/20/27 | | | | 1.000%(Q) | | | | 5,000 | | | | 78,759 | | | | 136 | | | | 78,623 | | | MSI |
Republic of Panama (D01) | | | 12/20/27 | | | | 1.000%(Q) | | | | 1,000 | | | | 27,303 | | | | 27 | | | | 27,276 | | | MSI |
Republic of Peru (D01) | | | 12/20/27 | | | | 1.000%(Q) | | | | 1,500 | | | | 35,123 | | | | 41 | | | | 35,082 | | | MSI |
Republic of Philippines (D01) | | | 12/20/27 | | | | 1.000%(Q) | | | | 1,000 | | | | 10,786 | | | | 27 | | | | 10,759 | | | MSI |
Republic of South Africa (D01) | | | 12/20/27 | | | | 1.000%(Q) | | | | 5,500 | | | | 468,089 | | | | 150 | | | | 467,939 | | | MSI |
Republic of Turkey (D01) | | | 12/20/27 | | | | 1.000%(Q) | | | | 6,000 | | | | 1,264,241 | | | | 163 | | | | 1,264,078 | | | MSI |
State of Qatar (D01) | | | 12/20/27 | | | | 1.000%(Q) | | | | 1,000 | | | | (19,496 | ) | | | 27 | | | | (19,523 | ) | | MSI |
Sultanate of Oman (D01) | | | 12/20/27 | | | | 1.000%(Q) | | | | 1,000 | | | | 57,828 | | | | 27 | | | | 57,801 | | | MSI |
United Mexican States (D01) | | | 12/20/27 | | | | 1.000%(Q) | | | | 6,000 | | | | 159,449 | | | | 163 | | | | 159,286 | | | MSI |
Arab Republic of Egypt (D02) | | | 12/20/27 | | | | 1.000%(Q) | | | | 2,000 | | | | 658,332 | | | | 1,376 | | | | 656,956 | | | JPM |
Emirate of Abu Dhabi (D02) | | | 12/20/27 | | | | 1.000%(Q) | | | | 2,000 | | | | (38,830 | ) | | | 1,376 | | | | (40,206 | ) | | JPM |
Federation of Malaysia (D02) | | | 12/20/27 | | | | 1.000%(Q) | | | | 3,000 | | | | 6,588 | | | | 2,065 | | | | 4,523 | | | JPM |
Federative Republic of Brazil (D02) | | | 12/20/27 | | | | 1.000%(Q) | | | | 12,000 | | | | 897,134 | | | | 8,258 | | | | 888,876 | | | JPM |
Kingdom of Saudi Arabia (D02) | | | 12/20/27 | | | | 1.000%(Q) | | | | 2,000 | | | | (30,247 | ) | | | 1,376 | | | | (31,623 | ) | | JPM |
People’s Republic of China (D02) | | | 12/20/27 | | | | 1.000%(Q) | | | | 12,000 | | | | 111,444 | | | | 8,258 | | | | 103,186 | | | JPM |
Republic of Argentina (D02) | | | 12/20/27 | | | | 1.000%(Q) | | | | 2,000 | | | | 1,569,466 | | | | 1,376 | | | | 1,568,090 | | | JPM |
Republic of Chile (D02) | | | 12/20/27 | | | | 1.000%(Q) | | | | 3,000 | | | | 67,401 | | | | 2,065 | | | | 65,336 | | | JPM |
Republic of Colombia (D02) | | | 12/20/27 | | | | 1.000%(Q) | | | | 6,000 | | | | 631,076 | | | | 4,129 | | | | 626,947 | | | JPM |
Republic of Indonesia (D02) | | | 12/20/27 | | | | 1.000%(Q) | | | | 10,000 | | | | 157,519 | | | | 6,882 | | | | 150,637 | | | JPM |
Republic of Panama (D02) | | | 12/20/27 | | | | 1.000%(Q) | | | | 2,000 | | | | 54,606 | | | | 1,376 | | | | 53,230 | | | JPM |
Republic of Peru (D02) | | | 12/20/27 | | | | 1.000%(Q) | | | | 3,000 | | | | 70,246 | | | | 2,065 | | | | 68,181 | | | JPM |
Republic of Philippines (D02) | | | 12/20/27 | | | | 1.000%(Q) | | | | 2,000 | | | | 21,572 | | | | 1,376 | | | | 20,196 | | | JPM |
Republic of South Africa (D02) | | | 12/20/27 | | | | 1.000%(Q) | | | | 11,000 | | | | 936,177 | | | | 7,570 | | | | 928,607 | | | JPM |
Republic of Turkey (D02) | | | 12/20/27 | | | | 1.000%(Q) | | | | 12,000 | | | | 2,528,482 | | | | 8,258 | | | | 2,520,224 | | | JPM |
State of Qatar (D02) | | | 12/20/27 | | | | 1.000%(Q) | | | | 2,000 | | | | (38,991 | ) | | | 1,376 | | | | (40,367 | ) | | JPM |
Sultanate of Oman (D02) | | | 12/20/27 | | | | 1.000%(Q) | | | | 2,000 | | | | 115,656 | | | | 1,376 | | | | 114,280 | | | JPM |
United Mexican States (D02) | | | 12/20/27 | | | | 1.000%(Q) | | | | 12,000 | | | | 318,898 | | | | 8,258 | | | | 310,640 | | | JPM |
| | | | | | | | | | | | | | | | | | | | | | | | | | |
| | | | | | | | | | | | | | $ | 12,054,794 | | | $ | 70,175 | | | $ | 11,984,619 | | | |
| | | | | | | | | | | | | | | | | | | | | | | | | | |
See Notes to Financial Statements.
56
Credit default swap agreements outstanding at October 31, 2022 (continued):
| | | | | | | | | | | | | | | | | | | | | | | | | | | | | | | | |
Reference Entity/ Obligation | | Termination
Date | | | Fixed
Rate | | | Notional
Amount
(000)#(3) | | | Implied
Credit
Spread at
October 31,
2022(4) | | | Fair
Value | | | Upfront
Premiums
Paid
(Received) | | | Unrealized
Appreciation
(Depreciation) | | | Counterparty | |
| | | | | | | | | | | | | | | | | | | | | | | | | |
|
OTC Packaged Credit Default Swap Agreements on credit indices— Sell Protection(2)**: | |
CDX.EM.38.V1 (D01) | | | 12/20/27 | | | | 1.000%(Q) | | | | 50,000 | | | | 2.960 | % | | $ | (4,085,034 | ) | | $ | (6,252 | ) | | $ | (4,078,782 | ) | | | MSI | |
CDX.EM.38.V1 (D02) | | | 12/20/27 | | | | 1.000%(Q) | | | | 100,000 | | | | 2.960 | % | | | (8,170,068 | ) | | | (207,563 | ) | | | (7,962,505 | ) | | | JPM | |
| | | | | | | | | | | | | | | | | | | | | | | | | | | | | | | | |
| | | | | | | | | | | | | | | | | | $ | (12,255,102 | ) | | $ | (213,815 | ) | | $ | (12,041,287 | ) | | | | |
| | | | | | | | | | | | | | | | | | | | | | | | | | | | | | | | |
| ** | The Fund entered into multiple credit default swap agreements in a packaged trade consisting of two parts. The Fund bought/sold protection on an Emerging Market CDX Index and bought/sold protection on the countries which comprise the index. The upfront premium is attached to the index of the trade for the Emerging Markets CDX package(s). Each swap is priced individually. If any of the component swaps are closed out early, the Index exposure will be reduced by an amount proportionate to the terminated swap(s). Individual packages in the tables above are denoted by the corresponding footnotes (D01-D02). |
| | | | | | | | | | | | | | | | | | | | | | | | | | |
Reference Entity/ Obligation | | Termination
Date | | | Fixed
Rate | | | Notional
Amount
(000)# (3) | | | Fair
Value | | | Upfront
Premiums
Paid
(Received) | | | Unrealized
Appreciation
(Depreciation) | | | Counterparty |
| | | | | | | | | | | | | | | | | | | | | |
|
OTC Credit Default Swap Agreements on corporate and/or sovereign issues - Buy Protection(1): |
Gazprom PAO | | | 03/20/23 | | | | 1.000%(Q) | | | | 1,630 | | | $ | 314,804 | | | $ | 351,969 | | | | $(37,165 | ) | | BARC |
United Mexican States | | | 06/20/23 | | | | 1.000%(Q) | | | | 1,400 | | | | (5,759 | ) | | | 1,127 | | | | (6,886 | ) | | CITI |
United Mexican States | | | 06/20/23 | | | | 1.000%(Q) | | | | 1,385 | | | | (5,697 | ) | | | 2,767 | | | | (8,464 | ) | | CITI |
United Mexican States | | | 06/20/23 | | | | 1.000%(Q) | | | | 460 | | | | (1,892 | ) | | | 1,031 | | | | (2,923 | ) | | CITI |
United Mexican States | | | 06/20/23 | | | | 1.000%(Q) | | | | 460 | | | | (1,892 | ) | | | 945 | | | | (2,837 | ) | | CITI |
United Mexican States | | | 06/20/23 | | | | 1.000%(Q) | | | | 455 | | | | (1,871 | ) | | | 341 | | | | (2,212 | ) | | CITI |
United Mexican States | | | 06/20/23 | | | | 1.000%(Q) | | | | 240 | | | | (987 | ) | | | 193 | | | | (1,180 | ) | | CITI |
United Mexican States | | | 12/20/24 | | | | 1.000%(Q) | | | | 1,000 | | | | (3,425 | ) | | | (5,085 | ) | | | 1,660 | | | BARC |
United Mexican States | | | 12/20/24 | | | | 1.000%(Q) | | | | 440 | | | | (1,506 | ) | | | 1,325 | | | | (2,831 | ) | | CITI |
| | | | | | | | | | | | | | | | | | | | | | | | | | |
| | | | | | | | | | | | | | $ | 291,775 | | | $ | 354,613 | | | | $(62,838 | ) | | |
| | | | | | | | | | | | | | | | | | | | | | | | | | |
| | | | | | | | | | | | | | | | | | | | | | | | | | | | | | |
Reference Entity/ Obligation | | Termination
Date | | | Fixed
Rate | | | Notional
Amount
(000)#(3) | | | Implied
Credit
Spread at
October 31,
2022(4) | | | Fair
Value | | | Upfront
Premiums
Paid
(Received) | | | Unrealized
Appreciation
(Depreciation) | | | Counterparty |
|
OTC Credit Default Swap Agreements on corporate and/or sovereign issues - Sell Protection(2): |
AT&T, Inc. | | | 06/20/23 | | | | 1.000%(Q) | | | | 730 | | | | 0.827 | % | | $ | 1,646 | | | $ | 229 | | | $ | 1,417 | | | GSI |
Boeing Co. | | | 06/20/24 | | | | 1.000%(Q) | | | | 1,460 | | | | 1.176 | % | | | (2,318 | ) | | | 3,304 | | | | (5,622 | ) | | GSI |
Casino Guichard Perrachon SA | | | 06/20/24 | | | | 5.000%(Q) | | | | EUR 1,490 | | | | * | | | | (491,281 | ) | | | 17,056 | | | | (508,337 | ) | | GSI |
See Notes to Financial Statements.
PGIM Absolute Return Bond Fund 57
Schedule of Investments (continued)
as of October 31, 2022
Credit default swap agreements outstanding at October 31, 2022 (continued):
| | | | | | | | | | | | | | | | | | | | | | | | | | | | | | | | | | | | | | | | | | | | | |
Reference Entity/ Obligation | | Termination
Date | | Fixed
Rate | | Notional
Amount
(000)#(3) | | Implied
Credit
Spread at
October 31,
2022(4) | | Fair
Value | | Upfront
Premiums
Paid
(Received) | | Unrealized
Appreciation
(Depreciation) | | Counterparty |
|
OTC Credit Default Swap Agreements on corporate and/or sovereign issues - Sell Protection(2)(cont’d.): | |
Casino Guichard Perrachon SA | | | | 06/20/24 | | | | | 5.000%(Q) | | | | | EUR | | | | | 220 | | | | | * | | | | $ | (72,538 | ) | | | $ | 2,610 | | | | $ | (75,148 | ) | | | | GSI | |
Electricite de France SA | | | | 12/20/22 | | | | | 1.000%(Q) | | | | | EUR | | | | | 1,820 | | | | | 0.674% | | | | | 2,910 | | | | | 3,584 | | | | | (674 | ) | | | | GSI | |
EQT Corp. | | | | 12/20/22 | | | | | 5.000%(Q) | | | | | | | | | | 770 | | | | | 0.861% | | | | | 8,870 | | | | | 3,901 | | | | | 4,969 | | | | | CSI | |
General Motors Co. | | | | 06/20/26 | | | | | 5.000%(Q) | | | | | | | | | | 2,230 | | | | | 1.761% | | | | | 248,082 | | | | | 316,234 | | | | | (68,152 | ) | | | | GSI | |
GS_21-PJ2A^ | | | | 11/14/22 | | | | | 0.500%(M) | | | | | | | | | | 3,418 | | | | | * | | | | | 2,324 | | | | | (66 | ) | | | | 2,390 | | | | | GSI | |
GS_21-PJA^ | | | | 11/14/22 | | | | | 0.250%(M) | | | | | | | | | | 6,588 | | | | | * | | | | | 2,239 | | | | | (64 | ) | | | | 2,303 | | | | | GSI | |
Halliburton Co. | | | | 12/20/26 | | | | | 1.000%(Q) | | | | | | | | | | 910 | | | | | 0.712% | | | | | 10,907 | | | | | 7,218 | | | | | 3,689 | | | | | GSI | |
Host Hotels & Resorts LP | | | | 06/20/24 | | | | | 1.000%(Q) | | | | | | | | | | 500 | | | | | 0.716% | | | | | 2,827 | | | | | 3,171 | | | | | (344 | ) | | | | GSI | |
Petroleos Mexicanos | | | | 06/20/23 | | | | | 1.000%(Q) | | | | | | | | | | 9,450 | | | | | 3.559% | | | | | (139,602 | ) | | | | (179,872 | ) | | | | 40,270 | | | | | BNP | |
Petroleos Mexicanos | | | | 06/20/23 | | | | | 1.000%(Q) | | | | | | | | | | 1,165 | | | | | 3.559% | | | | | (17,210 | ) | | | | (9,458 | ) | | | | (7,752 | ) | | | | CITI | |
Petroleos Mexicanos | | | | 06/20/23 | | | | | 1.000%(Q) | | | | | | | | | | 1,155 | | | | | 3.559% | | | | | (17,063 | ) | | | | (11,256 | ) | | | | (5,807 | ) | | | | CITI | |
Petroleos Mexicanos | | | | 06/20/23 | | | | | 1.000%(Q) | | | | | | | | | | 385 | | | | | 3.559% | | | | | (5,688 | ) | | | | (3,845 | ) | | | | (1,843 | ) | | | | CITI | |
Petroleos Mexicanos | | | | 06/20/23 | | | | | 1.000%(Q) | | | | | | | | | | 385 | | | | | 3.559% | | | | | (5,687 | ) | | | | (3,775 | ) | | | | (1,912 | ) | | | | CITI | |
Petroleos Mexicanos | | | | 06/20/23 | | | | | 1.000%(Q) | | | | | | | | | | 380 | | | | | 3.559% | | | | | (5,614 | ) | | | | (3,100 | ) | | | | (2,514 | ) | | | | CITI | |
Petroleos Mexicanos | | | | 06/20/23 | | | | | 1.000%(Q) | | | | | | | | | | 195 | | | | | 3.559% | | | | | (2,880 | ) | | | | (1,582 | ) | | | | (1,298 | ) | | | | CITI | |
Petroleos Mexicanos | | | | 12/20/24 | | | | | 1.000%(Q) | | | | | | | | | | 1,000 | | | | | 5.213% | | | | | (80,063 | ) | | | | (22,314 | ) | | | | (57,749 | ) | | | | BARC | |
Petroleos Mexicanos | | | | 12/20/24 | | | | | 1.000%(Q) | | | | | | | | | | 440 | | | | | 5.213% | | | | | (35,228 | ) | | | | (17,741 | ) | | | | (17,487 | ) | | | | CITI | |
Simon Property Group LP | | | | 06/20/26 | | | | | 1.000%(Q) | | | | | | | | | | 1,980 | | | | | 0.938% | | | | | 6,363 | | | | | 16,724 | | | | | (10,361 | ) | | | | GSI | |
Targa Resources Partners LP | | | | 06/20/23 | | | | | 5.000%(Q) | | | | | | | | | | 885 | | | | | 0.657% | | | | | 29,356 | | | | | 19,629 | | | | | 9,727 | | | | | MSI | |
Targa Resources Partners LP | | | | 06/20/23 | | | | | 5.000%(Q) | | | | | | | | | | 590 | | | | | 0.657% | | | | | 19,570 | | | | | 13,691 | | | | | 5,879 | | | | | MSI | |
Verizon Communications, Inc. | | | | 06/20/26 | | | | | 1.000%(Q) | | | | | | | | | | 680 | | | | | 1.164% | | | | | (2,874 | ) | | | | 10,373 | | | | | (13,247 | ) | | | | GSI | |
Wells Fargo & Co. | | | | 12/20/23 | | | | | 1.000%(Q) | | | | | | | | | | 7,500 | | | | | 0.513% | | | | | 49,301 | | | | | 24,965 | | | | | 24,336 | | | | | MSI | |
| | | | | | | | | | | | | | | | | | | | | | | | | | | | | | | | | | | | | | | | | | | | | |
| | | | | | | | | | | | | | | | | | | | | | | | | | | | $ | (493,651 | ) | | | $ | 189,616 | | | | $ | (683,267 | ) | | | | | |
| | | | | | | | | | | | | | | | | | | | | | | | | | | | | | | | | | | | | | | | | | | | | |
See Notes to Financial Statements.
58
Credit default swap agreements outstanding at October 31, 2022 (continued):
| | | | | | | | | | | | | | | | | | | | | | | | |
Reference Entity/ Obligation | | Termination
Date | | | Fixed
Rate | | | Notional
Amount
(000)#(3) | | | Value at
Trade Date | | | Value at
October 31,
2022 | | | Unrealized
Appreciation
(Depreciation) | |
|
Centrally Cleared Credit Default Swap Agreements on credit indices - Buy Protection(1): | |
CDX.NA.HY.38.V2 | | | 06/20/27 | | | | 5.000%(Q) | | | | 12,993 | | | $ | (64,506 | ) | | $ | (172,989 | ) | | $ | (108,483 | ) |
CDX.NA.IG.39.V1 | | | 12/20/27 | | | | 1.000%(Q) | | | | 197,340 | | | | (126,286 | ) | | | (1,098,948 | ) | | | (972,662 | ) |
| | | | | | | | | | | | | | | | | | | | | | | | |
| | | | | | | | | | | | | | $ | (190,792 | ) | | $ | (1,271,937 | ) | | $ | (1,081,145 | ) |
| | | | | | | | | | | | | | | | | | | | | | | | |
| | | | | | | | | | | | | | | | | | | | | | | | | | | | |
Reference Entity/ Obligation | | Termination
Date | | | Fixed
Rate | | | Notional
Amount
(000)# (3) | | | Fair
Value | | | Upfront
Premiums
Paid
(Received) | | | Unrealized
Appreciation
(Depreciation) | | | Counterparty | |
| | |
OTC Credit Default Swap Agreements on credit indices - Buy Protection(1): | | | | | | | | | |
CMBX.NA.13.AAA | | | 12/16/72 | | | | 0.500%(M) | | | | 25,000 | | | $ | 509,161 | | | $ | 683,820 | | | $ | (174,659 | ) | | | MSI | |
CMBX.NA.13.AAA | | | 12/16/72 | | | | 0.500%(M) | | | | 22,500 | | | | 458,245 | | | | 229,660 | | | | 228,585 | | | | CIGM | |
CMBX.NA.13.AAA | | | 12/16/72 | | | | 0.500%(M) | | | | 10,000 | | | | 203,665 | | | | 196,263 | | | | 7,402 | | | | GSI | |
CMBX.NA.13.AAA | | | 12/16/72 | | | | 0.500%(M) | | | | 7,000 | | | | 141,690 | | | | 32,778 | | | | 108,912 | | | | MSI | |
| | | | | | | | | | | | | | | | | | | | | | | | | | | | |
| | | | | | | | | | | | | | $ | 1,312,761 | | | $ | 1,142,521 | | | $ | 170,240 | | | | | |
| | | | | | | | | | | | | | | | | | | | | | | | | | | | |
The Fund entered into credit default swaps (“CDS”) to provide a measure of protection against defaults or to take an active long or short position with respect to the likelihood of a particular issuer’s default or the reference entity’s credit soundness. CDS contracts generally trade based on a spread which represents the cost a protection buyer has to pay the protection seller. The protection buyer is said to be short the credit as the value of the contract rises the more the credit deteriorates. The value of the CDS contract increases for the protection buyer if the spread increases.
| (1) | If the Fund is a buyer of protection, it pays the fixed rate. When a credit event occurs, as defined under the terms of that particular swap agreement, the Fund will either (i) receive from the seller of protection an amount equal to the notional amount of the swap and make delivery of the referenced obligation or underlying securities comprising the referenced index or (ii) receive a net settlement amount in the form of cash or securities equal to the notional amount of the swap less the recovery value of the referenced obligation or underlying securities comprising the referenced index. |
| (2) | If the Fund is a seller of protection, it receives the fixed rate. When a credit event occurs, as defined under the terms of that particular swap agreement, the Fund will either (i) pay to the buyer of protection an amount equal to the notional amount of the swap and take delivery of the referenced obligation or underlying securities comprising the referenced index or (ii) pay a net settlement amount in the form of cash or securities equal to the notional amount of the swap less the recovery value of the referenced obligation or underlying securities comprising the referenced index. |
| (3) | Notional amount represents the maximum potential amount the Fund could be required to pay as a seller of credit protection or receive as a buyer of credit protection if a credit event occurs as defined under the terms of that particular swap agreement. |
See Notes to Financial Statements.
PGIM Absolute Return Bond Fund 59
Schedule of Investments (continued)
as of October 31, 2022
| (4) | Implied credit spreads, represented in absolute terms, utilized in determining the fair value of credit default swap agreements where the Fund is the seller of protection as of the reporting date serve as an indicator of the current status of the payment/ performance risk and represent the likelihood of risk of default for the credit derivative. The implied credit spread of a particular referenced entity reflects the cost of buying/selling protection and may include up-front payments required to be made to enter into the agreement. Wider credit spreads represent a deterioration of the referenced entity’s credit soundness and a greater likelihood of risk of default or other credit event occurring as defined under the terms of the agreement. |
| * | When an implied credit spread is not available, reference the fair value of credit default swap agreements on credit indices and asset-backed securities. Where the Fund is the seller of protection, it serves as an indicator of the current status of the payment/performance risk and represents the likelihood of an expected liability (or profit) for the credit derivative should the notional amount of the swap agreement be closed/sold as of the reporting date. Increasing fair value in absolute terms, when compared to the notional amount of the swap, represents a deterioration of the referenced entity’s credit soundness and a greater likelihood of risk of default or other credit event occurring as defined under the terms of the agreement. |
Interest rate swap agreements outstanding at October 31, 2022:
| | | | | | | | | | | | | | | | | | | | | | | | |
Notional Amount (000)# | | Termination
Date | | | Fixed
Rate | | | Floating
Rate | | | Value at Trade Date | | | Value at October 31, 2022 | | | Unrealized Appreciation (Depreciation) | |
| | | | | | | | | | | | | | | | | | | |
Centrally Cleared Interest Rate Swap Agreements: | |
| | | | | | | | | | | 1 Day SONIA(1)(A)/ | | | | | | | | | | | | | |
GBP 6,090 | | | 05/08/26 | | | | 1.000 | %(A) | | | 2.184% | | | $ | (84,366 | ) | | $ | 783,281 | | | $ | 867,647 | |
| | | | | | | | | | | 1 Day SONIA(1)(A)/ | | | | | | | | | | | | | |
GBP 3,280 | | | 05/08/27 | | | | 1.050 | %(A) | | | 2.184% | | | | 169,315 | | | | 516,113 | | | | 346,798 | |
| | | | | | | | | | | 1 Day SONIA(1)(A)/ | | | | | | | | | | | | | |
GBP 1,340 | | | 05/08/31 | | | | 1.150 | %(A) | | | 2.184% | | | | (30,882 | ) | | | 305,749 | | | | 336,631 | |
| | | | | | | | | | | | | | | | | | | | | | | | |
| | | | | | | | | | | | | | $ | 54,067 | | | $ | 1,605,143 | | | $ | 1,551,076 | |
| | | | | | | | | | | | | | | | | | | | | | | | |
| (1) | The Fund pays the fixed rate and receives the floating rate. |
| (2) | The Fund pays the floating rate and receives the fixed rate. |
Total return swap agreements outstanding at October 31, 2022:
| | | | | | | | | | | | | | | | | | | | | | | | | | | | | |
Reference Entity | | Financing Rate | | Counterparty | | Termination
Date | | Long
(Short)
Notional
Amount
(000)#(1) | | Fair Value | | Upfront
Premiums
Paid
(Received) | | Unrealized
Appreciation
(Depreciation)(2) |
| | | | | | | | | | | | | | | |
| | | | | | | |
OTC Total Return Swap Agreements: | | | | | | | | | | | | | | | | | | | | | | | | | | | | | |
Total Return Benchmark Bond Index(T) | | 1 Day USOIS
-60bps(T)/ 2.480% | | GSI | | | | 12/20/22 | | | | | (3,222 | ) | | | $ | 304,665 | | | | $ | — | | | | $ | 304,665 | |
Total Return Benchmark Bond Index(T)†† | | 1 Day USOIS -50bps(Q)/ 2.580% | | JPM | | | | 03/20/23 | | | | | (52,633 | ) | | | | 411,672 | | | | | — | | | | | 411,672 | |
| | | | | | | | | | | | | | | | | | | | | | | | | | | | | |
| | | | | | | | | | | | | | | | | $ | 716,337 | | | | $ | — | | | | $ | 716,337 | |
| | | | | | | | | | | | | | | | | | | | | | | | | | | | | |
See Notes to Financial Statements.
60
| (1) | On a long total return swap, the Fund receives payments for any positive return on the reference entity (makes payments for any negative return) and pays the financing rate. On a short total return swap, the Fund makes payments for any positive return on the reference entity (receives payments for any negative return) and receives the financing rate. |
| (2) | Upfront/recurring fees or commissions, as applicable, are included in the net unrealized appreciation (depreciation). |
| †† | See the table below for the swap constituents. To the extent that any swap is composed of greater than 50 constituents, the Portfolio is only required to disclose the top 50. |
The following table represents the individual positions and related values of underlying securities of Total Return Benchmark Bond Index total return swap with JPM, as of October 31, 2022, termination date 03/20/2023:
Corporate Bonds:
| | | | | | | | | | | | | | | |
Reference Entity | | Principal
Amount | | Market
Value | | % of Total
Index Value |
| | | |
Sysco Corp. | | | | 4,000,000 | | | | $ | 4,160,960 | | | | | 1.51 | % |
United Parcel Service, Inc. | | | | 4,000,000 | | | | | 3,949,347 | | | | | 1.43 | % |
Northrop Grumman Corp. | | | | 4,000,000 | | | | | 3,846,560 | | | | | 1.40 | % |
Morgan Stanley | | | | 4,000,000 | | | | | 3,730,490 | | | | | 1.35 | % |
Conagra Brands, Inc. | | | | 4,000,000 | | | | | 3,557,600 | | | | | 1.29 | % |
Keurig Dr Pepper, Inc. | | | | 4,000,000 | | | | | 3,525,540 | | | | | 1.28 | % |
FedEx Corp. | | | | 4,000,000 | | | | | 3,512,553 | | | | | 1.28 | % |
The Walt Disney Co. | | | | 4,000,000 | | | | | 3,510,284 | | | | | 1.27 | % |
Cigna Corp. | | | | 4,000,000 | | | | | 3,482,524 | | | | | 1.26 | % |
TransCanada PipeLines Ltd. | | | | 4,000,000 | | | | | 3,447,787 | | | | | 1.25 | % |
Bristol-Myers Squibb Co. | | | | 4,000,000 | | | | | 3,415,033 | | | | | 1.24 | % |
Fox Corp. | | | | 4,000,000 | | | | | 3,412,117 | | | | | 1.24 | % |
Wells Fargo & Co. | | | | 4,000,000 | | | | | 3,393,479 | | | | | 1.23 | % |
Eli Lilly and Co. | | | | 4,000,000 | | | | | 3,392,349 | | | | | 1.23 | % |
ExxonMobil Corp. | | | | 4,000,000 | | | | | 3,371,353 | | | | | 1.22 | % |
Thermo Fisher Scientific, Inc. | | | | 4,000,000 | | | | | 3,316,102 | | | | | 1.20 | % |
HCA, Inc. | | | | 4,000,000 | | | | | 3,294,013 | | | | | 1.20 | % |
Intel Corp. | | | | 4,000,000 | | | | | 3,288,200 | | | | | 1.19 | % |
Johnson & Johnson | | | | 4,000,000 | | | | | 3,241,567 | | | | | 1.18 | % |
Telefonica Emisiones, S.A.U. | | | | 4,000,000 | | | | | 3,211,507 | | | | | 1.17 | % |
T-Mobile USA, Inc. | | | | 4,000,000 | | | | | 3,197,480 | | | | | 1.16 | % |
Deere & Co. | | | | 4,000,000 | | | | | 3,181,467 | | | | | 1.16 | % |
Mastercard, Inc. | | | | 4,000,000 | | | | | 3,164,972 | | | | | 1.15 | % |
McDonald’s Corp. | | | | 4,000,000 | | | | | 3,153,320 | | | | | 1.14 | % |
Fiserv, Inc. | | | | 4,000,000 | | | | | 3,090,307 | | | | | 1.12 | % |
Union Electric Co. | | | | 4,000,000 | | | | | 3,066,480 | | | | | 1.11 | % |
Dollar General Corp. | | | | 4,000,000 | | | | | 3,058,473 | | | | | 1.11 | % |
Equinor ASA | | | | 4,000,000 | | | | | 3,044,278 | | | | | 1.11 | % |
Progressive Corp. | | | | 4,000,000 | | | | | 3,022,521 | | | | | 1.10 | % |
Humana, Inc. | | | | 4,000,000 | | | | | 3,008,956 | | | | | 1.09 | % |
Enterprise Products Operating LLC | | | | 4,000,000 | | | | | 3,002,040 | | | | | 1.09 | % |
Becton, Dickinson & Co. | | | | 4,000,000 | | | | | 2,986,310 | | | | | 1.08 | % |
Bank of America Corp. | | | | 4,000,000 | | | | | 2,974,240 | | | | | 1.08 | % |
Nike, Inc. | | | | 4,000,000 | | | | | 2,939,510 | | | | | 1.07 | % |
Paramount Global | | | | 4,000,000 | | | | | 2,908,900 | | | | | 1.06 | % |
See Notes to Financial Statements.
PGIM Absolute Return Bond Fund 61
Schedule of Investments (continued)
as of October 31, 2022
Corporate Bonds: (continued)
| | | | | | | | | | | | | | | |
Reference Entity | | Principal
Amount | | Market
Value | | % of Total
Index Value |
| | | |
Caterpillar, Inc. | | | | 4,000,000 | | | | $ | 2,881,064 | | | | | 1.05 | % |
NVIDIA Corp. | | | | 4,000,000 | | | | | 2,855,067 | | | | | 1.04 | % |
Vodafone Group PLC | | | | 4,000,000 | | | | | 2,840,258 | | | | | 1.03 | % |
Starbucks Corp. | | | | 4,000,000 | | | | | 2,807,636 | | | | | 1.02 | % |
Walgreens Boots Alliance, Inc. | | | | 4,000,000 | | | | | 2,788,049 | | | | | 1.01 | % |
Entergy Corp. | | | | 4,000,000 | | | | | 2,787,587 | | | | | 1.01 | % |
Union Pacific Corp. | | | | 4,000,000 | | | | | 2,786,336 | | | | | 1.01 | % |
UnitedHealth Group, Inc | | | | 4,000,000 | | | | | 2,782,704 | | | | | 1.01 | % |
Amazon.com, Inc. | | | | 4,000,000 | | | | | 2,782,251 | | | | | 1.01 | % |
Suncor Energy, Inc | | | | 4,000,000 | | | | | 2,775,830 | | | | | 1.01 | % |
The Coca-Cola Co. | | | | 4,000,000 | | | | | 2,773,067 | | | | | 1.01 | % |
PepsiCo, Inc. | | | | 4,000,000 | | | | | 2,741,831 | | | | | 1.00 | % |
AstraZeneca PLC | | | | 4,000,000 | | | | | 2,737,680 | | | | | 0.99 | % |
Global Payments, Inc. | | | | 4,000,000 | | | | | 2,737,244 | | | | | 0.99 | % |
Verizon Communications, Inc. | | | | 4,000,000 | | | | | 2,733,503 | | | | | 0.99 | % |
| | | | | | | | | | | | | | | |
| | | | | | | | $ | 157,668,726 | | | | | | |
| | | | | | | | | | | | | | | |
Balances Reported in the Statement of Assets and Liabilities for OTC Swap Agreements:
| | | | | | | | | | | | |
| | | Premiums Paid | | Premiums Received | | Unrealized Appreciation | | | Unrealized Depreciation | |
| |
| | | | |
OTC Swap Agreements | | $2,015,083 | | $(471,973) | | | $13,308,807 | | | | $(13,225,003 | ) |
| |
Summary of Collateral for Centrally Cleared/Exchange-traded Derivatives:
Cash and securities segregated as collateral, including pending settlement for closed positions, to cover requirements for centrally cleared/exchange-traded derivatives are listed by broker as follows:
| | | | | | | | | | |
Broker | | Cash and/or Foreign Currency | | Securities Market Value |
CIGM | | | $ | 1,050,000 | | | | $ | 27,939,781 | |
| | | | | | | | | | |
Fair Value Measurements:
Various inputs are used in determining the value of the Fund’s investments. These inputs are summarized in the three broad levels listed below.
Level 1—unadjusted quoted prices generally in active markets for identical securities.
Level 2—quoted prices for similar securities, interest rates and yield curves, prepayment speeds, foreign currency exchange rates and other observable inputs.
Level 3—unobservable inputs for securities valued in accordance with Board approved fair valuation procedures.
See Notes to Financial Statements.
62
The following is a summary of the inputs used as of October 31, 2022 in valuing such portfolio securities:
| | | | | | | | | | | | |
| | | Level 1 | | | Level 2 | | | Level 3 | |
Investments in Securities | | | | | | | | | | | | |
Assets | | | | | | | | | | | | |
Long-Term Investments | | | | | | | | | | | | |
Asset-Backed Securities | | | | | | | | | | | | |
Automobiles | | $ | — | | | $ | 2,349,729 | | | $ | — | |
Collateralized Loan Obligations | | | — | | | | 269,063,292 | | | | — | |
Consumer Loans | | | — | | | | 6,955,454 | | | | — | |
Home Equity Loans | | | — | | | | 10,455,995 | | | | — | |
Other | | | — | | | | 3,043,710 | | | | — | |
Residential Mortgage-Backed Securities | | | — | | | | 8,062,716 | | | | 5,303,948 | |
Student Loans | | | — | | | | 3,807,177 | | | | — | |
Commercial Mortgage-Backed Securities | | | — | | | | 57,825,702 | | | | — | |
Convertible Bond | | | — | | | | 3,158 | | | | — | |
Corporate Bonds | | | — | | | | 263,497,202 | | | | 853,677 | |
Floating Rate and other Loans | | | — | | | | 12,868,905 | | | | 2,487,598 | |
Municipal Bonds | | | — | | | | 17,500,390 | | | | — | |
Residential Mortgage-Backed Securities | | | — | | | | 29,094,226 | | | | — | |
Sovereign Bonds | | | — | | | | 23,895,692 | | | | — | |
U.S. Government Agency Obligations | | | — | | | | 78,454,380 | | | | — | |
U.S. Treasury Obligations | | | — | | | | 412,070,389 | | | | — | |
Common Stocks | | | 1,714,045 | | | | 671,119 | | | | 1,362,600 | |
Rights | | | — | | | | — | | | | 23,677 | |
Warrants | | | — | | | | — | | | | 119 | |
| | | |
Short-Term Investments | | | | | | | | | | | | |
Affiliated Mutual Funds | | $ | 133,907,415 | | | $ | — | | | $ | — | |
Unaffiliated Fund | | | 46,674,293 | | | | — | | | | — | |
Options Purchased | | | — | | | | 7,385,358 | | | | — | |
| | | | | | | | | | | | |
Total | | $ | 182,295,753 | | | $ | 1,207,004,594 | | | $ | 10,031,619 | |
| | | | | | | | | | | | |
| | | |
Liabilities | | | | | | | | | | | | |
Options Written | | $ | — | | | $ | (7,272,362 | ) | | $ | (479 | ) |
| | | | | | | | | | | | |
| | | |
Other Financial Instruments* | | | | | | | | | | | | |
Assets | | | | | | | | | | | | |
Centrally Cleared Swaptions Written | | $ | — | | | $ | 860,882 | | | $ | — | |
Futures Contracts | | | 35,863,323 | | | | — | | | | — | |
OTC Forward Foreign Currency Exchange Contracts | | | — | | | | 18,397,052 | | | | — | |
OTC Cross Currency Exchange Contracts | | | — | | | | 1,125,092 | | | | — | |
OTC Packaged Credit Default Swap Agreements | | | — | | | | 12,216,897 | | | | — | |
OTC Credit Default Swap Agreements | | | — | | | | 2,007,397 | | | | 4,563 | |
Centrally Cleared Interest Rate Swap Agreements | | | — | | | | 1,551,076 | | | | — | |
OTC Total Return Swap Agreements | | | — | | | | 716,337 | | | | — | |
| | | | | | | | | | | | |
Total | | $ | 35,863,323 | | | $ | 36,874,733 | | | $ | 4,563 | |
| | | | | | | | | | | | |
| | | |
Liabilities | | | | | | | | | | | | |
Centrally Cleared Swaptions Purchased | | $ | — | | | $ | (932,654 | ) | | $ | — | |
See Notes to Financial Statements.
PGIM Absolute Return Bond Fund 63
Schedule of Investments (continued)
as of October 31, 2022
| | | | | | | | | | | | |
| | | Level 1 | | | Level 2 | | | Level 3 | |
Other Financial Instruments* (continued) | | | | | | | | | | | | |
Liabilities (continued) | | | | | | | | | | | | |
Centrally Cleared Swaptions Written | | $ | — | | | $ | (446,558 | ) | | $ | — | |
OTC Forward Foreign Currency Exchange Contracts | | | — | | | | (16,901,714 | ) | | | — | |
OTC Cross Currency Exchange Contracts | | | — | | | | (1,536,325 | ) | | | — | |
OTC Packaged Credit Default Swap Agreements | | | — | | | | (12,417,205 | ) | | | — | |
Centrally Cleared Credit Default Swap Agreements | | | — | | | | (1,081,145 | ) | | | — | |
OTC Credit Default Swap Agreements | | | — | | | | (901,075 | ) | | | — | |
| | | | | | | | | | | | |
Total | | $ | — | | | $ | (34,216,676 | ) | | $ | — | |
| | | | | | | | | | | | |
| * | Other financial instruments are derivative instruments not reflected in the Schedule of Investments, such as centrally cleared swaptions, futures, forwards and centrally cleared swap contracts, which are recorded at the unrealized appreciation (depreciation) on the instrument, and OTC swap contracts which are recorded at fair value. |
Industry Classification:
The industry classification of investments and liabilities in excess of other assets shown as a percentage of net assets as of October 31, 2022 were as follows:
| | | | |
U.S. Treasury Obligations | | | 31.8 | % |
Collateralized Loan Obligations | | | 20.8 | |
Affiliated Mutual Funds (1.9% represents investments purchased with collateral from securities on loan) | | | 10.3 | |
U.S. Government Agency Obligations | | | 6.0 | |
Banks | | | 5.5 | |
Commercial Mortgage-Backed Securities | | | 4.5 | |
Unaffiliated Fund | | | 3.6 | |
Residential Mortgage-Backed Securities | | | 3.2 | |
Sovereign Bonds | | | 1.8 | |
Oil & Gas | | | 1.8 | |
Municipal Bonds | | | 1.4 | |
Telecommunications | | | 1.3 | |
Pipelines | | | 1.2 | |
Electric | | | 1.0 | |
Pharmaceuticals | | | 1.0 | |
Retail | | | 1.0 | |
Chemicals | | | 0.9 | |
Home Equity Loans | | | 0.8 | |
Aerospace & Defense | | | 0.8 | |
Foods | | | 0.7 | |
Media | | | 0.6 | |
Insurance | | | 0.6 | |
Options Purchased | | | 0.6 | |
Consumer Loans | | | 0.5 | |
Commercial Services | | | 0.5 | |
| | | | |
Home Builders | | | 0.4 | % |
Gas | | | 0.4 | |
Real Estate | | | 0.3 | |
Airlines | | | 0.3 | |
Mining | | | 0.3 | |
Student Loans | | | 0.3 | |
Diversified Financial Services | | | 0.3 | |
Entertainment | | | 0.3 | |
Engineering & Construction | | | 0.3 | |
Auto Parts & Equipment | | | 0.3 | |
Other | | | 0.2 | |
Packaging & Containers | | | 0.2 | |
Internet | | | 0.2 | |
Healthcare-Services | | | 0.2 | |
Lodging | | | 0.2 | |
Automobiles | | | 0.2 | |
Healthcare-Products | | | 0.2 | |
Investment Companies | | | 0.2 | |
Oil, Gas & Consumable Fuels | | | 0.2 | |
Forest Products & Paper | | | 0.1 | |
Auto Manufacturers | | | 0.1 | |
Gas Utilities | | | 0.1 | |
Computers | | | 0.1 | |
Real Estate Investment Trusts (REITs) | | | 0.1 | |
Building Materials | | | 0.1 | |
Metal Fabricate/Hardware | | | 0.1 | |
Energy-Alternate Sources | | | 0.0 | * |
See Notes to Financial Statements.
64
Industry Classification (continued):
| | | | |
Wireless Telecommunication Services | | | 0.0 | *% |
Transportation | | | 0.0 | * |
Agriculture | | | 0.0 | * |
Beverages | | | 0.0 | * |
Housewares | | | 0.0 | * |
Oil & Gas Services | | | 0.0 | * |
Hotels, Restaurants & Leisure | | | 0.0 | * |
| | | | |
| | | 107.9 | |
Options Written | | | (0.6 | ) |
Liabilities in excess of other assets | | | (7.3 | ) |
| | | | |
| | | 100.0 | % |
| | | | |
Effects of Derivative Instruments on the Financial Statements and Primary Underlying Risk Exposure:
The Fund invested in derivative instruments during the reporting period. The primary types of risk associated with these derivative instruments are credit contracts risk, foreign exchange contracts risk and interest rate contracts risk. See the Notes to Financial Statements for additional detail regarding these derivative instruments and their risks. The effect of such derivative instruments on the Fund’s financial position and financial performance as reflected in the Statement of Assets and Liabilities and Statement of Operations is presented in the summary below.
Fair values of derivative instruments as of October 31, 2022 as presented in the Statement of Assets and Liabilities:
| | | | | | | | | | | | |
| | | Asset Derivatives | | | Liability Derivatives | |
Derivatives not accounted for as hedging instruments,
carried at fair value | | Statement of Assets and Liabilities Location | | Fair
Value | | | Statement of Assets and Liabilities Location | | Fair
Value | |
Credit contracts | | Due from/to broker-variation margin swaps and swaptions | | $ | 860,882 | * | | Due from/to broker-variation margin swaps and swaptions | | $ | 2,460,357 | * |
Credit contracts | | Premiums paid for OTC swap agreements | | | 2,015,083 | | | Premiums received for OTC swap agreements | | | 471,973 | |
Credit contracts | | Unaffiliated investments | | | 369,769 | | | Options written outstanding, at value | | | 257,251 | |
Credit contracts | | Unrealized appreciation on OTC swap agreements | | | 12,592,470 | | | Unrealized depreciation on OTC swap agreements | | | 13,225,003 | |
Foreign exchange contracts | | Unaffiliated investments | | | 7,015,589 | | | Options written outstanding, at value | | | 7,015,590 | |
Foreign exchange contracts | | Unrealized appreciation on OTC cross currency exchange contracts | | | 1,125,092 | | | Unrealized depreciation on OTC cross currency exchange contracts | | | 1,536,325 | |
See Notes to Financial Statements.
PGIM Absolute Return Bond Fund 65
Schedule of Investments (continued)
as of October 31, 2022
| | | | | | | | | | | | |
| | | Asset Derivatives | | | Liability Derivatives | |
Derivatives not accounted for as hedging instruments,
carried at fair value | | Statement of Assets and Liabilities Location | | Fair
Value | | | Statement of Assets and Liabilities Location | | Fair
Value | |
Foreign exchange contracts | | Unrealized appreciation on OTC forward foreign currency exchange contracts | | $ | 18,397,052 | | | Unrealized depreciation on OTC forward foreign currency exchange contracts | | $ | 16,901,714 | |
Interest rate contracts | | Due from/to broker-variation margin futures | | | 35,863,323 | * | | — | | | — | |
Interest rate contracts | | Due from/to broker-variation margin swaps and swaptions | | | 1,551,076 | * | | — | | | — | |
Interest rate contracts | | Unrealized appreciation on OTC swap agreements | | | 716,337 | | | — | | | — | |
| | | | | | | | | | | | |
| | | | |
| | | | $ | 80,506,673 | | | | | $ | 41,868,213 | |
| | | | | | | | | | | | |
| * | Includes cumulative appreciation (depreciation) as reported in the schedule of open futures, centrally cleared swap contracts, and centrally cleared swaptions. Only unsettled variation margin receivable (payable) is reported within the Statement of Assets and Liabilities. |
The effects of derivative instruments on the Statement of Operations for the year ended October 31, 2022 are as follows:
| | | | | | | | | | |
Amount of Realized Gain (Loss) on Derivatives Recognized in Income |
| | | | | | | | | | | | | | | | | | | | |
| | | | | |
Derivatives not accounted for as hedging instruments, carried at fair value | | Options
Purchased(1) | | | Options
Written | | | Futures | | | Forward &
Cross
Currency
Exchange
Contracts | | | Swaps | |
| | | | | |
Credit contracts | | $ | (6,162,603 | ) | | $ | 6,746,099 | | | $ | — | | | $ | — | | | $ | 4,400,189 | |
Foreign exchange contracts | | | (7,944,644 | ) | | | 8,951,146 | | | | — | | | | 25,932,198 | | | | — | |
Interest rate contracts | | | — | | | | — | | | | 62,769,587 | | | | — | | | | (19,063,905 | ) |
| | | | | | | | | | | | | | | | | | | | |
Total | | $ | (14,107,247 | ) | | $ | 15,697,245 | | | $ | 62,769,587 | | | $ | 25,932,198 | | | $ | (14,663,716 | ) |
| | | | | | | | | | | | | | | | | | | | |
| (1) | Included in net realized gain (loss) on investment transactions in the Statement of Operations. |
| | | | | | | | | | | | | | | | | | | | | | | | |
Change in Unrealized Appreciation (Depreciation) on Derivatives Recognized in Income | |
| | | | | | |
Derivatives not accounted for as hedging instruments, carried at fair value | | | | | Options
Purchased(2) | | | Options
Written | | | Futures | | | Forward
& Cross
Currency
Exchange
Contracts | | | Swaps | |
Credit contracts | | | | | | $ | (1,931,139) | | | $ | 1,398,491 | | | $ | — | | | $ | — | | | $ | (808,732) | |
See Notes to Financial Statements.
66
| | | | | | | | | | |
Change in Unrealized Appreciation (Depreciation) on Derivatives Recognized in Income |
| | | | | | | | | | | | | | | | | | | | | | | | | |
| | | | | |
Derivatives not accounted for as hedging instruments, carried at fair value | | Options
Purchased(2) | | Options
Written | | Futures | | Forward & Cross
Currency
Exchange
Contracts | | Swaps |
| | | | | |
Foreign exchange contracts | | | $ | 13,901,984 | | | | $ | (14,908,487 | ) | | | $ | — | | | | | $ (747,665) | | | | $ | — | |
Interest rate contracts | | | | — | | | | | — | | | | | 29,390,988 | | | | | — | | | | | 18,853,892 | |
| | | | | | | | | | | | | | | | | | | | | | | | | |
Total | | | $ | 11,970,845 | | | | $ | (13,509,996 | ) | | | $ | 29,390,988 | | | | | $ (747,665) | | | | $ | 18,045,160 | |
| | | | | | | | | | | | | | | | | | | | | | | | | |
(2) Included in net change in unrealized appreciation (depreciation) on investments in the Statement of Operations.
For the year ended October 31, 2022, the Fund’s average volume of derivative activities is as follows:
| | | | | | |
| Derivative Contract Type | | Average Volume of Derivative Activities* |
Options Purchased (1) | | | | $ 4,822,687 | | |
Options Written (2) | | | | 1,338,003,116 | | |
Futures Contracts - Long Positions (2) | | | | 7,193,319 | | |
Futures Contracts - Short Positions (2) | | | | 768,191,758 | | |
Forward Foreign Currency Exchange Contracts - Purchased (3) | | | | 180,132,638 | | |
Forward Foreign Currency Exchange Contracts - Sold (3) | | | | 338,096,463 | | |
Cross Currency Exchange Contracts (4) | | | | 17,527,811 | | |
Interest Rate Swap Agreements (2) | | | | 71,657,145 | | |
Credit Default Swap Agreements - Buy Protection (2) | | | | 359,880,552 | | |
Credit Default Swap Agreements -Sell Protection (2) | | | | 130,888,096 | | |
Total Return Swap Agreements (2) | | | | 12,601,028 | | |
Inflation Swap Agreements (2) | | | | 7,032,000 | | |
| * | Average volume is based on average quarter end balances as noted for the year ended October 31, 2022. |
| (2) | Notional Amount in USD. |
| (3) | Value at Settlement Date. |
Financial Instruments/Transactions—Summary of Offsetting and Netting Arrangements:
The Fund invested in OTC derivatives and entered into financial instruments/transactions during the reporting period that are either offset in accordance with current requirements or are subject to enforceable master netting arrangements or similar agreements that permit offsetting. The information about offsetting and related netting arrangements for OTC derivatives and financial instruments/transactions where the legal right to set-off exists is presented in the summary below.
See Notes to Financial Statements.
PGIM Absolute Return Bond Fund 67
Schedule of Investments (continued)
as of October 31, 2022
Offsetting of financial instrument/transaction assets and liabilities:
| | | | | | | | | | | | |
| Description | | Gross Market Value of Recognized Assets/(Liabilities) | | | | Collateral
Pledged/(Received)(2) | | Net
Amount |
Securities on Loan | | $23,516,253 | | | | | | | | $(23,516,253) | | $— |
Offsetting of OTC derivative assets and liabilities:
| | | | | | | | | | | | | | | | | | | | | | | | | | | | | | | | | | | | | | | | |
| Counterparty | | Gross Amounts of
Recognized
Assets(1) | | | Gross Amounts of Recognized Liabilities(1) | | Net Amounts of
Recognized
Assets/(Liabilities) | | Collateral Pledged/(Received)(2) | | Net Amount | |
BARC | | | | | | | $ 7,670,443 | | | | | | | | | | $ (1,938,906 | ) | | | | | | | $ 5,731,537 | | | | | | | | $(5,605,473 | ) | | | | | $126,064 | |
BNP | | | | | | | 44,221 | | | | | | | | | | (891,681 | ) | | | | | | | (847,460 | ) | | | | | | | 847,460 | | | | | | — | |
BOA | | | | | | | 6,962,268 | | | | | | | | | | (7,970,668 | ) | | | | | | | (1,008,400 | ) | | | | | | | 1,008,400 | | | | | | — | |
CIGM | | | | | | | 458,245 | | | | | | | | | | — | | | | | | | | 458,245 | | | | | | | | (272,375 | ) | | | | | 185,870 | |
CITI | | | | | | | 1,957,696 | | | | | | | | | | (369,671 | ) | | | | | | | 1,588,025 | | | | | | | | (1,440,000 | ) | | | | | 148,025 | |
CSI | | | | | | | 8,870 | | | | | | | | | | — | | | | | | | | 8,870 | | | | | | | | (8,870 | ) | | | | | — | |
DB | | | | | | | 1,224,615 | | | | | | | | | | (1,743,113 | ) | | | | | | | (518,498 | ) | | | | | | | 417,477 | | | | | | (101,021 | ) |
GSI | | | | | | | 3,979,222 | | | | | | | | | | (3,937,633 | ) | | | | | | | 41,589 | | | | | | | | — | | | | | | 41,589 | |
HSBC | | | | | | | 308,950 | | | | | | | | | | (877,308 | ) | | | | | | | (568,358 | ) | | | | | | | 464,266 | | | | | | (104,092 | ) |
JPM | | | | | | | 11,266,407 | | | | | | | | | | (9,448,229 | ) | | | | | | | 1,818,178 | | | | | | | | (1,775,946 | ) | | | | | 42,232 | |
MSI | | | | | | | 8,014,398 | | | | | | | | | | (10,130,068 | ) | | | | | | | (2,115,670 | ) | | | | | | | 1,898,789 | | | | | | (216,881 | ) |
SCB | | | | | | | 149,633 | | | | | | | | | | (909,519 | ) | | | | | | | (759,886 | ) | | | | | | | 396,484 | | | | | | (363,402 | ) |
TD | | | | | | | 68,666 | | | | | | | | | | (1,072,035 | ) | | | | | | | (1,003,369 | ) | | | | | | | 1,003,369 | | | | | | — | |
UAG | | | | | | | 117,758 | | | | | | | | | | (119,025 | ) | | | | | | | (1,267 | ) | | | | | | | — | | | | | | (1,267 | ) |
| | | | | | | | | | | | | | | | | | | | | | | | | | | | | | | | | | | | | | | | |
| | | | | | | $42,231,392 | | | | | | | | | | $(39,407,856 | ) | | | | | | | $ 2,823,536 | | | | | | | | $(3,066,419 | ) | | | | | $(242,883 | ) |
| | | | | | | | | | | | | | | | | | | | | | | | | | | | | | | | | | | | | | | | |
| (1) | Includes unrealized appreciation/(depreciation) on swaps and forwards, premiums paid/(received) on swap agreements and market value of purchased and written options, as represented on the Statement of Assets and Liabilities. |
| (2) | Collateral amount disclosed by the Fund is limited to the market value of financial instruments/transactions and the Fund’s OTC derivative exposure by counterparty. |
See Notes to Financial Statements.
68
Statement of Assets and Liabilities
as of October 31, 2022
| | | | |
| |
Assets | | | | |
Investments at value, including securities on loan of $23,516,253: | | | | |
Unaffiliated investments (cost $1,399,950,308) | | $ | 1,265,424,551 | |
Affiliated investments (cost $133,996,372) | | | 133,907,415 | |
Cash | | | 14,452 | |
Foreign currency, at value (cost $2,943,963) | | | 2,809,650 | |
Unrealized appreciation on OTC forward foreign currency exchange contracts | | | 18,397,052 | |
Receivable for investments sold | | | 17,575,862 | |
Unrealized appreciation on OTC swap agreements | | | 13,308,807 | |
Dividends and interest receivable | | | 10,233,351 | |
Receivable for Fund shares sold | | | 4,551,427 | |
Due from broker—variation margin futures | | | 2,645,922 | |
Premiums paid for OTC swap agreements | | | 2,015,083 | |
Unrealized appreciation on OTC cross currency exchange contracts | | | 1,125,092 | |
Deposit with broker for centrally cleared/exchange-traded derivatives | | | 1,050,000 | |
Due from broker—variation margin swaps and swaptions | | | 736,191 | |
Prepaid expenses | | | 8,162 | |
| | | | |
Total Assets | | | 1,473,803,017 | |
| | | | |
| |
Liabilities | | | | |
Payable for investments purchased | | | 106,720,185 | |
Payable to broker for collateral for securities on loan | | | 24,264,779 | |
Unrealized depreciation on OTC forward foreign currency exchange contracts | | | 16,901,714 | |
Unrealized depreciation on OTC swap agreements | | | 13,225,003 | |
Options written outstanding, at value (premiums received $1,861,279) | | | 7,272,841 | |
Payable for Fund shares purchased | | | 4,625,809 | |
Unrealized depreciation on OTC cross currency exchange contracts | | | 1,536,325 | |
Management fee payable | | | 662,956 | |
Accrued expenses and other liabilities | | | 598,635 | |
Dividends payable | | | 483,027 | |
Premiums received for OTC swap agreements | | | 471,973 | |
Distribution fee payable | | | 47,391 | |
Affiliated transfer agent fee payable | | | 3,949 | |
Trustees’ fees payable | | | 2,320 | |
| | | | |
Total Liabilities | | | 176,816,907 | |
| | | | |
| |
Net Assets | | $ | 1,296,986,110 | |
| | | | |
| |
| | | | | |
Net assets were comprised of: | | | | |
Shares of beneficial interest, at par | | $ | 146,954 | |
Paid-in capital in excess of par | | | 1,595,214,703 | |
Total distributable earnings (loss) | | | (298,375,547 | ) |
| | | | |
Net assets, October 31, 2022 | | $ | 1,296,986,110 | |
| | | | |
See Notes to Financial Statements.
PGIM Absolute Return Bond Fund 69
Statement of Assets and Liabilities
as of October 31, 2022
| | | | |
Class A | | | | |
Net asset value and redemption price per share,
($ 94,350,901 ÷ 10,731,886 shares of beneficial interest issued and outstanding) | | $ | 8.79 | |
Maximum sales charge (3.25% of offering price) | | | 0.30 | |
| | | | |
Maximum offering price to public | | $ | 9.09 | |
| | | | |
Class C | | | | |
Net asset value, offering price and redemption price per share,
($ 31,870,509 ÷ 3,613,940 shares of beneficial interest issued and outstanding) | | $ | 8.82 | |
| | | | |
Class Z | | | | |
Net asset value, offering price and redemption price per share,
($ 1,108,185,636 ÷ 125,486,392 shares of beneficial interest issued and outstanding) | | $ | 8.83 | |
| | | | |
Class R6 | | | | |
Net asset value, offering price and redemption price per share,
($ 62,579,064 ÷ 7,121,726 shares of beneficial interest issued and outstanding) | | $ | 8.79 | |
| | | | |
See Notes to Financial Statements.
70
Statement of Operations
Year Ended October 31, 2022
| | | | |
| Net Investment Income (Loss) | | | | |
| |
| Income | | | | |
Interest income | | $ | 36,564,133 | |
Unaffiliated dividend income | | | 1,517,791 | |
Affiliated dividend income | | | 787,641 | |
Income from securities lending, net (including affiliated income of $61,624) | | | 75,395 | |
| | | | |
| |
Total income | | | 38,944,960 | |
| | | | |
Expenses | | | | |
Management fee | | | 6,539,761 | |
Distribution fee(a) | | | 605,508 | |
Transfer agent’s fees and expenses (including affiliated expense of $20,431)(a) | | | 976,555 | |
Custodian and accounting fees | | | 128,624 | |
Registration fees(a) | | | 108,835 | |
Audit fee | | | 68,000 | |
Shareholders’ reports | | | 47,313 | |
Legal fees and expenses | | | 26,421 | |
Trustees’ fees | | | 23,380 | |
Miscellaneous | | | 30,455 | |
| | | | |
Total expenses | | | 8,554,852 | |
| | | | |
Net investment income (loss) | | | 30,390,108 | |
| | | | |
| |
| Realized And Unrealized Gain (Loss) On Investment And Foreign Currency Transactions | | | | |
Net realized gain (loss) on: | | | | |
Investment transactions (including affiliated of $(6,737)) | | | (14,424,012 | ) |
Futures transactions | | | 62,769,587 | |
Forward and cross currency contract transactions | | | 25,932,198 | |
Options written transactions | | | 15,697,245 | |
Swap agreement transactions | | | (14,663,716 | ) |
Foreign currency transactions | | | (1,216,719 | ) |
| | | | |
| | | 74,094,583 | |
| | | | |
Net change in unrealized appreciation (depreciation) on: | | | | |
Investments (including affiliated of $(99,251)) | | | (161,401,419 | ) |
Futures | | | 29,390,988 | |
Forward and cross currency contracts | | | (747,665 | ) |
Options written | | | (13,509,996 | ) |
Swap agreements | | | 18,045,160 | |
Foreign currencies | | | 1,688,249 | |
Unfunded loan commitment | | | (3,262 | ) |
| | | | |
| | | (126,537,945 | ) |
| | | | |
Net gain (loss) on investment and foreign currency transactions | | | (52,443,362 | ) |
| | | | |
Net Increase (Decrease) In Net Assets Resulting From Operations | | $ | (22,053,254 | ) |
| | | | |
See Notes to Financial Statements.
PGIM Absolute Return Bond Fund 71
Statement of Operations
Year Ended October 31, 2022
(a) Class specific expenses and waivers were as follows:
| | | | | | | | | | | | | | | | |
| | | Class A | | | Class C | | | Class Z | | | Class R6 | |
Distribution fee | | | 242,511 | | | | 362,997 | | | | — | | | | — | |
Transfer agent’s fees and expenses | | | 80,771 | | | | 33,032 | | | | 859,988 | | | | 2,764 | |
Registration fees | | | 22,829 | | | | 15,349 | | | | 55,001 | | | | 15,656 | |
See Notes to Financial Statements.
72
Statements of Changes in Net Assets
| | | | | | | | |
| |
| | | Year Ended October 31, | |
| | |
| | | 2022 | | | 2021 | |
| | |
Increase (Decrease) in Net Assets | | | | | | | | |
Operations | | | | | | | | |
Net investment income (loss) | | $ | 30,390,108 | | | $ | 27,877,591 | |
Net realized gain (loss) on investment and foreign currency transactions | | | 74,094,583 | | | | 33,546,778 | |
Net change in unrealized appreciation (depreciation) on investments and foreign currencies | | | (126,537,945 | ) | | | 12,215,766 | |
| | | | | | | | |
Net increase (decrease) in net assets resulting from operations | | | (22,053,254 | ) | | | 73,640,135 | |
| | | | | | | | |
Dividends and Distributions | | | | | | | | |
Distributions from distributable earnings | | | | | | | | |
Class A | | | (2,370,039 | ) | | | (2,322,399 | ) |
Class C | | | (598,981 | ) | | | (886,038 | ) |
Class Z | | | (25,120,070 | ) | | | (21,959,534 | ) |
Class R6 | | | (1,673,096 | ) | | | (2,674,791 | ) |
| | | | | | | | |
| | | (29,762,186 | ) | | | (27,842,762 | ) |
| | | | | | | | |
Tax return of capital distributions | | | | | | | | |
Class A | | | — | | | | (104,437 | ) |
Class C | | | — | | | | (39,845 | ) |
Class Z | | | — | | | | (987,511 | ) |
Class R6 | | | — | | | | (120,284 | ) |
| | | | | | | | |
| | | — | | | | (1,252,077 | ) |
| | | | | | | | |
Fund share transactions (Net of share conversions) | | | | | | | | |
Net proceeds from shares sold | | | 966,077,747 | | | | 358,440,154 | |
Net asset value of shares issued in reinvestment of dividends and distributions | | | 26,305,286 | | | | 25,054,049 | |
Cost of shares purchased | | | (623,037,493 | ) | | | (807,564,899 | ) |
| | | | | | | | |
Net increase (decrease) in net assets from Fund share transactions | | | 369,345,540 | | | | (424,070,696 | ) |
| | | | | | | | |
Total increase (decrease) | | | 317,530,100 | | | | (379,525,400 | ) |
| | |
Net Assets: | | | | | | | | |
Beginning of year | | | 979,456,010 | | | | 1,358,981,410 | |
| | | | | | | | |
End of year | | $ | 1,296,986,110 | | | $ | 979,456,010 | |
| | | | | | | | |
See Notes to Financial Statements.
PGIM Absolute Return Bond Fund 73
Financial Highlights
| | | | | | | | | | | | | | | | | | | | |
Class A Shares | | | | | | | | | | | | | | | | | | | | |
| | | Year Ended October 31, | |
| | | 2022 | | | 2021 | | | 2020 | | | 2019 | | | 2018 | |
Per Share Operating Performance(a): | | | | | | | | | | | | | | | | | | | | |
Net Asset Value, Beginning of Year | | $ | 9.22 | | | $ | 8.94 | | | $ | 9.73 | | | $ | 9.82 | | | $ | 9.93 | |
Income (loss) from investment operations: | | | | | | | | | | | | | | | | | | | | |
Net investment income (loss) | | | 0.22 | | | | 0.21 | | | | 0.30 | | | | 0.31 | | | | 0.27 | |
Net realized and unrealized gain (loss) on investment and foreign currency transactions | | | (0.43 | ) | | | 0.30 | | | | (0.49 | ) | | | 0.13 | | | | (0.05 | ) |
Total from investment operations | | | (0.21 | ) | | | 0.51 | | | | (0.19 | ) | | | 0.44 | | | | 0.22 | |
Less Dividends and Distributions: | | | | | | | | | | | | | | | | | | | | |
Dividends from net investment income | | | (0.22 | ) | | | (0.22 | ) | | | (0.26 | ) | | | (0.53 | ) | | | (0.33 | ) |
Tax return of capital distributions | | | - | | | | (0.01 | ) | | | (0.04 | ) | | | - | | | | - | |
Distributions from net realized gains | | | - | | | | - | | | | (0.30 | ) | | | - | | | | - | |
Total dividends and distributions | | | (0.22 | ) | | | (0.23 | ) | | | (0.60 | ) | | | (0.53 | ) | | | (0.33 | ) |
Net asset value, end of year | | $ | 8.79 | | | $ | 9.22 | | | $ | 8.94 | | | $ | 9.73 | | | $ | 9.82 | |
Total Return(b): | | | (2.30 | )% | | | 5.71 | % | | | (1.96 | )% | | | 4.71 | % | | | 2.21 | % |
| | | | | | | | | | | | | | | | | | | | | |
Ratios/Supplemental Data: | | | | | | | | | | | | | | | | | | | | |
Net assets, end of year (000) | | $ | 94,351 | | | $ | 109,630 | | | $ | 93,597 | | | $ | 142,879 | | | $ | 148,609 | |
Average net assets (000) | | $ | 97,005 | | | $ | 98,531 | | | $ | 114,656 | | | $ | 147,612 | | | $ | 142,613 | |
Ratios to average net assets(c): | | | | | | | | | | | | | | | | | | | | |
Expenses after waivers and/or expense reimbursement | | | 0.98 | % | | | 0.97 | % | | | 0.97 | % | | | 1.02 | % | | | 1.03 | % |
Expenses before waivers and/or expense reimbursement | | | 0.98 | % | | | 0.97 | % | | | 0.97 | % | | | 1.02 | % | | | 1.04 | % |
Net investment income (loss) | | | 2.46 | % | | | 2.32 | % | | | 3.27 | % | | | 3.24 | % | | | 2.72 | % |
Portfolio turnover rate(d) | | | 30 | % | | | 48 | % | | | 20 | % | | | 50 | % | | | 52 | % |
| (a) | Calculated based on average shares outstanding during the year. |
| (b) | Total return does not consider the effects of sales loads. Total return is calculated assuming a purchase of a share on the first day and a sale on the last day of each year reported and includes reinvestment of dividends and distributions, if any. Total returns may reflect adjustments to conform to GAAP. |
| (c) | Does not include expenses of the underlying funds in which the Fund invests. |
| (d) | The Fund’s portfolio turnover rate is calculated in accordance with regulatory requirements, without regard to transactions involving short-term investments, certain derivatives and in-kind transactions (if any). If such transactions were included, the Fund’s portfolio turnover rate may be higher. |
See Notes to Financial Statements.
74
| | | | | | | | | | | | | | | | | | | | |
Class C Shares | | | | | | | | | | | | | | | | | | | | |
| | | Year Ended October 31, | |
| | | 2022 | | | 2021 | | | 2020 | | | 2019 | | | 2018 | |
Per Share Operating Performance(a): | | | | | | | | | | | | | | | | | | | | |
Net Asset Value, Beginning of Year | | | $9.25 | | | | $8.97 | | | | $9.76 | | | | $9.85 | | | | $9.96 | |
Income (loss) from investment operations: | | | | | | | | | | | | | | | | | | | | |
Net investment income (loss) | | | 0.15 | | | | 0.15 | | | | 0.23 | | | | 0.24 | | | | 0.19 | |
Net realized and unrealized gain (loss) on investment and foreign currency transactions | | | (0.43 | ) | | | 0.29 | | | | (0.48 | ) | | | 0.13 | | | | (0.05 | ) |
Total from investment operations | | | (0.28 | ) | | | 0.44 | | | | (0.25 | ) | | | 0.37 | | | | 0.14 | |
Less Dividends and Distributions: | | | | | | | | | | | | | | | | | | | | |
Dividends from net investment income | | | (0.15 | ) | | | (0.15 | ) | | | (0.20 | ) | | | (0.46 | ) | | | (0.25 | ) |
Tax return of capital distributions | | | - | | | | (0.01 | ) | | | (0.04 | ) | | | - | | | | - | |
Distributions from net realized gains | | | - | | | | - | | | | (0.30 | ) | | | - | | | | - | |
Total dividends and distributions | | | (0.15 | ) | | | (0.16 | ) | | | (0.54 | ) | | | (0.46 | ) | | | (0.25 | ) |
Net asset value, end of year | | | $8.82 | | | | $9.25 | | | | $8.97 | | | | $9.76 | | | | $9.85 | |
Total Return(b): | | | (3.04 | )% | | | 5.03 | % | | | (2.70 | )% | | | 3.80 | % | | | 1.43 | % |
| | | | | | | | | | | | | | | | | | | | | |
Ratios/Supplemental Data: | | | | | | | | | | | | | | | | | | | | |
Net assets, end of year (000) | | | $31,871 | | | | $42,635 | | | | $66,396 | | | | $103,133 | | | | $106,734 | |
Average net assets (000) | | | $36,300 | | | | $52,974 | | | | $86,229 | | | | $107,605 | | | | $102,866 | |
Ratios to average net assets(c): | | | | | | | | | | | | | | | | | | | | |
Expenses after waivers and/or expense reimbursement | | | 1.75 | % | | | 1.73 | % | | | 1.73 | % | | | 1.78 | % | | | 1.79 | % |
Expenses before waivers and/or expense reimbursement | | | 1.75 | % | | | 1.73 | % | | | 1.73 | % | | | 1.78 | % | | | 1.80 | % |
Net investment income (loss) | | | 1.67 | % | | | 1.64 | % | | | 2.51 | % | | | 2.46 | % | | | 1.93 | % |
Portfolio turnover rate(d) | | | 30 | % | | | 48 | % | | | 20 | % | | | 50 | % | | | 52 | % |
| (a) | Calculated based on average shares outstanding during the year. |
| (b) | Total return does not consider the effects of sales loads. Total return is calculated assuming a purchase of a share on the first day and a sale on the last day of each year reported and includes reinvestment of dividends and distributions, if any. Total returns may reflect adjustments to conform to GAAP. |
| (c) | Does not include expenses of the underlying funds in which the Fund invests. |
| (d) | The Fund’s portfolio turnover rate is calculated in accordance with regulatory requirements, without regard to transactions involving short-term investments, certain derivatives and in-kind transactions (if any). If such transactions were included, the Fund’s portfolio turnover rate may be higher. |
See Notes to Financial Statements.
PGIM Absolute Return Bond Fund 75
Financial Highlights (continued)
| | | | | | | | | | | | | | | | | | | | |
Class Z Shares | | | | | | | | | | | | | | | | | | | | |
| | | Year Ended October 31, | |
| | | 2022 | | | 2021 | | | 2020 | | | 2019 | | | 2018 | |
Per Share Operating Performance(a): | | | | | | | | | | | | | | | | | | | | |
Net Asset Value, Beginning of Year | | $ | 9.26 | | | $ | 8.98 | | | $ | 9.77 | | | $ | 9.86 | | | $ | 9.97 | |
Income (loss) from investment operations: | | | | | | | | | | | | | | | | | | | | |
Net investment income (loss) | | | 0.25 | | | | 0.24 | | | | 0.32 | | | | 0.34 | | | | 0.30 | |
Net realized and unrealized gain (loss) on investment and foreign currency transactions | | | (0.44 | ) | | | 0.29 | | | | (0.48 | ) | | | 0.13 | | | | (0.06 | ) |
Total from investment operations | | | (0.19 | ) | | | 0.53 | | | | (0.16 | ) | | | 0.47 | | | | 0.24 | |
Less Dividends and Distributions: | | | | | | | | | | | | | | | | | | | | |
Dividends from net investment income | | | (0.24 | ) | | | (0.24 | ) | | | (0.29 | ) | | | (0.56 | ) | | | (0.35 | ) |
Tax return of capital distributions | | | - | | | | (0.01 | ) | | | (0.04 | ) | | | - | | | | - | |
Distributions from net realized gains | | | - | | | | - | | | | (0.30 | ) | | | - | | | | - | |
Total dividends and distributions | | | (0.24 | ) | | | (0.25 | ) | | | (0.63 | ) | | | (0.56 | ) | | | (0.35 | ) |
Net asset value, end of year | | $ | 8.83 | | | $ | 9.26 | | | $ | 8.98 | | | $ | 9.77 | | | $ | 9.86 | |
Total Return(b): | | | (2.03 | )% | | | 5.96 | % | | | (1.70 | )% | | | 5.00 | % | | | 2.48 | % |
| | | | | | | | | | | | | | | | | | | | |
Ratios/Supplemental Data: | | | | | | | | | | | | | | | | | | | | |
Net assets, end of year (000) | | $ | 1,108,186 | | | $ | 767,056 | | | $ | 1,071,124 | | | $ | 2,040,949 | | | $ | 2,159,518 | |
Average net assets (000) | | $ | 914,879 | | | $ | 833,908 | | | $ | 1,499,872 | | | $ | 2,155,699 | | | $ | 1,679,461 | |
Ratios to average net assets(c): | | | | | | | | | | | | | | | | | | | | |
Expenses after waivers and/or expense reimbursement | | | 0.72 | % | | | 0.73 | % | | | 0.73 | % | | | 0.73 | % | | | 0.75 | % |
Expenses before waivers and/or expense reimbursement | | | 0.72 | % | | | 0.73 | % | | | 0.74 | % | | | 0.79 | % | | | 0.81 | % |
Net investment income (loss) | | | 2.81 | % | | | 2.64 | % | | | 3.53 | % | | | 3.51 | % | | | 3.01 | % |
Portfolio turnover rate(d) | | | 30 | % | | | 48 | % | | | 20 | % | | | 50 | % | | | 52 | % |
| (a) | Calculated based on average shares outstanding during the year. |
| (b) | Total return is calculated assuming a purchase of a share on the first day and a sale on the last day of each year reported and includes reinvestment of dividends and distributions, if any. Total returns may reflect adjustments to conform to GAAP. |
| (c) | Does not include expenses of the underlying funds in which the Fund invests. |
| (d) | The Fund’s portfolio turnover rate is calculated in accordance with regulatory requirements, without regard to transactions involving short-term investments, certain derivatives and in-kind transactions (if any). If such transactions were included, the Fund’s portfolio turnover rate may be higher. |
See Notes to Financial Statements.
76
| | | | | | | | | | | | | | | | | | | | |
Class R6 Shares | | | | | | | | | | | | | | | | | | | | |
| | | Year Ended October 31, | |
| | | 2022 | | | 2021 | | | 2020 | | | 2019 | | | 2018 | |
Per Share Operating Performance(a): | | | | | | | | | | | | | | | | | | | | |
Net Asset Value, Beginning of Year | | $ | 9.21 | | | $ | 8.93 | | | $ | 9.72 | | | $ | 9.82 | | | $ | 9.94 | |
Income (loss) from investment operations: | | | | | | | | | | | | | | | | | | | | |
Net investment income (loss) | | | 0.25 | | | | 0.26 | | | | 0.32 | | | | 0.35 | | | | 0.29 | |
Net realized and unrealized gain (loss) on investment and foreign currency transactions | | | (0.42 | ) | | | 0.28 | | | | (0.48 | ) | | | 0.12 | | | | (0.05 | ) |
Total from investment operations | | | (0.17 | ) | | | 0.54 | | | | (0.16 | ) | | | 0.47 | | | | 0.24 | |
Less Dividends and Distributions: | | | | | | | | | | | | | | | | | | | | |
Dividends from net investment income | | | (0.25 | ) | | | (0.25 | ) | | | (0.29 | ) | | | (0.57 | ) | | | (0.36 | ) |
Tax return of capital distributions | | | - | | | | (0.01 | ) | | | (0.04 | ) | | | - | | | | - | |
Distributions from net realized gains | | | - | | | | - | | | | (0.30 | ) | | | - | | | | - | |
Total dividends and distributions | | | (0.25 | ) | | | (0.26 | ) | | | (0.63 | ) | | | (0.57 | ) | | | (0.36 | ) |
Net asset value, end of year | | $ | 8.79 | | | $ | 9.21 | | | $ | 8.93 | | | $ | 9.72 | | | $ | 9.82 | |
Total Return(b): | | | (1.87 | )% | | | 6.07 | % | | | (1.66 | )% | | | 4.94 | % | | | 2.42 | % |
| | | | | | | | | | | | | | | | | | | | |
Ratios/Supplemental Data: | | | | | | | | | | | | | | | | | | | | |
Net assets, end of year (000) | | $ | 62,579 | | | $ | 60,135 | | | $ | 127,864 | | | $ | 82,538 | | | $ | 203,372 | |
Average net assets (000) | | $ | 60,251 | | | $ | 97,518 | | | $ | 109,540 | | | $ | 88,570 | | | $ | 329,668 | |
Ratios to average net assets(c): | | | | | | | | | | | | | | | | | | | | |
Expenses after waivers and/or expense reimbursement | | | 0.65 | % | | | 0.64 | % | | | 0.65 | % | | | 0.70 | % | | | 0.74 | % |
Expenses before waivers and/or expense reimbursement | | | 0.65 | % | | | 0.64 | % | | | 0.65 | % | | | 0.71 | % | | | 0.75 | % |
Net investment income (loss) | | | 2.82 | % | | | 2.79 | % | | | 3.54 | % | | | 3.59 | % | | | 2.95 | % |
Portfolio turnover rate(d) | | | 30 | % | | | 48 | % | | | 20 | % | | | 50 | % | | | 52 | % |
| (a) | Calculated based on average shares outstanding during the year. |
| (b) | Total return is calculated assuming a purchase of a share on the first day and a sale on the last day of each year reported and includes reinvestment of dividends and distributions, if any. Total returns may reflect adjustments to conform to GAAP. |
| (c) | Does not include expenses of the underlying funds in which the Fund invests. |
| (d) | The Fund’s portfolio turnover rate is calculated in accordance with regulatory requirements, without regard to transactions involving short-term investments, certain derivatives and in-kind transactions (if any). If such transactions were included, the Fund’s portfolio turnover rate may be higher. |
See Notes to Financial Statements.
PGIM Absolute Return Bond Fund 77
Notes to Financial Statements
Prudential Investment Portfolios 9 (the “Registered Investment Company” or “RIC”) is registered under the Investment Company Act of 1940, as amended (“1940 Act”), as an open-end management investment company. The RIC is organized as a Delaware Statutory Trust. These financial statements relate only to the PGIM Absolute Return Bond Fund (the “Fund”), a series of the RIC. The Fund is classified as a diversified fund for purposes of the 1940 Act.
The investment objective of the Fund is to seek positive returns over the long term, regardless of market conditions.
The Fund follows the investment company accounting and reporting guidance of the Financial Accounting Standards Board (“FASB”) Accounting Standard Codification (“ASC”) Topic 946 Financial Services — Investment Companies. The following is a summary of significant accounting policies followed by the Fund in the preparation of its financial statements. The policies conform to U.S. generally accepted accounting principles (“GAAP”). The Fund consistently follows such policies in the preparation of its financial statements.
Securities Valuation: The Fund holds securities and other assets and liabilities that are fair valued as of the close of each day (generally, 4:00 PM Eastern time) the New York Stock Exchange (“NYSE”) is open for trading. As described in further detail below, the Fund’s investments are valued daily based on a number of factors, including the type of investment and whether market quotations are readily available. The RIC’s Board of Trustees (the “Board”) has approved the Fund’s valuation policies and procedures for security valuation and designated to PGIM Investments LLC (“PGIM Investments” or the “Manager”) as the Valuation Designee pursuant to SEC Rule 2a-5(b) to perform the fair value determination relating to all Fund investments. Pursuant to the Board’s oversight, the Valuation Designee has established a Valuation Committee to perform the duties and responsibilities as valuation designee under SEC Rule 2a-5. The valuation procedures permit the Fund to utilize independent pricing vendor services, quotations from market makers, and alternative valuation methods when market quotations are either not readily available or not deemed representative of fair value. Fair value is the price that would be received to sell an asset or paid to transfer a liability in an orderly transaction between market participants on the measurement date. A record of the Valuation Committee’s actions is provided to the Board at the first quarterly meeting following the quarter in which such actions take place.
For the fiscal reporting year-end, securities and other assets and liabilities were fair valued at the close of the last U.S. business day. Trading in certain foreign securities may occur when
78
the NYSE is closed (including weekends and holidays). Because such foreign securities trade in markets that are open on weekends and U.S. holidays, the values of some of the Fund’s foreign investments may change on days when investors cannot purchase or redeem Fund shares.
Various inputs determine how the Fund’s investments are valued, all of which are categorized according to the three broad levels (Level 1, 2, or 3) detailed in the Schedule of Investments and referred to herein as the “fair value hierarchy” in accordance with FASB ASC Topic 820 - Fair Value Measurement.
Common or preferred stocks, exchange-traded funds and derivative instruments, if applicable, that are traded on a national securities exchange are valued at the last sale price as of the close of trading on the applicable exchange where the security principally trades. Securities traded via NASDAQ are valued at the NASDAQ official closing price. To the extent these securities are valued at the last sale price or NASDAQ official closing price, they are classified as Level 1 in the fair value hierarchy. In the event that no sale or official closing price on valuation date exists, these securities are generally valued at the mean between the last reported bid and ask prices, or at the last bid price in the absence of an ask price. These securities are classified as Level 2 in the fair value hierarchy.
Investments in open-end funds (other than exchange-traded funds) are valued at their net asset values as of the close of the NYSE on the date of valuation. These securities are classified as Level 1 in the fair value hierarchy since they may be purchased or sold at their net asset values on the date of valuation.
Fixed income securities traded in the OTC market are generally classified as Level 2 in the fair value hierarchy. Such fixed income securities are typically valued using the market approach which generally involves obtaining data from an approved independent third-party vendor source. The Fund utilizes the market approach as the primary method to value securities when market prices of identical or comparable instruments are available. The third-party vendors’ valuation techniques used to derive the evaluated bid price are based on evaluating observable inputs, including but not limited to, yield curves, yield spreads, credit ratings, deal terms, tranche level attributes, default rates, cash flows, prepayment speeds, broker/dealer quotations and reported trades. Certain Level 3 securities are also valued using the market approach when obtaining a single broker quote or when utilizing transaction prices for identical securities that have been used in excess of five business days. During the reporting period, there were no changes to report with respect to the valuation approach and/or valuation techniques discussed above.
Floating rate and other loans are generally valued at prices provided by approved independent pricing vendors. The pricing vendors utilize broker/dealer quotations and provide prices based on the average of such quotations. Floating rate and other loans valued using such vendor prices are generally classified as Level 2 in the fair value hierarchy.
PGIM Absolute Return Bond Fund 79
Notes to Financial Statements (continued)
Floating rate and other loans valued based on a single broker quote or at the original transaction price in excess of five business days are classified as Level 3 in the fair value hierarchy.
OTC and centrally cleared derivative instruments are generally classified as Level 2 in the fair value hierarchy. Such derivative instruments are typically valued using the market approach and/or income approach which generally involves obtaining data from an approved independent third-party vendor source. The Fund utilizes the market approach when quoted prices in broker-dealer markets are available but also includes consideration of alternative valuation approaches, including the income approach. In the absence of reliable market quotations, the income approach is typically utilized for purposes of valuing derivatives such as interest rate swaps based on a discounted cash flow analysis whereby the value of the instrument is equal to the present value of its future cash inflows or outflows. Such analysis includes projecting future cash flows and determining the discount rate (including the present value factors that affect the discount rate) used to discount the future cash flows. In addition, the third-party vendors’ valuation techniques used to derive the evaluated derivative price is based on evaluating observable inputs, including but not limited to, underlying asset prices, indices, spreads, interest rates and exchange rates. Certain derivatives may be classified as Level 3 when valued using the market approach by obtaining a single broker quote or when utilizing unobservable inputs in the income approach. During the reporting period, there were no changes to report with respect to the valuation approach and/or valuation techniques discussed above.
Securities and other assets that cannot be priced according to the methods described above are valued based on policies and procedures approved by the Board. In the event that unobservable inputs are used when determining such valuations, the securities will be classified as Level 3 in the fair value hierarchy. Altering one or more unobservable inputs may result in a significant change to a Level 3 security’s fair value measurement.
When determining the fair value of securities, some of the factors influencing the valuation include: the nature of any restrictions on disposition of the securities; assessment of the general liquidity of the securities; the issuer’s financial condition and the markets in which it does business; the cost of the investment; the size of the holding and the capitalization of the issuer; the prices of any recent transactions or bids/offers for such securities or any comparable securities; any available analyst media or other reports or information deemed reliable by the Valuation Designee regarding the issuer or the markets or industry in which it operates. Using fair value to price securities may result in a value that is different from a security’s most recent closing price and from the price used by other unaffiliated mutual funds to calculate their net asset values.
80
Foreign Currency Translation: The books and records of the Fund are maintained in U.S. dollars. Foreign currency amounts are translated into U.S. dollars on the following basis:
(i) market value of investment securities, other assets and liabilities — at the exchange rate as of the valuation date;
(ii) purchases and sales of investment securities, income and expenses — at the rates of exchange prevailing on the respective dates of such transactions.
Although the net assets of the Fund are presented at the foreign exchange rates and market values at the close of the period, the Fund does not generally isolate that portion of the results of operations arising as a result of changes in the foreign exchange rates from the fluctuations arising from changes in the market prices of long-term portfolio securities held at the end of the period. Similarly, the Fund does not isolate the effect of changes in foreign exchange rates from the fluctuations arising from changes in the market prices of long-term portfolio securities sold during the period. Accordingly, holding period unrealized and realized foreign currency gains (losses) are included in the reported net change in unrealized appreciation (depreciation) on investments and net realized gains (losses) on investment transactions on the Statements of Operations. Notwithstanding the above, the Fund does isolate the effect of fluctuations in foreign currency exchange rates when determining the gain (loss) upon the sale or maturity of foreign currency denominated debt obligations; such amounts are included in net realized gains (losses) on foreign currency transactions.
Additionally, net realized gains (losses) on foreign currency transactions represent net foreign exchange gains (losses) from the disposition of holdings of foreign currencies, currency gains (losses) realized between the trade and settlement dates on investment transactions, and the difference between the amounts of interest, dividends and foreign withholding taxes recorded on the Fund’s books and the U.S. dollar equivalent amounts actually received or paid. Net unrealized currency gains (losses) arise from valuing foreign currency denominated assets and liabilities (other than investments) at period end exchange rates.
Forward and Cross Currency Contracts: A forward currency contract is a commitment to purchase or sell a foreign currency at a future date at a negotiated forward rate. The Fund enters into forward currency contracts, as defined in the prospectus, in order to hedge its exposure to changes in foreign currency exchange rates on its foreign portfolio holdings or on specific receivables and payables denominated in a foreign currency and to gain exposure to certain currencies. The contracts are valued daily at current forward exchange rates and any unrealized gain (loss) is included in net unrealized appreciation or depreciation on forward and cross currency contracts. Gain (loss) is realized on the settlement date of the contract equal to the difference between the settlement value of the original and negotiated forward contracts. This gain (loss), if any, is included in net realized gain (loss) on forward and cross currency contract transactions. Risks may arise upon entering into these contracts from the potential inability of the counterparties to meet the
PGIM Absolute Return Bond Fund 81
Notes to Financial Statements (continued)
terms of their contracts. Forward currency contracts involve risks from currency exchange rate and credit risk in excess of the amounts reflected on the Statement of Assets and Liabilities. The Fund’s maximum risk of loss from counterparty credit risk is the net value of the cash flows to be received from the counterparty at the end of the contract’s life. A cross currency contract is a forward contract where a specified amount of one foreign currency will be exchanged for a specified amount of another foreign currency.
Options: The Fund purchased and/or wrote options in order to hedge against adverse market movements or fluctuations in value caused by changes in prevailing interest rates, value of equities or foreign currency exchange rates with respect to securities or financial instruments which the Fund currently owns or intends to purchase. The Fund may also use options to gain additional market exposure. The Fund’s principal reason for writing options is to realize, through receipt of premiums, a greater current return than would be realized on the underlying security alone. When the Fund purchases an option, it pays a premium and an amount equal to that premium is recorded as an asset. When the Fund writes an option, it receives a premium and an amount equal to that premium is recorded as a liability. The asset or liability is adjusted daily to reflect the current market value of the option. If an option expires unexercised, the Fund realizes a gain (loss) to the extent of the premium received or paid. If an option is exercised, the premium received or paid is recorded as an adjustment to the proceeds from the sale or the cost of the purchase in determining whether the Fund has realized a gain (loss). The difference between the premium and the amount received or paid at the closing of a purchase or sale transaction is also treated as a realized gain (loss). Gain (loss) on purchased options is included in net realized gain (loss) on investment transactions. Gain (loss) on written options is presented separately as net realized gain (loss) on options written transactions.
The Fund, as writer of an option, may have no control over whether the underlying securities or financial instruments may be sold (called) or purchased (put). As a result, the Fund bears the market risk of an unfavorable change in the price of the security or financial instrument underlying the written option. The Fund, as purchaser of an OTC option, bears the risk of the potential inability of the counterparties to meet the terms of their contracts. With exchange-traded options contracts, there is minimal counterparty credit risk to the Fund since the exchanges’ clearinghouse acts as counterparty to all exchange-traded options and guarantees the options contracts against default.
When the Fund writes an option on a swap, an amount equal to any premium received by the Fund is recorded as a liability and is subsequently adjusted to the current market value of the written option on the swap. If a call option on a swap is exercised, the Fund becomes obligated to pay a fixed interest rate (noted as the strike price) and receive a variable interest rate on a notional amount. If a put option on a swap is exercised, the Fund becomes obligated to pay a variable interest rate and receive a fixed interest rate (noted as the strike
82
price) on a notional amount. Premiums received from writing options on swaps that expire or are exercised are treated as realized gains upon the expiration or exercise of such options on swaps. The risk associated with writing put and call options on swaps is that the Fund will be obligated to be party to a swap agreement if an option on a swap is exercised. The Fund entered into options on swaps that are executed through a central clearing facility, such as a registered exchange. Such options pay or receive an amount known as “variation margin”, based on daily changes in the valuation of the contract. The daily variation margin, rather than the contract market value, is recorded for financial statement purposes on the Statement of Assets and Liabilities.
Financial Futures Contracts: A financial futures contract is an agreement to purchase (long) or sell (short) an agreed amount of securities at a set price for delivery on a future date. Upon entering into a financial futures contract, the Fund is required to pledge to the broker an amount of cash and/or other assets equal to a certain percentage of the contract amount. This amount is known as the “initial margin.” Subsequent payments, known as “variation margin,” are made or received by the Fund each day, depending on the daily fluctuations in the value of the underlying security. Such variation margin is recorded for financial statement purposes on a daily basis as unrealized gain (loss). When the contract expires or is closed, the gain (loss) is realized and is presented in the Statement of Operations as net realized gain (loss) on futures transactions.
The Fund invested in financial futures contracts in order to hedge its existing portfolio securities, or securities the Fund intends to purchase, against fluctuations in value caused by changes in prevailing interest rates. Should interest rates move unexpectedly, the Fund may not achieve the anticipated benefits of the financial futures contracts and may realize a loss. The use of futures transactions involves the risk of imperfect correlation in movements in the price of futures contracts, interest rates and the underlying hedged assets. Since futures contracts are exchange-traded, there is minimal counterparty credit risk to the Fund since the exchanges’ clearinghouse acts as counterparty to all exchange-traded futures and guarantees the futures contracts against default.
Swap Agreements: The Fund entered into certain types of swap agreements detailed in the disclosures below. A swap agreement is an agreement to exchange the return generated by one instrument for the return generated by another instrument. Swap agreements are negotiated in the OTC market and may be executed either directly with a counterparty (“OTC-traded”) or through a central clearing facility, such as a registered exchange. Swap agreements are valued daily at current market value and any change in value is included in the net unrealized appreciation or depreciation on swap agreements. Centrally cleared swaps pay or receive an amount known as “variation margin”, based on daily changes in the valuation of the swap contract. For OTC-traded, upfront premiums paid and received are shown as swap premiums paid and swap premiums received in the Statement of Assets and Liabilities. Risk of loss may exceed amounts recognized on the Statement of Assets and Liabilities. Swap agreements outstanding at period end, if any, are listed on the Schedule of Investments.
PGIM Absolute Return Bond Fund 83
Notes to Financial Statements (continued)
Interest Rate Swaps: Interest rate swaps represent an agreement between counterparties to exchange cash flows based on the difference between two interest rates, applied to a notional principal amount for a specified period. The Fund is subject to interest rate risk exposure in the normal course of pursuing its investment objective. The Fund used interest rate swaps to maintain its ability to generate steady cash flow by receiving a stream of fixed rate payments or to increase exposure to prevailing market rates by receiving floating rate payments. The Fund’s maximum risk of loss from counterparty credit risk is the discounted net present value of the cash flows to be received from the counterparty over the contract’s remaining life.
Inflation Swaps: The Fund entered into inflation swap agreements to protect against fluctuations in inflation rates. Inflation swaps are characterized by one party paying a fixed rate in exchange for a floating rate that is derived from an inflation index, such as the Consumer Price Index or UK Retail Price Index. Inflation swaps subject the Fund to interest rate risk.
Credit Default Swaps (“CDS”): CDS involve one party (the protection buyer) making a stream of payments to another party (the protection seller) in exchange for the right to receive a specified payment in the event of a default or as a result of a default (collectively a “credit event”) for the referenced entity (typically corporate issues or sovereign issues of an emerging country) on its obligation; or in the event of a write-down, principal shortfall, interest shortfall or default of all or part of the referenced entities comprising a credit index.
The Fund is subject to credit risk in the normal course of pursuing its investment objectives, and as such, has entered into CDS contracts to provide a measure of protection against defaults or to take an active long or short position with respect to the likelihood of a particular issuer’s default or the reference entity’s credit soundness. CDS contracts generally trade based on a spread which represents the cost a protection buyer has to pay the protection seller. The protection buyer is said to be short the credit as the value of the contract rises the more the credit deteriorates. The value of the CDS contract increases for the protection buyer if the spread increases. The Fund’s maximum risk of loss from counterparty credit risk for purchased CDS is the inability of the counterparty to honor the contract up to the notional value due to a credit event.
As a seller of protection on credit default swap agreements, the Fund generally receives an agreed upon payment from the buyer of protection throughout the term of the swap, provided no credit event occurs. As the seller, the Fund effectively increases its investment risk because, in addition to its total net assets, the Fund may be subject to investment exposure on the notional amount of the swap.
84
The maximum amount of the payment that the Fund, as a seller of protection, could be required to make under a credit default swap agreement would be equal to the notional amount of the underlying security or index contract as a result of a credit event. This potential amount will be partially offset by any recovery values of the respective referenced obligations, or net amounts received from the settlement of buy protection credit default swap agreements which the Fund entered into for the same referenced entity or index. As a buyer of protection, the Fund generally receives an amount up to the notional value of the swap if a credit event occurs.
Implied credit spreads, represented in absolute terms, utilized in determining the market value of credit default swap agreements where the Fund is the seller of protection as of period end are disclosed in the footnotes to the Schedule of Investments, if applicable. These spreads serve as indicators of the current status of the payment/performance risk and represent the likelihood of default risk for the credit derivative. The implied credit spread of a particular referenced entity reflects the cost of buying/selling protection and may include upfront payments required to enter into the agreement. Wider credit spreads and increased market value in absolute terms, when compared to the notional amount of the swap, represent a deterioration of the referenced entity’s credit soundness and a greater likelihood of risk of default or other credit event occurring as defined under the terms of the agreement.
Total Return Swaps: In a total return swap, one party receives payments based on the market value of the security or the commodity involved, or total return of a specific referenced asset, such as an equity, index or bond, and in return pays a defined amount. The Fund is subject to risk exposures associated with the referenced asset in the normal course of pursuing its investment objectives. The Fund entered into total return swaps to manage its exposure to a security or an index. The Fund’s maximum risk of loss from counterparty credit risk is the change in the value of the security, in the Fund’s favor, from the point of entering into the contract.
Floating Rate and other Loans: The Fund invested in floating rate and other loans. Floating rate and other loans include loans that are privately negotiated between a corporate borrower and one or more financial institutions, including, but not limited to, term loans, revolvers, and other instruments issued in the floating rate and other loans market. The Fund acquires interests in loans directly (by way of assignment from the selling institution) and/or indirectly (by way of the purchase of a participation interest from the selling institution). Under a floating rate and other loans assignment, the Fund generally will succeed to all the rights and obligations of an assigning lending institution and becomes a lender under the loan agreement with the relevant borrower in connection with that loan. Under a floating rate and other loans participation, the Fund generally will have a contractual relationship only with the lender, not with the relevant borrower. As a result, the Fund generally will have the right to receive payments of principal, interest, and any fees to which it is entitled only from the lender selling the participation and only upon receipt by the lender of the payments from the relevant borrower. The Fund may not directly benefit from the collateral supporting the debt obligation in which it has purchased the
PGIM Absolute Return Bond Fund 85
Notes to Financial Statements (continued)
participation. As a result, the Fund will assume the credit risk of both the borrower and the institution selling the participation to the Fund.
Mortgage-Backed and Asset-Backed Securities: Mortgage-backed securities are pass-through securities, meaning that principal and interest payments made by the borrower on the underlying mortgages are passed through to the Fund. Asset-backed securities directly or indirectly represent a participation interest in, or are secured by and payable from, a stream of payments generated by particular assets such as motor vehicle or credit card receivables. Asset-backed securities may be classified as pass-through certificates or collateralized obligations, such as collateralized bond obligations, collateralized loan obligations and other similarly structured securities. The value of mortgage-backed and asset-backed securities varies with changes in interest rates and may be affected by changes in credit quality or value of the mortgage loans or other assets that support the securities.
Stripped mortgage-backed securities are usually structured with two classes that receive different proportions of the interest (“IO”) and principal (“PO”) distributions on a pool of mortgage assets. Payments received for IOs are included in interest income on the Statements of Operations. Because no principal will be received at the maturity of an IO, adjustments are made to the cost of the security on a monthly basis until maturity. These adjustments are included in interest income on the Statements of Operations. Payments received for POs are treated as reductions to the cost and par value of the securities.
Master Netting Arrangements: The RIC, on behalf of the Fund, is subject to various Master Agreements, or netting arrangements, with select counterparties. These are agreements which a subadviser may have negotiated and entered into on behalf of all or a portion of the Fund. A master netting arrangement between the Fund and the counterparty permits the Fund to offset amounts payable by the Fund to the same counterparty against amounts to be received; and by the receipt of collateral from the counterparty by the Fund to cover the Fund’s exposure to the counterparty. However, there is no assurance that such mitigating factors are easily enforceable. In addition to master netting arrangements, the right to set-off exists when all the conditions are met such that each of the parties owes the other determinable amounts, the reporting party has the right to set-off the amount owed with the amount owed by the other party, the reporting party intends to set-off and the right of set-off is enforceable by law.
The RIC, on behalf of the Fund, is a party to International Swaps and Derivatives Association, Inc. (“ISDA”) Master Agreements with certain counterparties that govern OTC derivative and foreign exchange contracts entered into from time to time. The Master Agreements may contain provisions regarding, among other things, the parties’ general obligations, representations, agreements, collateral requirements, events of default and
86
early termination. With respect to certain counterparties, in accordance with the terms of the Master Agreements, collateral posted to the Fund is held in a segregated account by the Fund’s custodian and with respect to those amounts which can be sold or re-pledged, is presented in the Schedule of Investments. Collateral pledged by the Fund is segregated by the Fund’s custodian and identified in the Schedule of Investments. Collateral can be in the form of cash or debt securities issued by the U.S. Government or related agencies or other securities as agreed to by the Fund and the applicable counterparty. Collateral requirements are determined based on the Fund’s net position with each counterparty. Termination events applicable to the Fund may occur upon a decline in the Fund’s net assets below a specified threshold over a certain period of time. Termination events applicable to counterparties may occur upon a decline in the counterparty’s long-term and short-term credit ratings below a specified level. In each case, upon occurrence, the other party may elect to terminate early and cause settlement of all derivative and foreign exchange contracts outstanding, including the payment of any losses and costs resulting from such early termination, as reasonably determined by the terminating party. Any decision by one or more of the Fund’s counterparties to elect early termination could impact the Fund’s future derivative activity.
In addition to each instrument’s primary underlying risk exposure (e.g. interest rate, credit, equity or foreign exchange, etc.), swap agreements involve, to varying degrees, elements of credit, market and documentation risk. Such risks involve the possibility that no liquid market for these agreements will exist, the counterparty to the agreement may default on its obligation to perform or disagree on the contractual terms of the agreement, and changes in net interest rates will be unfavorable. In connection with these agreements, securities in the portfolio may be identified or received as collateral from the counterparty in accordance with the terms of the respective swap agreements to provide or receive assets of value and to serve as recourse in the event of default or bankruptcy/insolvency of either party. Such OTC derivative agreements include conditions which, when materialized, give the counterparty the right to cause an early termination of the transactions under those agreements. Any election by the counterparty for early termination of the contract(s) may impact the amounts reported on financial statements.
Short sales and OTC contracts, including forward foreign currency exchange contracts, swaps, forward rate agreements and written options involve elements of both market and credit risk in excess of the amounts reflected on the Statement of Assets and Liabilities, if applicable. Such risks may be mitigated by engaging in master netting arrangements.
Warrants and Rights: The Fund held warrants and rights acquired either through a direct purchase or pursuant to corporate actions. Warrants and rights entitle the holder to buy a proportionate amount of common stock, or such other security that the issuer may specify, at a specific price and time through the expiration dates. Such warrants and rights are held as long positions by the Fund until exercised, sold or expired. Warrants and rights are valued at fair value in accordance with the Board approved fair valuation procedures.
Payment-In-Kind: The Fund invested in the open market or received pursuant to debt restructuring, securities that pay-in-kind (PIK) the interest due on such debt instruments.
PGIM Absolute Return Bond Fund 87
Notes to Financial Statements (continued)
The PIK interest, computed at the contractual rate specified, is added to the existing principal balance of the debt when issued bonds have same terms as the bond or recorded as a separate bond when terms are different from the existing debt, and is recorded as interest income.
Securities Lending: The Fund lends its portfolio securities to banks and broker-dealers. The loans are secured by collateral at least equal to the market value of the securities loaned. Collateral pledged by each borrower is invested in an affiliated money market fund and is marked to market daily, based on the previous day’s market value, such that the value of the collateral exceeds the value of the loaned securities. In the event of significant appreciation in value of securities on loan on the last business day of the reporting period, the financial statements may reflect a collateral value that is less than the market value of the loaned securities. Such shortfall is remedied as described above. Loans are subject to termination at the option of the borrower or the Fund. Upon termination of the loan, the borrower will return to the Fund securities identical to the loaned securities. The remaining open loans of the securities lending transactions are considered overnight and continuous. Should the borrower of the securities fail financially, the Fund has the right to repurchase the securities in the open market using the collateral.
The Fund recognizes income, net of any rebate and securities lending agent fees, for lending its securities in the form of fees or interest on the investment of any cash received as collateral. The borrower receives all interest and dividends from the securities loaned and such payments are passed back to the lender in amounts equivalent thereto, which are reflected in interest income or unaffiliated dividend income based on the nature of the payment on the Statement of Operations. The Fund also continues to recognize any unrealized gain (loss) in the market price of the securities loaned and on the change in the value of the collateral invested that may occur during the term of the loan. In addition, realized gain (loss) is recognized on changes in the value of the collateral invested upon liquidation of the collateral. Net earnings from securities lending are disclosed in the Statement of Operations.
Mortgage Dollar Rolls: The Fund entered into mortgage dollar rolls in which the Fund sell mortgage securities for delivery in the current month, realizing a gain (loss), and simultaneously enter into contracts to repurchase somewhat similar (same type, coupon and maturity) securities on a specified future date. During the roll period, the Fund forgoes principal and interest paid on the securities. The Fund is compensated by the interest earned on the cash proceeds of the initial sale and by the lower repurchase price at the future date. The difference between the sale proceeds and the lower repurchase price is recorded as a realized gain on investment transactions. The Fund maintains a segregated account, the dollar value of which is at least equal to its obligations, with respect to dollar
88
rolls. The Fund is subject to the risk that the market value of the securities the Fund is obligated to repurchase under the agreement may decline below the repurchase price.
Securities Transactions and Net Investment Income: Securities transactions are recorded on the trade date. Realized gains (losses) from investment and currency transactions are calculated on the specific identification method. Dividend income is recorded on the ex-date, or for certain foreign securities, when the Fund becomes aware of such dividends. Interest income, including amortization of premium and accretion of discount on debt securities, as required, is recorded on the accrual basis. Expenses are recorded on an accrual basis, which may require the use of certain estimates by management that may differ from actual. Net investment income or loss (other than class specific expenses and waivers, which are allocated as noted below) and unrealized and realized gains (losses) are allocated daily to each class of shares based upon the relative proportion of adjusted net assets of each class at the beginning of the day. Class specific expenses and waivers, where applicable, are charged to the respective share classes. Such class specific expenses and waivers include distribution fees and distribution fee waivers, shareholder servicing fees, transfer agent’s fees and expenses, registration fees and fee waivers and/or expense reimbursements, as applicable.
Taxes: It is the Fund’s policy to continue to meet the requirements of the Internal Revenue Code applicable to regulated investment companies and to distribute all of its taxable net investment income and capital gains, if any, to its shareholders. Therefore, no federal income tax provision is required. Withholding taxes on foreign dividends, interest and capital gains, if any, are recorded, net of reclaimable amounts, at the time the related income is earned.
Dividends and Distributions: Dividends and distributions to shareholders, which are determined in accordance with federal income tax regulations and which may differ from GAAP, are recorded on the ex-date. Permanent book/tax differences relating to income and gain (loss) are reclassified between total distributable earnings (loss) and paid-in capital in excess of par, as appropriate. The chart below sets forth the expected frequency of dividend and capital gains distributions to shareholders. Various factors may impact the frequency of dividend distributions to shareholders, including but not limited to adverse market conditions or portfolio holding-specific events.
| | | | |
| | |
| Expected Distribution Schedule to Shareholders* | | Frequency | |
Net Investment Income | | | Monthly | |
Short-Term Capital Gains | | | Annually | |
Long-Term Capital Gains | | | Annually | |
| * | Under certain circumstances, the Fund may make more than one distribution of short-term and/or long-term capital gains during a fiscal year. |
Estimates: The preparation of financial statements requires management to make estimates and assumptions that affect the reported amounts and disclosures in the financial statements. Actual results could differ from those estimates.
PGIM Absolute Return Bond Fund 89
Notes to Financial Statements (continued)
The RIC, on behalf of the Fund, has a management agreement with the Manager pursuant to which it has responsibility for all investment advisory services and supervises the subadviser’s performance of such services, and pursuant to which it renders administrative services.
The Manager has entered into a subadvisory agreement with PGIM, Inc., which provides subadvisory services to the Fund through its business unit PGIM Fixed Income, and PGIM Limited (collectively the “subadviser”). The Manager pays for the services of the subadviser.
Fees payable under the management agreement are computed daily and paid monthly. For the reporting period ended October 31, 2022, the contractual and effective management fee rates were as follows:
| | |
| | |
| Contractual Management Rate | | Effective Management Fee, before any waivers
and/or expense reimbursements |
0.590% of average daily net assets up to $2.5 billion; | | 0.59% |
0.565% of average daily net assets from $2.5 billion to $5 billion; | | |
0.540% of average daily net assets over $5 billion. | | |
The Manager has contractually agreed, through February 29, 2024, to limit total annual operating expenses after fee waivers and/or expense reimbursements. This contractual waiver excludes interest, brokerage, taxes (such as income and foreign withholdings taxes, stamp duty and deferred tax expenses), acquired fund fees and expenses, extraordinary expenses, and certain other Fund expenses such as dividend and interest expense and broker charges on short sales.
Where applicable, the Manager agrees to waive management fees or shared operating expenses on any share class to the same extent that it waives such expenses on any other share class. In addition, total annual operating expenses for Class R6 shares will not exceed total annual operating expenses for Class Z shares. Fees and/or expenses waived and/or reimbursed by the Manager for the purpose of preventing the expenses from exceeding a certain expense ratio limit may be recouped by the Manager within the same fiscal year during which such waiver and/or reimbursement is made if such recoupment can be realized without exceeding the expense limit in effect at the time of the recoupment for that fiscal year. The expense limitations attributable to each class are as follows:
| | | | |
| | |
| Class | | Expense
Limitations | |
A | | | — | % |
C | | | — | |
Z | | | 0.73 | |
90
| | |
| | |
| Class | | Expense
Limitations |
| R6 | | 0.70% |
The RIC, on behalf of the Fund, has a distribution agreement with Prudential Investment Management Services LLC (“PIMS”), which acts as the distributor of the Class A, Class C, Class Z and Class R6 shares of the Fund. The Fund compensates PIMS for distributing and servicing the Fund’s Class A and Class C shares, pursuant to the plans of distribution (the “Distribution Plans”), regardless of expenses actually incurred by PIMS.
Pursuant to the Distribution Plans, the Fund compensates PIMS for distribution related activities at an annual rate based on average daily net assets per class. The distribution fees are accrued daily and payable monthly.
The Fund’s annual gross and net distribution rate, where applicable, are as follows:
| | | | |
| | | |
| Class | | Gross Distribution Fee | | Net Distribution Fee |
| A | | 0.25% | | 0.25% |
| C | | 1.00 | | 1.00 |
| Z | | N/A | | N/A |
| R6 | | N/A | | N/A |
For the year ended October 31, 2022, PIMS received front-end sales charges (“FESL”) resulting from sales of certain class shares and contingent deferred sales charges (“CDSC”) imposed upon redemptions by certain shareholders. From these fees, PIMS paid such sales charges to broker-dealers, who in turn paid commissions to salespersons and incurred other distribution costs. The sales charges are as follows where applicable:
| | | | | | | | |
| | | |
| Class | | FESL | | | CDSC | |
A | | $ | 40,330 | | | $ | 80,743 | |
C | | | — | | | | 1,071 | |
PGIM Investments, PGIM, Inc., PGIM Limited and PIMS are indirect, wholly-owned subsidiaries of Prudential Financial, Inc. (“Prudential”).
| 4. | Other Transactions with Affiliates |
Prudential Mutual Fund Services LLC (“PMFS”), an affiliate of PGIM Investments and an indirect, wholly-owned subsidiary of Prudential, serves as the Fund’s transfer agent and shareholder servicing agent. Transfer agent’s fees and expenses in the Statement of Operations include certain out-of-pocket expenses paid to non-affiliates, where applicable.
The Fund may invest its overnight sweep cash in the PGIM Core Ultra Short Bond Fund (the “Core Fund”), and its securities lending cash collateral in the PGIM Institutional Money Market Fund (the “Money Market Fund”), each a fund of Prudential Investment Portfolios 2, registered under the 1940 Act and managed by PGIM Investments. PGIM Investments and/or its affiliates are paid fees or reimbursed for providing their services to the Core Fund
PGIM Absolute Return Bond Fund 91
Notes to Financial Statements (continued)
and the Money Market Fund. In addition to the realized and unrealized gains on investments in the Core Fund and Money Market Fund, earnings from such investments are disclosed on the Statement of Operations as “Affiliated dividend income” and “Income from securities lending, net”, respectively. Effective January 2022, the Fund changed its overnight cash sweep vehicle from the Core Fund to an unaffiliated money market fund.
The Fund may enter into certain securities purchase or sale transactions under Board approved Rule 17a-7 procedures. Rule 17a-7 is an exemptive rule under the 1940 Act, that subject to certain conditions, permits purchase and sale transactions among affiliated investment companies, or between an investment company and a person that is affiliated solely by reason of having a common (or affiliated) investment adviser, common directors/trustees, and/or common officers. For the year ended October 31, 2022, no 17a-7 transactions were entered into by the Fund.
The aggregate cost of purchases and proceeds from sales of portfolio securities (excluding short-term investments and U.S. Government securities) for the reporting period ended October 31, 2022, were as follows:
| | |
| | |
| Cost of Purchases | | Proceeds from Sales |
| |
$498,262,788 | | $202,857,589 |
A summary of the cost of purchases and proceeds from sales of shares of affiliated mutual funds for the year ended October 31, 2022, is presented as follows:
| | | | | | | | | | | | | | | | | | | | | | | | | | | | | | | | | | | | | | | | | | | | | | | | | | | | | | | | | | | | | | | | | | | | |
| | | | | | | | | | | | | | |
Value,
Beginning of
Year | | Cost of
Purchases | | | | Proceeds from Sales | | | | Change in
Unrealized
Gain
(Loss) | | | | Realized
Gain
(Loss) | | | | Value, End of Year | | | | Shares, End of Year | | | | Income |
|
| | | Short-Term Investments - Affiliated Mutual Funds: | |
|
| | | PGIM Core Short-Term Bond Fund(1)(wc) | |
| | | $ — | | | | $ | 109,669,242 | | | | | | | | | $ | — | | | | | | | | | $ | (98,074 | ) | | | | | | | | $ | — | | | | | | | | | $ | 109,571,168 | | | | | | | | | | 12,040,788 | | | | | | | | | $ | 756,838 | |
|
| | | PGIM Core Ultra Short Bond Fund(1)(wc) | |
| | | 127,420,190 | | | | | 54,384,327 | | | | | | | | | | 181,804,517 | | | | | | | | | | — | | | | | | | | | | — | | | | | | | | | | — | | | | | | | | | | — | | | | | | | | | | 30,803 | |
|
| | | PGIM Institutional Money Market Fund(1)(b)(wc) | |
| | | | | | | | | | | | | |
| | | 14,750,279 | | | | | 247,606,094 | | | | | | | | | | 238,012,212 | | | | | | | | | | (1,177 | ) | | | | | | | | | (6,737 | ) | | | | | | | | | 24,336,247 | | | | | | | | | | 24,358,169 | | | | | | | | | | 61,624 | (2) |
| | | $142,170,469 | | | | $ | 411,659,663 | | | | | | | | | $ | 419,816,729 | | | | | | | | | $ | (99,251 | ) | | | | | | | | $ | (6,737 | ) | | | | | | | | $ | 133,907,415 | | | | | | | | | | | | | | | | | | | $ | 849,265 | |
| (1) | The Fund did not have any capital gain distributions during the reporting period. |
| (2) | The amount, or a portion thereof, represents the affiliated securities lending income shown on the Statement of Operations. |
92
| (b) | Represents security, or portion thereof, purchased with cash collateral received for securities on loan and includes dividend reinvestment. |
| (wc) | PGIM Investments LLC, the manager of the Fund, also serves as manager of the PGIM Core Short-Term Bond Fund, PGIM Core Ultra Short Bond Fund and PGIM Institutional Money Market Fund, if applicable. |
| 6. | Distributions and Tax Information |
Distributions to shareholders, which are determined in accordance with federal income tax regulations and which may differ from GAAP, are recorded on the ex-date.
For the year ended October 31, 2022, the tax character of dividends paid by the Fund was $29,762,186 of ordinary income. For the year ended October 31, 2021, the tax character of dividends paid by the Fund were $27,842,762 of ordinary income and $1,252,077 of tax return of capital.
As of October 31, 2022, the accumulated undistributed earnings on a tax basis was $4,654,939 of ordinary income.
The United States federal income tax basis of the Fund’s investments and the net unrealized depreciation as of October 31, 2022 were as follows:
| | | | | | |
| Tax Basis | | Gross Unrealized Appreciation | | Gross Unrealized Depreciation | | Net Unrealized Depreciation |
$1,573,970,358 | | $85,535,772 | | $(228,921,062) | | $(143,385,290) |
The differences between GAAP and tax basis were primarily attributable to deferred losses on wash sales, straddle loss deferral, mark-to-market of futures and forwards contracts, difference in the treatment of premium amortization and other GAAP to tax differences.
For federal income tax purposes, the Fund had a capital loss carryforward as of October 31, 2022 of approximately $159,162,000 which can be carried forward for an unlimited period. The Fund utilized approximately $96,549,000 of its capital loss carryforward to offset net taxable gains realized in the fiscal year ended October 31, 2022. No capital gains distributions are expected to be paid to shareholders until net gains have been realized in excess of such losses.
The Manager has analyzed the Fund’s tax positions taken on federal, state and local income tax returns for all open tax years and has concluded that no provision for income tax is required in the Fund’s financial statements for the current reporting period. Since tax authorities can examine previously filed tax returns, the Fund’s U.S. federal and state tax returns for each of the four fiscal years up to the most recent fiscal year ended October 31, 2022 are subject to such review.
PGIM Absolute Return Bond Fund 93
Notes to Financial Statements (continued)
The Fund offers Class A, Class C, Class Z and Class R6 shares. Class A shares are sold with a maximum front-end sales charge of 3.25%. Investors who purchase $500,000 or more of Class A shares and sell those shares within 12 months of purchase are subject to a CDSC of 1% on sales although these purchases are not subject to a front-end sales charge. The Class A CDSC is waived for certain retirement and/or benefit plans. A special exchange privilege is also available for shareholders who qualified to purchase Class A shares at net asset value. Class C shares are sold with a CDSC of 1% on sales made within 12 months of purchase. Class C shares will automatically convert to Class A shares on a monthly basis approximately eight years (ten years prior to January 22, 2021) after purchase. Class Z and Class R6 shares are not subject to any sales or redemption charges and are available exclusively for sale to a limited group of investors.
Under certain circumstances, an exchange may be made from specified share classes of the Fund to one or more other share classes of the Fund as presented in the table of transactions in shares of beneficial interest, below.
The RIC has authorized an unlimited number of shares of beneficial interest of the Fund at $0.001 par value per share, currently divided into four classes, designated Class A, Class C, Class Z and Class R6.
As of October 31, 2022, Prudential, through its affiliated entities, including affiliated funds (if applicable), owned shares of the Fund as follows:
| | | | |
| | | |
| Class | | Number of Shares | | Percentage of Outstanding Shares |
A | | 3,838 | | 0.1% |
R6 | | 496 | | 0.1 |
At the reporting period end, the number of shareholders holding greater than 5% of the Fund are as follows:
| | | | |
| | | |
| | | Number of Shareholders | | Percentage of Outstanding Shares |
Affiliated | | — | | —% |
Unaffiliated | | 10 | | 94.6 |
94
Transactions in shares of beneficial interest were as follows:
| | | | | | | | | | | | |
| | | | |
| Share Class | | Shares | | | | | | Amount | |
| | | |
Class A | | | | | | | | | | | | |
Year ended October 31, 2022: | | | | | | | | | | | | |
Shares sold | | | 2,646,418 | | | | | | | $ | 23,662,293 | |
Shares issued in reinvestment of dividends and distributions | | | 225,474 | | | | | | | | 2,019,539 | |
Shares purchased | | | (4,801,741 | ) | | | | | | | (43,240,216 | ) |
Net increase (decrease) in shares outstanding before conversion | | | (1,929,849 | ) | | | | | | | (17,558,384 | ) |
Shares issued upon conversion from other share class(es) | | | 1,271,170 | | | | | | | | 11,431,721 | |
Shares purchased upon conversion into other share class(es) | | | (503,327 | ) | | | | | | | (4,526,308 | ) |
Net increase (decrease) in shares outstanding | | | (1,162,006 | ) | | | | | | $ | (10,652,971 | ) |
| | | |
Year ended October 31, 2021: | | | | | | | | | | | | |
Shares sold | | | 2,519,737 | | | | | | | $ | 23,342,981 | |
Shares issued in reinvestment of dividends and distributions | | | 219,481 | | | | | | | | 2,028,875 | |
Shares purchased | | | (2,990,518 | ) | | | | | | | (27,622,965 | ) |
Net increase (decrease) in shares outstanding before conversion | | | (251,300 | ) | | | | | | | (2,251,109 | ) |
Shares issued upon conversion from other share class(es) | | | 2,491,992 | | | | | | | | 23,060,684 | |
Shares purchased upon conversion into other share class(es) | | | (818,387 | ) | | | | | | | (7,550,819 | ) |
Net increase (decrease) in shares outstanding | | | 1,422,305 | | | | | | | $ | 13,258,756 | |
| | | |
Class C | | | | | | | | | | | | |
Year ended October 31, 2022: | | | | | | | | | | | | |
Shares sold | | | 877,518 | | | | | | | $ | 7,896,265 | |
Shares issued in reinvestment of dividends and distributions | | | 61,798 | | | | | | | | 555,299 | |
Shares purchased | | | (1,004,200 | ) | | | | | | | (9,079,074 | ) |
Net increase (decrease) in shares outstanding before conversion | | | (64,884 | ) | | | | | | | (627,510 | ) |
Shares issued upon conversion from other share class(es) | | | 562 | | | | | | | | 4,961 | |
Shares purchased upon conversion into other share class(es) | | | (932,971 | ) | | | | | | | (8,415,272 | ) |
Net increase (decrease) in shares outstanding | | | (997,293 | ) | | | | | | $ | (9,037,821 | ) |
| | | |
Year ended October 31, 2021: | | | | | | | | | | | | |
Shares sold | | | 522,542 | | | | | | | $ | 4,851,562 | |
Shares issued in reinvestment of dividends and distributions | | | 92,283 | | | | | | | | 855,331 | |
Shares purchased | | | (1,354,330 | ) | | | | | | | (12,530,754 | ) |
Net increase (decrease) in shares outstanding before conversion | | | (739,505 | ) | | | | | | | (6,823,861 | ) |
Shares purchased upon conversion into other share class(es) | | | (2,055,211 | ) | | | | | | | (19,078,475 | ) |
Net increase (decrease) in shares outstanding | | | (2,794,716 | ) | | | | | | $ | (25,902,336 | ) |
PGIM Absolute Return Bond Fund 95
Notes to Financial Statements (continued)
| | | | | | | | | | | | |
| | | | |
| Share Class | | Shares | | | | | | Amount | |
| | | |
Class Z | | | | | | | | | | | | |
Year ended October 31, 2022: | | | | | | | | | | | | |
Shares sold | | | 102,369,219 | | | | | | | $ | 919,665,721 | |
Shares issued in reinvestment of dividends and distributions | | | 2,460,724 | | | | | | | | 22,062,630 | |
Shares purchased | | | (62,343,869 | ) | | | | | | | (559,336,562 | ) |
Net increase (decrease) in shares outstanding before conversion | | | 42,486,074 | | | | | | | | 382,391,789 | |
Shares issued upon conversion from other share class(es) | | | 639,113 | | | | | | | | 5,782,742 | |
Shares purchased upon conversion into other share class(es) | | | (486,684 | ) | | | | | | | (4,407,950 | ) |
Net increase (decrease) in shares outstanding | | | 42,638,503 | | | | | | | $ | 383,766,581 | |
| | | |
Year ended October 31, 2021: | | | | | | | | | | | | |
Shares sold | | | 35,120,093 | | | | | | | $ | 326,191,894 | |
Shares issued in reinvestment of dividends and distributions | | | 2,091,073 | | | | | | | | 19,407,546 | |
Shares purchased | | | (72,927,948 | ) | | | | | | | (678,007,297 | ) |
Net increase (decrease) in shares outstanding before conversion | | | (35,716,782 | ) | | | | | | | (332,407,857 | ) |
Shares issued upon conversion from other share class(es) | | | 1,152,690 | | | | | | | | 10,687,873 | |
Shares purchased upon conversion into other share class(es) | | | (1,888,354 | ) | | | | | | | (17,538,221 | ) |
Net increase (decrease) in shares outstanding | | | (36,452,446 | ) | | | | | | $ | (339,258,205 | ) |
| | | |
Class R6 | | | | | | | | | | | | |
Year ended October 31, 2022: | | | | | | | | | | | | |
Shares sold | | | 1,666,379 | | | | | | | $ | 14,853,468 | |
Shares issued in reinvestment of dividends and distributions | | | 186,465 | | | | | | | | 1,667,818 | |
Shares purchased | | | (1,273,173 | ) | | | | | | | (11,381,641 | ) |
Net increase (decrease) in shares outstanding before conversion | | | 579,671 | | | | | | | | 5,139,645 | |
Shares issued upon conversion from other share class(es) | | | 14,475 | | | | | | | | 130,106 | |
Net increase (decrease) in shares outstanding | | | 594,146 | | | | | | | $ | 5,269,751 | |
| | | |
Year ended October 31, 2021: | | | | | | | | | | | | |
Shares sold | | | 444,812 | | | | | | | $ | 4,053,717 | |
Shares issued in reinvestment of dividends and distributions | | | 299,248 | | | | | | | | 2,762,297 | |
Shares purchased | | | (9,656,641 | ) | | | | | | | (89,403,883 | ) |
Net increase (decrease) in shares outstanding before conversion | | | (8,912,581 | ) | | | | | | | (82,587,869 | ) |
Shares issued upon conversion from other share class(es) | | | 1,126,351 | | | | | | | | 10,418,958 | |
Net increase (decrease) in shares outstanding | | | (7,786,230 | ) | | | | | | $ | (72,168,911 | ) |
The RIC, on behalf of the Fund, along with other affiliated registered investment companies (the “Participating Funds”), is a party to a Syndicated Credit Agreement (“SCA”) with a group of banks. The purpose of the SCA is to provide an alternative source of temporary
96
funding for capital share redemptions. The table below provides details of the current SCA in effect at the reporting period-end as well as the prior SCA.
| | | | |
| | | |
| | | Current SCA | | Prior SCA |
Term of Commitment | | 9/30/2022 - 9/28/2023 | | 10/1/2021 – 9/29/2022 |
Total Commitment | | $ 1,200,000,000 | | $1,200,000,000 |
Annualized Commitment Fee on the Unused Portion of the SCA | | 0.15% | | 0.15% |
| Annualized Interest Rate on Borrowings | | 1.00% plus the higher of (1)
the effective federal funds rate, (2) the daily SOFR
rate plus 0.10% or (3) zero percent | | 1.20% plus the higher of (1)
the effective federal funds rate, (2) the one-month
LIBOR rate or (3) zero
percent |
Certain affiliated registered investment companies that are parties to the SCA include portfolios that are subject to a predetermined mathematical formula used to manage certain benefit guarantees offered under variable annuity contracts. The formula may result in large scale asset flows into and out of these portfolios. Consequently, these portfolios may be more likely to utilize the SCA for purposes of funding redemptions. It may be possible for those portfolios to fully exhaust the committed amount of the SCA, thereby requiring the Manager to allocate available funding per a Board-approved methodology designed to treat the Participating Funds in the SCA equitably.
The Fund did not utilize the SCA during the year ended October 31, 2022.
| 9. | Risks of Investing in the Fund |
The Fund’s risks include, but are not limited to, some or all of the risks discussed below. For further information on the Fund’s risks, please refer to the Fund’s Prospectus and Statement of Additional Information.
“Covenant-Lite” Risk: Some of the loans or debt obligations in which the Fund may invest or get exposure to may be “covenant-lite”, which means the loans or obligations contain fewer financial maintenance covenants than other loans or obligations (in some cases, none) and do not include terms which allow the lender to monitor the borrower’s performance and declare a default if certain criteria are breached. An investment by the Fund in a covenant-lite loan may potentially hinder the ability to reprice credit risk associated with the issuer and reduce the ability to restructure a problematic loan and mitigate potential loss. The Fund may also experience difficulty, expenses or delays in enforcing its rights on its holdings of covenant-lite loans or obligations. As a result of these risks, the Fund’s exposure to losses may be increased, which could result in an adverse impact on the Fund’s net income and NAV.
Credit Risk: This is the risk that the issuer, the guarantor or the insurer of a fixed income security, or the counterparty to a contract, may be unable or unwilling to make timely principal and interest payments, or to otherwise honor its obligations. Additionally, fixed income securities could lose value due to a loss of confidence in the ability of the issuer,
PGIM Absolute Return Bond Fund 97
Notes to Financial Statements (continued)
guarantor, insurer or counterparty to pay back debt. The lower the credit quality of a bond, the more sensitive it is to credit risk.
Currency Risk: The Fund’s net asset value could decline as a result of changes in exchange rates, which could adversely affect the Fund’s investments in currencies, or in securities that trade in, and receive revenues related to, currencies, or in derivatives that provide exposure to currencies. Certain foreign countries may impose restrictions on the ability of issuers of foreign securities to make payment of principal and interest or dividends to investors located outside the country, due to blockage of foreign currency exchanges or otherwise.
Debt Obligations Risk: Debt obligations are subject to credit risk, market risk and interest rate risk. The Fund’s holdings, share price, yield and total return may also fluctuate in response to bond market movements. The value of bonds may decline for issuer-related reasons, including management performance, financial leverage and reduced demand for the issuer’s goods and services. Certain types of fixed income obligations also may be subject to “call and redemption risk,” which is the risk that the issuer may call a bond held by the Fund for redemption before it matures and the Fund may not be able to reinvest at the same rate of interest and therefore would earn less income.
Economic and Market Events Risk: Events in the U.S. and global financial markets, including actions taken by the U.S. Federal Reserve or foreign central banks to stimulate or stabilize economic growth or the functioning of the securities markets, or otherwise reduce inflation may at times result in unusually high market volatility, which could negatively impact performance. Governmental efforts to curb inflation often have negative effects on the level of economic activity. Relatively reduced liquidity in credit and fixed income markets could adversely affect issuers worldwide.
Floating Rate and Other Loans Risk: The Fund’s ability to receive payments of principal and interest and other amounts in connection with loans (whether through participations, assignments or otherwise) will depend primarily on the financial condition of the borrower. The failure by the Fund to receive scheduled interest or principal payments on a loan because of a default, bankruptcy or any other reason would adversely affect the income of the Fund and would likely reduce the value of its assets. Even with loans secured by collateral, there is the risk that the value of the collateral may decline, may be insufficient to meet the obligations of the borrower, or be difficult to liquidate. In the event of a default, the Fund may have difficulty collecting on any collateral and would not have the ability to collect on any collateral for an uncollateralized loan. Further, the Fund’s access to collateral, if any, may be limited by bankruptcy laws. Due to the nature of the private syndication of senior loans, including, for example, lack of publicly-available information, some senior loans are not as easily purchased or sold as publicly-traded securities. In addition, loan participations generally are subject to restrictions on transfer, and only limited opportunities may exist to
98
sell loan participations in secondary markets. As a result, it may be difficult for the Fund to value loans or sell loans at an acceptable price when it wants to sell them. Loans trade in an over-the-counter market, and confirmation and settlement, which are effected through standardized procedures and documentation, may take significantly longer than seven days to complete. Extended trade settlement periods may, in unusual market conditions with a high volume of shareholder redemptions, present a risk to shareholders regarding the Fund’s ability to pay redemption proceeds in a timely manner. In some instances, loans and loan participations are not rated by independent credit rating agencies; in such instances, a decision by the Fund to invest in a particular loan or loan participation could depend exclusively on the subadviser’s credit analysis of the borrower, or in the case of a loan participation, of the intermediary holding the portion of the loan that the Fund has purchased. To the extent the Fund invests in loans of non-U.S. issuers, the risks of investing in non-U.S. issuers are applicable. Loans may not be considered to be “securities” and as a result may not benefit from the protections of the federal securities laws, including anti-fraud protections and those with respect to the use of material non-public information, so that purchasers, such as the Fund, may not have the benefit of these protections. If the Fund is in possession of material non-public information about a borrower as a result of its investment in such borrower’s loan, the Fund may not be able to enter into a transaction with respect to a publicly-traded security of the borrower when it would otherwise be advantageous to do so.
Foreign Securities Risk: Investments in securities of non-U.S. issuers (including those denominated in U.S. dollars) may involve more risk than investing in securities of U.S. issuers. Foreign political, economic and legal systems, especially those in developing and emerging market countries, may be less stable and more volatile than in the United States. Foreign legal systems generally have fewer regulatory requirements than the U.S. legal system, particularly those of emerging markets. In general, less information is publicly available with respect to non-U.S. companies than U.S. companies. Non-U.S. companies generally are not subject to the same accounting, auditing, and financial reporting standards as are U.S. companies. Additionally, the changing value of foreign currencies and changes in exchange rates could also affect the value of the assets the Fund holds and the Fund’s performance. Certain foreign countries may impose restrictions on the ability of issuers of foreign securities to make payment of principal and interest or dividends to investors located outside the country, due to blockage of foreign currency exchanges or otherwise. Investments in emerging markets are subject to greater volatility and price declines.
In addition, the Fund’s investments in non-U.S. securities may be subject to the risks of nationalization or expropriation of assets, imposition of currency exchange controls or restrictions on the repatriation of non-U.S. currency, confiscatory taxation and adverse diplomatic developments. Special U.S. tax considerations may apply.
Increase in Expenses Risk: Your actual cost of investing in the Fund may be higher than the expenses shown in the expense table in the Fund’s prospectus for a variety of reasons. For example, expense ratios may be higher than those shown if average net assets decrease.
PGIM Absolute Return Bond Fund 99
Notes to Financial Statements (continued)
Net assets are more likely to decrease and Fund expense ratios are more likely to increase when markets are volatile. Active and frequent trading of Fund securities can increase expenses.
Interest Rate Risk: The value of your investment may go down when interest rates rise. A rise in rates tends to have a greater impact on the prices of longer term or duration debt securities. Similarly, a rise in interest rates may also have a greater negative impact on the value of equity securities whose issuers expect earnings further out in the future. For example, a fixed income security with a duration of three years is expected to decrease in value by approximately 3% if interest rates increase by 1%. This is referred to as “duration risk.” When interest rates fall, the issuers of debt obligations may prepay principal more quickly than expected, and the Fund may be required to reinvest the proceeds at a lower interest rate. This is referred to as “prepayment risk.” When interest rates rise, debt obligations may be repaid more slowly than expected, and the value of the Fund’s holdings may fall sharply. This is referred to as “extension risk.” The Fund may lose money if short-term or long-term interest rates rise sharply or in a manner not anticipated by the subadviser.
Junk Bonds Risk: High-yield, high-risk bonds have predominantly speculative characteristics, including particularly high credit risk. Junk bonds tend to have lower market liquidity than higher-rated securities. The liquidity of particular issuers or industries within a particular investment category may shrink or disappear suddenly and without warning. The non-investment grade bond market can experience sudden and sharp price swings and become illiquid due to a variety of factors, including changes in economic forecasts, stock market activity, large sustained sales by major investors, a high profile default or a change in the market’s psychology.
Large Shareholder and Large Scale Redemption Risk: Certain individuals, accounts, funds (including funds affiliated with the Manager) or institutions, including the Manager and its affiliates, may from time to time own or control a substantial amount of the Fund’s shares. There is no requirement that these entities maintain their investment in the Fund. There is a risk that such large shareholders or that the Fund’s shareholders generally may redeem all or a substantial portion of their investments in the Fund in a short period of time, which could have a significant negative impact on the Fund’s NAV, liquidity, and brokerage costs. Large redemptions could also result in tax consequences to shareholders and impact the Fund’s ability to implement its investment strategy. The Fund’s ability to pursue its investment objective after one or more large scale redemptions may be impaired and, as a result, the Fund may invest a larger portion of its assets in cash or cash equivalents.
Liquidity Risk: Liquidity risk is the risk that the Fund could not meet requests to redeem shares issued by the Fund without significant dilution of remaining investors’ interests in the
100
Fund. The Fund may invest in instruments that trade in lower volumes and are more illiquid than other investments. If the Fund is forced to sell these investments to pay redemption proceeds or for other reasons, the Fund may lose money. In addition, when there is no willing buyer and investments cannot be readily sold at the desired time or price, the Fund may have to accept a lower price or may not be able to sell the instrument at all. An inability to sell a portfolio position can adversely affect the Fund’s value or prevent the Fund from being able to take advantage of other investment opportunities.
Management Risk: Actively managed funds are subject to management risk. The subadviser will apply investment techniques and risk analyses in making investment decisions for the Fund, but the subadviser’s judgments about the attractiveness, value or market trends affecting a particular security, industry or sector or about market movements may be incorrect. Additionally, the investments selected for the Fund may underperform the markets in general, the Fund’s benchmark and other funds with similar investment objectives.
Market Disruption and Geopolitical Risks: Market disruption can be caused by economic, financial or political events and factors, including but not limited to, international wars or conflicts (including Russia’s military invasion of Ukraine), geopolitical developments (including trading and tariff arrangements, sanctions and cybersecurity attacks), instability in regions such as Asia, Eastern Europe and the Middle East, terrorism, natural disasters and public health epidemics (including the outbreak of COVID-19 globally).
The extent and duration of such events and resulting market disruptions cannot be predicted, but could be substantial and could magnify the impact of other risks to the Fund. These and other similar events could adversely affect the U.S. and foreign financial markets and lead to increased market volatility, reduced liquidity in the securities markets, significant negative impacts on issuers and the markets for certain securities and commodities and/or government intervention. They may also cause short- or long-term economic uncertainties in the United States and worldwide. As a result, whether or not the Fund invests in securities of issuers located in or with significant exposure to the countries directly affected, the value and liquidity of the Fund’s investments may be negatively impacted. Further, due to closures of certain markets and restrictions on trading certain securities, the value of certain securities held by the Fund could be significantly impacted, which could lead to such securities being valued at zero.
COVID-19 and the related governmental and public responses have had and may continue to have an impact on the Fund’s investments and net asset value and have led and may continue to lead to increased market volatility and the potential for illiquidity in certain classes of securities and sectors of the market. They have also had and may continue to result in periods of business disruption, business closures, inability to obtain raw materials, supplies and component parts, and reduced or disrupted operations for the issuers in which the Fund invests. The occurrence, reoccurrence and pendency of public health epidemics could adversely affect the economies and financial markets either in specific countries or worldwide.
PGIM Absolute Return Bond Fund 101
Notes to Financial Statements (continued)
Market Risk: Securities markets may be volatile and the market prices of the Fund’s securities may decline. Securities fluctuate in price based on changes in an issuer’s financial condition and overall market and economic conditions. If the market prices of the securities owned by the Fund fall, the value of your investment in the Fund will decline.
Mortgage-Backed and Asset-Backed Securities Risk: Mortgage-backed and asset-backed securities tend to increase in value less than other debt securities when interest rates decline, but are subject to similar risk of decline in market value during periods of rising interest rates. The values of mortgage-backed and asset-backed securities become more volatile as interest rates rise. In a period of declining interest rates, the Fund may be required to reinvest more frequent prepayments on mortgage-backed and asset-backed securities in lower-yielding investments.
Reference Rate Risk: The Fund may be exposed to financial instruments that are tied to the London Interbank Offered Rate (“LIBOR”) to determine payment obligations, financing terms, hedging strategies or investment value. The United Kingdom’s Financial Conduct Authority announced a phase out of LIBOR such that after June 30, 2023, the overnight, 1-month, 3-month, 6-month and 12-month U.S. dollar LIBOR settings will cease to be published or will no longer be representative. All other LIBOR settings and certain other interbank offered rates, such as the Euro Overnight Index Average (“EONIA”), ceased to be published or representative after December 31, 2021. The Fund may have investments linked to other interbank offered rates that may also cease to be published in the future. Various financial industry groups have been planning for the transition away from LIBOR, but there remain challenges to converting certain securities and transactions to a new reference rate (e.g., the Secured Overnight Financing Rate (“SOFR”), which is intended to replace the U.S. dollar LIBOR).
Neither the effect of the LIBOR transition process nor its ultimate success can yet be known. The transition process might lead to increased volatility and illiquidity in markets for instruments whose terms currently include LIBOR as well as loan facilities used by the Fund. While some existing LIBOR-based instruments may contemplate a scenario where LIBOR is no longer available by providing for an alternative rate-setting methodology, there may be significant uncertainty regarding the effectiveness of any such alternative methodologies to replicate LIBOR. Not all existing LIBOR-based instruments may have alternative rate-setting provisions and there remains uncertainty regarding the willingness and ability of issuers to add alternative rate-setting provisions in certain existing instruments. Global regulators have advised market participants to cease entering into new contracts using LIBOR as a reference rate, and it is possible that investments in LIBOR-based instruments could invite regulatory scrutiny. There may also be challenges for the Fund to enter into hedging transactions against such newly-issued instruments until a market for
102
such hedging transactions develops. All of the aforementioned may adversely affect the Fund’s performance or net asset value.
U.S. Government and Agency Securities Risk: U.S. Government and agency securities are subject to market risk, interest rate risk and credit risk. Not all U.S. Government securities are insured or guaranteed by the full faith and credit of the U.S. Government; some are only insured or guaranteed by the issuing agency, which must rely on its own resources to repay the debt. Some agency securities carry no guarantee whatsoever and the risk of default associated with these securities would be borne by the Fund. The maximum potential liability of the issuers of some U.S. Government securities held by the Fund may greatly exceed their current resources, including their legal right to support from the U.S. Treasury. No assurance can be given that the U.S. Government would provide financial support to any such issuers if it is not obligated to do so by law. It is possible that these issuers will not have the funds to meet their payment obligations in the future. In addition, the value of U.S. Government securities may be affected by changes in the credit rating of the U.S. Government.
10. Recent Accounting Pronouncement and Regulatory Developments
In March 2020, the FASB issued Accounting Standard Update (“ASU”) No. 2020-04, which provides optional guidance for applying GAAP to contract modifications, hedging relationships and other transactions affected by the reference rate reform if certain criteria are met. ASU 2020-04 is elective and is effective on March 12, 2020 through December 31, 2022. Management does not expect ASU 2020-04 to have a material impact on the financial statements.
PGIM Absolute Return Bond Fund 103
Report of Independent Registered Public Accounting Firm
To the Board of Trustees of Prudential Investment Portfolios 9 and Shareholders of PGIM Absolute Return Bond Fund
Opinion on the Financial Statements
We have audited the accompanying statement of assets and liabilities, including the schedule of investments, of PGIM Absolute Return Bond Fund (one of the funds constituting Prudential Investment Portfolios 9, referred to hereafter as the “Fund”) as of October 31, 2022, the related statement of operations for the year ended October 31, 2022, the statements of changes in net assets for each of the two years in the period ended October 31, 2022, including the related notes, and the financial highlights for each of the three years in the period ended October 31, 2022 (collectively referred to as the “financial statements”). In our opinion, the financial statements present fairly, in all material respects, the financial position of the Fund as of October 31, 2022, the results of its operations for the year then ended, the changes in its net assets for each of the two years in the period ended October 31 2022 and the financial highlights for each of the three years in the period ended October 31, 2022 in conformity with accounting principles generally accepted in the United States of America.
The financial statements of the Fund as of and for the year ended October 31, 2019 and the financial highlights for each of the periods ended on or prior to October 31, 2019 (not presented herein, other than the financial highlights) were audited by other auditors whose report dated December 19, 2019 expressed an unqualified opinion on those financial statements and financial highlights.
Basis for Opinion
These financial statements are the responsibility of the Fund’s management. Our responsibility is to express an opinion on the Fund’s financial statements based on our audits. We are a public accounting firm registered with the Public Company Accounting Oversight Board (United States) (PCAOB) and are required to be independent with respect to the Fund in accordance with the U.S. federal securities laws and the applicable rules and regulations of the Securities and Exchange Commission and the PCAOB.
We conducted our audits of these financial statements in accordance with the standards of the PCAOB. Those standards require that we plan and perform the audit to obtain reasonable assurance about whether the financial statements are free of material misstatement, whether due to error or fraud.
Our audits included performing procedures to assess the risks of material misstatement of the financial statements, whether due to error or fraud, and performing procedures that respond to those risks. Such procedures included examining, on a test basis, evidence regarding the amounts and disclosures in the financial statements. Our audits also included evaluating the accounting principles used and significant estimates made by management, as well as evaluating the overall presentation of the financial statements. Our procedures included confirmation of securities owned as of October 31, 2022 by correspondence with the custodian, transfer agent and brokers; when replies were not received from brokers, we performed other auditing procedures. We believe that our audits provide a reasonable basis for our opinion.
/s/PricewaterhouseCoopers LLP
New York, New York
December 19, 2022
We have served as the auditor of one or more investment companies in the PGIM Retail Funds complex since 2020.
104
Tax Information (unaudited)
For the year ended October 31, 2022, the Fund reports the maximum amount allowable but not less than 50.89% as interest related dividends in accordance with Section 871(k)(1) and 881(e)(1) of the Internal Revenue Code.
In January 2023, you will be advised on IRS Form 1099-DIV or substitute Form 1099-DIV as to the federal tax status of the distributions received by you in calendar year 2022.
We are required by Massachusetts, Missouri and Oregon to inform you that dividends which have been derived from interest on federal obligations are not taxable to shareholders provided the Fund meets certain requirements mandated by the respective state’s taxing authorities. We are pleased to report that 11.98% of the dividends paid by the Fund qualifies for such deduction.
Please consult your tax adviser or state/local authorities to properly report this information on your tax return. If you have any questions concerning the amounts listed above, please call your financial adviser.
PGIM Absolute Return Bond Fund 105
INFORMATION ABOUT BOARD MEMBERS AND OFFICERS (unaudited)
Information about Board Members and Officers of the Fund is set forth below. Board Members who are not deemed to be “interested persons” of the Fund, as defined in the 1940 Act, are referred to as “Independent Board Members.” Board Members who are deemed to be “interested persons” of the Fund are referred to as “Interested Board Members.” The Board Members are responsible for the overall supervision of the operations of the Fund and perform the various duties imposed on the directors of investment companies by the 1940 Act. The Board in turn elects the Officers, who are responsible for administering the day-to-day operations of the Fund.
| | | | | | |
| Independent Board Members |
| | | | |
Name Year of Birth Position(s) Portfolios Overseen | | Principal Occupation(s) During Past Five Years | | Other Directorships Held During Past Five Years | | Length of
Board Service |
| | | | |
Ellen S. Alberding 1958 Board Member Portfolios Overseen: 97 | | President and Board Member, The Joyce Foundation (charitable foundation) (since 2002); formerly Vice Chair, City Colleges of Chicago (community college system) (2011-2015); Trustee, National Park Foundation (charitable foundation for national park system) (2009-2018); Trustee, Economic Club of Chicago (2009-2016); Trustee, Loyola University (since 2018). | | None. | | Since September 2013 |
| | | | |
Kevin J. Bannon 1952 Board Member Portfolios Overseen: 97 | | Retired; formerly Managing Director (April 2008-May 2015) and Chief Investment Officer (October 2008-November 2013) of Highmount Capital LLC (registered investment adviser); formerly Executive Vice President and Chief Investment Officer (April 1993-August 2007) of Bank of New York Company; President (May 2003-May 2007) of BNY Hamilton Family of Mutual Funds. | | Director of Urstadt Biddle Properties (equity real estate investment trust) (since September 2008). | | Since July 2008 |
PGIM Absolute Return Bond Fund
| | | | | | |
| Independent Board Members |
| | | | |
Name
Year of Birth
Position(s)
Portfolios Overseen | | Principal Occupation(s)
During Past Five Years | | Other Directorships
Held During
Past Five Years | | Length of
Board Service |
| | | | |
Linda W. Bynoe 1952 Board Member Portfolios Overseen: 94 | | President and Chief Executive Officer (since March 1995) and formerly Chief Operating Officer (December 1989-February 1995) of Telemat Limited LLC (formerly Telemat Ltd) (management consulting); formerly Vice President (January 1985-June 1989) at Morgan Stanley & Co. (broker-dealer). | | Trustee of Equity Residential (residential real estate) (since December 2009); Director of Northern Trust Corporation (financial services) (since April 2006); formerly Director of Anixter International, Inc. (communication products distributor) (January 2006-June 2020). | | Since March 2005 |
| | | | |
Barry H. Evans 1960 Board Member Portfolios Overseen: 96 | | Retired; formerly President (2005-2016), Global Chief Operating Officer (2014-2016), Chief Investment Officer - Global Head of Fixed Income (1998-2014), and various portfolio manager roles (1986-2006), Manulife Asset Management (asset management). | | Formerly Director, Manulife Trust Company (2011-2018); formerly Director, Manulife Asset Management Limited (2015-2017); formerly Chairman of the Board of Directors of Manulife Asset Management U.S. (2005-2016); formerly Chairman of the Board, Declaration Investment Management and Research (2008-2016). | | Since September 2017 |
| | | | |
Keith F. Hartstein 1956 Board Member & Independent Chair Portfolios Overseen: 97 | | Retired; Member (November 2014-September 2022) of the Governing Council of the Independent Directors Council (IDC) (organization of independent mutual fund directors); formerly Executive Committee of the IDC Board of Governors (October 2019-December 2021); formerly President and Chief Executive Officer (2005-2012), Senior Vice President (2004-2005), Senior Vice President of Sales and Marketing (1997-2004), and various executive management positions (1990-1997), John Hancock Funds, LLC (asset management); Chairman, Investment Company Institute’s Sales Force Marketing Committee (2003-2008). | | None. | | Since September 2013 |
Visit our website at pgim.com/investments
| | | | | | |
| Independent Board Members |
| | | | |
Name
Year of Birth
Position(s)
Portfolios Overseen | | Principal Occupation(s)
During Past Five Years | | Other Directorships
Held During
Past Five Years | | Length of
Board Service |
| | | | |
Laurie Simon Hodrick 1962 Board Member Portfolios Overseen: 93 | | A. Barton Hepburn Professor Emerita of Economics in the Faculty of Business, Columbia Business School (since 2018); Visiting Fellow at the Hoover Institution, Stanford University (since 2015); Sole Member, ReidCourt LLC (since 2008) (a consulting firm); formerly Visiting Professor of Law, Stanford Law School (2015-2021); formerly A. Barton Hepburn Professor of Economics in the Faculty of Business, Columbia Business School (1996-2017); formerly Managing Director, Global Head of Alternative Investment Strategies, Deutsche Bank (2006-2008). | | Independent Director, Andela (since January 2022) (global talent network); Independent Director, Roku (since December 2020) (communication services); formerly Independent Director, Synnex Corporation (2019-2021) (information technology); formerly Independent Director, Kabbage, Inc. (2018-2020) (financial services); formerly Independent Director, Corporate Capital Trust (2017-2018) (a business development company). | | Since September 2017 |
| | | | |
Brian K. Reid 1961 Board Member Portfolios Overseen: 96 | | Retired; formerly Chief Economist for the Investment Company Institute (ICI) (2005-2017); formerly Senior Economist and Director of Industry and Financial Analysis at the ICI (1998-2004); formerly Senior Economist, Industry and Financial Analysis at the ICI (1996-1998); formerly Staff Economist at the Federal Reserve Board (1989-1996); Director, ICI Mutual Insurance Company (2012-2017). | | None. | | Since March 2018 |
PGIM Absolute Return Bond Fund
| | | | | | |
| Independent Board Members |
| | | | |
Name
Year of Birth
Position(s)
Portfolios Overseen | | Principal Occupation(s)
During Past Five Years | | Other Directorships
Held During
Past Five Years | | Length of
Board Service |
| | | | |
Grace C. Torres 1959 Board Member Portfolios Overseen: 96 | | Retired; formerly Treasurer and Principal Financial and Accounting Officer of the PGIM Funds, Target Funds, Advanced Series Trust, Prudential Variable Contract Accounts and The Prudential Series Fund (1998-June 2014); Assistant Treasurer (March 1999-June 2014) and Senior Vice President (September 1999-June 2014) of PGIM Investments LLC; Assistant Treasurer (May 2003-June 2014) and Vice President (June 2005-June 2014) of AST Investment Services, Inc.; Senior Vice President and Assistant Treasurer (May 2003-June 2014) of Prudential Annuities Advisory Services, Inc. | | Director (since January 2018) of OceanFirst Financial Corp. and OceanFirst Bank; formerly Director (July 2015-January 2018) of Sun Bancorp, Inc. N.A. and Sun National Bank. | | Since November 2014 |
Visit our website at pgim.com/investments
| | | | | | |
| Interested Board Members |
| | | | |
Name
Year of Birth
Position(s)
Portfolios Overseen | | Principal Occupation(s)
During Past Five Years | | Other Directorships
Held During
Past Five Years | | Length of
Board Service |
| | | | |
Stuart S. Parker 1962 Board Member & President Portfolios Overseen: 96 | | President, Chief Executive Officer, Chief Operating Officer and Officer in Charge of PGIM Investments LLC (formerly known as Prudential Investments LLC) (since January 2012); President and Principal Executive Officer (“PEO”) (since September 2022) of the PGIM Private Credit Fund; President and PEO (since March 2022) of the PGIM Private Real Estate Fund, Inc.; formerly Executive Vice President of Jennison Associates LLC and Head of Retail Distribution of PGIM Investments LLC (June 2005-December 2011); Investment Company Institute - Board of Governors (since May 2012). | | None. | | Since January 2012 |
| | | | |
Scott E. Benjamin 1973 Board Member & Vice President Portfolios Overseen: 97 | | Executive Vice President (since May 2009) of PGIM Investments LLC; Vice President (since June 2012) of Prudential Investment Management Services LLC; Executive Vice President (since September 2009) of AST Investment Services, Inc.; Senior Vice President of Product Development and Marketing, PGIM Investments (since February 2006); Vice President (since September 2022) of the PGIM Private Credit Fund; Vice President (since March 2022) of the PGIM Private Real Estate Fund, Inc.; formerly Vice President of Product Development and Product Management, PGIM Investments LLC (2003-2006). | | None. | | Since March 2010 |
PGIM Absolute Return Bond Fund
| | | | |
| Fund Officers(a) | | | | |
| | | |
Name
Year of Birth
Fund Position | | Principal Occupation(s) During Past Five Years | | Length of Service as Fund Officer |
| | | |
Claudia DiGiacomo 1974 Chief Legal Officer | | Chief Legal Officer (since September 2022) of the PGIM Private Credit Fund; Chief Legal Officer (since July 2022) of the PGIM Private Real Estate Fund, Inc.; Chief Legal Officer, Executive Vice President and Secretary of PGIM Investments LLC (since August 2020); Chief Legal Officer of Prudential Mutual Fund Services LLC (since August 2020); Chief Legal Officer of PIFM Holdco, LLC (since August 2020); Vice President and Corporate Counsel (since January 2005) of Prudential; and Corporate Counsel of AST Investment Services, Inc. (since August 2020); formerly Vice President and Assistant Secretary of PGIM Investments LLC (2005-2020); formerly Associate at Sidley Austin Brown & Wood LLP (1999-2004). | | Since December 2005 |
| | | |
Isabelle Sajous 1976 Chief Compliance Officer | | Chief Compliance Officer (since April 2022) of PGIM Investments LLC, the PGIM Funds, Target Funds, PGIM ETF Trust, PGIM Global High Yield Fund, Inc., PGIM High Yield Bond Fund, Inc., PGIM Short Duration High Yield Opportunities Fund, Advanced Series Trust, The Prudential Series Fund and Prudential’s Gibraltar Fund, Inc.; Chief Compliance Officer (since September 2022) of the PGIM Private Credit Fund; Chief Compliance Officer (since March 2022) of the PGIM Private Real Estate Fund, Inc.; Vice President, Compliance of PGIM Investments LLC (since December 2020); formerly Director, Compliance (July 2018-December 2020) of Credit Suisse Asset Management LLC; and Vice President, Associate General Counsel & Deputy Chief Compliance Officer of Cramer Rosenthal McGlynn, LLC (August 2014-July 2018). | | Since April 2022 |
| | | |
Andrew R. French 1962 Secretary | | Vice President (since December 2018) of PGIM Investments LLC; Secretary (since September 2022) of the PGIM Private Credit Fund; Secretary (since March 2022) of the PGIM Private Real Estate Fund, Inc.; formerly Vice President and Corporate Counsel (2010-2018) of Prudential; formerly Director and Corporate Counsel (2006-2010) of Prudential; Vice President and Assistant Secretary (since January 2007) of PGIM Investments LLC; Vice President and Assistant Secretary (since January 2007) of Prudential Mutual Fund Services LLC. | | Since October 2006 |
| | | |
Melissa Gonzalez 1980 Assistant Secretary | | Vice President and Corporate Counsel (since September 2018) of Prudential; Vice President and Assistant Secretary (since August 2020) of PGIM Investments LLC; Assistant Secretary (since September 2022) of the PGIM Private Credit Fund; Assistant Secretary (since March 2022) of the PGIM Private Real Estate Fund, Inc.; formerly Director and Corporate Counsel (March 2014-September 2018) of Prudential. | | Since March 2020 |
Visit our website at pgim.com/investments
| | | | |
| Fund Officers(a) | | | | |
| | | |
Name
Year of Birth
Fund Position | | Principal Occupation(s) During Past Five Years | | Length of Service as Fund Officer |
| | | |
Patrick E. McGuinness 1986 Assistant Secretary | | Vice President and Assistant Secretary (since August 2020) of PGIM Investments LLC; Director and Corporate Counsel (since February 2017) of Prudential; Assistant Secretary (since September 2022) of the PGIM Private Credit Fund; Assistant Secretary (since March 2022) of the PGIM Private Real Estate Fund, Inc. | | Since June 2020 |
| | | |
Debra Rubano 1975 Assistant Secretary | | Vice President and Corporate Counsel (since November 2020) of Prudential; Assistant Secretary (since September 2022) of the PGIM Private Credit Fund; Assistant Secretary (since March 2022) of the PGIM Private Real Estate Fund, Inc; formerly Director and Senior Counsel of Allianz Global Investors U.S. Holdings LLC (2010-2020) and Assistant Secretary of numerous funds in the Allianz fund complex (2015-2020). | | Since December 2020 |
| | | |
Kelly A. Coyne 1968 Assistant Secretary | | Director, Investment Operations of Prudential Mutual Fund Services LLC (since 2010); Assistant Secretary (since September 2022) of the PGIM Private Credit Fund; Assistant Secretary (since March 2022) of the PGIM Private Real Estate Fund, Inc. | | Since March 2015 |
| | | |
Christian J. Kelly 1975 Treasurer and Principal Financial and Accounting Officer | | Vice President, Head of Fund Administration of PGIM Investments LLC (since November 2018); Principal Financial Officer (since September 2022) of the PGIM Private Credit Fund; Principal Financial Officer (since March 2022) of the PGIM Private Real Estate Fund, Inc.; formerly, Treasurer and Principal Accounting Officer (March 2022- July 2022) of the PGIM Private Real Estate Fund, Inc.; formerly Director of Fund Administration of Lord Abbett & Co. LLC (2009-2018), Treasurer and Principal Accounting Officer of the Lord Abbett Family of Funds (2017-2018); Director of Accounting, Avenue Capital Group (2008-2009); Senior Manager, Investment Management Practice of Deloitte & Touche LLP (1998-2007). | | Since January 2019 |
| | | |
Lana Lomuti 1967 Assistant Treasurer | | Vice President (since 2007) and Director (2005-2007), within PGIM Investments Fund Administration; formerly Assistant Treasurer (December 2007-February 2014) of The Greater China Fund, Inc. | | Since April 2014 |
| | | |
Russ Shupak 1973 Assistant Treasurer | | Vice President (since 2017) and Director (2013-2017), within PGIM Investments Fund Administration; Treasurer and Principal Accounting Officer (since July 2022) of the PGIM Private Real Estate Fund, Inc.; Assistant Treasurer (since September 2022) of the PGIM Private Credit Fund; formerly Assistant Treasurer (March 2022 – July 2022) of the PGIM Private Real Estate Fund, Inc. | | Since October 2019 |
| | | |
Deborah Conway 1969 Assistant Treasurer | | Vice President (since 2017) and Director (2007-2017), within PGIM Investments Fund Administration. | | Since October 2019 |
PGIM Absolute Return Bond Fund
| | | | |
| Fund Officers(a) | | | | |
| | | |
Name
Year of Birth
Fund Position | | Principal Occupation(s) During Past Five Years | | Length of Service as Fund Officer |
| | | |
Elyse M. McLaughlin 1974 Assistant Treasurer | | Vice President (since 2017) and Director (2011-2017), within PGIM Investments Fund Administration; Treasurer and Principal Accounting Officer (since September 2022) of the PGIM Private Credit Fund; Assistant Treasurer (since March 2022) of the PGIM Private Real Estate Fund, Inc. | | Since October 2019 |
| | | |
Kelly Florio 1978 Anti-Money Laundering Compliance Officer | | Vice President, Corporate Compliance, Global Compliance Programs and Compliance Risk Management (since December 2021) of Prudential; formerly, Head of Fraud Risk Management (October 2019 to December 2021) at New York Life Insurance Company; formerly, Head of Key Risk Area Operations (November 2018 to October 2019), Director of the US Anti-Money Laundering Compliance Unit (2009-2018) and Bank Loss Prevention Associate (2006 -2009) at MetLife. | | Since June 2022 |
(a) Excludes Mr. Parker and Mr. Benjamin, interested Board Members who also serve as President and Vice President, respectively.
Explanatory Notes to Tables:
| ∎ | Board Members are deemed to be “Interested,” as defined in the 1940 Act, by reason of their affiliation with PGIM Investments LLC and/or an affiliate of PGIM Investments LLC. |
| ∎ | Unless otherwise noted, the address of all Board Members and Officers is c/o PGIM Investments LLC, 655 Broad Street, Newark, New Jersey 07102-4410. |
| ∎ | There is no set term of office for Board Members or Officers. The Board Members have adopted a retirement policy, which calls for the retirement of Board Members on December 31 of the year in which they reach the age of 75. |
| ∎ | Other Directorships Held” includes all directorships of companies required to register or file reports with the SEC under the 1934 Act (that is, “public companies”) or other investment companies registered under the 1940 Act. |
| ∎ | “Portfolios Overseen” includes all investment companies managed by PGIM Investments LLC. The investment companies for which PGIM Investments LLC serves as manager include the PGIM Mutual Funds, Target Funds, The Prudential Variable Contract Accounts, PGIM ETF Trust, PGIM Private Real Estate Fund, Inc., PGIM Private Credit Fund, PGIM High Yield Bond Fund, Inc., PGIM Global High Yield Fund, Inc., PGIM Short Duration High Yield Opportunities Fund, The Prudential Series Fund, Prudential’s Gibraltar Fund, Inc. and the Advanced Series Trust. |
| ∎ | As used in the Fund Officers table “Prudential” means The Prudential Insurance Company of America. |
Visit our website at pgim.com/investments
Approval of Advisory Agreements (unaudited)
The Fund’s Board of Trustees
The Board of Trustees (the “Board”) of PGIM Absolute Return Bond Fund (the “Fund”)1 consists of ten individuals, eight of whom are not “interested persons” of the Fund, as defined in the Investment Company Act of 1940, as amended (the “1940 Act”) (the “Independent Trustees”). The Board is responsible for the oversight of the Fund and its operations, and performs the various duties imposed on the directors of investment companies by the 1940 Act. The Independent Trustees have retained independent legal counsel to assist them in connection with their duties. The Chair of the Board is an Independent Trustee. The Board has established five standing committees: the Audit Committee, the Nominating and Governance Committee, the Compliance Committee and two Investment Committees. Each committee is chaired by, and composed of, Independent Trustees.
Annual Approval of the Fund’s Advisory Agreements
As required under the 1940 Act, the Board determines annually whether to renew the Fund’s management agreement with PGIM Investments LLC (“PGIM Investments”), the Fund’s subadvisory agreement with PGIM, Inc. (“PGIM”) on behalf of its PGIM Fixed Income unit (“PGIM Fixed Income”), and the Fund’s sub-subadvisory agreement with PGIM Limited (“PGIML”). In considering the renewal of the agreements, the Board, including all of the Independent Trustees, met on May 26 and June 7-9, 2022 (the “Board Meeting”) and approved the renewal of the agreements through July 31, 2023, after concluding that the renewal of the agreements was in the best interests of the Fund and its shareholders.
In advance of the meetings, the Board requested and received materials relating to the agreements, and had the opportunity to ask questions and request further information in connection with its consideration. Among other things, the Board considered comparative fee information from PGIM Investments, PGIM, and where appropriate, affiliates of PGIM. Also, the Board considered comparisons with other mutual funds in relevant Peer Universes and Peer Groups, as is further discussed below.
In approving the agreements, the Board, including the Independent Trustees advised by independent legal counsel, considered the factors it deemed relevant, including the nature, quality and extent of services provided by PGIM Investments, the subadviser, and, as relevant, its affiliates, the performance of the Fund, the profitability of PGIM Investments and its affiliates, expenses and fees, and the potential for economies of scale that may be shared with the Fund and its shareholders as the Fund’s assets grow. In their deliberations, the Trustees did not identify any single factor which alone was responsible for the Board’s decision to approve the agreements with respect to the Fund. In connection with its deliberations, the Board considered information provided by PGIM Investments throughout the year at regular Board meetings, presentations from portfolio managers and other information, as well as information furnished at or in advance of the Board Meeting.
| 1 | PGIM Absolute Return Bond Fund is a series of Prudential Investment Portfolios 9. |
PGIM Absolute Return Bond Fund
Approval of Advisory Agreements (continued)
The Trustees determined that the overall arrangements between the Fund and PGIM Investments, which serves as the Fund’s investment manager pursuant to a management agreement, between PGIM Investments and PGIM, which, through its PGIM Fixed Income unit, serves as the Fund’s subadviser pursuant to the terms of a subadvisory agreement with PGIM Investments, and between PGIM and PGIML, which serves as the Fund’s sub-subadviser pursuant to the terms of a sub-subadvisory agreement with PGIM, are in the best interests of the Fund and its shareholders in light of the services performed, fees charged and such other matters as the Trustees considered relevant in the exercise of their business judgment.
The material factors and conclusions that formed the basis for the Trustees’ reaching their determinations to approve the continuance of the agreements are separately discussed below.
Nature, Quality and Extent of Services
The Board received and considered information regarding the nature, quality and extent of services provided to the Fund by PGIM Investments, PGIM Fixed Income, and PGIML. The Board noted that PGIM Fixed Income and PGIML are affiliated with PGIM Investments. The Board considered the services provided by PGIM Investments, including but not limited to the oversight of the subadviser and sub-subadviser for the Fund, as well as the provision of fund recordkeeping, compliance and other services to the Fund, and PGIM Investments’ role as administrator for the Fund’s liquidity risk management program. With respect to PGIM Investments’ oversight of the subadviser and sub-subadviser, the Board noted that PGIM Investments’ Strategic Investment Research Group (“SIRG”), which is a business unit of PGIM Investments, is responsible for monitoring and reporting to PGIM Investments senior management on the performance and operations of the subadviser and sub-subadviser. The Board also considered that PGIM Investments pays the salaries of all of the officers and interested Trustees of the Fund who are part of Fund management. The Board also considered the investment subadvisory services provided by PGIM Fixed Income and PGIML, including investment research and security selection, as well as adherence to the Fund’s investment restrictions and compliance with applicable Fund policies and procedures. The Board considered PGIM Investments’ evaluation of the subadviser and sub-subadviser, as well as PGIM Investments’ recommendation, based on its review of the subadviser and sub-subadviser, to renew the subadvisory and sub-subadvisory agreements.
The Board considered the qualifications, backgrounds and responsibilities of PGIM Investments’ senior management responsible for the oversight of the Fund, PGIM Fixed Income, and PGIML, and also considered the qualifications, backgrounds and responsibilities of PGIM Fixed Income’s portfolio managers who are responsible for the day-to-day management of the Fund’s portfolio. The Board was provided with information pertaining to PGIM Investments’, PGIM Fixed Income’s, and PGIML’s organizational structure, senior management, investment operations, and other relevant
Visit our website at pgim.com/investments
information pertaining to PGIM Investments, PGIM Fixed Income, and PGIML. The Board also noted that it received favorable compliance reports from the Fund’s Chief Compliance Officer (“CCO”) as to PGIM Investments, PGIM Fixed Income, and PGIML.
The Board concluded that it was satisfied with the nature, extent and quality of the investment management services provided by PGIM Investments, the subadvisory services provided to the Fund by PGIM Fixed Income, and the sub-subadvisory services provided by PGIML, and that there was a reasonable basis on which to conclude that the Fund benefits from the services provided by PGIM Investments, PGIM Fixed Income, and PGIML under the management, subadvisory and sub-subadvisory agreements.
Costs of Services and Profits Realized by PGIM Investments
The Board was provided with information on the profitability of PGIM Investments and its affiliates in serving as the Fund’s investment manager. The Board discussed with PGIM Investments the methodology utilized in assembling the information regarding profitability and considered its reasonableness. The Board recognized that it is difficult to make comparisons of profitability from fund management contracts because comparative information is not generally publicly available and is affected by numerous factors, including the structure of the particular adviser, the types of funds it manages, its business mix, numerous assumptions regarding allocations and the adviser’s capital structure and cost of capital. Taking these factors into account, the Board concluded that the profitability of PGIM Investments and its affiliates in relation to the services rendered was not unreasonable.
Economies of Scale
The Board received and discussed information concerning economies of scale that PGIM Investments may realize as the Fund’s assets grow beyond current levels. The Board noted that the management fee schedule for the Fund includes breakpoints, which have the effect of decreasing the fee rate as assets increase. During the course of time, the Board has considered information regarding the launch date of the Fund, the management fees of the Fund compared to those of similarly managed funds and PGIM Investments’ investment in the Fund over time. The Board noted that economies of scale can be shared with the Fund in other ways, including low management fees from inception, additional technological and personnel investments to enhance shareholder services, and maintaining existing expense structures in the face of a rising cost environment. The Board also considered PGIM Investments’ assertion that it continually evaluates the management fee schedule of the Fund and the potential to share economies of scale through breakpoints or fee waivers as asset levels increase.
The Board recognized the inherent limitations of any analysis of economies of scale, stemming largely from the Board’s understanding that most of PGIM Investments’ costs are not specific to individual funds, but rather are incurred across a variety of products and services.
PGIM Absolute Return Bond Fund
Approval of Advisory Agreements (continued)
Other Benefits to PGIM Investments, PGIM Fixed Income, and PGIML
The Board considered potential ancillary benefits that might be received by PGIM Investments, PGIM Fixed Income, PGIML and their affiliates as a result of their relationship with the Fund. The Board concluded that potential benefits to be derived by PGIM Investments included transfer agency fees received by the Fund’s transfer agent (which is affiliated with PGIM Investments), as well as benefits to its reputation or other intangible benefits resulting from PGIM Investments’ association with the Fund. The Board concluded that the potential benefits to be derived by PGIM Fixed Income and PGIML included the ability to use soft dollar credits, as well as the potential benefits consistent with those generally resulting from an increase in assets under management, specifically, potential access to additional research resources and benefits to their reputations. The Board concluded that the benefits derived by PGIM Investments, PGIM Fixed Income, and PGIML were consistent with the types of benefits generally derived by investment managers and subadvisers to mutual funds.
Performance of the Fund / Fees and Expenses
The Board considered certain additional factors and made related conclusions relating to the historical performance of the Fund for the one, three-, and five-year periods ended December 31, 2021.
The Board also considered the Fund’s actual management fee, as well as the Fund’s net total expense ratio, for the fiscal year ended October 31, 2021. The Board considered the management fee for the Fund as compared to the management fee charged by PGIM Investments to other funds and the fee charged by other advisers to comparable mutual funds in a Peer Group. The actual management fee represents the fee rate actually paid by Fund shareholders and includes any fee waivers or reimbursements. The net total expense ratio for the Fund represents the actual expense ratio incurred by Fund shareholders.
The mutual funds included in the Peer Universe, which was used to consider performance, and the Peer Group, which was used to consider expenses and fees, were objectively determined by Broadridge, an independent provider of mutual fund data. In certain circumstances, PGIM Investments also provided supplemental Peer Universe or Peer Group information, for reasons addressed with the Board. The comparisons placed the Fund in various quartiles over various periods, with the first quartile being the best 25% of the mutual funds (for performance, the best performing mutual funds and, for expenses, the lowest cost mutual funds).
The section below summarizes key factors considered by the Board and the Board’s conclusions regarding the Fund’s performance, fees and overall expenses. The table sets forth net performance comparisons (which reflect the impact on performance of fund expenses, or any subsidies, expense caps or waivers that may be applicable) with the Peer Universe, actual management fees with the Peer Group (which reflect the impact of any subsidies or fee waivers), and net total expenses with the Peer Group, each of which were key factors considered by the Board.
Visit our website at pgim.com/investments
| | | | | | | | |
| | | | | |
Net Performance | | 1 Year | | 3 Years | | 5 Years | | 10 Years |
| | 1st Quartile | | 3rd Quartile | | 2nd Quartile | | 2nd Quartile |
| Actual Management Fees: 2nd Quartile | | |
Net Total Expenses: 1st Quartile | | |
| | • | | The Board noted that the Fund outperformed its benchmark index over all periods. |
| | • | | The Board and PGIM Investments agreed to retain the existing contractual expense cap, which (exclusive of certain fees and expenses) caps total annual operating expenses at 0.70% for Class R6 shares, and 0.73% for Class Z shares through February 28, 2023. |
| | • | | In addition, PGIM Investments will waive management fees or shared operating expenses on any share class to the same extent that it waives such expenses on any other share class, and has agreed that total annual fund operating expenses for Class R6 shares will not exceed total annual fund operating expenses for Class Z shares. |
| | • | | The Board concluded that, in light of the above, it would be in the best interests of the Fund and its shareholders to renew the agreements. |
| | • | | The Board concluded that the management fees (including subadvisory fees) and total expenses were reasonable in light of the services provided. |
* * *
After full consideration of these factors, the Board concluded that the approval of the agreements was in the best interests of the Fund and its shareholders.
PGIM Absolute Return Bond Fund
| | | | |
| | | |
⬛ MAIL 655 Broad Street Newark, NJ 07102 | | ⬛ TELEPHONE (800) 225-1852 | | ⬛ WEBSITE pgim.com/investments |
PROXY VOTING
The Board of Trustees of the Fund has delegated to the Fund’s subadviser the responsibility for voting any proxies and maintaining proxy recordkeeping with respect to the Fund. A description of these proxy voting policies and procedures is available without charge, upon request, by calling (800) 225-1852 or by visiting the Securities and Exchange Commission’s website at sec.gov. Information regarding how the Fund voted proxies relating to portfolio securities during the most recent 12-month period ended June 30 is available on the Fund’s website and on the Securities and Exchange Commission’s website.
TRUSTEES
Ellen S. Alberding ● Kevin J. Bannon ● Scott E. Benjamin ● Linda W. Bynoe ● Barry H. Evans ● Keith F. Hartstein ● Laurie Simon Hodrick ● Stuart S. Parker ● Brian K. Reid ● Grace C. Torres
OFFICERS
Stuart S. Parker, President ● Scott E. Benjamin, Vice President ● Christian J. Kelly, Treasurer and Principal Financial and Accounting Officer ● Claudia DiGiacomo, Chief Legal Officer ● Isabelle Sajous, Chief Compliance Officer ● Kelly Florio, Anti-Money Laundering Compliance Officer ● Andrew R. French, Secretary ● Melissa Gonzalez, Assistant Secretary ● Kelly A. Coyne, Assistant Secretary ● Patrick E. McGuinness, Assistant Secretary ● Debra Rubano, Assistant Secretary ● Lana Lomuti, Assistant Treasurer ● Russ Shupak, Assistant Treasurer ● Elyse M. McLaughlin, Assistant Treasurer ● Deborah Conway, Assistant Treasurer
| | | | |
MANAGER | | PGIM Investments LLC | | 655 Broad Street |
| | | | | Newark, NJ 07102 |
| | |
SUBADVISER | | PGIM Fixed Income | | 655 Broad Street |
| | | | Newark, NJ 07102 |
| | |
SUB-SUBADVISER | | PGIM Limited | | Grand Buildings, 1-3 Strand |
| | | | Trafalgar Square |
| | | | London, WC2N 5HR |
| | | | | United Kingdom |
| | |
DISTRIBUTOR | | Prudential Investment | | 655 Broad Street |
| | | Management Services LLC | | Newark, NJ 07102 |
| | |
CUSTODIAN | | The Bank of New York Mellon | | 240 Greenwich Street New York, NY 10286 |
| | |
TRANSFER AGENT | | Prudential Mutual Fund | | PO Box 9658 |
| | | Services LLC | | Providence, RI 02940 |
| | |
| INDEPENDENT REGISTERED PUBLIC ACCOUNTING FIRM | | PricewaterhouseCoopers LLP | | 300 Madison Avenue New York, NY 10017 |
| | | |
FUND COUNSEL | | Willkie Farr & Gallagher LLP | | 787 Seventh Avenue New York, NY 10019 |
An investor should consider the investment objectives, risks, charges, and expenses of the Fund carefully before investing. The prospectus and summary prospectus contain this and other information about the Fund. An investor may obtain the prospectus and summary prospectus by visiting our website at pgim.com/investments or by calling (800) 225-1852. The prospectus and summary prospectus should be read carefully before investing.
E-DELIVERY
To receive your mutual fund documents online, go to pgim.com/investments/resource/edelivery and enroll. Instead of receiving printed documents by mail, you will receive notification via email when new materials are available. You can cancel your enrollment or change your email address at any time by visiting the website address above.
SHAREHOLDER COMMUNICATIONS WITH TRUSTEES
Shareholders can communicate directly with the Board of Trustees by writing to the Chair of the Board, PGIM Absolute Return Bond Fund, PGIM Investments, Attn: Board of Trustees, 655 Broad Street, Newark, NJ 07102. Shareholders can communicate directly with an individual Trustee by writing to that Trustee at the same address. Communications are not screened before being delivered to the addressee.
AVAILABILITY OF PORTFOLIO HOLDINGS
The Fund files its complete schedule of portfolio holdings with the Securities and Exchange Commission for the first and third quarters of each fiscal year as an exhibit to its reports on Form N-PORT. The Fund’s Form N-PORT filings are available on the Commission’s website at sec.gov.
The Fund’s Statement of Additional Information contains additional information about the Fund’s Trustees and is available without charge, upon request, by calling (800) 225-1852.
Mutual Funds:
| | | | |
| | | |
ARE NOT INSURED BY THE FDIC OR ANY FEDERAL GOVERNMENT AGENCY | | MAY LOSE VALUE | | ARE NOT A DEPOSIT OF OR GUARANTEED BY ANY BANK OR ANY BANK AFFILIATE |
PGIM ABSOLUTE RETURN BOND FUND
| | | | | | | | | | | | | | | | | | |
| | | | | |
| SHARE CLASS | | | | A | | | C | | | Z | | | R6 | |
| | | | | |
NASDAQ | | | | | PADAX | | | | PADCX | | | | PADZX | | | | PADQX | |
CUSIP | | | | | 74441J852 | | | | 74441J845 | | | | 74441J829 | | | | 74441J837 | |
MF213E

PGIM QUANT SOLUTIONS LARGE-CAP CORE FUND
ANNUAL REPORT
OCTOBER 31, 2022

To enroll in e-delivery, go to pgim.com/investments/resource/edelivery
Table of Contents
This report is not authorized for distribution to prospective investors unless preceded or accompanied by a current prospectus.
The views expressed in this report and information about the Fund’s portfolio holdings are for the period covered by this report and are subject to change thereafter.
Mutual funds are distributed by Prudential Investment Management Services LLC, a Prudential Financial company, member SIPC. PGIM Quantitative Solutions LLC, a wholly owned subsidiary of PGIM, Inc. (PGIM), is a registered investment adviser and Prudential Financial company. © 2022 Prudential Financial, Inc. and its related entities. PGIM and the PGIM logo are service marks of Prudential Financial, Inc. and its related entities, registered in many jurisdictions worldwide.
2 Visit our website at pgim.com/investments
Letter from the President
| | |
 | | Dear Shareholder: We hope you find the annual report for the PGIM Quant Solutions Large-Cap Core Fund informative and useful. The report covers performance for the 12-month period that ended October 31, 2022. The attention of the global economy and financial markets pivoted during the period from the COVID-19 pandemic to the challenge of rapidly rising inflation. While job growth remained strong, prices for a wide range of goods and services rose in response to economic re-openings, supply-chain disruptions, governmental stimulus, and Russia’s invasion of Ukraine. With inflation surging to a 40-year high, the Federal Reserve and other central banks aggressively hiked interest rates, prompting recession concerns. |
After rising to record levels at the end of 2021, stocks have fallen sharply in 2022 as investors worried about higher prices, slowing economic growth, geopolitical uncertainty, and new COVID-19 outbreaks. Equities rallied for a time during the summer but began falling again in late August on fears that the Fed would keep raising rates to tame inflation. For the entire 12-month period, equities suffered a broad-based global decline, although large-cap US stocks outperformed their small-cap counterparts. International developed and emerging markets trailed the US market during this time.
Rising rates and economic uncertainty drove fixed income prices broadly lower as well. US and global investment-grade bonds, along with US high yield corporate bonds and emerging market debt, all posted negative returns during the period.
Regarding your investments with PGIM, we believe it is important to maintain a diversified portfolio of funds consistent with your tolerance for risk, time horizon, and financial goals. Your financial advisor can help you create a diversified investment plan that may include funds covering all the basic asset classes and that reflects your personal investor profile and risk tolerance. However, diversification and asset allocation strategies do not assure a profit or protect against loss in declining markets.
At PGIM Investments, we provide access to active investment strategies across the global markets in the pursuit of consistent outperformance for investors. PGIM is the world’s 11th-largest investment manager with more than $1.5 trillion in assets under management. Our scale and investment expertise allow us to deliver a diversified suite of actively managed solutions across a broad spectrum of asset classes and investment styles.
Thank you for choosing our family of funds.
Sincerely,

Stuart S. Parker, President
PGIM Quant Solutions Large-Cap Core Fund
December 15, 2022
PGIM Quant Solutions Large-Cap Core Fund 3
Your Fund’s Performance (unaudited)
Performance data quoted represent past performance. Past performance does not guarantee future results. The investment return and principal value of an investment will fluctuate so that an investor’s shares, when redeemed, may be worth more or less than their original cost. Current performance may be lower or higher than the past performance data quoted. An investor may obtain performance data as of the most recent month-end by visiting our website at pgim.com/investments or by calling (800) 225-1852.
| | | | | | | | |
| |
| | | Average Annual Total Returns as of 10/31/22 |
| | | One Year (%) | | Five Years (%) | | Ten Years (%) | | Since Inception (%) |
| | | | |
Class A | | | | | | | | |
| | | | |
(with sales charges) | | -17.63 | | 7.33 | | 10.99 | | — |
| | | | |
(without sales charges) | | -12.84 | | 8.55 | | 11.62 | | — |
| | | | |
Class C | | | | | | | | |
| | | | |
(with sales charges) | | -14.19 | | 7.77 | | 10.80 | | — |
| | | | |
(without sales charges) | | -13.46 | | 7.77 | | 10.80 | | — |
| | | | |
Class Z | | | | | | | | |
| | | | |
(without sales charges) | | -12.54 | | 8.83 | | 11.90 | | — |
| | | | |
Class R6 | | | | | | | | |
| | | | |
(without sales charges) | | -12.52 | | 8.97 | | N/A | | 10.58 (12/28/2016) |
| | | | |
S&P 500 Index | | | | | | | | |
| | | | |
| | | -14.60 | | 10.44 | | 12.78 | | — |
| | | | | | | | |
Average Annual Total Returns as of 10/31/22 Since Inception (%) | | | | | | |
| | | | | | | | | Class R6 |
| | | | | | | | | (12/28/2016) |
| | | | |
S&P 500 Index | | | | | | | | 11.84 |
Since Inception returns are provided for any share class with less than 10 fiscal years of returns. Since Inception returns for the Index are measured from the closest month-end to the class’s inception date.
4 Visit our website at pgim.com/investments
Growth of a $10,000 Investment (unaudited)

The graph compares a $10,000 investment in the Fund’s Class Z shares with a similar investment in the S&P 500 Index by portraying the initial account values at the beginning of the 10-year period for Class Z shares (October 31, 2012) and the account values at the end of the current fiscal year (October 31, 2022), as measured on a quarterly basis. For purposes of the graph, and unless otherwise indicated, it has been assumed that (a) all recurring fees (including management fees) were deducted and (b) all dividends and distributions were reinvested. The line graph provides information for Class Z shares only. As indicated in the tables provided earlier, performance for other share classes will vary due to the differing fees and expenses applicable to each share class (as indicated in the following paragraphs). Without waiver of fees and/or expense reimbursements, if any, the returns would have been lower.
Past performance does not predict future performance. Total returns and the ending account values in the graphs include changes in share price and reinvestment of dividends and capital gains distributions in a hypothetical investment for the periods shown. The Fund’s total returns do not reflect the deduction of income taxes on an individual’s investment. Taxes may reduce your actual investment returns on income or gains paid by the Fund or any gains you may realize if you sell your shares.
PGIM Quant Solutions Large-Cap Core Fund 5
Your Fund’s Performance (continued)
The returns in the tables do not reflect the deduction of taxes that a shareholder would pay on Fund distributions or following the redemption of Fund shares. The average annual total returns take into account applicable sales charges, which are described for each share class in the table below.
| | | | | | | | |
| | | | | |
| | | Class A | | Class C | | Class Z | | Class R6 |
| | | | | |
| Maximum initial sales charge | | 5.50% of the public offering price | | None | | None | | None |
| Contingent deferred sales charge (CDSC) (as a percentage of the lower of the original purchase price or the net asset value at redemption) | | 1.00% on sales of $1 million or more made within 12 months of purchase | | 1.00% on sales made within 12 months of purchase | | None | | None |
| Annual distribution and service (12b-1) fees (shown as a percentage of average daily net assets) | | 0.30% (0.25% currently) | | 1.00% | | None | | None |
Benchmark Definition
S&P 500 Index*—The S&P 500 Index is an unmanaged index of over 500 stocks of large US public companies. It gives a broad look at how stock prices in the United States have performed.
*The S&P 500 Index is a product of S&P Dow Jones Indices LLC and/or its affiliates and has been licensed for use by PGIM, Inc. and/or its affiliates. Copyright © 2022 S&P Dow Jones Indices LLC, a division of S&P Global, Inc., and/or its affiliates. All rights reserved. Redistribution or reproduction in whole or in part are prohibited without written permission of S&P Dow Jones Indices LLC. For more information on any of S&P Dow Jones Indices LLC’s indices please visit www.spdji.com. S&P® is a registered trademark of S&P Global and Dow Jones® is a registered trademark of Dow Jones Trademark Holdings LLC.
Investors cannot invest directly in an index. The returns for the Index would be lower if they included the effects of sales charges, operating expenses of a mutual fund, or taxes that may be paid by an investor.
6 Visit our website at pgim.com/investments
Presentation of Fund Holdings as of 10/31/22
| | | | |
| | |
| Ten Largest Holdings | | Line of Business | | % of Net Assets |
| | |
Apple, Inc. | | Technology Hardware, Storage & Peripherals | | 6.5% |
| | |
Microsoft Corp. | | Software | | 5.3% |
| | |
Tesla, Inc. | | Automobiles | | 2.3% |
| | |
Amazon.com, Inc. | | Internet & Direct Marketing Retail | | 2.3% |
| | |
UnitedHealth Group, Inc. | | Health Care Providers & Services | | 2.0% |
| | |
Alphabet, Inc. (Class A Stock) | | Interactive Media & Services | | 1.9% |
| | |
Alphabet, Inc. (Class C Stock) | | Interactive Media & Services | | 1.8% |
| | |
Mastercard, Inc. (Class A Stock) | | IT Services | | 1.4% |
| | |
Merck & Co., Inc. | | Pharmaceuticals | | 1.3% |
| | |
PepsiCo, Inc. | | Beverages | | 1.3% |
Holdings reflect only long-term investments and are subject to change.
PGIM Quant Solutions Large-Cap Core Fund 7
Strategy and Performance Overview* (unaudited)
How did the Fund perform?
The PGIM Quantitative Solutions Large-Cap Core Fund’s Class Z shares returned – 12.54% in the 12-month reporting period that ended October 31, 2022, outperforming the – 14.60% return of the S&P 500 Index (the Index).
What were the market conditions?
| · | | Hawkish monetary policy aimed at curbing high inflation, coupled with rising energy prices stemming from the Russia-Ukraine conflict, heightened fears of a global recession. As a result, the Index fell more than 14% over the reporting period. |
| · | | While segments of overall inflation in the US showed signs of easing, stickier elements, such as rent, wages, and medical costs, remained elevated. Inflation data supported the raise-and-hold message on interest rates, prompting equity sell-offs. |
What worked?
Favoring inexpensive stocks with positive quality attributes relative to industry peers benefited the Fund during the first half of 2022, when negative equity performance in the Index was characterized by earnings-multiple contraction.
What didn’t work?
While inexpensive stocks performed well during the first half of 2022, efficacy waned during the third quarter, as investor anticipation of a downturn resulted in indiscriminate selling regardless of stock fundamentals. Strong growth-factor performance during this time period somewhat offset the detraction.
Did the Fund use derivatives?
The Fund held futures contracts on the Index. PGIM Quantitative Solutions used these instruments primarily to manage daily cash flows, provide liquidity, and equitize cash—not as a means of adding to performance. Consequently, the effect on Fund performance was minimal.
Current outlook
Despite continued market volatility brought on by numerous macro and geopolitical risks—which often cause stocks to deviate from their fundamental values—year-to-date relative returns remain very strong. Nevertheless, there are no shortage of risks in today’s markets. PGIM Quantitative Solutions is confident that its multi-factor approach, which not only provides exposure to a variety of value, growth, and quality factors but also emphasizes diversification and risk controls, will hold up well in these difficult market conditions.
* This strategy and performance overview, which discusses what strategies or holdings (including derivatives, if applicable) affected the Fund’s performance, is compiled based on how the Fund performed relative to the Fund’s benchmark index and is viewed for performance attribution purposes at the aggregate Fund level, which in most instances
8 Visit our website at pgim.com/investments
will not directly correlate to the amounts disclosed in the Statement of Operations which conform to US generally accepted accounting principles.
PGIM Quant Solutions Large-Cap Core Fund 9
Fees and Expenses (unaudited)
As a shareholder of the Fund, you incur two types of costs: (1) transaction costs, including sales charges (loads) on purchase payments and redemptions, as applicable, and (2) ongoing costs, including management fees, distribution and/or service (12b-1) fees, and other Fund expenses, as applicable. This example is intended to help you understand your ongoing costs (in dollars) of investing in the Fund and to compare these costs with the ongoing costs of investing in other mutual funds.
The example is based on an investment of $1,000 held through the six-month period ended October 31, 2022. The example is for illustrative purposes only; you should consult the Prospectus for information on initial and subsequent minimum investment requirements.
Actual Expenses
The first line for each share class in the table on the following page provides information about actual account values and actual expenses. You may use the information on this line, together with the amount you invested, to estimate the expenses that you paid over the period. Simply divide your account value by $1,000 (for example, an $8,600 account value ÷ $1,000 = 8.6), then multiply the result by the number on the first line under the heading “Expenses Paid During the Six-Month Period” to estimate the expenses you paid on your account during this period.
Hypothetical Example for Comparison Purposes
The second line for each share class in the table on the following page provides information about hypothetical account values and hypothetical expenses based on the Fund’s actual expense ratio and an assumed rate of return of 5% per year before expenses, which is not the Fund’s actual return. The hypothetical account values and expenses may not be used to estimate the actual ending account balance or expenses you paid for the period. You may use this information to compare the ongoing costs of investing in the Fund and other funds. To do so, compare this 5% hypothetical example with the 5% hypothetical examples that appear in the shareholder reports of the other funds.
The Fund’s transfer agent may charge additional fees to holders of certain accounts that are not included in the expenses shown in the table on the following page. These fees apply to individual retirement accounts ( IRAs) and Section 403(b) accounts. As of the close of the six-month period covered by the table, IRA fees included an annual maintenance fee of $15 per account (subject to a maximum annual maintenance fee of $25 for all accounts held by the same shareholder). Section 403(b) accounts are charged an annual $25 fiduciary maintenance fee. Some of the fees may vary in amount, or may be waived, based on your total account balance or the number of PGIM funds, including the Fund, that you own. You should consider the additional fees that were charged to your Fund account over the six-month period when you estimate the total ongoing expenses paid over the period and the impact of these fees on your ending account value, as these additional expenses are not reflected in the information
10 Visit our website at pgim.com/investments
provided in the expense table. Additional fees have the effect of reducing investment returns.
Please note that the expenses shown in the table are meant to highlight your ongoing costs only and do not reflect any transactional costs such as sales charges (loads). Therefore, the second line for each share class in the table is useful in comparing ongoing costs only and will not help you determine the relative total costs of owning different funds. In addition, if these transactional costs were included, your costs would have been higher.
| | | | | | | | | | |
| | | | |
PGIM Quant Solutions Large-Cap Core Fund | | Beginning
Account Value
May 1, 2022 | | Ending Account Value
October 31, 2022 | | Annualized Expense
Ratio Based on the Six-Month Period | | Expenses Paid During the
Six-Month Period* |
| | | | | |
| Class A | | Actual | | $1,000.00 | | $ 937.50 | | 0.73% | | $3.57 |
| | | | | |
| | | Hypothetical | | $1,000.00 | | $ 1,021.53 | | 0.73% | | $3.72 |
| | | | | |
| Class C | | Actual | | $1,000.00 | | $ 934.30 | | 1.44% | | $7.02 |
| | | | | |
| | | Hypothetical | | $1,000.00 | | $ 1,017.95 | | 1.44% | | $7.32 |
| | | | | |
| Class Z | | Actual | | $1,000.00 | | $ 939.20 | | 0.34% | | $1.66 |
| | | | | |
| | | Hypothetical | | $1,000.00 | | $ 1,023.49 | | 0.34% | | $1.73 |
| | | | | |
| Class R6 | | Actual | | $1,000.00 | | $ 938.80 | | 0.35% | | $1.71 |
| | | | | |
| | | Hypothetical | | $1,000.00 | | $ 1,023.44 | | 0.35% | | $1.79 |
*Fund expenses (net of fee waivers or subsidies, if any) for each share class are equal to the annualized expense ratio for each share class (provided in the table), multiplied by the average account value over the period, multiplied by the 184 days in the six-month period ended October 31, 2022, and divided by the 365 days in the Fund’s fiscal year ended October 31, 2022 (to reflect the six-month period). Expenses presented in the table include the expenses of any underlying portfolios in which the Fund may invest.
PGIM Quant Solutions Large-Cap Core Fund 11
Schedule of Investments
as of October 31, 2022
| | | | | | | | |
| | |
| Description | | Shares | | | Value | |
| | |
LONG-TERM INVESTMENTS 98.5% | | | | | | | | |
| | |
COMMON STOCKS | | | | | | | | |
| | |
Aerospace & Defense 1.9% | | | | | | | | |
| | |
General Dynamics Corp. | | | 15,600 | | | $ | 3,896,880 | |
Howmet Aerospace, Inc. | | | 96,400 | | | | 3,427,020 | |
Lockheed Martin Corp. | | | 11,933 | | | | 5,807,552 | |
| | | | | | | | |
| | |
| | | | | | | 13,131,452 | |
| | |
Air Freight & Logistics 0.6% | | | | | | | | |
| | |
FedEx Corp. | | | 25,500 | | | | 4,087,140 | |
| | |
Airlines 1.0% | | | | | | | | |
| | |
Alaska Air Group, Inc.* | | | 73,800 | | | | 3,281,148 | |
Southwest Airlines Co.* | | | 87,000 | | | | 3,162,450 | |
| | | | | | | | |
| | |
| | | | | | | 6,443,598 | |
| | |
Auto Components 0.6% | | | | | | | | |
| | |
BorgWarner, Inc. | | | 61,500 | | | | 2,308,095 | |
Goodyear Tire & Rubber Co. (The)* | | | 140,500 | | | | 1,784,350 | |
| | | | | | | | |
| | |
| | | | | | | 4,092,445 | |
| | |
Automobiles 2.9% | | | | | | | | |
| | |
General Motors Co. | | | 97,200 | | | | 3,815,100 | |
Tesla, Inc.* | | | 69,200 | | | | 15,745,768 | |
| | | | | | | | |
| | |
| | | | | | | 19,560,868 | |
| | |
Banks 4.5% | | | | | | | | |
| | |
Bank of America Corp. | | | 117,000 | | | | 4,216,680 | |
Citigroup, Inc. | | | 116,978 | | | | 5,364,611 | |
Citizens Financial Group, Inc. | | | 52,200 | | | | 2,134,980 | |
JPMorgan Chase & Co. | | | 40,481 | | | | 5,095,748 | |
M&T Bank Corp. | | | 2,400 | | | | 404,088 | |
Truist Financial Corp. | | | 88,000 | | | | 3,941,520 | |
U.S. Bancorp | | | 40,000 | | | | 1,698,000 | |
Wells Fargo & Co. | | | 171,900 | | | | 7,905,681 | |
| | | | | | | | |
| | |
| | | | | | | 30,761,308 | |
| | |
Beverages 2.6% | | | | | | | | |
| | |
Coca-Cola Co. (The) | | | 115,800 | | | | 6,930,630 | |
See Notes to Financial Statements.
PGIM Quant Solutions Large-Cap Core Fund 13
Schedule of Investments (continued)
as of October 31, 2022
| | | | | | | | |
| | |
| Description | | Shares | | | Value | |
| | |
COMMON STOCKS (Continued) | | | | | | | | |
| | |
Beverages (cont’d.) | | | | | | | | |
| | |
Constellation Brands, Inc. (Class A Stock) | | | 6,700 | | | $ | 1,655,436 | |
PepsiCo, Inc. | | | 49,200 | | | | 8,933,736 | |
| | | | | | | | |
| | |
| | | | | | | 17,519,802 | |
| | |
Biotechnology 3.1% | | | | | | | | |
| | |
AbbVie, Inc. | | | 27,651 | | | | 4,048,106 | |
Amgen, Inc. | | | 7,200 | | | | 1,946,520 | |
Catalyst Pharmaceuticals, Inc.* | | | 45,900 | | | | 636,633 | |
Gilead Sciences, Inc. | | | 62,572 | | | | 4,909,399 | |
Moderna, Inc.* | | | 12,300 | | | | 1,849,059 | |
Regeneron Pharmaceuticals, Inc.* | | | 3,600 | | | | 2,695,500 | |
Vertex Pharmaceuticals, Inc.* | | | 16,200 | | | | 5,054,400 | |
| | | | | | | | |
| | |
| | | | | | | 21,139,617 | |
| | |
Capital Markets 2.3% | | | | | | | | |
| | |
Bank of New York Mellon Corp. (The) | | | 11,100 | | | | 467,421 | |
Charles Schwab Corp. (The) | | | 62,700 | | | | 4,995,309 | |
Goldman Sachs Group, Inc. (The) | | | 18,877 | | | | 6,503,315 | |
Morgan Stanley | | | 39,800 | | | | 3,270,366 | |
| | | | | | | | |
| | |
| | | | | | | 15,236,411 | |
| | |
Chemicals 1.2% | | | | | | | | |
| | |
Corteva, Inc. | | | 43,400 | | | | 2,835,756 | |
LyondellBasell Industries NV (Class A Stock) | | | 48,500 | | | | 3,707,825 | |
Sherwin-Williams Co. (The) | | | 7,400 | | | | 1,665,222 | |
| | | | | | | | |
| | |
| | | | | | | 8,208,803 | |
| | |
Commercial Services & Supplies 0.6% | | | | | | | | |
| | |
Waste Management, Inc. | | | 27,000 | | | | 4,275,990 | |
| | |
Communications Equipment 1.6% | | | | | | | | |
| | |
Arista Networks, Inc.* | | | 23,800 | | | | 2,876,468 | |
Calix, Inc.* | | | 2,700 | | | | 198,828 | |
Cisco Systems, Inc. | | | 163,382 | | | | 7,422,444 | |
| | | | | | | | |
| | |
| | | | | | | 10,497,740 | |
| | |
Construction & Engineering 0.1% | | | | | | | | |
| | |
Valmont Industries, Inc. | | | 2,500 | | | | 798,050 | |
See Notes to Financial Statements.
14
| | | | | | | | |
| | |
| Description | | Shares | | | Value | |
| | |
COMMON STOCKS (Continued) | | | | | | | | |
| | |
Construction Materials 0.4% | | | | | | | | |
| | |
Eagle Materials, Inc. | | | 20,200 | | | $ | 2,470,662 | |
| | |
Consumer Finance 0.4% | | | | | | | | |
| | |
Capital One Financial Corp. | | | 23,000 | | | | 2,438,460 | |
| | |
Containers & Packaging 0.5% | | | | | | | | |
| | |
Westrock Co. | | | 99,400 | | | | 3,385,564 | |
| | |
Diversified Financial Services 1.2% | | | | | | | | |
| | |
Berkshire Hathaway, Inc. (Class B Stock)* | | | 27,774 | | | | 8,195,830 | |
| | |
Diversified Telecommunication Services 1.5% | | | | | | | | |
| | |
AT&T, Inc.(a) | | | 349,435 | | | | 6,370,200 | |
Verizon Communications, Inc. | | | 105,250 | | | | 3,933,193 | |
| | | | | | | | |
| | |
| | | | | | | 10,303,393 | |
| | |
Electric Utilities 1.2% | | | | | | | | |
| | |
Avangrid, Inc.(a) | | | 33,200 | | | | 1,350,576 | |
Edison International | | | 53,400 | | | | 3,206,136 | |
Exelon Corp. | | | 84,545 | | | | 3,262,592 | |
| | | | | | | | |
| | |
| | | | | | | 7,819,304 | |
| | |
Electrical Equipment 0.4% | | | | | | | | |
| | |
Atkore, Inc.* | | | 8,421 | | | | 802,521 | |
Encore Wire Corp. | | | 8,500 | | | | 1,169,515 | |
Hubbell, Inc. | | | 3,500 | | | | 831,180 | |
| | | | | | | | |
| | |
| | | | | | | 2,803,216 | |
| | |
Electronic Equipment, Instruments &Components 0.2% | | | | | | | | |
| | |
Corning, Inc. | | | 25,300 | | | | 813,901 | |
Sanmina Corp.* | | | 4,600 | | | | 257,830 | |
| | | | | | | | |
| | |
| | | | | | | 1,071,731 | |
| | |
Energy Equipment &Services 0.4% | | | | | | | | |
| | |
Halliburton Co. | | | 51,200 | | | | 1,864,704 | |
ProPetro Holding Corp.* | | | 56,800 | | | | 672,512 | |
U.S. Silica Holdings, Inc.* | | | 18,000 | | | | 259,020 | |
| | | | | | | | |
| | |
| | | | | | | 2,796,236 | |
See Notes to Financial Statements.
PGIM Quant Solutions Large-Cap Core Fund 15
Schedule of Investments (continued)
as of October 31, 2022
| | | | | | | | |
| | |
| Description | | Shares | | | Value | |
| | |
COMMON STOCKS (Continued) | | | | | | | | |
| | |
Entertainment 1.3% | | | | | | | | |
| | |
Electronic Arts, Inc. | | | 3,900 | | | $ | 491,244 | |
Netflix, Inc.* | | | 2,900 | | | | 846,452 | |
Walt Disney Co. (The)*(a) | | | 70,800 | | | | 7,543,032 | |
| | | | | | | | |
| | |
| | | | | | | 8,880,728 | |
| |
Equity Real Estate Investment Trusts (REITs) 1.8% | | | | | |
| | |
American Tower Corp. | | | 4,800 | | | | 994,512 | |
Apple Hospitality REIT, Inc. | | | 48,000 | | | | 821,760 | |
DiamondRock Hospitality Co. | | | 123,800 | | | | 1,156,292 | |
Equinix, Inc. | | | 1,300 | | | | 736,372 | |
iStar, Inc. | | | 86,900 | | | | 910,712 | |
National Health Investors, Inc. | | | 4,800 | | | | 272,160 | |
Piedmont Office Realty Trust, Inc. (Class A Stock) | | | 20,800 | | | | 217,360 | |
Public Storage | | | 9,100 | | | | 2,818,725 | |
Simon Property Group, Inc. | | | 6,300 | | | | 686,574 | |
Ventas, Inc. | | | 43,300 | | | | 1,694,329 | |
Weyerhaeuser Co. | | | 65,300 | | | | 2,019,729 | |
| | | | | | | | |
| | |
| | | | | | | 12,328,525 | |
| | |
Food &Staples Retailing 0.8% | | | | | | | | |
| | |
Albertson’s Cos., Inc. (Class A Stock) | | | 128,100 | | | | 2,627,331 | |
Costco Wholesale Corp. | | | 4,400 | | | | 2,206,600 | |
Kroger Co. (The) | | | 19,000 | | | | 898,510 | |
| | | | | | | | |
| | |
| | | | | | | 5,732,441 | |
| | |
Food Products 1.9% | | | | | | | | |
| | |
Archer-Daniels-Midland Co. | | | 50,300 | | | | 4,878,094 | |
Bunge Ltd. | | | 3,100 | | | | 305,970 | |
Kraft Heinz Co. (The) | | | 58,500 | | | | 2,250,495 | |
Pilgrim’s Pride Corp.* | | | 55,600 | | | | 1,281,580 | |
Tyson Foods, Inc. (Class A Stock) | | | 58,400 | | | | 3,991,640 | |
| | | | | | | | |
| | |
| | | | | | | 12,707,779 | |
| | |
Gas Utilities 0.2% | | | | | | | | |
| | |
UGI Corp. | | | 33,000 | | | | 1,165,890 | |
| |
Health Care Equipment &Supplies 2.3% | | | | | |
| | |
Abbott Laboratories | | | 49,700 | | | | 4,917,318 | |
Baxter International, Inc. | | | 14,000 | | | | 760,900 | |
Becton, Dickinson & Co. | | | 1,700 | | | | 401,149 | |
Edwards Lifesciences Corp.* | | | 34,500 | | | | 2,498,835 | |
See Notes to Financial Statements.
16
| | | | | | | | |
| | |
| Description | | Shares | | | Value | |
| | |
COMMON STOCKS (Continued) | | | | | | | | |
| | |
Health Care Equipment &Supplies (cont’d.) | | | | | | | | |
| | |
Medtronic PLC | | | 45,400 | | | $ | 3,965,236 | |
Shockwave Medical, Inc.* | | | 2,400 | | | | 703,560 | |
STERIS PLC | | | 1,200 | | | | 207,096 | |
Zimmer Biomet Holdings, Inc. | | | 19,900 | | | | 2,255,665 | |
| | | | | | | | |
| | |
| | | | | | | 15,709,759 | |
| | |
Health Care Providers & Services 4.4% | | | | | | | | |
| | |
Cigna Corp. | | | 19,300 | | | | 6,235,058 | |
CVS Health Corp. | | | 62,200 | | | | 5,890,340 | |
Elevance Health, Inc. | | | 1,100 | | | | 601,447 | |
HCA Healthcare, Inc. | | | 4,600 | | | | 1,000,362 | |
McKesson Corp. | | | 1,200 | | | | 467,244 | |
Molina Healthcare, Inc.* | | | 5,800 | | | | 2,081,388 | |
UnitedHealth Group, Inc. | | | 24,600 | | | | 13,656,690 | |
| | | | | | | | |
| | |
| | | | | | | 29,932,529 | |
| | |
Hotels, Restaurants & Leisure 2.5% | | | | | | | | |
| | |
Booking Holdings, Inc.* | | | 2,200 | | | | 4,112,856 | |
Chipotle Mexican Grill, Inc.* | | | 1,800 | | | | 2,696,994 | |
Expedia Group, Inc.* | | | 2,000 | | | | 186,940 | |
Hilton Worldwide Holdings, Inc. | | | 15,300 | | | | 2,069,478 | |
Marriott International, Inc. (Class A Stock) | | | 29,500 | | | | 4,723,245 | |
McDonald’s Corp. | | | 2,500 | | | | 681,650 | |
Starbucks Corp. | | | 30,800 | | | | 2,666,972 | |
| | | | | | | | |
| | |
| | | | | | | 17,138,135 | |
| | |
Household Products 1.5% | | | | | | | | |
| | |
Colgate-Palmolive Co. | | | 47,100 | | | | 3,477,864 | |
Kimberly-Clark Corp. | | | 15,200 | | | | 1,891,792 | |
Procter &Gamble Co. (The) | | | 36,686 | | | | 4,940,504 | |
| | | | | | | | |
| | |
| | | | | | | 10,310,160 | |
| |
Independent Power & Renewable Electricity Producers 0.3% | | | | | |
| | |
AES Corp. (The) | | | 67,000 | | | | 1,752,720 | |
Clearway Energy, Inc. (Class C Stock) | | | 15,900 | | | | 552,366 | |
| | | | | | | | |
| | |
| | | | | | | 2,305,086 | |
| | |
Industrial Conglomerates 0.6% | | | | | | | | |
| | |
Honeywell International, Inc. | | | 20,900 | | | | 4,264,018 | |
See Notes to Financial Statements.
PGIM Quant Solutions Large-Cap Core Fund 17
Schedule of Investments (continued)
as of October 31, 2022
| | | | | | | | |
| | |
| Description | | Shares | | | Value | |
| | |
COMMON STOCKS (Continued) | | | | | | | | |
| | |
Insurance 2.1% | | | | | | | | |
| | |
American International Group, Inc. | | | 35,600 | | | $ | 2,029,200 | |
Chubb Ltd. | | | 27,100 | | | | 5,823,519 | |
Hartford Financial Services Group, Inc. (The) | | | 6,900 | | | | 499,629 | |
Progressive Corp. (The) | | | 38,600 | | | | 4,956,240 | |
Reinsurance Group of America, Inc. | | | 7,700 | | | | 1,133,209 | |
| | | | | | | | |
| | |
| | | | | | | 14,441,797 | |
| | |
Interactive Media & Services 4.4% | | | | | | | | |
| | |
Alphabet, Inc. (Class A Stock)* | | | 137,280 | | | | 12,974,333 | |
Alphabet, Inc. (Class C Stock)* | | | 129,360 | | | | 12,245,217 | |
Meta Platforms, Inc. (Class A Stock)* | | | 45,580 | | | | 4,246,233 | |
| | | | | | | | |
| | |
| | | | | | | 29,465,783 | |
| | |
Internet & Direct Marketing Retail 2.3% | | | | | | | | |
| | |
Amazon.com, Inc.* | | | 150,040 | | | | 15,370,098 | |
| | |
IT Services 4.0% | | | | | | | | |
| | |
Accenture PLC (Class A Stock) | | | 1,559 | | | | 442,600 | |
Automatic Data Processing, Inc. | | | 19,700 | | | | 4,761,490 | |
Broadridge Financial Solutions, Inc. | | | 5,900 | | | | 885,354 | |
EPAM Systems, Inc.*(a) | | | 5,400 | | | | 1,890,000 | |
Fidelity National Information Services, Inc. | | | 2,500 | | | | 207,475 | |
International Business Machines Corp. | | | 23,030 | | | | 3,184,819 | |
Mastercard, Inc. (Class A Stock) | | | 28,500 | | | | 9,353,130 | |
SS&C Technologies Holdings, Inc. | | | 5,800 | | | | 298,236 | |
Visa, Inc. (Class A Stock) | | | 29,625 | | | | 6,137,115 | |
| | | | | | | | |
| | |
| | | | | | | 27,160,219 | |
| | |
Life Sciences Tools &Services 1.1% | | | | | | | | |
| | |
Agilent Technologies, Inc. | | | 2,300 | | | | 318,205 | |
Danaher Corp. | | | 10,900 | | | | 2,743,203 | |
IQVIA Holdings, Inc.* | | | 2,700 | | | | 566,109 | |
Sotera Health Co.* | | | 59,600 | | | | 410,048 | |
Thermo Fisher Scientific, Inc. | | | 6,014 | | | | 3,091,016 | |
| | | | | | | | |
| | |
| | | | | | | 7,128,581 | |
| | |
Machinery 1.2% | | | | | | | | |
| | |
Altra Industrial Motion Corp. | | | 11,300 | | | | 679,582 | |
Caterpillar, Inc. | | | 1,700 | | | | 367,982 | |
IDEX Corp. | | | 8,400 | | | | 1,867,404 | |
See Notes to Financial Statements.
18
| | | | | | | | |
| | |
| Description | | Shares | | | Value | |
| | |
COMMON STOCKS (Continued) | | | | | | | | |
| | |
Machinery (cont’d.) | | | | | | | | |
| | |
Mueller Industries, Inc. | | | 10,600 | | | $ | 663,984 | |
PACCAR, Inc. | | | 46,400 | | | | 4,492,912 | |
| | | | | | | | |
| | |
| | | | | | | 8,071,864 | |
| | |
Media 0.5% | | | | | | | | |
| | |
Comcast Corp. (Class A Stock) | | | 96,800 | | | | 3,072,432 | |
| | |
Multiline Retail 0.5% | | | | | | | | |
| | |
Dollar General Corp. | | | 12,600 | | | | 3,213,630 | |
| | |
Multi-Utilities 1.2% | | | | | | | | |
| | |
DTE Energy Co. | | | 33,200 | | | | 3,722,052 | |
Sempra Energy | | | 28,900 | | | | 4,362,166 | |
| | | | | | | | |
| | |
| | | | | | | 8,084,218 | |
| |
Oil, Gas &Consumable Fuels 5.6% | | | | | |
| | |
Chevron Corp. | | | 40,400 | | | | 7,308,360 | |
ConocoPhillips | | | 44,200 | | | | 5,573,178 | |
CONSOL Energy, Inc. | | | 69,300 | | | | 4,367,286 | |
Diamondback Energy, Inc. | | | 2,700 | | | | 424,197 | |
Exxon Mobil Corp. | | | 77,900 | | | | 8,632,099 | |
Marathon Petroleum Corp. | | | 6,700 | | | | 761,254 | |
Murphy Oil Corp. | | | 40,300 | | | | 1,954,953 | |
Phillips 66 | | | 16,900 | | | | 1,762,501 | |
Pioneer Natural Resources Co. | | | 7,300 | | | | 1,871,793 | |
Valero Energy Corp. | | | 39,000 | | | | 4,896,450 | |
| | | | | | | | |
| | |
| | | | | | | 37,552,071 | |
| | |
Pharmaceuticals 4.9% | | | | | | | | |
| | |
Bristol-Myers Squibb Co. | | | 93,600 | | | | 7,251,192 | |
Eli Lilly &Co. | | | 4,500 | | | | 1,629,405 | |
Jazz Pharmaceuticals PLC* | | | 1,500 | | | | 215,685 | |
Johnson & Johnson | | | 35,458 | | | | 6,168,628 | |
Merck &Co., Inc. | | | 88,900 | | | | 8,996,680 | |
Pfizer, Inc. | | | 191,300 | | | | 8,905,015 | |
| | | | | | | | |
| | |
| | | | | | | 33,166,605 | |
| | |
Professional Services 0.3% | | | | | | | | |
| | |
CoStar Group, Inc.* | | | 24,800 | | | | 2,051,456 | |
See Notes to Financial Statements.
PGIM Quant Solutions Large-Cap Core Fund 19
Schedule of Investments (continued)
as of October 31, 2022
| | | | | | | | |
| | |
| Description | | Shares | | | Value | |
| | |
COMMON STOCKS (Continued) | | | | | | | | |
| | |
Real Estate Management & Development 0.0% | | | | | | | | |
| | |
Cushman & Wakefield PLC* | | | 17,500 | | | $ | 202,125 | |
| | |
Road & Rail 0.1% | | | | | | | | |
| | |
Union Pacific Corp. | | | 3,800 | | | | 749,132 | |
| |
Semiconductors & Semiconductor Equipment 4.5% | | | | | |
| | |
Broadcom, Inc. | | | 15,500 | | | | 7,286,860 | |
Enphase Energy, Inc.* | | | 15,800 | | | | 4,850,600 | |
Intel Corp. | | | 209,141 | | | | 5,945,879 | |
Microchip Technology, Inc. | | | 42,700 | | | | 2,636,298 | |
NVIDIA Corp. | | | 24,700 | | | | 3,333,759 | |
NXP Semiconductors NV (China) | | | 6,200 | | | | 905,696 | |
Photronics, Inc.* | | | 109,100 | | | | 1,769,602 | |
QUALCOMM, Inc. | | | 29,900 | | | | 3,518,034 | |
| | | | | | | | |
| | |
| | | | | | | 30,246,728 | |
| | |
Software 8.8% | | | | | | | | |
| | |
Adobe, Inc.* | | | 20,783 | | | | 6,619,384 | |
Autodesk, Inc.* | | | 3,000 | | | | 642,900 | |
Cadence Design Systems, Inc.* | | | 26,300 | | | | 3,981,557 | |
Microsoft Corp. | | | 153,184 | | | | 35,558,602 | |
NortonLifeLock, Inc. | | | 10,000 | | | | 225,300 | |
Oracle Corp. | | | 13,379 | | | | 1,044,499 | |
Paycom Software, Inc.* | | | 11,200 | | | | 3,875,200 | |
Roper Technologies, Inc. | | | 6,300 | | | | 2,611,602 | |
ServiceNow, Inc.* | | | 2,200 | | | | 925,628 | |
Synopsys, Inc.* | | | 14,100 | | | | 4,124,955 | |
| | | | | | | | |
| | |
| | | | | | | 59,609,627 | |
| | |
Specialty Retail 1.5% | | | | | | | | |
| | |
Asbury Automotive Group, Inc.* | | | 1,700 | | | | 268,175 | |
AutoNation, Inc.*(a) | | | 12,200 | | | | 1,296,982 | |
Bath & Body Works, Inc. | | | 38,100 | | | | 1,271,778 | |
Best Buy Co., Inc. | | | 16,900 | | | | 1,156,129 | |
Chico’s FAS, Inc.* | | | 50,500 | | | | 296,940 | |
Genesco, Inc.* | | | 4,400 | | | | 206,976 | |
Home Depot, Inc. (The) | | | 12,700 | | | | 3,760,851 | |
Lithia Motors, Inc. | | | 1,600 | | | | 317,040 | |
Lowe’s Cos., Inc. | | | 1,100 | | | | 214,445 | |
TJX Cos., Inc. (The) | | | 6,400 | | | | 461,440 | |
Ulta Beauty, Inc.* | | | 1,800 | | | | 754,866 | |
| | | | | | | | |
| | |
| | | | | | | 10,005,622 | |
See Notes to Financial Statements.
20
| | | | | | | | |
| | |
| Description | | Shares | | | Value | |
| | |
COMMON STOCKS (Continued) | | | | | | | | |
| |
Technology Hardware, Storage & Peripherals 6.7% | | | | | |
| | |
Apple, Inc. | | | 287,180 | | | $ | 44,036,181 | |
| | |
Pure Storage, Inc. (Class A Stock)*(a) | | | 49,200 | | | | 1,518,312 | |
| | | | | | | | |
| | |
| | | | | | | 45,554,493 | |
| | |
Textiles, Apparel & Luxury Goods 0.2% | | | | | | | | |
| | |
PVH Corp. | | | 19,800 | | | | 1,016,136 | |
| | |
Tobacco 0.7% | | | | | | | | |
| | |
Philip Morris International, Inc. | | | 48,700 | | | | 4,473,095 | |
| | |
Trading Companies & Distributors 0.7% | | | | | | | | |
| | |
Boise Cascade Co. | | | 12,600 | | | | 841,302 | |
GMS, Inc.* | | | 25,200 | | | | 1,189,440 | |
Veritiv Corp.*(a) | | | 10,200 | | | | 1,185,852 | |
W.W. Grainger, Inc. | | | 2,600 | | | | 1,519,310 | |
WESCO International, Inc.* | | | 1,600 | | | | 220,432 | |
| | | | | | | | |
| | |
| | | | | | | 4,956,336 | |
| | |
Wireless Telecommunication Services 0.4% | | | | | | | | |
| | |
T-Mobile US, Inc.* | | | 19,400 | | | | 2,940,264 | |
| | | | | | | | |
| | |
TOTAL LONG-TERM INVESTMENTS
(cost $547,731,297) | | | | | | | 666,044,982 | |
| | | | | | | | |
| | |
SHORT-TERM INVESTMENTS 2.7% | | | | | | | | |
| | |
AFFILIATED MUTUAL FUND 1.7% | | | | | | | | |
| | |
PGIM Institutional Money Market Fund (cost $11,320,593; includes $11,272,803 of cash collateral for securities on loan)(b)(wa) | | | 11,331,322 | | | | 11,321,124 | |
| | | | | | | | |
| | | | | | | | | | | | | | | | | | | | | | | | | | | | |
| | | Interest
Rate | | | | | | Maturity
Date | | | | | | Principal
Amount
(000)# | | | | | | | |
U.S. TREASURY OBLIGATION(k)(n) 0.1% | | | | | | | | | | | | | | | | | | | | | | | | | | | | |
U.S. Treasury Bills
(cost $747,108) | | | 3.180% | | | | | | | | 12/15/22 | | | | | | | | 750 | | | | 746,782 | |
| | | | | | | | | | | | | | | | | | | | | | | | | | | | |
See Notes to Financial Statements.
PGIM Quant Solutions Large-Cap Core Fund 21
Schedule of Investments (continued)
as of October 31, 2022
| | | | | | | | |
| | |
| Description | | Shares | | | Value | |
| | |
UNAFFILIATED FUND 0.9% | | | | | | | | |
| | |
Dreyfus Government Cash Management (Institutional Shares) (cost $6,394,673) | | | 6,394,673 | | | $ | 6,394,673 | |
| | | | | | | | |
| | |
TOTAL SHORT-TERM INVESTMENTS
(cost $18,462,374) | | | | | | | 18,462,579 | |
| | | | | | | | |
| | |
TOTAL INVESTMENTS 101.2%
(cost $566,193,671) | | | | | | | 684,507,561 | |
| | |
Liabilities in excess of other assets(z) (1.2)% | | | | | | | (7,998,105 | ) |
| | | | | | | | |
| | |
NET ASSETS 100.0% | | | | | | $ | 676,509,456 | |
| | | | | | | | |
Below is a list of the abbreviation(s) used in the annual report:
GS—Goldman Sachs & Co. LLC
LIBOR—London Interbank Offered Rate
OTC—Over-the-counter
REITs—Real Estate Investment Trust
S&P—Standard & Poor’s
SOFR—Secured Overnight Financing Rate
| * | Non-income producing security. |
| # | Principal amount is shown in U.S. dollars unless otherwise stated. |
| (a) | All or a portion of security is on loan. The aggregate market value of such securities, including those sold and pending settlement, is $10,977,127; cash collateral of $11,272,803 (included in liabilities) was received with which the Fund purchased highly liquid short-term investments. In the event of significant appreciation in value of securities on loan on the last business day of the reporting period, the Fund may reflect a collateral value that is less than the market value of the loaned securities and such shortfall is remedied the following business day. |
| (b) | Represents security, or portion thereof, purchased with cash collateral received for securities on loan and includes dividend reinvestment. |
| (k) | Represents security, or a portion thereof, segregated as collateral for centrally cleared/exchange-traded derivatives. |
| (n) | Rate shown reflects yield to maturity at purchased date. |
| (wa) | PGIM Investments LLC, the manager of the Fund, also serves as manager of the PGIM Core Ultra Short Bond Fund and PGIM Institutional Money Market Fund, if applicable. |
| (z) | Includes net unrealized appreciation/(depreciation) and/or market value of the below holdings which are excluded from the Schedule of Investments: |
Futures contracts outstanding at October 31, 2022:
| | | | | | | | | | | | | | | | | |
Number
of
Contracts | | Type | | Expiration
Date | | Current
Notional
Amount | | Value / Unrealized Appreciation (Depreciation) |
| | | | | | | | | |
| | | |
Long Position: | | | | | | | | | | | | | | | |
53 | | S&P 500 E-Mini Index | | | | Dec. 2022 | | | | | $10,289,950 | | | | | $(377,557) | |
| | | | | | | | | | | | | | | | | |
See Notes to Financial Statements.
22
Summary of Collateral for Centrally Cleared/Exchange-traded Derivatives:
Cash and securities segregated as collateral, including pending settlement for closed positions, to cover requirements for centrally cleared/exchange-traded derivatives are listed by broker as follows:
| | | | | | | | | | | | | | |
Broker | | Cash and/or Foreign Currency | | | | Securities Market Value |
| | | | | | | |
GS | | | | $— | | | | | | | | $746,782 | | |
| | | | | | | | | | | | | | |
Fair Value Measurements:
Various inputs are used in determining the value of the Fund’s investments. These inputs are summarized in the three broad levels listed below.
Level 1—unadjusted quoted prices generally in active markets for identical securities.
Level 2—quoted prices for similar securities, interest rates and yield curves, prepayment speeds, foreign currency exchange rates and other observable inputs.
Level 3—unobservable inputs for securities valued in accordance with Board approved fair valuation procedures.
The following is a summary of the inputs used as of October 31, 2022 in valuing such portfolio securities:
| | | | | | | | | | | | |
| | | Level 1 | | | Level 2 | | | Level 3 | |
Investments in Securities | | | | | | | | | | | | |
Assets | | | | | | | | | | | | |
Long-Term Investments | | | | | | | | | | | | |
Common Stocks | | | | | | | | | | | | |
Aerospace & Defense | | $ | 13,131,452 | | | $ | — | | | | $— | |
Air Freight & Logistics | | | 4,087,140 | | | | — | | | | — | |
Airlines | | | 6,443,598 | | | | — | | | | — | |
Auto Components | | | 4,092,445 | | | | — | | | | — | |
Automobiles | | | 19,560,868 | | | | — | | | | — | |
Banks | | | 30,761,308 | | | | — | | | | — | |
Beverages | | | 17,519,802 | | | | — | | | | — | |
Biotechnology | | | 21,139,617 | | | | — | | | | — | |
Capital Markets | | | 15,236,411 | | | | — | | | | — | |
Chemicals | | | 8,208,803 | | | | — | | | | — | |
Commercial Services &Supplies | | | 4,275,990 | | | | — | | | | — | |
Communications Equipment | | | 10,497,740 | | | | — | | | | — | |
Construction & Engineering | | | 798,050 | | | | — | | | | — | |
Construction Materials | | | 2,470,662 | | | | — | | | | — | |
Consumer Finance | | | 2,438,460 | | | | — | | | | — | |
Containers & Packaging | | | 3,385,564 | | | | — | | | | — | |
Diversified Financial Services | | | 8,195,830 | | | | — | | | | — | |
Diversified Telecommunication Services | | | 10,303,393 | | | | — | | | | — | |
Electric Utilities | | | 7,819,304 | | | | — | | | | — | |
Electrical Equipment | | | 2,803,216 | | | | — | | | | — | |
Electronic Equipment, Instruments &Components | | | 1,071,731 | | | | — | | | | — | |
Energy Equipment &Services | | | 2,796,236 | | | | — | | | | — | |
Entertainment | | | 8,880,728 | | | | — | | | | — | |
See Notes to Financial Statements.
PGIM Quant Solutions Large-Cap Core Fund 23
Schedule of Investments (continued)
as of October 31, 2022
| | | | | | | | | | |
| | | Level 1 | | | Level 2 | | | Level 3 |
Investments in Securities (continued) | | | | | | | | | | |
Assets (continued) | | | | | | | | | | |
Long-Term Investments (continued) | | | | | | | | | | |
Common Stocks (continued) | | | | | | | | | | |
Equity Real Estate Investment Trusts (REITs) | | $ | 12,328,525 | | | $ | — | | | $— |
Food &Staples Retailing | | | 5,732,441 | | | | — | | | — |
Food Products | | | 12,707,779 | | | | — | | | — |
Gas Utilities | | | 1,165,890 | | | | — | | | — |
Health Care Equipment &Supplies | | | 15,709,759 | | | | — | | | — |
Health Care Providers &Services | | | 29,932,529 | | | | — | | | — |
Hotels, Restaurants & Leisure | | | 17,138,135 | | | | — | | | — |
Household Products | | | 10,310,160 | | | | — | | | — |
Independent Power & Renewable Electricity Producers | | | 2,305,086 | | | | — | | | — |
Industrial Conglomerates | | | 4,264,018 | | | | — | | | — |
Insurance | | | 14,441,797 | | | | — | | | — |
Interactive Media &Services | | | 29,465,783 | | | | — | | | — |
Internet & Direct Marketing Retail | | | 15,370,098 | | | | — | | | — |
IT Services | | | 27,160,219 | | | | — | | | — |
Life Sciences Tools &Services | | | 7,128,581 | | | | — | | | — |
Machinery | | | 8,071,864 | | | | — | | | — |
Media | | | 3,072,432 | | | | — | | | — |
Multiline Retail | | | 3,213,630 | | | | — | | | — |
Multi-Utilities | | | 8,084,218 | | | | — | | | — |
Oil, Gas & Consumable Fuels | | | 37,552,071 | | | | — | | | — |
Pharmaceuticals | | | 33,166,605 | | | | — | | | — |
Professional Services | | | 2,051,456 | | | | — | | | — |
Real Estate Management & Development | | | 202,125 | | | | — | | | — |
Road & Rail | | | 749,132 | | | | — | | | — |
Semiconductors &Semiconductor Equipment | | | 30,246,728 | | | | — | | | — |
Software | | | 59,609,627 | | | | — | | | — |
Specialty Retail | | | 10,005,622 | | | | — | | | — |
Technology Hardware, Storage & Peripherals | | | 45,554,493 | | | | — | | | — |
Textiles, Apparel & Luxury Goods | | | 1,016,136 | | | | — | | | — |
Tobacco | | | 4,473,095 | | | | — | | | — |
Trading Companies & Distributors | | | 4,956,336 | | | | — | | | — |
Wireless Telecommunication Services | | | 2,940,264 | | | | — | | | — |
Short-Term Investments | | | | | | | | | | |
Affiliated Mutual Fund | | | 11,321,124 | | | | — | | | — |
U.S. Treasury Obligation | | | — | | | | 746,782 | | | — |
Unaffiliated Fund | | | 6,394,673 | | | | — | | | — |
| | | | | | | | | | |
Total | | $ | 683,760,779 | | | $ | 746,782 | | | $— |
| | | | | | | | | | |
| | | |
Other Financial Instruments* | | | | | | | | | | |
Liabilities | | | | | | | | | | |
Futures Contracts | | $ | (377,557 | ) | | $ | — | | | $— |
| | | | | | | | | | |
See Notes to Financial Statements.
24
| * | Other financial instruments are derivative instruments not reflected in the Schedule of Investments, such as futures, forwards and centrally cleared swap contracts, which are recorded at the unrealized appreciation (depreciation) on the instrument, and OTC swap contracts which are recorded at fair value. |
Industry Classification:
The industry classification of investments and liabilities in excess of other assets shown as a percentage of net assets as of October 31, 2022 were as follows:
| | | | |
Software | | | 8.8 | % |
Technology Hardware, Storage & Peripherals | | | 6.7 | |
Oil, Gas & Consumable Fuels | | | 5.6 | |
Pharmaceuticals | | | 4.9 | |
Banks | | | 4.5 | |
Semiconductors & Semiconductor Equipment | | | 4.5 | |
Health Care Providers &Services | | | 4.4 | |
Interactive Media & Services | | | 4.4 | |
IT Services | | | 4.0 | |
Biotechnology | | | 3.1 | |
Automobiles | | | 2.9 | |
Beverages | | | 2.6 | |
Hotels, Restaurants & Leisure | | | 2.5 | |
Health Care Equipment &Supplies | | | 2.3 | |
Internet & Direct Marketing Retail | | | 2.3 | |
Capital Markets | | | 2.3 | |
Insurance | | | 2.1 | |
Aerospace & Defense | | | 1.9 | |
Food Products | | | 1.9 | |
Equity Real Estate Investment Trusts (REITs) | | | 1.8 | |
Affiliated Mutual Fund (1.7% represents investments purchased with collateral from securities on loan) | | | 1.7 | |
Communications Equipment | | | 1.6 | |
Household Products | | | 1.5 | |
Diversified Telecommunication Services | | | 1.5 | |
Specialty Retail | | | 1.5 | |
Entertainment | | | 1.3 | |
Chemicals | | | 1.2 | |
Diversified Financial Services | | | 1.2 | |
Multi-Utilities | | | 1.2 | |
Machinery | | | 1.2 | |
Electric Utilities | | | 1.2 | |
Life Sciences Tools & Services | | | 1.1 | |
Airlines | | | 1.0 | |
| | | | |
Unaffiliated Fund | | | 0.9 | % |
Food &Staples Retailing | | | 0.8 | |
Trading Companies & Distributors | | | 0.7 | |
Tobacco | | | 0.7 | |
Commercial Services & Supplies | | | 0.6 | |
Industrial Conglomerates | | | 0.6 | |
Auto Components | | | 0.6 | |
Air Freight & Logistics | | | 0.6 | |
Containers & Packaging | | | 0.5 | |
Multiline Retail | | | 0.5 | |
Media | | | 0.5 | |
Wireless Telecommunication Services | | | 0.4 | |
Electrical Equipment | | | 0.4 | |
Energy Equipment &Services | | | 0.4 | |
Construction Materials | | | 0.4 | |
Consumer Finance | | | 0.4 | |
Independent Power & Renewable Electricity Producers | | | 0.3 | |
Professional Services | | | 0.3 | |
Gas Utilities | | | 0.2 | |
Electronic Equipment, Instruments & Components | | | 0.2 | |
Textiles, Apparel & Luxury Goods | | | 0.2 | |
Construction & Engineering | | | 0.1 | |
Road & Rail | | | 0.1 | |
U.S. Treasury Obligation | | | 0.1 | |
Real Estate Management & Development | | | 0.0 | * |
| | | | |
| | | 101.2 | |
Liabilities in excess of other assets | | | (1.2 | ) |
| | | | |
| |
| | | 100.0 | % |
| | | | |
See Notes to Financial Statements.
PGIM Quant Solutions Large-Cap Core Fund 25
Schedule of Investments (continued)
as of October 31, 2022
Effects of Derivative Instruments on the Financial Statements and Primary Underlying Risk Exposure:
The Fund invested in derivative instruments during the reporting period. The primary type of risk associated with these derivative instruments is equity contracts risk. See the Notes to Financial Statements for additional detail regarding these derivative instruments and their risks. The effect of such derivative instruments on the Fund’s financial position and financial performance as reflected in the Statement of Assets and Liabilities and Statement of Operations is presented in the summary below.
Fair values of derivative instruments as of October 31, 2022 as presented in the Statement of Assets and Liabilities:
| | | | | | | | | | |
| | | Asset Derivatives | | Liability Derivatives | |
| | | | |
Derivatives not accounted for as hedging instruments, carried at fair value | | Statement of
Assets and
Liabilities Location | | Fair
Value | | Statement of Assets and
Liabilities Location | | Fair
Value | |
| Equity contracts | | — | | $— | | Due from/to broker-variation margin futures | | | $377,557 | * |
| | | | | | | | | | |
| * | Includes cumulative appreciation (depreciation) as reported in the schedule of open futures and centrally cleared swap contracts. Only unsettled variation margin receivable (payable) is reported within the Statement of Assets and Liabilities. |
The effects of derivative instruments on the Statement of Operations for the year ended October 31, 2022 are as follows:
| | | | |
Amount of Realized Gain (Loss) on Derivatives Recognized in Income | |
| |
Derivatives not accounted for as hedging instruments, carried at fair value | | Futures | |
| |
Equity contracts | | $ | (627,429 | ) |
| | | | |
|
Change in Unrealized Appreciation (Depreciation) on Derivatives Recognized in Income | |
| |
Derivatives not accounted for as hedging instruments, carried at fair value | | Futures | |
| |
Equity contracts | | $ | (952,731 | ) |
| | | | |
For the year ended October 31, 2022, the Fund’s average volume of derivative activities is as follows:
| | |
| |
| Derivative Contract Type | | Average Volume of Derivative Activities* |
| |
Futures Contracts - Long Positions (1) | | $12,304,858 |
| * | Average volume is based on average quarter end balances as noted for the year ended October 31, 2022. |
| (1) | Notional Amount in USD. |
See Notes to Financial Statements.
26
Financial Instruments/Transactions—Summary of Offsetting and Netting Arrangements:
The Fund entered into financial instruments/transactions during the reporting period that are either offset in accordance with current requirements or are subject to enforceable master netting arrangements or similar agreements that permit offsetting. The information about offsetting and related netting arrangements for financial instruments/transactions where the legal right to set-off exists is presented in the summary below.
Offsetting of financial instrument/transaction assets and liabilities:
| | | | | | |
| Description | | Gross Market
Value of
Recognized
Assets/(Liabilities) | | Collateral
Pledged/(Received)(1) | | Net
Amount |
Securities on Loan | | $10,977,127 | | $(10,977,127) | | $— |
| (1) | Collateral amount disclosed by the Fund is limited to the market value of financial instruments/transactions. |
See Notes to Financial Statements.
PGIM Quant Solutions Large-Cap Core Fund 27
Statement of Assets and Liabilities
as of October 31, 2022
| | | | |
| |
Assets | | | | |
| |
Investments at value, including securities on loan of $10,977,127: | | | | |
Unaffiliated investments (cost $554,873,078) | | $ | 673,186,437 | |
Affiliated investments (cost $11,320,593) | | | 11,321,124 | |
Receivable for investments sold | | | 3,918,050 | |
Receivable for Fund shares sold | | | 1,533,416 | |
Dividends and interest receivable | | | 1,393,459 | |
Prepaid expenses | | | 10,017 | |
| | | | |
| |
Total Assets | | | 691,362,503 | |
| | | | |
| |
Liabilities | | | | |
| |
Payable to broker for collateral for securities on loan | | | 11,272,803 | |
Payable for Fund shares purchased | | | 3,025,707 | |
Accrued expenses and other liabilities | | | 167,146 | |
Management fee payable | | | 149,491 | |
Distribution fee payable | | | 97,036 | |
Due to broker—variation margin futures | | | 74,863 | |
Affiliated transfer agent fee payable | | | 63,834 | |
Trustees’ fees payable | | | 2,167 | |
| | | | |
| |
Total Liabilities | | | 14,853,047 | |
| | | | |
| |
Net Assets | | $ | 676,509,456 | |
| | | | |
| |
| | | | | |
| |
Net assets were comprised of: | | | | |
Shares of beneficial interest, at par | | $ | 42,482 | |
Paid-in capital in excess of par | | | 546,404,115 | |
Total distributable earnings (loss) | | | 130,062,859 | |
| | | | |
| |
Net assets, October 31, 2022 | | $ | 676,509,456 | |
| | | | |
See Notes to Financial Statements.
28
| | | | | | | | |
Class A | | | | | | | | |
| | |
Net asset value and redemption price per share, ($ 411,797,898 ÷ 26,148,295 shares of beneficial interest issued and outstanding) | | $ | 15.75 | | | | | |
Maximum sales charge (5.50% of offering price) | | | 0.92 | | | | | |
| | | | | | | | |
| | |
Maximum offering price to public | | $ | 16.67 | | | | | |
| | | | | | | | |
| | |
Class C | | | | | | | | |
| | |
Net asset value, offering price and redemption price per share, ($ 15,991,905 ÷ 1,184,008 shares of beneficial interest issued and outstanding) | | $ | 13.51 | | | | | |
| | | | | | | | |
| | |
Class Z | | | | | | | | |
| | |
Net asset value, offering price and redemption price per share, ($ 20,646,693 ÷ 1,260,677 shares of beneficial interest issued and outstanding) | | $ | 16.38 | | | | | |
| | | | | | | | |
| | |
Class R6 | | | | | | | | |
| | |
Net asset value, offering price and redemption price per share, ($ 228,072,960 ÷ 13,888,556 shares of beneficial interest issued and outstanding) | | $ | 16.42 | | | | | |
| | | | | | | | |
See Notes to Financial Statements.
PGIM Quant Solutions Large-Cap Core Fund 29
Statement of Operations
Year Ended October 31, 2022
| | | | |
Net Investment Income (Loss) | | | | |
| |
Income | | | | |
Unaffiliated dividend income (net of $7,300 foreign withholding tax) | | $ | 13,405,871 | |
Income from securities lending, net (including affiliated income of $11,517) | | | 11,682 | |
Interest income | | | 6,155 | |
Affiliated dividend income | | | 2,828 | |
| | | | |
| |
Total income | | | 13,426,536 | |
| | | | |
| |
Expenses | | | | |
Management fee | | | 2,694,649 | |
Distribution fee(a) | | | 1,597,493 | |
Transfer agent’s fees and expenses (including affiliated expense of $354,545)(a) | | | 680,386 | |
Custodian and accounting fees | | | 79,576 | |
Shareholders’ reports | | | 72,968 | |
Registration fees(a) | | | 71,794 | |
Legal fees and expenses | | | 33,437 | |
Audit fee | | | 24,350 | |
Trustees’ fees | | | 19,874 | |
SEC registration fees | | | 5,050 | |
Miscellaneous | | | 61,340 | |
| | | | |
| |
Total expenses | | | 5,340,917 | |
Less: Fee waiver and/or expense reimbursement(a) | | | (441,149 | ) |
Distribution fee waiver(a) | | | (234,437 | ) |
| | | | |
| |
Net expenses | | | 4,665,331 | |
| | | | |
| |
Net investment income (loss) | | | 8,761,205 | |
| | | | |
| |
Realized And Unrealized Gain (Loss)On Investments | | | | |
| |
Net realized gain (loss) on: | | | | |
Investment transactions (including affiliated of $(7,409)) | | | 7,267,631 | |
Futures transactions | | | (627,429 | ) |
| | | | |
| |
| | | 6,640,202 | |
| | | | |
Net change in unrealized appreciation (depreciation) on: | | | | |
Investments (including affiliated of $531) | | | (119,434,501 | ) |
Futures | | | (952,731 | ) |
| | | | |
| |
| | | (120,387,232 | ) |
| | | | |
| |
Net gain (loss) on investment transactions | | | (113,747,030 | ) |
| | | | |
| |
Net Increase (Decrease) In Net Assets Resulting From Operations | | $ | (104,985,825 | ) |
| | | | |
| (a) | Class specific expenses and waivers were as follows: |
| | | | | | | | | | | | | | | | |
| | | Class A | | | Class C | | | Class Z | | | Class R6 | |
| | | | |
Distribution fee | | | 1,406,621 | | | | 190,872 | | | | — | | | | — | |
Transfer agent’s fees and expenses | | | 627,964 | | | | 34,520 | | | | 15,401 | | | | 2,501 | |
Registration fees | | | 23,415 | | | | 14,876 | | | | 20,207 | | | | 13,296 | |
Fee waiver and/or expense reimbursement | | | (263,420 | ) | | | (39,271 | ) | | | (29,056 | ) | | | (109,402 | ) |
Distribution fee waiver | | | (234,437 | ) | | | — | | | | — | | | | — | |
See Notes to Financial Statements.
30
Statements of Changes in Net Assets
| | | | | | | | | | |
| | |
| | | Year Ended
October 31, | | | |
| | | |
| | | 2022 | | | 2021 | | | |
| | | |
Increase (Decrease) in Net Assets | | | | | | | | | | |
| | | |
Operations | | | | | | | | | | |
Net investment income (loss) | | $ | 8,761,205 | | | $ | 7,056,819 | | | |
Net realized gain (loss) on investment transactions | | | 6,640,202 | | | | 112,391,771 | | | |
Net change in unrealized appreciation (depreciation) on investments | | | (120,387,232 | ) | | | 133,980,627 | | | |
| | | | | | | | | | |
| | | |
Net increase (decrease) in net assets resulting from operations | | | (104,985,825 | ) | | | 253,429,217 | | | |
| | | | | | | | | | |
| | | |
Dividends and Distributions | | | | | | | | | | |
Distributions from distributable earnings | | | | | | | | | | |
Class A | | | (75,324,555 | ) | | | (9,498,862 | ) | | |
Class C | | | (3,481,355 | ) | | | (464,608 | ) | | |
Class Z | | | (3,670,638 | ) | | | (1,395,424 | ) | | |
Class R6 | | | (37,719,399 | ) | | | (3,717,913 | ) | | |
| | | | | | | | | | |
| | | |
| | | (120,195,947 | ) | | | (15,076,807 | ) | | |
| | | | | | | | | | |
Fund share transactions (Net of share conversions) | | | | | | | | | | |
Net proceeds from shares sold | | | 181,955,294 | | | | 187,786,089 | | | |
Net asset value of shares issued in reinvestment of dividends and distributions | | | 119,012,363 | | | | 14,909,423 | | | |
Cost of shares purchased | | | (265,425,580 | ) | | | (158,286,541 | ) | | |
| | | | | | | | | | |
| | | |
Net increase (decrease) in net assets from Fund share transactions | | | 35,542,077 | | | | 44,408,971 | | | |
| | | | | | | | | | |
| | | |
Total increase (decrease) | | | (189,639,695 | ) | | | 282,761,381 | | | |
| | | |
Net Assets: | | | | | | | | | | |
| | | |
Beginning of year | | | 866,149,151 | | | | 583,387,770 | | | |
| | | | | | | | | | |
| | | |
End of year | | $ | 676,509,456 | | | $ | 866,149,151 | | | |
| | | | | | | | | | |
See Notes to Financial Statements.
PGIM Quant Solutions Large-Cap Core Fund 31
Financial Highlights
| | | | | | | | | | | | | | | | | | | | |
| | | | | | |
Class A Shares | | | | | | | | | | | | | | | | | | | | |
| | | Year Ended October 31, | |
| | | | | | |
| | | 2022 | | | 2021 | | | 2020 | | | 2019 | | | 2018 | |
| | | | | | |
Per Share Operating Performance(a): | | | | | | | | | | | | | | | | | | | | |
Net Asset Value, Beginning of Year | | | $21.09 | | | | $15.17 | | | | $15.17 | | | | $16.76 | | | | $18.37 | |
Income (loss)from investment operations: | | | | | | | | | | | | | | | | | | | | |
Net investment income (loss) | | | 0.18 | | | | 0.16 | | | | 0.19 | | | | 0.18 | | | | 0.20 | |
| Net realized and unrealized gain (loss) on investment transactions | | | (2.46 | ) | | | 6.14 | | | | 0.43 | | | | 1.19 | | | | 0.80 | |
Total from investment operations | | | (2.28 | ) | | | 6.30 | | | | 0.62 | | | | 1.37 | | | | 1.00 | |
Less Dividends and Distributions: | | | | | | | | | | | | | | | | | | | | |
Dividends from net investment income | | | (0.17 | ) | | | (0.19 | ) | | | (0.19 | ) | | | (0.22 | ) | | | (0.18 | ) |
Distributions from net realized gains | | | (2.89 | ) | | | (0.19 | ) | | | (0.43 | ) | | | (2.74 | ) | | | (2.43 | ) |
Total dividends and distributions | | | (3.06 | ) | | | (0.38 | ) | | | (0.62 | ) | | | (2.96 | ) | | | (2.61 | ) |
Net asset value, end of year | | | $15.75 | | | | $21.09 | | | | $15.17 | | | | $15.17 | | | | $16.76 | |
Total Return(b): | | | (12.84 | )% | | | 42.24 | % | | | 4.02 | % | | | 10.61 | % | | | 5.67 | % |
| | | | | | | | | | | | | | | | | | | | | |
Ratios/Supplemental Data: | | | | | | | | | | | | | | | | | | | | |
Net assets, end of year (000) | | | $411,798 | | | | $522,601 | | | | $382,165 | | | | $400,634 | | | | $105,855 | |
Average net assets (000) | | | $468,874 | | | | $475,322 | | | | $389,009 | | | | $302,864 | | | | $112,391 | |
Ratios to average net assets(c): | | | | | | | | | | | | | | | | | | | | |
| Expenses after waivers and/or expense reimbursement | | | 0.72 | % | | | 0.72 | % | | | 0.72 | % | | | 0.74 | % | | | 0.72 | % |
| Expenses before waivers and/or expense reimbursement | | | 0.83 | % | | | 0.81 | % | | | 0.83 | % | | | 0.87 | % | | | 0.86 | % |
Net investment income (loss) | | | 1.03 | % | | | 0.84 | % | | | 1.26 | % | | | 1.27 | % | | | 1.14 | % |
Portfolio turnover rate(d) | | | 98 | % | | | 101 | % | | | 92 | % | | | 88 | % | | | 95 | % |
| (a) | Calculated based on average shares outstanding during the year. |
| (b) | Total return does not consider the effects of sales loads. Total return is calculated assuming a purchase of a share on the first day and a sale on the last day of each year reported and includes reinvestment of dividends and distributions, if any. Total returns may reflect adjustments to conform to GAAP. |
| (c) | Does not include expenses of the underlying funds in which the Fund invests. |
| (d) | The Fund’s portfolio turnover rate is calculated in accordance with regulatory requirements, without regard to transactions involving short-term investments, certain derivatives and in-kind transactions (if any). If such transactions were included, the Fund’s portfolio turnover rate may be higher. |
See Notes to Financial Statements.
32
| | | | | | | | | | | | | | | | | | | | |
| | | | | | |
Class C Shares | | | | | | | | | | | | | | | | | | | | |
| | | Year Ended October 31, | |
| | | | | | |
| | | 2022 | | | 2021 | | | 2020 | | | 2019 | | | 2018 | |
| | | | | | |
Per Share Operating Performance(a): | | | | | | | | | | | | | | | | | | | | |
Net Asset Value, Beginning of Year | | | $18.52 | | | | $13.38 | | | | $13.46 | | | | $15.20 | | | | $16.89 | |
Income (loss)from investment operations: | | | | | | | | | | | | | | | | | | | | |
Net investment income (loss) | | | 0.05 | | | | 0.02 | | | | 0.07 | | | | 0.08 | | | | 0.07 | |
| Net realized and unrealized gain (loss) on investment transactions | | | (2.11 | ) | | | 5.42 | | | | 0.38 | | | | 1.03 | | | | 0.73 | |
Total from investment operations | | | (2.06 | ) | | | 5.44 | | | | 0.45 | | | | 1.11 | | | | 0.80 | |
Less Dividends and Distributions: | | | | | | | | | | | | | | | | | | | | |
Dividends from net investment income | | | (0.06 | ) | | | (0.11 | ) | | | (0.10 | ) | | | (0.11 | ) | | | (0.06 | ) |
Distributions from net realized gains | | | (2.89 | ) | | | (0.19 | ) | | | (0.43 | ) | | | (2.74 | ) | | | (2.43 | ) |
Total dividends and distributions | | | (2.95 | ) | | | (0.30 | ) | | | (0.53 | ) | | | (2.85 | ) | | | (2.49 | ) |
Net asset value, end of year | | | $13.51 | | | | $18.52 | | | | $13.38 | | | | $13.46 | | | | $15.20 | |
Total Return(b): | | | (13.46 | )% | | | 41.25 | % | | | 3.27 | % | | | 9.77 | % | | | 4.91 | % |
| | | | | | | | | | | | | | | | | | | | | |
Ratios/Supplemental Data: | | | | | | | | | | | | | | | | | | | | |
Net assets, end of year (000) | | | $15,992 | | | | $22,453 | | | | $21,047 | | | | $27,333 | | | | $29,930 | |
Average net assets (000) | | | $19,087 | | | | $22,342 | | | | $24,287 | | | | $36,812 | | | | $31,783 | |
Ratios to average net assets(c): | | | | | | | | | | | | | | | | | | | | |
| Expenses after waivers and/or expense reimbursement | | | 1.44 | % | | | 1.44 | % | | | 1.44 | % | | | 1.47 | % | | | 1.44 | % |
| Expenses before waivers and/or expense reimbursement | | | 1.65 | % | | | 1.59 | % | | | 1.59 | % | | | 1.54 | % | | | 1.55 | % |
Net investment income (loss) | | | 0.30 | % | | | 0.14 | % | | | 0.56 | % | | | 0.59 | % | | | 0.43 | % |
Portfolio turnover rate(d) | | | 98 | % | | | 101 | % | | | 92 | % | | | 88 | % | | | 95 | % |
| (a) | Calculated based on average shares outstanding during the year. |
| (b) | Total return does not consider the effects of sales loads. Total return is calculated assuming a purchase of a share on the first day and a sale on the last day of each year reported and includes reinvestment of dividends and distributions, if any. Total returns may reflect adjustments to conform to GAAP. |
| (c) | Does not include expenses of the underlying funds in which the Fund invests. |
| (d) | The Fund’s portfolio turnover rate is calculated in accordance with regulatory requirements, without regard to transactions involving short-term investments, certain derivatives and in-kind transactions (if any).If such transactions were included, the Fund’s portfolio turnover rate may be higher. |
See Notes to Financial Statements.
PGIM Quant Solutions Large-Cap Core Fund 33
Financial Highlights (continued)
| | | | | | | | | | | | | | | | | | | | |
| | | | | | |
Class Z Shares | | | | | | | | | | | | | | | | | | | | |
| | | Year Ended October 31, | |
| | | | | | |
| | | 2022 | | | 2021 | | | 2020 | | | 2019 | | | 2018 | |
| | | | | | |
Per Share Operating Performance(a): | | | | | | | | | | | | | | | | | | | | |
Net Asset Value, Beginning of Year | | | $21.79 | | | | $15.67 | | | | $15.65 | | | | $17.20 | | | | $18.78 | |
Income (loss)from investment operations: | | | | | | | | | | | | | | | | | | | | |
Net investment income (loss) | | | 0.24 | | | | 0.21 | | | | 0.23 | | | | 0.24 | | | | 0.25 | |
| Net realized and unrealized gain (loss) on investment transactions | | | (2.55 | ) | | | 6.32 | | | | 0.44 | | | | 1.21 | | | | 0.82 | |
Total from investment operations | | | (2.31 | ) | | | 6.53 | | | | 0.67 | | | | 1.45 | | | | 1.07 | |
Less Dividends and Distributions: | | | | | | | | | | | | | | | | | | | | |
Dividends from net investment income | | | (0.21 | ) | | | (0.22 | ) | | | (0.22 | ) | | | (0.26 | ) | | | (0.22 | ) |
Distributions from net realized gains | | | (2.89 | ) | | | (0.19 | ) | | | (0.43 | ) | | | (2.74 | ) | | | (2.43 | ) |
Total dividends and distributions | | | (3.10 | ) | | | (0.41 | ) | | | (0.65 | ) | | | (3.00 | ) | | | (2.65 | ) |
Net asset value, end of year | | | $16.38 | | | | $21.79 | | | | $15.67 | | | | $15.65 | | | | $17.20 | |
Total Return(b): | | | (12.54 | )% | | | 42.44 | % | | | 4.27 | % | | | 10.91 | % | | | 5.98 | % |
| | | | | | | | | | | | | | | | | | | | | |
Ratios/Supplemental Data: | | | | | | | | | | | | | | | | | | | | |
Net assets, end of year (000) | | | $20,647 | | | | $25,663 | | | | $47,730 | | | | $67,192 | | | | $61,857 | |
Average net assets (000) | | | $23,609 | | | | $60,616 | | | | $64,099 | | | | $65,923 | | | | $62,456 | |
Ratios to average net assets(c): | | | | | | | | | | | | | | | | | | | | |
| Expenses after waivers and/or expense reimbursement | | | 0.42 | % | | | 0.49 | % | | | 0.48 | % | | | 0.48 | % | | | 0.46 | % |
| Expenses before waivers and/or expense reimbursement | | | 0.54 | % | | | 0.55 | % | | | 0.55 | % | | | 0.54 | % | | | 0.55 | % |
Net investment income (loss) | | | 1.34 | % | | | 1.10 | % | | | 1.54 | % | | | 1.59 | % | | | 1.40 | % |
Portfolio turnover rate(d) | | | 98 | % | | | 101 | % | | | 92 | % | | | 88 | % | | | 95 | % |
| (a) | Calculated based on average shares outstanding during the year. |
| (b) | Total return is calculated assuming a purchase of a share on the first day and a sale on the last day of each year reported and includes reinvestment of dividends and distributions, if any. Total returns may reflect adjustments to conform to GAAP. |
| (c) | Does not include expenses of the underlying funds in which the Fund invests. |
| (d) | The Fund’s portfolio turnover rate is calculated in accordance with regulatory requirements, without regard to transactions involving short-term investments, certain derivatives and in-kind transactions (if any). If such transactions were included, the Fund’s portfolio turnover rate may be higher. |
See Notes to Financial Statements.
34
| | | | | | | | | | | | | | | | | | | | |
| | | | | | |
Class R6 Shares | | | | | | | | | | | | | | | | | | | | |
| | | Year Ended October 31, | |
| | | | | | |
| | | 2022 | | | 2021 | | | 2020 | | | 2019 | | | 2018 | |
| | | | | | |
Per Share Operating Performance(a): | | | | | | | | | | | | | | | | | | | | |
Net Asset Value, Beginning of Year | | | $21.86 | | | | $15.70 | | | | $15.68 | | | | $17.23 | | | | $18.81 | |
Income (loss)from investment operations: | | | | | | | | | | | | | | | | | | | | |
Net investment income (loss) | | | 0.25 | | | | 0.23 | | | | 0.25 | | | | 0.26 | | | | 0.27 | |
| Net realized and unrealized gain (loss) on investment transactions | | | (2.56 | ) | | | 6.36 | | | | 0.44 | | | | 1.21 | | | | 0.82 | |
Total from investment operations | | | (2.31 | ) | | | 6.59 | | | | 0.69 | | | | 1.47 | | | | 1.09 | |
Less Dividends and Distributions: | | | | | | | | | | | | | | | | | | | | |
Dividends from net investment income | | | (0.24 | ) | | | (0.24 | ) | | | (0.24 | ) | | | (0.28 | ) | | | (0.24 | ) |
Distributions from net realized gains | | | (2.89 | ) | | | (0.19 | ) | | | (0.43 | ) | | | (2.74 | ) | | | (2.43 | ) |
Total dividends and distributions | | | (3.13 | ) | | | (0.43 | ) | | | (0.67 | ) | | | (3.02 | ) | | | (2.67 | ) |
Net asset value, end of year | | | $16.42 | | | | $21.86 | | | | $15.70 | | | | $15.68 | | | | $17.23 | |
Total Return(b): | | | (12.52 | )% | | | 42.79 | % | | | 4.39 | % | | | 11.05 | % | | | 6.10 | % |
| | | | | | | | | | | | | | | | | | | | | |
Ratios/Supplemental Data: | | | | | | | | | | | | | | | | | | | | |
Net assets, end of year (000) | | | $228,073 | | | | $295,432 | | | | $132,446 | | | | $90,722 | | | | $76,551 | |
Average net assets (000) | | | $258,329 | | | | $204,016 | | | | $105,498 | | | | $86,249 | | | | $71,390 | |
Ratios to average net assets(c): | | | | | | | | | | | | | | | | | | | | |
| Expenses after waivers and/or expense reimbursement | | | 0.35 | % | | | 0.35 | % | | | 0.35 | % | | | 0.35 | % | | | 0.35 | % |
| Expenses before waivers and/or expense reimbursement | | | 0.39 | % | | | 0.38 | % | | | 0.40 | % | | | 0.41 | % | | | 0.44 | % |
Net investment income (loss) | | | 1.38 | % | | | 1.17 | % | | | 1.60 | % | | | 1.72 | % | | | 1.51 | % |
Portfolio turnover rate(d) | | | 98 | % | | | 101 | % | | | 92 | % | | | 88 | % | | | 95 | % |
| (a) | Calculated based on average shares outstanding during the year. |
| (b) | Total return is calculated assuming a purchase of a share on the first day and a sale on the last day of each year reported and includes reinvestment of dividends and distributions, if any. Total returns may reflect adjustments to conform to GAAP. |
| (c) | Does not include expenses of the underlying funds in which the Fund invests. |
| (d) | The Fund’s portfolio turnover rate is calculated in accordance with regulatory requirements, without regard to transactions involving short-term investments, certain derivatives and in-kind transactions (if any). If such transactions were included, the Fund’s portfolio turnover rate may be higher. |
See Notes to Financial Statements.
PGIM Quant Solutions Large-Cap Core Fund 35
Notes to Financial Statements
Prudential Investment Portfolios 9 (the “Registered Investment Company” or “RIC”) is registered under the Investment Company Act of 1940, as amended (“1940 Act”), as an open-end management investment company. The RIC is organized as a Delaware Statutory Trust. These financial statements relate only to the PGIM Quant Solutions Large-Cap Core Fund (formerly known as PGIM QMA Large-Cap Core Fund) (the “Fund”), a series of the RIC. The Fund is classified as a diversified fund for purposes of the 1940 Act.
The investment objective of the Fund is to seek long-term growth of capital.
The Fund follows the investment company accounting and reporting guidance of the Financial Accounting Standards Board (“FASB”) Accounting Standard Codification (“ASC”) Topic 946 Financial Services — Investment Companies. The following is a summary of significant accounting policies followed by the Fund in the preparation of its financial statements. The policies conform to U.S. generally accepted accounting principles (“GAAP”). The Fund consistently follows such policies in the preparation of its financial statements.
Securities Valuation: The Fund holds securities and other assets and liabilities that are fair valued as of the close of each day (generally, 4:00 PM Eastern time) the New York Stock Exchange (“NYSE”) is open for trading. As described in further detail below, the Fund’s investments are valued daily based on a number of factors, including the type of investment and whether market quotations are readily available. The RIC’s Board of Trustees (the “Board”) has approved the Fund’s valuation policies and procedures for security valuation and designated to PGIM Investments LLC (“PGIM Investments” or the “Manager”) as the Valuation Designee pursuant to SEC Rule 2a-5(b) to perform the fair value determination relating to all Fund investments. Pursuant to the Board’s oversight, the Valuation Designee has established a Valuation Committee to perform the duties and responsibilities as valuation designee under SEC Rule 2a-5. The valuation procedures permit the Fund to utilize independent pricing vendor services, quotations from market makers, and alternative valuation methods when market quotations are either not readily available or not deemed representative of fair value. Fair value is the price that would be received to sell an asset or paid to transfer a liability in an orderly transaction between market participants on the measurement date. A record of the Valuation Committee’s actions is provided to the Board at the first quarterly meeting following the quarter in which such actions take place.
For the fiscal reporting year-end, securities and other assets and liabilities were fair valued at the close of the last U.S. business day. Trading in certain foreign securities may occur when the NYSE is closed (including weekends and holidays). Because such foreign securities
36
trade in markets that are open on weekends and U.S. holidays, the values of some of the Fund’s foreign investments may change on days when investors cannot purchase or redeem Fund shares.
Various inputs determine how the Fund’s investments are valued, all of which are categorized according to the three broad levels (Level 1, 2, or 3) detailed in the Schedule of Investments and referred to herein as the “fair value hierarchy” in accordance with FASB ASC Topic 820 - Fair Value Measurement.
Common or preferred stocks, exchange-traded funds and derivative instruments, if applicable, that are traded on a national securities exchange are valued at the last sale price as of the close of trading on the applicable exchange where the security principally trades. Securities traded via NASDAQ are valued at the NASDAQ official closing price. To the extent these securities are valued at the last sale price or NASDAQ official closing price, they are classified as Level 1 in the fair value hierarchy. In the event that no sale or official closing price on valuation date exists, these securities are generally valued at the mean between the last reported bid and ask prices, or at the last bid price in the absence of an ask price. These securities are classified as Level 2 in the fair value hierarchy.
Foreign equities traded on foreign securities exchanges are generally valued using pricing vendor services that provide model prices derived using adjustment factors based on information such as local closing price, relevant general and sector indices, currency fluctuations, depositary receipts, and futures, as applicable. Securities valued using such model prices are classified as Level 2 in the fair value hierarchy. The models generate an evaluated adjustment factor for each security, which is applied to the local closing price to adjust it for post closing market movements up to the time the Fund is valued. Utilizing that evaluated adjustment factor, the vendor provides an evaluated price for each security. If the vendor does not provide an evaluated price, securities are valued in accordance with exchange-traded common and preferred stock valuation policies discussed above.
Investments in open-end funds (other than exchange-traded funds) are valued at their net asset values as of the close of the NYSE on the date of valuation. These securities are classified as Level 1 in the fair value hierarchy since they may be purchased or sold at their net asset values on the date of valuation.
Securities and other assets that cannot be priced according to the methods described above are valued based on policies and procedures approved by the Board. In the event that unobservable inputs are used when determining such valuations, the securities will be classified as Level 3 in the fair value hierarchy. Altering one or more unobservable inputs may result in a significant change to a Level 3 security’s fair value measurement.
When determining the fair value of securities, some of the factors influencing the valuation include: the nature of any restrictions on disposition of the securities; assessment of the general liquidity of the securities; the issuer’s financial condition and the markets in which it does business; the cost of the investment; the size of the holding and the capitalization of
PGIM Quant Solutions Large-Cap Core Fund 37
Notes to Financial Statements (continued)
the issuer; the prices of any recent transactions or bids/offers for such securities or any comparable securities; any available analyst media or other reports or information deemed reliable by the Valuation Designee regarding the issuer or the markets or industry in which it operates. Using fair value to price securities may result in a value that is different from a security’s most recent closing price and from the price used by other unaffiliated mutual funds to calculate their net asset values.
Financial Futures Contracts: A financial futures contract is an agreement to purchase (long) or sell (short) an agreed amount of securities at a set price for delivery on a future date. Upon entering into a financial futures contract, the Fund is required to pledge to the broker an amount of cash and/or other assets equal to a certain percentage of the contract amount. This amount is known as the “initial margin.” Subsequent payments, known as “variation margin,” are made or received by the Fund each day, depending on the daily fluctuations in the value of the underlying security. Such variation margin is recorded for financial statement purposes on a daily basis as unrealized gain (loss). When the contract expires or is closed, the gain (loss) is realized and is presented in the Statement of Operations as net realized gain (loss) on futures transactions.
The Fund invested in financial futures contracts in order to hedge its existing portfolio securities, or securities the Fund intends to purchase, against fluctuations in value caused by changes in prevailing interest rates. Should interest rates move unexpectedly, the Fund may not achieve the anticipated benefits of the financial futures contracts and may realize a loss. The use of futures transactions involves the risk of imperfect correlation in movements in the price of futures contracts and the underlying hedged assets. Since futures contracts are exchange-traded, there is minimal counterparty credit risk to the Fund since the exchanges’ clearinghouse acts as counterparty to all exchange-traded futures and guarantees the futures contracts against default.
Master Netting Arrangements: The RIC, on behalf of the Fund, is subject to various Master Agreements, or netting arrangements, with select counterparties. These are agreements which a subadviser may have negotiated and entered into on behalf of all or a portion of the Fund. A master netting arrangement between the Fund and the counterparty permits the Fund to offset amounts payable by the Fund to the same counterparty against amounts to be received; and by the receipt of collateral from the counterparty by the Fund to cover the Fund’s exposure to the counterparty. However, there is no assurance that such mitigating factors are easily enforceable. In addition to master netting arrangements, the right to set-off exists when all the conditions are met such that each of the parties owes the other determinable amounts, the reporting party has the right to set-off the amount owed with the amount owed by the other party, the reporting party intends to set-off and the right of set-off is enforceable by law.
38
Securities Lending: The Fund lends its portfolio securities to banks and broker-dealers. The loans are secured by collateral at least equal to the market value of the securities loaned. Collateral pledged by each borrower is invested in an affiliated money market fund and is marked to market daily, based on the previous day’s market value, such that the value of the collateral exceeds the value of the loaned securities. In the event of significant appreciation in value of securities on loan on the last business day of the reporting period, the financial statements may reflect a collateral value that is less than the market value of the loaned securities. Such shortfall is remedied as described above. Loans are subject to termination at the option of the borrower or the Fund. Upon termination of the loan, the borrower will return to the Fund securities identical to the loaned securities. The remaining open loans of the securities lending transactions are considered overnight and continuous. Should the borrower of the securities fail financially, the Fund has the right to repurchase the securities in the open market using the collateral.
The Fund recognizes income, net of any rebate and securities lending agent fees, for lending its securities in the form of fees or interest on the investment of any cash received as collateral. The borrower receives all interest and dividends from the securities loaned and such payments are passed back to the lender in amounts equivalent thereto, which are reflected in interest income or unaffiliated dividend income based on the nature of the payment on the Statement of Operations. The Fund also continues to recognize any unrealized gain (loss) in the market price of the securities loaned and on the change in the value of the collateral invested that may occur during the term of the loan. In addition, realized gain (loss) is recognized on changes in the value of the collateral invested upon liquidation of the collateral. Net earnings from securities lending are disclosed in the Statement of Operations.
Equity and Mortgage Real Estate Investment Trusts (collectively REITs): The Fund invested in REITs, which report information on the source of their distributions annually. Based on current and historical information, a portion of distributions received from REITs during the period is estimated to be dividend income, capital gain or return of capital and recorded accordingly. When material, these estimates are adjusted periodically when the actual source of distributions is disclosed by the REITs.
Securities Transactions and Net Investment Income: Securities transactions are recorded on the trade date. Realized gains (losses) from investment and currency transactions are calculated on the specific identification method. Dividend income is recorded on the ex-date, or for certain foreign securities, when the Fund becomes aware of such dividends. Expenses are recorded on an accrual basis, which may require the use of certain estimates by management that may differ from actual. Net investment income or loss (other than class specific expenses and waivers, which are allocated as noted below) and unrealized and realized gains (losses) are allocated daily to each class of shares based upon the relative proportion of adjusted net assets of each class at the beginning of the day. Class specific expenses and waivers, where applicable, are charged to the respective share classes. Such class specific expenses and waivers include distribution fees and distribution fee waivers,
PGIM Quant Solutions Large-Cap Core Fund 39
Notes to Financial Statements (continued)
shareholder servicing fees, transfer agent’s fees and expenses, registration fees and fee waivers and/or expense reimbursements, as applicable.
Taxes: It is the Fund’s policy to continue to meet the requirements of the Internal Revenue Code applicable to regulated investment companies and to distribute all of its taxable net investment income and capital gains, if any, to its shareholders. Therefore, no federal income tax provision is required. Withholding taxes on foreign dividends, interest and capital gains, if any, are recorded, net of reclaimable amounts, at the time the related income is earned.
Dividends and Distributions: Dividends and distributions to shareholders, which are determined in accordance with federal income tax regulations and which may differ from GAAP, are recorded on the ex-date. Permanent book/tax differences relating to income and gain (loss) are reclassified between total distributable earnings (loss) and paid-in capital in excess of par,as appropriate. The chart below sets forth the expected frequency of dividend and capital gains distributions to shareholders. Various factors may impact the frequency of dividend distributions to shareholders, including but not limited to adverse market conditions or portfolio holding-specific events.
| | |
| | |
Expected Distribution Schedule to Shareholders* | | Frequency |
Net Investment Income | | Annually |
Short-Term Capital Gains | | Annually |
Long-Term Capital Gains | | Annually |
| * | Under certain circumstances, the Fund may make more than one distribution of short-term and/or long-term capital gains during a fiscal year. |
Estimates: The preparation of financial statements requires management to make estimates and assumptions that affect the reported amounts and disclosures in the financial statements. Actual results could differ from those estimates.
The RIC, on behalf of the Fund, has a management agreement with the Manager pursuant to which it has responsibility for all investment advisory services and supervises the subadviser’s performance of such services, and pursuant to which it renders administrative services.
The Manager has entered into a subadvisory agreement with PGIM Quantitative Solutions LLC (“PGIM Quantitative Solutions” or the “subadviser”). The Manager pays for the services of PGIM Quantitative Solutions.
40
Fees payable under the management agreement are computed daily and paid monthly. For the reporting period ended October 31, 2022, the contractual and effective management fee rates were as follows:
| | | | |
Contractual Management Rate | |
| Effective Management Fee, before any waivers
and/or expense reimbursements |
|
0.35% of average daily net assets up to $5 billion; | | | 0.35% | |
0.34% of average daily net assets over $5 billion. | | | | |
The Manager has contractually agreed, through February 29, 2024, to limit certain operating expenses and/or to limit total annual operating expenses after fee waivers and/or expense reimbursements. This contractual waiver exclude interest, brokerage, taxes (such as income and foreign withholding taxes, stamp duty and deferred tax expenses), acquired fund fees and expenses, extraordinary expenses, and certain other Fund expenses such as dividend and interest expense and broker charges on short sales.
Where applicable, the Manager agrees to waive management fees or shared operating expenses on any share class to the same extent that it waives such expenses on any other share class. In addition, total annual operating expenses for Class R6 shares will not exceed total annual operating expenses for Class Z shares. Fees and/or expenses waived and/or reimbursed by the Manager for the purpose of preventing the expenses from exceeding a certain expense ratio limit may be recouped by the Manager within the same fiscal year during which such waiver and/or reimbursement is made if such recoupment can be realized without exceeding the expense limit in effect at the time of the recoupment for that fiscal year. The expense limitations attributable to each class are as follows:
| | | | |
Class | | Fund Expense
Limitation* | | Class Expense
Limitation |
A | | 0.35% | | 0.72% |
C | | 0.35 | | 1.44 |
Z | | 0.35 | | — |
R6 | | 0.35 | | — |
*Expense limitation excludes distribution and service (12b-1) fees, shareholder service fee, and transfer agency expenses (including sub-transfer agency and networking fees).
The RIC, on behalf of the Fund, has a distribution agreement with Prudential Investment Management Services LLC (“PIMS”), which acts as the distributor of the Class A, Class C, Class Z and Class R6 shares of the Fund. The Fund compensates PIMS for distributing and servicing the Fund’s Class A and Class C shares, pursuant to the plans of distribution (the “Distribution Plans”), regardless of expenses actually incurred by PIMS.
Pursuant to the Distribution Plans, the Fund compensates PIMS for distribution related activities at an annual rate based on average daily net assets per class. PIMS has contractually agreed through February 29, 2024 to limit such fees on certain classes based on the daily net assets. The distribution fees are accrued daily and payable monthly.
PGIM Quant Solutions Large-Cap Core Fund 41
Notes to Financial Statements (continued)
The Fund’s annual gross and net distribution rate, where applicable, are as follows:
| | | | |
| | | |
Class | | Gross Distribution Fee | | Net Distribution Fee |
A | | 0.30% | | 0.25% |
C | | 1.00 | | 1.00 |
Z | | N/A | | N/A |
R6 | | N/A | | N/A |
For the year ended October 31, 2022, PIMS received front-end sales charges (“FESL”) resulting from sales of certain class shares and contingent deferred sales charges (“CDSC”) imposed upon redemptions by certain shareholders. From these fees, PIMS paid such sales charges to broker-dealers, who in turn paid commissions to salespersons and incurred other distribution costs. The sales charges are as follows where applicable:
| | | | | | | | |
Class | | | FESL | | | | CDSC | |
A | | | $180,341 | | | | $ — | |
C | | | — | | | | 785 | |
PGIM Investments, PIMS and PGIM Quantitative Solutions are indirect, wholly-owned subsidiaries of Prudential Financial, Inc. (“Prudential”).
| 4. | Other Transactions with Affiliates |
Prudential Mutual Fund Services LLC (“PMFS”), an affiliate of PGIM Investments and an indirect, wholly-owned subsidiary of Prudential, serves as the Fund’s transfer agent and shareholder servicing agent. Transfer agent’s fees and expenses in the Statement of Operations include certain out-of-pocket expenses paid to non-affiliates, where applicable.
The Fund may invest its overnight sweep cash in the PGIM Core Ultra Short Bond Fund (the “Core Fund”), and its securities lending cash collateral in the PGIM Institutional Money Market Fund (the “Money Market Fund”), each a fund of Prudential Investment Portfolios 2, registered under the 1940 Act and managed by PGIM Investments. PGIM Investments and/or its affiliates are paid fees or reimbursed for providing their services to the Core Fund and the Money Market Fund. In addition to the realized and unrealized gains on investments in the Core Fund and Money Market Fund, earnings from such investments are disclosed on the Statement of Operations as “Affiliated dividend income” and “Affiliated income from securities lending, net”, respectively. Effective January 2022, the Fund changed its overnight cash sweep vehicle from the Core Fund to an unaffiliated money market fund.
The Fund may enter into certain securities purchase or sale transactions under Board approved Rule 17a-7 procedures. Rule 17a-7 is an exemptive rule under the 1940 Act, that subject to certain conditions, permits purchase and sale transactions among affiliated
42
investment companies, or between an investment company and a person that is affiliated solely by reason of having a common (or affiliated) investment adviser, common directors/trustees, and/or common officers. For the year ended October 31, 2022, no 17a-7 transactions were entered into by the Fund.
The aggregate cost of purchases and proceeds from sales of portfolio securities (excluding short-term investments and U.S. Government securities) for the reporting period ended October 31, 2022, were as follows:
| | |
Cost of Purchases | | Proceeds from Sales |
$741,157,967 | | $816,610,465 |
A summary of the cost of purchases and proceeds from sales of shares of affiliated mutual funds for the year ended October 31, 2022, is presented as follows:
| | | | | | | | | | | | | | | | | | | | | | | | | | | | | | | | | | | | | | | | | | | | | | | | | | | | | | |
| | |
Value,
Beginning of Year | | | Cost of
Purchases | | | | | | Proceeds
from Sales | | | | | | Change in
Unrealized
Gain
(Loss) | | | | | | Realized
Gain
(Loss) | | | | | | Value, End of Year | | | | | | Shares,
End of Year | | | | | | Income | |
| | |
|
| | Short-Term Investments - Affiliated Mutual Funds: | |
| | |
|
| | PGIM Core Ultra Short Bond Fund(1)(wa) | |
| | |
| | $15,957,883 | | | $ | 30,591,188 | | | | | | | $ | 46,549,071 | | | | | | | $ | — | | | | | | | $ | — | | | | | | | $ | — | | | | | | | | — | | | | | | | $ | 2,828 | |
| | |
|
| | PGIM Institutional Money Market Fund(1)(b)(wa) | |
| | |
| | 602,941 | | | | 339,043,780 | | | | | | | | 328,318,719 | | | | | | | | 531 | | | | | | | | (7,409 | ) | | | | | | | 11,321,124 | | | | | | | | 11,331,322 | | | | | | | | 11,517 | (2) |
| | |
| | $16,560,824 | | | $ | 369,634,968 | | | | | | | $ | 374,867,790 | | | | | | | $ | 531 | | | | | | | $ | (7,409 | ) | | | | | | $ | 11,321,124 | | | | | | | | | | | | | | | $ | 14,345 | |
| | |
| (1) | The Fund did not have any capital gain distributions during the reporting period. |
| (2) | The amount, or a portion thereof, represents the affiliated securities lending income shown on the Statement of Operations. |
| (b) | Represents security, or portion thereof, purchased with cash collateral received for securities on loan and includes dividend reinvestment. |
| (wa) | PGIM Investments LLC, the manager of the Fund, also serves as manager of the PGIM Core Ultra Short Bond Fund and PGIM Institutional Money Market Fund, if applicable. |
| 6. | Distributions and Tax Information |
Distributions to shareholders, which are determined in accordance with federal income tax regulations and which may differ from GAAP, are recorded on the ex-date.
For the year ended October 31, 2022, the tax character of dividends paid by the Fund were $72,705,214 of ordinary income and $47,490,733 of long-term capital gains. For the year ended October 31, 2021, the tax character of dividends paid by the Fund were $7,619,643 of ordinary income $7,457,164 of long-term capital gains.
As of October 31, 2022, the accumulated undistributed earnings on a tax basis were $7,187,685 of ordinary income and $7,670,621 of long-term capital gains.
PGIM Quant Solutions Large-Cap Core Fund 43
Notes to Financial Statements (continued)
The United States federal income tax basis of the Fund’s investments and the net unrealized appreciation as of October 31, 2022 were as follows:
| | | | | | |
| | | | |
| Tax Basis | | Gross Unrealized
Appreciation | | Gross Unrealized
Depreciation | | Net Unrealized
Appreciation |
$568,925,451 | | $148,931,600 | | $(33,727,047) | | $115,204,553 |
The difference between GAAP and tax basis were primarily attributable to deferred losses on wash sales and mark-to-market of futures contracts.
The Manager has analyzed the Fund’s tax positions taken on federal, state and local income tax returns for all open tax years and has concluded that no provision for income tax is required in the Fund’s financial statements for the current reporting period. Since tax authorities can examine previously filed tax returns, the Fund’s U.S. federal and state tax returns for each of the four fiscal years up to the most recent fiscal year ended October 31, 2022 are subject to such review.
The Fund offers Class A, Class C, Class Z and Class R6 shares. Class A shares are sold with a maximum front-end sales charge of 5.50%. Investors who purchase $1 million or more of Class A shares and sell these shares within 12 months of purchase are subject to a CDSC of 1%, although they are not subject to an initial sales charge. The Class A CDSC is waived for certain retirement and/or benefit plans. A special exchange privilege is also available for shareholders who qualified to purchase Class A shares at net asset value. Class C shares are sold with a CDSC of 1% on sales made within 12 months of purchase. Class C shares will automatically convert to Class A shares on a monthly basis approximately eight years (ten years prior to January 22, 2021) after purchase. Class Z and Class R6 shares are not subject to any sales or redemption charges and are available exclusively for sale to a limited group of investors.
Under certain circumstances, an exchange may be made from specified share classes of the Fund to one or more other share classes of the Fund as presented in the table of transactions in shares of beneficial interest, below.
The RIC has authorized an unlimited number of shares of beneficial interest of the Fund at $0.001 par value per share, currently divided into four classes, designated Class A, Class C, Class Z and Class R6.
44
As of October 31, 2022, Prudential, through its affiliated entities, including affiliated funds (if applicable), owned shares of the Fund as follows:
| | | | | | | | |
| | | |
| Class | | Number of Shares | | Percentage of Outstanding Shares |
A | | | 5,148 | | | | 0.1 | % |
C | | | 3 | | | | 0.1 | |
R6 | | | 9,126,935 | | | | 65.7 | |
At the reporting period end, the number of shareholders holding greater than 5% of the Fund are as follows:
| | | | |
| | | |
| | | Number of Shareholders | | Percentage of Outstanding Shares |
Affiliated | | 1 | | 7.0% |
Unaffiliated | | 2 | | 33.3 |
Transactions in shares of beneficial interest were as follows:
| | | | | | | | | | | | |
| | | | |
Share Class | | | Shares | | | | | | | | Amount | |
| | | |
Class A | | | | | | | | | | | | |
Year ended October 31, 2022: | | | | | | | | | | | | |
Shares sold | | | 728,579 | | | | | | | $ | 12,708,622 | |
Shares issued in reinvestment of dividends and distributions | | | 4,053,312 | | | | | | | | 74,256,672 | |
Shares purchased | | | (3,441,735 | ) | | | | | | | (59,313,796 | ) |
Net increase (decrease) in shares outstanding before conversion | | | 1,340,156 | | | | | | | | 27,651,498 | |
Shares issued upon conversion from other share class(es) | | | 133,317 | | | | | | | | 2,309,798 | |
Shares purchased upon conversion into other share class(es) | | | (106,980 | ) | | | | | | | (1,845,512 | ) |
Net increase (decrease) in shares outstanding | | | 1,366,493 | | | | | | | $ | 28,115,784 | |
| | | |
Year ended October 31, 2021: | | | | | | | | | | | | |
Shares sold | | | 2,091,107 | | | | | | | $ | 38,400,935 | |
Shares issued in reinvestment of dividends and distributions | | | 566,431 | | | | | | | | 9,351,778 | |
Shares purchased | | | (3,160,671 | ) | | | | | | | (58,723,676 | ) |
Net increase (decrease) in shares outstanding before conversion | | | (503,133 | ) | | | | | | | (10,970,963 | ) |
Shares issued upon conversion from other share class(es) | | | 242,510 | | | | | | | | 4,439,967 | |
Shares purchased upon conversion into other share class(es) | | | (151,501 | ) | | | | | | | (2,826,352 | ) |
Net increase (decrease) in shares outstanding | | | (412,124 | ) | | | | | | $ | (9,357,348 | ) |
| | | |
Class C | | | | | | | | | | | | |
Year ended October 31, 2022: | | | | | | | | | | | | |
Shares sold | | | 99,883 | | | | | | | $ | 1,472,695 | |
Shares issued in reinvestment of dividends and distributions | | | 218,899 | | | | | | | | 3,460,797 | |
Shares purchased | | | (180,782 | ) | | | | | | | (2,754,149 | ) |
Net increase (decrease) in shares outstanding before conversion | | | 138,000 | | | | | | | | 2,179,343 | |
Shares purchased upon conversion into other share class(es) | | | (166,582 | ) | | | | | | | (2,478,670 | ) |
Net increase (decrease) in shares outstanding | | | (28,582 | ) | | | | | | $ | (299,327 | ) |
PGIM Quant Solutions Large-Cap Core Fund 45
Notes to Financial Statements (continued)
| | | | | | | | | | | | |
| | | | |
Share Class | | | Shares | | | | | | | | Amount | |
| | | |
Year ended October 31, 2021: | | | | | | | | | | | | |
Shares sold | | | 75,244 | | | | | | | $ | 1,234,291 | |
Shares issued in reinvestment of dividends and distributions | | | 31,819 | | | | | | | | 464,240 | |
Shares purchased | | | (182,947 | ) | | | | | | | (2,971,760 | ) |
Net increase (decrease) in shares outstanding before conversion | | | (75,884 | ) | | | | | | | (1,273,229 | ) |
Shares purchased upon conversion into other share class(es) | | | (284,445 | ) | | | | | | | (4,601,367 | ) |
Net increase (decrease) in shares outstanding | | | (360,329 | ) | | | | | | $ | (5,874,596 | ) |
| | | |
Class Z | | | | | | | | | | | | |
Year ended October 31, 2022: | | | | | | | | | | | | |
Shares sold | | | 132,004 | | | | | | | $ | 2,380,417 | |
Shares issued in reinvestment of dividends and distributions | | | 188,283 | | | | | | | | 3,575,495 | |
Shares purchased | | | (345,859 | ) | | | | | | | (6,006,503 | ) |
Net increase (decrease) in shares outstanding before conversion | | | (25,572 | ) | | | | | | | (50,591 | ) |
Shares issued upon conversion from other share class(es) | | | 108,667 | | | | | | | | 1,922,987 | |
Net increase (decrease) in shares outstanding | | | 83,095 | | | | | | | $ | 1,872,396 | |
| | | |
Year ended October 31, 2021: | | | | | | | | | | | | |
Shares sold | | | 2,430,335 | | | | | | | $ | 45,745,515 | |
Shares issued in reinvestment of dividends and distributions | | | 80,721 | | | | | | | | 1,375,492 | |
Shares purchased | | | (824,320 | ) | | | | | | | (15,996,802 | ) |
Net increase (decrease) in shares outstanding before conversion | | | 1,686,736 | | | | | | | | 31,124,205 | |
Shares issued upon conversion from other share class(es) | | | 146,046 | | | | | | | | 2,809,035 | |
Shares purchased upon conversion into other share class(es) | | | (3,701,600 | ) | | | | | | | (77,197,081 | ) |
Net increase (decrease) in shares outstanding | | | (1,868,818 | ) | | | | | | $ | (43,263,841 | ) |
| | | |
Class R6 | | | | | | | | | | | | |
Year ended October 31, 2022: | | | | | | | | | | | | |
Shares sold | | | 9,138,234 | | | | | | | $ | 165,393,560 | |
Shares issued in reinvestment of dividends and distributions | | | 1,981,061 | | | | | | | | 37,719,399 | |
Shares purchased | | | (10,749,193 | ) | | | | | | | (197,351,132 | ) |
Net increase (decrease) in shares outstanding before conversion | | | 370,102 | | | | | | | | 5,761,827 | |
Shares issued upon conversion from other share class(es) | | | 4,909 | | | | | | | | 102,158 | |
Shares purchased upon conversion into other share class(es) | | | (577 | ) | | | | | | | (10,761 | ) |
Net increase (decrease) in shares outstanding | | | 374,434 | | | | | | | $ | 5,853,224 | |
46
| | | | | | | | | | | | |
| | | | |
Share Class | | | Shares | | | | | | | | Amount | |
| | | |
Year ended October 31, 2021: | | | | | | | | | | | | |
Shares sold | | | 5,207,231 | | | | | | | $ | 102,405,348 | |
Shares issued in reinvestment of dividends and distributions | | | 217,932 | | | | | | | | 3,717,913 | |
Shares purchased | | | (4,048,357 | ) | | | | | | | (80,594,303 | ) |
Net increase (decrease) in shares outstanding before conversion | | | 1,376,806 | | | | | | | | 25,528,958 | |
Shares issued upon conversion from other share class(es) | | | 3,703,938 | | | | | | | | 77,392,006 | |
Shares purchased upon conversion into other share class(es) | | | (758 | ) | | | | | | | (16,208 | ) |
Net increase (decrease) in shares outstanding | | | 5,079,986 | | | | | | | $ | 102,904,756 | |
The RIC, on behalf of the Fund, along with other affiliated registered investment companies (the “Participating Funds”), is a party to a Syndicated Credit Agreement (“SCA”) with a group of banks. The purpose of the SCA is to provide an alternative source of temporary funding for capital share redemptions. The table below provides details of the current SCA in effect at the reporting period-end as well as the prior SCA.
| | | | | | |
| | | | |
| | | Current SCA | | | | Prior SCA |
Term of Commitment | | 9/30/2022 - 9/28/2023 | | | | 10/1/2021 – 9/29/2022 |
Total Commitment | | $ 1,200,000,000 | | | | $ 1,200,000,000 |
Annualized Commitment Fee on the Unused Portion of the SCA | | 0.15% | | | | 0.15% |
Annualized Interest Rate on Borrowings | | 1.00% plus the higher of (1) the effective federal funds rate, (2) the daily SOFR rate plus 0.10% or (3) zero percent | | | | 1.20% plus the higher of (1) the effective federal funds rate, (2) the one-month LIBOR rate or (3) zero percent |
Certain affiliated registered investment companies that are parties to the SCA include portfolios that are subject to a predetermined mathematical formula used to manage certain benefit guarantees offered under variable annuity contracts. The formula may result in large scale asset flows into and out of these portfolios. Consequently, these portfolios may be more likely to utilize the SCA for purposes of funding redemptions. It may be possible for those portfolios to fully exhaust the committed amount of the SCA, thereby requiring the Manager to allocate available funding per a Board-approved methodology designed to treat the Participating Funds in the SCA equitably.
The Fund utilized the SCA during the year ended October 31, 2022. The average daily balance for the 8 days that the Fund had loans outstanding during the period was approximately $26,693,000, borrowed at a weighted average interest rate of 1.67%. The maximum loan outstanding amount during the period was $53,926,000. At October 31, 2022, the Fund did not have an outstanding loan amount.
PGIM Quant Solutions Large-Cap Core Fund 47
Notes to Financial Statements (continued)
| 9. | Risks of Investing in the Fund |
The Fund’s risks include, but are not limited to, some or all of the risks discussed below. For further information on the Fund’s risks, please refer to the Fund’s Prospectus and Statement of Additional Information.
Active Trading Risk: The Fund actively and frequently trades its portfolio securities. High portfolio turnover results in higher transaction costs, which can affect the Fund’s performance and have adverse tax consequences. In addition, high portfolio turnover may also mean that a proportionately greater amount of distributions to shareholders will be taxed as ordinary income rather than long-term capital gains compared to investment companies with lower portfolio turnover.
Blend Style Risk: The Fund’s blend investment style may subject the Fund to risks of both value and growth investing. The portion of the Fund’s portfolio that makes investments pursuant to a growth strategy may be subject to above-average fluctuations as a result of seeking higher than average capital growth. The portion of the Fund’s portfolio that makes investments pursuant to a value strategy may be subject to the risk that the market may not recognize a security’s intrinsic value for long periods of time or at all, or that a stock judged to be undervalued may actually be appropriately priced or overvalued. Issuers of value stocks may have experienced adverse business developments or may be subject to special risks that have caused the stock to be out of favor. If the Fund’s assessment of market conditions or a company’s value is inaccurate, the Fund could suffer losses or produce poor performance relative to other funds. Historically, growth stocks have performed best during later stages of economic expansion and value stocks have performed best during periods of economic recovery. Therefore, both styles may over time go in and out of favor with the markets. At times when a style is out of favor, that portion of the portfolio may lag the other portion of the portfolio, which may cause the Fund to underperform the market in general, its benchmark and other mutual funds. Growth and value stocks have historically produced similar long-term results, though each category has periods when it outperforms the other.
Economic and Market Events Risk: Events in the U.S. and global financial markets, including actions taken by the U.S. Federal Reserve or foreign central banks to stimulate or stabilize economic growth or the functioning of the securities markets, or otherwise reduce inflation may at times result in unusually high market volatility, which could negatively impact performance. Governmental efforts to curb inflation often have negative effects on the level of economic activity. Relatively reduced liquidity in credit and fixed income markets could adversely affect issuers worldwide.
Equity and Equity-Related Securities Risk: Equity and equity-related securities may be subject to changes in value, and their values may be more volatile than those of other asset classes. In addition to an individual security losing value, the value of the equity markets or a
48
sector in which the Fund invests could go down. Different parts of a market can react differently to adverse issuer, market, regulatory, political and economic developments.
Increase in Expenses Risk: Your actual cost of investing in the Fund may be higher than the expenses shown in the expense table in the Fund’s prospectus for a variety of reasons. For example, expense ratios may be higher than those shown if average net assets decrease. Net assets are more likely to decrease and Fund expense ratios are more likely to increase when markets are volatile. Active and frequent trading of Fund securities can increase expenses.
Large Capitalization Company Risk: Companies with large market capitalizations go in and out of favor based on market and economic conditions. Larger companies tend to be less volatile than companies with smaller market capitalizations. In exchange for this potentially lower risk, the Fund’s value may not rise or fall as much as the value of funds that emphasize companies with smaller market capitalizations.
Large Shareholder and Large Scale Redemption Risk: Certain individuals, accounts, funds (including funds affiliated with the Manager) or institutions, including the Manager and its affiliates, may from time to time own or control a substantial amount of the Fund’s shares. There is no requirement that these entities maintain their investment in the Fund. There is a risk that such large shareholders or that the Fund’s shareholders generally may redeem all or a substantial portion of their investments in the Fund in a short period of time, which could have a significant negative impact on the Fund’s NAV, liquidity, and brokerage costs. Large redemptions could also result in tax consequences to shareholders and impact the Fund’s ability to implement its investment strategy. The Fund’s ability to pursue its investment objective after one or more large scale redemptions may be impaired and, as a result, the Fund may invest a larger portion of its assets in cash or cash equivalents.
Management Risk: Actively managed funds are subject to management risk. The subadviser will apply investment techniques and risk analyses in making investment decisions for the Fund, but the subadviser’s judgments about the attractiveness, value or market trends affecting a particular security, industry or sector or about market movements may be incorrect. Additionally, the investments selected for the Fund may underperform the markets in general, the Fund’s benchmark and other funds with similar investment objectives.
Market Disruption and Geopolitical Risks: Market disruption can be caused by economic, financial or political events and factors, including but not limited to, international wars or conflicts (including Russia’s military invasion of Ukraine), geopolitical developments (including trading and tariff arrangements, sanctions and cybersecurity attacks), instability in regions such as Asia, Eastern Europe and the Middle East, terrorism, natural disasters and public health epidemics (including the outbreak of COVID-19 globally).
The extent and duration of such events and resulting market disruptions cannot be predicted, but could be substantial and could magnify the impact of other risks to the Fund.
PGIM Quant Solutions Large-Cap Core Fund 49
Notes to Financial Statements (continued)
These and other similar events could adversely affect the U.S. and foreign financial markets and lead to increased market volatility, reduced liquidity in the securities markets, significant negative impacts on issuers and the markets for certain securities and commodities and/or government intervention. They may also cause short- or long-term economic uncertainties in the United States and worldwide. As a result, whether or not the Fund invests in securities of issuers located in or with significant exposure to the countries directly affected, the value and liquidity of the Fund’s investments may be negatively impacted. Further, due to closures of certain markets and restrictions on trading certain securities, the value of certain securities held by the Fund could be significantly impacted, which could lead to such securities being valued at zero.
COVID-19 and the related governmental and public responses have had and may continue to have an impact on the Fund’s investments and net asset value and have led and may continue to lead to increased market volatility and the potential for illiquidity in certain classes of securities and sectors of the market. They have also had and may continue to result in periods of business disruption, business closures, inability to obtain raw materials, supplies and component parts, and reduced or disrupted operations for the issuers in which the Fund invests. The occurrence, reoccurrence and pendency of public health epidemics could adversely affect the economies and financial markets either in specific countries or worldwide.
Market Risk: Securities markets may be volatile and the market prices of the Fund’s securities may decline. Securities fluctuate in price based on changes in an issuer’s financial condition and overall market and economic conditions. If the market prices of the securities owned by the Fund fall, the value of your investment in the Fund will decline.
Model Design Risk: The subadviser uses certain quantitative models to help guide its investment decisions. The design of the underlying models may be flawed or incomplete. The investment models the subadviser uses are based on historical and theoretical underpinnings that it believes are sound. There can be no guarantee, however, that these underpinnings will correlate with security price behavior in the manner assumed by the subadviser’s models. Additionally, the quantitative techniques that underlie the subadviser’s portfolio construction processes may fail to fully anticipate important risks.
Model Implementation Risk: While the subadviser strives to mitigate the likelihood of material implementation errors, it is impossible to completely eliminate the risk of error in the implementation of the computer models that guide the subadviser’s quantitative investment processes. Additionally, it may be difficult to implement model recommendations in volatile and rapidly changing market conditions.
50
Report of Independent Registered Public Accounting Firm
To the Board of Trustees of Prudential Investment Portfolios 9 and Shareholders of PGIM Quant Solutions Large-Cap Core Fund
Opinion on the Financial Statements
We have audited the accompanying statement of assets and liabilities, including the schedule of investments, of PGIM Quant Solutions Large-Cap Core Fund (one of the funds constituting Prudential Investment Portfolios 9, referred to hereafter as the “Fund”) as of October 31, 2022, the related statement of operations for the year ended October 31, 2022, the statements of changes in net assets for each of the two years in the period ended October 31, 2022, including the related notes, and the financial highlights for each of the three years in the period ended October 31, 2022 (collectively referred to as the “financial statements”). In our opinion, the financial statements present fairly, in all material respects, the financial position of the Fund as of October 31, 2022, the results of its operations for the year then ended, the changes in its net assets for each of the two years in the period ended October 31 2022 and the financial highlights for each of the three years in the period ended October 31, 2022 in conformity with accounting principles generally accepted in the United States of America.
The financial statements of the Fund as of and for the year ended October 31, 2019 and the financial highlights for each of the periods ended on or prior to October 31, 2019 (not presented herein, other than the financial highlights) were audited by other auditors whose report dated December 19, 2019 expressed an unqualified opinion on those financial statements and financial highlights.
Basis for Opinion
These financial statements are the responsibility of the Fund’s management. Our responsibility is to express an opinion on the Fund’s financial statements based on our audits. We are a public accounting firm registered with the Public Company Accounting Oversight Board (United States) (PCAOB) and are required to be independent with respect to the Fund in accordance with the U.S. federal securities laws and the applicable rules and regulations of the Securities and Exchange Commission and the PCAOB.
We conducted our audits of these financial statements in accordance with the standards of the PCAOB. Those standards require that we plan and perform the audit to obtain reasonable assurance about whether the financial statements are free of material misstatement, whether due to error or fraud.
Our audits included performing procedures to assess the risks of material misstatement of the financial statements, whether due to error or fraud, and performing procedures that respond to those risks. Such procedures included examining, on a test basis, evidence regarding the amounts and disclosures in the financial statements. Our audits also included evaluating the accounting principles used and significant estimates made by management, as well as evaluating the overall presentation of the financial statements. Our procedures included confirmation of securities owned as of October 31, 2022 by correspondence with the custodian, transfer agent and brokers; when replies were not received from brokers, we performed other auditing procedures. We believe that our audits provide a reasonable basis for our opinion.
/s/PricewaterhouseCoopers LLP
New York, New York
December 16, 2022
We have served as the auditor of one or more investment companies in the PGIM Retail Funds complex since 2020.
PGIM Quant Solutions Large-Cap Core Fund 51
Tax Information (unaudited)
We are advising you that during the fiscal year ended October 31, 2022, the Fund reports the maximum amount allowed per share but not less than $1.22 for Class A, C, Z and R6 shares as a capital gain distribution in accordance with Section 852(b)(3)(C) of the Internal Revenue Code.
For the year ended October 31, 2022, the Fund reports the maximum amount allowable under Section 854 of the Internal Revenue Code, but not less than, the following percentages of the ordinary income dividends paid as 1) qualified dividend income (QDI); and 2) eligible for corporate dividends received deduction (DRD):
| | | | | | |
| | | | |
Fund | | QDI | | | | DRD |
| | | |
PGIM Quant Solutions Large-Cap Core Fund | | 16.92% | | | | 17.00% |
In January 2023, you will be advised on IRS Form 1099-DIV or substitute 1099-DIV, as to the federal tax status of dividends and distributions received by you in calendar year 2022.
52
INFORMATION ABOUT BOARD MEMBERS AND OFFICERS (unaudited)
Information about Board Members and Officers of the Fund is set forth below. Board Members who are not deemed to be “interested persons” of the Fund, as defined in the 1940 Act, are referred to as “Independent Board Members.” Board Members who are deemed to be “interested persons” of the Fund are referred to as “Interested Board Members.” The Board Members are responsible for the overall supervision of the operations of the Fund and perform the various duties imposed on the directors of investment companies by the 1940 Act. The Board in turn elects the Officers, who are responsible for administering the day-to-day operations of the Fund.
| | | | | | |
| |
Independent Board Members |
| | | | |
Name Year of Birth Position(s) Portfolios Overseen | | Principal Occupation(s) During Past Five Years | | Other Directorships Held During Past Five Years | | Length of Board Service |
| | | | |
Ellen S. Alberding 1958 Board Member Portfolios Overseen: 97 | | President and Board Member, The Joyce Foundation (charitable foundation) (since 2002); formerly Vice Chair, City Colleges of Chicago (community college system) (2011-2015); Trustee, National Park Foundation (charitable foundation for national park system) (2009-2018); Trustee, Economic Club of Chicago (2009-2016); Trustee, Loyola University (since 2018). | | None. | | Since September 2013 |
| | | | |
Kevin J. Bannon 1952 Board Member Portfolios Overseen: 97 | | Retired; formerly Managing Director (April 2008-May 2015) and Chief Investment Officer (October 2008-November 2013) of Highmount Capital LLC (registered investment adviser); formerly Executive Vice President and Chief Investment Officer (April 1993-August 2007) of Bank of New York Company; President (May 2003-May 2007) of BNY Hamilton Family of Mutual Funds. | | Director of Urstadt Biddle Properties (equity real estate investment trust) (since September 2008). | | Since July 2008 |
PGIM Quant Solutions Large-Cap Core Fund
| | | | | | |
| |
Independent Board Members |
| | | | |
Name Year of Birth Position(s) Portfolios Overseen | | Principal Occupation(s) During Past Five Years | | Other Directorships Held During Past Five Years | | Length of Board Service |
| | | | |
Linda W. Bynoe 1952 Board Member Portfolios Overseen: 94 | | President and Chief Executive Officer (since March 1995) and formerly Chief Operating Officer (December 1989-February 1995) of Telemat Limited LLC (formerly Telemat Ltd) (management consulting); formerly Vice President (January 1985-June 1989) at Morgan Stanley & Co. (broker-dealer). | | Trustee of Equity Residential (residential real estate) (since December 2009); Director of Northern Trust Corporation (financial services) (since April 2006); formerly Director of Anixter International, Inc. (communication products distributor) (January 2006-June 2020). | | Since March 2005 |
| | | | |
Barry H. Evans 1960 Board Member Portfolios Overseen: 96 | | Retired; formerly President (2005-2016), Global Chief Operating Officer (2014-2016), Chief Investment Officer - Global Head of Fixed Income (1998-2014), and various portfolio manager roles (1986-2006), Manulife Asset Management (asset management). | | Formerly Director, Manulife Trust Company (2011-2018); formerly Director, Manulife Asset Management Limited (2015-2017); formerly Chairman of the Board of Directors of Manulife Asset Management U.S. (2005-2016); formerly Chairman of the Board, Declaration Investment Management and Research (2008-2016). | | Since September 2017 |
| | | | |
Keith F. Hartstein 1956 Board Member & Independent Chair Portfolios Overseen: 97 | | Retired; Member (November 2014-September 2022) of the Governing Council of the Independent Directors Council (IDC) (organization of independent mutual fund directors); formerly Executive Committee of the IDC Board of Governors (October 2019-December 2021); formerly President and Chief Executive Officer (2005-2012), Senior Vice President (2004-2005), Senior Vice President of Sales and Marketing (1997-2004), and various executive management positions (1990-1997), John Hancock Funds, LLC (asset management); Chairman, Investment Company Institute’s Sales Force Marketing Committee (2003-2008). | | None. | | Since September 2013 |
Visit our website at pgim.com/investments
| | | | | | |
| |
Independent Board Members |
| | | | |
Name Year of Birth Position(s) Portfolios Overseen | | Principal Occupation(s) During Past Five Years | | Other Directorships Held During Past Five Years | | Length of Board Service |
| | | | |
Laurie Simon Hodrick 1962 Board Member Portfolios Overseen: 93 | | A. Barton Hepburn Professor Emerita of Economics in the Faculty of Business, Columbia Business School (since 2018); Visiting Fellow at the Hoover Institution, Stanford University (since 2015); Sole Member, ReidCourt LLC (since 2008) (a consulting firm); formerly Visiting Professor of Law, Stanford Law School (2015-2021); formerly A. Barton Hepburn Professor of Economics in the Faculty of Business, Columbia Business School (1996-2017); formerly Managing Director, Global Head of Alternative Investment Strategies, Deutsche Bank (2006-2008). | | Independent Director, Andela (since January 2022) (global talent network); Independent Director, Roku (since December 2020) (communication services); formerly Independent Director, Synnex Corporation (2019-2021) (information technology); formerly Independent Director, Kabbage, Inc. (2018-2020) (financial services); formerly Independent Director, Corporate Capital Trust (2017-2018) (a business development company). | | Since September 2017 |
| | | | |
Brian K. Reid 1961 Board Member Portfolios Overseen: 96 | | Retired; formerly Chief Economist for the Investment Company Institute (ICI) (2005-2017); formerly Senior Economist and Director of Industry and Financial Analysis at the ICI (1998-2004); formerly Senior Economist, Industry and Financial Analysis at the ICI (1996-1998); formerly Staff Economist at the Federal Reserve Board (1989-1996); Director, ICI Mutual Insurance Company (2012-2017). | | None. | | Since March 2018 |
PGIM Quant Solutions Large-Cap Core Fund
| | | | | | |
| |
Independent Board Members |
| | | | |
Name Year of Birth Position(s) Portfolios Overseen | | Principal Occupation(s) During Past Five Years | | Other Directorships Held During Past Five Years | | Length of Board Service |
| | | | |
Grace C. Torres 1959 Board Member Portfolios Overseen: 96 | | Retired; formerly Treasurer and Principal Financial and Accounting Officer of the PGIM Funds, Target Funds, Advanced Series Trust, Prudential Variable Contract Accounts and The Prudential Series Fund (1998-June 2014); Assistant Treasurer (March 1999-June 2014) and Senior Vice President (September 1999-June 2014) of PGIM Investments LLC; Assistant Treasurer (May 2003-June 2014) and Vice President (June 2005-June 2014) of AST Investment Services, Inc.; Senior Vice President and Assistant Treasurer (May 2003-June 2014) of Prudential Annuities Advisory Services, Inc. | | Director (since January 2018) of OceanFirst Financial Corp. and OceanFirst Bank; formerly Director (July 2015-January 2018) of Sun Bancorp, Inc. N.A. and Sun National Bank. | | Since November 2014 |
Visit our website at pgim.com/investments
| | | | | | |
| |
Interested Board Members |
| | | | |
Name Year of Birth Position(s) Portfolios Overseen | | Principal Occupation(s) During Past Five Years | | Other Directorships Held During Past Five Years | | Length of Board Service |
| | | | |
Stuart S. Parker 1962 Board Member & President Portfolios Overseen: 96 | | President, Chief Executive Officer, Chief Operating Officer and Officer in Charge of PGIM Investments LLC (formerly known as Prudential Investments LLC) (since January 2012); President and Principal Executive Officer (“PEO”) (since September 2022) of the PGIM Private Credit Fund; President and PEO (since March 2022) of the PGIM Private Real Estate Fund, Inc.; formerly Executive Vice President of Jennison Associates LLC and Head of Retail Distribution of PGIM Investments LLC (June 2005-December 2011); Investment Company Institute - Board of Governors (since May 2012). | | None. | | Since January 2012 |
| | | | |
Scott E. Benjamin 1973 Board Member & Vice President Portfolios Overseen: 97 | | Executive Vice President (since May 2009) of PGIM Investments LLC; Vice President (since June 2012) of Prudential Investment Management Services LLC; Executive Vice President (since September 2009) of AST Investment Services, Inc.; Senior Vice President of Product Development and Marketing, PGIM Investments (since February 2006); Vice President (since September 2022) of the PGIM Private Credit Fund; Vice President (since March 2022) of the PGIM Private Real Estate Fund, Inc.; formerly Vice President of Product Development and Product Management, PGIM Investments LLC (2003-2006). | | None. | | Since March 2010 |
PGIM Quant Solutions Large-Cap Core Fund
| | | | |
| |
Fund Officers(a) |
| | | |
Name Year of Birth Fund Position | | Principal Occupation(s) During Past Five Years | | Length of Service as Fund Officer |
| | | |
Claudia DiGiacomo 1974 Chief Legal Officer | | Chief Legal Officer (since September 2022) of the PGIM Private Credit Fund; Chief Legal Officer (since July 2022) of the PGIM Private Real Estate Fund, Inc.; Chief Legal Officer, Executive Vice President and Secretary of PGIM Investments LLC (since August 2020); Chief Legal Officer of Prudential Mutual Fund Services LLC (since August 2020); Chief Legal Officer of PIFM Holdco, LLC (since August 2020); Vice President and Corporate Counsel (since January 2005) of Prudential; and Corporate Counsel of AST Investment Services, Inc. (since August 2020); formerly Vice President and Assistant Secretary of PGIM Investments LLC (2005-2020); formerly Associate at Sidley Austin Brown & Wood LLP (1999-2004). | | Since December 2005 |
| | | |
Isabelle Sajous 1976 Chief Compliance Officer | | Chief Compliance Officer (since April 2022) of PGIM Investments LLC, the PGIM Funds, Target Funds, PGIM ETF Trust, PGIM Global High Yield Fund, Inc., PGIM High Yield Bond Fund, Inc., PGIM Short Duration High Yield Opportunities Fund, Advanced Series Trust, The Prudential Series Fund and Prudential’s Gibraltar Fund, Inc.; Chief Compliance Officer (since September 2022) of the PGIM Private Credit Fund; Chief Compliance Officer (since March 2022) of the PGIM Private Real Estate Fund, Inc.; Vice President, Compliance of PGIM Investments LLC (since December 2020); formerly Director, Compliance (July 2018-December 2020) of Credit Suisse Asset Management LLC; and Vice President, Associate General Counsel & Deputy Chief Compliance Officer of Cramer Rosenthal McGlynn, LLC (August 2014-July 2018). | | Since April 2022 |
| | | |
Andrew R. French 1962 Secretary | | Vice President (since December 2018) of PGIM Investments LLC; Secretary (since September 2022) of the PGIM Private Credit Fund; Secretary (since March 2022) of the PGIM Private Real Estate Fund, Inc.; formerly Vice President and Corporate Counsel (2010-2018) of Prudential; formerly Director and Corporate Counsel (2006-2010) of Prudential; Vice President and Assistant Secretary (since January 2007) of PGIM Investments LLC; Vice President and Assistant Secretary (since January 2007) of Prudential Mutual Fund Services LLC. | | Since October 2006 |
| | | |
Melissa Gonzalez 1980 Assistant Secretary | | Vice President and Corporate Counsel (since September 2018) of Prudential; Vice President and Assistant Secretary (since August 2020) of PGIM Investments LLC; Assistant Secretary (since September 2022) of the PGIM Private Credit Fund; Assistant Secretary (since March 2022) of the PGIM Private Real Estate Fund, Inc.; formerly Director and Corporate Counsel (March 2014-September 2018) of Prudential. | | Since March 2020 |
Visit our website at pgim.com/investments
| | | | |
| |
Fund Officers(a) |
| | | |
Name Year of Birth Fund Position | | Principal Occupation(s) During Past Five Years | | Length of Service as Fund Officer |
| | | |
Patrick E. McGuinness 1986 Assistant Secretary | | Vice President and Assistant Secretary (since August 2020) of PGIM Investments LLC; Director and Corporate Counsel (since February 2017) of Prudential; Assistant Secretary (since September 2022) of the PGIM Private Credit Fund; Assistant Secretary (since March 2022) of the PGIM Private Real Estate Fund, Inc. | | Since June 2020 |
| | | |
Debra Rubano 1975 Assistant Secretary | | Vice President and Corporate Counsel (since November 2020) of Prudential; Assistant Secretary (since September 2022) of the PGIM Private Credit Fund; Assistant Secretary (since March 2022) of the PGIM Private Real Estate Fund, Inc; formerly Director and Senior Counsel of Allianz Global Investors U.S. Holdings LLC (2010-2020) and Assistant Secretary of numerous funds in the Allianz fund complex (2015-2020). | | Since December 2020 |
| | | |
Kelly A. Coyne 1968 Assistant Secretary | | Director, Investment Operations of Prudential Mutual Fund Services LLC (since 2010); Assistant Secretary (since September 2022) of the PGIM Private Credit Fund; Assistant Secretary (since March 2022) of the PGIM Private Real Estate Fund, Inc. | | Since March 2015 |
| | | |
Christian J. Kelly 1975 Treasurer and Principal Financial and Accounting Officer | | Vice President, Head of Fund Administration of PGIM Investments LLC (since November 2018); Principal Financial Officer (since September 2022) of the PGIM Private Credit Fund; Principal Financial Officer (since March 2022) of the PGIM Private Real Estate Fund, Inc.; formerly, Treasurer and Principal Accounting Officer (March 2022- July 2022) of the PGIM Private Real Estate Fund, Inc.; formerly Director of Fund Administration of Lord Abbett & Co. LLC (2009-2018), Treasurer and Principal Accounting Officer of the Lord Abbett Family of Funds (2017-2018); Director of Accounting, Avenue Capital Group (2008-2009); Senior Manager, Investment Management Practice of Deloitte & Touche LLP (1998-2007). | | Since January 2019 |
| | | |
Lana Lomuti 1967 Assistant Treasurer | | Vice President (since 2007) and Director (2005-2007), within PGIM Investments Fund Administration; formerly Assistant Treasurer (December 2007-February 2014) of The Greater China Fund, Inc. | | Since April 2014 |
| | | |
Russ Shupak 1973 Assistant Treasurer | | Vice President (since 2017) and Director (2013-2017), within PGIM Investments Fund Administration; Treasurer and Principal Accounting Officer (since July 2022) of the PGIM Private Real Estate Fund, Inc.; Assistant Treasurer (since September 2022) of the PGIM Private Credit Fund; formerly Assistant Treasurer (March 2022 – July 2022) of the PGIM Private Real Estate Fund, Inc. | | Since October 2019 |
| | | |
Deborah Conway 1969 Assistant Treasurer | | Vice President (since 2017) and Director (2007-2017), within PGIM Investments Fund Administration. | | Since October 2019 |
PGIM Quant Solutions Large-Cap Core Fund
| | | | |
| | | |
Fund Officers(a) | | | | |
| | | |
Name Year of Birth Fund Position | | Principal Occupation(s) During Past Five Years | | Length of Service as Fund Officer |
| | | |
Elyse M. McLaughlin 1974 Assistant Treasurer | | Vice President (since 2017) and Director (2011-2017), within PGIM Investments Fund Administration; Treasurer and Principal Accounting Officer (since September 2022) of the PGIM Private Credit Fund; Assistant Treasurer (since March 2022) of the PGIM Private Real Estate Fund, Inc. | | Since October 2019 |
| | | |
Kelly Florio 1978 Anti-Money Laundering Compliance Officer | | Vice President, Corporate Compliance, Global Compliance Programs and Compliance Risk Management (since December 2021) of Prudential; formerly, Head of Fraud Risk Management (October 2019 to December 2021) at New York Life Insurance Company; formerly, Head of Key Risk Area Operations (November 2018 to October 2019), Director of the US Anti-Money Laundering Compliance Unit (2009-2018) and Bank Loss Prevention Associate (2006 -2009) at MetLife. | | Since June 2022 |
| (a) | Excludes Mr. Parker and Mr. Benjamin, interested Board Members who also serve as President and Vice President, respectively. |
Explanatory Notes to Tables:
| ∎ | | Board Members are deemed to be “Interested,” as defined in the 1940 Act, by reason of their affiliation with PGIM Investments LLC and/or an affiliate of PGIM Investments LLC. |
| ∎ | | Unless otherwise noted, the address of all Board Members and Officers is c/o PGIM Investments LLC, 655 Broad Street, Newark, New Jersey 07102-4410. |
| ∎ | | There is no set term of office for Board Members or Officers. The Board Members have adopted a retirement policy, which calls for the retirement of Board Members on December 31 of the year in which they reach the age of 75. |
| ∎ | | “Other Directorships Held” includes all directorships of companies required to register or file reports with the SEC under the 1934 Act (that is, “public companies”) or other investment companies registered under the 1940 Act. |
| ∎ | | “Portfolios Overseen” includes all investment companies managed by PGIM Investments LLC. The investment companies for which PGIM Investments LLC serves as manager include the PGIM Mutual Funds, Target Funds, The Prudential Variable Contract Accounts, PGIM ETF Trust, PGIM Private Real Estate Fund, Inc., PGIM Private Credit Fund, PGIM High Yield Bond Fund, Inc., PGIM Global High Yield Fund, Inc., PGIM Short Duration High Yield Opportunities Fund, The Prudential Series Fund, Prudential’s Gibraltar Fund, Inc. and the Advanced Series Trust. |
| ∎ | | As used in the Fund Officers table “Prudential” means The Prudential Insurance Company of America. |
Visit our website at pgim.com/investments
Approval of Advisory Agreements (unaudited)
The Fund’s Board of Trustees
The Board of Trustees (the “Board”) of PGIM Quant Solutions Large-Cap Core Fund, (formerly PGIM QMA Large-Cap Core Equity Fund), (the “Fund”)1 consists of ten individuals, eight of whom are not “interested persons” of the Fund, as defined in the Investment Company Act of 1940, as amended (the “1940 Act”) (the “Independent Trustees”). The Board is responsible for the oversight of the Fund and its operations, and performs the various duties imposed on the directors of investment companies by the 1940 Act. The Independent Trustees have retained independent legal counsel to assist them in connection with their duties. The Chair of the Board is an Independent Trustee. The Board has established five standing committees: the Audit Committee, the Nominating and Governance Committee, the Compliance Committee and two Investment Committees. Each committee is chaired by, and composed of, Independent Trustees.
Annual Approval of the Fund’s Advisory Agreements
As required under the 1940 Act, the Board determines annually whether to renew the Fund’s management agreement with PGIM Investments LLC (“PGIM Investments”) and the Fund’s subadvisory agreement with PGIM Quantitative Solutions LLC (“PGIM Quantitative Solutions”). In considering the renewal of the agreements, the Board, including all of the Independent Trustees, met on May 26 and June 7-9, 2022 (the “Board Meeting”) and approved the renewal of the agreements through July 31, 2023, after concluding that the renewal of the agreements was in the best interests of the Fund and its shareholders.
In advance of the meetings, the Board requested and received materials relating to the agreements, and had the opportunity to ask questions and request further information in connection with its consideration. Among other things, the Board considered comparative fee information from PGIM Investments and PGIM Quantitative Solutions. Also, the Board considered comparisons with other mutual funds in relevant Peer Universes and Peer Groups, as is further discussed below.
In approving the agreements, the Board, including the Independent Trustees advised by independent legal counsel, considered the factors it deemed relevant, including the nature, quality and extent of services provided by PGIM Investments and the subadviser, the performance of the Fund, the profitability of PGIM Investments and its affiliates, expenses and fees, and the potential for economies of scale that may be shared with the Fund and its shareholders as the Fund’s assets grow. In their deliberations, the Trustees did not identify any single factor which alone was responsible for the Board’s decision to approve the agreements with respect to the Fund. In connection with its deliberations, the Board considered information provided by PGIM Investments throughout the year at regular Board meetings, presentations from portfolio managers and other information, as well as information furnished at or in advance of the Board Meeting.
1 PGIM Quant Solutions Large-Cap Core Fund is a series of Prudential Investment Portfolios 9.
PGIM Quant Solutions Large-Cap Core Fund
Approval of Advisory Agreements (continued)
The Trustees determined that the overall arrangements between the Fund and PGIM Investments, which serves as the Fund’s investment manager pursuant to a management agreement, and between PGIM Investments and PGIM Quantitative Solutions, which serves as the Fund’s subadviser pursuant to the terms of a subadvisory agreement with PGIM Investments, are in the best interests of the Fund and its shareholders in light of the services performed, fees charged and such other matters as the Trustees considered relevant in the exercise of their business judgment.
The material factors and conclusions that formed the basis for the Trustees’ reaching their determinations to approve the continuance of the agreements are separately discussed below.
Nature, Quality and Extent of Services
The Board received and considered information regarding the nature, quality and extent of services provided to the Fund by PGIM Investments and PGIM Quantitative Solutions. The Board noted that PGIM Quantitative Solutions is affiliated with PGIM Investments. The Board considered the services provided by PGIM Investments, including but not limited to the oversight of the subadviser for the Fund, as well as the provision of fund recordkeeping, compliance and other services to the Fund, and PGIM Investments’ role as administrator for the Fund’s liquidity risk management program. With respect to PGIM Investments’ oversight of the subadviser, the Board noted that PGIM Investments’ Strategic Investment Research Group (“SIRG”), which is a business unit of PGIM Investments, is responsible for monitoring and reporting to PGIM Investments’ senior management on the performance and operations of the subadviser. The Board also considered that PGIM Investments pays the salaries of all of the officers and interested Trustees of the Fund who are part of Fund management. The Board also considered the investment subadvisory services provided by PGIM Quantitative Solutions, including investment research and security selection, as well as adherence to the Fund’s investment restrictions and compliance with applicable Fund policies and procedures. The Board considered PGIM Investments’ evaluation of the subadviser, as well as PGIM Investments’ recommendation, based on its review of the subadviser, to renew the subadvisory agreement.
The Board considered the qualifications, backgrounds and responsibilities of PGIM Investments’ senior management responsible for the oversight of the Fund and PGIM Quantitative Solutions, and also considered the qualifications, backgrounds and responsibilities of PGIM Quantitative Solutions’ portfolio managers who are responsible for the day-to-day management of the Fund’s portfolio. The Board was provided with information pertaining to PGIM Investments’ and PGIM Quantitative Solutions’ organizational structure, senior management, investment operations, and other relevant information pertaining to both PGIM Investments and PGIM Quantitative Solutions. The Board also noted that it received favorable compliance reports from the Fund’s Chief Compliance Officer (“CCO”) as to both PGIM Investments and PGIM Quantitative Solutions.
Visit our website at pgim.com/investments
The Board concluded that it was satisfied with the nature, extent and quality of the investment management services provided by PGIM Investments and the subadvisory services provided to the Fund by PGIM Quantitative Solutions, and that there was a reasonable basis on which to conclude that the Fund benefits from the services provided by PGIM Investments and PGIM Quantitative Solutions under the management and subadvisory agreements.
Costs of Services and Profits Realized by PGIM Investments
The Board was provided with information on the profitability of PGIM Investments and its affiliates in serving as the Fund’s investment manager. The Board discussed with PGIM Investments the methodology utilized in assembling the information regarding profitability and considered its reasonableness. The Board recognized that it is difficult to make comparisons of profitability from fund management contracts because comparative information is not generally publicly available and is affected by numerous factors, including the structure of the particular adviser, the types of funds it manages, its business mix, numerous assumptions regarding allocations and the adviser’s capital structure and cost of capital. However, the Board considered that the cost of services provided by PGIM Investments during the year ended December 31, 2021 exceeded the management fees paid by the Fund, resulting in an operating loss to PGIM Investments. Taking these factors into account, the Board concluded that the profitability of PGIM Investments and its affiliates in relation to the services rendered was not unreasonable.
Economies of Scale
The Board received and discussed information concerning economies of scale that PGIM Investments may realize as the Fund’ s assets grow beyond current levels. The Board noted that the management fee schedule for the Fund includes breakpoints, which have the effect of decreasing the fee rate as assets increase. During the course of time, the Board has considered information regarding the launch date of the Fund, the management fees of the Fund compared to those of similarly managed funds and PGIM Investments’ investment in the Fund over time. The Board noted that economies of scale can be shared with the Fund in other ways, including low management fees from inception, additional technological and personnel investments to enhance shareholder services, and maintaining existing expense structures in the face of a rising cost environment. The Board also considered PGIM Investments’ assertion that it continually evaluates the management fee schedule of the Fund and the potential to share economies of scale through breakpoints or fee waivers as asset levels increase.
The Board recognized the inherent limitations of any analysis of economies of scale, stemming largely from the Board’s understanding that most of PGIM Investments’ costs are not specific to individual funds, but rather are incurred across a variety of products and services.
PGIM Quant Solutions Large-Cap Core Fund
Approval of Advisory Agreements (continued)
Other Benefits to PGIM Investments and PGIM Quantitative Solutions
The Board considered potential ancillary benefits that might be received by PGIM Investments, PGIM Quantitative Solutions and their affiliates as a result of their relationship with the Fund. The Board concluded that potential benefits to be derived by PGIM Investments included transfer agency fees received by the Fund’ s transfer agent (which is affiliated with PGIM Investments), and benefits to its reputation as well as other intangible benefits resulting from PGIM Investments’ association with the Fund. The Board concluded that the potential benefits to be derived by PGIM Quantitative Solutions included its ability to use soft dollar credits, as well as the potential benefits consistent with those generally resulting from an increase in assets under management, specifically, potential access to additional research resources and benefits to its reputation. The Board concluded that the benefits derived by PGIM Investments and PGIM Quantitative Solutions were consistent with the types of benefits generally derived by investment managers and subadvisers to mutual funds.
Performance of the Fund / Fees and Expenses
The Board considered certain additional factors and made related conclusions relating to the historical performance of the Fund for the one-, three-, five- and ten-year periods ended December 31, 2021.
The Board also considered the Fund’s actual management fee, as well as the Fund’s net total expense ratio, for the fiscal year ended October 31, 2021. The Board considered the management fee for the Fund as compared to the management fee charged by PGIM Investments to other funds and the fee charged by other advisers to comparable mutual funds in a Peer Group. The actual management fee represents the fee rate actually paid by Fund shareholders and includes any fee waivers or reimbursements. The net total expense ratio for the Fund represents the actual expense ratio incurred by Fund shareholders.
The mutual funds included in the Peer Universe, which was used to consider performance, and the Peer Group, which was used to consider expenses and fees, were objectively determined by Broadridge, an independent provider of mutual fund data. In certain circumstances, PGIM Investments also provided supplemental Peer Universe or Peer Group information for reasons addressed with the Board. The comparisons placed the Fund in various quartiles over various periods, with the first quartile being the best 25% of the mutual funds (for performance, the best performing mutual funds and, for expenses, the lowest cost mutual funds).
The section below summarizes key factors considered by the Board and the Board’s conclusions regarding the Fund’s performance, fees and overall expenses. The table sets forth net performance comparisons (which reflect the impact on performance of fund expenses, or any subsidies, expense caps or waivers that may be applicable) with the Peer Universe, actual management fees with the Peer Group (which reflect the
Visit our website at pgim.com/investments
impact of any subsidies or fee waivers), and net total expenses with the Peer Group, each of which were key factors considered by the Board.
| | | | | | | | |
| | | | | |
Net Performance | | 1 Year | | 3 Years | | 5 Years | | 10 Years |
| | 1st Quartile | | 4th Quartile | | 3rd Quartile | | 3rd Quartile |
| |
Actual Management Fees: 1st Quartile |
| |
Net Total Expenses: 1st Quartile |
| | · | | The Board noted that the Fund outperformed its benchmark index over the one-year period but underperformed over the three-, five-, and ten-year periods. |
| | · | | The Board considered PGIM Investments’ assertions that the subadviser’s bias toward stocks that trade at a price discount drove outperformance over the one-year period as the value style factor reversed course in 2021, and as markets normalize, PGIM Investments expects this Fund to continue to generate outperformance. |
| | · | | The Board noted that most recent underperformance streak (2018 to 2020) was the longest since the global financial crisis in terms of length and magnitude, and that prior to 2018, the Fund outperformed in seven of ten calendar years from 2008 – 2017 on a gross basis. |
| | · | | The Board and PGIM Investments agreed to retain the existing contractual expense cap, which (exclusive of certain fees and expenses) caps the Fund’s net annual operating expenses at 0.35% for each class of the Fund’s shares through February 28, 2023. |
| | · | | The Board and PGIM Investments also agreed to retain the existing contractual expense cap that (exclusive of certain fees and expenses) limits the Fund’s total annual operating expenses to 0.72% of the average daily net assets for Class A shares, and 1.44% of the average daily net assets for Class C shares, through February 28, 2023. |
| | · | | In addition, PGIM Investments will waive management fees or shared operating expenses on any share class to the same extent that it waives such expenses on any other share class, and has agreed that total annual fund operating expenses for Class R6 shares will not exceed total annual fund operating expenses for Class Z shares. |
| | · | | The Board concluded that, in light of the above, it would be in the best interests of the Fund and its shareholders to renew the agreements. |
| | · | | The Board concluded that the management fees (including subadvisory fees) and total expenses were reasonable in light of the services provided. |
PGIM Quant Solutions Large-Cap Core Fund
Approval of Advisory Agreements (continued)
* * *
After full consideration of these factors, the Board concluded that the approval of the agreements was in the best interests of the Fund and its shareholders
Visit our website at pgim.com/investments
| | | | |
| | | |
⬛ MAIL 655 Broad Street Newark, NJ 07102 | | ⬛ TELEPHONE (800) 225-1852 | | ⬛ WEBSITE pgim.com/investments |
PROXY VOTING
The Board of Trustees of the Fund has delegated to the Fund’ s subadviser the responsibility for voting any proxies and maintaining proxy recordkeeping with respect to the Fund. A description of these proxy voting policies and procedures is available without charge, upon request, by calling (800) 225-1852 or by visiting the Securities and Exchange Commission’s website at sec.gov. Information regarding how the Fund voted proxies relating to portfolio securities during the most recent 12-month period ended June 30 is available on the Fund’s website and on the Securities and Exchange Commission’s website.
TRUSTEES
Ellen S. Alberding ● Kevin J. Bannon ● Scott E. Benjamin ● Linda W. Bynoe ● Barry H. Evans ● Keith F. Hartstein ● Laurie Simon Hodrick ● Stuart S. Parker ● Brian K. Reid ● Grace C. Torres
OFFICERS
Stuart S. Parker, President ● Scott E. Benjamin, Vice President ● Christian J. Kelly, Treasurer and Principal Financial and Accounting Officer ● Claudia DiGiacomo, Chief Legal Officer ● Isabelle Sajous, Chief Compliance Officer ● Kelly Florio, Anti-Money Laundering Compliance Officer ● Andrew R. French, Secretary ● Melissa Gonzalez, Assistant Secretary ● Kelly A. Coyne, Assistant Secretary ● Patrick E. McGuinness, Assistant Secretary ● Debra Rubano, Assistant Secretary ● Lana Lomuti, Assistant Treasurer ● Russ Shupak, Assistant Treasurer ● Elyse M. McLaughlin, Assistant Treasurer ● Deborah Conway, Assistant Treasurer
| | | | |
MANAGER | | PGIM Investments LLC | | 655 Broad Street Newark, NJ 07102 |
| | |
SUBADVISER | | PGIM Quantitative Solutions LLC | | Gateway Center Two 100 Mulberry Street Newark, NJ 07102 |
| | |
DISTRIBUTOR | | Prudential Investment Management Services LLC | | 655 Broad Street Newark, NJ 07102 |
| | |
CUSTODIAN | | The Bank of New York Mellon | | 240 Greenwich Street New York, NY 10286 |
| | |
TRANSFER AGENT | | Prudential Mutual Fund Services LLC | | PO Box 9658 Providence, RI 02940 |
| | |
INDEPENDENT REGISTERED PUBLIC ACCOUNTING FIRM | | PricewaterhouseCoopers LLP | | 300 Madison Avenue New York, NY 10017 |
| | |
FUND COUNSEL | | Willkie Farr & Gallagher LLP | | 787 Seventh Avenue New York, NY 10019 |
An investor should consider the investment objectives, risks, charges, and expenses of the Fund carefully before investing. The prospectus and summary prospectus contain this and other information about the Fund. An investor may obtain the prospectus and summary prospectus by visiting our website at pgim.com/investments or by calling (800) 225-1852. The prospectus and summary prospectus should be read carefully before investing.
E-DELIVERY
To receive your mutual fund documents online, go to pgim.com/investments/resource/edelivery and enroll. Instead of receiving printed documents by mail, you will receive notification via email when new materials are available. You can cancel your enrollment or change your email address at any time by visiting the website address above.
SHAREHOLDER COMMUNICATIONS WITH TRUSTEES
Shareholders can communicate directly with the Board of Trustees by writing to the Chair of the Board, PGIM Quant Solutions Large-Cap Core Fund, PGIM Investments, Attn: Board of Trustees, 655 Broad Street, Newark, NJ 07102. Shareholders can communicate directly with an individual Trustee by writing to that Trustee at the same address. Communications are not screened before being delivered to the addressee.
AVAILABILITY OF PORTFOLIO HOLDINGS
The Fund files its complete schedule of portfolio holdings with the Securities and Exchange Commission for the first and third quarters of each fiscal year as an exhibit to its reports on Form N-PORT. The Fund’s Form N-PORT filings are available on the Commission’s website at sec.gov.
The Fund’s Statement of Additional Information contains additional information about the Fund’s Trustees and is available without charge, upon request, by calling (800) 225-1852.
Mutual Funds:
| | | | |
| | | |
ARE NOT INSURED BY THE FDIC OR ANY FEDERAL GOVERNMENT AGENCY | | MAY LOSE VALUE | | ARE NOT A DEPOSIT OF OR GUARANTEED BY ANY BANK OR ANY BANK AFFILIATE |
PGIM QUANT SOLUTIONS LARGE-CAP CORE FUND
| | | | | | | | | | | | |
| | | | | |
| SHARE CLASS | | | | | A | | C | | Z | | R6 |
| | | | | |
NASDAQ | | | | | | PTMAX | | PTMCX | | PTEZX | | PTMQX |
| | | | | |
CUSIP | | | | | | 74441J100 | | 74441J308 | | 74441J407 | | 74441J688 |
MF187E

PGIM REAL ESTATE INCOME FUND
ANNUAL REPORT
OCTOBER 31, 2022

To enroll in e-delivery, go to pgim.com/investments/resource/edelivery
Table of Contents
This report is not authorized for distribution to prospective investors unless preceded or accompanied by a current prospectus.
The views expressed in this report and information about the Fund’s portfolio holdings are for the period covered by this report and are subject to change thereafter.
Mutual funds are distributed by Prudential Investment Management Services LLC (PIMS), member SIPC. PGIM Real Estate is a unit of PGIM, Inc. (PGIM), a registered investment adviser. PIMS and PGIM are Prudential Financial companies. © 2022 Prudential Financial, Inc. and its related entities. PGIM Real Estate, PGIM, and the PGIM logo are service marks of Prudential Financial, Inc. and its related entities, registered in many jurisdictions worldwide.
2 Visit our website at pgim.com/investments
Letter from the President
| | |
 | | Dear Shareholder: |
| | We hope you find the annual report for the PGIM Real Estate Income Fund informative and useful. The report covers performance for the 12-month period that ended October 31, 2022. |
| | The attention of the global economy and financial markets pivoted during the period from the COVID-19 pandemic to the challenge of rapidly rising inflation. While job growth remained strong, prices for a wide range of goods and services rose in response to economic re-openings, supply-chain disruptions, governmental stimulus, and Russia’s invasion of Ukraine. With inflation surging to a 40-year high, the Federal Reserve and other central banks aggressively hiked interest rates, prompting recession concerns. |
After rising to record levels at the end of 2021, stocks have fallen sharply in 2022 as investors worried about higher prices, slowing economic growth, geopolitical uncertainty, and new COVID-19 outbreaks. Equities rallied for a time during the summer but began falling again in late August on fears that the Fed would keep raising rates to tame inflation. For the entire 12-month period, equities suffered a broad-based global decline, although large-cap US stocks outperformed their small-cap counterparts. International developed and emerging markets trailed the US market during this time.
Rising rates and economic uncertainty drove fixed income prices broadly lower as well. US and global investment-grade bonds, along with US high yield corporate bonds and emerging market debt, all posted negative returns during the period.
Regarding your investments with PGIM, we believe it is important to maintain a diversified portfolio of funds consistent with your tolerance for risk, time horizon, and financial goals. Your financial advisor can help you create a diversified investment plan that may include funds covering all the basic asset classes and that reflects your personal investor profile and risk tolerance. However, diversification and asset allocation strategies do not assure a profit or protect against loss in declining markets.
At PGIM Investments, we provide access to active investment strategies across the global markets in the pursuit of consistent outperformance for investors. PGIM is the world’s 11th-largest investment manager with more than $1.5 trillion in assets under management. Our scale and investment expertise allow us to deliver a diversified suite of actively managed solutions across a broad spectrum of asset classes and investment styles.
Thank you for choosing our family of funds.
Sincerely,

Stuart S. Parker, President
PGIM Real Estate Income Fund
December 15, 2022
PGIM Real Estate Income Fund 3
Your Fund’s Performance (unaudited)
Performance data quoted represent past performance. Past performance does not guarantee future results. The investment return and principal value of an investment will fluctuate so that an investor’s shares, when redeemed, may be worth more or less than their original cost. Current performance may be lower or higher than the past performance data quoted. An investor may obtain performance data as of the most recent month-end by visiting our website at pgim.com/investments or by calling (800) 225-1852.
| | | | | | |
| |
| | | Average Annual Total Returns as of 10/31/22 |
| | | One Year (%) | | Five Years (%) | | Since Inception (%) |
| | | |
Class A | | | | | | |
| | | |
(with sales charges) | | -24.57 | | 0.17 | | 1.28 (06/03/2015) |
| | | |
(without sales charges) | | -20.18 | | 1.31 | | 2.06 (06/03/2015) |
| | | |
Class C | | | | | | |
| | | |
(with sales charges) | | -21.41 | | 0.55 | | 1.30 (06/03/2015) |
| | | |
(without sales charges) | | -20.81 | | 0.55 | | 1.30 (06/03/2015) |
| | | |
Class Z | | | | | | |
| | | |
(without sales charges) | | -20.03 | | 1.59 | | 2.33 (06/03/2015) |
| | | |
Class R6 | | | | | | |
| | | |
(without sales charges) | | -19.95 | | 1.58 | | 2.60 (12/28/2016) |
| | | |
Custom Blend Index | | | | | | |
| | | -25.64 | | -0.44 | | — |
| | | | |
|
| Average Annual Total Returns as of 10/31/22 Since Inception (%) |
| | |
| | | Class A, Class C, Class Z (06/03/2015) | | Class R6 (12/28/2016) |
| | |
Custom Blend Index | | 1.07 | | 0.80 |
Since Inception returns are provided since the Fund has less than 10 fiscal years of returns. Since Inception returns for the Index are measured from the closest month-end to the class’s inception date.
4 Visit our website at pgim.com/investments
Growth of a $10,000 Investment (unaudited)
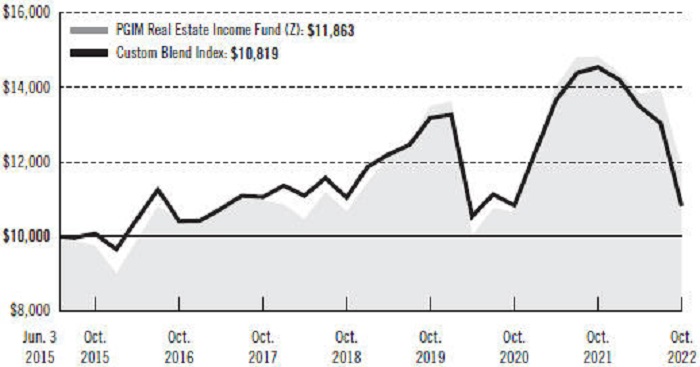
The graph compares a $10,000 investment in the Fund’s Class Z shares with a similar investment in the Custom Blend Index by portraying the initial account values at the commencement of operations for Class Z shares (June 3, 2015) and the account values at the end of the current fiscal year (October 31, 2022), as measured on a quarterly basis. For purposes of the graph, and unless otherwise indicated, it has been assumed that (a) all recurring fees (including management fees) were deducted and (b) all dividends and distributions were reinvested. The line graph provides information for Class Z shares only. As indicated in the tables provided earlier, performance for other share classes will vary due to the differing fees and expenses applicable to each share class (as indicated in the following paragraphs). Without waiver of fees and/or expense reimbursements, if any, the returns would have been lower.
Past performance does not predict future performance. Total returns and the ending account values in the graphs include changes in share price and reinvestment of dividends and capital gains distributions in a hypothetical investment for the periods shown. The Fund’s total returns do not reflect the deduction of income taxes on an individual’s investment. Taxes may reduce your actual investment returns on income or gains paid by the Fund or any gains you may realize if you sell your shares.
PGIM Real Estate Income Fund 5
Your Fund’s Performance (continued)
The returns in the tables do not reflect the deduction of taxes that a shareholder would pay on Fund distributions or following the redemption of Fund shares. The average annual total returns take into account applicable sales charges, which are described for each share class in the table below.
| | | | | | | | |
| | | | | |
| | | Class A | | Class C | | Class Z | | Class R6 |
| | | | | |
| Maximum initial sales charge | | 5.50% of the public offering price | | None | | None | | None |
| | | | | |
| Contingent deferred sales charge (CDSC) (as a percentage of the lower of the original purchase price or the net asset value at redemption) | | 1.00% on sales of $1 million or more made within 12 months of purchase | | 1.00% on sales made within 12 months of purchase | | None | | None |
| | | | | |
| Annual distribution and service (12b-1) fees (shown as a percentage of average daily net assets) | | 0.30% (0.25% currently) | | 1.00% | | None | | None |
Benchmark Definition
Custom Blend Index—The Custom Blend Index is a model portfolio consisting of the FTSE EPRA/NAREIT Developed Index (80%), which is an unmanaged index and reflects the stock performance of companies engaged in specific aspects of the major real estate markets/regions of the world, and the BofA Merrill Lynch 7% Constrained REIT Preferred Securities Index (20%), which is an unmanaged index that is a subset of the BofA Merrill Lynch Fixed Rate Preferred Securities Index including all REIT-issued preferred securities.
Investors cannot invest directly in an index. The returns for the Index would be lower if they included the effects of sales charges, operating expenses of a mutual fund, or taxes that may be paid by an investor.
6 Visit our website at pgim.com/investments
Presentation of Fund Holdings as of 10/31/22
| | | | |
| | |
| Ten Largest Holdings | | Real Estate Sectors | | % of Net Assets |
| | |
Agree Realty Corp. | | Retail REITs | | 6.1% |
| | |
Omega Healthcare Investors, Inc. | | Health Care REITs | | 5.9% |
| | |
Community Healthcare Trust, Inc. | | Health Care REITs | | 5.1% |
| | |
Spirit Realty Capital, Inc. | | Retail REITs | | 5.0% |
| | |
Essential Properties Realty Trust, Inc. | | Diversified REITs | | 4.8% |
| | |
Sun Hung Kai Properties Ltd. (Hong Kong) | | Diversified Real Estate Activities | | 3.9% |
| | |
National Retail Properties, Inc. | | Retail REITs | | 3.9% |
| | |
CapitaLand Integrated Commercial Trust (Singapore) | | Retail REITs | | 3.6% |
| | |
EPR Properties, Series G | | Specialized REITs | | 3.6% |
| | |
Global Medical REIT, Inc. | | Health Care REITs | | 3.2% |
Holdings reflect only long-term investments and are subject to change.
PGIM Real Estate Income Fund 7
Strategy and Performance Overview* (unaudited)
How did the Fund perform?
The PGIM Real Estate Income Fund’s Class Z shares returned –20.03% in the 12-month reporting period that ended October 31, 2022, outperforming the –25.64% return of the Custom Blend Index (the Index). The Index is a model portfolio consisting of the FTSE EPRA/NAREIT Developed Index (80%) and the BofA Merrill Lynch 7% Constrained REIT Preferred Securities Index (20%).
What were conditions like in the global real estate securities market?
| · | | Conditions in the US real estate investment trust (REIT) market during the reporting period were largely driven by the US Federal Reserve (Fed) and inflation. Over the summer, the Fed commenced its restrictive approach with interest rate hikes to fight inflation following an easy money policy during the COVID-19 era. With six hikes during the first 10 months of 2022, including four 75-bps hikes, the range reached its highest level since 2008 at 3.75–4.00%, with further increases expected. (One basis point equals 0.01%.) While REITs typically benefit during periods of high inflation, they are inversely correlated to a rise in rates. During the first 10 months of 2022, the yield on the 10-year Treasury note increased by approximately 230 bps (basis points) to 3.8%. As a result, the broader REIT market underperformed the S&P 500 Index of large-cap US equities by approximately 5%, with the US REIT sector down approximately 30% overall. |
| · | | Markets saw a deceleration in fundamental trends in real estate (e.g., slowing rent growth and tenant demand) as the US economy started to find its new, post-COVID-19 normal, coupled with the recessionary backdrop, yet earnings results largely held up during the period. However, higher rates affected borrowing costs for REITs, particularly those with higher leverage. In addition, the cost of equity increased due to the move in REITs, making the asset class a less viable source of capital. Combined, these factors led to a period of price discovery in the transaction market and, with bank financing on the sidelines, investment sales as a source of funds became less reliable. |
| · | | The total return of Europe’s REIT market during the period was strongly negative at –45.5% (US dollar total return), as Russia’s invasion of Ukraine plunged the region into disruption against the backdrop of soaring inflation and interest rates. Europe was the worst-performing global region over the period by a wide margin, with Asia Pacific REITs returning –22.8% and North American REITs returning –20.5%. The Ukraine invasion sent European energy markets into chaos, introducing huge volatility in energy prices due to much of Europe’s high degree of dependence on Russian energy supplies. European central banks were behind the Fed in the rate tightening cycle but were forced to accelerate their pace due to inflation levels throughout Europe that quickly surpassed inflation in the US. All European REIT markets produced double-digit negative US dollar returns during the period. Negative local currency returns were compounded by the rising value of the US dollar, which strengthened against all European currencies. Switzerland, thanks to its safe-haven status and more resilient currency, was the best-performing market, with a return of –21%. France, with a return of –30%, was the next-best performer of the major countries, with its |
8 Visit our website at pgim.com/investments
| | dominant retail sector experiencing a bounce back as its economy emerged from lockdowns. The United Kingdom (UK) was next with a return of –40%, performing slightly better than the European average due to its lower dependency on Russian energy. Tied in last place—with matching –59% US dollar total returns for the period—were Germany and Sweden (last year’s best performer), where heavily indebted real estate companies faced refinancing challenges and soaring interest costs. |
| · | | Asia evolved from lockdown restrictions in 2020–21 to a more orderly reopening in 2022, underpinned by recovery from COVID-19. This transition greatly benefited stocks perceived to be “reopening” proxies in the region, most notably Japanese hotel REITs and developers. Beyond that, regional REITs experienced broad-based weakness due to rising interest rates, a trend especially pronounced in perceived “growth” names, particularly among industrials. Australia bore the brunt of the selling, with the Australian REIT index down most sharply due to the sector’s higher-yield correlation to the US and fears of escalating inflation. Hong Kong and Singapore REITs—generally viewed as bond proxies with limited growth—followed. Hong Kong and China also faced equity risks that emanated from China’s relentless “Zero-COVID” policies (which seemed to be moderating somewhat late in the period) and the government’s apparent push toward economic socialism. |
What worked and didn’t work?
| · | | During the reporting period, all three regions—North America, Europe and Asia Pacific—represented in the Fund outperformed, relative to the Index, on a relative basis. |
| · | | In North America, overweight allocations, relative to the Index, to the US gaming and mall sectors largely drove outperformance. Additionally, stock selection was strong in the healthcare sector. The shopping center and office sectors also performed relatively well. The largest drag on relative performance was an overweight position, relative to the Index, in the mall sector. |
| · | | The Fund’s European positions outperformed the Index on a relative basis as well, primarily due to lack of exposure to Germany and Sweden, along with positive stock selection and an underweight allocation to the UK. |
| · | | In the Asia Pacific region, favorable security selection in Hong Kong and Singapore bolstered the Fund’s relative returns, while positions in Japan slightly lagged. |
Current Outlook
| · | | Equity markets are now focused on the pace of Fed hikes and the potential for policy mistakes as stagflation looms. The ongoing Ukraine conflict poses another threat to global economic recovery with surging energy prices adding to tail risks on the downside. In addition, global reopening remains fraught with the risk of subsequent COVID-19 wave impacts amid growing economic and social marginalization. That said, the following themes could remain key areas of focus for the market in the near term: |
PGIM Real Estate Income Fund 9
Strategy and Performance Overview* (continued)
| | · | | Additional Fed rate hikes |
| | · | | The developing energy crisis resulting from the Ukraine conflict |
| | · | | The further recovery in reopening names (retail and hospitality) |
| · | | While current market conditions have created uncertainty for REITs and the broader market heading into 2023, most of the impact is likely baked in following the sector’s relative underperformance to equities during the first 10 months of 2022 and versus pre-COVID-19 market conditions. Now that the Fed is eyeing a softer pace of rate hikes, PGIM Real Estate suspects that visibility will provide some cushion for the US REIT sector in 2023. The REIT market’s average implied capitalization rate is attractive at 6.0%, or a roughly 220-bps spread to the 10-year Treasury note. While this spread has compressed relative to the long-term average, given most REITs’ current depressed net operating income (NOI) levels, this spread appears likely to compress further before reverting to its long-term average. Despite some near-term disruption to NOI growth in certain sectors, PGIM Real Estate expects funds from operations (FFO) per-share growth in the mid-single-digit range in 2023 and 2024. |
| · | | The recent spike in interest rates has created a challenging environment for the US REIT market. Lack of clarity on the direction of rates and limited transaction data have reduced transparency into the underly value of REIT assets. Public markets have likely overreacted to this period of valuation uncertainty by pushing implied cap rates to 6.1% on average for US REITs, a roughly 200-bps spread to the 10-year Treasury note. Furthermore, the underlying fundamentals for most REIT sectors remain favorable, with strong secular demand trends that should serve to cushion operations in the event of a prolonged downturn. This, combined with a relatively defensive and domestic-based business model, should garner increased appeal from equity investors over the next 12–18 months. PGIM Real Estate continues to favor a barbell approach to the Fund’s sector allocation, minimizing unintended factor exposure. Positioning includes increased overweight exposure to industrial REITs, given the sector’s reasonable valuations and significant embedded NOI growth. Industrial REIT portfolios carry average rents 30–40% below market, providing a strong cushion to continue posting above-average earnings growth as leases roll up to market even in the event of a slowdown in demand. Other sectors with positive outlooks include those with embedded occupancy upside and limited economic sensitivity, such as healthcare and cold storage. Both sectors were negatively impacted by labor-cost pressures during the first 10 months of 2022; such pressure appears likely to moderate in 2023. In addition, occupancy overall remains roughly 400–600 bps below pre-COVID-19 levels, which should allow for significant top-line growth as trends continue to normalize. Conversely, caution appears incrementally more warranted on the self-storage sector following its recent outperformance. Fundamentals seem likely to remain strong, but current valuations leave the group vulnerable to a contraction relative to the broader REIT market. Greater caution |
10 Visit our website at pgim.com/investments
| | appears merited on lodging and retail, as both sectors are more susceptible to a downturn in economic growth, and on the office sector where, despite discounted valuations, the sector seems to face the early stages of a multiyear secular headwind. |
| · | | The sharp sell-off in European stock markets during the first 10 months of 2022 has opened up historically wide discounts to net asset values, but the outlook for the region’s economy remains highly uncertain. Threats from inflation, extremely volatile energy prices, and potential recession dominate investment markets. Companies with weak balance sheets remain very significantly discounted as refinancing costs have already increased, and these companies remain exposed to refinancing risk and falling cash flows from further rising debt costs. Cap rates have begun to move up in response to the major upward moves in bond yields and interest rates, but share prices imply a much higher move in cap rates to come in private real estate markets. The interest rate outlook remains highly uncertain as well, as inflation has still not been brought under control, and the outlook for demand is weakening as the risk of a recession increases. PGIM Real Estate has positioned the Fund with a balanced risk profile to help neutralize negative market impacts as much as possible. More defensive stocks with lower leverage and higher cash flow yields have outperformed throughout the recent market sell-off. The energy dependency of the European region and of several continental European economies (notably Germany) does put them at somewhat greater risk of inflation spikes and energy-supply interruptions from the ongoing Ukraine war, but the whole region is directly affected. Governments throughout the region and at the European Union level are developing policy responses to the cost-of-energy crisis, which could help to offset some of the huge, anticipated inflationary shocks. PGIM Real Estate continues to adopt a cautious stance on the European region and monitors the rapidly changing situation to make appropriate portfolio changes. |
| · | | PGIM Real Estate remains positive on the Australian self-storage and manufactured housing sectors, which stand to benefit from structural tailwinds resulting from demographic and market consolidation trends. The Australian retail sector is also in recovery as strong retail sales growth and inflation push up rents. Hong Kong is gradually moving away from restrictive COVID-19-era policies. Accordingly, PGIM Real Estate has positioned the Fund with exposure to non-discretionary retail for reopening and potential minimum wage increases in early 2023. PGIM Real Estate is neutral with respect to Japanese developers, preferring names that exhibit strong shareholder returns and provide greater reopening exposure. The Fund holds overweight exposure to Japanese REITs, particularly the heavily discounted hospitality names that benefit from reopening. In Singapore, the Fund is overweight developers in the form of fund manager/landlord plays, particularly diversified office/retail names that are reopening proxies and industrial names with solid rental growth. China’s current zero-COVID-19 strategy and the correction of the housing market pose significant risks to that country’s economic outlook. The way China deals with these challenges will be major variables affecting the region’s economy. For the rest of Asia, domestic recovery and border reopening is coming up against inflationary pressures. Similarly, a strong |
PGIM Real Estate Income Fund 11
Strategy and Performance Overview* (continued)
| | recovery in the US could stoke inflationary pressures beyond mere transitory impacts. This could drive expectations of quicker and more interest rate hikes. Supply-chain concerns could hamper growth while creating an inflation spiral that is harder to arrest. Within the Fund’s individual sectors, a sharper rise in long-term real interest rates could negatively impact regional REIT valuations. In the event of setbacks on the geopolitical front and potential COVID-19 variants, risk appetite could remain in check heading into 2023. |
*This strategy and performance overview, which discusses what strategies or holdings (including derivatives, if applicable) affected the Fund’s performance, is compiled based on how the Fund performed relative to the Fund’s benchmark index and is viewed for performance attribution purposes at the aggregate Fund level, which in most instances will not directly correlate to the amounts disclosed in the Statement of Operations which conform to US generally accepted accounting principles.
12 Visit our website at pgim.com/investments
Comments on Largest Holdings (unaudited)
6.1% Agree Realty Corp., Retail REITs
Agree Realty owns, manages, and develops primarily neighborhood community shopping centers and single tenant properties located in twelve states and leased under net leases to major retail tenants.
5.9% Omega Healthcare Investors Inc., Health Care REITs
Omega Healthcare Investors invests in and provides financing to the long-term care industry. Omega operates healthcare facilities in the US that are operated by independent healthcare operating companies.
5.1% Community Healthcare Trust Inc., Health Care REITs
Community Healthcare is a fully integrated healthcare real estate company. The company was organized as a Maryland corporation to acquire and own properties that are leased to hospitals, doctors, healthcare systems, or other healthcare service providers in non-urban markets.
5.0% Spirit Realty Capital Inc. Retail REITs
Spirit Realty Capital invests in single-tenant and triple-net-basis real estate properties engaged in retail, service, and distribution industries in the US.
4.8% Essential Properties Realty Trust Inc., Diversified REITs
Essential Properties Realty Trust owns, acquires, and manages single-tenant properties that are net leased on a long-term basis to service-oriented and experience-based businesses in the US.
PGIM Real Estate Income Fund 13
Fees and Expenses (unaudited)
As a shareholder of the Fund, you incur two types of costs: (1) transaction costs, including sales charges (loads) on purchase payments and redemptions, as applicable, and (2) ongoing costs, including management fees, distribution and/or service (12b-1) fees, and other Fund expenses, as applicable. This example is intended to help you understand your ongoing costs (in dollars) of investing in the Fund and to compare these costs with the ongoing costs of investing in other mutual funds.
The example is based on an investment of $1,000 held through the six-month period ended October 31, 2022. The example is for illustrative purposes only; you should consult the Prospectus for information on initial and subsequent minimum investment requirements.
Actual Expenses
The first line for each share class in the table on the following page provides information about actual account values and actual expenses. You may use the information on this line, together with the amount you invested, to estimate the expenses that you paid over the period. Simply divide your account value by $1,000 (for example, an $8,600 account value ÷ $1,000 = 8.6), then multiply the result by the number on the first line under the heading “Expenses Paid During the Six-Month Period” to estimate the expenses you paid on your account during this period.
Hypothetical Example for Comparison Purposes
The second line for each share class in the table on the following page provides information about hypothetical account values and hypothetical expenses based on the Fund’s actual expense ratio and an assumed rate of return of 5% per year before expenses, which is not the Fund’s actual return. The hypothetical account values and expenses may not be used to estimate the actual ending account balance or expenses you paid for the period. You may use this information to compare the ongoing costs of investing in the Fund and other funds. To do so, compare this 5% hypothetical example with the 5% hypothetical examples that appear in the shareholder reports of the other funds.
The Fund’s transfer agent may charge additional fees to holders of certain accounts that are not included in the expenses shown in the table on the following page. These fees apply to individual retirement accounts (IRAs) and Section 403(b) accounts. As of the close of the six-month period covered by the table, IRA fees included an annual maintenance fee of $15 per account (subject to a maximum annual maintenance fee of $25 for all accounts held by the same shareholder). Section 403(b) accounts are charged an annual $25 fiduciary maintenance fee. Some of the fees may vary in amount, or may be waived, based on your total account balance or the number of PGIM funds, including the Fund, that you own. You should consider the additional fees that were charged to your Fund account over the six-month period when you estimate the total ongoing expenses paid over the period and the impact of these fees on your ending account value, as these additional expenses are not reflected in the information
14 Visit our website at pgim.com/investments
provided in the expense table. Additional fees have the effect of reducing investment returns.
Please note that the expenses shown in the table are meant to highlight your ongoing costs only and do not reflect any transactional costs such as sales charges (loads). Therefore, the second line for each share class in the table is useful in comparing ongoing costs only and will not help you determine the relative total costs of owning different funds. In addition, if these transactional costs were included, your costs would have been higher.
| | | | | | | | | | |
| | | | |
| PGIM Real Estate Income Fund | | Beginning
Account Value
May 1, 2022 | | Ending Account Value October 31, 2022 | | Annualized Expense Ratio Based on the Six-Month Period | | Expenses Paid During the
Six-Month Period* |
| | | | | |
Class A | | Actual | | $1,000.00 | | $ 856.00 | | 1.35% | | $ 6.32 |
| | | | | |
| | Hypothetical | | $1,000.00 | | $1,018.40 | | 1.35% | | $ 6.87 |
| | | | | |
Class C | | Actual | | $1,000.00 | | $ 853.70 | | 2.10% | | $ 9.81 |
| | | | | |
| | Hypothetical | | $1,000.00 | | $1,014.62 | | 2.10% | | $10.66 |
| | | | | |
Class Z | | Actual | | $1,000.00 | | $ 857.60 | | 1.10% | | $ 5.15 |
| | | | | |
| | Hypothetical | | $1,000.00 | | $1,019.66 | | 1.10% | | $ 5.60 |
| | | | | |
Class R6 | | Actual | | $1,000.00 | | $ 858.60 | | 1.10% | | $ 5.15 |
| | | | | |
| | | Hypothetical | | $1,000.00 | | $1,019.66 | | 1.10% | | $ 5.60 |
*Fund expenses (net of fee waivers or subsidies, if any) for each share class are equal to the annualized expense ratio for each share class (provided in the table), multiplied by the average account value over the period, multiplied by the 184 days in the six-month period ended October 31, 2022, and divided by the 365 days in the Fund’s fiscal year ended October 31, 2022 (to reflect the six-month period). Expenses presented in the table include the expenses of any underlying portfolios in which the Fund may invest.
PGIM Real Estate Income Fund 15
Schedule of Investments
as of October 31, 2022
| | | | | | | | |
| | |
| Description | | Shares | | | Value | |
| | |
LONG-TERM INVESTMENTS 98.8% | | | | | | | | |
| | |
COMMON STOCKS 82.1% | | | | | | | | |
| | |
Diversified Real Estate Activities 3.9% | | | | | | | | |
| | |
Sun Hung Kai Properties Ltd. (Hong Kong) | | | 102,608 | | | $ | 1,102,659 | |
| | |
Diversified REITs 10.5% | | | | | | | | |
| | |
Daiwa House REIT Investment Corp. (Japan) | | | 132 | | | | 266,415 | |
Essential Properties Realty Trust, Inc. | | | 63,110 | | | | 1,358,127 | |
Land Securities Group PLC (United Kingdom) | | | 55,919 | | | | 365,648 | |
Mirvac Group (Australia) | | | 362,385 | | | | 480,148 | |
Nomura Real Estate Master Fund, Inc. (Japan) | | | 432 | | | | 492,839 | |
| | | | | | | | |
| | |
| | | | | | | 2,963,177 | |
| | |
Health Care REITs 17.2% | | | | | | | | |
| | |
Community Healthcare Trust, Inc. | | | 41,792 | | | | 1,446,003 | |
Global Medical REIT, Inc. | | | 98,586 | | | | 901,076 | |
Healthcare Realty Trust, Inc. | | | 40,095 | | | | 815,131 | |
Omega Healthcare Investors, Inc. | | | 52,089 | | | | 1,655,389 | |
| | | | | | | | |
| | |
| | | | | | | 4,817,599 | |
| | |
Hotel & Resort REITs 2.5% | | | | | | | | |
| | |
Apple Hospitality REIT, Inc. | | | 41,477 | | | | 710,086 | |
| | |
Industrial REITs 5.1% | | | | | | | | |
| | |
CapitaLand Ascendas REIT (Singapore) | | | 310,268 | | | | 574,055 | |
Nexus Industrial REIT (Canada) | | | 130,288 | | | | 847,324 | |
| | | | | | | | |
| | |
| | | | | | | 1,421,379 | |
| | |
Office REITs 1.1% | | | | | | | | |
| | |
Nippon Building Fund, Inc. (Japan) | | | 68 | | | | 302,277 | |
| | |
Real Estate Operating Companies 3.0% | | | | | | | | |
| | |
Swire Properties Ltd. (Hong Kong) | | | 443,076 | | | | 851,554 | |
| | |
Residential REITs 1.8% | | | | | | | | |
| | |
Equity Residential | | | 3,833 | | | | 241,556 | |
Essex Property Trust, Inc. | | | 1,196 | | | | 265,799 | |
| | | | | | | | |
| | |
| | | | | | | 507,355 | |
| | |
Retail REITs 32.9% | | | | | | | | |
| | |
Agree Realty Corp. | | | 24,990 | | | | 1,716,813 | |
Brixmor Property Group, Inc. | | | 36,618 | | | | 780,330 | |
See Notes to Financial Statements.
PGIM Real Estate Income Fund 17
Schedule of Investments (continued)
as of October 31, 2022
| | | | | | | | |
| | |
| Description | | Shares | | | Value | |
| | |
COMMON STOCKS (Continued) | | | | | | | | |
| | |
Retail REITs (cont’d.) | | | | | | | | |
| | |
CapitaLand Integrated Commercial Trust (Singapore) | | | 760,416 | | | $ | 1,009,190 | |
Japan Metropolitan Fund Investment Corp. (Japan) | | | 4 | | | | 2,947 | |
Kimco Realty Corp. | | | 25,087 | | | | 536,360 | |
Kite Realty Group Trust | | | 38,752 | | | | 761,089 | |
Link REIT (Hong Kong) | | | 73,783 | | | | 436,103 | |
National Retail Properties, Inc. | | | 25,810 | | | | 1,084,794 | |
NETSTREIT Corp. | | | 31,147 | | | | 586,186 | |
Scentre Group (Australia) | | | 262,433 | | | | 488,394 | |
Spirit Realty Capital, Inc. | | | 36,501 | | | | 1,417,334 | |
Supermarket Income REIT PLC (United Kingdom) | | | 354,600 | | | | 416,872 | |
| | | | | | | | |
| | |
| | | | | | | 9,236,412 | |
| | |
Specialized REITs 4.1% | | | | | | | | |
| | |
CubeSmart | | | 17,429 | | | | 729,752 | |
Digital Realty Trust, Inc. | | | 4,189 | | | | 419,947 | |
| | | | | | | | |
| | |
| | | | | | | 1,149,699 | |
| | | | | | | | |
TOTAL COMMON STOCKS
(cost $27,110,118) | | | | | | | 23,062,197 | |
| | | | | | | | |
| | |
PREFERRED STOCKS 16.7% | | | | | | | | |
| | |
Diversified REITs 5.0% | | | | | | | | |
| | |
Armada Hoffler Properties, Inc., Series A, 6.750%, Maturing 06/18/24(oo) | | | 28,205 | | | | 582,151 | |
Gladstone Commercial Corp., Series G, 6.000%, Maturing 06/28/26(oo) | | | 44,841 | | | | 825,523 | |
| | | | | | | | |
| | |
| | | | | | | 1,407,674 | |
| | |
Hotel & Resort REITs 3.1% | | | | | | | | |
| | |
Pebblebrook Hotel Trust, Series H, 5.700%, Maturing 07/27/26(oo) | | | 52,321 | | | | 865,389 | |
| | |
Residential REITs 5.0% | | | | | | | | |
| | |
American Homes 4 Rent, Series G, 5.875%, Maturing 12/01/22(oo) | | | 36,285 | | | | 797,544 | |
Centerspace, Series C, 6.625%, Maturing 12/01/22(a)(oo) | | | 25,594 | | | | 614,256 | |
| | | | | | | | |
| | |
| | | | | | | 1,411,800 | |
See Notes to Financial Statements.
18
| | | | | | | | |
| | |
| Description | | Shares | | | Value | |
| | |
PREFERRED STOCKS (Continued) | | | | | | | | |
| | |
Specialized REITs 3.6% | | | | | | | | |
| | |
EPR Properties, Series G, 5.750%, Maturing 12/01/22(oo) | | | 59,871 | | | $ | 1,008,827 | |
| | | | | | | | |
| | |
TOTAL PREFERRED STOCKS
(cost $6,042,950) | | | | | | | 4,693,690 | |
| | | | | | | | |
| | |
TOTAL LONG-TERM INVESTMENTS
(cost $33,153,068) | | | | | | | 27,755,887 | |
| | | | | | | | |
| | |
SHORT-TERM INVESTMENTS 1.0% | | | | | | | | |
| | |
AFFILIATED MUTUAL FUND 0.0% | | | | | | | | |
PGIM Institutional Money Market Fund
(cost $9,696; includes $9,680 of cash collateral for securities on loan)(b)(wa) | | | 9,704 | | | | 9,696 | |
| | | | | | | | |
| | |
UNAFFILIATED FUND 1.0% | | | | | | | | |
Dreyfus Government Cash Management (Institutional Shares)
(cost $270,287) | | | 270,287 | | | | 270,287 | |
| | | | | | | | |
| | |
TOTAL SHORT-TERM INVESTMENTS
(cost $279,983) | | | | | | | 279,983 | |
| | | | | | | | |
| | |
TOTAL INVESTMENTS 99.8%
(cost $33,433,051) | | | | | | | 28,035,870 | |
Other assets in excess of liabilities 0.2% | | | | | | | 54,478 | |
| | | | | | | | |
| | |
NET ASSETS 100.0% | | | | | | $ | 28,090,348 | |
| | | | | | | | |
Below is a list of the abbreviation(s) used in the annual report:
LIBOR—London Interbank Offered Rate
REITs—Real Estate Investment Trust
SOFR—Secured Overnight Financing Rate
| (a) | All or a portion of security is on loan. The aggregate market value of such securities, including those sold and pending settlement, is $9,600; cash collateral of $9,680 (included in liabilities) was received with which the Fund purchased highly liquid short-term investments. In the event of significant appreciation in value of securities on loan on the last business day of the reporting period, the Fund may reflect a collateral value that is less than the market value of the loaned securities and such shortfall is remedied the following business day. |
| (b) | Represents security, or portion thereof, purchased with cash collateral received for securities on loan and includes dividend reinvestment. |
| (oo) | Perpetual security. Maturity date represents next call date. |
| (wa) | PGIM Investments LLC, the manager of the Fund, also serves as manager of the PGIM Core Ultra Short Bond Fund and PGIM Institutional Money Market Fund, if applicable. |
See Notes to Financial Statements.
PGIM Real Estate Income Fund 19
Schedule of Investments (continued)
as of October 31, 2022
Fair Value Measurements:
Various inputs are used in determining the value of the Fund’s investments. These inputs are summarized in the three broad levels listed below.
Level 1—unadjusted quoted prices generally in active markets for identical securities.
Level 2—quoted prices for similar securities, interest rates and yield curves, prepayment speeds, foreign currency exchange rates and other observable inputs.
Level 3—unobservable inputs for securities valued in accordance with Board approved fair valuation procedures.
The following is a summary of the inputs used as of October 31, 2022 in valuing such portfolio securities:
| | | | | | | | | | | | | | | | | | | | | | | | | | | | | | | | | | |
| | | Level 1 | | | Level 2 | | | Level 3 | |
Investments in Securities | | | | | | | | | | | | | | | | | | | | | | | | | | | | | | | | | | |
Assets | | | | | | | | | | | | | | | | | | | | | | | | | | | | | | | | | | |
Long-Term Investments | | | | | | | | | | | | | | | | | | | | | | | | | | | | | | | | | | |
Common Stocks | | | | | | | | | | | | | | | | | | | | | | | | | | | | | | | | | | |
Diversified Real Estate Activities | | | | $ | — | | | | | | | | | | | $ | 1,102,659 | | | | | | | | | | | $ | — | | | | | |
Diversified REITs | | | | | 1,358,127 | | | | | | | | | | | | 1,605,050 | | | | | | | | | | | | — | | | | | |
Health Care REITs | | | | | 4,817,599 | | | | | | | | | | | | — | | | | | | | | | | | | — | | | | | |
Hotel & Resort REITs | | | | | 710,086 | | | | | | | | | | | | — | | | | | | | | | | | | — | | | | | |
Industrial REITs | | | | | 847,324 | | | | | | | | | | | | 574,055 | | | | | | | | | | | | — | | | | | |
Office REITs | | | | | — | | | | | | | | | | | | 302,277 | | | | | | | | | | | | — | | | | | |
Real Estate Operating Companies | | | | | — | | | | | | | | | | | | 851,554 | | | | | | | | | | | | — | | | | | |
Residential REITs | | | | | 507,355 | | | | | | | | | | | | — | | | | | | | | | | | | — | | | | | |
Retail REITs | | | | | 6,882,906 | | | | | | | | | | | | 2,353,506 | | | | | | | | | | | | — | | | | | |
Specialized REITs | | | | | 1,149,699 | | | | | | | | | | | | — | | | | | | | | | | | | — | | | | | |
Preferred Stocks | | | | | | | | | | | | | | | | | | | | | | | | | | | | | | | | | | |
Diversified REITs | | | | | 1,407,674 | | | | | | | | | | | | — | | | | | | | | | | | | — | | | | | |
Hotel & Resort REITs | | | | | 865,389 | | | | | | | | | | | | — | | | | | | | | | | | | — | | | | | |
Residential REITs | | | | | 1,411,800 | | | | | | | | | | | | — | | | | | | | | | | | | — | | | | | |
Specialized REITs | | | | | 1,008,827 | | | | | | | | | | | | — | | | | | | | | | | | | — | | | | | |
Short-Term Investments | | | | | | | | | | | | | | | | | | | | | | | | | | | | | | | | | | |
Affiliated Mutual Fund | | | | | 9,696 | | | | | | | | | | | | — | | | | | | | | | | | | — | | | | | |
Unaffiliated Fund | | | | | 270,287 | | | | | | | | | | | | — | | | | | | | | | | | | — | | | | | |
| | | | | | | | | | | | | | | | | | | | | | | | | | | | | | | | | | |
| | | | | | | | | |
Total | | | | $ | 21,246,769 | | | | | | | | | | | $ | 6,789,101 | | | | | | | | | | | $ | — | | | | | |
| | | | | | | | | | | | | | | | | | | | | | | | | | |
Sector Classification:
The sector classification of investments and other assets in excess of liabilities shown as a percentage of net assets as of October 31, 2022 were as follows:
| | | | |
Retail REITs | | | 32.9 | % |
Health Care REITs | | | 17.2 | |
Diversified REITs | | | 15.5 | |
Specialized REITs | | | 7.7 | |
Residential REITs | | | 6.8 | |
| | | | |
Hotel & Resort REITs | | | 5.6 | % |
Industrial REITs | | | 5.1 | |
Diversified Real Estate Activities | | | 3.9 | |
Real Estate Operating Companies | | | 3.0 | |
Office REITs | | | 1.1 | |
See Notes to Financial Statements.
20
Sector Classification (continued):
| | | | |
Unaffiliated Fund | | | 1.0 | % |
Affiliated Mutual Fund (0.0% represents investments purchased with collateral from securities on loan) | | | 0.0 | * |
| | | | |
| | | 99.8 | |
Other assets in excess of liabilities | | | 0.2 | |
| | | | |
| | | 100.0 | % |
| | | | |
Financial Instruments/Transactions—Summary of Offsetting and Netting Arrangements:
The Fund entered into financial instruments/transactions during the reporting period that are either offset in accordance with current requirements or are subject to enforceable master netting arrangements or similar agreements that permit offsetting. The information about offsetting and related netting arrangements for financial instruments/transactions where the legal right to set-off exists is presented in the summary below.
Offsetting of financial instrument/transaction assets and liabilities:
| | | | | | |
| Description | | Gross Market Value of Recognized Assets/(Liabilities) | | Collateral Pledged/(Received)(1) | | Net Amount |
| | | |
Securities on Loan | | $9,600 | | $(9,600) | | $— |
| (1) | Collateral amount disclosed by the Fund is limited to the market value of financial instruments/transactions. |
See Notes to Financial Statements.
PGIM Real Estate Income Fund 21
Statement of Assets and Liabilities
as of October 31, 2022
| | | | |
Assets | | | | |
| |
Investments at value, including securities on loan of $9,600: | | | | |
Unaffiliated investments (cost $33,423,355) | | $ | 28,026,174 | |
Affiliated investments (cost $9,696) | | | 9,696 | |
Foreign currency, at value (cost $13) | | | 12 | |
Dividends receivable | | | 78,955 | |
Receivable for Fund shares sold | | | 60,751 | |
Tax reclaim receivable | | | 10,249 | |
Receivable for investments sold | | | 2 | |
Prepaid expenses and other assets | | | 1,841 | |
| | | | |
Total Assets | | | 28,187,680 | |
| | | | |
| |
Liabilities | | | | |
| |
Audit fee payable | | | 31,899 | |
Payable for Fund shares purchased | | | 15,350 | |
Custodian and accounting fees payable | | | 12,829 | |
Management fee payable | | | 11,193 | |
Payable to broker for collateral for securities on loan | | | 9,680 | |
Legal fees and expenses payable | | | 6,262 | |
Shareholders’ reports payable | | | 5,590 | |
Accrued expenses and other liabilities | | | 3,002 | |
Trustees’ fees payable | | | 850 | |
Affiliated transfer agent fee payable | | | 372 | |
Distribution fee payable | | | 305 | |
| | | | |
Total Liabilities | | | 97,332 | |
| | | | |
| |
Net Assets | | $ | 28,090,348 | |
| | | | |
| |
| | | | | |
| |
Net assets were comprised of: | | | | |
Shares of beneficial interest, at par | | $ | 4,537 | |
Paid-in capital in excess of par | | | 33,958,686 | |
Total distributable earnings (loss) | | | (5,872,875 | ) |
| | | | |
Net assets, October 31, 2022 | | $ | 28,090,348 | |
| | | | |
See Notes to Financial Statements.
22
| | | | | | |
| | |
Class A | | | | | | |
| | |
Net asset value and redemption price per share, ($738,435 ÷ 119,492 shares of beneficial interest issued and outstanding) | | $ | 6.18 | | | |
Maximum sales charge (5.50% of offering price) | | | 0.36 | | | |
| | | | | | |
Maximum offering price to public | | $ | 6.54 | | | |
| | | | | | |
| | |
Class C | | | | | | |
| | |
Net asset value, offering price and redemption price per share, ($178,365 ÷ 28,860 shares of beneficial interest issued and outstanding) | | $ | 6.18 | | | |
| | | | | | |
| | |
Class Z | | | | | | |
| | |
Net asset value, offering price and redemption price per share, ($7,023,631 ÷ 1,131,963 shares of beneficial interest issued and outstanding) | | $ | 6.20 | | | |
| | | | | | |
| | |
Class R6 | | | | | | |
| | |
Net asset value, offering price and redemption price per share, ($20,149,917 ÷ 3,256,287 shares of beneficial interest issued and outstanding) | | $ | 6.19 | | | |
| | | | | | |
See Notes to Financial Statements.
PGIM Real Estate Income Fund 23
Statement of Operations
Year Ended October 31, 2022
| | | | |
Net Investment Income (Loss) | | | | |
| |
Income | | | | |
Unaffiliated dividend income (net of $29,920 foreign withholding tax) | | $ | 1,645,073 | |
Income from securities lending, net (including affiliated income of $389) | | | 3,660 | |
Affiliated dividend income | | | 37 | |
| | | | |
Total income | | | 1,648,770 | |
| | | | |
| |
Expenses | | | | |
Management fee | | | 273,092 | |
Distribution fee(a) | | | 5,969 | |
Custodian and accounting fees | | | 42,022 | |
Audit fee | | | 31,900 | |
Registration fees(a) | | | 28,439 | |
Legal fees and expenses | | | 21,193 | |
Shareholders’ reports | | | 15,512 | |
Trustees’ fees | | | 9,697 | |
Transfer agent’s fees and expenses (including affiliated expense of $2,194)(a) | | | 5,669 | |
Miscellaneous | | | 20,265 | |
| | | | |
Total expenses | | | 453,758 | |
Less: Fee waiver and/or expense reimbursement(a) | | | (71,562 | ) |
Distribution fee waiver(a) | | | (595 | ) |
| | | | |
Net expenses | | | 381,601 | |
| | | | |
Net investment income (loss) | | | 1,267,169 | |
| | | | |
| |
Realized And Unrealized Gain (Loss)On Investment And Foreign Currency Transactions | | | | |
| |
Net realized gain (loss) on: | | | | |
Investment transactions (including affiliated of $(731)) | | | (273,702 | ) |
Foreign currency transactions | | | (7,104 | ) |
| | | | |
| | | (280,806 | ) |
| | | | |
Net change in unrealized appreciation (depreciation) on: | | | | |
Investments | | | (8,313,309 | ) |
Foreign currencies | | | (2,048 | ) |
| | | | |
| | | (8,315,357 | ) |
| | | | |
Net gain (loss) on investment and foreign currency transactions | | | (8,596,163 | ) |
| | | | |
Net Increase (Decrease) In Net Assets Resulting From Operations | | $ | (7,328,994 | ) |
| | | | |
| (a) | Class specific expenses and waivers were as follows: |
| | | | | | | | | | | | | | | | |
| | | Class A | | | Class C | | | Class Z | | | Class R6 | |
Distribution fee | | | 3,571 | | | | 2,398 | | | | — | | | | — | |
Registration fees | | | 7,925 | | | | 6,175 | | | | 8,014 | | | | 6,325 | |
Transfer agent’s fees and expenses | | | 2,488 | | | | 583 | | | | 2,352 | | | | 246 | |
Fee waiver and/or expense reimbursement | | | (11,727 | ) | | | (7,023 | ) | | | (18,974 | ) | | | (33,838 | ) |
Distribution fee waiver | | | (595 | ) | | | — | | | | — | | | | — | |
See Notes to Financial Statements.
24
Statements of Changes in Net Assets
| | | | | | | | |
| |
| | | Year Ended October 31, | |
| | | | |
| | |
| | | 2022 | | | 2021 | |
| | |
Increase (Decrease) in Net Assets | | | | | | | | |
| | |
Operations | | | | | | | | |
Net investment income (loss) | | $ | 1,267,169 | | | $ | 1,319,578 | |
Net realized gain (loss) on investment and foreign currency transactions | | | (280,806 | ) | | | 9,184,310 | |
Net change in unrealized appreciation (depreciation) on investments and foreign currencies | | | (8,315,357 | ) | | | 4,312,329 | |
| | | | | | | | |
Net increase (decrease) in net assets resulting from operations | | | (7,328,994 | ) | | | 14,816,217 | |
| | | | | | | | |
Dividends and Distributions | | | | | | | | |
Distributions from distributable earnings | | | | | | | | |
Class A | | | (342,173 | ) | | | (54,882 | ) |
Class C | | | (63,156 | ) | | | (9,354 | ) |
Class Z | | | (1,890,345 | ) | | | (433,149 | ) |
Class R6 | | | (6,496,377 | ) | | | (1,310,830 | ) |
| | | | | | | | |
| | | (8,792,051 | ) | | | (1,808,215 | ) |
| | | | | | | | |
Tax return of capital distributions | | | | | | | | |
Class A | | | (18,151 | ) | | | — | |
Class C | | | (3,350 | ) | | | — | |
Class Z | | | (100,276 | ) | | | — | |
Class R6 | | | (344,611 | ) | | | — | |
| | | | | | | | |
| | | (466,388 | ) | | | — | |
| | | | | | | | |
Fund share transactions (Net of share conversions) | | | | | | | | |
Net proceeds from shares sold | | | 7,132,240 | | | | 21,122,631 | |
Net asset value of shares issued in reinvestment of dividends and distributions | | | 9,242,174 | | | | 1,805,219 | |
Cost of shares purchased | | | (14,139,352 | ) | | | (25,640,300 | ) |
| | | | | | | | |
Net increase (decrease) in net assets from Fund share transactions | | | 2,235,062 | | | | (2,712,450 | ) |
| | | | | | | | |
Total increase (decrease) | | | (14,352,371 | ) | | | 10,295,552 | |
| | |
Net Assets: | | | | | | | | |
| | |
Beginning of year | | | 42,442,719 | | | | 32,147,167 | |
| | | | | | | | |
End of year | | $ | 28,090,348 | | | $ | 42,442,719 | |
| | | | | | | | |
See Notes to Financial Statements.
PGIM Real Estate Income Fund 25
Financial Highlights
| | | | | | | | | | | | | | | | | | | | |
| | | | | | |
Class A Shares | | | | | | | | | | | | | | | | | | | | |
| | | Year Ended October 31, | |
| | | | | | |
| | | 2022 | | | 2021 | | | 2020 | | | 2019 | | | 2018 | |
| | | | | | |
Per Share Operating Performance(a): | | | | | | | | | | | | | | | | | | | | |
Net Asset Value, Beginning of Year | | | $10.26 | | | | $7.67 | | | | $10.66 | | | | $8.76 | | | | $9.62 | |
Income (loss) from investment operations: | | | | | | | | | | | | | | | | | | | | |
Net investment income (loss) | | | 0.32 | | | | 0.25 | | | | 0.27 | | | | 0.28 | | | | 0.34 | |
| Net realized and unrealized gain (loss) on investment and foreign currency transactions | | | (1.99 | ) | | | 2.70 | | | | (2.43 | ) | | | 1.97 | | | | (0.63 | ) |
Total from investment operations | | | (1.67 | ) | | | 2.95 | | | | (2.16 | ) | | | 2.25 | | | | (0.29 | ) |
Less Dividends and Distributions: | | | | | | | | | | | | | | | | | | | | |
Dividends from net investment income | | | (0.29 | ) | | | (0.36 | ) | | | (0.63 | ) | | | (0.35 | ) | | | (0.50 | ) |
Tax return of capital distributions | | | (0.10 | ) | | | - | | | | (0.14 | ) | | | - | | | | (0.07 | ) |
Distributions from net realized gains | | | (2.02 | ) | | | - | | | | (0.06 | ) | | | - | | | | - | |
Total dividends and distributions | | | (2.41 | ) | | | (0.36 | ) | | | (0.83 | ) | | | (0.35 | ) | | | (0.57 | ) |
Net asset value, end of year | | | $6.18 | | | | $10.26 | | | | $7.67 | | | | $10.66 | | | | $8.76 | |
Total Return(b): | | | (20.18 | )% | | | 38.84 | % | | | (21.25 | )% | | | 26.26 | % | | | (3.15 | )% |
| | | | | | | | | | | | | | | | | | | | | |
Ratios/Supplemental Data: | | | | | | | | | | | | | | | | | | | | |
Net assets, end of year (000) | | | $738 | | | | $1,582 | | | | $866 | | | | $915 | | | | $621 | |
Average net assets (000) | | | $1,190 | | | | $1,428 | | | | $796 | | | | $677 | | | | $878 | |
Ratios to average net assets(c): | | | | | | | | | | | | | | | | | | | | |
| Expenses after waivers and/or expense reimbursement | | | 1.35 | % | | | 1.35 | % | | | 1.36 | % | | | 1.35 | % | | | 1.36 | % |
| Expenses before waivers and/or expense reimbursement | | | 2.39 | % | | | 2.16 | % | | | 4.78 | % | | | 4.65 | % | | | 4.85 | % |
Net investment income (loss) | | | 4.16 | % | | | 2.56 | % | | | 3.18 | % | | | 2.91 | % | | | 3.73 | % |
Portfolio turnover rate(d) | | | 90 | % | | | 201 | % | | | 235 | % | | | 257 | % | | | 153 | % |
| (a) | Calculated based on average shares outstanding during the year. |
| (b) | Total return does not consider the effects of sales loads. Total return is calculated assuming a purchase of a share on the first day and a sale on the last day of each year reported and includes reinvestment of dividends and distributions, if any. Total returns may reflect adjustments to conform to GAAP. |
| (c) | Does not include expenses of the underlying funds in which the Fund invests. |
| (d) | The Fund’s portfolio turnover rate is calculated in accordance with regulatory requirements, without regard to transactions involving short-term investments, certain derivatives and in-kind transactions (if any). If such transactions were included, the Fund’s portfolio turnover rate may be higher. |
See Notes to Financial Statements.
26
| | | | | | | | | | | | | | | | | | | | |
| | | | | | |
Class C Shares | | | | | | | | | | | | | | | | | | | | |
| | | Year Ended October 31, | |
| | | | | | |
| | | 2022 | | | 2021 | | | 2020 | | | 2019 | | | 2018 | |
| | | | | | |
Per Share Operating Performance(a): | | | | | | | | | | | | | | | | | | | | |
Net Asset Value, Beginning of Year | | | $10.26 | | | | $7.67 | | | | $10.66 | | | | $8.76 | | | | $9.62 | |
Income (loss) from investment operations: | | | | | | | | | | | | | | | | | | | | |
Net investment income (loss) | | | 0.20 | | | | 0.18 | | | | 0.23 | | | | 0.21 | | | | 0.27 | |
| Net realized and unrealized gain (loss) on investment and foreign currency transactions | | | (1.93 | ) | | | 2.70 | | | | (2.45 | ) | | | 1.97 | | | | (0.63 | ) |
Total from investment operations | | | (1.73 | ) | | | 2.88 | | | | (2.22 | ) | | | 2.18 | | | | (0.36 | ) |
Less Dividends and Distributions: | | | | | | | | | | | | | | | | | | | | |
Dividends from net investment income | | | (0.23 | ) | | | (0.29 | ) | | | (0.57 | ) | | | (0.28 | ) | | | (0.44 | ) |
Tax return of capital distributions | | | (0.10 | ) | | | - | | | | (0.14 | ) | | | - | | | | (0.06 | ) |
Distributions from net realized gains | | | (2.02 | ) | | | - | | | | (0.06 | ) | | | - | | | | - | |
Total dividends and distributions | | | (2.35 | ) | | | (0.29 | ) | | | (0.77 | ) | | | (0.28 | ) | | | (0.50 | ) |
Net asset value, end of year | | | $6.18 | | | | $10.26 | | | | $7.67 | | | | $10.66 | | | | $8.76 | |
Total Return(b): | | | (20.81 | )% | | | 37.84 | % | | | (21.86 | )% | | | 25.34 | % | | | (3.85 | )% |
| | | | | | | | | | | | | | | | | | | | | |
Ratios/Supplemental Data: | | | | | | | | | | | | | | | | | | | | |
Net assets, end of year (000) | | | $178 | | | | $277 | | | | $268 | | | | $639 | | | | $336 | |
Average net assets (000) | | | $240 | | | | $302 | | | | $500 | | | | $510 | | | | $314 | |
Ratios to average net assets(c): | | | | | | | | | | | | | | | | | | | | |
| Expenses after waivers and/or expense reimbursement | | | 2.10 | % | | | 2.10 | % | | | 2.11 | % | | | 2.10 | % | | | 2.11 | % |
| Expenses before waivers and/or expense reimbursement | | | 5.03 | % | | | 4.27 | % | | | 6.45 | % | | | 5.86 | % | | | 8.85 | % |
Net investment income (loss) | | | 2.65 | % | | | 1.92 | % | | | 2.62 | % | | | 2.21 | % | | | 2.98 | % |
Portfolio turnover rate(d) | | | 90 | % | | | 201 | % | | | 235 | % | | | 257 | % | | | 153 | % |
| (a) | Calculated based on average shares outstanding during the year. |
| (b) | Total return does not consider the effects of sales loads. Total return is calculated assuming a purchase of a share on the first day and a sale on the last day of each year reported and includes reinvestment of dividends and distributions, if any. Total returns may reflect adjustments to conform to GAAP. |
| (c) | Does not include expenses of the underlying funds in which the Fund invests. |
| (d) | The Fund’s portfolio turnover rate is calculated in accordance with regulatory requirements, without regard to transactions involving short-term investments, certain derivatives and in-kind transactions (if any). If such transactions were included, the Fund’s portfolio turnover rate may be higher. |
See Notes to Financial Statements.
PGIM Real Estate Income Fund 27
Financial Highlights (continued)
| | | | | | | | | | | | | | | | | | | | |
| | | | | | |
Class Z Shares | | | | | | | | | | | | | | | | | | | | |
| | | Year Ended October 31, | |
| | | | | | |
| | | 2022 | | | 2021 | | | 2020 | | | 2019 | | | 2018 | |
| | | | | | |
Per Share Operating Performance(a): | | | | | | | | | | | | | | | | | | | | |
Net Asset Value, Beginning of Year | | | $10.29 | | | | $7.69 | | | | $10.69 | | | | $8.78 | | | | $9.62 | |
Income (loss) from investment operations: | | | | | | | | | | | | | | | | | | | | |
Net investment income (loss) | | | 0.28 | | | | 0.28 | | | | 0.34 | | | | 0.31 | | | | 0.39 | |
| Net realized and unrealized gain (loss) on investment and foreign currency transactions | | | (1.94 | ) | | | 2.71 | | | | (2.49 | ) | | | 1.98 | | | | (0.64 | ) |
Total from investment operations | | | (1.66 | ) | | | 2.99 | | | | (2.15 | ) | | | 2.29 | | | | (0.25 | ) |
Less Dividends and Distributions: | | | | | | | | | | | | | | | | | | | | |
Dividends from net investment income | | | (0.31 | ) | | | (0.39 | ) | | | (0.65 | ) | | | (0.38 | ) | | | (0.52 | ) |
Tax return of capital distributions | | | (0.10 | ) | | | - | | | | (0.14 | ) | | | - | | | | (0.07 | ) |
Distributions from net realized gains | | | (2.02 | ) | | | - | | | | (0.06 | ) | | | - | | | | - | |
Total dividends and distributions | | | (2.43 | ) | | | (0.39 | ) | | | (0.85 | ) | | | (0.38 | ) | | | (0.59 | ) |
Net asset value, end of year | | | $6.20 | | | | $10.29 | | | | $7.69 | | | | $10.69 | | | | $8.78 | |
Total Return(b): | | | (20.03 | )% | | | 39.19 | % | | | (21.08 | )% | | | 26.62 | % | | | (2.70 | )% |
| | | | | | | | | | | | | | | | | | | | | |
Ratios/Supplemental Data: | | | | | | | | | | | | | | | | | | | | |
Net assets, end of year (000) | | | $7,024 | | | | $10,941 | | | | $7,797 | | | | $16,451 | | | | $6,951 | |
Average net assets (000) | | | $7,858 | | | | $11,287 | | | | $9,743 | | | | $12,060 | | | | $8,632 | |
Ratios to average net assets(c): | | | | | | | | | | | | | | | | | | | | |
| Expenses after waivers and/or expense reimbursement | | | 1.10 | % | | | 1.10 | % | | | 1.11 | % | | | 1.10 | % | | | 0.98 | % |
| Expenses before waivers and/or expense reimbursement | | | 1.34 | % | | | 1.38 | % | | | 2.54 | % | | | 2.31 | % | | | 2.81 | % |
Net investment income (loss) | | | 3.67 | % | | | 2.92 | % | | | 3.81 | % | | | 3.17 | % | | | 4.25 | % |
Portfolio turnover rate(d) | | | 90 | % | | | 201 | % | | | 235 | % | | | 257 | % | | | 153 | % |
| (a) | Calculated based on average shares outstanding during the year. |
| (b) | Total return is calculated assuming a purchase of a share on the first day and a sale on the last day of each year reported and includes reinvestment of dividends and distributions, if any. Total returns may reflect adjustments to conform to GAAP. |
| (c) | Does not include expenses of the underlying funds in which the Fund invests. |
| (d) | The Fund’s portfolio turnover rate is calculated in accordance with regulatory requirements, without regard to transactions involving short-term investments, certain derivatives and in-kind transactions (if any). If such transactions were included, the Fund’s portfolio turnover rate may be higher. |
See Notes to Financial Statements.
28
| | | | | | | | | | | | | | | | | | | | |
| | | | | | |
Class R6 Shares | | | | | | | | | | | | | | | | | | | | |
| | | Year Ended October 31, | |
| | | | | | |
| | | 2022 | | | 2021 | | | 2020 | | | 2019 | | | 2018 | |
| | | | | | |
Per Share Operating Performance(a): | | | | | | | | | | | | | | | | | | | | |
Net Asset Value, Beginning of Year | | | $10.27 | | | | $7.68 | | | | $10.67 | | | | $8.76 | | | | $9.62 | |
Income (loss) from investment operations: | | | | | | | | | | | | | | | | | | | | |
Net investment income (loss) | | | 0.28 | | | | 0.27 | | | | 0.12 | | | | 0.31 | | | | 0.25 | |
| Net realized and unrealized gain (loss) on investment and foreign currency transactions | | | (1.93 | ) | | | 2.71 | | | | (2.26 | ) | | | 1.98 | | | | (0.52 | ) |
Total from investment operations | | | (1.65 | ) | | | 2.98 | | | | (2.14 | ) | | | 2.29 | | | | (0.27 | ) |
Less Dividends and Distributions: | | | | | | | | | | | | | | | | | | | | |
Dividends from net investment income | | | (0.31 | ) | | | (0.39 | ) | | | (0.65 | ) | | | (0.38 | ) | | | (0.50 | ) |
Tax return of capital distributions | | | (0.10 | ) | | | - | | | | (0.14 | ) | | | - | | | | (0.09 | ) |
Distributions from net realized gains | | | (2.02 | ) | | | - | | | | (0.06 | ) | | | - | | | | - | |
Total dividends and distributions | | | (2.43 | ) | | | (0.39 | ) | | | (0.85 | ) | | | (0.38 | ) | | | (0.59 | ) |
Net asset value, end of year | | | $6.19 | | | | $10.27 | | | | $7.68 | | | | $10.67 | | | | $8.76 | |
Total Return(b): | | | (19.95 | )% | | | 39.11 | % | | | (21.03 | )% | | | 26.54 | % | | | (2.92 | )% |
| | | | | | | | | | | | | | | | | | | | | |
Ratios/Supplemental Data: | | | | | | | | | | | | | | | | | | | | |
Net assets, end of year (000) | | | $20,150 | | | | $29,642 | | | | $23,216 | | | | $158 | | | | $70 | |
Average net assets (000) | | | $24,849 | | | | $33,597 | | | | $675 | | | | $115 | | | | $17 | |
Ratios to average net assets(c): | | | | | | | | | | | | | | | | | | | | |
| Expenses after waivers and/or expense reimbursement | | | 1.10 | % | | | 1.10 | % | | | 1.10 | % | | | 1.10 | % | | | 1.10 | % |
| Expenses before waivers and/or expense reimbursement | | | 1.24 | % | | | 1.15 | % | | | 3.80 | % | | | 8.55 | % | | | 91.97 | % |
Net investment income (loss) | | | 3.72 | % | | | 2.82 | % | | | 1.36 | % | | | 3.15 | % | | | 2.70 | % |
Portfolio turnover rate(d) | | | 90 | % | | | 201 | % | | | 235 | % | | | 257 | % | | | 153 | % |
| (a) | Calculated based on average shares outstanding during the year. |
| (b) | Total return is calculated assuming a purchase of a share on the first day and a sale on the last day of each year reported and includes reinvestment of dividends and distributions, if any. Total returns may reflect adjustments to conform to GAAP. |
| (c) | Does not include expenses of the underlying funds in which the Fund invests. |
| (d) | The Fund’s portfolio turnover rate is calculated in accordance with regulatory requirements, without regard to transactions involving short-term investments, certain derivatives and in-kind transactions (if any). If such transactions were included, the Fund’s portfolio turnover rate may be higher. |
See Notes to Financial Statements.
PGIM Real Estate Income Fund 29
Notes to Financial Statements
1. Organization
Prudential Investment Portfolios 9 (the “Registered Investment Company” or “RIC”) is registered under the Investment Company Act of 1940, as amended (“1940 Act”), as an open-end management investment company. The RIC is organized as a Delaware Statutory Trust. These financial statements relate only to the PGIM Real Estate Income Fund (the “Fund”), a series of the RIC. The Fund is classified as a non-diversified fund for purposes of the 1940 Act.
The investment objective of the Fund is to seek income and capital appreciation.
2. Accounting Policies
The Fund follows the investment company accounting and reporting guidance of the Financial Accounting Standards Board (“FASB”) Accounting Standard Codification (“ASC”) Topic 946 Financial Services — Investment Companies. The following is a summary of significant accounting policies followed by the Fund in the preparation of its financial statements. The policies conform to U.S. generally accepted accounting principles (“GAAP”). The Fund consistently follows such policies in the preparation of its financial statements.
Securities Valuation: The Fund holds securities and other assets and liabilities that are fair valued as of the close of each day (generally, 4:00 PM Eastern time) the New York Stock Exchange (“NYSE”) is open for trading. As described in further detail below, the Fund’s investments are valued daily based on a number of factors, including the type of investment and whether market quotations are readily available. The RIC’s Board of Trustees (the “Board”) has approved the Fund’s valuation policies and procedures for security valuation and designated to PGIM Investments LLC (“PGIM Investments” or the “Manager”) as the Valuation Designee pursuant to SEC Rule 2a-5(b) to perform the fair value determination relating to all Fund investments. Pursuant to the Board’s oversight, the Valuation Designee has established a Valuation Committee to perform the duties and responsibilities as valuation designee under SEC Rule 2a-5. The valuation procedures permit the Fund to utilize independent pricing vendor services, quotations from market makers, and alternative valuation methods when market quotations are either not readily available or not deemed representative of fair value. Fair value is the price that would be received to sell an asset or paid to transfer a liability in an orderly transaction between market participants on the measurement date. A record of the Valuation Committee’s actions is provided to the Board at the first quarterly meeting following the quarter in which such actions take place.
For the fiscal reporting year-end, securities and other assets and liabilities were fair valued at the close of the last U.S. business day. Trading in certain foreign securities may occur when the NYSE is closed (including weekends and holidays). Because such foreign securities
30
trade in markets that are open on weekends and U.S. holidays, the values of some of the Fund’s foreign investments may change on days when investors cannot purchase or redeem Fund shares.
Various inputs determine how the Fund’s investments are valued, all of which are categorized according to the three broad levels (Level 1, 2, or 3) detailed in the Schedule of Investments and referred to herein as the “fair value hierarchy” in accordance with FASB ASC Topic 820 - Fair Value Measurement.
Common or preferred stocks, exchange-traded funds and derivative instruments, if applicable, that are traded on a national securities exchange are valued at the last sale price as of the close of trading on the applicable exchange where the security principally trades. Securities traded via NASDAQ are valued at the NASDAQ official closing price. To the extent these securities are valued at the last sale price or NASDAQ official closing price, they are classified as Level 1 in the fair value hierarchy. In the event that no sale or official closing price on valuation date exists, these securities are generally valued at the mean between the last reported bid and ask prices, or at the last bid price in the absence of an ask price. These securities are classified as Level 2 in the fair value hierarchy.
Foreign equities traded on foreign securities exchanges are generally valued using pricing vendor services that provide model prices derived using adjustment factors based on information such as local closing price, relevant general and sector indices, currency fluctuations, depositary receipts, and futures, as applicable. Securities valued using such model prices are classified as Level 2 in the fair value hierarchy. The models generate an evaluated adjustment factor for each security, which is applied to the local closing price to adjust it for post closing market movements up to the time the Fund is valued. Utilizing that evaluated adjustment factor, the vendor provides an evaluated price for each security. If the vendor does not provide an evaluated price, securities are valued in accordance with exchange-traded common and preferred stock valuation policies discussed above.
Investments in open-end funds (other than exchange-traded funds) are valued at their net asset values as of the close of the NYSE on the date of valuation. These securities are classified as Level 1 in the fair value hierarchy since they may be purchased or sold at their net asset values on the date of valuation.
Securities and other assets that cannot be priced according to the methods described above are valued based on policies and procedures approved by the Board. In the event that unobservable inputs are used when determining such valuations, the securities will be classified as Level 3 in the fair value hierarchy. Altering one or more unobservable inputs may result in a significant change to a Level 3 security’s fair value measurement.
When determining the fair value of securities, some of the factors influencing the valuation include: the nature of any restrictions on disposition of the securities; assessment of the general liquidity of the securities; the issuer’s financial condition and the markets in which it does business; the cost of the investment; the size of the holding and the capitalization of
PGIM Real Estate Income Fund 31
Notes to Financial Statements (continued)
the issuer; the prices of any recent transactions or bids/offers for such securities or any comparable securities; any available analyst media or other reports or information deemed reliable by the Valuation Designee regarding the issuer or the markets or industry in which it operates. Using fair value to price securities may result in a value that is different from a security’s most recent closing price and from the price used by other unaffiliated mutual funds to calculate their net asset values.
Foreign Currency Translation: The books and records of the Fund are maintained in U.S. dollars. Foreign currency amounts are translated into U.S. dollars on the following basis:
(i) market value of investment securities, other assets and liabilities — at the exchange rate as of the valuation date;
(ii) purchases and sales of investment securities, income and expenses — at the rates of exchange prevailing on the respective dates of such transactions.
Although the net assets of the Fund are presented at the foreign exchange rates and market values at the close of the period, the Fund does not generally isolate that portion of the results of operations arising as a result of changes in the foreign exchange rates from the fluctuations arising from changes in the market prices of long-term portfolio securities held at the end of the period. Similarly, the Fund does not isolate the effect of changes in foreign exchange rates from the fluctuations arising from changes in the market prices of long-term portfolio securities sold during the period. Accordingly, holding period unrealized and realized foreign currency gains (losses) are included in the reported net change in unrealized appreciation (depreciation) on investments and net realized gains (losses) on investment transactions on the Statements of Operations.
Net realized gains (losses) on foreign currency transactions represent net foreign exchange gains (losses) from the disposition of holdings of foreign currencies, currency gains (losses) realized between the trade and settlement dates on investment transactions, and the difference between the amounts of interest, dividends and foreign withholding taxes recorded on the Fund’s books and the U.S. dollar equivalent amounts actually received or paid. Net unrealized currency gains (losses) arise from valuing foreign currency denominated assets and liabilities (other than investments) at period end exchange rates.
Master Netting Arrangements: The RIC, on behalf of the Fund, is subject to various Master Agreements, or netting arrangements, with select counterparties. These are agreements which a subadviser may have negotiated and entered into on behalf of all or a portion of the Fund. A master netting arrangement between the Fund and the counterparty permits the Fund to offset amounts payable by the Fund to the same counterparty against amounts to be received; and by the receipt of collateral from the counterparty by the Fund to cover the
32
Fund’s exposure to the counterparty. However, there is no assurance that such mitigating factors are easily enforceable. In addition to master netting arrangements, the right to set-off exists when all the conditions are met such that each of the parties owes the other determinable amounts, the reporting party has the right to set-off the amount owed with the amount owed by the other party, the reporting party intends to set-off and the right of set-off is enforceable by law.
Securities Lending: The Fund lends its portfolio securities to banks and broker-dealers. The loans are secured by collateral at least equal to the market value of the securities loaned. Collateral pledged by each borrower is invested in an affiliated money market fund and is marked to market daily, based on the previous day’s market value, such that the value of the collateral exceeds the value of the loaned securities. In the event of significant appreciation in value of securities on loan on the last business day of the reporting period, the financial statements may reflect a collateral value that is less than the market value of the loaned securities. Such shortfall is remedied as described above. Loans are subject to termination at the option of the borrower or the Fund. Upon termination of the loan, the borrower will return to the Fund securities identical to the loaned securities. The remaining open loans of the securities lending transactions are considered overnight and continuous. Should the borrower of the securities fail financially, the Fund has the right to repurchase the securities in the open market using the collateral.
The Fund recognizes income, net of any rebate and securities lending agent fees, for lending its securities in the form of fees or interest on the investment of any cash received as collateral. The borrower receives all interest and dividends from the securities loaned and such payments are passed back to the lender in amounts equivalent thereto, which are reflected in interest income or unaffiliated dividend income based on the nature of the payment on the Statement of Operations. The Fund also continues to recognize any unrealized gain (loss) in the market price of the securities loaned and on the change in the value of the collateral invested that may occur during the term of the loan. In addition, realized gain (loss) is recognized on changes in the value of the collateral invested upon liquidation of the collateral. Net earnings from securities lending are disclosed in the Statement of Operations.
Equity and Mortgage Real Estate Investment Trusts (collectively REITs): The Fund invested in REITs, which report information on the source of their distributions annually. Based on current and historical information, a portion of distributions received from REITs during the period is estimated to be dividend income, capital gain or return of capital and recorded accordingly. When material, these estimates are adjusted periodically when the actual source of distributions is disclosed by the REITs.
Securities Transactions and Net Investment Income: Securities transactions are recorded on the trade date. Realized gains (losses) from investment and currency transactions are calculated on the specific identification method. Dividend income is recorded on the ex-date, or for certain foreign securities, when the Fund becomes aware of such dividends. Expenses are recorded on an accrual basis, which may require the use of certain estimates
PGIM Real Estate Income Fund 33
Notes to Financial Statements (continued)
by management that may differ from actual. Net investment income or loss (other than class specific expenses and waivers, which are allocated as noted below) and unrealized and realized gains (losses) are allocated daily to each class of shares based upon the relative proportion of adjusted net assets of each class at the beginning of the day. Class specific expenses and waivers, where applicable, are charged to the respective share classes. Such class specific expenses and waivers include distribution fees and distribution fee waivers, shareholder servicing fees, transfer agent’s fees and expenses, registration fees and fee waivers and/or expense reimbursements, as applicable.
Taxes: It is the Fund’s policy to continue to meet the requirements of the Internal Revenue Code applicable to regulated investment companies and to distribute all of its taxable net investment income and capital gains, if any, to its shareholders. Therefore, no federal income tax provision is required. Withholding taxes on foreign dividends, interest and capital gains, if any, are recorded, net of reclaimable amounts, at the time the related income is earned.
Tax reform legislation commonly referred to as the Tax Cuts and Jobs Act permits a direct REIT shareholder to claim a 20% “qualified business income” deduction for ordinary REIT dividends. The tax legislation did not expressly permit regulated investment companies (“RICs”) paying dividends attributable to such income to pass through this special treatment to its shareholders. On January 18, 2019, the Internal Revenue Service issued final regulations that permit RICs to pass through “qualified REIT dividends” to their shareholders.
Dividends and Distributions: Dividends and distributions to shareholders, which are determined in accordance with federal income tax regulations and which may differ from GAAP, are recorded on the ex-date. Permanent book/tax differences relating to income and gain (loss) are reclassified between total distributable earnings (loss) and paid-in capital in excess of par, as appropriate. The chart below sets forth the expected frequency of dividend and capital gains distributions to shareholders. Various factors may impact the frequency of dividend distributions to shareholders, including but not limited to adverse market conditions or portfolio holding-specific events.
| | |
| Expected Distribution Schedule to Shareholders* | | Frequency |
Net Investment Income | | Quarterly |
Short-Term Capital Gains | | Annually |
Long-Term Capital Gains | | Annually |
| * | Under certain circumstances, the Fund may make more than one distribution of short-term and/or long-term capital gains during a fiscal year. |
34
Estimates: The preparation of financial statements requires management to make estimates and assumptions that affect the reported amounts and disclosures in the financial statements. Actual results could differ from those estimates.
3. Agreements
The RIC, on behalf of the Fund, has a management agreement with the Manager pursuant to which it has responsibility for all investment advisory services and supervises the subadviser’s performance of such services, and pursuant to which it renders administrative services.
The Manager has entered into a subadvisory agreement with PGIM, Inc., which provides subadvisory services to the Fund through its business unit, PGIM Real Estate, and PGIM Real Estate (UK) Limited, an indirect wholly-owned subsidiary of PGIM, Inc. (collectively referred to herein as the “subadviser”). The Manager pays for the services of the subadviser.
Fees payable under the management agreement are computed daily and paid monthly. For the reporting period ended October 31, 2022, the contractual and effective management fee rates were as follows:
| | |
| | |
| Contractual Management Rate | | Effective Management Fee, before any waivers
and/or expense reimbursements |
0.80% on average daily net assets up to and including $1 billion; | | 0.80% |
0.78% on the next $2 billion of average daily net assets; | | |
0.76% on the next $2 billion of average daily net assets; | | |
0.75% on the next $5 billion of average daily net assets; | | |
0.74% on average daily net assets exceeding $10 billion. | | |
The Manager has contractually agreed, through February 29, 2024, to limit total annual operating expenses after fee waivers and/or expense reimbursements. This contractual waiver excludes interest, brokerage, taxes (such as income and foreign withholding taxes, stamp duty and deferred tax expenses), acquired fund fees and expenses, extraordinary expenses, and certain other Fund expenses such as dividend and interest expense and broker charges on short sales.
Where applicable, the Manager agrees to waive management fees or shared operating expenses on any share class to the same extent that it waives such expenses on any other share class. In addition, total annual operating expenses for Class R6 shares will not exceed total annual operating expenses for Class Z shares. Fees and/or expenses waived and/or reimbursed by the Manager for the purpose of preventing the expenses from exceeding a certain expense ratio limit may be recouped by the Manager within the same fiscal year during which such waiver and/or reimbursement is made if such recoupment can be
PGIM Real Estate Income Fund 35
Notes to Financial Statements (continued)
realized without exceeding the expense limit in effect at the time of the recoupment for that fiscal year. The expense limitations attributable to each class are as follows:
| | |
| | |
| Class | | Expense
Limitations |
| A | | 1.35% |
| C | | 2.10 |
| Z | | 1.10 |
| R6 | | 1.10 |
The RIC, on behalf of the Fund, has a distribution agreement with Prudential Investment Management Services LLC (“PIMS”), which acts as the distributor of the Class A, Class C, Class Z and Class R6 shares of the Fund. The Fund compensates PIMS for distributing and servicing the Fund’s Class A and Class C shares, pursuant to the plans of distribution (the “Distribution Plans”), regardless of expenses actually incurred by PIMS.
Pursuant to the Distribution Plans, the Fund compensates PIMS for distribution related activities at an annual rate based on average daily net assets per class. PIMS has contractually agreed through February 29, 2024 to limit such fees on certain classes based on the average daily net assets. The distribution fees are accrued daily and payable monthly.
The Fund’s annual gross and net distribution rate, where applicable, are as follows:
| | | | | | |
| | | | |
| Class | | Gross Distribution Fee | | | | Net Distribution Fee |
A | | 0.30% | | | | 0.25% |
C | | 1.00 | | | | 1.00 |
Z | | N/A | | | | N/A |
R6 | | N/A | | | | N/A |
For the year ended October 31, 2022, PIMS received front-end sales charges (“FESL”) resulting from sales of certain class shares. Additionally, for the year ended October 31, 2022, PIMS did not receive any contingent deferred sales charges (“CDSC”) imposed upon redemptions by certain shareholders.
| | | | | | | | |
| Class | | FESL | | | CDSC | |
A | | $ | 4,182 | | | | $— | |
C | | | — | | | | — | |
PGIM Investments, PGIM, Inc., PGIM Real Estate (UK) Limited and PIMS are indirect, wholly-owned subsidiaries of Prudential Financial, Inc. (“Prudential”).
36
4. Other Transactions with Affiliates
Prudential Mutual Fund Services LLC (“PMFS”), an affiliate of PGIM Investments and an indirect, wholly-owned subsidiary of Prudential, serves as the Fund’s transfer agent and shareholder servicing agent. Transfer agent’s fees and expenses in the Statement of Operations include certain out-of-pocket expenses paid to non-affiliates, where applicable.
The Fund may invest its overnight sweep cash in the PGIM Core Ultra Short Bond Fund (the “Core Fund”), and its securities lending cash collateral in the PGIM Institutional Money Market Fund (the “Money Market Fund”), each a fund of Prudential Investment Portfolios 2, registered under the 1940 Act and managed by PGIM Investments. PGIM Investments and/or its affiliates are paid fees or reimbursed for providing their services to the Core Fund and the Money Market Fund. In addition to the realized and unrealized gains on investments in the Core Fund and Money Market Fund, earnings from such investments are disclosed on the Statement of Operations as “Affiliated dividend income” and “Income from securities lending, net”, respectively. Effective January 2022, the Fund changed its overnight cash sweep vehicle from the Core Fund to an unaffiliated money market fund.
The Fund may enter into certain securities purchase or sale transactions under Board approved Rule 17a-7 procedures. Rule 17a-7 is an exemptive rule under the 1940 Act, that subject to certain conditions, permits purchase and sale transactions among affiliated investment companies, or between an investment company and a person that is affiliated solely by reason of having a common (or affiliated) investment adviser, common directors/trustees, and/or common officers. For the year ended October 31, 2022, no 17a-7 transactions were entered into by the Fund.
5. Portfolio Securities
The aggregate cost of purchases and proceeds from sales of portfolio securities (excluding short-term investments and U.S. Government securities) for the reporting period ended October 31, 2022, were as follows:
| | |
| Cost of Purchases | | Proceeds from Sales |
| |
$30,613,514 | | $36,056,423 |
A summary of the cost of purchases and proceeds from sales of shares of affiliated mutual funds for the year ended October 31, 2022, is presented as follows:
| | | | | | | | | | | | | | |
| | | | | | | | |
Value, Beginning of Year | | Cost of Purchases | | Proceeds from Sales | | Change in Unrealized Gain (Loss) | | Realized Gain (Loss) | | Value, End of Year | | Shares, End of Year | | Income |
|
Short-Term Investments -Affiliated Mutual Funds: |
PGIM Core Ultra Short Bond Fund(1)(wa) |
$108,325 | | $2,070,422 | | $2,178,747 | | $— | | $ — | | $ — | | — | | $ 37 |
PGIM Real Estate Income Fund 37
Notes to Financial Statements (continued)
| | | | | | | | | | | | | | |
| | | | | | | | |
Value, Beginning of Year | | Cost of Purchases | | Proceeds from Sales | | Change in Unrealized Gain (Loss) | | Realized Gain (Loss) | | Value, End of Year | | Shares, End of Year | | Income |
|
PGIM Institutional Money Market Fund(1)(b)(wa) |
$ — | | $4,361,082 | | $4,350,655 | | $— | | $(731) | | $9,696 | | 9,704 | | $389(2) |
$108,325 | | $6,431,504 | | $6,529,402 | | $— | | $(731) | | $9,696 | | | | $426 |
| (1) | The Fund did not have any capital gain distributions during the reporting period. |
| (2) | The amount, or a portion thereof, represents the affiliated securities lending income shown on the Statement of Operations. |
| (b) | Represents security, or portion thereof, purchased with cash collateral received for securities on loan and includes dividend reinvestment. |
| (wa) | PGIM Investments LLC, the manager of the Fund, also serves as manager of the PGIM Core Ultra Short Bond Fund and PGIM Institutional Money Market Fund, if applicable. |
6. Distributions and Tax Information
Distributions to shareholders, which are determined in accordance with federal income tax regulations and which may differ from GAAP, are recorded on the ex-date.
For the year ended October 31, 2022, the tax character of dividends paid by the Fund were $8,792,051 of ordinary income and $466,388 of tax return of capital. For the year ended October 31, 2021, the tax character of dividends paid by the Fund was $1,808,215 of ordinary income.
As of October 31, 2022, there were no accumulated undistributed earnings on a tax basis.
The United States federal income tax basis of the Fund’s investments and the net unrealized depreciation as of October 31, 2022 were as follows:
| | | | | | |
| | | | |
| Tax Basis | | Gross
Unrealized
Appreciation | | Gross
Unrealized
Depreciation | | Net Unrealized
Depreciation |
$33,827,101 | | $214,725 | | $(6,005,956) | | $(5,791,231) |
The difference between GAAP and tax basis were primarily due to deferred losses on wash sales.
For federal income tax purposes, the Fund had a capital loss carryforward as of October 31, 2022 of approximately $79,373 which can be carried forward for an unlimited period. No capital gains distributions are expected to be paid to shareholders until net gains have been realized in excess of such losses.
38
The Manager has analyzed the Fund’s tax positions taken on federal, state and local income tax returns for all open tax years and has concluded that no provision for income tax is required in the Fund’s financial statements for the current reporting period. Since tax authorities can examine previously filed tax returns, the Fund’s U.S. federal and state tax returns for each of the four fiscal years up to the most recent fiscal year ended October 31, 2022 are subject to such review.
7. Capital and Ownership
The Fund offers Class A, Class C, Class Z and Class R6 shares. Class A shares are sold with a maximum front-end sales charge of 5.50%. Investors who purchase $1 million or more of Class A shares and sell these shares within 12 months of purchase are subject to a CDSC of 1%, although they are not subject to an initial sales charge. The Class A CDSC is waived for certain retirement and/or benefit plans. A special exchange privilege is also available for shareholders who qualified to purchase Class A shares at net asset value. Class C shares are sold with a CDSC of 1% on sales made within 12 months of purchase. Class C shares will automatically convert to Class A shares on a monthly basis approximately eight years (ten years prior to January 22, 2021) after purchase. Class Z and Class R6 shares are not subject to any sales or redemption charges and are available exclusively for sale to a limited group of investors.
Under certain circumstances, an exchange may be made from specified share classes of the Fund to one or more other share classes of the Fund as presented in the table of transactions in shares of beneficial interest, below.
The RIC has authorized an unlimited number of shares of beneficial interest of the Fund at $0.001 par value per share, currently divided into four classes, designated Class A, Class C, Class Z and Class R6.
As of October 31, 2022, Prudential, through its affiliated entities, including affiliated funds (if applicable), owned shares of the Fund as follows:
| | | | | | | | |
| | | |
| Class | | Number of Shares | | Percentage of Outstanding Shares |
Z | | | 956,688 | | | | 84.5 | % |
R6 | | | 2,695,189 | | | | 82.8 | |
At the reporting period end, the number of shareholders holding greater than 5% of the Fund are as follows:
| | | | | | | | |
| | | |
| | | Number of Shareholders | | Percentage of Outstanding Shares |
Affiliated | | | 2 | | | | 80.5 | % |
Unaffiliated | | | 1 | | | | 14.4 | |
PGIM Real Estate Income Fund 39
Notes to Financial Statements (continued)
Transactions in shares of beneficial interest were as follows:
| | | | | | | | | | | | |
| | | | |
| Share Class | | Shares | | | | | | Amount | |
| | | |
Class A | | | | | | | | | | | | |
Year ended October 31, 2022: | | | | | | | | | | | | |
Shares sold | | | 23,992 | | | | | | | $ | 207,103 | |
Shares issued in reinvestment of dividends and distributions | | | 46,023 | | | | | | | | 355,748 | |
Shares purchased | | | (104,941 | ) | | | | | | | (795,676 | ) |
Net increase (decrease) in shares outstanding before conversion | | | (34,926 | ) | | | | | | | (232,825 | ) |
Shares issued upon conversion from other share class(es) | | | 258 | | | | | | | | 2,020 | |
Net increase (decrease) in shares outstanding | | | (34,668 | ) | | | | | | $ | (230,805 | ) |
| | | |
Year ended October 31, 2021: | | | | | | | | | | | | |
Shares sold | | | 79,927 | | | | | | | $ | 748,083 | |
Shares issued in reinvestment of dividends and distributions | | | 5,448 | | | | | | | | 53,702 | |
Shares purchased | | | (47,077 | ) | | | | | | | (456,874) | |
Net increase (decrease) in shares outstanding before conversion | | | 38,298 | | | | | | | | 344,911 | |
Shares issued upon conversion from other share class(es) | | | 2,962 | | | | | | | | 28,998 | |
Net increase (decrease) in shares outstanding | | | 41,260 | | | | | | | $ | 373,909 | |
| | | |
Class C | | | | | | | | | | | | |
Year ended October 31, 2022: | | | | | | | | | | | | |
Shares sold | | | 2,956 | | | | | | | $ | 24,300 | |
Shares issued in reinvestment of dividends and distributions | | | 8,622 | | | | | | | | 66,506 | |
Shares purchased | | | (9,484 | ) | | | | | | | (68,123 | ) |
Net increase (decrease) in shares outstanding before conversion | | | 2,094 | | | | | | | | 22,683 | |
Shares purchased upon conversion into other share class(es) | | | (258 | ) | | | | | | | (2,020 | ) |
Net increase (decrease) in shares outstanding | | | 1,836 | | | | | | | $ | 20,663 | |
| | | |
Year ended October 31, 2021: | | | | | | | | | | | | |
Shares sold | | | 3,450 | | | | | | | $ | 34,123 | |
Shares issued in reinvestment of dividends and distributions | | | 961 | | | | | | | | 9,354 | |
Shares purchased | | | (9,335 | ) | | | | | | | (94,421 | ) |
Net increase (decrease) in shares outstanding before conversion | | | (4,924 | ) | | | | | | | (50,944 | ) |
Shares purchased upon conversion into other share class(es) | | | (2,962 | ) | | | | | | | (28,998 | ) |
Net increase (decrease) in shares outstanding | | | (7,886 | ) | | | | | | $ | (79,942 | ) |
| | | |
Class Z | | | | | | | | | | | | |
Year ended October 31, 2022: | | | | | | | | | | | | |
Shares sold | | | 128,475 | | | | | | | $ | 975,580 | |
Shares issued in reinvestment of dividends and distributions | | | 257,914 | | | | | | | | 1,978,932 | |
Shares purchased | | | (317,510 | ) | | | | | | | (3,032,469 | ) |
Net increase (decrease) in shares outstanding | | | 68,879 | | | | | | | $ | (77,957 | ) |
40
| | | | | | | | | | | | |
| | | | |
| Share Class | | Shares | | | | | | Amount | |
| | | |
Year ended October 31, 2021: | | | | | | | | | | | | |
Shares sold | | | 450,856 | | | | | | | $ | 4,063,420 | |
Shares issued in reinvestment of dividends and distributions | | | 44,107 | | | | | | | | 431,334 | |
Shares purchased | | | (217,541 | ) | | | | | | | (2,132,230 | ) |
Net increase (decrease) in shares outstanding before conversion | | | 277,422 | | | | | | | | 2,362,524 | |
Shares purchased upon conversion into other share class(es) | | | (227,572 | ) | | | | | | | (2,384,950 | ) |
Net increase (decrease) in shares outstanding | | | 49,850 | | | | | | | $ | (22,426 | ) |
| | | |
Class R6 | | | | | | | | | | | | |
Year ended October 31, 2022: | | | | | | | | | | | | |
Shares sold | | | 813,769 | | | | | | | $ | 5,925,257 | |
Shares issued in reinvestment of dividends and distributions | | | 890,352 | | | | | | | | 6,840,988 | |
Shares purchased | | | (1,334,054 | ) | | | | | | | (10,243,084 | ) |
Net increase (decrease) in shares outstanding | | | 370,067 | | | | | | | $ | 2,523,161 | |
| | | |
Year ended October 31, 2021: | | | | | | | | | | | | |
Shares sold | | | 1,745,152 | | | | | | | $ | 16,277,005 | |
Shares issued in reinvestment of dividends and distributions | | | 134,512 | | | | | | | | 1,310,829 | |
Shares purchased | | | (2,245,276 | ) | | | | | | | (22,956,775 | ) |
Net increase (decrease) in shares outstanding before conversion | | | (365,612 | ) | | | | | | | (5,368,941 | ) |
Shares issued upon conversion from other share class(es) | | | 228,225 | | | | | | | | 2,384,950 | |
Net increase (decrease) in shares outstanding | | | (137,387 | ) | | | | | | $ | (2,983,991 | ) |
8. Borrowings
The RIC, on behalf of the Fund, along with other affiliated registered investment companies (the “Participating Funds”), is a party to a Syndicated Credit Agreement (“SCA”) with a group of banks. The purpose of the SCA is to provide an alternative source of temporary funding for capital share redemptions. The table below provides details of the current SCA in effect at the reporting period-end as well as the prior SCA.
| | | | |
| | | |
| | | Current SCA | | Prior SCA |
Term of Commitment | | 9/30/2022 - 9/28/2023 | | 10/1/2021 – 9/29/2022 |
Total Commitment | | $1,200,000,000 | | $ 1,200,000,000 |
Annualized Commitment Fee on the Unused Portion of the SCA | | 0.15% | | 0.15% |
Annualized Interest Rate on Borrowings | | 1.00% plus the higher of (1) the effective federal funds rate, (2) the daily SOFR rate plus 0.10% or (3) zero percent | | 1.20% plus the higher of (1) the effective federal funds rate, (2) the one-month LIBOR rate or (3) zero percent |
Certain affiliated registered investment companies that are parties to the SCA include portfolios that are subject to a predetermined mathematical formula used to manage certain benefit guarantees offered under variable annuity contracts. The formula may result in large scale asset flows into and out of these portfolios. Consequently, these portfolios may be more likely to utilize the SCA for purposes of funding redemptions. It may be possible for those
PGIM Real Estate Income Fund 41
Notes to Financial Statements (continued)
portfolios to fully exhaust the committed amount of the SCA, thereby requiring the Manager to allocate available funding per a Board-approved methodology designed to treat the Participating Funds in the SCA equitably.
The Fund utilized the SCA during the year ended October 31, 2022. The average daily balance for the 32 days that the Fund had loans outstanding during the period was approximately $520,219, borrowed at a weighted average interest rate of 1.57%. The maximum loan outstanding amount during the period was $2,043,000. At October 31, 2022, the Fund did not have an outstanding loan amount.
9. Risks of Investing in the Fund
The Fund’s risks include, but are not limited to, some or all of the risks discussed below. For further information on the Fund’s risks, please refer to the Fund’s Prospectus and Statement of Additional Information.
Active Trading Risk: The Fund actively and frequently trades its portfolio securities. High portfolio turnover results in higher transaction costs, which can affect the Fund’s performance and have adverse tax consequences. In addition, high portfolio turnover may also mean that a proportionately greater amount of distributions to shareholders will be taxed as ordinary income rather than long-term capital gains compared to investment companies with lower portfolio turnover.
Distribution Risk: The Fund’s distributions may consist of net investment income, if any, and net realized gains, if any, from the sale of investments and/or return of capital. The Fund will provide to shareholders early in each calendar year the final tax character of the Fund’s distributions for the previous year. Also, at such time that the Fund distribution is expected to be from sources other than current or accumulated net income, a notice to shareholders may be required.
Economic and Market Events Risk: Events in the U.S. and global financial markets, including actions taken by the U.S. Federal Reserve or foreign central banks to stimulate or stabilize economic growth or the functioning of the securities markets, or otherwise reduce inflation may at times result in unusually high market volatility, which could negatively impact performance. Governmental efforts to curb inflation often have negative effects on the level of economic activity. Relatively reduced liquidity in credit and fixed income markets could adversely affect issuers worldwide.
Emerging Markets Risk: The risks of foreign investments are greater for investments in or exposed to emerging markets. Emerging market countries typically have economic and political systems that are less fully developed, and can be expected to be less stable, than
42
those of more developed countries. For example, the economies of such countries can be subject to rapid and unpredictable rates of inflation or deflation. Low trading volumes may result in a lack of liquidity and price volatility. Emerging market countries may have policies that restrict investment by non-U.S. investors, or that prevent non-U.S. investors from withdrawing their money at will.
The Fund may invest in some emerging markets that subject it to risks such as those associated with illiquidity, custody of assets, different settlement and clearance procedures and asserting legal title under a developing legal and regulatory regime to a greater degree than in developed markets or even in other emerging markets.
Equity and Equity-Related Securities Risk: Equity and equity-related securities may be subject to changes in value, and their values may be more volatile than those of other asset classes. In addition to an individual security losing value, the value of the equity markets or a sector in which the Fund invests could go down. Different parts of a market can react differently to adverse issuer, market, regulatory, political and economic developments.
Foreign Securities Risk: Investments in securities of non-U.S. issuers (including those denominated in U.S. dollars) may involve more risk than investing in securities of U.S. issuers. Foreign political, economic and legal systems, especially those in developing and emerging market countries, may be less stable and more volatile than in the United States. Foreign legal systems generally have fewer regulatory requirements than the U.S. legal system, particularly those of emerging markets. In general, less information is publicly available with respect to non-U.S. companies than U.S. companies. Non-U.S. companies generally are not subject to the same accounting, auditing, and financial reporting standards as are U.S. companies. Additionally, the changing value of foreign currencies and changes in exchange rates could also affect the value of the assets the Fund holds and the Fund’s performance. Certain foreign countries may impose restrictions on the ability of issuers of foreign securities to make payment of principal and interest or dividends to investors located outside the country, due to blockage of foreign currency exchanges or otherwise. Investments in emerging markets are subject to greater volatility and price declines.
In addition, the Fund’s investments in non-U.S. securities may be subject to the risks of nationalization or expropriation of assets, imposition of currency exchange controls or restrictions on the repatriation of non-U.S. currency, confiscatory taxation and adverse diplomatic developments. Special U.S. tax considerations may apply.
Increase in Expenses Risk: Your actual cost of investing in the Fund may be higher than the expenses shown in the expense table in the Fund’s prospectus for a variety of reasons. For example, expense ratios may be higher than those shown if average net assets decrease. Net assets are more likely to decrease and Fund expense ratios are more likely to increase when markets are volatile. Active and frequent trading of Fund securities can increase expenses.
PGIM Real Estate Income Fund 43
Notes to Financial Statements (continued)
Large Shareholder and Large Scale Redemption Risk: Certain individuals, accounts, funds (including funds affiliated with the Manager) or institutions, including the Manager and its affiliates, may from time to time own or control a substantial amount of the Fund’s shares. There is no requirement that these entities maintain their investment in the Fund. There is a risk that such large shareholders or that the Fund’s shareholders generally may redeem all or a substantial portion of their investments in the Fund in a short period of time, which could have a significant negative impact on the Fund’s NAV, liquidity, and brokerage costs. Large redemptions could also result in tax consequences to shareholders and impact the Fund’s ability to implement its investment strategy. The Fund’s ability to pursue its investment objective after one or more large scale redemptions may be impaired and, as a result, the Fund may invest a larger portion of its assets in cash or cash equivalents.
Market Capitalization Risk: The Fund may invest in companies of any market capitalization. Generally, the stock prices of small- and mid-cap companies are less stable than the prices of large-cap stocks and may present greater risks. Large capitalization companies as a group could fall out of favor with the market, causing the Fund to underperform compared to investments that focus on smaller capitalized companies.
Market Disruption and Geopolitical Risks: Market disruption can be caused by economic, financial or political events and factors, including but not limited to, international wars or conflicts (including Russia’s military invasion of Ukraine), geopolitical developments (including trading and tariff arrangements, sanctions and cybersecurity attacks), instability in regions such as Asia, Eastern Europe and the Middle East, terrorism, natural disasters and public health epidemics (including the outbreak of COVID-19 globally).
The extent and duration of such events and resulting market disruptions cannot be predicted, but could be substantial and could magnify the impact of other risks to the Fund. These and other similar events could adversely affect the U.S. and foreign financial markets and lead to increased market volatility, reduced liquidity in the securities markets, significant negative impacts on issuers and the markets for certain securities and commodities and/or government intervention. They may also cause short- or long-term economic uncertainties in the United States and worldwide. As a result, whether or not the Fund invests in securities of issuers located in or with significant exposure to the countries directly affected, the value and liquidity of the Fund’s investments may be negatively impacted. Further, due to closures of certain markets and restrictions on trading certain securities, the value of certain securities held by the Fund could be significantly impacted, which could lead to such securities being valued at zero.
COVID-19 and the related governmental and public responses have had and may continue to have an impact on the Fund’s investments and net asset value and have led and may continue to lead to increased market volatility and the potential for illiquidity in certain
44
classes of securities and sectors of the market. They have also had and may continue to result in periods of business disruption, business closures, inability to obtain raw materials, supplies and component parts, and reduced or disrupted operations for the issuers in which the Fund invests. The occurrence, reoccurrence and pendency of public health epidemics could adversely affect the economies and financial markets either in specific countries or worldwide.
Market Risk: Securities markets may be volatile and the market prices of the Fund’s securities may decline. Securities fluctuate in price based on changes in an issuer’s financial condition and overall market and economic conditions. If the market prices of the securities owned by the Fund fall, the value of your investment in the Fund will decline.
Non-Diversified Investment Company Risk: The Fund is non-diversified for purposes of the 1940 Act. This means that the Fund may invest a greater percentage of its assets in the securities of a single company or other issuer than a diversified fund. Investing in a non-diversified fund involves greater risk than investing in a diversified fund because a loss resulting from the decline in value of any one security may represent a greater portion of the total assets of a non-diversified fund.
Real Estate Investment Trust (“REIT”) Risk: Investing in REITs involves certain unique risks in addition to those risks associated with investing in the real estate industry in general. REITs may be affected by changes in the value of the underlying property owned by the REITs, while mortgage REITs may be affected by the quality of any credit extended. REITs are dependent upon management skills, may not be diversified geographically or by property/mortgage asset type, and are subject to heavy cash flow dependency, default by borrowers and self-liquidation. REITs may be more volatile and/or more illiquid than other types of equity securities. REITs (especially mortgage REITs) are subject to interest rate risks. REITs may incur significant amounts of leverage. The Fund will indirectly bear a portion of the expenses, including management fees, paid by each REIT in which it invests, in addition to the expenses of the Fund.
REITs must also meet certain requirements under the Internal Revenue Code of 1986, as amended (the Code) to avoid entity level tax and be eligible to pass-through certain tax attributes of their income to shareholders. REITs are consequently subject to the risk of failing to meet these requirements for favorable tax treatment and of failing to maintain their exemptions from registration under the Investment Company Act of 1940. REITs are subject to the risks of changes in the Code affecting their tax status.
Real Estate Related Securities Risk: Because the Fund invests in real estate securities, including REITs, the Fund is subject to the risks of investing in the real estate industry, such as changes in general and local economic conditions, the supply and demand for real estate and changes in zoning and tax laws. Since the Fund concentrates in the real estate industry, its holdings can vary significantly from broad market indices. As a result, the Fund’s performance can deviate from the performance of such indices. Because the Fund invests in stocks, there is the risk that the price of a particular stock owned by the Fund could go
PGIM Real Estate Income Fund 45
Notes to Financial Statements (continued)
down or pay lower-than-expected or no dividends. In addition to an individual stock losing value, the value of the equity markets or of companies comprising the real estate industry could go down.
An investment in the Fund will be closely linked to the performance of the real estate markets. Real estate securities are subject to the same risks as direct investments in real estate and mortgages, and their value will depend on the value of the underlying properties or the underlying loans or interests. The underlying loans may be subject to the risks of default or of prepayments that occur earlier or later than expected, and such loans may also include so-called “subprime” mortgages. The value of these securities will rise and fall in response to many factors, including economic conditions, the demand for rental property and interest rates. In particular, the value of these securities may decline when interest rates rise and will also be affected by the real estate market and by the management of the underlying properties.
Selection Risk: Selection risk is the risk that the securities selected by the subadviser will underperform the market, the relevant indices, or other funds with similar investment objectives and investment strategies. Individual REIT prices may drop because of the failure of borrowers to pay their loans, a dividend reduction, a disruption to the real estate investment sales market, changes in federal or state taxation policies affecting REITs, or poor management of a REIT.
Value Style Risk: Since the Fund follows a value investment style, there is the risk that the value style may be out of favor for long periods of time, that the market will not recognize a security’s intrinsic value for a long time or at all, or that a stock judged to be undervalued may actually be appropriately priced or overvalued. Issuers of value stocks may have experienced adverse business developments or may be subject to special risks that have caused the stock to be out of favor. In addition, the Fund’s value investment style may go out of favor with investors, negatively affecting the Fund’s performance. If the Fund’s assessment of market conditions or a company’s value is inaccurate, the Fund could suffer losses or produce poor performance relative to other funds.
10. Subsequent Event
As of the close of business on November 15, 2022, the Fund settled the redemption of fund Class Z shares by delivering to an affiliate portfolio securities and other assets. The value of such securities and other assets that were transferred in-kind was $6,247,174.
In-kind redemption gains and losses are excluded in the calculation of taxable gain (loss) for federal income tax purposes.
46
Report of Independent Registered Public Accounting Firm
To the Board of Trustees of Prudential Investment Portfolios 9 and Shareholders of PGIM Real Estate Income Fund
Opinion on the Financial Statements
We have audited the accompanying statement of assets and liabilities, including the schedule of investments, of PGIM Real Estate Income Fund (one of the funds constituting Prudential Investment Portfolios 9, referred to hereafter as the “Fund”) as of October 31, 2022, the related statement of operations for the year ended October 31, 2022, the statements of changes in net assets for each of the two years in the period ended October 31, 2022, including the related notes, and the financial highlights for each of the three years in the period ended October 31, 2022 (collectively referred to as the “financial statements”). In our opinion, the financial statements present fairly, in all material respects, the financial position of the Fund as of October 31, 2022, the results of its operations for the year then ended, the changes in its net assets for each of the two years in the period ended October 31 2022 and the financial highlights for each of the three years in the period ended October 31, 2022 in conformity with accounting principles generally accepted in the United States of America.
The financial statements of the Fund as of and for the year ended October 31, 2019 and the financial highlights for each of the periods ended on or prior to October 31, 2019 (not presented herein, other than the financial highlights) were audited by other auditors whose report dated December 16, 2019 expressed an unqualified opinion on those financial statements and financial highlights.
Basis for Opinion
These financial statements are the responsibility of the Fund’s management. Our responsibility is to express an opinion on the Fund’s financial statements based on our audits. We are a public accounting firm registered with the Public Company Accounting Oversight Board (United States) (PCAOB) and are required to be independent with respect to the Fund in accordance with the U.S. federal securities laws and the applicable rules and regulations of the Securities and Exchange Commission and the PCAOB.
We conducted our audits of these financial statements in accordance with the standards of the PCAOB. Those standards require that we plan and perform the audit to obtain reasonable assurance about whether the financial statements are free of material misstatement, whether due to error or fraud.
Our audits included performing procedures to assess the risks of material misstatement of the financial statements, whether due to error or fraud, and performing procedures that respond to those risks. Such procedures included examining, on a test basis, evidence regarding the amounts and disclosures in the financial statements. Our audits also included evaluating the accounting principles used and significant estimates made by management, as well as evaluating the overall presentation of the financial statements. Our procedures included confirmation of securities owned as of October 31, 2022 by correspondence with the custodian, transfer agent and brokers. We believe that our audits provide a reasonable basis for our opinion.
/s/PricewaterhouseCoopers LLP
New York, New York
December 16, 2022
We have served as the auditor of one or more investment companies in the PGIM Retail Funds complex since 2020.
PGIM Real Estate Income Fund 47
Tax Information (unaudited)
For the year ended October 31, 2022, the Fund reports the maximum amount allowable, but not less than 2.37% of the ordinary income dividends paid during the year as qualified dividend income in accordance with Section 854 of the Internal Revenue Code.
In January 2023, you will be advised on IRS Form 1099-DIV or substitute 1099-DIV as to the federal tax status of the dividends received by you in calendar year 2022.
48
INFORMATION ABOUT BOARD MEMBERS AND OFFICERS (unaudited)
Information about Board Members and Officers of the Fund is set forth below. Board Members who are not deemed to be “interested persons” of the Fund, as defined in the 1940 Act, are referred to as “Independent Board Members.” Board Members who are deemed to be “interested persons” of the Fund are referred to as “Interested Board Members.” The Board Members are responsible for the overall supervision of the operations of the Fund and perform the various duties imposed on the directors of investment companies by the 1940 Act. The Board in turn elects the Officers, who are responsible for administering the day-to-day operations of the Fund.
| | | | | | |
| | | |
| Independent Board Members | | | | |
| | | | |
Name Year of Birth Position(s) Portfolios Overseen | | Principal Occupation(s) During Past Five Years | | Other Directorships Held During Past Five Years | | Length of Board Service |
| | | | |
Ellen S. Alberding 1958 Board Member Portfolios Overseen: 97 | | President and Board Member, The Joyce Foundation (charitable foundation) (since 2002); formerly Vice Chair, City Colleges of Chicago (community college system) (2011-2015); Trustee, National Park Foundation (charitable foundation for national park system) (2009-2018); Trustee, Economic Club of Chicago (2009-2016); Trustee, Loyola University (since 2018). | | None. | | Since September 2013 |
| | | | |
Kevin J. Bannon 1952 Board Member Portfolios Overseen: 97 | | Retired; formerly Managing Director (April 2008-May 2015) and Chief Investment Officer (October 2008-November 2013) of Highmount Capital LLC (registered investment adviser); formerly Executive Vice President and Chief Investment Officer (April 1993-August 2007) of Bank of New York Company; President (May 2003-May 2007) of BNY Hamilton Family of Mutual Funds. | | Director of Urstadt Biddle Properties (equity real estate investment trust) (since September 2008). | | Since July 2008 |
PGIM Real Estate Income Fund
| | | | | | |
| | | |
| Independent Board Members | | | | |
| | | | |
Name Year of Birth Position(s) Portfolios Overseen | | Principal Occupation(s) During Past Five Years | | Other Directorships Held During Past Five Years | | Length of Board Service |
| | | | |
Linda W. Bynoe 1952 Board Member Portfolios Overseen: 94 | | President and Chief Executive Officer (since March 1995) and formerly Chief Operating Officer (December 1989-February 1995) of Telemat Limited LLC (formerly Telemat Ltd) (management consulting); formerly Vice President (January 1985-June 1989) at Morgan Stanley & Co. (broker-dealer). | | Trustee of Equity Residential (residential real estate) (since December 2009); Director of Northern Trust Corporation (financial services) (since April 2006); formerly Director of Anixter International, Inc. (communication products distributor) (January 2006-June 2020). | | Since March 2005 |
| | | | |
Barry H. Evans 1960 Board Member Portfolios Overseen: 96 | | Retired; formerly President (2005-2016), Global Chief Operating Officer (2014-2016), Chief Investment Officer - Global Head of Fixed Income (1998-2014), and various portfolio manager roles (1986-2006), Manulife Asset Management (asset management). | | Formerly Director, Manulife Trust Company (2011-2018); formerly Director, Manulife Asset Management Limited (2015-2017); formerly Chairman of the Board of Directors of Manulife Asset Management U.S. (2005-2016); formerly Chairman of the Board, Declaration Investment Management and Research (2008-2016). | | Since September 2017 |
| | | | |
Keith F. Hartstein 1956 Board Member & Independent Chair Portfolios Overseen: 97 | | Retired; Member (November 2014-September 2022) of the Governing Council of the Independent Directors Council (IDC) (organization of independent mutual fund directors); formerly Executive Committee of the IDC Board of Governors (October 2019-December 2021); formerly President and Chief Executive Officer (2005-2012), Senior Vice President (2004-2005), Senior Vice President of Sales and Marketing (1997-2004), and various executive management positions (1990-1997), John Hancock Funds, LLC (asset management); Chairman, Investment Company Institute’s Sales Force Marketing Committee (2003-2008). | | None. | | Since September 2013 |
Visit our website at pgim.com/investments
| | | | | | |
| | | |
| Independent Board Members | | | | |
| | | | |
Name Year of Birth Position(s) Portfolios Overseen | | Principal Occupation(s) During Past Five Years | | Other Directorships Held During Past Five Years | | Length of Board Service |
| | | | |
Laurie Simon Hodrick 1962 Board Member Portfolios Overseen: 93 | | A. Barton Hepburn Professor Emerita of Economics in the Faculty of Business, Columbia Business School (since 2018); Visiting Fellow at the Hoover Institution, Stanford University (since 2015); Sole Member, ReidCourt LLC (since 2008) (a consulting firm); formerly Visiting Professor of Law, Stanford Law School (2015-2021); formerly A. Barton Hepburn Professor of Economics in the Faculty of Business, Columbia Business School (1996-2017); formerly Managing Director, Global Head of Alternative Investment Strategies, Deutsche Bank (2006-2008). | | Independent Director, Andela (since January 2022) (global talent network); Independent Director, Roku (since December 2020) (communication services); formerly Independent Director, Synnex Corporation (2019-2021) (information technology); formerly Independent Director, Kabbage, Inc. (2018-2020) (financial services); formerly Independent Director, Corporate Capital Trust (2017-2018) (a business development company). | | Since September 2017 |
| | | | |
Brian K. Reid 1961 Board Member Portfolios Overseen: 96 | | Retired; formerly Chief Economist for the Investment Company Institute (ICI) (2005-2017); formerly Senior Economist and Director of Industry and Financial Analysis at the ICI (1998-2004); formerly Senior Economist, Industry and Financial Analysis at the ICI (1996-1998); formerly Staff Economist at the Federal Reserve Board (1989-1996); Director, ICI Mutual Insurance Company (2012-2017). | | None. | | Since March 2018 |
PGIM Real Estate Income Fund
| | | | | | |
| | | |
| Independent Board Members | | | | |
| | | | |
Name Year of Birth Position(s) Portfolios Overseen | | Principal Occupation(s) During Past Five Years | | Other Directorships Held During Past Five Years | | Length of Board Service |
| | | | |
Grace C. Torres 1959 Board Member Portfolios Overseen: 96 | | Retired; formerly Treasurer and Principal Financial and Accounting Officer of the PGIM Funds, Target Funds, Advanced Series Trust, Prudential Variable Contract Accounts and The Prudential Series Fund (1998-June 2014); Assistant Treasurer (March 1999-June 2014) and Senior Vice President (September 1999-June 2014) of PGIM Investments LLC; Assistant Treasurer (May 2003-June 2014) and Vice President (June 2005-June 2014) of AST Investment Services, Inc.; Senior Vice President and Assistant Treasurer (May 2003-June 2014) of Prudential Annuities Advisory Services, Inc. | | Director (since January 2018) of OceanFirst Financial Corp. and OceanFirst Bank; formerly Director (July 2015-January 2018) of Sun Bancorp, Inc. N.A. and Sun National Bank. | | Since November 2014 |
Visit our website at pgim.com/investments
| | | | | | |
| |
| Interested Board Members |
| | | | |
Name Year of Birth Position(s) Portfolios Overseen | | Principal Occupation(s) During Past Five Years | | Other Directorships Held During Past Five Years | | Length of Board Service |
| | | | |
Stuart S. Parker 1962 Board Member & President Portfolios Overseen: 96 | | President, Chief Executive Officer, Chief Operating Officer and Officer in Charge of PGIM Investments LLC (formerly known as Prudential Investments LLC) (since January 2012); President and Principal Executive Officer ("PEO") (since September 2022) of the PGIM Private Credit Fund; President and PEO (since March 2022) of the PGIM Private Real Estate Fund, Inc.; formerly Executive Vice President of Jennison Associates LLC and Head of Retail Distribution of PGIM Investments LLC (June 2005-December 2011); Investment Company Institute - Board of Governors (since May 2012). | | None. | | Since January 2012 |
| | | | |
Scott E. Benjamin 1973 Board Member & Vice President Portfolios Overseen: 97 | | Executive Vice President (since May 2009) of PGIM Investments LLC; Vice President (since June 2012) of Prudential Investment Management Services LLC; Executive Vice President (since September 2009) of AST Investment Services, Inc.; Senior Vice President of Product Development and Marketing, PGIM Investments (since February 2006); Vice President (since September 2022) of the PGIM Private Credit Fund; Vice President (since March 2022) of the PGIM Private Real Estate Fund, Inc.; formerly Vice President of Product Development and Product Management, PGIM Investments LLC (2003-2006). | | None. | | Since March 2010 |
PGIM Real Estate Income Fund
| | | | |
| | | |
| Fund Officers(a) | | | | |
| | | |
Name Year of Birth Fund Position | | Principal Occupation(s) During Past Five Years | | Length of Service as Fund Officer |
| | | |
Claudia DiGiacomo 1974 Chief Legal Officer | | Chief Legal Officer (since September 2022) of the PGIM Private Credit Fund; Chief Legal Officer (since July 2022) of the PGIM Private Real Estate Fund, Inc.; Chief Legal Officer, Executive Vice President and Secretary of PGIM Investments LLC (since August 2020); Chief Legal Officer of Prudential Mutual Fund Services LLC (since August 2020); Chief Legal Officer of PIFM Holdco, LLC (since August 2020); Vice President and Corporate Counsel (since January 2005) of Prudential; and Corporate Counsel of AST Investment Services, Inc. (since August 2020); formerly Vice President and Assistant Secretary of PGIM Investments LLC (2005-2020); formerly Associate at Sidley Austin Brown & Wood LLP (1999-2004). | | Since December 2005 |
| | | |
Isabelle Sajous 1976 Chief Compliance Officer | | Chief Compliance Officer (since April 2022) of PGIM Investments LLC, the PGIM Funds, Target Funds, PGIM ETF Trust, PGIM Global High Yield Fund, Inc., PGIM High Yield Bond Fund, Inc., PGIM Short Duration High Yield Opportunities Fund, Advanced Series Trust, The Prudential Series Fund and Prudential’s Gibraltar Fund, Inc.; Chief Compliance Officer (since September 2022) of the PGIM Private Credit Fund; Chief Compliance Officer (since March 2022) of the PGIM Private Real Estate Fund, Inc.; Vice President, Compliance of PGIM Investments LLC (since December 2020); formerly Director, Compliance (July 2018-December 2020) of Credit Suisse Asset Management LLC; and Vice President, Associate General Counsel & Deputy Chief Compliance Officer of Cramer Rosenthal McGlynn, LLC (August 2014-July 2018). | | Since April 2022 |
| | | |
Andrew R. French 1962 Secretary | | Vice President (since December 2018) of PGIM Investments LLC; Secretary (since September 2022) of the PGIM Private Credit Fund; Secretary (since March 2022) of the PGIM Private Real Estate Fund, Inc.; formerly Vice President and Corporate Counsel (2010-2018) of Prudential; formerly Director and Corporate Counsel (2006-2010) of Prudential; Vice President and Assistant Secretary (since January 2007) of PGIM Investments LLC; Vice President and Assistant Secretary (since January 2007) of Prudential Mutual Fund Services LLC. | | Since October 2006 |
| | | |
Melissa Gonzalez 1980 Assistant Secretary | | Vice President and Corporate Counsel (since September 2018) of Prudential; Vice President and Assistant Secretary (since August 2020) of PGIM Investments LLC; Assistant Secretary (since September 2022) of the PGIM Private Credit Fund; Assistant Secretary (since March 2022) of the PGIM Private Real Estate Fund, Inc.; formerly Director and Corporate Counsel (March 2014-September 2018) of Prudential. | | Since March 2020 |
Visit our website at pgim.com/investments
| | | | |
| | | |
| Fund Officers(a) | | | | |
| | | |
Name Year of Birth Fund Position | | Principal Occupation(s) During Past Five Years | | Length of Service as Fund Officer |
| | | |
Patrick E. McGuinness 1986 Assistant Secretary | | Vice President and Assistant Secretary (since August 2020) of PGIM Investments LLC; Director and Corporate Counsel (since February 2017) of Prudential; Assistant Secretary (since September 2022) of the PGIM Private Credit Fund; Assistant Secretary (since March 2022) of the PGIM Private Real Estate Fund, Inc. | | Since June 2020 |
| | | |
Debra Rubano 1975 Assistant Secretary | | Vice President and Corporate Counsel (since November 2020) of Prudential; Assistant Secretary (since September 2022) of the PGIM Private Credit Fund; Assistant Secretary (since March 2022) of the PGIM Private Real Estate Fund, Inc; formerly Director and Senior Counsel of Allianz Global Investors U.S. Holdings LLC (2010-2020) and Assistant Secretary of numerous funds in the Allianz fund complex (2015-2020). | | Since December 2020 |
| | | |
Kelly A. Coyne 1968 Assistant Secretary | | Director, Investment Operations of Prudential Mutual Fund Services LLC (since 2010); Assistant Secretary (since September 2022) of the PGIM Private Credit Fund; Assistant Secretary (since March 2022) of the PGIM Private Real Estate Fund, Inc. | | Since March 2015 |
| | | |
Christian J. Kelly 1975 Treasurer and Principal Financial and Accounting Officer | | Vice President, Head of Fund Administration of PGIM Investments LLC (since November 2018); Principal Financial Officer (since September 2022) of the PGIM Private Credit Fund; Principal Financial Officer (since March 2022) of the PGIM Private Real Estate Fund, Inc.; formerly, Treasurer and Principal Accounting Officer (March 2022- July 2022) of the PGIM Private Real Estate Fund, Inc.; formerly Director of Fund Administration of Lord Abbett & Co. LLC (2009-2018), Treasurer and Principal Accounting Officer of the Lord Abbett Family of Funds (2017-2018); Director of Accounting, Avenue Capital Group (2008-2009); Senior Manager, Investment Management Practice of Deloitte & Touche LLP (1998-2007). | | Since January 2019 |
| | | |
Lana Lomuti 1967 Assistant Treasurer | | Vice President (since 2007) and Director (2005-2007), within PGIM Investments Fund Administration; formerly Assistant Treasurer (December 2007-February 2014) of The Greater China Fund, Inc. | | Since April 2014 |
| | | |
Russ Shupak 1973 Assistant Treasurer | | Vice President (since 2017) and Director (2013-2017), within PGIM Investments Fund Administration; Treasurer and Principal Accounting Officer (since July 2022) of the PGIM Private Real Estate Fund, Inc.; Assistant Treasurer (since September 2022) of the PGIM Private Credit Fund; formerly Assistant Treasurer (March 2022 – July 2022) of the PGIM Private Real Estate Fund, Inc. | | Since October 2019 |
| | | |
Deborah Conway 1969 Assistant Treasurer | | Vice President (since 2017) and Director (2007-2017), within PGIM Investments Fund Administration. | | Since October 2019 |
PGIM Real Estate Income Fund
| | | | |
| | | |
| Fund Officers(a) | | | | |
| | | |
Name Year of Birth Fund Position | | Principal Occupation(s) During Past Five Years | | Length of Service as Fund Officer |
| | | |
Elyse M. McLaughlin 1974 Assistant Treasurer | | Vice President (since 2017) and Director (2011-2017), within PGIM Investments Fund Administration; Treasurer and Principal Accounting Officer (since September 2022) of the PGIM Private Credit Fund; Assistant Treasurer (since March 2022) of the PGIM Private Real Estate Fund, Inc. | | Since October 2019 |
| | | |
Kelly Florio 1978 Anti-Money Laundering Compliance Officer | | Vice President, Corporate Compliance, Global Compliance Programs and Compliance Risk Management (since December 2021) of Prudential; formerly, Head of Fraud Risk Management (October 2019 to December 2021) at New York Life Insurance Company; formerly, Head of Key Risk Area Operations (November 2018 to October 2019), Director of the US Anti-Money Laundering Compliance Unit (2009-2018) and Bank Loss Prevention Associate (2006 -2009) at MetLife. | | Since June 2022 |
(a) Excludes Mr. Parker and Mr. Benjamin, interested Board Members who also serve as President and Vice President, respectively.
Explanatory Notes to Tables:
| ∎ | | Board Members are deemed to be “Interested,” as defined in the 1940 Act, by reason of their affiliation with PGIM Investments LLC and/or an affiliate of PGIM Investments LLC. |
| ∎ | | Unless otherwise noted, the address of all Board Members and Officers is c/o PGIM Investments LLC, 655 Broad Street, Newark, New Jersey 07102-4410. |
| ∎ | | There is no set term of office for Board Members or Officers. The Board Members have adopted a retirement policy, which calls for the retirement of Board Members on December 31 of the year in which they reach the age of 75. |
| ∎ | | “Other Directorships Held” includes all directorships of companies required to register or file reports with the SEC under the 1934 Act (that is, “public companies”) or other investment companies registered under the 1940 Act. |
| ∎ | | “Portfolios Overseen” includes all investment companies managed by PGIM Investments LLC. The investment companies for which PGIM Investments LLC serves as manager include the PGIM Mutual Funds, Target Funds, The Prudential Variable Contract Accounts, PGIM ETF Trust, PGIM Private Real Estate Fund, Inc., PGIM Private Credit Fund, PGIM High Yield Bond Fund, Inc., PGIM Global High Yield Fund, Inc., PGIM Short Duration High Yield Opportunities Fund, The Prudential Series Fund, Prudential’s Gibraltar Fund, Inc. and the Advanced Series Trust. |
| ∎ | | As used in the Fund Officers table “Prudential” means The Prudential Insurance Company of America. |
Visit our website at pgim.com/investments
Approval of Advisory Agreements (unaudited)
The Fund’s Board of Trustees
The Board of Trustees (the “Board") of PGIM Real Estate Income Fund (the “Fund”)1 consists of ten individuals, eight of whom are not “interested persons" of the Fund, as defined in the Investment Company Act of 1940, as amended (the "1940 Act") (the "Independent Trustees"). The Board is responsible for the oversight of the Fund and its operations, and performs the various duties imposed on the directors of investment companies by the 1940 Act. The Independent Trustees have retained independent legal counsel to assist them in connection with their duties. The Chair of the Board is an Independent Trustee. The Board has established five standing committees: the Audit Committee, the Nominating and Governance Committee, the Compliance Committee and two Investment Committees. Each committee is chaired by, and composed of, Independent Trustees.
Annual Approval of the Fund’s Advisory Agreements
As required under the 1940 Act, the Board determines annually whether to renew the Fund‘s management agreement with PGIM Investments LLC ("PGIM Investments") and the Fund’s subadvisory agreement with PGIM Real Estate (UK) Limited ("PGIM RE (UK)") and PGIM, Inc. (“PGIM”) on behalf of its PGIM Real Estate unit (“PGIM Real Estate”). In considering the renewal of the agreements, the Board, including all of the Independent Trustees, met on May 26 and June 7-9, 2022 (the ”Board Meeting”) and approved the renewal of the agreements through July 31, 2022, after concluding that the renewal of the agreements was in the best interests of the Fund and its shareholders.
In advance of the meetings, the Board requested and received materials relating to the agreements, and had the opportunity to ask questions and request further information in connection with its consideration. Among other things, the Board considered comparative fee information from PGIM Investments, PGIM RE (UK) and PGIM. Also, the Board considered comparisons with other mutual funds in relevant Peer Universes and Peer Groups, as is further discussed below.
In approving the agreements, the Board, including the Independent Trustees advised by independent legal counsel, considered the factors it deemed relevant, including the nature, quality and extent of services provided by PGIM Investments and the subadvisers, the performance of the Fund, the profitability of PGIM Investments and its affiliates, expenses and fees, and the potential for economies of scale that may be shared with the Fund and its shareholders as the Fund’s assets grow. In their deliberations, the Trustees did not identify any single factor which alone was responsible for the Board’s decision to approve the agreements with respect to the Fund. In connection with its deliberations, the Board considered information provided by PGIM Investments throughout the year at regular Board meetings, presentations from portfolio managers and other information, as well as information furnished at or in advance of the Board Meeting.
1 PGIM Real Estate Income Fund is a series of Prudential Investment Portfolios 9.
PGIM Real Estate Income Fund
Approval of Advisory Agreements (continued)
The Trustees determined that the overall arrangements between the Fund and PGIM Investments, which serves as the Fund’s investment manager pursuant to a management agreement, and between PGIM Investments and each of PGIM RE (UK) and PGIM, which serve as the Fund’s subadvisers pursuant to the terms of a subadvisory agreement with PGIM Investments, are in the best interests of the Fund and its shareholders in light of the services performed, fees charged and such other matters as the Trustees considered relevant in the exercise of their business judgment.
The material factors and conclusions that formed the basis for the Trustees’ reaching their determinations to approve the continuance of the agreements are separately discussed below.
Nature, Quality and Extent of Services
The Board received and considered information regarding the nature, quality and extent of services provided to the Fund by PGIM Investments, PGIM RE (UK) and PGIM Real Estate. The Board noted that PGIM Real Estate and PGIM RE (UK) are affiliated with PGIM Investments. The Board considered the services provided by PGIM Investments, including but not limited to the oversight of the subadvisers for the Fund, as well as the provision of fund recordkeeping, compliance and other services to the Fund and PGIM Investments’ role as the administrator for the Fund’s liquidity risk management program. With respect to PGIM Investments’ oversight of the subadvisers, the Board noted that PGIM Investments’ Strategic Investment Research Group (“SIRG”), which is a business unit of PGIM Investments, is responsible for monitoring and reporting to PGIM Investments’ senior management on the performance and operations of the subadvisers. The Board also considered that PGIM Investments pays the salaries of all of the officers and interested Trustees of the Fund who are part of Fund management.
The Board also considered the investment subadvisory services provided by PGIM Real Estate and PGIM RE (UK), including investment research and security selection, as well as adherence to the Fund’s investment restrictions and compliance with applicable Fund policies and procedures. The Board considered PGIM Investments’ evaluation of the subadvisers, as well as PGIM Investments’ recommendation, based on its review of the subadvisers, to renew the subadvisory agreement. The Board considered the qualifications, backgrounds and responsibilities of PGIM Investments’ senior management responsible for the oversight of the Fund, PGIM RE (UK) and PGIM Real Estate, and also considered the qualifications, backgrounds and responsibilities of the PGIM RE (UK) and PGIM Real Estate portfolio managers who are responsible for the day-to-day management of the Fund’s portfolio. The Board was provided with information pertaining to PGIM Investments’, PGIM Real Estate’s, PGIM RE (UK)’s and PGIM’s organizational structure, senior management, investment operations, and other relevant information pertaining to PGIM Investments, PGIM Real Estate, PGIM RE (UK) and PGIM. The Board also noted that it received favorable compliance reports from the Fund’s Chief Compliance Officer (“CCO”) as to PGIM Investments, PGIM Real Estate, PGIM RE (UK) and PGIM.
Visit our website at pgim.com/investments
The Board concluded that it was satisfied with the nature, extent and quality of the investment management services provided by PGIM Investments and the subadvisory services provided to the Fund by PGIM Real Estate and PGIM RE (UK), and that there was a reasonable basis on which to conclude that the Fund benefits from the services provided by PGIM Investments, PGIM RE (UK) and PGIM Real Estate under the management and subadvisory agreements.
Costs of Services and Profits Realized by PGIM Investments
The Board was provided with information on the profitability of PGIM Investments and its affiliates in serving as the Fund’s investment manager. The Board discussed with PGIM Investments the methodology utilized in assembling the information regarding profitability and considered its reasonableness. The Board recognized that it is difficult to make comparisons of profitability from fund management contracts because comparative information is not generally publicly available and is affected by numerous factors, including the structure of the particular adviser, the types of funds it manages, its business mix, numerous assumptions regarding allocations and the adviser’s capital structure and cost of capital. However, the Board considered that the cost of services provided by PGIM Investments to the Fund during the year ended December 31, 2021 exceeded the management fees paid by the Fund, resulting in an operating loss to PGIM Investments. Taking these factors into account, the Board concluded that the profitability of PGIM Investments and its affiliates in relation to the services rendered was not unreasonable.
Economies of Scale
The Board received and discussed information concerning economies of scale that PGIM Investments may realize as the Fund’s assets grow beyond current levels. The Board noted that the management fee schedule for the Fund includes breakpoints, which have the effect of decreasing the fee rate as assets increase. During the course of time, the Board has considered information regarding the launch date of the Fund, the management fees of the Fund compared to those of similarly managed funds and PGIM Investments’ investment in the Fund over time. The Board noted that economies of scale can be shared with the Fund in other ways, including low management fees from inception, additional technological and personnel investments to enhance shareholder services, and maintaining existing expense structures in the face of a rising cost environment. The Board also considered PGIM Investments’ assertion that it continually evaluates the management fee schedule of the Fund and the potential to share economies of scale through breakpoints or fee waivers as asset levels increase.
The Board recognized the inherent limitations of any analysis of economies of scale, stemming largely from the Board’s understanding that most of PGIM Investments’ costs are not specific to individual funds, but rather are incurred across a variety of products and services.
PGIM Real Estate Income Fund
Approval of Advisory Agreements (continued)
Other Benefits to PGIM Investments, PGIM RE (UK) and PGIM Real Estate
The Board considered potential ancillary benefits that might be received by PGIM Investments, PGIM Real Estate, PGIM RE (UK) and their affiliates as a result of their relationship with the Fund. The Board concluded that potential benefits to be derived by PGIM Investments included transfer agency fees received by the Fund’s transfer agent (which is affiliated with PGIM Investments), and benefits to its reputation as well as other intangible benefits resulting from PGIM Investments’ association with the Fund. The Board concluded that the potential benefits to be derived by PGIM Real Estate and PGIM RE (UK) included the ability to use soft dollar credits, as well as the potential benefits consistent with those generally resulting from an increase in assets under management, specifically, potential access to additional research resources and benefits to its reputation. The Board concluded that the benefits derived by PGIM Investments, PGIM Real Estate and PGIM RE (UK) were consistent with the types of benefits generally derived by investment managers and subadvisers to mutual funds.
Performance of the Fund / Fees and Expenses
The Board considered certain additional factors and made related conclusions relating to the historical performance of the Fund for the one-, three- and five-year periods ended December 31, 2021. The Board considered that the Fund commenced operations on June 3, 2015 and that longer-term performance was not yet available.
The Board also considered the Fund’s actual management fee, as well as the Fund’s net total expense ratio, for the fiscal year ended October 31, 2021. The Board considered the management fee for the Fund as compared to the management fee charged by PGIM Investments to other funds and the fee charged by other advisers to comparable mutual funds in a Peer Group. The actual management fee represents the fee rate actually paid by Fund shareholders and includes any fee waivers or reimbursements. The net total expense ratio for the Fund represents the actual expense ratio incurred by Fund shareholders.
The mutual funds included in the Peer Universe, which was used to consider performance, and the Peer Group, which was used to consider expenses and fees, were objectively determined by Broadridge, an independent provider of mutual fund data. In certain circumstances, PGIM Investments also provided supplemental Peer Universe or Peer Group information for reasons addressed with the Board. The comparisons placed the Fund in various quartiles over various periods, with the first quartile being the best 25% of the mutual funds (for performance, the best performing mutual funds and, for expenses, the lowest cost mutual funds).
The section below summarizes key factors considered by the Board and the Board’s conclusions regarding the Fund’s performance, fees and overall expenses. The table sets forth net performance comparisons (which reflect the impact on performance of fund expenses, or any subsidies, expense caps or waivers that may be applicable) with the Peer Universe, actual management fees with the Peer Group (which reflect the
Visit our website at pgim.com/investments
impact of any subsidies or fee waivers), and net total expenses with the Peer Group, each of which were key factors considered by the Board.
| | | | | | | | |
| | | | | |
Net Performance | | 1 Year | | 3 Years | | 5 Years | | 10 Years |
| | | 4th Quartile | | 3rd Quartile | | 4th Quartile | | N/A |
Actual Management Fees: 3rd Quartile |
Net Total Expenses: 4th Quartile |
| · | | The Board noted that the Fund performed equal to its benchmark index over the one-year period and outperformed its benchmark index over the three-year period, though it underperformed over the five-year period. |
| · | | The Board considered PGIM Investments, assertion that peer group-relative comparisons for this Fund are challenging given the Fund’s focus on higher yielding REITs and REIT preferred securities, as the Fund’s peer group does not have specific income or preferred REIT requirements. |
| · | | The Board also considered PGIM Investments’ assertion that some of the higher-yielding property types where this Fund invests were significantly impacted by the COVID-19 pandemic, and that as these property types recover, PGIM Investments expect the Fund’s performance to improve. |
| · | | The Board noted that the Fund outperformed its benchmark and peer group for the first quarter of 2022 and outperformed its benchmark for the one-, three- and five-year periods ended March 31, 2022. |
| · | | The Board and PGIM Investments agreed to retain the Fund’s existing contractual expense cap, which (exclusive of certain fees and expenses) caps the Fund’s annual operating expenses at 1.35% for Class A shares, 2.10% for Class C shares, 1.10% for Class R6 shares, and 1.10% for Class Z shares through February 28, 2023. |
| · | | In addition, PGIM Investments will waive management fees or shared operating expenses on any share class to the same extent that it waives such expenses on any other share class, and has agreed that total annual fund operating expenses for Class R6 shares will not exceed total annual fund operating expenses for Class Z shares. |
| · | | The Board concluded that, in light of the above, it would be in the best interests of the Fund and its shareholders to renew the agreements. |
| · | | The Board concluded that the management fees (including subadvisory fees) and total expenses were reasonable in light of the services provided. |
* * *
After full consideration of these factors, the Board concluded that the approval of the agreements was in the best interests of the Fund and its shareholders.
PGIM Real Estate Income Fund
| | | | |
| ∎ MAIL | | ∎ TELEPHONE | | ∎ WEBSITE |
| | | |
| 655 Broad Street | | (800) 225-1852 | | pgim.com/investments |
| Newark, NJ 07102 | | | | |
| | | | |
PROXY VOTING | | | | |
| The Board of Trustees of the Fund has delegated to the Fund’s subadvisers the responsibility for voting any proxies and maintaining proxy recordkeeping with respect to the Fund. A description of these proxy voting policies and procedures is available without charge, upon request, by calling (800) 225-1852 or by visiting the Securities and Exchange Commission’s website at sec.gov. Information regarding how the Fund voted proxies relating to portfolio securities during the most recent 12-month period ended June 30 is available on the Fund’s website and on the Securities and Exchange Commission’s website. |
| | | | |
| TRUSTEES | | | | |
| Ellen S. Alberding · Kevin J. Bannon · Scott E. Benjamin · Linda W. Bynoe · Barry H. Evans · Keith F. Hartstein · Laurie Simon Hodrick · Stuart S. Parker · Brian K. Reid · Grace C. Torres |
|
| OFFICERS |
| Stuart S. Parker, President · Scott E. Benjamin, Vice President · Christian J. Kelly, Treasurer and Principal Financial and Accounting Officer · Claudia DiGiacomo, Chief Legal Officer · Isabelle Sajous, Chief Compliance Officer · Kelly Florio, Anti-Money Laundering Compliance Officer · Andrew R. French, Secretary · Melissa Gonzalez, Assistant Secretary · Kelly A. Coyne, Assistant Secretary · Patrick E. McGuinness, Assistant Secretary · Debra Rubano, Assistant Secretary · Lana Lomuti, Assistant Treasurer · Russ Shupak, Assistant Treasurer · Elyse M. McLaughlin, Assistant Treasurer · Deborah Conway, Assistant Treasurer |
| | | | |
| MANAGER | | PGIM Investments LLC | | 655 Broad Street Newark, NJ 07102 |
| | |
| SUBADVISERS | | PGIM Real Estate | | 7 Giralda Farms Madison, NJ 07940 |
| | |
| | | PGIM Real Estate (UK) Limited | | Grand Buildings, 1-3 Strand Trafalgar Square London, WC2N 5HR United Kingdom |
| | |
| DISTRIBUTOR | | Prudential Investment Management Services LLC | | 655 Broad Street Newark, NJ 07102 |
| | |
| CUSTODIAN | | The Bank of New York Mellon | | 240 Greenwich Street New York, NY 10286 |
| | |
| TRANSFER AGENT | | Prudential Mutual Fund Services LLC | | PO Box 9658 Providence, RI 02940 |
| | |
| INDEPENDENT REGISTERED PUBLIC ACCOUNTING FIRM | | PricewaterhouseCoopers LLP | | 300 Madison Avenue New York, NY 10017 |
| | |
| FUND COUNSEL | | Willkie Farr & Gallagher LLP | | 787 Seventh Avenue New York, NY 10019 |
|
| An investor should consider the investment objectives, risks, charges, and expenses of the Fund carefully before investing. The prospectus and summary prospectus contain this and other information about the Fund. An investor may obtain the prospectus and summary prospectus by visiting our website at pgim.com/investments or by calling (800) 225-1852. The prospectus and summary prospectus should be read carefully before investing. |
|
E-DELIVERY To receive your mutual fund documents online, go to pgim.com/investments/resource/edelivery and enroll. Instead of receiving printed documents by mail, you will receive notification via email when new materials are available. You can cancel your enrollment or change your email address at any time by visiting the website address above. |
|
SHAREHOLDER COMMUNICATIONS WITH TRUSTEES Shareholders can communicate directly with the Board of Trustees by writing to the Chair of the Board, PGIM Real Estate Income Fund, PGIM Investments, Attn: Board of Trustees, 655 Broad Street, Newark, NJ 07102. Shareholders can communicate directly with an individual Trustee by writing to that Trustee at the same address. Communications are not screened before being delivered to the addressee. |
|
AVAILABILITY OF PORTFOLIO HOLDINGS The Fund files its complete schedule of portfolio holdings with the Securities and Exchange Commission for the first and third quarters of each fiscal year
as an exhibit to its reports on Form N-PORT. The Fund’s Form N-PORT filings are available on the Commission’s website at sec.gov. |
|
| The Fund’s Statement of Additional Information contains additional information about the Fund’s Trustees and is available without charge, upon request, by calling (800) 225-1852. |
Mutual Funds:
| | | | |
| | | |
ARE NOT INSURED BY THE FDIC OR ANY FEDERAL GOVERNMENT AGENCY | | MAY LOSE VALUE | | ARE NOT A DEPOSIT OF OR GUARANTEED BY ANY BANK OR ANY BANK AFFILIATE |

PGIM REAL ESTATE INCOME FUND
| | | | | | | | |
| | | | |
| SHARE CLASS | | A | | C | | Z | | R6 |
| | | | |
NASDAQ | | PRKAX | | PRKCX | | PRKZX | | PRKQX |
| | | | |
CUSIP | | 74441J761 | | 74441J753 | | 74441J746 | | 74441J670 |
MF228E

PGIM SELECT REAL ESTATE FUND
ANNUAL REPORT
OCTOBER 31, 2022

To enroll in e-delivery, go to pgim.com/investments/resource/edelivery
Table of Contents
This report is not authorized for distribution to prospective investors unless preceded or accompanied by a current prospectus.
The views expressed in this report and information about the Fund’s portfolio holdings are for the period covered by this report and are subject to change thereafter.
Mutual funds are distributed by Prudential Investment Management Services LLC (PIMS), member SIPC. PGIM Real Estate is a unit of PGIM, Inc. (PGIM), a registered investment adviser. PIMS and PGIM are Prudential Financial companies. © 2022 Prudential Financial, Inc. and its related entities. PGIM Real Estate, PGIM, and the PGIM logo are service marks of Prudential Financial, Inc. and its related entities, registered in many jurisdictions worldwide.
2 Visit our website at pgim.com/investments
Letter from the President
| | | | |
 | | | | Dear Shareholder: |
| | | | We hope you find the annual report for the PGIM Select Real Estate Fund informative and useful. The report covers performance for the 12-month period that ended October 31, 2022. |
| | | | The attention of the global economy and financial markets pivoted during the period from the COVID-19 pandemic to the challenge of rapidly rising inflation. While job growth remained strong, prices for a wide range of goods and services |
rose in response to economic re-openings, supply-chain disruptions, governmental stimulus, and Russia’s invasion of Ukraine. With inflation surging to a 40-year high, the Federal Reserve and other central banks aggressively hiked interest rates, prompting recession concerns.
After rising to record levels at the end of 2021, stocks have fallen sharply in 2022 as investors worried about higher prices, slowing economic growth, geopolitical uncertainty, and new COVID-19 outbreaks. Equities rallied for a time during the summer but began falling again in late August on fears that the Fed would keep raising rates to tame inflation. For the entire 12-month period, equities suffered a broad-based global decline, although large-cap US stocks outperformed their small-cap counterparts. International developed and emerging markets trailed the US market during this time.
Rising rates and economic uncertainty drove fixed income prices broadly lower as well. US and global investment-grade bonds, along with US high yield corporate bonds and emerging market debt, all posted negative returns during the period.
Regarding your investments with PGIM, we believe it is important to maintain a diversified portfolio of funds consistent with your tolerance for risk, time horizon, and financial goals. Your financial advisor can help you create a diversified investment plan that may include funds covering all the basic asset classes and that reflects your personal investor profile and risk tolerance. However, diversification and asset allocation strategies do not assure a profit or protect against loss in declining markets.
At PGIM Investments, we provide access to active investment strategies across the global markets in the pursuit of consistent outperformance for investors. PGIM is the world’s 11th-largest investment manager with more than $1.5 trillion in assets under management. Our scale and investment expertise allow us to deliver a diversified suite of actively managed solutions across a broad spectrum of asset classes and investment styles.
Thank you for choosing our family of funds.
Sincerely,

Stuart S. Parker, President
PGIM Select Real Estate Fund
December 15, 2022
PGIM Select Real Estate Fund 3
Your Fund’s Performance (unaudited)
Performance data quoted represent past performance. Past performance does not guarantee future results. The investment return and principal value of an investment will fluctuate so that an investor’s shares, when redeemed, may be worth more or less than their original cost. Current performance may be lower or higher than the past performance data quoted. An investor may obtain performance data as of the most recent month-end by visiting our website at pgim.com/investments or by calling (800) 225-1852.
| | | | | | | | | | | | |
| |
| | | Average Annual Total Returns as of 10/31/22 | |
| | | |
| | | One Year (%) | | | Five Years (%) | | | Since Inception (%) | |
| | | |
Class A | | | | | | | | | | | | |
| | | |
(with sales charges) | | | -30.74 | | | | 3.16 | | | | 3.95 (08/01/2014) | |
| | | |
(without sales charges) | | | -26.71 | | | | 4.34 | | | | 4.67 (08/01/2014) | |
| | | |
Class C | | | | | | | | | | | | |
| | | |
(with sales charges) | | | -27.95 | | | | 3.57 | | | | 3.87 (08/01/2014) | |
| | | |
(without sales charges) | | | -27.25 | | | | 3.57 | | | | 3.87 (08/01/2014) | |
| | | |
Class Z | | | | | | | | | | | | |
| | | |
(without sales charges) | | | -26.46 | | | | 4.60 | | | | 4.93 (08/01/2014) | |
| | | |
Class R6 | | | | | | | | | | | | |
| | | |
(without sales charges) | | | -26.39 | | | | 4.66 | | | | 4.95 (08/01/2014) | |
FTSE EPRA/NAREIT Developed Index | | | | | | | | | | | | |
| | | |
| | | -24.95 | | | | -0.17 | | | | 1.32 | |
| | | |
S&P 500 Index | | | | | | | | | | | | |
| | | -14.60 | | | | 10.44 | | | | 10.88 | |
Since Inception returns are provided since the Fund has less than 10 fiscal years of returns. Since Inception returns for the Indexes are measured from the closest month-end to the Fund’s inception date.
4 Visit our website at pgim.com/investments
Growth of a $10,000 Investment (unaudited)
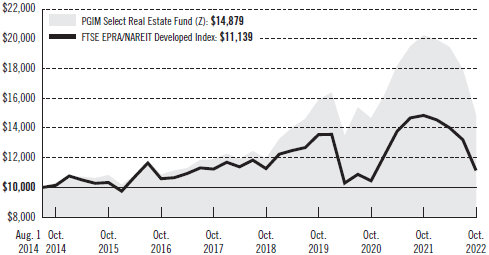
The graph compares a $10,000 investment in the Fund’s Class Z shares with a similar investment in the FTSE EPRA/NAREIT Developed Index, by portraying the initial account values at the commencement of operations for Class Z shares (August 1, 2014) and the account values at the end of the current fiscal year (October 31, 2022), as measured on a quarterly basis. For purposes of the graph, and unless otherwise indicated, it has been assumed that (a) all recurring fees (including management fees) were deducted and (b) all dividends and distributions were reinvested. The line graph provides information for Class Z shares only. As indicated in the tables provided earlier, performance for other share classes will vary due to the differing fees and expenses applicable to each share class (as indicated in the following paragraphs). Without waiver of fees and/or expense reimbursements, if any, the returns would have been lower.
Past performance does not predict future performance. Total returns and the ending account values in the graphs include changes in share price and reinvestment of dividends and capital gains distributions in a hypothetical investment for the periods shown. The Fund’s total returns do not reflect the deduction of income taxes on an individual’s investment. Taxes may reduce your actual investment returns on income or gains paid by the Fund or any gains you may realize if you sell your shares.
PGIM Select Real Estate Fund 5
Your Fund’s Performance (continued)
The returns in the tables do not reflect the deduction of taxes that a shareholder would pay on Fund distributions or following the redemption of Fund shares. The average annual total returns take into account applicable sales charges, which are described for each share class in the table below.
| | | | | | | | |
| | | | | |
| | | Class A | | Class C | | Class Z | | Class R6 |
| | | | | |
| Maximum initial sales charge | | 5.50% of the public offering price | | None | | None | | None |
| Contingent deferred sales charge (CDSC) (as a percentage of the lower of the original purchase price or the net asset value at redemption) | | 1.00% on sales of $1 million or more made within 12 months of purchase | | 1.00% on sales made within 12 months of purchase | | None | | None |
| Annual distribution and service (12b-1) fees (shown as a percentage of average daily net assets) | | 0.30% (0.25% currently) | | 1.00% | | None | | None |
Benchmark Definitions
FTSE EPRA/NAREIT Developed Index—The Financial Times Stock Exchange European Public Real Estate Association/National Association of Real Estate Investment Trusts (FTSE EPRA/NAREIT) Developed Index reflects the stock performance of companies engaged in specific aspects of the major real estate markets/regions of the world.
S&P 500 Index*—The S&P 500 Index is an unmanaged index of over 500 stocks of large US public companies. It gives a broad look at how stock prices in the United States have performed.
*The S&P 500 Index is a product of S&P Dow Jones Indices LLC and/or its affiliates and has been licensed for use by PGIM, Inc. and/or its affiliates. Copyright © 2022 S&P Dow Jones Indices LLC, a division of S&P Global, Inc., and/or its affiliates. All rights reserved. Redistribution or reproduction in whole or in part are prohibited without written permission of S&P Dow Jones Indices LLC. For more information on any of S&P Dow Jones Indices LLC’s indices please visit www.spdji.com. S&P® is a registered trademark of S&P Global and Dow Jones® is a registered trademark of Dow Jones Trademark Holdings LLC.
Investors cannot invest directly in an index. The returns for the Indexes would be lower if they included the effects of sales charges, operating expenses of a mutual fund, or taxes that may be paid by an investor.
6 Visit our website at pgim.com/investments
Presentation of Fund Holdings as of 10/31/22
| | | | |
| | |
Ten Largest Holdings | | Real Estate Sectors | | % of Net Assets |
| | |
Prologis, Inc. | | Industrial REITs | | 9.8% |
| | |
Equity Residential | | Residential REITs | | 7.5% |
| | |
Welltower, Inc. | | Health Care REITs | | 6.5% |
| | |
Public Storage | | Specialized REITs | | 4.5% |
| | |
Mitsui Fudosan Co. Ltd. (Japan) | | Diversified Real Estate Activities | | 4.5% |
| | |
Camden Property Trust | | Residential REITs | | 3.7% |
| | |
Digital Realty Trust, Inc. | | Specialized REITs | | 3.3% |
| | |
Sun Communities, Inc. | | Residential REITs | | 2.9% |
| | |
National Storage REIT (Australia) | | Specialized REITs | | 2.8% |
| | |
Invincible Investment Corp. (Japan) | | Hotel & Resort REITs | | 2.7% |
Holdings reflect only long-term investments and are subject to change.
PGIM Select Real Estate Fund 7
Strategy and Performance Overview* (unaudited)
How did the Fund perform?
The PGIM Select Real Estate Fund’s Class Z shares returned –26.46% in the 12-month reporting period that ended October 31, 2022, underperforming the –24.95% return of the FTSE EPRA/NAREIT Developed Index (the Index).
What were conditions like in the global real estate securities market?
| · | | Conditions in the US real estate investment trust (REIT) market during the reporting period were largely driven by the US Federal Reserve (Fed) and inflation. Over the summer, the Fed commenced its restrictive approach with interest rate hikes to fight inflation following an easy money policy during the COVID-19 era. With six hikes during the first 10 months of 2022, including four 75-bps hikes, the range reached its highest level since 2008 at 3.75–4.00%, with further increases expected. (One basis point equals 0.01%.) While REITs typically benefit during periods of high inflation, they are inversely correlated to a rise in rates. During the first 10 months of 2022, the yield on the 10-year Treasury note increased by approximately 230 bps (basis points) to 3.8%. As a result, the broader REIT market underperformed the S&P 500 Index of large-cap US equities by approximately 5%, with the US REIT sector down approximately 30% overall. |
| · | | Markets saw a deceleration in fundamental trends in real estate (e.g., slowing rent growth and tenant demand) as the US economy started to find its new, post-COVID-19 normal, coupled with the recessionary backdrop, yet earnings results largely held up during the period. However, higher rates affected borrowing costs for REITs, particularly those with higher leverage. In addition, the cost of equity increased due to the move in REITs, making the asset class a less viable source of capital. Combined, these factors led to a period of price discovery in the transaction market and, with bank financing on the sidelines, investment sales as a source of funds became less reliable. |
| · | | The total return of Europe’s REIT market during the period was strongly negative at –45.5% (US dollar total return), as Russia’s invasion of Ukraine plunged the region into disruption against the backdrop of soaring inflation and interest rates. Europe was the worst-performing global region over the period by a wide margin, with Asia Pacific REITs returning –22.8% and North American REITs returning –20.5%. The Ukraine invasion sent European energy markets into chaos, introducing huge volatility in energy prices due to much of Europe’s high degree of dependence on Russian energy supplies. European central banks were behind the Fed in the rate tightening cycle but were forced to accelerate their pace due to inflation levels throughout Europe that quickly surpassed inflation in the US. All European REIT markets produced double-digit negative US dollar returns during the period. Negative local currency returns were compounded by the rising value of the US dollar, which strengthened against all European currencies. Switzerland, thanks to its safe-haven status and more resilient currency, was the best-performing market, with a return of –21%. France, with a return of –30%, was the next-best performer of the major countries, with its dominant retail sector experiencing a bounce back as its economy emerged from lockdowns. The United Kingdom (UK) was next with a return of –40%, performing |
8 Visit our website at pgim.com/investments
| | slightly better than the European average due to its lower dependency on Russian energy. Tied in last place—with matching –59% US dollar total returns for the period—were Germany and Sweden (last year’s best performer), where heavily indebted real estate companies faced refinancing challenges and soaring interest costs. |
| · | | Asia evolved from lockdown restrictions in 2020–21 to a more orderly reopening in 2022, underpinned by recovery from COVID-19. This transition greatly benefited stocks perceived to be “reopening” proxies in the region, most notably Japanese hotel REITs and developers. Beyond that, regional REITs experienced broad-based weakness due to rising interest rates, a trend especially pronounced in perceived “growth” names, particularly among industrials. Australia bore the brunt of the selling, with the Australian REIT index down most sharply due to the sector’s higher-yield correlation to the US and fears of escalating inflation. Hong Kong and Singapore REITs—generally viewed as bond proxies with limited growth—followed. Hong Kong and China also faced equity risks that emanated from China’s relentless “zero-COVID” policies (which seemed to be moderating somewhat late in the period) and the government’s apparent push toward economic socialism. |
What worked and didn’t work?
| · | | The Fund’s North America and Asia positions underperformed, relative to the Index, during the reporting period, while positions in Europe outperformed. |
| · | | In North America, asset allocation to the US gaming and mall sectors largely drove underperformance. Additionally, stock selection proved weak in Canada, data centers, and triple net (triple net or NNN is a lease agreement on a property whereby the tenant or lessee promises to pay all the expenses of the property, including real estate taxes, building insurance, and maintenance). However, several sectors saw positive relative performance, including industrial, office, and shopping centers. |
| · | | In Europe, the Fund outperformed the Index most notably due to an underweight position in Germany. Strong stock selection in Sweden also added to relative performance. The largest detractors were the United Kingdom (UK) and Belgium due to a combination of weak stock selection and overweight positions. |
| · | | In the Asia Pacific region, the Fund’s positions in Japan produced positive relative performance due to favorable stock selection. Conversely, holdings in Australia and Hong Kong trailed. |
Current Outlook
| · | | Equity markets are now focused on the pace of Fed hikes and the potential for policy mistakes as stagflation looms. The ongoing Ukraine conflict poses another threat to global economic recovery with surging energy prices adding to tail risks on the downside. In addition, global reopening remains fraught with the risk of subsequent COVID-19 wave impacts amid growing economic and social marginalization. That said, the following themes could remain key areas of focus for the market in the near term: |
PGIM Select Real Estate Fund 9
Strategy and Performance Overview* (continued)
| | · | | Additional Fed rate hikes |
| | · | | The developing energy crisis resulting from the Ukraine conflict |
| | · | | The further recovery in reopening names (retail and hospitality) |
| · | | While current market conditions have created uncertainty for REITs and the broader market heading into 2023, most of the impact is likely baked in following the sector’s relative underperformance to equities during the first 10 months of 2022 and versus pre-COVID-19 market conditions. Now that the Fed is eyeing a softer pace of rate hikes, PGIM Real Estate suspects that visibility will provide some cushion for the US REIT sector in 2023. The REIT market’s average implied capitalization rate is attractive at 6.0%, or a roughly 220-bps spread to the 10-year Treasury note. While this spread has compressed relative to the long-term average, given most REITs’ current depressed net operating income (NOI) levels, this spread appears likely to compress further before reverting to its long-term average. Despite some near-term disruption to NOI growth in certain sectors, PGIM Real Estate expects funds from operations (FFO) per-share growth in the mid-single-digit range in 2023 and 2024. |
| · | | The recent spike in interest rates has created a challenging environment for the US REIT market. Lack of clarity on the direction of rates and limited transaction data have reduced transparency into the underly value of REIT assets. Public markets have likely overreacted to this period of valuation uncertainty by pushing implied cap rates to 6.1% on average for US REITs, a roughly 200-bps spread to the 10-year Treasury note. Furthermore, the underlying fundamentals for most REIT sectors remain favorable, with strong secular demand trends that should serve to cushion operations in the event of a prolonged downturn. This, combined with a relatively defensive and domestic-based business model, should garner increased appeal from equity investors over the next 12–18 months. PGIM Real Estate continues to favor a barbell approach to the Fund’s sector allocation, minimizing unintended factor exposure. Positioning includes increased overweight exposure to industrial REITs, given the sector’s reasonable valuations and significant embedded NOI growth. Industrial REIT portfolios carry average rents 30–40% below market, providing a strong cushion to continue posting above-average earnings growth as leases roll up to market, even in the event of a slowdown in demand. Other sectors with positive outlooks include those with embedded occupancy upside and limited economic sensitivity, such as healthcare and cold storage. Both sectors were negatively impacted by labor-cost pressures during the first 10 months of 2022; such pressure appears likely to moderate in 2023. In addition, occupancy overall remains roughly 400–600 bps below pre-COVID-19 levels, which should allow for significant top-line growth as trends continue to normalize. Conversely, caution appears incrementally more warranted on the self-storage sector following its recent outperformance. Fundamentals seem likely to remain strong, but current valuations leave the group vulnerable to a contraction relative to the broader REIT market. Greater caution |
10 Visit our website at pgim.com/investments
| | appears merited on lodging and retail, as both sectors are more susceptible to a downturn in economic growth, and on the office sector where, despite discounted valuations, the sector seems to face the early stages of a multiyear secular headwind. |
| · | | The sharp sell-off in European stock markets during the first 10 months of 2022 has opened up historically wide discounts to net asset values, but the outlook for the region’s economy remains highly uncertain. Threats from inflation, extremely volatile energy prices, and potential recession dominate investment markets. Companies with weak balance sheets remain very significantly discounted as refinancing costs have already increased, and these companies remain exposed to refinancing risk and falling cash flows from further rising debt costs. Cap rates have begun to move up in response to the major upward moves in bond yields and interest rates, but share prices imply a much higher move in cap rates to come in private real estate markets. The interest rate outlook remains highly uncertain as well, as inflation has still not been brought under control, and the outlook for demand is weakening as the risk of a recession increases. PGIM Real Estate has positioned the Fund with a balanced risk profile to help neutralize negative market impacts as much as possible. More defensive stocks with lower leverage and higher cash flow yields have outperformed throughout the recent market sell-off. The energy dependency of the European region and of several continental European economies (notably Germany) does put them at somewhat greater risk of inflation spikes and energy-supply interruptions from the ongoing Ukraine war, but the whole region is directly affected. Governments throughout the region and at the European Union level are developing policy responses to the cost-of-energy crisis, which could help to offset some of the huge, anticipated inflationary shocks. PGIM Real Estate continues to adopt a cautious stance on the European region and monitors the rapidly changing situation to make appropriate portfolio changes. |
| · | | PGIM Real Estate remains positive on the Australian self-storage and manufactured housing sectors, which stand to benefit from structural tailwinds resulting from demographic and market consolidation trends. The Australian retail sector is also in recovery as strong retail sales growth and inflation push up rents. Hong Kong is gradually moving away from restrictive COVID-19-era policies. Accordingly, PGIM Real Estate has positioned the Fund with exposure to non-discretionary retail for reopening and potential minimum wage increases in early 2023. PGIM Real Estate is neutral with respect to Japanese developers, preferring names that exhibit strong shareholder returns and provide greater reopening exposure. The Fund holds overweight exposure to Japanese REITs, particularly the heavily discounted hospitality names that benefit from reopening. In Singapore, the Fund is overweight developers in the form of fund manager/landlord plays, particularly diversified office/retail names that are reopening proxies and industrial names with solid rental growth. China’s current zero-COVID-19 strategy and the correction of the housing market pose significant risks to that country’s economic outlook. The way China deals with these challenges will be major variables affecting the region’s economy. For the rest of Asia, domestic recovery and border reopening are coming up against inflationary pressures. Similarly, a strong |
PGIM Select Real Estate Fund 11
Strategy and Performance Overview* (continued)
| | recovery in the US could stoke inflationary pressures beyond mere transitory impacts. This could drive expectations of quicker and additional interest rate hikes. Supply-chain concerns could hamper growth while creating an inflation spiral that is harder to arrest. Within the Fund’s individual sectors, a sharper rise in long-term real interest rates could negatively impact regional REIT valuations. In the event of setbacks on the geopolitical front and potential COVID-19 variants, risk appetite could remain in check heading into 2023. |
*This strategy and performance overview, which discusses what strategies or holdings (including derivatives, if applicable) affected the Fund’s performance, is compiled based on how the Fund performed relative to the Fund’s benchmark index and is viewed for performance attribution purposes at the aggregate Fund level, which in most instances will not directly correlate to the amounts disclosed in the Statement of Operations which conform to US generally accepted accounting principles.
12 Visit our website at pgim.com/investments
Comments on Largest Holdings (unaudited)
9.8% Prologis Inc., Industrial REITs
Prologis is an owner, operator, and developer of industrial real estate, focused on global and regional markets across the Americas, Europe, and Asia. The company also leases modern distribution facilities to customers, including manufacturers, retailers, transportation companies, third-party logistics providers, and other enterprises.
7.5% Equity Residential, Residential REITs
Equity Residential acquires, develops, and manages apartment complexes in the US.
6.5% Welltower Inc., Health Care REITs
Welltower invests in senior housing operators, post-acute providers, and health systems, and delivers the healthcare infrastructure necessary to facilitate better treatment. Welltower serves customers in the US, Canada, and the UK.
4.5% Mitsui Fudosan Co. Ltd., Diversified Real Estate Activities
Mitsui Fudosan provides overall real estate services such as leasing, subdivision, construction, sales, and maintenance of office buildings and residential houses. The company also manufactures building materials, operates commercial facilities, including hotels and golf places, and provides financial services, such as securitization.
3.6% Public Storage, Specialized REITs
Public Storage acquires, develops, owns, and operates self-storage facilities in the US. Public Storage also owns an equity interest in an owner and operator of self-storage facilities in Europe.
PGIM Select Real Estate Fund 13
Fees and Expenses (unaudited)
As a shareholder of the Fund, you incur two types of costs: (1) transaction costs, including sales charges (loads) on purchase payments and redemptions, as applicable, and (2) ongoing costs, including management fees, distribution and/or service (12b-1) fees, and other Fund expenses, as applicable. This example is intended to help you understand your ongoing costs (in dollars) of investing in the Fund and to compare these costs with the ongoing costs of investing in other mutual funds.
The example is based on an investment of $1,000 held through the six-month period ended October 31, 2022. The example is for illustrative purposes only; you should consult the Prospectus for information on initial and subsequent minimum investment requirements.
Actual Expenses
The first line for each share class in the table on the following page provides information about actual account values and actual expenses. You may use the information on this line, together with the amount you invested, to estimate the expenses that you paid over the period. Simply divide your account value by $1,000 (for example, an $8,600 account value ÷ $1,000 = 8.6), then multiply the result by the number on the first line under the heading “Expenses Paid During the Six-Month Period” to estimate the expenses you paid on your account during this period.
Hypothetical Example for Comparison Purposes
The second line for each share class in the table on the following page provides information about hypothetical account values and hypothetical expenses based on the Fund’s actual expense ratio and an assumed rate of return of 5% per year before expenses, which is not the Fund’s actual return. The hypothetical account values and expenses may not be used to estimate the actual ending account balance or expenses you paid for the period. You may use this information to compare the ongoing costs of investing in the Fund and other funds. To do so, compare this 5% hypothetical example with the 5% hypothetical examples that appear in the shareholder reports of the other funds.
The Fund’s transfer agent may charge additional fees to holders of certain accounts that are not included in the expenses shown in the table on the following page. These fees apply to individual retirement accounts (IRAs) and Section 403(b) accounts. As of the close of the six-month period covered by the table, IRA fees included an annual maintenance fee of $15 per account (subject to a maximum annual maintenance fee of $25 for all accounts held by the same shareholder). Section 403(b) accounts are charged an annual $25 fiduciary maintenance fee. Some of the fees may vary in amount, or may be waived, based on your total account balance or the number of PGIM funds, including the Fund, that you own. You should consider the additional fees that were charged to your Fund account over the six-month period when you estimate the total ongoing expenses paid over the period and the impact of these fees on your ending account value, as these additional expenses are not reflected in the information
14 Visit our website at pgim.com/investments
provided in the expense table. Additional fees have the effect of reducing investment returns.
Please note that the expenses shown in the table are meant to highlight your ongoing costs only and do not reflect any transactional costs such as sales charges (loads). Therefore, the second line for each share class in the table is useful in comparing ongoing costs only and will not help you determine the relative total costs of owning different funds. In addition, if these transactional costs were included, your costs would have been higher.
| | | | | | | | | | | | |
| | | | | |
| PGIM Select Real Estate Fund | | Beginning
Account Value
May 1, 2022 | | Ending Account Value October 31, 2022 | | Annualized Expense Ratio Based on the Six-Month Period | | Expenses Paid During the Six-Month Period* |
| | | | | |
Class A | | Actual | | $1,000.00 | | $ 764.20 | | 1.32% | | $ 5.87 |
| | | | | |
| | Hypothetical | | $1,000.00 | | $1,018.55 | | 1.32% | | $ 6.72 |
| | | | | |
Class C | | Actual | | $1,000.00 | | $ 761.20 | | 2.05% | | $ 9.10 |
| | | | | |
| | Hypothetical | | $1,000.00 | | $1,014.87 | | 2.05% | | $10.41 |
| | | | | |
Class Z | | Actual | | $1,000.00 | | $ 765.20 | | 1.07% | | $ 4.76 |
| | | | | |
| | Hypothetical | | $1,000.00 | | $1,019.81 | | 1.07% | | $ 5.45 |
| | | | | |
Class R6 | | Actual | | $1,000.00 | | $ 765.90 | | 0.91% | | $ 4.05 |
| | | | | |
| | | Hypothetical | | $1,000.00 | | $1,020.62 | | 0.91% | | $ 4.63 |
*Fund expenses (net of fee waivers or subsidies, if any) for each share class are equal to the annualized expense ratio for each share class (provided in the table), multiplied by the average account value over the period, multiplied by the 184 days in the six-month period ended October 31, 2022, and divided by the 365 days in the Fund’s fiscal year ended October 31, 2022 (to reflect the six-month period). Expenses presented in the table include the expenses of any underlying portfolios in which the Fund may invest.
PGIM Select Real Estate Fund 15
Schedule of Investments
as of October 31, 2022
| | | | | | | | |
| | |
| Description | | Shares | | | Value | |
| | |
LONG-TERM INVESTMENTS 98.8% | | | | | | | | |
| | |
COMMON STOCKS | | | | | | | | |
| | |
Diversified Real Estate Activities 4.5% | | | | | | | | |
| | |
Mitsui Fudosan Co. Ltd. (Japan) | | | 606,204 | | | $ | 11,607,820 | |
| | |
Diversified REITs 1.8% | | | | | | | | |
| | |
Essential Properties Realty Trust, Inc. | | | 220,342 | | | | 4,741,760 | |
| | |
Health Care REITs 11.4% | | | | | | | | |
| | |
Aedifica SA (Belgium) | | | 42,424 | | | | 3,235,373 | |
Healthcare Realty Trust, Inc.(a) | | | 212,184 | | | | 4,313,701 | |
Omega Healthcare Investors, Inc. | | | 158,377 | | | | 5,033,221 | |
Welltower, Inc.(a) | | | 277,945 | | | | 16,965,763 | |
| | | | | | | | |
| | |
| | | | | | | 29,548,058 | |
| | |
Hotel & Resort REITs 5.9% | | | | | | | | |
| | |
Apple Hospitality REIT, Inc. | | | 115,630 | | | | 1,979,586 | |
Invincible Investment Corp. (Japan) | | | 22,529 | | | | 7,072,157 | |
Japan Hotel REIT Investment Corp. (Japan) | | | 12,125 | | | | 6,388,141 | |
| | | | | | | | |
| | |
| | | | | | | 15,439,884 | |
| | |
Industrial REITs 17.7% | | | | | | | | |
| | |
Americold Realty Trust, Inc. | | | 278,226 | | | | 6,746,980 | |
GLP J-REIT (Japan) | | | 3,430 | | | | 3,557,192 | |
Prologis, Inc. | | | 229,840 | | | | 25,454,780 | |
Segro PLC (United Kingdom) | | | 396,775 | | | | 3,570,977 | |
Summit Industrial Income REIT (Canada) | | | 525,115 | | | | 6,710,649 | |
| | | | | | | | |
| | |
| | | | | | | 46,040,578 | |
| | |
Real Estate Development 1.3% | | | | | | | | |
| | |
CK Asset Holdings Ltd. (Hong Kong) | | | 605,801 | | | | 3,349,214 | |
| | |
Real Estate Operating Companies 6.6% | | | | | | | | |
| | |
Capitaland Investment Ltd. (Singapore) | | | 2,170,731 | | | | 4,616,376 | |
Grainger PLC (United Kingdom) | | | 782,038 | | | | 2,033,371 | |
Pandox AB (Sweden)* | | | 310,350 | | | | 3,800,589 | |
Shurgard Self Storage SA (Belgium) | | | 103,930 | | | | 4,525,213 | |
Swire Properties Ltd. (Hong Kong) | | | 596,494 | | | | 1,146,410 | |
VGP NV (Belgium) | | | 12,381 | | | | 938,782 | |
| | | | | | | | |
| | |
| | | | | | | 17,060,741 | |
See Notes to Financial Statements.
PGIM Select Real Estate Fund 17
Schedule of Investments (continued)
as of October 31, 2022
| | | | | | | | |
| | |
| Description | | Shares | | | Value | |
| | |
COMMON STOCKS (Continued) | | | | | | | | |
| | |
Residential REITs 19.4% | | | | | | | | |
| | |
American Homes 4 Rent (Class A Stock) | | | 82,434 | | | $ | 2,632,942 | |
Camden Property Trust | | | 82,289 | | | | 9,508,494 | |
Equity LifeStyle Properties, Inc. | | | 96,162 | | | | 6,150,521 | |
Equity Residential | | | 308,736 | | | | 19,456,543 | |
Ingenia Communities Group (Australia) | | | 668,967 | | | | 1,678,698 | |
InterRent Real Estate Investment Trust (Canada) | | | 400,118 | | | | 3,368,704 | |
Sun Communities, Inc. | | | 56,638 | | | | 7,637,634 | |
| | | | | | | | |
| | |
| | | | | | | 50,433,536 | |
| | |
Retail REITs 15.2% | | | | | | | | |
| | |
Agree Realty Corp. | | | 84,000 | | | | 5,770,800 | |
Brixmor Property Group, Inc. | | | 175,266 | | | | 3,734,918 | |
CapitaLand Integrated Commercial Trust (Singapore) | | | 2,742,837 | | | | 3,640,169 | |
Japan Metropolitan Fund Investment Corp. (Japan) | | | 5,244 | | | | 3,863,409 | |
Kite Realty Group Trust | | | 279,365 | | | | 5,486,729 | |
Lendlease Global Commercial REIT (Singapore) | | | 9,532,271 | | | | 4,718,124 | |
Link REIT (Hong Kong) | | | 586,596 | | | | 3,467,144 | |
National Retail Properties, Inc. | | | 138,672 | | | | 5,828,384 | |
NETSTREIT Corp. | | | 88,258 | | | | 1,661,016 | |
Spirit Realty Capital, Inc. | | | 36,528 | | | | 1,418,382 | |
| | | | | | | | |
| | |
| | | | | | | 39,589,075 | |
| | |
Specialized REITs 15.0% | | | | | | | | |
| | |
Big Yellow Group PLC (United Kingdom) | | | 469,057 | | | | 6,035,625 | |
CubeSmart | | | 56,504 | | | | 2,365,822 | |
Digital Realty Trust, Inc. | | | 86,066 | | | | 8,628,116 | |
Equinix, Inc. | | | 5,625 | | | | 3,186,225 | |
National Storage REIT (Australia) | | | 4,307,098 | | | | 7,207,211 | |
Public Storage | | | 37,853 | | | | 11,724,967 | |
| | | | | | | | |
| | |
| | | | | | | 39,147,966 | |
| | | | | | | | |
| | |
TOTAL LONG-TERM INVESTMENTS
(cost $293,264,898) | | | | | | | 256,958,632 | |
| | | | | | | | |
| | |
SHORT-TERM INVESTMENTS 6.9% | | | | | | | | |
| | |
AFFILIATED MUTUAL FUND 5.9% | | | | | | | | |
PGIM Institutional Money Market Fund
(cost $15,192,724; includes $15,172,887 of cash collateral for securities on loan)(b)(wa) | | | 15,207,204 | | | | 15,193,517 | |
| | | | | | | | |
See Notes to Financial Statements.
18
| | | | | | | | |
| | |
| Description | | Shares | | | Value | |
| | |
UNAFFILIATED FUND 1.0% | | | | | | | | |
Dreyfus Government Cash Management (Institutional Shares)
(cost $2,649,593) | | | 2,649,593 | | | $ | 2,649,593 | |
| | | | | | | | |
| | |
TOTAL SHORT-TERM INVESTMENTS
(cost $17,842,317) | | | | | | | 17,843,110 | |
| | | | | | | | |
| | |
TOTAL INVESTMENTS 105.7%
(cost $311,107,215) | | | | | | | 274,801,742 | |
Liabilities in excess of other assets (5.7)% | | | | | | | (14,803,508 | ) |
| | | | | | | | |
| | |
NET ASSETS 100.0% | | | | | | $ | 259,998,234 | |
| | | | | | | | |
Below is a list of the abbreviation(s) used in the annual report:
LIBOR—London Interbank Offered Rate
REITs—Real Estate Investment Trust
SOFR—Secured Overnight Financing Rate
| * | Non-income producing security. |
| (a) | All or a portion of security is on loan. The aggregate market value of such securities, including those sold and pending settlement, is $14,748,680; cash collateral of $15,172,887 (included in liabilities) was received with which the Fund purchased highly liquid short-term investments. In the event of significant appreciation in value of securities on loan on the last business day of the reporting period, the Fund may reflect a collateral value that is less than the market value of the loaned securities and such shortfall is remedied the following business day. |
| (b) | Represents security, or portion thereof, purchased with cash collateral received for securities on loan and includes dividend reinvestment. |
| (wa) | PGIM Investments LLC, the manager of the Fund, also serves as manager of the PGIM Core Ultra Short Bond Fund and PGIM Institutional Money Market Fund, if applicable. |
Fair Value Measurements:
Various inputs are used in determining the value of the Fund’s investments. These inputs are summarized in the three broad levels listed below.
Level 1—unadjusted quoted prices generally in active markets for identical securities.
Level 2—quoted prices for similar securities, interest rates and yield curves, prepayment speeds, foreign currency exchange rates and other observable inputs.
Level 3—unobservable inputs for securities valued in accordance with Board approved fair valuation procedures.
The following is a summary of the inputs used as of October 31, 2022 in valuing such portfolio securities:
| | | | | | | | | | | | | | | | | | | | | | | | | | |
| | | Level 1 | | | | | | Level 2 | | | | | | Level 3 | |
Investments in Securities | | | | | | | | | | | | | | | | | | | | | | | | | | |
Assets | | | | | | | | | | | | | | | | | | | | | | | | | | |
Long-Term Investments | | | | | | | | | | | | | | | | | | | | | | | | | | |
Common Stocks | | | | | | | | | | | | | | | | | | | | | | | | | | |
Australia | | $ | — | | | | | | | $ | 8,885,909 | | | | | | | | | | | $— | | | | |
Belgium | | | — | | | | | | | | 8,699,368 | | | | | | | | | | | — | | | | |
See Notes to Financial Statements.
PGIM Select Real Estate Fund 19
Schedule of Investments (continued)
as of October 31, 2022
| | | | | | | | | | | | | | | | | | | | | | | | | | |
| | | Level 1 | | | | | | Level 2 | | | | | | Level 3 | |
Investments in Securities (continued) | | | | | | | | | | | | | | | | | | | | | | | | | | |
Assets (continued) | | | | | | | | | | | | | | | | | | | | | | | | | | |
Long-Term Investments (continued) | | | | | | | | | | | | | | | | | | | | | | | | | | |
Common Stocks (continued) | | | | | | | | | | | | | | | | | | | | | | | | | | |
Canada | | $ | 10,079,353 | | | | | | | $ | — | | | | | | | | | | | $— | | | | |
Hong Kong | | | — | | | | | | | | 7,962,768 | | | | | | | | | | | — | | | | |
Japan | | | — | | | | | | | | 32,488,719 | | | | | | | | | | | — | | | | |
Singapore | | | — | | | | | | | | 12,974,669 | | | | | | | | | | | — | | | | |
Sweden | | | — | | | | | | | | 3,800,589 | | | | | | | | | | | — | | | | |
United Kingdom | | | — | | | | | | | | 11,639,973 | | | | | | | | | | | — | | | | |
United States | | | 160,427,284 | | | | | | | | — | | | | | | | | | | | — | | | | |
Short-Term Investments | | | | | | | | | | | | | | | | | | | | | | | | | | |
Affiliated Mutual Fund | | | 15,193,517 | | | | | | | | — | | | | | | | | | | | — | | | | |
Unaffiliated Fund | | | 2,649,593 | | | | | | | | — | | | | | | | | | | | — | | | | |
| | | | | | | | | | | | | | | | | | | | | | | | | | |
Total | | $ | 188,349,747 | | | | | | | $ | 86,451,995 | | | | | | | | | | | $— | | | | |
| | | | | | | | | | | | | | | | | | | | |
Country Allocation:
The country allocation of portfolio holdings and liabilities in excess of other assets shown as a percentage of net assets as of October 31, 2022 were as follows:
| | | | |
United States (including 5.8% of collateral for securities on loan) | | | 68.6 | % |
| |
Japan | | | 12.4 | |
Singapore | | | 5.0 | |
United Kingdom | | | 4.5 | |
Canada | | | 3.9 | |
Australia | | | 3.4 | |
Belgium | | | 3.4 | |
| | | | |
Hong Kong | | | 3.0 | % |
| Sweden | | | 1.5 | |
| | | | |
| |
| | | 105.7 | |
| Liabilities in excess of other assets | | | (5.7 | ) |
| | | | |
| |
| | | 100.0 | % |
| | | | |
Financial Instruments/Transactions—Summary of Offsetting and Netting Arrangements:
The Fund entered into financial instruments/transactions during the reporting period that are either offset in accordance with current requirements or are subject to enforceable master netting arrangements or similar agreements that permit offsetting. The information about offsetting and related netting arrangements for financial instruments/transactions where the legal right to set-off exists is presented in the summary below.
Offsetting of financial instrument/transaction assets and liabilities:
| | | | | | |
| | | | |
| Description | | Gross Market Value of Recognized
Assets/(Liabilities) | | Collateral
Pledged/(Received)(1) | | Net Amount |
| | | |
Securities on Loan | | $14,748,680 | | $(14,748,680) | | $— |
| (1) | Collateral amount disclosed by the Fund is limited to the market value of financial instruments/transactions. |
See Notes to Financial Statements.
20
Statement of Assets and Liabilities
as of October 31, 2022
| | | | |
| |
Assets | | | | |
| |
Investments at value, including securities on loan of $14,748,680: | | | | |
Unaffiliated investments (cost $295,914,491) | | $ | 259,608,225 | |
Affiliated investments (cost $15,192,724) | | | 15,193,517 | |
Foreign currency, at value (cost $32) | | | 32 | |
Receivable for investments sold | | | 2,414,375 | |
Receivable for Fund shares sold | | | 1,016,980 | |
Dividends receivable | | | 518,710 | |
Tax reclaim receivable | | | 170,924 | |
Prepaid expenses and other assets | | | 8,160 | |
| | | | |
| |
Total Assets | | | 278,930,923 | |
| | | | |
| |
Liabilities | | | | |
| |
Payable to broker for collateral for securities on loan | | | 15,172,887 | |
Payable for investments purchased | | | 2,333,377 | |
Payable for Fund shares purchased | | | 1,122,899 | |
Management fee payable | | | 169,125 | |
Accrued expenses and other liabilities | | | 128,154 | |
Distribution fee payable | | | 3,787 | |
Trustees’ fees payable | | | 1,300 | |
Affiliated transfer agent fee payable | | | 1,160 | |
| | | | |
| |
Total Liabilities | | | 18,932,689 | |
| | | | |
| |
Net Assets | | $ | 259,998,234 | |
| | | | |
| |
| | | | | |
| |
Net assets were comprised of: | | | | |
Shares of beneficial interest, at par | | $ | 24,076 | |
Paid-in capital in excess of par | | | 337,459,089 | |
Total distributable earnings (loss) | | | (77,484,931 | ) |
| | | | |
| |
Net assets, October 31, 2022 | | $ | 259,998,234 | |
| | | | |
See Notes to Financial Statements.
PGIM Select Real Estate Fund 21
Statement of Assets and Liabilities
as of October 31, 2022
| | | | | | | | |
Class A | | | | | | | | |
| | |
Net asset value and redemption price per share, ($10,981,500 ÷ 1,012,971 shares of beneficial interest issued and outstanding) | | $ | 10.84 | | | | | |
Maximum sales charge (5.50% of offering price) | | | 0.63 | | | | | |
| | | | | | | | |
| | |
Maximum offering price to public | | $ | 11.47 | | | | | |
| | | | | | | | |
| | |
Class C | | | | | | | | |
| | |
Net asset value, offering price and redemption price per share, ($1,753,595 ÷ 163,971 shares of beneficial interest issued and outstanding) | | $ | 10.69 | | | | | |
| | | | | | | | |
| | |
Class Z | | | | | | | | |
| | |
Net asset value, offering price and redemption price per share, ($171,629,397 ÷ 15,810,082 shares of beneficial interest issued and outstanding) | | $ | 10.86 | | | | | |
| | | | | | | | |
| | |
Class R6 | | | | | | | | |
| | |
Net asset value, offering price and redemption price per share, ($75,633,742 ÷ 7,089,342 shares of beneficial interest issued and outstanding) | | $ | 10.67 | | | | | |
| | | | | | | | |
See Notes to Financial Statements.
22
Statement of Operations
Year Ended October 31, 2022
| | | | |
Net Investment Income (Loss) | | | | |
| |
Income | | | | |
Unaffiliated dividend income (net of $269,394 foreign withholding tax) | | $ | 7,856,940 | |
Income from securities lending, net (including affiliated income of $8,225) | | | 8,499 | |
Affiliated dividend income | | | 1,075 | |
| | | | |
| |
Total income | | | 7,866,514 | |
| | | | |
| |
Expenses | | | | |
Management fee | | | 2,736,792 | |
Distribution fee(a) | | | 56,570 | |
Transfer agent’s fees and expenses (including affiliated expense of $17,789)(a) | | | 329,685 | |
Custodian and accounting fees | | | 93,466 | |
Registration fees(a) | | | 79,997 | |
Shareholders’ reports | | | 33,167 | |
Audit fee | | | 32,000 | |
Legal fees and expenses | | | 22,964 | |
Trustees’ fees | | | 14,020 | |
Miscellaneous | | | 36,878 | |
| | | | |
| |
Total expenses | | | 3,435,539 | |
Less: Fee waiver and/or expense reimbursement(a) | | | (20,871 | ) |
Distribution fee waiver(a) | | | (5,816 | ) |
| | | | |
| |
Net expenses | | | 3,408,852 | |
| | | | |
| |
Net investment income (loss) | | | 4,457,662 | |
| | | | |
| |
Realized And Unrealized Gain (Loss)On Investment And Foreign Currency Transactions | | | | |
| |
Net realized gain (loss) on: | | | | |
Investment transactions (including affiliated of $343) | | | (38,650,655 | ) |
Foreign currency transactions | | | (53,639 | ) |
| | | | |
| |
| | | (38,704,294 | ) |
| | | | |
| |
Net change in unrealized appreciation (depreciation) on: | | | | |
Investments (including affiliated of $793) | | | (70,955,339 | ) |
Foreign currencies | | | (32,038 | ) |
| | | | |
| |
| | | (70,987,377 | ) |
| | | | |
| |
Net gain (loss) on investment and foreign currency transactions | | | (109,691,671 | ) |
| | | | |
| |
Net Increase (Decrease) In Net Assets Resulting From Operations | | $ | (105,234,009 | ) |
| | | | |
| (a) | Class specific expenses and waivers were as follows: |
| | | | | | | | | | | | | | | | |
| | | Class A | | | Class C | | | Class Z | | | Class R6 | |
| | | | |
Distribution fee | | | 34,895 | | | | 21,675 | | | | — | | | | — | |
Transfer agent’s fees and expenses | | | 15,246 | | | | 3,278 | | | | 309,428 | | | | 1,733 | |
Registration fees | | | 15,887 | | | | 11,672 | | | | 30,666 | | | | 21,772 | |
Fee waiver and/or expense reimbursement | | | (9,895 | ) | | | (10,976 | ) | | | — | | | | — | |
Distribution fee waiver | | | (5,816 | ) | | | — | | | | — | | | | — | |
See Notes to Financial Statements.
PGIM Select Real Estate Fund 23
Statements of Changes in Net Assets
| | | | | | | | |
| |
| | | Year Ended October 31, | |
| | | | |
| | |
| | | 2022 | | | 2021 | |
| | |
Increase (Decrease) in Net Assets | | | | | | | | |
| | |
Operations | | | | | | | | |
Net investment income (loss) | | $ | 4,457,662 | | | $ | 1,813,565 | |
Net realized gain (loss) on investment and foreign currency transactions | | | (38,704,294 | ) | | | 14,087,807 | |
Net change in unrealized appreciation (depreciation) on investments and foreign currencies | | | (70,987,377 | ) | | | 32,748,400 | |
| | | | | | | | |
| | |
Net increase (decrease) in net assets resulting from operations | | | (105,234,009 | ) | | | 48,649,772 | |
| | | | | | | | |
Dividends and Distributions | | | | | | | | |
Distributions from distributable earnings | | | | | | | | |
Class A | | | (414,882 | ) | | | (70,197 | ) |
Class C | | | (91,196 | ) | | | (5,910 | ) |
Class Z | | | (10,983,011 | ) | | | (1,699,095 | ) |
Class R6 | | | (5,037,561 | ) | | | (918,302 | ) |
| | | | | | | | |
| | |
| | | (16,526,650 | ) | | | (2,693,504 | ) |
| | | | | | | | |
Tax return of capital distributions | | | | | | | | |
Class A | | | (24,202 | ) | | | — | |
Class C | | | (5,320 | ) | | | — | |
Class Z | | | (640,682 | ) | | | — | |
Class R6 | | | (293,861 | ) | | | — | |
| | | | | | | | |
| | |
| | | (964,065 | ) | | | — | |
| | | | | | | | |
Fund share transactions (Net of share conversions) | | | | | | | | |
Net proceeds from shares sold | | | 188,423,446 | | | | 269,891,981 | |
Net asset value of shares issued in reinvestment of dividends and distributions | | | 17,480,857 | | | | 2,689,833 | |
Cost of shares purchased | | | (151,688,740 | ) | | | (39,255,864 | ) |
| | | | | | | | |
| | |
Net increase (decrease) in net assets from Fund share transactions | | | 54,215,563 | | | | 233,325,950 | |
| | | | | | | | |
| | |
Total increase (decrease) | | | (68,509,161 | ) | | | 279,282,218 | |
| | |
Net Assets: | | | | | | | | |
| | |
Beginning of year | | | 328,507,395 | | | | 49,225,177 | |
| | | | | | | | |
| | |
End of year | | $ | 259,998,234 | | | $ | 328,507,395 | |
| | | | | | | | |
See Notes to Financial Statements.
24
Financial Highlights
| | | | | | | | | | | | | | | | | | | | |
Class A Shares | | | | | | | | | |
| | | Year Ended October 31, | |
| | | 2022 | | | 2021 | | | 2020 | | | 2019 | | | 2018 | |
Per Share Operating Performance(a): | | | | | | | | | | | | | | | | | | | | |
Net Asset Value, Beginning of Year | | | $15.54 | | | | $11.48 | | | | $13.18 | | | | $10.33 | | | | $10.54 | |
Income (loss)from investment operations: | | | | | | | | | | | | | | | | | | | | |
Net investment income (loss) | | | 0.14 | | | | 0.10 | | | | 0.15 | | | | 0.16 | | | | 0.12 | |
Net realized and unrealized gain (loss) on investment and foreign currency transactions | | | (4.12 | ) | | | 4.18 | | | | (1.16 | ) | | | 3.10 | | | | (0.08 | ) |
Total from investment operations | | | (3.98 | ) | | | 4.28 | | | | (1.01 | ) | | | 3.26 | | | | 0.04 | |
Less Dividends and Distributions: | | | | | | | | | | | | | | | | | | | | |
Dividends from net investment income | | | (0.22 | ) | | | (0.22 | ) | | | (0.43 | ) | | | (0.21 | ) | | | (0.25 | ) |
Tax return of capital distributions | | | (0.04 | ) | | | - | | | | - | | | | - | | | | - | |
Distributions from net realized gains | | | (0.46 | ) | | | - | | | | (0.26 | ) | | | (0.20 | ) | | | - | |
Total dividends and distributions | | | (0.72 | ) | | | (0.22 | ) | | | (0.69 | ) | | | (0.41 | ) | | | (0.25 | ) |
Net asset value, end of year | | | $10.84 | | | | $15.54 | | | | $11.48 | | | | $13.18 | | | | $10.33 | |
Total Return(b): | | | (26.71 | )% | | | 37.61 | % | | | (7.90 | )% | | | 32.64 | % | | | 0.37 | % |
| | | | | | | | | | | | | | | | | | | | | |
Ratios/Supplemental Data: | | | | | | | | | | | | | | | | | | | | |
Net assets, end of year (000) | | | $10,982 | | | | $6,733 | | | | $3,878 | | | | $4,447 | | | | $2,612 | |
Average net assets (000) | | | $11,632 | | | | $4,803 | | | | $4,534 | | | | $3,205 | | | | $1,645 | |
Ratios to average net assets(c): | | | | | | | | | | | | | | | | | | | | |
Expenses after waivers and/or expense reimbursement | | | 1.30 | % | | | 1.30 | % | | | 1.30 | % | | | 1.30 | % | | | 1.30 | % |
Expenses before waivers and/or expense reimbursement | | | 1.44 | % | | | 1.57 | % | | | 2.11 | % | | | 3.04 | % | | | 4.02 | % |
Net investment income (loss) | | | 1.05 | % | | | 0.74 | % | | | 1.26 | % | | | 1.36 | % | | | 1.14 | % |
Portfolio turnover rate(d) | | | 137 | % | | | 165 | % | | | 313 | % | | | 242 | % | | | 202 | % |
| (a) | Calculated based on average shares outstanding during the year. |
| (b) | Total return does not consider the effects of sales loads. Total return is calculated assuming a purchase of a share on the first day and a sale on the last day of each year reported and includes reinvestment of dividends and distributions, if any. Total returns may reflect adjustments to conform to GAAP. |
| (c) | Does not include expenses of the underlying funds in which the Fund invests. |
| (d) | The Fund’s portfolio turnover rate is calculated in accordance with regulatory requirements, without regard to transactions involving short-term investments, certain derivatives and in-kind transactions (if any). If such transactions were included, the Fund’s portfolio turnover rate may be higher. |
See Notes to Financial Statements.
PGIM Select Real Estate Fund 25
Financial Highlights (continued)
| | | | | | | | | | | | | | | | | | | | |
Class C Shares | | | | | | | | |
| | | Year Ended October 31, | |
| | | 2022 | | | 2021 | | | 2020 | | | 2019 | | | 2018 | |
Per Share Operating Performance(a): | | | | | | | | |
Net Asset Value, Beginning of Year | | | $15.33 | | | | $11.35 | | | $ | 13.03 | | | $ | 10.23 | | | $ | 10.44 | |
Income (loss) from investment operations: | | | | | | | | | | | | | | | | | | | | |
Net investment income (loss) | | | 0.03 | | | | (0.01 | )(b) | | | 0.06 | | | | 0.06 | | | | 0.09 | |
Net realized and unrealized gain (loss) on investment and foreign currency transactions | | | (4.05 | ) | | | 4.12 | | | | (1.13 | ) | | | 3.08 | | | | (0.12 | ) |
Total from investment operations | | | (4.02 | ) | | | 4.11 | | | | (1.07 | ) | | | 3.14 | | | | (0.03 | ) |
Less Dividends and Distributions: | | | | | | | | | | | | | | | | | | | | |
Dividends from net investment income | | | (0.12 | ) | | | (0.13 | ) | | | (0.35 | ) | | | (0.14 | ) | | | (0.18 | ) |
Tax return of capital distributions | | | (0.04 | ) | | | - | | | | - | | | | - | | | | - | |
Distributions from net realized gains | | | (0.46 | ) | | | - | | | | (0.26 | ) | | | (0.20 | ) | | | - | |
Total dividends and distributions | | | (0.62 | ) | | | (0.13 | ) | | | (0.61 | ) | | | (0.34 | ) | | | (0.18 | ) |
Net asset value, end of year | | | $10.69 | | | | $15.33 | | | $ | 11.35 | | | $ | 13.03 | | | $ | 10.23 | |
Total Return(c): | | | (27.25 | )% | | | 36.64 | % | | | (8.60 | )% | | | 31.59 | % | | | (0.34 | )% |
| | | | | | | | | | | | | | | | | | | | | |
Ratios/Supplemental Data: | | | | | | | | |
Net assets, end of year (000) | | | $1,754 | | | | $1,636 | | | | $605 | | | | $351 | | | | $56 | |
Average net assets (000) | | | $2,168 | | | | $1,021 | | | | $532 | | | | $148 | | | | $64 | |
Ratios to average net assets(d): | | | | | | | | | | | | | | | | | | | | |
Expenses after waivers and/or expense reimbursement | | | 2.05 | % | | | 2.05 | % | | | 2.05 | % | | | 2.05 | % | | | 2.05 | % |
Expenses before waivers and/or expense reimbursement | | | 2.56 | % | | | 2.95 | % | | | 5.31 | % | | | 11.73 | % | | | 29.08 | % |
Net investment income (loss) | | | 0.26 | % | | | (0.06 | )% | | | 0.55 | % | | | 0.54 | % | | | 0.91 | % |
Portfolio turnover rate(e) | | | 137 | % | | | 165 | % | | | 313 | % | | | 242 | % | | | 202 | % |
| (a) | Calculated based on average shares outstanding during the year. |
| (b) | The per share amount of net investment income (loss) does not directly correlate to the amounts reported in the Statement of Operations due to class specific expenses. |
| (c) | Total return does not consider the effects of sales loads. Total return is calculated assuming a purchase of a share on the first day and a sale on the last day of each year reported and includes reinvestment of dividends and distributions, if any. Total returns may reflect adjustments to conform to GAAP. |
| (d) | Does not include expenses of the underlying funds in which the Fund invests. |
| (e) | The Fund’s portfolio turnover rate is calculated in accordance with regulatory requirements, without regard to transactions involving short-term investments, certain derivatives and in-kind transactions (if any). If such transactions were included, the Fund’s portfolio turnover rate may be higher. |
See Notes to Financial Statements.
26
| | | | | | | | | | | | | | | | | | | | |
Class Z Shares | | | | | | | | | | | | | | | | |
| | |
| | | Year Ended October 31, | |
| | | | | | |
| | | 2022 | | | 2021 | | | 2020 | | | 2019 | | | 2018 | |
Per Share Operating Performance(a): | | | | | | | | | | | | | | | | |
Net Asset Value, Beginning of Year | | | $15.56 | | | | $11.49 | | | | $13.20 | | | | $10.34 | | | | $10.56 | |
Income (loss)from investment operations: | | | | | | | | | | | | | | | | |
Net investment income (loss) | | | 0.18 | | | | 0.13 | | | | 0.16 | | | | 0.19 | | | | 0.22 | |
Net realized and unrealized gain (loss) on investment and foreign currency transactions | | | (4.12 | ) | | | 4.19 | | | | (1.15 | ) | | | 3.11 | | | | (0.16 | ) |
Total from investment operations | | | (3.94 | ) | | | 4.32 | | | | (0.99 | ) | | | 3.30 | | | | 0.06 | |
Less Dividends and Distributions: | | | | | | | | | | | | | | | | |
Dividends from net investment income | | | (0.26 | ) | | | (0.25 | ) | | | (0.46 | ) | | | (0.24 | ) | | | (0.28 | ) |
Tax return of capital distributions | | | (0.04 | ) | | | - | | | | - | | | | - | | | | - | |
Distributions from net realized gains | | | (0.46 | ) | | | - | | | | (0.26 | ) | | | (0.20 | ) | | | - | |
Total dividends and distributions | | | (0.76 | ) | | | (0.25 | ) | | | (0.72 | ) | | | (0.44 | ) | | | (0.28 | ) |
Net asset value, end of year | | | $10.86 | | | | $15.56 | | | | $11.49 | | | | $13.20 | | | | $10.34 | |
Total Return(b): | | | (26.46 | )% | | | 38.04 | % | | | (7.73 | )% | | | 33.02 | % | | | 0.51 | % |
| | | | | | | | | | | | | | | | | | | | | |
Ratios/Supplemental Data: | | | | | | | | | | | | | | | | |
Net assets, end of year (000) | | | $171,629 | | | | $226,286 | | | | $29,056 | | | | $6,366 | | | | $65 | |
Average net assets (000) | | | $235,834 | | | | $126,992 | | | | $14,227 | | | | $1,621 | | | | $145 | |
Ratios to average net assets(c): | | | | | | | | | | | | | | | | |
Expenses after waivers and/or expense reimbursement | | | 1.01 | % | | | 1.04 | % | | | 1.05 | % | | | 1.05 | % | | | 1.05 | % |
Expenses before waivers and/or expense reimbursement | | | 1.01 | % | | | 1.04 | % | | | 1.61 | % | | | 2.85 | % | | | 14.17 | % |
Net investment income (loss) | | | 1.29 | % | | | 0.92 | % | | | 1.40 | % | | | 1.48 | % | | | 2.07 | % |
Portfolio turnover rate(d) | | | 137 | % | | | 165 | % | | | 313 | % | | | 242 | % | | | 202 | % |
| (a) | Calculated based on average shares outstanding during the year. |
| (b) | Total return is calculated assuming a purchase of a share on the first day and a sale on the last day of each year reported and includes reinvestment of dividends and distributions, if any. Total returns may reflect adjustments to conform to GAAP. |
| (c) | Does not include expenses of the underlying funds in which the Fund invests. |
| (d) | The Fund’s portfolio turnover rate is calculated in accordance with regulatory requirements, without regard to transactions involving short-term investments, certain derivatives and in-kind transactions (if any). If such transactions were included, the Fund’s portfolio turnover rate may be higher. |
See Notes to Financial Statements.
PGIM Select Real Estate Fund 27
Financial Highlights (continued)
| | | | | | | | | | | | | | | | | | | | |
Class R6 Shares | | | | | | | | | | | | | | | | |
| | |
| | | Year Ended October 31, | |
| | | | | | |
| | | 2022 | | | 2021 | | | 2020 | | | 2019 | | | 2018 | |
| | | | | |
Per Share Operating Performance(a): | | | | | | | | | | | | | | | | |
Net Asset Value, Beginning of Year | | | $15.31 | | | | $11.31 | | | | $13.00 | | | | $10.19 | | | | $10.40 | |
Income (loss)from investment operations: | | | | | | | | | | | | | | | | |
Net investment income (loss) | | | 0.19 | | | | 0.15 | | | | 0.18 | | | | 0.18 | | | | 0.20 | |
Net realized and unrealized gain (loss) on investment and foreign currency transactions | | | (4.06 | ) | | | 4.11 | | | | (1.15 | ) | | | 3.07 | | | | (0.13 | ) |
Total from investment operations | | | (3.87 | ) | | | 4.26 | | | | (0.97 | ) | | | 3.25 | | | | 0.07 | |
Less Dividends and Distributions: | | | | | | | | | | | | | | | | |
Dividends from net investment income | | | (0.27 | ) | | | (0.26 | ) | | | (0.46 | ) | | | (0.24 | ) | | | (0.28 | ) |
Tax return of capital distributions | | | (0.04 | ) | | | - | | | | - | | | | - | | | | - | |
Distributions from net realized gains | | | (0.46 | ) | | | - | | | | (0.26 | ) | | | (0.20 | ) | | | - | |
Total dividends and distributions | | | (0.77 | ) | | | (0.26 | ) | | | (0.72 | ) | | | (0.44 | ) | | | (0.28 | ) |
Net asset value, end of year | | | $10.67 | | | | $15.31 | | | | $11.31 | | | | $13.00 | | | | $10.19 | |
Total Return(b): | | | (26.39 | )% | | | 38.10 | % | | | (7.70 | )% | | | 33.02 | % | | | 0.62 | % |
| | | | | | | | | | | | | | | | | | | | | |
Ratios/Supplemental Data: | | | | | | | | | | | | | | | | |
Net assets, end of year (000) | | | $75,634 | | | | $93,853 | | | | $15,686 | | | | $17,138 | | | | $5,970 | |
Average net assets (000) | | | $92,466 | | | | $57,833 | | | | $16,060 | | | | $8,739 | | | | $6,039 | |
Ratios to average net assets(c): | | | | | | | | | | | | | | | | |
Expenses after waivers and/or expense reimbursement | | | 0.89 | % | | | 0.94 | % | | | 1.05 | % | | | 1.05 | % | | | 1.05 | % |
Expenses before waivers and/or expense reimbursement | | | 0.89 | % | | | 0.94 | % | | | 1.42 | % | | | 2.25 | % | | | 3.07 | % |
Net investment income (loss) | | | 1.40 | % | | | 1.06 | % | | | 1.56 | % | | | 1.56 | % | | | 1.89 | % |
Portfolio turnover rate(d) | | | 137 | % | | | 165 | % | | | 313 | % | | | 242 | % | | | 202 | % |
| (a) | Calculated based on average shares outstanding during the year. |
| (b) | Total return is calculated assuming a purchase of a share on the first day and a sale on the last day of each year reported and includes reinvestment of dividends and distributions, if any. Total returns may reflect adjustments to conform to GAAP. |
| (c) | Does not include expenses of the underlying funds in which the Fund invests. |
| (d) | The Fund’s portfolio turnover rate is calculated in accordance with regulatory requirements, without regard to transactions involving short-term investments, certain derivatives and in-kind transactions (if any). If such transactions were included, the Fund’s portfolio turnover rate may be higher. |
See Notes to Financial Statements.
28
Notes to Financial Statements
Prudential Investment Portfolios 9 (the “Registered Investment Company” or “RIC”) is registered under the Investment Company Act of 1940, as amended (“1940 Act”), as an open-end management investment company. The RIC is organized as a Delaware Statutory Trust. These financial statements relate only to the PGIM Select Real Estate Fund (the “Fund”), a series of the RIC. The Fund is classified as a diversified fund for purposes of the 1940 Act.
The investment objective of the Fund is to seek income and capital appreciation.
The Fund follows the investment company accounting and reporting guidance of the Financial Accounting Standards Board (“FASB”) Accounting Standard Codification (“ASC”) Topic 946 Financial Services— Investment Companies. The following is a summary of significant accounting policies followed by the Fund in the preparation of its financial statements. The policies conform to U.S. generally accepted accounting principles (“GAAP”). The Fund consistently follows such policies in the preparation of its financial statements.
Securities Valuation: The Fund holds securities and other assets and liabilities that are fair valued as of the close of each day (generally, 4:00 PM Eastern time) the New York Stock Exchange (“NYSE”) is open for trading. As described in further detail below, the Fund’s investments are valued daily based on a number of factors, including the type of investment and whether market quotations are readily available. The RIC’s Board of Trustees (the “Board”) has approved the Fund’s valuation policies and procedures for security valuation and designated to PGIM Investments LLC (“PGIM Investments” or the “Manager”) as the Valuation Designee pursuant to SEC Rule 2a-5(b) to perform the fair value determination relating to all Fund investments. Pursuant to the Board’s oversight, the Valuation Designee has established a Valuation Committee to perform the duties and responsibilities as valuation designee under SEC Rule 2a-5. The valuation procedures permit the Fund to utilize independent pricing vendor services, quotations from market makers, and alternative valuation methods when market quotations are either not readily available or not deemed representative of fair value. Fair value is the price that would be received to sell an asset or paid to transfer a liability in an orderly transaction between market participants on the measurement date. A record of the Valuation Committee’s actions is provided to the Board at the first quarterly meeting following the quarter in which such actions take place.
For the fiscal reporting year-end, securities and other assets and liabilities were fair valued at the close of the last U.S. business day. Trading in certain foreign securities may occur when the NYSE is closed (including weekends and holidays). Because such foreign securities
PGIM Select Real Estate Fund 29
Notes to Financial Statements (continued)
trade in markets that are open on weekends and U.S. holidays, the values of some of the Fund’s foreign investments may change on days when investors cannot purchase or redeem Fund shares.
Various inputs determine how the Fund’s investments are valued, all of which are categorized according to the three broad levels (Level 1, 2, or 3) detailed in the Schedule of Investments and referred to herein as the “fair value hierarchy” in accordance with FASB ASC Topic 820 - Fair Value Measurement.
Common or preferred stocks, exchange-traded funds and derivative instruments, if applicable, that are traded on a national securities exchange are valued at the last sale price as of the close of trading on the applicable exchange where the security principally trades. Securities traded via NASDAQ are valued at the NASDAQ official closing price. To the extent these securities are valued at the last sale price or NASDAQ official closing price, they are classified as Level 1 in the fair value hierarchy. In the event that no sale or official closing price on valuation date exists, these securities are generally valued at the mean between the last reported bid and ask prices, or at the last bid price in the absence of an ask price. These securities are classified as Level 2 in the fair value hierarchy.
Foreign equities traded on foreign securities exchanges are generally valued using pricing vendor services that provide model prices derived using adjustment factors based on information such as local closing price, relevant general and sector indices, currency fluctuations, depositary receipts, and futures, as applicable. Securities valued using such model prices are classified as Level 2 in the fair value hierarchy. The models generate an evaluated adjustment factor for each security, which is applied to the local closing price to adjust it for post closing market movements up to the time the Fund is valued. Utilizing that evaluated adjustment factor, the vendor provides an evaluated price for each security. If the vendor does not provide an evaluated price, securities are valued in accordance with exchange-traded common and preferred stock valuation policies discussed above.
Investments in open-end funds (other than exchange-traded funds) are valued at their net asset values as of the close of the NYSE on the date of valuation. These securities are classified as Level 1 in the fair value hierarchy since they may be purchased or sold at their net asset values on the date of valuation.
Securities and other assets that cannot be priced according to the methods described above are valued based on policies and procedures approved by the Board. In the event that unobservable inputs are used when determining such valuations, the securities will be classified as Level 3 in the fair value hierarchy. Altering one or more unobservable inputs may result in a significant change to a Level 3 security’s fair value measurement.
30
When determining the fair value of securities, some of the factors influencing the valuation include: the nature of any restrictions on disposition of the securities; assessment of the general liquidity of the securities; the issuer’s financial condition and the markets in which it does business; the cost of the investment; the size of the holding and the capitalization of the issuer; the prices of any recent transactions or bids/offers for such securities or any comparable securities; any available analyst media or other reports or information deemed reliable by the Valuation Designee regarding the issuer or the markets or industry in which it operates. Using fair value to price securities may result in a value that is different from a security’s most recent closing price and from the price used by other unaffiliated mutual funds to calculate their net asset values.
Foreign Currency Translation: The books and records of the Fund are maintained in U.S. dollars. Foreign currency amounts are translated into U.S. dollars on the following basis:
(i) market value of investment securities, other assets and liabilities — at the exchange rate as of the valuation date;
(ii) purchases and sales of investment securities, income and expenses — at the rates of exchange prevailing on the respective dates of such transactions.
Although the net assets of the Fund are presented at the foreign exchange rates and market values at the close of the period, the Fund does not generally isolate that portion of the results of operations arising as a result of changes in the foreign exchange rates from the fluctuations arising from changes in the market prices of long-term portfolio securities held at the end of the period. Similarly, the Fund does not isolate the effect of changes in foreign exchange rates from the fluctuations arising from changes in the market prices of long-term portfolio securities sold during the period. Accordingly, holding period unrealized and realized foreign currency gains (losses) are included in the reported net change in unrealized appreciation (depreciation) on investments and net realized gains (losses) on investment transactions on the Statements of Operations.
Net realized gains (losses) on foreign currency transactions represent net foreign exchange gains (losses)from the disposition of holdings of foreign currencies, currency gains (losses) realized between the trade and settlement dates on investment transactions, and the difference between the amounts of interest, dividends and foreign withholding taxes recorded on the Fund’s books and the U.S. dollar equivalent amounts actually received or paid. Net unrealized currency gains (losses) arise from valuing foreign currency denominated assets and liabilities (other than investments) at period end exchange rates.
Master Netting Arrangements: The RIC, on behalf of the Fund, is subject to various Master Agreements, or netting arrangements, with select counterparties. These are agreements which a subadviser may have negotiated and entered into on behalf of all or a portion of the Fund. A master netting arrangement between the Fund and the counterparty permits the Fund to offset amounts payable by the Fund to the same counterparty against amounts to be received; and by the receipt of collateral from the counterparty by the Fund to cover the
PGIM Select Real Estate Fund 31
Notes to Financial Statements (continued)
Fund’s exposure to the counterparty. However, there is no assurance that such mitigating factors are easily enforceable. In addition to master netting arrangements, the right to set-off exists when all the conditions are met such that each of the parties owes the other determinable amounts, the reporting party has the right to set-off the amount owed with the amount owed by the other party, the reporting party intends to set-off and the right of set-off is enforceable by law.
Securities Lending: The Fund lends its portfolio securities to banks and broker-dealers. The loans are secured by collateral at least equal to the market value of the securities loaned. Collateral pledged by each borrower is invested in an affiliated money market fund and is marked to market daily, based on the previous day’s market value, such that the value of the collateral exceeds the value of the loaned securities. In the event of significant appreciation in value of securities on loan on the last business day of the reporting period, the financial statements may reflect a collateral value that is less than the market value of the loaned securities. Such shortfall is remedied as described above. Loans are subject to termination at the option of the borrower or the Fund. Upon termination of the loan, the borrower will return to the Fund securities identical to the loaned securities. The remaining open loans of the securities lending transactions are considered overnight and continuous. Should the borrower of the securities fail financially, the Fund has the right to repurchase the securities in the open market using the collateral.
The Fund recognizes income, net of any rebate and securities lending agent fees, for lending its securities in the form of fees or interest on the investment of any cash received as collateral. The borrower receives all interest and dividends from the securities loaned and such payments are passed back to the lender in amounts equivalent thereto, which are reflected in interest income or unaffiliated dividend income based on the nature of the payment on the Statement of Operations. The Fund also continues to recognize any unrealized gain (loss) in the market price of the securities loaned and on the change in the value of the collateral invested that may occur during the term of the loan. In addition, realized gain (loss) is recognized on changes in the value of the collateral invested upon liquidation of the collateral. Net earnings from securities lending are disclosed in the Statement of Operations.
Equity and Mortgage Real Estate Investment Trusts (collectively REITs): The Fund invested in REITs, which report information on the source of their distributions annually. Based on current and historical information, a portion of distributions received from REITs during the period is estimated to be dividend income, capital gain or return of capital and recorded accordingly. When material, these estimates are adjusted periodically when the actual source of distributions is disclosed by the REITs.
32
Securities Transactions and Net Investment Income: Securities transactions are recorded on the trade date. Realized gains (losses) from investment and currency transactions are calculated on the specific identification method. Dividend income is recorded on the ex-date, or for certain foreign securities, when the Fund becomes aware of such dividends. Expenses are recorded on an accrual basis, which may require the use of certain estimates by management that may differ from actual. Net investment income or loss (other than class specific expenses and waivers, which are allocated as noted below) and unrealized and realized gains (losses) are allocated daily to each class of shares based upon the relative proportion of adjusted net assets of each class at the beginning of the day. Class specific expenses and waivers, where applicable, are charged to the respective share classes. Such class specific expenses and waivers include distribution fees and distribution fee waivers, shareholder servicing fees, transfer agent’s fees and expenses, registration fees and fee waivers and/or expense reimbursements, as applicable.
Taxes: It is the Fund’s policy to continue to meet the requirements of the Internal Revenue Code applicable to regulated investment companies and to distribute all of its taxable net investment income and capital gains, if any, to its shareholders. Therefore, no federal income tax provision is required. Withholding taxes on foreign dividends, interest and capital gains, if any, are recorded, net of reclaimable amounts, at the time the related income is earned.
Tax reform legislation commonly referred to as the Tax Cuts and Jobs Act permits a direct REIT shareholder to claim a 20% “qualified business income” deduction for ordinary REIT dividends. The tax legislation did not expressly permit regulated investment companies (“RICs”) paying dividends attributable to such income to pass through this special treatment to its shareholders. On January 18, 2019, the Internal Revenue Service issued final regulations that permit RICs to pass through “qualified REIT dividends” to their shareholders.
Dividends and Distributions: Dividends and distributions to shareholders, which are determined in accordance with federal income tax regulations and which may differ from GAAP, are recorded on the ex-date. Permanent book/tax differences relating to income and gain (loss) are reclassified between total distributable earnings (loss) and paid-in capital in excess of par, as appropriate. The chart below sets forth the expected frequency of dividend and capital gains distributions to shareholders. Various factors may impact the frequency of dividend distributions to shareholders, including but not limited to adverse market conditions or portfolio holding-specific events.
| | |
| | |
| Expected Distribution Schedule to Shareholders* | | Frequency |
Net Investment Income | | Quarterly |
Short-Term Capital Gains | | Annually |
Long-Term Capital Gains | | Annually |
| * | Under certain circumstances, the Fund may make more than one distribution of short-term and/or long-term capital gains during a fiscal year. |
PGIM Select Real Estate Fund 33
Notes to Financial Statements (continued)
Estimates: The preparation of financial statements requires management to make estimates and assumptions that affect the reported amounts and disclosures in the financial statements. Actual results could differ from those estimates.
The RIC, on behalf of the Fund, has a management agreement with the Manager pursuant to which it has responsibility for all investment advisory services and supervises the subadviser’s performance of such services, and pursuant to which it renders administrative services.
The Manager has entered into a subadvisory agreement with PGIM, Inc., which provides subadvisory services to the Fund through its business unit, PGIM Real Estate, and PGIM Real Estate (UK) Limited, an indirect wholly-owned subsidiary of PGIM, Inc. (collectively referred to herein as the “subadviser”). The Manager pays for the services of subadviser.
Fees payable under the management agreement are computed daily and paid monthly. For the reporting period ended October 31, 2022, the contractual and effective management fee rates were as follows:
| | | | |
| Contractual Management Rate | | Effective Management Fee, before any waivers and/or expense reimbursements | |
0.80% on average daily net assets up to and including $1 billion; | | | 0.80% | |
0.78% on the next $2 billion of average daily net assets; | | | | |
0.76% on the next $2 billion of average daily net assets; | | | | |
0.75% on the next $5 billion of average daily net assets; | | | | |
0.74% on average daily net assets exceeding $10 billion. | | | | |
The Manager has contractually agreed, through February 29, 2024, to limit total annual operating expenses after fee waivers and/or expense reimbursements. This contractual waiver excludes interest, brokerage, taxes (such as income and foreign withholding taxes, stamp duty and deferred tax expenses), acquired fund fees and expenses, extraordinary expenses, and certain other Fund expenses such as dividend and interest expense and broker charges on short sales.
Where applicable, the Manager agrees to waive management fees or shared operating expenses on any share class to the same extent that it waives such expenses on any other share class. In addition, total annual operating expenses for Class R6 shares will not exceed total annual operating expenses for Class Z shares. Fees and/or expenses waived and/or reimbursed by the Manager for the purpose of preventing the expenses from exceeding a certain expense ratio limit may be recouped by the Manager within the same fiscal year during which such waiver and/or reimbursement is made if such recoupment can be
34
realized without exceeding the expense limit in effect at the time of the recoupment for that fiscal year. The expense limitations attributable to each class are as follows:
| | | | | |
| | |
| Class | | Expense Limitations |
A | | | | 1.30 | % |
C | | | | 2.05 | |
Z | | | | 1.05 | |
R6 | | | | 1.05 | |
The RIC, on behalf of the Fund, has a distribution agreement with Prudential Investment Management Services LLC (“PIMS”), which acts as the distributor of the Class A, Class C, Class Z and Class R6 shares of the Fund. The Fund compensates PIMS for distributing and servicing the Fund’s Class A and Class C shares, pursuant to the plans of distribution (the “Distribution Plans”), regardless of expenses actually incurred by PIMS.
Pursuant to the Distribution Plans, the Fund compensates PIMS for distribution related activities at an annual rate based on average daily net assets per class. PIMS has contractually agreed through February 29, 2024 to limit such fees on certain classes based on the average daily net assets. The distribution fees are accrued daily and payable monthly.
The Fund’s annual gross and net distribution rate, where applicable, are as follows:
| | | | | | | | | | |
| Class | | Gross Distribution Fee | | Net Distribution Fee |
A | | | | 0.30 | % | | | | 0.25 | % |
C | | | | 1.00 | | | | | 1.00 | |
Z | | | | N/A | | | | | N/A | |
R6 | | | | N/A | | | | | N/A | |
For the year ended October 31, 2022, PIMS received front-end sales charges (“FESL”) resulting from sales of certain class shares and contingent deferred sales charges (“CDSC”) imposed upon redemptions by certain shareholders. From these fees, PIMS paid such sales charges to broker-dealers, who in turn paid commissions to salespersons and incurred other distribution costs. The sales charges are as follows where applicable:
| | | | | | | | |
| Class | | FESL | | | CDSC | |
A | | $ | 77,170 | | | $ | — | |
C | | | — | | | | 1,635 | |
PGIM Investments, PGIM, Inc., PGIM Real Estate (UK) Limited and PIMS are indirect, wholly-owned subsidiaries of Prudential Financial, Inc. (“Prudential”).
| 4. | Other Transactions with Affiliates |
Prudential Mutual Fund Services LLC (“PMFS”), an affiliate of PGIM Investments and an indirect, wholly-owned subsidiary of Prudential, serves as the Fund’s transfer agent and shareholder servicing agent. Transfer agent’s fees and expenses in the Statement of Operations include certain out-of-pocket expenses paid to non-affiliates, where applicable.
PGIM Select Real Estate Fund 35
Notes to Financial Statements (continued)
The Fund may invest its overnight sweep cash in the PGIM Core Ultra Short Bond Fund (the “Core Fund”), and its securities lending cash collateral in the PGIM Institutional Money Market Fund (the “Money Market Fund”), each a fund of Prudential Investment Portfolios 2, registered under the 1940 Act and managed by PGIM Investments. PGIM Investments and/or its affiliates are paid fees or reimbursed for providing their services to the Core Fund and the Money Market Fund. In addition to the realized and unrealized gains on investments in the Core Fund and Money Market Fund, earnings from such investments are disclosed on the Statement of Operations as “Affiliated dividend income” and “Income from securities lending, net”, respectively. Effective January 2022, the Fund changed its overnight cash sweep vehicle from the Core Fund to an unaffiliated money market fund.
The Fund may enter into certain securities purchase or sale transactions under Board approved Rule 17a-7 procedures. Rule 17a-7 is an exemptive rule under the 1940 Act, that subject to certain conditions, permits purchase and sale transactions among affiliated investment companies, or between an investment company and a person that is affiliated solely by reason of having a common (or affiliated) investment adviser, common directors/trustees, and/or common officers. For the year ended October 31, 2022, no 17a-7 transactions were entered into by the Fund.
The aggregate cost of purchases and proceeds from sales of portfolio securities (excluding short-term investments and U.S. Government securities) for the reporting period ended October 31, 2022, were as follows:
| | |
| Cost of Purchases | | Proceeds from Sales |
$502,612,624 | | $460,538,149 |
A summary of the cost of purchases and proceeds from sales of shares of affiliated mutual funds for the year ended October 31, 2022, is presented as follows:
| | | | | | | | | | | | | | | | | | | | | | | | | | |
Value, Beginning of Year | | Cost of Purchases | | | Proceeds from Sales | | | Change in Unrealized Gain (Loss) | | Realized Gain (Loss) | | | Value, End of Year | | | Shares, End of Year | | | Income | |
| | | | |
Short-Term Investments - Affiliated Mutual Funds: | | | | | | | | | | | | | | | | |
| | | | | |
PGIM Core Ultra Short Bond Fund(1)(wa) | | | | | | | | | | | | | | | | | | | |
$2,866,302 | | $ | 35,146,155 | | | $ | 38,012,457 | | | $— | | | $— | | | $ | — | | | | — | | | | $1,075 | |
36
| | | | | | | | | | | | | | |
Value, Beginning of Year | | Cost of Purchases | | Proceeds from Sales | | Change in Unrealized Gain (Loss) | | Realized Gain (Loss) | | Value, End of Year | | Shares, End of Year | | Income |
|
PGIM Institutional Money Market Fund(1)(b)(wa) |
$ — | | $230,054,509 | | $214,862,128 | | $793 | | $343 | | $15,193,517 | | 15,207,204 | | $8,225(2) |
$2,866,302 | | $265,200,664 | | $252,874,585 | | $793 | | $343 | | $15,193,517 | | | | $9,300 |
| | |
| (1) | | The Fund did not have any capital gain distributions during the reporting period. |
| (2) | | The amount, or a portion thereof, represents the affiliated securities lending income shown on the Statement of Operations. |
| (b) | | Represents security, or portion thereof, purchased with cash collateral received for securities on loan and includes dividend reinvestment. |
| (wa) | | PGIM Investments LLC, the manager of the Fund, also serves as manager of the PGIM Core Ultra Short Bond Fund and PGIM Institutional Money Market Fund, if applicable. |
| 6. | Distributions and Tax Information |
Distributions to shareholders, which are determined in accordance with federal income tax regulations and which may differ from GAAP, are recorded on the ex-date.
For the year ended October 31, 2022, the tax character of dividends paid by the Fund were $14,767,334 of ordinary income, $1,759,316 of long-term capital gains and $964,065 of tax return of capital. For the year ended October 31, 2021, the tax character of dividends paid by the Fund was $2,693,504 of ordinary income.
As of October 31, 2022, there were no accumulated undistributed earnings on a tax basis.
The United States federal income tax basis of the Fund’s investments and the net unrealized depreciation as of October 31, 2022 were as follows:
| | | | | | |
| Tax Basis | | Gross Unrealized Appreciation | | Gross Unrealized
Depreciation | | Net Unrealized Depreciation |
| $316,244,337 | | $6,487,933 | | $(47,930,528) | | $(41,442,595) |
The GAAP basis differs from tax basis primarily due to deferred losses on wash sales and investments in passive foreign investment companies.
For federal income tax purposes, the Fund had a capital loss carryforward as of October 31, 2022 of approximately $36,042,000 which can be carried forward for an unlimited period. No capital gains distributions are expected to be paid to shareholders until net gains have been realized in excess of such losses.
The Manager has analyzed the Fund’s tax positions taken on federal, state and local income tax returns for all open tax years and has concluded that no provision for income tax is required in the Fund’s financial statements for the current reporting period. Since tax authorities can examine previously filed tax returns, the Fund’s U.S. federal and state tax returns for each of the four fiscal years up to the most recent fiscal year ended October 31,
PGIM Select Real Estate Fund 37
Notes to Financial Statements (continued)
2022 are subject to such review.
The Fund offers Class A, Class C, Class Z and Class R6 shares. Class A shares are sold with a maximum front-end sales charge of 5.50%. Investors who purchase $1 million or more of Class A shares and sell these shares within 12 months of purchase are subject to a CDSC of 1%, although they are not subject to an initial sales charge. The Class A CDSC is waived for certain retirement and/or benefit plans. A special exchange privilege is also available for shareholders who qualified to purchase Class A shares at net asset value. Class C shares are sold with a CDSC of 1% on sales made within 12 months of purchase. Class C shares will automatically convert to Class A shares on a monthly basis approximately eight years (ten years prior to January 22, 2021) after purchase. Class Z and Class R6 shares are not subject to any sales or redemption charges and are available exclusively for sale to a limited group of investors.
Under certain circumstances, an exchange may be made from specified share classes of the Fund to one or more other share classes of the Fund as presented in the table of transactions in shares of beneficial interest, below.
The RIC has authorized an unlimited number of shares of beneficial interest of the Fund at $0.001 par value per share, currently divided into four classes, designated Class A, Class C, Class Z and Class R6.
As of October 31, 2022, Prudential, through its affiliated entities, including affiliated funds (if applicable), owned shares of the Fund as follows:
| | | | | | | | | | |
| | | |
| Class | | Number of Shares | | Percentage of Outstanding Shares |
A | | | | 221,498 | | | | | 21.9 | % |
C | | | | 1,280 | | | | | 0.8 | |
R6 | | | | 1,453,640 | | | | | 20.5 | |
At the reporting period end, the number of shareholders holding greater than 5% of the Fund are as follows:
| | | | | | | | | | |
| | | |
| | | Number of Shareholders | | Percentage of Outstanding Shares |
Affiliated | | | | — | | | | | — | % |
Unaffiliated | | | | 3 | | | | | 80.9 | |
38
Transactions in shares of beneficial interest were as follows:
| | | | | | | | | | |
| | | | |
| Share Class | | Shares | | | | | | Amount |
| | | |
Class A | | | | | | | | | | |
| | | |
Year ended October 31, 2022: | | | | | | | | | | |
Shares sold | | | 729,508 | | | | | | | $ 10,506,840 |
Shares issued in reinvestment of dividends and distributions | | | 31,595 | | | | | | | 438,849 |
Shares purchased | | | (187,168 | ) | | | | | | (2,503,324) |
Net increase (decrease) in shares outstanding before conversion | | | 573,935 | | | | | | | 8,442,365 |
Shares issued upon conversion from other share class(es) | | | 7,131 | | | | | | | 78,490 |
Shares purchased upon conversion into other share class(es) | | | (1,433 | ) | | | | | | (21,124) |
Net increase (decrease) in shares outstanding | | | 579,633 | | | | | | | $ 8,499,731 |
| | | |
Year ended October 31, 2021: | | | | | | | | | | |
Shares sold | | | 198,267 | | | | | | | $ 2,874,733 |
Shares issued in reinvestment of dividends and distributions | | | 5,277 | | | | | | | 69,387 |
Shares purchased | | | (94,647 | ) | | | | | | (1,279,321) |
Net increase (decrease) in shares outstanding before conversion | | | 108,897 | | | | | | | 1,664,799 |
Shares issued upon conversion from other share class(es) | | | 183 | | | | | | | 2,546 |
Shares purchased upon conversion into other share class(es) | | | (13,661 | ) | | | | | | (205,052) |
Net increase (decrease) in shares outstanding | | | 95,419 | | | | | | | $ 1,462,293 |
| | | |
Class C | | | | | | | | | | |
Year ended October 31, 2022: | | | | | | | | | | |
Shares sold | | | 122,024 | | | | | | | $ 1,749,306 |
Shares issued in reinvestment of dividends and distributions | | | 6,629 | | | | | | | 94,764 |
Shares purchased | | | (64,019 | ) | | | | | | (849,402) |
Net increase (decrease) in shares outstanding before conversion | | | 64,634 | | | | | | | 994,668 |
Shares purchased upon conversion into other share class(es) | | | (7,369 | ) | | | | | | (80,418) |
Net increase (decrease) in shares outstanding | | | 57,265 | | | | | | | $ 914,250 |
| | | |
Year ended October 31, 2021: | | | | | | | | | | |
Shares sold | | | 71,343 | | | | | | | $ 998,329 |
Shares issued in reinvestment of dividends and distributions | | | 443 | | | | | | | 5,538 |
Shares purchased | | | (13,215 | ) | | | | | | (175,530) |
Net increase (decrease) in shares outstanding before conversion | | | 58,571 | | | | | | | 828,337 |
Shares purchased upon conversion into other share class(es) | | | (5,162 | ) | | | | | | (65,704) |
Net increase (decrease) in shares outstanding | | | 53,409 | | | | | | | $ 762,633 |
| | | |
Class Z | | | | | | | | | | |
Year ended October 31, 2022: | | | | | | | | | | |
Shares sold | | | 8,857,165 | | | | | | | $ 124,834,508 |
Shares issued in reinvestment of dividends and distributions | | | 819,289 | | | | | | | 11,616,446 |
Shares purchased | | | (8,410,286 | ) | | | | | | (106,630,767) |
Net increase (decrease) in shares outstanding before conversion | | | 1,266,168 | | | | | | | 29,820,187 |
Shares issued upon conversion from other share class(es) | | | 1,826 | | | | | | | 26,512 |
Net increase (decrease) in shares outstanding | | | 1,267,994 | | | | | | | $ 29,846,699 |
PGIM Select Real Estate Fund 39
Notes to Financial Statements (continued)
| | | | | | | | | | |
| | | | | | | | | | |
| | | | |
| Share Class | | Shares | | | | | | Amount |
| | | |
Year ended October 31, 2021: | | | | | | | | | | |
Shares sold | | | 13,350,960 | | | | | | | $ 186,168,605 |
Shares issued in reinvestment of dividends and distributions | | | 121,767 | | | | | | | 1,696,608 |
Shares purchased | | | (1,477,815 | ) | | | | | | (21,446,422) |
Net increase (decrease) in shares outstanding before conversion | | | 11,994,912 | | | | | | | 166,418,791 |
Shares issued upon conversion from other share class(es) | | | 19,401 | | | | | | | 280,074 |
Net increase (decrease) in shares outstanding | | | 12,014,313 | | | | | | | $ 166,698,865 |
| | | |
Class R6 | | | | | | | | | | |
Year ended October 31, 2022: | | | | | | | | | | |
Shares sold | | | 3,629,909 | | | | | | | $ 51,332,792 |
Shares issued in reinvestment of dividends and distributions | | | 383,091 | | | | | | | 5,330,798 |
Shares purchased | | | (3,053,513 | ) | | | | | | (41,705,247) |
Net increase (decrease) in shares outstanding before conversion | | | 959,487 | | | | | | | 14,958,343 |
Shares purchased upon conversion into other share class(es) | | | (263 | ) | | | | | | (3,460) |
Net increase (decrease) in shares outstanding | | | 959,224 | | | | | | | $ 14,954,883 |
| | | |
Year ended October 31, 2021: | | | | | | | | | | |
Shares sold | | | 5,802,725 | | | | | | | $ 79,850,314 |
Shares issued in reinvestment of dividends and distributions | | | 67,943 | | | | | | | 918,300 |
Shares purchased | | | (1,126,477 | ) | | | | | | (16,354,591) |
Net increase (decrease) in shares outstanding before conversion | | | 4,744,191 | | | | | | | 64,414,023 |
Shares purchased upon conversion into other share class(es) | | | (877 | ) | | | | | | (11,864) |
Net increase (decrease) in shares outstanding | | | 4,743,314 | | | | | | | $ 64,402,159 |
The RIC, on behalf of the Fund, along with other affiliated registered investment companies (the “Participating Funds”), is a party to a Syndicated Credit Agreement (“SCA”) with a group of banks. The purpose of the SCA is to provide an alternative source of temporary funding for capital share redemptions. The table below provides details of the current SCA in effect at the reporting period-end as well as the prior SCA.
| | | | | | |
| | | Current SCA | | | | Prior SCA |
Term of Commitment | | 9/30/2022 - 9/28/2023 | | | | 10/1/2021 – 9/29/2022 |
Total Commitment | | $ 1,200,000,000 | | | | $ 1,200,000,000 |
Annualized Commitment Fee on the Unused Portion of the SCA | | 0.15% | | | | 0.15% |
Annualized Interest Rate on Borrowings | | 1.00% plus the higher of (1) the effective federal funds rate, (2) the daily SOFR rate plus 0.10% or (3) zero percent | | | | 1.20% plus the higher of (1) the effective federal funds rate, (2) the one-month LIBOR rate or (3) zero percent |
40
Certain affiliated registered investment companies that are parties to the SCA include portfolios that are subject to a predetermined mathematical formula used to manage certain benefit guarantees offered under variable annuity contracts. The formula may result in large scale asset flows into and out of these portfolios. Consequently, these portfolios may be more likely to utilize the SCA for purposes of funding redemptions. It may be possible for those portfolios to fully exhaust the committed amount of the SCA, thereby requiring the Manager to allocate available funding per a Board-approved methodology designed to treat the Participating Funds in the SCA equitably.
The Fund utilized the SCA during the year ended October 31, 2022. The average daily balance for the 37 days that the Fund had loans outstanding during the period was approximately $2,908,595, borrowed at a weighted average interest rate of 2.52%. The maximum loan outstanding amount during the period was $13,822,000. At October 31, 2022, the Fund did not have an outstanding loan amount.
| 9. | Risks of Investing in the Fund |
The Fund’s risks include, but are not limited to, some or all of the risks discussed below. For further information on the Fund’s risks, please refer to the Fund’s Prospectus and Statement of Additional Information.
Active Trading Risk: The Fund actively and frequently trades its portfolio securities. High portfolio turnover results in higher transaction costs, which can affect the Fund’s performance and have adverse tax consequences. In addition, high portfolio turnover may also mean that a proportionately greater amount of distributions to shareholders will be taxed as ordinary income rather than long-term capital gains compared to investment companies with lower portfolio turnover.
Distribution Risk: The Fund’s distributions may consist of net investment income, if any, and net realized gains, if any, from the sale of investments and/or return of capital. The Fund will provide to shareholders early in each calendar year the final tax character of the Fund’s distributions for the previous year. Also, at such time that the Fund distribution is expected to be from sources other than current or accumulated net income, a notice to shareholders may be required.
Economic and Market Events Risk: Events in the U.S. and global financial markets, including actions taken by the U.S. Federal Reserve or foreign central banks to stimulate or stabilize economic growth or the functioning of the securities markets, or otherwise reduce inflation may at times result in unusually high market volatility, which could negatively impact performance. Governmental efforts to curb inflation often have negative effects on the level of economic activity. Relatively reduced liquidity in credit and fixed income markets could adversely affect issuers worldwide.
Emerging Markets Risk: The risks of foreign investments are greater for investments in or exposed to emerging markets. Emerging market countries typically have economic and
PGIM Select Real Estate Fund 41
Notes to Financial Statements (continued)
political systems that are less fully developed, and can be expected to be less stable, than those of more developed countries. For example, the economies of such countries can be subject to rapid and unpredictable rates of inflation or deflation. Low trading volumes may result in a lack of liquidity and price volatility. Emerging market countries may have policies that restrict investment by non-U.S. investors, or that prevent non-U.S. investors from withdrawing their money at will.
The Fund may invest in some emerging markets that subject it to risks such as those associated with illiquidity, custody of assets, different settlement and clearance procedures and asserting legal title under a developing legal and regulatory regime to a greater degree than in developed markets or even in other emerging markets.
Equity and Equity-Related Securities Risk: Equity and equity-related securities may be subject to changes in value, and their values may be more volatile than those of other asset classes. In addition to an individual security losing value, the value of the equity markets or a sector in which the Fund invests could go down. Different parts of a market can react differently to adverse issuer, market, regulatory, political and economic developments.
Foreign Securities Risk: Investments in securities of non-U.S. issuers (including those denominated in U.S. dollars) may involve more risk than investing in securities of U.S. issuers. Foreign political, economic and legal systems, especially those in developing and emerging market countries, may be less stable and more volatile than in the United States. Foreign legal systems generally have fewer regulatory requirements than the U.S. legal system, particularly those of emerging markets. In general, less information is publicly available with respect to non-U.S. companies than U.S. companies. Non-U.S. companies generally are not subject to the same accounting, auditing, and financial reporting standards as are U.S. companies. Additionally, the changing value of foreign currencies and changes in exchange rates could also affect the value of the assets the Fund holds and the Fund’s performance. Certain foreign countries may impose restrictions on the ability of issuers of foreign securities to make payment of principal and interest or dividends to investors located outside the country, due to blockage of foreign currency exchanges or otherwise. Investments in emerging markets are subject to greater volatility and price declines.
In addition, the Fund’s investments in non-U.S. securities may be subject to the risks of nationalization or expropriation of assets, imposition of currency exchange controls or restrictions on the repatriation of non-U.S. currency, confiscatory taxation and adverse diplomatic developments. Special U.S. tax considerations may apply.
Increase in Expenses Risk: Your actual cost of investing in the Fund may be higher than the expenses shown in the expense table in the Fund’s prospectus for a variety of reasons. For example, expense ratios may be higher than those shown if average net assets decrease.
42
Net assets are more likely to decrease and Fund expense ratios are more likely to increase when markets are volatile. Active and frequent trading of Fund securities can increase expenses.
Large Shareholder and Large Scale Redemption Risk: Certain individuals, accounts, funds (including funds affiliated with the Manager) or institutions, including the Manager and its affiliates, may from time to time own or control a substantial amount of the Fund’s shares. There is no requirement that these entities maintain their investment in the Fund. There is a risk that such large shareholders or that the Fund’s shareholders generally may redeem all or a substantial portion of their investments in the Fund in a short period of time, which could have a significant negative impact on the Fund’s NAV, liquidity, and brokerage costs. Large redemptions could also result in tax consequences to shareholders and impact the Fund’s ability to implement its investment strategy. The Fund’s ability to pursue its investment objective after one or more large scale redemptions may be impaired and, as a result, the Fund may invest a larger portion of its assets in cash or cash equivalents.
Market Capitalization Risk: The Fund may invest in companies of any market capitalization. Generally, the stock prices of small- and mid-cap companies are less stable than the prices of large-cap stocks and may present greater risks. Large capitalization companies as a group could fall out of favor with the market, causing the Fund to underperform compared to investments that focus on smaller capitalized companies.
Market Disruption and Geopolitical Risks: Market disruption can be caused by economic, financial or political events and factors, including but not limited to, international wars or conflicts (including Russia’s military invasion of Ukraine), geopolitical developments (including trading and tariff arrangements, sanctions and cybersecurity attacks), instability in regions such as Asia, Eastern Europe and the Middle East, terrorism, natural disasters and public health epidemics (including the outbreak of COVID-19 globally).
The extent and duration of such events and resulting market disruptions cannot be predicted, but could be substantial and could magnify the impact of other risks to the Fund. These and other similar events could adversely affect the U.S. and foreign financial markets and lead to increased market volatility, reduced liquidity in the securities markets, significant negative impacts on issuers and the markets for certain securities and commodities and/or government intervention. They may also cause short- or long-term economic uncertainties in the United States and worldwide. As a result, whether or not the Fund invests in securities of issuers located in or with significant exposure to the countries directly affected, the value and liquidity of the Fund’s investments may be negatively impacted. Further, due to closures of certain markets and restrictions on trading certain securities, the value of certain securities held by the Fund could be significantly impacted, which could lead to such securities being valued at zero.
COVID-19 and the related governmental and public responses have had and may continue to have an impact on the Fund’s investments and net asset value and have led and may continue to lead to increased market volatility and the potential for illiquidity in certain
PGIM Select Real Estate Fund 43
Notes to Financial Statements (continued)
classes of securities and sectors of the market. They have also had and may continue to result in periods of business disruption, business closures, inability to obtain raw materials, supplies and component parts, and reduced or disrupted operations for the issuers in which the Fund invests. The occurrence, reoccurrence and pendency of public health epidemics could adversely affect the economies and financial markets either in specific countries or worldwide.
Market Risk: Securities markets may be volatile and the market prices of the Fund’s securities may decline. Securities fluctuate in price based on changes in an issuer’s financial condition and overall market and economic conditions. If the market prices of the securities owned by the Fund fall, the value of your investment in the Fund will decline.
Real Estate Investment Trust (“REIT”) Risk: Investing in REITs involves certain unique risks in addition to those risks associated with investing in the real estate industry in general. REITs may be affected by changes in the value of the underlying property owned by the REITs, while mortgage REITs may be affected by the quality of any credit extended. REITs are dependent upon management skills, may not be diversified geographically or by property/mortgage asset type, and are subject to heavy cash flow dependency, default by borrowers and self-liquidation. REITs may be more volatile and/or more illiquid than other types of equity securities. REITs (especially mortgage REITs) are subject to interest rate risks. REITs may incur significant amounts of leverage. The Fund will indirectly bear a portion of the expenses, including management fees, paid by each REIT in which it invests, in addition to the expenses of the Fund.
REITs must also meet certain requirements under the Internal Revenue Code of 1986, as amended (the Code) to avoid entity level tax and be eligible to pass-through certain tax attributes of their income to shareholders. REITs are consequently subject to the risk of failing to meet these requirements for favorable tax treatment and of failing to maintain their exemptions from registration under the Investment Company Act of 1940. REITs are subject to the risks of changes in the Code affecting their tax status.
Real Estate Related Securities Risk: Because the Fund invests in real estate securities, including REITs, the Fund is subject to the risks of investing in the real estate industry, such as changes in general and local economic conditions, the supply and demand for real estate and changes in zoning and tax laws. Since the Fund concentrates in the real estate industry, its holdings can vary significantly from broad market indices. As a result, the Fund’s performance can deviate from the performance of such indices. Because the Fund invests in stocks, there is the risk that the price of a particular stock owned by the Fund could go down or pay lower-than-expected or no dividends. In addition to an individual stock losing value, the value of the equity markets or of companies comprising the real estate industry could go down.
44
An investment in the Fund will be closely linked to the performance of the real estate markets. Real estate securities are subject to the same risks as direct investments in real estate and mortgages, and their value will depend on the value of the underlying properties or the underlying loans or interests. The underlying loans may be subject to the risks of default or of prepayments that occur earlier or later than expected, and such loans may also include so-called “subprime” mortgages. The value of these securities will rise and fall in response to many factors, including economic conditions, the demand for rental property and interest rates. In particular, the value of these securities may decline when interest rates rise and will also be affected by the real estate market and by the management of the underlying properties.
Selection Risk: Selection risk is the risk that the securities selected by the subadviser will underperform the market, the relevant indices, or other funds with similar investment objectives and investment strategies. Individual REIT prices may drop because of the failure of borrowers to pay their loans, a dividend reduction, a disruption to the real estate investment sales market, changes in federal or state taxation policies affecting REITs, or poor management of a REIT.
Value Style Risk: Since the Fund follows a value investment style, there is the risk that the value style may be out of favor for long periods of time, that the market will not recognize a security’s intrinsic value for a long time or at all, or that a stock judged to be undervalued may actually be appropriately priced or overvalued. Issuers of value stocks may have experienced adverse business developments or may be subject to special risks that have caused the stock to be out of favor. In addition, the Fund’s value investment style may go out of favor with investors, negatively affecting the Fund’s performance. If the Fund’s assessment of market conditions or a company’s value is inaccurate, the Fund could suffer losses or produce poor performance relative to other funds.
PGIM Select Real Estate Fund 45
Report of Independent Registered Public Accounting Firm
To the Board of Trustees of Prudential Investment Portfolios 9 and Shareholders of PGIM Select Real Estate Fund
Opinion on the Financial Statements
We have audited the accompanying statement of assets and liabilities, including the schedule of investments, of PGIM Select Real Estate Fund (one of the funds constituting Prudential Investment Portfolios 9, referred to hereafter as the “Fund”) as of October 31, 2022, the related statement of operations for the year ended October 31, 2022, the statements of changes in net assets for each of the two years in the period ended October 31, 2022, including the related notes, and the financial highlights for each of the three years in the period ended October 31, 2022 (collectively referred to as the “financial statements”). In our opinion, the financial statements present fairly, in all material respects, the financial position of the Fund as of October 31, 2022, the results of its operations for the year then ended, the changes in its net assets for each of the two years in the period ended October 31 2022 and the financial highlights for each of the three years in the period ended October 31, 2022 in conformity with accounting principles generally accepted in the United States of America.
The financial statements of the Fund as of and for the year ended October 31, 2019 and the financial highlights for each of the periods ended on or prior to October 31, 2019 (not presented herein, other than the financial highlights) were audited by other auditors whose report dated December 19, 2019 expressed an unqualified opinion on those financial statements and financial highlights.
Basis for Opinion
These financial statements are the responsibility of the Fund’s management. Our responsibility is to express an opinion on the Fund’s financial statements based on our audits. We are a public accounting firm registered with the Public Company Accounting Oversight Board (United States) (PCAOB) and are required to be independent with respect to the Fund in accordance with the U.S. federal securities laws and the applicable rules and regulations of the Securities and Exchange Commission and the PCAOB.
We conducted our audits of these financial statements in accordance with the standards of the PCAOB. Those standards require that we plan and perform the audit to obtain reasonable assurance about whether the financial statements are free of material misstatement, whether due to error or fraud.
Our audits included performing procedures to assess the risks of material misstatement of the financial statements, whether due to error or fraud, and performing procedures that respond to those risks. Such procedures included examining, on a test basis, evidence regarding the amounts and disclosures in the financial statements. Our audits also included evaluating the accounting principles used and significant estimates made by management, as well as evaluating the overall presentation of the financial statements. Our procedures included confirmation of securities owned as of October 31, 2022 by correspondence with the custodian, transfer agent and brokers; when replies were not received from brokers, we performed other auditing procedures. We believe that our audits provide a reasonable basis for our opinion.
/s/PricewaterhouseCoopers LLP
New York, New York
December 16, 2022
We have served as the auditor of one or more investment companies in the PGIM Retail Funds complex since 2020.
46
Tax Information (unaudited)
We are advising you that during the fiscal year ended October 31, 2022, the Fund reports the maximum amount allowed per share, but not less than $0.08 for Class A, C, R6, and Z shares as a capital gain distribution in accordance with Section 852(b)(3)(C) of the Internal Revenue Code.
For the year ended October 31, 2022, the Fund reports the maximum amount allowable under Section 854 of the Internal Revenue Code, but not less than 19.97% of the ordinary income dividends paid during the year as qualified dividend income.
In January 2023, you will be advised on IRS Form 1099-DIV or substitute 1099-DIV as to the federal tax status of the distributions received by you in calendar year 2022.
PGIM Select Real Estate Fund 47
INFORMATION ABOUT BOARD MEMBERS AND OFFICERS (unaudited)
Information about Board Members and Officers of the Fund is set forth below. Board Members who are not deemed to be “interested persons” of the Fund, as defined in the 1940 Act, are referred to as “Independent Board Members.” Board Members who are deemed to be “interested persons” of the Fund are referred to as “Interested Board Members.” The Board Members are responsible for the overall supervision of the operations of the Fund and perform the various duties imposed on the directors of investment companies by the 1940 Act. The Board in turn elects the Officers, who are responsible for administering the day-to-day operations of the Fund.
| | | | | | |
| | | |
Independent Board Members | | | | |
| | | | |
Name Year of Birth Position(s) Portfolios Overseen | | Principal Occupation(s) During Past Five Years | | Other Directorships Held During Past Five Years | | Length of Board Service |
| | | | |
Ellen S. Alberding 1958 Board Member Portfolios Overseen: 97 | | President and Board Member, The Joyce Foundation (charitable foundation) (since 2002); formerly Vice Chair, City Colleges of Chicago (community college system) (2011-2015); Trustee, National Park Foundation (charitable foundation for national park system) (2009-2018); Trustee, Economic Club of Chicago (2009-2016); Trustee, Loyola University (since 2018). | | None. | | Since September 2013 |
| | | | |
Kevin J. Bannon 1952 Board Member Portfolios Overseen: 97 | | Retired; formerly Managing Director (April 2008-May 2015) and Chief Investment Officer (October 2008-November 2013) of Highmount Capital LLC (registered investment adviser); formerly Executive Vice President and Chief Investment Officer (April 1993-August 2007) of Bank of New York Company; President (May 2003-May 2007) of BNY Hamilton Family of Mutual Funds. | | Director of Urstadt Biddle Properties (equity real estate investment trust) (since September 2008). | | Since July 2008 |
PGIM Select Real Estate Fund
| | | | | | |
| | | |
Independent Board Members | | | | |
| | | | |
Name Year of Birth Position(s) Portfolios Overseen | | Principal Occupation(s) During Past Five Years | | Other Directorships Held During Past Five Years | | Length of Board Service |
| | | | |
Linda W. Bynoe 1952 Board Member Portfolios Overseen: 94 | | President and Chief Executive Officer (since March 1995) and formerly Chief Operating Officer (December 1989-February 1995) of Telemat Limited LLC (formerly Telemat Ltd) (management consulting); formerly Vice President (January 1985-June 1989) at Morgan Stanley & Co. (broker-dealer). | | Trustee of Equity Residential (residential real estate) (since December 2009); Director of Northern Trust Corporation (financial services) (since April 2006); formerly Director of Anixter International, Inc. (communication products distributor) (January 2006-June 2020). | | Since March 2005 |
| | | | |
Barry H. Evans 1960 Board Member Portfolios Overseen: 96 | | Retired; formerly President (2005-2016), Global Chief Operating Officer (2014-2016), Chief Investment Officer - Global Head of Fixed Income (1998-2014), and various portfolio manager roles (1986-2006), Manulife Asset Management (asset management). | | Formerly Director, Manulife Trust Company (2011-2018); formerly Director, Manulife Asset Management Limited (2015-2017); formerly Chairman of the Board of Directors of Manulife Asset Management U.S. (2005-2016); formerly Chairman of the Board, Declaration Investment Management and Research (2008-2016). | | Since September 2017 |
| | | | |
Keith F. Hartstein 1956 Board Member & Independent Chair Portfolios Overseen: 97 | | Retired; Member (November 2014-September 2022) of the Governing Council of the Independent Directors Council (IDC) (organization of independent mutual fund directors); formerly Executive Committee of the IDC Board of Governors (October 2019-December 2021); formerly President and Chief Executive Officer (2005-2012), Senior Vice President (2004-2005), Senior Vice President of Sales and Marketing (1997-2004), and various executive management positions (1990-1997), John Hancock Funds, LLC (asset management); Chairman, Investment Company Institute’s Sales Force Marketing Committee (2003-2008). | | None. | | Since September 2013 |
Visit our website at pgim.com/investments
| | | | | | |
| | | |
Independent Board Members | | | | |
| | | | |
Name Year of Birth Position(s) Portfolios Overseen | | Principal Occupation(s) During Past Five Years | | Other Directorships Held During Past Five Years | | Length of Board Service |
| | | | |
Laurie Simon Hodrick 1962 Board Member Portfolios Overseen: 93 | | A. Barton Hepburn Professor Emerita of Economics in the Faculty of Business, Columbia Business School (since 2018); Visiting Fellow at the Hoover Institution, Stanford University (since 2015); Sole Member, ReidCourt LLC (since 2008) (a consulting firm); formerly Visiting Professor of Law, Stanford Law School (2015-2021); formerly A. Barton Hepburn Professor of Economics in the Faculty of Business, Columbia Business School (1996-2017); formerly Managing Director, Global Head of Alternative Investment Strategies, Deutsche Bank (2006-2008). | | Independent Director, Andela (since January 2022) (global talent network); Independent Director, Roku (since December 2020) (communication services); formerly Independent Director, Synnex Corporation (2019-2021) (information technology); formerly Independent Director, Kabbage, Inc. (2018-2020) (financial services); formerly Independent Director, Corporate Capital Trust (2017-2018) (a business development company). | | Since September 2017 |
| | | | |
Brian K. Reid 1961 Board Member Portfolios Overseen: 96 | | Retired; formerly Chief Economist for the Investment Company Institute (ICI) (2005-2017); formerly Senior Economist and Director of Industry and Financial Analysis at the ICI (1998-2004); formerly Senior Economist, Industry and Financial Analysis at the ICI (1996-1998); formerly Staff Economist at the Federal Reserve Board (1989-1996); Director, ICI Mutual Insurance Company (2012-2017). | | None. | | Since March 2018 |
PGIM Select Real Estate Fund
| | | | | | |
| | | |
Independent Board Members | | | | |
| | | | |
Name Year of Birth Position(s) Portfolios Overseen | | Principal Occupation(s) During Past Five Years | | Other Directorships Held During Past Five Years | | Length of Board Service |
| | | | |
Grace C. Torres 1959 Board Member Portfolios Overseen: 96 | | Retired; formerly Treasurer and Principal Financial and Accounting Officer of the PGIM Funds, Target Funds, Advanced Series Trust, Prudential Variable Contract Accounts and The Prudential Series Fund (1998-June 2014); Assistant Treasurer (March 1999-June 2014) and Senior Vice President (September 1999-June 2014) of PGIM Investments LLC; Assistant Treasurer (May 2003-June 2014) and Vice President (June 2005-June 2014) of AST Investment Services, Inc.; Senior Vice President and Assistant Treasurer (May 2003-June 2014) of Prudential Annuities Advisory Services, Inc. | | Director (since January 2018) of OceanFirst Financial Corp. and OceanFirst Bank; formerly Director (July 2015-January 2018) of Sun Bancorp, Inc. N.A. and Sun National Bank. | | Since November 2014 |
Visit our website at pgim.com/investments
| | | | | | |
| |
Interested Board Members |
| | | | |
Name Year of Birth Position(s) Portfolios Overseen | | Principal Occupation(s) During Past Five Years | | Other Directorships Held During Past Five Years | | Length of Board Service |
| | | | |
Stuart S. Parker 1962 Board Member & President Portfolios Overseen: 96 | | President, Chief Executive Officer, Chief Operating Officer and Officer in Charge of PGIM Investments LLC (formerly known as Prudential Investments LLC) (since January 2012); President and Principal Executive Officer (“PEO”) (since September 2022) of the PGIM Private Credit Fund; President and PEO (since March 2022) of the PGIM Private Real Estate Fund, Inc.; formerly Executive Vice President of Jennison Associates LLC and Head of Retail Distribution of PGIM Investments LLC (June 2005-December 2011); Investment Company Institute - Board of Governors (since May 2012). | | None. | | Since January 2012 |
| | | | |
Scott E. Benjamin 1973 Board Member & Vice President Portfolios Overseen: 97 | | Executive Vice President (since May 2009) of PGIM Investments LLC; Vice President (since June 2012) of Prudential Investment Management Services LLC; Executive Vice President (since September 2009) of AST Investment Services, Inc.; Senior Vice President of Product Development and Marketing, PGIM Investments (since February 2006); Vice President (since September 2022) of the PGIM Private Credit Fund; Vice President (since March 2022) of the PGIM Private Real Estate Fund, Inc.; formerly Vice President of Product Development and Product Management, PGIM Investments LLC (2003-2006). | | None. | | Since March 2010 |
PGIM Select Real Estate Fund
| | | | |
| | | |
Fund Officers(a) | | | | |
| | | |
Name Year of Birth Fund Position | | Principal Occupation(s) During Past Five Years | | Length of Service as Fund Officer |
| | | |
Claudia DiGiacomo 1974 Chief Legal Officer | | Chief Legal Officer (since September 2022) of the PGIM Private Credit Fund; Chief Legal Officer (since July 2022) of the PGIM Private Real Estate Fund, Inc.; Chief Legal Officer, Executive Vice President and Secretary of PGIM Investments LLC (since August 2020); Chief Legal Officer of Prudential Mutual Fund Services LLC (since August 2020); Chief Legal Officer of PIFM Holdco, LLC (since August 2020); Vice President and Corporate Counsel (since January 2005) of Prudential; and Corporate Counsel of AST Investment Services, Inc. (since August 2020); formerly Vice President and Assistant Secretary of PGIM Investments LLC (2005-2020); formerly Associate at Sidley Austin Brown & Wood LLP (1999-2004). | | Since December 2005 |
| | | |
Isabelle Sajous 1976 Chief Compliance Officer | | Chief Compliance Officer (since April 2022) of PGIM Investments LLC, the PGIM Funds, Target Funds, PGIM ETF Trust, PGIM Global High Yield Fund, Inc., PGIM High Yield Bond Fund, Inc., PGIM Short Duration High Yield Opportunities Fund, Advanced Series Trust, The Prudential Series Fund and Prudential’s Gibraltar Fund, Inc.; Chief Compliance Officer (since September 2022) of the PGIM Private Credit Fund; Chief Compliance Officer (since March 2022) of the PGIM Private Real Estate Fund, Inc.; Vice President, Compliance of PGIM Investments LLC (since December 2020); formerly Director, Compliance (July 2018-December 2020) of Credit Suisse Asset Management LLC; and Vice President, Associate General Counsel & Deputy Chief Compliance Officer of Cramer Rosenthal McGlynn, LLC (August 2014-July 2018). | | Since April 2022 |
| | | |
Andrew R. French 1962 Secretary | | Vice President (since December 2018) of PGIM Investments LLC; Secretary (since September 2022) of the PGIM Private Credit Fund; Secretary (since March 2022) of the PGIM Private Real Estate Fund, Inc.; formerly Vice President and Corporate Counsel (2010-2018) of Prudential; formerly Director and Corporate Counsel (2006-2010) of Prudential; Vice President and Assistant Secretary (since January 2007) of PGIM Investments LLC; Vice President and Assistant Secretary (since January 2007) of Prudential Mutual Fund Services LLC. | | Since October 2006 |
| | | |
Melissa Gonzalez 1980 Assistant Secretary | | Vice President and Corporate Counsel (since September 2018) of Prudential; Vice President and Assistant Secretary (since August 2020) of PGIM Investments LLC; Assistant Secretary (since September 2022) of the PGIM Private Credit Fund; Assistant Secretary (since March 2022) of the PGIM Private Real Estate Fund, Inc.; formerly Director and Corporate Counsel (March 2014-September 2018) of Prudential. | | Since March 2020 |
Visit our website at pgim.com/investments
| | | | |
| | | |
Fund Officers(a) | | | | |
| | | |
Name Year of Birth Fund Position | | Principal Occupation(s) During Past Five Years | | Length of Service as Fund Officer |
| | | |
Patrick E. McGuinness 1986 Assistant Secretary | | Vice President and Assistant Secretary (since August 2020) of PGIM Investments LLC; Director and Corporate Counsel (since February 2017) of Prudential; Assistant Secretary (since September 2022) of the PGIM Private Credit Fund; Assistant Secretary (since March 2022) of the PGIM Private Real Estate Fund, Inc. | | Since June 2020 |
| | | |
Debra Rubano 1975 Assistant Secretary | | Vice President and Corporate Counsel (since November 2020) of Prudential; Assistant Secretary (since September 2022) of the PGIM Private Credit Fund; Assistant Secretary (since March 2022) of the PGIM Private Real Estate Fund, Inc; formerly Director and Senior Counsel of Allianz Global Investors U.S. Holdings LLC (2010-2020) and Assistant Secretary of numerous funds in the Allianz fund complex (2015-2020). | | Since December 2020 |
| | | |
Kelly A. Coyne 1968 Assistant Secretary | | Director, Investment Operations of Prudential Mutual Fund Services LLC (since 2010); Assistant Secretary (since September 2022) of the PGIM Private Credit Fund; Assistant Secretary (since March 2022) of the PGIM Private Real Estate Fund, Inc. | | Since March 2015 |
| | | |
Christian J. Kelly 1975 Treasurer and Principal Financial and Accounting Officer | | Vice President, Head of Fund Administration of PGIM Investments LLC (since November 2018); Principal Financial Officer (since September 2022) of the PGIM Private Credit Fund; Principal Financial Officer (since March 2022) of the PGIM Private Real Estate Fund, Inc.; formerly, Treasurer and Principal Accounting Officer (March 2022- July 2022) of the PGIM Private Real Estate Fund, Inc.; formerly Director of Fund Administration of Lord Abbett & Co. LLC (2009-2018), Treasurer and Principal Accounting Officer of the Lord Abbett Family of Funds (2017-2018); Director of Accounting, Avenue Capital Group (2008-2009); Senior Manager, Investment Management Practice of Deloitte & Touche LLP (1998-2007). | | Since January 2019 |
| | | |
Lana Lomuti 1967 Assistant Treasurer | | Vice President (since 2007) and Director (2005-2007), within PGIM Investments Fund Administration; formerly Assistant Treasurer (December 2007-February 2014) of The Greater China Fund, Inc. | | Since April 2014 |
| | | |
Russ Shupak 1973 Assistant Treasurer | | Vice President (since 2017) and Director (2013-2017), within PGIM Investments Fund Administration; Treasurer and Principal Accounting Officer (since July 2022) of the PGIM Private Real Estate Fund, Inc.; Assistant Treasurer (since September 2022) of the PGIM Private Credit Fund; formerly Assistant Treasurer (March 2022 – July 2022) of the PGIM Private Real Estate Fund, Inc. | | Since October 2019 |
| | | |
Deborah Conway 1969 Assistant Treasurer | | Vice President (since 2017) and Director (2007-2017), within PGIM Investments Fund Administration. | | Since October 2019 |
PGIM Select Real Estate Fund
| | | | |
| | | |
| Fund Officers(a) | | | | |
| | | |
Name Year of Birth Fund Position | | Principal Occupation(s) During Past Five Years | | Length of Service as Fund Officer |
| | | |
Elyse M. McLaughlin 1974 Assistant Treasurer | | Vice President (since 2017) and Director (2011-2017), within PGIM Investments Fund Administration; Treasurer and Principal Accounting Officer (since September 2022) of the PGIM Private Credit Fund; Assistant Treasurer (since March 2022) of the PGIM Private Real Estate Fund, Inc. | | Since October 2019 |
| | | |
Kelly Florio 1978 Anti-Money Laundering Compliance Officer | | Vice President, Corporate Compliance, Global Compliance Programs and Compliance Risk Management (since December 2021) of Prudential; formerly, Head of Fraud Risk Management (October 2019 to December 2021) at New York Life Insurance Company; formerly, Head of Key Risk Area Operations (November 2018 to October 2019), Director of the US Anti-Money Laundering Compliance Unit (2009-2018) and Bank Loss Prevention Associate (2006 -2009) at MetLife. | | Since June 2022 |
(a) Excludes Mr. Parker and Mr. Benjamin, interested Board Members who also serve as President and Vice President, respectively.
Explanatory Notes to Tables:
| ∎ | | Board Members are deemed to be “Interested,” as defined in the 1940 Act, by reason of their affiliation with PGIM Investments LLC and/or an affiliate of PGIM Investments LLC. |
| ∎ | | Unless otherwise noted, the address of all Board Members and Officers is c/o PGIM Investments LLC, 655 Broad Street, Newark, New Jersey 07102-4410. |
| ∎ | | There is no set term of office for Board Members or Officers. The Board Members have adopted a retirement policy, which calls for the retirement of Board Members on December 31 of the year in which they reach the age of 75. |
| ∎ | | “Other Directorships Held” includes all directorships of companies required to register or file reports with the SEC under the 1934 Act (that is, “public companies”) or other investment companies registered under the 1940 Act. |
| ∎ | | “Portfolios Overseen” includes all investment companies managed by PGIM Investments LLC. The investment companies for which PGIM Investments LLC serves as manager include the PGIM Mutual Funds, Target Funds, The Prudential Variable Contract Accounts, PGIM ETF Trust, PGIM Private Real Estate Fund, Inc., PGIM Private Credit Fund, PGIM High Yield Bond Fund, Inc., PGIM Global High Yield Fund, Inc., PGIM Short Duration High Yield Opportunities Fund, The Prudential Series Fund, Prudential’s Gibraltar Fund, Inc. and the Advanced Series Trust. |
| ∎ | | As used in the Fund Officers table “Prudential” means The Prudential Insurance Company of America. |
Visit our website at pgim.com/investments
Approval of Advisory Agreements (unaudited)
The Fund’s Board of Trustees
The Board of Trustees (the “Board”) of PGIM Select Real Estate Fund (the “Fund”)1 consists of ten individuals, eight of whom are not “interested persons” of the Fund, as defined in the Investment Company Act of 1940, as amended (the “1940 Act”) (the “Independent Trustees”). The Board is responsible for the oversight of the Fund and its operations, and performs the various duties imposed on the directors of investment companies by the 1940 Act. The Independent Trustees have retained independent legal counsel to assist them in connection with their duties. The Chair of the Board is an Independent Trustee. The Board has established five standing committees: the Audit Committee, the Nominating and Governance Committee, the Compliance Committee and two Investment Committees. Each committee is chaired by, and composed of, Independent Trustees.
Annual Approval of the Fund’s Advisory Agreements
As required under the 1940 Act, the Board determines annually whether to renew the Fund’s management agreement with PGIM Investments LLC (“PGIM Investments”) and the Fund’s subadvisory agreement with PGIM, Inc. (“PGIM”) on behalf of its PGIM Real Estate unit (“PGIM Real Estate”), and PGIM Real Estate (UK) Limited (“PGIM RE (UK)”). In considering the renewal of the agreements, the Board, including all of the Independent Trustees, met on May 26 and June 7-9, 2022 (the “Board Meeting”) and approved the renewal of the agreements through July 31, 2023, after concluding that the renewal of the agreements was in the best interests of the Fund and its shareholders.
In advance of the meetings, the Board requested and received materials relating to the agreements, and had the opportunity to ask questions and request further information in connection with its consideration. Among other things, the Board considered comparative fee information from PGIM Investments, PGIM and PGIM RE (UK). Also, the Board considered comparisons with other mutual funds in relevant Peer Universes and Peer Groups, as is further discussed below.
In approving the agreements, the Board, including the Independent Trustees advised by independent legal counsel, considered the factors it deemed relevant, including the nature, quality and extent of services provided by PGIM Investments and the subadvisers, the performance of the Fund, the profitability of PGIM Investments and its affiliates, expenses and fees, and the potential for economies of scale that may be shared with the Fund and its shareholders as the Fund’s assets grow. In their deliberations, the Trustees did not identify any single factor which alone was responsible for the Board’s decision to approve the agreements with respect to the Fund. In connection with its deliberations, the Board considered information provided by PGIM Investments throughout the year at regular Board meetings, presentations from portfolio managers and other information, as well as information furnished at or in advance of the Board Meeting.
1 PGIM Select Real Estate Fund is a series of Prudential Investment Portfolios 9.
PGIM Select Real Estate Fund
Approval of Advisory Agreements (continued)
The Trustees determined that the overall arrangements between the Fund and PGIM Investments, which serves as the Fund’s investment manager pursuant to a management agreement, and between PGIM Investments and each of PGIM, which, through its PGIM Real Estate unit, and PGIM RE (UK), serve as the Fund’s subadvisers pursuant to the terms of a subadvisory agreement with PGIM Investments, are in the best interests of the Fund and its shareholders in light of the services performed, fees charged and such other matters as the Trustees considered relevant in the exercise of their business judgment.
The material factors and conclusions that formed the basis for the Trustees’ reaching their determinations to approve the continuance of the agreements are separately discussed below.
Nature, Quality and Extent of Services
The Board received and considered information regarding the nature, quality and extent of services provided to the Fund by PGIM Investments, PGIM Real Estate and PGIM RE (UK). The Board noted that PGIM Real Estate and PGIM RE (UK) are affiliated with PGIM Investments. The Board considered the services provided by PGIM Investments, including but not limited to the oversight of the subadvisers for the Fund, as well as the provision of fund recordkeeping, compliance and other services to the Fund, and PGIM Investments’ role as the administrator for the Fund’s liquidity risk management program. With respect to PGIM Investments’ oversight of the subadvisers, the Board noted that PGIM Investments’ Strategic Investment Research Group (“SIRG”), which is a business unit of PGIM Investments, is responsible for monitoring and reporting to PGIM Investments’ senior management on the performance and operations of the subadvisers. The Board also considered that PGIM Investments pays the salaries of all of the officers and interested Trustees of the Fund who are part of Fund management. The Board also considered the investment subadvisory services provided by PGIM Real Estate and PGIM RE (UK), including investment research and security selection, as well as adherence to the Fund’s investment restrictions and compliance with applicable Fund policies and procedures. The Board considered PGIM Investments’ evaluation of the subadvisers, as well as PGIM Investments’ recommendation, based on its review of the subadvisers, to renew the subadvisory agreement.
The Board considered the qualifications, backgrounds and responsibilities of PGIM Investments’ senior management responsible for the oversight of the Fund, PGIM Real Estate and PGIM RE (UK), and also considered the qualifications, backgrounds and responsibilities of the PGIM Real Estate and PGIM RE (UK) portfolio managers who are responsible for the day-to-day management of the Fund’s portfolio. The Board was provided with information pertaining to PGIM Investments’, PGIM Real Estate’s, PGIM’s and PGIM RE (UK)’s organizational structure, senior management, investment operations, and other relevant information pertaining to PGIM Investments, PGIM Real Estate, PGIM and PGIM RE (UK). The Board also noted that it received favorable
Visit our website at pgim.com/investments
compliance reports from the Fund’s Chief Compliance Officer (“CCO”) as to PGIM Investments, PGIM Real Estate, PGIM and PGIM RE (UK).
The Board concluded that it was satisfied with the nature, extent and quality of the investment management services provided by PGIM Investments and the subadvisory services provided to the Fund by PGIM Real Estate and PGIM RE (UK), and that there was a reasonable basis on which to conclude that the Fund benefits from the services provided by PGIM Investments, PGIM Real Estate and PGIM RE (UK) under the management and subadvisory agreements.
Costs of Services and Profits Realized by PGIM Investments
The Board was provided with information on the profitability of PGIM Investments and its affiliates in serving as the Fund’s investment manager. The Board discussed with PGIM Investments the methodology utilized in assembling the information regarding profitability and considered its reasonableness. The Board recognized that it is difficult to make comparisons of profitability from fund management contracts because comparative information is not generally publicly available and is affected by numerous factors, including the structure of the particular adviser, the types of funds it manages, its business mix, numerous assumptions regarding allocations and the adviser’s capital structure and cost of capital. However, the Board considered that the cost of services provided by PGIM Investments to the Fund during the year ended December 31, 2021 exceeded the management fees paid by the Fund, resulting in an operating loss to PGIM Investments. Taking these factors into account, the Board concluded that the profitability of PGIM Investments and its affiliates in relation to the services rendered was not unreasonable.
Economies of Scale
The Board received and discussed information concerning economies of scale that PGIM Investments may realize as the Fund’s assets grow beyond current levels. The Board noted that the management fee schedule for the Fund includes breakpoints, which have the effect of decreasing the fee rate as assets increase. During the course of time, the Board has considered information regarding the launch date of the Fund, the management fees of the Fund compared to those of similarly managed funds and PGIM Investments’ investment in the Fund over time. The Board noted that economies of scale, can be shared with the Fund in other ways, including low management fees from inception, additional technological and personnel investments to enhance shareholder services, and maintaining existing expense structures in the face of a rising cost environment. The Board considered PGIM Investments’ assertion that it continually evaluates the management fee schedule of the Fund and the potential to share economies of scale through breakpoints or fee waivers as asset levels increase.
The Board recognized the inherent limitations of any analysis of economies of scale, stemming largely from the Board’s understanding that most of PGIM Investments’ costs are not specific to individual funds, but rather are incurred across a variety of products and services.
PGIM Select Real Estate Fund
Approval of Advisory Agreements (continued)
Other Benefits to PGIM Investments, PGIM Real Estate and PGIM RE (UK)
The Board considered potential ancillary benefits that might be received by PGIM Investments, PGIM Real Estate, PGIM RE (UK) and their affiliates as a result of their relationship with the Fund. The Board concluded that potential benefits to be derived by PGIM Investments included transfer agency fees received by the Fund’s transfer agent (which is affiliated with PGIM Investments), and benefits to its reputation as well as other intangible benefits resulting from PGIM Investments’ association with the Fund. The Board concluded that the potential benefits to be derived by PGIM Real Estate and PGIM RE (UK) included their ability to use soft dollar credits, as well as the potential benefits consistent with those generally resulting from an increase in assets under management, specifically, potential access to additional research resources and benefits to its reputation. The Board concluded that the benefits derived by PGIM Investments, PGIM Real Estate and PGIM RE (UK) were consistent with the types of benefits generally derived by investment managers and subadvisers to mutual funds.
Performance of the Fund / Fees and Expenses
The Board considered certain additional factors and made related conclusions relating to the historical performance of the Fund for the one-, three- and five-year periods ended December 31, 2021. The Board considered that the Fund commenced investment operations on August 1, 2014 and that longer-term performance was not yet available.
The Board also considered the Fund’s actual management fee, as well as the Fund’s net total expense ratio, for the fiscal year ended October 31, 2021. The Board considered the management fee for the Fund as compared to the management fee charged by PGIM Investments to other funds and the fee charged by other advisers to comparable mutual funds in a Peer Group. The actual management fee represents the fee rate actually paid by Fund shareholders and includes any fee waivers or reimbursements. The net total expense ratio for the Fund represents the actual expense ratio incurred by Fund shareholders.
The mutual funds included in the Peer Universe, which was used to consider performance, and the Peer Group, which was used to consider expenses and fees, were objectively determined by Broadridge, an independent provider of mutual fund data. In certain circumstances, PGIM Investments also provided supplemental Peer Universe or Peer Group information for reasons addressed with the Board. The comparisons placed the Fund in various quartiles over various periods, with the first quartile being the best 25% of the mutual funds (for performance, the best performing mutual funds and, for expenses, the lowest cost mutual funds).
The section below summarizes key factors considered by the Board and the Board’s conclusions regarding the Fund’s performance, fees and overall expenses. The table sets forth net performance comparisons (which reflect the impact on performance of fund expenses, or any subsidies, expense caps or waivers that may be applicable) with the Peer Universe, actual management fees with the Peer Group (which reflect the
Visit our website at pgim.com/investments
impact of any subsidies or fee waivers), and net total expenses with the Peer Group, each of which were key factors considered by the Board.
| | | | | | | | |
Net Performance | | 1 Year | | 3 Years | | 5 Years | | 10 Years |
| | | 2nd Quartile | | 1st Quartile | | 1st Quartile | | N/A |
Actual Management Fees: 3rd Quartile | | | | |
| Net Total Expenses: 2nd Quartile | | |
| · | | The Board noted that the Fund outperformed its benchmark index over all periods. |
| · | | The Board and PGIM Investments agreed to retain the existing contractual expense cap that (exclusive of certain fees and expenses) caps total annual operating expenses at 1.30% for Class A shares, 2.05% for Class C shares, 1.05% for Class R6 shares, and 1.05% for Class Z shares through February 28, 2023. |
| · | | In addition, PGIM Investments will waive management fees or shared operating expenses on any share class to the same extent that it waives such expenses on any other share class, and has agreed that total annual fund operating expenses for Class R6 shares will not exceed total annual fund operating expenses for Class Z shares. |
| · | | The Board concluded that, in light of the above, it would be in the best interests of the Fund and its shareholders to renew the agreements. |
| · | | The Board concluded that the management fees (including subadvisory fees) and total expenses were reasonable in light of the services provided. |
* * *
After full consideration of these factors, the Board concluded that the approval of the agreements was in the best interests of the Fund and its shareholders.
PGIM Select Real Estate Fund
| | | | |
| | | |
∎ MAIL | | ∎ TELEPHONE | | ∎ WEBSITE |
| | | |
655 Broad Street Newark, NJ 07102 | | (800) 225-1852 | | pgim.com/investments |
|
| |
| PROXY VOTING |
| |
The Board of Trustees of the Fund has delegated to the Fund’s subadvisers the responsibility for voting any proxies and maintaining proxy recordkeeping with respect to the Fund. A description of these proxy voting policies and procedures is available without charge, upon request, by calling (800) 225-1852 or by visiting the Securities and Exchange Commission’s website at sec.gov. Information regarding how the Fund voted proxies relating to portfolio securities during the most recent 12-month period ended June 30 is available on the Fund’s website and on the Securities and Exchange Commission’s website. |
|
| |
| TRUSTEES |
| |
Ellen S. Alberding · Kevin J. Bannon · Scott E. Benjamin · Linda W. Bynoe · Barry H. Evans · Keith F. Hartstein · Laurie Simon Hodrick · Stuart S. Parker · Brian K. Reid · Grace C. Torres |
|
| |
| OFFICERS |
| |
| Stuart S. Parker, President · Scott E. Benjamin, Vice President · Christian J. Kelly, Treasurer and Principal Financial and Accounting Officer · Claudia DiGiacomo, Chief Legal Officer · Isabelle Sajous, Chief Compliance Officer · Kelly Florio, Anti-Money Laundering Compliance Officer · Andrew R. French, Secretary · Melissa Gonzalez, Assistant Secretary · Kelly A. Coyne, Assistant Secretary · Patrick E. McGuinness, Assistant Secretary · Debra Rubano, Assistant Secretary · Lana Lomuti, Assistant Treasurer · Russ Shupak, Assistant Treasurer · Elyse M. McLaughlin, Assistant Treasurer · Deborah Conway, Assistant Treasurer |
| | | | |
| | |
| MANAGER | | PGIM Investments LLC | | 655 Broad Street Newark, NJ 07102 |
| | |
| SUBADVISERS | | PGIM Real Estate | | 7 Giralda Farms Madison, NJ 07940 |
| | |
| | | PGIM Real Estate (UK) Limited | | Grand Buildings, 1-3 Strand Trafalgar Square London, WC2N 5HR United Kingdom |
| | |
| DISTRIBUTOR | | Prudential Investment Management Services LLC | | 655 Broad Street Newark, NJ 07102 |
| | |
| CUSTODIAN | | The Bank of New York Mellon | | 240 Greenwich Street New York, NY 10286 |
| | |
| TRANSFER AGENT | | Prudential Mutual Fund Services LLC | | PO Box 9658 Providence, RI 02940 |
| | |
INDEPENDENT REGISTERED PUBLIC ACCOUNTING FIRM | | PricewaterhouseCoopers LLP | | 300 Madison Avenue New York, NY 10017 |
| | |
| FUND COUNSEL | | Willkie Farr & Gallagher LLP | | 787 Seventh Avenue New York, NY 10019 |
|
| An investor should consider the investment objectives, risks, charges, and expenses of the Fund carefully before investing. The prospectus and summary prospectus contain this and other information about the Fund. An investor may obtain the prospectus and summary prospectus by visiting our website at pgim.com/investments or by calling (800) 225-1852. The prospectus and summary prospectus should be read carefully before investing. |
|
| E-DELIVERY |
| |
| To receive your mutual fund documents online, go to pgim.com/investments/resource/edelivery and enroll. Instead of receiving printed documents by mail, you will receive notification via email when new materials are available. You can cancel your enrollment or change your email address at any time by visiting the website address above. |
|
| SHAREHOLDER COMMUNICATIONS WITH TRUSTEES |
| |
| Shareholders can communicate directly with the Board of Trustees by writing to the Chair of the Board, PGIM Select Real Estate Fund, PGIM Investments, Attn: Board of Trustees, 655 Broad Street, Newark, NJ 07102. Shareholders can communicate directly with an individual Trustee by writing to that Trustee at the same address. Communications are not screened before being delivered to the addressee. |
|
| AVAILABILITY OF PORTFOLIO HOLDINGS |
| |
| The Fund files its complete schedule of portfolio holdings with the Securities and Exchange Commission for the first and third quarters of each fiscal year as an exhibit to its reports on Form N-PORT. The Fund’s Form N-PORT filings are available on the Commission’s website at sec.gov. |
|
| The Fund’s Statement of Additional Information contains additional information about the Fund’s Trustees and is available without charge, upon request, by calling (800) 225-1852. |
| | | | |
Mutual Funds: | | | | |
| | | |
ARE NOT INSURED BY THE FDIC OR ANY
FEDERAL GOVERNMENT AGENCY | | MAY LOSE VALUE | | ARE NOT A DEPOSIT OF OR GUARANTEED
BY ANY BANK OR ANY BANK AFFILIATE |
PGIM SELECT REAL ESTATE FUND
| | | | | | | | | | | | | | | | | | |
| | | | | |
SHARE CLASS | | | | | A | | | | C | | | | Z | | | | R6 | |
| | | | | |
NASDAQ | | | | | SREAX | | | | SRECX | | | | SREZX | | | | SREQX | |
| | | | | |
CUSIP | | | | | 74441J811 | | | | 74441J795 | | | | 74441J779 | | | | 74441J787 | |
MF223E

PGIM INTERNATIONAL BOND FUND
ANNUAL REPORT
OCTOBER 31, 2022

To enroll in e-delivery, go to pgim.com/investments/resource/edelivery
Table of Contents
This report is not authorized for distribution to prospective investors unless preceded or accompanied by a current prospectus.
The views expressed in this report and information about the Fund’s portfolio holdings are for the period covered by this report and are subject to change thereafter.
Mutual funds are distributed by Prudential Investment Management Services LLC (PIMS), member SIPC. PGIM Fixed Income is a unit of PGIM, Inc. (PGIM), a registered investment adviser. PIMS and PGIM are Prudential Financial companies. © 2022 Prudential Financial, Inc. and its related entities. PGIM and the PGIM logo are service marks of Prudential Financial, Inc. and its related entities, registered in many jurisdictions worldwide.
| | |
| 2 Visit our website at pgim.com/investments | | |
Letter from the President
| | |
 | | Dear Shareholder: We hope you find the annual report for the PGIM International Bond Fund informative and useful. The report covers performance for the 12-month period that ended October 31, 2022. The attention of the global economy and financial markets pivoted during the period from the COVID-19 pandemic to the challenge of rapidly rising inflation. While job growth remained strong, prices for a wide range of goods and services rose in response to economic re-openings, supply-chain disruptions, governmental stimulus, and Russia’s invasion of Ukraine. With inflation surging to a 40-year high, the Federal Reserve and other central banks aggressively hiked interest rates, |
prompting recession concerns.
After rising to record levels at the end of 2021, stocks have fallen sharply in 2022 as investors worried about higher prices, slowing economic growth, geopolitical uncertainty, and new COVID-19 outbreaks. Equities rallied for a time during the summer but began falling again in late August on fears that the Fed would keep raising rates to tame inflation. For the entire 12-month period, equities suffered a broad-based global decline, although large-cap US stocks outperformed their small-cap counterparts. International developed and emerging markets trailed the US market during this time.
Rising rates and economic uncertainty drove fixed income prices broadly lower as well. US and global investment-grade bonds, along with US high yield corporate bonds and emerging market debt, all posted negative returns during the period.
Regarding your investments with PGIM, we believe it is important to maintain a diversified portfolio of funds consistent with your tolerance for risk, time horizon, and financial goals. Your financial advisor can help you create a diversified investment plan that may include funds covering all the basic asset classes and that reflects your personal investor profile and risk tolerance. However, diversification and asset allocation strategies do not assure a profit or protect against loss in declining markets.
At PGIM Investments, we provide access to active investment strategies across the global markets in the pursuit of consistent outperformance for investors. PGIM is the world’s 11th-largest investment manager with more than $1.5 trillion in assets under management. Our scale and investment expertise allow us to deliver a diversified suite of actively managed solutions across a broad spectrum of asset classes and investment styles.
Thank you for choosing our family of funds.
Sincerely,

Stuart S. Parker, President
PGIM International Bond Fund
December 15, 2022
| | |
| | PGIM International Bond Fund 3 |
Your Fund’s Performance (unaudited)
Performance data quoted represent past performance. Past performance does not guarantee future results. The investment return and principal value of an investment will fluctuate so that an investor’s shares, when redeemed, may be worth more or less than their original cost. Current performance may be lower or higher than the past performance data quoted. An investor may obtain performance data as of the most recent month-end by visiting our website at pgim.com/investments or by calling (800) 225-1852.
| | | | | | |
| |
| | Average Annual Total Returns as of 10/31/22 |
| | One Year (%) | | Five Years (%) | | Since Inception (%) |
| | | |
Class A | | | | | | |
| | | |
(with sales charges) | | -22.03 | | -1.74 | | -0.43 (12/14/2016) |
| | | |
(without sales charges) | | -19.41 | | -1.09 | | 0.13 (12/14/2016) |
| | | |
Class C | | | | | | |
| | | |
(with sales charges) | | -20.89 | | -1.86 | | -0.65 (12/14/2016) |
| | | |
(without sales charges) | | -20.13 | | -1.86 | | -0.65 (12/14/2016) |
| | | |
Class Z | | | | | | |
| | | |
(without sales charges) | | -19.12 | | -0.78 | | 0.44 (12/14/2016) |
| | | |
Class R6 | | | | | | |
| | | |
(without sales charges) | | -19.08 | | -0.75 | | 0.46 (12/14/2016) |
| | | |
Bloomberg Global Aggregate ex-USD (USD Hedged) Index | | | | | | |
| | | |
| | | -9.02 | | 0.67 | | 0.98 |
Since Inception returns are provided since the Fund has less than 10 fiscal years of returns. Since Inception returns for the Index are measured from the closest month-end to the Fund’s inception date.
4 Visit our website at pgim.com/investments
Growth of a $10,000 Investment (unaudited)
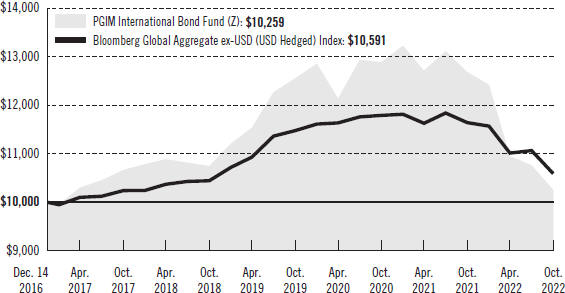
The graph compares a $10,000 investment in the Fund’s Class Z shares with a similar investment in the Bloomberg Global Aggregate ex-USD (USD Hedged) Index by portraying the initial account values at the commencement of operations for Class Z shares (December 14, 2016) and the account values at the end of the current fiscal year (October 31, 2022), as measured on a quarterly basis. For purposes of the graph, and unless otherwise indicated, it has been assumed that (a) all recurring fees (including management fees) were deducted and (b) all dividends and distributions were reinvested. The line graph provides information for Class Z shares only. As indicated in the tables provided earlier, performance for other share classes will vary due to the differing fees and expenses applicable to each share class (as indicated in the following paragraphs). Without waiver of fees and/or expense reimbursements, if any, the returns would have been lower.
Past performance does not predict future performance. Total returns and the ending account values in the graphs include changes in share price and reinvestment of dividends and capital gains distributions in a hypothetical investment for the periods shown. The Fund’s total returns do not reflect the deduction of income taxes on an individual’s investment. Taxes may reduce your actual investment returns on income or gains paid by the Fund or any gains you may realize if you sell your shares.
PGIM International Bond Fund 5
Your Fund’s Performance (continued)
The returns in the tables do not reflect the deduction of taxes that a shareholder would pay on Fund distributions or following the redemption of Fund shares. The average annual total returns take into account applicable sales charges, which are described for each share class in the table below.
| | | | | | | | |
| | | Class A | | Class C | | Class Z | | Class R6 |
| Maximum initial sales charge | | 3.25% of the public offering price | | None | | None | | None |
| Contingent deferred sales charge (CDSC) (as a percentage of the lower of the original purchase price or the net asset value at redemption) | | 1.00% on sales of $500,000 or more made within 12 months of purchase | | 1.00% on sales made within 12 months of purchase | | None | | None |
| Annual distribution and service (12b-1) fees (shown as a percentage of average daily net assets) | | 0.25% | | 1.00% | | None | | None |
Benchmark Definition
Bloomberg Global Aggregate ex-USD (USD Hedged) Index—The Bloomberg Global Aggregate ex-USD (USD Hedged) Index provides a broad-based measure of the global investment-grade fixed income markets, with index components for the Pan-European Aggregate and the Asian-Pacific Aggregate excluding US dollar-denominated components. Returns for the Index are hedged to the US dollar.
Investors cannot invest directly in an index. The returns for the Index would be lower if they included the effects of sales charges, operating expenses of a mutual fund, or taxes that may be paid by an investor.
6 Visit our website at pgim.com/investments
| | | | |
| |
| Credit Quality expressed as a percentage of total investments as of 10/31/22 (%) | | | |
| |
AAA | | | 9.3 | |
| |
AA | | | 9.8 | |
| |
A | | | 20.5 | |
| |
BBB | | | 32.2 | |
| |
BB | | | 11.3 | |
| |
B | | | 5.5 | |
| |
CCC | | | 0.8 | |
| |
Not Rated | | | -0.1 | |
| |
Cash/Cash Equivalents | | | 10.7 | |
| | |
| Total | | | 100.0 | |
Credit ratings reflect the highest rating assigned by a nationally recognized statistical rating organization (NRSRO) such as Moody’s Investors Service, Inc. (Moody’s), S&P Global Ratings (S&P), or Fitch, Inc. (Fitch). Credit ratings reflect the common nomenclature used by both S&P and Fitch. Where applicable, ratings are converted to the comparable S&P/Fitch rating tier nomenclature. These rating agencies are independent and are widely used. The Not Rated category consists of securities that have not been rated by an NRSRO. Credit ratings are subject to change.
| | | | | | |
| | | |
| Distributions and Yields as of 10/31/22 | | | | | | |
| | | |
| | | Total Distributions
Paid for One Year ($) | | SEC 30-Day
Subsidized
Yield* (%) | | SEC 30-Day
Unsubsidized
Yield** (%) |
| | | |
Class A | | 0.47 | | 5.60 | | 5.51 |
| | | |
Class C | | 0.40 | | 5.05 | | -19.96 |
| | | |
Class Z | | 0.50 | | 6.15 | | 8.76 |
| | | |
Class R6 | | 0.50 | | 6.21 | | 5.51 |
*SEC 30-Day Subsidized Yield (%)—A standardized yield calculation created by the Securities and Exchange Commission, it reflects the income earned during a 30-day period, after the deduction of the Fund’s net expenses (net of any expense waivers or reimbursements). The investor experience is represented by the SEC 30-Day Subsidized Yield.
**SEC 30-Day Unsubsidized Yield (%)—A standardized yield calculation created by the Securities and Exchange Commission, it reflects the income earned during a 30-day period, after the deduction of the Fund’s gross expenses. The investor experience is represented by the SEC 30-Day Subsidized Yield.
PGIM International Bond Fund 7
Strategy and Performance Overview*
(unaudited)
How did the Fund perform?
The PGIM International Bond Fund’s Class Z shares returned -19.12% in the 12-month reporting period that ended October 31, 2022, underperforming the -9.02% return of the Bloomberg Global Aggregate ex-USD (USD Hedged) Index (the Index).
What were the market conditions?
| ● | From a starting point of low yields, tight spreads, and high equity multiples, the shift in fundamentals—most notably, high inflation—drove a wholesale repricing of markets during the reporting period. Concerns about central bank tightening, hard economic landings, and the war in Ukraine led global credit spreads to be notably wider, while rate volatility increased as markets first began pricing in more aggressive Federal Open Market Committee policy tightening and then later began to price in a hard economic landing. |
| ● | Against the backdrop of historic lows in unemployment and generational highs in inflation, central banks signaled an increased willingness to accept more economic and market pain than they had been over the prior decade of low inflation. A succession of federal funds rate hikes—including outsized 75 basis-point (bp) hikes in June, July, and September—confirmed to markets that the Federal Reserve (the Fed) is fully focused on tackling inflation. (One basis point equals 0.01%.) |
| ● | At the August Jackson Hole symposium, Fed Chairman Jerome Powell’s speech was successful in lifting rate-hike expectations for 2022 and removing market pricing for rate cuts in 2023. While long-run inflation expectations remain relatively subdued at this point, Powell expressed the need to exercise vigilance about the trajectory of market expectations to avoid a self-fulfilling inflation spiral. Underpinning this escalation in rhetoric was the reality that Fed officials don’t know how high they will ultimately take the federal funds rate in order to tame inflation. |
| ● | As a result, enormous volatility continued to be priced into US Treasuries, with sharply higher front-end rates and lower long-dated yields forming a substantially flatter US Treasury yield curve before the curve finally inverted during the last three months of the period. The 10-year/2-year Treasury spread declined from 1.10% on October 31, 2021 to -0.44% by the end of the period. |
| ● | Beginning the period at 1.55%, US 10-year Treasury yields ended the period at 4.05%. Meanwhile, the yield on the 2-year Treasury note ended the period at 4.49%, a rise of 404 bps since the beginning of the period. |
| ● | In Europe, German 10-year bond yields rose to end the period at 2.43% as the European Central Bank (ECB) raised rates amid mounting inflationary pressures driven by demand and supply-chain bottlenecks. Similarly, UK 10-year bond yields rose over the period to end it at 3.51% as the Bank of England raised rates in order to bring inflation under control. |
| ● | US investment-grade corporate spreads widened significantly as corporates were challenged by elevated inflationary pressures, a slower growth outlook, and higher event and geopolitical risk. US high yield bonds posted significant declines through |
8 Visit our website at pgim.com/investments
| | much of 2022 as rate-hike concerns, high and persistent inflation, and recession fears overshadowed the strength of earnings and credit fundamentals. Securitized credit spreads widened, with collateralized loan obligation (CLO) and commercial mortgage-backed securities (CMBS) spreads trading well above their recent tights by the end of the period. The emerging markets sector posted negative total returns, and spreads widened as markets were pressured by tightening financial conditions and slowing growth in China and Europe. Meanwhile, agency mortgage-backed securities (MBS) underperformed Treasuries on concerns that the Fed may begin selling MBS if officials need to step up their inflation fight. |
What worked?
| ● | The Fund’s yield curve positioning, in both developed market and emerging market rates, contributed to performance during the reporting period. |
| ● | While overall security selection detracted from performance, selection in developed market investment-grade corporate bonds, emerging market Treasuries, and emerging market derivatives linked to the London Interbank Offered Rate (LIBOR) contributed to performance over the period. |
| ● | While overall sector allocation detracted, underweights relative to the Index to developed market agency securities, developed market investment-grade corporate bonds, and developed market covered bonds contributed. |
| ● | Within credit, positioning in the other financials, banking, and chemicals sectors contributed. |
| ● | In individual security selection, the Fund benefited from positioning in Mexico, Saudi Arabia, and the Republic of Croatia. |
What didn’t work?
| ● | During the period, the Fund’s long duration bias detracted from returns. (Duration measures the sensitivity of the price—the value of principal—of a bond to a change in interest rates.) |
| ● | Within security selection, positions in emerging markets sovereign debt, emerging markets agency securities, developed markets Treasuries, and developed markets high yield bonds detracted the most. |
| ● | Within sector allocation, overweights relative to the Index to emerging markets sovereign debt, developed markets CMBS, and developed markets sovereign debt detracted from performance. |
| ● | Within credit, positioning in foreign non-corporate bonds as well as the paper & packaging and consumer non-cyclicals sectors detracted from performance. |
| ● | In individual security selection, overweights relative to the Index to the Republic of Ukraine, the Russian Federation, and the Republic of Greece detracted from performance. |
PGIM International Bond Fund 9
Strategy and Performance Overview* (continued)
Did the Fund use derivatives?
The Fund uses derivatives when they facilitate implementation of the overall investment approach. During the reporting period, the Fund held positions in Russia combined with the use of derivatives designed to offset the decline in value of certain Russian securities. The Fund also used interest rate futures, options, and swaps during the period to help manage duration positioning and yield curve exposure. The use of futures and swaps detracted from performance, while the use of options contributed. Credit default swaps and credit default swap index (CDX) positions were used to either add risk exposure to certain issuers or to hedge credit risk imposed by certain issuers. Overall, credit derivative exposure contributed during the period. In addition, the Fund traded foreign-exchange derivatives, which had a negligible impact on performance over the period.
Current outlook
| ● | PGIM Fixed Income maintains that it will likely take another quarter to see a material downtrend in the key categories of services inflation. Such relief would come from a combination of a slowdown in labor demand, in line with other slowing measures of aggregate demand, and incremental gains in labor supply as workers with lower balances of savings are drawn back into the workforce. |
| ● | Based on its review of inflation and other macroeconomic data, PGIM Fixed Income believes the Fed is unlikely to soon stop raising rates and, as a result, recently raised its terminal rate projection to 4.75% by January—assuming 50-bp and 25-bp rate hikes in December and January, respectively. This would likely be followed by precautionary rate cuts by the end of the second quarter of 2023, as the downturn takes hold amid a negative fiscal impulse, mounting external shocks, and tighter financial conditions. |
| ● | In Europe, PGIM Fixed Income expects rates to rise by 50 bps when the ECB meets in December, taking the deposit facility rate to 2% before pausing through the winter period and, ultimately, peaking at less than 3%. However, if inflation continues surprising to the upside, particularly if nominal wages or inflation expectations start to inch above levels consistent with the 2% inflation target, then such a dovish shift could prove premature. In that case, PGIM Fixed Income would expect sequential rate hikes to continue, with rates peaking above 3%. |
| ● | Beyond the progression of events over the next few quarters or years, PGIM Fixed Income expects economic conditions to eventually return to a configuration more like pre-COVID-19 conditions, as an aging demographic and high debt burdens are likely to drive a return to moderate growth and inflation, which may lead to a lower interest rate environment. |
| ● | PGIM Fixed Income maintains its positive view of spread sectors over the medium to long term and holds allocations to structured products (CLOs, CMBS), investment-grade corporate bonds, high yield bonds, and emerging markets. |
10 Visit our website at pgim.com/investments
| ● | In terms of calling the peak in long-term rates, given the economic strength and level of inflation, PGIM Fixed income believes it’s too early to preclude the possibility of higher highs. Yet, from a long-term perspective, exposure to developed market duration is becoming more compelling after the broad repricing and with the looming moderation in global growth. While acknowledging the immediate trajectory of inflation is going to dictate market volatility and the path of the US Treasury 10-year yield, PGIM Fixed Income’s base case is that implied volatility will ultimately decline, and the 10-year yield will stay below the terminal rate of this interest rate hiking cycle when it is eventually reached. In the meantime, the best course will be to focus on the micro-alpha opportunities within and across sectors, in PGIM Fixed Income’s view. |
*This strategy and performance overview, which discusses what strategies or holdings (including derivatives, if applicable) affected the Fund’s performance, is compiled based on how the Fund performed relative to the Fund’s benchmark index and is viewed for performance attribution purposes at the aggregate Fund level, which in most instances will not directly correlate to the amounts disclosed in the Statement of Operations which conform to US generally accepted accounting principles.
PGIM International Bond Fund 11
Fees and Expenses (unaudited)
As a shareholder of the Fund, you incur two types of costs: (1) transaction costs, including sales charges (loads) on purchase payments and redemptions, as applicable, and (2) ongoing costs, including management fees, distribution and/or service (12b-1) fees, and other Fund expenses, as applicable. This example is intended to help you understand your ongoing costs (in dollars) of investing in the Fund and to compare these costs with the ongoing costs of investing in other mutual funds.
The example is based on an investment of $1,000 held through the six-month period ended October 31, 2022. The example is for illustrative purposes only; you should consult the Prospectus for information on initial and subsequent minimum investment requirements.
Actual Expenses
The first line for each share class in the table on the following page provides information about actual account values and actual expenses. You may use the information on this line, together with the amount you invested, to estimate the expenses that you paid over the period. Simply divide your account value by $1,000 (for example, an $8,600 account value ÷ $1,000 = 8.6), then multiply the result by the number on the first line under the heading “Expenses Paid During the Six-Month Period” to estimate the expenses you paid on your account during this period.
Hypothetical Example for Comparison Purposes
The second line for each share class in the table on the following page provides information about hypothetical account values and hypothetical expenses based on the Fund’s actual expense ratio and an assumed rate of return of 5% per year before expenses, which is not the Fund’s actual return. The hypothetical account values and expenses may not be used to estimate the actual ending account balance or expenses you paid for the period. You may use this information to compare the ongoing costs of investing in the Fund and other funds. To do so, compare this 5% hypothetical example with the 5% hypothetical examples that appear in the shareholder reports of the other funds.
The Fund’s transfer agent may charge additional fees to holders of certain accounts that are not included in the expenses shown in the table on the following page. These fees apply to individual retirement accounts (IRAs) and Section 403(b) accounts. As of the close of the six-month period covered by the table, IRA fees included an annual maintenance fee of $15 per account (subject to a maximum annual maintenance fee of $25 for all accounts held by the same shareholder). Section 403(b) accounts are charged an annual $25 fiduciary maintenance fee. Some of the fees may vary in amount, or may be waived, based on your total account balance or the number of PGIM funds, including the Fund, that you own. You should consider the additional fees that were charged to your Fund account over the six-month period when you estimate the total ongoing expenses paid over the period and the impact of these fees on your ending account value, as these additional expenses are not reflected in the information
12 Visit our website at pgim.com/investments
provided in the expense table. Additional fees have the effect of reducing investment returns.
Please note that the expenses shown in the table are meant to highlight your ongoing costs only and do not reflect any transactional costs such as sales charges (loads). Therefore, the second line for each share class in the table is useful in comparing ongoing costs only and will not help you determine the relative total costs of owning different funds. In addition, if these transactional costs were included, your costs would have been higher.
| | | | | | | | | | |
| | | | | |
| PGIM International Bond Fund | | Beginning Account Value May 1, 2022 | | Ending Account Value October 31, 2022 | | Annualized Expense Ratio Based on the Six-Month Period | | Expenses Paid During the Six-Month Period* |
| | | | | |
Class A | | Actual | | $ 1,000.00 | | $ 934.00 | | 0.99% | | $ 4.83 |
| | | | | |
| | Hypothetical | | $ 1,000.00 | | $ 1,020.21 | | 0.99% | | $ 5.04 |
| | | | | |
Class C | | Actual | | $ 1,000.00 | | $ 930.40 | | 1.74% | | $ 8.47 |
| | | | | |
| | Hypothetical | | $ 1,000.00 | | $ 1,016.43 | | 1.74% | | $ 8.84 |
| | | | | |
Class Z | | Actual | | $ 1,000.00 | | $ 936.90 | | 0.63% | | $ 3.08 |
| | | | | |
| | Hypothetical | | $ 1,000.00 | | $ 1,022.03 | | 0.63% | | $ 3.21 |
| | | | | |
Class R6 | | Actual | | $ 1,000.00 | | $ 936.00 | | 0.58% | | $ 2.83 |
| | | | | |
| | | Hypothetical | | $ 1,000.00 | | $ 1,022.28 | | 0.58% | | $ 2.96 |
*Fund expenses (net of fee waivers or subsidies, if any) for each share class are equal to the annualized expense ratio for each share class (provided in the table), multiplied by the average account value over the period, multiplied by the 184 days in the six-month period ended October 31, 2022, and divided by the 365 days in the Fund’s fiscal year ended October 31, 2022 (to reflect the six-month period). Expenses presented in the table include the expenses of any underlying portfolios in which the Fund may invest.
PGIM International Bond Fund 13
Schedule of Investments
as of October 31, 2022
| | | | | | | | | | | | | | | | |
| | | | |
| Description | | Interest
Rate | | | Maturity
Date | | | Principal Amount (000)# | | | Value | |
| | | | |
LONG-TERM INVESTMENTS 93.1% | | | | | | | | | | | | | | | | |
| | | | |
ASSET-BACKED SECURITIES 4.2% | | | | | | | | | | | | | | | | |
| | | | |
Cayman Islands 2.7% | | | | | | | | | | | | | | | | |
| | | | |
HPS Loan Management Ltd., | | | | | | | | | | | | | | | | |
Series 10A-16, Class A1RR, 144A, 3 Month LIBOR + 1.140% (Cap N/A, Floor 1.140%) | | | 5.383%(c) | | | | 04/20/34 | | | | 500 | | | $ | 477,572 | |
Mountain View CLO Ltd., | | | | | | | | | | | | | | | | |
Series 2019-01A, Class A1R, 144A, 3 Month LIBOR + 1.250% (Cap N/A, Floor 1.250%) | | | 5.329(c) | | | | 10/15/34 | | | | 250 | | | | 240,829 | |
| | | | | | | | | | | | | | | | |
| | | | |
| | | | | | | | | | | | | | | 718,401 | |
| | | | |
United States 1.5% | | | | | | | | | | | | | | | | |
| | | | |
Oportun Funding XIII LLC, | | | | | | | | | | | | | | | | |
Series 2019-A, Class B, 144A | | | 3.870 | | | | 08/08/25 | | | | 86 | | | | 82,893 | |
Silver Creek CLO Ltd., | | | | | | | | | | | | | | | | |
Series 2014-01A,Class AR, 144A, 3 Month LIBOR + 1.240% (Cap N/A, Floor 0.000%) | | | 5.483(c) | | | | 07/20/30 | | | | 197 | | | | 194,516 | |
TH MSR Issuer Trust, | | | | | | | | | | | | | | | | |
Series 2019-FT01, Class A, 144A, 1 Month LIBOR + 2.800% (Cap N/A, Floor 2.800%) | | | 6.386(c) | | | | 06/25/24 | | | | 150 | | | | 139,347 | |
| | | | | | | | | | | | | | | | |
| | | | |
| | | | | | | | | | | | | | | 416,756 | |
| | | | | | | | | | | | | | | | |
| | | | |
TOTAL ASSET-BACKED SECURITIES
(cost $1,183,244) | | | | | | | | | | | | | | | 1,135,157 | |
| | | | | | | | | | | | | | | | |
| | | | |
COMMERCIAL MORTGAGE-BACKED SECURITIES 7.2% | | | | | | | | | | | | | | | | |
| | | | |
Canada 0.1% | | | | | | | | | | | | | | | | |
| | | | |
Real Estate Asset Liquidity Trust, | | | | | | | | | | | | | | | | |
Series 2020-01A, Class A1, 144A | | | 2.381(cc) | | | | 02/12/55 | | | CAD | 22 | | | | 14,756 | |
| | | | | | | | | | | | | | | | |
| | | | |
United Kingdom 1.9% | | | | | | | | | | | | | | | | |
| | | | |
Salus European Loan Conduit DAC, | | | | | | | | | | | | | | | | |
Series 33A, Class A, 144A, SONIA + 1.619% (Cap 6.500%, Floor 1.500%) | | | 3.809(c) | | | | 01/23/29 | | | GBP | 200 | | | | 228,080 | |
| | | | |
Taurus DAC, | | | | | | | | | | | | | | | | |
Series 2021-UK4A, Class B, 144A, SONIA + 1.500% (Cap N/A, Floor 1.500%) | | | 3.459(c) | | | | 08/17/31 | | | GBP | 95 | | | | 102,628 | |
See Notes to Financial Statements.
PGIM International Bond Fund 15
Schedule of Investments (continued)
as of October 31, 2022
| | | | | | | | | | | | | | | | |
| | | | |
| Description | | Interest
Rate | | | Maturity
Date | | | Principal Amount (000)# | | | Value | |
| | | | |
COMMERCIAL MORTGAGE-BACKED SECURITIES (Continued) | | | | | | | | | | | | | | | | |
| | | | |
United Kingdom (cont’d.) | | | | | | | | | | | | | | | | |
| | | | |
Taurus DAC, (cont’d.) | | | | | | | | | | | | | | | | |
Series 2021-UK4A, Class C, 144A, SONIA + 1.750% (Cap N/A, Floor 1.750%) | | | 3.709%(c) | | | | 08/17/31 | | | GBP | 96 | | | $ | 99,500 | |
Series 2021-UK4A, Class D, 144A, SONIA + 2.100% (Cap N/A, Floor 2.100%) | | | 4.059(c) | | | | 08/17/31 | | | GBP | 95 | | | | 95,904 | |
| | | | | | | | | | | | | | | | |
| | | | |
| | | | | | | | | | | | | | | 526,112 | |
| | | | |
United States 5.2% | | | | | | | | | | | | | | | | |
| | | | |
BX Commercial Mortgage Trust, | | | | | | | | | | | | | | | | |
Series 2019-XL, Class J, 144A, 1 Month LIBOR + 2.650% (Cap N/A, Floor 2.650%) | | | 6.062(c) | | | | 10/15/36 | | | | 255 | | | | 243,671 | |
Cold Storage Trust, | | | | | | | | | | | | | | | | |
Series 2020-ICE05, Class E, 144A, 1 Month LIBOR + 2.766% (Cap N/A, Floor 2.833%) | | | 6.178(c) | | | | 11/15/37 | | | | 98 | | | | 93,367 | |
FHLMC Multifamily Structured Pass-Through Certificates, | | | | | | | | | | | | | | | | |
Series K111, Class X1, IO | | | 1.572(cc) | | | | 05/25/30 | | | | 398 | | | | 35,534 | |
Series K113, Class X1, IO | | | 1.380(cc) | | | | 06/25/30 | | | | 1,150 | | | | 91,683 | |
Series KG03, Class X1, IO | | | 1.380(cc) | | | | 06/25/30 | | | | 1,288 | | | | 100,356 | |
MKT Mortgage Trust, | | | | | | | | | | | | | | | | |
Series 2020-525M, Class F, 144A | | | 2.941(cc) | | | | 02/12/40 | | | | 250 | | | | 141,270 | |
Morgan Stanley Capital I Trust, | | | | | | | | | | | | | | | | |
Series 2019-MEAD, Class E, 144A | | | 3.177(cc) | | | | 11/10/36 | | | | 300 | | | | 247,119 | |
One New York Plaza Trust, | | | | | | | | | | | | | | | | |
Series 2020-01NYP, Class C, 144A, 1 Month LIBOR + 2.200% (Cap N/A, Floor 2.200%) | | | 5.612(c) | | | | 01/15/36 | | | | 100 | | | | 93,501 | |
Series 2020-01NYP, Class D, 144A, 1 Month LIBOR + 2.750% (Cap N/A, Floor 2.750%) | | | 6.162(c) | | | | 01/15/36 | | | | 100 | | | | 93,315 | |
Wells Fargo Commercial Mortgage Trust, | | | | | | | | | | | | | | | | |
Series 2021-FCMT, Class C, 144A, 1 Month LIBOR + 2.400% (Cap N/A, Floor 2.400%) | | | 5.812(c) | | | | 05/15/31 | | | | 100 | | | | 93,219 | |
Series 2021-FCMT, Class E, 144A, 1 Month LIBOR + 4.500% (Cap N/A, Floor 4.500%) | | | 7.912(c) | | | | 05/15/31 | | | | 200 | | | | 183,861 | |
| | | | | | | | | | | | | | | | |
| | | | |
| | | | | | | | | | | | | | | 1,416,896 | |
| | | | | | | | | | | | | | | | |
| | | | |
TOTAL COMMERCIAL MORTGAGE-BACKED SECURITIES
(cost $2,290,731) | | | | | | | | | | | | | | | 1,957,764 | |
| | | | | | | | | | | | | | | | |
See Notes to Financial Statements.
16
| | | | | | | | | | | | |
| | | | |
| Description | | Interest
Rate | | Maturity
Date | | Principal Amount (000)# | | | Value | |
| | | | |
CORPORATE BONDS 26.7% | | | | | | | | | | | | |
| | | | |
Australia 0.3% | | | | | | | | | | | | |
| | | | |
Transurban Finance Co. Pty Ltd., | | | | | | | | | | | | |
Sr. Sec’d. Notes, EMTN | | 2.000% | | 08/28/25 | | EUR | 100 | | | $ | 93,859 | |
| | | | |
Belgium 0.2% | | | | | | | | | | | | |
| | | | |
Anheuser-Busch Cos. LLC/Anheuser-Busch InBev Worldwide, Inc., | | | | | | | | | | | | |
Gtd. Notes | | 4.900 | | 02/01/46 | | | 60 | | | | 52,053 | |
| | | | |
Brazil 0.3% | | | | | | | | | | | | |
| | | | |
Petrobras Global Finance BV, | | | | | | | | | | | | |
Gtd. Notes | | 6.625 | | 01/16/34 | | GBP | 100 | | | | 95,779 | |
| | | | |
Bulgaria 0.3% | | | | | | | | | | | | |
| | | | |
Bulgarian Energy Holding EAD, | | | | | | | | | | | | |
Sr. Unsec’d. Notes | | 2.450 | | 07/22/28 | | EUR | 100 | | | | 70,895 | |
| | | | |
China 1.3% | | | | | | | | | | | | |
| | | | |
Agricultural Development Bank of China, | | | | | | | | | | | | |
Sr. Unsec’d. Notes | | 3.800 | | 10/27/30 | | CNH | 2,000 | | | | 281,702 | |
Aircraft Finance Co. Ltd., | | | | | | | | | | | | |
Sr. Sec’d. Notes, Series B | | 4.100 | | 03/29/26 | | | 62 | | | | 61,182 | |
| | | | | | | | | | | | |
| | | | |
| | | | | | | | | | | 342,884 | |
| | | | |
France 2.1% | | | | | | | | | | | | |
| | | | |
Altice France SA, | | | | | | | | | | | | |
Sr. Sec’d. Notes | | 3.375 | | 01/15/28 | | EUR | 100 | | | | 75,691 | |
Sr. Sec’d. Notes, 144A | | 2.500 | | 01/15/25 | | EUR | 100 | | | | 87,633 | |
Sr. Sec’d. Notes, 144A | | 3.375 | | 01/15/28 | | EUR | 100 | | | | 75,691 | |
Iliad Holding SASU, | | | | | | | | | | | | |
Sr. Sec’d. Notes, 144A | | 5.125 | | 10/15/26 | | EUR | 100 | | | | 91,809 | |
La Poste SA, | | | | | | | | | | | | |
Sr. Unsec’d. Notes, EMTN | | 1.375 | | 04/21/32 | | EUR | 100 | | | | 80,920 | |
SNCF Reseau, | | | | | | | | | | | | |
Sr. Unsec’d. Notes, Series MPLE | | 4.700 | | 06/01/35 | | CAD | 100 | | | | 75,101 | |
Verallia SA, | | | | | | | | | | | | |
Gtd. Notes | | 1.625 | | 05/14/28 | | EUR | 100 | | | | 81,704 | |
| | | | | | | | | | | | |
| | | | |
| | | | | | | | | | | 568,549 | |
See Notes to Financial Statements.
PGIM International Bond Fund 17
Schedule of Investments (continued)
as of October 31, 2022
| | | | | | | | | | | | | | | | |
| | | | |
| Description | | Interest
Rate | | | Maturity
Date | | | Principal Amount (000)# | | | Value | |
| | | | |
CORPORATE BONDS (Continued) | | | | | | | | | | | | | | | | |
| | | | |
Germany 2.2% | | | | | | | | | | | | | | | | |
| | | | |
Allianz SE, | | | | | | | | | | | | | | | | |
Jr. Sub. Notes | | | 3.375%(ff) | | | | 09/18/24(oo) | | | EUR | 200 | | | $ | 190,928 | |
Techem Verwaltungsgesellschaft 674 mbH, | | | | | | | | | | | | | | | | |
Sr. Sec’d. Notes | | | 6.000 | | | | 07/30/26 | | | EUR | 88 | | | | 80,880 | |
TK Elevator Midco GmbH, | | | | | | | | | | | | | | | | |
Sr. Sec’d. Notes, 144A | | | 4.375 | | | | 07/15/27 | | | EUR | 100 | | | | 83,619 | |
Volkswagen International Finance NV, | | | | | | | | | | | | | | | | |
Gtd. Notes | | | 2.700(ff) | | | | 12/14/22(oo) | | | EUR | 100 | | | | 98,460 | |
Gtd. Notes | | | 4.625(ff) | | | | 03/24/26(oo) | | | EUR | 150 | | | | 140,378 | |
| | | | | | | | | | | | | | | | |
| | | | |
| | | | | | | | | | | | | | | 594,265 | |
| | | | |
Hong Kong 0.8% | | | | | | | | | | | | | | | | |
| | | | |
HKT Capital No. 3 Ltd., | | | | | | | | | | | | | | | | |
Gtd. Notes | | | 1.650 | | | | 04/10/27 | | | EUR | 100 | | | | 85,420 | |
Sun Hung Kai Properties Capital Market Ltd., | | | | | | | | | | | | | | | | |
Gtd. Notes, EMTN | | | 3.200 | | | | 08/14/27 | | | CNH | 1,000 | | | | 129,971 | |
| | | | | | | | | | | | | | | | |
| | | | |
| | | | | | | | | | | | | | | 215,391 | |
| | | | |
Hungary 0.3% | | | | | | | | | | | | | | | | |
| | | | |
MFB Magyar Fejlesztesi Bank Zrt, | | | | | | | | | | | | | | | | |
Gov’t. Gtd. Notes | | | 1.375 | | | | 06/24/25 | | | EUR | 100 | | | | 89,363 | |
| | | | |
Iceland 0.3% | | | | | | | | | | | | | | | | |
| | | | |
Landsvirkjun, | | | | | | | | | | | | | | | | |
Gov’t. Gtd. Notes, EMTN, 3 Month EURIBOR + 0.090% | | | 1.592(c) | | | | 07/24/26 | | | EUR | 100 | | | | 97,078 | |
| | | | |
India 0.3% | | | | | | | | | | | | | | | | |
| | | | |
NTPC Ltd., | | | | | | | | | | | | | | | | |
Sr. Unsec’d. Notes, EMTN | | | 2.750 | | | | 02/01/27 | | | EUR | 100 | | | | 90,660 | |
| | | | |
Indonesia 0.2% | | | | | | | | | | | | | | | | |
| | | | |
Perusahaan Perseroan Persero PT Perusahaan | | | | | | | | | | | | | | | | |
Listrik Negara, | | | | | | | | | | | | | | | | |
Sr. Unsec’d. Notes, 144A | | | 1.875 | | | | 11/05/31 | | | EUR | 100 | | | | 69,072 | |
See Notes to Financial Statements.
18
| | | | | | | | | | | | |
| | | | |
| Description | | Interest
Rate | | Maturity Date | | Principal
Amount
(000)# | | | Value | |
| | | | |
CORPORATE BONDS (Continued) | | | | | | | | | | | | |
| | | | |
Italy 0.9% | | | | | | | | | | | | |
| | | | |
Assicurazioni Generali SpA, | | | | | | | | | | | | |
Sub. Notes, EMTN | | 5.500%(ff) | | 10/27/47 | | EUR | 100 | | | $ | 96,853 | |
Nexi SpA, | | | | | | | | | | | | |
Sr. Unsec’d. Notes | | 2.125 | | 04/30/29 | | EUR | 200 | | | | 157,275 | |
| | | | | | | | | | | | |
| | | | |
| | | | | | | | | | | 254,128 | |
| | | | |
Kazakhstan 0.2% | | | | | | | | | | | | |
| | | | |
Kazakhstan Temir Zholy National Co. JSC, | | | | | | | | | | | | |
Gtd. Notes | | 3.250 | | 12/05/23 | | CHF | 50 | | | | 43,591 | |
| | | | |
Luxembourg 1.1% | | | | | | | | | | | | |
| | | | |
ARD Finance SA, | | | | | | | | | | | | |
Sr. Sec’d. Notes, Cash coupon 5.000% or PIK 5.750% | | 5.000 | | 06/30/27 | | EUR | 100 | | | | 67,067 | |
Sr. Sec’d. Notes, 144A, Cash coupon 5.000% or PIK 5.750% | | 5.000 | | 06/30/27 | | EUR | 100 | | | | 67,067 | |
Matterhorn Telecom SA, | | | | | | | | | | | | |
Sr. Sec’d. Notes | | 3.125 | | 09/15/26 | | EUR | 200 | | | | 173,160 | |
| | | | | | | | | | | | |
| | | | |
| | | | | | | | | | | 307,294 | |
| | | | |
Mexico 1.2% | | | | | | | | | | | | |
| | | | |
Petroleos Mexicanos, | | | | | | | | | | | | |
Gtd. Notes | | 3.625 | | 11/24/25 | | EUR | 200 | | | | 170,078 | |
Gtd. Notes, EMTN | | 4.875 | | 02/21/28 | | EUR | 200 | | | | 152,536 | |
| | | | | | | | | | | | |
| | | | |
| | | | | | | | | | | 322,614 | |
| | | | |
Netherlands 1.8% | | | | | | | | | | | | |
| | | | |
Cooperatieve Rabobank UA, | | | | | | | | | | | | |
Sr. Unsec’d. Notes, GMTN | | 3.500 | | 12/14/26 | | AUD | 100 | | | | 59,127 | |
OCI NV, | | | | | | | | | | | | |
Sr. Sec’d. Notes | | 3.625 | | 10/15/25 | | EUR | 135 | | | | 130,050 | |
United Group BV, | | | | | | | | | | | | |
Sr. Sec’d. Notes, 144A | | 3.125 | | 02/15/26 | | EUR | 200 | | | | 153,356 | |
Ziggo Bond Co. BV, | | | | | | | | | | | | |
Gtd. Notes, 144A | | 3.375 | | 02/28/30 | | EUR | 200 | | | | 145,027 | |
| | | | | | | | | | | | |
| | | | |
| | | | | | | | | | | 487,560 | |
See Notes to Financial Statements.
PGIM International Bond Fund 19
Schedule of Investments (continued)
as of October 31, 2022
| | | | | | | | | | | | | | |
| | | | |
| Description | | Interest
Rate | | Maturity Date | | | Principal
Amount
(000)# | | | Value | |
| | | | |
CORPORATE BONDS (Continued) | | | | | | | | | | | | | | |
| | | | |
Peru 0.3% | | | | | | | | | | | | | | |
| | | | |
Peru Enhanced Pass-Through Finance Ltd., | | | | | | | | | | | | | | |
Pass-Through Certificates | | 1.963%(s) | | | 06/02/25 | | | | 75 | | | $ | 69,989 | |
| | | | |
Poland 0.8% | | | | | | | | | | | | | | |
| | | | |
Bank Gospodarstwa Krajowego, | | | | | | | | | | | | | | |
Gov’t. Gtd. Notes | | 1.625 | | | 04/30/28 | | | EUR | 250 | | | | 207,116 | |
| | | | |
Russia 0.8% | | | | | | | | | | | | | | |
| | | | |
Gazprom PJSC Via Gaz Capital SA, | | | | | | | | | | | | | | |
Sr. Unsec’d. Notes | | 1.450 | | | 03/06/23 | (d) | | CHF | 200 | | | | 109,852 | |
Sr. Unsec’d. Notes | | 2.500 | | | 03/21/26 | (d) | | EUR | 200 | | | | 108,707 | |
| | | | | | | | | | | | | | |
| | | | |
| | | | | | | | | | | | | 218,559 | |
| | | | |
Spain 0.4% | | | | | | | | | | | | | | |
| | | | |
Cellnex Finance Co. SA, | | | | | | | | | | | | | | |
Gtd. Notes, EMTN | | 2.000 | | | 02/15/33 | | | EUR | 100 | | | | 68,286 | |
Codere Finance 2 Luxembourg SA, | | | | | | | | | | | | | | |
Sr. Sec’d. Notes, 144A, Cash coupon 8.000% and PIK 3.000% (original cost $42,295; purchased 10/09/20 - 09/30/22)(f) | | 11.000 | | | 09/30/26 | (d) | | EUR | 36 | | | | 33,006 | |
| | | | | | | | | | | | | | |
| | | | |
| | | | | | | | | | | | | 101,292 | |
| | | | |
Supranational Bank 0.4% | | | | | | | | | | | | | | |
| | | | |
European Bank for Reconstruction & Development, | | | | | | | | | | | | | | |
Sr. Unsec’d. Notes, GMTN | | 6.450 | | | 12/13/22 | | | IDR | 408,000 | | | | 26,147 | |
European Investment Bank, | | | | | | | | | | | | | | |
Sr. Unsec’d. Notes, 144A, EMTN | | 5.400 | | | 01/05/45 | | | CAD | 100 | | | | 83,454 | |
| | | | | | | | | | | | | | |
| | | | |
| | | | | | | | | | | | | 109,601 | |
| | | | |
United Arab Emirates 1.0% | | | | | | | | | | | | | | |
| | | | |
Abu Dhabi National Energy Co. PJSC, | | | | | | | | | | | | | | |
Sr. Unsec’d. Notes, GMTN | | 2.750 | | | 05/02/24 | | | EUR | 100 | | | | 98,825 | |
DP World Ltd., | | | | | | | | | | | | | | |
Sr. Unsec’d. Notes | | 4.250 | | | 09/25/30 | | | GBP | 100 | | | | 105,384 | |
Emirates NBD Bank PJSC, | | | | | | | | | | | | | | |
Sr. Unsec’d. Notes, MTN | | 4.750 | | | 02/09/28 | | | AUD | 100 | | | | 62,438 | |
| | | | | | | | | | | | | | |
| | | | |
| | | | | | | | | | | | | 266,647 | |
See Notes to Financial Statements.
20
| | | | | | | | | | | | | | |
| | | | |
| Description | | Interest
Rate | | Maturity
Date | | | Principal Amount (000)# | | | Value | |
| | | | |
CORPORATE BONDS (Continued) | | | | | | | | | | | | | | |
| | | | |
United Kingdom 4.2% | | | | | | | | | | | | | | |
| | | | |
Barclays PLC, | | | | | | | | | | | | | | |
Sub. Notes, EMTN | | 2.000%(ff) | | | 02/07/28 | | | EUR | 100 | | | $ | 97,086 | |
Bellis Acquisition Co. PLC, | | | | | | | | | | | | | | |
Sr. Sec’d. Notes, 144A | | 3.250 | | | 02/16/26 | | | GBP | 100 | | | | 93,154 | |
Bellis Finco PLC, | | | | | | | | | | | | | | |
Sr. Unsec’d. Notes, 144A | | 4.000 | | | 02/16/27 | | | GBP | 100 | | | | 79,650 | |
eG Global Finance PLC, | | | | | | | | | | | | | | |
Sr. Sec’d. Notes | | 6.250 | | | 10/30/25 | | | EUR | 100 | | | | 85,164 | |
Sr. Sec’d. Notes, 144A | | 6.250 | | | 10/30/25 | | | EUR | 100 | | | | 85,000 | |
HSBC Holdings PLC, | | | | | | | | | | | | | | |
Sr. Unsec’d. Notes, EMTN | | 3.350(ff) | | | 02/16/24 | | | AUD | 200 | | | | 127,490 | |
InterContinental Hotels Group PLC, | | | | | | | | | | | | | | |
Gtd. Notes, EMTN | | 1.625 | | | 10/08/24 | | | EUR | 200 | | | | 187,083 | |
Market Bidco Finco PLC, | | | | | | | | | | | | | | |
Sr. Sec’d. Notes, 144A | | 5.500 | | | 11/04/27 | | | GBP | 100 | | | | 86,732 | |
Pinewood Finance Co. Ltd., | | | | | | | | | | | | | | |
Sr. Sec’d. Notes, 144A | | 3.250 | | | 09/30/25 | | | GBP | 100 | | | | 99,772 | |
Tesco PLC, | | | | | | | | | | | | | | |
Sr. Unsec’d. Notes, EMTN | | 5.000 | | | 03/24/23 | | | GBP | 80 | | | | 91,646 | |
Virgin Media Secured Finance PLC, | | | | | | | | | | | | | | |
Sr. Sec’d. Notes | | 5.000 | | | 04/15/27 | | | GBP | 100 | | | | 104,478 | |
| | | | | | | | | | | | | | |
| | | | |
| | | | | | | | | | | | | 1,137,255 | |
| | | | |
United States 5.0% | | | | | | | | | | | | | | |
| | | | |
American International Group, Inc., | | | | | | | | | | | | | | |
Sr. Unsec’d. Notes | | 1.875 | | | 06/21/27 | | | EUR | 100 | | | | 88,751 | |
American Medical Systems Europe BV, | | | | | | | | | | | | | | |
Gtd. Notes | | 1.625 | | | 03/08/31 | | | EUR | 100 | | | | 82,869 | |
Avantor Funding, Inc., | | | | | | | | | | | | | | |
Sr. Sec’d. Notes | | 2.625 | | | 11/01/25 | | | EUR | 150 | | | | 137,839 | |
Banff Merger Sub, Inc., | | | | | | | | | | | | | | |
Sr. Unsec’d. Notes | | 8.375 | | | 09/01/26 | | | EUR | 100 | | | | 90,720 | |
Broadcom, Inc., | | | | | | | | | | | | | | |
Gtd. Notes, 144A | | 3.500 | | | 02/15/41 | | | | 30 | | | | 20,022 | |
Goldman Sachs Group, Inc. (The), | | | | | | | | | | | | | | |
Sr. Unsec’d. Notes, EMTN, 6 Month EURIBOR +
0.000% (Cap 5.500%, Floor 0.000%) | | 0.774(c) | | | 08/12/25 | | | EUR | 100 | | | | 95,681 | |
JPMorgan Chase Bank, NA, | | | | | | | | | | | | | | |
Sr. Unsec’d. Notes | | 4.762(s) | | | 03/17/48 | | | ITL(jj) | 100,000 | | | | 10,856 | |
Medline Borrower LP, | | | | | | | | | | | | | | |
Sr. Sec’d. Notes, 144A | | 3.875 | | | 04/01/29 | | | | 25 | | | | 20,420 | |
See Notes to Financial Statements.
PGIM International Bond Fund 21
Schedule of Investments (continued)
as of October 31, 2022
| | | | | | | | | | | | |
| Description | | Interest Rate | | Maturity Date | | Principal Amount (000)# | | | Value | |
| | | | |
CORPORATE BONDS (Continued) | | | | | | | | | | | | |
| | | | |
United States (cont’d.) | | | | | | | | | | | | |
| | | | |
Morgan Guaranty Trust Co., | | | | | | | | | | | | |
Sr. Unsec’d. Notes | | 1.388%(s) | | 01/21/27 | | ITL(jj) | 50,000 | | | $ | 21,131 | |
Morgan Stanley, | | | | | | | | | | | | |
Sr. Unsec’d. Notes, GMTN | | 1.875 | | 03/06/30 | | EUR | 100 | | | | 81,492 | |
Sr. Unsec’d. Notes, GMTN | | 5.148(ff) | | 01/25/34 | | EUR | 100 | | | | 101,614 | |
MPT Operating Partnership LP/MPT Finance Corp., | | | | | | | | | | | | |
Gtd. Notes | | 3.375 | | 04/24/30 | | GBP | 150 | | | | 106,873 | |
Realty Income Corp., | | | | | | | | | | | | |
Sr. Unsec’d. Notes | | 2.200 | | 06/15/28 | | | 5 | | | | 4,146 | |
Sr. Unsec’d. Notes | | 2.850 | | 12/15/32 | | | 5 | | | | 3,912 | |
Spectrum Brands, Inc., | | | | | | | | | | | | |
Gtd. Notes | | 4.000 | | 10/01/26 | | EUR | 100 | | | | 83,221 | |
Stryker Corp., | | | | | | | | | | | | |
Sr. Unsec’d. Notes | | 2.625 | | 11/30/30 | | EUR | 100 | | | | 88,978 | |
UGI International LLC, | | | | | | | | | | | | |
Gtd. Notes, 144A | | 2.500 | | 12/01/29 | | EUR | 100 | | | | 72,934 | |
Verizon Communications, Inc., | | | | | | | | | | | | |
Sr. Unsec’d. Notes | | 1.250 | | 04/08/30 | | EUR | 100 | | | | 82,035 | |
Vistra Corp., | | | | | | | | | | | | |
Jr. Sub. Notes, 144A | | 7.000(ff) | | 12/15/26(oo) | | | 25 | | | | 22,218 | |
Jr. Sub. Notes, 144A | | 8.000(ff) | | 10/15/26(oo) | | | 50 | | | | 47,490 | |
Zimmer Biomet Holdings, Inc., | | | | | | | | | | | | |
Sr. Unsec’d. Notes | | 2.425 | | 12/13/26 | | EUR | 100 | | | | 92,251 | |
| | | | | | | | | | | | |
| | | | |
| | | | | | | | | | | 1,355,453 | |
| | | | | | | | | | | | |
| | | | |
TOTAL CORPORATE BONDS
(cost $9,715,264) | | | | | | | | | | | 7,260,947 | |
| | | | | | | | | | | | |
| | | | |
RESIDENTIAL MORTGAGE-BACKED SECURITIES 1.6% | | | | | | | | | | | | |
| | | | |
Spain 0.1% | | | | | | | | | | | | |
| | | | |
Retiro Mortgage Securities DAC, | | | | | | | | | | | | |
Series 01A, Class A1, 144A, 3 Month EURIBOR +
2.000% (Cap 5.000%, Floor 0.000%) | | 3.578(c) | | 07/30/75 | | EUR | 43 | | | | 41,863 | |
| | | | |
United States 1.5% | | | | | | | | | | | | |
| | | | |
Bellemeade Re Ltd., | | | | | | | | | | | | |
Series 2021-01A, Class M1A, 144A, 30 Day
Average SOFR + 1.750% (Cap N/A, Floor 1.750%) | | 4.747(c) | | 03/25/31 | | | 84 | | | | 84,125 | |
See Notes to Financial Statements.
22
| | | | | | | | | | | | |
| Description | | Interest Rate | | Maturity Date | | Principal Amount (000)# | | | Value | |
| | | |
RESIDENTIAL MORTGAGE-BACKED SECURITIES (Continued) | | | | | | | | | | |
| | | | |
United States (cont’d.) | | | | | | | | | | | | |
Connecticut Avenue Securities Trust, | | | | | | | | | | | | |
Series 2022-R04, Class 1B1, 144A, 30 Day Average SOFR + 5.250% (Cap N/A, Floor 0.000%) | | 8.247%(c) | | 03/25/42 | | | 10 | | | $ | 9,425 | |
FHLMC Structured Agency Credit Risk Debt Notes, | | | | | | | | | | | | |
Series 2020-HQA05, Class B1, 144A, 30 Day Average SOFR + 4.000% (Cap N/A, Floor 0.000%) | | 6.997(c) | | 11/25/50 | | | 10 | | | | 9,039 | |
Series 2020-HQA05, Class M2, 144A, 30 Day Average SOFR + 2.600% (Cap N/A, Floor 0.000%) | | 5.597(c) | | 11/25/50 | | | 37 | | | | 37,336 | |
FHLMC Structured Agency Credit Risk REMIC Trust, | | | | | | | | | | | | |
Series 2022-DNA03, Class M1B, 144A, 30 Day Average SOFR + 2.900% (Cap N/A, Floor 0.000%) | | 5.897(c) | | 04/25/42 | | | 30 | | | | 27,825 | |
Legacy Mortgage Asset Trust, | | | | | | | | | | | | |
Series 2020-GS01, Class A1, 144A | | 2.882 | | 10/25/59 | | | 69 | | | | 67,235 | |
PMT Credit Risk Transfer Trust, | | | | | | | | | | | | |
Series 2020-02R, Class A, 144A, 1 Month LIBOR
+ 3.815% (Cap N/A, Floor 3.815%) | | 7.411(c) | | 12/25/22 | | | 78 | | | | 76,475 | |
PNMAC GMSR Issuer Trust, | | | | | | | | | | | | |
Series 2018-GT02, Class A, 144A, 1 Month LIBOR
+ 2.650% (Cap N/A, Floor 0.000%) | | 6.236(c) | | 08/25/25 | | | 100 | | | | 97,965 | |
| | | | | | | | | | | | |
| | | | |
| | | | | | | | | | | 409,425 | |
| | | | | | | | | | | | |
| | | | |
TOTAL RESIDENTIAL MORTGAGE-BACKED SECURITIES
(cost $469,241) | | | | | | | | | | | 451,288 | |
| | | | | | | | | | | | |
| | | | |
SOVEREIGN BONDS 53.4% | | | | | | | | | | | | |
| | | | |
Belgium 1.5% | | | | | | | | | | | | |
| | | | |
Kingdom of Belgium Government Bond, | | | | | | | | | | | | |
Sr. Unsec’d. Notes, 144A, Series 73 | | 3.000 | | 06/22/34 | | EUR | 400 | | | | 399,262 | |
| | | | |
Brazil 1.5% | | | | | | | | | | | | |
| | | | |
Brazil Loan Trust 1, | | | | | | | | | | | | |
Gov’t. Gtd. Notes | | 5.477 | | 07/24/23 | | | 24 | | | | 24,004 | |
Brazil Minas SPE via State of Minas Gerais, | | | | | | | | | | | | |
Gov’t. Gtd. Notes | | 5.333 | | 02/15/28 | | | 390 | | | | 373,986 | |
| | | | | | | | | | | | |
| | | | |
| | | | | | | | | | | 397,990 | |
See Notes to Financial Statements.
PGIM International Bond Fund 23
Schedule of Investments (continued)
as of October 31, 2022
| | | | | | | | | | | | |
| Description | | Interest Rate | | Maturity Date | | Principal Amount (000)# | | | Value | |
| | | | |
SOVEREIGN BONDS (Continued) | | | | | | | | | | | | |
| | | | |
Bulgaria 0.3% | | | | | | | | | | | | |
| | | | |
Bulgaria Government International Bond, | | | | | | | | | | | | |
Sr. Unsec’d. Notes, GMTN | | 3.125% | | 03/26/35 | | EUR | 115 | | | $ | 90,088 | |
| | | | |
Canada 0.7% | | | | | | | | | | | | |
| | | | |
City of Toronto, | | | | | | | | | | | | |
Sr. Unsec’d. Notes | | 3.500 | | 06/02/36 | | CAD | 100 | | | | 65,535 | |
Province of Nova Scotia, | | | | | | | | | | | | |
Unsec’d. Notes | | 3.450 | | 06/01/45 | | CAD | 100 | | | | 62,280 | |
Province of Saskatchewan, | | | | | | | | | | | | |
Unsec’d. Notes | | 2.750 | | 12/02/46 | | CAD | 100 | | | | 55,028 | |
| | | | | | | | | | | | |
| | | | |
| | | | | | | | | | | 182,843 | |
| | | | |
China 4.2% | | | | | | | | | | | | |
| | | | |
China Government Bond, | | | | | | | | | | | | |
Sr. Unsec’d. Notes | | 3.900 | | 07/04/36 | | CNH | 1,000 | | | | 146,008 | |
Sr. Unsec’d. Notes | | 3.950 | | 06/29/43 | | CNH | 500 | | | | 72,629 | |
China Government International Bond, | | | | | | | | | | | | |
Sr. Unsec’d. Notes | | 0.250 | | 11/25/30 | | EUR | 100 | | | | 76,461 | |
Export-Import Bank of China (The), | | | | | | | | | | | | |
Sr. Unsec’d. Notes | | 4.400 | | 05/14/24 | | CNH | 6,000 | | | | 835,971 | |
| | | | | | | | | | | | |
| | | | |
| | | | | | | | | | | 1,131,069 | |
| | | | |
Colombia 2.0% | | | | | | | | | | | | |
| | | | |
Colombia Government International Bond, | | | | | | | | | | | | |
Sr. Unsec’d. Notes, EMTN | | 3.875 | | 03/22/26 | | EUR | 600 | | | | 534,693 | |
| | | | |
Croatia 0.7% | | | | | | | | | | | | |
| | | | |
Croatia Government International Bond, | | | | | | | | | | | | |
Sr. Unsec’d. Notes | | 2.700 | | 06/15/28 | | EUR | 200 | | | | 189,966 | |
| | | | |
Cyprus 2.0% | | | | | | | | | | | | |
| | | | |
Cyprus Government International Bond, | | | | | | | | | | | | |
Notes, EMTN | | 1.500 | | 04/16/27 | | EUR | 200 | | | | 182,925 | |
Sr. Unsec’d. Notes, EMTN | | 2.375 | | 09/25/28 | | EUR | 200 | | | | 182,035 | |
Sr. Unsec’d. Notes, EMTN | | 2.750 | | 02/26/34 | | EUR | 200 | | | | 172,734 | |
| | | | | | | | | | | | |
| | | | |
| | | | | | | | | | | 537,694 | |
See Notes to Financial Statements.
24
| | | | | | | | | | | | |
| Description | | Interest Rate | | Maturity Date | | Principal Amount (000)# | | | Value | |
| | | | |
SOVEREIGN BONDS (Continued) | | | | | | | | | | | | |
| | | | |
France 5.0% | | | | | | | | | | | | |
| | | | |
Caisse Francaise de Financement Local, | | | | | | | | | | | | |
Covered Bonds, EMTN | | 4.680% | | 03/09/29 | | CAD | 100 | | | $ | 74,240 | |
French Republic Government Bond OAT, | | | | | | | | | | | | |
Bonds(k) | | 0.000 | | 05/25/32 | | EUR | 1,145 | | | | 883,857 | |
Bonds | | 0.750 | | 02/25/28 | | EUR | 450 | | | | 409,559 | |
| | | | | | | | | | | | |
| | | | |
| | | | | | | | | | | 1,367,656 | |
| | | | |
Germany 3.3% | | | | | | | | | | | | |
| | | | |
Bundesobligation, | | | | | | | | | | | | |
Bonds, Series 181 | | 0.000 | | 04/11/25 | | EUR | 100 | | | | 94,345 | |
Bundesschatzanweisungen, | | | | | | | | | | | | |
Bonds(k) | | 0.200 | | 06/14/24 | | EUR | 835 | | | | 802,653 | |
| | | | | | | | | | | | |
| | | | |
| | | | | | | | | | | 896,998 | |
| | | | |
Greece 2.4% | | | | | | | | | | | | |
| | | | |
Hellenic Republic Government Bond, | | | | | | | | | | | | |
Sr. Unsec’d. Notes, 144A | | 1.875 | | 02/04/35 | | EUR | 744 | | | | 537,495 | |
Sr. Unsec’d. Notes, 144A | | 1.875 | | 01/24/52 | | EUR | 110 | | | | 60,327 | |
Hellenic Republic Government International Bond, | | | | | | | | | | | | |
Sr. Unsec’d. Notes | | 5.200 | | 07/17/34 | | EUR | 60 | | | | 58,791 | |
| | | | | | | | | | | | |
| | | | |
| | | | | | | | | | | 656,613 | |
| | | | |
Hong Kong 0.2% | | | | | | | | | | | | |
| | | | |
Hong Kong Government International Bond, | | | | | | | | | | | | |
Sr. Unsec’d. Notes, GMTN | | 1.000 | | 11/24/41 | | EUR | 100 | | | | 65,141 | |
| | | | |
Hungary 0.2% | | | | | | | | | | | | |
| | | | |
Hungary Government International Bond, | | | | | | | | | | | | |
Sr. Unsec’d. Notes | | 1.750 | | 06/05/35 | | EUR | 100 | | | | 60,425 | |
| | | | |
Indonesia 3.4% | | | | | | | | | | | | |
| | | | |
Indonesia Government International Bond, | | | | | | | | | | | | |
Sr. Unsec’d. Notes | | 0.900 | | 02/14/27 | | EUR | 100 | | | | 82,908 | |
Sr. Unsec’d. Notes | | 1.400 | | 10/30/31 | | EUR | 100 | | | | 71,574 | |
Sr. Unsec’d. Notes | | 1.450 | | 09/18/26 | | EUR | 300 | | | | 259,471 | |
Sr. Unsec’d. Notes | | 1.750 | | 04/24/25 | | EUR | 200 | | | | 184,901 | |
Sr. Unsec’d. Notes, EMTN | | 2.150 | | 07/18/24 | | EUR | 140 | | | | 133,236 | |
Sr. Unsec’d. Notes, EMTN | | 3.750 | | 06/14/28 | | EUR | 200 | | | | 183,790 | |
| | | | | | | | | | | | |
| | | | |
| | | | | | | | | | | 915,880 | |
See Notes to Financial Statements.
PGIM International Bond Fund 25
Schedule of Investments (continued)
as of October 31, 2022
| | | | | | | | | | | | | | | | |
| Description | | Interest Rate | | | Maturity Date | | | Principal Amount (000)# | | | Value | |
| | | | |
SOVEREIGN BONDS (Continued) | | | | | | | | | | | | | | | | |
| | | | |
Israel 0.6% | | | | | | | | | | | | | | | | |
| | | | |
Israel Government International Bond, | | | | | | | | | | | | | | | | |
Sr. Unsec’d. Notes, EMTN | | | 1.500% | | | | 01/16/29 | | | EUR | 200 | | | $ | 172,477 | |
| | | | |
Italy 6.7% | | | | | | | | | | | | | | | | |
| | | | |
Italy Buoni Poliennali Del Tesoro, | | | | | | | | | | | | | | | | |
Bonds, 144A | | | 2.800 | | | | 03/01/67 | | | EUR | 150 | | | | 103,246 | |
Sr. Unsec’d. Notes, 144A | | | 3.350 | | | | 03/01/35 | | | EUR | 250 | | | | 222,178 | |
Region of Lazio, | | | | | | | | | | | | | | | | |
Sr. Unsec’d. Notes | | | 3.088 | | | | 03/31/43 | | | EUR | 86 | | | | 73,196 | |
Repubic of Italy Government International Bond | | | | | | | | | | | | | | | | |
Coupon Strips, | | | | | | | | | | | | | | | | |
Sr. Unsec’d. Notes | | | 1.643(s) | | | | 02/20/31 | | | EUR | 134 | | | | 91,920 | |
Republic of Italy Government International Bond, | | | | | | | | | | | | | | | | |
Sr. Unsec’d. Notes | | | 2.875 | | | | 10/17/29 | | | | 200 | | | | 160,913 | |
Sr. Unsec’d. Notes, EMTN | | | 5.345 | | | | 01/27/48 | | | EUR | 50 | | | | 52,308 | |
Sr. Unsec’d. Notes, EMTN | | | 6.000 | | | | 08/04/28 | | | GBP | 205 | | | | 237,494 | |
Sr. Unsec’d. Notes, MTN | | | 5.125 | | | | 07/31/24 | | | EUR | 875 | | | | 896,831 | |
| | | | | | | | | | | | | | | | |
| | | | |
| | | | | | | | | | | | | | | 1,838,086 | |
| | | | |
Japan 2.5% | | | | | | | | | | | | | | | | |
| | | | |
Japan Government Five Year Bond, | | | | | | | | | | | | | | | | |
Bonds, Series 153 | | | 0.005 | | | | 06/20/27 | | | JPY | 60,000 | | | | 402,434 | |
Japan Government Ten Year Bond, | | | | | | | | | | | | | | | | |
Bonds, Series 367 | | | 0.200 | | | | 06/20/32 | | | JPY | 42,300 | | | | 283,200 | |
| | | | | | | | | | | | | | | | |
| | | | |
| | | | | | | | | | | | | | | 685,634 | |
| | | | |
Kazakhstan 0.4% | | | | | | | | | | | | | | | | |
| | | | |
Kazakhstan Government International Bond, | | | | | | | | | | | | | | | | |
Sr. Unsec’d. Notes, EMTN | | | 2.375 | | | | 11/09/28 | | | EUR | 115 | | | | 99,890 | |
| | | | |
Lithuania 0.3% | | | | | | | | | | | | | | | | |
| | | | |
Lithuania Government International Bond, | | | | | | | | | | | | | | | | |
Sr. Unsec’d. Notes, EMTN | | | 2.125 | | | | 10/22/35 | | | EUR | 100 | | | | 75,895 | |
| | | | |
Mexico 1.2% | | | | | | | | | | | | | | | | |
| | | | |
Mexico Government International Bond, | | | | | | | | | | | | | | | | |
Sr. Unsec’d. Notes | | | 2.875 | | | | 04/08/39 | | | EUR | 100 | | | | 67,837 | |
Sr. Unsec’d. Notes, EMTN | | | 1.750 | | | | 04/17/28 | | | EUR | 300 | | | | 254,932 | |
| | | | | | | | | | | | | | | | |
| | | | |
| | | | | | | | | | | | | | | 322,769 | |
See Notes to Financial Statements.
26
| | | | | | | | | | | | |
| Description | | Interest Rate | | Maturity Date | | Principal Amount (000)# | | | Value | |
| | | | |
SOVEREIGN BONDS (Continued) | | | | | | | | | | | | |
| | | | |
New Zealand 0.1% | | | | | | | | | | | | |
| | | | |
New Zealand Local Government Funding Agency Bond, | | | | | | | | | | | | |
Local Gov’t. Gtd. Notes | | 2.000% | | 04/15/37 | | NZD | 100 | | | $ | 37,573 | |
| | | | |
Peru 1.4% | | | | | | | | | | | | |
| | | | |
Peruvian Government International Bond, | | | | | | | | | | | | |
Sr. Unsec’d. Notes | | 2.750 | | 01/30/26 | | EUR | 100 | | | | 94,273 | |
Sr. Unsec’d. Notes | | 3.750 | | 03/01/30 | | EUR | 300 | | | | 271,052 | |
Sr. Unsec’d. Notes | | 6.900 | | 08/12/37 | | PEN | 100 | | | | 21,595 | |
| | | | | | | | | | | | |
| | | | |
| | | | | | | | | | | 386,920 | |
| | | | |
Philippines 1.2% | | | | | | | | | | | | |
| | | | |
Philippine Government International Bond, | | | | | | | | | | | | |
Sr. Unsec’d. Notes | | 0.700 | | 02/03/29 | | EUR | 300 | | | | 231,862 | |
Sr. Unsec’d. Notes, EMTN | | 0.875 | | 05/17/27 | | EUR | 100 | | | | 84,576 | |
| | | | | | | | | | | | |
| | | | |
| | | | | | | | | | | 316,438 | |
| | | | |
Portugal 2.8% | | | | | | | | | | | | |
| | | | |
Portugal Obrigacoes do Tesouro OT, | | | | | | | | | | | | |
Sr. Unsec’d. Notes, 144A | | 4.100 | | 04/15/37 | | EUR | 515 | | | | 551,187 | |
Sr. Unsec’d. Notes, 144A | | 4.100 | | 02/15/45 | | EUR | 140 | | | | 150,613 | |
Unsec’d. Notes, 144A | | 1.000 | | 04/12/52 | | EUR | 105 | | | | 54,389 | |
| | | | | | | | | | | | |
| | | | |
| | | | | | | | | | | 756,189 | |
| | | | |
Romania 1.1% | | | | | | | | | | | | |
| | | | |
Romania Government Bond, | | | | | | | | | | | | |
Bonds, Series 10YR | | 4.150 | | 10/24/30 | | RON | 100 | | | | 14,491 | |
Romanian Government International Bond, | | | | | | | | | | | | |
Sr. Unsec’d. Notes, 144A, MTN | | 2.125 | | 03/07/28 | | EUR | 120 | | | | 92,856 | |
Sr. Unsec’d. Notes, 144A, MTN | | 2.500 | | 02/08/30 | | EUR | 100 | | | | 71,976 | |
Sr. Unsec’d. Notes, EMTN | | 3.500 | | 04/03/34 | | EUR | 50 | | | | 33,424 | |
Sr. Unsec’d. Notes, EMTN | | 3.875 | | 10/29/35 | | EUR | 100 | | | | 67,559 | |
Unsec’d. Notes, 144A, MTN | | 2.124 | | 07/16/31 | | EUR | 40 | | | | 26,406 | |
| | | | | | | | | | | | |
| | | | |
| | | | | | | | | | | 306,712 | |
| | | | |
Saudi Arabia 0.3% | | | | | | | | | | | | |
| | | | |
Saudi Government International Bond, | | | | | | | | | | | | |
Sr. Unsec’d. Notes, 144A | | 2.000 | | 07/09/39 | | EUR | 125 | | | | 86,418 | |
See Notes to Financial Statements.
PGIM International Bond Fund 27
Schedule of Investments (continued)
as of October 31, 2022
| | | | | | | | | | | | |
| Description | | Interest Rate | | Maturity Date | | Principal Amount (000)# | | | Value | |
| | | | |
SOVEREIGN BONDS (Continued) | | | | | | | | | | | | |
| | | | |
Serbia 0.8% | | | | | | | | | | | | |
| | | | |
Serbia International Bond, | | | | | | | | | | | | |
Sr. Unsec’d. Notes | | 3.125% | | 05/15/27 | | EUR | 250 | | | $ | 210,049 | |
| | | | |
Spain 5.7% | | | | | | | | | | | | |
| | | | |
Autonomous Community of Catalonia, | | | | | | | | | | | | |
Sr. Unsec’d. Notes, EMTN | | 6.350 | | 11/30/41 | | EUR | 50 | | | | 60,765 | |
Spain Government Bond, | | | | | | | | | | | | |
Bonds, 144A(k) | | 5.150 | | 10/31/28 | | EUR | 185 | | | | 206,278 | |
Sr. Unsec’d. Notes, 144A | | 0.500 | | 04/30/30 | | EUR | 25 | | | | 20,761 | |
Sr. Unsec’d. Notes, 144A(k) | | 1.000 | | 10/31/50 | | EUR | 310 | | | | 165,992 | |
Sr. Unsec’d. Notes, 144A(k) | | 1.400 | | 04/30/28 | | EUR | 70 | | | | 64,502 | |
Sr. Unsec’d. Notes, 144A(k) | | 1.850 | | 07/30/35 | | EUR | 325 | | | | 271,009 | |
Sr. Unsec’d. Notes, 144A | | 3.450 | | 07/30/66 | | EUR | 50 | | | | 46,123 | |
Spain Government International Bond, | | | | | | | | | | | | |
Sr. Unsec’d. Notes, EMTN | | 5.250 | | 04/06/29 | | GBP | 615 | | | | 721,471 | |
| | | | | | | | | | | | |
| | | | |
| | | | | | | | | | | 1,556,901 | |
| | | | |
Ukraine 0.3% | | | | | | | | | | | | |
| | | | |
Ukraine Government International Bond, | | | | | | | | | | | | |
Sr. Unsec’d. Notes | | 4.375 | | 01/27/32(d) | | EUR | 259 | | | | 38,394 | |
Sr. Unsec’d. Notes | | 6.750 | | 06/20/28(d) | | EUR | 300 | | | | 48,603 | |
| | | | | | | | | | | | |
| | | | |
| | | | | | | | | | | 86,997 | |
| | | | |
United Kingdom 0.6% | | | | | | | | | | | | |
| | | | |
Transport for London, | | | | | | | | | | | | |
Sr. Unsec’d. Notes, EMTN | | 3.875 | | 07/23/42 | | GBP | 100 | | | | 90,223 | |
United Kingdom Gilt, | | | | | | | | | | | | |
Bonds | | 0.625 | | 07/31/35 | | GBP | 70 | | | | 55,089 | |
Bonds(k) | | 4.250 | | 12/07/46 | | GBP | 20 | | | | 24,520 | |
| | | | | | | | | | | | |
| | | | |
| | | | | | | | | | | 169,832 | |
| | | | | | | | | | | | |
| | | | |
TOTAL SOVEREIGN BONDS
(cost $19,410,029) | | | | | | | | | | | 14,535,098 | |
| | | | | | | | | | | | |
| | | | |
TOTAL LONG-TERM INVESTMENTS
(cost $33,068,509) | | | | | | | | | | | 25,340,254 | |
| | | | | | | | | | | | |
See Notes to Financial Statements.
28
| | | | | | | | |
| | |
| Description | | Shares | | | Value | |
SHORT-TERM INVESTMENTS 5.4% | | | | | | | | |
| | |
UNAFFILIATED FUND 5.3% | | | | | | | | |
| | |
Dreyfus Government Cash Management (Institutional Shares) | | | | | | | | |
(cost $1,429,509) | | | 1,429,509 | | | $ | 1,429,509 | |
| | | | | | | | |
| | |
OPTIONS PURCHASED*~ 0.1% | | | | | | | | |
(cost $6,300) | | | | | | | 28,509 | |
| | | | | | | | |
| | |
TOTAL SHORT-TERM INVESTMENTS | | | | | | | | |
(cost $1,435,809) | | | | | | | 1,458,018 | |
| | | | | | | | |
| | |
TOTAL INVESTMENTS, BEFORE OPTION WRITTEN 98.5% | | | | | | | | |
(cost $34,504,318) | | | | | | | 26,798,272 | |
| | | | | | | | |
| | |
OPTIONS WRITTEN*~ (0.1)% | | | | | | | | |
(premiums received $7,500) | | | | | | | (32,379 | ) |
| | | | | | | | |
| | |
TOTAL INVESTMENTS, NET OF OPTION WRITTEN 98.4% | | | | | | | | |
(cost $34,496,818) | | | | | | | 26,765,893 | |
Other assets in excess of liabilities(z) 1.6% | | | | | | | 445,680 | |
| | | | | | | | |
| | |
NET ASSETS 100.0% | | | | | | $ | 27,211,573 | |
| | | | | | | | |
Below is a list of the abbreviation(s) used in the annual report:
AUD—Australian Dollar
CAD—Canadian Dollar
CHF—Swiss Franc
CLP—Chilean Peso
CNH—Chinese Renminbi
COP—Colombian Peso
CZK—Czech Koruna
DKK—Danish Krone
EUR—Euro
GBP—British Pound
HKD—Hong Kong Dollar
HUF—Hungarian Forint
IDR—Indonesian Rupiah
ILS—Israeli Shekel
ITL—Italian Lira
JPY—Japanese Yen
KRW—South Korean Won
MXN—Mexican Peso
MYR—Malaysian Ringgit
NOK—Norwegian Krone
NZD—New Zealand Dollar
PEN—Peruvian Nuevo Sol
PLN—Polish Zloty
RON—Romanian Leu
SAR—Saudi Arabian Riyal
SEK—Swedish Krona
See Notes to Financial Statements.
PGIM International Bond Fund 29
Schedule of Investments (continued)
as of October 31, 2022
SGD—Singapore Dollar
THB—Thai Baht
USD—US Dollar
ZAR—South African Rand
144A—Security was purchased pursuant to Rule 144A under the Securities Act of 1933 and, pursuant to the requirements of Rule 144A, may not be resold except to qualified institutional buyers.
A—Annual payment frequency for swaps
BARC—Barclays Bank PLC
BBSW—Australian Bank Bill Swap Reference Rate
BNP—BNP Paribas S.A.
BOA—Bank of America, N.A.
BUBOR—Budapest Interbank Offered Rate
CDOR—Canadian Dollar Offered Rate
CIBOR—Copenhagen Interbank Offered Rate
CIGM—Citigroup Global Markets, Inc.
CITI—Citibank, N.A.
CLO—Collateralized Loan Obligation
CLOIS—Sinacofi Chile Interbank Rate Average
COOIS—Colombia Overnight Interbank Reference Rate
CPI—Consumer Price Index
CS—Credit Suisse Securities (USA) LLC
DB—Deutsche Bank AG
EMTN—Euro Medium Term Note
EURIBOR—Euro Interbank Offered Rate
EuroSTR—Euro Short-Term Rate
FHLMC—Federal Home Loan Mortgage Corporation
GMTN—Global Medium Term Note
GSI—Goldman Sachs International
HICP—Harmonised Index of Consumer Prices
HSBC—HSBC Bank PLC
IO—Interest Only (Principal amount represents notional)
iTraxx—International Credit Derivative Index
JIBAR—Johannesburg Interbank Agreed Rate
JPM—JPMorgan Chase Bank N.A.
JPS—J.P. Morgan Securities LLC
KLIBOR—Kuala Lumpur Interbank Offered Rate
KWCDC—Korean Won Certificate of Deposit
LIBOR—London Interbank Offered Rate
LP—Limited Partnership
M—Monthly payment frequency for swaps
MPLE—Maple Bonds
MSI—Morgan Stanley &Co International PLC
MTN—Medium Term Note
NIBOR—Norwegian Interbank Offered Rate
OAT—Obligations Assimilables du Tresor
OTC—Over-the-counter
PIK—Payment-in-Kind
PJSC—Public Joint-Stock Company
PRIBOR—Prague Interbank Offered Rate
Q—Quarterly payment frequency for swaps
REMIC—Real Estate Mortgage Investment Conduit
S—Semiannual payment frequency for swaps
See Notes to Financial Statements.
30
SAIBOR—Saudi Arabian Interbank Offered Rate
SARON—Swiss Average Rate Overnight
SCB—Standard Chartered Bank
SOFR—Secured Overnight Financing Rate
SONIA—Sterling Overnight Index Average
SORA—Singapore Overnight Rate Average
STIBOR—Stockholm Interbank Offered Rate
STRIPs—Separate Trading of Registered Interest and Principal of Securities
T—Swap payment upon termination
TD—The Toronto-Dominion Bank
TELBOR—Tel Aviv Interbank Offered Rate
THBFIX—Thai Baht Interest Rate Fixing
THOR—Thai Overnight Repurchase Rate
TONAR—Tokyo Overnight Average Rate
UAG—UBS AG
USOIS—United States Overnight Index Swap
WIBOR—Warsaw Interbank Offered Rate
| * | Non-income producing security. |
| # | Principal or notional amount is shown in U.S. dollars unless otherwise stated. |
| ~ | See tables subsequent to the Schedule of Investments for options detail. |
| (c) | Variable rate instrument. The interest rate shown reflects the rate in effect at October 31, 2022. |
| (cc) | Variable rate instrument. The rate shown is based on the latest available information as of October 31, 2022. Certain variable rate securities are not based on a published reference rate and spread but are determined by the issuer or agent and are based on current market conditions. These securities do not indicate a reference rate and spread in their description. |
| (d) | Represents issuer in default on interest payments and/or principal repayment. Non-income producing security. Such securities may be post-maturity. |
| (f) | Indicates a restricted security that is acquired in unregistered, private sales from the issuing company or from an affiliate of the issuer and is considered restricted as to disposition under federal securities law; the aggregate original cost of such securities is $42,295. The aggregate value of $33,006 is 0.1% of net assets. |
| (ff) | Variable rate security. Security may be issued at a fixed coupon rate, which converts to a variable rate at a specified date. Rate shown is the rate in effect as of period end. |
| (jj) | Represents original contract currency denomination, settlement to occur in Euro currency. |
| (k) | Represents security, or a portion thereof, segregated as collateral for centrally cleared/exchange-traded derivatives. |
| (oo) | Perpetual security. Maturity date represents next call date. |
| (s) | Represents zero coupon bond or principal only security. Rate represents yield to maturity at purchase date. |
| (z) | Includes net unrealized appreciation/(depreciation) and/or market value of the below holdings which are excluded from the Schedule of Investments: |
See Notes to Financial Statements.
PGIM International Bond Fund 31
Schedule of Investments (continued)
as of October 31, 2022
Options Purchased:
OTC Swaptions
| | | | | | | | | | | | | | | | | | | | | | | | | | |
Description | | Call/
Put | | Counterparty | | Expiration
Date | | Strike | | | Receive | | | Pay | | | Notional
Amount
(000)# | | | Value | |
| | | | | | | | |
2- Year Interest Rate Swap, 05/21/25 | | Call | | DB | | 05/17/23 | | | 2.05% | | | | 2.05%(A) | | |
| 3 Month
SAIBOR(Q)/ 5.599% |
| | | SAR 1,875 | | | $ | — | |
2-Year Interest Rate Swap, 05/21/25 | | Put | | DB | | 05/17/23 | | | 2.05% | | |
| 3 Month
SAIBOR(Q)/ 5.599% |
| | | 2.05%(A) | | | | SAR 1,875 | | | | 28,509 | |
| | | | | | | | | | | | | | | | | | | | | | | | | | |
| | | | |
Total Options Purchased (cost $6,300) | | | | | | | | | | | | | | | $ | 28,509 | |
| | | | | | | | | | | | | | | | | | | | | | | | | | |
Option Written:
OTC Swaptions
| | | | | | | | | | | | | | | | | | | | | | | | | | |
Description | | Call/
Put | | Counterparty | | Expiration
Date | | Strike | | | Receive | | | Pay | | | Notional
Amount
(000)# | | | Value | |
| | | | | | | | |
2- Year Interest Rate Swap, 05/19/25 | | Call | | DB | | 05/17/23 | | | 1.13% | | |
| 3 Month
LIBOR(Q)/ 4.460% |
| | | 1.13%(S) | | | | 500 | | | $ | (41 | ) |
2- Year Interest Rate Swap, 05/19/25 | | Put | | DB | | 05/17/23 | | | 1.13% | | | | 1.13%(S | ) | |
| 3 Month
LIBOR(Q)/ 4.460% |
| | | 500 | | | | (32,338 | ) |
| | | | | | | | | | | | | | | | | | | | | | | | | | |
| | | | |
Total Options Written (premiums received $7,500) | | | | | | | | | | | | | | | $ | (32,379 | ) |
| | | | | | | | | | | | | | | | | | | | | | | | | | |
Futures contracts outstanding at October 31, 2022:
| | | | | | | | | | | | | | | | | | | | | | | | |
Number of Contracts | | | Type | | Expiration
Date | | | Current
Notional
Amount | | | Value / Unrealized
Appreciation
(Depreciation) | |
| | | | | |
| | Long Position: | | | | | | | | | | | | | | | | | | | | |
| | 13 | | | 2 Year U.S. Treasury Notes | | | Dec. 2022 | | | $ | 2,656,977 | | | | | | | $ | (26,698 | ) | | | | |
| | | | | | | | | | | | | | | | | | | | | | | | |
| | | | | |
| | Short Positions: | | | | | | | | | | | | | | | | | | | | |
| | 18 | | | 5 Year Euro-Bobl | | | Dec. 2022 | | | | 2,128,750 | | | | | | | | 57,929 | | | | | |
| | 25 | | | 10 Year Euro-Bund | | | Dec. 2022 | | | | 3,420,333 | | | | | | | | 166,902 | | | | | |
| | 5 | | | 10 Year U.K. Gilt | | | Dec. 2022 | | | | 585,613 | | | | | | | | 44,974 | | | | | |
| | 4 | | | 10 Year U.S. Treasury Notes | | | Dec. 2022 | | | | 442,375 | | | | | | | | (5,876 | ) | | | | |
| | 7 | | | 10 Year U.S. Ultra Treasury Notes Dec. 2022 | | | | | | | 811,891 | | | | | | | | 62,788 | | | | | |
| | 20 | | | British Pound Currency | | | Dec. 2022 | | | | 1,435,750 | | | | | | | | 4,519 | | | | | |
| | 143 | | | Euro Currency | | | Dec. 2022 | | | | 17,738,256 | | | | | | | | 233,782 | | | | | |
| | 40 | | | Euro Schatz Index | | | Dec. 2022 | | | | 4,227,141 | | | | | | | | 32,874 | | | | | |
| | | | | | | | | | | | | | | | | | | | | | | | |
| | | | | | | | | | | | | | | | 597,892 | | | | | |
| | | | | | | | | | | | | | | | | | | | | | | | |
| | | | | | | | | | | | | | | $ | 571,194 | | | | | |
| | | | | | | | | | | | | | | | | | | | | | | | |
See Notes to Financial Statements.
32
Forward foreign currency exchange contracts outstanding at October 31, 2022:
| | | | | | | | | | | | | | | | | | | | | | | | | | | | | | | | | | | | | | | | |
Purchase Contracts | | Counterparty | | | | Notional Amount (000) | | Value at Settlement Date | | Current Value | | Unrealized
Appreciation | | Unrealized Depreciation |
| | | | |
| OTC Forward Foreign Currency Exchange Contracts: | | | | | | | | | | | | | | | | | | | | | |
British Pound, | | | | | | | | | | | | | | | | | | | | | | | | | | | | | | | | | | | | | | | | |
Expiring 11/02/22 | | | | BARC | | | | | | | | | | GBP | | | | | 271 | | | | $ | 308,374 | | | | $ | 311,092 | | | | $ | 2,718 | | | | $ | — | |
Expiring 11/02/22 | | | | BNP | | | | | | | | | | GBP | | | | | 835 | | | | | 945,870 | | | | | 958,137 | | | | | 12,267 | | | | | — | |
Expiring 11/02/22 | | | | JPM | | | | | | | | | | GBP | | | | | 10 | | | | | 10,820 | | | | | 10,912 | | | | | 92 | | | | | — | |
Expiring 12/02/22 | | | | BOA | | | | | | | | | | GBP | | | | | 98 | | | | | 114,495 | | | | | 112,895 | | | | | — | | | | | (1,600 | ) |
Chinese Renminbi, | | | | | | | | | | | | | | | | | | | | | | | | | | | | | | | | | | | | | | | | |
Expiring 11/23/22 | | | | BARC | | | | | | | | | | CNH | | | | | 415 | | | | | 58,427 | | | | | 56,577 | | | | | — | | | | | (1,850 | ) |
Expiring 11/23/22 | | | | HSBC | | | | | | | | | | CNH | | | | | 273 | | | | | 38,219 | | | | | 37,303 | | | | | — | | | | | (916 | ) |
Colombian Peso, | | | | | | | | | | | | | | | | | | | | | | | | | | | | | | | | | | | | | | | | |
Expiring 12/21/22 | | | | BARC | | | | | | | | | | COP | | | | | 111,571 | | | | | 24,517 | | | | | 22,390 | | | | | — | | | | | (2,127 | ) |
Czech Koruna, | | | | | | | | | | | | | | | | | | | | | | | | | | | | | | | | | | | | | | | | |
Expiring 01/19/23 | | | | GSI | | | | | | | | | | CZK | | | | | 364 | | | | | 14,303 | | | | | 14,619 | | | | | 316 | | | | | — | |
Euro, | | | | | | | | | | | | | | | | | | | | | | | | | | | | | | | | | | | | | | | | |
Expiring 11/02/22 | | | | HSBC | | | | | | | | | | EUR | | | | | 511 | | | | | 494,131 | | | | | 504,768 | | | | | 10,637 | | | | | — | |
Expiring 11/02/22 | | | | JPM | | | | | | | | | | EUR | | | | | 726 | | | | | 714,765 | | | | | 717,806 | | | | | 3,041 | | | | | — | |
Expiring 11/02/22 | | | | JPM | | | | | | | | | | EUR | | | | | 73 | | | | | 72,208 | | | | | 72,471 | | | | | 263 | | | | | — | |
Expiring 11/02/22 | | | | TD | | | | | | | | | | EUR | | | | | 111 | | | | | 109,210 | | | | | 109,481 | | | | | 271 | | | | | — | |
Expiring 11/02/22 | | | | UAG | | | | | | | | | | EUR | | | | | 71 | | | | | 68,130 | | | | | 69,759 | | | | | 1,629 | | | | | — | |
Expiring 12/02/22 | | | | BARC | | | | | | | | | | EUR | | | | | 755 | | | | | 747,400 | | | | | 748,245 | | | | | 845 | | | | | — | |
Expiring 12/02/22 | | | | MSI | | | | | | | | | | EUR | | | | | 94 | | | | | 95,142 | | | | | 93,558 | | | | | — | | | | | (1,584 | ) |
Hong Kong Dollar, | | | | | | | | | | | | | | | | | | | | | | | | | | | | | | | | | | | | | | | | |
Expiring 11/23/22 | | | | HSBC | | | | | | | | | | HKD | | | | | 1,022 | | | | | 130,411 | | | | | 130,269 | | | | | — | | | | | (142 | ) |
Hungarian Forint, | | | | | | | | | | | | | | | | | | | | | | | | | | | | | | | | | | | | | | | | |
Expiring 12/21/22 | | | | MSI | | | | | | | | | | HUF | | | | | 10,387 | | | | | 23,961 | | | | | 24,702 | | | | | 741 | | | | | — | |
Expiring 01/19/23 | | | | MSI | | | | | | | | | | HUF | | | | | 18,532 | | | | | 42,194 | | | | | 43,691 | | | | | 1,497 | | | | | — | |
Expiring 01/19/23 | | | | MSI | | | | | | | | | | HUF | | | | | 14,847 | | | | | 32,510 | | | | | 35,004 | | | | | 2,494 | | | | | — | |
Israeli Shekel, | | | | | | | | | | | | | | | | | | | | | | | | | | | | | | | | | | | | | | | | |
Expiring 12/21/22 | | | | CITI | | | | | | | | | | ILS | | | | | 44 | | | | | 12,975 | | | | | 12,572 | | | | | — | | | | | (403 | ) |
Japanese Yen, | | | | | | | | | | | | | | | | | | | | | | | | | | | | | | | | | | | | | | | | |
Expiring 11/02/22 | | | | DB | | | | | | | | | | JPY | | | | | 6,041 | | | | | 41,137 | | | | | 40,632 | | | | | — | | | | | (505 | ) |
Expiring 11/02/22 | | | | MSI | | | | | | | | | | JPY | | | | | 104,643 | | | | | 703,385 | | | | | 703,895 | | | | | 510 | | | | | — | |
Mexican Peso, | | | | | | | | | | | | | | | | | | | | | | | | | | | | | | | | | | | | | | | | |
Expiring 12/21/22 | | | | HSBC | | | | | | | | | | MXN | | | | | 859 | | | | | 41,933 | | | | | 42,971 | | | | | 1,038 | | | | | — | |
Norwegian Krone, | | | | | | | | | | | | | | | | | | | | | | | | | | | | | | | | | | | | | | | | |
Expiring 01/19/23 | | | | BOA | | | | | | | | | | NOK | | | | | 533 | | | | | 49,787 | | | | | 51,414 | | | | | 1,627 | | | | | — | |
Polish Zloty, | | | | | | | | | | | | | | | | | | | | | | | | | | | | | | | | | | | | | | | | |
Expiring 01/19/23 | | | | HSBC | | | | | | | | | | PLN | | | | | 460 | | | | | 90,336 | | | | | 94,926 | | | | | 4,590 | | | | | — | |
South Korean Won, | | | | | | | | | | | | | | | | | | | | | | | | | | | | | | | | | | | | | | | | |
Expiring 12/21/22 | | | | JPM | | | | | | | | | | KRW | | | | | 112,260 | | | | | 81,347 | | | | | 78,731 | | | | | — | | | | | (2,616 | ) |
Expiring 12/21/22 | | | | MSI | | | | | | | | | | KRW | | | | | 26,282 | | | | | 18,345 | | | | | 18,432 | | | | | 87 | | | | | — | |
Swedish Krona, | | | | | | | | | | | | | | | | | | | | | | | | | | | | | | | | | | | | | | | | |
Expiring 01/19/23 | | | | MSI | | | | | | | | | | SEK | | | | | 1,010 | | | | | 91,251 | | | | | 92,062 | | | | | 811 | | | | | — | |
See Notes to Financial Statements.
PGIM International Bond Fund 33
Schedule of Investments (continued)
as of October 31, 2022
Forward foreign currency exchange contracts outstanding at October 31, 2022 (continued):
| | | | | | | | | | | | | | | | | | | | | | | | | | | | | | | | | | | | | | | | |
Purchase Contracts | | Counterparty | | | | Notional Amount (000) | | Value at
Settlement
Date | | Current
Value | | Unrealized
Appreciation | | Unrealized
Depreciation |
| | | | |
| OTC Forward Foreign Currency Exchange Contracts (cont’d.): | | | | | | | | | | | | | | | | | | | | | |
Thai Baht, | | | | | | | | | | | | | | | | | | | | | | | | | | | | | | | | | | | | | | | | |
Expiring 12/21/22 | | | | CITI | | | | | | | | | | THB | | | | | 663 | | | | $ | 18,184 | | | | $ | 17,506 | | | | $ | — | | | | $ | (678 | ) |
| | | | | | | | | | | | | | | | | | | | | | | | | | | | | | | | | | | | | | | | |
| | | | | | | | |
| | | | | | | | | | | | | | | | | | | | | | | $ | 5,193,767 | | | | $ | 5,226,820 | | | | | 45,474 | | | | | (12,421 | ) |
| | | | | | | | | | | | | | | | | | | | | | | | | | | | | | | | | | | | | | | | |
| | | | | | | |
Sale Contracts | | Counterparty | | | | Notional Amount (000) | | Value at Settlement Date | | Current Value | | Unrealized Appreciation | | Unrealized
Depreciation |
| | | | | | | | | | | | | | | | | |
| | | | |
| OTC Forward Foreign Currency Exchange Contracts: | | | | | | | | | | | | | | | | | | | | | |
Australian Dollar, | | | | | | | | | | | | | | | | | | | | | | | | | | | | | | | | | | | | | | | | |
Expiring 01/19/23 | | | | HSBC | | | | | | | | | | AUD | | | | | 351 | | | | $ | 220,576 | | | | $ | 225,268 | | | | $ | — | | | | $ | (4,692 | ) |
British Pound, | | | | | | | | | | | | | | | | | | | | | | | | | | | | | | | | | | | | | | | | |
Expiring 11/02/22 | | | | MSI | | | | | | | | | | GBP | | | | | 1,116 | | | | | 1,208,256 | | | | | 1,280,140 | | | | | — | | | | | (71,884 | ) |
Expiring 12/02/22 | | | | BNP | | | | | | | | | | GBP | | | | | 835 | | | | | 946,559 | | | | | 958,964 | | | | | — | | | | | (12,405 | ) |
Expiring 01/19/23 | | | | BOA | | | | | | | | | | GBP | | | | | 65 | | | | | 75,496 | | | | | 75,207 | | | | | 289 | | | | | — | |
Canadian Dollar, | | | | | | | | | | | | | | | | | | | | | | | | | | | | | | | | | | | | | | | | |
Expiring 01/19/23 | | | | HSBC | | | | | | | | | | CAD | | | | | 555 | | | | | 401,985 | | | | | 407,669 | | | | | — | | | | | (5,684 | ) |
Chinese Renminbi, | | | | | | | | | | | | | | | | | | | | | | | | | | | | | | | | | | | | | | | | |
Expiring 11/23/22 | | | | CITI | | | | | | | | | | CNH | | | | | 200 | | | | | 27,770 | | | | | 27,266 | | | | | 504 | | | | | — | |
Expiring 11/23/22 | | | | GSI | | | | | | | | | | CNH | | | | | 9,280 | | | | | 1,366,935 | | | | | 1,266,611 | | | | | 100,324 | | | | | — | |
Expiring 11/23/22 | | | | HSBC | | | | | | | | | | CNH | | | | | 2,100 | | | | | 299,493 | | | | | 286,626 | | | | | 12,867 | | | | | — | |
Expiring 11/23/22 | | | | HSBC | | | | | | | | | | CNH | | | | | 210 | | | | | 29,952 | | | | | 28,615 | | | | | 1,337 | | | | | — | |
Expiring 11/23/22 | | | | MSI | | | | | | | | | | CNH | | | | | 236 | | | | | 34,335 | | | | | 32,261 | | | | | 2,074 | | | | | — | |
Expiring 11/23/22 | | | | MSI | | | | | | | | | | CNH | | | | | 231 | | | | | 32,566 | | | | | 31,473 | | | | | 1,093 | | | | | — | |
Euro, | | | | | | | | | | | | | | | | | | | | | | | | | | | | | | | | | | | | | | | | |
Expiring 11/02/22 | | | | BARC | | | | | | | | | | EUR | | | | | 755 | | | | | 745,811 | | | | | 746,599 | | | | | — | | | | | (788 | ) |
Expiring 11/02/22 | | | | BOA | | | | | | | | | | EUR | | | | | 90 | | | | | 89,029 | | | | | 89,315 | | | | | — | | | | | (286 | ) |
Expiring 11/02/22 | | | | BOA | | | | | | | | | | EUR | | | | | 40 | | | | | 39,369 | | | | | 39,606 | | | | | — | | | | | (237 | ) |
Expiring 11/02/22 | | | | CITI | | | | | | | | | | EUR | | | | | 138 | | | | | 135,377 | | | | | 136,510 | | | | | — | | | | | (1,133 | ) |
Expiring 11/02/22 | | | | JPM | | | | | | | | | | EUR | | | | | 314 | | | | | 306,398 | | | | | 310,521 | | | | | — | | | | | (4,123 | ) |
Expiring 11/02/22 | | | | JPM | | | | | | | | | | EUR | | | | | 65 | | | | | 63,798 | | | | | 64,354 | | | | | — | | | | | (556 | ) |
Expiring 11/02/22 | | | | TD | | | | | | | | | | EUR | | | | | 88 | | | | | 86,869 | | | | | 87,380 | | | | | — | | | | | (511 | ) |
Expiring 01/19/23 | | | | BOA | | | | | | | | | | EUR | | | | | 119 | | | | | 117,995 | | | | | 118,009 | | | | | — | | | | | (14 | ) |
Hong Kong Dollar, | | | | | | | | | | | | | | | | | | | | | | | | | | | | | | | | | | | | | | | | |
Expiring 11/23/22 | | | | JPM | | | | | | | | | | HKD | | | | | 1,026 | | | | | 131,107 | | | | | 130,815 | | | | | 292 | | | | | — | |
Indonesian Rupiah, | | | | | | | | | | | | | | | | | | | | | | | | | | | | | | | | | | | | | | | | |
Expiring 12/21/22 | | | | SCB | | | | | | | | | | IDR | | | | | 2,724,990 | | | | | 181,860 | | | | | 174,088 | | | | | 7,772 | | | | | — | |
Japanese Yen, | | | | | | | | | | | | | | | | | | | | | | | | | | | | | | | | | | | | | | | | |
Expiring 11/02/22 | | | | JPM | | | | | | | | | | JPY | | | | | 59,803 | | | | | 415,117 | | | | | 402,276 | | | | | 12,841 | | | | | — | |
Expiring 11/02/22 | | | | MSI | | | | | | | | | | JPY | | | | | 50,880 | | | | | 354,061 | | | | | 342,251 | | | | | 11,810 | | | | | — | |
Expiring 12/02/22 | | | | MSI | | | | | | | | | | JPY | | | | | 104,643 | | | | | 705,738 | | | | | 706,323 | | | | | — | | | | | (585 | ) |
See Notes to Financial Statements.
34
Forward foreign currency exchange contracts outstanding at October 31, 2022 (continued):
| | | | | | | | | | | | | | | | | | | | | | | | | | | | | | | | | | | | | | | | |
Sale Contracts | | Counterparty | | | | Notional
Amount (000) | | Value at
Settlement
Date | | Current
Value | | Unrealized
Appreciation | | Unrealized
Depreciation |
| | | | |
| OTC Forward Foreign Currency Exchange Contracts (cont’d.): | | | | | | | | | | | | | | | | | | | | | |
New Zealand Dollar, | | | | | | | | | | | | | | | | | | | | | | | | | | | | | | | | | | | | | | | | |
Expiring 01/19/23 | | | | BARC | | | | | | | | | | NZD | | | | | 51 | | | | $ | 28,567 | | | | $ | 29,760 | | | | $ | — | | | | $ | (1,193 | ) |
Peruvian Nuevo Sol, | | | | | | | | | | | | | | | | | | | | | | | | | | | | | | | | | | | | | | | | |
Expiring 12/21/22 | | | | BNP | | | | | | | | | | PEN | | | | | 93 | | | | | 23,548 | | | | | 23,123 | | | | | 425 | | | | | — | |
Romanian Leu, | | | | | | | | | | | | | | | | | | | | | | | | | | | | | | | | | | | | | | | | |
Expiring 01/19/23 | | | | JPM | | | | | | | | | | RON | | | | | 82 | | | | | 15,883 | | | | | 16,315 | | | | | — | | | | | (432 | ) |
South African Rand, | | | | | | | | | | | | | | | | | | | | | | | | | | | | | | | | | | | | | | | | |
Expiring 12/21/22 | | | | MSI | | | | | | | | | | ZAR | | | | | 277 | | | | | 15,851 | | | | | 15,013 | | | | | 838 | | | | | — | |
Swedish Krona, | | | | | | | | | | | | | | | | | | | | | | | | | | | | | | | | | | | | | | | | |
Expiring 01/19/23 | | | | CITI | | | | | | | | | | SEK | | | | | 1,008 | | | | | 89,463 | | | | | 91,895 | | | | | — | | | | | (2,432 | ) |
Swiss Franc, | | | | | | | | | | | | | | | | | | | | | | | | | | | | | | | | | | | | | | | | |
Expiring 01/19/23 | | | | CITI | | | | | | | | | | CHF | | | | | 180 | | | | | 182,346 | | | | | 181,124 | | | | | 1,222 | | | | | — | |
| | | | | | | | | | | | | | | | | | | | | | | | | | | | | | | | | | | | | | | | |
| | | | | | | | |
| | | | | | | | | | | | | | | | | | | | | | | $ | 8,372,110 | | | | $ | 8,325,377 | | | | | 153,688 | | | | | (106,955 | ) |
| | | | | | | | | | | | | | | | | | | | | | | | | | | | | | | | | | | | | | | | |
| | | | | | | | |
| | | | | | | | | | | | | | | | | | | | | | | | | | | | | | | | | $ | 199,162 | | | | $ | (119,376 | ) |
| | | | | | | | | | | | | | | | | | | | | | | | | | | | | | | | | | | | | | | | |
Credit default swap agreements outstanding at October 31, 2022:
| | | | | | | | | | | | | | | | | | | | | | | | | | | | | | | | | | | |
Reference Entity/ Obligation | | Termination
Date | | Fixed Rate | | Notional Amount (000)#(3) | | Fair Value | | Upfront
Premiums
Paid (Received) | | Unrealized
Appreciation
(Depreciation) | | Counterparty |
| | | | | | | | | | | | | | | |
| |
OTC Credit Default Swap Agreements on corporate and/or sovereign issues - Buy Protection(1): | | | | | | |
Gazprom PAO | | | | 03/20/23 | | | | | 1.000%(Q) | | | | | 110 | | | | $ | 21,245 | | | | $ | 23,753 | | | | $ | (2,508 | ) | | | | BARC | |
Gazprom PAO | | | | 03/20/23 | | | | | 1.000%(Q) | | | | | 110 | | | | | 21,244 | | | | | 23,316 | | | | | (2,072 | ) | | | | BARC | |
| | | | | | | | | | | | | | | | | | | | | | | | | | | | | | | | | | | |
| | | | | | | |
| | | | | | | | | | | | | | | | | | $ | 42,489 | | | | $ | 47,069 | | | | $ | (4,580 | ) | | | | | |
| | | | | | | | | | | | | | | | | | | | | | | | | | | | | | | | | | | |
| | | | | | | | | | | | | | | | | | | | | | | | | | | | | | | | | | | | | | | | |
Reference Entity/ Obligation | | Termination
Date | | Fixed Rate | | Notional Amount (000)#(3) | | Implied
Credit
Spread at
October 31,
2022(4) | | Fair Value | | Upfront
Premiums Paid (Received) | | Unrealized Appreciation (Depreciation) | | Counterparty |
| | | | | | | | | | | | | | | | | |
|
OTC Credit Default Swap Agreements on corporate and/or sovereign issues - Sell Protection(2): |
DP World PLC | | 12/20/24 | | | | 1.000%(Q) | | | | | 100 | | | | | 0.854 | % | | | $ | 413 | | | | $ | 201 | | | | $ | 212 | | | BARC | |
Electricite de France S.A. | | 12/20/22 | | | | 1.000%(Q) | | | | EUR | 60 | | | | | 0.674 | % | | | | 96 | | | | | 118 | | | | | (22 | ) | | GSI | |
EQT Corp. | | 12/20/22 | | | | 5.000%(Q) | | | | | 30 | | | | | 0.861 | % | | | | 346 | | | | | 152 | | | | | 194 | | | CS | |
Generalitat de Cataluna | | 12/20/22 | | | | 1.000%(Q) | | | | | 110 | | | | | * | | | | | 256 | | | | | (424 | ) | | | | 680 | | | CITI | |
Halliburton Co. | | 12/20/26 | | | | 1.000%(Q) | | | | | 30 | | | | | 0.712 | % | | | | 360 | | | | | 238 | | | | | 122 | | | GSI | |
Republic of Estonia | | 12/20/26 | | | | 1.000%(Q) | | | | | 20 | | | | | 0.973 | % | | | | 44 | | | | | 157 | | | | | (113 | ) | | JPM | |
See Notes to Financial Statements.
PGIM International Bond Fund 35
Schedule of Investments (continued)
as of October 31, 2022
Credit default swap agreements outstanding at October 31, 2022 (continued):
| | | | | | | | | | | | | | | | | | | | | | | | | | | | | | | | | | | | | | | | |
Reference Entity/ Obligation | | Termination
Date | | Fixed Rate | | Notional Amount (000)#(3) | | Implied
Credit
Spread at
October 31,
2022(4) | | Fair Value | | Upfront
Premiums Paid (Received) | | Unrealized Appreciation (Depreciation) | | Counterparty |
| | | | | | | | | | | | | | | | | |
| | | | | | | | | | | | | | | | | | | | | | | | | | | | | | | | | | | | | | | | |
| | | | | | | | | | | | | | | | | |
|
OTC Credit Default Swap Agreements on corporate and/or sovereign issues - Sell Protection(2)(cont’d.): | |
Republic of Indonesia | | | | 06/20/23 | | | | | 1.000 | %(Q) | | | | 220 | | | | | 0.331 | % | | | $ | 1,185 | | | | $ | (179 | ) | | | $ | 1,364 | | | | | CITI | |
Republic of Ireland | | | | 06/20/27 | | | | | 1.000 | %(Q) | | | | 100 | | | | | 0.266 | % | | | | 3,207 | | | | | 1,166 | | | | | 2,041 | | | | | MSI | |
Republic of Kazakhstan | | | | 06/20/23 | | | | | 1.000 | %(Q) | | | | 115 | | | | | 0.942 | % | | | | 176 | | | | | — | | | | | 176 | | | | | CITI | |
Republic of Panama | | | | 12/20/26 | | | | | 1.000 | %(Q) | | | | 80 | | | | | 1.397 | % | | | | (1,084 | ) | | | | 191 | | | | | (1,275 | ) | | | | CITI | |
Republic of South Africa | | | | 12/20/23 | | | | | 1.000 | %(Q) | | | | 400 | | | | | 1.413 | % | | | | (1,359 | ) | | | | (4,886 | ) | | | | 3,527 | | | | | BOA | |
Simon Property Group LP | | | | 06/20/26 | | | | | 1.000 | %(Q) | | | | 80 | | | | | 0.938 | % | | | | 257 | | | | | 676 | | | | | (419 | ) | | | | GSI | |
State of Illinois | | | | 12/20/22 | | | | | 1.000 | %(Q) | | | | 100 | | | | | 0.659 | % | | | | 163 | | | | | (107 | ) | | | | 270 | | | | | CITI | |
State of Illinois | | | | 12/20/24 | | | | | 1.000 | %(Q) | | | | 100 | | | | | 0.753 | % | | | | 611 | | | | | (2,122 | ) | | | | 2,733 | | | | | GSI | |
Targa Resources Partners LP | | | | 06/20/23 | | | | | 5.000 | %(Q) | | | | 30 | | | | | 0.657 | % | | | | 995 | | | | | 665 | | | | | 330 | | | | | MSI | |
Targa Resources Partners LP | | | | 06/20/23 | | | | | 5.000 | %(Q) | | | | 20 | | | | | 0.657 | % | | | | 663 | | | | | 464 | | | | | 199 | | | | | MSI | |
| | | | | | | | | | | | | | | | | | | | | | | | | | | | | | | | | | | | | | | | |
| | | | | | | | |
| | | | | | | | | | | | | | | | | | | | | | | $ | 6,329 | | | | $ | (3,690 | ) | | | $ | 10,019 | | | | | | |
| | | | | | | | | | | | | | | | | | | | | | | | | | | | | | | | | | | | | | | | |
| | | | | | | | | | | | | | | | | | | | | | | | | | | | | | | | | | | | | | | | |
Reference Entity/ Obligation | | Termination Date | | Fixed
Rate | | Notional Amount (000)#(3) | | Implied Credit
Spread at
October 31,
2022(4) | | Value at
Trade Date | | Value at October 31, 2022 | | Unrealized
Appreciation
(Depreciation) |
| | | | | | | | | | | | | | | | | |
|
Centrally Cleared Credit Default Swap Agreements on credit indices - Sell Protection(2): | |
iTraxx.EUR.38.V1 | | | | 12/20/27 | | | | | 1.000 | %(Q) | | | | EUR | | | | | 1,700 | | | | | 1.140 | % | | | $ | (14,962 | ) | | | $ | (8,940 | ) | | | $ | 6,022 | |
iTraxx.XO.38.V1 | | | | 12/20/27 | | | | | 5.000 | %(Q) | | | | EUR | | | | | 2,470 | | | | | 5.558 | % | | | | (82,573 | ) | | | | (38,640 | ) | | | | 43,933 | |
| | | | | | | | | | | | | | | | | | | | | | | | | | | | | | | | | | | | | | | | |
| | | | | | | | |
| | | | | | | | | | | | | | | | | | | | | | | | | | | | $ | (97,535 | ) | | | $ | (47,580 | ) | | | $ | 49,955 | |
| | | | | | | | | | | | | | | | | | | | | | | | | | | | | | | | | | | | | | | | |
The Fund entered into credit default swaps (“CDS”) to provide a measure of protection against defaults or to take an active long or short position with respect to the likelihood of a particular issuer’s default or the reference entity’s credit soundness. CDS contracts generally trade based on a spread which represents the cost a protection buyer has to pay the protection seller. The protection buyer is said to be short the credit as the value of the contract rises the more the credit deteriorates. The value of the CDS contract increases for the protection buyer if the spread increases.
| (1) | If the Fund is a buyer of protection, it pays the fixed rate. When a credit event occurs, as defined under the terms of that particular swap agreement, the Fund will either (i) receive from the seller of protection an amount equal to the notional amount of the swap and make delivery of the referenced obligation or underlying securities comprising the referenced index or (ii) receive a net settlement amount in the form of cash or securities equal to the notional amount of the swap less the recovery value of the referenced obligation or underlying securities comprising the referenced index. |
See Notes to Financial Statements.
36
| (2) | If the Fund is a seller of protection, it receives the fixed rate. When a credit event occurs, as defined under the terms of that particular swap agreement, the Fund will either (i) pay to the buyer of protection an amount equal to the notional amount of the swap and take delivery of the referenced obligation or underlying securities comprising the referenced index or (ii) pay a net settlement amount in the form of cash or securities equal to the notional amount of the swap less the recovery value of the referenced obligation or underlying securities comprising the referenced index. |
| (3) | Notional amount represents the maximum potential amount the Fund could be required to pay as a seller of credit protection or receive as a buyer of credit protection if a credit event occurs as defined under the terms of that particular swap agreement. |
| (4) | Implied credit spreads, represented in absolute terms, utilized in determining the fair value of credit default swap agreements where the Fund is the seller of protection as of the reporting date serve as an indicator of the current status of the payment/performance risk and represent the likelihood of risk of default for the credit derivative. The implied credit spread of a particular referenced entity reflects the cost of buying/selling protection and may include up-front payments required to be made to enter into the agreement. Wider credit spreads represent a deterioration of the referenced entity’s credit soundness and a greater likelihood of risk of default or other credit event occurring as defined under the terms of the agreement. |
| * | When an implied credit spread is not available, reference the fair value of credit default swap agreements on credit indices and asset-backed securities. Where the Fund is the seller of protection, it serves as an indicator of the current status of the payment/performance risk and represents the likelihood of an expected liability (or profit) for the credit derivative should the notional amount of the swap agreement be closed/sold as of the reporting date. Increasing fair value in absolute terms, when compared to the notional amount of the swap, represents a deterioration of the referenced entity’s credit soundness and a greater likelihood of risk of default or other credit event occurring as defined under the terms of the agreement. |
Currency swap agreement outstanding at October 31, 2022:
| | | | | | | | | | | | | | | | | | | | | | | | | | | | | | | | | | | | | | | | | | | | | | | | | | | | |
Notional Amount (000)# | | Fund
Receives | | Notional
Amount
(000)# | | Fund
Pays | | | Counterparty | | | Termination
Date | | | Fair
Value | | | Upfront
Premiums
Paid
(Received) | | | Unrealized
Appreciation
(Depreciation) | |
| | | | | | | | | | | | | | | | | | | | | | | | | | | | | | | | | | | | | | | | | |
| | | | | | | | | | | | |
| OTC Currency Swap Agreement: | | | | | | | | | | | | | | | | | | | | | | | | | | | | | | | | | | | | | | | | | | | | | | | | |
IDR 2,000,000 | | 8.22%(S) | | 138 | |
| 6 Month
LIBOR(S)/ 4.916% |
| | | CITI | | | | 11/29/23 | | | | | | | $ | (5,326 | ) | | | | | | | | | | $ | — | | | | | | | | | | | $ | (5,326 | ) | | | | |
| | | | | | | | | | | | | | | | | | | | | | | | | | | | | | | | | | | | | | | | | | | | | | | | | | | | |
See Notes to Financial Statements.
PGIM International Bond Fund 37
Schedule of Investments (continued)
as of October 31, 2022
Inflation swap agreements outstanding at October 31, 2022:
| | | | | | | | | | | | | | | | | | | | | | | | | | | | | | |
Notional Amount (000)# | | Termination
Date | | Fixed
Rate | | Floating
Rate | | Value at
Trade Date | | Value at
October 31,
2022 | | Unrealized
Appreciation
(Depreciation) |
| | | | | | | | | | | | | |
|
Centrally Cleared Inflation Swap Agreements: | |
EUR 200 | | | | 05/15/23 | | | | | 1.485%(T) | | | |
| France CPI ex Tobacco
Household(1)(T) |
| | | $ | — | | | | $ | 10,079 | | | | $ | 10,079 | |
EUR 200 | | | | 05/15/23 | | | | | 1.510%(T) | | | |
| Eurostat Eurozone HICP
ex Tobacco(2)(T) |
| | | | — | | | | | (22,555 | ) | | | | (22,555 | ) |
| | | | | | | | | | | | | | | | | | | | | | | | | | | | | | |
| | | | | | |
| | | | | | | | | | | | | | | | | | $ | — | | | | $ | (12,476 | ) | | | $ | (12,476 | ) |
| | | | | | | | | | | | | | | | | | | | | | | | | | | | | | |
| (1) | The Fund pays the fixed rate and receives the floating rate. |
| (2) | The Fund pays the floating rate and receives the fixed rate. |
Interest rate swap agreements outstanding at October 31, 2022:
| | | | | | | | | | | | | | | | | | | | | | | | |
Notional
Amount
(000)# | | | Termination
Date | | | Fixed
Rate | | Floating Rate | | Value at
Trade Date | | | Value at
October 31,
2022 | | | Unrealized
Appreciation
(Depreciation) | |
| | | | | | | | | | | | | | | | | | | | |
|
Centrally Cleared Interest Rate Swap Agreements: | |
| AUD | | | 350 | | | | 12/03/29 | | | 2.700%(S) | | 6 Month BBSW(2)(S)/3.665% | | $ | 23,932 | | | $ | (22,915 | ) | | $ | (46,847 | ) |
| AUD | | | 150 | | | | 05/09/32 | | | 3.140%(S) | | 6 Month BBSW(2)(S)/3.665% | | | (2 | ) | | | (9,911 | ) | | | (9,909 | ) |
| AUD | | | 165 | | | | 07/19/32 | | | 3.130%(S) | | 6 Month BBSW(2)(S)/3.665% | | | (3 | ) | | | (11,883 | ) | | | (11,880 | ) |
| CAD | | | 500 | | | | 09/03/25 | | | 0.733%(S) | | 3 Month CDOR(2)(S)/4.563% | | | (1 | ) | | | (35,130 | ) | | | (35,129 | ) |
| CAD | | | 200 | | | | 12/03/28 | | | 2.600%(S) | | 3 Month CDOR(2)(S)/4.563% | | | 1,205 | | | | (9,225 | ) | | | (10,430 | ) |
| CAD | | | 280 | | | | 12/03/32 | | | 2.700%(S) | | 3 Month CDOR(2)(S)/4.563% | | | (12,903 | ) | | | (18,688 | ) | | | (5,785 | ) |
| CAD | | | 150 | | | | 05/30/47 | | | 2.240%(S) | | 3 Month CDOR(2)(S)/4.563% | | | (7,036 | ) | | | (28,273 | ) | | | (21,237 | ) |
| CHF | | | 140 | | | | 01/31/29 | | | 0.260%(A) | | 1 Day SARON(2)(S)/0.471% | | | (589 | ) | | | (12,991 | ) | | | (12,402 | ) |
| CHF | | | 80 | | | | 04/03/33 | | | 0.687%(A) | | 1 Day SARON(2)(S)/0.471% | | | (461 | ) | | | (10,266 | ) | | | (9,805 | ) |
| CLP | | | 22,700 | | | | 11/17/30 | | | 2.420%(S) | | 1 Day CLOIS(2)(S)/11.25% | | | — | | | | (6,901 | ) | | | (6,901 | ) |
| CNH | | | 800 | | | | 08/15/23 | | | 3.115%(Q) | | 7 Day China Fixing Repo Rates(2)(Q)/1.940% | | | (1 | ) | | | 1,367 | | | | 1,368 | |
See Notes to Financial Statements.
38
Interest rate swap agreements outstanding at October 31, 2022 (continued):
| | | | | | | | | | | | | | | | | | | | | | | | |
Notional
Amount
(000)# | | | Termination
Date | | Fixed
Rate | | | Floating Rate | | Value at
Trade Date | | | Value at
October 31,
2022 | | | Unrealized
Appreciation
(Depreciation) | |
| | | | | | | | | | | | | | | | | | | | |
|
Centrally Cleared Interest Rate Swap Agreements (cont’d.): | |
| CNH | | | 800 | | | 03/13/24 | | | 2.945%(Q) | | | 7 Day China Fixing Repo Rates(2)(Q)/1.940% | | $ | (1 | ) | | $ | 1,599 | | | $ | 1,600 | |
| CNH | | | 1,400 | | | 04/01/24 | | | 2.923%(Q) | | | 7 Day China Fixing Repo Rates(2)(Q)/1.940% | | | — | | | | 2,674 | | | | 2,674 | |
| CNH | | | 2,440 | | | 06/20/24 | | | 2.900%(Q) | | | 7 Day China Fixing Repo Rates(2)(Q)/1.940% | | | 2 | | | | 5,140 | | | | 5,138 | |
| CNH | | | 2,300 | | | 09/03/24 | | | 2.860%(Q) | | | 7 Day China Fixing Repo Rates(2)(Q)/1.940% | | | (3 | ) | | | 5,169 | | | | 5,172 | |
| CNH | | | 2,600 | | | 10/10/24 | | | 2.860%(Q) | | | 7 Day China Fixing Repo Rates(2)(Q)/1.940% | | | (1 | ) | | | 5,599 | | | | 5,600 | |
| CNH | | | 1,780 | | | 11/01/24 | | | 3.120%(Q) | | | 7 Day China Fixing Repo Rates(2)(Q)/1.940% | | | (6 | ) | | | 5,870 | | | | 5,876 | |
| CNH | | | 2,500 | | | 02/04/25 | | | 2.600%(Q) | | | 7 Day China Fixing Repo Rates(2)(Q)/1.940% | | | — | | | | 4,498 | | | | 4,498 | |
| CNH | | | 3,900 | | | 03/06/25 | | | 2.425%(Q) | | | 7 Day China Fixing Repo Rates(2)(Q)/1.940% | | | (6 | ) | | | 4,287 | | | | 4,293 | |
| CNH | | | 6,000 | | | 03/12/25 | | | 2.400%(Q) | | | 7 Day China Fixing Repo Rates(2)(Q)/1.940% | | | (2 | ) | | | 6,009 | | | | 6,011 | |
| CNH | | | 2,880 | | | 06/01/25 | | | 1.973%(Q) | | | 7 Day China Fixing Repo Rates(2)(Q)/1.940% | | | 2 | | | | (1,550 | ) | | | (1,552 | ) |
| CNH | | | 5,039 | | | 08/06/25 | | | 2.555%(Q) | | | 7 Day China Fixing Repo Rates(2)(Q)/1.940% | | | (5 | ) | | | 8,473 | | | | 8,478 | |
| CNH | | | 11,480 | | | 11/02/25 | | | 2.588%(Q) | | | 7 Day China Fixing Repo Rates(2)(Q)/1.940% | | | 19 | | | | 20,955 | | | | 20,936 | |
| CNH | | | 1,270 | | | 04/12/26 | | | 2.810%(Q) | | | 7 Day China Fixing Repo Rates(2)(Q)/1.940% | | | (5 | ) | | | 3,239 | | | | 3,244 | |
| CNH | | | 4,300 | | | 08/04/27 | | | 2.388%(Q) | | | 7 Day China Fixing Repo Rates(2)(Q)/1.940% | | | — | | | | 1,464 | | | | 1,464 | |
See Notes to Financial Statements.
PGIM International Bond Fund 39
Schedule of Investments (continued)
as of October 31, 2022
Interest rate swap agreements outstanding at October 31, 2022 (continued):
| | | | | | | | | | | | | | | | | | | | | | | | | | |
Notional
Amount
(000)# | | | Termination
Date | | | Fixed
Rate | | | Floating Rate | | Value at
Trade Date | | | Value at
October 31,
2022 | | | Unrealized
Appreciation
(Depreciation) | |
| | | | | | | | | | | | | | | | | | | | | |
|
Centrally Cleared Interest Rate Swap Agreements (cont’d.): | |
| COP | | | 690,000 | | | | 04/20/26 | | | | 4.190%(Q) | | | 1 Day COOIS(2)(Q)/10.285% | | $ | — | | | $ | (28,485 | ) | | $ | (28,485 | ) |
| CZK | | | 3,300 | | | | 06/29/27 | | | | 1.175%(A) | | | 6 Month PRIBOR(2)(S)/7.390% | | | (4,643 | ) | | | (29,222 | ) | | | (24,579 | ) |
| DKK | | | 600 | | | | 04/08/32 | | | | 1.581%(A) | | | 6 Month CIBOR(2)(S)/2.443% | | | (3,286 | ) | | | (9,871 | ) | | | (6,585 | ) |
| EUR | | | 3,205 | | | | 11/23/24 | | | | (0.046)%(A) | | | 6 Month EURIBOR(2)(S)/2.130% | | | — | | | | (95,070 | ) | | | (95,070 | ) |
| EUR | | | 2,125 | | | | 12/02/24 | | | | (0.285)%(A) | | | 6 Month EURIBOR(2)(S)/2.130% | | | — | | | | (134,190 | ) | | | (134,190 | ) |
| EUR | | | 225 | | | | 04/27/30 | | | | (0.016)%(A) | | | 6 Month EURIBOR(2)(S)/2.130% | | | — | | | | (44,706 | ) | | | (44,706 | ) |
| EUR | | | 171 | | | | 08/15/30 | | | | (0.191)%(A) | | | 1 Day EuroSTR(2)(A)/0.648% | | | (73 | ) | | | (34,369 | ) | | | (34,296 | ) |
| EUR | | | 1,335 | | | | 06/28/32 | | | | 0.785%(A) | | | 6 Month EURIBOR(2)(S)/2.130% | | | (65,530 | ) | | | (242,001 | ) | | | (176,471 | ) |
| EUR | | | 100 | | | | 11/24/41 | | | | 0.565%(A) | | | 6 Month EURIBOR(1)(S)/2.130% | | | — | | | | 14,893 | | | | 14,893 | |
| EUR | | | 100 | | | | 11/24/41 | | | | 0.600%(A) | | | 3 Month EURIBOR(2)(Q)/1.704% | | | — | | | | (15,605 | ) | | | (15,605 | ) |
| EUR | | | 242 | | | | 11/25/41 | | | | 0.629%(A) | | | 6 Month EURIBOR(1)(S)/2.130% | | | — | | | | 35,006 | | | | 35,006 | |
| EUR | | | 242 | | | | 11/25/41 | | | | 0.663%(A) | | | 3 Month EURIBOR(2)(Q)/1.704% | | | — | | | | (36,751 | ) | | | (36,751 | ) |
| GBP | | | 60 | | | | 05/08/24 | | | | 0.950%(A) | | | 1 Day SONIA(1)(A)/2.184% | | | 1,520 | | | | 3,742 | | | | 2,222 | |
| GBP | | | 50 | | | | 05/08/29 | | | | 1.100%(A) | | | 1 Day SONIA(2)(A)/2.184% | | | 1,929 | | | | (9,453 | ) | | | (11,382 | ) |
| GBP | | | 190 | | | | 05/08/31 | | | | 1.150%(A) | | | 1 Day SONIA(2)(A)/2.184% | | | 8,640 | | | | (42,632 | ) | | | (51,272 | ) |
| GBP | | | 160 | | | | 05/08/37 | | | | 1.200%(A) | | | 1 Day SONIA(2)(A)/2.184% | | | (54,044 | ) | | | (50,210 | ) | | | 3,834 | |
See Notes to Financial Statements.
40
Interest rate swap agreements outstanding at October 31, 2022 (continued):
| | | | | | | | | | | | | | | | | | | | | | | | | | |
Notional
Amount
(000)# | | | Termination
Date | | | Fixed
Rate | | | Floating Rate | | Value at
Trade Date | | | Value at
October 31,
2022 | | | Unrealized
Appreciation
(Depreciation) | |
| | | | | | | | | | | | | | | | | | | | | |
|
Centrally Cleared Interest Rate Swap Agreements (cont’d.): | |
| GBP | | | 100 | | | | 09/30/40 | | | | 0.262%(A) | | | 1 Day SONIA(2)(A)/2.184% | | $ | (3,862 | ) | | $ | (48,853 | ) | | $ | (44,991 | ) |
| GBP | | | 525 | | | | 05/08/46 | | | | 1.250%(A) | | | 1 Day SONIA(2)(A)/2.184% | | | 120,708 | | | | (205,599 | ) | | | (326,307 | ) |
| GBP | | | 50 | | | | 05/08/47 | | | | 1.250%(A) | | | 1 Day SONIA(1)(A)/2.184% | | | 2,883 | | | | 20,127 | | | | 17,244 | |
| GBP | | | 80 | | | | 09/03/50 | | | | 0.328%(A) | | | 1 Day SONIA(2)(A)/2.184% | | | (1 | ) | | | (48,468 | ) | | | (48,467 | ) |
| HUF | | | 20,000 | | | | 01/12/27 | | | | 4.150%(A) | | | 6 Month BUBOR(2)(S)/16.740% | | | — | | | | (12,800 | ) | | | (12,800 | ) |
| JPY | | | 301,250 | | | | 12/20/24 | | | | 0.126%(S) | | | 1 Day TONAR(2)(S)/(0.062)% | | | (930 | ) | | | (1,150 | ) | | | (220 | ) |
| JPY | | | 46,500 | | | | 07/04/28 | | | | 0.282%(S) | | | 1 Day TONAR(2)(S)/(0.062)% | | | (397 | ) | | | (1,250 | ) | | | (853 | ) |
| JPY | | | 100,000 | | | | 11/12/28 | | | | 0.011%(S) | | | 1 Day TONAR(2)(S)/(0.062)% | | | 4 | | | | (15,439 | ) | | | (15,443 | ) |
| JPY | | | 57,765 | | | | 12/03/28 | | | | 0.200%(S) | | | 1 Day TONAR(2)(S)/(0.062)% | | | (9 | ) | | | (4,345 | ) | | | (4,336 | ) |
| JPY | | | 10,000 | | | | 07/08/32 | | | | 0.050%(A) | | | 1 Day TONAR(2)(A)/(0.062)% | | | (2,982 | ) | | | (3,246 | ) | | | (264 | ) |
| JPY | | | 70,000 | | | | 12/22/36 | | | | 0.641%(S) | | | 1 Day TONAR(2)(S)/(0.062)% | | | (1,650 | ) | | | (12,474 | ) | | | (10,824 | ) |
| JPY | | | 95,000 | | | | 07/26/37 | | | | 0.676%(S) | | | 1 Day TONAR(2)(S)/(0.062)% | | | (1,891 | ) | | | (17,373 | ) | | | (15,482 | ) |
| JPY | | | 35,000 | | | | 02/06/40 | | | | 0.223%(S) | | | 1 Day TONAR(2)(S)/(0.062)% | | | (193 | ) | | | (29,906 | ) | | | (29,713 | ) |
| JPY | | | 45,000 | | | | 12/22/41 | | | | 0.731%(S) | | | 1 Day TONAR(2)(S)/(0.062)% | | | (1,234 | ) | | | (17,638 | ) | | | (16,404 | ) |
| JPY | | | 90,000 | | | | 11/24/47 | | | | 0.888%(S) | | | 1 Day TONAR(2)(S)/(0.062)% | | | (239 | ) | | | (42,532 | ) | | | (42,293 | ) |
| KRW | | | 400,000 | | | | 04/28/24 | | | | 2.725%(Q) | | | 3 Month KWCDC(2)(Q)/3.960% | | | (1,502 | ) | | | (6,328 | ) | | | (4,826 | ) |
| KRW | | | 75,700 | | | | 04/17/29 | | | | 1.740%(Q) | | | 3 Month KWCDC(2)(Q)/3.960% | | | — | | | | (7,149 | ) | | | (7,149 | ) |
| KRW | | | 184,000 | | | | 04/27/30 | | | | 1.065%(Q) | | | 3 Month KWCDC(2)(Q)/3.960% | | | — | | | | (25,398 | ) | | | (25,398 | ) |
| MXN | | | 4,020 | | | | 02/27/29 | | | | 8.260%(M) | | | 28 Day Mexican Interbank Rate(2)(M)/9.596% | | | 641 | | | | (9,890 | ) | | | (10,531 | ) |
See Notes to Financial Statements.
PGIM International Bond Fund 41
Schedule of Investments (continued)
as of October 31, 2022
Interest rate swap agreements outstanding at October 31, 2022 (continued):
| | | | | | | | | | | | | | | | | | | | | | | | | | |
Notional
Amount
(000)# | | | Termination
Date | | | Fixed
Rate | | | Floating Rate | | Value at
Trade Date | | | Value at
October 31,
2022 | | | Unrealized
Appreciation
(Depreciation) | |
| | | | | | | | | | | | | | | | | | | | | |
|
Centrally Cleared Interest Rate Swap Agreements (cont’d.): | |
| NOK | | | 500 | | | | 02/07/29 | | | | 2.083%(A) | | | 6 Month NIBOR(2)(S)/3.850% | | $ | 586 | | | $ | (3,999 | ) | | $ | (4,585 | ) |
| PLN | | | 515 | | | | 04/27/31 | | | | 1.788%(A) | | | 6 Month WIBOR(2)(S)/7.720% | | | — | | | | (34,458 | ) | | | (34,458 | ) |
| SEK | | | 1,500 | | | | 01/24/30 | | | | 0.605%(A) | | | 3 Month STIBOR(2)(Q)/2.069% | | | — | | | | (21,424 | ) | | | (21,424 | ) |
| SGD | | | 140 | | | | 07/29/31 | | | | 1.120%(S) | | | 1 Day SORA(2)(S)/2.852% | | | — | | | | (20,330 | ) | | | (20,330 | ) |
| THB | | | 4,200 | | | | 07/03/30 | | | | 1.028%(Q) | | | 1 Day THOR(2)(Q)/0.984% | | | — | | | | (15,550 | ) | | | (15,550 | ) |
| | | 680 | | | | 11/09/22 | | | | 0.050%(A) | | | 1 Day USOIS(1)(A)/3.080% | | | — | | | | 7,477 | | | | 7,477 | |
| | | 4,000 | | | | 11/09/22 | | | | 0.061%(A) | | | 1 Day SOFR(1)(A)/3.050% | | | — | | | | 41,671 | | | | 41,671 | |
| | | 247 | | | | 08/15/28 | | | | 1.220%(A) | | | 1 Day SOFR(1)(A)/3.050% | | | — | | | | 35,615 | | | | 35,615 | |
| | | | | | | | | | | | | | | | | | | | | | | | | | |
| | | | | | | | | | | | | | | | $ | (1,420 | ) | | $ | (1,311,023 | ) | | $ | (1,309,603 | ) |
| | | | | | | | | | | | | | | | | | | | | | | | | | |
| | | | | | | | | | | | | | | | | | | | | | | | | | | | | | | | | | | | | | | | | | | | | | | | | | | | |
Notional
Amount
(000)# | | | Termination
Date | | | Fixed
Rate | | | Floating
Rate | | Fair
Value | | | Upfront
Premiums
Paid(Received) | | | Unrealized
Appreciation
(Depreciation) | | | Counterparty |
| | | | | | | | | | | | | | | | | | | | | | | | | | | | | | | | | | | | | | | | | |
|
OTC Interest Rate Swap Agreements: |
| CNH | | | 500 | | | | 04/02/26 | | | | 3.120%(Q) | | | 7 Day China Fixing Repo Rates(2)(Q)/1.940% | | | | | | $ | 1,988 | | | | | | | | | | | $ | (1 | ) | | | | | | | | | | $ | 1,989 | | | | | | | CITI |
| ILS | | | 450 | | | | 04/24/30 | | | | 0.710%(A) | | | 3 Month TELBOR(2)(Q)/3.279% | | | | | | | (23,440 | ) | | | | | | | | | | | (4 | ) | | | | | | | | | | | (23,436 | ) | | | | | | GSI |
| KRW | | | 850,000 | | | | 01/06/27 | | | | 1.800%(Q) | | | 3 Month KWCDC(2)(Q)/3.960% | | | | | | | (54,611 | ) | | | | | | | | | | | (9 | ) | | | | | | | | | | | (54,602 | ) | | | | | | CITI |
| MYR | | | 1,000 | | | | 11/27/23 | | | | 3.900%(Q) | | | 3 Month KLIBOR(2)(Q)/3.160% | | | | | | | 1,037 | | | | | | | | | | | | (2 | ) | | | | | | | | | | | 1,039 | | | | | | | CITI |
| MYR | | | 200 | | | | 11/19/29 | | | | 3.245%(Q) | | | 3 Month KLIBOR(2)(Q)/3.160% | | | | | | | (2,833 | ) | | | | | | | | | | | — | | | | | | | | | | | | (2,833 | ) | | | | | | MSI |
| MYR | | | 200 | | | | 02/04/30 | | | | 3.060%(Q) | | | 3 Month KLIBOR(2)(Q)/3.160% | | | | | | | (3,455 | ) | | | | | | | | | | | — | | | | | | | | | | | | (3,455 | ) | | | | | | MSI |
| MYR | | | 100 | | | | 04/07/32 | | | | 3.870%(Q) | | | 3 Month KLIBOR(2)(Q)/3.160% | | | | | | | (911 | ) | | | | | | | | | | | (1 | ) | | | | | | | | | | | (910 | ) | | | | | | CITI |
| THB | | | 5,000 | | | | 05/07/25 | | | | 0.795%(S) | | | 6 Month THBFIX(2)(S)/1.488% | | | | | | | (5,099 | ) | | | | | | | | | | | 1 | | | | | | | | | | | | (5,100 | ) | | | | | | HSBC |
See Notes to Financial Statements.
42
Interest rate swap agreements outstanding at October 31, 2022 (continued):
| | | | | | | | | | | | | | | | | | | | | | | | | | | | | | | | | | | | | | | | | | | | | | | | | | | | | | |
Notional
Amount
(000)# | | | Termination
Date | | | Fixed
Rate | | | Floating
Rate | | Fair
Value | | | Upfront
Premiums
Paid(Received) | | | Unrealized
Appreciation
(Depreciation) | | | Counterparty | |
| | | | | | | | | | | | | | | | | | | | | | | | | | | | | | | | | | | | | | | | | | |
|
OTC Interest Rate Swap Agreements (cont’d.): | |
| THB | | | 3,500 | | | | 02/14/29 | | | | 2.180%(S) | | | 6 Month THBFIX(2)(S)/1.488% | | | | | | $ | (3,567 | ) | | | | | | | | | | $ | — | | | | | | | | | | | $ | (3,567 | ) | | | | | | | CITI | |
| ZAR | | | 3,300 | | | | 09/22/42 | | | | 8.020%(Q) | | | 3 Month JIBAR(2)(Q)/6.517% | | | | | | | (28,845 | ) | | | | | | | | | | | (24 | ) | | | | | | | | | | | (28,821 | ) | | | | | | | CITI | |
| ZAR | | | 3,100 | | | | 09/22/47 | | | | 7.890%(Q) | | | 3 Month JIBAR(1)(Q)/6.517% | | | | | | | 31,090 | | | | | | | | | | | | 20 | | | | | | | | | | | | 31,070 | | | | | | | | CITI | |
| | | | | | | | | | | | | | | | | | | | | | | | | | | | | | | | | | | | | | | | | | | | | | | | | | | | | | |
| | | | | | | | | | | | | | | | | | | | $ | (88,646 | ) | | | | | | | | | | $ | (20 | ) | | | | | | | | | | $ | (88,626 | ) | | | | | | | | |
| | | | | | | | | | | | | | | | | | | | | | | | | | | | | | | | | | | | | | | | | | | | | | | | | | | | | | |
| (1) | The Fund pays the fixed rate and receives the floating rate. |
| (2) | The Fund pays the floating rate and receives the fixed rate. |
Balances Reported in the Statement of Assets and Liabilities for OTC Swap Agreements:
| | | | | | | | |
| | | Premiums Paid | | Premiums Received | | Unrealized Appreciation | | Unrealized Depreciation |
|
| | | | |
OTC Swap Agreements | | $51,118 | | $(7,759) | | $45,946 | | $(134,459) |
|
Summary of Collateral for Centrally Cleared/Exchange-traded Derivatives:
Cash and securities segregated as collateral, including pending settlement for closed positions, to cover requirements for centrally cleared/exchange-traded derivatives are listed by broker as follows:
| | | | | | | | | | |
Broker | | Cash and/or Foreign Currency | | Securities Market Value |
CIGM | | | $ | — | | | | $ | 886,034 | |
JPS | | | | — | | | | | 908,377 | |
| | | | | | | | | | |
| | |
Total | | | $ | — | | | | $ | 1,794,411 | |
| | | | | | | | | | |
Fair Value Measurements:
Various inputs are used in determining the value of the Fund’s investments. These inputs are summarized in the three broad levels listed below.
Level 1—unadjusted quoted prices generally in active markets for identical securities.
Level 2—quoted prices for similar securities, interest rates and yield curves, prepayment speeds, foreign currency exchange rates and other observable inputs.
Level 3—unobservable inputs for securities valued in accordance with Board approved fair valuation procedures.
See Notes to Financial Statements.
PGIM International Bond Fund 43
Schedule of Investments (continued)
as of October 31, 2022
The following is a summary of the inputs used as of October 31, 2022 in valuing such portfolio securities:
| | | | | | | | | | |
| | | Level 1 | | | Level 2 | | | Level 3 |
Investments in Securities | | | | | | | | | | |
Assets | | | | | | | | | | |
Long-Term Investments | | | | | | | | | | |
Asset-Backed Securities | | | | | | | | | | |
Cayman Islands | | $ | — | | | $ | 718,401 | | | $— |
United States | | | — | | | | 416,756 | | | — |
Commercial Mortgage-Backed Securities | | | | | | | | | | |
Canada | | | — | | | | 14,756 | | | — |
United Kingdom | | | — | | | | 526,112 | | | — |
United States | | | — | | | | 1,416,896 | | | — |
Corporate Bonds | | | | | | | | | | |
Australia | | | — | | | | 93,859 | | | — |
Belgium | | | — | | | | 52,053 | | | — |
Brazil | | | — | | | | 95,779 | | | — |
Bulgaria | | | — | | | | 70,895 | | | — |
China | | | — | | | | 342,884 | | | — |
France | | | — | | | | 568,549 | | | — |
Germany | | | — | | | | 594,265 | | | — |
Hong Kong | | | — | | | | 215,391 | | | — |
Hungary | | | — | | | | 89,363 | | | — |
Iceland | | | — | | | | 97,078 | | | — |
India | | | — | | | | 90,660 | | | — |
Indonesia | | | — | | | | 69,072 | | | — |
Italy | | | — | | | | 254,128 | | | — |
Kazakhstan | | | — | | | | 43,591 | | | — |
Luxembourg | | | — | | | | 307,294 | | | — |
Mexico | | | — | | | | 322,614 | | | — |
Netherlands | | | — | | | | 487,560 | | | — |
Peru | | | — | | | | 69,989 | | | — |
Poland | | | — | | | | 207,116 | | | — |
Russia | | | — | | | | 218,559 | | | — |
Spain | | | — | | | | 101,292 | | | — |
Supranational Bank | | | — | | | | 109,601 | | | — |
United Arab Emirates | | | — | | | | 266,647 | | | — |
United Kingdom | | | — | | | | 1,137,255 | | | — |
United States | | | — | | | | 1,355,453 | | | — |
Residential Mortgage-Backed Securities | | | | | | | | | | |
Spain | | | — | | | | 41,863 | | | — |
United States | | | — | | | | 409,425 | | | — |
Sovereign Bonds | | | | | | | | | | |
Belgium | | | — | | | | 399,262 | | | — |
Brazil | | | — | | | | 397,990 | | | — |
Bulgaria | | | — | | | | 90,088 | | | — |
Canada | | | — | | | | 182,843 | | | — |
China | | | — | | | | 1,131,069 | | | — |
Colombia | | | — | | | | 534,693 | | | — |
Croatia | | | — | | | | 189,966 | | | — |
Cyprus | | | — | | | | 537,694 | | | — |
France | | | — | | | | 1,367,656 | | | — |
Germany | | | — | | | | 896,998 | | | — |
Greece | | | — | | | | 656,613 | | | — |
Hong Kong | | | — | | | | 65,141 | | | — |
Hungary | | | — | | | | 60,425 | | | — |
Indonesia | | | — | | | | 915,880 | | | — |
Israel | | | — | | | | 172,477 | | | — |
Italy | | | — | | | | 1,838,086 | | | — |
Japan | | | — | | | | 685,634 | | | — |
Kazakhstan | | | — | | | | 99,890 | | | — |
See Notes to Financial Statements.
44
| | | | | | | | | | | | | | |
| | | Level 1 | | | Level 2 | | | Level 3 |
Investments in Securities (continued) | | | | | | | | | | | | | | |
Assets (continued) | | | | | | | | | | | | | | |
Long-Term Investments (continued) | | | | | | | | | | | | | | |
Sovereign Bonds (continued) | | | | | | | | | | | | | | |
Lithuania | | $ | — | | | $ | 75,895 | | | | | $— | | |
Mexico | | | — | | | | 322,769 | | | | | — | | |
New Zealand | | | — | | | | 37,573 | | | | | — | | |
Peru | | | — | | | | 386,920 | | | | | — | | |
Philippines | | | — | | | | 316,438 | | | | | — | | |
Portugal | | | — | | | | 756,189 | | | | | — | | |
Romania | | | — | | | | 306,712 | | | | | — | | |
Saudi Arabia | | | — | | | | 86,418 | | | | | — | | |
Serbia | | | — | | | | 210,049 | | | | | — | | |
Spain | | | — | | | | 1,556,901 | | | | | — | | |
Ukraine | | | — | | | | 86,997 | | | | | — | | |
United Kingdom | | | — | | | | 169,832 | | | | | — | | |
Short-Term Investments | | | | | | | | | | | | | | |
Unaffiliated Fund | | | 1,429,509 | | | | — | | | | | — | | |
Options Purchased | | | — | | | | 28,509 | | | | | — | | |
| | | | | | | | | | | | | | |
Total | | $ | 1,429,509 | | | $ | 25,368,763 | | | | | $— | | |
| | | | | | | | | | | | | | |
| | | | | |
Liabilities | | | | | | | | | | | | | | |
Options Written | | $ | — | | | $ | (32,379 | ) | | | | $— | | |
| | | | | | | | | | | | | | |
| | | | | |
Other Financial Instruments* | | | | | | | | | | | | | | |
Assets | | | | | | | | | | | | | | |
Futures Contracts | | $ | 603,768 | | | $ | — | | | | | $— | | |
OTC Forward Foreign Currency Exchange Contracts | | | — | | | | 199,162 | | | | | — | | |
Centrally Cleared Credit Default Swap Agreements | | | — | | | | 49,955 | | | | | — | | |
OTC Credit Default Swap Agreements | | | — | | | | 51,261 | | | | | — | | |
Centrally Cleared Inflation Swap Agreement | | | — | | | | 10,079 | | | | | — | | |
Centrally Cleared Interest Rate Swap Agreements | | | — | | | | 234,314 | | | | | — | | |
OTC Interest Rate Swap Agreements | | | — | | | | 34,115 | | | | | — | | |
| | | | | | | | | | | | | | |
Total | | $ | 603,768 | | | $ | 578,886 | | | | | $— | | |
| | | | | | | | | | | | | | |
| | | | | |
Liabilities | | | | | | | | | | | | | | |
Futures Contracts | | $ | (32,574 | ) | | $ | — | | | | | $— | | |
OTC Forward Foreign Currency Exchange Contracts | | | — | | | | (119,376 | ) | | | | — | | |
OTC Credit Default Swap Agreements | | | — | | | | (2,443 | ) | | | | — | | |
OTC Currency Swap Agreement | | | — | | | | (5,326 | ) | | | | — | | |
Centrally Cleared Inflation Swap Agreement | | | — | | | | (22,555 | ) | | | | — | | |
Centrally Cleared Interest Rate Swap Agreements | | | — | | | | (1,543,917 | ) | | | | — | | |
OTC Interest Rate Swap Agreements | | | — | | | | (122,761 | ) | | | | — | | |
| | | | | | | | | | | | | | |
Total | | $ | (32,574 | ) | | $ | (1,816,378 | ) | | | | $— | | |
| | | | | | | | | | | | | | |
| * | Other financial instruments are derivative instruments not reflected in the Schedule of Investments, such as futures, forwards and centrally cleared swap contracts, which are recorded at the unrealized appreciation (depreciation) on the instrument, and OTC swap contracts which are recorded at fair value. |
See Notes to Financial Statements.
PGIM International Bond Fund 45
Schedule of Investments (continued)
as of October 31, 2022
Industry Classification:
The industry classification of investments and other assets in excess of liabilities shown as a percentage of net assets as of October 31, 2022 were as follows:
| | | | |
Sovereign Bonds | | | 53.4 | % |
Commercial Mortgage-Backed Securities | | | 7.2 | |
Unaffiliated Fund | | | 5.3 | |
Banks | | | 4.7 | |
Collateralized Loan Obligations | | | 3.4 | |
Telecommunications | | | 2.4 | |
Oil & Gas | | | 2.3 | |
Electric | | | 1.8 | |
Residential Mortgage-Backed Securities | | | 1.6 | |
Commercial Services | | | 1.6 | |
Healthcare-Products | | | 1.5 | |
Insurance | | | 1.3 | |
Foods | | | 1.2 | |
Media | | | 0.9 | |
Auto Manufacturers | | | 0.9 | |
Packaging & Containers | | | 0.8 | |
Transportation | | | 0.8 | |
Lodging | | | 0.7 | |
Retail | | | 0.6 | |
Internet | | | 0.6 | |
Other | | | 0.5 | |
| | | | |
Entertainment | | | 0.5 | % |
Diversified Financial Services | | | 0.5 | |
Chemicals | | | 0.5 | |
Real Estate | | | 0.5 | |
Real Estate Investment Trusts (REITs) | | | 0.4 | |
Multi-National | | | 0.4 | |
Computers | | | 0.3 | |
Machinery-Diversified | | | 0.3 | |
Household Products/Wares | | | 0.3 | |
Consumer Loans | | | 0.3 | |
Gas | | | 0.3 | |
Engineering & Construction | | | 0.3 | |
Beverages | | | 0.2 | |
Options Purchased | | | 0.1 | |
Semiconductors | | | 0.1 | |
| | | | |
| |
| | | 98.5 | |
Options Written | | | (0.1 | ) |
Other assets in excess of liabilities | | | 1.6 | |
| | | | |
| |
| | | 100.0 | % |
| | | | |
Effects of Derivative Instruments on the Financial Statements and Primary Underlying Risk Exposure:
The Fund invested in derivative instruments during the reporting period. The primary types of risk associated with these derivative instruments are credit contracts risk, foreign exchange contracts risk and interest rate contracts risk. See the Notes to Financial Statements for additional detail regarding these derivative instruments and their risks. The effect of such derivative instruments on the Fund’s financial position and financial performance as reflected in the Statement of Assets and Liabilities and Statement of Operations is presented in the summary below.
Fair values of derivative instruments as of October 31, 2022 as presented in the Statement of Assets and Liabilities:
| | | | | | | | | | | | | | | | | | | | |
| | | | | Asset Derivatives | | | | | Liability Derivatives | |
Derivatives not accounted for as hedging instruments, carried at fair value | | | | Statement of Assets and Liabilities Location | | | | Fair
Value | | | | | Statement of Assets and Liabilities Location | | | | Fair
Value | |
Credit contracts | | | | Due from/to broker-variation margin swaps | | | | $ | 49,955 | * | | | | — | | | | $ | — | |
Credit contracts | | | | Premiums paid for OTC swap agreements | | | | | 51,097 | | | | | Premiums received for OTC swap agreements | | | | | 7,718 | |
See Notes to Financial Statements.
46
| | | | | | | | | | | | | | | | | | | | |
| | | | | Asset Derivatives | | | | | Liability Derivatives | |
Derivatives not accounted for as hedging instruments, carried at fair value | | | | Statement of Assets and Liabilities Location | | | | Fair
Value | | | | | Statement of Assets and Liabilities Location | | | | Fair
Value | |
Credit contracts | | | | Unrealized appreciation on OTC swap agreements | | | | $ | 11,848 | | | | | Unrealized depreciation on OTC swap agreements | | | | $ | 6,409 | |
Foreign exchange contracts | | | | Due from/to broker-variation margin futures | | | | | 238,301 | * | | | | — | | | | | — | |
Foreign exchange contracts | | | | Unrealized appreciation on OTC forward foreign currency exchange contracts | | | | | 199,162 | | | | | Unrealized depreciation on OTC forward foreign currency exchange contracts | | | | | 119,376 | |
Interest rate contracts | | | | Due from/to broker-variation margin futures | | | | | 365,467 | * | | | | Due from/to broker-variation margin futures | | | | | 32,574 | * |
Interest rate contracts | | | | Due from/to broker-variation margin swaps | | | | | 244,393 | * | | | | Due from/to broker-variation margin swaps | | | | | 1,566,472 | * |
Interest rate contracts | | | | Premiums paid for OTC swap agreements | | | | | 21 | | | | | Premiums received for OTC swap agreements | | | | | 41 | |
Interest rate contracts | | | | Unaffiliated investments | | | | | 28,509 | | | | | Options written outstanding, at value | | | | | 32,379 | |
Interest rate contracts | | | | Unrealized appreciation on OTC swap agreements | | | | | 34,098 | | | | | Unrealized depreciation on OTC swap agreements | | | | | 128,050 | |
| | | | | | | | | | | | | | | | | | | | |
| | | | | | | | |
| | | | | | | | $ | 1,222,851 | | | | | | | | | $ | 1,893,019 | |
| | | | | | | | | | | | | | | | | | | | |
| * | Includes cumulative appreciation (depreciation) as reported in the schedule of open futures and centrally cleared swap contracts. Only unsettled variation margin receivable (payable) is reported within the Statement of Assets and Liabilities. |
The effects of derivative instruments on the Statement of Operations for the year ended October 31, 2022 are as follows:
| | | | | | | | | | | | |
Amount of Realized Gain (Loss) on Derivatives Recognized in Income | |
| | | | | | Forward | | | | |
| | | | | | Currency | | | | |
| Derivatives not accounted for as hedging | | | | | Exchange | | | | |
instruments, carried at fair value | | Futures | | | Contracts | | | Swaps | |
| | | |
Credit contracts | | $ | — | | | $ | — | | | $ | (451,391 | ) |
Foreign exchange contracts | | | 3,953,456 | | | | 435,906 | | | | — | |
Interest rate contracts | | | 743,904 | | | | — | | | | (684,226 | ) |
| | | | | | | | | | | | |
| | | |
Total | | $ | 4,697,360 | | | $ | 435,906 | | | $ | (1,135,617 | ) |
| | | | | | | | | | | | |
See Notes to Financial Statements.
PGIM International Bond Fund 47
Schedule of Investments (continued)
as of October 31, 2022
| | | | | | | | | | | | | | | | | | | | | | | | |
Change in Unrealized Appreciation (Depreciation) on Derivatives Recognized in Income | |
| | | | | | | | | | | | | | | | Forward | | | | |
| Derivatives not accounted for | | | | | | | | | | | | | | | Currency | | | | |
| as hedging instruments, | | Options | | Options | | | | | | Exchange | | | | |
carried at fair value | | Purchased(1) | | Written | | | Futures | | | Contracts | | | Swaps | |
Credit contracts | | | | $ | — | | | | | $ | — | | | $ | — | | | $ | — | | | $ | (10,712 | ) |
Foreign exchange contracts | | | | | — | | | | | | — | | | | (282,435 | ) | | | 106,777 | | | | — | |
Interest rate contracts | | | | | 22,063 | | | | | | (24,235 | ) | | | 157,652 | | | | — | | | | (1,240,005 | ) |
| | | | | | | | | | | | | | | | | | | | | | | | |
| | | | | | | |
Total | | | | $ | 22,063 | | | | | $ | (24,235 | ) | | $ | (124,783 | ) | | $ | 106,777 | | | $ | (1,250,717 | ) |
| | | | | | | | | | | | | | | | | | | | | | | | |
| (1) | Included in net change in unrealized appreciation (depreciation) on investments in the Statement of Operations. |
For the year ended October 31, 2022, the Fund’s average volume of derivative activities is as follows:
| | | | | | | | |
| Derivative Contract Type | | Average Volume of Derivative Activities* |
Options Purchased (1) | | | | $ | 6,300 | | | |
Options Written (2) | | | | | 1,000,000 | | | |
Futures Contracts - Long Positions (2) | | | | | 4,106,950 | | | |
Futures Contracts - Short Positions (2) | | | | | 39,791,830 | | | |
Forward Foreign Currency Exchange Contracts - Purchased (3) | | | | | 6,407,405 | | | |
Forward Foreign Currency Exchange Contracts - Sold (3) | | | | | 10,336,858 | | | |
Interest Rate Swap Agreements (2) | | | | | 49,526,931 | | | |
Credit Default Swap Agreements - Buy Protection (2) | | | | | 1,719,280 | | | |
Credit Default Swap Agreements - Sell Protection (2) | | | | | 6,019,076 | | | |
Currency Swap Agreements (2) | | | | | 138,169 | | | |
Inflation Swap Agreements (2) | | | | | 671,576 | | | |
| * | Average volume is based on average quarter end balances as noted for the year ended October 31, 2022. |
| (2) | Notional Amount in USD. |
| (3) | Value at Settlement Date. |
Financial Instruments/Transactions—Summary of Offsetting and Netting Arrangements:
The Fund invested in OTC derivatives during the reporting period that are either offset in accordance with current requirements or are subject to enforceable master netting arrangements or similar agreements that permit offsetting. The information about offsetting and related netting arrangements for OTC derivatives where the legal right to set-off exists is presented in the summary below.
Offsetting of OTC derivative assets and liabilities:
| | | | | | | | | | | | | | | | | | | | | | | | | | | | | | | | | | |
Counterparty | | Gross Amounts of
Recognized
Assets(1) | | | | | | Gross Amounts of
Recognized
Liabilities(1) | | | | | | Net Amounts of
Recognized
Assets/
(Liabilities) | | | | | | Collateral
Pledged/(Received)(2) | | | | | Net Amount | |
BARC | | $ | 51,045 | | | | | | | $ | (10,538 | ) | | | | | | $ | 40,507 | | | | | | | $— | | | | | | $ | 40,507 | |
See Notes to Financial Statements.
48
| | | | | | | | | | | | | | | | | | | | | | | | | | | | | | | | |
Counterparty | | Gross Amounts of
Recognized
Assets(1) | | | | | | Gross Amounts of
Recognized
Liabilities(1) | | | | | | Net Amounts of
Recognized
Assets/
(Liabilities) | | | | | | Collateral
Pledged/(Received)(2) | | | | Net Amount | |
BNP | | $ | 12,692 | | | | | | | $ | (12,405 | ) | | | | | | $ | 287 | | | | | | | $— | | | | $ | 287 | |
BOA | | | 5,443 | | | | | | | | (7,023 | ) | | | | | | | (1,580 | ) | | | | | | — | | | | | (1,580 | ) |
CITI | | | 38,525 | | | | | | | | (99,894 | ) | | | | | | | (61,369 | ) | | | | | | — | | | | | (61,369 | ) |
CS | | | 346 | | | | | | | | — | | | | | | | | 346 | | | | | | | — | | | | | 346 | |
DB | | | 28,509 | | | | | | | | (32,884 | ) | | | | | | | (4,375 | ) | | | | | | — | | | | | (4,375 | ) |
GSI | | | 104,527 | | | | | | | | (26,003 | ) | | | | | | | 78,524 | | | | | | | — | | | | | 78,524 | |
HSBC | | | 30,470 | | | | | | | | (16,534 | ) | | | | | | | 13,936 | | | | | | | — | | | | | 13,936 | |
JPM | | | 16,686 | | | | | | | | (7,840 | ) | | | | | | | 8,846 | | | | | | | — | | | | | 8,846 | |
MSI | | | 26,820 | | | | | | | | (80,341 | ) | | | | | | | (53,521 | ) | | | | | | — | | | | | (53,521 | ) |
SCB | | | 7,772 | | | | | | | | — | | | | | | | | 7,772 | | | | | | | — | | | | | 7,772 | |
TD | | | 271 | | | | | | | | (511 | ) | | | | | | | (240 | ) | | | | | | — | | | | | (240 | ) |
UAG | | | 1,629 | | | | | | | | — | | | | | | | | 1,629 | | | | | | | — | | | | | 1,629 | |
| | | | | | | | | | | | | | | | | | | | | | | | | | | | | | | | |
| | | | | | | | | |
| | $ | 324,735 | | | | | | | $ | (293,973 | ) | | | | | | $ | 30,762 | | | | | | | $— | | | | $ | 30,762 | |
| | | | | | | | | | | | | | | | | | | | | | | | | | | | | | | | |
| (1) | Includes unrealized appreciation/(depreciation) on swaps and forwards, premiums paid/(received) on swap agreements and market value of purchased and written options, as represented on the Statement of Assets and Liabilities. |
| (2) | Collateral amount disclosed by the Fund is limited to the market value of financial instruments/transactions and the Fund’s OTC derivative exposure by counterparty. |
See Notes to Financial Statements.
PGIM International Bond Fund 49
Statement of Assets and Liabilities
as of October 31, 2022
| | | | |
| Assets | | | |
| |
Unaffiliated investments (cost $34,504,318) | | $ | 26,798,272 | |
Foreign currency, at value (cost $55,612) | | | 55,414 | |
Dividends and interest receivable | | | 286,338 | |
Unrealized appreciation on OTC forward foreign currency exchange contracts | | | 199,162 | |
Due from broker—variation margin futures | | | 173,120 | |
Premiums paid for OTC swap agreements | | | 51,118 | |
Unrealized appreciation on OTC swap agreements | | | 45,946 | |
Receivable for Fund shares sold | | | 15,243 | |
Due from Manager | | | 2,962 | |
Prepaid expenses and other assets | | | 12,955 | |
| | | | |
| |
Total Assets | | | 27,640,530 | |
| | | | |
| |
Liabilities | | | | |
| |
Unrealized depreciation on OTC swap agreements | | | 134,459 | |
Unrealized depreciation on OTC forward foreign currency exchange contracts | | | 119,376 | |
Audit fee payable | | | 50,500 | |
Options written outstanding, at value (premiums received $7,500) | | | 32,379 | |
Due to broker—variation margin swaps | | | 29,062 | |
Custodian and accounting fees payable | | | 22,242 | |
Payable for Fund shares purchased | | | 17,573 | |
Accrued expenses and other liabilities | | | 14,475 | |
Premiums received for OTC swap agreements | | | 7,759 | |
Trustees’ fees payable | | | 841 | |
Affiliated transfer agent fee payable | | | 201 | |
Distribution fee payable | | | 75 | |
Dividends payable | | | 15 | |
| | | | |
| |
Total Liabilities | | | 428,957 | |
| | | | |
| |
Net Assets | | $ | 27,211,573 | |
| | | | |
| |
| | | | | |
| |
Net assets were comprised of: | | | | |
Shares of beneficial interest, at par | | $ | 3,692 | |
Paid-in capital in excess of par | | | 35,239,361 | |
Total distributable earnings (loss) | | | (8,031,480 | ) |
| | | | |
| |
Net assets, October 31, 2022 | | $ | 27,211,573 | |
| | | | |
See Notes to Financial Statements.
50
| | | | | | | | |
| | |
| Class A | | | | | | | | |
| | |
Net asset value and redemption price per share, | | | | | | | | |
($218,687 ÷ 29,679 shares of beneficial interest issued and outstanding) | | $ | 7.37 | | | | | |
Maximum sales charge (3.25% of offering price) | | | 0.25 | | | | | |
| | | | | | | | |
| | |
Maximum offering price to public | | $ | 7.62 | | | | | |
| | | | | | | | |
| | |
| Class C | | | | | | | | |
| | |
Net asset value, offering price and redemption price per share, | | | | | | | | |
($32,770 ÷ 4,449 shares of beneficial interest issued and outstanding) | | $ | 7.37 | | | | | |
| | | | | | | | |
| | |
| Class Z | | | | | | | | |
| | |
Net asset value, offering price and redemption price per share, | | | | | | | | |
($789,145 ÷ 107,108 shares of beneficial interest issued and outstanding) | | $ | 7.37 | | | | | |
| | | | | | | | |
| | |
| Class R6 | | | | | | | | |
| | |
Net asset value, offering price and redemption price per share, | | | | | | | | |
($26,170,971 ÷ 3,551,208 shares of beneficial interest issued and outstanding) | | $ | 7.37 | | | | | |
| | | | | | | | |
See Notes to Financial Statements.
PGIM International Bond Fund 51
Statement of Operations
Year Ended October 31, 2022
| | | | |
| |
| Net Investment Income (Loss) | | | | |
| |
Income | | | | |
Interest income (net of $2,158 foreign withholding tax) | | $ | 796,689 | |
Unaffiliated dividend income | | | 8,120 | |
Affiliated dividend income | | | 156 | |
| | | | |
| |
Total income | | | 804,965 | |
| | | | |
| |
Expenses | | | | |
Management fee | | | 152,076 | |
Distribution fee(a) | | | 1,144 | |
Custodian and accounting fees | | | 66,142 | |
Audit fee | | | 50,500 | |
Registration fees(a) | | | 25,301 | |
Legal fees and expenses | | | 21,200 | |
Shareholders’ reports | | | 16,299 | |
Trustees’ fees | | | 9,788 | |
Transfer agent’s fees and expenses (including affiliated expense of $1,220)(a) | | | 2,570 | |
Miscellaneous | | | 19,255 | |
| | | | |
| |
Total expenses | | | 364,275 | |
Less: Fee waiver and/or expense reimbursement(a) | | | (185,562 | ) |
| | | | |
| |
Net expenses | | | 178,713 | |
| | | | |
| |
Net investment income (loss) | | | 626,252 | |
| | | | |
| |
| Realized And Unrealized Gain (Loss) On Investment And Foreign Currency Transactions | | | | |
| |
Net realized gain (loss) on: | | | | |
Investment transactions | | | (287,989 | ) |
Futures transactions | | | 4,697,360 | |
Forward currency contract transactions | | | 435,906 | |
Swap agreement transactions | | | (1,135,617 | ) |
Foreign currency transactions | | | (309,965 | ) |
| | | | |
| |
| | | 3,399,695 | |
| | | | |
Net change in unrealized appreciation (depreciation) on: | | | | |
Investments | | | (9,180,991 | ) |
Futures | | | (124,783 | ) |
Forward currency contracts | | | 106,777 | |
Options written | | | (24,235 | ) |
Swap agreements | | | (1,250,717 | ) |
Foreign currencies | | | (63,683 | ) |
| | | | |
| |
| | | (10,537,632 | ) |
| | | | |
| |
Net gain (loss) on investment and foreign currency transactions | | | (7,137,937 | ) |
| | | | |
| |
Net Increase (Decrease) In Net Assets Resulting From Operations | | $ | (6,511,685 | ) |
| | | | |
See Notes to Financial Statements.
52
| (a) | Class specific expenses and waivers were as follows: |
| | | | | | | | | | | | | | | | |
| | | Class A | | | Class C | | | Class Z | | | Class R6 | |
Distribution fee | | | 630 | | | | 514 | | | | — | | | | — | |
Registration fees | | | 6,200 | | | | 5,451 | | | | 8,200 | | | | 5,450 | |
Transfer agent’s fees and expenses | | | 1,218 | | | | 257 | | | | 682 | | | | 413 | |
Fee waiver and/or expense reimbursement | | | (8,330 | ) | | | (5,892 | ) | | | (15,216 | ) | | | (156,124 | ) |
See Notes to Financial Statements.
PGIM International Bond Fund 53
Statements of Changes in Net Assets
| | | | | | | | |
| |
| | | Year Ended
October 31, | |
| | |
| | | 2022 | | | 2021 | |
| | |
| Increase (Decrease) in Net Assets | | | | | | | | |
| | |
Operations | | | | | | | | |
Net investment income (loss) | | $ | 626,252 | | | $ | 659,213 | |
Net realized gain (loss) on investment and foreign currency transactions | | | 3,399,695 | | | | 1,621,948 | |
Net change in unrealized appreciation (depreciation) on investments and foreign currencies | | | (10,537,632 | ) | | | (2,640,034 | ) |
| | | | | | | | |
| | |
Net increase (decrease) in net assets resulting from operations | | | (6,511,685 | ) | | | (358,873 | ) |
| | | | | | | | |
| | |
Dividends and Distributions | | | | | | | | |
Distributions from distributable earnings | | | | | | | | |
Class A | | | (13,794 | ) | | | (11,618 | ) |
Class C | | | (2,261 | ) | | | (5,396 | ) |
Class Z | | | (84,987 | ) | | | (221,194 | ) |
Class R6 | | | (1,698,473 | ) | | | (1,074,118 | ) |
| | | | | | | | |
| | |
| | | (1,799,515 | ) | | | (1,312,326 | ) |
| | | | | | | | |
Fund share transactions (Net of share conversions) | | | | | | | | |
Net proceeds from shares sold | | | 1,242,724 | | | | 2,351,743 | |
Net asset value of shares issued in reinvestment of dividends and distributions | | | 1,799,179 | | | | 1,312,012 | |
Cost of shares purchased | | | (2,289,882 | ) | | | (16,437,684 | ) |
| | | | | | | | |
| | |
Net increase (decrease) in net assets from Fund share transactions | | | 752,021 | | | | (12,773,929 | ) |
| | | | | | | | |
| | |
Total increase (decrease) | | | (7,559,179 | ) | | | (14,445,128 | ) |
| | |
| Net Assets: | | | | | | | | |
| | |
Beginning of year | | | 34,770,752 | | | | 49,215,880 | |
| | | | | | | | |
| | |
End of year | | $ | 27,211,573 | | | $ | 34,770,752 | |
| | | | | | | | |
See Notes to Financial Statements.
54
Financial Highlights
| | | | | | | | | | | | | | | | | | | | |
| Class A Shares | | | | | | | | | | | | | | | |
| | | Year Ended October 31, | |
| | 2022 | | | 2021 | | | 2020 | | | 2019 | | | 2018 | |
Per Share Operating Performance(a): | | | | | | | | | | | | | | | | | | | | |
Net Asset Value, Beginning of Year | | | $9.65 | | | | $10.13 | | | | $10.83 | | | | $10.22 | | | | $10.44 | |
Income (loss) from investment operations: | | | | | | | | | | | | | | | | | | | | |
Net investment income (loss) | | | 0.14 | | | | 0.13 | | | | 0.14 | | | | 0.14 | | | | 0.12 | |
| Net realized and unrealized gain (loss) on investment and foreign currency transactions | | | (1.95 | ) | | | (0.32 | ) | | | 0.10 | | | | 1.43 | | | | (0.08 | ) |
Total from investment operations | | | (1.81 | ) | | | (0.19 | ) | | | 0.24 | | | | 1.57 | | | | 0.04 | |
Less Dividends and Distributions: | | | | | | | | | | | | | | | | | | | | |
Dividends from net investment income | | | (0.16 | ) | | | (0.29 | ) | | | (0.53 | ) | | | (0.96 | ) | | | (0.26 | ) |
Tax return of capital distributions | | | - | | | | - | | | | (0.24 | ) | | | - | | | | - | |
Distributions from net realized gains | | | (0.31 | ) | | | - | | | | (0.17 | ) | | | - | | | | - | |
Total dividends and distributions | | | (0.47 | ) | | | (0.29 | ) | | | (0.94 | ) | | | (0.96 | ) | | | (0.26 | ) |
Net asset value, end of year | | | $7.37 | | | | $9.65 | | | | $10.13 | | | | $10.83 | | | | $10.22 | |
Total Return(b): | | | (19.41 | )% | | | (1.93 | )% | | | 2.30 | % | | | 16.52 | % | | | 0.40 | % |
| | | | | | | | | | | | | | | | | | | | | |
| Ratios/Supplemental Data: | | | | | | | | | | | | | | | |
Net assets, end of year (000) | | | $219 | | | | $275 | | | | $523 | | | | $267 | | | | $103 | |
Average net assets (000) | | | $252 | | | | $397 | | | | $383 | | | | $163 | | | | $99 | |
Ratios to average net assets(c): | | | | | | | | | | | | | | | | | | | | |
Expenses after waivers and/or expense reimbursement | | | 0.99 | % | | | 0.99 | % | | | 0.99 | % | | | 0.99 | % | | | 0.99 | % |
Expenses before waivers and/or expense reimbursement | | | 4.29 | % | | | 3.34 | % | | | 4.24 | % | | | 9.63 | % | | | 17.44 | % |
Net investment income (loss) | | | 1.65 | % | | | 1.29 | % | | | 1.42 | % | | | 1.35 | % | | | 1.14 | % |
Portfolio turnover rate(d) | | | 17 | % | | | 29 | % | | | 16 | % | | | 49 | % | | | 35 | % |
| (a) | Calculated based on average shares outstanding during the year. |
| (b) | Total return does not consider the effects of sales loads. Total return is calculated assuming a purchase of a share on the first day and a sale on the last day of each year reported and includes reinvestment of dividends and distributions, if any. Total returns may reflect adjustments to conform to GAAP. |
| (c) | Does not include expenses of the underlying funds in which the Fund invests. |
| (d) | The Fund’s portfolio turnover rate is calculated in accordance with regulatory requirements, without regard to transactions involving short-term investments, certain derivatives and in-kind transactions (if any). If such transactions were included, the Fund’s portfolio turnover rate may be higher. |
See Notes to Financial Statements.
PGIM International Bond Fund 55
Financial Highlights (continued)
| | | | | | | | | | | | | | | | | | | | |
| Class C Shares | | | | | | | | | | | | | | | |
| | | Year Ended October 31, | |
| | 2022 | | | 2021 | | | 2020 | | | 2019 | | | 2018 | |
Per Share Operating Performance(a): | | | | | | | | | | | | | | | | | | | | |
Net Asset Value, Beginning of Year | | | $9.65 | | | | $10.13 | | | | $10.83 | | | | $10.22 | | | | $10.44 | |
Income (loss) from investment operations: | | | | | | | | | | | | | | | | | | | | |
Net investment income (loss) | | | 0.07 | | | | 0.05 | | | | 0.06 | | | | 0.03 | | | | 0.04 | |
| Net realized and unrealized gain (loss) on investment and foreign currency transactions | | | (1.95 | ) | | | (0.31 | ) | | | 0.10 | | | | 1.46 | | | | (0.07 | ) |
Total from investment operations | | | (1.88 | ) | | | (0.26 | ) | | | 0.16 | | | | 1.49 | | | | (0.03 | ) |
Less Dividends and Distributions: | | | | | | | | | | | | | | | | | | | | |
Dividends from net investment income | | | (0.09 | ) | | | (0.22 | ) | | | (0.45 | ) | | | (0.88 | ) | | | (0.19 | ) |
Tax return of capital distributions | | | - | | | | - | | | | (0.24 | ) | | | - | | | | - | |
Distributions from net realized gains | | | (0.31 | ) | | | - | | | | (0.17 | ) | | | - | | | | - | |
Total dividends and distributions | | | (0.40 | ) | | | (0.22 | ) | | | (0.86 | ) | | | (0.88 | ) | | | (0.19 | ) |
Net asset value, end of year | | | $7.37 | | | | $9.65 | | | | $10.13 | | | | $10.83 | | | | $10.22 | |
Total Return(b): | | | (20.13 | )% | | | (2.66 | )% | | | 1.61 | % | | | 15.65 | % | | | (0.34 | )% |
| | | | | | | | | | | | | | | | | | | | | |
| Ratios/Supplemental Data: | | | | | | | | | | | | | | | |
Net assets, end of year (000) | | | $33 | | | | $95 | | | | $311 | | | | $45 | | | | $16 | |
Average net assets (000) | | | $51 | | | | $250 | | | | $222 | | | | $31 | | | | $13 | |
Ratios to average net assets(c): | | | | | | | | | | | | | | | | | | | | |
Expenses after waivers and/or expense reimbursement | | | 1.74 | % | | | 1.74 | % | | | 1.74 | % | | | 1.74 | % | | | 1.74 | % |
Expenses before waivers and/or expense reimbursement | | | 13.21 | % | | | 4.44 | % | | | 6.58 | % | | | 43.49 | % | | | 124.78 | % |
Net investment income (loss) | | | 0.88 | % | | | 0.54 | % | | | 0.63 | % | | | 0.33 | % | | | 0.41 | % |
Portfolio turnover rate(d) | | | 17 | % | | | 29 | % | | | 16 | % | | | 49 | % | | | 35 | % |
| (a) | Calculated based on average shares outstanding during the year. |
| (b) | Total return does not consider the effects of sales loads. Total return is calculated assuming a purchase of a share on the first day and a sale on the last day of each year reported and includes reinvestment of dividends and distributions, if any. Total returns may reflect adjustments to conform to GAAP. |
| (c) | Does not include expenses of the underlying funds in which the Fund invests. |
| (d) | The Fund’s portfolio turnover rate is calculated in accordance with regulatory requirements, without regard to transactions involving short-term investments, certain derivatives and in-kind transactions (if any). If such transactions were included, the Fund’s portfolio turnover rate may be higher. |
See Notes to Financial Statements.
56
| | | | | | | | | | | | | | | | | | | | |
| Class Z Shares | | | | | | | | | | | | | | | |
| | | Year Ended October 31, | |
| | 2022 | | | 2021 | | | 2020 | | | 2019 | | | 2018 | |
Per Share Operating Performance(a): | | | | | | | | | | | | | | | | | | | | |
Net Asset Value, Beginning of Year | | | $9.65 | | | | $10.13 | | | | $10.83 | | | | $10.23 | | | | $10.44 | |
Income (loss) from investment operations: | | | | | | | | | | | | | | | | | | | | |
Net investment income (loss) | | | 0.17 | | | | 0.17 | | | | 0.18 | | | | 0.14 | | | | 0.15 | |
| Net realized and unrealized gain (loss) on investment and foreign currency transactions | | | (1.95 | ) | | | (0.32 | ) | | | 0.09 | | | | 1.45 | | | | (0.07 | ) |
Total from investment operations | | | (1.78 | ) | | | (0.15 | ) | | | 0.27 | | | | 1.59 | | | | 0.08 | |
Less Dividends and Distributions: | | | | | | | | | | | | | | | | | | | | |
Dividends from net investment income | | | (0.19 | ) | | | (0.33 | ) | | | (0.56 | ) | | | (0.99 | ) | | | (0.29 | ) |
Tax return of capital distributions | | | - | | | | - | | | | (0.24 | ) | | | - | | | | - | |
Distributions from net realized gains | | | (0.31 | ) | | | - | | | | (0.17 | ) | | | - | | | | - | |
Total dividends and distributions | | | (0.50 | ) | | | (0.33 | ) | | | (0.97 | ) | | | (0.99 | ) | | | (0.29 | ) |
Net asset value, end of year | | | $7.37 | | | | $9.65 | | | | $10.13 | | | | $10.83 | | | | $10.23 | |
Total Return(b): | | | (19.12 | )% | | | (1.57 | )% | | | 2.66 | % | | | 16.80 | % | | | 0.75 | % |
| | | | | | | | | | | | | | | | | | | | | |
| Ratios/Supplemental Data: | | | | | | | | | | | | | | | |
Net assets, end of year (000) | | | $789 | | | | $2,537 | | | | $16,104 | | | | $3,466 | | | | $160 | |
Average net assets (000) | | | $1,348 | | | | $6,683 | | | | $10,840 | | | | $1,763 | | | | $140 | |
Ratios to average net assets(c): | | | | | | | | | | | | | | | | | | | | |
Expenses after waivers and/or expense reimbursement | | | 0.63 | % | | | 0.63 | % | | | 0.63 | % | | | 0.74 | % | | | 0.74 | % |
Expenses before waivers and/or expense reimbursement | | | 1.76 | % | | | 1.33 | % | | | 1.31 | % | | | 2.16 | % | | | 12.47 | % |
Net investment income (loss) | | | 1.94 | % | | | 1.66 | % | | | 1.74 | % | | | 1.28 | % | | | 1.43 | % |
Portfolio turnover rate(d) | | | 17 | % | | | 29 | % | | | 16 | % | | | 49 | % | | | 35 | % |
| (a) | Calculated based on average shares outstanding during the year. |
| (b) | Total return is calculated assuming a purchase of a share on the first day and a sale on the last day of each year reported and includes reinvestment of dividends and distributions, if any. Total returns may reflect adjustments to conform to GAAP. |
| (c) | Does not include expenses of the underlying funds in which the Fund invests. |
| (d) | The Fund’s portfolio turnover rate is calculated in accordance with regulatory requirements, without regard to transactions involving short-term investments, certain derivatives and in-kind transactions (if any). If such transactions were included, the Fund’s portfolio turnover rate may be higher. |
See Notes to Financial Statements.
PGIM International Bond Fund 57
Financial Highlights (continued)
| | | | | | | | | | | | | | | | | | | | |
| Class R6 Shares | | | | | | | | | | | | | | | |
| | | Year Ended October 31, | |
| | 2022 | | | 2021 | | | 2020 | | | 2019 | | | 2018 | |
Per Share Operating Performance(a): | | | | | | | | | | | | | | | | | | | | |
Net Asset Value, Beginning of Year | | | $9.66 | | | | $10.13 | | | | $10.84 | | | | $10.23 | | | | $10.44 | |
Income (loss) from investment operations: | | | | | | | | | | | | | | | | | | | | |
Net investment income (loss) | | | 0.17 | | | | 0.17 | | | | 0.19 | | | | 0.18 | | | | 0.14 | |
| Net realized and unrealized gain (loss) on investment and foreign currency transactions | | | (1.96 | ) | | | (0.31 | ) | | | 0.08 | | | | 1.42 | | | | (0.06 | ) |
Total from investment operations | | | (1.79 | ) | | | (0.14 | ) | | | 0.27 | | | | 1.60 | | | | 0.08 | |
Less Dividends and Distributions: | | | | | | | | | | | | | | | | | | | | |
Dividends from net investment income | | | (0.19 | ) | | | (0.33 | ) | | | (0.57 | ) | | | (0.99 | ) | | | (0.29 | ) |
Tax return of capital distributions | | | - | | | | - | | | | (0.24 | ) | | | - | | | | - | |
Distributions from net realized gains | | | (0.31 | ) | | | - | | | | (0.17 | ) | | | - | | | | - | |
Total dividends and distributions | | | (0.50 | ) | | | (0.33 | ) | | | (0.98 | ) | | | (0.99 | ) | | | (0.29 | ) |
Net asset value, end of year | | | $7.37 | | | | $9.66 | | | | $10.13 | | | | $10.84 | | | | $10.23 | |
Total Return(b): | | | (19.08 | )% | | | (1.53 | )% | | | 2.71 | % | | | 16.81 | % | | | 0.75 | % |
| | | | | | | | | | | | | | | | | | | | | |
| Ratios/Supplemental Data: | | | | | | | | | | | | | | | |
Net assets, end of year (000) | | | $26,171 | | | | $31,863 | | | | $32,278 | | | | $31,421 | | | | $26,850 | |
Average net assets (000) | | | $28,764 | | | | $32,477 | | | | $31,522 | | | | $29,104 | | | | $26,854 | |
Ratios to average net assets(c): | | | | | | | | | | | | | | | | | | | | |
Expenses after waivers and/or expense reimbursement | | | 0.58 | % | | | 0.58 | % | | | 0.59 | % | | | 0.74 | % | | | 0.74 | % |
Expenses before waivers and/or expense reimbursement | | | 1.12 | % | | | 1.02 | % | | | 1.13 | % | | | 1.40 | % | | | 1.55 | % |
Net investment income (loss) | | | 2.07 | % | | | 1.67 | % | | | 1.84 | % | | | 1.75 | % | | | 1.39 | % |
Portfolio turnover rate(d) | | | 17 | % | | | 29 | % | | | 16 | % | | | 49 | % | | | 35 | % |
| (a) | Calculated based on average shares outstanding during the year. |
| (b) | Total return is calculated assuming a purchase of a share on the first day and a sale on the last day of each year reported and includes reinvestment of dividends and distributions, if any. Total returns may reflect adjustments to conform to GAAP. |
| (c) | Does not include expenses of the underlying funds in which the Fund invests. |
| (d) | The Fund’s portfolio turnover rate is calculated in accordance with regulatory requirements, without regard to transactions involving short-term investments, certain derivatives and in-kind transactions (if any). If such transactions were included, the Fund’s portfolio turnover rate may be higher. |
See Notes to Financial Statements.
58
Notes to Financial Statements
1. Organization
Prudential Investment Portfolios 9 (the “Registered Investment Company” or “RIC”) is registered under the Investment Company Act of 1940, as amended (“1940 Act”), as an open-end management investment company. The RIC is organized as a Delaware Statutory Trust. These financial statements relate only to the PGIM International Bond Fund (the “Fund”), a series of the RIC. The Fund is classified as a non-diversified fund for purposes of the 1940 Act.
The investment objective of the Fund is to seek total return, made up of current income and capital appreciation.
2. Accounting Policies
The Fund follows the investment company accounting and reporting guidance of the Financial Accounting Standards Board (“FASB”) Accounting Standard Codification (“ASC”) Topic 946 Financial Services — Investment Companies. The following is a summary of significant accounting policies followed by the Fund in the preparation of its financial statements. The policies conform to U.S. generally accepted accounting principles (“GAAP”). The Fund consistently follows such policies in the preparation of its financial statements.
Securities Valuation: The Fund holds securities and other assets and liabilities that are fair valued as of the close of each day (generally, 4:00 PM Eastern time) the New York Stock Exchange (“NYSE”) is open for trading. As described in further detail below, the Fund’s investments are valued daily based on a number of factors, including the type of investment and whether market quotations are readily available. The RIC’s Board of Trustees (the “Board”) has approved the Fund’s valuation policies and procedures for security valuation and designated to PGIM Investments LLC (“PGIM Investments” or the “Manager”) as the Valuation Designee pursuant to SEC Rule 2a-5(b) to perform the fair value determination relating to all Fund investments. Pursuant to the Board’s oversight, the Valuation Designee has established a Valuation Committee to perform the duties and responsibilities as valuation designee under SEC Rule 2a-5. The valuation procedures permit the Fund to utilize independent pricing vendor services, quotations from market makers, and alternative valuation methods when market quotations are either not readily available or not deemed representative of fair value. Fair value is the price that would be received to sell an asset or paid to transfer a liability in an orderly transaction between market participants on the measurement date. A record of the Valuation Committee’s actions is provided to the Board at the first quarterly meeting following the quarter in which such actions take place.
For the fiscal reporting year-end, securities and other assets and liabilities were fair valued at the close of the last U.S. business day. Trading in certain foreign securities may occur when
PGIM International Bond Fund 59
Notes to Financial Statements (continued)
the NYSE is closed (including weekends and holidays). Because such foreign securities trade in markets that are open on weekends and U.S. holidays, the values of some of the Fund’s foreign investments may change on days when investors cannot purchase or redeem Fund shares.
Various inputs determine how the Fund’s investments are valued, all of which are categorized according to the three broad levels (Level 1, 2, or 3) detailed in the Schedule of Investments and referred to herein as the “fair value hierarchy” in accordance with FASB ASC Topic 820 - Fair Value Measurement.
Common or preferred stocks, exchange-traded funds and derivative instruments, if applicable, that are traded on a national securities exchange are valued at the last sale price as of the close of trading on the applicable exchange where the security principally trades. Securities traded via NASDAQ are valued at the NASDAQ official closing price. To the extent these securities are valued at the last sale price or NASDAQ official closing price, they are classified as Level 1 in the fair value hierarchy. In the event that no sale or official closing price on valuation date exists, these securities are generally valued at the mean between the last reported bid and ask prices, or at the last bid price in the absence of an ask price. These securities are classified as Level 2 in the fair value hierarchy.
Investments in open-end funds (other than exchange-traded funds) are valued at their net asset values as of the close of the NYSE on the date of valuation. These securities are classified as Level 1 in the fair value hierarchy since they may be purchased or sold at their net asset values on the date of valuation.
Fixed income securities traded in the OTC market are generally classified as Level 2 in the fair value hierarchy. Such fixed income securities are typically valued using the market approach which generally involves obtaining data from an approved independent third-party vendor source. The Fund utilizes the market approach as the primary method to value securities when market prices of identical or comparable instruments are available. The third-party vendors’ valuation techniques used to derive the evaluated bid price are based on evaluating observable inputs, including but not limited to, yield curves, yield spreads, credit ratings, deal terms, tranche level attributes, default rates, cash flows, prepayment speeds, broker/dealer quotations and reported trades. Certain Level 3 securities are also valued using the market approach when obtaining a single broker quote or when utilizing transaction prices for identical securities that have been used in excess of five business days. During the reporting period, there were no changes to report with respect to the valuation approach and/or valuation techniques discussed above.
OTC and centrally cleared derivative instruments are generally classified as Level 2 in the fair value hierarchy. Such derivative instruments are typically valued using the market
60
approach and/or income approach which generally involves obtaining data from an approved independent third-party vendor source. The Fund utilizes the market approach when quoted prices in broker-dealer markets are available but also includes consideration of alternative valuation approaches, including the income approach. In the absence of reliable market quotations, the income approach is typically utilized for purposes of valuing derivatives such as interest rate swaps based on a discounted cash flow analysis whereby the value of the instrument is equal to the present value of its future cash inflows or outflows. Such analysis includes projecting future cash flows and determining the discount rate (including the present value factors that affect the discount rate) used to discount the future cash flows. In addition, the third-party vendors’ valuation techniques used to derive the evaluated derivative price is based on evaluating observable inputs, including but not limited to, underlying asset prices, indices, spreads, interest rates and exchange rates. Certain derivatives may be classified as Level 3 when valued using the market approach by obtaining a single broker quote or when utilizing unobservable inputs in the income approach. During the reporting period, there were no changes to report with respect to the valuation approach and/or valuation techniques discussed above.
Securities and other assets that cannot be priced according to the methods described above are valued based on policies and procedures approved by the Board. In the event that unobservable inputs are used when determining such valuations, the securities will be classified as Level 3 in the fair value hierarchy. Altering one or more unobservable inputs may result in a significant change to a Level 3 security’s fair value measurement.
When determining the fair value of securities, some of the factors influencing the valuation include: the nature of any restrictions on disposition of the securities; assessment of the general liquidity of the securities; the issuer’s financial condition and the markets in which it does business; the cost of the investment; the size of the holding and the capitalization of the issuer; the prices of any recent transactions or bids/offers for such securities or any comparable securities; any available analyst media or other reports or information deemed reliable by the Valuation Designee regarding the issuer or the markets or industry in which it operates. Using fair value to price securities may result in a value that is different from a security’s most recent closing price and from the price used by other unaffiliated mutual funds to calculate their net asset values.
Foreign Currency Translation: The books and records of the Fund are maintained in U.S. dollars. Foreign currency amounts are translated into U.S. dollars on the following basis:
(i) market value of investment securities, other assets and liabilities — at the exchange rate as of the valuation date;
(ii) purchases and sales of investment securities, income and expenses — at the rates of exchange prevailing on the respective dates of such transactions.
Although the net assets of the Fund are presented at the foreign exchange rates and market values at the close of the period, the Fund does not generally isolate that portion of the
PGIM International Bond Fund 61
Notes to Financial Statements (continued)
results of operations arising as a result of changes in the foreign exchange rates from the fluctuations arising from changes in the market prices of long-term portfolio securities held at the end of the period. Similarly, the Fund does not isolate the effect of changes in foreign exchange rates from the fluctuations arising from changes in the market prices of long-term portfolio securities sold during the period. Accordingly, holding period unrealized and realized foreign currency gains (losses) are included in the reported net change in unrealized appreciation (depreciation) on investments and net realized gains (losses) on investment transactions on the Statements of Operations. Notwithstanding the above, the Fund does isolate the effect of fluctuations in foreign currency exchange rates when determining the gain (loss) upon the sale or maturity of foreign currency denominated debt obligations; such amounts are included in net realized gains (losses) on foreign currency transactions.
Additionally, net realized gains (losses) on foreign currency transactions represent net foreign exchange gains (losses) from the disposition of holdings of foreign currencies, currency gains (losses) realized between the trade and settlement dates on investment transactions, and the difference between the amounts of interest, dividends and foreign withholding taxes recorded on the Fund’s books and the U.S. dollar equivalent amounts actually received or paid. Net unrealized currency gains (losses) arise from valuing foreign currency denominated assets and liabilities (other than investments) at period end exchange rates.
Forward and Cross Currency Contracts: A forward currency contract is a commitment to purchase or sell a foreign currency at a future date at a negotiated forward rate. The Fund enters into forward currency contracts, as defined in the prospectus, in order to hedge its exposure to changes in foreign currency exchange rates on its foreign portfolio holdings or on specific receivables and payables denominated in a foreign currency and to gain exposure to certain currencies. The contracts are valued daily at current forward exchange rates and any unrealized gain (loss) is included in net unrealized appreciation or depreciation on forward and cross currency contracts. Gain (loss) is realized on the settlement date of the contract equal to the difference between the settlement value of the original and negotiated forward contracts. This gain (loss), if any, is included in net realized gain (loss) on forward and cross currency contract transactions. Risks may arise upon entering into these contracts from the potential inability of the counterparties to meet the terms of their contracts. Forward currency contracts involve risks from currency exchange rate and credit risk in excess of the amounts reflected on the Statement of Assets and Liabilities. The Fund’s maximum risk of loss from counterparty credit risk is the net value of the cash flows to be received from the counterparty at the end of the contract’s life. A cross currency contract is a forward contract where a specified amount of one foreign currency will be exchanged for a specified amount of another foreign currency.
62
Options: The Fund purchased and/or wrote options in order to hedge against adverse market movements or fluctuations in value caused by changes in prevailing interest rates, value of equities or foreign currency exchange rates with respect to securities or financial instruments which the Fund currently owns or intends to purchase. The Fund may also use options to gain additional market exposure. The Fund’s principal reason for writing options is to realize, through receipt of premiums, a greater current return than would be realized on the underlying security alone. When the Fund purchases an option, it pays a premium and an amount equal to that premium is recorded as an asset. When the Fund writes an option, it receives a premium and an amount equal to that premium is recorded as a liability. The asset or liability is adjusted daily to reflect the current market value of the option. If an option expires unexercised, the Fund realizes a gain (loss) to the extent of the premium received or paid. If an option is exercised, the premium received or paid is recorded as an adjustment to the proceeds from the sale or the cost of the purchase in determining whether the Fund has realized a gain (loss). The difference between the premium and the amount received or paid at the closing of a purchase or sale transaction is also treated as a realized gain (loss). Gain (loss) on purchased options is included in net realized gain (loss) on investment transactions. Gain (loss) on written options is presented separately as net realized gain (loss) on options written transactions.
The Fund, as writer of an option, may have no control over whether the underlying securities or financial instruments may be sold (called) or purchased (put). As a result, the Fund bears the market risk of an unfavorable change in the price of the security or financial instrument underlying the written option. The Fund, as purchaser of an OTC option, bears the risk of the potential inability of the counterparties to meet the terms of their contracts. With exchange-traded options contracts, there is minimal counterparty credit risk to the Fund since the exchanges’ clearinghouse acts as counterparty to all exchange-traded options and guarantees the options contracts against default.
When the Fund writes an option on a swap, an amount equal to any premium received by the Fund is recorded as a liability and is subsequently adjusted to the current market value of the written option on the swap. If a call option on a swap is exercised, the Fund becomes obligated to pay a fixed interest rate (noted as the strike price) and receive a variable interest rate on a notional amount. If a put option on a swap is exercised, the Fund becomes obligated to pay a variable interest rate and receive a fixed interest rate (noted as the strike price) on a notional amount. Premiums received from writing options on swaps that expire or are exercised are treated as realized gains upon the expiration or exercise of such options on swaps. The risk associated with writing put and call options on swaps is that the Fund will be obligated to be party to a swap agreement if an option on a swap is exercised.
Financial Futures Contracts: A financial futures contract is an agreement to purchase (long) or sell (short) an agreed amount of securities at a set price for delivery on a future date. Upon entering into a financial futures contract, the Fund is required to pledge to the broker an amount of cash and/or other assets equal to a certain percentage of the contract amount. This amount is known as the “initial margin.” Subsequent payments, known as “variation margin,” are made or received by the Fund each day, depending on the daily fluctuations in
PGIM International Bond Fund 63
Notes to Financial Statements (continued)
the value of the underlying security. Such variation margin is recorded for financial statement purposes on a daily basis as unrealized gain (loss). When the contract expires or is closed, the gain (loss) is realized and is presented in the Statement of Operations as net realized gain (loss) on futures transactions.
The Fund invested in financial futures contracts in order to hedge its existing portfolio securities, or securities the Fund intends to purchase, against fluctuations in value caused by changes in prevailing interest rates. Should interest rates move unexpectedly, the Fund may not achieve the anticipated benefits of the financial futures contracts and may realize a loss. The use of futures transactions involves the risk of imperfect correlation in movements in the price of futures contracts, interest rates and the underlying hedged assets. Since futures contracts are exchange-traded, there is minimal counterparty credit risk to the Fund since the exchanges’ clearinghouse acts as counterparty to all exchange-traded futures and guarantees the futures contracts against default.
Swap Agreements: The Fund entered into certain types of swap agreements detailed in the disclosures below. A swap agreement is an agreement to exchange the return generated by one instrument for the return generated by another instrument. Swap agreements are negotiated in the OTC market and may be executed either directly with a counterparty (“OTC-traded”) or through a central clearing facility, such as a registered exchange. Swap agreements are valued daily at current market value and any change in value is included in the net unrealized appreciation or depreciation on swap agreements. Centrally cleared swaps pay or receive an amount known as “variation margin”, based on daily changes in the valuation of the swap contract. For OTC-traded, upfront premiums paid and received are shown as swap premiums paid and swap premiums received in the Statement of Assets and Liabilities. Risk of loss may exceed amounts recognized on the Statement of Assets and Liabilities. Swap agreements outstanding at period end, if any, are listed on the Schedule of Investments.
Interest Rate Swaps: Interest rate swaps represent an agreement between counterparties to exchange cash flows based on the difference between two interest rates, applied to a notional principal amount for a specified period. The Fund is subject to interest rate risk exposure in the normal course of pursuing its investment objective. The Fund used interest rate swaps to maintain its ability to generate steady cash flow by receiving a stream of fixed rate payments or to increase exposure to prevailing market rates by receiving floating rate payments. The Fund’s maximum risk of loss from counterparty credit risk is the discounted net present value of the cash flows to be received from the counterparty over the contract’s remaining life.
Inflation Swaps: The Fund entered into inflation swap agreements to protect against fluctuations in inflation rates. Inflation swaps are characterized by one party paying a fixed
64
rate in exchange for a floating rate that is derived from an inflation index, such as the Consumer Price Index or UK Retail Price Index. Inflation swaps subject the Fund to interest rate risk.
Credit Default Swaps (“CDS”): CDS involve one party (the protection buyer) making a stream of payments to another party (the protection seller) in exchange for the right to receive a specified payment in the event of a default or as a result of a default (collectively a “credit event”) for the referenced entity (typically corporate issues or sovereign issues of an emerging country) on its obligation; or in the event of a write-down, principal shortfall, interest shortfall or default of all or part of the referenced entities comprising a credit index.
The Fund is subject to credit risk in the normal course of pursuing its investment objectives, and as such, has entered into CDS contracts to provide a measure of protection against defaults or to take an active long or short position with respect to the likelihood of a particular issuer’s default or the reference entity’s credit soundness. CDS contracts generally trade based on a spread which represents the cost a protection buyer has to pay the protection seller. The protection buyer is said to be short the credit as the value of the contract rises the more the credit deteriorates. The value of the CDS contract increases for the protection buyer if the spread increases. The Fund’s maximum risk of loss from counterparty credit risk for purchased CDS is the inability of the counterparty to honor the contract up to the notional value due to a credit event.
As a seller of protection on credit default swap agreements, the Fund generally receives an agreed upon payment from the buyer of protection throughout the term of the swap, provided no credit event occurs. As the seller, the Fund effectively increases its investment risk because, in addition to its total net assets, the Fund may be subject to investment exposure on the notional amount of the swap.
The maximum amount of the payment that the Fund, as a seller of protection, could be required to make under a credit default swap agreement would be equal to the notional amount of the underlying security or index contract as a result of a credit event. This potential amount will be partially offset by any recovery values of the respective referenced obligations, or net amounts received from the settlement of buy protection credit default swap agreements which the Fund entered into for the same referenced entity or index. As a buyer of protection, the Fund generally receives an amount up to the notional value of the swap if a credit event occurs.
Implied credit spreads, represented in absolute terms, utilized in determining the market value of credit default swap agreements where the Fund is the seller of protection as of period end are disclosed in the footnotes to the Schedule of Investments, if applicable. These spreads serve as indicators of the current status of the payment/performance risk and represent the likelihood of default risk for the credit derivative. The implied credit spread of a particular referenced entity reflects the cost of buying/selling protection and may include upfront payments required to enter into the agreement. Wider credit spreads and increased market value in absolute terms, when compared to the notional amount of the swap,
PGIM International Bond Fund 65
Notes to Financial Statements (continued)
represent a deterioration of the referenced entity’s credit soundness and a greater likelihood of risk of default or other credit event occurring as defined under the terms of the agreement.
Currency Swaps: The Fund entered into currency swap agreements primarily to gain yield exposure on foreign bonds. Currency swap agreements involve two parties exchanging two different currencies with an agreement to reverse the exchange at a later date at specified exchange rates.
Mortgage-Backed and Asset-Backed Securities: Mortgage-backed securities are pass-through securities, meaning that principal and interest payments made by the borrower on the underlying mortgages are passed through to the Fund. Asset-backed securities directly or indirectly represent a participation interest in, or are secured by and payable from, a stream of payments generated by particular assets such as motor vehicle or credit card receivables. Asset-backed securities may be classified as pass-through certificates or collateralized obligations, such as collateralized bond obligations, collateralized loan obligations and other similarly structured securities. The value of mortgage-backed and asset-backed securities varies with changes in interest rates and may be affected by changes in credit quality or value of the mortgage loans or other assets that support the securities.
Stripped mortgage-backed securities are usually structured with two classes that receive different proportions of the interest (“IO”) and principal (“PO”) distributions on a pool of mortgage assets. Payments received for IOs are included in interest income on the Statements of Operations. Because no principal will be received at the maturity of an IO, adjustments are made to the cost of the security on a monthly basis until maturity. These adjustments are included in interest income on the Statements of Operations. Payments received for POs are treated as reductions to the cost and par value of the securities.
Master Netting Arrangements: The RIC, on behalf of the Fund, is subject to various Master Agreements, or netting arrangements, with select counterparties. These are agreements which a subadviser may have negotiated and entered into on behalf of all or a portion of the Fund. A master netting arrangement between the Fund and the counterparty permits the Fund to offset amounts payable by the Fund to the same counterparty against amounts to be received; and by the receipt of collateral from the counterparty by the Fund to cover the Fund’s exposure to the counterparty. However, there is no assurance that such mitigating factors are easily enforceable. In addition to master netting arrangements, the right to set-off exists when all the conditions are met such that each of the parties owes the other determinable amounts, the reporting party has the right to set-off the amount owed with the amount owed by the other party, the reporting party intends to set-off and the right of set-off is enforceable by law.
66
The RIC, on behalf of the Fund, is a party to International Swaps and Derivatives Association, Inc. (“ISDA”) Master Agreements with certain counterparties that govern OTC derivative and foreign exchange contracts entered into from time to time. The Master Agreements may contain provisions regarding, among other things, the parties’ general obligations, representations, agreements, collateral requirements, events of default and early termination. With respect to certain counterparties, in accordance with the terms of the Master Agreements, collateral posted to the Fund is held in a segregated account by the Fund’s custodian and with respect to those amounts which can be sold or re-pledged, is presented in the Schedule of Investments. Collateral pledged by the Fund is segregated by the Fund’s custodian and identified in the Schedule of Investments. Collateral can be in the form of cash or debt securities issued by the U.S. Government or related agencies or other securities as agreed to by the Fund and the applicable counterparty. Collateral requirements are determined based on the Fund’s net position with each counterparty. Termination events applicable to the Fund may occur upon a decline in the Fund’s net assets below a specified threshold over a certain period of time. Termination events applicable to counterparties may occur upon a decline in the counterparty’s long-term and short-term credit ratings below a specified level. In each case, upon occurrence, the other party may elect to terminate early and cause settlement of all derivative and foreign exchange contracts outstanding, including the payment of any losses and costs resulting from such early termination, as reasonably determined by the terminating party. Any decision by one or more of the Fund’s counterparties to elect early termination could impact the Fund’s future derivative activity.
In addition to each instrument’s primary underlying risk exposure (e.g. interest rate, credit, equity or foreign exchange, etc.), swap agreements involve, to varying degrees, elements of credit, market and documentation risk. Such risks involve the possibility that no liquid market for these agreements will exist, the counterparty to the agreement may default on its obligation to perform or disagree on the contractual terms of the agreement, and changes in net interest rates will be unfavorable. In connection with these agreements, securities in the portfolio may be identified or received as collateral from the counterparty in accordance with the terms of the respective swap agreements to provide or receive assets of value and to serve as recourse in the event of default or bankruptcy/insolvency of either party. Such OTC derivative agreements include conditions which, when materialized, give the counterparty the right to cause an early termination of the transactions under those agreements. Any election by the counterparty for early termination of the contract(s) may impact the amounts reported on financial statements.
Short sales and OTC contracts, including forward foreign currency exchange contracts, swaps, forward rate agreements and written options involve elements of both market and credit risk in excess of the amounts reflected on the Statement of Assets and Liabilities, if applicable. Such risks may be mitigated by engaging in master netting arrangements.
Payment-In-Kind: The Fund invested in the open market or received pursuant to debt restructuring, securities that pay-in-kind (PIK) the interest due on such debt instruments. The PIK interest, computed at the contractual rate specified, is added to the existing principal balance of the debt when issued bonds have same terms as the bond or recorded
PGIM International Bond Fund 67
Notes to Financial Statements (continued)
as a separate bond when terms are different from the existing debt, and is recorded as interest income.
Securities Transactions and Net Investment Income: Securities transactions are recorded on the trade date. Realized gains (losses) from investment and currency transactions are calculated on the specific identification method. Dividend income is recorded on the ex-date, or for certain foreign securities, when the Fund becomes aware of such dividends. Interest income, including amortization of premium and accretion of discount on debt securities, as required, is recorded on the accrual basis. Expenses are recorded on an accrual basis, which may require the use of certain estimates by management that may differ from actual. Net investment income or loss (other than class specific expenses and waivers, which are allocated as noted below) and unrealized and realized gains (losses) are allocated daily to each class of shares based upon the relative proportion of adjusted net assets of each class at the beginning of the day. Class specific expenses and waivers, where applicable, are charged to the respective share classes. Such class specific expenses and waivers include distribution fees and distribution fee waivers, shareholder servicing fees, transfer agent’s fees and expenses, registration fees and fee waivers and/or expense reimbursements, as applicable.
Taxes: It is the Fund’s policy to continue to meet the requirements of the Internal Revenue Code applicable to regulated investment companies and to distribute all of its taxable net investment income and capital gains, if any, to its shareholders. Therefore, no federal income tax provision is required. Withholding taxes on foreign dividends, interest and capital gains, if any, are recorded, net of reclaimable amounts, at the time the related income is earned.
Dividends and Distributions: Dividends and distributions to shareholders, which are determined in accordance with federal income tax regulations and which may differ from GAAP, are recorded on the ex-date. Permanent book/tax differences relating to income and gain (loss) are reclassified between total distributable earnings (loss) and paid-in capital in excess of par, as appropriate. The chart below sets forth the expected frequency of dividend and capital gains distributions to shareholders. Various factors may impact the frequency of dividend distributions to shareholders, including but not limited to adverse market conditions or portfolio holding-specific events.
| | | | |
Expected Distribution Schedule to Shareholders* | | | Frequency | |
Net Investment Income | | | Monthly | |
Short-Term Capital Gains | | | Annually | |
Long-Term Capital Gains | | | Annually | |
| * | Under certain circumstances, the Fund may make more than one distribution of short-term and/or long-term capital gains during a fiscal year. |
68
Estimates: The preparation of financial statements requires management to make estimates and assumptions that affect the reported amounts and disclosures in the financial statements. Actual results could differ from those estimates.
The RIC, on behalf of the Fund, has a management agreement with the Manager pursuant to which it has responsibility for all investment advisory services and supervises the subadviser’s performance of such services, and pursuant to which it renders administrative services.
The Manager has entered into a subadvisory agreement with PGIM, Inc., which provides subadvisory services to the Fund through its business unit PGIM Fixed Income, and PGIM Limited (collectively referred to herein as the “subadviser”). The Manager pays for the services of the subadviser.
Fees payable under the management agreement are computed daily and paid monthly. For the reporting period ended October 31, 2022, the contractual and effective management fee rates were as follows:
| | |
| | |
| Contractual Management Rate | | Effective Management Fee, before any waivers
and/or expense reimbursements |
0.50% of the Fund’s average daily net assets up to $2 billion; and | | 0.50% |
0.485% of the Fund’s average daily net assets over $2 billion. | | |
The Manager has contractually agreed, through February 29, 2024, to limit total annual operating expenses after fee waivers and/or expense reimbursements. This contractual waiver excludes interest, brokerage, taxes (such as income and foreign withholding taxes, stamp duty and deferred tax expenses), acquired fund fees and expenses, extraordinary expenses, and certain other Fund expenses such as dividend and interest expense and broker charges on short sales.
Where applicable, the Manager agrees to waive management fees or shared operating expenses on any share class to the same extent that it waives such expenses on any other share class. In addition, total annual operating expenses for Class R6 shares will not exceed total annual operating expenses for Class Z shares. Fees and/or expenses waived and/or reimbursed by the Manager for the purpose of preventing the expenses from exceeding a certain expense ratio limit may be recouped by the Manager within the same fiscal year during which such waiver and/or reimbursement is made if such recoupment can be realized without exceeding the expense limit in effect at the time of the recoupment for the fiscal year. The expense limitations attributable to each class are as follows:
| | | | | |
| | |
| Class | | Expense
Limitations |
A | | | | 0.99% | |
PGIM International Bond Fund 69
Notes to Financial Statements (continued)
| | |
| | |
| Class | | Expense
Limitations |
C | | 1.74% |
Z | | 0.63 |
R6 | | 0.58 |
The RIC, on behalf of the Fund, has a distribution agreement with Prudential Investment Management Services LLC (“PIMS”), which acts as the distributor of the Class A, Class C, Class Z and Class R6 shares of the Fund. The Fund compensates PIMS for distributing and servicing the Fund’s Class A and Class C shares, pursuant to the plans of distribution (the “Distribution Plans”), regardless of expenses actually incurred by PIMS.
Pursuant to the Distribution Plans, the Fund compensates PIMS for distribution related activities at an annual rate based on average daily net assets per class. The distribution fees are accrued daily and payable monthly.
The Fund’s annual gross and net distribution rate, where applicable, are as follows:
| | | | |
| | | |
| Class | | Gross Distribution Fee | | Net Distribution Fee |
| | |
A | | 0.25% | | 0.25% |
| | |
C | | 1.00 | | 1.00 |
| | |
Z | | N/A | | N/A |
| | |
R6 | | N/A | | N/A |
For the year ended October 31, 2022, PIMS received front-end sales charges (“FESL”) resulting from sales of certain class shares and contingent deferred sales charges (“CDSC”) imposed upon redemptions by certain shareholders. From these fees, PIMS paid such sales charges to broker-dealers, who in turn paid commissions to salespersons and incurred other distribution costs. The sales charges are as follows where applicable:
| | | | | | |
| | | |
| Class | | FESL | | | CDSC |
A | | $ | 15 | | | $— |
C | | | — | | | — |
PGIM Investments, PGIM, Inc., PGIM Limited and PIMS are indirect, wholly-owned subsidiaries of Prudential Financial, Inc. (“Prudential”).
| 4. | Other Transactions with Affiliates |
Prudential Mutual Fund Services LLC (“PMFS”), an affiliate of PGIM Investments and an indirect, wholly-owned subsidiary of Prudential, serves as the Fund’s transfer agent and shareholder servicing agent. Transfer agent’s fees and expenses in the Statement of Operations include certain out-of-pocket expenses paid to non-affiliates, where applicable.
70
The Fund may invest its overnight sweep cash in the PGIM Core Ultra Short Bond Fund (the “Core Fund”), a fund of Prudential Investment Portfolios 2, registered under the 1940 Act and managed by PGIM Investments. PGIM Investments and/or its affiliates are paid fees or reimbursed for providing their services to the Core Fund. In addition to the realized and unrealized gains on investments in the Core Fund, earnings from such investments are disclosed on the Statement of Operations as “Affiliated dividend income”. Effective January 2022, the Fund changed its overnight cash sweep vehicle from the Core Fund to an unaffiliated money market fund.
The Fund may enter into certain securities purchase or sale transactions under Board approved Rule 17a-7 procedures. Rule 17a-7 is an exemptive rule under the 1940 Act, that subject to certain conditions, permits purchase and sale transactions among affiliated investment companies, or between an investment company and a person that is affiliated solely by reason of having a common (or affiliated) investment adviser, common directors/trustees, and/or common officers. For the year ended October 31, 2022, no 17a-7 transactions were entered into by the Fund.
The aggregate cost of purchases and proceeds from sales of portfolio securities (excluding short-term investments and U.S. Government securities) for the reporting period ended October 31, 2022, were as follows:
| | |
| | |
| Cost of Purchases | | Proceeds from Sales |
| |
$6,701,761 | | $4,774,568 |
A summary of the cost of purchases and proceeds from sales of shares of an affiliated mutual fund for the year ended October 31, 2022, is presented as follows:
| | | | | | | | | | | | | | | | | | | | | | | | |
| | | | | | | | |
Value, Beginning of Year | | Cost of
Purchases | | | Proceeds
from Sales | | | Change in
Unrealized
Gain
(Loss) | | Realized
Gain
(Loss) | | | Value,
End of Year | | | Shares,
End
of Year | | | Income |
| | | | |
Short-Term Investments - Affiliated Mutual Fund: | | | | | | | | | | | | | | |
| | | | | |
PGIM Core Ultra Short Bond Fund(1)(wb) | | | | | | | | | | | | | | | | | |
| | | | | | | |
| $30,869 | | | $2,992,822 | | | | $3,023,691 | | | $— | | | $— | | | | $— | | | | — | | | $156 |
| (1) | The Fund did not have any capital gain distributions during the reporting period. |
| (wb) | PGIM Investments LLC, the manager of the Fund, also serves as manager of the PGIM Core Ultra Short Bond Fund. |
| 6. | Distributions and Tax Information |
Distributions to shareholders, which are determined in accordance with federal income tax regulations and which may differ from GAAP, are recorded on the ex-date.
PGIM International Bond Fund 71
Notes to Financial Statements (continued)
For the year ended October 31, 2022, the tax character of dividends paid by the Fund was $1,799,515 of ordinary income. For the year ended October 31, 2021, the tax character of dividends paid by the Fund was $1,312,326 of ordinary income.
As of October 31, 2022, the accumulated undistributed earnings on a tax basis were $142,973 of ordinary income and $2,084,914 of long-term capital gains.
The United States federal income tax basis of the Fund’s investments and the net unrealized depreciation as of October 31, 2022 were as follows:
| | | | | | |
| | | | |
| Tax Basis | | Gross
Unrealized
Appreciation | | Gross
Unrealized
Depreciation | | Net
Unrealized
Depreciation |
| | | |
| $36,358,947 | | $1,152,393 | | $(11,411,745) | | $(10,259,352) |
The differences between GAAP and tax basis were primarily attributable to forward foreign currency exchange contracts, straddles, premium on bonds and other GAAP to tax differences.
The Fund utilized approximately $671,000 of its capital loss carryforward to offset net taxable gains realized in the fiscal year ended October 31, 2022.
The Manager has analyzed the Fund’s tax positions taken on federal, state and local income tax returns for all open tax years and has concluded that no provision for income tax is required in the Fund’s financial statements for the current reporting period. Since tax authorities can examine previously filed tax returns, the Fund’s U.S. federal and state tax returns for each of the four fiscal years up to the most recent fiscal year ended October 31, 2022 are subject to such review.
The Fund offers Class A, Class C, Class Z and Class R6 shares. Class A shares are sold with a maximum front-end sales charge of 3.25%. Investors who purchase $500,000 or more of Class A shares and sell those shares within 12 months of purchase are subject to a CDSC of 1% on sales although these purchases are not subject to a front-end sales charge. The Class A CDSC is waived for certain retirement and/or benefit plans. A special exchange privilege is also available for shareholders who qualified to purchase Class A shares at net asset value. Class C shares are sold with a CDSC of 1% on sales made within 12 months of purchase. Class C shares will automatically convert to Class A shares on a monthly basis approximately eight years (ten years prior to January 22, 2021) after purchase. Class Z and Class R6 shares are not subject to any sales or redemption charges and are available exclusively for sale to a limited group of investors.
72
Under certain circumstances, an exchange may be made from specified share classes of the Fund to one or more other share classes of the Fund as presented in the table of transactions in shares of beneficial interest, below.
The RIC has authorized an unlimited number of shares of beneficial interest of the Fund at $0.001 par value per share, currently divided into four classes, designated Class A, Class C, Class Z and Class R6.
As of October 31, 2022, Prudential, through its affiliated entities, including affiliated funds (if applicable), owned shares of the Fund as follows:
| | | | |
| | | |
| Class | | Number of Shares | | Percentage of Outstanding Shares |
C | | 1,308 | | 29.4% |
R6 | | 3,483,661 | | 98.1 |
At the reporting period end, the number of shareholders holding greater than 5% of the Fund are as follows:
| | | | |
| | | |
| | | Number of Shareholders | | Percentage of Outstanding Shares |
Affiliated | | 1 | | 94.4% |
Unaffiliated | | — | | — |
Transactions in shares of beneficial interest were as follows:
| | | | | | | | |
| | | |
| Share Class | | Shares | | | Amount | |
| | |
Class A | | | | | | | | |
Year ended October 31, 2022: | | | | | | | | |
Shares sold | | | 5,133 | | | $ | 48,065 | |
Shares issued in reinvestment of dividends and distributions | | | 1,569 | | | | 13,504 | |
Shares purchased | | | (5,543 | ) | | | (48,166 | ) |
Net increase (decrease) in shares outstanding | | | 1,159 | | | $ | 13,403 | |
| | |
Year ended October 31, 2021: | | | | | | | | |
Shares sold | | | 21,689 | | | $ | 223,463 | |
Shares issued in reinvestment of dividends and distributions | | | 1,136 | | | | 11,418 | |
Shares purchased | | | (45,960 | ) | | | (468,504 | ) |
Net increase (decrease) in shares outstanding | | | (23,135 | ) | | $ | (233,623 | ) |
| | |
Class C | | | | | | | | |
Year ended October 31, 2022: | | | | | | | | |
Shares sold | | | 3,601 | | | $ | 34,634 | |
Shares issued in reinvestment of dividends and distributions | | | 262 | | | | 2,261 | |
Shares purchased | | | (3,972 | ) | | | (33,769 | ) |
Net increase (decrease) in shares outstanding before conversion | | | (109 | ) | | | 3,126 | |
Shares purchased upon conversion into other share class(es) | | | (5,334 | ) | | | (51,847 | ) |
Net increase (decrease) in shares outstanding | | | (5,443 | ) | | $ | (48,721 | ) |
PGIM International Bond Fund 73
Notes to Financial Statements (continued)
| | | | | | | | |
| | | |
| Share Class | | Shares | | | Amount | |
| | |
Year ended October 31, 2021: | | | | | | | | |
Shares issued in reinvestment of dividends and distributions | | | 532 | | | $ | 5,336 | |
Shares purchased | | | (12,035 | ) | | | (119,657 | ) |
Net increase (decrease) in shares outstanding before conversion | | | (11,503 | ) | | | (114,321 | ) |
Shares purchased upon conversion into other share class(es) | | | (9,268 | ) | | | (92,894 | ) |
Net increase (decrease) in shares outstanding | | | (20,771 | ) | | $ | (207,215 | ) |
| | |
Class Z | | | | | | | | |
Year ended October 31, 2022: | | | | | | | | |
Shares sold | | | 11,802 | | | $ | 103,794 | |
Shares issued in reinvestment of dividends and distributions | | | 9,656 | | | | 84,941 | |
Shares purchased | | | (182,501 | ) | | | (1,636,569 | ) |
Net increase (decrease) in shares outstanding before conversion | | | (161,043 | ) | | | (1,447,834 | ) |
Shares issued upon conversion from other share class(es) | | | 5,334 | | | | 51,847 | |
Net increase (decrease) in shares outstanding | | | (155,709 | ) | | $ | (1,395,987 | ) |
| | |
Year ended October 31, 2021: | | | | | | | | |
Shares sold | | | 203,980 | | | $ | 2,083,183 | |
Shares issued in reinvestment of dividends and distributions | | | 21,985 | | | | 221,149 | |
Shares purchased | | | (1,559,263 | ) | | | (15,844,416 | ) |
Net increase (decrease) in shares outstanding before conversion | | | (1,333,298 | ) | | | (13,540,084 | ) |
Shares issued upon conversion from other share class(es) | | | 6,534 | | | | 65,645 | |
Net increase (decrease) in shares outstanding | | | (1,326,764 | ) | | $ | (13,474,439 | ) |
| | |
Class R6 | | | | | | | | |
Year ended October 31, 2022: | | | | | | | | |
Shares sold | | | 116,638 | | | $ | 1,056,231 | |
Shares issued in reinvestment of dividends and distributions | | | 198,055 | | | | 1,698,473 | |
Shares purchased | | | (63,592 | ) | | | (571,378 | ) |
Net increase (decrease) in shares outstanding | | | 251,101 | | | $ | 2,183,326 | |
| | |
Year ended October 31, 2021: | | | | | | | | |
Shares sold | | | 4,585 | | | $ | 45,097 | |
Shares issued in reinvestment of dividends and distributions | | | 107,453 | | | | 1,074,109 | |
Shares purchased | | | (518 | ) | | | (5,107 | ) |
Net increase (decrease) in shares outstanding before conversion | | | 111,520 | | | | 1,114,099 | |
Shares issued upon conversion from other share class(es) | | | 2,733 | | | | 27,249 | |
Net increase (decrease) in shares outstanding | | | 114,253 | | | $ | 1,141,348 | |
74
The RIC, on behalf of the Fund, along with other affiliated registered investment companies (the “Participating Funds”), is a party to a Syndicated Credit Agreement (“SCA”) with a group of banks. The purpose of the SCA is to provide an alternative source of temporary funding for capital share redemptions. The table below provides details of the current SCA in effect at the reporting period-end as well as the prior SCA.
| | | | |
| | | Current SCA | | Prior SCA |
Term of Commitment | | 9/30/2022 – 9/28/2023 | | 10/1/2021 – 9/29/2022 |
Total Commitment | | $ 1,200,000,000 | | $ 1,200,000,000 |
Annualized Commitment Fee on the Unused Portion of the SCA | | 0.15% | | 0.15% |
Annualized Interest Rate on Borrowings | | 1.00% plus the higher of (1)
the effective federal funds
rate, (2) the daily SOFR
rate plus 0.10% or (3) zero
percent | | 1.20% plus the higher of (1)
the effective federal funds
rate, (2) the one-month
LIBOR rate or (3) zero
percent |
Certain affiliated registered investment companies that are parties to the SCA include portfolios that are subject to a predetermined mathematical formula used to manage certain benefit guarantees offered under variable annuity contracts. The formula may result in large scale asset flows into and out of these portfolios. Consequently, these portfolios may be more likely to utilize the SCA for purposes of funding redemptions. It may be possible for those portfolios to fully exhaust the committed amount of the SCA, thereby requiring the Manager to allocate available funding per a Board-approved methodology designed to treat the Participating Funds in the SCA equitably.
The Fund did not utilize the SCA during the year ended October 31, 2022.
| 9. | Risks of Investing in the Fund |
The Fund’s risks include, but are not limited to, some or all of the risks discussed below. For further information on the Fund’s risks, please refer to the Fund’s Prospectus and Statement of Additional Information.
Credit Risk/Counterparty Risk: The ability, or perceived ability, of the issuer or guarantor of a debt security, or the counterparty (the party on the other side of the transaction) to a derivatives contract or other financial contract to meet its financial obligations will affect the value of the security or derivative. Counterparty and credit risk are especially important in the context of privately negotiated instruments. The Fund expects to enter into certain privately negotiated agreements where the counterparty assumes the physical settlement obligations of the Fund under such transactions. Under this type of arrangement, there is a risk that the relevant counterparty or intermediary would, due to insolvency or other reasons, be unable to or fail to assume the physical settlement obligations of the Fund, in which case the Fund could be required to sell portfolio instruments at unfavorable times or prices or could have insufficient assets to satisfy its physical settlement obligations.
PGIM International Bond Fund 75
Notes to Financial Statements (continued)
Credit ratings are intended to provide a measure of credit risk. However, credit ratings are only the opinions of the credit rating agency issuing the ratings and are not guarantees as to quality. The lower the rating of a debt security held by the Fund, the greater the degree of credit risk that is perceived to exist by the credit rating agency with respect to that security. Increasing the amount of Fund assets allocated to lower-rated securities generally will increase the credit risk to which the Fund is subject. Not all securities in which the Fund invests are rated. The lower the credit quality of a bond, the more sensitive it is to credit risk.
Currency Risk: The Fund’s net asset value could decline as a result of changes in exchange rates, which could adversely affect the Fund’s investments in currencies, or in securities that trade in, and receive revenues related to, currencies, or in derivatives that provide exposure to currencies. Certain foreign countries may impose restrictions on the ability of issuers of foreign securities to make payment of principal and interest or dividends to investors located outside the country, due to blockage of foreign currency exchanges or otherwise.
Debt Obligations Risk: Debt obligations are subject to credit risk, market risk and interest rate risk. The Fund’s holdings, share price, yield and total return may also fluctuate in response to bond market movements. The value of bonds may decline for issuer-related reasons, including management performance, financial leverage and reduced demand for the issuer’s goods and services. Certain types of fixed income obligations also may be subject to “call and redemption risk,” which is the risk that the issuer may call a bond held by the Fund for redemption before it matures and the Fund may not be able to reinvest at the same rate of interest and therefore would earn less income.
Derivatives Risk: Derivatives involve special risks and costs and may result in losses to the Fund. The successful use of derivatives requires sophisticated management, and, to the extent that derivatives are used, the Fund will depend on the subadviser’s ability to analyze and manage derivatives transactions. The prices of derivatives may move in unexpected ways, especially in abnormal market conditions. Some derivatives are “leveraged” or may create economic leverage for the Fund. and therefore may magnify or otherwise increase investment losses to the Fund. The Fund’s use of derivatives may also increase the amount of taxes payable by shareholders.
Other risks arise from the potential inability to terminate or sell derivatives positions. A liquid secondary market may not always exist for the Fund’s derivatives positions. In fact, many over-the-counter derivative instruments will not have liquidity beyond the counterparty to the instrument. Over-the-counter derivative instruments also involve the risk that the other party will not meet its obligations to the Fund. The use of derivatives also exposes the Fund to operational issues, such as documentation and settlement issues, systems failures, inadequate control and human error.
76
Derivatives may also involve legal risks, such as insufficient documentation, the lack of capacity or authority of a counterparty to execute or settle a transaction, and the legality and enforceability of derivatives contracts. The U.S. Government and foreign governments have adopted (and may adopt further) regulations governing derivatives markets, including mandatory clearing of certain derivatives, margin and reporting requirements and risk exposure limitations. Regulation of derivatives may make derivatives more costly, limit their availability or utility to the Fund, or otherwise adversely affect their performance or disrupt markets.
Economic and Market Events Risk: Events in the U.S. and global financial markets, including actions taken by the U.S. Federal Reserve or foreign central banks to stimulate or stabilize economic growth or the functioning of the securities markets, or otherwise reduce inflation may at times result in unusually high market volatility, which could negatively impact performance. Governmental efforts to curb inflation often have negative effects on the level of economic activity. Relatively reduced liquidity in credit and fixed income markets could adversely affect issuers worldwide.
Emerging Markets Risk: The risks of foreign investments are greater for investments in or exposed to emerging markets. Emerging market countries typically have economic and political systems that are less fully developed, and can be expected to be less stable, than those of more developed countries. For example, the economies of such countries can be subject to rapid and unpredictable rates of inflation or deflation. Low trading volumes may result in a lack of liquidity and price volatility. Emerging market countries may have policies that restrict investment by non-U.S. investors, or that prevent non-U.S. investors from withdrawing their money at will.
The Fund may invest in some emerging markets that subject it to risks such as those associated with illiquidity, custody of assets, different settlement and clearance procedures and asserting legal title under a developing legal and regulatory regime to a greater degree than in developed markets or even in other emerging markets.
Foreign Securities Risk: Investments in securities of non-U.S. issuers (including those denominated in U.S. dollars) may involve more risk than investing in securities of U.S. issuers. Foreign political, economic and legal systems, especially those in developing and emerging market countries, may be less stable and more volatile than in the United States. Foreign legal systems generally have fewer regulatory requirements than the U.S. legal system, particularly those of emerging markets. In general, less information is publicly available with respect to non-U.S. companies than U.S. companies. Non-U.S. companies generally are not subject to the same accounting, auditing, and financial reporting standards as are U.S. companies. Additionally, the changing value of foreign currencies and changes in exchange rates could also affect the value of the assets the Fund holds and the Fund’s performance. Certain foreign countries may impose restrictions on the ability of issuers of foreign securities to make payment of principal and interest or dividends to investors located outside the country, due to blockage of foreign currency exchanges or otherwise. Investments in emerging markets are subject to greater volatility and price declines.
PGIM International Bond Fund 77
Notes to Financial Statements (continued)
In addition, the Fund’s investments in non-U.S. securities may be subject to the risks of nationalization or expropriation of assets, imposition of currency exchange controls or restrictions on the repatriation of non-U.S. currency, confiscatory taxation and adverse diplomatic developments. Special U.S. tax considerations may apply.
Futures and Forward Contracts Risk: The primary risks associated with the use of futures or forward contracts are (a) the imperfect correlation between the change in market value of the instruments held by the Fund and the price of the futures or forward contract; (b) possible lack of a liquid secondary market for a futures or forward contract and the resulting inability to close a futures or forward contract when desired; (c) losses caused by unanticipated market movements, which are potentially unlimited; (d) the failure to predict correctly the direction of securities or commodities prices, interest rates, currency exchange rates and other economic factors; and (e) the possibility that the counterparty to the futures or forward contract will default in the performance of its obligations. Additionally, not all forward contracts require a counterparty to post collateral, which may expose the Fund to greater losses in the event of a default by a counterparty.
Increase in Expenses Risk: Your actual cost of investing in the Fund may be higher than the expenses shown in the expense table in the Fund’s prospectus for a variety of reasons. For example, expense ratios may be higher than those shown if average net assets decrease. Net assets are more likely to decrease and Fund expense ratios are more likely to increase when markets are volatile. Active and frequent trading of Fund securities can increase expenses.
Interest Rate Risk: The value of your investment may go down when interest rates rise. A rise in rates tends to have a greater impact on the prices of longer term or duration debt securities. Similarly, a rise in interest rates may also have a greater negative impact on the value of equity securities whose issuers expect earnings further out in the future. For example, a fixed income security with a duration of three years is expected to decrease in value by approximately 3% if interest rates increase by 1%. This is referred to as “duration risk.” When interest rates fall, the issuers of debt obligations may prepay principal more quickly than expected, and the Fund may be required to reinvest the proceeds at a lower interest rate. This is referred to as “prepayment risk.” When interest rates rise, debt obligations may be repaid more slowly than expected, and the value of the Fund’s holdings may fall sharply. This is referred to as “extension risk.” The Fund may lose money if short-term or long-term interest rates rise sharply or in a manner not anticipated by the subadviser.
Junk Bonds Risk: High-yield, high-risk bonds have predominantly speculative characteristics, including particularly high credit risk. Junk bonds tend to have lower market liquidity than higher-rated securities. The liquidity of particular issuers or industries within a
78
particular investment category may shrink or disappear suddenly and without warning. The non-investment grade bond market can experience sudden and sharp price swings and become illiquid due to a variety of factors, including changes in economic forecasts, stock market activity, large sustained sales by major investors, a high profile default or a change in the market’s psychology.
Large Shareholder and Large Scale Redemption Risk: Certain individuals, accounts, funds (including funds affiliated with the Manager) or institutions, including the Manager and its affiliates, may from time to time own or control a substantial amount of the Fund’s shares. There is no requirement that these entities maintain their investment in the Fund. There is a risk that such large shareholders or that the Fund’s shareholders generally may redeem all or a substantial portion of their investments in the Fund in a short period of time, which could have a significant negative impact on the Fund’s NAV, liquidity, and brokerage costs. Large redemptions could also result in tax consequences to shareholders and impact the Fund’s ability to implement its investment strategy. The Fund’s ability to pursue its investment objective after one or more large scale redemptions may be impaired and, as a result, the Fund may invest a larger portion of its assets in cash or cash equivalents.
Leverage Risk: Certain transactions in which the Fund may engage may give rise to leverage. The use of leverage exaggerates the effect of any increase or decrease in the value of the Fund’s holdings, and makes any change in the Fund’s net asset value (“NAV”) greater than it would be without the use of leverage. This could result in increased volatility of investment return. There is a possibility that segregation involving a large percentage of the assets of the Fund could impede portfolio management or the Fund’s ability to meet redemption requests or other current obligations or that the Fund may be required to dispose of some of its investments at unfavorable prices or times.
Liquidity Risk: Liquidity risk is the risk that the Fund could not meet requests to redeem shares issued by the Fund without significant dilution of remaining investors’ interests in the Fund. The Fund may invest in instruments that trade in lower volumes and are more illiquid than other investments. If the Fund is forced to sell these investments to pay redemption proceeds or for other reasons, the Fund may lose money. In addition, when there is no willing buyer and investments cannot be readily sold at the desired time or price, the Fund may have to accept a lower price or may not be able to sell the instrument at all. An inability to sell a portfolio position can adversely affect the Fund’s value or prevent the Fund from being able to take advantage of other investment opportunities.
Management Risk: Actively managed funds are subject to management risk. The subadviser will apply investment techniques and risk analyses in making investment decisions for the Fund, but the subadviser’s judgments about the attractiveness, value or market trends affecting a particular security, industry or sector or about market movements may be incorrect. Additionally, the investments selected for the Fund may underperform the markets in general, the Fund’s benchmark and other funds with similar investment objectives.
PGIM International Bond Fund 79
Notes to Financial Statements (continued)
Market Disruption and Geopolitical Risks: Market disruption can be caused by economic, financial or political events and factors, including but not limited to, international wars or conflicts (including Russia’s military invasion of Ukraine), geopolitical developments (including trading and tariff arrangements, sanctions and cybersecurity attacks), instability in regions such as Asia, Eastern Europe and the Middle East, terrorism, natural disasters and public health epidemics (including the outbreak of COVID-19 globally).
The extent and duration of such events and resulting market disruptions cannot be predicted, but could be substantial and could magnify the impact of other risks to the Fund. These and other similar events could adversely affect the U.S. and foreign financial markets and lead to increased market volatility, reduced liquidity in the securities markets, significant negative impacts on issuers and the markets for certain securities and commodities and/or government intervention. They may also cause short- or long-term economic uncertainties in the United States and worldwide. As a result, whether or not the Fund invests in securities of issuers located in or with significant exposure to the countries directly affected, the value and liquidity of the Fund’s investments may be negatively impacted. Further, due to closures of certain markets and restrictions on trading certain securities, the value of certain securities held by the Fund could be significantly impacted, which could lead to such securities being valued at zero.
COVID-19 and the related governmental and public responses have had and may continue to have an impact on the Fund’s investments and net asset value and have led and may continue to lead to increased market volatility and the potential for illiquidity in certain classes of securities and sectors of the market. They have also had and may continue to result in periods of business disruption, business closures, inability to obtain raw materials, supplies and component parts, and reduced or disrupted operations for the issuers in which the Fund invests. The occurrence, reoccurrence and pendency of public health epidemics could adversely affect the economies and financial markets either in specific countries or worldwide.
Market Risk: Securities markets may be volatile and the market prices of the Fund’s securities may decline. Securities fluctuate in price based on changes in an issuer’s financial condition and overall market and economic conditions. If the market prices of the securities owned by the Fund fall, the value of your investment in the Fund will decline.
Mortgage-Backed and Asset-Backed Securities Risk: Mortgage-backed and asset-backed securities tend to increase in value less than other debt securities when interest rates decline, but are subject to similar risk of decline in market value during periods of rising interest rates. The values of mortgage-backed and asset-backed securities become more volatile as interest rates rise. In a period of declining interest rates, the Fund may be
80
required to reinvest more frequent prepayments on mortgage-backed and asset-backed securities in lower-yielding investments.
Non-Diversified Investment Company Risk: The Fund is non-diversified for purposes of the 1940 Act. This means that the Fund may invest a greater percentage of its assets in the securities of a single company or other issuer than a diversified fund. Investing in a non-diversified fund involves greater risk than investing in a diversified fund because a loss resulting from the decline in value of any one security may represent a greater portion of the total assets of a non-diversified fund.
Short Position Risk: The Fund may take short positions in derivative instruments that present various risks, including credit/counterparty risk and leverage risk. A short position on a derivative instrument involves the risk of a theoretically unlimited increase in the value of the underlying security or instrument and, thus, the risk of a theoretically unlimited loss for the Fund. Short positions also involve transaction and other costs that will reduce potential Fund gains and increase potential Fund losses.
Sovereign Debt Risk: The Fund may invest in sovereign debt issued by governments, their agencies or instrumentalities, or other government-related entities. Holders of sovereign debt may be requested to participate in the rescheduling of such debt and to extend further loans to governmental entities. In addition, there is no bankruptcy proceeding by which defaulted sovereign debt may be collected.
| 10. | Recent Accounting Pronouncement and Regulatory Developments |
In March 2020, the FASB issued Accounting Standard Update (“ASU”) No. 2020-04, which provides optional guidance for applying GAAP to contract modifications, hedging relationships and other transactions affected by the reference rate reform if certain criteria are met. ASU 2020-04 is elective and is effective on March 12, 2020 through December 31, 2022. Management does not expect ASU 2020-04 to have a material impact on the financial statements.
PGIM International Bond Fund 81
Report of Independent Registered Public Accounting Firm
To the Board of Trustees of Prudential Investment Portfolios 9 and Shareholders of PGIM International Bond Fund
Opinion on the Financial Statements
We have audited the accompanying statement of assets and liabilities, including the schedule of investments, of PGIM International Bond Fund (one of the funds constituting Prudential Investment Portfolios 9, referred to hereafter as the “Fund”) as of October 31, 2022, the related statement of operations for the year ended October 31, 2022, the statements of changes in net assets for each of the two years in the period ended October 31, 2022, including the related notes, and the financial highlights for each of the three years in the period ended October 31, 2022 (collectively referred to as the “financial statements”). In our opinion, the financial statements present fairly, in all material respects, the financial position of the Fund as of October 31, 2022, the results of its operations for the year then ended, the changes in its net assets for each of the two years in the period ended October 31 2022 and the financial highlights for each of the three years in the period ended October 31, 2022 in conformity with accounting principles generally accepted in the United States of America.
The financial statements of the Fund as of and for the year ended October 31, 2019 and the financial highlights for each of the periods ended on or prior to October 31, 2019 (not presented herein, other than the financial highlights) were audited by other auditors whose report dated December 19, 2019 expressed an unqualified opinion on those financial statements and financial highlights.
Basis for Opinion
These financial statements are the responsibility of the Fund’s management. Our responsibility is to express an opinion on the Fund’s financial statements based on our audits. We are a public accounting firm registered with the Public Company Accounting Oversight Board (United States) (PCAOB) and are required to be independent with respect to the Fund in accordance with the U.S. federal securities laws and the applicable rules and regulations of the Securities and Exchange Commission and the PCAOB.
We conducted our audits of these financial statements in accordance with the standards of the PCAOB. Those standards require that we plan and perform the audit to obtain reasonable assurance about whether the financial statements are free of material misstatement, whether due to error or fraud.
Our audits included performing procedures to assess the risks of material misstatement of the financial statements, whether due to error or fraud, and performing procedures that respond to those risks. Such procedures included examining, on a test basis, evidence regarding the amounts and disclosures in the financial statements. Our audits also included evaluating the accounting principles used and significant estimates made by management, as well as evaluating the overall presentation of the financial statements. Our procedures included confirmation of securities owned as of October 31, 2022 by correspondence with the custodian, transfer agent and brokers; when replies were not received from brokers, we performed other auditing procedures. We believe that our audits provide a reasonable basis for our opinion.
/s/PricewaterhouseCoopers LLP
New York, New York
December 16, 2022
We have served as the auditor of one or more investment companies in the PGIM Retail Funds complex since 2020.
82
Tax Information (unaudited)
For the year ended October 31, 2022, the Fund reports the maximum amount allowable but not less than 9.15% as interest-related dividends in accordance with Section 871(k)(1) and 881(e)(1) of the Internal Revenue Code.
In January 2023, you will be advised on IRS Form 1099-DIV or substitute 1099-DIV, as to the federal tax status of dividends and distributions received by you in calendar year 2022.
PGIM International Bond Fund 83
INFORMATION ABOUT BOARD MEMBERS AND OFFICERS (unaudited)
Information about Board Members and Officers of the Fund is set forth below. Board Members who are not deemed to be “interested persons” of the Fund, as defined in the 1940 Act, are referred to as “Independent Board Members.” Board Members who are deemed to be “interested persons” of the Fund are referred to as “Interested Board Members.” The Board Members are responsible for the overall supervision of the operations of the Fund and perform the various duties imposed on the directors of investment companies by the 1940 Act. The Board in turn elects the Officers, who are responsible for administering the day-to-day operations of the Fund.
| | | | | | |
| | |
| Independent Board Members | | | | |
| | | |
Name Year of Birth Position(s) Portfolios Overseen | | Principal Occupation(s) During Past Five Years | | Other Directorships Held During Past Five Years | �� | Length of Board Service |
| | | |
Ellen S. Alberding 1958 Board Member Portfolios Overseen: 97 | | President and Board Member, The Joyce Foundation (charitable foundation) (since 2002); formerly Vice Chair, City Colleges of Chicago (community college system) (2011-2015); Trustee, National Park Foundation (charitable foundation for national park system) (2009-2018); Trustee, Economic Club of Chicago (2009-2016); Trustee, Loyola University (since 2018). | | None. | | Since September 2013 |
| | | |
Kevin J. Bannon 1952 Board Member Portfolios Overseen: 97 | | Retired; formerly Managing Director (April 2008-May 2015) and Chief Investment Officer (October 2008-November 2013) of Highmount Capital LLC (registered investment adviser); formerly Executive Vice President and Chief Investment Officer (April 1993-August 2007) of Bank of New York Company; President (May 2003-May 2007) of BNY Hamilton Family of Mutual Funds. | | Director of Urstadt Biddle Properties (equity real estate investment trust) (since September 2008). | | Since July 2008 |
PGIM International Bond Fund
| | | | | | |
| | | |
| Independent Board Members | | | | |
| | | | |
Name Year of Birth Position(s) Portfolios Overseen | | Principal Occupation(s) During Past Five Years | | Other Directorships Held During Past Five Years | | Length of Board Service |
| | | | |
Linda W. Bynoe 1952 Board Member Portfolios Overseen: 94 | | President and Chief Executive Officer (since March 1995) and formerly Chief Operating Officer (December 1989-February 1995) of Telemat Limited LLC (formerly Telemat Ltd) (management consulting); formerly Vice President (January 1985-June 1989) at Morgan Stanley & Co. (broker-dealer). | | Trustee of Equity Residential (residential real estate) (since December 2009); Director of Northern Trust Corporation (financial services) (since April 2006); formerly Director of Anixter International, Inc. (communication products distributor) (January 2006-June 2020). | | Since March 2005 |
| | | | |
Barry H. Evans 1960 Board Member Portfolios Overseen: 96 | | Retired; formerly President (2005-2016), Global Chief Operating Officer (2014-2016), Chief Investment Officer - Global Head of Fixed Income (1998-2014), and various portfolio manager roles (1986-2006), Manulife Asset Management (asset management). | | Formerly Director, Manulife Trust Company (2011-2018); formerly Director, Manulife Asset Management Limited (2015-2017); formerly Chairman of the Board of Directors of Manulife Asset Management U.S. (2005-2016); formerly Chairman of the Board, Declaration Investment Management and Research (2008-2016). | | Since September 2017 |
| | | | |
Keith F. Hartstein 1956 Board Member & Independent Chair Portfolios Overseen: 97 | | Retired; Member (November 2014-September 2022) of the Governing Council of the Independent Directors Council (IDC) (organization of independent mutual fund directors); formerly Executive Committee of the IDC Board of Governors (October 2019-December 2021); formerly President and Chief Executive Officer (2005-2012), Senior Vice President (2004-2005), Senior Vice President of Sales and Marketing (1997-2004), and various executive management positions (1990-1997), John Hancock Funds, LLC (asset management); Chairman, Investment Company Institute’s Sales Force Marketing Committee (2003-2008). | | None. | | Since September 2013 |
Visit our website at pgim.com/investments
| | | | | | |
| | | |
| Independent Board Members | | | | |
| | | | |
Name Year of Birth Position(s) Portfolios Overseen | | Principal Occupation(s) During Past Five Years | | Other Directorships Held During Past Five Years | | Length of Board Service |
| | | | |
Laurie Simon Hodrick 1962 Board Member Portfolios Overseen: 93 | | A. Barton Hepburn Professor Emerita of Economics in the Faculty of Business, Columbia Business School (since 2018); Visiting Fellow at the Hoover Institution, Stanford University (since 2015); Sole Member, ReidCourt LLC (since 2008) (a consulting firm); formerly Visiting Professor of Law, Stanford Law School (2015-2021); formerly A. Barton Hepburn Professor of Economics in the Faculty of Business, Columbia Business School (1996-2017); formerly Managing Director, Global Head of Alternative Investment Strategies, Deutsche Bank (2006-2008). | | Independent Director, Andela (since January 2022) (global talent network); Independent Director, Roku (since December 2020) (communication services); formerly Independent Director, Synnex Corporation (2019-2021) (information technology); formerly Independent Director, Kabbage, Inc. (2018-2020) (financial services); formerly Independent Director, Corporate Capital Trust (2017-2018) (a business development company). | | Since September 2017 |
| | | | |
Brian K. Reid 1961 Board Member Portfolios Overseen: 96 | | Retired; formerly Chief Economist for the Investment Company Institute (ICI) (2005-2017); formerly Senior Economist and Director of Industry and Financial Analysis at the ICI (1998-2004); formerly Senior Economist, Industry and Financial Analysis at the ICI (1996-1998); formerly Staff Economist at the Federal Reserve Board (1989-1996); Director, ICI Mutual Insurance Company (2012-2017). | | None. | | Since March 2018 |
PGIM International Bond Fund
| | | | | | |
| | | |
| Independent Board Members | | | | |
| | | | |
Name Year of Birth Position(s) Portfolios Overseen | | Principal Occupation(s) During Past Five Years | | Other Directorships Held During Past Five Years | | Length of Board Service |
| | | | |
Grace C. Torres 1959 Board Member Portfolios Overseen: 96 | | Retired; formerly Treasurer and Principal Financial and Accounting Officer of the PGIM Funds, Target Funds, Advanced Series Trust, Prudential Variable Contract Accounts and The Prudential Series Fund (1998-June 2014); Assistant Treasurer (March 1999-June 2014) and Senior Vice President (September 1999-June 2014) of PGIM Investments LLC; Assistant Treasurer (May 2003-June 2014) and Vice President (June 2005-June 2014) of AST Investment Services, Inc.; Senior Vice President and Assistant Treasurer (May 2003-June 2014) of Prudential Annuities Advisory Services, Inc. | | Director (since January 2018) of OceanFirst Financial Corp. and OceanFirst Bank; formerly Director (July 2015-January 2018) of Sun Bancorp, Inc. N.A. and Sun National Bank. | | Since November 2014 |
Visit our website at pgim.com/investments
| | | | | | |
| | | |
| Interested Board Members | | | | |
| | | | |
Name Year of Birth Position(s) Portfolios Overseen | | Principal Occupation(s) During Past Five Years | | Other Directorships Held During Past Five Years | | Length of Board Service |
| | | | |
Stuart S. Parker 1962 Board Member & President Portfolios Overseen: 96 | | President, Chief Executive Officer, Chief Operating Officer and Officer in Charge of PGIM Investments LLC (formerly known as Prudential Investments LLC) (since January 2012); President and Principal Executive Officer (“PEO”) (since September 2022) of the PGIM Private Credit Fund; President and PEO (since March 2022) of the PGIM Private Real Estate Fund, Inc.; formerly Executive Vice President of Jennison Associates LLC and Head of Retail Distribution of PGIM Investments LLC (June 2005-December 2011); Investment Company Institute - Board of Governors (since May 2012). | | None. | | Since January 2012 |
| | | | |
Scott E. Benjamin 1973 Board Member & Vice President Portfolios Overseen: 97 | | Executive Vice President (since May 2009) of PGIM Investments LLC; Vice President (since June 2012) of Prudential Investment Management Services LLC; Executive Vice President (since September 2009) of AST Investment Services, Inc.; Senior Vice President of Product Development and Marketing, PGIM Investments (since February 2006); Vice President (since September 2022) of the PGIM Private Credit Fund; Vice President (since March 2022) of the PGIM Private Real Estate Fund, Inc.; formerly Vice President of Product Development and Product Management, PGIM Investments LLC (2003-2006). | | None. | | Since March 2010 |
PGIM International Bond Fund
| | | | |
| |
| Fund Officers(a) |
| | | |
Name Year of Birth Fund Position | | Principal Occupation(s) During Past Five Years | | Length of Service as Fund Officer |
| | | |
Claudia DiGiacomo 1974 Chief Legal Officer | | Chief Legal Officer (since September 2022) of the PGIM Private Credit Fund; Chief Legal Officer (since July 2022) of the PGIM Private Real Estate Fund, Inc.; Chief Legal Officer, Executive Vice President and Secretary of PGIM Investments LLC (since August 2020); Chief Legal Officer of Prudential Mutual Fund Services LLC (since August 2020); Chief Legal Officer of PIFM Holdco, LLC (since August 2020); Vice President and Corporate Counsel (since January 2005) of Prudential; and Corporate Counsel of AST Investment Services, Inc. (since August 2020); formerly Vice President and Assistant Secretary of PGIM Investments LLC (2005-2020); formerly Associate at Sidley Austin Brown & Wood LLP (1999-2004). | | Since December 2005 |
| | | |
Isabelle Sajous 1976 Chief Compliance Officer | | Chief Compliance Officer (since April 2022) of PGIM Investments LLC, the PGIM Funds, Target Funds, PGIM ETF Trust, PGIM Global High Yield Fund, Inc., PGIM High Yield Bond Fund, Inc., PGIM Short Duration High Yield Opportunities Fund, Advanced Series Trust, The Prudential Series Fund and Prudential’s Gibraltar Fund, Inc.; Chief Compliance Officer (since September 2022) of the PGIM Private Credit Fund; Chief Compliance Officer (since March 2022) of the PGIM Private Real Estate Fund, Inc.; Vice President, Compliance of PGIM Investments LLC (since December 2020); formerly Director, Compliance (July 2018-December 2020) of Credit Suisse Asset Management LLC; and Vice President, Associate General Counsel & Deputy Chief Compliance Officer of Cramer Rosenthal McGlynn, LLC (August 2014-July 2018). | | Since April 2022 |
| | | |
Andrew R. French 1962 Secretary | | Vice President (since December 2018) of PGIM Investments LLC; Secretary (since September 2022) of the PGIM Private Credit Fund; Secretary (since March 2022) of the PGIM Private Real Estate Fund, Inc.; formerly Vice President and Corporate Counsel (2010-2018) of Prudential; formerly Director and Corporate Counsel (2006-2010) of Prudential; Vice President and Assistant Secretary (since January 2007) of PGIM Investments LLC; Vice President and Assistant Secretary (since January 2007) of Prudential Mutual Fund Services LLC. | | Since October 2006 |
| | | |
Melissa Gonzalez 1980 Assistant Secretary | | Vice President and Corporate Counsel (since September 2018) of Prudential; Vice President and Assistant Secretary (since August 2020) of PGIM Investments LLC; Assistant Secretary (since September 2022) of the PGIM Private Credit Fund; Assistant Secretary (since March 2022) of the PGIM Private Real Estate Fund, Inc.; formerly Director and Corporate Counsel (March 2014-September 2018) of Prudential. | | Since March 2020 |
Visit our website at pgim.com/investments
| | | | |
| |
| Fund Officers(a) |
| | | |
Name Year of Birth Fund Position | | Principal Occupation(s) During Past Five Years | | Length of Service as Fund Officer |
| | | |
Patrick E. McGuinness 1986 Assistant Secretary | | Vice President and Assistant Secretary (since August 2020) of PGIM Investments LLC; Director and Corporate Counsel (since February 2017) of Prudential; Assistant Secretary (since September 2022) of the PGIM Private Credit Fund; Assistant Secretary (since March 2022) of the PGIM Private Real Estate Fund, Inc. | | Since June 2020 |
| | | |
Debra Rubano 1975 Assistant Secretary | | Vice President and Corporate Counsel (since November 2020) of Prudential; Assistant Secretary (since September 2022) of the PGIM Private Credit Fund; Assistant Secretary (since March 2022) of the PGIM Private Real Estate Fund, Inc; formerly Director and Senior Counsel of Allianz Global Investors U.S. Holdings LLC (2010-2020) and Assistant Secretary of numerous funds in the Allianz fund complex (2015-2020). | | Since December 2020 |
| | | |
Kelly A. Coyne 1968 Assistant Secretary | | Director, Investment Operations of Prudential Mutual Fund Services LLC (since 2010); Assistant Secretary (since September 2022) of the PGIM Private Credit Fund; Assistant Secretary (since March 2022) of the PGIM Private Real Estate Fund, Inc. | | Since March 2015 |
| | | |
Christian J. Kelly 1975 Treasurer and Principal Financial and Accounting Officer | | Vice President, Head of Fund Administration of PGIM Investments LLC (since November 2018); Principal Financial Officer (since September 2022) of the PGIM Private Credit Fund; Principal Financial Officer (since March 2022) of the PGIM Private Real Estate Fund, Inc.; formerly, Treasurer and Principal Accounting Officer (March 2022- July 2022) of the PGIM Private Real Estate Fund, Inc.; formerly Director of Fund Administration of Lord Abbett & Co. LLC (2009-2018), Treasurer and Principal Accounting Officer of the Lord Abbett Family of Funds (2017-2018); Director of Accounting, Avenue Capital Group (2008-2009); Senior Manager, Investment Management Practice of Deloitte & Touche LLP (1998-2007). | | Since January 2019 |
| | | |
Lana Lomuti 1967 Assistant Treasurer | | Vice President (since 2007) and Director (2005-2007), within PGIM Investments Fund Administration; formerly Assistant Treasurer (December 2007-February 2014) of The Greater China Fund, Inc. | | Since April 2014 |
| | | |
Russ Shupak 1973 Assistant Treasurer | | Vice President (since 2017) and Director (2013-2017), within PGIM Investments Fund Administration; Treasurer and Principal Accounting Officer (since July 2022) of the PGIM Private Real Estate Fund, Inc.; Assistant Treasurer (since September 2022) of the PGIM Private Credit Fund; formerly Assistant Treasurer (March 2022 – July 2022) of the PGIM Private Real Estate Fund, Inc. | | Since October 2019 |
| | | |
Deborah Conway 1969 Assistant Treasurer | | Vice President (since 2017) and Director (2007-2017), within PGIM Investments Fund Administration. | | Since October 2019 |
PGIM International Bond Fund
| | | | |
| |
| Fund Officers(a) |
| | | |
Name Year of Birth Fund Position | | Principal Occupation(s) During Past Five Years | | Length of Service as Fund Officer |
| | | |
Elyse M. McLaughlin 1974 Assistant Treasurer | | Vice President (since 2017) and Director (2011-2017), within PGIM Investments Fund Administration; Treasurer and Principal Accounting Officer (since September 2022) of the PGIM Private Credit Fund; Assistant Treasurer (since March 2022) of the PGIM Private Real Estate Fund, Inc. | | Since October 2019 |
| | | |
Kelly Florio 1978 Anti-Money Laundering Compliance Officer | | Vice President, Corporate Compliance, Global Compliance Programs and Compliance Risk Management (since December 2021) of Prudential; formerly, Head of Fraud Risk Management (October 2019 to December 2021) at New York Life Insurance Company; formerly, Head of Key Risk Area Operations (November 2018 to October 2019), Director of the US Anti-Money Laundering Compliance Unit (2009-2018) and Bank Loss Prevention Associate (2006 -2009) at MetLife. | | Since June 2022 |
| (a) | Excludes Mr. Parker and Mr. Benjamin, interested Board Members who also serve as President and Vice President, respectively. |
Explanatory Notes to Tables:
| ∎ | Board Members are deemed to be “Interested,” as defined in the 1940 Act, by reason of their affiliation with PGIM Investments LLC and/or an affiliate of PGIM Investments LLC. |
| ∎ | Unless otherwise noted, the address of all Board Members and Officers is c/o PGIM Investments LLC, 655 Broad Street, Newark, New Jersey 07102-4410. |
| ∎ | There is no set term of office for Board Members or Officers. The Board Members have adopted a retirement policy, which calls for the retirement of Board Members on December 31 of the year in which they reach the age of 75. |
| ∎ | “Other Directorships Held” includes all directorships of companies required to register or file reports with the SEC under the 1934 Act (that is, “public companies”) or other investment companies registered under the 1940 Act. |
| ∎ | “Portfolios Overseen” includes all investment companies managed by PGIM Investments LLC. The investment companies for which PGIM Investments LLC serves as manager include the PGIM Mutual Funds, Target Funds, The Prudential Variable Contract Accounts, PGIM ETF Trust, PGIM Private Real Estate Fund, Inc., PGIM Private Credit Fund, PGIM High Yield Bond Fund, Inc., PGIM Global High Yield Fund, Inc., PGIM Short Duration High Yield Opportunities Fund, The Prudential Series Fund, Prudential’s Gibraltar Fund, Inc. and the Advanced Series Trust. |
| ∎ | As used in the Fund Officers table “Prudential” means The Prudential Insurance Company of America. |
Visit our website at pgim.com/investments
Approval of Advisory Agreements (unaudited)
The Fund’s Board of Trustees
The Board of Trustees (the “Board”) of PGIM International Bond Fund (the “Fund”)1 consists of ten individuals, eight of whom are not “interested persons” of the Fund, as defined in the Investment Company Act of 1940, as amended (the “1940 Act”) (the “Independent Trustees”). The Board is responsible for the oversight of the Fund and its operations, and performs the various duties imposed on the directors of investment companies by the 1940 Act. The Independent Trustees have retained independent legal counsel to assist them in connection with their duties. The Chair of the Board is an Independent Trustee. The Board has established five standing committees: the Audit Committee, the Nominating and Governance Committee, the Compliance Committee and two Investment Committees. Each committee is chaired by, and composed of, Independent Trustees.
Annual Approval of the Fund’s Advisory Agreements
As required under the 1940 Act, the Board determines annually whether to renew the Fund’s management agreement with PGIM Investments LLC (“PGIM Investments”) and the Fund’s subadvisory agreement with PGIM, Inc. (“PGIM”) on behalf of its PGIM Fixed Income unit (“PGIM Fixed Income”) and PGIM Limited (“PGIML”). In considering the renewal of the agreements, the Board, including all of the Independent Trustees, met on May 26 and June 7-9, 2022 (the “Board Meeting”) and approved the renewal of the agreements through July 31, 2023, after concluding that the renewal of the agreements was in the best interests of the Fund and its shareholders.
In advance of the meetings, the Board requested and received materials relating to the agreements, and had the opportunity to ask questions and request further information in connection with its consideration. Among other things, the Board considered comparative fee information from PGIM Investments, PGIM and PGIML. Also, the Board considered comparisons with other mutual funds in relevant Peer Universes and Peer Groups, as is further discussed below.
In approving the agreements, the Board, including the Independent Trustees advised by independent legal counsel, considered the factors it deemed relevant, including the nature, quality and extent of services provided by PGIM Investments and the subadvisers, the performance of the Fund, the profitability of PGIM Investments and its affiliates, expenses and fees, and the potential for economies of scale that may be shared with the Fund and its shareholders as the Fund’s assets grow. In their deliberations, the Trustees did not identify any single factor which alone was responsible for the Board’s decision to approve the agreements with respect to the Fund. In connection with its deliberations, the Board considered information provided by PGIM Investments throughout the year at regular Board meetings, presentations from portfolio managers and other information, as well as information furnished at or in advance of the Board Meeting.
1PGIM International Bond Fund is a series of Prudential Investment Portfolios 9.
PGIM International Bond Fund
Approval of Advisory Agreements (continued)
The Trustees determined that the overall arrangements between the Fund and PGIM Investments, which serves as the Fund’s investment manager pursuant to a management agreement, and between each of PGIM Investments and PGIM, which, through its PGIM Fixed Income unit, and PGIML, which serve as the Fund’s subadvisers pursuant to the terms of a subadvisory agreement with PGIM Investments, are in the best interests of the Fund and its shareholders in light of the services performed, fees charged and such other matters as the Trustees considered relevant in the exercise of their business judgment.
The material factors and conclusions that formed the basis for the Trustees’ reaching their determinations to approve the continuance of the agreements are separately discussed below.
Nature, Quality and Extent of Services
The Board received and considered information regarding the nature, quality and extent of services provided to the Fund by PGIM Investments, PGIM Fixed Income, and PGIML. The Board noted that PGIM Fixed Income and PGIML are affiliated with PGIM Investments. The Board considered the services provided by PGIM Investments, including but not limited to the oversight of the subadvisers for the Fund, as well as the provision of fund recordkeeping, compliance and other services to the Fund, and PGIM Investments’ role as administrator for the Fund’s liquidity risk management program. With respect to PGIM Investments’ oversight of the subadvisers, the Board noted that PGIM Investments’ Strategic Investment Research Group (“SIRG”), which is a business unit of PGIM Investments, is responsible for monitoring and reporting to PGIM Investments senior management on the performance and operations of the subadvisers. The Board also considered that PGIM Investments pays the salaries of all of the officers and interested Trustees of the Fund who are part of Fund management. The Board also considered the investment subadvisory services provided by PGIM Fixed Income and PGIML, including investment research and security selection, as well as adherence to the Fund’s investment restrictions and compliance with applicable Fund policies and procedures. The Board considered PGIM Investments’ evaluation of the subadvisers, as well as PGIM Investments’ recommendation, based on its review of the subadvisers, to renew the subadvisory agreement.
The Board considered the qualifications, backgrounds and responsibilities of PGIM Investments’ senior management responsible for the oversight of the Fund, PGIM Fixed Income, and PGIML, and also considered the qualifications, backgrounds and responsibilities of PGIM Fixed Income’s portfolio managers who are responsible for the day-to-day management of the Fund’s portfolio. The Board was provided with information pertaining to PGIM Investments’, PGIM Fixed Income’s, and PGIML’s organizational structure, senior management, investment operations, and other relevant information pertaining to PGIM Investments, PGIM Fixed Income, and PGIML. The Board also noted that it received favorable compliance reports from the Fund’s Chief Compliance Officer (“CCO”) as to PGIM Investments, PGIM Fixed Income, and PGIML.
Visit our website at pgim.com/investments
The Board concluded that it was satisfied with the nature, extent and quality of the investment management services provided by PGIM Investments, the subadvisory services provided to the Fund by PGIM Fixed Income and PGIML, and that there was a reasonable basis on which to conclude that the Fund benefits from the services provided by PGIM Investments, PGIM Fixed Income, and PGIML under the management and subadvisory agreements.
Costs of Services and Profits Realized by PGIM Investments
The Board was provided with information on the profitability of PGIM Investments and its affiliates in serving as the Fund’s investment manager. The Board discussed with PGIM Investments the methodology utilized in assembling the information regarding profitability and considered its reasonableness. The Board recognized that it is difficult to make comparisons of profitability from fund management contracts because comparative information is not generally publicly available and is affected by numerous factors, including the structure of the particular adviser, the types of funds it manages, its business mix, numerous assumptions regarding allocations and the adviser’s capital structure and cost of capital. Taking these factors into account, the Board concluded that the profitability of PGIM Investments and its affiliates in relation to the services rendered was not unreasonable.
Economies of Scale
The Board received and discussed information concerning economies of scale that PGIM Investments may realize as the Fund’s assets grow beyond current levels. The Board noted that the management fee schedule for the Fund includes breakpoints, which have the effect of decreasing the fee rate as assets increase. During the course of time, the Board has considered information regarding the launch date of the Fund, the management fees of the Fund compared to those of similarly managed funds and PGIM Investments’ investment in the Fund over time. The Board noted that economies of scale can be shared with the Fund in other ways, including low management fees from inception, additional technological and personnel investments to enhance shareholder services, and maintaining existing expense structures in the face of a rising cost environment. The Board also considered PGIM Investments’ assertion that it continually evaluates the management fee schedule of the Fund and the potential to share economies of scale through breakpoints or fee waivers as asset levels increase.
The Board recognized the inherent limitations of any analysis of economies of scale, stemming largely from the Board’s understanding that most of PGIM Investments’ costs are not specific to individual funds, but rather are incurred across a variety of products and services.
Other Benefits to PGIM Investments, PGIM Fixed Income, and PGIML
The Board considered potential ancillary benefits that might be received by PGIM Investments, PGIM Fixed Income, PGIML and their affiliates as a result of their relationship with the Fund. The Board concluded that potential benefits to be derived by PGIM Investments included transfer agency fees received by the Fund’s transfer agent
PGIM International Bond Fund
Approval of Advisory Agreements (continued)
(which is affiliated with PGIM Investments), as well as benefits to its reputation or other intangible benefits resulting from PGIM Investments’ association with the Fund. The Board concluded that the potential benefits to be derived by PGIM Fixed Income and PGIML included the ability to use soft dollar credits, as well as the potential benefits consistent with those generally resulting from an increase in assets under management, specifically, potential access to additional research resources and benefits to their reputations. The Board concluded that the benefits derived by PGIM Investments, PGIM Fixed Income, and PGIML were consistent with the types of benefits generally derived by investment managers and subadvisers to mutual funds.
Performance of the Fund / Fees and Expenses
The Board considered certain additional factors and made related conclusions relating to the historical performance of the Fund for the one-year and the three-year periods ended December 31, 2021. The Board considered that the Fund commenced operations on December 14, 2016 and that longer-term performance was not yet available.
The Board also considered the Fund’s actual management fee, as well as the Fund’s net total expense ratio, for the fiscal year ended October 31, 2021. The Board considered the management fee for the Fund as compared to the management fee charged by PGIM Investments to other funds and the fee charged by other advisers to comparable mutual funds in a Peer Group. The actual management fee represents the fee rate actually paid by Fund shareholders and includes any fee waivers or reimbursements. The net total expense ratio for the Fund represents the actual expense ratio incurred by Fund shareholders.
The mutual funds included in the Peer Universe, which was used to consider performance, and the Peer Group, which was used to consider expenses and fees, were objectively determined by Broadridge, an independent provider of mutual fund data. In certain circumstances, PGIM Investments also provided supplemental Peer Universe or Peer Group information, for reasons addressed with the Board. The comparisons placed the Fund in various quartiles over various periods, with the first quartile being the best 25% of the mutual funds (for performance, the best performing mutual funds and, for expenses, the lowest cost mutual funds).
The section below summarizes key factors considered by the Board and the Board’s conclusions regarding the Fund’s performance, fees and overall expenses. The table sets forth net performance comparisons (which reflect the impact on performance of fund expenses, or any subsidies, expense caps or waivers that may be applicable) with the Peer Universe, actual management fees with the Peer Group (which reflect the impact of any subsidies or fee waivers), and net total expenses with the Peer Group, each of which were key factors considered by the Board.
Visit our website at pgim.com/investments
| | | | | | | | |
| Net Performance | | 1 Year | | 3 Years | | 5 Years | | 10 Years |
| | | 2nd Quartile | | 1st Quartile | | 1st Quartile | | N/A |
| Actual Management Fees: 1st Quartile | | |
| Net Total Expenses: 1st Quartile |
| · | | The Board noted that the Fund outperformed its benchmark index over the three- and five-year periods and underperformed over the one-year period. |
| · | | The Board and PGIM Investments agreed to retain the existing contractual expense cap that (exclusive of certain fees and expenses) caps total annual operating expenses at 0.99% for Class A shares, 1.74% for Class C shares, 0.58% for Class R6 shares and 0.63% for Class Z shares through February 28, 2023. |
| · | | In addition, PGIM Investments will waive management fees or shared operating expenses on any share class to the same extent that it waives such expenses on any other share class, and has agreed that total annual fund operating expenses for Class R6 shares will not exceed total annual fund operating expenses for Class Z shares. |
| · | | The Board concluded that, in light of the above, it would be in the best interests of the Fund and its shareholders to renew the agreements. |
| · | | The Board concluded that the management fees (including subadvisory fees) and total expenses were reasonable in light of the services provided. |
* * *
After full consideration of these factors, the Board concluded that the approval of the agreements was in the best interests of the Fund and its shareholders.
PGIM International Bond Fund
| | | | |
| | | |
∎ MAIL 655 Broad Street Newark, NJ 07102 | | ∎ TELEPHONE (800) 225-1852 | | ∎ WEBSITE pgim.com/investments |
|
| |
PROXY VOTING The Board of Trustees of the Fund has delegated to the Fund’s subadvisers the responsibility for voting any proxies and maintaining proxy
recordkeeping with respect to the Fund. A description of these proxy voting policies and procedures is available without charge, upon request, by calling
(800) 225-1852 or by visiting the Securities and Exchange Commission’s website at sec.gov. Information regarding how the Fund voted proxies relating
to portfolio securities during the most recent 12-month period ended June 30 is available on the Fund’s website and on the Securities and Exchange
Commission’s website. |
|
| |
TRUSTEES Ellen S. Alberding ● Kevin J. Bannon ● Scott E. Benjamin ● Linda W. Bynoe ● Barry H. Evans ● Keith F. Hartstein ● Laurie Simon Hodrick ● Stuart S.
Parker ● Brian K. Reid ● Grace C. Torres |
|
| |
OFFICERS Stuart S. Parker, President ● Scott E. Benjamin, Vice President ● Christian J. Kelly, Treasurer and Principal Financial and Accounting Officer ● Claudia
DiGiacomo, Chief Legal Officer ● Isabelle Sajous, Chief Compliance Officer ● Kelly Florio, Anti-Money Laundering Compliance Officer ● Andrew R.
French, Secretary ● Melissa Gonzalez, Assistant Secretary ● Kelly A. Coyne, Assistant Secretary ● Patrick E. McGuinness, Assistant Secretary ● Debra
Rubano, Assistant Secretary ● Lana Lomuti, Assistant Treasurer ● Russ Shupak, Assistant Treasurer ● Elyse M. McLaughlin, Assistant Treasurer ●
Deborah Conway, Assistant Treasurer |
| | | | |
| | |
| MANAGER | | PGIM Investments LLC | | 655 Broad Street Newark, NJ 07102 |
| | |
| SUBADVISERS | | PGIM Fixed Income | | 655 Broad Street Newark, NJ 07102 |
| | |
| | | PGIM Limited | | Grand Buildings, 1-3 Strand Trafalgar Square London, WC2N 5HR United Kingdom |
| | |
| DISTRIBUTOR | | Prudential Investment Management Services LLC | | 655 Broad Street Newark, NJ 07102 |
| | |
| CUSTODIAN | | The Bank of New York Mellon | | 240 Greenwich Street New York, NY 10286 |
| | |
| TRANSFER AGENT | | Prudential Mutual Fund Services LLC | | PO Box 9658 Providence, RI 02940 |
| | |
| INDEPENDENT REGISTERED PUBLIC ACCOUNTING FIRM | | PricewaterhouseCoopers LLP | | 300 Madison Avenue New York, NY 10017 |
| | |
| FUND COUNSEL | | Willkie Farr &Gallagher LLP | | 787 Seventh Avenue New York, NY 10019 |
|
| |
| An investor should consider the investment objectives, risks, charges, and expenses of the Fund carefully before investing. The prospectus and summary prospectus contain this and other information about the Fund. An investor may obtain the prospectus and summary prospectus by visiting our website at pgim.com/investments or by calling (800) 225-1852. The prospectus and summary prospectus should be read carefully before investing. |
|
| |
E-DELIVERY To receive your mutual fund documents online, go to pgim.com/investments/resource/edelivery and enroll. Instead of receiving printed documents by mail, you will receive notification via email when new materials are available. You can cancel your enrollment or change your email address at any time by visiting the website address above. |
|
| |
SHAREHOLDER COMMUNICATIONS WITH TRUSTEES Shareholders can communicate directly with the Board of Trustees by writing to the Chair of the Board, PGIM International Bond Fund, PGIM Investments, Attn: Board of Trustees, 655 Broad Street, Newark, NJ 07102. Shareholders can communicate directly with an individual Trustee by writing to that Trustee at the same address. Communications are not screened before being delivered to the addressee. |
|
| |
AVAILABILITY OF PORTFOLIO HOLDINGS The Fund files its complete schedule of portfolio holdings with the Securities and Exchange Commission for the first and third quarters of each fiscal year as an exhibit to its reports on Form N-PORT. The Fund’s Form N-PORT filings are available on the Commission’s website at sec.gov. |
|
| |
| The Fund’s Statement of Additional Information contains additional information about the Fund’s Trustees and is available without charge, upon request, by calling (800) 225-1852. |
Mutual Funds:
| | | | |
| | | |
ARE NOT INSURED BY THE FDIC OR ANY FEDERAL GOVERNMENT AGENCY | | MAY LOSE VALUE | | ARE NOT A DEPOSIT OF OR GUARANTEED BY ANY BANK OR ANY BANK AFFILIATE |
| | | | | | | | |
PGIM INTERNATIONAL BOND FUND |
| | | | |
SHARE CLASS | | A | | C | | Z | | R6 |
| | | | |
NASDAQ | | PXBAX | | PXBCX | | PXBZX | | PXBQX |
| | | | |
CUSIP | | 74441J738 | | 74441J720 | | 74441J696 | | 74441J712 |
MF234E
Item 2 – Code of Ethics — See Exhibit (a)
As of the end of the period covered by this report, the registrant has adopted a code of ethics (the “Section 406 Standards for Investment Companies – Ethical Standards for Principal Executive and Financial Officers”) that applies to the registrant’s Principal Executive Officer and Principal Financial Officer; the registrant’s Principal Financial Officer also serves as the Principal Accounting Officer.
The registrant hereby undertakes to provide any person, without charge, upon request, a copy of the code of ethics. To request a copy of the code of ethics, contact the registrant 800-225-1852, and ask for a copy of the Section 406 Standards for Investment Companies - Ethical Standards for Principal Executive and Financial Officers.
Item 3 – Audit Committee Financial Expert –
The registrant’s Board has determined that Ms. Grace C. Torres, member of the Board’s Audit Committee is an “audit committee financial expert,” and that she is “independent,” for purposes of this item.
Item 4 – Principal Accountant Fees and Services –
(a) Audit Fees
For the fiscal years ended October 31, 2022 and October 31, 2021, PricewaterhouseCoopers LLP (“PwC”), the Registrant’s principal accountant, billed the Registrant $206,750 and $206,750, respectively, for professional services rendered for the audit of the Registrant’s annual financial statements or services that are normally provided in connection with statutory and regulatory filings.
(b) Audit-Related Fees
For the fiscal years ended October 31, 2022 and October 31, 2021: none.
(c) Tax Fees
For the fiscal years ended October 31, 2022 and October 31, 2021: none.
(d) All Other Fees
For the fiscal years ended October 31, 2022 and October 31, 2021: none.
(e) (1) Audit Committee Pre-Approval Policies and Procedures
THE PGIM MUTUAL FUNDS
AUDIT COMMITTEE POLICY
on
Pre-Approval of Services Provided by the Independent
Accountants
The Audit Committee of each PGIM Mutual Fund is charged with the responsibility to monitor the independence of the Fund’s independent accountants. As part of this responsibility, the Audit Committee must pre-approve the independent accounting firm’s engagement to render audit and/or permissible non-audit services, as required by law. In evaluating a proposed engagement of the independent accountants, the Audit Committee will assess the effect that the engagement might reasonably be expected to have on the accountant’s independence. The Committee’s evaluation will be based on:
| | • | | a review of the nature of the professional services expected to be provided, |
| | • | | a review of the safeguards put into place by the accounting firm to safeguard independence, and |
| | • | | periodic meetings with the accounting firm. |
Policy for Audit and Non-Audit Services Provided to the Funds
On an annual basis, the scope of audits for each Fund, audit fees and expenses, and audit-related and non-audit services (and fees proposed in respect thereof) proposed to be performed by the Fund’s independent accountants will be presented by the Treasurer and the independent accountants to the Audit Committee for review and, as appropriate, approval prior to the initiation of such services.
Such presentation shall be accompanied by confirmation by both the Treasurer and the independent accountants that the proposed
non-audit services will not adversely affect the independence of the independent accountants. Such proposed non-audit services shall be described in sufficient detail to enable the Audit Committee to assess the appropriateness of such services and fees, and the compatibility of the provision of such services with the auditor’s independence. The Committee shall receive periodic reports on the progress of the audit and other services which are approved by the Committee or by the Committee Chair pursuant to authority delegated in this Policy.
The categories of services enumerated under “Audit Services”, “Audit-related Services”, and “Tax Services” are intended to provide guidance to the Treasurer and the independent accountants as to those categories of services which the Committee believes are generally consistent with the independence of the independent accountants and which the Committee (or the Committee Chair) would expect upon the presentation of specific proposals to pre-approve. The enumerated categories are not intended as an exclusive list of audit, audit-related or tax services, which the Committee (or the Committee Chair) would consider for pre-approval.
Audit Services
The following categories of audit services are considered to be consistent with the role of the Fund’s independent accountants:
| | • | | Annual Fund financial statement audits |
| | • | | Seed audits (related to new product filings, as required) |
| | • | | SEC and regulatory filings and consents |
Audit-related Services
The following categories of audit-related services are considered to be consistent with the role of the Fund’s independent accountants:
| | • | | Accounting consultations |
| | • | | Fund merger support services |
| | • | | Agreed Upon Procedure Reports |
| | • | | Other Internal Control Reports |
Individual audit-related services that fall within one of these categories (except for fund merger support services) and are not presented to the Audit Committee as part of the annual pre-approval process are subject to an authorized pre-approval by the Audit Committee so long as the estimated fee for those services does not exceed $30,000. Any services provided under such pre-approval will be reported to the Audit Committee at its next regular meeting. Should the amount of such services exceed $30,000 any additional fees will be subject to pre-approval by the Committee Chair (or any other Committee member on
whom this responsibility has been delegated). Fees related to fund merger support services are subject to a separate authorized pre-approval by the Audit Committee with fees determined on a per occurrence and merger complexity basis.
Tax Services
The following categories of tax services are considered to be consistent with the role of the Fund’s independent accountants:
| | • | | Tax compliance services related to the filing or amendment of the following: |
| | • | | Federal, state and local income tax compliance; and, |
| | • | | Sales and use tax compliance |
| | • | | Timely RIC qualification reviews |
| | • | | Tax distribution analysis and planning |
| | • | | Tax authority examination services |
| | • | | Tax appeals support services |
| | • | | Accounting methods studies |
| | • | | Fund merger support services |
| | • | | Tax consulting services and related projects |
Individual tax services that fall within one of these categories and are not presented to the Audit Committee as part of the annual pre-approval process are subject to an authorized pre-approval by the Audit Committee so long as the estimated fee for those services does not exceed $30,000. Any services provided under such pre-approval will be reported to the Audit Committee at its next regular meeting. Should the amount of such services exceed $30,000 any additional fees will be subject to pre-approval by the Committee Chair (or any other Committee member on whom this responsibility has been delegated).
Other Non-Audit Services
Certain non-audit services that the independent accountants are legally permitted to render will be subject to pre-approval by the Committee or by one or more Committee members to whom the Committee has delegated this authority and who will report to the full Committee any pre-approval decisions made pursuant to this Policy. Non-audit services presented for pre-approval pursuant to this paragraph will be accompanied by a confirmation from both the Treasurer and the independent accountants that the proposed services will not adversely affect the independence of the independent accountants.
Proscribed Services
The Fund’s independent accountants will not render services in the following categories of non-audit services:
| | • | | Bookkeeping or other services related to the accounting records or financial statements of the Fund |
| | • | | Financial information systems design and implementation |
| | • | | Appraisal or valuation services, fairness opinions, or contribution-in-kind reports |
| | • | | Internal audit outsourcing services |
| | • | | Management functions or human resources |
| | • | | Broker or dealer, investment adviser, or investment banking services |
| | • | | Legal services and expert services unrelated to the audit |
| | • | | Any other service that the Public Company Accounting Oversight Board determines, by regulation, is impermissible. |
Pre-approval of Non-Audit Services Provided to Other Entities Within the PGIM Fund Complex
Certain non-audit services provided to PGIM Investments LLC or any of its affiliates that also provide ongoing services to the PGIM Mutual Funds will be subject to pre-approval by the Audit Committee. The only non-audit services provided to
these entities that will require pre-approval are those related directly to the operations and financial reporting of the Funds. Individual projects that are not presented to the Audit Committee as part of the annual pre-approval process will be subject to pre-approval by the Committee Chair (or any other Committee member on whom this responsibility has been delegated) so long as the estimated fee for those services does not exceed $30,000. Services presented for pre-approval pursuant to this paragraph will be accompanied by a confirmation from both the Treasurer and the independent accountants that the proposed services will not adversely affect the independence of the independent accountants.
Although the Audit Committee will not pre-approve all services provided to PGIM Investments LLC and its affiliates, the Committee will receive an annual report from the Fund’s independent accounting firm showing the aggregate fees for all services provided to PGIM Investments and its affiliates.
(e) (2) Percentage of services described in each of paragraphs (b) through (d) of this Item that were approved by the audit committee pursuant to paragraph (c)(7)(i)(C) of Rule 2-01 of Regulation S-X –
| | | | | | |
| | Fiscal Year Ended October 31, 2022 | | | | Fiscal Year Ended October 31, 2021 |
| 4(b) | | Not applicable. | | | | Not applicable. |
| 4(c) | | Not applicable. | | | | Not applicable. |
| 4(d) | | Not applicable. | | | | Not applicable. |
(f) Percentage of hours expended attributable to work performed by other than full time employees of principal accountant if greater than 50%.
The percentage of hours expended on the principal accountant’s engagement to audit the registrant’s financial statements for the most recent fiscal year that were attributed to work performed by persons other than the principal accountant’s full-time, permanent employees was 0%.
(g) Non-Audit Fees
The aggregate non-audit fees billed by the Registrant’s principal accountant for services rendered to the registrant’s investment adviser and any entity controlling, controlled by, or under common control with the investment adviser that provides ongoing services to the registrant for the fiscal years ended October 31, 2022 and October 31, 2021 was $0 and $0, respectively.
(h) Principal Accountant’s Independence
Not applicable as the Registrant’s principal accountant has not provided non-audit services to the registrant’s investment adviser and any entity controlling, controlled by, or under common control with the investment adviser that provides ongoing services to the registrant that were not pre-approved pursuant to Rule 2-01(c)(7)(ii) of Regulation S-X.
(i) Not applicable.
(j) Not applicable.
Item 5 – Audit Committee of Listed Registrants – Not applicable.
Item 6 – Schedule of Investments – The schedule is included as part of the report to shareholders filed under Item 1 of this Form.
Item 7 – Disclosure of Proxy Voting Policies and Procedures for Closed-End Management Investment Companies – Not applicable.
| | |
| Item 8 – | | Portfolio Managers of Closed-End Management Investment Companies – Not applicable. |
| | |
| Item 9 – | | Purchases of Equity Securities by Closed-End Management Investment Company and Affiliated Purchasers – Not applicable. |
| | |
| Item 10 – | | Submission of Matters to a Vote of Security Holders – There have been no material changes to these procedures. |
| | |
| Item 11 – | | Controls and Procedures |
| | (a) | It is the conclusion of the registrant’s principal executive officer and principal financial officer that the effectiveness of the registrant’s current disclosure controls and procedures (such disclosure controls and procedures having been evaluated within 90 days of the date of this filing) provide reasonable assurance that the information required to be disclosed by the registrant has been recorded, processed, summarized and reported within the time period specified in the Commission’s rules and forms and that the information required to be disclosed by the registrant has been accumulated and communicated to the registrant’s principal executive officer and principal financial officer in order to allow timely decisions regarding required disclosure. |
| | (b) | There has been no significant change in the registrant’s internal control over financial reporting (as defined in Rule 30a-3(d) under the Act (17 CFR 270.30a-3(d)) that occurred during the period covered by this report that has materially affected, or is reasonably likely to materially affect, the registrant’s internal control over financial reporting. |
Item 12 – Controls and Procedures - Disclosure of Securities Lending Activities for Closed-End Management Investment Companies – Not applicable.
Item 13 – Exhibits
SIGNATURES
Pursuant to the requirements of the Securities Exchange Act of 1934 and the Investment Company Act of 1940, the registrant has duly caused this report to be signed on its behalf by the undersigned, thereunto duly authorized.
| | |
| Registrant: | | Prudential Investment Portfolios 9 |
| |
| By: | | /s/ Andrew R. French |
| | Andrew R. French |
| | Secretary |
| |
| Date: | | December 19, 2022 |
Pursuant to the requirements of the Securities Exchange Act of 1934 and the Investment Company Act of 1940, this report has been signed below by the following persons on behalf of the registrant and in the capacities and on the dates indicated.
| | |
| By: | | /s/ Stuart S. Parker |
| | Stuart S. Parker |
| | President and Principal Executive Officer |
| |
| Date: | | December 19, 2022 |
| |
| By: | | /s/ Christian J. Kelly |
| | Christian J. Kelly |
| | Treasurer and Principal Financial and Accounting Officer |
| |
| Date: | | December 19, 2022 |