UNITED STATES
SECURITIES AND EXCHANGE COMMISSION
Washington, D.C. 20549
CERTIFIED SHAREHOLDER REPORT OF REGISTERED MANAGEMENT INVESTMENT COMPANIES
| | |
| Investment Company Act file number: | | 811-09101 |
| |
| Exact name of registrant as specified in charter: | | Prudential Investment Portfolios 9 |
| |
| Address of principal executive offices: | | 655 Broad Street, 6 th Floor |
| | | Newark, New Jersey 07102 |
| |
| Name and address of agent for service: | | Andrew R. French |
| | | 655 Broad Street, 6 th Floor |
| | | Newark, New Jersey 07102 |
| |
| Registrant’s telephone number, including area code: | | |
| |
| Date of fiscal year end: | | 10/31/2024 |
| |
| Date of reporting period: | | 10/31/2024 |
Item 1 – Reports to Stockholders
| | (a) | Report transmitted to stockholders pursuant to Rule 30e-1 under the Act (17 CFR 270.30e-1). |
PGIM Quant Solutions Large-Cap Core Fund
ANNUAL SHAREHOLDER REPORT – October 31, 2024
This annual shareholder report contains important information about the Class A shares of PGIM Quant Solutions Large-Cap Core Fund (the
“Fund”) for the period of November 1, 2023 to October 31, 2024.
You can find additional information about the Fund at
pgim.com/investments/mutual-funds/prospectuses-fact-sheets
. You can also request
this information by contacting us at (800) 225-1852 or (973) 367-3529 from outside the US.
This report describes changes to the Fund that occurred during the reporting period.
WHAT WERE THE FUND COSTS FOR THE LAST YEAR?
(Based on a hypothetical $10,000 investment)
| Costs of a $10,000 investment | Costs paid as a percentage of a $10,000 investment |
PGIM Quant Solutions Large-Cap Core Fund—Class | | |
WHAT AFFECTED THE FUND’S PERFORMANCE DURING THE REPORTING
PERIOD
?
■
US Federal Reserve (Fed) policy dominated headlines and acted as the main directional catalyst for equity performance during the reporting
period. After keeping interest rates steady for the majority of the period, the Fed lowered interest rates by a half percentage point at its
September 2024 meeting. Large-cap stocks outpaced small-cap stocks during most of the period, although this trend shifted and volatility
increased toward the end of the period, as investors focused on the US presidential election.
■
The Fund’s performance relative to the S&P 500 Index (Index) benefited from a tilt in favor of stocks with improving growth expectations,
notably in the industrials sector. Overweight positions in some mega-cap tech stocks also helped.
■
The Fund’s stock selection in the consumer staples sector did not perform well, detracting from relative returns.
■
The Fund used futures contracts on the Index primarily to manage daily cash flows, provide liquidity, and equitize cash—not as a means of
adding to performance. Consequently, the effect on Fund performance was minimal.
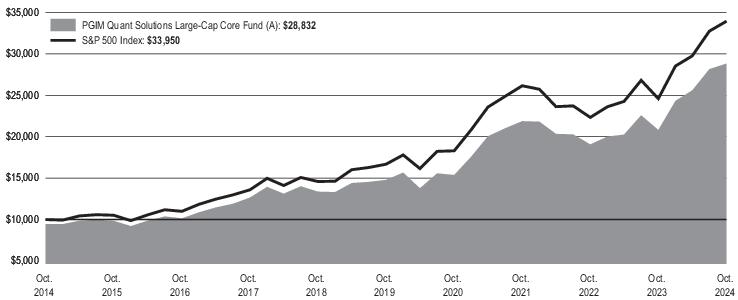
HOW HAS T
HE
FUND PERFORMED OVER THE PAST 10 YEARS?
The Fund’s past performance is not a good predictor of the Fund’s future performance.
The returns do not reflect the deduction of
taxes that a shareholder would pay on Fund distributions or redemption of Fund shares.
Visit
pgim.com/investments/mutual-funds/prospectuses-fact-sheets
or call (800) 225-1852 or (973) 367-3529 from outside the US for more recent performance data.
The line graph reflects a hypothetical $10,000 investment in Class A shares and assumes that all recurring fees (including management fees)
were deducted and dividend and distributions were reinvested. Without waiver of fees and/or expense reimbursements, if any, the returns
would
have been lower.
Cumulative Performance: October 31, 2014 to October 31, 2024 Initial Investment of $10,000 |
The line graph reflects the return on the Fund's Class A shares with sales charges.
Average Annual Total Returns as of 10/31/2024 |
| | | |
Class A with sales charges | | | |
Class A without sales charges | | | |
Broad-Based Securities Market Index: S&P 500 Index | | | |
WHAT ARE SOME KEY FUND STATISTICS AS OF 10/31/2024?
| |
| |
Total advisory fees paid for the year | |
Portfolio turnover rate for the year | |
WHAT ARE SOME CHARACTERISTICS OF THE FUND’S HOLDINGS AS OF 10/31/20
2
4
?
| |
Semiconductors & Semiconductor Equipment | |
| |
Technology Hardware, Storage & Peripherals | |
Interactive Media & Services | |
| |
| |
Oil, Gas & Consumable Fuels | |
| |
| |
| |
| |
| |
Health Care Equipment & Supplies | |
| |
| |
Life Sciences Tools & Services | |
Consumer Staples Distribution & Retail | |
| |
| |
Health Care Providers & Services | |
| |
| |
Hotels, Restaurants & Leisure | |
| |
Diversified Telecommunication Services | |
| |
| |
Affiliated Mutual Fund - Short-Term Investment | |
| |
| |
| |
| |
| |
| |
| |
| |
| |
| |
| |
| |
| |
| |
Liabilities in excess of other assets | |
| |
* Consists of Industries that each make up less than
0.5
% of the Fund's net
WERE THERE ANY CHANGES TO THE FUND THIS YEAR?
The following is a summary of certain changes to the Fund since November 1, 2023:
■
The Fund's principal risk disclosure was revised to include Sector Exposure Risk as a principal risk of the Fund due to changes in the Fund's
portfolio which may result in greater exposure to certain economic sectors.
For more complete information, you should review the Fund’s next prospectus, which we expect to be available by December 30, 2024 at
pgim.com/investments/mutual-funds/prospectuses-fact-sheets
or by request at (800) 225-1852.
You can find additional information at
pgim.com/investments/mutual-funds/prospectuses-fact-sheets
or by scanning the QR code below,
including the Fund’s prospectus, financial information, fund holdings, and proxy voting information. You can also request this information by
contacting us at (800) 225-1852 or (973) 367-3529 from outside the US.
To receive your fund documents online, go to
pgim.com/investments/resource/edelivery
and enroll.
PGIM Quant Solutions Large-Cap Core Fund
PGIM Quant Solutions Large-Cap Core Fund
ANNUAL SHAREHOLDER REPORT – October 31, 2024
This annual shareholder report contains important information about the Class C shares of PGIM Quant Solutions Large-Cap Core Fund (the
“Fund”) for the period of November 1, 2023 to October 31, 2024.
You can find additional information about the Fund at
pgim.com/investments/mutual-funds/prospectuses-fact-sheets
. You can also request
this information by contacting us at (800) 225-1852 or (973) 367-3529 from outside the US.
This report describes changes to the Fund that occurred during the reporting period.
WHAT WERE THE FUND COSTS FOR THE LAST YEAR?
(Based on a hypothetical $10,000 investment)
| Costs of a $10,000 investment | Costs paid as a percentage of a $10,000 investment |
PGIM Quant Solutions Large-Cap Core Fund—Class | | |
WHAT AFFECTED THE FUND’S PERFORMANCE DURING THE REPORTING PERIOD?
■
US Federal Reserve (Fed) policy dominated headlines and acted as the main directional catalyst for equity performance during the reporting
period. After keeping interest rates steady for the majority of the period, the Fed lowered interest rates by a half percentage point at its
September 2024 meeting. Large-cap stocks outpaced small-cap stocks during most of the period, although this trend shifted and volatility
increased toward the end of the period, as investors focused on the US presidential election.
■
The Fund’s performance relative to the S&P 500 Index (Index) benefited from a tilt in favor of stocks with improving growth expectations,
notably in the industrials sector. Overweight positions in some mega-cap tech stocks also helped.
■
The Fund’s stock selection in the consumer staples sector did not perform well, detracting from relative returns.
■
The Fund used futures contracts on the Index primarily to manage daily cash flows, provide liquidity, and equitize cash—not as a means of
adding to performance. Consequently, the effect on Fund performance was minimal.
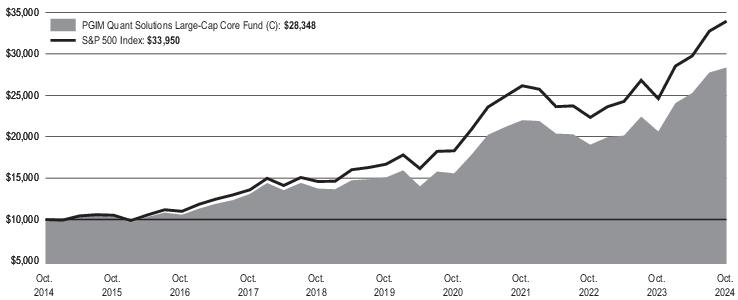
HOW HAS THE FUND PERFORMED OVER THE PAST 10 YEARS?
The Fund’s past performance is not a good predictor of the Fund’s future performance.
The returns do not reflect the deduction of
taxes that a shareholder would pay on Fund distributions or redemption of Fund shares.
Visit
pgim.com/investments/mutual-funds/prospectuses-fact-sheets
or call (800) 225-1852 or (973) 367-3529 from outside the US for more recent performance data.
The line graph reflects a hypothetical $10,000 investment in Class C shares and assumes that all recurring fees (including management fees)
were deducted and dividend and distributions were reinvested. Without waiver of fees and/or expense reimbursements, if any, the returns would
have been lower.
Cumulative Performance: October 31, 2014 to October 31, 2024 Initial Investment of $10,000 |
Average Annual Total Returns as of 10/31/2024 |
| | | |
Class C with sales charges | | | |
Class C without sales charges | | | |
Broad-Based Securities Market Index: S&P 500 Index | | | |
WHAT ARE SOME KEY FUND STATISTICS AS OF 10/31/2024?
| |
| |
Total advisory fees paid for the year | |
Portfolio turnover rate for the year | |
WHAT ARE SOME CHARACTERISTICS OF THE FUND’S HOLDINGS AS OF 10/31/2024?
| |
Semiconductors & Semiconductor Equipment | |
| |
Technology Hardware, Storage & Peripherals | |
Interactive Media & Services | |
| |
| |
Oil, Gas & Consumable Fuels | |
| |
| |
| |
| |
| |
Health Care Equipment & Supplies | |
| |
| |
Life Sciences Tools & Services | |
Consumer Staples Distribution & Retail | |
| |
| |
Health Care Providers & Services | |
| |
| |
Hotels, Restaurants & Leisure | |
| |
Diversified Telecommunication Services | |
| |
| |
Affiliated Mutual Fund - Short-Term Investment | |
| |
| |
| |
| |
| |
| |
| |
| |
| |
| |
| |
| |
| |
| |
Liabilities in excess of other assets | |
| |
* Consists of Industries that each make up less
than
0.5% of the Fund's net assets
WERE THERE ANY CHANGES TO THE FUND THIS YEAR?
The following is a summary of certain changes to the Fund since November 1, 2023:
■
The Fund's principal risk disclosure was revised to include Sector Exposure Risk as a principal risk of the Fund due to changes in the Fund's
portfolio which may result in greater exposure to certain economic sectors.
For more complete information, you should review the Fund’s next prospectus, which we expect to be available by December 30, 2024 at
pgim.com/investments/mutual-funds/prospectuses-fact-sheets
or by request at (800) 225-1852.
You can find additional information at
pgim.com/investments/mutual-funds/prospectuses-fact-sheets
or by scanning the QR code below,
including the Fund’s prospectus, financial information, fund holdings, and proxy voting information. You can also request this information by
contacting us at (800) 225-1852 or (973) 367-3529 from outside the US.
To receive your fund documents online, go to
pgim.com/investments/resource/edelivery
and enroll.
PGIM Quant Solutions Large-Cap Core Fund
PGIM Quant Solutions Large-Cap Core Fund
ANNUAL SHAREHOLDER REPORT – October 31, 2024
This annual shareholder report contains important information about the Class Z shares of PGIM Quant Solutions Large-Cap Core Fund (the
“Fund”) for the period of November 1, 2023 to October 31, 2024.
You can find additional information about the Fund at
pgim.com/investments/mutual-funds/prospectuses-fact-sheets
. You can also request
this information by contacting us at (800) 225-1852 or (973) 367-3529 from outside the US.
This report describes changes to the Fund that occurred during the reporting period.
WHAT WERE THE FUND COSTS FOR THE LAST YEAR?
(Based on a hypothetical $10,000 investment)
| Costs of a $10,000 investment | Costs paid as a percentage of a $10,000 investment |
PGIM Quant Solutions Large-Cap Core Fund—Class | | |
WHAT AFFECTED THE FUND’S PERFORMANCE DURING THE REPORTING PERIOD?
■
US Federal Reserve (Fed) policy dominated headlines and acted as the main directional catalyst for equity performance during the reporting
period. After keeping interest rates steady for the majority of the period, the Fed lowered interest rates by a half percentage point at its
September 2024 meeting. Large-cap stocks outpaced small-cap stocks during most of the period, although this trend shifted and volatility
increased toward the end of the period, as investors focused on the US presidential election.
■
The Fund’s performance relative to the S&P 500 Index (Index) benefited from a tilt in favor of stocks with improving growth expectations,
notably in the industrials sector. Overweight positions in some mega-cap tech stocks also helped.
■
The Fund’s stock selection in the consumer staples sector did not perform well, detracting from relative returns.
■
The Fund used futures contracts on the Index primarily to manage daily cash flows, provide liquidity, and equitize cash—not as a means of
adding to performance. Consequently, the effect on Fund performance was minimal.
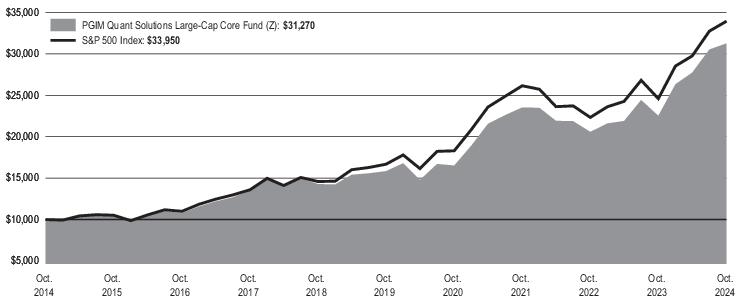
HOW HAS THE FUND PERFORMED OVER THE PAST 10 YEARS?
The Fund’s past performance is not a good predictor of the Fund’s future performance.
The returns do not reflect the deduction of
taxes that a shareholder would pay on Fund distributions or redemption of Fund shares.
Visit
pgim.com/investments/mutual-funds/prospectuses-fact-sheets
or call (800) 225-1852 or (973) 367-3529 from outside the US for more recent performance data.
The line graph reflects a hypothetical $10,000 investment in Class Z shares and assumes that all recurring fees (including management fees)
were deducted and dividend and distributions were reinvested. Without waiver of fees and/or expense reimbursements, if any, the returns would
have been lower.
Cumulative Performance: October 31, 2014 to October 31, 2024 Initial Investment of $10,000 |
Average Annual Total Returns as of 10/31/2024 |
| | | |
| | | |
Broad-Based Securities Market Index: S&P 500 Index | | | |
WHAT ARE SOME KEY FUND STATISTICS AS OF 10/31/2024?
| |
| |
Total advisory fees paid for the year | |
Portfolio turnover rate for the year | |
WHAT ARE SOME CHARACTERISTICS
OF
THE FUND’S HOLDINGS AS OF 10/31/2024?
| |
Semiconductors & Semiconductor Equipment | |
| |
Technology Hardware, Storage & Peripherals | |
Interactive Media & Services | |
| |
| |
Oil, Gas & Consumable Fuels | |
| |
| |
| |
| |
| |
Health Care Equipment & Supplies | |
| |
| |
Life Sciences Tools & Services | |
Consumer Staples Distribution & Retail | |
| |
| |
Health Care Providers & Services | |
| |
| |
Hotels, Restaurants & Leisure | |
| |
Diversified Telecommunication Services | |
| |
| |
Affiliated Mutual Fund - Short-Term Investment | |
| |
| |
| |
| |
| |
| |
| |
| |
| |
| |
| |
| |
| |
| |
Liabilities in excess of other assets | |
| |
* Consists of Industries that
each
make up less than
0.5
% of the Fund's net assets
WERE THERE ANY CHANGES TO THE FUND THIS YEAR?
The following is a summary of certain changes to the Fund since November 1, 2023:
■
The Fund's principal risk disclosure was revised to include Sector Exposure Risk as a principal risk of the Fund due to changes in the Fund's
portfolio which may result in greater exposure to certain economic sectors.
For more complete information, you should review the Fund’s next prospectus, which we expect to be available by December 30, 2024 at
pgim.com/investments/mutual-funds/prospectuses-fact-sheets
or by request at (800) 225-1852.
You can find additional information at
pgim.com/investments/mutual-funds/prospectuses-fact-sheets
or by scanning the QR code below,
including the Fund’s prospectus, financial information, fund holdings, and proxy voting information. You can also request this information by
contacting us at (800) 225-
1852
or (973) 367-3529 from outside the US.
To receive your fund documents online, go to
pgim.com/investments/resource/edelivery
and enroll.
PGIM Quant Solutions Large-Cap Core Fund
PGIM Quant Solutions Large-Cap Core Fund
ANNUAL SHAREHOLDER REPORT – October 31, 2024
This annual shareholder report contains important information about the Class R6 shares of PGIM Quant Solutions Large-Cap Core Fund (the
“Fund”) for the period of November 1, 2023 to October 31, 2024.
Y
ou can find additional information about the Fund at
pgim.com/investments/mutual-funds/prospectuses-fact-sheets
. You can also request
this information by contacting us at (800) 225-1852 or (973) 367-3529 from outside the US.
This report describes changes to the Fund that occurred during the reporting period.
WHAT WERE THE FUND COSTS FOR THE LAST YEAR?
(Based on a hypothetical $10,000 investment)
| Costs of a $10,000 investment | Costs paid as a percentage of a $10,000 investment |
PGIM Quant Solutions Large-Cap Core Fund—Class | | |
WHAT AFFECTED THE FUND’S PERFORMANCE DURING THE REPORTING PERIOD?
■
US Federal Reserve (Fed) policy dominated headlines and acted as the main directional catalyst for equity performance during the reporting
period. After keeping interest rates steady for the majority of the period, the Fed lowered interest rates by a half percentage point at its
September 2024 meeting. Large-cap stocks outpaced small-cap stocks during most of the period, although this trend shifted and volatility
increased toward the end of the period, as investors focused on the US presidential election.
■
The Fund’s performance relative to the S&P 500 Index (Index) benefited from a tilt in favor of stocks with improving growth expectations,
notably in the industrials sector. Overweight positions in some mega-cap tech stocks also helped.
■
The Fund’s stock selection in the consumer staples sector did not perform well, detracting from relative returns.
■
The Fund used futures contracts on the Index primarily to manage daily cash flows, provide liquidity, and equitize cash—not as a means of
adding to performance. Consequently, the effect on Fund performance was minimal.
HOW HAS THE FUND PERFORMED OVER THE PAST 10 YEARS?
The Fund’s past performance is not a good predictor of the Fund’s future performance.
The returns do not reflect the deduction of
taxes that a shareholder would pay on Fund distributions or redemption of Fund shares.
Visit
pgim.com/investments/mutual-funds/prospectuses-fact-sheets
or call (800) 225-1852 or (973) 367-3529 from outside the US for more recent performance data.
The line graph reflects a hypothetical $10,000 investment in Class R6 shares and assumes that all recurring fees (including management fees)
were deducted and dividend and distributions were reinvested. Without waiver of fees and/or expense reimbursements, if any, the
returns
would
have been lower.
Cumulative Performance: December 28, 2016 to October 31, 2024 Initial Investment of $10,000 |
Average Annual Total Returns as of 10/31/2024 |
| | | |
| | | |
Broad-Based Securities Market Index: S&P 500 Index | | | |
Since Inception returns are provided for the share class since it has less than 10 fiscal years of returns. Since Inception returns for the Index are measured from the
closest month-end to the class’s inception date.
WHAT ARE SOME KEY FUND STATISTICS AS OF 10/31/2024?
| |
| |
Total advisory fees paid for the year | |
Portfolio turnover rate for the year | |
WHAT ARE SOME CHARACTERISTICS OF THE FUND’S HOLDINGS AS OF 10/31/2024?
| |
Semiconductors & Semiconductor Equipment | |
| |
Technology Hardware, Storage & Peripherals | |
Interactive Media & Services | |
| |
| |
Oil, Gas & Consumable Fuels | |
| |
| |
| |
| |
| |
Health Care Equipment & Supplies | |
| |
| |
Life Sciences Tools & Services | |
Consumer Staples Distribution & Retail | |
| |
| |
Health Care Providers & Services | |
| |
| |
Hotels, Restaurants & Leisure | |
| |
Diversified Telecommunication Services | |
| |
| |
Affiliated Mutual Fund - Short-Term Investment | |
| |
| |
| |
| |
| |
| |
| |
| |
| |
| |
| |
| |
| |
| |
Liabilities in excess of other assets | |
| |
* Consists of
Industries
that each make up less than 0.5% of the Fund's net assets
WERE THERE ANY CHANGES TO THE FUND THIS YEAR?
The following is a summary of certain changes to the Fund since November 1, 2023:
■
The Fund's principal risk disclosure was revised to include Sector Exposure Risk as a principal risk of the Fund due to changes in the Fund's
portfolio which may result in greater exposure to certain economic sectors.
For more complete information, you should review the Fund’s next prospectus, which we expect to be available by December 30, 2024 at
pgim.com/investments/mutual-funds/prospectuses-fact-sheets
or by request at (800) 225-1852.
You can find additional information at
pgim.com/investments/mutual-funds/prospectuses-fact-sheets
or by scanning the QR code
below
,
including the Fund’s prospectus, financial information, fund holdings, and proxy voting information. You can also request this information by
contacting us at (800) 225-1852 or (973) 367-3529 from outside the US.
To receive your fund documents online, go to
pgim.com/investments/resource/edelivery
and enroll.
PGIM Quant Solutions Large-Cap Core Fund
PGIM Real Estate Income Fund
ANNUAL SHAREHOLDER REPORT – October 31, 2024
This annual shareholder report contains important information about the Class A shares of PGIM Real Estate Income Fund (the “Fund”) for the
period of November 1, 2023 to October 31, 2024.
You can find additional information about the Fund at
pgim.com/investments/mutual-funds/prospectuses-fact-sheets
. You can also request
this information by contacting us at (800) 225-1852 or (973) 367-3529 from outside the US.
WHAT WERE THE FUND COSTS FOR THE LAST YEAR?
(Based on a hypothetical $
10,000
investment)
| Costs of a $10,000 investment | Costs paid as a percentage of a $10,000 investment |
PGIM Real Estate Income Fund—Class A | | |
WHAT AFFECTED THE FUND’S PERFORMANCE DURING THE REPORTING PERIOD?
■
Coming off a volatile macroeconomic environment for real estate investment trusts (REITs) in 2023, global REITs saw a nearly flat first half of
2024, as investors remained cautious about the pace of interest rate cuts, election uncertainty, and economic growth. However, the sector
delivered strong performance in the third quarter of 2024. Gains were fairly uniform across Asia, the US, and Europe, as investors began to
factor in cooling global inflation and the early stages of a rate-cutting cycle in the US. Many of the headwinds for REITs began turning into
tailwinds, as private real estate pricing appeared to bottom globally, and capital markets and transaction activity increased significantly.
■
Positive stock selection contributed to the Fund’s performance relative to the Custom Blended Index in several sectors and regions. Within
North America, favorable stock selection, particularly in the data center, health care, and office sectors drove outperformance. Performance
benefited as well from stock selection in the industrial sector and an overweighting to mall stocks. Stock selection was also strong in the Asia
Pacific region, most notably in Japan.
■
Stock selection in US hotels detracted from the Fund’s performance, as did an overweight allocation to the US triple-net sector. In Europe, lack
of exposure to Germany undermined relative performance, while in Asia, an overweight position in Singapore dragged on returns.
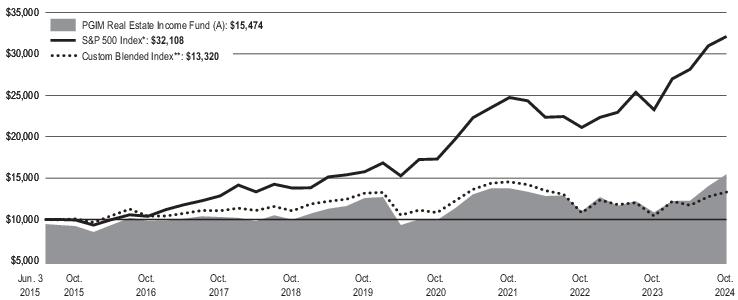
HOW HAS THE FUND PERFORMED OVER THE PAST 10 YEARS?
The Fund’s past performance is not a good predictor of the Fund’s future performance.
The returns do not reflect the deduction of
taxes that a shareholder would pay on Fund distributions or redemption of Fund shares.
Visit
pgim.com/investments/mutual-funds/prospectuses-fact-sheets
or call (800) 225-1852 or (973) 367-3529 from outside the US for more recent performance data.
The line graph reflects a hypothetical $10,000 investment in Class A shares and assumes that all recurring fees (including management fees)
were deducted and dividend and distributions were reinvested. Without waiver of fees and/or expense reimbursements, if any, the returns would
have been lower.
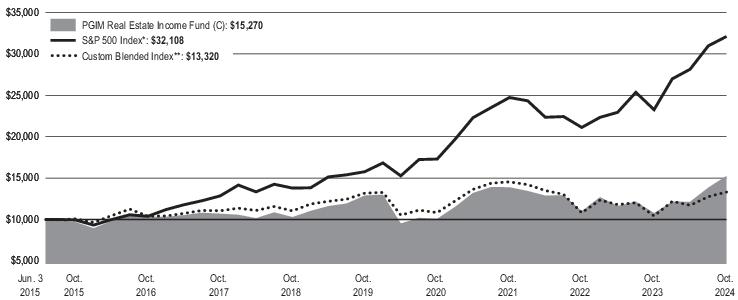
Cumulative Performance: June 3, 2015 to October 31, 2024 Initial Investment of $10,000 |
The line graph reflects the return on the Fund's Class A shares with sales charges.
Average Annual Total Returns as of 10/31/2024 |
| | | |
Class A with sales charges | | | |
Class A without sales charges | | | |
Broad-Based Securities Market Index: S&P 500 Index* | | | |
| | | |
*The Fund has added this broad-based index in response to new regulatory requirements.
**The Fund's Custom Blended Index is a model portfolio consisting of the FTSE EPRA/NAREIT Developed Net Index (80%) and the BofA 7% Constrained REIT Preferred Securities
Index (20%).
Since
Inception
returns are provided for the share class since it has less than 10 fiscal years of returns. Since Inception returns for the
Indexes
are measured from the
closest month-end to the class’s inception date.
WHAT ARE SOME KEY FUND STATISTICS AS OF 10/31/2024?
| |
| |
Total advisory fees paid for the year | |
Portfolio turnover rate for the year | |
WHAT ARE
SOME
CHARACTERISTICS OF THE FUND’S
HOLDINGS
AS OF 10/31/2024?
| |
Real Estate Operating Companies | |
Affiliated Mutual Fund - Short Term Investment (0.0% represents investments purchased with collateral from securities on loan) | |
| |
Other assets in excess of liabilities | |
| |
You can find additional information at
pgim.com/investments/mutual-funds/prospectuses-fact-sheets
or by scanning the QR code below,
including the Fund’s prospectus, financial information, fund holdings, and proxy voting information. You can also request this information by
contacting us at (800) 225-1852 or (973) 367-3529 from outside the US.
To receive your fund documents online, go to
pgim.com/investments/resource/edelivery
and enroll.
PGIM Real Estate Income Fund
PGIM Real Estate Income Fund
ANNUAL SHAREHOLDER REPORT – October 31, 2024
This annual shareholder report contains important information about the Class C shares of PGIM Real Estate Income Fund (the “Fund”) for the
period of November 1, 2023 to October 31, 2024.
You can find additional information about the Fund at
pgim.com/investments/mutual-funds/prospectuses-fact-sheets
. You can also request
this information by contacting us at (800) 225-1852 or (973) 367-3529 from outside the US.
WHAT WERE THE FUND COSTS FOR THE LAST YEAR?
(Based on a hypothetical $10,000 investment)
| Costs of a $10,000 investment | Costs paid as a percentage of a $10,000 investment |
PGIM Real Estate Income Fund—Class C | | |
WHAT AFFECTED THE FUND’S PERFORMANCE DURING THE REPORTING PERIOD?
■
Coming off a volatile macroeconomic environment for real estate investment trusts (REITs) in 2023, global REITs saw a nearly flat first half of
2024, as investors remained cautious about the pace of interest rate cuts, election uncertainty, and economic growth. However, the sector
delivered strong performance in the third quarter of 2024. Gains were fairly uniform across Asia, the US, and Europe, as investors began to
factor in cooling global inflation and the early stages of a rate-cutting cycle in the US. Many of the headwinds for REITs began turning into
tailwinds, as private real estate pricing appeared to bottom globally, and capital markets and transaction activity increased significantly.
■
Positive stock selection contributed to the Fund’s performance relative to the Custom Blended Index in several sectors and regions. Within
North America, favorable stock selection, particularly in the data center, health care, and office sectors drove outperformance. Performance
benefited as well from stock selection in the industrial sector and an overweighting to mall stocks. Stock selection was also strong in the Asia
Pacific region, most notably in Japan.
■
Stock selection in US hotels detracted from the Fund’s performance, as did an overweight allocation to the US triple-net sector. In Europe, lack
of exposure to Germany undermined relative performance, while in Asia, an overweight position in Singapore dragged on returns.
HOW HAS THE FUND PERFORMED OVER THE PAST 10 YEARS?
The Fund’s past performance is not a good predictor of the Fund’s future performance.
The returns do not reflect the deduction of
taxes that a shareholder would pay on Fund distributions or redemption of Fund shares.
Visit
pgim.com/investments/mutual-funds/prospectuses-fact-sheets
or call (800) 225-1852 or (973) 367-3529 from outside the US for more recent performance data.
The line graph reflects a hypothetical $10,000 investment in Class C shares and assumes that all recurring fees (including management fees)
were deducted and dividend and distributions were reinvested. Without waiver of fees and/or expense reimbursements, if any, the returns would
have been lower.
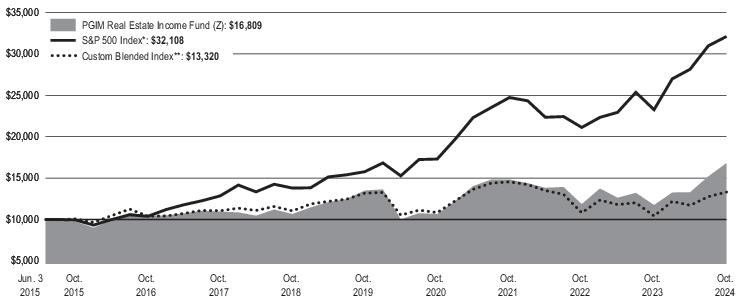
Cumulative Performance: June 3, 2015 to October 31, 2024 Initial Investment of $10,000 |
Average Annual Total Returns as of 10/31/2024 |
| | | |
Class C with sales charges | | | |
Class C without sales charges | | | |
Broad-Based Securities Market Index: S&P 500 Index * | | | |
| | | |
*The Fund has added this broad-based index in response to new regulatory requirements.
**The Fund's Custom Blended Index is a model portfolio consisting of the FTSE EPRA/NAREIT Developed Net Index (80%) and the BofA 7% Constrained REIT Preferred Securities
Index (20%).
Since Inception returns are provided for the share class since it has less than 10 fiscal years of returns. Since Inception returns for the Indexes are measured from the
closest month-end to the class’s inception date.
WHAT ARE SOME KEY FUND STATISTICS AS OF 10/31/2024?
| |
| |
Total advisory fees paid for the year | |
Portfolio turnover rate for the year | |
WHAT ARE SOME CHARACTERISTICS OF THE FUND’S HOLDINGS AS OF 10/31/2024?
| |
Real Estate Operating Companies | |
Affiliated Mutual Fund - Short Term Investment (0.0% represents investments purchased with collateral from securities on loan) | |
| |
Other assets in excess of liabilities | |
| |
You can find additional information at
pgim.com/investments/mutual-funds/prospectuses-fact-sheets
or by scanning the QR code below,
including the Fund’s prospectus, financial information, fund holdings, and proxy voting information. You can also request this information by
contacting us at (800) 225-1852 or (973) 367-3529 from outside the US.
To receive your fund documents online, go to
pgim.com/investments/resource/edelivery
and enroll.
PGIM Real Estate Income Fund
PGIM Real Estate Income Fund
ANNUAL SHAREHOLDER REPORT – October 31, 2024
This annual shareholder report contains important information about the Class Z shares of PGIM Real Estate Income Fund (the “Fund”) for the
period of November 1, 2023 to October 31, 2024.
You can find additional information about the Fund at
pgim.com/investments/mutual-funds/prospectuses-fact-sheets
. You can also request
this information by contacting us at (800) 225-1852 or (973) 367-3529 from outside the US.
WHAT WERE THE FUND COSTS FOR THE LAST YEAR?
(Based on a hypothetical $10,000 investment)
| Costs of a $10,000 investment | Costs paid as a percentage of a $10,000 investment |
PGIM Real Estate Income Fund—Class Z | | |
WHAT AFFECTED THE FUND’S PERFORMANCE DURING THE REPORTING PERIOD?
■
Coming off a volatile macroeconomic environment for real estate investment trusts (REITs) in 2023, global REITs saw a nearly flat first half of
2024, as investors remained cautious about the pace of interest rate cuts, election uncertainty, and economic growth. However, the sector
delivered strong performance in the third quarter of 2024. Gains were fairly uniform across Asia, the US, and Europe, as investors began to
factor in cooling global inflation and the early stages of a rate-cutting cycle in the US. Many of the headwinds for REITs began turning into
tailwinds, as private real estate pricing appeared to bottom globally, and capital markets and transaction activity increased significantly.
■
Positive stock selection contributed to the Fund’s performance relative to the Custom Blended Index in several sectors and regions. Within
North America, favorable stock selection, particularly in the data center, health care, and office sectors drove outperformance. Performance
benefited as well from stock selection in the industrial sector and an overweighting to mall stocks. Stock selection was also strong in the Asia
Pacific region, most notably in Japan.
■
Stock selection in US hotels detracted from the Fund’s performance, as did an overweight allocation to the US triple-net sector. In Europe, lack
of exposure to Germany undermined relative performance, while in Asia, an overweight position in Singapore dragged on returns.
HOW HAS THE FUND PERFORMED OVER THE PAST 10 YEARS?
The Fund’s past performance is not a good predictor of the Fund’s future performance.
The returns do not reflect the deduction of
taxes that a shareholder would pay on Fund distributions or redemption of Fund shares.
Visit
pgim.com/investments/mutual-funds/prospectuses-fact-sheets
or call (800) 225-1852 or (973) 367-3529 from outside the US for more recent performance data.
The line graph reflects a hypothetical $10,000 investment in Class Z shares and assumes that all recurring fees (including management fees)
were deducted and dividend and distributions were reinvested. Without waiver of fees and/or expense reimbursements, if any, the returns would
have been lower.
Cumulative Performance: June 3, 2015 to October 31, 2024 Initial Investment of $10,000 |
Average Annual Total Returns as of 10/31/2024 |
| | | |
| | | |
Broad-Based Securities Market Index: S&P 500 Index* | | | |
| | | |
*The Fund has added this broad-based index in response to new regulatory requirements.
**The Fund's Custom Blended Index is a model portfolio consisting of the FTSE EPRA/NAREIT Developed Net Index (80%) and the BofA 7% C
onstr
ained REIT Preferred Securities
Index (20%).
Since Inception returns are provided for the share class since it has less than 10 fiscal years of returns. Since Inception returns for the Indexes are measured from the
closest month-end to the class’s inception date.
WHAT ARE SOME KEY FUND STATISTICS AS OF
10/31/2024
?
| |
| |
Total advisory fees paid for the year | |
Portfolio turnover rate for the year | |
WHAT ARE SOME CHARACTERISTICS OF THE FUND’S HOL
DI
NGS AS OF 10/31/2024?
| |
Real Estate Operating Companies | |
Affiliated Mutual Fund - Short Term Investment (0.0% represents investments purchased with collateral from securities on loan) | |
| |
Other assets in excess of liabilities | |
| |
You can find additional information at
pgim.com/investments/mutual-funds/prospectuses-fact-sheets
or by scanning the QR code below,
including the Fund’s prospectus, financial information, fund holdings, and proxy voting information. You can also request this information by
contacting us at (800) 225-1852 or (973) 367-3529 from outside the US.
To receive your fund documents online, go to
pgim.com/investments/resource/edelivery
and enroll.
PGIM Real Estate Income Fund
PGIM Real Estate Income Fund
ANNUAL SHAREHOLDER REPORT – October 31, 2024
This annual shareholder report contains important information about the Class R6 shares of PGIM Real Estate Income Fund (the “Fund”) for the
period of November 1, 2023 to October 31, 2024.
You can find additional information about the Fund at
pgim.com/investments/mutual-funds/prospectuses-fact-sheets
. You can also request
this information by contacting us at (800) 225-1852 or (973) 367-3529 from outside the US.
WHAT WERE THE FUND COSTS FOR THE LAST YEAR?
(Based on a hypothetical $10,000 investment)
| Costs of a $10,000 investment | Costs paid as a percentage of a $10,000 investment |
PGIM Real Estate Income Fund—Class R6 | | |
WHAT AFFECTED THE FUND’S PERFORMANCE DURING THE REPORTING PERIOD?
■
Coming off a volatile macroeconomic environment for real estate investment trusts (REITs) in 2023, global REITs saw a nearly flat first half of
2024, as investors remained cautious about the pace of interest rate cuts, election uncertainty, and economic growth. However, the sector
delivered strong performance in the third quarter of 2024. Gains were fairly uniform across Asia, the US, and Europe, as investors began to
factor in cooling global inflation and the early stages of a rate-cutting cycle in the US. Many of the headwinds for REITs began turning into
tailwinds, as private real estate pricing appeared to bottom globally, and capital markets and transaction activity increased significantly.
■
Positive stock selection contributed to the Fund’s performance relative to the Custom Blended Index in several sectors and regions. Within
North America, favorable stock selection, particularly in the data center, health care, and office sectors drove outperformance. Performance
benefited as well from stock selection in the industrial sector and an overweighting to mall stocks. Stock selection was also strong in the Asia
Pacific region, most notably in Japan.
■
Stock selection in US hotels detracted from the Fund’s performance, as did an overweight allocation to the US triple-net sector. In Europe, lack
of exposure to Germany undermined relative performance, while in Asia, an overweight position in Singapore dragged on returns.
HOW HAS THE FUND PERFORMED OVER THE PAST 10 YEARS?
The Fund’s past performance is not a good predictor of the Fund’s future performance.
The returns do not reflect the deduction of
taxes that a shareholder would pay on Fund distributions or redemption of Fund shares.
Visit
pgim.com/investments/mutual-funds/prospectuses-fact-sheets
or call (800) 225-1852 or (973) 367-3529 from outside the US for more recent performance data.
The line graph reflects a hypothetical $10,000 investment in Class R6 shares and assumes that all recurring fees (including management fees)
were deducted and dividend and distributions were reinvested. Without waiver of fees and/or expense reimbursements, if any, the returns would
have been lower.
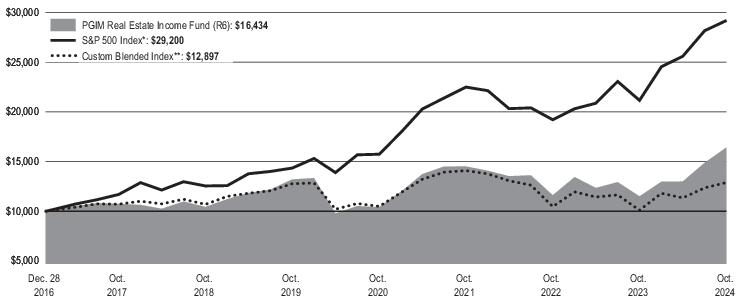
Cumulative Performance: December 28, 2016 to October 31, 2024 Initial Investment of $10,000 |
Average Annual Total Returns as of 10/31/2024 |
| | | |
| | | |
Broad-Based Securities Market Index: S&P 500 Index* | | | |
| | | |
*The Fund has added this broad-based index in response to new regulatory requirements.
**The Fund's Custom Blended Index is a model portfolio consisting of the FTSE EPRA/NAREIT
Developed
Net Index (80%) and the BofA 7% Constrained REIT Preferred Securities
Index (20%).
Since Inception returns are provided for the share class since it has less than 10 fiscal years of returns. Since Inception returns for the Indexes are measured from the
closest month-end to the class’s inception date.
WHAT ARE SOME KEY FUND STATISTICS AS OF 10/31/2024?
| |
| |
Total advisory fees paid for the year | |
Portfolio turnover rate for the year | |
WHAT ARE SOME CHARACTERISTICS OF THE FUND’S H
OLDIN
GS AS OF 10/31/2024?
| |
Real Estate Operating Companies | |
Affiliated Mutual Fund - Short Term Investment (0.0% represents investments purchased with collateral from securities on loan) | |
| |
Other assets in excess of liabilities | |
| |
You can find additional information at
pgim.com/investments/mutual-funds/prospectuses-fact-sheets
or by scanning the QR code below,
including the Fund’s prospectus, financial information, fund holdings, and proxy voting information. You can also request this information by
contacting us at (800) 225-1852 or (973) 367-3529 from outside the US.
To receive your fund documents online, go to
pgim.com/investments/resource/edelivery
and enroll.
PGIM Real Estate Income Fund
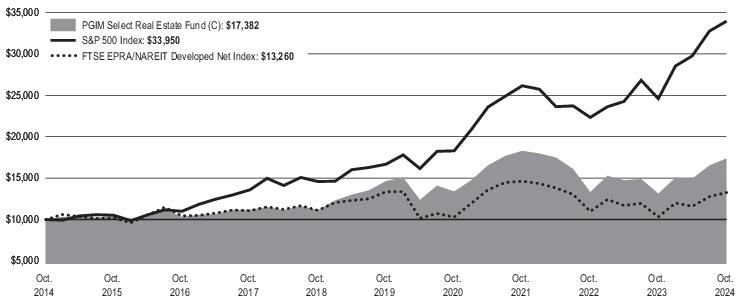
PGIM Select Real Estate Fund
ANNUAL SHAREHOLDER REPORT – October 31, 2024
This annual shareholder report contains important information about the Class A shares of PGIM Select Real Estate Fund (the “Fund”) for the
period of November 1, 2023 to October 31, 2024.
You can find additional information about the Fund at
pgim.com/investments/mutual-funds/prospectuses-fact-sheets
. You can also request
this information by contacting us at (800) 225-1852 or (973) 367-3529 from outside the US.
WHAT WERE THE FUND COSTS FOR THE LAST YEAR?
(Based on a hypothetical $10,000 investment)
| Costs of a $10,000 investment | Costs paid as a percentage of a $10,000 investment |
PGIM Select Real Estate Fund—Class A | | |
WHAT AFFECTED THE FUND’S PERFORMANCE DURING THE REPORTING PERIOD?
■
Coming off a volatile macroeconomic environment for real estate investment trusts (REITs) in 2023, global REITs saw a nearly flat first half of
2024, as investors remained cautious about the pace of interest rate cuts, election uncertainty, and economic growth. However, the sector
delivered strong performance in the third quarter of 2024. Gains were fairly uniform across Asia, the US, and Europe, as investors begin to
factor in cooling global inflation and the early stages of a rate-cutting cycle in the US. Many of the headwinds for REITs began turning into
tailwinds, as private real estate pricing appeared to bottom globally, and capital markets and transaction activity increased significantly.
■
Positive stock selection across all regions contributed to the Fund’s performance relative to the FTSE EPRA/NAREIT Developed Net Index.
Within North America, favorable stock selection, particularly in the data center, health care, triple-net and office sectors, drove outperformance.
Stock selection was also strong in the Asia Pacific region, most notably in Japan and Australia.
■
Underweight allocation to US storage stocks detracted from relative performance, as did stock selection in the US storage sector. In Europe,
security selection in the UK undermined relative returns, while in Asia, security selection in Singapore detracted.
HOW HAS THE FUND PERFORMED OVER THE PAST 10 YEARS?
The Fund’s past performance is not a good predictor of the Fund’s future performance.
The returns do not reflect the deduction of
taxes that a shareholder would pay on Fund distributions or redemption of Fund shares.
Visit
pgim.com/investments/mutual-funds/prospectuses-fact-sheets
or call (800) 225-1852 or (973) 367-3529 from outside the US for more recent performance data.
The line graph reflects a hypothetical $10,000 investment in Class A shares and assumes that all recurring fees (including management fees)
were deducted and dividend and distributions were reinvested. Without waiver of fees and/or expense reimbursements, if any, the returns would
have been lower.
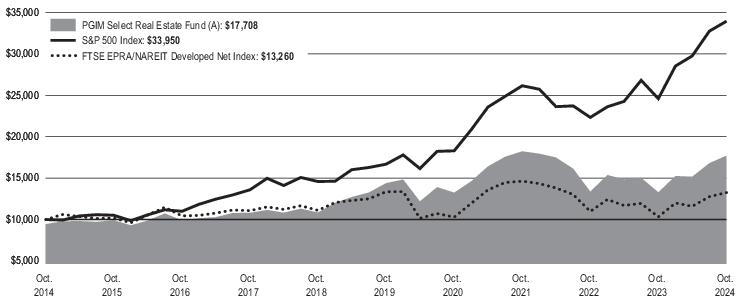
Cumulative Performance: October 31, 2014 to October 31, 2024 Initial Investment of $10,000 |
The line graph reflects the return on the Fund's Class A shares with sales charges.
Average Annual Total Returns as of 10/31/2024 |
| | | |
Class A with sales charges | | | |
Class A without sales charges | | | |
Broad-Based Securities Market Index: S&P 500 Index | | | |
FTSE EPRA/NAREIT Developed Net Index | | | |
WHAT ARE SOME KEY FUND STATISTICS AS OF 10/31/2024
?
| |
| |
Total advisory fees paid for the year | |
Portfolio turnover rate for the year | |
WHAT ARE SOME CHARACTERISTICS OF THE FUND’S HOLDINGS AS OF 10/31/2024?
| |
| |
| |
| |
| |
Other assets in excess of liabilities | |
| |
You can find additional information at
pgim.com/investments/mutual-funds/prospectuses-fact-sheets
or by scanning the QR code below,
including the Fund’s prospectus, financial information, fund holdings, and proxy voting information. You can also request this information by
contacting us at (800) 225-1852 or (973) 367-3529 from outside the US.
To receive your fund documents online, go to
pgim.com/investments/resource/edelivery
and enroll.
PGIM Select Real Estate Fund
PGIM Select Real Estate Fund
ANNUAL SHAREHOLDER REPORT – October 31, 2024
This annual shareholder report contains important information about the Class C shares of PGIM Select Real Estate Fund (the “Fund”) for the
period of November 1, 2023 to October 31, 2024.
You can find additional information about the Fund at
pgim.com/investments/mutual-funds/prospectuses-fact-sheets
. You can also request
this information by contacting us at (800) 225-1852 or (973) 367-3529 from outside the US.
WHAT WERE THE FUND COSTS FOR THE LAST YEAR?
(Based on a hypothetical $10,000 investment)
| Costs of a $10,000 investment | Costs paid as a percentage of a $10,000 investment |
PGIM Select Real Estate Fund—Class C | | |
WHAT AFFECTED THE FUND’S PERFORMANCE DURING THE REPORTING PERIOD?
■
Coming off a volatile macroeconomic environment for real estate investment trusts (REITs) in 2023, global REITs saw a nearly flat first half of
2024, as investors remained cautious about the pace of interest rate cuts, election uncertainty, and economic growth. However, the sector
delivered strong performance in the third quarter of 2024. Gains were fairly uniform across Asia, the US, and Europe, as investors begin to
factor in cooling global inflation and the early stages of a rate-cutting cycle in the US. Many of the headwinds for REITs began turning into
tailwinds, as private real estate pricing appeared to bottom globally, and capital markets and transaction activity increased significantly.
■
Positive stock selection across all regions contributed to the Fund’s performance relative to the FTSE EPRA/NAREIT Developed Net Index.
Within North America, favorable stock selection, particularly in the data center, health care, triple-net and office sectors, drove outperformance.
Stock selection was also strong in the Asia Pacific region, most notably in Japan and Australia.
■
Underweight allocation to US storage stocks detracted from relative performance, as did stock selection in the US storage sector. In Europe,
security selection in the UK undermined relative returns, while in Asia, security selection in Singapore detracted.
HOW HAS THE FUND PERFORMED OVER THE PAST 10 YEARS?
The Fund’s past performance is not a good predictor of the Fund’s future performance.
The returns do not reflect the deduction of
taxes that a shareholder would pay on Fund distributions or redemption of Fund shares.
Visit
pgim.com/investments/mutual-funds/prospectuses-fact-sheets
or call (800) 225-1852 or (973) 367-3529 from outside the US for more recent performance data.
The line graph reflects a hypothetical $10,000 investment in Class C shares and assumes that all recurring fees (including management fees)
were deducted and dividend and distributions were reinvested. Without waiver of fees and/or expense reimbursements, if any, the returns would
have been lower.
Cumulative Performance: October 31, 2014 to October 31, 2024 Initial Investment of $10,000 |
Average Annual Total Returns as of 10/31/2024 |
| | | |
Class C with sales charges | | | |
Class C without sales charges | | | |
Broad-Based Securities Market Index: S&P 500 Index | | | |
FTSE EPRA/NAREIT Developed Net Index | | | |
WHAT ARE SOME KEY FUND STATISTICS AS OF 10/31/2024?
| |
| |
Total advisory fees paid for the year | |
Portfolio turnover rate for the year | |
WHAT ARE SOME CHARACTERISTICS OF
THE
FUND’S HOLDINGS AS OF 10/31/2024?
| |
| |
| |
| |
| |
Other assets in excess of liabilities | |
| |
You can find additional information at
pgim.com/investments/mutual-funds/prospectuses-fact-sheets
or by scanning the QR code below,
including the Fund’s prospectus, financial information, fund holdings, and proxy voting information. You can also request this information by
contacting us at (800) 225-1852 or (973) 367-3529 from outside the US.
To receive your fund documents online, go to
pgim.com/investments/resource/edelivery
and enroll.
PGIM Select Real Estate Fund
PGIM Select Real Estate Fund
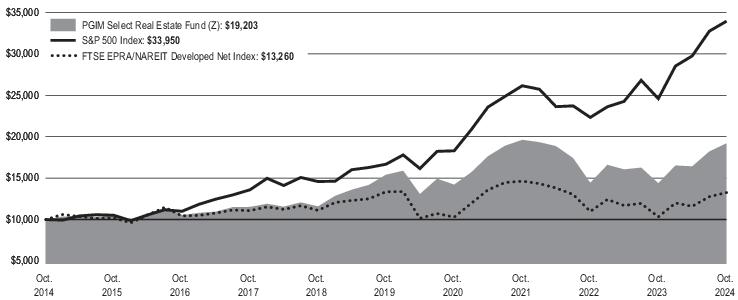
ANNUAL SHAREHOLDER REPORT – October 31, 2024
This annual shareholder report contains important information about the Class Z shares of PGIM Select Real Estate Fund (the “Fund”) for the
period of November 1, 2023 to October 31, 2024.
You can find additional information about the Fund at
pgim.com/investments/mutual-funds/prospectuses-fact-sheets
. You can also request
this information by contacting us at (800) 225-1852 or (973) 367-3529 from outside the US.
WHAT WERE THE FUND COSTS FOR THE LAST YEAR?
(Based on a hypothetical $10,000 investment)
| Costs of a $10,000 investment | Costs paid as a percentage of a $10,000 investment |
PGIM Select Real Estate Fund—Class Z | | |
WHAT AFFECTED THE FUND’S PERFORMANCE DURING THE REPORTING PERIOD?
■
Coming off a volatile macroeconomic environment for real estate investment trusts (REITs) in 2023, global REITs saw a nearly flat first half of
2024, as investors remained cautious about the pace of interest rate cuts, election uncertainty, and economic growth. However, the sector
delivered strong performance in the third quarter of 2024. Gains were fairly uniform across Asia, the US, and Europe, as investors begin to
factor in cooling global inflation and the early stages of a rate-cutting cycle in the US. Many of the headwinds for REITs began turning into
tailwinds, as private real estate pricing appeared to bottom globally, and capital markets and transaction activity increased significantly.
■
Positive stock selection across all regions contributed to the Fund’s performance relative to the FTSE EPRA/NAREIT Developed Net Index.
Within North America, favorable stock selection, particularly in the data center, health care, triple-net and office sectors, drove outperformance.
Stock selection was also strong in the Asia Pacific region, most notably in Japan and Australia.
■
Underweight allocation to US storage stocks detracted from relative performance, as did stock selection in the US storage sector. In Europe,
security selection in the UK undermined relative returns, while in Asia, security selection in Singapore detracted.
HOW HAS THE FUND PERFORMED OVER THE PAST 10 YEARS?
The Fund’s past performance is not a good predictor of the Fund’s future performance.
The returns do not reflect the deduction of
taxes that a shareholder would pay on Fund distributions or redemption of Fund shares.
Visit
pgim.com/investments/mutual-funds/prospectuses-fact-sheets
or call (800) 225-1852 or (973) 367-3529 from outside the US for more recent performance data.
The line graph reflects a hypothetical $10,000 investment in Class Z shares and assumes that all recurring fees (including management fees)
were deducted and dividend and distributions were reinvested. Without waiver of fees and/or expense reimbursements, if any, the returns would
have been lower.
Cumulative Performance: October 31, 2014 to October 31, 2024 Initial Investment of $10,000 |
Average Annual Total Returns as of 10/31/2024 |
| | | |
| | | |
Broad-Based Securities Market Index: S&P 500 Index | | | |
FTSE EPRA/NAREIT Developed Net Index | | | |
WHAT ARE SOME KEY FUND STATISTICS AS OF 10/31/2024?
| |
| |
Total advisory fees paid for the year | |
Portfolio turnover rate for the year | |
WHAT ARE SOME CHARACTERISTICS OF THE FUND’S HOLDINGS AS OF 10/31/2024?
| |
| |
| |
| |
| |
Other assets in excess of liabilities | |
| |
You can find additional information at
pgim.com/investments/mutual-funds/prospectuses-fact-sheets
or by scanning the QR code below,
including the Fund’s prospectus, financial information, fund holdings, and proxy voting information. You can also request this information by
contacting us at (800) 225-1852 or (973) 367-3529 from outside the US.
To receive your fund documents online, go to
pgim.com/investments/resource/edelivery
and enroll.
PGIM Select Real Estate Fund
PGIM Select Real Estate Fund
ANNUAL SHAREHOLDER REPORT – October 31, 2024
This annual shareholder report contains important information about the Class R6 shares of PGIM Select Real Estate Fund (the “Fund”) for the
period of November 1, 2023 to October 31, 2024.
You can find additional information about the Fund at
pgim.com/investments/mutual-funds/prospectuses-fact-sheets
. You can also request
this information by contacting us at (800) 225-1852 or (973) 367-3529 from outside the US.
This report describes changes to the Fund that occurred during the reporting period.
WHAT WERE THE FUND COSTS FOR THE LAST YEAR?
(Based on a hypothetical $10,000 investment)
| Costs of a $10,000 investment | Costs paid as a percentage of a $10,000 investment |
PGIM Select Real Estate Fund—Class R6 | | |
WHAT AFFECTED THE FUND’S PERFORMANCE DURING THE REPORTING PERIOD?
■
Coming off a volatile macroeconomic environment for real estate investment trusts (REITs) in 2023, global REITs saw a nearly flat first half of
2024, as investors remained cautious about the pace of interest rate cuts, election uncertainty, and economic growth. However, the sector
delivered strong performance in the third quarter of 2024. Gains were fairly uniform across Asia, the US, and Europe, as investors begin to
factor in cooling global inflation and the early stages of a rate-cutting cycle in the US. Many of the headwinds for REITs began turning into
tailwinds, as private real estate pricing appeared to bottom globally, and capital markets and transaction activity increased significantly.
■
Positive stock selection across all regions contributed to the Fund’s performance relative to the FTSE EPRA/NAREIT Developed Net Index.
Within North America, favorable stock selection, particularly in the data center, health care, triple-net and office sectors, drove outperformance.
Stock selection was also strong in the Asia Pacific region, most notably in Japan and Australia.
■
Underweight allocation to US storage stocks detracted from relative performance, as did stock selection in the US storage sector. In Europe,
security selection in the UK undermined relative returns, while in Asia, security selection in Singapore detracted.
HOW HAS THE FUND PERFORMED OVER THE PAST 10 YEARS?
The Fund’s past performance is not a good predictor of the Fund’s future performance.
The returns do not reflect the deduction of
taxes that a shareholder would pay on Fund distributions or redemption of Fund shares.
Visit
pgim.com/investments/mutual-funds/prospectuses-fact-sheets
or call (800) 225-1852 or (973) 367-3529 from outside the US for more recent performance data.
The line graph reflects a hypothetical $10,000 investment in Class R6 shares and assumes that all recurring fees (including management fees)
were deducted and dividend and distributions were reinvested. Without waiver of fees and/or expense reimbursements, if any, the returns would
have been lower.
Cumulative Performance: October 31, 2014 to October 31, 2024 Initial Investment of $10,000 |
Average Annual Total Returns as of 10/31/2024 |
| | | |
| | | |
Broad-Based Securities Market Index: S&P 500 Index | | | |
FTSE EPRA/NAREIT Developed Net Index | | | |
WHAT ARE SOME KEY FUND STATISTICS AS OF 10/31/2024?
| |
| |
Total advisory fees paid for the year | |
Portfolio turnover rate for the year | |
WHAT ARE SOME CHARACTERISTICS OF THE FU
ND’
S HOLDINGS AS OF 10/31/2024?
| |
| |
| |
| |
| |
Other assets in excess of liabilities | |
| |
WERE THERE ANY CHANGES TO THE FUND THIS YEAR?
The following is a summary of certain changes to the Fund since November 1, 2023:
■
For the year ended October 31, 2024, the total annual Fund operating expenses after waivers and/or expense reimbursement for Class R6
shares increased from 0.93% in the year ended October 31, 2023 to 1.04% primarily due to a decrease in the Fund’s average net assets.
For more complete information, you should review the Fund’s next prospectus, which we expect to be available by February 28, 2025
at
pgim.com/investments/mutual-funds/prospectuses-fact-sheets
or by request at (800) 225-1852.
You can find additional information at
pgim.com/investments/mutual-funds/prospectuses-fact-sheets
or by scanning the QR code below,
including the Fund’s prospectus, financial information, fund holdings, and proxy voting information. You can also request this information by
contacting us at (800) 225-1852 or (973) 367-3529 from outside the US.
To receive your fund documents online, go to
pgim.com/investments/resource/edelivery
and enroll.
PGIM Select Real Estate Fund
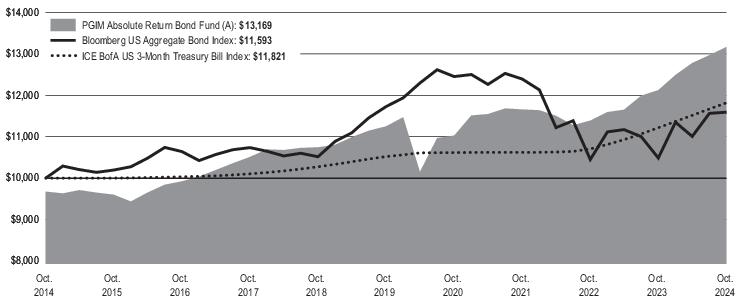
PGIM Absolute Return Bond Fund
ANNUAL SHAREHOLDER REPORT – October 31, 2024
This annual shareholder report contains important information about the Class A shares of PGIM Absolute Return Bond Fund (the “Fund”) for the
period of November 1, 2023 to October 31, 2024.
You can find additional information about the Fund at
pgim.com/investments/mutual-funds/prospectuses-fact-sheets
. You can also request
this information by contacting us at (800) 225-1852 or (973) 367-3529 from outside the US.
WHAT WERE THE FUND COSTS FOR THE LAST YEAR?
(Based on a hypothetical $10,000 investment)
| Costs of a $10,000 investment | Costs paid as a percentage of a $10,000 investment |
PGIM Absolute Return Bond Fund—Class A | | |
WHAT AFFECTED THE FUND’S PERFORMANCE DURING THE REPORTING PERIOD?
■
During the reporting period, market expectations for both the timing and number of rate cuts fluctuated significantly as inflation slowed and
employment data showed some signs of softening. The US Federal Reserve easing cycle began in September 2024 with a 0.50% rate cut,
which was preceded by a resteepening of the US Treasury curve as well as greater market volatility due to elections and fiscal uncertainty in
the US, France, and the UK. As demand for yield remained robust, credit spreads largely tightened, and performance across fixed income
sectors was positive.
■
The following contributed most to the Fund’s performance relative to the ICE BofA US 3-Month Treasury Bill Index during the reporting period:
positioning in US investment grade corporates, emerging markets high yield, non-agency commercial mortgage-backed securities
(CMBS) AA-and-below, and collateralized loan obligations (CLOs) AA; security selection in US Treasuries, US high yield corporates, and
non-agency mortgage-backed securities (MBS); allocations to the CLOs AAA, MBS, and asset-backed securities sectors; and credit positioning
in banking, cable & satellite, health care & pharmaceuticals, retailers & restaurants, midstream energy, consumer non-cyclicals, and
electric utilities.
■
The following detracted most from relative performance during the reporting period: yield curve positioning; security selection in British pound
sterling-denominated high yield corporates and European high yield corporates; duration positioning; and allocations to the emerging markets
investment grade and tax-exempt municipal bond sectors.
■
The Fund used futures, swaps, and options to help manage duration positioning and yield curve exposure, and forward currency exchange
contracts were used to hedge against non-US dollar-denominated positions. Collectively, the use of derivatives had a positive impact on
relative performance.
HOW HAS THE FUND PERFORMED OVER THE PAST 10 YEARS?
The Fund’s past performance is not a good predictor of the Fund’s future performance.
The returns do not reflect the deduction of
taxes that a shareholder would pay on Fund distributions or redemption of Fund shares.
Visit
pgim.com/investments/mutual-funds/prospectuses-fact-sheets
or call (800) 225-1852 or (973) 367-3529 from outside the US for more recent performance data.
The line graph reflects a hypothetical $10,000 investment in Class A shares and assumes that all recurring fees (including management fees)
were deducted and dividend and distributions were reinvested. Without waiver of fees and/or expense reimbursements, if any, the returns would
have been lower.
Cumulative Performance: O cto ber 31, 2014 to Octobe r 31, 2024 Initial Investment of $10,000 |
The line graph reflects the return on the Fund's Class A shares with sales charges.
Average Annual Total Returns as of 10/31/2024 |
| | | |
Class A with sales charges | | | |
Class A without sales charges | | | |
Broad-Based Securities Market Index: Bloomberg US Aggregate Bond | | | |
ICE BofA US 3-Month Treasury Bill Index | | | |
WHAT ARE SOME KEY FUND STATISTICS AS OF 10/31/2024?
| |
| |
Total advisory fees paid for the year | |
Portfolio turnover rate for the year | |
WHAT ARE SOME CHARACTERISTICS OF THE FUND’S HOLDINGS AS OF 10/31/2024?
Credit Quality expressed as a percentage of total investments as of 10/31/2024 (%) |
| |
| |
| |
| |
| |
| |
| |
| |
| |
| |
| |
| |
| |
Credit ratings reflect the highest rating assigned by a nationally recognized statistical rating organization (NRSRO) such as Moody’s Investors Service, Inc. (Moody’s), S&P Global
Ratings (S&P), or Fitch Ratings, Inc. (Fitch). Credit ratings reflect the common nomenclature used by both S&P and Fitch. Where applicable, ratings are converted to the comparable
S&P/Fitch rating tier nomenclature. The Not Rated category consists of securities that have not been rated by an NRSRO. Credit ratings are subject to change.
You can find additional information at
pgim.com/investments/mutual-funds/prospectuses-fact-sheets
or by scanning the QR code below,
including the Fund’s prospectus, financial information, fund holdings, and proxy voting information. You can also request this information by
contacting us at (800) 225-1852 or (973) 367-3529 from outside the US.
To receive your fund documents online, go to
pgim.com/investments/resource/edelivery
and enroll.
PGIM Absolute Return Bond Fund
PGIM Absolute Return Bond Fund
ANNUAL SHAREHOLDER REPORT – October 31, 2024
This annual shareholder report contains important information about the Class C shares of PGIM Absolute Return Bond Fund (the “Fund”) for the
period of November 1, 2023 to October 31, 2024.
You can find additional information about the Fund at
pgim.com/investments/mutual-funds/prospectuses-fact-sheets
. You can also request
this information by contacting us at (800) 225-1852 or (973) 367-3529 from outside the US.
WHAT WERE THE FUND COSTS FOR THE LAST YEAR?
(Based on a hypothetical $10,000 investment)
| Costs of a $10,000 investment | Costs paid as a percentage of a $10,000 investment |
PGIM Absolute Return Bond Fund—Class C | | |
WHAT AFFECTED THE FUND’S PERFORMANCE DURING THE REPORTING PERIOD?
■
During the reporting period, market expectations for both the timing and number of rate cuts fluctuated significantly as inflation slowed and
employment data showed some signs of softening. The US Federal Reserve easing cycle began in September 2024 with a 0.50% rate cut,
which was preceded by a resteepening of the US Treasury curve as well as greater market volatility due to elections and fiscal uncertainty in
the US, France, and the UK. As demand for yield remained robust, credit spreads largely tightened, and performance across fixed income
sectors was positive.
■
The following contributed most to the Fund’s performance relative to the ICE BofA US 3-Month Treasury Bill Index during the reporting period:
positioning in US investment grade corporates, emerging markets high yield, non-agency commercial mortgage-backed securities
(CMBS) AA-and-below, and collateralized loan obligations (CLOs) AA; security selection in US Treasuries, US high yield corporates, and
non-agency mortgage-backed securities (MBS); allocations to the CLOs AAA, MBS, and asset-backed securities sectors; and credit positioning
in banking, cable & satellite, health care & pharmaceuticals, retailers & restaurants, midstream energy, consumer non-cyclicals, and
electric utilities.
■
The following detracted most from relative performance during the reporting period: yield curve positioning; security selection in British pound
sterling-denominated high yield corporates and European high yield corporates; duration positioning; and allocations to the emerging markets
investment grade and tax-exempt municipal bond sectors.
■
The Fund used futures, swaps, and options to help manage duration positioning and yield curve exposure, and forward currency exchange
contracts were used to hedge against non-US dollar-denominated positions. Collectively, the use of derivatives had a positive impact on
relative performance.
HOW HAS THE FUND PERFORMED OVER THE PAST 10 YEARS?
The Fund’s past performance is not a good predictor of the Fund’s future performance.
The returns do not reflect the deduction of
taxes that a shareholder would pay on Fund distributions or redemption of Fund shares.
Visit
pgim.com/investments/mutual-funds/prospectuses-fact-sheets
or call (800) 225-1852 or (973) 367-3529 from outside the US for more recent performance data.
The line graph reflects a hypothetical $10,000 investment in Class C shares and assumes that all recurring fees (including management fees)
were deducted and dividend and distributions were reinvested. Without waiver of fees and/or expense reimbursements, if any, the returns would
have been lower.
Cumulative Performance: October 31, 2014 to October 31, 2024 Initial Investment of $10,000 |
Average Annual Total Returns as of 10/31/2024 |
| | | |
Class C with sales charges | | | |
Class C without sales charges | | | |
Broad-Based Securities Market Index: Bloomberg US Aggregate Bond | | | |
ICE BofA US 3-Month Treasury Bill Index | | | |
WHAT ARE SOME KEY FUND STATISTICS AS OF 10/31/2024?
| |
| |
Total advisory fees paid for the year | |
Portfolio turnover rate for the year | |
WHAT ARE SOME CHARACTERISTICS OF THE FUND’S HOLDINGS AS OF 10/31/2
0
24?
Credit Quality expressed as a percentage of total investments as of 10/31/2024 (%) |
| |
| |
| |
| |
| |
| |
| |
| |
| |
| |
| |
| |
| |
Credit ratings reflect the highest rating assigned by a nationally recognized statistical rating organization (NRSRO) such as Moody’s Investors Service, Inc. (Moody’s), S&P Global
Ratings (S&P), or Fitch Ratings, Inc. (Fitch). Credit ratings reflect the common nomenclature used by both S&P and Fitch. Where applicable, ratings are converted to the comparable
S&P/Fitch rating tier nomenclature. The Not Rated category consists of securities that have not been rated by an NRSRO. Credit ratings are subject to change.
You can find additional information at
pgim.com/investments/mutual-funds/prospectuses-fact-sheets
or by scanning the QR code below,
including the Fund’s prospectus, financial information, fund holdings, and proxy voting information. You can also request this information by
contacting us at (800) 225-1852 or (973) 367-3529 from outside the US.
To receive your fund documents online, go to
pgim.com/investments/resource/edelivery
and enroll.
PGIM Absolute Return Bond Fund
PGIM Absolute Return Bond Fund
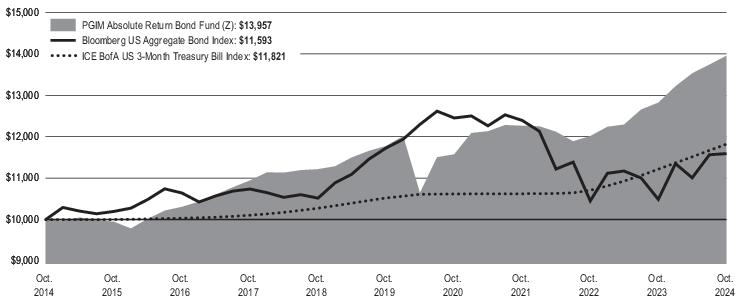
ANNUAL SHAREHOLDER REPORT – October 31, 2024
This annual shareholder report contains important information about the Class Z shares of PGIM Absolute Return Bond Fund (the “Fund”) for the
period of November 1, 2023 to October 31, 2024.
You can find additional information about the Fund at
pgim.com/investments/mutual-funds/prospectuses-fact-sheets
. You can also request
this information by contacting us at (800) 225-1852 or (973) 367-3529 from outside the US.
WHAT WERE THE FUND COSTS FOR THE LAST YEAR?
(Based on a hypothetical $10,000 investment)
| Costs of a $10,000 investment | Costs paid as a percentage of a $10,000 investment |
PGIM Absolute Return Bond Fund—Class Z | | |
WHAT AFFECTED THE FUND’S PERFORMANCE DURING THE REPORTING PERIOD?
■
During the reporting period, market expectations for both the timing and number of rate cuts fluctuated significantly as inflation slowed and
employment data showed some signs of softening. The US Federal Reserve easing cycle began in September 2024 with a 0.50% rate cut,
which was preceded by a resteepening of the US Treasury curve as well as greater market volatility due to elections and fiscal uncertainty in
the US, France, and the UK. As demand for yield remained robust, credit spreads largely tightened, and performance across fixed income
sectors was positive.
■
The following contributed most to the Fund’s performance relative to the ICE BofA US 3-Month Treasury Bill Index during the reporting period:
positioning in US investment grade corporates, emerging markets high yield, non-agency commercial mortgage-backed securities
(CMBS) AA-and-below, and collateralized loan obligations (CLOs) AA; security selection in US Treasuries, US high yield corporates, and
non-agency mortgage-backed securities (MBS); allocations to the CLOs AAA, MBS, and asset-backed securities sectors; and credit positioning
in banking, cable & satellite, health care & pharmaceuticals, retailers & restaurants, midstream energy, consumer non-cyclicals, and
electric utilities.
■
The following detracted most from relative performance during the reporting period: yield curve positioning; security selection in British pound
sterling-denominated high yield corporates and European high yield corporates; duration positioning; and allocations to the emerging markets
investment grade and tax-exempt municipal bond sectors.
■
The Fund used futures, swaps, and options to help manage duration positioning and yield curve exposure, and forward currency exchange
contracts were used to hedge against non-US dollar-denominated positions. Collectively, the use of derivatives had a positive impact on
relative performance.
HOW HAS THE FUND PERFORMED OVER THE PAST 10 YEARS?
The Fund’s past performance is not a good predictor of the Fund’s future performance.
The returns do not reflect the deduction of
taxes that a shareholder would pay on Fund distributions or redemption of Fund shares.
Visit
pgim.com/investments/mutual-funds/prospectuses-fact-sheets
or call (800) 225-1852 or (973) 367-3529 from outside the US for more recent performance data.
The line graph reflects a hypothetical $10,000 investment in Class Z shares and assumes that all recurring fees (including management fees)
were deducted and dividend and distributions were reinvested. Without waiver of fees and/or expense reimbursements, if any, the returns would
have been lower.
Cumulative Performance: October 31, 2014 to October 31, 2024 Initial Investment of $10,000 |
Average Annual Total Returns as of 10/31/2024 |
| | | |
| | | |
Broad-Based Securities Market Index: Bloomberg US Aggregate Bond | | | |
ICE BofA US 3-Month Treasury Bill Index | | | |
WHAT ARE SOME KEY FUND STATISTICS AS OF 10/31/2024?
| |
| |
Total advisory fees paid for the year | |
Portfolio turnover rate for the year | |
WHAT ARE SOME CHARACTERISTICS OF THE FUND’S HOLDINGS AS OF 10/31/2
0
24?
Credit Quality expressed as a percentage of total investments as of 10/31/2024 (%) |
| |
| |
| |
| |
| |
| |
| |
| |
| |
| |
| |
| |
| |
Credit ratings reflect the highest rating assigned by a nationally recognized statistical rating organization (NRSRO) such as Moody’s Investors Service, Inc. (Moody’s), S&P Global
Ratings (S&P), or Fitch Ratings, Inc. (Fitch). Credit ratings reflect the common nomenclature used by both S&P and Fitch. Where applicable, ratings are converted to the comparable
S&P/Fitch rating tier nomenclature. The Not Rated category consists of securities that have not been rated by an NRSRO. Credit ratings are subject to change.
You can find additional information at
pgim.com/investments/mutual-funds/prospectuses-fact-sheets
or by scanning the QR code below,
including the Fund’s prospectus, financial information, fund holdings, and proxy voting information. You can also request this information by
contacting us at (800) 225-1852 or (973) 367-3529 from outside the US.
To receive your fund documents online, go to
pgim.com/investments/resource/edelivery
and enroll.
PGIM Absolute Return Bond Fund
PGIM Absolute Return Bond Fund
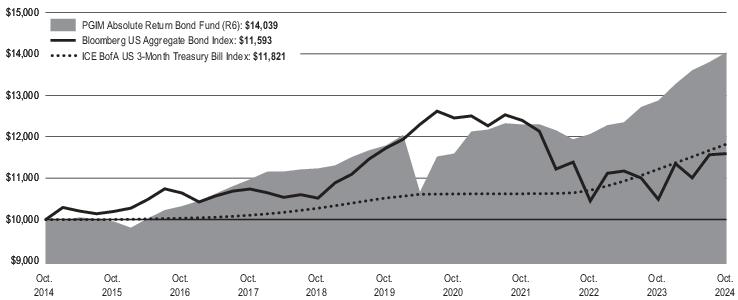
ANNUAL SHAREHOLDER REPORT – October 31, 2024
This annual shareholder report contains important information about the Class R6 shares of PGIM Absolute Return Bond Fund (the “Fund”) for
the period of November 1, 2023 to October 31, 2024.
You can find additional information about the Fund at
pgim.com/investments/mutual-funds/prospectuses-fact-sheets
. You can also request
this information by contacting us at (800) 225-1852 or (973) 367-3529 from outside the US.
WHAT WERE THE FUND COSTS FOR THE LAST YEAR?
(Based on a hypothetical $10,000 investment)
| Costs of a $10,000 investment | Costs paid as a percentage of a $10,000 investment |
PGIM Absolute Return Bond Fund—Class R6 | | |
WHAT AFFECTED THE FUND’S PERFORMANCE DURING THE REPORTING PERIOD?
■
During the reporting period, market expectations for both the timing and number of rate cuts fluctuated significantly as inflation slowed and
employment data showed some signs of softening. The US Federal Reserve easing cycle began in September 2024 with a 0.50% rate cut,
which was preceded by a resteepening of the US Treasury curve as well as greater market volatility due to elections and fiscal uncertainty in
the US, France, and the UK. As demand for yield remained robust, credit spreads largely tightened, and performance across fixed income
sectors was positive.
■
The following contributed most to the Fund’s performance relative to the ICE BofA US 3-Month Treasury Bill Index during the reporting period:
positioning in US investment grade corporates, emerging markets high yield, non-agency commercial mortgage-backed securities
(CMBS) AA-and-below, and collateralized loan obligations (CLOs) AA; security selection in US Treasuries, US high yield corporates, and
non-agency mortgage-backed securities (MBS); allocations to the CLOs AAA, MBS, and asset-backed securities sectors; and credit positioning
in banking, cable & satellite, health care & pharmaceuticals, retailers & restaurants, midstream energy, consumer non-cyclicals, and
electric utilities.
■
The following detracted most from relative performance during the reporting period: yield curve positioning; security selection in British pound
sterling-denominated high yield corporates and European high yield corporates; duration positioning; and allocations to the emerging markets
investment grade and tax-exempt municipal bond sectors.
■
The Fund used futures, swaps, and options to help manage duration positioning and yield curve exposure, and forward currency exchange
contracts were used to hedge against non-US dollar-denominated positions. Collectively, the use of derivatives had a positive impact on
relative performance.
HOW HAS THE FUND PERFORMED OVER THE PAST 10 YEARS?
The Fund’s past performance is not a good predictor of the Fund’s future performance.
The returns do not reflect the deduction of
taxes that a shareholder would pay on Fund distributions or redemption of Fund shares.
Visit
pgim.com/investments/mutual-funds/prospectuses-fact-sheets
or call (800) 225-1852 or (973) 367-3529 from outside the US for more recent performance data.
The line graph reflects a hypothetical $10,000 investment in Class R6 shares and assumes that all recurring fees (including management fees)
were deducted and dividend and distributions were reinvested. Without waiver of fees and/or expense reimbursements, if any, the returns would
have been lower.
Cumulative Performance: October 31, 2014 to October 31, 2024 Initial Investment of $10,000 |
Average Annual Total Returns as of 10/31/2024 |
| | | |
| | | |
Broad-Based Securities Market Index: Bloomberg US Aggregate Bond
Index | | | |
ICE BofA US 3-Month Treasury Bill Index | | | |
WHAT ARE SOME KEY FUND STATISTICS AS OF 10/31/2024?
| |
| |
Total advisory fees paid for the year | |
Portfolio turnover rate for the year | |
WHAT ARE SOME CHARACTERISTICS OF THE FUND’S HOLDINGS AS OF 10/31/20
2
4?
Credit Quality expressed as a percentage of total investments as of 10/31/2024 (%) |
| |
| |
| |
| |
| |
| |
| |
| |
| |
| |
| |
| |
| |
Credit ratings reflect the highest rating assigned by a nationally recognized statistical rating organization (NRSRO) such as Moody’s Investors Service, Inc. (Moody’s), S&P Global
Ratings (S&P), or Fitch Ratings, Inc. (Fitch). Credit ratings reflect the common nomenclature used by both S&P and Fitch. Where applicable, ratings are converted to the comparable
S&P/Fitch rating tier nomenclature. The Not Rated category consists of securities that have not been rated by an NRSRO. Credit ratings are subject to change.
You can find additional information at
pgim.com/investments/mutual-funds/prospectuses-fact-sheets
or by scanning the QR code below,
including the Fund’s prospectus, financial information, fund holdings, and proxy voting information. You can also request this information by
contacting us at (800) 225-1852 or (973) 367-3529 from outside the US.
To receive your fund documents online, go to
pgim.com/investments/resource/edelivery
and enroll.
PGIM Absolute Return Bond Fund
| | (b) | Copy of each notice transmitted to stockholders in reliance on Rule 30e-3 under the Act (17 CFR 270.30e-3) that contains disclosures specified by paragraph (c)(3) of that rule – Not applicable. |
Item 2 – Code of Ethics – See Exhibit (a)
As of the end of the period covered by this report, the registrant has adopted a code of ethics (the “Section 406 Standards for Investment Companies – Ethical Standards for Principal Executive and Financial Officers”) that applies to the registrant’s Principal Executive Officer, Principal Financial Officer and Principal Accounting Officer.
The registrant hereby undertakes to provide any person, without charge, upon request, a copy of the code of ethics. To request a copy of the code of ethics, contact the registrant 800-225-1852, and ask for a copy of the Section 406 Standards for Investment Companies - Ethical Standards for Principal Executive and Financial Officers.
Item 3 – Audit Committee Financial Expert –
The registrant’s Board has determined that Ms. Grace C. Torres, member of the Board’s Audit Committee is an “audit committee financial expert,” and that she is “independent,” for purposes of this item.
Item 4 – Principal Accountant Fees and Services –
For the fiscal years ended October 31, 2024 and October 31, 2023, PricewaterhouseCoopers LLP (“PwC”), the Registrant’s principal accountant, billed the Registrant $171,622 and $161,544, respectively, for professional services rendered for the audit of the Registrant’s annual financial statements or services that are normally provided in connection with statutory and regulatory filings.
For the fiscal years ended October 31, 2024 and October 31, 2023: none.
For the fiscal years ended October 31, 2024 and October 31, 2023: none.
For the fiscal years ended October 31, 2024 and October 31, 2023: none.
| | (e) | (1) Audit Committee Pre-Approval Policies and Procedures |
THE PGIM MUTUAL FUNDS
AUDIT COMMITTEE POLICY
on
Pre-Approval of Services Provided by the Independent
Accountants
The Audit Committee of each PGIM Mutual Fund is charged with the responsibility to monitor the independence of the Fund’s independent accountants. As part of this responsibility, the Audit Committee must pre-approve the independent accounting firm’s engagement to render audit and/or permissible non-audit services, as required by law. In evaluating a proposed engagement of the independent accountants, the Audit Committee will assess the effect that the engagement might reasonably be expected to have on the accountant’s independence. The Committee’s evaluation will be based on:
| | • | | a review of the nature of the professional services expected to be provided, |
| | • | | a review of the safeguards put into place by the accounting firm to safeguard independence, and |
| | • | | periodic meetings with the accounting firm. |
Policy for Audit and Non-Audit Services Provided to the Funds
On an annual basis, the scope of audits for each Fund, audit fees and expenses, and audit-related and non-audit services (and fees proposed in respect thereof) proposed to be performed by the Fund’s independent accountants will be presented by the Treasurer and the independent accountants to the Audit Committee for review and, as appropriate, approval prior to the initiation of such services.
Such presentation shall be accompanied by confirmation by both the Treasurer and the independent accountants that the proposed non-audit services will not adversely affect the independence of the independent accountants. Such proposed non-audit services shall be described in sufficient detail to enable the Audit Committee to assess the appropriateness of such services and fees, and the compatibility of the provision of such services with the auditor’s independence. The Committee shall receive periodic reports on the progress of the audit and other services which are approved by the Committee or by the Committee Chair pursuant to authority delegated in this Policy.
The categories of services enumerated under “Audit Services”, “Audit-related Services”, and “Tax Services” are intended to provide guidance to the Treasurer and the independent accountants as to those categories of services which the Committee believes are generally consistent with the independence of the independent accountants and which the Committee (or the Committee Chair) would expect upon the presentation of specific proposals to pre-approve. The enumerated categories are not intended as an exclusive list of audit, audit-related or tax services, which the Committee (or the Committee Chair) would consider for pre-approval.
Audit Services
The following categories of audit services are considered to be consistent with the role of the Fund’s independent accountants:
| | • | | Annual Fund financial statement audits |
| | • | | Seed audits (related to new product filings, as required) |
| | • | | SEC and regulatory filings and consents |
Audit-related Services
The following categories of audit-related services are considered to be consistent with the role of the Fund’s independent accountants:
| | • | | Accounting consultations |
| | • | | Fund merger support services |
| | • | | Agreed Upon Procedure Reports |
| | • | | Other Internal Control Reports |
Individual audit-related services that fall within one of these categories (except for fund merger support services) and are not presented to the Audit Committee as part of the annual pre-approval process are subject to an authorized pre-approval by the Audit Committee so long as the estimated fee for those services does not exceed $30,000. Any services provided under such pre-approval will be reported to the Audit Committee at its next regular meeting. Should the amount of such services exceed $30,000 any additional fees will be subject to pre-approval by the Committee Chair (or any other Committee member on whom this responsibility has been delegated). Fees related to fund merger support services are subject to a separate authorized pre-approval by the Audit Committee with fees determined on a per occurrence and merger complexity basis.
Tax Services
The following categories of tax services are considered to be consistent with the role of the Fund’s independent accountants:
| | • | | Tax compliance services related to the filing or amendment of the following: |
| | • | | Federal, state and local income tax compliance; and, |
| | • | | Sales and use tax compliance |
| | • | | Timely RIC qualification reviews |
| | • | | Tax distribution analysis and planning |
| | • | | Tax authority examination services |
| | • | | Tax appeals support services |
| | • | | Accounting methods studies |
| | • | | Fund merger support services |
| | • | | Tax consulting services and related projects |
Individual tax services that fall within one of these categories and are not presented to the Audit Committee as part of the annual pre-approval process are subject to an authorized pre-approval by the Audit Committee so long as the estimated fee for those services does not exceed $30,000. Any services provided under such pre-approval will be reported to the Audit Committee at its next regular meeting. Should the amount of such services exceed $30,000 any additional fees will be subject to pre-approval by the Committee Chair (or any other Committee member on whom this responsibility has been delegated).
Other Non-Audit Services
Certain non-audit services that the independent accountants are legally permitted to render will be subject to pre-approval by the Committee or by one or more Committee members to whom the Committee has delegated this authority and who will report to the full Committee any pre-approval decisions made pursuant to this Policy. Non-audit services presented for pre-approval pursuant to this paragraph will be accompanied by a confirmation from both the Treasurer and the independent accountants that the proposed services will not adversely affect the independence of the independent accountants.
Proscribed Services
The Fund’s independent accountants will not render services in the following categories of non-audit services:
| | • | | Bookkeeping or other services related to the accounting records or financial statements of the Fund |
| | • | | Financial information systems design and implementation |
| | • | | Appraisal or valuation services, fairness opinions, or contribution-in-kind reports |
| | • | | Internal audit outsourcing services |
| | • | | Management functions or human resources |
| | • | | Broker or dealer, investment adviser, or investment banking services |
| | • | | Legal services and expert services unrelated to the audit |
| | • | | Any other service that the Public Company Accounting Oversight Board determines, by regulation, is impermissible. |
Pre-approval of Non-Audit Services Provided to Other Entities Within the PGIM Fund Complex
Certain non-audit services provided to PGIM Investments LLC or any of its affiliates that also provide ongoing services to the PGIM Mutual Funds will be subject to pre-approval by the Audit Committee. The only non-audit services provided to these entities that will require pre-approval are those related directly to the operations and financial reporting of the Funds. Individual projects that are not presented to the Audit Committee as part of the annual pre-approval process will be subject to pre-approval by the Committee Chair (or any other Committee member on whom this responsibility has been delegated) so long as the estimated fee for those services does not exceed $30,000. Services presented for pre-approval pursuant to this paragraph will be accompanied by a confirmation from both the Treasurer and the independent accountants that the proposed services will not adversely affect the independence of the independent accountants.
Although the Audit Committee will not pre-approve all services provided to PGIM Investments LLC and its affiliates, the Committee will receive an annual report from the Fund’s independent accounting firm showing the aggregate fees for all services provided to PGIM Investments and its affiliates.
(e) (2) Percentage of services described in each of paragraphs (b) through (d) of this Item that were approved by the audit committee pursuant to paragraph (c)(7)(i)(C) of Rule 2-01 of Regulation S-X –
| | | | | | | | |
| | | | Fiscal Year Ended October 31, 2024 | | Fiscal Year Ended October 31, 2023 | | |
| | 4(b) | | Not applicable. | | Not applicable. | | |
| | 4(c) | | Not applicable. | | Not applicable. | | |
| | 4(d) | | Not applicable. | | Not applicable. | | |
(f) Percentage of hours expended attributable to work performed by other than full time employees of principal accountant if greater than 50%.
The percentage of hours expended on the principal accountant’s engagement to audit the registrant’s financial statements for the most recent fiscal year that were attributed to work performed by persons other than the principal accountant’s full-time, permanent employees was 0%.
(g) Non-Audit Fees
The aggregate non-audit fees billed by the Registrant’s principal accountant for services rendered to the registrant’s investment adviser and any entity controlling, controlled by, or under common control with the investment adviser that provides ongoing services to the registrant for the fiscal years ended October 31, 2024 and October 31, 2023 was $0 and $0, respectively.
(h) Principal Accountant’s Independence
Not applicable as the Registrant’s principal accountant has not provided non-audit services to the registrant’s investment adviser and any entity controlling, controlled by, or under common control with the investment adviser that provides ongoing services to the registrant that were not pre-approved pursuant to Rule 2-01(c)(7)(ii) of Regulation S-X.
(i) Not applicable.
(j) Not applicable.
Item 5 – Audit Committee of Listed Registrants – Not applicable.
| | |
| |
| Item 6 – | | Investments – The registrant’s Schedule of Investments is included in the financial statements filed under Item 7 of this Form. |
| | |
| |
| Items 7 – 11 | | (Refer to Reports below) |

PRUDENTIAL INVESTMENT PORTFOLIOS 9
PGIM Quant Solutions Large-Cap Core Fund
PGIM Real Estate Income Fund
PGIM Select Real Estate Fund
FINANCIAL STATEMENTS AND OTHER INFORMATION
OCTOBER 31, 2024

| | | | |
Table of Contents | | Financial Statements and Other Information | | October 31, 2024 |
Form N-CSR Item 7 - Financial Statements and Financial Highlights for Open-End Management Investment Companies.
Other Information - Form N-CSR Items 8-11
Glossary
The following abbreviations are used in the Funds’ descriptions:
USD—US Dollar
GS—Goldman Sachs & Co. LLC
REITs—Real Estate Investment Trust
S&P—Standard & Poor’s
SOFR—Secured Overnight Financing Rate
UTS—Unit Trust Security
1
PGIM Quant Solutions Large-Cap Core Fund
Schedule of Investments
as of October 31, 2024
| | | | | | | | |
| | |
| Description | | Shares | | | Value | |
|
LONG-TERM INVESTMENTS 99.3% | |
|
COMMON STOCKS | |
|
Aerospace & Defense 2.6% | |
| | |
Axon Enterprise, Inc.* | | | 700 | | | $ | 296,450 | |
General Dynamics Corp. | | | 13,600 | | | | 3,965,896 | |
General Electric Co. | | | 10,800 | | | | 1,855,224 | |
Howmet Aerospace, Inc. | | | 17,100 | | | | 1,705,212 | |
L3Harris Technologies, Inc. | | | 21,100 | | | | 5,221,617 | |
Lockheed Martin Corp. | | | 6,800 | | | | 3,713,140 | |
Northrop Grumman Corp. | | | 4,400 | | | | 2,239,688 | |
RTX Corp. | | | 37,100 | | | | 4,488,729 | |
| | | | | | | | |
| | |
| | | | | | | 23,485,956 | |
| | |
Air Freight & Logistics 0.9% | | | | | | | | |
| | |
FedEx Corp. | | | 18,300 | | | | 5,011,455 | |
United Parcel Service, Inc. (Class B Stock) | | | 24,000 | | | | 3,217,440 | |
| | | | | | | | |
| | |
| | | | | | | 8,228,895 | |
| | |
Automobiles 2.3% | | | | | | | | |
| | |
Ford Motor Co. | | | 429,700 | | | | 4,421,613 | |
General Motors Co. | | | 116,000 | | | | 5,888,160 | |
Tesla, Inc.* | | | 43,100 | | | | 10,768,535 | |
| | | | | | | | |
| | |
| | | | | | | 21,078,308 | |
| | |
Banks 2.6% | | | | | | | | |
| | |
Bank of America Corp. | | | 72,900 | | | | 3,048,678 | |
BankUnited, Inc. | | | 9,100 | | | | 321,594 | |
Citigroup, Inc. | | | 23,000 | | | | 1,475,910 | |
Citizens Financial Group, Inc. | | | 41,400 | | | | 1,743,768 | |
JPMorgan Chase & Co. | | | 52,781 | | | | 11,713,160 | |
PNC Financial Services Group, Inc. (The) | | | 1,500 | | | | 282,405 | |
Popular, Inc. (Puerto Rico) | | | 10,900 | | | | 972,607 | |
Truist Financial Corp. | | | 77,600 | | | | 3,340,680 | |
| | | | | | | | |
| | |
| | | | | | | 22,898,802 | |
| | |
Beverages 1.6% | | | | | | | | |
| | |
Coca-Cola Co. (The) | | | 120,200 | | | | 7,850,262 | |
Keurig Dr. Pepper, Inc. | | | 97,300 | | | | 3,206,035 | |
PepsiCo, Inc. | | | 22,100 | | | | 3,670,368 | |
| | | | | | | | |
| | |
| | | | | | | 14,726,665 | |
See Notes to Financial Statements.
2
PGIM Quant Solutions Large-Cap Core Fund
Schedule of Investments (continued)
as of October 31, 2024
| | | | | | | | |
| | |
| Description | | Shares | | | Value | |
|
COMMON STOCKS (Continued) | |
|
Biotechnology 1.9% | |
| | |
AbbVie, Inc. | | | 32,951 | | | $ | 6,717,720 | |
Amgen, Inc. | | | 9,600 | | | | 3,073,536 | |
Biogen, Inc.* | | | 24,300 | | | | 4,228,200 | |
Gilead Sciences, Inc. | | | 19,000 | | | | 1,687,580 | |
Travere Therapeutics, Inc.* | | | 78,800 | | | | 1,379,000 | |
| | | | | | | | |
| | |
| | | | | | | 17,086,036 | |
| | |
Broadline Retail 3.7% | | | | | | | | |
| | |
Amazon.com, Inc.* | | | 176,040 | | | | 32,813,856 | |
eBay, Inc. | | | 9,000 | | | | 517,590 | |
| | | | | | | | |
| | |
| | | | | | | 33,331,446 | |
| | |
Building Products 0.2% | | | | | | | | |
| | |
Resideo Technologies, Inc.* | | | 92,700 | | | | 1,823,409 | |
| | |
Capital Markets 2.9% | | | | | | | | |
| | |
Bank of New York Mellon Corp. (The) | | | 42,500 | | | | 3,202,800 | |
BGC Group, Inc. (Class A Stock) | | | 67,700 | | | | 634,349 | |
Blackrock, Inc. | | | 700 | | | | 686,721 | |
Goldman Sachs Group, Inc. (The) | | | 9,500 | | | | 4,919,005 | |
Intercontinental Exchange, Inc. | | | 16,700 | | | | 2,603,029 | |
Janus Henderson Group PLC | | | 37,900 | | | | 1,565,649 | |
Morgan Stanley | | | 16,500 | | | | 1,918,125 | |
MSCI, Inc. | | | 4,700 | | | | 2,684,640 | |
S&P Global, Inc. | | | 14,700 | | | | 7,061,292 | |
State Street Corp. | | | 4,600 | | | | 426,880 | |
| | | | | | | | |
| | |
| | | | | | | 25,702,490 | |
| | |
Chemicals 0.8% | | | | | | | | |
| | |
International Flavors & Fragrances, Inc. | | | 18,100 | | | | 1,799,683 | |
LyondellBasell Industries NV (Class A Stock) | | | 8,700 | | | | 755,595 | |
PPG Industries, Inc. | | | 2,200 | | | | 273,922 | |
Sherwin-Williams Co. (The) | | | 11,100 | | | | 3,982,347 | |
| | | | | | | | |
| | |
| | | | | | | 6,811,547 | |
| | |
Commercial Services & Supplies 0.4% | | | | | | | | |
| | |
Veralto Corp. | | | 35,100 | | | | 3,586,869 | |
See Notes to Financial Statements.
PGIM Quant Solutions Large-Cap Core Fund 3
PGIM Quant Solutions Large-Cap Core Fund
Schedule of Investments (continued)
as of October 31, 2024
| | | | | | | | |
| | |
| Description | | Shares | | | Value | |
|
COMMON STOCKS (Continued) | |
|
Communications Equipment 1.5% | |
| | |
Arista Networks, Inc.* | | | 17,200 | | | $ | 6,646,768 | |
Cisco Systems, Inc. | | | 131,782 | | | | 7,217,700 | |
| | | | | | | | |
| | |
| | | | | | | 13,864,468 | |
| | |
Construction Materials 0.5% | | | | | | | | |
| | |
CRH PLC | | | 50,000 | | | | 4,771,500 | |
| | |
Consumer Finance 0.1% | | | | | | | | |
| | |
LendingClub Corp.* | | | 33,100 | | | | 469,358 | |
| | |
Consumer Staples Distribution & Retail 1.7% | | | | | | | | |
| | |
Costco Wholesale Corp. | | | 3,500 | | | | 3,059,630 | |
Target Corp. | | | 37,200 | | | | 5,581,488 | |
United Natural Foods, Inc.* | | | 136,300 | | | | 2,772,342 | |
Walmart, Inc. | | | 45,700 | | | | 3,745,115 | |
| | | | | | | | |
| | |
| | | | | | | 15,158,575 | |
| | |
Diversified Consumer Services 0.3% | | | | | | | | |
| | |
Frontdoor, Inc.* | | | 54,700 | | | | 2,718,043 | |
| | |
Diversified Telecommunication Services 1.3% | | | | | | | | |
| | |
AT&T, Inc. | | | 246,435 | | | | 5,554,645 | |
Verizon Communications, Inc. | | | 137,800 | | | | 5,805,514 | |
| | | | | | | | |
| | |
| | | | | | | 11,360,159 | |
| | |
Electric Utilities 1.3% | | | | | | | | |
| | |
Constellation Energy Corp. | | | 1,700 | | | | 447,032 | |
NRG Energy, Inc. | | | 38,700 | | | | 3,498,480 | |
Portland General Electric Co. | | | 23,400 | | | | 1,109,160 | |
TXNM Energy, Inc. | | | 24,400 | | | | 1,062,376 | |
Xcel Energy, Inc. | | | 77,400 | | | | 5,171,094 | |
| | | | | | | | |
| | |
| | | | | | | 11,288,142 | |
| | |
Electrical Equipment 0.7% | | | | | | | | |
| | |
Acuity Brands, Inc. | | | 1,200 | | | | 360,828 | |
See Notes to Financial Statements.
4
PGIM Quant Solutions Large-Cap Core Fund
Schedule of Investments (continued)
as of October 31, 2024
| | | | | | | | |
| | |
| Description | | Shares | | | Value | |
|
COMMON STOCKS (Continued) | |
|
Electrical Equipment (cont’d.) | |
| | |
Eaton Corp. PLC | | | 15,500 | | | $ | 5,139,490 | |
Vertiv Holdings Co. (Class A Stock) | | | 6,100 | | | | 666,669 | |
| | | | | | | | |
| | |
| | | | | | | 6,166,987 | |
| | |
Electronic Equipment, Instruments & Components 0.2% | | | | | | | | |
| | |
Amphenol Corp. (Class A Stock) | | | 28,400 | | | | 1,903,368 | |
| | |
Entertainment 1.5% | | | | | | | | |
| | |
Electronic Arts, Inc. | | | 4,800 | | | | 724,080 | |
Netflix, Inc.* | | | 14,600 | | | | 11,038,038 | |
Walt Disney Co. (The) | | | 20,700 | | | | 1,991,340 | |
| | | | | | | | |
| | |
| | | | | | | 13,753,458 | |
| | |
Financial Services 4.5% | | | | | | | | |
| | |
Berkshire Hathaway, Inc. (Class B Stock)* | | | 23,674 | | | | 10,675,080 | |
Fidelity National Information Services, Inc. | | | 34,000 | | | | 3,050,820 | |
Fiserv, Inc.* | | | 1,400 | | | | 277,060 | |
Mastercard, Inc. (Class A Stock) | | | 21,700 | | | | 10,841,103 | |
PayPal Holdings, Inc.* | | | 92,800 | | | | 7,359,040 | |
Visa, Inc. (Class A Stock) | | | 28,125 | | | | 8,152,031 | |
| | | | | | | | |
| | |
| | | | | | | 40,355,134 | |
| | |
Food Products 0.4% | | | | | | | | |
| | |
Archer-Daniels-Midland Co. | | | 23,200 | | | | 1,280,872 | |
General Mills, Inc. | | | 4,000 | | | | 272,080 | |
Hain Celestial Group, Inc. (The)* | | | 47,100 | | | | 411,183 | |
Ingredion, Inc. | | | 12,600 | | | | 1,672,776 | |
| | | | | | | | |
| | |
| | | | | | | 3,636,911 | |
| | |
Ground Transportation 1.7% | | | | | | | | |
| | |
CSX Corp. | | | 166,900 | | | | 5,614,516 | |
Norfolk Southern Corp. | | | 1,800 | | | | 450,774 | |
Uber Technologies, Inc.* | | | 99,400 | | | | 7,161,770 | |
Union Pacific Corp. | | | 8,100 | | | | 1,879,767 | |
| | | | | | | | |
| | |
| | | | | | | 15,106,827 | |
| | |
Health Care Equipment & Supplies 2.3% | | | | | | | | |
| | |
Abbott Laboratories | | | 72,500 | | | | 8,219,325 | |
See Notes to Financial Statements.
PGIM Quant Solutions Large-Cap Core Fund 5
PGIM Quant Solutions Large-Cap Core Fund
Schedule of Investments (continued)
as of October 31, 2024
| | | | | | | | |
| | |
| Description | | Shares | | | Value | |
|
COMMON STOCKS (Continued) | |
|
Health Care Equipment & Supplies (cont’d.) | |
| | |
Becton, Dickinson & Co. | | | 16,600 | | | $ | 3,877,594 | |
Boston Scientific Corp.* | | | 52,200 | | | | 4,385,844 | |
Intuitive Surgical, Inc.* | | | 5,900 | | | | 2,972,656 | |
Medtronic PLC | | | 18,200 | | | | 1,624,350 | |
| | | | | | | | |
| | |
| | | | | | | 21,079,769 | |
| | |
Health Care Providers & Services 1.6% | | | | | | | | |
| | |
Cardinal Health, Inc. | | | 5,900 | | | | 640,268 | |
Centene Corp.* | | | 6,800 | | | | 423,368 | |
Cigna Group (The) | | | 17,200 | | | | 5,414,732 | |
Quest Diagnostics, Inc. | | | 18,000 | | | | 2,786,940 | |
UnitedHealth Group, Inc. | | | 8,400 | | | | 4,741,800 | |
| | | | | | | | |
| | |
| | | | | | | 14,007,108 | |
| | |
Health Care REITs 0.3% | | | | | | | | |
| | |
Ventas, Inc. | | | 36,000 | | | | 2,357,640 | |
| | |
Hotels, Restaurants & Leisure 1.3% | | | | | | | | |
| | |
Bloomin’ Brands, Inc. | | | 25,000 | | | | 414,750 | |
Chipotle Mexican Grill, Inc.* | | | 51,400 | | | | 2,866,578 | |
Darden Restaurants, Inc. | | | 13,300 | | | | 2,128,266 | |
Dave & Buster’s Entertainment, Inc.* | | | 87,700 | | | | 3,238,761 | |
Life Time Group Holdings, Inc.* | | | 24,500 | | | | 545,860 | |
McDonald’s Corp. | | | 7,600 | | | | 2,220,036 | |
| | | | | | | | |
| | |
| | | | | | | 11,414,251 | |
| | |
Household Products 1.1% | | | | | | | | |
| | |
Colgate-Palmolive Co. | | | 68,000 | | | | 6,372,280 | |
Energizer Holdings, Inc. | | | 16,700 | | | | 535,569 | |
Procter & Gamble Co. (The) | | | 16,886 | | | | 2,789,229 | |
| | | | | | | | |
| | |
| | | | | | | 9,697,078 | |
| | |
Independent Power & Renewable Electricity Producers 0.0% | | | | | | | | |
| | |
AES Corp. (The) | | | 16,400 | | | | 270,436 | |
| | |
Industrial Conglomerates 0.8% | | | | | | | | |
| | |
3M Co. | | | 55,900 | | | | 7,181,473 | |
See Notes to Financial Statements.
6
PGIM Quant Solutions Large-Cap Core Fund
Schedule of Investments (continued)
as of October 31, 2024
| | | | | | | | |
| | |
| Description | | Shares | | | Value | |
|
COMMON STOCKS (Continued) | |
|
Industrial REITs 0.9% | |
| | |
Americold Realty Trust, Inc. | | | 10,200 | | | $ | 261,936 | |
LXP Industrial Trust | | | 139,800 | | | | 1,319,712 | |
Prologis, Inc. | | | 55,500 | | | | 6,268,170 | |
| | | | | | | | |
| | |
| | | | | | | 7,849,818 | |
| | |
Insurance 2.8% | | | | | | | | |
| | |
Allstate Corp. (The) | | | 25,300 | | | | 4,718,956 | |
Assurant, Inc. | | | 11,700 | | | | 2,242,890 | |
Genworth Financial, Inc. (Class A Stock)* | | | 162,000 | | | | 1,091,880 | |
Marsh & McLennan Cos., Inc. | | | 12,900 | | | | 2,815,296 | |
MetLife, Inc. | | | 75,600 | | | | 5,928,552 | |
Progressive Corp. (The) | | | 31,900 | | | | 7,746,277 | |
Willis Towers Watson PLC | | | 2,300 | | | | 695,037 | |
| | | | | | | | |
| | |
| | | | | | | 25,238,888 | |
| | |
Interactive Media & Services 6.8% | | | | | | | | |
| | |
Alphabet, Inc. (Class A Stock) | | | 124,680 | | | | 21,333,995 | |
Alphabet, Inc. (Class C Stock) | | | 105,860 | | | | 18,280,963 | |
Meta Platforms, Inc. (Class A Stock) | | | 37,080 | | | | 21,045,867 | |
| | | | | | | | |
| | |
| | | | | | | 60,660,825 | |
| | |
IT Services 0.8% | | | | | | | | |
| | |
Cognizant Technology Solutions Corp. (Class A Stock) | | | 37,600 | | | | 2,804,584 | |
International Business Machines Corp. | | | 21,330 | | | | 4,409,338 | |
| | | | | | | | |
| | |
| | | | | | | 7,213,922 | |
| | |
Life Sciences Tools & Services 1.8% | | | | | | | | |
| | |
Danaher Corp. | | | 23,700 | | | | 5,822,142 | |
Illumina, Inc.* | | | 13,100 | | | | 1,888,234 | |
Thermo Fisher Scientific, Inc. | | | 15,814 | | | | 8,639,505 | |
| | | | | | | | |
| | |
| | | | | | | 16,349,881 | |
| | |
Machinery 0.9% | | | | | | | | |
| | |
Allison Transmission Holdings, Inc. | | | 22,500 | | | | 2,404,350 | |
Flowserve Corp. | | | 54,000 | | | | 2,842,560 | |
Mueller Water Products, Inc. (Class A Stock) | | | 20,800 | | | | 449,072 | |
See Notes to Financial Statements.
PGIM Quant Solutions Large-Cap Core Fund 7
PGIM Quant Solutions Large-Cap Core Fund
Schedule of Investments (continued)
as of October 31, 2024
| | | | | | | | |
| | |
| Description | | Shares | | | Value | |
|
COMMON STOCKS (Continued) | |
|
Machinery (cont’d.) | |
| | |
Tennant Co. | | | 13,500 | | | $ | 1,182,060 | |
Terex Corp. | | | 29,300 | | | | 1,515,103 | |
| | | | | | | | |
| | |
| | | | | | | 8,393,145 | |
| | |
Metals & Mining 0.1% | | | | | | | | |
| | |
Freeport-McMoRan, Inc. | | | 27,400 | | | | 1,233,548 | |
| | |
Mortgage Real Estate Investment Trusts (REITs) 0.1% | | | | | | | | |
| | |
MFA Financial, Inc. | | | 78,300 | | | | 962,307 | |
| | |
Multi-Utilities 1.1% | | | | | | | | |
| | |
Avista Corp. | | | 90,600 | | | | 3,395,688 | |
Black Hills Corp. | | | 43,500 | | | | 2,574,765 | |
DTE Energy Co. | | | 28,000 | | | | 3,478,160 | |
| | | | | | | | |
| | |
| | | | | | | 9,448,613 | |
| | |
Oil, Gas & Consumable Fuels 3.8% | | | | | | | | |
| | |
Cheniere Energy, Inc. | | | 16,100 | | | | 3,081,218 | |
Chevron Corp. | | | 4,800 | | | | 714,336 | |
ConocoPhillips | | | 37,600 | | | | 4,118,704 | |
Devon Energy Corp. | | | 88,100 | | | | 3,407,708 | |
Diamondback Energy, Inc. | | | 26,800 | | | | 4,737,436 | |
Exxon Mobil Corp. | | | 80,800 | | | | 9,435,824 | |
Phillips 66 | | | 38,600 | | | | 4,702,252 | |
Valero Energy Corp. | | | 11,500 | | | | 1,492,240 | |
Williams Cos., Inc. (The) | | | 39,900 | | | | 2,089,563 | |
| | | | | | | | |
| | |
| | | | | | | 33,779,281 | |
| | |
Passenger Airlines 0.6% | | | | | | | | |
| | |
Alaska Air Group, Inc.* | | | 9,900 | | | | 474,309 | |
SkyWest, Inc.* | | | 23,300 | | | | 2,218,160 | |
United Airlines Holdings, Inc.* | | | 40,200 | | | | 3,146,052 | |
| | | | | | | | |
| | |
| | | | | | | 5,838,521 | |
| | |
Pharmaceuticals 4.2% | | | | | | | | |
| | |
Bristol-Myers Squibb Co. | | | 37,300 | | | | 2,080,221 | |
Elanco Animal Health, Inc.* | | | 86,200 | | | | 1,089,568 | |
Eli Lilly & Co. | | | 17,600 | | | | 14,603,424 | |
See Notes to Financial Statements.
8
PGIM Quant Solutions Large-Cap Core Fund
Schedule of Investments (continued)
as of October 31, 2024
| | | | | | | | |
| | |
| Description | | Shares | | | Value | |
|
COMMON STOCKS (Continued) | |
|
Pharmaceuticals (cont’d.) | |
| | |
Johnson & Johnson | | | 66,958 | | | $ | 10,703,906 | |
Merck & Co., Inc. | | | 83,100 | | | | 8,502,792 | |
Pfizer, Inc. | | | 20,400 | | | | 577,320 | |
| | | | | | | | |
| | |
| | | | | | | 37,557,231 | |
| | |
Real Estate Management & Development 0.2% | | | | | | | | |
| | |
Jones Lang LaSalle, Inc.* | | | 6,300 | | | | 1,707,048 | |
| | |
Residential REITs 0.4% | | | | | | | | |
| | |
Equity Residential | | | 53,600 | | | | 3,771,832 | |
| | |
Semiconductors & Semiconductor Equipment 11.5% | | | | | | | | |
| | |
Applied Materials, Inc. | | | 22,600 | | | | 4,103,708 | |
Broadcom, Inc. | | | 61,200 | | | | 10,389,924 | |
Lam Research Corp. | | | 38,800 | | | | 2,884,780 | |
Micron Technology, Inc. | | | 55,200 | | | | 5,500,680 | |
NVIDIA Corp. | | | 502,300 | | | | 66,685,348 | |
NXP Semiconductors NV (China) | | | 5,800 | | | | 1,360,100 | |
Onto Innovation, Inc.* | | | 4,700 | | | | 932,151 | |
Qorvo, Inc.* | | | 9,000 | | | | 641,340 | |
QUALCOMM, Inc. | | | 51,000 | | | | 8,301,270 | |
Skyworks Solutions, Inc. | | | 14,700 | | | | 1,287,426 | |
Synaptics, Inc.* | | | 12,400 | | | | 851,508 | |
Teradyne, Inc. | | | 4,900 | | | | 520,429 | |
| | | | | | | | |
| | |
| | | | | | | 103,458,664 | |
| | |
Software 9.6% | | | | | | | | |
| | |
ACI Worldwide, Inc.* | | | 8,700 | | | | 428,040 | |
Adobe, Inc.* | | | 7,300 | | | | 3,489,984 | |
Autodesk, Inc.* | | | 7,800 | | | | 2,213,640 | |
Crowdstrike Holdings, Inc. (Class A Stock)* | | | 1,500 | | | | 445,305 | |
Gitlab, Inc. (Class A Stock)* | | | 9,600 | | | | 516,000 | |
Informatica, Inc. (Class A Stock)* | | | 72,800 | | | | 1,987,440 | |
Intapp, Inc.* | | | 35,100 | | | | 1,760,967 | |
Intuit, Inc. | | | 2,100 | | | | 1,281,630 | |
Microsoft Corp. | | | 126,984 | | | | 51,599,948 | |
Oracle Corp. | | | 8,400 | | | | 1,409,856 | |
Roper Technologies, Inc. | | | 600 | | | | 322,638 | |
Salesforce, Inc. | | | 30,300 | | | | 8,828,511 | |
ServiceNow, Inc.* | | | 8,300 | | | | 7,743,817 | |
See Notes to Financial Statements.
PGIM Quant Solutions Large-Cap Core Fund 9
PGIM Quant Solutions Large-Cap Core Fund
Schedule of Investments (continued)
as of October 31, 2024
| | | | | | | | |
| | |
| Description | | Shares | | | Value | |
|
COMMON STOCKS (Continued) | |
|
Software (cont’d.) | |
| | |
Verint Systems, Inc.* | | | 116,600 | | | $ | 2,483,580 | |
Workday, Inc. (Class A Stock)* | | | 3,600 | | | | 841,860 | |
Zoom Video Communications, Inc. (Class A Stock)* | | | 6,000 | | | | 448,440 | |
| | | | | | | | |
| | |
| | | | | | | 85,801,656 | |
| | |
Specialized REITs 0.3% | | | | | | | | |
| | |
American Tower Corp. | | | 2,500 | | | | 533,850 | |
Equinix, Inc. | | | 1,200 | | | | 1,089,696 | |
Outfront Media, Inc. | | | 19,300 | | | | 342,768 | |
Public Storage | | | 2,200 | | | | 723,932 | |
| | | | | | | | |
| | |
| | | | | | | 2,690,246 | |
| | |
Specialty Retail 1.2% | | | | | | | | |
| | |
Home Depot, Inc. (The) | | | 16,700 | | | | 6,575,625 | |
Lowe’s Cos., Inc. | | | 15,700 | | | | 4,110,731 | |
ODP Corp. (The)* | | | 11,400 | | | | 353,742 | |
| | | | | | | | |
| | |
| | | | | | | 11,040,098 | |
| | |
Technology Hardware, Storage & Peripherals 8.1% | | | | | | | | |
| | |
Apple, Inc. | | | 302,380 | | | | 68,310,666 | |
Hewlett Packard Enterprise Co. | | | 244,600 | | | | 4,767,254 | |
| | | | | | | | |
| | |
| | | | | | | 73,077,920 | |
| | |
Textiles, Apparel & Luxury Goods 0.3% | | | | | | | | |
| | |
G-III Apparel Group Ltd.* | | | 70,500 | | | | 2,134,740 | |
Wolverine World Wide, Inc. | | | 28,600 | | | | 440,154 | |
| | | | | | | | |
| | |
| | | | | | | 2,574,894 | |
| | |
Tobacco 0.5% | | | | | | | | |
| | |
Altria Group, Inc. | | | 75,000 | | | | 4,084,500 | |
| | |
Wireless Telecommunication Services 0.3% | | | | | | | | |
| | |
T-Mobile US, Inc. | | | 10,600 | | | | 2,365,496 | |
| | | | | | | | |
| | |
TOTAL LONG-TERM INVESTMENTS
(cost $570,577,829) | | | | | | | 890,419,442 | |
| | | | | | | | |
See Notes to Financial Statements.
10
PGIM Quant Solutions Large-Cap Core Fund
Schedule of Investments (continued)
as of October 31, 2024
| | | | | | | | | | | | | | | | |
| | | | |
| Description | | | | | | | | Shares | | | Value | |
|
SHORT-TERM INVESTMENTS 1.3% | |
|
AFFILIATED MUTUAL FUND 1.2% | |
| | | | |
PGIM Core Government Money Market Fund (7-day effective yield 5.011%)
(cost $10,504,394)(wb) | | | | | | | | | | | 10,504,394 | | | $ | 10,504,394 | |
| | | | | | | | | | | | | | | | |
| | | | |
| | | Interest Rate | | | Maturity Date | | | Principal
Amount (000)# | | | | |
|
U.S. TREASURY OBLIGATION(k)(n) 0.1% | |
U.S. Treasury Bills
(cost $844,628) | | | 4.799% | | | | 12/19/24 | | | | 850 | | | | 844,843 | |
| | | | | | | | | | | | | | | | |
| | | | |
TOTAL SHORT-TERM INVESTMENTS
(cost $11,349,022) | | | | | | | | | | | | | | | 11,349,237 | |
| | | | | | | | | | | | | | | | |
| | | | |
TOTAL INVESTMENTS 100.6%
(cost $581,926,851) | | | | | | | | | | | | | | | 901,768,679 | |
Liabilities in excess of other assets(z) (0.6)% | | | | | | | | | | | | | | | (5,158,537 | ) |
| | | | | | | | | | | | | | | | |
| | | | |
NET ASSETS 100.0% | | | | | | | | | | | | | | $ | 896,610,142 | |
| | | | | | | | | | | | | | | | |
See the Glossary for a list of the abbreviation(s) used in the annual report.
| * | Non-income producing security. |
| # | Principal amount is shown in U.S. dollars unless otherwise stated. |
| (k) | Represents security, or a portion thereof, segregated as collateral for centrally cleared/exchange-traded derivatives. |
| (n) | Rate shown reflects yield to maturity at purchased date. |
| (wb) | Represents an investment in a Fund affiliated with the Manager. |
| (z) | Includes net unrealized appreciation/(depreciation) and/or market value of the below holdings which are excluded from the Schedule of Investments: |
Futures contracts outstanding at October 31, 2024:
| | | | | | | | | | | | | | | | | |
Number
of
Contracts | | Type | | Expiration
Date | | Current
Notional
Amount | | Value /
Unrealized
Appreciation
(Depreciation) |
Long Position: | | | | | | | | | | | | | | | |
40 | | S&P 500 E-Mini Index | | | | Dec. 2024 | | | | $ | 11,477,000 | | | | $ | 96,026 | |
| | | | | | | | | | | | | | | | | |
See Notes to Financial Statements.
PGIM Quant Solutions Large-Cap Core Fund 11
PGIM Quant Solutions Large-Cap Core Fund
Schedule of Investments (continued)
as of October 31, 2024
Summary of Collateral for Centrally Cleared/Exchange-traded Derivatives:
Cash and securities segregated as collateral, including pending settlement for closed positions, to cover requirements for centrally cleared/exchange-traded derivatives are listed by broker as follows:
| | | | | | | | | | |
Broker | | Cash and/or Foreign Currency | | Securities Market Value |
GS | | | | $— | | | | | $844,843 | |
| | | | | | | | | | |
Fair Value Measurements:
Various inputs are used in determining the value of the Fund’s investments. These inputs are summarized in the three broad levels listed below.
Level 1—unadjusted quoted prices generally in active markets for identical securities.
Level 2—quoted prices for similar securities, interest rates and yield curves, prepayment speeds, foreign currency exchange rates and other observable inputs.
Level 3—unobservable inputs for securities valued in accordance with Board approved fair valuation procedures.
The following is a summary of the inputs used as of October 31, 2024 in valuing such portfolio securities:
| | | | | | | | | | | | |
| | | Level 1 | | | Level 2 | | | Level 3 | |
Investments in Securities | | | | | | | | | | | | |
Assets | | | | | | | | | | | | |
Long-Term Investments | | | | | | | | | | | | |
Common Stocks | | | | | | | | | | | | |
Aerospace & Defense | | $ | 23,485,956 | | | $ | — | | | $ | — | |
Air Freight & Logistics | | | 8,228,895 | | | | — | | | | — | |
Automobiles | | | 21,078,308 | | | | — | | | | — | |
Banks | | | 22,898,802 | | | | — | | | | — | |
Beverages | | | 14,726,665 | | | | — | | | | — | |
Biotechnology | | | 17,086,036 | | | | — | | | | — | |
Broadline Retail | | | 33,331,446 | | | | — | | | | — | |
Building Products | | | 1,823,409 | | | | — | | | | — | |
Capital Markets | | | 25,702,490 | | | | — | | | | — | |
Chemicals | | | 6,811,547 | | | | — | | | | — | |
Commercial Services & Supplies | | | 3,586,869 | | | | — | | | | — | |
Communications Equipment | | | 13,864,468 | | | | — | | | | — | |
Construction Materials | | | 4,771,500 | | | | — | | | | — | |
Consumer Finance | | | 469,358 | | | | — | | | | — | |
Consumer Staples Distribution & Retail | | | 15,158,575 | | | | — | | | | — | |
Diversified Consumer Services | | | 2,718,043 | | | | — | | | | — | |
Diversified Telecommunication Services | | | 11,360,159 | | | | — | | | | — | |
Electric Utilities | | | 11,288,142 | | | | — | | | | — | |
Electrical Equipment | | | 6,166,987 | | | | — | | | | — | |
Electronic Equipment, Instruments & Components | | | 1,903,368 | | | | — | | | | — | |
Entertainment | | | 13,753,458 | | | | — | | | | — | |
See Notes to Financial Statements.
12
PGIM Quant Solutions Large-Cap Core Fund
Schedule of Investments (continued)
as of October 31, 2024
| | | | | | | | | | | | |
| | | Level 1 | | | Level 2 | | | Level 3 | |
Investments in Securities (continued) | | | | | | | | | | | | |
Assets (continued) | | | | | | | | | | | | |
Long-Term Investments (continued) | | | | | | | | | | | | |
Common Stocks (continued) | | | | | | | | | | | | |
Financial Services | | $ | 40,355,134 | | | $ | — | | | $ | — | |
Food Products | | | 3,636,911 | | | | — | | | | — | |
Ground Transportation | | | 15,106,827 | | | | — | | | | — | |
Health Care Equipment & Supplies | | | 21,079,769 | | | | — | | | | — | |
Health Care Providers & Services. | | | 14,007,108 | | | | — | | | | — | |
Health Care REITs | | | 2,357,640 | | | | — | | | | — | |
Hotels, Restaurants & Leisure | | | 11,414,251 | | | | — | | | | — | |
Household Products. | | | 9,697,078 | | | | — | | | | — | |
Independent Power & Renewable Electricity Producers | | | 270,436 | | | | — | | | | — | |
Industrial Conglomerates | | | 7,181,473 | | | | — | | | | — | |
Industrial REITs | | | 7,849,818 | | | | — | | | | — | |
Insurance | | | 25,238,888 | | | | — | | | | — | |
Interactive Media & Services. | | | 60,660,825 | | | | — | | | | — | |
IT Services | | | 7,213,922 | | | | — | | | | — | |
Life Sciences Tools & Services | | | 16,349,881 | | | | — | | | | — | |
Machinery | | | 8,393,145 | | | | — | | | | — | |
Metals & Mining | | | 1,233,548 | | | | — | | | | — | |
Mortgage Real Estate Investment Trusts (REITs) | | | 962,307 | | | | — | | | | — | |
Multi-Utilities | | | 9,448,613 | | | | — | | | | — | |
Oil, Gas & Consumable Fuels | | | 33,779,281 | | | | — | | | | — | |
Passenger Airlines | | | 5,838,521 | | | | — | | | | — | |
Pharmaceuticals | | | 37,557,231 | | | | — | | | | — | |
Real Estate Management & Development | | | 1,707,048 | | | | — | | | | — | |
Residential REITs | | | 3,771,832 | | | | — | | | | — | |
Semiconductors & Semiconductor Equipment | | | 103,458,664 | | | | — | | | | — | |
Software | | | 85,801,656 | | | | — | | | | — | |
Specialized REITs | | | 2,690,246 | | | | — | | | | — | |
Specialty Retail | | | 11,040,098 | | | | — | | | | — | |
Technology Hardware, Storage & Peripherals | | | 73,077,920 | | | | — | | | | — | |
Textiles, Apparel & Luxury Goods | | | 2,574,894 | | | | — | | | | — | |
Tobacco. | | | 4,084,500 | | | | — | | | | — | |
Wireless Telecommunication Services. | | | 2,365,496 | | | | — | | | | — | |
Short-Term Investments | | | | | | | | | | | | |
Affiliated Mutual Fund | | | 10,504,394 | | | | — | | | | — | |
U.S. Treasury Obligation | | | — | | | | 844,843 | | | | — | |
| | | | | | | | | | | | |
Total | | $ | 900,923,836 | | | $ | 844,843 | | | $ | — | |
| | | | | | | | | | | | |
| | | |
Other Financial Instruments* | | | | | | | | | | | | |
Assets | | | | | | | | | | | | |
Futures Contracts | | $ | 96,026 | | | $ | — | | | $ | — | |
| | | | | | | | | | | | |
See Notes to Financial Statements.
PGIM Quant Solutions Large-Cap Core Fund 13
PGIM Quant Solutions Large-Cap Core Fund
Schedule of Investments (continued)
as of October 31, 2024
| * | Other financial instruments are derivative instruments not reflected in the Schedule of Investments, such as futures, forwards and centrally cleared swap contracts, which are recorded at unrealized appreciation (depreciation) on the instrument, and OTC swap contracts which are recorded at fair value. |
Industry Classification:
The industry classification of investments and liabilities in excess of other assets shown as a percentage of net assets as of October 31, 2024 were as follows:
| | | | |
Semiconductors & Semiconductor Equipment | | | 11.5 | % |
Software | | | 9.6 | |
Technology Hardware, Storage & Peripherals | | | 8.1 | |
Interactive Media & Services | | | 6.8 | |
Financial Services | | | 4.5 | |
Pharmaceuticals | | | 4.2 | |
Oil, Gas & Consumable Fuels | | | 3.8 | |
Broadline Retail | | | 3.7 | |
Capital Markets | | | 2.9 | |
Insurance | | | 2.8 | |
Aerospace & Defense | | | 2.6 | |
Banks | | | 2.6 | |
Health Care Equipment & Supplies | | | 2.3 | |
Automobiles | | | 2.3 | |
Biotechnology | | | 1.9 | |
Life Sciences Tools & Services | | | 1.8 | |
Consumer Staples Distribution & Retail | | | 1.7 | |
Ground Transportation | | | 1.7 | |
Beverages | | | 1.6 | |
Health Care Providers & Services | | | 1.6 | |
Communications Equipment | | | 1.5 | |
Entertainment | | | 1.5 | |
Hotels, Restaurants & Leisure | | | 1.3 | |
Diversified Telecommunication Services | | | 1.3 | |
Electric Utilities | | | 1.3 | |
Specialty Retail | | | 1.2 | |
Affiliated Mutual Fund | | | 1.2 | |
Household Products | | | 1.1 | |
Multi-Utilities | | | 1.1 | |
Machinery | | | 0.9 | |
Air Freight & Logistics | | | 0.9 | |
Industrial REITs | | | 0.9 | |
| | | | |
IT Services | | | 0.8 | % |
Industrial Conglomerates | | | 0.8 | |
Chemicals | | | 0.8 | |
Electrical Equipment | | | 0.7 | |
Passenger Airlines | | | 0.6 | |
Construction Materials | | | 0.5 | |
Tobacco | | | 0.5 | |
Residential REITs | | | 0.4 | |
Food Products | | | 0.4 | |
Commercial Services & Supplies | | | 0.4 | |
Diversified Consumer Services | | | 0.3 | |
Specialized REITs | | | 0.3 | |
Textiles, Apparel & Luxury Goods | | | 0.3 | |
Wireless Telecommunication Services | | | 0.3 | |
Health Care REITs | | | 0.3 | |
Electronic Equipment, Instruments & Components | | | 0.2 | |
Building Products | | | 0.2 | |
Real Estate Management & Development | | | 0.2 | |
Metals & Mining | | | 0.1 | |
Mortgage Real Estate Investment Trusts (REITs) | | | 0.1 | |
U.S. Treasury Obligations | | | 0.1 | |
Consumer Finance | | | 0.1 | |
Independent Power & Renewable Electricity Producers | | | 0.0 | * |
| | | | |
| | | 100.6 | |
Liabilities in excess of other assets | | | (0.6 | ) |
| | | | |
| |
| | | 100.0 | % |
| | | | |
See Notes to Financial Statements.
14
PGIM Quant Solutions Large-Cap Core Fund
Schedule of Investments (continued)
as of October 31, 2024
Effects of Derivative Instruments on the Financial Statements and Primary Underlying Risk Exposure:
The Fund invested in derivative instruments during the reporting period. The primary type of risk associated with these derivative instruments is equity risk. See the Notes to Financial Statements for additional detail regarding these derivative instruments and their risks. The effect of such derivative instruments on the Fund’s financial position and financial performance as reflected in the Statement of Assets and Liabilities and Statement of Operations is presented in the summary below.
Fair values of derivative instruments as of October 31, 2024 as presented in the Statement of Assets and Liabilities:
| | | | | | | | | | | | |
| | | Asset Derivatives | | | Liability Derivatives | |
Derivatives not accounted for as
hedging instruments, carried at fair
value | | Statement of
Assets and
Liabilities Location | | Fair
Value | | | Statement of
Assets and
Liabilities Location | | Fair
Value | |
Equity contracts | | Due from/to broker-variation margin futures | | $ | 96,026 | * | | — | | $ | — | |
| | | | | | | | | | | | |
| * | Includes cumulative appreciation (depreciation) as reported in the schedule of open futures and centrally cleared swap contracts. Only unsettled variation margin receivable (payable) is reported within the Statement of Assets and Liabilities. |
The effects of derivative instruments on the Statement of Operations for the year ended October 31, 2024 are as follows:
| | | | | |
Amount of Realized Gain (Loss) on Derivatives Recognized in Income | |
Derivatives not accounted for as hedging instruments, carried at fair value | | Futures |
Equity contracts | | | $ | 2,437,710 | |
| | | | | |
| | | | | |
Change in Unrealized Appreciation (Depreciation) on Derivatives Recognized in Income | |
Derivatives not accounted for as hedging instruments, carried at fair value | | Futures |
Equity contracts | | | $ | 828,347 | |
| | | | | |
For the year ended October 31, 2024, the Fund’s average volume of derivative activities is as follows:
| | | | | |
| Derivative Contract Type | | Average Volume of Derivative Activities* |
Futures Contracts - Long Positions (1) | | | $ | 11,507,963 | |
| * | Average volume is based on average quarter end balances for the year ended October 31, 2024. |
| (1) | Notional Amount in USD. |
See Notes to Financial Statements.
PGIM Quant Solutions Large-Cap Core Fund 15
PGIM Quant Solutions Large-Cap Core Fund
Statement of Assets & Liabilities
as of October 31, 2024
| | | | |
| |
Assets | | | | |
Investments at value: | | | | |
Unaffiliated investments (cost $571,422,457) | | $ | 891,264,285 | |
Affiliated investments (cost $10,504,394) | | | 10,504,394 | |
Dividends and interest receivable | | | 496,571 | |
Receivable for Fund shares sold | | | 471,477 | |
Prepaid expenses | | | 8,033 | |
| | | | |
| |
Total Assets | | | 902,744,760 | |
| | | | |
| |
Liabilities | | | | |
Payable for Fund shares purchased | | | 5,406,558 | |
Due to broker—variation margin futures | | | 227,000 | |
Management fee payable | | | 203,591 | |
Accrued expenses and other liabilities | | | 128,317 | |
Distribution fee payable | | | 125,050 | |
Affiliated transfer agent fee payable | | | 41,649 | |
Trustees’ fees payable | | | 2,453 | |
| | | | |
| |
Total Liabilities | | | 6,134,618 | |
| | | | |
| |
Net Assets | | $ | 896,610,142 | |
| | | | |
| |
| | | | | |
Net assets were comprised of: | | | | |
Shares of beneficial interest, at par | | $ | 39,305 | |
Paid-in capital in excess of par | | | 489,236,672 | |
Total distributable earnings (loss) | | | 407,334,165 | |
| | | | |
| |
Net assets, October 31, 2024 | | $ | 896,610,142 | |
| | | | |
See Notes to Financial Statements.
16
PGIM Quant Solutions Large-Cap Core Fund
Statement of Assets & Liabilities (continued)
as of October 31, 2024
| | | | | | | | |
| | |
Class A | | | | | | | | |
Net asset value and redemption price per share, ($524,581,446 ÷ 23,337,494 shares of beneficial interest issued and outstanding) | | $ | 22.48 | | | | | |
Maximum sales charge (5.50% of offering price) | | | 1.31 | | | | | |
| | | | | | | | |
Maximum offering price to public | | $ | 23.79 | | | | | |
| | | | | | | | |
| | |
Class C | | | | | | | | |
Net asset value, offering price and redemption price per share, ($13,238,688 ÷ 694,543 shares of beneficial interest issued and outstanding) | | $ | 19.06 | | | | | |
| | | | | | | | |
| | |
Class Z | | | | | | | | |
Net asset value, offering price and redemption price per share, ($34,831,487 ÷ 1,487,639 shares of beneficial interest issued and outstanding) | | $ | 23.41 | | | | | |
| | | | | | | | |
| | |
Class R6 | | | | | | | | |
Net asset value, offering price and redemption price per share, ($323,958,521 ÷ 13,784,981 shares of beneficial interest issued and outstanding) | | $ | 23.50 | | | | | |
| | | | | | | | |
See Notes to Financial Statements.
PGIM Quant Solutions Large-Cap Core Fund 17
PGIM Quant Solutions Large-Cap Core Fund
Statement of Operations
Year Ended October 31, 2024
| | | | |
Net Investment Income (Loss) | |
Income | | | | |
Unaffiliated dividend income (net of $7,291 foreign withholding tax) | | $ | 11,300,636 | |
Affiliated dividend income | | | 721,095 | |
Interest income | | | 45,478 | |
Income from securities lending, net (including affiliated income of $5,295) | | | 5,322 | |
| | | | |
Total income | | | 12,072,531 | |
| | | | |
| |
Expenses | | | | |
Management fee | | | 2,907,221 | |
Distribution fee(a) | | | 1,638,727 | |
Transfer agent’s fees and expenses (including affiliated expense of $246,968)(a) | | | 558,353 | |
Registration fees(a) | | | 96,059 | |
Custodian and accounting fees | | | 81,056 | |
Shareholders’ reports | | | 59,645 | |
Professional fees | | | 42,984 | |
Audit fee | | | 24,910 | |
Trustees’ fees | | | 21,816 | |
Miscellaneous | | | 28,927 | |
| | | | |
Total expenses | | | 5,459,698 | |
Less: Fee waiver and/or expense reimbursement(a) | | | (365,106 | ) |
Distribution fee waiver(a) | | | (249,229 | ) |
| | | | |
Net expenses | | | 4,845,363 | |
| | | | |
Net investment income (loss) | | | 7,227,168 | |
| | | | |
Realized And Unrealized Gain (Loss) On Investments | |
Net realized gain (loss) on: | | | | |
Investment transactions (including affiliated of $555) | | | 81,051,234 | |
Futures transactions | | | 2,437,710 | |
| | | | |
| | | 83,488,944 | |
| | | | |
Net change in unrealized appreciation (depreciation) on: | | | | |
Investments (including affiliated of $(262)) | | | 164,844,684 | |
Futures | | | 828,347 | |
| | | | |
| | | 165,673,031 | |
| | | | |
Net gain (loss) on investment transactions | | | 249,161,975 | |
| | | | |
| |
Net Increase (Decrease) In Net Assets Resulting From Operations | | $ | 256,389,143 | |
| | | | |
| (a) | Class specific expenses and waivers were as follows: |
| | | | | | | | | | | | | | | | |
| | | Class A | | | Class C | | | Class Z | | | Class R6 | |
Distribution fee | | | 1,495,375 | | | | 143,352 | | | | — | | | | — | |
Transfer agent’s fees and expenses | | | 504,103 | | | | 23,958 | | | | 27,963 | | | | 2,329 | |
Registration fees | | | 33,046 | | | | 19,423 | | | | 22,241 | | | | 21,349 | |
Fee waiver and/or expense reimbursement | | | (188,296 | ) | | | (34,994 | ) | | | (31,079 | ) | | | (110,737 | ) |
Distribution fee waiver | | | (249,229 | ) | | | — | | | | — | | | | — | |
See Notes to Financial Statements.
18
PGIM Quant Solutions Large-Cap Core Fund
Statements of Changes in Net Assets
| | | | | | | | |
| |
| | | Year Ended
October 31, | |
| | |
| | | 2024 | | | 2023 | |
| | |
Increase (Decrease) in Net Assets | | | | | | | | |
| | |
Operations | | | | | | | | |
Net investment income (loss) | | $ | 7,227,168 | | | $ | 7,723,328 | |
Net realized gain (loss) on investment transactions | | | 83,488,944 | | | | 18,338,002 | |
Net change in unrealized appreciation (depreciation) on investments | | | 165,673,031 | | | | 36,328,490 | |
| | | | | | | | |
Net increase (decrease) in net assets resulting from operations | | | 256,389,143 | | | | 62,389,820 | |
| | | | | | | | |
| | |
Dividends and Distributions | | | | | | | | |
Distributions from distributable earnings | | | | | | | | |
Class A | | | (15,634,208 | ) | | | (9,633,764 | ) |
Class C | | | (513,234 | ) | | | (322,443 | ) |
Class Z | | | (838,560 | ) | | | (535,641 | ) |
Class R6 | | | (7,877,677 | ) | | | (6,152,130 | ) |
| | | | | | | | |
| | | (24,863,679 | ) | | | (16,643,978 | ) |
| | | | | | | | |
| | |
Fund share transactions (Net of share conversions) | | | | | | | | |
Net proceeds from shares sold | | | 154,726,965 | | | | 77,334,909 | |
Net asset value of shares issued in reinvestment of dividends and distributions | | | 24,632,216 | | | | 16,494,157 | |
Cost of shares purchased | | | (216,469,945 | ) | | | (113,888,922 | ) |
| | | | | | | | |
Net increase (decrease) in net assets from Fund share transactions | | | (37,110,764 | ) | | | (20,059,856 | ) |
| | | | | | | | |
Total increase (decrease) | | | 194,414,700 | | | | 25,685,986 | |
| | |
Net Assets: | | | | | | | | |
Beginning of year | | | 702,195,442 | | | | 676,509,456 | |
| | | | | | | | |
End of year | | $ | 896,610,142 | | | $ | 702,195,442 | |
| | | | | | | | |
See Notes to Financial Statements.
PGIM Quant Solutions Large-Cap Core Fund 19
PGIM Quant Solutions Large-Cap Core Fund
Financial Highlights
| | | | | | | | | | | | | | | | | | | | |
| | | | | | |
Class A Shares | | | | | | | | | | | | | | | | | | | | |
| | | Year Ended October 31, | |
| | | 2024 | | | 2023 | | | 2022 | | | 2021 | | | 2020 | |
Per Share Operating Performance(a): | | | | | | | | | | | | | | | | | | | | |
Net Asset Value, Beginning of Year | | | $16.80 | | | | $15.75 | | | | $21.09 | | | | $15.17 | | | | $15.17 | |
Income (loss) from investment operations: | | | | | | | | | | | | | | | | | | | | |
Net investment income (loss) | | | 0.15 | | | | 0.16 | | | | 0.18 | | | | 0.16 | | | | 0.19 | |
Net realized and unrealized gain (loss) on investment transactions | | | 6.17 | | | | 1.26 | | | | (2.46 | ) | | | 6.14 | | | | 0.43 | |
Total from investment operations | | | 6.32 | | | | 1.42 | | | | (2.28 | ) | | | 6.30 | | | | 0.62 | |
Less Dividends and Distributions: | | | | | | | | | | | | | | | | | | | | |
Dividends from net investment income | | | (0.18 | ) | | | (0.19 | ) | | | (0.17 | ) | | | (0.19 | ) | | | (0.19 | ) |
Distributions from net realized gains | | | (0.46 | ) | | | (0.18 | ) | | | (2.89 | ) | | | (0.19 | ) | | | (0.43 | ) |
Total dividends and distributions | | | (0.64 | ) | | | (0.37 | ) | | | (3.06 | ) | | | (0.38 | ) | | | (0.62 | ) |
Net asset value, end of year | | | $22.48 | | | | $16.80 | | | | $15.75 | | | | $21.09 | | | | $15.17 | |
Total Return(b): | | | 38.49 | % | | | 9.16 | % | | | (12.84 | )% | | | 42.24 | % | | | 4.02 | % |
| | | | | | |
| | | | | | | | | | | | | | | | | | | | | |
| | | | | | |
Ratios/Supplemental Data: | | | | | | | | | | | | | | | | | | | | |
Net assets, end of year (000) | | | $524,581 | | | | $412,198 | | | | $411,798 | | | | $522,601 | | | | $382,165 | |
Average net assets (000) | | | $498,458 | | | | $423,340 | | | | $468,874 | | | | $475,322 | | | | $389,009 | |
Ratios to average net assets(c): | | | | | | | | | | | | | | | | | | | | |
Expenses after waivers and/or expense reimbursement | | | 0.70 | % | | | 0.72 | % | | | 0.72 | % | | | 0.72 | % | | | 0.72 | % |
Expenses before waivers and/or expense reimbursement | | | 0.79 | % | | | 0.83 | % | | | 0.83 | % | | | 0.81 | % | | | 0.83 | % |
Net investment income (loss) | | | 0.75 | % | | | 0.97 | % | | | 1.03 | % | | | 0.84 | % | | | 1.26 | % |
Portfolio turnover rate(d) | | | 113 | % | | | 96 | % | | | 98 | % | | | 101 | % | | | 92 | % |
| (a) | Calculated based on average shares outstanding during the year. |
| (b) | Total return does not consider the effects of sales loads. Total return is calculated assuming a purchase of a share on the first day and a sale on the last day of each year reported and includes reinvestment of dividends and distributions, if any. Total returns may reflect adjustments to conform to GAAP. |
| (c) | Does not include expenses of the underlying funds in which the Fund invests. |
| (d) | The Fund’s portfolio turnover rate is calculated in accordance with regulatory requirements, without regard to transactions involving short-term investments, certain derivatives and in-kind transactions (if any). If such transactions were included, the Fund’s portfolio turnover rate may be higher. |
See Notes to Financial Statements.
20
PGIM Quant Solutions Large-Cap Core Fund
Financial Highlights (continued)
| | | | | | | | | | | | | | | | | | | | |
| | | | | | |
Class C Shares | | | | | | | | | | | | | | | | | | | | |
| | | Year Ended October 31, | |
| | | 2024 | | | 2023 | | | 2022 | | | 2021 | | | 2020 | |
Per Share Operating Performance(a): | | | | | | | | | | | | | | | | | | | | |
Net Asset Value, Beginning of Year | | | $14.35 | | | | $13.51 | | | | $18.52 | | | | $13.38 | | | | $13.46 | |
Income (loss) from investment operations: | | | | | | | | | | | | | | | | | | | | |
Net investment income (loss) | | | 0.01 | | | | 0.04 | | | | 0.05 | | | | 0.02 | | | | 0.07 | |
Net realized and unrealized gain (loss) on investment transactions | | | 5.25 | | | | 1.08 | | | | (2.11 | ) | | | 5.42 | | | | 0.38 | |
Total from investment operations | | | 5.26 | | | | 1.12 | | | | (2.06 | ) | | | 5.44 | | | | 0.45 | |
Less Dividends and Distributions: | | | | | | | | | | | | | | | | | | | | |
Dividends from net investment income | | | (0.09 | ) | | | (0.10 | ) | | | (0.06 | ) | | | (0.11 | ) | | | (0.10 | ) |
Distributions from net realized gains | | | (0.46 | ) | | | (0.18 | ) | | | (2.89 | ) | | | (0.19 | ) | | | (0.43 | ) |
Total dividends and distributions | | | (0.55 | ) | | | (0.28 | ) | | | (2.95 | ) | | | (0.30 | ) | | | (0.53 | ) |
Net asset value, end of year | | | $19.06 | | | | $14.35 | | | | $13.51 | | | | $18.52 | | | | $13.38 | |
Total Return(b): | | | 37.45 | % | | | 8.37 | % | | | (13.46 | )% | | | 41.25 | % | | | 3.27 | % |
| | | | | | |
| | | | | | | | | | | | | | | | | | | | | |
| | | | | | |
Ratios/Supplemental Data: | | | | | | | | | | | | | | | | | | | | |
Net assets, end of year (000) | | | $13,239 | | | | $13,876 | | | | $15,992 | | | | $22,453 | | | | $21,047 | |
Average net assets (000) | | | $14,335 | | | | $15,468 | | | | $19,087 | | | | $22,342 | | | | $24,287 | |
Ratios to average net assets(c): | | | | | | | | | | | | | | | | | | | | |
Expenses after waivers and/or expense reimbursement | | | 1.44 | % | | | 1.44 | % | | | 1.44 | % | | | 1.44 | % | | | 1.44 | % |
Expenses before waivers and/or expense reimbursement | | | 1.68 | % | | | 1.65 | % | | | 1.65 | % | | | 1.59 | % | | | 1.59 | % |
Net investment income (loss) | | | 0.03 | % | | | 0.27 | % | | | 0.30 | % | | | 0.14 | % | | | 0.56 | % |
Portfolio turnover rate(d) | | | 113 | % | | | 96 | % | | | 98 | % | | | 101 | % | | | 92 | % |
| (a) | Calculated based on average shares outstanding during the year. |
| (b) | Total return does not consider the effects of sales loads. Total return is calculated assuming a purchase of a share on the first day and a sale on the last day of each year reported and includes reinvestment of dividends and distributions, if any. Total returns may reflect adjustments to conform to GAAP. |
| (c) | Does not include expenses of the underlying funds in which the Fund invests. |
| (d) | The Fund’s portfolio turnover rate is calculated in accordance with regulatory requirements, without regard to transactions involving short-term investments, certain derivatives and in-kind transactions (if any). If such transactions were included, the Fund’s portfolio turnover rate may be higher. |
See Notes to Financial Statements.
PGIM Quant Solutions Large-Cap Core Fund 21
PGIM Quant Solutions Large-Cap Core Fund
Financial Highlights (continued)
| | | | | | | | | | | | | | | | | | | | |
| | | | | | |
Class Z Shares | | | | | | | | | | | | | | | | | | | | |
| | | Year Ended October 31, | |
| | | 2024 | | | 2023 | | | 2022 | | | 2021 | | | 2020 | |
Per Share Operating Performance(a): | | | | | | | | | | | | | | | | | | | | |
Net Asset Value, Beginning of Year | | | $17.47 | | | | $16.38 | | | | $21.79 | | | | $15.67 | | | | $15.65 | |
Income (loss) from investment operations: | | | | | | | | | | | | | | | | | | | | |
Net investment income (loss) | | | 0.21 | | | | 0.21 | | | | 0.24 | | | | 0.21 | | | | 0.23 | |
Net realized and unrealized gain (loss) on investment transactions | | | 6.41 | | | | 1.31 | | | | (2.55 | ) | | | 6.32 | | | | 0.44 | |
Total from investment operations | | | 6.62 | | | | 1.52 | | | | (2.31 | ) | | | 6.53 | | | | 0.67 | |
Less Dividends and Distributions: | | | | | | | | | | | | | | | | | | | | |
Dividends from net investment income | | | (0.22 | ) | | | (0.25 | ) | | | (0.21 | ) | | | (0.22 | ) | | | (0.22 | ) |
Distributions from net realized gains | | | (0.46 | ) | | | (0.18 | ) | | | (2.89 | ) | | | (0.19 | ) | | | (0.43 | ) |
Total dividends and distributions | | | (0.68 | ) | | | (0.43 | ) | | | (3.10 | ) | | | (0.41 | ) | | | (0.65 | ) |
Net asset value, end of year | | | $23.41 | | | | $17.47 | | | | $16.38 | | | | $21.79 | | | | $15.67 | |
Total Return(b): | | | 38.82 | % | | | 9.43 | % | | | (12.54 | )% | | | 42.44 | % | | | 4.27 | % |
| | | | | | |
| | | | | | | | | | | | | | | | | | | | | |
| | | | | | |
Ratios/Supplemental Data: | | | | | | | | | | | | | | | | | | | | |
Net assets, end of year (000) | | | $34,831 | | | | $21,379 | | | | $20,647 | | | | $25,663 | | | | $47,730 | |
Average net assets (000) | | | $28,654 | | | | $21,455 | | | | $23,609 | | | | $60,616 | | | | $64,099 | |
Ratios to average net assets(c): | | | | | | | | | | | | | | | | | | | | |
Expenses after waivers and/or expense reimbursement | | | 0.45 | % | | | 0.46 | % | | | 0.42 | % | | | 0.49 | % | | | 0.48 | % |
Expenses before waivers and/or expense reimbursement | | | 0.56 | % | | | 0.54 | % | | | 0.54 | % | | | 0.55 | % | | | 0.55 | % |
Net investment income (loss) | | | 1.00 | % | | | 1.22 | % | | | 1.34 | % | | | 1.10 | % | | | 1.54 | % |
Portfolio turnover rate(d) | | | 113 | % | | | 96 | % | | | 98 | % | | | 101 | % | | | 92 | % |
| (a) | Calculated based on average shares outstanding during the year. |
| (b) | Total return is calculated assuming a purchase of a share on the first day and a sale on the last day of each year reported and includes reinvestment of dividends and distributions, if any. Total returns may reflect adjustments to conform to GAAP. |
| (c) | Does not include expenses of the underlying funds in which the Fund invests. |
| (d) | The Fund’s portfolio turnover rate is calculated in accordance with regulatory requirements, without regard to transactions involving short-term investments, certain derivatives and in-kind transactions (if any). If such transactions were included, the Fund’s portfolio turnover rate may be higher. |
See Notes to Financial Statements.
22
PGIM Quant Solutions Large-Cap Core Fund
Financial Highlights (continued)
| | | | | | | | | | | | | | | | | | | | |
| | | | | | |
Class R6 Shares | | | | | | | | | | | | | | | | | | | | |
| | | Year Ended October 31, | |
| | | 2024 | | | 2023 | | | 2022 | | | 2021 | | | 2020 | |
Per Share Operating Performance(a): | | | | | | | | | | | | | | | | | | | | |
Net Asset Value, Beginning of Year | | | $17.53 | | | | $16.42 | | | | $21.86 | | | | $15.70 | | | | $15.68 | |
Income (loss) from investment operations: | | | | | | | | | | | | | | | | | | | | |
Net investment income (loss) | | | 0.24 | | | | 0.23 | | | | 0.25 | | | | 0.23 | | | | 0.25 | |
Net realized and unrealized gain (loss) on investment transactions | | | 6.43 | | | | 1.31 | | | | (2.56 | ) | | | 6.36 | | | | 0.44 | |
Total from investment operations | | | 6.67 | | | | 1.54 | | | | (2.31 | ) | | | 6.59 | | | | 0.69 | |
Less Dividends and Distributions: | | | | | | | | | | | | | | | | | | | | |
Dividends from net investment income | | | (0.24 | ) | | | (0.25 | ) | | | (0.24 | ) | | | (0.24 | ) | | | (0.24 | ) |
Distributions from net realized gains | | | (0.46 | ) | | | (0.18 | ) | | | (2.89 | ) | | | (0.19 | ) | | | (0.43 | ) |
Total dividends and distributions | | | (0.70 | ) | | | (0.43 | ) | | | (3.13 | ) | | | (0.43 | ) | | | (0.67 | ) |
Net asset value, end of year | | | $23.50 | | | | $17.53 | | | | $16.42 | | | | $21.86 | | | | $15.70 | |
Total Return(b): | | | 39.00 | % | | | 9.56 | % | | | (12.52 | )% | | | 42.79 | % | | | 4.39 | % |
| | | | | | |
| | | | | | | | | | | | | | | | | | | | | |
| | | | | | |
Ratios/Supplemental Data: | | | | | | | | | | | | | | | | | | | | |
Net assets, end of year (000) | | | $323,959 | | | | $254,742 | | | | $228,073 | | | | $295,432 | | | | $132,446 | |
Average net assets (000) | | | $289,187 | | | | $248,145 | | | | $258,329 | | | | $204,016 | | | | $105,498 | |
Ratios to average net assets(c): | | | | | | | | | | | | | | | | | | | | |
Expenses after waivers and/or expense reimbursement | | | 0.35 | % | | | 0.35 | % | | | 0.35 | % | | | 0.35 | % | | | 0.35 | % |
Expenses before waivers and/or expense reimbursement | | | 0.39 | % | | | 0.39 | % | | | 0.39 | % | | | 0.38 | % | | | 0.40 | % |
Net investment income (loss) | | | 1.10 | % | | | 1.33 | % | | | 1.38 | % | | | 1.17 | % | | | 1.60 | % |
Portfolio turnover rate(d) | | | 113 | % | | | 96 | % | | | 98 | % | | | 101 | % | | | 92 | % |
| (a) | Calculated based on average shares outstanding during the year. |
| (b) | Total return is calculated assuming a purchase of a share on the first day and a sale on the last day of each year reported and includes reinvestment of dividends and distributions, if any. Total returns may reflect adjustments to conform to GAAP. |
| (c) | Does not include expenses of the underlying funds in which the Fund invests. |
| (d) | The Fund’s portfolio turnover rate is calculated in accordance with regulatory requirements, without regard to transactions involving short-term investments, certain derivatives and in-kind transactions (if any). If such transactions were included, the Fund’s portfolio turnover rate may be higher. |
See Notes to Financial Statements.
PGIM Quant Solutions Large-Cap Core Fund 23
PGIM Real Estate Income Fund
Schedule of Investments
as of October 31, 2024
| | | | | | | | |
| | |
| Description | | Shares | | | Value | |
| | |
LONG-TERM INVESTMENTS 99.5% | | | | | | | | |
| | |
COMMON STOCKS 79.8% | | | | | | | | |
| | |
Diversified REITs 5.5% | | | | | | | | |
British Land Co. PLC (The) (United Kingdom) | | | 118,779 | | | $ | 611,231 | |
Broadstone Net Lease, Inc. | | | 128,827 | | | | 2,266,067 | |
| | | | | | | | |
| | |
| | | | | | | 2,877,298 | |
| | |
Health Care Facilities 3.1% | | | | | | | | |
Chartwell Retirement Residences (Canada), UTS | | | 144,653 | | | | 1,625,898 | |
| | |
Health Care REITs 12.4% | | | | | | | | |
American Healthcare REIT, Inc. | | | 98,553 | | | | 2,621,510 | |
CareTrust REIT, Inc. | | | 71,338 | | | | 2,330,612 | |
Sila Realty Trust, Inc. | | | 61,373 | | | | 1,545,372 | |
| | | | | | | | |
| | |
| | | | | | | 6,497,494 | |
| | |
Industrial REITs 7.4% | | | | | | | | |
CapitaLand Ascendas REIT (Singapore) | | | 440,081 | | | | 891,828 | |
Frasers Logistics & Commercial Trust (Singapore) | | | 1,625,383 | | | | 1,309,864 | |
LXP Industrial Trust | | | 178,309 | | | | 1,683,237 | |
| | | | | | | | |
| | |
| | | | | | | 3,884,929 | |
| | |
Office REITs 5.7% | | | | | | | | |
Kilroy Realty Corp. | | | 38,433 | | | | 1,545,776 | |
Piedmont Office Realty Trust, Inc. (Class A Stock) | | | 144,847 | | | | 1,439,779 | |
| | | | | | | | |
| | |
| | | | | | | 2,985,555 | |
| | |
Real Estate Operating Companies 0.8% | | | | | | | | |
Swire Properties Ltd. (Hong Kong) | | | 210,956 | | | | 429,337 | |
| | |
Residential REITs 5.7% | | | | | | | | |
Sun Communities, Inc. | | | 7,943 | | | | 1,053,877 | |
UDR, Inc. | | | 45,191 | | | | 1,906,609 | |
| | | | | | | | |
| | |
| | | | | | | 2,960,486 | |
| | |
Retail REITs 24.8% | | | | | | | | |
Brixmor Property Group, Inc. | | | 75,557 | | | | 2,036,261 | |
First Capital Real Estate Investment Trust (Canada) | | | 100,683 | | | | 1,285,700 | |
Getty Realty Corp. | | | 36,761 | | | | 1,153,928 | |
Japan Metropolitan Fund Investment Corp. (Japan) | | | 510 | | | | 313,019 | |
See Notes to Financial Statements.
24
PGIM Real Estate Income Fund
Schedule of Investments (continued)
as of October 31, 2024
| | | | | | | | |
| | |
| Description | | Shares | | | Value | |
| | |
COMMON STOCKS (Continued) | | | | | | | | |
| | |
Retail REITs (cont’d.) | | | | | | | | |
Link REIT (Hong Kong) | | | 153,501 | | | $ | 715,225 | |
NNN REIT, Inc. | | | 30,517 | | | | 1,325,658 | |
Realty Income Corp. | | | 10,589 | | | | 628,669 | |
Scentre Group (Australia) | | | 885,487 | | | | 2,030,127 | |
Simon Property Group, Inc. | | | 17,940 | | | | 3,034,013 | |
Supermarket Income REIT PLC (United Kingdom) | | | 475,685 | | | | 435,141 | |
| | | | | | | | |
| | |
| | | | | | | 12,957,741 | |
| | |
Specialized REITs 14.4% | | | | | | | | |
Digital Realty Trust, Inc. | | | 14,800 | | | | 2,637,804 | |
Iron Mountain, Inc. | | | 11,737 | | | | 1,452,219 | |
National Storage Affiliates Trust | | | 34,501 | | | | 1,454,217 | |
VICI Properties, Inc. | | | 61,503 | | | | 1,953,336 | |
| | | | | | | | |
| | |
| | | | | | | 7,497,576 | |
| | | | | | | | |
| | |
TOTAL COMMON STOCKS
(cost $36,320,563) | | | | | | | 41,716,314 | |
| | | | | | | | |
| | |
PREFERRED STOCKS 19.7% | | | | | | | | |
| | |
Diversified REITs 2.5% | | | | | | | | |
Gladstone Commercial Corp., Series G, 6.000%, Maturing 06/28/26(oo) | | | 60,110 | | | | 1,328,431 | |
| | |
Hotel & Resort REITs 2.8% | | | | | | | | |
Pebblebrook Hotel Trust, Series H, 5.700%, Maturing 07/27/26(oo) | | | 70,139 | | | | 1,451,877 | |
| | |
Industrial REITs 1.9% | | | | | | | | |
Rexford Industrial Realty, Inc., Series C, 5.625%, Maturing 11/20/24(oo) | | | 43,233 | | | | 993,927 | |
| | |
Office REITs 3.8% | | | | | | | | |
Vornado Realty Trust, Series M, 5.250%, Maturing 11/30/24(oo) | | | 109,023 | | | | 1,987,489 | |
| | |
Retail REITs 5.1% | | | | | | | | |
Agree Realty Corp., Series A, 4.250%, Maturing 09/17/26(oo) | | | 135,343 | | | | 2,670,318 | |
See Notes to Financial Statements.
PGIM Real Estate Income Fund 25
PGIM Real Estate Income Fund
Schedule of Investments (continued)
as of October 31, 2024
| | | | | | | | |
| | |
| Description | | Shares | | | Value | |
| | |
PREFERRED STOCKS (Continued) | | | | | | | | |
| | |
Specialized REITs 3.6% | | | | | | | | |
EPR Properties, Series G, 5.750%, Maturing 11/30/24(a)(oo) | | | 65,725 | | | $ | 1,440,035 | |
Public Storage, Series H, 5.600%, Maturing 11/30/24(oo) | | | 18,055 | | | | 451,736 | |
| | | | | | | | |
| | |
| | | | | | | 1,891,771 | |
| | | | | | | | |
| | |
TOTAL PREFERRED STOCKS | | | | | | | | |
(cost $9,700,532) | | | | | | | 10,323,813 | |
| | | | | | | | |
| | |
TOTAL LONG-TERM INVESTMENTS | | | | | | | | |
(cost $46,021,095) | | | | | | | 52,040,127 | |
| | | | | | | | |
| | |
SHORT-TERM INVESTMENTS 0.2% | | | | | | | | |
| | |
AFFILIATED MUTUAL FUNDS | | | | | | | | |
PGIM Core Government Money Market Fund (7-day effective yield 5.011%)(wb) | | | 114,268 | | | | 114,268 | |
PGIM Institutional Money Market Fund (7-day effective yield 5.096%) | | | | | | | | |
(cost $4,500; includes $4,500 of cash collateral for securities on loan)(b)(wb) | | | 4,503 | | | | 4,500 | |
| | | | | | | | |
| | |
TOTAL SHORT-TERM INVESTMENTS | | | | | | | | |
(cost $118,768) | | | | | | | 118,768 | |
| | | | | | | | |
| | |
TOTAL INVESTMENTS 99.7% | | | | | | | | |
(cost $46,139,863) | | | | | | | 52,158,895 | |
Other assets in excess of liabilities 0.3% | | | | | | | 156,874 | |
| | | | | | | | |
| | |
NET ASSETS 100.0% | | | | | | $ | 52,315,769 | |
| | | | | | | | |
See the Glossary for a list of the abbreviation(s) used in the annual report.
| (a) | All or a portion of security is on loan. The aggregate market value of such securities, including those sold and pending settlement, is $4,382; cash collateral of $4,500 (included in liabilities) was received with which the Fund purchased highly liquid short-term investments. In the event of significant appreciation in value of securities on loan on the last business day of the reporting period, the Fund may reflect a collateral value that is less than the market value of the loaned securities and such shortfall is remedied the following business day. |
| (b) | Represents security, or portion thereof, purchased with cash collateral received for securities on loan and includes dividend reinvestment. |
| (oo) | Perpetual security. Maturity date represents next call date. |
| (wb) | Represents an investment in a Fund affiliated with the Manager. |
Fair Value Measurements:
Various inputs are used in determining the value of the Fund’s investments. These inputs are summarized in the three broad levels listed below.
See Notes to Financial Statements.
26
PGIM Real Estate Income Fund
Schedule of Investments (continued)
as of October 31, 2024
Level 1—unadjusted quoted prices generally in active markets for identical securities.
Level 2—quoted prices for similar securities, interest rates and yield curves, prepayment speeds, foreign currency exchange rates and other observable inputs.
Level 3—unobservable inputs for securities valued in accordance with Board approved fair valuation procedures.
The following is a summary of the inputs used as of October 31, 2024 in valuing such portfolio securities:
| | | | | | | | | | | | |
| | | Level 1 | | | Level 2 | | | Level 3 | |
Investments in Securities | | | | | | | | | | | | |
Assets | | | | | | | | | | | | |
Long-Term Investments | | | | | | | | | | | | |
Common Stocks | | | | | | | | | | | | |
Diversified REITs | | $ | 2,266,067 | | | $ | 611,231 | | | | $— | |
Health Care Facilities | | | 1,625,898 | | | | — | | | | — | |
Health Care REITs | | | 6,497,494 | | | | — | | | | — | |
Industrial REITs | | | 1,683,237 | | | | 2,201,692 | | | | — | |
Office REITs | | | 2,985,555 | | | | — | | | | — | |
Real Estate Operating Companies | | | — | | | | 429,337 | | | | — | |
Residential REITs | | | 2,960,486 | | | | — | | | | — | |
Retail REITs | | | 9,464,229 | | | | 3,493,512 | | | | — | |
Specialized REITs | | | 7,497,576 | | | | — | | | | — | |
Preferred Stocks | | | | | | | | | | | | |
Diversified REITs | | | 1,328,431 | | | | — | | | | — | |
Hotel & Resort REITs | | | 1,451,877 | | | | — | | | | — | |
Industrial REITs | | | 993,927 | | | | — | | | | — | |
Office REITs | | | 1,987,489 | | | | — | | | | — | |
Retail REITs | | | 2,670,318 | | | | — | | | | — | |
Specialized REITs | | | 1,891,771 | | | | — | | | | — | |
Short-Term Investments | | | | | | | | | | | | |
Affiliated Mutual Funds | | | 118,768 | | | | — | | | | — | |
| | | | | | | | | | | | |
Total | | $ | 45,423,123 | | | $ | 6,735,772 | | | | $— | |
| | | | | | | | | | | | |
Sector Classification:
The sector classification of investments and other assets in excess of liabilities shown as a percentage of net assets as of October 31, 2024 were as follows:
| | | | |
Retail REITs | | | 29.9 | % |
Specialized REITs | | | 18.0 | |
Health Care REITs | | | 12.4 | |
Office REITs | | | 9.5 | |
Industrial REITs | | | 9.3 | |
Diversified REITs | | | 8.0 | |
Residential REITs | | | 5.7 | |
Health Care Facilities | | | 3.1 | |
Hotel & Resort REITs | | | 2.8 | |
Real Estate Operating Companies | | | 0.8 | |
| | | | |
Affiliated Mutual Funds (0.0% represents investments purchased with collateral from securities on loan) | | | 0.2 | % |
| | | | |
| | | 99.7 | |
Other assets in excess of liabilities | | | 0.3 | |
| | | | |
| | | 100.0 | % |
| | | | |
See Notes to Financial Statements.
PGIM Real Estate Income Fund 27
PGIM Real Estate Income Fund
Schedule of Investments (continued)
as of October 31, 2024
Financial Instruments/Transactions—Summary of Offsetting and Netting Arrangements:
The Fund entered into financial instruments/transactions during the reporting period that are either offset in accordance with current requirements or are subject to enforceable master netting arrangements or similar agreements that permit offsetting. The information about offsetting and related netting arrangements for financial instruments/transactions where the legal right to set-off exists is presented in the summary below.
Offsetting of financial instrument/transaction assets and liabilities:
| | | | | | | | | | | | |
| Description | | Gross Market
Value of
Recognized
Assets/(Liabilities) | | | Collateral Pledged/(Received)(1) | | | Net
Amount | |
Securities on Loan | | $ | 4,382 | | | $ | (4,382 | ) | | $ | — | |
| (1) | Collateral amount disclosed by the Fund is limited to the market value of financial instruments/transactions. |
See Notes to Financial Statements.
28
PGIM Real Estate Income Fund
Statement of Assets & Liabilities
as of October 31, 2024
| | | | |
| |
Assets | | | | |
Investments at value, including securities on loan of $4,382: | | | | |
Unaffiliated investments (cost $46,021,095) | | $ | 52,040,127 | |
Affiliated investments (cost $118,768) | | | 118,768 | |
Foreign currency, at value (cost $18) | | | 18 | |
Receivable for investments sold | | | 932,321 | |
Dividends receivable | | | 56,705 | |
Receivable for Fund shares sold | | | 38,661 | |
Tax reclaim receivable | | | 29,215 | |
Prepaid expenses | | | 1,383 | |
| | | | |
| |
Total Assets | | | 53,217,198 | |
| | | | |
| |
Liabilities | | | | |
Payable for investments purchased | | | 786,213 | |
Audit fee payable | | | 35,504 | |
Payable for Fund shares purchased | | | 27,949 | |
Accrued expenses and other liabilities | | | 26,303 | |
Management fee payable | | | 19,461 | |
Payable to broker for collateral for securities on loan | | | 4,500 | |
Trustees’ fees payable | | | 866 | |
Affiliated transfer agent fee payable | | | 379 | |
Distribution fee payable | | | 254 | |
| | | | |
| |
Total Liabilities | | | 901,429 | |
| | | | |
| |
Net Assets | | $ | 52,315,769 | |
| | | | |
| |
| | | | |
| |
Net assets were comprised of: | | | | |
Shares of beneficial interest, at par | | $ | 6,493 | |
Paid-in capital in excess of par | | | 45,513,757 | |
Total distributable earnings (loss) | | | 6,795,519 | |
| | | | |
| |
Net assets, October 31, 2024 | | $ | 52,315,769 | |
| | | | |
See Notes to Financial Statements.
PGIM Real Estate Income Fund 29
PGIM Real Estate Income Fund
Statement of Assets & Liabilities (continued)
as of October 31, 2024
| | | | | | | | |
Class A | | | | | | | | |
Net asset value and redemption price per share, ($744,676 ÷ 92,578 shares of beneficial interest issued and outstanding) | | $ | 8.04 | | | | | |
Maximum sales charge (5.50% of offering price) | | | 0.47 | | | | | |
| | | | | | | | |
Maximum offering price to public | | $ | 8.51 | | | | | |
| | | | | | | | |
Class C | | | | | | | | |
Net asset value, offering price and redemption price per share, ($131,303 ÷ 16,327 shares of beneficial interest issued and outstanding) | | $ | 8.04 | | | | | |
| | | | | | | | |
Class Z | | | | | | | | |
Net asset value, offering price and redemption price per share, ($3,712,330 ÷ 459,345 shares of beneficial interest issued and outstanding) | | $ | 8.08 | | | | | |
| | | | | | | | |
Class R6 | | | | | | | | |
Net asset value, offering price and redemption price per share, ($47,727,460 ÷ 5,924,883 shares of beneficial interest issued and outstanding) | | $ | 8.06 | | | | | |
| | | | | | | | |
See Notes to Financial Statements.
30
PGIM Real Estate Income Fund
Statement of Operations
Year Ended October 31, 2024
| | | | |
Net Investment Income (Loss) | | | | |
Income | | | | |
Unaffiliated dividend income (net of $35,912 foreign withholding tax) | | $ | 2,101,646 | |
Affiliated dividend income | | | 17,133 | |
Income from securities lending, net (including affiliated income of $267) | | | 268 | |
| | | | |
Total income | | | 2,119,047 | |
| | | | |
| |
Expenses | | | | |
Management fee | | | 335,045 | |
Distribution fee(a) | | | 3,362 | |
Custodian and accounting fees | | | 42,247 | |
Professional fees | | | 41,168 | |
Registration fees(a) | | | 36,017 | |
Audit fee | | | 35,505 | |
Shareholders’ reports | | | 21,927 | |
Trustees’ fees | | | 10,125 | |
Transfer agent’s fees and expenses (including affiliated expense of $2,206)(a) | | | 5,501 | |
Miscellaneous | | | 20,164 | |
| | | | |
Total expenses | | | 551,061 | |
Less: Fee waiver and/or expense reimbursement(a) | | | (85,787 | ) |
Distribution fee waiver(a) | | | (303 | ) |
| | | | |
Net expenses | | | 464,971 | |
| | | | |
Net investment income (loss) | | | 1,654,076 | |
| | | | |
Realized And Unrealized Gain (Loss) On Investment And Foreign Currency Transactions | | | | |
| |
Net realized gain (loss) on: | | | | |
Investment transactions (including affiliated of $15) | | | 3,004,870 | |
Foreign currency transactions | | | 1,192 | |
| | | | |
| | | 3,006,062 | |
| | | | |
Net change in unrealized appreciation (depreciation) on: | | | | |
Investments | | | 9,904,828 | |
Foreign currencies | | | (56 | ) |
| | | | |
| | | 9,904,772 | |
| | | | |
Net gain (loss) on investment and foreign currency transactions | | | 12,910,834 | |
| | | | |
Net Increase (Decrease) In Net Assets Resulting From Operations | | $ | 14,564,910 | |
| | | | |
| (a) | Class specific expenses and waivers were as follows: |
| | | | | | | | | | | | | | | | |
| | | Class A | | | Class C | | | Class Z | | | Class R6 | |
Distribution fee | | | 1,821 | | | | 1,541 | | | | — | | | | — | |
Registration fees | | | 7,204 | | | | 7,854 | | | | 12,794 | | | | 8,165 | |
Transfer agent’s fees and expenses | | | 1,594 | | | | 479 | | | | 2,920 | | | | 508 | |
Fee waiver and/or expense reimbursement | | | (9,455 | ) | | | (8,513 | ) | | | (16,601 | ) | | | (51,218 | ) |
Distribution fee waiver | | | (303 | ) | | | — | | | | — | | | | — | |
See Notes to Financial Statements.
PGIM Real Estate Income Fund 31
PGIM Real Estate Income Fund
Statements of Changes in Net Assets
| | | | | | | | |
| |
| | | Year Ended | |
| | | October 31, | |
| | |
| | | 2024 | | | 2023 | |
| | |
Increase (Decrease) in Net Assets | | | | | | | | |
| | |
Operations | | | | | | | | |
Net investment income (loss) | | $ | 1,654,076 | | | $ | 927,467 | |
Net realized gain (loss) on investment and foreign currency transactions | | | 3,006,062 | | | | (2,804,509 | ) |
Net change in unrealized appreciation (depreciation) on investments and foreign currencies | | | 9,904,772 | | | | 1,511,844 | |
| | | | | | | | |
| | |
Net increase (decrease) in net assets resulting from operations | | | 14,564,910 | | | | (365,198 | ) |
| | | | | | | | |
| | |
Dividends and Distributions | | | | | | | | |
Distributions from distributable earnings | | | | | | | | |
Class A | | | (23,772 | ) | | | (23,535 | ) |
Class C | | | (4,672 | ) | | | (6,131 | ) |
Class Z | | | (54,570 | ) | | | (24,610 | ) |
Class R6 | | | (1,672,200 | ) | | | (869,841 | ) |
| | | | | | | | |
| | | (1,755,214 | ) | | | (924,117 | ) |
| | | | | | | | |
Tax return of capital distributions | | | | | | | | |
Class A | | | — | | | | (4,438 | ) |
Class C | | | — | | | | (1,156 | ) |
Class Z | | | — | | | | (4,641 | ) |
Class R6 | | | — | | | | (164,033 | ) |
| | | | | | | | |
| | | — | | | | (174,268 | ) |
| | | | | | | | |
Fund share transactions (Net of share conversions) | | | | | | | | |
Net proceeds from shares sold | | | 16,572,671 | | | | 12,658,309 | |
Net asset value of shares issued in reinvestment of dividends and distributions | | | 1,753,806 | | | | 1,096,923 | |
Cost of shares purchased | | | (8,342,612 | ) | | | (10,859,789 | ) |
| | | | | | | | |
Net increase (decrease) in net assets from Fund share transactions | | | 9,983,865 | | | | 2,895,443 | |
| | | | | | | | |
Total increase (decrease) | | | 22,793,561 | | | | 1,431,860 | |
| | |
Net Assets: | | | | | | | | |
Beginning of year | | | 29,522,208 | | | | 28,090,348 | |
| | | | | | | | |
End of year | | $ | 52,315,769 | | | $ | 29,522,208 | |
| | | | | | | | |
See Notes to Financial Statements.
32
PGIM Real Estate Income Fund
Financial Highlights
| | | | | | | | | | | | | | | | | | | | |
| | | | | | |
Class A Shares | | | | | | | | | | | | | | | | | | | | |
| | | Year Ended October 31, | |
| | | 2024 | | | 2023 | | | 2022 | | | 2021 | | | 2020 | |
Per Share Operating Performance(a): | | | | | | | | | | | | | | | | | | | | |
Net Asset Value, Beginning of Year | | | $5.85 | | | | $6.18 | | | | $10.26 | | | | $7.67 | | | | $10.66 | |
Income (loss) from investment operations: | | | | | | | | | | | | | | | | | | | | |
Net investment income (loss) | | | 0.26 | | | | 0.22 | | | | 0.32 | | | | 0.25 | | | | 0.27 | |
| Net realized and unrealized gain (loss) on investment and foreign currency transactions | | | 2.21 | | | | (0.29 | ) | | | (1.99) | | | | 2.70 | | | | (2.43 | ) |
Total from investment operations | | | 2.47 | | | | (0.07 | ) | | | (1.67 | ) | | | 2.95 | | | | (2.16 | ) |
Less Dividends and Distributions: | | | | | | | | | | | | | | | | | | | | |
Dividends from net investment income | | | (0.27 | ) | | | (0.22 | ) | | | (0.29 | ) | | | (0.36 | ) | | | (0.63 | ) |
Tax return of capital distributions | | | - | | | | (0.04 | ) | | | (0.10 | ) | | | - | | | | (0.14 | ) |
Distributions from net realized gains | | | (0.01 | ) | | | - | | | | (2.02 | ) | | | - | | | | (0.06 | ) |
Total dividends and distributions | | | (0.28 | ) | | | (0.26 | ) | | | (2.41 | ) | | | (0.36 | ) | | | (0.83 | ) |
Net asset value, end of year | | | $8.04 | | | | $5.85 | | | | $6.18 | | | | $10.26 | | | | $7.67 | |
Total Return(b): | | | 42.57 | % | | | (1.24 | )% | | | (20.18 | )% | | | 38.84 | % | | | (21.25 | )% |
| | | | | | | | | | | | | | | | | | | | |
| | | | | | |
Ratios/Supplemental Data: | | | | | | | | | | | | | | | | | | | | |
Net assets, end of year (000) | | | $745 | | | | $524 | | | | $738 | | | | $1,582 | | | | $866 | |
Average net assets (000) | | | $607 | | | | $705 | | | | $1,190 | | | | $1,428 | | | | $796 | |
Ratios to average net assets(c): | | | | | | | | | | | | | | | | | | | | |
Expenses after waivers and/or expense reimbursement | | | 1.35 | % | | | 1.36 | %(d) | | | 1.35 | % | | | 1.35 | % | | | 1.36 | % |
Expenses before waivers and/or expense reimbursement | | | 2.96 | % | | | 2.79 | % | | | 2.39 | % | | | 2.16 | % | | | 4.78 | % |
Net investment income (loss) | | | 3.74 | % | | | 3.40 | % | | | 4.16 | % | | | 2.56 | % | | | 3.18 | % |
Portfolio turnover rate(e) | | | 112 | % | | | 92 | % | | | 90 | % | | | 201 | % | | | 235 | % |
| (a) | Calculated based on average shares outstanding during the year. |
| (b) | Total return does not consider the effects of sales loads. Total return is calculated assuming a purchase of a share on the first day and a sale on the last day of each year reported and includes reinvestment of dividends and distributions, if any. Total returns may reflect adjustments to conform to GAAP. |
| (c) | Does not include expenses of the underlying funds in which the Fund invests. |
| (d) | Includes certain non-recurring expenses of 0.01% which are being excluded from the Fund’s contractual waiver, if applicable, for the year ended October 31, 2023. |
| (e) | The Fund’s portfolio turnover rate is calculated in accordance with regulatory requirements, without regard to transactions involving short-term investments, certain derivatives and in-kind transactions (if any). If such transactions were included, the Fund’s portfolio turnover rate may be higher. |
See Notes to Financial Statements.
PGIM Real Estate Income Fund 33
PGIM Real Estate Income Fund
Financial Highlights (continued)
| | | | | | | | | | | | | | | | | | | | |
| | | | | | |
Class C Shares | | | | | | | | | | | | | | | | | | | | |
| | | Year Ended October 31, | |
| | | 2024 | | | 2023 | | | 2022 | | | 2021 | | | 2020 | |
Per Share Operating Performance(a): | | | | | | | | | | | | | | | | | | | | |
Net Asset Value, Beginning of Year | | | $5.85 | | | | $6.18 | | | | $10.26 | | | | $7.67 | | | | $10.66 | |
Income (loss) from investment operations: | | | | | | | | | | | | | | | | | | | | |
Net investment income (loss) | | | 0.21 | | | | 0.17 | | | | 0.20 | | | | 0.18 | | | | 0.23 | |
| Net realized and unrealized gain (loss) on investment and foreign currency transactions | | | 2.20 | | | | (0.29 | ) | | | (1.93) | | | | 2.70 | | | | (2.45 | ) |
Total from investment operations | | | 2.41 | | | | (0.12 | ) | | | (1.73 | ) | | | 2.88 | | | | (2.22 | ) |
Less Dividends and Distributions: | | | | | | | | | | | | | | | | | | | | |
Dividends from net investment income | | | (0.21 | ) | | | (0.17 | ) | | | (0.23 | ) | | | (0.29 | ) | | | (0.57 | ) |
Tax return of capital distributions | | | - | | | | (0.04 | ) | | | (0.10 | ) | | | - | | | | (0.14 | ) |
Distributions from net realized gains | | | (0.01 | ) | | | - | | | | (2.02 | ) | | | - | | | | (0.06 | ) |
Total dividends and distributions | | | (0.22 | ) | | | (0.21 | ) | | | (2.35 | ) | | | (0.29 | ) | | | (0.77 | ) |
Net asset value, end of year | | | $8.04 | | | | $5.85 | | | | $6.18 | | | | $10.26 | | | | $7.67 | |
Total Return(b): | | | 41.57 | % | | | (2.01 | )% | | | (20.81 | )% | | | 37.84 | % | | | (21.86 | )% |
| | | | | | | | | | | | | | | | | | | | |
| | | | | | |
Ratios/Supplemental Data: | | | | | | | | | | | | | | | | | | | | |
Net assets, end of year (000) | | | $131 | | | | $167 | | | | $178 | | | | $277 | | | | $268 | |
Average net assets (000) | | | $154 | | | | $221 | | | | $240 | | | | $302 | | | | $500 | |
Ratios to average net assets(c): | | | | | | | | | | | | | | | | | | | | |
Expenses after waivers and/or expense reimbursement | | | 2.11 | %(d) | | | 2.11 | %(d) | | | 2.10 | % | | | 2.10 | % | | | 2.11 | % |
Expenses before waivers and/or expense reimbursement | | | 7.63 | % | | | 5.30 | % | | | 5.03 | % | | | 4.27 | % | | | 6.45 | % |
Net investment income (loss) | | | 3.07 | % | | | 2.63 | % | | | 2.65 | % | | | 1.92 | % | | | 2.62 | % |
Portfolio turnover rate(e) | | | 112 | % | | | 92 | % | | | 90 | % | | | 201 | % | | | 235 | % |
| (a) | Calculated based on average shares outstanding during the year. |
| (b) | Total return does not consider the effects of sales loads. Total return is calculated assuming a purchase of a share on the first day and a sale on the last day of each year reported and includes reinvestment of dividends and distributions, if any. Total returns may reflect adjustments to conform to GAAP. |
| (c) | Does not include expenses of the underlying funds in which the Fund invests. |
| (d) | Includes certain non-recurring expenses of 0.01% and 0.01%, respectively, which are being excluded from the Fund’s contractual waiver, if applicable, for the years ended October 31, 2024 and 2023, respectively. |
| (e) | The Fund’s portfolio turnover rate is calculated in accordance with regulatory requirements, without regard to transactions involving short-term investments, certain derivatives and in-kind transactions (if any). If such transactions were included, the Fund’s portfolio turnover rate may be higher. |
See Notes to Financial Statements.
34
PGIM Real Estate Income Fund
Financial Highlights (continued)
| | | | | | | | | | | | | | | | | | | | |
| | | | | | |
Class Z Shares | | | | | | | | | | | | | | | | | | | | |
| | | Year Ended October 31, | |
| | | 2024 | | | 2023 | | | 2022 | | | 2021 | | | 2020 | |
Per Share Operating Performance(a): | | | | | | | | | | | | | | | | | | | | |
Net Asset Value, Beginning of Year | | | $5.87 | | | | $6.20 | | | | $10.29 | | | | $7.69 | | | | $10.69 | |
Income (loss) from investment operations: | | | | | | | | | | | | | | | | | | | | |
Net investment income (loss) | | | 0.28 | | | | 0.26 | | | | 0.28 | | | | 0.28 | | | | 0.34 | |
| Net realized and unrealized gain (loss) on investment and foreign currency transactions | | | 2.22 | | | | (0.31 | ) | | | (1.94) | | | | 2.71 | | | | (2.49 | ) |
Total from investment operations | | | 2.50 | | | | (0.05 | ) | | | (1.66 | ) | | | 2.99 | | | | (2.15 | ) |
Less Dividends and Distributions: | | | | | | | | | | | | | | | | | | | | |
Dividends from net investment income | | | (0.28 | ) | | | (0.24 | ) | | | (0.31 | ) | | | (0.39 | ) | | | (0.65 | ) |
Tax return of capital distributions | | | - | | | | (0.04 | ) | | | (0.10 | ) | | | - | | | | (0.14 | ) |
Distributions from net realized gains | | | (0.01 | ) | | | - | | | | (2.02 | ) | | | - | | | | (0.06 | ) |
Total dividends and distributions | | | (0.29 | ) | | | (0.28 | ) | | | (2.43 | ) | | | (0.39 | ) | | | (0.85 | ) |
Net asset value, end of year | | | $8.08 | | | | $5.87 | | | | $6.20 | | | | $10.29 | | | | $7.69 | |
Total Return(b): | | | 43.11 | % | | | (0.99 | )% | | | (20.03 | )% | | | 39.19 | % | | | (21.08 | )% |
| | | | | | | | | | | | | | | | | | | | |
| | | | | | |
Ratios/Supplemental Data: | | | | | | | | | | | | | | | | | | | | |
Net assets, end of year (000) | | | $3,712 | | | | $451 | | | | $7,024 | | | | $10,941 | | | | $7,797 | |
Average net assets (000) | | | $958 | | | | $1,033 | | | | $7,858 | | | | $11,287 | | | | $9,743 | |
Ratios to average net assets(c): | | | | | | | | | | | | | | | | | | | | |
Expenses after waivers and/or expense reimbursement | | | 1.10 | % | | | 1.11 | %(d) | | | 1.10 | % | | | 1.10 | % | | | 1.11 | % |
Expenses before waivers and/or expense reimbursement | | | 2.83 | % | | | 2.22 | % | | | 1.34 | % | | | 1.38 | % | | | 2.54 | % |
Net investment income (loss) | | | 3.71 | % | | | 4.08 | % | | | 3.67 | % | | | 2.92 | % | | | 3.81 | % |
Portfolio turnover rate(e) | | | 112 | % | | | 92 | % | | | 90 | % | | | 201 | % | | | 235 | % |
| (a) | Calculated based on average shares outstanding during the year. |
| (b) | Total return is calculated assuming a purchase of a share on the first day and a sale on the last day of each year reported and includes reinvestment of dividends and distributions, if any. Total returns may reflect adjustments to conform to GAAP. |
| (c) | Does not include expenses of the underlying funds in which the Fund invests. |
| (d) | Includes certain non-recurring expenses of 0.01% which are being excluded from the Fund’s contractual waiver, if applicable, for the year ended October 31, 2023. |
| (e) | The Fund’s portfolio turnover rate is calculated in accordance with regulatory requirements, without regard to transactions involving short-term investments, certain derivatives and in-kind transactions (if any). If such transactions were included, the Fund’s portfolio turnover rate may be higher. |
See Notes to Financial Statements.
PGIM Real Estate Income Fund 35
PGIM Real Estate Income Fund
Financial Highlights (continued)
| | | | | | | | | | | | | | | | | | | | |
| | | | | | |
Class R6 Shares | | | | | | | | | | | | | | | | | | | | |
| | | Year Ended October 31, | |
| | | 2024 | | | 2023 | | | 2022 | | | 2021 | | | 2020 | |
Per Share Operating Performance(a): | | | | | | | | | | | | | | | | | | | | |
Net Asset Value, Beginning of Year | | | $5.86 | | | | $6.19 | | | | $10.27 | | | | $7.68 | | | | $10.67 | |
Income (loss) from investment operations: | | | | | | | | | | | | | | | | | | | | |
Net investment income (loss) | | | 0.28 | | | | 0.24 | | | | 0.28 | | | | 0.27 | | | | 0.12 | |
| Net realized and unrealized gain (loss) on investment and foreign currency transactions | | | 2.21 | | | | (0.29 | ) | | | (1.93) | | | | 2.71 | | | | (2.26 | ) |
Total from investment operations | | | 2.49 | | | | (0.05 | ) | | | (1.65 | ) | | | 2.98 | | | | (2.14 | ) |
Less Dividends and Distributions: | | | | | | | | | | | | | | | | | | | | |
Dividends from net investment income | | | (0.28 | ) | | | (0.24 | ) | | | (0.31 | ) | | | (0.39 | ) | | | (0.65 | ) |
Tax return of capital distributions | | | - | | | | (0.04 | ) | | | (0.10 | ) | | | - | | | | (0.14 | ) |
Distributions from net realized gains | | | (0.01 | ) | | | - | | | | (2.02 | ) | | | - | | | | (0.06 | ) |
Total dividends and distributions | | | (0.29 | ) | | | (0.28 | ) | | | (2.43 | ) | | | (0.39 | ) | | | (0.85 | ) |
Net asset value, end of year | | | $8.06 | | | | $5.86 | | | | $6.19 | | | | $10.27 | | | | $7.68 | |
Total Return(b): | | | 42.84 | % | | | (0.98 | )% | | | (19.95 | )% | | | 39.11 | % | | | (21.03 | )% |
| | | | | | | | | | | | | | | | | | | | |
| | | | | | |
Ratios/Supplemental Data: | | | | | | | | | | | | | | | | | | | | |
Net assets, end of year (000) | | | $47,727 | | | | $28,381 | | | | $20,150 | | | | $29,642 | | | | $23,216 | |
Average net assets (000) | | | $40,162 | | | | $23,207 | | | | $24,849 | | | | $33,597 | | | | $675 | |
Ratios to average net assets(c): | | | | | | | | | | | | | | | | | | | | |
Expenses after waivers and/or expense reimbursement | | | 1.10 | % | | | 1.12 | %(d) | | | 1.10 | % | | | 1.10 | % | | | 1.10 | % |
Expenses before waivers and/or expense reimbursement | | | 1.23 | % | | | 1.49 | % | | | 1.24 | % | | | 1.15 | % | | | 3.80 | % |
Net investment income (loss) | | | 3.96 | % | | | 3.69 | % | | | 3.72 | % | | | 2.82 | % | | | 1.36 | % |
Portfolio turnover rate(e) | | | 112 | % | | | 92 | % | | | 90 | % | | | 201 | % | | | 235 | % |
| (a) | Calculated based on average shares outstanding during the year. |
| (b) | Total return is calculated assuming a purchase of a share on the first day and a sale on the last day of each year reported and includes reinvestment of dividends and distributions, if any. Total returns may reflect adjustments to conform to GAAP. |
| (c) | Does not include expenses of the underlying funds in which the Fund invests. |
| (d) | Includes certain non-recurring expenses of 0.02% which are being excluded from the Fund’s contractual waiver, if applicable, for the year ended October 31, 2023. |
| (e) | The Fund’s portfolio turnover rate is calculated in accordance with regulatory requirements, without regard to transactions involving short-term investments, certain derivatives and in-kind transactions (if any). If such transactions were included, the Fund’s portfolio turnover rate may be higher. |
See Notes to Financial Statements.
36
PGIM Select Real Estate Fund
Schedule of Investments
as of October 31, 2024
| | | | | | | | |
| Description | | Shares | | | Value | |
| | |
LONG-TERM INVESTMENTS 99.6% | | | | | | | | |
| | |
COMMON STOCKS | | | | | | | | |
| | |
Diversified REITs 7.9% | | | | | | | | |
| | |
British Land Co. PLC (The) (United Kingdom) | | | 450,831 | | | $ | 2,319,955 | |
| | |
Essential Properties Realty Trust, Inc. | | | 240,720 | | | | 7,628,416 | |
| | |
Merlin Properties Socimi SA (Spain) | | | 269,363 | | | | 3,005,634 | |
| | |
Stockland (Australia) | | | 969,657 | | | | 3,279,016 | |
| | | | | | | | |
| | |
| | | | | | | 16,233,021 | |
| | |
Health Care Providers & Services 1.2% | | | | | | | | |
| | |
Chartwell Retirement Residences (Canada), UTS | | | 227,214 | | | | 2,553,883 | |
| | |
Health Care REITs 11.3% | | | | | | | | |
| | |
American Healthcare REIT, Inc. | | | 155,444 | | | | 4,134,811 | |
| | |
CareTrust REIT, Inc. | | | 193,805 | | | | 6,331,609 | |
| | |
Welltower, Inc. | | | 95,558 | | | | 12,888,863 | |
| | | | | | | | |
| | | | | | | 23,355,283 | |
| | |
Hotel & Resort REITs 1.5% | | | | | | | | |
| | |
Invincible Investment Corp. (Japan) | | | 7,468 | | | | 3,041,856 | |
| | |
Industrial REITs 14.3% | | | | | | | | |
| | |
Americold Realty Trust, Inc. | | | 142,182 | | | | 3,651,234 | |
| | |
Frasers Logistics & Commercial Trust (Singapore) | | | 3,446,306 | | | | 2,777,310 | |
| | |
GLP J-REIT (Japan) | | | 3,675 | | | | 3,231,505 | |
| | |
Goodman Group (Australia) | | | 231,279 | | | | 5,522,826 | |
| | |
Prologis, Inc. | | | 80,395 | | | | 9,079,811 | |
| | |
STAG Industrial, Inc. | | | 88,652 | | | | 3,304,947 | |
| | |
Tritax Big Box REIT PLC (United Kingdom) | | | 1,102,847 | | | | 2,002,047 | |
| | | | | | | | |
| | |
| | | | | | | 29,569,680 | |
| | |
IT Services 0.7% | | | | | | | | |
| | |
NEXTDC Ltd. (Australia)* | | | 135,841 | | | | 1,451,065 | |
| | |
Office REITs 5.0% | | | | | | | | |
| | |
Kilroy Realty Corp. | | | 100,809 | | | | 4,054,538 | |
| | |
Nippon Building Fund, Inc. (Japan) | | | 2,595 | | | | 2,225,865 | |
| | |
SL Green Realty Corp. | | | 53,583 | | | | 4,051,411 | |
| | | | | | | | |
| | |
| | | | | | | 10,331,814 | |
See Notes to Financial Statements.
PGIM Select Real Estate Fund 37
PGIM Select Real Estate Fund
Schedule of Investments (continued)
as of October 31, 2024
| | | | | | | | |
| | |
| Description | | Shares | | | Value | |
| | |
COMMON STOCKS (Continued) | | | | | | | | |
| | |
Real Estate Management & Development 10.3% | | | | | | | | |
| | |
CapitaLand Investment Ltd. (Singapore) | | | 1,082,009 | | | $ | 2,285,841 | |
| | |
Catena AB (Sweden) | | | 41,725 | | | | 1,912,606 | |
| | |
Grainger PLC (United Kingdom) | | | 612,294 | | | | 1,799,096 | |
| | |
Mitsui Fudosan Co. Ltd. (Japan) | | | 729,625 | | | | 6,225,420 | |
| | |
Sagax AB (Sweden) (Class B Stock) | | | 69,580 | | | | 1,676,799 | |
| | |
Sun Hung Kai Properties Ltd. (Hong Kong) | | | 212,997 | | | | 2,306,324 | |
| | |
Swire Properties Ltd. (Hong Kong) | | | 324,637 | | | | 660,701 | |
| | |
Vonovia SE (Germany) | | | 131,630 | | | | 4,315,588 | |
| | | | | | | | |
| | |
| | | | | | | 21,182,375 | |
| | |
Residential REITs 9.8% | | | | | | | | |
| | |
Killam Apartment Real Estate Investment Trust (Canada) | | | 104,023 | | | | 1,397,084 | |
| | |
Sun Communities, Inc. | | | 30,037 | | | | 3,985,309 | |
| | |
UDR, Inc. | | | 160,221 | | | | 6,759,724 | |
| | |
UNITE Group PLC (The) (United Kingdom) | | | 203,494 | | | | 2,301,935 | |
| | |
Veris Residential, Inc. | | | 355,576 | | | | 5,856,337 | |
| | | | | | | | |
| | |
| | | | | | | 20,300,389 | |
| | |
Retail REITs 16.6% | | | | | | | | |
| | |
Agree Realty Corp. | | | 99,668 | | | | 7,400,349 | |
| | |
CapitaLand Integrated Commercial Trust (Singapore) | | | 94,395 | | | | 143,412 | |
| | |
Japan Metropolitan Fund Investment Corp. (Japan) | | | 2,895 | | | | 1,776,841 | |
| | |
Klepierre SA (France) | | | 105,755 | | | | 3,381,157 | |
| | |
Link REIT (Hong Kong) | | | 476,286 | | | | 2,219,216 | |
| | |
Regency Centers Corp. | | | 92,836 | | | | 6,632,204 | |
| | |
Scentre Group (Australia) | | | 1,390,524 | | | | 3,188,009 | |
| | |
Simon Property Group, Inc. | | | 56,920 | | | | 9,626,310 | |
| | | | | | | | |
| | |
| | | | | | | 34,367,498 | |
| | |
Specialized REITs 21.0% | | | | | | | | |
| | |
Digital Realty Trust, Inc. | | | 68,487 | | | | 12,206,438 | |
| | |
Equinix, Inc. | | | 14,053 | | | | 12,761,248 | |
| | |
Extra Space Storage, Inc. | | | 57,351 | | | | 9,365,419 | |
See Notes to Financial Statements.
38
PGIM Select Real Estate Fund
Schedule of Investments (continued)
as of October 31, 2024
| | | | | | | | |
| | |
| Description | | Shares | | | Value | |
| | |
COMMON STOCKS (Continued) | | | | | | | | |
| | |
Specialized REITs (cont’d.) | | | | | | | | |
| | |
Iron Mountain, Inc. | | | 54,900 | | | $ | 6,792,777 | |
| | |
Shurgard Self Storage Ltd. (Belgium) | | | 52,493 | | | | 2,247,968 | |
| | | | | | | | |
| | |
| | | | | | | 43,373,850 | |
| | | | | | | | |
| | |
TOTAL LONG-TERM INVESTMENTS
(cost $175,049,737) | | | | | | | 205,760,714 | |
| | | | | | | | |
| | |
SHORT-TERM INVESTMENT 0.4% | | | | | | | | |
| | |
AFFILIATED MUTUAL FUND | | | | | | | | |
PGIM Core Government Money Market Fund (7-day effective yield 5.011%)
(cost $847,274)(wb) | | | 847,274 | | | | 847,274 | |
| | | | | | | | |
| | |
TOTAL INVESTMENTS 100.0%
(cost $175,897,011) | | | | | | | 206,607,988 | |
| | |
Other assets in excess of liabilities 0.0% | | | | | | | 19,792 | |
| | | | | | | | |
| | |
NET ASSETS 100.0% | | | | | | $ | 206,627,780 | |
| | | | | | | | |
See the Glossary for a list of the abbreviation(s) used in the annual report.
| * | Non-income producing security. |
| (wb) | Represents an investment in a Fund affiliated with the Manager. |
Fair Value Measurements:
Various inputs are used in determining the value of the Fund’s investments. These inputs are summarized in the three broad levels listed below.
Level 1—unadjusted quoted prices generally in active markets for identical securities.
Level 2—quoted prices for similar securities, interest rates and yield curves, prepayment speeds, foreign currency exchange rates and other observable inputs.
Level 3—unobservable inputs for securities valued in accordance with Board approved fair valuation procedures.
The following is a summary of the inputs used as of October 31, 2024 in valuing such portfolio securities:
| | | | | | | | | | | | |
| | | Level 1 | | | Level 2 | | | Level 3 | |
Investments in Securities | | | | | | | | | | | | |
Assets | | | | | | | | | | | | |
Long-Term Investments | | | | | | | | | | | | |
Common Stocks | | | | | | | | | | | | |
Australia | | $ | — | | | $ | 13,440,916 | | | $ | — | |
See Notes to Financial Statements.
PGIM Select Real Estate Fund 39
PGIM Select Real Estate Fund
Schedule of Investments (continued)
as of October 31, 2024
| | | | | | | | | | | | |
| | | Level 1 | | | Level 2 | | | Level 3 | |
Investments in Securities (continued) | | | | | | | | | | | | |
Assets (continued) | | | | | | | | | | | | |
Long-Term Investments (continued) | | | | | | | | | | | | |
Common Stocks (continued) | | | | | | | | | | | | |
Belgium | | $ | — | | | $ | 2,247,968 | | | $ | — | |
Canada | | | 3,950,967 | | | | — | | | | — | |
France | | | — | | | | 3,381,157 | | | | — | |
Germany | | | — | | | | 4,315,588 | | | | — | |
Hong Kong | | | — | | | | 5,186,241 | | | | — | |
Japan | | | — | | | | 16,501,488 | | | | — | |
Singapore | | | — | | | | 5,206,563 | | | | — | |
Spain | | | — | | | | 3,005,634 | | | | — | |
Sweden | | | — | | | | 3,589,405 | | | | — | |
United Kingdom | | | — | | | | 8,423,033 | | | | — | |
United States | | | 136,511,754 | | | | — | | | | — | |
Short-Term Investment | | | | | | | | | | | | |
Affiliated Mutual Fund | | | 847,274 | | | | — | | | | — | |
| | | | | | | | | | | | |
Total | | $ | 141,309,995 | | | $ | 65,297,993 | | | $ | — | |
| | | | | | | | | | | | |
Country Allocation:
The country allocation of portfolio holdings and other assets in excess of liabilities shown as a percentage of net assets as of October 31, 2024 were as follows:
| | | | |
United States | | | 66.4 | % |
Japan | | | 8.0 | |
Australia | | | 6.5 | |
United Kingdom | | | 4.1 | |
Singapore | | | 2.5 | |
Hong Kong | | | 2.5 | |
Germany | | | 2.1 | |
Canada | | | 2.0 | |
Sweden | | | 1.7 | |
France | | | 1.6 | |
| | | | |
Spain | | | 1.5 | % |
Belgium | | | 1.1 | |
| | | | |
| | | 100.0 | |
Other assets in excess of liabilities | | | 0.0 | * |
| | | | |
| | | 100.0 | % |
| | | | |
See Notes to Financial Statements.
40
PGIM Select Real Estate Fund
Statement of Assets & Liabilities
as of October 31, 2024
| | | | |
| |
Assets | | | | |
Investments at value: | | | | |
Unaffiliated investments (cost $175,049,737) | | $ | 205,760,714 | |
Affiliated investments (cost $847,274) | | | 847,274 | |
Foreign currency, at value (cost $9) | | | 9 | |
Receivable for investments sold | | | 2,064,383 | |
Tax reclaim receivable | | | 327,593 | |
Dividends receivable | | | 237,652 | |
Receivable for Fund shares sold | | | 196,387 | |
Prepaid expenses | | | 7,254 | |
| | | | |
| |
Total Assets | | | 209,441,266 | |
| | | | |
| |
Liabilities | | | | |
Payable for investments purchased | | | 2,343,477 | |
Payable for Fund shares purchased | | | 232,601 | |
Management fee payable | | | 140,003 | |
Accrued expenses and other liabilities | | | 92,829 | |
Distribution fee payable | | | 2,078 | |
Affiliated transfer agent fee payable | | | 1,367 | |
Trustees’ fees payable | | | 1,131 | |
| | | | |
| |
Total Liabilities | | | 2,813,486 | |
| | | | |
| |
Net Assets | | $ | 206,627,780 | |
| | | | |
| |
| | | | | |
Net assets were comprised of: | | | | |
Shares of beneficial interest, at par | | $ | 15,046 | |
Paid-in capital in excess of par | | | 235,648,652 | |
Total distributable earnings (loss) | | | (29,035,918 | ) |
| | | | |
| |
Net assets, October 31, 2024 | | $ | 206,627,780 | |
| | | | |
See Notes to Financial Statements.
PGIM Select Real Estate Fund 41
PGIM Select Real Estate Fund
Statement of Assets & Liabilities (continued)
as of October 31, 2024
| | | | | | | | |
| | |
Class A | | | | | | | | |
Net asset value and redemption price per share, | | | | | | | | |
($3,311,581 ÷ 240,923 shares of beneficial interest issued and outstanding) | | $ | 13.75 | | | | | |
Maximum sales charge (5.50% of offering price) | | | 0.80 | | | | | |
| | | | | | | | |
Maximum offering price to public | | $ | 14.55 | | | | | |
| | | | | | | | |
| | |
Class C | | | | | | | | |
Net asset value, offering price and redemption price per share, | | | | | | | | |
($1,592,272 ÷ 117,495 shares of beneficial interest issued and outstanding) | | $ | 13.55 | | | | | |
| | | | | | | | |
| | |
Class Z | | | | | | | | |
Net asset value, offering price and redemption price per share, | | | | | | | | |
($174,960,209 ÷ 12,707,401 shares of beneficial interest issued and outstanding) | | $ | 13.77 | | | | | |
| | | | | | | | |
| | |
Class R6 | | | | | | | | |
Net asset value, offering price and redemption price per share, | | | | | | | | |
($26,763,718 ÷ 1,980,140 shares of beneficial interest issued and outstanding) | | $ | 13.52 | | | | | |
| | | | | | | | |
See Notes to Financial Statements.
42
PGIM Select Real Estate Fund
Statement of Operations
Year Ended October 31, 2024
| | | | |
Net Investment Income (Loss) | |
Income | | | | |
Unaffiliated dividend income (net of $232,751 foreign withholding tax) | | $ | 5,789,613 | |
Affiliated dividend income | | | 62,492 | |
Income from securities lending, net (including affiliated income of $2,703) | | | 3,974 | |
| | | | |
| |
Total income | | | 5,856,079 | |
| | | | |
| |
Expenses | | | | |
Management fee | | | 1,457,426 | |
Distribution fee(a) | | | 32,940 | |
Transfer agent’s fees and expenses (including affiliated expense of $8,232)(a) | | | 204,429 | |
Custodian and accounting fees | | | 68,144 | |
Registration fees(a) | | | 65,443 | |
Professional fees | | | 42,671 | |
Audit fee | | | 35,616 | |
Shareholders’ reports | | | 33,347 | |
Trustees’ fees | | | 11,797 | |
Miscellaneous | | | 96,022 | |
| | | | |
| |
Total expenses | | | 2,047,835 | |
Less: Fee waiver and/or expense reimbursement(a) | | | (83,662 | ) |
Distribution fee waiver(a) | | | (2,826 | ) |
| | | | |
| |
Net expenses | | | 1,961,347 | |
| | | | |
Net investment income (loss) | | | 3,894,732 | |
| | | | |
Realized And Unrealized Gain (Loss) On Investment And Foreign Currency Transactions | |
Net realized gain (loss) on: | | | | |
Investment transactions (including affiliated of $(960)) | | | 11,952,557 | |
Foreign currency transactions | | | (14,587 | ) |
| | | | |
| |
| | | 11,937,970 | |
| | | | |
Net change in unrealized appreciation (depreciation) on: | | | | |
Investments | | | 35,984,272 | |
Foreign currencies | | | (3,236 | ) |
| | | | |
| |
| | | 35,981,036 | |
| | | | |
Net gain (loss) on investment and foreign currency transactions | | | 47,919,006 | |
| | | | |
| |
Net Increase (Decrease) In Net Assets Resulting From Operations | | $ | 51,813,738 | |
| | | | |
| (a) | Class specific expenses and waivers were as follows: |
| | | | | | | | | | | | | | | | |
| | | Class A | | | Class C | | | Class Z | | | Class R6 | |
Distribution fee | | | 16,959 | | | | 15,981 | | | | — | | | | — | |
Transfer agent’s fees and expenses | | | 8,911 | | | | 2,705 | | | | 188,850 | | | | 3,963 | |
Registration fees | | | 12,062 | | | | 9,882 | | | | 26,022 | | | | 17,477 | |
Fee waiver and/or expense reimbursement | | | (15,482 | ) | | | (10,953 | ) | | | (57,227 | ) | | | — | |
Distribution fee waiver | | | (2,826 | ) | | | — | | | | — | | | | — | |
See Notes to Financial Statements.
PGIM Select Real Estate Fund 43
PGIM Select Real Estate Fund
Statements of Changes in Net Assets
| | | | | | | | |
| |
| | | Year Ended
October 31, | |
| | |
| | | 2024 | | | 2023 | |
| | |
Increase (Decrease) in Net Assets | | | | | | | | |
| | |
Operations | | | | | | | | |
Net investment income (loss) | | $ | 3,894,732 | | | $ | 4,804,590 | |
Net realized gain (loss) on investment and foreign currency transactions | | | 11,937,970 | | | | (29,329,278 | ) |
Net change in unrealized appreciation (depreciation) on investments and foreign currencies | | | 35,981,036 | | | | 31,047,926 | |
| | | | | | | | |
Net increase (decrease) in net assets resulting from operations | | | 51,813,738 | | | | 6,523,238 | |
| | | | | | | | |
| | |
Dividends and Distributions | | | | | | | | |
Distributions from distributable earnings | | | | | | | | |
Class A | | | (146,453 | ) | | | (171,028 | ) |
Class C | | | (31,688 | ) | | | (21,353 | ) |
Class Z | | | (4,023,109 | ) | | | (3,811,369 | ) |
Class R6 | | | (721,679 | ) | | | (1,011,529 | ) |
| | | | | | | | |
| | | (4,922,929 | ) | | | (5,015,279 | ) |
| | | | | | | | |
| | |
Fund share transactions (Net of share conversions) | | | | | | | | |
Net proceeds from shares sold | | | 73,538,206 | | | | 96,110,698 | |
Net asset value of shares issued in reinvestment of dividends and distributions | | | 4,913,737 | | | | 5,008,295 | |
Cost of shares purchased | | | (92,467,650 | ) | | | (188,872,508 | ) |
| | | | | | | | |
Net increase (decrease) in net assets from Fund share transactions | | | (14,015,707 | ) | | | (87,753,515 | ) |
| | | | | | | | |
Total increase (decrease) | | | 32,875,102 | | | | (86,245,556 | ) |
| | |
Net Assets: | | | | | | | | |
Beginning of year | | | 173,752,678 | | | | 259,998,234 | |
| | | | | | | | |
End of year | | $ | 206,627,780 | | | $ | 173,752,678 | |
| | | | | | | | |
See Notes to Financial Statements.
44
PGIM Select Real Estate Fund
Financial Highlights
| | | | | | | | | | | | | | | | | | | | |
| | | | | | |
Class A Shares | | | | | | | | | | | | | | | | | | | | |
| | | Year Ended October 31, | |
| | |
| | | 2024 | | | 2023 | | | 2022 | | | 2021 | | | 2020 | |
Per Share Operating Performance(a): | | | | | | | | | | | | | | | | | | | | |
Net Asset Value, Beginning of Year | | | $10.57 | | | | $10.84 | | | | $15.54 | | | | $11.48 | | | | $13.18 | |
Income (loss) from investment operations: | | | | | | | | | | | | | | | | | | | | |
Net investment income (loss) | | | 0.24 | | | | 0.20 | (b) | | | 0.14 | | | | 0.10 | | | | 0.15 | |
Net realized and unrealized gain (loss) on investment and foreign currency transactions | | | 3.26 | | | | (0.25 | )(c) | | | (4.12 | ) | | | 4.18 | | | | (1.16 | ) |
Total from investment operations | | | 3.50 | | | | (0.05 | ) | | | (3.98 | ) | | | 4.28 | | | | (1.01 | ) |
Less Dividends and Distributions: | | | | | | | | | | | | | | | | | | | | |
Dividends from net investment income | | | (0.32 | ) | | | (0.22 | ) | | | (0.22 | ) | | | (0.22 | ) | | | (0.43 | ) |
Tax return of capital distributions | | | - | | | | - | | | | (0.04 | ) | | | - | | | | - | |
Distributions from net realized gains | | | - | | | | - | | | | (0.46 | ) | | | - | | | | (0.26 | ) |
Total dividends and distributions | | | (0.32 | ) | | | (0.22 | ) | | | (0.72 | ) | | | (0.22 | ) | | | (0.69 | ) |
Net asset value, end of year | | | $13.75 | | | | $10.57 | | | | $10.84 | | | | $15.54 | | | | $11.48 | |
Total Return(d): | | | 33.31 | % | | | (0.62 | )% | | | (26.71 | )% | | | 37.61 | % | | | (7.90 | )% |
| | | | | | | | | | | | | | | | | | | | | |
| | | | | | |
Ratios/Supplemental Data: | | | | | | | | | | | | | | | | | | | | |
Net assets, end of year (000) | | | $3,312 | | | | $5,278 | | | | $10,982 | | | | $6,733 | | | | $3,878 | |
Average net assets (000) | | | $5,653 | | | | $9,796 | | | | $11,632 | | | | $4,803 | | | | $4,534 | |
Ratios to average net assets(e): | | | | | | | | | | | | | | | | | | | | |
Expenses after waivers and/or expense reimbursement | | | 1.31 | %(f) | | | 1.32 | %(f) | | | 1.30 | % | | | 1.30 | % | | | 1.30 | % |
Expenses before waivers and/or expense reimbursement | | | 1.63 | % | | | 1.43 | % | | | 1.44 | % | | | 1.57 | % | | | 2.11 | % |
Net investment income (loss) | | | 1.94 | % | | | 1.73 | % | | | 1.05 | % | | | 0.74 | % | | | 1.26 | % |
Portfolio turnover rate(g) | | | 142 | % | | | 121 | % | | | 137 | % | | | 165 | % | | | 313 | % |
| (a) | Calculated based on average shares outstanding during the year. |
| (b) | The per share amount of net investment income (loss) does not directly correlate to the amounts reported in the Statement of Operations due to class specific expenses. |
| (c) | The per share amount of realized and unrealized gain (loss) on investments does not directly correlate to the amounts reported in the Statement of Operations due to the timing of portfolio share transactions in relation to fluctuating market values. |
| (d) | Total return does not consider the effects of sales loads. Total return is calculated assuming a purchase of a share on the first day and a sale on the last day of each year reported and includes reinvestment of dividends and distributions, if any. Total returns may reflect adjustments to conform to GAAP. |
| (e) | Does not include expenses of the underlying funds in which the Fund invests. |
| (f) | Includes interest expense on borrowings from the Syndicated Credit Agreement and certain non-recurring expenses of 0.01% and 0.02% which are being excluded from the Fund’s contractual waiver, if applicable, for the years ended October 31, 2024 and 2023, respectively. |
| (g) | The Fund’s portfolio turnover rate is calculated in accordance with regulatory requirements, without regard to transactions involving short-term investments, certain derivatives and in-kind transactions (if any). If such transactions were included, the Fund’s portfolio turnover rate may be higher. |
See Notes to Financial Statements.
PGIM Select Real Estate Fund 45
PGIM Select Real Estate Fund
Financial Highlights (continued)
| | | | | | | | | | | | | | | | | | | | |
| | | | | | |
Class C Shares | | | | | | | | | | | | | | | | | | | | |
| | | Year Ended October 31, | |
| | | 2024 | | | 2023 | | | 2022 | | | 2021 | | | 2020 | |
Per Share Operating Performance(a): | | | | | | | | | | | | | | | | | | | | |
Net Asset Value, Beginning of Year | | | $10.43 | | | | $10.69 | | | | $15.33 | | | | $11.35 | | | | $13.03 | |
Income (loss) from investment operations: | | | | | | | | | | | | | | | | | | | | |
Net investment income (loss) | | | 0.14 | | | | 0.11 | (b) | | | 0.03 | | | | (0.01 | )(b) | | | 0.06 | |
Net realized and unrealized gain (loss) on investment and foreign currency transactions | | | 3.21 | | | | (0.24 | )(c) | | | (4.05 | ) | | | 4.12 | | | | (1.13 | ) |
Total from investment operations | | | 3.35 | | | | (0.13 | ) | | | (4.02 | ) | | | 4.11 | | | | (1.07 | ) |
Less Dividends and Distributions: | | | | | | | | | | | | | | | | | | | | |
Dividends from net investment income | | | (0.23 | ) | | | (0.13 | ) | | | (0.12 | ) | | | (0.13 | ) | | | (0.35 | ) |
Tax return of capital distributions | | | - | | | | - | | | | (0.04 | ) | | | - | | | | - | |
Distributions from net realized gains | | | - | | | | - | | | | (0.46 | ) | | | - | | | | (0.26 | ) |
Total dividends and distributions | | | (0.23 | ) | | | (0.13 | ) | | | (0.62 | ) | | | (0.13 | ) | | | (0.61 | ) |
Net asset value, end of year | | | $13.55 | | | | $10.43 | | | | $10.69 | | | | $15.33 | | | | $11.35 | |
Total Return(d): | | | 32.33 | % | | | (1.30 | )% | | | (27.25 | )% | | | 36.64 | % | | | (8.60 | )% |
| | | | | | | | | | | | | | | | | | | | | |
| | | | | | |
Ratios/Supplemental Data: | | | | | | | | | | | | | | | | | | | | |
Net assets, end of year (000) | | | $1,592 | | | | $1,617 | | | | $1,754 | | | | $1,636 | | | | $605 | |
Average net assets (000) | | | $1,598 | | | | $1,880 | | | | $2,168 | | | | $1,021 | | | | $532 | |
Ratios to average net assets(e): | | | | | | | | | | | | | | | | | | | | |
Expenses after waivers and/or expense reimbursement | | | 2.07 | %(f) | | | 2.07 | %(f) | | | 2.05 | % | | | 2.05 | % | | | 2.05 | % |
Expenses before waivers and/or expense reimbursement | | | 2.76 | % | | | 2.48 | % | | | 2.56 | % | | | 2.95 | % | | | 5.31 | % |
Net investment income (loss) | | | 1.17 | % | | | 0.96 | % | | | 0.26 | % | | | (0.06 | )% | | | 0.55 | % |
Portfolio turnover rate(g) | | | 142 | % | | | 121 | % | | | 137 | % | | | 165 | % | | | 313 | % |
| (a) | Calculated based on average shares outstanding during the year. |
| (b) | The per share amount of net investment income (loss) does not directly correlate to the amounts reported in the Statement of Operations due to class specific expenses. |
| (c) | The per share amount of realized and unrealized gain (loss) on investments does not directly correlate to the amounts reported in the Statement of Operations due to the timing of portfolio share transactions in relation to fluctuating market values. |
| (d) | Total return does not consider the effects of sales loads. Total return is calculated assuming a purchase of a share on the first day and a sale on the last day of each year reported and includes reinvestment of dividends and distributions, if any. Total returns may reflect adjustments to conform to GAAP. |
| (e) | Does not include expenses of the underlying funds in which the Fund invests. |
| (f) | Includes interest expense on borrowings from the Syndicated Credit Agreement and certain non-recurring expenses of 0.02% and 0.02% which are being excluded from the Fund’s contractual waiver, if applicable, for the years ended October 31, 2024 and 2023, respectively. |
| (g) | The Fund’s portfolio turnover rate is calculated in accordance with regulatory requirements, without regard to transactions involving short-term investments, certain derivatives and in-kind transactions (if any). If such transactions were included, the Fund’s portfolio turnover rate may be higher. |
See Notes to Financial Statements.
46
PGIM Select Real Estate Fund
Financial Highlights (continued)
| | | | | | | | | | | | | | | | | | | | |
| | | | | | |
Class Z Shares | | | | | | | | | | | | | | | | | | | | |
| | | Year Ended October 31, | |
| | |
| | | 2024 | | | 2023 | | | 2022 | | | 2021 | | | 2020 | |
Per Share Operating Performance(a): | | | | | | | | | | | | | | | | | | | | |
Net Asset Value, Beginning of Year | | | $10.58 | | | | $10.86 | | | | $15.56 | | | | $11.49 | | | | $13.20 | |
Income (loss) from investment operations: | | | | | | | | | | | | | | | | | | | | |
Net investment income (loss) | | | 0.27 | | | | 0.23 | (b) | | | 0.18 | | | | 0.13 | | | | 0.16 | |
Net realized and unrealized gain (loss) on investment and foreign currency transactions | | | 3.27 | | | | (0.26 | )(c) | | | (4.12 | ) | | | 4.19 | | | | (1.15 | ) |
Total from investment operations | | | 3.54 | | | | (0.03 | ) | | | (3.94 | ) | | | 4.32 | | | | (0.99 | ) |
Less Dividends and Distributions: | | | | | | | | | | | | | | | | | | | | |
Dividends from net investment income | | | (0.35 | ) | | | (0.25 | ) | | | (0.26 | ) | | | (0.25 | ) | | | (0.46 | ) |
Tax return of capital distributions | | | - | | | | - | | | | (0.04 | ) | | | - | | | | - | |
Distributions from net realized gains | | | - | | | | - | | | | (0.46 | ) | | | - | | | | (0.26 | ) |
Total dividends and distributions | | | (0.35 | ) | | | (0.25 | ) | | | (0.76 | ) | | | (0.25 | ) | | | (0.72 | ) |
Net asset value, end of year | | | $13.77 | | | | $10.58 | | | | $10.86 | | | | $15.56 | | | | $11.49 | |
Total Return(d): | | | 33.56 | % | | | (0.37 | )% | | | (26.46 | )% | | | 38.04 | % | | | (7.73 | )% |
| | | | | | | | | | | | | | | | | | | | | |
| | | | | | |
Ratios/Supplemental Data: | | | | | | | | | | | | | | | | | | | | |
Net assets, end of year (000) | | | $174,960 | | | | $147,176 | | | | $171,629 | | | | $226,286 | | | | $29,056 | |
Average net assets (000) | | | $149,439 | | | | $177,323 | | | | $235,834 | | | | $126,992 | | | | $14,227 | |
Ratios to average net assets(e): | | | | | | | | | | | | | | | | | | | | |
Expenses after waivers and/or expense reimbursement | | | 1.06 | %(f) | | | 1.07 | %(f) | | | 1.01 | % | | | 1.04 | % | | | 1.05 | % |
Expenses before waivers and/or expense reimbursement | | | 1.10 | % | | | 1.07 | % | | | 1.01 | % | | | 1.04 | % | | | 1.61 | % |
Net investment income (loss) | | | 2.15 | % | | | 1.97 | % | | | 1.29 | % | | | 0.92 | % | | | 1.40 | % |
Portfolio turnover rate(g) | | | 142 | % | | | 121 | % | | | 137 | % | | | 165 | % | | | 313 | % |
| (a) | Calculated based on average shares outstanding during the year. |
| (b) | The per share amount of net investment income (loss) does not directly correlate to the amounts reported in the Statement of Operations due to class specific expenses. |
| (c) | The per share amount of realized and unrealized gain (loss) on investments does not directly correlate to the amounts reported in the Statement of Operations due to the timing of portfolio share transactions in relation to fluctuating market values. |
| (d) | Total return is calculated assuming a purchase of a share on the first day and a sale on the last day of each year reported and includes reinvestment of dividends and distributions, if any. Total returns may reflect adjustments to conform to GAAP. |
| (e) | Does not include expenses of the underlying funds in which the Fund invests. |
| (f) | Includes interest expense on borrowings from the Syndicated Credit Agreement and certain non-recurring expenses of 0.01% and 0.02% which are being excluded from the Fund’s contractual waiver, if applicable, for the years ended October 31, 2024 and 2023, respectively. |
| (g) | The Fund’s portfolio turnover rate is calculated in accordance with regulatory requirements, without regard to transactions involving short-term investments, certain derivatives and in-kind transactions (if any). If such transactions were included, the Fund’s portfolio turnover rate may be higher. |
See Notes to Financial Statements.
PGIM Select Real Estate Fund 47
PGIM Select Real Estate Fund
Financial Highlights (continued)
| | | | | | | | | | | | | | | | | | | | |
| | | | | | |
Class R6 Shares | | | | | | | | | | | | | | | | | | | | |
| | | Year Ended October 31, | |
| | | 2024 | | | 2023 | | | 2022 | | | 2021 | | | 2020 | |
Per Share Operating Performance(a): | | | | | | | | | | | | | | | | | | | | |
Net Asset Value, Beginning of Year | | | $10.40 | | | | $10.67 | | | | $15.31 | | | | $11.31 | | | | $13.00 | |
Income (loss) from investment operations: | | | | | | | | | | | | | | | | | | | | |
Net investment income (loss) | | | 0.27 | | | | 0.24 | (b) | | | 0.19 | | | | 0.15 | | | | 0.18 | |
Net realized and unrealized gain (loss) on investment and foreign currency transactions | | | 3.20 | | | | (0.25 | )(c) | | | (4.06 | ) | | | 4.11 | | | | (1.15 | ) |
Total from investment operations | | | 3.47 | | | | (0.01 | ) | | | (3.87 | ) | | | 4.26 | | | | (0.97 | ) |
Less Dividends and Distributions: | | | | | | | | | | | | | | | | | | | | |
Dividends from net investment income | | | (0.35 | ) | | | (0.26 | ) | | | (0.27 | ) | | | (0.26 | ) | | | (0.46 | ) |
Tax return of capital distributions | | | - | | | | - | | | | (0.04 | ) | | | - | | | | - | |
Distributions from net realized gains | | | - | | | | - | | | | (0.46 | ) | | | - | | | | (0.26 | ) |
Total dividends and distributions | | | (0.35 | ) | | | (0.26 | ) | | | (0.77 | ) | | | (0.26 | ) | | | (0.72 | ) |
Net asset value, end of year | | | $13.52 | | | | $10.40 | | | | $10.67 | | | | $15.31 | | | | $11.31 | |
Total Return(d): | | | 33.63 | % | | | (0.27 | )% | | | (26.39 | )% | | | 38.10 | % | | | (7.70 | )% |
| | | | | | | | | | | | | | | | | | | | | |
| | | | | | |
Ratios/Supplemental Data: | | | | | | | | | | | | | | | | | | | | |
Net assets, end of year (000) | | | $26,764 | | | | $19,682 | | | | $75,634 | | | | $93,853 | | | | $15,686 | |
Average net assets (000) | | | $25,488 | | | | $53,351 | | | | $92,466 | | | | $57,833 | | | | $16,060 | |
Ratios to average net assets(e): | | | | | | | | | | | | | | | | | | | | |
Expenses after waivers and/or expense reimbursement | | | 1.04 | %(f) | | | 0.93 | % | | | 0.89 | % | | | 0.94 | % | | | 1.05 | % |
Expenses before waivers and/or expense reimbursement | | | 1.04 | % | | | 0.93 | % | | | 0.89 | % | | | 0.94 | % | | | 1.42 | % |
Net investment income (loss) | | | 2.19 | % | | | 2.11 | % | | | 1.40 | % | | | 1.06 | % | | | 1.56 | % |
Portfolio turnover rate(g) | | | 142 | % | | | 121 | % | | | 137 | % | | | 165 | % | | | 313 | % |
| (a) | Calculated based on average shares outstanding during the year. |
| (b) | The per share amount of net investment income (loss) does not directly correlate to the amounts reported in the Statement of Operations due to class specific expenses. |
| (c) | The per share amount of realized and unrealized gain (loss) on investments does not directly correlate to the amounts reported in the Statement of Operations due to the timing of portfolio share transactions in relation to fluctuating market values. |
| (d) | Total return is calculated assuming a purchase of a share on the first day and a sale on the last day of each year reported and includes reinvestment of dividends and distributions, if any. Total returns may reflect adjustments to conform to GAAP. |
| (e) | Does not include expenses of the underlying funds in which the Fund invests. |
| (f) | Includes interest expense on borrowings from the Syndicated Credit Agreement and certain non-recurring expenses of 0.01% which are being excluded from the Fund’s contractual waiver, if applicable, for the year ended October 31, 2024. |
| (g) | The Fund’s portfolio turnover rate is calculated in accordance with regulatory requirements, without regard to transactions involving short-term investments, certain derivatives and in-kind transactions (if any). If such transactions were included, the Fund’s portfolio turnover rate may be higher. |
See Notes to Financial Statements.
48
Notes to Financial Statements
Prudential Investment Portfolios 9 (the “Registered Investment Company” or “RIC”) is registered under the Investment Company Act of 1940, as amended (“1940 Act”), as an open-end management investment company. The RIC is organized as a Delaware Statutory Trust. These financial statements relate to the following series of the RIC: PGIM Quant Solutions Large-Cap Core Fund, PGIM Real Estate Income Fund and PGIM Select Real Estate Fund (each, a “Fund” and collectively, the “Funds”). Each Portfolio is a diversified portfolio for purposes of the 1940 Act, except for PGIM Real Estate Income Fund, which is a non-diversified portfolio for purposes of the 1940 Act.
| | | | |
| | | |
Fund | | | | Investment Objective(s) |
PGIM Quant Solutions Large-Cap Core Fund (“Quant Solutions Large-Cap Core”) | | | | To seek long-term growth of capital |
PGIM Real Estate Income Fund (“Real Estate Income”) | | | | To seek income and capital appreciation |
PGIM Select Real Estate Fund (“Select Real Estate”) | | | | To seek income and capital appreciation |
The Funds follow the investment company accounting and reporting guidance of the Financial Accounting Standards Board (“FASB”) Accounting Standard Codification (“ASC”) Topic 946 Financial Services — Investment Companies. The following is a summary of significant accounting policies followed by the Funds in the preparation of their financial statements. The policies conform to U.S. generally accepted accounting principles (“GAAP”). The Funds consistently follow such policies in the preparation of their financial statements.
Securities Valuation: The Funds hold securities and other assets and liabilities that are fair valued as of the close of each day (generally, 4:00 PM Eastern time) the New York Stock Exchange (“NYSE”) is open for trading. As described in further detail below, the Funds’ investments are valued daily based on a number of factors, including the type of investment and whether market quotations are readily available. The RIC’s Board of Trustees (the “Board”) has approved the Funds’ valuation policies and procedures for security valuation and designated PGIM Investments LLC (“PGIM Investments” or the “Manager”) as the “Valuation Designee,” as defined by Rule 2a-5(b) under the 1940 Act, to perform the fair value determination relating to all Funds investments. Pursuant to the Board’s oversight, the Valuation Designee has established a Valuation Committee to perform the duties and responsibilities of the Valuation Designee under Rule 2a-5. The valuation procedures permit
49
Notes to Financial Statements (continued)
the Funds to utilize independent pricing vendor services, quotations from market makers, and alternative valuation methods when market quotations are either not readily available or not deemed representative of fair value. Fair value is the estimated price that would be received to sell an asset or paid to transfer a liability in an orderly transaction between market participants on the measurement date.
For the fiscal reporting year-end, securities and other assets and liabilities were fair valued at the close of the last U.S. business day. Trading in certain foreign securities may occur when the NYSE is closed (including weekends and holidays). Because such foreign securities trade in markets that are open on weekends and U.S. holidays, the values of some of the Funds’ foreign investments may change on days when investors cannot purchase or redeem Fund shares.
Various inputs determine how the Funds’ investments are valued, all of which are categorized according to the three broad levels (Level 1, 2, or 3) detailed in the Schedule of Investments and referred to herein as the “fair value hierarchy” in accordance with FASB ASC Topic 820 Fair Value Measurement.
Common or preferred stocks, exchange-traded funds (“ETFs”) and derivative instruments, if applicable, that are traded on a national securities exchange are valued at the last sale price as of the close of trading on the applicable exchange where the security principally trades. Securities traded via NASDAQ are valued at the NASDAQ official closing price. To the extent these securities are valued at the last sale price or NASDAQ official closing price, they are classified as Level 1 in the fair value hierarchy. In the event that no sale or official closing price on a valuation date exists, these securities are generally valued at the mean between the last reported bid and ask prices, or at the last bid price in the absence of an ask price. These securities are classified as Level 2 in the fair value hierarchy.
Foreign equities traded on foreign securities exchanges are generally valued using pricing vendor services that provide model prices derived using adjustment factors based on information such as local closing price, relevant general and sector indices, currency fluctuations, depositary receipts, and futures, as applicable. Securities valued using such model prices are classified as Level 2 in the fair value hierarchy. The models generate an evaluated adjustment factor for each security, which is applied to the local closing price to adjust it for post closing market movements up to the time each Fund is valued. Utilizing that evaluated adjustment factor, the vendor provides an evaluated price for each security. If the vendor does not provide an evaluated price, securities are valued in accordance with exchange-traded common and preferred stock valuation policies discussed above.
Investments in open-end funds (other than ETFs) are valued at their net asset values as of the close of the NYSE on the date of valuation. These securities are classified as Level 1 in
50
the fair value hierarchy since they may be purchased or sold at their net asset values on the date of valuation.
Securities and other assets that cannot be priced according to the methods described above are valued based on policies and procedures approved by the Board. In the event that unobservable inputs are used when determining such valuations, the securities will be classified as Level 3 in the fair value hierarchy. Altering one or more unobservable inputs may result in a significant change to a Level 3 security’s fair value measurement.
When determining the fair value of securities, some of the factors influencing the valuation include: the nature of any restrictions on disposition of the securities; assessment of the general liquidity of the securities; the issuer’s financial condition and the markets in which it does business; the cost of the investment; the size of the holding and the capitalization of the issuer; the prices of any recent transactions or bids/offers for such securities or any comparable securities; and any available analyst media or other reports or information deemed reliable by the Valuation Designee regarding the issuer or the markets or industry in which it operates. Using fair value to price securities may result in a value that is different from a security’s most recent closing price and from the price used by other unaffiliated mutual funds to calculate their net asset values.
Foreign Currency Translation: The books and records of the Funds are maintained in U.S. dollars. Foreign currency amounts are translated into U.S. dollars on the following basis:
(i) market value of investment securities, other assets and liabilities — at the exchange rate as of the valuation date;
(ii) purchases and sales of investment securities, income and expenses — at the rates of exchange prevailing on the respective dates of such transactions.
Although the net assets of the Funds are presented at the foreign exchange rates and market values at the close of the period, the Funds do not generally isolate that portion of the results of operations arising as a result of changes in the foreign exchange rates from the fluctuations arising from changes in the market prices of long-term portfolio securities held at the end of the period. Similarly, the Funds do not isolate the effect of changes in foreign exchange rates from the fluctuations arising from changes in the market prices of long-term portfolio securities sold during the period. Accordingly, holding period unrealized and realized foreign currency gains (losses) are included in the reported net change in unrealized appreciation (depreciation) on investments and net realized gains (losses) on investment transactions on the Statements of Operations.
Additionally, net realized gains (losses) on foreign currency transactions represent net foreign exchange gains (losses) from the disposition of holdings of foreign currencies, currency gains (losses) realized between the trade and settlement dates on investment transactions, and the difference between the amounts of interest, dividends and foreign withholding taxes recorded on the Funds’ books and the U.S. dollar equivalent amounts
51
Notes to Financial Statements (continued)
actually received or paid. Net unrealized currency gains (losses) arise from valuing foreign currency denominated assets and liabilities (other than investments) at period end exchange rates.
Financial Futures Contracts: A financial futures contract is an agreement to purchase (long) or sell (short) an agreed amount of securities at a set price for delivery on a future date. Upon entering into a financial futures contract, the Funds are required to pledge to the broker an amount of cash and/or other assets equal to a certain percentage of the contract amount. This amount is known as the “initial margin.” Subsequent payments, known as “variation margin,” are made or received by the Funds each day, depending on the daily fluctuations in the value of the underlying security. Such variation margin is recorded for financial statement purposes on a daily basis as unrealized gain (loss). When the contract expires or is closed, the gain (loss) is realized and is presented in the Statement of Operations as net realized gain (loss) on futures transactions.
The Funds invested in financial futures contracts in order to hedge their existing portfolio securities, or securities the Funds intend to purchase, against fluctuations in value caused by changes in prevailing interest rates. Should interest rates move unexpectedly, the Funds may not achieve the anticipated benefits of the financial futures contracts and may realize a loss. The use of futures transactions involves the risk of imperfect correlation in movements in the price of futures contracts and the underlying hedged assets. Since futures contracts are exchange-traded, there is minimal counterparty credit risk to the Funds since the exchanges’ clearinghouse acts as counterparty to all exchange-traded futures and guarantees the futures contracts against default.
Master Netting Arrangements: The RIC, on behalf of each Fund, is subject to various Master Agreements, or netting arrangements, with select counterparties. These are agreements which a subadviser may have negotiated and entered into on behalf of all or a portion of each Fund. A master netting arrangement between each Fund and the counterparty permits each Fund to offset amounts payable by each Fund to the same counterparty against amounts to be received and by the receipt of collateral from the counterparty by each Fund to cover each Fund’s exposure to the counterparty. However, there is no assurance that such mitigating factors are easily enforceable. In addition to master netting arrangements, the right to set-off exists when all the conditions are met such that each of the parties owes the other determinable amounts, the reporting party has the right to set-off the amount owed with the amount owed by the other party, the reporting party intends to set-off and the right of set-off is enforceable by law.
Securities Lending: Certain Funds lend their portfolio securities to banks and broker-dealers. The loans are secured by collateral at least equal to the market value of the securities loaned. Collateral pledged by each borrower is invested in an affiliated money market fund
52
and is marked to market daily, based on the previous day’s market value, such that the value of the collateral exceeds the value of the loaned securities. In the event of significant appreciation in value of the securities on loan on the last business day of the reporting period, the financial statements may reflect a collateral value that is less than the market value of the loaned securities. Such shortfall is remedied as described above. Loans are subject to termination at the option of the borrower or the Funds. Upon termination of the loan, the borrower will return to the Funds securities identical to the loaned securities. The remaining open loans of the securities lending transactions are considered overnight and continuous. Should the borrower of the securities fail financially, the Funds have the right to repurchase the securities in the open market using the collateral.
The Funds recognize income, net of any rebate and securities lending agent fees, for lending their securities in the form of fees or interest on the investment of any cash received as collateral. The borrower receives all interest and dividends from the securities loaned and such payments are passed back to the lender in amounts equivalent thereto, which are reflected in interest income or unaffiliated dividend income based on the nature of the payment on the Statement of Operations. The Funds also continue to recognize any unrealized gain (loss) in the market price of the securities loaned and on the change in the value of the collateral invested that may occur during the term of the loan. In addition, realized gain (loss) is recognized on changes in the value of the collateral invested upon liquidation of the collateral. Net earnings from securities lending are disclosed in the Statement of Operations.
Equity and Mortgage Real Estate Investment Trusts (collectively “REITs”): Certain Funds invested in REITs, which report information on the source of their distributions annually. Based on current and historical information, a portion of distributions received from REITs during the period is estimated to be dividend income, capital gain or return of capital and recorded accordingly. When material, these estimates are adjusted periodically when the actual source of distributions is disclosed by the REITs.
Securities Transactions and Net Investment Income: Securities transactions are recorded on the trade date. Realized gains (losses) from investment and currency transactions are calculated on the specific identification method. Dividend income is recorded on the ex-date, or for certain foreign securities, when the Funds become aware of such dividends. Expenses are recorded on an accrual basis, which may require the use of certain estimates by management that may differ from actual expense amounts. Net investment income or loss (other than class specific expenses and waivers, which are allocated as noted below) and unrealized and realized gains (losses) are allocated daily to each class of shares based upon the relative proportion of adjusted net assets of each class at the beginning of the day. Class specific expenses and waivers, where applicable, are charged to the respective share classes. Such class specific expenses and waivers include distribution fees and distribution fee waivers, shareholder servicing fees, transfer agent’s fees and expenses, registration fees and fee waivers and/or expense reimbursements, as applicable.
53
Notes to Financial Statements (continued)
Taxes: It is each Fund’s policy to continue to meet the requirements of the Internal Revenue Code applicable to regulated investment companies and to distribute all of its taxable net investment income and capital gains, if any, to its shareholders. Therefore, no federal income tax provision is required. Withholding taxes on foreign dividends, interest and capital gains, if any, are recorded, net of reclaimable amounts, at the time the related income is earned.
Dividends and Distributions: Dividends and distributions to shareholders, which are determined in accordance with federal income tax regulations and which may differ from GAAP, are recorded on the ex-date. Permanent book/tax differences relating to income and gain (loss) are reclassified between total distributable earnings (loss) and paid-in capital in excess of par, as appropriate. The chart below sets forth the expected frequency of dividend and capital gains distributions to shareholders. Various factors may impact the frequency of dividend distributions to shareholders, including but not limited to adverse market conditions or portfolio holding-specific events.
| | |
| | |
| Expected Distribution Schedule to Shareholders* | | Frequency |
| | |
| Quant Solutions Large-Cap Core: | | |
| |
Net Investment Income | | Annually |
| |
Short-Term Capital Gains | | Annually |
| |
Long-Term Capital Gains | | Annually |
| |
| | | |
| |
| Each Fund other than Quant Solutions Large-Cap Core: | | |
| |
Net Investment Income | | Quarterly |
| |
Short-Term Capital Gains | | Annually |
| |
Long-Term Capital Gains | | Annually |
| * | Under certain circumstances, each Fund may make more than one distribution of short-term and/or long-term capital gains during a fiscal year. |
Estimates: The preparation of financial statements requires management to make estimates and assumptions that affect the reported amounts and disclosures in the financial statements. Actual results could differ from those estimates.
The RIC, on behalf of each Fund, has management agreements with the Manager pursuant to which it has responsibility for all investment advisory services, including supervision of the subadviser’s performance of such services, and for rendering administrative services. The Manager has entered into subadvisory with the subadvisers listed below (each a “subadviser” and collectively the “subadvisers”).
54
The Manager pays for the services of each subadviser.
| | | | |
| Fund | | | | Subadviser(s) |
| | |
Quant Solutions Large-Cap Core | | | | PGIM Quantitative Solutions LLC (“PGIM Quantitative Solutions”) (a wholly-owned subsidiary of PGIM, Inc.) |
| | |
Real Estate Income | | | | PGIM Real Estate (a business unit of PGIM, Inc.); PGIM Real Estate (UK) Limited (an indirect wholly-owned subsidiary of PGIM, Inc.) |
| | |
Select Real Estate | | | | PGIM Real Estate (a business unit of PGIM, Inc.); PGIM Real Estate (UK) Limited (an indirect wholly-owned subsidiary of PGIM, Inc.) |
Fees payable under the management agreement are computed daily and paid monthly. For the reporting period ended October 31, 2024, the contractual and effective management fee rates were as follows:
| | | | |
| Fund | | Management Fee | | Effective Management Fee, before any waiver and/or expense reimbursements |
| | |
Quant Solutions Large-Cap Core | | 0.35% of average daily net assets up to and including $5 billion; 0.34% of average daily net assets over $5 billion. | | 0.35% |
| | |
Real Estate Income | | 0.80% on average daily net assets up to and including $1 billion; 0.78% on the next $2 billion of average daily net assets; 0.76% on the next $2 billion of average daily net asset; 0.75% on the next $5 billion of average daily net assets; 0.74% on average daily net assets exceeding $10 billion. | | 0.80 |
| | |
Select Real Estate | | 0.80% on average daily net assets up to and including $1 billion; 0.78% on the next $2 billion of average daily net assets; 0.76% on the next $2 billion of average daily net asset; 0.75% on the next $5 billion of average daily net assets; 0.74% on average daily net assets exceeding $10 billion. | | 0.80 |
The Manager has contractually agreed, through February 28, 2026, to limit certain operating expenses and/or to limit total annual operating expenses after fee waivers and/or expense reimbursements. This contractual waiver excludes interest, brokerage, taxes (such as income and foreign withholding taxes, stamp duty and deferred tax expenses), acquired fund fees and expenses, extraordinary expenses, and certain other Fund expenses such as dividend and interest expense and broker charges on short sales.
55
Notes to Financial Statements (continued)
Where applicable, the Manager agrees to waive management fees or shared operating expenses on any share class to the same extent that it waives such expenses on any other share class. In addition, total annual fund operating expenses for Class R6 shares will not exceed total annual fund operating expenses for Class Z shares. Fees and/or expenses waived and/or reimbursed by the Manager for the purpose of preventing the expenses from exceeding a certain expense ratio limit may be recouped by the Manager within the same fiscal year during which such waiver and/or reimbursement is made if such recoupment can be realized without exceeding the expense limit in effect at the time of the waiver/reimbursement and/or recoupment for that fiscal year, as applicable. The expense limitations attributable to each class are as follows:
| | | | |
| Fund | | Fund Expense
Limitation* | | Class Expense
Limitation |
| | |
Quant Solutions Large-Cap Core - Class A | | 0.35% | | 0.72% |
| | |
Quant Solutions Large-Cap Core - Class C | | 0.35 | | 1.44 |
| | |
Quant Solutions Large-Cap Core - Class Z | | 0.35 | | — |
| | |
Quant Solutions Large-Cap Core - Class R6 | | 0.35 | | — |
| | |
Real Estate Income - Class A | | — | | 1.35 |
| | |
Real Estate Income - Class C | | — | | 2.10 |
| | |
Real Estate Income - Class Z | | — | | 1.10 |
| | |
Real Estate Income - Class R6 | | — | | 1.10 |
| | |
Select Real Estate - Class A | | — | | 1.30 |
| | |
Select Real Estate - Class C | | — | | 2.05 |
| | |
Select Real Estate - Class Z | | — | | 1.05 |
| | |
Select Real Estate - Class R6 | | — | | 1.05 |
* Expense limitation excludes distribution and service (12b-1) fees, shareholder service fee, and transfer agency expenses (including sub-transfer agency and networking fees).
The RIC, on behalf of each Fund, has a distribution agreement with Prudential Investment Management Services LLC (“PIMS”), which acts as the distributor of the Class A, Class C, Class Z and Class R6 shares of each Fund. Each Fund compensates PIMS for distributing and servicing each Fund’s Class A and Class C shares, pursuant to the plans of distribution (the “Distribution Plans”), regardless of expenses actually incurred by PIMS.
Pursuant to the Distribution Plans, each Fund compensates PIMS for distribution related activities at an annual rate based on average daily net assets per class. PIMS has contractually agreed through February 28, 2026 to limit such fees on certain classes based on the daily net assets. The distribution fees are accrued daily and payable monthly.
Each Fund’s annual gross and net distribution rates, where applicable, are as follows:
| | | | |
| Fund | | Gross Distribution Fee | | Net Distribution Fee |
| | |
Quant Solutions Large-Cap Core - Class A | | 0.30% | | 0.25% |
56
| | | | |
| Fund | | Gross Distribution Fee | | Net Distribution Fee |
| | |
Quant Solutions Large-Cap Core - Class C | | 1.00% | | 1.00% |
| | |
Quant Solutions Large-Cap Core - Class Z | | N/A | | N/A |
| | |
Quant Solutions Large-Cap Core - Class R6 | | N/A | | N/A |
| | |
Real Estate Income - Class A | | 0.30 | | 0.25 |
| | |
Real Estate Income - Class C | | 1.00 | | 1.00 |
| | |
Real Estate Income - Class Z | | N/A | | N/A |
| | |
Real Estate Income - Class R6 | | N/A | | N/A |
| | |
Select Real Estate - Class A | | 0.30 | | 0.25 |
| | |
Select Real Estate - Class C | | 1.00 | | 1.00 |
| | |
Select Real Estate - Class Z | | N/A | | N/A |
| | |
Select Real Estate - Class R6 | | N/A | | N/A |
For the year ended October 31, 2024, PIMS received front-end sales charges (“FESL”) resulting from sales of certain class shares and contingent deferred sales charges (“CDSC”) imposed upon redemptions by certain shareholders. From these fees, PIMS paid such sales charges to broker-dealers, who in turn paid commissions to salespersons and incurred other distribution costs. The sales charges are as follows where applicable:
| | | | | | | | |
| Fund | | FESL | | | CDSC | |
Quant Solutions Large-Cap Core - Class A | | $ | 180,691 | | | $ | 558 | |
Quant Solutions Large-Cap Core - Class C | | | — | | | | 1,023 | |
Real Estate Income - Class A | | | 1,780 | | | | — | |
Real Estate Income - Class C | | | — | | | | — | |
Select Real Estate - Class A | | | 2,538 | | | | — | |
Select Real Estate - Class C | | | — | | | | — | |
PGIM Investments, PGIM, Inc., PGIM Real Estate (UK) Limited, PIMS and PGIM Quantitative Solutions are indirect, wholly-owned subsidiaries of Prudential Financial, Inc. (“Prudential”).
| 4. | Other Transactions with Affiliates |
Prudential Mutual Fund Services LLC (“PMFS”), an affiliate of PGIM Investments and an indirect, wholly-owned subsidiary of Prudential, serves as each Fund’s transfer agent and shareholder servicing agent. Transfer agent’s fees and expenses in the Statement of Operations include certain out-of-pocket expenses paid to non-affiliates, where applicable.
The Funds may invest their overnight sweep cash in the PGIM Core Government Money Market Fund (the “Core Government Fund”), a series of the Prudential Government Money Market Fund, Inc., and their securities lending cash collateral in the PGIM Institutional Money Market Fund (the “Money Market Fund”), a series of Prudential Investment Portfolios 2, each registered under the 1940 Act and managed by PGIM Investments. PGIM Investments and/or its affiliates are paid fees or reimbursed for providing their services to the Core Government Fund and the Money Market Fund. In addition to the realized and unrealized gains on investments in the Core Government Fund and the Money Market Fund,
57
Notes to Financial Statements (continued)
earnings from such investments are disclosed on the Statement of Operations as “Affiliated dividend income” and “Affiliated income from securities lending, net”, respectively.
The Funds may enter into certain securities purchase or sale transactions under Board approved Rule 17a-7 procedures. Rule 17a-7 is an exemptive rule under the 1940 Act that, subject to certain conditions, permits purchase and sale transactions among affiliated investment companies, or between an investment company and a person that is affiliated solely by reason of having a common (or affiliated) investment adviser, common directors/trustees, and/or common officers. For the year ended October 31, 2024, no Rule 17a-7 transactions were entered into by the Funds.
The aggregate cost of purchases and proceeds from sales of portfolio securities (excluding short-term investments and U.S. Government securities) for the reporting period ended October 31, 2024, were as follows:
| | | | | | | | |
| Fund | | Cost of
Purchases | | | Proceeds
from Sales | |
| | |
Quant Solutions Large-Cap Core | | | $920,115,197 | | | | $966,510,545 | |
Real Estate Income | | | 56,113,366 | | | | 46,077,279 | |
Select Real Estate | | | 258,001,454 | | | | 271,463,056 | |
A summary of the cost of purchases and proceeds from sales of shares of affiliated mutual funds for the year ended October 31, 2024, is presented as follows:
Quant Solutions Large-Cap Core:
| | | | | | | | | | | | | | | | | | | | | | | | | | | | |
Value,
Beginning
of Year | | Cost of
Purchases | | | Proceeds
from Sales | | | Change in
Unrealized
Gain
(Loss) | | | Realized
Gain
(Loss) | | | Value,
End of Year | | | Shares,
End
of Year | | | Income | |
|
Short-Term Investments - Affiliated Mutual Funds: | |
|
PGIM Core Government Money Market Fund (7-day effective yield 5.011%)(1)(wb) | |
| $10,525,531 | | | $203,100,593 | | | | $203,121,730 | | | | $ — | | | | $ — | | | | $10,504,394 | | | | 10,504,394 | | | | $721,095 | |
|
PGIM Institutional Money Market Fund (7-day effective yield 5.096%)(1)(b)(wb) | |
| 10,584,741 | | | 37,008,906 | | | | 47,593,940 | | | | (262 | ) | | | 555 | | | | — | | | | — | | | | 5,295 | (2) |
| $21,110,272 | | | $240,109,499 | | | | $250,715,670 | | | | $(262 | ) | | | $555 | | | | $10,504,394 | | | | | | | | $726,390 | |
58
Real Estate Income:
| | | | | | | | | | | | | | | | | | | | | | | | | | | | |
Value,
Beginning
of Year | | Cost of
Purchases | | | Proceeds
from Sales | | | Change in
Unrealized
Gain
(Loss) | | | Realized
Gain
(Loss) | | | Value,
End of Year | | | Shares,
End
of Year | | | Income | |
|
Short-Term Investments - Affiliated Mutual Funds: | |
|
PGIM Core Government Money Market Fund (7-day effective yield 5.011%)(1)(wb) | |
$114,668 | | | $21,392,530 | | | | $21,392,930 | | | | $— | | | | $— | | | | $114,268 | | | | 114,268 | | | | $17,133 | |
|
PGIM Institutional Money Market Fund (7-day effective yield 5.096%)(1)(b)(wb) | |
— | | | 6,811,969 | | | | 6,807,484 | | | | — | | | | 15 | | | | 4,500 | | | | 4,503 | | | | 267 | (2) |
$114,668 | | | $28,204,499 | | | | $28,200,414 | | | | $— | | | | $15 | | | | $118,768 | | | | | | | | $17,400 | |
Select Real Estate:
| | | | | | | | | | | | | | | | | | | | | | | | | | | | |
Value,
Beginning
of Year | | Cost of
Purchases | | | Proceeds
from Sales | | | Change in
Unrealized
Gain
(Loss) | | | Realized
Gain
(Loss) | | | Value,
End of Year | | | Shares,
End
of Year | | | Income | |
|
Short-Term Investments - Affiliated Mutual Funds: | |
|
PGIM Core Government Money Market Fund (7-day effective yield 5.011%)(1)(wb) | |
$420 | | | $65,027,678 | | | | $64,180,824 | | | | $— | | | | $ — | | | | $847,274 | | | | 847,274 | | | | $62,492 | |
|
PGIM Institutional Money Market Fund (7-day effective yield 5.096%)(1)(b)(wb) | |
— | | | 27,156,770 | | | | 27,155,810 | | | | — | | | | (960 | ) | | | — | | | | — | | | | 2,703 | (2) |
$420 | | | $92,184,448 | | | | $91,336,634 | | | | $— | | | | $(960 | ) | | | $847,274 | | | | | | | | $65,195 | |
| (1) | The Fund did not have any capital gain distributions during the reporting period. |
| (2) | The amount, or a portion thereof, represents the affiliated securities lending income shown on the Statement of Operations. |
| (b) | Represents security, or portion thereof, purchased with cash collateral received for securities on loan and includes dividend reinvestment. |
| (wb) | Represents an investment in a Fund affiliated with the Manager. |
| 6. | Distributions and Tax Information |
Distributions to shareholders, which are determined in accordance with federal income tax regulations and which may differ from GAAP, are recorded on the ex-date.
For the year ended October 31, 2024, the tax character of dividends paid as reflected in the Statement of Changes in Net Assets were as follows:
| | | | | | | | | | | | | | | | | | | | |
| Fund | | Ordinary
Income | | Long-Term
Capital Gains | | Tax Return
of Capital | | Total Dividends
and Distributions |
| | | | |
Quant Solutions Large-Cap Core | | | | $7,377,567 | | | | | $17,486,112 | | | | | $— | | | | $ | 24,863,679 | |
Real Estate Income | | | | 1,755,214 | | | | | — | | | | | — | | | | | 1,755,214 | |
Select Real Estate | | | | 4,922,929 | | | | | — | | | | | — | | | | | 4,922,929 | |
59
Notes to Financial Statements (continued)
For the year ended October 31, 2023, the tax character of dividends paid as reflected in the Statement of Changes in Net Assets were as follows:
| | | | | | | | | | | | | | | | | | | | |
| Fund | | Ordinary
Income | | Long-Term
Capital Gains | | Tax Return
of Capital | | Total Dividends
and Distributions |
| | | | |
Quant Solutions Large-Cap Core | | | | $8,973,357 | | | | | $7,670,621 | | | | | $ — | | | | $ | 16,643,978 | |
Real Estate Income | | | | 924,117 | | | | | — | | | | | 174,268 | | | | | 1,098,385 | |
Select Real Estate | | | | 5,015,279 | | | | | — | | | | | — | | | | | 5,015,279 | |
For the year ended October 31, 2024, the Funds indicated below had the following amounts of accumulated undistributed earnings on a tax basis:
| | | | | | | | | | |
| Fund | | Undistributed
Ordinary
Income | | Undistributed
Long-Term
Capital Gains |
| | |
Quant Solutions Large-Cap Core | | | | $53,821,268 | | | | $ | 37,022,820 | |
Real Estate Income | | | | 1,186,185 | | | | | — | |
Select Real Estate | | | | 800,734 | | | | | — | |
The United States federal income tax basis of the Funds’ investments and the net unrealized appreciation/(depreciation) as of October 31, 2024 were as follows:
| | | | | | | | | | | | | | | | | | | | |
| Fund | | Tax Basis | | Gross
Unrealized
Appreciation | | Gross
Unrealized
Depreciation | | Net
Unrealized
Appreciation |
| | | | |
Quant Solutions Large-Cap Core | | | | $585,374,628 | | | | | $328,461,468 | | | | $ | (11,971,391 | ) | | | $ | 316,490,077 | |
Real Estate Income | | | | 46,545,720 | | | | | 6,792,492 | | | | | (1,179,317 | ) | | | | 5,613,175 | |
Select Real Estate | | | | 179,829,577 | | | | | 34,476,045 | | | | | (7,697,634 | ) | | | | 26,778,411 | |
The GAAP basis may differ from tax basis due to certain tax-related adjustments.
For federal income tax purposes, the following Funds had an approximated capital loss carryforward as of October 31, 2024 which can be carried forward for an unlimited period. No capital gains distributions are expected to be paid to shareholders until net gains have been realized in excess of such losses.
| | | | | | | | | | |
| Fund | | Capital Loss
Carryforward | | Capital Loss
Carryforward Utilized |
| | |
Quant Solutions Large-Cap Core | | | $ | — | | | | $ | — | |
Real Estate Income | | | | — | | | | | 1,903,000 | |
Select Real Estate | | | | 56,591,000 | | | | | 8,597,000 | |
The Manager has analyzed the Funds’ tax positions taken on federal, state and local income tax returns for all open tax years and has concluded that no provision for income tax is required in the Funds’ financial statements for the current reporting period. Since tax authorities can examine previously filed tax returns, the Funds’ U.S. federal and state tax returns for each of the four fiscal years up to the most recent fiscal year ended October 31,
60
2024 are subject to such review.
Each Fund offers Class A, Class C, Class Z and Class R6 shares. Class A shares are sold with a maximum front-end sales charge of 5.50%. Investors who purchase $1 million or more of Class A shares and sell these shares within 12 months of purchase are subject to a CDSC of 1%, although they are not subject to an initial sales charge. The Class A CDSC is waived for certain retirement and/or benefit plans. A special exchange privilege is also available for shareholders who qualified to purchase Class A shares at net asset value. Class C shares are sold with a CDSC of 1% on sales made within 12 months of purchase. Class C shares will automatically convert to Class A shares on a monthly basis approximately eight years (ten years prior to January 22, 2021) after purchase. Class Z and Class R6 shares are not subject to any sales or redemption charges and are available exclusively for sale to a limited group of investors.
Under certain circumstances, an exchange may be made from specified share classes of each Fund to one or more other share classes of each Fund as presented in the table of transactions in shares of beneficial interest, below.
The RIC has authorized an unlimited number of shares of beneficial interest of the Fund at $0.001 par value per share, currently divided into four classes, designated Class A, Class C, Class Z and Class R6.
As of October 31, 2024, Prudential, through its affiliated entities, including affiliated funds (if applicable), owned shares of each Fund as follows:
| | | | | | | | |
| Fund | | Number of Shares | | | Percentage of
Outstanding Shares | |
Quant Solutions Large-Cap Core–Class Z | | | 25,110 | | | | 1.7% | |
Quant Solutions Large-Cap Core–Class R6 | | | 2,772,695 | | | | 20.1 | |
Real Estate Income–Class R6 | | | 4,249,667 | | | | 71.7 | |
Select Real Estate–Class C | | | 1,319 | | | | 1.1 | |
Select Real Estate–Class R6 | | | 1,367,191 | | | | 69.0 | |
At the reporting period end, the number of shareholders holding greater than 5% of the Funds are as follows:
| | | | | | | | |
| Fund | | Number of Shareholders | | | Percentage of Outstanding Shares | |
Affiliated: | | | | | | | | |
Quant Solutions Large-Cap Core | | | 1 | | | | 7.3% | |
Real Estate Income | | | 1 | | | | 65.4 | |
Select Real Estate | | | 1 | | | | 8.9 | |
Unaffiliated: | | | | | | | | |
Quant Solutions Large-Cap Core | | | 3 | | | | 52.7 | |
Real Estate Income | | | 2 | | | | 32.4 | |
Select Real Estate | | | 4 | | | | 80.2 | |
61
Notes to Financial Statements (continued)
Transactions in shares of beneficial interest were as follows:
Quant Solutions Large-Cap Core:
| | | | | | | | |
| | | |
| Share Class | | Shares | | | Amount | |
| | |
Class A | | | | | | | | |
| | |
Year ended October 31, 2024: | | | | | | | | |
| | |
Shares sold | | | 695,150 | | | $ | 13,923,169 | |
| | |
Shares issued in reinvestment of dividends and distributions | | | 838,970 | | | | 15,421,342 | |
| | |
Shares purchased | | | (2,807,283 | ) | | | (57,390,524 | ) |
| | |
Net increase (decrease) in shares outstanding before conversion | | | (1,273,163 | ) | | | (28,046,013 | ) |
| | |
Shares issued upon conversion from other share class(es) | | | 208,691 | | | | 4,274,655 | |
| | |
Shares purchased upon conversion into other share class(es) | | | (132,693 | ) | | | (2,776,982 | ) |
| | |
Net increase (decrease) in shares outstanding | | | (1,197,165 | ) | | $ | (26,548,340 | ) |
| | |
Year ended October 31, 2023: | | | | | | | | |
| | |
Shares sold | | | 535,744 | | | $ | 8,875,073 | |
| | |
Shares issued in reinvestment of dividends and distributions | | | 597,462 | | | | 9,499,642 | |
| | |
Shares purchased | | | (2,779,584 | ) | | | (46,070,888 | ) |
| | |
Net increase (decrease) in shares outstanding before conversion | | | (1,646,378 | ) | | | (27,696,173 | ) |
| | |
Shares issued upon conversion from other share class(es) | | | 152,757 | | | | 2,546,276 | |
| | |
Shares purchased upon conversion into other share class(es) | | | (120,015 | ) | | | (1,974,533 | ) |
| | |
Net increase (decrease) in shares outstanding | | | (1,613,636 | ) | | $ | (27,124,430 | ) |
| | |
Class C | | | | | | | | |
| | |
Year ended October 31, 2024: | | | | | | | | |
| | |
Shares sold | | | 50,436 | | | $ | 882,622 | |
| | |
Shares issued in reinvestment of dividends and distributions | | | 32,626 | | | | 512,216 | |
| | |
Shares purchased | | | (120,490 | ) | | | (2,096,877 | ) |
| | |
Net increase (decrease) in shares outstanding before conversion | | | (37,428 | ) | | | (702,039 | ) |
| | |
Shares purchased upon conversion into other share class(es) | | | (234,996 | ) | | | (4,077,726 | ) |
| | |
Net increase (decrease) in shares outstanding | | | (272,424 | ) | | $ | (4,779,765 | ) |
| | |
Year ended October 31, 2023: | | | | | | | | |
| | |
Shares sold | | | 89,439 | | | $ | 1,253,172 | |
| | |
Shares issued in reinvestment of dividends and distributions | | | 23,548 | | | | 321,896 | |
| | |
Shares purchased | | | (153,755 | ) | | | (2,160,660 | ) |
| | |
Net increase (decrease) in shares outstanding before conversion | | | (40,768 | ) | | | (585,592 | ) |
| | |
Shares purchased upon conversion into other share class(es) | | | (176,273 | ) | | | (2,518,164 | ) |
| | |
Net increase (decrease) in shares outstanding | | | (217,041 | ) | | $ | (3,103,756 | ) |
62
| | | | | | | | |
| | | |
| Share Class | | Shares | | | Amount | |
| | |
Class Z | | | | | | | | |
| | |
Year ended October 31, 2024: | | | | | | | | |
| | |
Shares sold | | | 335,119 | | | $ | 7,348,589 | |
| | |
Shares issued in reinvestment of dividends and distributions | | | 42,985 | | | | 821,035 | |
| | |
Shares purchased | | | (223,197 | ) | | | (4,751,242 | ) |
| | |
Net increase (decrease) in shares outstanding before conversion | | | 154,907 | | | | 3,418,382 | |
| | |
Shares issued upon conversion from other share class(es) | | | 120,093 | | | | 2,612,994 | |
| | |
Shares purchased upon conversion into other share class(es) | | | (11,004 | ) | | | (258,468 | ) |
| | |
Net increase (decrease) in shares outstanding | | | 263,996 | | | $ | 5,772,908 | |
| | |
Year ended October 31, 2023: | | | | | | | | |
| | |
Shares sold | | | 69,891 | | | $ | 1,220,580 | |
| | |
Shares issued in reinvestment of dividends and distributions | | | 31,553 | | | | 520,632 | |
| | |
Shares purchased | | | (224,709 | ) | | | (3,859,034 | ) |
| | |
Net increase (decrease) in shares outstanding before conversion | | | (123,265 | ) | | | (2,117,822 | ) |
| | |
Shares issued upon conversion from other share class(es) | | | 96,062 | | | | 1,644,906 | |
| | |
Shares purchased upon conversion into other share class(es) | | | (9,831 | ) | | | (174,755 | ) |
| | |
Net increase (decrease) in shares outstanding | | | (37,034 | ) | | $ | (647,671 | ) |
| | |
Class R6 | | | | | | | | |
| | |
Year ended October 31, 2024: | | | | | | | | |
| | |
Shares sold | | | 6,195,432 | | | $ | 132,572,585 | |
| | |
Shares issued in reinvestment of dividends and distributions | | | 411,338 | | | | 7,877,623 | |
| | |
Shares purchased | | | (7,359,838 | ) | | | (152,231,302 | ) |
| | |
Net increase (decrease) in shares outstanding before conversion | | | (753,068 | ) | | | (11,781,094 | ) |
| | |
Shares issued upon conversion from other share class(es) | | | 10,660 | | | | 236,261 | |
| | |
Shares purchased upon conversion into other share class(es) | | | (503 | ) | | | (10,734 | ) |
| | |
Net increase (decrease) in shares outstanding | | | (742,911 | ) | | $ | (11,555,567 | ) |
| | |
Year ended October 31, 2023: | | | | | | | | |
| | |
Shares sold | | | 3,818,309 | | | $ | 65,986,084 | |
| | |
Shares issued in reinvestment of dividends and distributions | | | 371,721 | | | | 6,151,987 | |
| | |
Shares purchased | | | (3,578,240 | ) | | | (61,798,340 | ) |
| | |
Net increase (decrease) in shares outstanding before conversion | | | 611,790 | | | | 10,339,731 | |
| | |
Shares issued upon conversion from other share class(es) | | | 27,597 | | | | 477,110 | |
| | |
Shares purchased upon conversion into other share class(es) | | | (51 | ) | | | (840 | ) |
| | |
Net increase (decrease) in shares outstanding | | | 639,336 | | | $ | 10,816,001 | |
63
Notes to Financial Statements (continued)
Real Estate Income:
| | | | | | | | |
| | | |
| Share Class | | Shares | | | Amount | |
| | |
Class A | | | | | | | | |
| | |
Year ended October 31, 2024: | | | | | | | | |
| | |
Shares sold | | | 19,416 | | | $ | 146,330 | |
| | |
Shares issued in reinvestment of dividends and distributions | | | 3,328 | | | | 23,772 | |
| | |
Shares purchased | | | (25,101 | ) | | | (178,712 | ) |
| | |
Net increase (decrease) in shares outstanding before conversion | | | (2,357 | ) | | | (8,610 | ) |
| | |
Shares issued upon conversion from other share class(es) | | | 5,284 | | | | 37,082 | |
| | |
Net increase (decrease) in shares outstanding | | | 2,927 | | | $ | 28,472 | |
| | |
Year ended October 31, 2023: | | | | | | | | |
| | |
Shares sold | | | 14,594 | | | $ | 95,679 | |
| | |
Shares issued in reinvestment of dividends and distributions | | | 4,374 | | | | 27,806 | |
| | |
Shares purchased | | | (47,480 | ) | | | (303,028 | ) |
| | |
Net increase (decrease) in shares outstanding before conversion | | | (28,512 | ) | | | (179,543 | ) |
| | |
Shares purchased upon conversion into other share class(es) | | | (1,329 | ) | | | (8,359 | ) |
| | |
Net increase (decrease) in shares outstanding | | | (29,841 | ) | | $ | (187,902 | ) |
| | |
Class C | | | | | | | | |
| | |
Year ended October 31, 2024: | | | | | | | | |
| | |
Shares sold | | | 4,156 | | | $ | 34,000 | |
| | |
Shares issued in reinvestment of dividends and distributions | | | 671 | | | | 4,672 | |
| | |
Shares purchased | | | (11,716 | ) | | | (84,091 | ) |
| | |
Net increase (decrease) in shares outstanding before conversion | | | (6,889 | ) | | | (45,419 | ) |
| | |
Shares purchased upon conversion into other share class(es) | | | (5,288 | ) | | | (37,082 | ) |
| | |
Net increase (decrease) in shares outstanding | | | (12,177 | ) | | $ | (82,501 | ) |
| | |
Year ended October 31, 2023: | | | | | | | | |
| | |
Shares sold | | | 11,910 | | | $ | 80,031 | |
| | |
Shares issued in reinvestment of dividends and distributions | | | 1,142 | | | | 7,287 | |
| | |
Shares purchased | | | (13,408 | ) | | | (85,394 | ) |
| | |
Net increase (decrease) in shares outstanding | | | (356 | ) | | $ | 1,924 | |
| | |
Class Z | | | | | | | | |
| | |
Year ended October 31, 2024: | | | | | | | | |
| | |
Shares sold | | | 444,819 | | | $ | 3,596,125 | |
| | |
Shares issued in reinvestment of dividends and distributions | | | 6,814 | | | | 53,173 | |
| | |
Shares purchased | | | (69,009 | ) | | | (523,102 | ) |
| | |
Net increase (decrease) in shares outstanding before conversion | | | 382,624 | | | | 3,126,196 | |
| | |
Shares issued upon conversion from other share class(es) | | | 12 | | | | 79 | |
| | |
Net increase (decrease) in shares outstanding | | | 382,636 | | | $ | 3,126,275 | |
64
Real Estate Income (cont’d.):
| | | | | | | | |
| | | |
| Share Class | | Shares | | | Amount | |
| | |
Year ended October 31, 2023: | | | | | | | | |
| | |
Shares sold | | | 52,996 | | | $ | 352,376 | |
| | |
Shares issued in reinvestment of dividends and distributions | | | 4,353 | | | | 27,956 | |
| | |
Shares purchased | | | (1,113,926 | ) | | | (7,255,107 | ) |
| | |
Net increase (decrease) in shares outstanding before conversion | | | (1,056,577 | ) | | | (6,874,775 | ) |
| | |
Shares issued upon conversion from other share class(es) | | | 1,323 | | | | 8,359 | |
| | |
Net increase (decrease) in shares outstanding | | | (1,055,254 | ) | | $ | (6,866,416 | ) |
| | |
Class R6 | | | | | | | | |
| | |
Year ended October 31, 2024: | | | | | | | | |
| | |
Shares sold | | | 1,916,301 | | | $ | 12,796,216 | |
| | |
Shares issued in reinvestment of dividends and distributions | | | 233,173 | | | | 1,672,189 | |
| | |
Shares purchased | | | (1,070,898 | ) | | | (7,556,707 | ) |
| | |
Net increase (decrease) in shares outstanding before conversion | | | 1,078,576 | | | | 6,911,698 | |
| | |
Shares purchased upon conversion into other share class(es) | | | (12 | ) | | | (79 | ) |
| | |
Net increase (decrease) in shares outstanding | | | 1,078,564 | | | $ | 6,911,619 | |
| | |
Year ended October 31, 2023: | | | | | | | | |
| | |
Shares sold | | | 1,918,443 | | | $ | 12,130,223 | |
| | |
Shares issued in reinvestment of dividends and distributions | | | 164,171 | | | | 1,033,874 | |
| | |
Shares purchased | | | (492,582 | ) | | | (3,216,260 | ) |
| | |
Net increase (decrease) in shares outstanding | | | 1,590,032 | | | $ | 9,947,837 | |
Select Real Estate:
| | | | | | | | |
| | | |
| Share Class | | Shares | | | Amount | |
| | |
Class A | | | | | | | | |
| | |
Year ended October 31, 2024: | | | | | | | | |
| | |
Shares sold | | | 108,712 | | | $ | 1,367,036 | |
| | |
Shares issued in reinvestment of dividends and distributions | | | 11,714 | | | | 146,342 | |
| | |
Shares purchased | | | (376,666 | ) | | | (5,047,115 | ) |
| | |
Net increase (decrease) in shares outstanding before conversion | | | (256,240 | ) | | | (3,533,737 | ) |
| | |
Shares issued upon conversion from other share class(es) | | | 3,744 | | | | 46,703 | |
| | |
Shares purchased upon conversion into other share class(es) | | | (5,968 | ) | | | (76,964 | ) |
| | |
Net increase (decrease) in shares outstanding | | | (258,464 | ) | | $ | (3,563,998 | ) |
65
Notes to Financial Statements (continued)
Select Real Estate (cont’d.):
| | | | | | | | |
| | | |
| Share Class | | Shares | | | Amount | |
| | |
Year ended October 31, 2023: | | | | | | | | |
| | |
Shares sold | | | 98,715 | | | $ | 1,153,903 | |
| | |
Shares issued in reinvestment of dividends and distributions | | | 14,810 | | | | 170,993 | |
| | |
Shares purchased | | | (621,093 | ) | | | (7,305,097 | ) |
| | |
Net increase (decrease) in shares outstanding before conversion | | | (507,568 | ) | | | (5,980,201 | ) |
| | |
Shares issued upon conversion from other share class(es) | | | 6,087 | | | | 70,327 | |
| | |
Shares purchased upon conversion into other share class(es) | | | (12,103 | ) | | | (140,249 | ) |
| | |
Net increase (decrease) in shares outstanding | | | (513,584 | ) | | $ | (6,050,123 | ) |
| | |
Class C | | | | | | | | |
| | |
Year ended October 31, 2024: | | | | | | | | |
| | |
Shares sold | | | 15,043 | | | $ | 191,532 | |
| | |
Shares issued in reinvestment of dividends and distributions | | | 2,570 | | | | 31,688 | |
| | |
Shares purchased | | | (54,820 | ) | | | (678,317 | ) |
| | |
Net increase (decrease) in shares outstanding before conversion | | | (37,207 | ) | | | (455,097 | ) |
| | |
Shares purchased upon conversion into other share class(es) | | | (352 | ) | | | (4,358 | ) |
| | |
Net increase (decrease) in shares outstanding | | | (37,559 | ) | | $ | (459,455 | ) |
| | |
Year ended October 31, 2023: | | | | | | | | |
| | |
Shares sold | | | 47,930 | | | $ | 545,368 | |
| | |
Shares issued in reinvestment of dividends and distributions | | | 1,875 | | | | 21,318 | |
| | |
Shares purchased | | | (53,248 | ) | | | (609,473 | ) |
| | |
Net increase (decrease) in shares outstanding before conversion | | | (3,443 | ) | | | (42,787 | ) |
| | |
Shares purchased upon conversion into other share class(es) | | | (5,474 | ) | | | (62,252 | ) |
| | |
Net increase (decrease) in shares outstanding | | | (8,917 | ) | | $ | (105,039 | ) |
| | |
Class Z | | | | | | | | |
| | |
Year ended October 31, 2024: | | | | | | | | |
| | |
Shares sold | | | 4,778,274 | | | $ | 60,238,153 | |
| | |
Shares issued in reinvestment of dividends and distributions | | | 316,927 | | | | 4,014,434 | |
| | |
Shares purchased | | | (6,284,615 | ) | | | (74,955,033 | ) |
| | |
Net increase (decrease) in shares outstanding before conversion | | | (1,189,414 | ) | | | (10,702,446 | ) |
| | |
Shares issued upon conversion from other share class(es) | | | 6,166 | | | | 79,677 | |
| | |
Shares purchased upon conversion into other share class(es) | | | (14,252 | ) | | | (198,743 | ) |
| | |
Net increase (decrease) in shares outstanding | | | (1,197,500 | ) | | $ | (10,821,512 | ) |
66
Select Real Estate (cont’d.):
| | | | | | | | |
| | | |
| Share Class | | Shares | | | Amount | |
| | |
Year ended October 31, 2023: | | | | | | | | |
| | |
Shares sold | | | 6,472,628 | | | $ | 74,952,042 | |
| | |
Shares issued in reinvestment of dividends and distributions | | | 331,388 | | | | 3,805,130 | |
| | |
Shares purchased | | | (8,718,343 | ) | | | (99,098,086 | ) |
| | |
Net increase (decrease) in shares outstanding before conversion | | | (1,914,327 | ) | | | (20,340,914 | ) |
| | |
Shares issued upon conversion from other share class(es) | | | 12,484 | | | | 144,855 | |
| | |
Shares purchased upon conversion into other share class(es) | | | (3,338 | ) | | | (38,972 | ) |
| | |
Net increase (decrease) in shares outstanding | | | (1,905,181 | ) | | $ | (20,235,031 | ) |
| | |
Class R6 | | | | | | | | |
| | |
Year ended October 31, 2024: | | | | | | | | |
| | |
Shares sold | | | 969,133 | | | $ | 11,741,485 | |
| | |
Shares issued in reinvestment of dividends and distributions | | | 58,194 | | | | 721,273 | |
| | |
Shares purchased | | | (950,997 | ) | | | (11,787,185 | ) |
| | |
Net increase (decrease) in shares outstanding before conversion | | | 76,330 | | | | 675,573 | |
| | |
Shares issued upon conversion from other share class(es) | | | 11,061 | | | | 156,398 | |
| | |
Shares purchased upon conversion into other share class(es) | | | (211 | ) | | | (2,713 | ) |
| | |
Net increase (decrease) in shares outstanding | | | 87,180 | | | $ | 829,258 | |
| | |
Year ended October 31, 2023: | | | | | | | | |
| | |
Shares sold | | | 1,674,290 | | | $ | 19,459,385 | |
| | |
Shares issued in reinvestment of dividends and distributions | | | 89,449 | | | | 1,010,854 | |
| | |
Shares purchased | | | (6,962,409 | ) | | | (81,859,852 | ) |
| | |
Net increase (decrease) in shares outstanding before conversion | | | (5,198,670 | ) | | | (61,389,613 | ) |
| | |
Shares issued upon conversion from other share class(es) | | | 2,696 | | | | 30,897 | |
| | |
Shares purchased upon conversion into other share class(es) | | | (408 | ) | | | (4,606 | ) |
| | |
Net increase (decrease) in shares outstanding | | | (5,196,382 | ) | | $ | (61,363,322 | ) |
The RIC, on behalf of each Fund, along with other affiliated registered investment companies (the “Participating Funds”), is a party to a Syndicated Credit Agreement (“SCA”) with a group of banks. The purpose of the SCA is to provide an alternative source of temporary funding for capital share redemptions. The table below provides details of the SCA in effect at the reporting period-end.
| | | | |
| | | Current SCA | | Prior SCA |
Term of Commitment | | 9/27/2024 – 9/25/2025 | | 9/29/2023 – 9/26/2024 |
Total Commitment | | $1,200,000,000 | | $1,200,000,000 |
Annualized Commitment Fee on the Unused Portion of the SCA | | 0.15% | | 0.15% |
67
Notes to Financial Statements (continued)
| | | | |
| | | Current SCA | | Prior SCA |
Annualized Interest Rate on Borrowings | | 1.00% plus the higher of (1) the effective federal funds rate, (2) the daily SOFR rate plus 0.10% or (3) zero percent | | 1.00% plus the higher of (1) the effective federal funds rate, (2) the daily SOFR rate plus 0.10% or (3) zero percent |
Certain affiliated registered investment companies that are parties to the SCA include portfolios that are subject to a predetermined mathematical formula used to manage certain benefit guarantees offered under variable annuity contracts. The formula may result in large scale asset flows into and out of these portfolios. Consequently, these portfolios may be more likely to utilize the SCA for purposes of funding redemptions. It may be possible for those portfolios to fully exhaust the committed amount of the SCA, thereby requiring the Manager to allocate available funding per a Board-approved methodology designed to treat the Participating Funds in the SCA equitably.
Each Fund indicated below utilized the SCA during the year ended October 31, 2024. The average balance outstanding is for the number of days each Fund utilized the credit facility.
| | | | | | | | | | | | | | | | | | | | |
| | | | | | |
| Fund | | Average
Balance
Outstanding | | | Weighted
Average Interest Rates | | | Number
of Days Outstanding | | | Maximum
Balance Outstanding | | | Balance
Outstanding at October 31, 2024 | |
Quant Solutions Large-Cap Core | | | $3,807,000 | | | | 6.45% | | | | 1 | | | | $ 3,807,000 | | | | $— | |
Real Estate Income | | | 311,889 | | | | 6.42 | | | | 9 | | | | 693,000 | | | | — | |
Select Real Estate | | | 2,376,453 | | | | 6.43 | | | | 53 | | | | 19,707,000 | | | | — | |
| 9. | Risks of Investing in the Funds |
Each Fund’s principal risks include, but are not limited to, some or all of the risks discussed below. For further information on the risks applicable to any given Fund, please refer to the Prospectus and Statement of Additional Information of that Fund.
| | | | | | |
| | | | |
| Risks | | Quant Solutions
Large-Cap Core | | Real
Estate
Income | | Select
Real
Estate |
Active Trading | | X | | X | | X |
Blend Style | | X | | – | | – |
Distribution | | – | | X | | X |
Economic and Market Events | | X | | X | | X |
Emerging Markets | | – | | X | | X |
Equity and Equity-Related Securities | | X | | X | | X |
Foreign Securities | | – | | X | | X |
Increase in Expenses | | X | | X | | X |
68
| | | | | | |
| | | | |
Large Capitalization Company | | X | | – | | – |
Large Shareholder and Large Scale Redemption | | X | | X | | X |
Management | | X | | – | | – |
Market Capitalization | | – | | X | | X |
Market Disruption and Geopolitical | | X | | X | | X |
Market | | X | | X | | X |
Model Design | | X | | – | | – |
Model Implementation | | X | | – | | – |
Non-Diversified Investment Company | | – | | X | | – |
Real Estate Investment Trust | | – | | X | | X |
Real Estate Related Securities | | – | | X | | X |
Sector Exposure | | X | | – | | – |
Selection | | – | | X | | X |
Value Style | | – | | X | | X |
Active Trading Risk: The Fund actively and frequently trades its portfolio securities. High portfolio turnover results in higher transaction costs, which can affect the Fund’s performance and have adverse tax consequences. In addition, high portfolio turnover may also mean that a proportionately greater amount of distributions to shareholders will be taxed as ordinary income rather than long-term capital gains compared to investment companies with lower portfolio turnover.
Blend Style Risk: The Fund’s blend investment style may subject the Fund to risks of both value and growth investing. The portion of the Fund’s portfolio that makes investments pursuant to a growth strategy may be subject to above-average fluctuations as a result of seeking higher than average capital growth. The portion of the Fund’s portfolio that makes investments pursuant to a value strategy may be subject to the risk that the market may not recognize a security’s intrinsic value for long periods of time or at all, or that a stock judged to be undervalued may actually be appropriately priced. Growth and value stocks have historically produced similar long-term results, though each category has periods when it outperforms the other. Issuers of value stocks may have experienced adverse business developments or may be subject to special risks that have caused the stock to be out of favor. If the Fund’s assessment of market conditions or a company’s value is inaccurate, the Fund could suffer losses or produce poor performance relative to other funds. Historically, growth stocks have performed best during later stages of economic expansion and value stocks have performed best during periods of economic recovery. Therefore, both styles may over time go in and out of favor with the markets. At times when a style is out of favor, that portion of the portfolio may lag the other portion of the portfolio, which may cause the Fund to underperform the market in general, its benchmark, and have a notable impact on settlement performance and other mutual funds.
Distribution Risk: The Fund’s distributions may consist of net investment income, if any, and net realized gains, if any, from the sale of investments and/or return of capital. The Fund will provide to shareholders early in each calendar year the final tax character of the Fund’s distributions for the previous year. Also, at such time that the Fund distribution is expected
69
Notes to Financial Statements (continued)
to be from sources other than current or accumulated net income, a notice to shareholders may be required.
Economic and Market Events Risk: Events in the U.S. and global financial markets, including actions taken by the U.S. Federal Reserve or foreign central banks to stimulate or stabilize economic growth or the functioning of the securities markets, or otherwise reduce inflation, may at times result in unusually high market volatility, which could negatively impact performance. Governmental efforts to curb inflation often have negative effects on the level of economic activity. Relatively reduced liquidity in credit and fixed income markets could adversely affect issuers worldwide.
Emerging Markets Risk: The risks of foreign investments are greater for investments in or exposed to emerging markets. Emerging market countries typically have economic and political systems that are less fully developed, and can be expected to be less stable, than those of more developed countries. For example, the economies of such countries can be subject to rapid and unpredictable rates of inflation or deflation. Low trading volumes may result in a lack of liquidity and price volatility. Emerging market countries may have policies that restrict investment by non-U.S. investors, or that prevent non-U.S. investors from withdrawing their money at will.
The Fund may invest in some emerging markets that subject it to risks such as those associated with illiquidity, custody of assets, different settlement and clearance procedures and asserting legal title under a developing legal and regulatory regime to a greater degree than in developed markets or even in other emerging markets.
Equity and Equity-Related Securities Risk: Equity and equity-related securities may be subject to changes in value, and their values may be more volatile than those of other asset classes. In addition to an individual security losing value, the value of the equity markets or a sector in which the Fund invests could go down. Different parts of a market can react differently to adverse issuer, market, regulatory, political and economic developments.
Foreign Securities Risk: Investments in securities of non-U.S. issuers (including those denominated in U.S. dollars) may involve more risk than investing in securities of U.S. issuers. Foreign political, economic and legal systems, especially those in developing and emerging market countries, may be less stable and more volatile than in the United States. Foreign legal systems generally have fewer regulatory requirements than the U.S. legal system, particularly those of emerging markets. In general, less information is publicly available with respect to non-U.S. companies than U.S. companies. Non-U.S. companies generally are not subject to the same accounting, auditing, and financial reporting standards as are U.S. companies. Additionally, the changing value of foreign currencies and changes in exchange rates could also affect the value of the assets the Fund holds and the Fund’s
70
performance. Certain foreign countries may impose restrictions on the ability of issuers of foreign securities to make payment of principal and interest or dividends to investors located outside the country, due to blockage of foreign currency exchanges or otherwise. Investments in emerging markets are subject to greater volatility and price declines.
In addition, the Fund’s investments in non-U.S. securities may be subject to the risks of nationalization or expropriation of assets, imposition of currency exchange controls or restrictions on the repatriation of non-U.S. currency, confiscatory taxation and adverse diplomatic developments. Special U.S. tax considerations may apply.
Increase in Expenses Risk: Your actual cost of investing in the Fund may be higher than the expenses shown in the expense table in the Fund’s prospectus for a variety of reasons. For example, expense ratios may be higher than those shown if average net assets decrease. Net assets are more likely to decrease and Fund expense ratios are more likely to increase when markets are volatile. Active and frequent trading of Fund securities can increase expenses.
Large Capitalization Company Risk: Companies with large market capitalizations go in and out of favor based on market and economic conditions. Larger companies tend to be less volatile than companies with smaller market capitalizations. In exchange for this potentially lower risk, the Fund’s value may not rise or fall as much as the value of funds that emphasize companies with smaller market capitalizations.
Large Shareholder and Large Scale Redemption Risk: Certain individuals, accounts, funds (including funds affiliated with the Manager) or institutions, including the Manager and its affiliates, may from time to time own or control a substantial amount of the Fund’s shares. There is no requirement that these entities maintain their investment in the Fund. There is a risk that such large shareholders or that the Fund’s shareholders generally may redeem all or a substantial portion of their investments in the Fund in a short period of time, which could have a significant negative impact on the Fund’s NAV, liquidity, and brokerage costs. Large redemptions could also result in tax consequences to shareholders and impact the Fund’s ability to implement its investment strategy. The Fund’s ability to pursue its investment objective after one or more large scale redemptions may be impaired and, as a result, the Fund may invest a larger portion of its assets in cash or cash equivalents.
Management Risk: Actively managed funds are subject to management risk. The subadviser will apply investment techniques and risk analyses in making investment decisions for the Fund, but the subadviser’s judgments about the attractiveness, value or market trends affecting a particular security, industry or sector or about market movements may be incorrect. Additionally, the investments selected for the Fund may underperform the markets in general, the Fund’s benchmark and other funds with similar investment objectives.
Market Capitalization Risk: The Fund may invest in companies of any market capitalization. Generally, the stock prices of small- and mid-cap companies are less stable than the prices
71
Notes to Financial Statements (continued)
of large-cap stocks and may present greater risks. Large capitalization companies as a group could fall out of favor with the market, causing the Fund to underperform compared to investments that focus on smaller capitalized companies.
Market Disruption and Geopolitical Risks: Market disruption can be caused by economic, financial or political events and factors, including but not limited to, international wars or conflicts (including Russia’s military invasion of Ukraine and the Israel-Hamas war), geopolitical developments (including trading and tariff arrangements, sanctions and cybersecurity attacks), instability in regions such as Asia, Eastern Europe and the Middle East, terrorism, natural disasters and public health epidemics (including the outbreak of COVID-19 globally).
The extent and duration of such events and resulting market disruptions cannot be predicted, but could be substantial and could magnify the impact of other risks to the Fund. These and other similar events could adversely affect the U.S. and foreign financial markets and lead to increased market volatility, reduced liquidity in the securities markets, significant negative impacts on issuers and the markets for certain securities and commodities and/or government intervention. They may also cause short- or long-term economic uncertainties in the United States and worldwide. As a result, whether or not the Fund invests in securities of issuers located in or with significant exposure to the countries directly affected, the value and liquidity of the Fund’s investments may be negatively impacted. Further, due to closures of certain markets and restrictions on trading certain securities, the value of certain securities held by the Fund could be significantly impacted, which could lead to such securities being valued at zero.
Market Risk: Securities markets may be volatile and the market prices of the Fund’s securities may decline. Securities fluctuate in price based on changes in an issuer’s financial condition and overall market and economic conditions. If the market prices of the securities owned by the Fund fall, the value of your investment in the Fund will decline.
Model Design Risk: The subadviser uses certain quantitative models to help guide its investment decisions. The design of the underlying models may be flawed or incomplete. The investment models the subadviser uses are based on historical and theoretical underpinnings that it believes are sound. There can be no guarantee, however, that these underpinnings will correlate with security price behavior in the manner assumed by the subadviser’s models. Additionally, the quantitative techniques that underlie the subadviser’s portfolio construction processes may fail to fully anticipate important risks.
Model Implementation Risk: While the subadviser strives to mitigate the likelihood of material implementation errors, it is impossible to completely eliminate the risk of error in the implementation of the computer models that guide the subadviser’s quantitative
72
investment processes. Additionally, it may be difficult to implement model recommendations in volatile and rapidly changing market conditions.
Non-Diversified Investment Company Risk: The Fund is non-diversified for purposes of the 1940 Act. This means that the Fund may invest a greater percentage of its assets in the securities of a single company or other issuer than a diversified fund. Investing in a non-diversified fund involves greater risk than investing in a diversified fund because a loss resulting from the decline in value of any one security may represent a greater portion of the total assets of a non-diversified fund.
Real Estate Investment Trust (“REIT”) Risk: Investing in REITs involves certain unique risks in addition to those risks associated with investing in the real estate industry in general. REITs may be affected by changes in the value of the underlying property owned by the REITs, while mortgage REITs may be affected by the quality of any credit extended. REITs are dependent upon management skills, may not be diversified geographically or by property/mortgage asset type, and are subject to heavy cash flow dependency, default by borrowers and self-liquidation. REITs may be more volatile and/or more illiquid than other types of equity securities. REITs (especially mortgage REITs) are subject to interest rate risks. REITs may incur significant amounts of leverage. The Fund will indirectly bear a portion of the expenses, including management fees, paid by each REIT in which it invests, in addition to the expenses of the Fund.
REITs must also meet certain requirements under the Internal Revenue Code of 1986, as amended (the Code) to avoid entity level tax and be eligible to pass-through certain tax attributes of their income to shareholders. REITs are consequently subject to the risk of failing to meet these requirements for favorable tax treatment and of failing to maintain their exemptions from registration under the Investment Company Act of 1940. REITs are subject to the risks of changes in the Code affecting their tax status.
Real Estate Related Securities Risk: Because the Fund invests in real estate securities, including REITs, the Fund is subject to the risks of investing in the real estate industry, such as changes in general and local economic conditions, the supply and demand for real estate and changes in zoning and tax laws. Since the Fund concentrates in the real estate industry, its holdings can vary significantly from broad market indices. As a result, the Fund’s performance can deviate from the performance of such indices. Because the Fund invests in stocks, there is the risk that the price of a particular stock owned by the Fund could go down or pay lower-than-expected or no dividends. In addition to an individual stock losing value, the value of the equity markets or of companies comprising the real estate industry could go down.
An investment in the Fund will be closely linked to the performance of the real estate markets. Real estate securities are subject to the same risks as direct investments in real estate and mortgages, and their value will depend on the value of the underlying properties or the underlying loans or interests. The underlying loans may be subject to the risks of default or of prepayments that occur earlier or later than expected, and such loans may also
73
Notes to Financial Statements (continued)
include so-called “subprime” mortgages. The value of these securities will rise and fall in response to many factors, including economic conditions, the demand for rental property and interest rates. In particular, the value of these securities may decline when interest rates rise and will also be affected by the real estate market and by the management of the underlying properties.
Sector Exposure Risk: At times, the Fund may have a significant portion of its assets invested in the same economic sector, such as the information technology sector. Issuers in the same economic sector may be similarly affected by economic or market events, making the Fund more vulnerable to unfavorable developments in that economic sector than funds that invest more broadly.
Selection Risk: Selection risk is the risk that the securities selected by the subadviser will underperform the market, the relevant indices, or other funds with similar investment objectives and investment strategies. Individual REIT prices may drop because of the failure of borrowers to pay their loans, a dividend reduction, a disruption to the real estate investment sales market, changes in federal or state taxation policies affecting REITs, or poor management of a REIT.
Value Style Risk: Since the Fund follows a value investment style, there is the risk that the value style may be out of favor for long periods of time, that the market will not recognize a security’s intrinsic value for a long time or at all, or that a stock judged to be undervalued may actually be appropriately priced or overvalued. Issuers of value stocks may have experienced adverse business developments or may be subject to special risks that have caused the stock to be out of favor. In addition, the Fund’s value investment style may go out of favor with investors, negatively affecting the Fund’s performance. If the Fund’s assessment of market conditions or a company’s value is inaccurate, the Fund could suffer losses or produce poor performance relative to other funds.
74
Report of Independent Registered Public Accounting Firm
To the Board of Trustees of Prudential Investment Portfolios 9 and Shareholders of PGIM Quant Solutions Large-Cap Core Fund, PGIM Real Estate Income Fund and PGIM Select Real Estate Fund
Opinions on the Financial Statements
We have audited the accompanying statements of assets and liabilities, including the schedules of investments, of PGIM Quant Solutions Large-Cap Core Fund, PGIM Real Estate Income Fund and PGIM Select Real Estate Fund (three of the funds constituting Prudential Investment Portfolios 9, hereafter collectively referred to as the “Funds”) as of October 31, 2024, the related statements of operations for the year ended October 31, 2024, the statements of changes in net assets for each of the two years in the period ended October 31, 2024, including the related notes, and the financial highlights for each of the five years in the period ended October 31, 2024 (collectively referred to as the “financial statements”). In our opinion, the financial statements present fairly, in all material respects, the financial position of each of the Funds as of October 31, 2024, the results of each of their operations for the year then ended, the changes in each of their net assets for each of the two years in the period ended October 31, 2024 and each of the financial highlights for each of the five years in the period ended October 31, 2024 in conformity with accounting principles generally accepted in the United States of America.
Basis for Opinions
These financial statements are the responsibility of the Funds’ management. Our responsibility is to express an opinion on the Funds’ financial statements based on our audits. We are a public accounting firm registered with the Public Company Accounting Oversight Board (United States) (PCAOB) and are required to be independent with respect to the Funds in accordance with the U.S. federal securities laws and the applicable rules and regulations of the Securities and Exchange Commission and the PCAOB.
We conducted our audits of these financial statements in accordance with the standards of the PCAOB. Those standards require that we plan and perform the audit to obtain reasonable assurance about whether the financial statements are free of material misstatement, whether due to error or fraud.
Our audits included performing procedures to assess the risks of material misstatement of the financial statements, whether due to error or fraud, and performing procedures that respond to those risks. Such procedures included examining, on a test basis, evidence regarding the amounts and disclosures in the financial statements. Our audits also included evaluating the accounting principles used and significant estimates made by management, as well as evaluating the overall presentation of the financial statements. Our procedures included confirmation of securities owned as of October 31, 2024 by correspondence with the custodian, transfer agent and brokers; when replies were not received from brokers, we performed other auditing procedures. We believe that our audits provide a reasonable basis for our opinions.
/s/PricewaterhouseCoopers LLP
New York, New York
December 18, 2024
We have served as the auditor of one or more investment companies in the PGIM Retail Funds complex since 2020.
75
Other Information
Form N-CSR Item 8 - Changes in and Disagreements with Accountants for Open-End Management Investment Companies - None.
Form N-CSR Item 9 - Proxy Disclosures for Open-End Management Investment Companies-None.
Form N-CSR Item 10 - Remuneration Paid to Directors, Officers, and Others of Open-End Management Investment Companies - Included within the Statement of Operations of the financial statements filed under Item 7 of this Form.
Form N-CSR Item 11 - Statement Regarding Basis for Approval of Investment Advisory Contract.
Approval of Advisory Agreements
PGIM Quant Solutions Large-Cap Core Fund
The Fund’s Board of Trustees
The Board of Trustees (the “Board”) of PGIM Quant Solutions Large-Cap Core Fund (the “Fund”)1 consists of ten individuals, eight of whom are not “interested persons” of the Fund, as defined in the Investment Company Act of 1940, as amended (the “1940 Act”) (the “Independent Trustees”). The Board is responsible for the oversight of the Fund and its operations, and performs the various duties imposed on the directors of investment companies by the 1940 Act. The Independent Trustees have retained independent legal counsel to assist them in connection with their duties. The Chair of the Board is an Independent Trustee. The Board has established five standing committees: the Audit Committee, the Nominating and Governance Committee, the Compliance Committee and two Investment Committees. Each committee is chaired by, and composed of, Independent Trustees.
Annual Approval of the Fund’s Advisory Agreements
As required under the 1940 Act, the Board determines annually whether to renew the Fund’s management agreement with PGIM Investments LLC (“PGIM Investments”) and the Fund’s subadvisory agreement with PGIM Quantitative Solutions LLC (“PGIM Quantitative Solutions”). In considering the renewal of the agreements, the Board, including all of the Independent Trustees, met on May 28 June 4-6, 2024 (the “Board Meeting”) and approved the renewal of the agreements through July 31, 2025, after concluding that the renewal of the agreements was in the best interests of the Fund and its shareholders.
In advance of the meetings, the Board requested and received materials relating to the agreements, and had the opportunity to ask questions and request further information in connection with its consideration. Among other things, the Board considered comparative fee information from PGIM Investments and PGIM Quantitative Solutions. Also, the Board considered comparisons with other mutual funds in relevant peer universes and peer groups, as is further discussed below.
In approving the agreements, the Board, including the Independent Trustees advised by independent legal counsel, considered the factors it deemed relevant, including the nature, quality and extent of services provided by PGIM Investments and the subadviser, the performance of the Fund, the profitability of PGIM Investments and its affiliates, expenses and fees, and the potential for economies of scale that may be shared with the Fund and its shareholders as the Fund’s assets grow. In their deliberations, the Trustees did not identify any single factor which alone was responsible for the Board’s decision to approve an
| 1 | PGIM Quant Solutions Large-Cap Core Fund is a series of Prudential Investment Portfolios 9. |
PGIM Quant Solutions Large-Cap Core Fund
Approval of Advisory Agreements (continued)
agreement with respect to the Fund. In connection with its deliberations, the Board considered information provided by PGIM Investments throughout the year at regular and special Board meetings, presentations from portfolio managers and other information, as well as information furnished at or in advance of the Board Meeting.
The Trustees determined that the overall arrangements between the Fund and PGIM Investments, which serves as the Fund’s investment manager pursuant to a management agreement, and between PGIM Investments and PGIM Quantitative Solutions, which serves as the Fund’s subadviser pursuant to the terms of a subadvisory agreement with PGIM Investments, are in the best interests of the Fund and its shareholders in light of the services performed, fees charged and such other matters as the Trustees considered relevant in the exercise of their business judgment. The Board considered the approval of the agreements for the Fund as part of its consideration of agreements for multiple funds, but its approvals were made on a fund-by-fund basis.
The material factors and conclusions that formed the basis for the Trustees’ reaching their determinations to approve the continuance of the agreements are separately discussed below.
Nature, Quality and Extent of Services
The Board received and considered information regarding the nature, quality and extent of services provided to the Fund by PGIM Investments and PGIM Quantitative Solutions. The Board noted that PGIM Quantitative Solutions is affiliated with PGIM Investments. The Board considered the services provided by PGIM Investments, including but not limited to the oversight of the subadviser for the Fund, as well as the provision of accounting oversight, fund recordkeeping, compliance and other services to the Fund, such as PGIM Investments’ role as administrator for the Fund’s liquidity risk management program and as valuation designee. With respect to PGIM Investments’ oversight of the subadviser, the Board noted that PGIM Investments’ Strategic Investment Research Group (“SIRG”), which is a business unit of PGIM Investments, is responsible for monitoring and reporting to PGIM Investments’ senior management on the performance and operations of the subadviser. The Board also considered that PGIM Investments pays the salaries of all of the officers and interested Trustees of the Fund who are part of Fund management. The Board also considered the investment subadvisory services provided by PGIM Quantitative Solutions, including investment research and security selection, as well as adherence to the Fund’s investment restrictions and compliance with applicable Fund policies and procedures. The Board considered PGIM Investments’ evaluation of the subadviser, as well as PGIM Investments’ recommendation, based on its review of the subadviser, to renew the subadvisory agreement.
The Board considered the qualifications, backgrounds and responsibilities of PGIM Investments’ senior management responsible for the oversight of the Fund and PGIM Quantitative Solutions, and also considered the qualifications, backgrounds and responsibilities of PGIM Quantitative Solutions’ portfolio managers who are responsible for the day-to-day management of the Fund’s portfolio. The Board was provided with
Visit our website at pgim.com/investments
information pertaining to PGIM Investments’ and PGIM Quantitative Solutions’ organizational structure, senior management, investment operations, and other relevant information pertaining to both PGIM Investments and PGIM Quantitative Solutions. The Board also noted that it received favorable compliance reports from the Fund’s Chief Compliance Officer (“CCO”) as to both PGIM Investments and PGIM Quantitative Solutions.
The Board concluded that it was satisfied with the nature, extent and quality of the investment management services provided by PGIM Investments and the subadvisory services provided to the Fund by PGIM Quantitative Solutions, and that there was a reasonable basis on which to conclude that the Fund benefits from the services provided by PGIM Investments and PGIM Quantitative Solutions under the management and subadvisory agreements.
Costs of Services and Profits Realized by PGIM Investments
The Board was provided with information on the profitability of PGIM Investments and its affiliates in serving as the Fund’s investment manager. The Board discussed with PGIM Investments the methodology utilized in assembling the information regarding profitability and considered its reasonableness. The Board recognized that it is difficult to make comparisons of profitability from fund management contracts because comparative information is not generally publicly available and is affected by numerous factors, including the structure of the particular adviser, the types of funds it manages, its business mix, numerous assumptions regarding allocations of direct and indirect costs and the adviser’s capital structure and cost of capital. Taking these factors into account, the Board concluded that the profitability of PGIM Investments and its affiliates in relation to the services rendered was not unreasonable.
Economies of Scale
The Board received and discussed information concerning economies of scale that PGIM Investments may realize as the Fund’s assets grow beyond current levels. The Board noted that the management fee schedule for the Fund includes breakpoints, which have the effect of decreasing the fee rate as assets increase. During the course of time, the Board has considered information regarding the launch date of the Fund, the management fees of the Fund compared to those of similarly managed funds and PGIM Investments’ investment in the Fund over time. The Board noted that economies of scale can be shared with the Fund in other ways, including low management fees from inception, additional technological and personnel investments to enhance shareholder services, and maintaining existing expense structures in the face of a rising cost environment. The Board also considered PGIM Investments’ assertion that it continually evaluates the management fee schedule of the Fund and the potential to share economies of scale through breakpoints or fee waivers as asset levels increase.
PGIM Quant Solutions Large-Cap Core Fund
Approval of Advisory Agreements (continued)
The Board recognized the inherent limitations of any analysis of economies of scale, stemming largely from the Board’s understanding that most of PGIM Investments’ costs are not specific to individual funds, but rather are incurred across a variety of products and services.
Other Benefits to PGIM Investments and PGIM Quantitative Solutions
The Board considered potential ancillary benefits that might be received by PGIM Investments, PGIM Quantitative Solutions and their affiliates as a result of their relationship with the Fund. The Board concluded that potential benefits to be derived by PGIM Investments included transfer agency fees received by the Fund’s transfer agent (which is affiliated with PGIM Investments), and benefits to its reputation as well as other intangible benefits resulting from PGIM Investments’ association with the Fund. The Board concluded that the potential benefits to be derived by PGIM Quantitative Solutions included its ability to use soft dollar credits, as well as the potential benefits consistent with those generally resulting from an increase in assets under management, specifically, potential access to additional research resources and benefits to its reputation. The Board concluded that the benefits derived by PGIM Investments and PGIM Quantitative Solutions were consistent with the types of benefits generally derived by investment managers and subadvisers to mutual funds.
Performance of the Fund / Fees and Expenses
The Board considered certain additional factors and made related conclusions relating to the historical performance of the Fund for the one-, three-, five- and ten-year periods ended December 31, 2023.
The Board also considered the Fund’s actual management fee, as well as the Fund’s net total expense ratio, for the fiscal year ended October 31, 2023. The Board considered the management fee for the Fund as compared to the management fee charged by PGIM Investments to other funds and the fee charged by other advisers to comparable mutual funds in a peer group. The actual management fee represents the fee rate actually paid by Fund shareholders and includes any fee waivers or reimbursements. The net total expense ratio for the Fund represents the actual expense ratio incurred by Fund shareholders.
The mutual funds included in the peer universe, which was used to consider performance, and the peer group, which was used to consider expenses and fees, were objectively determined by Broadridge, an independent provider of mutual fund data. In certain circumstances, PGIM Investments also provided supplemental peer universe or peer group information for reasons addressed with the Board. The comparisons placed the Fund in various quartiles over various periods, with the first quartile being the best 25% of the mutual funds (for performance, the best performing mutual funds and, for expenses, the lowest cost mutual funds).
Visit our website at pgim.com/investments
The section below summarizes key factors considered by the Board and the Board’s conclusions regarding the Fund’s performance, fees and overall expenses. The table sets forth net performance comparisons (which reflect the impact on performance of fund expenses, or any subsidies, expense caps or waivers that may be applicable) with the peer universe, actual management fees with the peer group (which reflect the impact of any subsidies or fee waivers), and net total expenses with the peer group, each of which were key factors considered by the Board.
| | | | | | | | |
| | | | | |
| Net Performance | | 1 Year | | 3 Years | | 5 Years | | 10 Years |
| | 2nd Quartile | | 1st Quartile | | 3rd Quartile | | 2nd Quartile |
Actual Management Fees: 1st Quartile |
Net Total Expenses: 1st Quartile |
| ● | The Board noted that the Fund outperformed its benchmark index over the one- and three-year periods and underperformed over the remaining periods. |
| ● | The Board and PGIM Investments agreed to retain the existing contractual expense cap, which (exclusive of certain fees and expenses) caps the Fund’s net annual operating expenses at 0.35% for each class of the Fund’s shares through February 28, 2025. |
| ● | The Board and PGIM Investments also agreed to retain the existing contractual expense cap that (exclusive of certain fees and expenses) limits the Fund’s total annual operating expenses to 0.72% of the average daily net assets for Class A shares, and 1.44% of the average daily net assets for Class C shares through February 28, 2025. |
| ● | In addition, PGIM Investments will waive management fees or shared operating expenses on any share class to the same extent that it waives such expenses on any other share class and has agreed that total annual fund operating expenses for Class R6 shares will not exceed total annual fund operating expenses for Class Z shares. |
| ● | The Board concluded that, in light of the above, it would be in the best interests of the Fund and its shareholders to renew the agreements. |
| ● | The Board concluded that the management fees (including subadvisory fees) and total expenses were reasonable in light of the services provided. |
* * *
After full consideration of these factors, the Board concluded that the approval of the agreements was in the best interests of the Fund and its shareholders.
PGIM Quant Solutions Large-Cap Core Fund
Approval of Advisory Agreements
PGIM Real Estate Income Fund
The Fund’s Board of Trustees
The Board of Trustees (the “Board”) of PGIM Real Estate Income Fund (the “Fund”)1 consists of ten individuals, eight of whom are not “interested persons” of the Fund, as defined in the Investment Company Act of 1940, as amended (the “1940 Act”) (the “Independent Trustees”). The Board is responsible for the oversight of the Fund and its operations, and performs the various duties imposed on the directors of investment companies by the 1940 Act. The Independent Trustees have retained independent legal counsel to assist them in connection with their duties. The Chair of the Board is an Independent Trustee. The Board has established five standing committees: the Audit Committee, the Nominating and Governance Committee, the Compliance Committee and two Investment Committees. Each committee is chaired by, and composed of, Independent Trustees.
Annual Approval of the Fund’s Advisory Agreements
As required under the 1940 Act, the Board determines annually whether to renew the Fund’s management agreement with PGIM Investments LLC (“PGIM Investments”) and the Fund’s subadvisory agreement with PGIM Real Estate (UK) Limited (“PGIM RE (UK)”) and PGIM, Inc. (“PGIM”) on behalf of its PGIM Real Estate unit (“PGIM Real Estate”). In considering the renewal of the agreements, the Board, including all of the Independent Trustees, met on May 28-5 and June 4-6, 2024 (the “Board Meeting”) and approved the renewal of the agreements through July 31, 2025, after concluding that the renewal of the agreements was in the best interests of the Fund and its shareholders.
In advance of the meetings, the Board requested and received materials relating to the agreements, and had the opportunity to ask questions and request further information in connection with its consideration. Among other things, the Board considered comparative fee information from PGIM Investments, PGIM RE (UK) and PGIM. Also, the Board considered comparisons with other mutual funds in relevant peer universes and peer groups, as is further discussed below.
In approving the agreements, the Board, including the Independent Trustees advised by independent legal counsel, considered the factors it deemed relevant, including the nature, quality and extent of services provided by PGIM Investments and the subadvisers, the performance of the Fund, the profitability of PGIM Investments and its affiliates, expenses and fees, and the potential for economies of scale that may be shared with the Fund and its shareholders as the Fund’s assets grow. In their deliberations, the Trustees did not identify
| 1 | PGIM Real Estate Income Fund is a series of Prudential Investment Portfolios 9. |
Visit our website at pgim.com/investments
any single factor which alone was responsible for the Board’s decision to approve an agreement with respect to the Fund. In connection with its deliberations, the Board considered information provided by PGIM Investments throughout the year at regular and special Board meetings, presentations from portfolio managers and other information, as well as information furnished at or in advance of the Board Meeting.
The Trustees determined that the overall arrangements between the Fund and PGIM Investments, which serves as the Fund’s investment manager pursuant to a management agreement, and between PGIM Investments and each of PGIM RE (UK) and PGIM, which serve as the Fund’s subadvisers pursuant to the terms of a subadvisory agreement with PGIM Investments, are in the best interests of the Fund and its shareholders in light of the services performed, fees charged and such other matters as the Trustees considered relevant in the exercise of their business judgment. The Board considered the approval of the agreements for the Fund as part of its consideration of agreements for multiple funds, but its approvals were made on a fund-by-fund basis.
The material factors and conclusions that formed the basis for the Trustees’ reaching their determinations to approve the continuance of the agreements are separately discussed below.
Nature, Quality and Extent of Services
The Board received and considered information regarding the nature, quality and extent of services provided to the Fund by PGIM Investments, PGIM RE (UK) and PGIM Real Estate. The Board noted that PGIM Real Estate and PGIM RE (UK) are affiliated with PGIM Investments. The Board considered the services provided by PGIM Investments, including but not limited to the oversight of the subadvisers for the Fund, as well as the provision of accounting oversight, fund recordkeeping, compliance and other services to the Fund such as PGIM Investments’ role as the administrator for the Fund’s liquidity risk management program and as valuation designee. With respect to PGIM Investments’ oversight of the subadvisers, the Board noted that PGIM Investments’ Strategic Investment Research Group (“SIRG”), which is a business unit of PGIM Investments, is responsible for monitoring and reporting to PGIM Investments’ senior management on the performance and operations of the subadvisers. The Board also considered that PGIM Investments pays the salaries of all of the officers and interested Trustees of the Fund who are part of Fund management. The Board also considered the investment subadvisory services provided by PGIM Real Estate and PGIM RE (UK), including investment research and security selection, as well as adherence to the Fund’s investment restrictions and compliance with applicable Fund policies and procedures. The Board considered PGIM Investments’ evaluation of the subadvisers, as well as PGIM Investments’ recommendation, based on its review of the subadvisers, to renew the subadvisory agreement.
PGIM Real Estate Income Fund
Approval of Advisory Agreements (continued)
The Board considered the qualifications, backgrounds and responsibilities of PGIM Investments’ senior management responsible for the oversight of the Fund, PGIM RE (UK) and PGIM Real Estate, and also considered the qualifications, backgrounds and responsibilities of the PGIM RE (UK) and PGIM Real Estate portfolio managers who are responsible for the day-to-day management of the Fund’s portfolio. The Board was provided with information pertaining to PGIM Investments’, PGIM Real Estate’s, PGIM RE (UK)’s and PGIM’s organizational structure, senior management, investment operations, and other relevant information pertaining to PGIM Investments, PGIM Real Estate, PGIM RE (UK) and PGIM. The Board also noted that it received favorable compliance reports from the Fund’s Chief Compliance Officer (“CCO”) as to PGIM Investments, PGIM Real Estate, PGIM RE (UK) and PGIM.
The Board concluded that it was satisfied with the nature, extent and quality of the investment management services provided by PGIM Investments and the subadvisory services provided to the Fund by PGIM Real Estate and PGIM RE (UK), and that there was a reasonable basis on which to conclude that the Fund benefits from the services provided by PGIM Investments, PGIM RE (UK) and PGIM Real Estate under the management and subadvisory agreements.
Costs of Services and Profits Realized by PGIM Investments
The Board was provided with information on the profitability of PGIM Investments and its affiliates in serving as the Fund’s investment manager. The Board discussed with PGIM Investments the methodology utilized in assembling the information regarding profitability and considered its reasonableness. The Board recognized that it is difficult to make comparisons of profitability from fund management contracts because comparative information is not generally publicly available and is affected by numerous factors, including the structure of the particular adviser, the types of funds it manages, its business mix, numerous assumptions regarding allocations of direct and indirect costs and the adviser’s capital structure and cost of capital. However, the Board considered that the cost of services provided by PGIM Investments to the Fund during the year ended December 31, 2023 exceeded the management fees paid by the Fund, resulting in an operating loss to PGIM Investments. Taking these factors into account, the Board concluded that the profitability of PGIM Investments and its affiliates in relation to the services rendered was not unreasonable.
Economies of Scale
The Board received and discussed information concerning economies of scale that PGIM Investments may realize as the Fund’s assets grow beyond current levels. The Board noted that the management fee schedule for the Fund includes breakpoints, which have the effect of decreasing the fee rate as assets increase. During the course of time, the Board
Visit our website at pgim.com/investments
has considered information regarding the launch date of the Fund, the management fees of the Fund compared to those of similarly managed funds and PGIM Investments’ investment in the Fund over time. The Board noted that economies of scale can be shared with the Fund in other ways, including low management fees from inception, additional technological and personnel investments to enhance shareholder services, and maintaining existing expense structures in the face of a rising cost environment. The Board also considered PGIM Investments’ assertion that it continually evaluates the management fee schedule of the Fund and the potential to share economies of scale through breakpoints or fee waivers as asset levels increase.
The Board recognized the inherent limitations of any analysis of economies of scale, stemming largely from the Board’s understanding that most of PGIM Investments’ costs are not specific to individual funds, but rather are incurred across a variety of products and services.
Other Benefits to PGIM Investments, PGIM RE (UK) and PGIM Real Estate
The Board considered potential ancillary benefits that might be received by PGIM Investments, PGIM Real Estate, PGIM RE (UK) and their affiliates as a result of their relationship with the Fund. The Board concluded that potential benefits to be derived by PGIM Investments included transfer agency fees received by the Fund’s transfer agent (which is affiliated with PGIM Investments), and benefits to its reputation as well as other intangible benefits resulting from PGIM Investments’ association with the Fund. The Board concluded that the potential benefits to be derived by PGIM Real Estate and PGIM RE (UK) included the ability to use soft dollar credits, as well as the potential benefits consistent with those generally resulting from an increase in assets under management, specifically, potential access to additional research resources and benefits to its reputation. The Board concluded that the benefits derived by PGIM Investments, PGIM Real Estate and PGIM RE (UK) were consistent with the types of benefits generally derived by investment managers and subadvisers to mutual funds.
Performance of the Fund / Fees and Expenses
The Board considered certain additional factors and made related conclusions relating to the historical performance of the Fund for the one-, three- and five-year periods ended December 31, 2023. The Board considered that the Fund commenced operations on June 3, 2015 and that longer-term performance was not yet available.
The Board also considered the Fund’s actual management fee, as well as the Fund’s net total expense ratio, for the fiscal year ended October 31, 2023. The Board considered the management fee for the Fund as compared to the management fee charged by PGIM Investments to other funds and the fee charged by other advisers to comparable mutual funds in a peer group. The actual management fee represents the fee rate actually paid by
PGIM Real Estate Income Fund
Approval of Advisory Agreements (continued)
Fund shareholders and includes any fee waivers or reimbursements. The net total expense ratio for the Fund represents the actual expense ratio incurred by Fund shareholders.
The mutual funds included in the peer universe, which was used to consider performance, and the peer group, which was used to consider expenses and fees, were objectively determined by Broadridge, an independent provider of mutual fund data. In certain circumstances, PGIM Investments also provided supplemental peer universe or peer group information for reasons addressed with the Board. The comparisons placed the Fund in various quartiles over various periods, with the first quartile being the best 25% of the mutual funds (for performance, the best performing mutual funds and, for expenses, the lowest cost mutual funds).
The section below summarizes key factors considered by the Board and the Board’s conclusions regarding the Fund’s performance, fees and overall expenses. The table sets forth net performance comparisons (which reflect the impact on performance of fund expenses, or any subsidies, expense caps or waivers that may be applicable) with the peer universe, actual management fees with the peer group (which reflect the impact of any subsidies or fee waivers), and net total expenses with the peer group, each of which were key factors considered by the Board.
| | | | | | | | |
| Net Performance | | 1 Year | | 3 Years | | 5 Years | | 10 Years |
| | 3rd Quartile | | 1st Quartile | | 1st Quartile | | N/A |
| Actual Management Fees: 1st Quartile |
| Net Total Expenses: 3rd Quartile |
| ● | The Board noted that the Fund outperformed its benchmark index over the three- and five- year periods, and underperformed over the one- year period. |
| ● | The Board and PGIM Investments agreed to a contractual expense cap, which (exclusive of certain fees and expenses) caps the Fund’s annual operating expenses at 1.35% for Class A shares, 2.10% for Class C shares, 1.10% for Class R6 shares, and 1.10% for Class Z shares through February 28, 2025. |
| ● | In addition, PGIM Investments will waive management fees or shared operating expenses on any share class to the same extent that it waives such expenses on any other share class and has agreed that total annual fund operating expenses for Class R6 shares will not exceed total annual fund operating expenses for Class Z shares. |
| ● | The Board concluded that, in light of the above, it would be in the best interests of the Fund and its shareholders to renew the agreements. |
| ● | The Board concluded that the management fees (including subadvisory fees) and total expenses were reasonable in light of the services provided. |
* * *
After full consideration of these factors, the Board concluded that the approval of the agreements was in the best interests of the Fund and its shareholders.
Visit our website at pgim.com/investments
Approval of Advisory Agreements
PGIM Select Real Estate Fund
The Fund’s Board of Trustees
The Board of Trustees (the “Board”) of PGIM Select Real Estate Fund (the “Fund”)1 consists of ten individuals, eight of whom are not “interested persons” of the Fund, as defined in the Investment Company Act of 1940, as amended (the “1940 Act”) (the “Independent Trustees”). The Board is responsible for the oversight of the Fund and its operations, and performs the various duties imposed on the directors of investment companies by the 1940 Act. The Independent Trustees have retained independent legal counsel to assist them in connection with their duties. The Chair of the Board is an Independent Trustee. The Board has established five standing committees: the Audit Committee, the Nominating and Governance Committee, the Compliance Committee and two Investment Committees. Each committee is chaired by, and composed of, Independent Trustees.
Annual Approval of the Fund’s Advisory Agreements
As required under the 1940 Act, the Board determines annually whether to renew the Fund’s management agreement with PGIM Investments LLC (“PGIM Investments”) and the Fund’s subadvisory agreement with PGIM, Inc. (“PGIM”) on behalf of its PGIM Real Estate unit (“PGIM Real Estate”), and PGIM Real Estate (UK) Limited (“PGIM RE (UK)”). In considering the renewal of the agreements, the Board, including all of the Independent Trustees, met on May 28 and June 4-6, 2024 (the “Board Meeting”) and approved the renewal of the agreements through July 31, 2025, after concluding that the renewal of the agreements was in the best interests of the Fund and its shareholders.
In advance of the meetings, the Board requested and received materials relating to the agreements, and had the opportunity to ask questions and request further information in connection with its consideration. Among other things, the Board considered comparative fee information from PGIM Investments, PGIM and PGIM RE (UK). Also, the Board considered comparisons with other mutual funds in relevant peer universes and peer groups, as is further discussed below.
In approving the agreements, the Board, including the Independent Trustees advised by independent legal counsel, considered the factors it deemed relevant, including the nature, quality and extent of services provided by PGIM Investments and the subadvisers, the performance of the Fund, the profitability of PGIM Investments and its affiliates, expenses and fees, and the potential for economies of scale that may be shared with the Fund and its
| 1 | PGIM Select Real Estate Fund is a series of Prudential Investment Portfolios 9. |
PGIM Select Real Estate Fund
Approval of Advisory Agreements (continued)
shareholders as the Fund’s assets grow. In their deliberations, the Trustees did not identify any single factor which alone was responsible for the Board’s decision to approve an agreement with respect to the Fund. In connection with its deliberations, the Board considered information provided by PGIM Investments throughout the year at regular and special Board meetings, presentations from portfolio managers and other information, as well as information furnished at or in advance of the Board Meeting.
The Trustees determined that the overall arrangements between the Fund and PGIM Investments, which serves as the Fund’s investment manager pursuant to a management agreement, and between PGIM Investments and each of PGIM, which, through its PGIM Real Estate unit, and PGIM RE (UK), serve as the Fund’s subadvisers pursuant to the terms of a subadvisory agreement with PGIM Investments, are in the best interests of the Fund and its shareholders in light of the services performed, fees charged and such other matters as the Trustees considered relevant in the exercise of their business judgment. The Board considered the approval of the agreements for the Fund as part of its consideration of agreements for multiple funds, but its approvals were made on a fund-by-fund basis.
The material factors and conclusions that formed the basis for the Trustees’ reaching their determinations to approve the continuance of the agreements are separately discussed below.
Nature, Quality and Extent of Services
The Board received and considered information regarding the nature, quality and extent of services provided to the Fund by PGIM Investments, PGIM Real Estate and PGIM RE (UK). The Board noted that PGIM Real Estate and PGIM RE (UK) are affiliated with PGIM Investments. The Board considered the services provided by PGIM Investments, including but not limited to the oversight of the subadvisers for the Fund, as well as the provision of accounting oversight, fund recordkeeping, compliance and other services to the Fund, such as PGIM Investments’ role as the administrator for the Fund’s liquidity risk management program and as valuation designee. With respect to PGIM Investments’ oversight of the subadvisers, the Board noted that PGIM Investments’ Strategic Investment Research Group (“SIRG”), which is a business unit of PGIM Investments, is responsible for monitoring and reporting to PGIM Investments’ senior management on the performance and operations of the subadvisers. The Board also considered that PGIM Investments pays the salaries of all of the officers and interested Trustees of the Fund who are part of Fund management. The Board also considered the investment subadvisory services provided by PGIM Real Estate and PGIM RE (UK), including investment research and security selection, as well as adherence to the Fund’s investment restrictions and compliance with applicable Fund policies and procedures. The Board considered PGIM Investments’ evaluation of the subadvisers, as well as PGIM Investments’ recommendation, based on its review of the subadvisers, to renew the subadvisory agreement.
Visit our website at pgim.com/investments
The Board considered the qualifications, backgrounds and responsibilities of PGIM Investments’ senior management responsible for the oversight of the Fund, PGIM Real Estate and PGIM RE (UK), and also considered the qualifications, backgrounds and responsibilities of the PGIM Real Estate and PGIM RE (UK) portfolio managers who are responsible for the day-to-day management of the Fund’s portfolio. The Board was provided with information pertaining to PGIM Investments’, PGIM Real Estate’s, PGIM’s and PGIM RE (UK)’s organizational structure, senior management, investment operations, and other relevant information pertaining to PGIM Investments, PGIM Real Estate, PGIM and PGIM RE (UK). The Board also noted that it received favorable compliance reports from the Fund’s Chief Compliance Officer (“CCO”) as to PGIM Investments, PGIM Real Estate, PGIM and PGIM RE (UK).
The Board concluded that it was satisfied with the nature, extent and quality of the investment management services provided by PGIM Investments and the subadvisory services provided to the Fund by PGIM Real Estate and PGIM RE (UK), and that there was a reasonable basis on which to conclude that the Fund benefits from the services provided by PGIM Investments, PGIM Real Estate and PGIM RE (UK) under the management and subadvisory agreements.
Costs of Services and Profits Realized by PGIM Investments
The Board was provided with information on the profitability of PGIM Investments and its affiliates in serving as the Fund’s investment manager. The Board discussed with PGIM Investments the methodology utilized in assembling the information regarding profitability and considered its reasonableness. The Board recognized that it is difficult to make comparisons of profitability from fund management contracts because comparative information is not generally publicly available and is affected by numerous factors, including the structure of the particular adviser, the types of funds it manages, its business mix, numerous assumptions regarding allocations of direct and indirect costs, and the adviser’s capital structure and cost of capital. Taking these factors into account, the Board concluded that the profitability of PGIM Investments and its affiliates in relation to the services rendered was not unreasonable.
Economies of Scale
The Board received and discussed information concerning economies of scale that PGIM Investments may realize as the Fund’s assets grow beyond current levels. The Board noted that the management fee schedule for the Fund includes breakpoints, which have the effect of decreasing the fee rate as assets increase. During the course of time, the Board has considered information regarding the launch date of the Fund, the management fees of the Fund compared to those of similarly managed funds and PGIM Investments’ investment in the Fund over time. The Board noted that economies of scale, can be shared with the Fund in other ways, including low management fees from inception, additional technological and personnel investments to enhance shareholder services, and maintaining
PGIM Select Real Estate Fund
Approval of Advisory Agreements (continued)
existing expense structures in the face of a rising cost environment. The Board considered PGIM Investments’ assertion that it continually evaluates the management fee schedule of the Fund and the potential to share economies of scale through breakpoints or fee waivers as asset levels increase.
The Board recognized the inherent limitations of any analysis of economies of scale, stemming largely from the Board’s understanding that most of PGIM Investments’ costs are not specific to individual funds, but rather are incurred across a variety of products and services.
Other Benefits to PGIM Investments, PGIM Real Estate and PGIM RE (UK)
The Board considered potential ancillary benefits that might be received by PGIM Investments, PGIM Real Estate, PGIM RE (UK) and their affiliates as a result of their relationship with the Fund. The Board concluded that potential benefits to be derived by PGIM Investments included transfer agency fees received by the Fund’s transfer agent (which is affiliated with PGIM Investments), and benefits to its reputation as well as other intangible benefits resulting from PGIM Investments’ association with the Fund. The Board concluded that the potential benefits to be derived by PGIM Real Estate and PGIM RE (UK) included their ability to use soft dollar credits, as well as the potential benefits consistent with those generally resulting from an increase in assets under management, specifically, potential access to additional research resources and benefits to its reputation. The Board concluded that the benefits derived by PGIM Investments, PGIM Real Estate and PGIM RE (UK) were consistent with the types of benefits generally derived by investment managers and subadvisers to mutual funds.
Performance of the Fund / Fees and Expenses
The Board considered certain additional factors and made related conclusions relating to the historical performance of the Fund for the one-, three- and five-year periods ended December 31, 2023. The Board considered that the Fund commenced investment operations on August 1, 2014 and that longer-term performance was not yet available.
The Board also considered the Fund’s actual management fee, as well as the Fund’s net total expense ratio, for the fiscal year ended October 31, 2023. The Board considered the management fee for the Fund as compared to the management fee charged by PGIM Investments to other funds and the fee charged by other advisers to comparable mutual funds in a peer group. The actual management fee represents the fee rate actually paid by Fund shareholders and includes any fee waivers or reimbursements. The net total expense ratio for the Fund represents the actual expense ratio incurred by Fund shareholders.
The mutual funds included in the peer universe, which was used to consider performance, and the peer group, which was used to consider expenses and fees, were objectively determined by Broadridge, an independent provider of mutual fund data. In certain
Visit our website at pgim.com/investments
circumstances, PGIM Investments also provided supplemental peer universe or peer group information for reasons addressed with the Board. The comparisons placed the Fund in various quartiles over various periods, with the first quartile being the best 25% of the mutual funds (for performance, the best performing mutual funds and, for expenses, the lowest cost mutual funds).
The section below summarizes key factors considered by the Board and the Board’s conclusions regarding the Fund’s performance, fees and overall expenses. The table sets forth net performance comparisons (which reflect the impact on performance of fund expenses, or any subsidies, expense caps or waivers that may be applicable) with the peer universe, actual management fees with the peer group (which reflect the impact of any subsidies or fee waivers), and net total expenses with the peer group, each of which were key factors considered by the Board.
| | | | | | | | |
| Net Performance | | 1 Year | | 3 Years | | 5 Years | | 10 Years |
| | 1st Quartile | | 1st Quartile | | 1st Quartile | | N/A |
| Actual Management Fees: 3rd Quartile |
| Net Total Expenses: 2nd Quartile |
| ● | The Board noted that the Fund outperformed its benchmark index over all periods. |
| ● | The Board and PGIM Investments agreed to retain the existing contractual expense cap that (exclusive of certain fees and expenses) caps total annual operating expenses at 1.30% for Class A shares, 2.05% for Class C shares, 1.05% for Class R6 shares, and 1.05% for Class Z shares through February 28, 2025. |
| ● | In addition, PGIM Investments will waive management fees or shared operating expenses on any share class to the same extent that it waives such expenses on any other share class and has agreed that total annual fund operating expenses for Class R6 shares will not exceed total annual fund operating expenses for Class Z shares. |
| ● | The Board concluded that, in light of the above, it would be in the best interests of the Fund and its shareholders to renew the agreements. |
| ● | The Board concluded that the management fees (including subadvisory fees) and total expenses were reasonable in light of the services provided. |
* * *
After full consideration of these factors, the Board concluded that the approval of the agreements was in the best interests of the Fund and its shareholders.
PGIM Select Real Estate Fund

PRUDENTIAL INVESTMENT PORTFOLIOS 9
PGIM Absolute Return Bond Fund
FINANCIAL STATEMENTS AND OTHER INFORMATION
OCTOBER 31, 2024

| | | | |
Table of Contents | | Financial Statements and Other Information | | October 31, 2024 |
Form N-CSR Item 7 - Financial Statements and Financial Highlights for Open-End Management Investment Companies.
Other Information - Form N-CSR Items 8-11
Schedule of Investments
as of October 31, 2024
| | | | | | | | | | | | | | | | |
| | | | |
| Description | | Interest Rate | | | Maturity Date | | | Principal Amount (000)# | | | Value | |
| | | | |
LONG-TERM INVESTMENTS 98.5% | | | | | | | | | | | | | | | | |
| | | | |
ASSET-BACKED SECURITIES 23.8% | | | | | | | | | | | | | | | | |
| | | | |
Automobiles 1.0% | | | | | | | | | | | | | | | | |
| | | | |
Ally Bank Auto Credit-Linked Notes,
Series 2024-A, Class E, 144A | | | 7.917% | | | | 05/17/32 | | | | 1,895 | | | $ | 1,919,970 | |
Avis Budget Rental Car Funding AESOP LLC, | | | | | | | | | | | | | | | | |
Series 2022-05A, Class C, 144A | | | 6.240 | | | | 04/20/27 | | | | 1,100 | | | | 1,103,726 | |
Series 2023-02A, Class C, 144A | | | 6.180 | | | | 10/20/27 | | | | 800 | | | | 800,744 | |
Series 2023-05A, Class C, 144A | | | 6.850 | | | | 04/20/28 | | | | 500 | | | | 508,087 | |
Series 2023-08A, Class C, 144A | | | 7.340 | | | | 02/20/30 | | | | 2,700 | | | | 2,816,880 | |
Series 2024-01A, Class C, 144A | | | 6.480 | | | | 06/20/30 | | | | 2,200 | | | | 2,218,370 | |
Bayview Opportunity Master Fund VII LLC,
Series 2024-CAR01, Class E, 144A, 30 Day Average SOFR + 3.600% (Cap N/A, Floor 0.000%) | | | 8.457(c) | | | | 12/26/31 | | | | 1,158 | | | | 1,160,761 | |
Bayview Opportunity Master Fund VII Trust,
Series 2024-CAR1F, Class A, 144A | | | 6.971 | | | | 07/29/32 | | | | 645 | | | | 643,934 | |
Enterprise Fleet Financing LLC,
Series 2023-02, Class A2, 144A | | | 5.560 | | | | 04/22/30 | | | | 1,903 | | | | 1,916,731 | |
Ford Credit Auto Owner Trust,
Series 2023-02, Class D, 144A | | | 6.600 | | | | 02/15/36 | | | | 1,200 | | | | 1,221,782 | |
Ford Credit Floorplan Master Owner Trust,
Series 2023-01, Class A1, 144A | | | 4.920 | | | | 05/15/28 | | | | 2,600 | | | | 2,608,998 | |
OneMain Direct Auto Receivables Trust, | | | | | | | | | | | | | | | | |
Series 2019-01A, Class B, 144A | | | 3.950 | | | | 11/14/28 | | | | 1,700 | | | | 1,670,533 | |
Series 2021-01A, Class D, 144A | | | 1.620 | | | | 11/14/30 | | | | 200 | | | | 191,313 | |
Series 2022-01A, Class D, 144A | | | 5.900 | | | | 12/16/30 | | | | 2,900 | | | | 2,899,805 | |
Series 2023-01A, Class D, 144A | | | 7.070 | | | | 02/14/33 | | | | 3,700 | | | | 3,811,663 | |
Santander Bank Auto Credit-Linked Notes, | | | | | | | | | | | | | | | | |
Series 2022-A, Class C, 144A | | | 7.375 | | | | 05/15/32 | | | | 93 | | | | 93,885 | |
Series 2022-C, Class E, 144A | | | 11.366 | | | | 12/15/32 | | | | 71 | | | | 72,224 | |
Series 2023-A, Class E, 144A | | | 10.068 | | | | 06/15/33 | | | | 266 | | | | 270,078 | |
Series 2023-B, Class G, 144A | | | 17.128 | | | | 12/15/33 | | | | 835 | | | | 849,822 | |
Santander Drive Auto Receivables Trust,
Series 2023-02, Class C | | | 5.470 | | | | 12/16/30 | | | | 1,250 | | | | 1,259,690 | |
| | | | | | | | | | | | | | | | |
| | | | |
| | | | | | | | | | | | | | | 28,038,996 | |
| | | | |
Collateralized Loan Obligations 21.1% | | | | | | | | | | | | | | | | |
| | | | |
AGL CLO Ltd. (Cayman Islands),
Series 2020-09A, Class AR, 144A, 3 Month SOFR + 1.530% (Cap N/A, Floor 1.530%) | | | 6.147(c) | | | | 04/20/37 | | | | 19,500 | | | | 19,544,390 | |
See Notes to Financial Statements.
PGIM Absolute Return Bond Fund 1
Schedule of Investments (continued)
as of October 31, 2024
| | | | | | | | | | | | | | | | |
| | | | |
| Description | | Interest Rate | | | Maturity Date | | | Principal Amount (000)# | | | Value | |
| | | | |
ASSET-BACKED SECURITIES (Continued) | | | | | | | | | | | | | | | | |
| | | | |
Collateralized Loan Obligations (cont’d.) | | | | | | | | | | | | | | | | |
| | | | |
AlbaCore EURO CLO DAC (Ireland), | | | | | | | | | | | | | | | | |
Series 02A, Class B, 144A, 3 Month EURIBOR + 1.650% (Cap N/A, Floor 1.650%) | | | 5.131%(c) | | | | 06/15/34 | | | EUR | 1,000 | | | $ | 1,085,951 | |
Series 02X, Class B, 3 Month EURIBOR + 1.650% (Cap N/A, Floor 1.650%) | | | 5.131(c) | | | | 06/15/34 | | | EUR | 4,000 | | | | 4,343,804 | |
Anchorage Capital CLO Ltd. (Cayman Islands), | | | | | | | | | | | | | | | | |
Series 2019-11A, Class AR2, 144A, 3 Month SOFR + 1.530% (Cap N/A, Floor 1.530%) | | | 6.162(c) | | | | 07/22/37 | | | | 16,000 | | | | 16,041,054 | |
Anchorage Capital Europe CLO DAC (Ireland), | | | | | | | | | | | | | | | | |
Series 06A, Class B1R, 144A, 3 Month EURIBOR + 2.750% (Cap N/A, Floor 2.750%) | | | 5.951(c) | | | | 01/22/38 | | | EUR | 5,000 | | | | 5,507,761 | |
Apex Credit CLO LLC (Cayman Islands), | | | | | | | | | | | | | | | | |
Series 2021-02A, Class A1A, 144A, 3 Month SOFR + 1.492% (Cap N/A, Floor 1.230%) | | | 6.109(c) | | | | 10/20/34 | | | | 5,000 | | | | 5,003,245 | |
Arbour CLO DAC (Ireland), | | | | | | | | | | | | | | | | |
Series 04A, Class BRR, 144A, 3 Month EURIBOR + 1.300% (Cap N/A, Floor 1.300%) | | | 4.484(c) | | | | 04/15/34 | | | EUR | 5,000 | | | | 5,358,490 | |
Ares European CLO DAC (Ireland), | | | | | | | | | | | | | | | | |
Series 2013-06A, Class B1RR, 144A, 3 Month EURIBOR + 1.250% (Cap N/A, Floor 1.250%) | | | 4.434(c) | | | | 04/15/30 | | | EUR | 2,500 | | | | 2,718,214 | |
Atlas Static Senior Loan Fund Ltd. (Cayman Islands), | | | | | | | | | | | | | | | | |
Series 2022-01A, Class AR, 144A, 3 Month SOFR + 1.750% (Cap N/A, Floor 1.750%) | | | 6.406(c) | | | | 07/15/30 | | | | 3,795 | | | | 3,807,109 | |
Bain Capital Credit CLO Ltd. (Cayman Islands), | | | | | | | | | | | | | | | | |
Series 2022-01A, Class A1, 144A, 3 Month SOFR + 1.320% (Cap N/A, Floor 1.320%) | | | 5.952(c) | | | | 04/18/35 | | | | 1,500 | | | | 1,500,748 | |
Barings Euro CLO DAC (Ireland), | | | | | | | | | | | | | | | | |
Series 2020-01A, Class AR, 144A, 3 Month EURIBOR + 0.980% (Cap N/A, Floor 0.980%) | | | 4.199(c) | | | | 10/21/34 | | | EUR | 3,000 | | | | 3,255,049 | |
Series 2021-01A, Class A, 144A, 3 Month EURIBOR + 0.800% (Cap N/A, Floor 0.800%) | | | 3.898(c) | | | | 04/24/34 | | | EUR | 2,800 | | | | 3,033,599 | |
Barrow Hanley CLO Ltd. (Cayman Islands), | | | | | | | | | | | | | | | | |
Series 2024-03A, Class A1, 144A, 3 Month SOFR + 1.620% (Cap N/A, Floor 1.620%) | | | 6.237(c) | | | | 04/20/37 | | | | 19,500 | | | | 19,637,095 | |
Battalion CLO Ltd. (Cayman Islands), | | | | | | | | | | | | | | | | |
Series 2016-10A, Class A1R2, 144A, 3 Month SOFR + 1.432% (Cap N/A, Floor 1.170%) | | | 6.066(c) | | | | 01/25/35 | | | | 4,740 | | | | 4,742,440 | |
Canyon Capital CLO Ltd. (Cayman Islands), | | | | | | | | | | | | | | | | |
Series 2019-01A, Class BRR, 144A, 3 Month SOFR + 1.800% (Cap N/A, Floor 1.800%) | | | 6.456(c) | | | | 07/15/37 | | | | 10,000 | | | | 10,010,000 | |
See Notes to Financial Statements.
2
| | | | | | | | | | | | | | | | |
| | | | |
| Description | | Interest Rate | | | Maturity Date | | | Principal Amount (000)# | | | Value | |
| | | | |
ASSET-BACKED SECURITIES (Continued) | | | | | | | | | | | | | | | | |
| | | | |
Collateralized Loan Obligations (cont’d.) | | | | | | | | | | | | | | | | |
| | | | |
Carlyle Euro CLO DAC (Ireland), | | | | | | | | | | | | | | | | |
Series 2019-01A, Class A1R, 144A, 3 Month EURIBOR + 0.750% (Cap N/A, Floor 0.750%) | | | 4.231%(c) | | | | 03/15/32 | | | EUR | 1,666 | | | $ | 1,806,052 | |
Series 2019-01A, Class A2RB, 144A | | | 2.100 | | | | 03/15/32 | | | EUR | 6,500 | | | | 6,651,602 | |
Series 2022-05A, Class A2R, 144A, 3 Month EURIBOR + 2.200% (Cap N/A, Floor 2.200%) | | | 5.286(c) | | | | 04/25/37 | | | EUR | 6,000 | | | | 6,527,157 | |
Cathedral Lake Ltd. (Cayman Islands), | | | | | | | | | | | | | | | | |
Series 2021-07RA, Class AR, 144A, 3 Month SOFR + 1.180% (Cap N/A, Floor 1.180%) | | | 5.836(c) | | | | 01/15/32 | | | | 9,392 | | | | 9,394,372 | |
CIFC Funding Ltd. (Cayman Islands), | | | | | | | | | | | | | | | | |
Series 2015-01A, Class ARR, 144A, 3 Month SOFR + 1.372% (Cap N/A, Floor 1.110%) | | | 6.003(c) | | | | 01/22/31 | | | | 3,880 | | | | 3,885,870 | |
Clover CLO LLC, | | | | | | | | | | | | | | | | |
Series 2018-01A, Class A1RR, 144A, 3 Month SOFR + 1.530% (Cap N/A, Floor 1.530%) | | | 6.147(c) | | | | 04/20/37 | | | | 15,000 | | | | 15,033,912 | |
Columbia Cent CLO Ltd. (Cayman Islands), | | | | | | | | | | | | | | | | |
Series 2020-29A, Class BR, 144A, 3 Month SOFR + 1.962% (Cap N/A, Floor 0.000%) | | | 6.579(c) | | | | 10/20/34 | | | | 11,335 | | | | 11,335,116 | |
Crown City CLO (Cayman Islands), | | | | | | | | | | | | | | | | |
Series 2020-02A, Class A1AR, 144A, 3 Month SOFR + 1.340% (Cap N/A, Floor 1.340%) | | | 5.957(c) | | | | 04/20/35 | | | | 2,750 | | | | 2,750,711 | |
Elevation CLO Ltd. (Cayman Islands), | | | | | | | | | | | | | | | | |
Series 2021-12A, Class A1R, 144A, 3 Month SOFR + 1.620% (Cap N/A, Floor 1.620%) | | | 6.237(c) | | | | 04/20/37 | | | | 10,000 | | | | 10,038,717 | |
Series 2023-17A, Class A1, 144A, 3 Month SOFR + 1.870% (Cap N/A, Floor 1.870%) | | | 6.487(c) | | | | 10/20/36 | | | | 10,000 | | | | 10,104,101 | |
Elmwood CLO Ltd. (Cayman Islands), | | | | | | | | | | | | | | | | |
Series 2024-05A, Class AR1, 144A, 3 Month SOFR + 1.520% (Cap N/A, Floor 1.520%) | | | 6.137(c) | | | | 04/20/37 | | | | 10,000 | | | | 10,051,200 | |
Series 2024-05A, Class BR, 144A, 3 Month SOFR + 2.000% (Cap N/A, Floor 2.000%) | | | 6.617(c) | | | | 04/20/37 | | | | 10,000 | | | | 10,031,541 | |
Generate CLO Ltd. (Cayman Islands), | | | | | | | | | | | | | | | | |
Series 04A, Class ARR, 144A, 3 Month SOFR + 1.430% (Cap N/A, Floor 1.430%) | | | 6.047(c) | | | | 07/20/37 | | | | 13,395 | | | | 13,454,896 | |
Series 07A, Class A1R, 144A, 3 Month SOFR + 1.620% (Cap N/A, Floor 1.620%) | | | 6.252(c) | | | | 04/22/37 | | | | 5,050 | | | | 5,081,931 | |
Grosvenor Place CLO DAC (Ireland), | | | | | | | | | | | | | | | | |
Series 2022-01A, Class AR, 144A, 3 Month EURIBOR + 1.600% (Cap N/A, Floor 1.600%) | | | 5.141(c) | | | | 05/24/38 | | | EUR | 17,500 | | | | 19,133,639 | |
Harvest CLO DAC (Ireland), | | | | | | | | | | | | | | | | |
Series 32A, Class A, 144A, 3 Month EURIBOR + 1.450% (Cap N/A, Floor 1.450%) | | | 5.148(c) | | | | 07/25/37 | | | EUR | 7,000 | | | | 7,645,240 | |
See Notes to Financial Statements.
PGIM Absolute Return Bond Fund 3
Schedule of Investments (continued)
as of October 31, 2024
| | | | | | | | | | | | | | | | |
| | | | |
| Description | | Interest Rate | | | Maturity Date | | | Principal Amount (000)# | | | Value | |
| | | | |
ASSET-BACKED SECURITIES (Continued) | | | | | | | | | | | | | | | | |
| | | | |
Collateralized Loan Obligations (cont’d.) | | | | | | | | | | | | | | | | |
| | | | |
Harvest CLO DAC (Ireland), (cont’d.) | | | | | | | | | | | | | | | | |
Series 32A, Class B, 144A, 3 Month EURIBOR + 2.050% (Cap N/A, Floor 2.050%) | | | 5.748%(c) | | | | 07/25/37 | | | EUR | 13,750 | | | $ | 14,976,983 | |
ICG Euro CLO DAC (Ireland), | | | | | | | | | | | | | | | | |
Series 2023-02A, Class A1, 144A, 3 Month EURIBOR + 1.730% (Cap N/A, Floor 1.730%) | | | 4.802(c) | | | | 01/26/38 | | | EUR | 6,000 | | | | 6,570,836 | |
Series 2023-02A, Class B1, 144A, 3 Month EURIBOR + 2.750% (Cap N/A, Floor 2.750%) | | | 5.822(c) | | | | 01/26/38 | | | EUR | 5,000 | | | | 5,505,766 | |
Indigo Credit Management DAC (Ireland), | | | | | | | | | | | | | | | | |
Series 02A, Class C, 144A, 3 Month EURIBOR + 2.650% (Cap N/A, Floor 2.650%) | | | 2.650(c) | | | | 07/15/38 | | | EUR | 6,500 | | | | 7,070,375 | |
Invesco Euro CLO (Ireland), | | | | | | | | | | | | | | | | |
Series 06A, Class B1, 144A, 3 Month EURIBOR + 1.650% (Cap N/A, Floor 1.650%) | | | 4.834(c) | | | | 07/15/34 | | | EUR | 9,250 | | | | 9,983,208 | |
Jubilee CLO DAC (Ireland), | | | | | | | | | | | | | | | | |
Series 2018-21A, Class BR, 144A, 3 Month EURIBOR + 1.400% (Cap N/A, Floor 1.400%) | | | 4.584(c) | | | | 04/15/35 | | | EUR | 10,000 | | | | 10,822,101 | |
KKR CLO Ltd. (Cayman Islands), | | | | | | | | | | | | | | | | |
Series 17, Class AR, 144A, 3 Month SOFR + 1.342% (Cap N/A, Floor 1.080%) | | | 5.998(c) | | | | 04/15/34 | | | | 3,300 | | | | 3,306,930 | |
Madison Park Euro Funding DAC (Ireland), | | | | | | | | | | | | | | | | |
Series 16A, Class A, 144A, 3 Month EURIBOR + 0.790% (Cap N/A, Floor 0.790%) | | | 3.969(c) | | | | 05/25/34 | | | EUR | 2,500 | | | | 2,707,087 | |
Madison Park Funding Ltd. (Cayman Islands), | | | | | | | | | | | | | | | | |
Series 2019-33A, Class AR, 144A, 3 Month SOFR + 1.290% (Cap N/A, Floor 1.290%) | | | 5.946(c) | | | | 10/15/32 | | | | 5,500 | | | | 5,504,715 | |
Series 2021-59A, Class BR, 144A, 3 Month SOFR + 1.920% (Cap N/A, Floor 1.920%) | | | 6.552(c) | | | | 04/18/37 | | | | 10,000 | | | | 10,011,524 | |
MidOcean Credit CLO (Cayman Islands), | | | | | | | | | | | | | | | | |
Series 2014-03A, Class BR, 144A, 3 Month SOFR + 2.062% (Cap N/A, Floor 1.800%) | | | 6.679(c) | | | | 04/21/31 | | | | 18,000 | | | | 18,021,029 | |
Monument CLO DAC (Ireland), | | | | | | | | | | | | | | | | |
Series 01A, Class A, 144A, 3 Month EURIBOR + 1.590% (Cap N/A, Floor 1.590%) | | | 5.332(c) | | | | 05/15/37 | | | EUR | 20,000 | | | | 21,857,912 | |
Series 01A, Class D, 144A, 3 Month EURIBOR + 4.350% (Cap N/A, Floor 4.350%) | | | 8.092(c) | | | | 05/15/37 | | | EUR | 4,150 | | | | 4,612,939 | |
Oak Hill European Credit Partners (Ireland), | | | | | | | | | | | | | | | | |
Series 2021-08A, Class B1, 144A, 3 Month EURIBOR + 1.350% (Cap N/A, Floor 1.350%) | | | 4.558(c) | | | | 04/18/35 | | | EUR | 12,000 | | | | 12,911,740 | |
Oaktree CLO Ltd. (Cayman Islands), | | | | | | | | | | | | | | | | |
Series 2020-01A, Class AR, 144A, 3 Month SOFR + 1.412% (Cap N/A, Floor 1.150%) | | | 6.068(c) | | | | 07/15/34 | | | | 6,195 | | | | 6,204,240 | |
See Notes to Financial Statements.
4
| | | | | | | | | | | | | | | | |
| | | | |
| Description | | Interest Rate | | | Maturity Date | | | Principal Amount (000)# | | | Value | |
| | | | |
ASSET-BACKED SECURITIES (Continued) | | | | | | | | | | | | | | | | |
| | | | |
Collateralized Loan Obligations (cont’d.) | | | | | | | | | | | | | | | | |
| | | | |
OFSI BSL Ltd. (Cayman Islands), | | | | | | | | | | | | | | | | |
Series 2022-11A, Class A1R, 144A, 3 Month SOFR + 2.050% (Cap N/A, Floor 2.050%) | | | 6.682%(c) | | | | 10/18/35 | | | | 10,000 | | | $ | 10,037,034 | |
Palmer Square European CLO DAC (Ireland), | | | | | | | | | | | | | | | | |
Series 2022-02A, Class AR, 144A, 3 Month EURIBOR + 1.600% (Cap N/A, Floor 1.600%) | | | 4.784(c) | | | | 01/15/38 | | | EUR | 10,000 | | | | 10,925,299 | |
Penta CLO DAC (Ireland), | | | | | | | | | | | | | | | | |
Series 2018-05A, Class B1R, 144A, 3 Month EURIBOR + 1.550% (Cap N/A, Floor 1.550%) | | | 4.769(c) | | | | 04/20/35 | | | EUR | 10,000 | | | | 10,841,851 | |
Rad CLO Ltd. (Cayman Islands), | | | | | | | | | | | | | | | | |
Series 2023-19A, Class A1, 144A, 3 Month SOFR + 2.000% (Cap N/A, Floor 2.000%) | | | 6.617(c) | | | | 04/20/35 | | | | 7,000 | | | | 7,048,703 | |
Regatta Funding Ltd. (Cayman Islands), | | | | | | | | | | | | | | | | |
Series 2017-01A, Class A1R, 144A, 3 Month SOFR + 1.550% (Cap N/A, Floor 1.550%) | | | 6.197(c) | | | | 04/17/37 | | | | 18,000 | | | | 18,047,086 | |
Rockford Tower CLO Ltd., | | | | | | | | | | | | | | | | |
Series 2022-02A, Class A1R, 144A, 3 Month SOFR + 1.850% (Cap N/A, Floor 1.850%) | | | 6.467(c) | | | | 10/20/35 | | | | 11,500 | | | | 11,566,876 | |
Romark WM-R Ltd. (Cayman Islands), | | | | | | | | | | | | | | | | |
Series 2018-01A, Class A1, 144A, 3 Month SOFR + 1.292% (Cap N/A, Floor 0.000%) | | | 5.909(c) | | | | 04/20/31 | | | | 907 | | | | 908,279 | |
Silver Rock CLO Ltd. (Cayman Islands), | | | | | | | | | | | | | | | | |
Series 2021-02A, Class A, 144A, 3 Month SOFR + 1.452% (Cap N/A, Floor 1.190%) | | | 6.069(c) | | | | 01/20/35 | | | | 10,000 | | | | 10,009,806 | |
Sona Fios CLO DAC (Ireland), | | | | | | | | | | | | | | | | |
Series 01A, Class A1, 144A, 3 Month EURIBOR + 1.850% (Cap N/A, Floor 1.850%) | | | 5.034(c) | | | | 07/15/36 | | | EUR | 13,250 | | | | 14,510,485 | |
St. Pauls CLO DAC (Ireland), | | | | | | | | | | | | | | | | |
Series 02A, Class AR4, 144A, 3 Month EURIBOR + 0.980% (Cap N/A, Floor 0.980%) | | | 4.066(c) | | | | 10/25/35 | | | EUR | 8,000 | | | | 8,684,716 | |
THL Credit Wind River CLO Ltd. (Cayman Islands), | | | | | | | | | | | | | | | | |
Series 2020-01A, Class BR, 144A, 3 Month SOFR + 2.100% (Cap N/A, Floor 2.100%) | | | 6.717(c) | | | | 07/20/37 | | | | 5,000 | | | | 5,032,732 | |
Tikehau US CLO Ltd. (Bermuda), | | | | | | | | | | | | | | | | |
Series 2023-02A, Class A1, 144A, 3 Month SOFR + 1.950% (Cap N/A, Floor 1.950%) | | | 6.606(c) | | | | 01/15/36 | | | | 13,250 | | | | 13,418,441 | |
Toro European CLO DAC (Ireland), | | | | | | | | | | | | | | | | |
Series 09A, Class A, 144A, 3 Month EURIBOR + 1.650% (Cap N/A, Floor 1.650%) | | | 4.829(c) | | | | 04/15/37 | | | EUR | 9,000 | | | | 9,854,327 | |
Trinitas CLO Ltd. (Bermuda), | | | | | | | | | | | | | | | | |
Series 2023-26A, Class B, 144A, 3 Month SOFR + 2.500% (Cap N/A, Floor 2.500%) | | | 7.117(c) | | | | 01/20/35 | | | | 3,750 | | | | 3,770,004 | |
See Notes to Financial Statements.
PGIM Absolute Return Bond Fund 5
Schedule of Investments (continued)
as of October 31, 2024
| | | | | | | | | | | | | | | | |
| | | | |
| Description | | Interest Rate | | | Maturity Date | | | Principal Amount (000)# | | | Value | |
| | | | |
ASSET-BACKED SECURITIES (Continued) | | | | | | | | | | | | | | | | |
| | | | |
Collateralized Loan Obligations (cont’d.) | | | | | | | | | | | | | | | | |
| | | | |
Trinitas CLO Ltd. (Bermuda), | | | | | | | | | | | | | | | | |
Series 2024-24A, Class A1, 144A, 3 Month SOFR + 1.600% (Cap N/A, Floor 1.600%) | | | 6.226%(c) | | | | 04/25/37 | | | | 6,000 | | | $ | 6,031,670 | |
Warwick Capital CLO Ltd. (United Kingdom), | | | | | | | | | | | | | | | | |
Series 2023-02A, Class A1, 144A, 3 Month SOFR + 1.950% (Cap N/A, Floor 1.950%) | | | 6.606(c) | | | | 01/15/37 | | | | 12,500 | | | | 12,623,306 | |
Wellfleet CLO Ltd. (Cayman Islands), | | | | | | | | | | | | | | | | |
Series 2022-02A, Class AR, 144A, 3 Month SOFR + 1.420% (Cap N/A, Floor 1.420%) | | | 6.052(c) | | | | 10/18/37 | | | | 15,000 | | | | 14,999,554 | |
Wellfleet CLO Ltd., | | | | | | | | | | | | | | | | |
Series 2017-03A, Class A1, 144A, 3 Month SOFR + 1.412% (Cap N/A, Floor 1.150%) | | | 6.059(c) | | | | 01/17/31 | | | | 3,144 | | | | 3,145,167 | |
Zais CLO Ltd. (Cayman Islands), | | | | | | | | | | | | | | | | |
Series 2015-03A, Class A2R, 144A, 3 Month SOFR + 2.452% (Cap N/A, Floor 0.000%) | | | 7.108(c) | | | | 07/15/31 | | | | 11,300 | | | | 11,320,123 | |
| | | | | | | | | | | | | | | | |
| | | | |
| | | | | | | | | | | | | | | 571,357,850 | |
| | | | |
Consumer Loans 0.4% | | | | | | | | | | | | | | | | |
| | | | |
Affirm Asset Securitization Trust, | | | | | | | | | | | | | | | | |
Series 2024-A, Class 1E, 144A | | | 9.170 | | | | 02/15/29 | | | | 2,350 | | | | 2,413,901 | |
Series 2024-B, Class E, 144A | | | 7.350 | | | | 09/15/29 | | | | 1,250 | | | | 1,245,914 | |
OneMain Financial Issuance Trust, | | | | | | | | | | | | | | | | |
Series 2023-01A, Class A, 144A | | | 5.500 | | | | 06/14/38 | | | | 4,800 | | | | 4,878,761 | |
Series 2023-01A, Class D, 144A | | | 7.490 | | | | 06/14/38 | | | | 200 | | | | 209,198 | |
Series 2023-02A, Class D, 144A | | | 7.520 | | | | 09/15/36 | | | | 2,500 | | | | 2,592,217 | |
| | | | | | | | | | | | | | | | |
| | | | |
| | | | | | | | | | | | | | | 11,339,991 | |
| | | | |
Equipment 0.1% | | | | | | | | | | | | | | | | |
| | | | |
Auxilior Term Funding LLC, | | | | | | | | | | | | | | | | |
Series 2023-01A, Class D, 144A | | | 7.270 | | | | 12/16/30 | | | | 1,500 | | | | 1,518,919 | |
| | | | |
Home Equity Loans 0.5% | | | | | | | | | | | | | | | | |
| | | | |
Accredited Mortgage Loan Trust, | | | | | | | | | | | | | | | | |
Series 2004-03, Class 2A2, 1 Month SOFR + 1.314% (Cap 13.000%, Floor 1.200%) | | | 6.052(c) | | | | 10/25/34 | | | | 546 | | | | 537,915 | |
Asset-Backed Securities Corp. Home Equity Loan Trust, | | | | | | | | | | | | | | | | |
Series 2003-HE06, Class A3B, 1 Month SOFR + 1.074% (Cap N/A, Floor 0.960%) | | | 5.812(c) | | | | 11/25/33 | | | | 3,226 | | | | 3,196,045 | |
See Notes to Financial Statements.
6
| | | | | | | | | | | | | | | | |
| | | | |
| Description | | Interest Rate | | | Maturity Date | | | Principal Amount (000)# | | | Value | |
| | | | |
ASSET-BACKED SECURITIES (Continued) | | | | | | | | | | | | | | | | |
| | | | |
Home Equity Loans (cont’d.) | | | | | | | | | | | | | | | | |
| | | | |
Bear Stearns Asset-Backed Securities Trust, | | | | | | | | | | | | | | | | |
Series 2003-03, Class A2, 1 Month SOFR + 1.294% (Cap 11.000%, Floor 1.180%) | | | 6.032%(c) | | | | 06/25/43 | | | | 52 | | | $ | 51,306 | |
Series 2003-HE01, Class M1, 1 Month SOFR + 1.209% (Cap N/A, Floor 1.095%) | | | 5.795(c) | | | | 01/25/34 | | | | 1,366 | | | | 1,364,511 | |
Home Equity Asset Trust, | | | | | | | | | | | | | | | | |
Series 2004-07, Class A2, 1 Month SOFR + 0.954% (Cap N/A, Floor 0.840%) | | | 5.692(c) | | | | 01/25/35 | | | | 825 | | | | 813,955 | |
JPMorgan Mortgage Trust, | | | | | | | | | | | | | | | | |
Series 2023-HE03, Class M1, 144A, 30 Day Average SOFR + 2.100% (Cap N/A, Floor 0.000%) | | | 6.973(c) | | | | 05/25/54 | | | | 1,019 | | | | 1,026,581 | |
MASTR Asset-Backed Securities Trust, | | | | | | | | | | | | | | | | |
Series 2003-WMC02, Class M2, 1 Month SOFR + 2.589% (Cap N/A, Floor 2.475%) | | | 4.327(c) | | | | 08/25/33 | | | | 429 | | | | 460,050 | |
Morgan Stanley ABS Capital I, Inc. Trust, | | | | | | | | | | | | | | | | |
Series 2003-HE03, Class M1, 1 Month SOFR + 1.134% (Cap N/A, Floor 1.020%) | | | 5.872(c) | | | | 10/25/33 | | | | 63 | | | | 63,038 | |
Towd Point Mortgage Trust, | | | | | | | | | | | | | | | | |
Series 2024-CES01, Class A1A, 144A | | | 5.848(cc) | | | | 01/25/64 | | | | 600 | | | | 600,052 | |
Series 2024-CES05, Class M1, 144A | | | 5.601(cc) | | | | 09/25/64 | | | | 3,750 | | | | 3,679,434 | |
| | | | | | | | | | | | | | | | |
| | | | |
| | | | | | | | | | | | | | | 11,792,887 | |
| | | | |
Other 0.3% | | | | | | | | | | | | | | | | |
| | | | |
GoodLeap Sustainable Home Solutions Trust, | | | | | | | | | | | | | | | | |
Series 2023-03C, Class A, 144A | | | 6.500 | | | | 07/20/55 | | | | 444 | | | | 449,070 | |
Series 2023-04C, Class A, 144A | | | 6.480 | | | | 03/20/57 | | | | 916 | | | | 930,758 | |
Series 2024-01GS, Class A, 144A | | | 6.250 | | | | 06/20/57 | | | | 2,129 | | | | 2,128,702 | |
Sierra Timeshare Receivables Funding LLC, | | | | | | | | | | | | | | | | |
Series 2023-02A, Class D, 144A | | | 9.720 | | | | 04/20/40 | | | | 856 | | | | 871,437 | |
Sunrun Vesta Issuer LLC, | | | | | | | | | | | | | | | | |
Series 2024-03A, Class A1, 144A | | | 5.490 | | | | 10/30/59 | | | | 859 | | | | 834,798 | |
Series 2024-03A, Class A2, 144A | | | 5.880 | | | | 10/30/59 | | | | 3,397 | | | | 3,263,901 | |
| | | | | | | | | | | | | | | | |
| | | | |
| | | | | | | | | | | | | | | 8,478,666 | |
| | | | |
Residential Mortgage-Backed Securities 0.3% | | | | | | | | | | | | | | | | |
| | | | |
Chase Funding Trust, | | | | | | | | | | | | | | | | |
Series 2002-03, Class 2A1, 1 Month SOFR + 0.754% (Cap N/A, Floor 0.640%) | | | 5.492(c) | | | | 08/25/32 | | | | 229 | | | | 225,112 | |
Series 2003-04, Class 1A5 | | | 4.912 | | | | 05/25/33 | | | | 257 | | | | 251,253 | |
See Notes to Financial Statements.
PGIM Absolute Return Bond Fund 7
Schedule of Investments (continued)
as of October 31, 2024
| | | | | | | | | | | | | | | | |
| | | | |
| Description | | Interest Rate | | | Maturity Date | | | Principal Amount (000)# | | | Value | |
| | | | |
ASSET-BACKED SECURITIES (Continued) | | | | | | | | | | | | | | | | |
| | | | |
Residential Mortgage-Backed Securities (cont’d.) | | | | | | | | | | | | | | | | |
| | | | |
Citigroup Mortgage Loan Trust, Inc., | | | | | | | | | | | | | | | | |
Series 2005-OPT01, Class M1, 1 Month SOFR + 0.744% (Cap N/A, Floor 0.630%) | | | 5.482%(c) | | | | 02/25/35 | | | | 154 | | | $ | 143,472 | |
Countrywide Asset-Backed Certificates Trust, | | | | | | | | | | | | | | | | |
Series 2004-BC04, Class M1, 1 Month SOFR + 1.164% (Cap N/A, Floor 1.050%) | | | 5.902(c) | | | | 11/25/34 | | | | 26 | | | | 26,922 | |
Credit-Based Asset Servicing & Securitization LLC, | | | | | | | | | | | | | | | | |
Series 2003-CB03, Class AF1 | | | 3.379 | | | | 12/25/32 | | | | 56 | | | | 54,027 | |
Finance America Mortgage Loan Trust, | | | | | | | | | | | | | | | | |
Series 2003-01, Class M1, 1 Month SOFR + 1.164% (Cap N/A, Floor 1.050%) | | | 5.902(c) | | | | 09/25/33 | | | | 910 | | | | 898,971 | |
First Franklin Mortgage Loan Trust, | | | | | | | | | | | | | | | | |
Series 2004-FF05, Class A2, 1 Month SOFR + 0.874% (Cap N/A, Floor 0.760%) | | | 5.612(c) | | | | 08/25/34 | | | | 345 | | | | 314,193 | |
Fremont Home Loan Trust, | | | | | | | | | | | | | | | | |
Series 2004-04, Class M1, 1 Month SOFR + 0.909% (Cap N/A, Floor 0.795%) | | | 5.647(c) | | | | 03/25/35 | | | | 1,337 | | | | 1,258,069 | |
Long Beach Mortgage Loan Trust, | | | | | | | | | | | | | | | | |
Series 2004-02, Class A1, 1 Month SOFR + 0.554% (Cap N/A, Floor 0.440%) | | | 5.292(c) | | | | 06/25/34 | | | | 465 | | | | 455,834 | |
Structured Asset Investment Loan Trust, | | | | | | | | | | | | | | | | |
Series 2004-BNC01, Class A2, 1 Month SOFR + 1.114% (Cap N/A, Floor 1.000%) | | | 5.969(c) | | | | 09/25/34 | | | | 1,605 | | | | 1,618,801 | |
TFS (Spain), | | | | | | | | | | | | | | | | |
Series 2018-03^ | | | 0.000(s) | | | | 04/16/40 | | | EUR | —(r | ) | | | 1 | |
Series 2018-03, Class A1, 1 Month EURIBOR + 3.250%^ | | | 6.856(c) | | | | 03/15/26 | | | EUR | 3,963 | | | | 3,314,799 | |
| | | | | | | | | | | | | | | | |
| | | | |
| | | | | | | | | | | | | | | 8,561,454 | |
| | | | |
Student Loans 0.1% | | | | | | | | | | | | | | | | |
| | | | |
Bayview Opportunity Master Fund VII LLC, | | | | | | | | | | | | | | | | |
Series 2024-EDU01, Class D, 144A, 30 Day Average SOFR + 2.750% (Cap N/A, Floor 0.000%) | | | 7.607(c) | | | | 06/25/47 | | | | 895 | | | | 905,124 | |
Laurel Road Prime Student Loan Trust, | | | | | | | | | | | | | | | | |
Series 2018-D, Class A, 144A | | | 0.000(cc) | | | | 11/25/43 | | | | 1,905 | | | | 1,777,046 | |
Series 2019-A, Class R, 144A | | | 0.000 | | | | 10/25/48 | | | | 1,427 | | | | 380,944 | |
| | | | | | | | | | | | | | | | |
| | | | |
| | | | | | | | | | | | | | | 3,063,114 | |
| | | | | | | | | | | | | | | | |
| | | | |
TOTAL ASSET-BACKED SECURITIES | | | | | | | | | | | | | | | | |
(cost $642,488,209) | | | | | | | | | | | | | | | 644,151,877 | |
| | | | | | | | | | | | | | | | |
See Notes to Financial Statements.
8
| | | | | | | | | | | | |
| | | | |
| Description | | Interest Rate | | Maturity Date | | Principal Amount (000)# | | | Value | |
| | | | |
COMMERCIAL MORTGAGE-BACKED SECURITIES 4.9% | | | | | | | | | | | | |
| | | | |
20 Times Square Trust, | | | | | | | | | | | | |
Series 2018-20TS, Class G, 144A | | 3.100%(cc) | | 05/15/35 | | | 2,700 | | | $ | 2,061,544 | |
Series 2018-20TS, Class H, 144A | | 3.100(cc) | | 05/15/35 | | | 2,700 | | | | 2,007,544 | |
Barclays Commercial Mortgage Securities Trust, | | | | | | | | | | | | |
Series 2018-CHRS, Class B, 144A | | 4.267(cc) | | 08/05/38 | | | 2,650 | | | | 2,395,946 | |
Series 2018-CHRS, Class C, 144A | | 4.267(cc) | | 08/05/38 | | | 900 | | | | 798,926 | |
Series 2018-CHRS, Class D, 144A | | 4.267(cc) | | 08/05/38 | | | 1,490 | | | | 1,277,385 | |
Series 2020-BID, Class A, 144A, 1 Month SOFR + 2.254% (Cap N/A, Floor 2.140%) | | 7.058(c) | | 10/15/37 | | | 5,745 | | | | 5,737,819 | |
Series 2024-5C29, Class XD, IO, 144A | | 2.673(cc) | | 09/15/57 | | | 28,469 | | | | 3,241,620 | |
Benchmark Mortgage Trust, | | | | | | | | | | | | |
Series 2023-V03, Class XA, IO | | 0.814(cc) | | 07/15/56 | | | 50,590 | | | | 1,332,710 | |
BFLD Mortgage Trust, | | | | | | | | | | | | |
Series 2024-VICT, Class B, 144A, 1 Month SOFR + 2.589% (Cap N/A, Floor 2.589%) | | 7.393(c) | | 07/15/41 | | | 4,400 | | | | 4,398,625 | |
Series 2024-WRHS, Class E, 144A, 1 Month SOFR + 3.689% (Cap N/A, Floor 3.689%) | | 8.493(c) | | 08/15/26 | | | 3,300 | | | | 3,304,738 | |
BPR Commercial Mortgage Trust, | | | | | | | | | | | | |
Series 2024-PARK, Class C, 144A | | 6.183(cc) | | 11/05/39 | | | 5,350 | | | | 5,350,000 | |
BPR Trust, | | | | | | | | | | | | |
Series 2021-TY, Class C, 144A, 1 Month SOFR + 1.814% (Cap N/A, Floor 1.700%) | | 6.618(c) | | 09/15/38 | | | 2,024 | | | | 2,000,641 | |
Series 2023-BRK02, Class C, 144A | | 8.335(cc) | | 10/05/38 | | | 4,300 | | | | 4,413,251 | |
Series 2024-PMDW, Class C, 144A | | 5.850(cc) | | 11/05/29 | | | 1,900 | | | | 1,858,044 | |
BX Trust, | | | | | | | | | | | | |
Series 2024-PAT, Class A, 144A, 1 Month SOFR + 2.090% (Cap N/A, Floor 2.090%) | | 6.894(c) | | 03/15/41 | | | 5,600 | | | | 5,617,465 | |
Series 2024-VLT04, Class C, 144A, 1 Month SOFR + 2.140% (Cap N/A, Floor 2.140%) | | 6.944(c) | | 07/15/29 | | | 6,000 | | | | 6,003,750 | |
Commercial Mortgage Trust, | | | | | | | | | | | | |
Series 2015-LC19, Class XB, IO, 144A | | 0.252(cc) | | 02/10/48 | | | 123,049 | | | | 1,230 | |
Series 2024-277P, Class A, 144A | | 6.338 | | 08/10/44 | | | 1,600 | | | | 1,647,850 | |
Series 2024-277P, Class X, IO, 144A | | 0.661(cc) | | 08/10/44 | | | 5,300 | | | | 160,376 | |
FHLMC Multifamily Structured Pass-Through Certificates, | | | | | | | | | | | | |
Series K055, Class X1, IO | | 1.326(cc) | | 03/25/26 | | | 20,365 | | | | 307,768 | |
GS Mortgage Securities Corp. Trust, | | | | | | | | | | | | |
Series 2021-IP, Class A, 144A, 1 Month SOFR + 1.064% (Cap N/A, Floor 0.950%) | | 5.868(c) | | 10/15/36 | | | 2,130 | | | | 2,112,598 | |
Series 2024-RVR, Class A, 144A | | 5.198(cc) | | 08/10/41 | | | 6,900 | | | | 6,828,321 | |
GS Mortgage Securities Trust, | | | | | | | | | | | | |
Series 2013-GC10, Class XB, IO, 144A | | 0.252(cc) | | 02/10/46 | | | 26,089 | | | | 261 | |
Independence Plaza Trust, | | | | | | | | | | | | |
Series 2018-INDP, Class E, 144A | | 4.996 | | 07/10/35 | | | 3,000 | | | | 2,821,349 | |
See Notes to Financial Statements.
PGIM Absolute Return Bond Fund 9
Schedule of Investments (continued)
as of October 31, 2024
| | | | | | | | | | | | |
| | | | |
| Description | | Interest Rate | | Maturity Date | | Principal Amount (000)# | | | Value | |
| | |
COMMERCIAL MORTGAGE-BACKED SECURITIES (Continued) | | | | | | | | |
| | | | |
JPMBB Commercial Mortgage Securities Trust, | | | | | | | | | | | | |
Series 2015-C27, Class XB, IO | | 0.386%(cc) | | 02/15/48 | | | 52,766 | | | $ | 528 | |
JPMCC Commercial Mortgage Securities Trust, | | | | | | | | | | | | |
Series 2017-JP06, Class A5 | | 3.490 | | 07/15/50 | | | 5,000 | | | | 4,735,562 | |
JPMorgan Chase Commercial Mortgage Securities Trust, | | | | | | | | | | | | |
Series 2013-LC11, Class XB, IO | | 0.717(cc) | | 04/15/46 | | | 34,956 | | | | 147,250 | |
Series 2016-JP03, Class A5 | | 2.870 | | 08/15/49 | | | 10,495 | | | | 10,039,937 | |
Series 2018-AON, Class E, 144A | | 4.613(cc) | | 07/05/31 | | | 7,950 | | | | 2,742,752 | |
LBA Trust, | | | | | | | | | | | | |
Series 2024-BOLT, Class D, 144A, 1 Month SOFR + 2.590% (Cap N/A, Floor 2.590%) | | 7.394(c) | | 06/15/26 | | | 2,930 | | | | 2,929,084 | |
MHC Commercial Mortgage Trust, | | | | | | | | | | | | |
Series 2021-MHC, Class F, 144A, 1 Month SOFR + 2.715% (Cap N/A, Floor 2.601%) | | 7.519(c) | | 04/15/38 | | | 5,261 | | | | 5,227,986 | |
Morgan Stanley Capital I Trust, | | | | | | | | | | | | |
Series 2019-MEAD, Class C, 144A | | 3.177(cc) | | 11/10/36 | | | 2,020 | | | | 2,015,766 | |
Series 2019-MEAD, Class D, 144A | | 3.177(cc) | | 11/10/36 | | | 3,000 | | | | 2,992,910 | |
Series 2019-MEAD, Class E, 144A | | 3.177(cc) | | 11/10/36 | | | 2,505 | | | | 2,498,415 | |
ONE Mortgage Trust, | | | | | | | | | | | | |
Series 2021-PARK, Class D, 144A, 1 Month SOFR + 1.614% (Cap N/A, Floor 1.500%) | | 6.418(c) | | 03/15/36 | | | 2,350 | | | | 2,240,026 | |
Series 2021-PARK, Class E, 144A, 1 Month SOFR + 1.864% (Cap N/A, Floor 1.750%) | | 6.668(c) | | 03/15/36 | | | 1,400 | | | | 1,321,688 | |
ROCK Trust, | | | | | | | | | | | | |
Series 2024-CNTR, Class E, 144A | | 8.819 | | 11/13/41 | | | 4,435 | | | | 4,514,292 | |
Salus European Loan Conduit DAC (United Kingdom), | | | | | | | | | | | | |
Series 33A, Class A, 144A, SONIA + 1.969% (Cap 6.850%, Floor 1.500%) | | 6.850(c) | | 01/23/29 | | GBP | 9,500 | | | | 12,132,777 | |
WCORE Commercial Mortgage Trust, | | | | | | | | | | | | |
Series 2024-CORE, Class D, 144A, 1 Month SOFR + 2.940% (Cap N/A, Floor 2.940%) | | 7.640(c) | | 11/15/41 | | | 6,690 | | | | 6,672,902 | |
Wells Fargo Commercial Mortgage Trust, | | | | | | | | | | | | |
Series 2024-01CHI, Class E, 144A | | 7.574(cc) | | 07/15/35 | | | 2,900 | | | | 2,891,229 | |
Series 2024-GRP, Class B, 144A, 1 Month SOFR + 2.291% (Cap N/A, Floor 2.291%) | | 7.141(c) | | 10/15/41 | | | 1,500 | | | | 1,494,470 | |
Series 2024-GRP, Class C, 144A, 1 Month SOFR + 2.940% (Cap N/A, Floor 2.940%) | | 7.790(c) | | 10/15/41 | | | 2,500 | | | | 2,489,845 | |
| | | | | | | | | | | | |
| | | | |
TOTAL COMMERCIAL MORTGAGE-BACKED SECURITIES
(cost $136,964,637) | | | | | | | | | | | 132,767,180 | |
| | | | | | | | | | | | |
See Notes to Financial Statements.
10
| | | | | | | | | | | | |
| | | | |
| Description | | Interest Rate | | Maturity Date | | Principal Amount (000)# | | | Value | |
| | | | |
CORPORATE BONDS 23.0% | | | | | | | | | | | | |
| | | | |
Aerospace & Defense 0.7% | | | | | | | | | | | | |
| | | | |
BAE Systems PLC (United Kingdom), | | | | | | | | | | | | |
Sr. Unsec’d. Notes, 144A | | 5.125% | | 03/26/29 | | | 2,775 | | | $ | 2,799,651 | |
Boeing Co. (The), | | | | | | | | | | | | |
Sr. Unsec’d. Notes | | 3.250 | | 02/01/28 | | | 5,555 | | | | 5,216,522 | |
Sr. Unsec’d. Notes | | 3.250 | | 02/01/35 | | | 5,710 | | | | 4,546,796 | |
Bombardier, Inc. (Canada), | | | | | | | | | | | | |
Sr. Unsec’d. Notes, 144A | | 7.500 | | 02/01/29 | | | 1,000 | | | | 1,040,780 | |
Sr. Unsec’d. Notes, 144A | | 7.875 | | 04/15/27 | | | 2,804 | | | | 2,807,505 | |
Embraer Netherlands Finance BV (Brazil), | | | | | | | | | | | | |
Gtd. Notes, 144A | | 7.000 | | 07/28/30 | | | 1,770 | | | | 1,874,541 | |
| | | | | | | | | | | | |
| | | | |
| | | | | | | | | | | 18,285,795 | |
| | | | |
Agriculture 0.2% | | | | | | | | | | | | |
| | | | |
Imperial Brands Finance PLC (United Kingdom), | | | | | | | | | | | | |
Gtd. Notes, 144A, MTN | | 5.500 | | 02/01/30 | | | 6,200 | | | | 6,312,029 | |
| | | | |
Airlines 0.1% | | | | | | | | | | | | |
American Airlines 2013-1 Class A Pass-Through Trust, | | | | | | | | | | | | |
Pass-Through Certificates | | 4.000 | | 01/15/27 | | | 1,246 | | | | 1,226,633 | |
United Airlines 2013-1 Class A Pass-Through Trust, | | | | | | | | | | | | |
Pass-Through Certificates | | 4.300 | | 02/15/27 | | | 1,233 | | | | 1,224,581 | |
United Airlines, Inc., | | | | | | | | | | | | |
Sr. Sec’d. Notes, 144A | | 4.375 | | 04/15/26 | | | 645 | | | | 633,714 | |
Sr. Sec’d. Notes, 144A | | 4.625 | | 04/15/29 | | | 170 | | | | 162,786 | |
| | | | | | | | | | | | |
| | | | |
| | | | | | | | | | | 3,247,714 | |
| | | | |
Apparel 0.0% | | | | | | | | | | | | |
| | | | |
Wolverine World Wide, Inc., | | | | | | | | | | | | |
Gtd. Notes, 144A | | 4.000 | | 08/15/29 | | | 825 | | | | 705,337 | |
| | | | |
Auto Manufacturers 0.4% | | | | | | | | | | | | |
| | | | |
Ford Motor Credit Co. LLC, | | | | | | | | | | | | |
Sr. Unsec’d. Notes | | 3.375 | | 11/13/25 | | | 2,650 | | | | 2,599,286 | |
Sr. Unsec’d. Notes | | 4.125 | | 08/17/27 | | | 1,170 | | | | 1,130,660 | |
Sr. Unsec’d. Notes | | 5.125 | | 11/05/26 | | | 1,800 | | | | 1,792,915 | |
Sr. Unsec’d. Notes | | 5.850 | | 05/17/27 | | | 1,225 | | | | 1,236,541 | |
Sr. Unsec’d. Notes | | 6.800 | | 05/12/28 | | | 625 | | | | 647,658 | |
General Motors Co., | | | | | | | | | | | | |
Sr. Unsec’d. Notes | | 6.250 | | 10/02/43 | | | 1,205 | | | | 1,213,321 | |
See Notes to Financial Statements.
PGIM Absolute Return Bond Fund 11
Schedule of Investments (continued)
as of October 31, 2024
| | | | | | | | | | | | |
| | | | |
| Description | | Interest Rate | | Maturity Date | | Principal Amount (000)# | | | Value | |
| | | | |
CORPORATE BONDS (Continued) | | | | | | | | | | | | |
| | | | |
Auto Manufacturers (cont’d.) | | | | | | | | | | | | |
| | | | |
General Motors Financial Co., Inc., | | | | | | | | | | | | |
Sr. Unsec’d. Notes | | 5.350% | | 07/15/27 | | | 2,355 | | | $ | 2,379,430 | |
Sr. Unsec’d. Notes | | 5.800 | | 01/07/29 | | | 695 | | | | 710,931 | |
| | | | | | | | | | | | |
| | | | |
| | | | | | | | | | | 11,710,742 | |
| | | | |
Auto Parts & Equipment 0.2% | | | | | | | | | | | | |
| | | | |
Adient Global Holdings Ltd., | | | | | | | | | | | | |
Gtd. Notes, 144A | | 4.875 | | 08/15/26 | | | 1,900 | | | | 1,865,971 | |
American Axle & Manufacturing, Inc., | | | | | | | | | | | | |
Gtd. Notes | | 6.250 | | 03/15/26 | | | 135 | | | | 134,523 | |
BorgWarner, Inc., | | | | | | | | | | | | |
Sr. Unsec’d. Notes | | 4.950 | | 08/15/29 | | | 985 | | | | 981,300 | |
Dana, Inc., | | | | | | | | | | | | |
Sr. Unsec’d. Notes | | 4.500 | | 02/15/32 | | | 25 | | | | 21,372 | |
Nemak SAB de CV (Mexico), | | | | | | | | | | | | |
Sr. Unsec’d. Notes, 144A | | 3.625 | | 06/28/31 | | | 350 | | | | 277,158 | |
Phinia, Inc., | | | | | | | | | | | | |
Sr. Sec’d. Notes, 144A | | 6.750 | | 04/15/29 | | | 375 | | | | 383,416 | |
Tenneco, Inc., | | | | | | | | | | | | |
Sr. Sec’d. Notes, 144A | | 8.000 | | 11/17/28 | | | 3,000 | | | | 2,775,911 | |
| | | | | | | | | | | | |
| | | | |
| | | | | | | | | | | 6,439,651 | |
| | | | |
Banks 4.5% | | | | | | | | | | | | |
| | | | |
ABN AMRO Bank NV (Netherlands), | | | | | | | | | | | | |
Sr. Non-Preferred Notes, 144A, MTN | | 6.575(ff) | | 10/13/26 | | | 3,700 | | | | 3,744,733 | |
Banco de Credito del Peru SA (Peru), | | | | | | | | | | | | |
Sub. Notes, 144A, MTN | | 3.250(ff) | | 09/30/31 | | | 1,055 | | | | 988,007 | |
Banco Santander SA (Spain), | | | | | | | | | | | | |
Sr. Non-Preferred Notes | | 5.538(ff) | | 03/14/30 | | | 2,200 | | | | 2,227,383 | |
Sr. Non-Preferred Notes | | 5.552(ff) | | 03/14/28 | | | 3,400 | | | | 3,434,572 | |
Bangkok Bank PCL (Thailand), | | | | | | | | | | | | |
Sub. Notes, 144A(a) | | 3.466(ff) | | 09/23/36 | | | 945 | | | | 816,948 | |
Bank of America Corp., | | | | | | | | | | | | |
Sr. Unsec’d. Notes, MTN | | 4.271(ff) | | 07/23/29 | | | 1,450 | | | | 1,419,700 | |
Bank of Montreal (Canada), | | | | | | | | | | | | |
Jr. Sub. Notes | | 7.300(ff) | | 11/26/84 | | | 2,380 | | | | 2,478,248 | |
Barclays PLC (United Kingdom), | | | | | | | | | | | | |
Sr. Unsec’d. Notes | | 7.437(ff) | | 11/02/33 | | | 3,810 | | | | 4,266,334 | |
Cassa Depositi e Prestiti SpA (Italy), | | | | | | | | | | | | |
Sr. Unsec’d. Notes, 144A | | 5.750 | | 05/05/26 | | | 2,415 | | | | 2,431,330 | |
Sr. Unsec’d. Notes, 144A | | 5.875 | | 04/30/29 | | | 1,000 | | | | 1,023,783 | |
See Notes to Financial Statements.
12
| | | | | | | | | | | | |
| | | | |
| Description | | Interest Rate | | Maturity Date | | Principal Amount (000)# | | | Value | |
| | | | |
CORPORATE BONDS (Continued) | | | | | | | | | | | | |
| | | | |
Banks (cont’d.) | | | | | | | | | | | | |
| | | | |
Citigroup, Inc., | | | | | | | | | | | | |
Jr. Sub. Notes, Series CC | | 7.125%(ff) | | 08/15/29(oo) | | | 7,055 | | | $ | 7,253,001 | |
Sr. Unsec’d. Notes | | 2.976(ff) | | 11/05/30 | | | 870 | | | | 789,654 | |
Sr. Unsec’d. Notes | | 3.200 | | 10/21/26 | | | 1,145 | | | | 1,112,732 | |
Sr. Unsec’d. Notes | | 3.887(ff) | | 01/10/28 | | | 980 | | | | 959,995 | |
Sr. Unsec’d. Notes | | 4.542(ff) | | 09/19/30 | | | 5,265 | | | | 5,157,707 | |
Sub. Notes | | 4.400 | | 06/10/25 | | | 405 | | | | 403,409 | |
Danske Bank A/S (Denmark), | | | | | | | | | | | | |
Sr. Non-Preferred Notes, 144A | | 4.613(ff) | | 10/02/30 | | | 3,745 | | | | 3,653,038 | |
Deutsche Bank AG (Germany), | | | | | | | | | | | | |
Sr. Non-Preferred Notes | | 4.999(ff) | | 09/11/30 | | | 2,065 | | | | 2,026,807 | |
Sr. Non-Preferred Notes | | 6.819(ff) | | 11/20/29 | | | 3,300 | | | | 3,475,141 | |
Freedom Mortgage Corp., | | | | | | | | | | | | |
Sr. Unsec’d. Notes, 144A | | 12.000 | | 10/01/28 | | | 175 | | | | 189,163 | |
Goldman Sachs Group, Inc. (The), | | | | | | | | | | | | |
Sr. Unsec’d. Notes | | 1.992(ff) | | 01/27/32 | | | 4,275 | | | | 3,560,739 | |
Sr. Unsec’d. Notes | | 3.814(ff) | | 04/23/29 | | | 35 | | | | 33,740 | |
Sr. Unsec’d. Notes | | 3.850 | | 01/26/27 | | | 3,940 | | | | 3,863,482 | |
Sr. Unsec’d. Notes | | 4.223(ff) | | 05/01/29 | | | 135 | | | | 131,900 | |
Sr. Unsec’d. Notes | | 6.484(ff) | | 10/24/29 | | | 3,110 | | | | 3,281,028 | |
JPMorgan Chase & Co., | | | | | | | | | | | | |
Jr. Sub. Notes, Series HH | | 4.600(ff) | | 02/01/25(oo) | | | 15,325 | | | | 15,235,928 | |
KeyCorp, | | | | | | | | | | | | |
Sr. Unsec’d. Notes, MTN | | 2.550 | | 10/01/29 | | | 2,370 | | | | 2,108,985 | |
Mizrahi Tefahot Bank Ltd. (Israel), | | | | | | | | | | | | |
Sub. Notes, 144A | | 3.077(ff) | | 04/07/31 | | | 1,555 | | | | 1,463,939 | |
Morgan Stanley, | | | | | | | | | | | | |
Sr. Unsec’d. Notes | | 6.407(ff) | | 11/01/29 | | | 2,570 | | | | 2,706,566 | |
Sr. Unsec’d. Notes, GMTN | | 2.239(ff) | | 07/21/32 | | | 2,865 | | | | 2,399,044 | |
Sr. Unsec’d. Notes, GMTN | | 3.772(ff) | | 01/24/29 | | | 1,750 | | | | 1,693,475 | |
Sr. Unsec’d. Notes, GMTN | | 3.875 | | 01/27/26 | | | 605 | | | | 599,527 | |
Sr. Unsec’d. Notes, MTN | | 1.928(ff) | | 04/28/32 | | | 2,230 | | | | 1,843,717 | |
Societe Generale SA (France), | | | | | | | | | | | | |
Sr. Non-Preferred Notes, 144A | | 2.889(ff) | | 06/09/32 | | | 2,845 | | | | 2,405,566 | |
Sr. Non-Preferred Notes, 144A | | 5.634(ff) | | 01/19/30 | | | 9,920 | | | | 9,993,576 | |
Truist Financial Corp., | | | | | | | | | | | | |
Sr. Unsec’d. Notes, MTN | | 7.161(ff) | | 10/30/29 | | | 1,005 | | | | 1,077,470 | |
UBS Group AG (Switzerland), | | | | | | | | | | | | |
Sr. Unsec’d. Notes | | 3.750 | | 03/26/25 | | | 1,200 | | | | 1,194,958 | |
Sr. Unsec’d. Notes, 144A | | 4.488(ff) | | 05/12/26 | | | 615 | | | | 612,449 | |
Sr. Unsec’d. Notes, 144A(a) | | 5.617(ff) | | 09/13/30 | | | 3,100 | | | | 3,161,225 | |
Sr. Unsec’d. Notes, 144A, SOFR + 1.580% | | 6.678(c) | | 05/12/26 | | | 1,925 | | | | 1,934,962 | |
See Notes to Financial Statements.
PGIM Absolute Return Bond Fund 13
Schedule of Investments (continued)
as of October 31, 2024
| | | | | | | | | | | | |
| | | | |
| Description | | Interest Rate | | Maturity Date | | Principal Amount (000)# | | | Value | |
| | | | |
CORPORATE BONDS (Continued) | | | | | | | | | | | | |
| | | | |
Banks (cont’d.) | | | | | | | | | | | | |
| | | | |
Wells Fargo & Co., | | | | | | | | | | | | |
Jr. Sub. Notes | | 6.850%(ff) | | 09/15/29(oo) | | | 4,200 | | | $ | 4,343,232 | |
Sr. Unsec’d. Notes, MTN(a) | | 4.808(ff) | | 07/25/28 | | | 6,475 | | | | 6,465,695 | |
Sr. Unsec’d. Notes, MTN | | 5.707(ff) | | 04/22/28 | | | 2,475 | | | | 2,522,924 | |
| | | | | | | | | | | | |
| | | | |
| | | | | | | | | | | 120,485,812 | |
| | | | |
Building Materials 0.3% | | | | | | | | | | | | |
| | | | |
Cemex SAB de CV (Mexico), | | | | | | | | | | | | |
Gtd. Notes, 144A | | 5.450 | | 11/19/29 | | | 1,180 | | | | 1,172,483 | |
JELD-WEN, Inc., | | | | | | | | | | | | |
Gtd. Notes, 144A | | 4.875 | | 12/15/27 | | | 2,400 | | | | 2,322,911 | |
Sisecam UK PLC (Turkey), | | | | | | | | | | | | |
Gtd. Notes, 144A | | 8.250 | | 05/02/29 | | | 3,120 | | | | 3,196,066 | |
| | | | | | | | | | | | |
| | | | |
| | | | | | | | | | | 6,691,460 | |
| | | | |
Chemicals 1.1% | | | | | | | | | | | | |
| | | | |
Ashland, Inc., | | | | | | | | | | | | |
Sr. Unsec’d. Notes | | 6.875 | | 05/15/43 | | | 4,100 | | | | 4,332,391 | |
Braskem Netherlands Finance BV (Brazil), | | | | | | | | | | | | |
Gtd. Notes | | 8.500 | | 01/12/31 | | | 1,422 | | | | 1,470,348 | |
Gtd. Notes, 144A | | 4.500 | | 01/10/28 | | | 1,630 | | | | 1,524,539 | |
Gtd. Notes, 144A | | 4.500 | | 01/31/30 | | | 629 | | | | 545,815 | |
Gtd. Notes, 144A | | 8.500 | | 01/12/31 | | | 3,725 | | | | 3,851,650 | |
DuPont de Nemours, Inc., | | | | | | | | | | | | |
Sr. Unsec’d. Notes(h) | | 4.725 | | 11/15/28 | | | 4,070 | | | | 4,067,594 | |
FMC Corp., | | | | | | | | | | | | |
Sr. Unsec’d. Notes | | 3.450 | | 10/01/29 | | | 3,223 | | | | 2,965,893 | |
LYB International Finance BV, | | | | | | | | | | | | |
Gtd. Notes | | 5.250 | | 07/15/43 | | | 175 | | | | 162,501 | |
OCP SA (Morocco), | | | | | | | | | | | | |
Sr. Unsec’d. Notes, 144A | | 3.750 | | 06/23/31 | | | 213 | | | | 186,308 | |
Sr. Unsec’d. Notes, 144A | | 6.750 | | 05/02/34 | | | 5,469 | | | | 5,704,851 | |
Sasol Financing USA LLC (South Africa), | | | | | | | | | | | | |
Gtd. Notes | | 4.375 | | 09/18/26 | | | 350 | | | | 337,531 | |
Solvay Finance America LLC (Belgium), | | | | | | | | | | | | |
Gtd. Notes, 144A(a) | | 5.650 | | 06/04/29 | | | 3,060 | | | | 3,118,972 | |
See Notes to Financial Statements.
14
| | | | | | | | | | | | |
| | | | |
| Description | | Interest Rate | | Maturity Date | | Principal Amount (000)# | | | Value | |
| | | | |
CORPORATE BONDS (Continued) | | | | | | | | | | | | |
| | | | |
Chemicals (cont’d.) | | | | | | | | | | | | |
| | | | |
TPC Group, Inc., | | | | | | | | | | | | |
Sr. Sec’d. Notes, 144A (original cost $903,755; purchased 12/15/22 - 05/16/23)(f) | | 13.000% | | 12/16/27 | | | 907 | | | $ | 916,330 | |
Yara International ASA (Brazil), | | | | | | | | | | | | |
Sr. Unsec’d. Notes, 144A | | 3.148 | | 06/04/30 | | | 1,500 | | | | 1,338,705 | |
| | | | | | | | | | | | |
| | | | |
| | | | | | | | | | | 30,523,428 | |
| | | | |
Coal 0.0% | | | | | | | | | | | | |
| | | | |
Conuma Resources Ltd. (Canada), | | | | | | | | | | | | |
Sr. Sec’d. Notes, 144A | | 13.125 | | 05/01/28 | | | 944 | | | | 965,240 | |
| | | | |
Commercial Services 0.3% | | | | | | | | | | | | |
| | | | |
Alta Equipment Group, Inc., | | | | | | | | | | | | |
Sec’d. Notes, 144A | | 9.000 | | 06/01/29 | | | 845 | | | | 750,917 | |
AMN Healthcare, Inc., | | | | | | | | | | | | |
Gtd. Notes, 144A | | 4.000 | | 04/15/29 | | | 2,475 | | | | 2,282,327 | |
Belron UK Finance PLC (United Kingdom), | | | | | | | | | | | | |
Sr. Sec’d. Notes, 144A | | 5.750 | | 10/15/29 | | | 680 | | | | 681,367 | |
Boost Newco Borrower LLC, | | | | | | | | | | | | |
Sr. Sec’d. Notes, 144A | | 7.500 | | 01/15/31 | | | 200 | | | | 210,890 | |
Dcli Bidco LLC, | | | | | | | | | | | | |
Second Mortgage, 144A | | 7.750 | | 11/15/29 | | | 425 | | | | 432,255 | |
DP World Ltd. (United Arab Emirates), | | | | | | | | | | | | |
Sr. Unsec’d. Notes, 144A | | 2.375 | | 09/25/26 | | EUR | 601 | | | | 640,048 | |
ERAC USA Finance LLC, | | | | | | | | | | | | |
Gtd. Notes, 144A | | 6.700 | | 06/01/34 | | | 110 | | | | 122,973 | |
Gtd. Notes, 144A | | 7.000 | | 10/15/37 | | | 1,725 | | | | 1,990,306 | |
Service Corp. International, | | | | | | | | | | | | |
Sr. Unsec’d. Notes | | 5.750 | | 10/15/32 | | | 730 | | | | 718,432 | |
United Rentals North America, Inc., | | | | | | | | | | | | |
Gtd. Notes | | 3.750 | | 01/15/32 | | | 325 | | | | 288,215 | |
Gtd. Notes | | 5.250 | | 01/15/30 | | | 700 | | | | 687,704 | |
| | | | | | | | | | | | |
| | | | |
| | | | | | | | | | | 8,805,434 | |
| | | | |
Computers 0.4% | | | | | | | | | | | | |
| | | | |
CA Magnum Holdings (India), | | | | | | | | | | | | |
Sr. Sec’d. Notes, 144A | | 5.375 | | 10/31/26 | | | 5,225 | | | | 5,127,031 | |
Hewlett Packard Enterprise Co., | | | | | | | | | | | | |
Sr. Unsec’d. Notes | | 4.450 | | 09/25/26 | | | 4,250 | | | | 4,231,028 | |
See Notes to Financial Statements.
PGIM Absolute Return Bond Fund 15
Schedule of Investments (continued)
as of October 31, 2024
| | | | | | | | | | | | |
| | | | |
| Description | | Interest Rate | | Maturity Date | | Principal Amount (000)# | | | Value | |
| | | | |
CORPORATE BONDS (Continued) | | | | | | | | | | | | |
| | | | |
Computers (cont’d.) | | | | | | | | | | | | |
| | | | |
McAfee Corp., | | | | | | | | | | | | |
Sr. Unsec’d. Notes, 144A | | 7.375% | | 02/15/30 | | | 675 | | | $ | 651,379 | |
NCR Atleos Corp., | | | | | | | | | | | | |
Sr. Sec’d. Notes, 144A | | 9.500 | | 04/01/29 | | | 761 | | | | 837,929 | |
| | | | | | | | | | | | |
| | | | |
| | | | | | | | | | | 10,847,367 | |
| | | | |
Distribution/Wholesale 0.1% | | | | | | | | | | | | |
| | | | |
H&E Equipment Services, Inc., | | | | | | | | | | | | |
Gtd. Notes, 144A | | 3.875 | | 12/15/28 | | | 1,150 | | | | 1,062,366 | |
Ritchie Bros Holdings, Inc. (Canada), | | | | | | | | | | | | |
Sr. Sec’d. Notes, 144A | | 6.750 | | 03/15/28 | | | 75 | | | | 76,687 | |
| | | | | | | | | | | | |
| | | | |
| | | | | | | | | | | 1,139,053 | |
| | | | |
Diversified Financial Services 0.5% | | | | | | | | | | | | |
| | | | |
Blackstone Private Credit Fund, | | | | | | | | | | | | |
Sr. Sec’d. Notes^ | | 5.610 | | 05/03/27 | | | 950 | | | | 943,470 | |
Cantor Fitzgerald LP, | | | | | | | | | | | | |
Sr. Unsec’d. Notes, 144A | | 7.200 | | 12/12/28 | | | 1,285 | | | | 1,345,074 | |
Capital One Financial Corp., | | | | | | | | | | | | |
Sr. Unsec’d. Notes | | 7.624(ff) | | 10/30/31 | | | 935 | | | | 1,038,889 | |
Jefferies Finance LLC/JFIN Co-Issuer Corp., | | | | | | | | | | | | |
Sr. Unsec’d. Notes, 144A | | 5.000 | | 08/15/28 | | | 400 | | | | 369,230 | |
LPL Holdings, Inc., | | | | | | | | | | | | |
Gtd. Notes | | 5.700 | | 05/20/27 | | | 1,605 | | | | 1,629,595 | |
Nationstar Mortgage Holdings, Inc., | | | | | | | | | | | | |
Gtd. Notes, 144A | | 5.750 | | 11/15/31 | | | 1,675 | | | | 1,603,920 | |
Navient Corp., | | | | | | | | | | | | |
Sr. Unsec’d. Notes | | 6.750 | | 06/25/25 | | | 575 | | | | 578,602 | |
Nuveen LLC, | | | | | | | | | | | | |
Sr. Unsec’d. Notes, 144A | | 5.550 | | 01/15/30 | | | 1,280 | | | | 1,311,015 | |
OneMain Finance Corp., | | | | | | | | | | | | |
Gtd. Notes | | 3.875 | | 09/15/28 | | | 1,200 | | | | 1,107,700 | |
Gtd. Notes | | 6.625 | | 05/15/29 | | | 1,750 | | | | 1,750,000 | |
PennyMac Financial Services, Inc., | | | | | | | | | | | | |
Gtd. Notes, 144A | | 7.875 | | 12/15/29 | | | 710 | | | | 744,709 | |
Power Finance Corp. Ltd. (India), | | | | | | | | | | | | |
Sr. Unsec’d. Notes, EMTN | | 5.250 | | 08/10/28 | | | 1,100 | | | | 1,103,094 | |
| | | | | | | | | | | | |
| | | | |
| | | | | | | | | | | 13,525,298 | |
See Notes to Financial Statements.
16
| | | | | | | | | | | | |
| | | | |
| Description | | Interest Rate | | Maturity Date | | Principal Amount (000)# | | | Value | |
| | | | |
CORPORATE BONDS (Continued) | | | | | | | | | | | | |
| | | | |
Electric 1.7% | | | | | | | | | | | | |
| | | | |
Algonquin Power & Utilities Corp. (Canada), | | | | | | | | | | | | |
Sr. Unsec’d. Notes | | 5.365%(cc) | | 06/15/26 | | | 1,635 | | | $ | 1,643,484 | |
American Electric Power Co., Inc., | | | | | | | | | | | | |
Jr. Sub. Notes | | 5.699 | | 08/15/25 | | | 2,075 | | | | 2,086,109 | |
Aydem Yenilenebilir Enerji A/S (Turkey), | | | | | | | | | | | | |
Sr. Sec’d. Notes | | 7.750 | | 02/02/27 | | | 3,500 | | | | 3,474,844 | |
Sr. Sec’d. Notes, 144A | | 7.750 | | 02/02/27 | | | 630 | | | | 625,472 | |
Calpine Corp., | | | | | | | | | | | | |
Sr. Unsec’d. Notes, 144A | | 4.625 | | 02/01/29 | | | 1,500 | | | | 1,424,729 | |
Sr. Unsec’d. Notes, 144A | | 5.000 | | 02/01/31 | | | 2,695 | | | | 2,543,427 | |
Clean Renewable Power Mauritius Pte Ltd. (India), | | | | | | | | | | | | |
Sr. Sec’d. Notes, 144A | | 4.250 | | 03/25/27 | | | 398 | | | | 379,911 | |
Duke Energy Carolinas LLC, | | | | | | | | | | | | |
First Ref. Mortgage | | 4.000 | | 09/30/42 | | | 50 | | | | 41,563 | |
Enel Finance International NV (Italy), | | | | | | | | | | | | |
Gtd. Notes, 144A | | 5.125 | | 06/26/29 | | | 6,560 | | | | 6,585,953 | |
Engie SA (France), | | | | | | | | | | | | |
Sr. Unsec’d. Notes, 144A | | 5.250 | | 04/10/29 | | | 2,440 | | | | 2,473,732 | |
Eskom Holdings SOC Ltd. (South Africa), | | | | | | | | | | | | |
Gov’t. Gtd. Notes, 144A, MTN | | 6.350 | | 08/10/28 | | | 1,337 | | | | 1,335,329 | |
Gov’t. Gtd. Notes, MTN | | 6.350 | | 08/10/28 | | | 213 | | | | 212,734 | |
Sr. Unsec’d. Notes | | 7.125 | | 02/11/25 | | | 2,500 | | | | 2,496,100 | |
Sr. Unsec’d. Notes, 144A | | 7.125 | | 02/11/25 | | | 2,145 | | | | 2,141,654 | |
Sr. Unsec’d. Notes, 144A, MTN | | 8.450 | | 08/10/28 | | | 290 | | | | 302,597 | |
Sr. Unsec’d. Notes, MTN | | 8.450 | | 08/10/28 | | | 2,180 | | | | 2,274,699 | |
Israel Electric Corp. Ltd. (Israel), | | | | | | | | | | | | |
Sr. Sec’d. Notes, 144A, GMTN | | 4.250 | | 08/14/28 | | | 3,000 | | | | 2,829,000 | |
Mong Duong Finance Holdings BV (Vietnam), | | | | | | | | | | | | |
Sr. Sec’d. Notes | | 5.125 | | 05/07/29 | | | 1,092 | | | | 1,061,340 | |
MVM Energetika Zrt (Hungary), | | | | | | | | | | | | |
Sr. Unsec’d. Notes | | 7.500 | | 06/09/28 | | | 2,330 | | | | 2,456,694 | |
NRG Energy, Inc., | | | | | | | | | | | | |
Gtd. Notes, 144A | | 3.625 | | 02/15/31 | | | 1,475 | | | | 1,306,370 | |
Gtd. Notes, 144A | | 3.875 | | 02/15/32 | | | 1,050 | | | | 931,069 | |
Jr. Sub. Notes, 144A | | 10.250(ff) | | 03/15/28(oo) | | | 275 | | | | 303,650 | |
Vistra Corp., | | | | | | | | | | | | |
Jr. Sub. Notes, 144A | | 7.000(ff) | | 12/15/26(oo) | | | 450 | | | | 454,360 | |
Jr. Sub. Notes, 144A | | 8.000(ff) | | 10/15/26(oo) | | | 4,125 | | | | 4,242,222 | |
Jr. Sub. Notes, Series C, 144A | | 8.875(ff) | | 01/15/29(oo) | | | 3,250 | | | | 3,479,577 | |
| | | | | | | | | | | | |
| | | | |
| | | | | | | | | | | 47,106,619 | |
See Notes to Financial Statements.
PGIM Absolute Return Bond Fund 17
Schedule of Investments (continued)
as of October 31, 2024
| | | | | | | | | | | | |
| | | | |
| Description | | Interest Rate | | Maturity Date | | Principal Amount (000)# | | | Value | |
| | | | |
CORPORATE BONDS (Continued) | | | | | | | | | | | | |
| | | | |
Engineering & Construction 0.5% | | | | | | | | | | | | |
| | | | |
Cellnex Finance Co. SA (Spain), | | | | | | | | | | | | |
Gtd. Notes, EMTN | | 2.000% | | 02/15/33 | | EUR | 1,100 | | | $ | 1,049,577 | |
Cellnex Telecom SA (Spain), | | | | | | | | | | | | |
Sr. Unsec’d. Notes, EMTN | | 1.750 | | 10/23/30 | | EUR | 700 | | | | 692,232 | |
MasTec, Inc., | | | | | | | | | | | | |
Sr. Unsec’d. Notes | | 5.900 | | 06/15/29 | | | 3,705 | | | | 3,788,948 | |
Mexico City Airport Trust (Mexico), | | | | | | | | | | | | |
Sr. Sec’d. Notes, 144A | | 3.875 | | 04/30/28 | | | 2,000 | | | | 1,902,540 | |
Sr. Sec’d. Notes, 144A | | 4.250 | | 10/31/26 | | | 218 | | | | 213,708 | |
Sr. Sec’d. Notes, 144A | | 5.500 | | 10/31/46 | | | 415 | | | | 345,230 | |
Sr. Sec’d. Notes, 144A | | 5.500 | | 07/31/47 | | | 6,995 | | | | 5,821,169 | |
| | | | | | | | | | | | |
| | | | |
| | | | | | | | | | | 13,813,404 | |
| | | | |
Entertainment 0.3% | | | | | | | | | | | | |
| | | | |
Caesars Entertainment, Inc., | | | | | | | | | | | | |
Sr. Sec’d. Notes, 144A | | 6.500 | | 02/15/32 | | | 655 | | | | 664,865 | |
Sr. Sec’d. Notes, 144A | | 7.000 | | 02/15/30 | | | 1,450 | | | | 1,486,261 | |
CCM Merger, Inc., | | | | | | | | | | | | |
Sr. Unsec’d. Notes, 144A | | 6.375 | | 05/01/26 | | | 1,525 | | | | 1,520,304 | |
Codere Finance 2 Luxembourg SA (Spain), | | | | | | | | | | | | |
Sr. Sec’d. Notes, PIK 11.000%^ | | 11.000 | | 12/31/28 | | EUR | 822 | | | | 885,389 | |
Jacobs Entertainment, Inc., | | | | | | | | | | | | |
Sr. Unsec’d. Notes, 144A | | 6.750 | | 02/15/29 | | | 1,125 | | | | 1,107,070 | |
Sr. Unsec’d. Notes, 144A | | 6.750 | | 02/15/29 | | | 690 | | | | 673,636 | |
Premier Entertainment Sub LLC/Premier Entertainment Finance Corp., | | | | | | | | | | | | |
Gtd. Notes, 144A | | 5.875 | | 09/01/31 | | | 625 | | | | 405,067 | |
Wynn Resorts Finance LLC/Wynn Resorts Capital Corp., | | | | | | | | | | | | |
Gtd. Notes, 144A | | 6.250 | | 03/15/33 | | | 1,190 | | | | 1,184,726 | |
Gtd. Notes, 144A | | 7.125 | | 02/15/31 | | | 680 | | | | 715,110 | |
| | | | | | | | | | | | |
| | | | |
| | | | | | | | | | | 8,642,428 | |
| | | | |
Environmental Control 0.0% | | | | | | | | | | | | |
| | | | |
GFL Environmental, Inc., | | | | | | | | | | | | |
Sr. Sec’d. Notes, 144A | | 6.750 | | 01/15/31 | | | 310 | | | | 319,021 | |
See Notes to Financial Statements.
18
| | | | | | | | | | | | |
| | | | |
| Description | | Interest Rate | | Maturity Date | | Principal Amount (000)# | | | Value | |
| | | | |
CORPORATE BONDS (Continued) | | | | | | | | | | | | |
| | | | |
Foods 1.3% | | | | | | | | | | | | |
| | | | |
Albertson’s Cos., Inc./Safeway, Inc./New Albertson’s LP/Albertson’s LLC, | | | | | | | | | | | | |
Gtd. Notes, 144A | | 6.500% | | 02/15/28 | | | 450 | | | $ | 457,730 | |
B&G Foods, Inc., | | | | | | | | | | | | |
Gtd. Notes | | 5.250 | | 09/15/27 | | | 1,275 | | | | 1,236,950 | |
Sr. Sec’d. Notes, 144A | | 8.000 | | 09/15/28 | | | 675 | | | | 701,309 | |
Bellis Acquisition Co. PLC (United Kingdom), | | | | | | | | | | | | |
Sr. Sec’d. Notes, 144A | | 8.125 | | 05/14/30 | | GBP | 6,950 | | | | 8,830,389 | |
Bellis Finco PLC (United Kingdom), | | | | | | | | | | | | |
Gtd. Notes | | 4.000 | | 02/16/27 | | GBP | 2,700 | | | | 3,245,468 | |
Ingles Markets, Inc., | | | | | | | | | | | | |
Sr. Unsec’d. Notes, 144A | | 4.000 | | 06/15/31 | | | 275 | | | | 245,439 | |
Lamb Weston Holdings, Inc., | | | | | | | | | | | | |
Gtd. Notes, 144A | | 4.125 | | 01/31/30 | | | 175 | | | | 162,473 | |
Gtd. Notes, 144A | | 4.375 | | 01/31/32 | | | 2,325 | | | | 2,128,605 | |
Picard Groupe SAS (France), | | | | | | | | | | | | |
Sr. Sec’d. Notes, 144A | | 6.375 | | 07/01/29 | | EUR | 7,000 | | | | 7,761,510 | |
Post Holdings, Inc., | | | | | | | | | | | | |
Gtd. Notes, 144A | | 4.625 | | 04/15/30 | | | 225 | | | | 210,393 | |
Gtd. Notes, 144A | | 6.375 | | 03/01/33 | | | 1,055 | | | | 1,044,680 | |
Sr. Sec’d. Notes, 144A(a) | | 6.250 | | 02/15/32 | | | 660 | | | | 668,217 | |
Smithfield Foods, Inc., | | | | | | | | | | | | |
Sr. Unsec’d. Notes, 144A | | 3.000 | | 10/15/30 | | | 8,270 | | | | 7,169,110 | |
US Foods, Inc., | | | | | | | | | | | | |
Gtd. Notes, 144A | | 5.750 | | 04/15/33 | | | 590 | | | | 581,174 | |
| | | | | | | | | | | | |
| | | | |
| | | | | | | | | | | 34,443,447 | |
| | | | |
Forest Products & Paper 0.1% | | | | | | | | | | | | |
| | | | |
Georgia-Pacific LLC, | | | | | | | | | | | | |
Sr. Unsec’d. Notes | | 7.375 | | 12/01/25 | | | 400 | | | | 411,766 | |
LD Celulose International GmbH (Brazil), | | | | | | | | | | | | |
Sr. Sec’d. Notes, 144A(a) | | 7.950 | | 01/26/32 | | | 3,085 | | | | 3,152,870 | |
| | | | | | | | | | | | |
| | | | |
| | | | | | | | | | | 3,564,636 | |
| | | | |
Gas 0.2% | | | | | | | | | | | | |
| | | | |
AmeriGas Partners LP/AmeriGas Finance Corp., | | | | | | | | | | | | |
Sr. Unsec’d. Notes | | 5.500 | | 05/20/25 | | | 373 | | | | 371,251 | |
See Notes to Financial Statements.
PGIM Absolute Return Bond Fund 19
Schedule of Investments (continued)
as of October 31, 2024
| | | | | | | | | | | | |
| | | | |
| Description | | Interest Rate | | Maturity Date | | Principal Amount (000)# | | | Value | |
| | | | |
CORPORATE BONDS (Continued) | | | | | | | | | | | | |
| | | | |
Gas (cont’d.) | | | | | | | | | | | | |
| | | | |
ENN Clean Energy International Investment Ltd. (China), | | | | | | | | | | | | |
Gtd. Notes, 144A | | 3.375% | | 05/12/26 | | | 1,350 | | | $ | 1,309,952 | |
NiSource, Inc., | | | | | | | | | | | | |
Sr. Unsec’d. Notes | | 5.200 | | 07/01/29 | | | 2,525 | | | | 2,559,214 | |
| | | | | | | | | | | | |
| | | | |
| | | | | | | | | | | 4,240,417 | |
| | | | |
Healthcare-Products 0.1% | | | | | | | | | | | | |
| | | | |
Medline Borrower LP, | | | | | | | | | | | | |
Sr. Sec’d. Notes, 144A | | 3.875 | | 04/01/29 | | | 1,710 | | | | 1,600,652 | |
| | |
Healthcare-Services 0.4% | | | | | | | | |
| | | | |
Aetna, Inc., | | | | | | | | | | | | |
Sr. Unsec’d. Notes | | 4.500 | | 05/15/42 | | | 530 | | | | 447,479 | |
Cigna Group (The), | | | | | | | | | | | | |
Gtd. Notes(h) | | 4.375 | | 10/15/28 | | | 3,990 | | | | 3,919,100 | |
DaVita, Inc., | | | | | | | | | | | | |
Gtd. Notes, 144A | | 4.625 | | 06/01/30 | | | 2,625 | | | | 2,414,572 | |
Elevance Health, Inc., | | | | | | | | | | | | |
Sr. Unsec’d. Notes | | 4.101 | | 03/01/28 | | | 700 | | | | 686,214 | |
Sr. Unsec’d. Notes | | 4.650 | | 01/15/43 | | | 120 | | | | 106,494 | |
Sr. Unsec’d. Notes | | 5.100 | | 01/15/44 | | | 515 | | | | 480,114 | |
Tenet Healthcare Corp., | | | | | | | | | | | | |
Sr. Sec’d. Notes | | 6.750 | | 05/15/31 | | | 1,425 | | | | 1,456,741 | |
Sr. Unsec’d. Notes | | 6.875 | | 11/15/31 | | | 1,200 | | | | 1,286,377 | |
| | | | | | | | | | | | |
| | | | |
| | | | | | | | | | | 10,797,091 | |
| | | | |
Home Builders 0.3% | | | | | | | | | | | | |
| | | | |
Beazer Homes USA, Inc., | | | | | | | | | | | | |
Gtd. Notes | | 5.875 | | 10/15/27 | | | 150 | | | | 148,768 | |
Gtd. Notes | | 7.250 | | 10/15/29 | | | 3,475 | | | | 3,532,031 | |
M/I Homes, Inc., | | | | | | | | | | | | |
Gtd. Notes | | 4.950 | | 02/01/28 | | | 1,000 | | | | 966,900 | |
Taylor Morrison Communities, Inc., | | | | | | | | | | | | |
Gtd. Notes, 144A | | 5.875 | | 06/15/27 | | | 2,560 | | | | 2,574,177 | |
| | | | | | | | | | | | |
| | | | |
| | | | | | | | | | | 7,221,876 | |
| | | | |
Housewares 0.0% | | | | | | | | | | | | |
| | | | |
Newell Brands, Inc., | | | | | | | | | | | | |
Sr. Unsec’d. Notes | | 6.375 | | 05/15/30 | | | 355 | | | | 356,922 | |
See Notes to Financial Statements.
20
| | | | | | | | | | | | |
| | | | |
| Description | | Interest Rate | | Maturity Date | | Principal Amount (000)# | | | Value | |
| | | | |
CORPORATE BONDS (Continued) | | | | | | | | | | | | |
| | | | |
Housewares (cont’d.) | | | | | | | | | | | | |
| | | | |
Newell Brands, Inc., (cont’d.) | | | | | | | | | | | | |
Sr. Unsec’d. Notes | | 6.625% | | 05/15/32 | | | 185 | | | $ | 185,667 | |
SWF Holdings I Corp., | | | | | | | | | | | | |
Sr. Unsec’d. Notes, 144A (original cost $289,469; purchased 03/07/22)(f) | | 6.500 | | 10/01/29 | | | 325 | | | | 212,476 | |
| | | | | | | | | | | | |
| | | | |
| | | | | | | | | | | 755,065 | |
| | | | |
Insurance 0.1% | | | | | | | | | | | | |
| | | | |
Hartford Financial Services Group, Inc. (The), | | | | | | | | | | | | |
Sr. Unsec’d. Notes | | 5.950 | | 10/15/36 | | | 215 | | | | 224,301 | |
Sr. Unsec’d. Notes | | 6.100 | | 10/01/41 | | | 280 | | | | 292,174 | |
Liberty Mutual Group, Inc., | | | | | | | | | | | | |
Gtd. Notes, 144A | | 4.569 | | 02/01/29 | | | 1,614 | | | | 1,587,102 | |
Lincoln National Corp., | | | | | | | | | | | | |
Sr. Unsec’d. Notes | | 5.852 | | 03/15/34 | | | 985 | | | | 1,011,770 | |
Sr. Unsec’d. Notes | | 7.000 | | 06/15/40 | | | 32 | | | | 35,808 | |
Principal Financial Group, Inc., | | | | | | | | | | | | |
Gtd. Notes | | 4.350 | | 05/15/43 | | | 245 | | | | 211,681 | |
Teachers Insurance & Annuity Association of America, | | | | | | | | | | | | |
Sub. Notes, 144A | | 6.850 | | 12/16/39 | | | 54 | | | | 61,296 | |
| | | | | | | | | | | | |
| | | | |
| | | | | | | | | | | 3,424,132 | |
| | | | |
Internet 0.1% | | | | | | | | | | | | |
| | | | |
United Group BV (Slovenia), | | | | | | | | | | | | |
Sr. Sec’d. Notes, 144A | | 6.750 | | 02/15/31 | | EUR | 2,950 | | | | 3,247,273 | |
| | | | |
Iron/Steel 0.1% | | | | | | | | | | | | |
| | | | |
Big River Steel LLC/BRS Finance Corp., | | | | | | | | | | | | |
Sr. Sec’d. Notes, 144A | | 6.625 | | 01/31/29 | | | 1,600 | | | | 1,611,710 | |
Cleveland-Cliffs, Inc., | | | | | | | | | | | | |
Gtd. Notes, 144A | | 6.875 | | 11/01/29 | | | 580 | | | | 582,010 | |
Gtd. Notes, 144A | | 7.375 | | 05/01/33 | | | 375 | | | | 377,819 | |
Mineral Resources Ltd. (Australia), | | | | | | | | | | | | |
Sr. Unsec’d. Notes, 144A | | 9.250 | | 10/01/28 | | | 575 | | | | 605,682 | |
| | | | | | | | | | | | |
| | | | |
| | | | | | | | | | | 3,177,221 | |
See Notes to Financial Statements.
PGIM Absolute Return Bond Fund 21
Schedule of Investments (continued)
as of October 31, 2024
| | | | | | | | | | | | |
| | | | |
| Description | | Interest Rate | | Maturity Date | | Principal Amount (000)# | | | Value | |
| | | | |
CORPORATE BONDS (Continued) | | | | | | | | | | | | |
| | | | |
Leisure Time 0.4% | | | | | | | | | | | | |
| | | | |
Carnival Corp., | | | | | | | | | | | | |
Gtd. Notes, 144A | | 5.750% | | 03/01/27 | | | 2,375 | | | $ | 2,380,937 | |
Gtd. Notes, 144A | | 6.000 | | 05/01/29 | | | 2,250 | | | | 2,252,812 | |
Sr. Sec’d. Notes, 144A | | 4.000 | | 08/01/28 | | | 125 | | | | 118,715 | |
NCL Corp. Ltd., | | | | | | | | | | | | |
Gtd. Notes, 144A | | 5.875 | | 03/15/26 | | | 1,300 | | | | 1,298,323 | |
Sr. Sec’d. Notes, 144A | | 8.125 | | 01/15/29 | | | 550 | | | | 583,000 | |
Sr. Sec’d. Notes, 144A | | 8.375 | | 02/01/28 | | | 925 | | | | 970,094 | |
Royal Caribbean Cruises Ltd., | | | | | | | | | | | | |
Sr. Unsec’d. Notes, 144A | | 5.500 | | 08/31/26 | | | 950 | | | | 949,554 | |
Sr. Unsec’d. Notes, 144A | | 5.500 | | 04/01/28 | | | 25 | | | | 25,000 | |
Sr. Unsec’d. Notes, 144A | | 5.625 | | 09/30/31 | | | 845 | | | | 839,271 | |
Viking Cruises Ltd., | | | | | | | | | | | | |
Gtd. Notes, 144A | | 5.875 | | 09/15/27 | | | 650 | | | | 643,409 | |
Viking Ocean Cruises Ship VII Ltd., | | | | | | | | | | | | |
Sr. Sec’d. Notes, 144A | | 5.625 | | 02/15/29 | | | 1,100 | | | | 1,081,212 | |
| | | | | | | | | | | | |
| | | | |
| | | | | | | | | | | 11,142,327 | |
| | | |
Lodging 0.3% | | | | | | | | | | |
| | | | |
Boyd Gaming Corp., | | | | | | | | | | | | |
Gtd. Notes, 144A | | 4.750 | | 06/15/31 | | | 545 | | | | 508,589 | |
MGM China Holdings Ltd. (Macau), | | | | | | | | | | | | |
Sr. Unsec’d. Notes, 144A | | 4.750 | | 02/01/27 | | | 700 | | | | 675,696 | |
MGM Resorts International, | | | | | | | | | | | | |
Gtd. Notes | | 4.750 | | 10/15/28 | | | 2,400 | | | | 2,318,696 | |
Gtd. Notes | | 6.500 | | 04/15/32 | | | 2,000 | | | | 2,000,249 | |
Sands China Ltd. (Macau), | | | | | | | | | | | | |
Sr. Unsec’d. Notes | | 5.400 | | 08/08/28 | | | 344 | | | | 342,435 | |
Sugarhouse HSP Gaming Prop Mezz LP/Sugarhouse HSP Gaming Finance Corp., | | | | | | | | | | | | |
Sr. Sec’d. Notes, 144A | | 5.875 | | 05/15/25 | | | 1,198 | | | | 1,195,018 | |
Wynn Macau Ltd. (Macau), | | | | | | | | | | | | |
Sr. Unsec’d. Notes, 144A | | 5.500 | | 10/01/27 | | | 1,025 | | | | 991,047 | |
| | | | | | | | | | | | |
| | | | |
| | | | | | | | | | | 8,031,730 | |
| | | | |
Machinery-Diversified 0.1% | | | | | | | | | | | | |
| | | | |
AGCO Corp., | | | | | | | | | | | | |
Gtd. Notes | | 5.450 | | 03/21/27 | | | 850 | | | | 858,785 | |
See Notes to Financial Statements.
22
| | | | | | | | | | | | |
| | | | |
| Description | | Interest Rate | | Maturity Date | | Principal Amount (000)# | | | Value | |
| | | | |
CORPORATE BONDS (Continued) | | | | | | | | | | | | |
| | | | |
Machinery-Diversified (cont’d.) | | | | | | | | | | | | |
| | | | |
Chart Industries, Inc., | | | | | | | | | | | | |
Sr. Sec’d. Notes, 144A | | 7.500% | | 01/01/30 | | | 850 | | | $ | 883,151 | |
Maxim Crane Works Holdings Capital LLC, | | | | | | | | | | | | |
Sec’d. Notes, 144A | | 11.500 | | 09/01/28 | | | 1,875 | | | | 2,012,941 | |
| | | | | | | | | | | | |
| | | | |
| | | | | | | | | | | 3,754,877 | |
| | | | |
Media 0.7% | | | | | | | | | | | | |
| | | | |
CCO Holdings LLC/CCO Holdings Capital Corp., | | | | | | | | | | | | |
Sr. Unsec’d. Notes, 144A | | 4.750 | | 03/01/30 | | | 1,300 | | | | 1,182,967 | |
Charter Communications Operating LLC/Charter Communications Operating Capital, | | | | | | | | | | | | |
Sr. Sec’d. Notes | | 2.250 | | 01/15/29 | | | 1,220 | | | | 1,070,858 | |
Sr. Sec’d. Notes | | 6.384 | | 10/23/35 | | | 1,140 | | | | 1,139,706 | |
Sr. Sec’d. Notes | | 6.484 | | 10/23/45 | | | 400 | | | | 378,648 | |
CSC Holdings LLC, | | | | | | | | | | | | |
Gtd. Notes, 144A | | 3.375 | | 02/15/31 | | | 1,000 | | | | 717,376 | |
Gtd. Notes, 144A | | 4.125 | | 12/01/30 | | | 300 | | | | 221,159 | |
Gtd. Notes, 144A | | 5.375 | | 02/01/28 | | | 1,600 | | | | 1,369,226 | |
Gtd. Notes, 144A | | 5.500 | | 04/15/27 | | | 1,500 | | | | 1,335,005 | |
Sr. Unsec’d. Notes, 144A | | 4.625 | | 12/01/30 | | | 1,000 | | | | 502,411 | |
Diamond Sports Group LLC/Diamond Sports Finance Co., | | | | | | | | | | | | |
Gtd. Notes, 144A (original cost $2,576,156; purchased 07/18/19 - 02/27/20)(f) | | 6.625 | | 08/15/27(d) | | | 2,785 | | | | 17,652 | |
Sec’d. Notes, 144A (original cost $147,813; purchased 01/31/24)(f) | | 5.375 | | 08/15/26(d) | | | 2,150 | | | | 14,527 | |
DISH DBS Corp., | | | | | | | | | | | | |
Gtd. Notes | | 5.125 | | 06/01/29 | | | 425 | | | | 282,280 | |
Gtd. Notes | | 7.375 | | 07/01/28 | | | 350 | | | | 256,297 | |
Gtd. Notes | | 7.750 | | 07/01/26 | | | 550 | | | | 464,682 | |
DISH Network Corp., | | | | | | | | | | | | |
Sr. Sec’d. Notes, 144A | | 11.750 | | 11/15/27 | | | 3,500 | | | | 3,684,608 | |
Sinclair Television Group, Inc., | | | | | | | | | | | | |
Gtd. Notes, 144A (original cost $225,500; purchased 05/08/23)(f) | | 5.125 | | 02/15/27 | | | 275 | | | | 243,373 | |
Univision Communications, Inc., | | | | | | | | | | | | |
Sr. Sec’d. Notes, 144A | | 8.000 | | 08/15/28 | | | 2,185 | | | | 2,220,429 | |
See Notes to Financial Statements.
PGIM Absolute Return Bond Fund 23
Schedule of Investments (continued)
as of October 31, 2024
| | | | | | | | | | | | |
| | | | |
| Description | | Interest Rate | | Maturity Date | | Principal Amount (000)# | | | Value | |
| | | | |
CORPORATE BONDS (Continued) | | | | | | | | | | | | |
| | | | |
Media (cont’d.) | | | | | | | | | | | | |
| | | | |
Virgin Media Secured Finance PLC (United Kingdom), | | | | | | | | | | | | |
Sr. Sec’d. Notes | | 4.125% | | 08/15/30 | | GBP | 700 | | | $ | 772,368 | |
Sr. Sec’d. Notes | | 4.250 | | 01/15/30 | | GBP | 2,700 | | | | 3,047,718 | |
| | | | | | | | | | | | |
| | | | |
| | | | | | | | | | | 18,921,290 | |
| | | | |
Mining 0.3% | | | | | | | | | | | | |
| | | | |
AngloGold Ashanti Holdings PLC (Australia), | | | | | | | | | | | | |
Gtd. Notes | | 3.375 | | 11/01/28 | | | 730 | | | | 675,710 | |
First Quantum Minerals Ltd. (Zambia), | | | | | | | | | | | | |
Gtd. Notes, 144A | | 6.875 | | 10/15/27 | | | 600 | | | | 593,034 | |
Sec’d. Notes, 144A | | 9.375 | | 03/01/29 | | | 350 | | | | 370,863 | |
Freeport Indonesia PT (Indonesia), | | | | | | | | | | | | |
Sr. Unsec’d. Notes, EMTN | | 5.315 | | 04/14/32 | | | 600 | | | | 591,000 | |
Hecla Mining Co., | | | | | | | | | | | | |
Gtd. Notes | | 7.250 | | 02/15/28 | | | 1,200 | | | | 1,212,864 | |
Indonesia Asahan Aluminium PT/Mineral Industri Indonesia Persero PT (Indonesia), | | | | | | | | | | | | |
Sr. Unsec’d. Notes | | 6.530 | | 11/15/28 | | | 1,650 | | | | 1,721,280 | |
Novelis Corp., | | | | | | | | | | | | |
Gtd. Notes, 144A | | 3.250 | | 11/15/26 | | | 1,425 | | | | 1,370,384 | |
| | | | | | | | | | | | |
| | | | |
| | | | | | | | | | | 6,535,135 | |
| | | | |
Multi-National 0.1% | | | | | | | | | | | | |
| | | | |
Corp. Andina de Fomento (Supranational Bank), | | | | | | | | | | | | |
Sr. Unsec’d. Notes | | 6.000 | | 04/26/27 | | | 1,665 | | | | 1,718,055 | |
| | | | |
Office/Business Equipment 0.2% | | | | | | | | | | | | |
| | | | |
CDW LLC/CDW Finance Corp., | | | | | | | | | | | | |
Gtd. Notes(a) | | 4.250 | | 04/01/28 | | | 4,010 | | | | 3,902,092 | |
Gtd. Notes | | 5.100 | | 03/01/30 | | | 1,255 | | | | 1,246,237 | |
| | | | | | | | | | | | |
| | | | |
| | | | | | | | | | | 5,148,329 | |
| | | | |
Oil & Gas 2.1% | | | | | | | | | | | | |
| | | | |
Aker BP ASA (Norway), | | | | | | | | | | | | |
Sr. Unsec’d. Notes, 144A | | 3.750 | | 01/15/30 | | | 2,760 | | | | 2,569,628 | |
Sr. Unsec’d. Notes, 144A | | 5.600 | | 06/13/28 | | | 2,440 | | | | 2,468,414 | |
Ascent Resources Utica Holdings LLC/ARU Finance Corp., | | | | | | | | | | | | |
Gtd. Notes, 144A | | 9.000 | | 11/01/27 | | | 899 | | | | 1,067,193 | |
See Notes to Financial Statements.
24
| | | | | | | | | | | | |
| | | | |
| Description | | Interest Rate | | Maturity Date | | Principal Amount (000)# | | | Value | |
| | | | |
CORPORATE BONDS (Continued) | �� | | | | | | | | | | | |
| | | | |
Oil & Gas (cont’d.) | | | | | | | | | | | | |
| | | | |
Ascent Resources Utica Holdings LLC/ARU Finance Corp., (cont’d.) | | | | | | | | | | | | |
Sr. Unsec’d. Notes, 144A | | 6.625% | | 10/15/32 | | | 565 | | | $ | 559,726 | |
Cenovus Energy, Inc. (Canada), | | | | | | | | | | | | |
Sr. Unsec’d. Notes | | 5.400 | | 06/15/47 | | | 1,092 | | | | 1,010,880 | |
CITGO Petroleum Corp., | | | | | | | | | | | | |
Sr. Sec’d. Notes, 144A | | 7.000 | | 06/15/25 | | | 1,325 | | | | 1,326,419 | |
Civitas Resources, Inc., | | | | | | | | | | | | |
Gtd. Notes, 144A | | 8.375 | | 07/01/28 | | | 200 | | | | 206,794 | |
Gtd. Notes, 144A | | 8.625 | | 11/01/30 | | | 225 | | | | 236,434 | |
Crescent Energy Finance LLC, | | | | | | | | | | | | |
Gtd. Notes, 144A | | 7.625 | | 04/01/32 | | | 860 | | | | 849,406 | |
Gtd. Notes, 144A | | 9.250 | | 02/15/28 | | | 450 | | | | 472,546 | |
Ecopetrol SA (Colombia), | | | | | | | | | | | | |
Sr. Unsec’d. Notes | | 4.625 | | 11/02/31 | | | 440 | | | | 362,560 | |
Sr. Unsec’d. Notes | | 6.875 | | 04/29/30 | | | 2,170 | | | | 2,112,929 | |
Sr. Unsec’d. Notes | | 7.750 | | 02/01/32 | | | 3,125 | | | | 3,048,125 | |
Sr. Unsec’d. Notes | | 8.625 | | 01/19/29 | | | 4,495 | | | | 4,751,664 | |
Sr. Unsec’d. Notes | | 8.875 | | 01/13/33 | | | 2,660 | | | | 2,719,052 | |
Energean Israel Finance Ltd. (Israel), | | | | | | | | | | | | |
Sr. Sec’d. Notes, 144A | | 5.375 | | 03/30/28 | | | 623 | | | | 560,857 | |
Expand Energy Corp., | | | | | | | | | | | | |
Gtd. Notes | | 4.750 | | 02/01/32 | | | 1,775 | | | | 1,667,590 | |
Gtd. Notes | | 5.375 | | 02/01/29 | | | 725 | | | | 713,965 | |
Hilcorp Energy I LP/Hilcorp Finance Co., | | | | | | | | | | | | |
Sr. Unsec’d. Notes, 144A | | 6.250 | | 11/01/28 | | | 700 | | | | 683,389 | |
Sr. Unsec’d. Notes, 144A | | 6.250 | | 04/15/32 | | | 500 | | | | 469,157 | |
New Generation Gas Gathering LLC,
Sr. Sec’d. Notes, 144A, 3 Month SOFR + 5.750%
(Cap N/A, Floor 2.000%)^ | | 10.342(c) | | 09/30/29 | | | 351 | | | | 346,081 | |
Occidental Petroleum Corp., | | | | | | | | | | | | |
Sr. Unsec’d. Notes | | 5.200 | | 08/01/29 | | | 1,450 | | | | 1,444,681 | |
Ovintiv, Inc., | | | | | | | | | | | | |
Gtd. Notes | | 5.650 | | 05/15/28 | | | 2,145 | | | | 2,173,455 | |
Permian Resources Operating LLC, | | | | | | | | | | | | |
Gtd. Notes, 144A | | 8.000 | | 04/15/27 | | | 1,025 | | | | 1,053,368 | |
Petrobras Global Finance BV (Brazil), | | | | | | | | | | | | |
Gtd. Notes | | 5.375 | | 10/01/29 | | GBP | 800 | | | | 984,547 | |
Gtd. Notes | | 6.625 | | 01/16/34 | | GBP | 300 | | | | 376,354 | |
Gtd. Notes, EMTN | | 6.250 | | 12/14/26 | | GBP | 2,000 | | | | 2,585,618 | |
Petroleos Mexicanos (Mexico), | | | | | | | | | | | | |
Gtd. Notes | | 4.750 | | 02/26/29 | | EUR | 2,055 | | | | 2,063,206 | |
Gtd. Notes | | 5.350 | | 02/12/28 | | | 2,188 | | | | 2,036,350 | |
See Notes to Financial Statements.
PGIM Absolute Return Bond Fund 25
Schedule of Investments (continued)
as of October 31, 2024
| | | | | | | | | | | | |
| | | | |
| Description | | Interest Rate | | Maturity Date | | Principal Amount (000)# | | | Value | |
| | | | |
CORPORATE BONDS (Continued) | | | | | | | | | | | | |
| | | | |
Oil & Gas (cont’d.) | | | | | | | | | | | | |
| | | | |
Petroleos Mexicanos (Mexico), (cont’d.) | | | | | | | | | | | | |
Gtd. Notes | | 6.500% | | 03/13/27 | | | 960 | | | $ | 939,734 | |
Gtd. Notes | | 6.700 | | 02/16/32 | | | 2,660 | | | | 2,359,925 | |
Gtd. Notes | | 6.840 | | 01/23/30 | | | 500 | | | | 460,125 | |
Gtd. Notes | | 6.875 | | 10/16/25 | | | 2,830 | | | | 2,837,415 | |
Gtd. Notes, EMTN | | 2.750 | | 04/21/27 | | EUR | 5,370 | | | | 5,388,524 | |
Gtd. Notes, EMTN | | 4.875 | | 02/21/28 | | EUR | 1,362 | | | | 1,411,606 | |
Precision Drilling Corp. (Canada), | | | | | | | | | | | | |
Gtd. Notes, 144A | | 7.125 | | 01/15/26 | | | 415 | | | | 414,481 | |
Preem Holdings AB (Sweden), | | | | | | | | | | | | |
Sr. Unsec’d. Notes, 144A | | 12.000 | | 06/30/27 | | EUR | 1,760 | | | | 2,017,341 | |
Transocean, Inc., | | | | | | | | | | | | |
Gtd. Notes, 144A | | 8.250 | | 05/15/29 | | | 335 | | | | 337,094 | |
| | | | | | | | | | | | |
| | | | |
| | | | | | | | | | | 57,086,633 | |
| | | | |
Oil & Gas Services 0.0% | | | | | | | | | | | | |
| | | | |
Cameron International Corp., | | | | | | | | | | | | |
Gtd. Notes | | 5.950 | | 06/01/41 | | | 100 | | | | 99,005 | |
| | | | |
Packaging & Containers 0.2% | | | | | | | | | | | | |
| | | | |
Ball Corp., | | | | | | | | | | | | |
Gtd. Notes(a) | | 2.875 | | 08/15/30 | | | 1,000 | | | | 869,906 | |
Gtd. Notes | | 6.000 | | 06/15/29 | | | 1,125 | | | | 1,142,657 | |
Pactiv Evergreen Group Issuer LLC/Pactiv Evergreen Group Issuer, Inc., | | | | | | | | | | | | |
Sr. Sec’d. Notes, 144A | | 4.375 | | 10/15/28 | | | 2,625 | | | | 2,469,361 | |
Sealed Air Corp./Sealed Air Corp. US, | | | | | | | | | | | | |
Gtd. Notes, 144A | | 6.125 | | 02/01/28 | | | 125 | | | | 126,181 | |
| | | | | | | | | | | | |
| | | | |
| | | | | | | | | | | 4,608,105 | |
| | | | |
Pharmaceuticals 0.3% | | | | | | | | | | | | |
| | | | |
AdaptHealth LLC, | | | | | | | | | | | | |
Gtd. Notes, 144A | | 4.625 | | 08/01/29 | | | 750 | | | | 681,473 | |
Gtd. Notes, 144A | | 6.125 | | 08/01/28 | | | 800 | | | | 788,932 | |
Bausch Health Americas, Inc., | | | | | | | | | | | | |
Gtd. Notes, 144A | | 8.500 | | 01/31/27 | | | 75 | | | | 60,184 | |
Bausch Health Cos., Inc., | | | | | | | | | | | | |
Gtd. Notes, 144A | | 5.000 | | 01/30/28 | | | 400 | | | | 256,000 | |
Gtd. Notes, 144A | | 5.000 | | 02/15/29 | | | 275 | | | | 158,125 | |
Gtd. Notes, 144A | | 5.250 | | 01/30/30 | | | 275 | | | | 151,250 | |
See Notes to Financial Statements.
26
| | | | | | | | | | | | |
| | | | |
| Description | | Interest Rate | | Maturity Date | | Principal Amount (000)# | | | Value | |
| | | | |
CORPORATE BONDS (Continued) | | | | | | | | | | | | |
| | | | |
Pharmaceuticals (cont’d.) | | | | | | | | | | | | |
| | | | |
Bausch Health Cos., Inc., (cont’d.) | | | | | | | | | | | | |
Gtd. Notes, 144A | | 5.250% | | 02/15/31 | | | 275 | | | $ | 148,500 | |
Gtd. Notes, 144A | | 6.250 | | 02/15/29 | | | 1,200 | | | | 742,500 | |
Gtd. Notes, 144A | | 7.000 | | 01/15/28 | | | 275 | | | | 181,500 | |
Gtd. Notes, 144A | | 9.000 | | 12/15/25 | | | 100 | | | | 98,054 | |
Sr. Sec’d. Notes, 144A | | 4.875 | | 06/01/28 | | | 275 | | | | 211,750 | |
Organon & Co./Organon Foreign Debt Co-Issuer BV, | | | | | | | | | | | | |
Sr. Sec’d. Notes, 144A | | 4.125 | | 04/30/28 | | | 650 | | | | 615,832 | |
Sr. Unsec’d. Notes, 144A | | 5.125 | | 04/30/31 | | | 650 | | | | 592,671 | |
Utah Acquisition Sub, Inc., | | | | | | | | | | | | |
Gtd. Notes | | 5.250 | | 06/15/46 | | | 520 | | | | 440,475 | |
Viatris, Inc., | | | | | | | | | | | | |
Gtd. Notes | | 4.000 | | 06/22/50 | | | 2,190 | | | | 1,512,265 | |
| | | | | | | | | | | | |
| | | | |
| | | | | | | | | | | 6,639,511 | |
| | | | |
Pipelines 1.2% | | | | | | | | | | | | |
| | | | |
Antero Midstream Partners LP/Antero Midstream Finance Corp., | | | | | | | | | | | | |
Gtd. Notes, 144A | | 5.375 | | 06/15/29 | | | 1,275 | | | | 1,244,757 | |
Gtd. Notes, 144A | | 6.625 | | 02/01/32 | | | 580 | | | | 586,418 | |
Eastern Gas Transmission & Storage, Inc., | | | | | | | | | | | | |
Sr. Unsec’d. Notes | | 4.600 | | 12/15/44 | | | 125 | | | | 108,132 | |
Energy Transfer LP, | | | | | | | | | | | | |
Jr. Sub. Notes, Series G | | 7.125(ff) | | 05/15/30(oo) | | | 3,360 | | | | 3,418,068 | |
Sr. Unsec’d. Notes | | 5.150 | | 03/15/45 | | | 55 | | | | 48,998 | |
Sr. Unsec’d. Notes | | 5.300 | | 04/15/47 | | | 125 | | | | 112,256 | |
Sr. Unsec’d. Notes | | 5.400 | | 10/01/47 | | | 60 | | | | 54,690 | |
Sr. Unsec’d. Notes | | 6.250 | | 04/15/49 | | | 75 | | | | 76,226 | |
EQM Midstream Partners LP, | | | | | | | | | | | | |
Sr. Unsec’d. Notes, 144A | | 6.500 | | 07/01/27 | | | 700 | | | | 716,029 | |
Kinder Morgan, Inc., | | | | | | | | | | | | |
Sr. Unsec’d. Notes | | 5.100 | | 08/01/29 | | | 6,310 | | | | 6,335,955 | |
MPLX LP, | | | | | | | | | | | | |
Sr. Unsec’d. Notes | | 5.200 | | 03/01/47 | | | 145 | | | | 131,114 | |
NGPL PipeCo LLC, | | | | | | | | | | | | |
Sr. Unsec’d. Notes, 144A | | 4.875 | | 08/15/27 | | | 500 | | | | 495,147 | |
ONEOK, Inc., | | | | | | | | | | | | |
Gtd. Notes | | 4.200 | | 12/01/42 | | | 125 | | | | 98,057 | |
Gtd. Notes | | 4.950 | | 07/13/47 | | | 255 | | | | 219,110 | |
Gtd. Notes | | 5.150 | | 10/15/43 | | | 1,350 | | | | 1,229,447 | |
Gtd. Notes | | 5.650 | | 11/01/28 | | | 3,435 | | | | 3,526,315 | |
See Notes to Financial Statements.
PGIM Absolute Return Bond Fund 27
Schedule of Investments (continued)
as of October 31, 2024
| | | | | | | | | | | | |
| | | | |
| Description | | Interest Rate | | Maturity Date | | Principal Amount (000)# | | | Value | |
| | | | |
CORPORATE BONDS (Continued) | | | | | | | | | | | | |
| | | | |
Pipelines (cont’d.) | | | | | | | | | | | | |
| | | | |
Rockies Express Pipeline LLC, | | | | | | | | | | | | |
Sr. Unsec’d. Notes, 144A | | 3.600% | | 05/15/25 | | | 775 | | | $ | 763,909 | |
Sr. Unsec’d. Notes, 144A | | 6.875 | | 04/15/40 | | | 1,850 | | | | 1,753,844 | |
Tallgrass Energy Partners LP/Tallgrass Energy Finance Corp., | | | | | | | | | | | | |
Gtd. Notes, 144A | | 5.500 | | 01/15/28 | | | 1,000 | | | | 960,922 | |
Targa Resources Corp., | | | | | | | | | | | | |
Gtd. Notes | | 6.150 | | 03/01/29 | | | 2,914 | | | | 3,042,376 | |
Venture Global Calcasieu Pass LLC, | | | | | | | | | | | | |
Sr. Sec’d. Notes, 144A | | 3.875 | | 08/15/29 | | | 75 | | | | 69,273 | |
Sr. Sec’d. Notes, 144A | | 4.125 | | 08/15/31 | | | 75 | | | | 68,280 | |
Venture Global LNG, Inc., | | | | | | | | | | | | |
Jr. Sub. Notes, 144A | | 9.000(ff) | | 09/30/29(oo) | | | 1,375 | | | | 1,374,421 | |
Western Midstream Operating LP, | | | | | | | | | | | | |
Sr. Unsec’d. Notes | | 4.500 | | 03/01/28 | | | 4,990 | | | | 4,870,097 | |
Williams Cos., Inc. (The), | | | | | | | | | | | | |
Sr. Unsec’d. Notes | | 5.150 | | 03/15/34 | | | 1,340 | | | | 1,318,918 | |
| | | | | | | | | | | | |
| | | | |
| | | | | | | | | | | 32,622,759 | |
| | | | |
Real Estate 0.1% | | | | | | | | | | | | |
| | | | |
Howard Hughes Corp. (The), | | | | | | | | | | | | |
Gtd. Notes, 144A | | 5.375 | | 08/01/28 | | | 1,375 | | | | 1,336,419 | |
| | | | |
Real Estate Investment Trusts (REITs) 0.4% | | | | | | | | | | | | |
| | | | |
Brixmor Operating Partnership LP, | | | | | | | | | | | | |
Sr. Unsec’d. Notes | | 4.125 | | 05/15/29 | | | 1,441 | | | | 1,384,239 | |
COPT Defense Properties LP, | | | | | | | | | | | | |
Gtd. Notes | | 2.000 | | 01/15/29 | | | 2,170 | | | | 1,903,612 | |
Diversified Healthcare Trust, | | | | | | | | | | | | |
Gtd. Notes | | 4.375 | | 03/01/31 | | | 1,000 | | | | 808,684 | |
Gtd. Notes | | 9.750 | | 06/15/25 | | | 21 | | | | 21,000 | |
Sr. Unsec’d. Notes | | 4.750 | | 02/15/28 | | | 25 | | | | 22,090 | |
GLP Capital LP/GLP Financing II, Inc., | | | | | | | | | | | | |
Gtd. Notes | | 5.300 | | 01/15/29 | | | 2,770 | | | | 2,763,499 | |
MPT Operating Partnership LP/MPT Finance Corp., | | | | | | | | | | | | |
Gtd. Notes | | 3.500 | | 03/15/31 | | | 250 | | | | 176,913 | |
Gtd. Notes | | 5.000 | | 10/15/27 | | | 200 | | | | 176,560 | |
Park Intermediate Holdings LLC/PK Domestic Property LLC/PK Finance Co-Issuer, | | | | | | | | | | | | |
Sr. Sec’d. Notes, 144A | | 4.875 | | 05/15/29 | | | 1,375 | | | | 1,308,649 | |
See Notes to Financial Statements.
28
| | | | | | | | | | | | | | | | |
| | | | |
| Description | | Interest Rate | | | Maturity Date | | | Principal Amount (000)# | | | Value | |
| | | | |
CORPORATE BONDS (Continued) | | | | | | | | | | | | | | | | |
| | | | |
Real Estate Investment Trusts (REITs) (cont’d.) | | | | | | | | | | | | | | | | |
| | | | |
RHP Hotel Properties LP/RHP Finance Corp., | | | | | | | | | | | | | | | | |
Gtd. Notes, 144A | | | 6.500% | | | | 04/01/32 | | | | 975 | | | $ | 985,749 | |
SBA Communications Corp., | | | | | | | | | | | | | | | | |
Sr. Unsec’d. Notes | | | 3.125 | | | | 02/01/29 | | | | 1,500 | | | | 1,364,945 | |
VICI Properties LP/VICI Note Co., Inc., | | | | | | | | | | | | | | | | |
Gtd. Notes, 144A | | | 5.750 | | | | 02/01/27 | | | | 993 | | | | 1,000,941 | |
| | | | | | | | | | | | | | | | |
| | | | |
| | | | | | | | | | | | | | | 11,916,881 | |
| | | | |
Retail 0.8% | | | | | | | | | | | | | | | | |
| | | | |
1011778 BC ULC/New Red Finance, Inc. (Canada), | | | | | | | | | | | | | | | | |
Sr. Sec’d. Notes, 144A | | | 5.625 | | | | 09/15/29 | | | | 1,335 | | | | 1,331,663 | |
Sr. Sec’d. Notes, 144A | | | 6.125 | | | | 06/15/29 | | | | 1,110 | | | | 1,124,508 | |
AutoNation, Inc., | | | | | | | | | | | | | | | | |
Gtd. Notes(a) | | | 3.800 | | | | 11/15/27 | | | | 4,122 | | | | 3,973,293 | |
Carvana Co., | | | | | | | | | | | | | | | | |
Sr. Sec’d. Notes, 144A, Cash coupon 9.000% or PIK 12.000% | | | 12.000 | | | | 12/01/28 | | | | 725 | | | | 767,373 | |
Sr. Sec’d. Notes, 144A, Cash coupon 11.000% or PIK 13.000% | | | 13.000 | | | | 06/01/30 | | | | 1,900 | | | | 2,075,086 | |
eG Global Finance PLC (United Kingdom), | | | | | | | | | | | | | | | | |
Sr. Sec’d. Notes, 144A | | | 11.000 | | | | 11/30/28 | | | EUR | 3,800 | | | | 4,543,158 | |
Sr. Sec’d. Notes, 144A | | | 12.000 | | | | 11/30/28 | | | | 2,175 | | | | 2,411,531 | |
Falabella SA (Chile), | | | | | | | | | | | | | | | | |
Sr. Unsec’d. Notes, 144A | | | 3.375 | | | | 01/15/32 | | | | 1,805 | | | | 1,484,612 | |
Fertitta Entertainment LLC/Fertitta Entertainment Finance Co., Inc., | | | | | | | | | | | | | | | | |
Gtd. Notes, 144A | | | 6.750 | | | | 01/15/30 | | | | 1,075 | | | | 977,384 | |
Lithia Motors, Inc., | | | | | | | | | | | | | | | | |
Sr. Unsec’d. Notes, 144A | | | 3.875 | | | | 06/01/29 | | | | 1,350 | | | | 1,238,528 | |
Sally Holdings LLC/Sally Capital, Inc., | | | | | | | | | | | | | | | | |
Gtd. Notes | | | 6.750 | | | | 03/01/32 | | | | 415 | | | | 420,530 | |
| | | | | | | | | | | | | | | | |
| | | | |
| | | | | | | | | | | | | | | 20,347,666 | |
| | | | |
Semiconductors 0.2% | | | | | | | | | | | | | | | | |
| | | | |
Broadcom, Inc., | | | | | | | | | | | | | | | | |
Sr. Unsec’d. Notes | | | 5.050 | | | | 07/12/29 | | | | 6,365 | | | | 6,420,718 | |
| | | | |
Telecommunications 1.2% | | | | | | | | | | | | | | | | |
| | | | |
CT Trust (Guatemala), | | | | | | | | | | | | | | | | |
Sr. Sec’d. Notes, 144A | | | 5.125 | | | | 02/03/32 | | | | 760 | | | | 688,750 | |
See Notes to Financial Statements.
PGIM Absolute Return Bond Fund 29
Schedule of Investments (continued)
as of October 31, 2024
| | | | | | | | | | | | | | | | |
| | | | |
| Description | | Interest Rate | | | Maturity Date | | | Principal Amount (000)# | | | Value | |
| | | | |
CORPORATE BONDS (Continued) | | | | | | | | | | | | | | | | |
| | | | |
Telecommunications (cont’d.) | | | | | | | | | | | | | | | | |
| | | | |
Digicel Group Holdings Ltd. (Jamaica), | | | | | | | | | | | | | | | | |
Sr. Sec’d. Notes, Series 1B14, 144A (original cost $14; purchased 11/14/23 - 07/25/24)^(f) | | | 0.000% | | | | 12/31/30 | | | | 141 | | | $ | 10,536 | |
Sr. Sec’d. Notes, Series 3A14, 144A (original cost $830; purchased 11/14/23)^(f) | | | 0.000 | | | | 12/31/30 | | | | —(r | ) | | | 363 | |
Sr. Sec’d. Notes, Series 3B14, 144A (original cost $4; purchased 11/14/23)^(f) | | | 0.000 | | | | 12/31/30 | | | | 45 | | | | 303 | |
Digicel Intermediate Holdings Ltd./Digicel International Finance Ltd./DIFL US LLC (Jamaica), | | | | | | | | | | | | | | | | |
Sr. Sec’d. Notes, Cash coupon 9.000% and PIK 1.500% (original cost $1,084,178; purchased 01/29/24 - 05/15/24)(f) | | | 10.500 | | | | 05/25/27 | | | | 1,168 | | | | 1,175,236 | |
Digicel MidCo Ltd./DIFL US II LLC (Jamaica), | | | | | | | | | | | | | | | | |
Sr. Unsec’d. Notes, PIK 10.500% (original cost $516,661; purchased 01/30/24 - 05/15/24)(f) | | | 10.500 | | | | 11/25/28 | | | | 788 | | | | 729,181 | |
Eutelsat SA (France), | | | | | | | | | | | | | | | | |
Sr. Unsec’d. Notes, 144A | | | 9.750 | | | | 04/13/29 | | | EUR | 2,900 | | | | 3,226,145 | |
Frontier Communications Holdings LLC, | | | | | | | | | | | | | | | | |
Sr. Sec’d. Notes, 144A | | | 8.750 | | | | 05/15/30 | | | | 2,000 | | | | 2,118,390 | |
Intelsat Jackson Holdings SA (Luxembourg), | | | | | | | | | | | | | | | | |
Sr. Sec’d. Notes, 144A | | | 6.500 | | | | 03/15/30 | | | | 1,400 | | | | 1,312,500 | |
Level 3 Financing, Inc., | | | | | | | | | | | | | | | | |
Sec’d. Notes, 144A | | | 4.875 | | | | 06/15/29 | | | | 1,975 | | | | 1,689,143 | |
Sr. Sec’d. Notes, 144A | | | 10.500 | | | | 04/15/29 | | | | 465 | | | | 518,331 | |
Sr. Sec’d. Notes, 144A | | | 10.750 | | | | 12/15/30 | | | | 750 | | | | 840,377 | |
Sr. Sec’d. Notes, 144A | | | 11.000 | | | | 11/15/29 | | | | 4,222 | | | | 4,764,733 | |
Lorca Telecom Bondco SA (Spain), | | | | | | | | | | | | | | | | |
Sr. Sec’d. Notes, 144A | | | 5.750 | | | | 04/30/29 | | | EUR | 2,350 | | | | 2,663,318 | |
Millicom International Cellular SA (Guatemala), | | | | | | | | | | | | | | | | |
Sr. Unsec’d. Notes, 144A | | | 4.500 | | | | 04/27/31 | | | | 515 | | | | 462,212 | |
Sprint LLC, | | | | | | | | | | | | | | | | |
Gtd. Notes | | | 7.625 | | | | 02/15/25 | | | | 835 | | | | 836,121 | |
Gtd. Notes | | | 7.625 | | | | 03/01/26 | | | | 315 | | | | 323,259 | |
TalkTalk Telecom Group Ltd. (United Kingdom), | | | | | | | | | | | | | | | | |
Gtd. Notes | | | 3.875 | | | | 02/20/25 | | | GBP | 8,100 | | | | 6,266,727 | |
Total Play Telecomunicaciones SA de CV (Mexico), | | | | | | | | | | | | | | | | |
Gtd. Notes, 144A | | | 6.375 | | | | 09/20/28 | | | | 480 | | | | 267,600 | |
Verizon Communications, Inc., | | | | | | | | | | | | | | | | |
Sr. Unsec’d. Notes(h) | | | 3.400 | | | | 03/22/41 | | | | 1,575 | | | | 1,219,571 | |
See Notes to Financial Statements.
30
| | | | | | | | | | | | | | | | |
| | | | |
| Description | | Interest Rate | | | Maturity Date | | | Principal Amount (000)# | | | Value | |
| | | | |
CORPORATE BONDS (Continued) | | | | | | | | | | | | | | | | |
| | | | |
Telecommunications (cont’d.) | | | | | | | | | | | | | | | | |
| | | | |
Vmed O2 UK Financing I PLC (United Kingdom), | | | | | | | | | | | | | | | | |
Sr. Sec’d. Notes | | | 4.000% | | | | 01/31/29 | | | GBP | 2,250 | | | $ | 2,606,494 | |
Windstream Services LLC/Windstream Escrow Finance Corp., | | | | | | | | | | | | | | | | |
Sr. Sec’d. Notes, 144A | | | 8.250 | | | | 10/01/31 | | | | 345 | | | | 349,287 | |
| | | | | | | | | | | | | | | | |
| | | | |
| | | | | | | | | | | | | | | 32,068,577 | |
| | | | |
Transportation 0.2% | | | | | | | | | | | | | | | | |
| | | | |
Burlington Northern Santa Fe LLC, | | | | | | | | | | | | | | | | |
Sr. Unsec’d. Notes | | | 5.050 | | | | 03/01/41 | | | | 295 | | | | 286,166 | |
GN Bondco LLC, | | | | | | | | | | | | | | | | |
Sr. Sec’d. Notes, 144A | | | 9.500 | | | | 10/15/31 | | | | 4,000 | | | | 4,248,669 | |
Indian Railway Finance Corp. Ltd. (India), | | | | | | | | | | | | | | | | |
Sr. Unsec’d. Notes, 144A, MTN | | | 3.570 | | | | 01/21/32 | | | | 360 | | | | 325,282 | |
RXO, Inc., | | | | | | | | | | | | | | | | |
Gtd. Notes, 144A | | | 7.500 | | | | 11/15/27 | | | | 975 | | | | 1,012,389 | |
XPO, Inc., | | | | | | | | | | | | | | | | |
Gtd. Notes, 144A | | | 7.125 | | | | 06/01/31 | | | | 225 | | | | 232,752 | |
Gtd. Notes, 144A | | | 7.125 | | | | 02/01/32 | | | | 385 | | | | 399,618 | |
| | | | | | | | | | | | | | | | |
| | | | |
| | | | | | | | | | | | | | | 6,504,876 | |
| | | | |
Trucking & Leasing 0.2% | | | | | | | | | | | | | | | | |
| | | | |
Penske Truck Leasing Co. LP/PTL Finance Corp., | | | | | | | | | | | | | | | | |
Sr. Unsec’d. Notes, 144A(a) | | | 5.250 | | | | 07/01/29 | | | | 2,110 | | | | 2,128,902 | |
Sr. Unsec’d. Notes, 144A | | | 5.350 | | | | 03/30/29 | | | | 3,440 | | | | 3,480,626 | |
| | | | | | | | | | | | | | | | |
| | | | |
| | | | | | | | | | | | | | | 5,609,528 | |
| | | | | | | | | | | | | | | | |
| | | | |
TOTAL CORPORATE BONDS | | | | | | | | | | | | | | | | |
(cost $623,839,553) | | | | | | | | | | | | | | | 622,550,063 | |
| | | | | | | | | | | | | | | | |
| | | | |
FLOATING RATE AND OTHER LOANS 1.0% | | | | | | | | | | | | | | | | |
| | | | |
Auto Parts & Equipment 0.0% | | | | | | | | | | | | | | | | |
| | | | |
Tenneco, Inc., | | | | | | | | | | | | | | | | |
Term A Loan, 3 Month SOFR + 4.850% | | | 9.978(c) | | | | 11/17/28 | | | | 544 | | | | 515,501 | |
| | | | |
Computers 0.0% | | | | | | | | | | | | | | | | |
| | | | |
McAfee Corp., | | | | | | | | | | | | | | | | |
Tranche B-1 Term Loan, 1 Month SOFR + 3.250% | | | 8.100(c) | | | | 03/01/29 | | | | 1,005 | | | | 1,001,615 | |
See Notes to Financial Statements.
PGIM Absolute Return Bond Fund 31
Schedule of Investments (continued)
as of October 31, 2024
| | | | | | | | | | | | | | | | |
| | | | |
| Description | | Interest Rate | | | Maturity Date | | | Principal Amount (000)# | | | Value | |
| | | | |
FLOATING RATE AND OTHER LOANS (Continued) | | | | | | | | | | | | | | | | |
| | | | |
Cosmetics/Personal Care 0.1% | | | | | | | | | | | | | | | | |
| | | | |
Rainbow Midco Ltd. (United Kingdom), | | | | | | | | | | | | | | | | |
Note Purchase Facility, 6 Month EURIBOR + 7.750%^ | | | 11.172%(c) | | | | 02/22/30 | | | EUR | 2,545 | | | $ | 2,767,929 | |
| | | | |
Diversified Financial Services 0.0% | | | | | | | | | | | | | | | | |
| | | | |
Hudson River Trading LLC, | | | | | | | | | | | | | | | | |
Term Loan, 3 Month SOFR + 3.262% | | | 8.319(c) | | | | 03/20/28 | | | | 1,162 | | | | 1,161,539 | |
| | | | |
Housewares 0.0% | | | | | | | | | | | | | | | | |
| | | | |
SWF Holdings I Corp., | | | | | | | | | | | | | | | | |
Initial Term Loan, 1 Month SOFR + 4.000% | | | 8.800(c) | | | | 10/06/28 | | | | 25 | | | | 20,447 | |
| | | | |
Media 0.1% | | | | | | | | | | | | | | | | |
| | | | |
CSC Holdings LLC, | | | | | | | | | | | | | | | | |
2022 Refinancing Term Loan, 1 Month SOFR + 4.500% | | | 9.304(c) | | | | 01/18/28 | | | | 995 | | | | 971,307 | |
Diamond Sports Group LLC, | | | | | | | | | | | | | | | | |
Dip Term Loan | | | 10.000 | | | | 12/02/24 | | | | 425 | | | | 447,924 | |
First Lien Term Loan, 1 Month SOFR + 10.100% (original cost $17,471; purchased 03/09/22)^(f) | | | 14.944(c) | | | | 05/25/26 | | | | 18 | | | | 15,430 | |
Second Lien Term Loan | | | 8.175 | | | | 08/24/26 | | | | 2,065 | | | | 5,860 | |
| | | | | | | | | | | | | | | | |
| | | | |
| | | | | | | | | | | | | | | 1,440,521 | |
| | | | |
Metal Fabricate/Hardware 0.2% | | | | | | | | | | | | | | | | |
| | | | |
Doncasters US Finance LLC (United Kingdom), | | | | | | | | | | | | | | | | |
Initial Term Loan, 3 Month SOFR + 6.500%^ | | | 11.104(c) | | | | 04/23/30 | | | | 3,547 | | | | 3,511,703 | |
Tank Holding Corp., | | | | | | | | | | | | | | | | |
Term Loan, 3 Month SOFR + 6.000% | | | 10.245(c) | | | | 03/31/28 | | | | 563 | | | | 551,747 | |
| | | | | | | | | | | | | | | | |
| | | | |
| | | | | | | | | | | | | | | 4,063,450 | |
| | | | |
Pharmaceuticals 0.0% | | | | | | | | | | | | | | | | |
| | | | |
Bausch Health Cos., Inc., | | | | | | | | | | | | | | | | |
Second Amendment Term Loan, 1 Month SOFR + 5.350% | | | 10.706(c) | | | | 02/01/27 | | | | 200 | | | | 195,333 | |
| | | | |
Retail 0.3% | | | | | | | | | | | | | | | | |
| | | | |
CD&R Firefly Bidco Ltd. (United Kingdom), | | | | | | | | | | | | | | | | |
Facility B6 Loan, SONIA + 5.750% | | | 10.950(c) | | | | 06/21/28 | | | GBP | 1,450 | | | | 1,868,300 | |
See Notes to Financial Statements.
32
| | | | | | | | | | | | | | | | |
| | | | |
| Description | | Interest Rate | | | Maturity Date | | | Principal Amount (000)# | | | Value | |
| | | | |
FLOATING RATE AND OTHER LOANS (Continued) | | | | | | | | | | | | | | | | |
| | | | |
Retail (cont’d.) | | | | | | | | | | | | | | | | |
| | | | |
Constellation Automotive Group Ltd. (United Kingdom), | | | | | | | | | | | | | | | | |
Facility 1 Loan, SONIA + 7.500% | | | 12.450%(c) | | | | 07/27/29 | | | GBP | 1,025 | | | $ | 990,321 | |
Peer Holding III BV (Netherlands), | | | | | | | | | | | | | | | | |
Term B-6 Loan, 3 Month EURIBOR + 3.250% | | | 6.595(c) | | | | 07/01/31 | | | EUR | 4,200 | | | | 4,572,548 | |
WSH Services Holdings Ltd. (United Kingdom), | | | | | | | | | | | | | | | | |
Term Facility B2, SONIA + 5.500% | | | 10.450(c) | | | | 05/16/31 | | | GBP | 275 | | | | 354,776 | |
| | | | | | | | | | | | | | | | |
| | | | |
| | | | | | | | | | | | | | | 7,785,945 | |
| | | | |
Telecommunications 0.3% | | | | | | | | | | | | | | | | |
| | | | |
Digicel International Finance Ltd. (Jamaica), | | | | | | | | | | | | | | | | |
Initial Term Loan, 3 Month SOFR + 6.750% | | | 11.335(c) | | | | 05/25/27 | | | | 194 | | | | 193,525 | |
Level 3 Financing, Inc., | | | | | | | | | | | | | | | | |
Term B-1, 1 Month SOFR + 6.560% | | | 11.278(c) | | | | 04/15/29 | | | | 90 | | | | 91,554 | |
Term B-2, 1 Month SOFR + 6.560% | | | 11.278(c) | | | | 04/15/30 | | | | 90 | | | | 92,103 | |
Zegona Holdco Ltd. (United Kingdom), | | | | | | | | | | | | | | | | |
Facility B (EUR) Loan, 6 Month EURIBOR + 4.250% | | | 7.885(c) | | | | 07/17/29 | | | EUR | 6,100 | | | | 6,664,305 | |
| | | | | | | | | | | | | | | | |
| | | | |
| | | | | | | | | | | | | | | 7,041,487 | |
| | | | | | | | | | | | | | | | |
| | | | |
TOTAL FLOATING RATE AND OTHER LOANS | | | | | | | | | | | | | | | | |
(cost $26,586,529) | | | | | | | | | | | | | | | 25,993,767 | |
| | | | | | | | | | | | | | | | |
| | | | |
MUNICIPAL BONDS 0.3% | | | | | | | | | | | | | | | | |
| | | | |
California 0.1% | | | | | | | | | | | | | | | | |
| | | | |
Bay Area Toll Authority, | | | | | | | | | | | | | | | | |
Revenue Bonds, BABs, Series F2 | | | 6.263 | | | | 04/01/49 | | | | 550 | | | | 599,336 | |
University of California, | | | | | | | | | | | | | | | | |
Taxable, Revenue Bonds, Series AP | | | 3.931 | | | | 05/15/45 | | | | 625 | | | | 575,243 | |
Taxable, Revenue Bonds, Series J | | | 4.131 | | | | 05/15/45 | | | | 675 | | | | 611,581 | |
| | | | | | | | | | | | | | | | |
| | | | |
| | | | | | | | | | | | | | | 1,786,160 | |
| | | | |
Colorado 0.1% | | | | | | | | | | | | | | | | |
| | | | |
Regional Transportation District Sales Tax Revenue, | | | | | | | | | | | | | | | | |
Revenue Bonds, BABs, Series B | | | 5.844 | | | | 11/01/50 | | | | 1,190 | | | | 1,258,360 | |
| | | | |
Illinois 0.0% | | | | | | | | | | | | | | | | |
| | | | |
State of Illinois, | | | | | | | | | | | | | | | | |
General Obligation Unlimited, Taxable | | | 5.100 | | | | 06/01/33 | | | | 814 | | | | 809,421 | |
See Notes to Financial Statements.
PGIM Absolute Return Bond Fund 33
Schedule of Investments (continued)
as of October 31, 2024
| | | | | | | | | | | | | | | | |
| | | | |
| Description | | Interest Rate | | | Maturity Date | | | Principal Amount (000)# | | | Value | |
| | | | |
MUNICIPAL BONDS (Continued) | | | | | | | | | | | | | | | | |
| | | | |
New Jersey 0.1% | | | | | | | | | | | | | | | | |
| | | | |
New Jersey Turnpike Authority, | | | | | | | | | | | | | | | | |
Taxable, Revenue Bonds, BABs, Series F | | | 7.414% | | | | 01/01/40 | | | | 2,000 | | | $ | 2,356,852 | |
Rutgers The State University of New Jersey, | | | | | | | | | | | | | | | | |
Taxable, Revenue Bonds, BABs, Series H | | | 5.665 | | | | 05/01/40 | | | | 200 | | | | 202,719 | |
| | | | | | | | | | | | | | | | |
| | | | |
| | | | | | | | | | | | | | | 2,559,571 | |
| | | | |
Ohio 0.0% | | | | | | | | | | | | | | | | |
| | | | |
Ohio State University (The), | | | | | | | | | | | | | | | | |
Taxable, Revenue Bonds, Series A | | | 4.800 | | | | 06/01/2111 | | | | 180 | | | | 161,866 | |
| | | | |
Texas 0.0% | | | | | | | | | | | | | | | | |
| | | | |
City of San Antonio Electric & Gas Systems Revenue, | | | | | | | | | | | | | | | | |
Taxable, Revenue Bonds | | | 4.427 | | | | 02/01/42 | | | | 120 | | | | 113,534 | |
| | | | | | | | | | | | | | | | |
| | | | |
TOTAL MUNICIPAL BONDS | | | | | | | | | | | | | | | | |
(cost $7,658,437) | | | | | | | | | | | | | | | 6,688,912 | |
| | | | | | | | | | | | | | | | |
| | | | |
RESIDENTIAL MORTGAGE-BACKED SECURITIES 3.7% | | | | | | | | | | | | | | | | |
| | | | |
Bayview Financing Trust, | | | | | | | | | | | | | | | | |
Series 2023-01F, Class A, 144A, 30 Day Average SOFR + 4.000% (Cap N/A, Floor 4.000%)^ | | | 8.855(c) | | | | 07/01/26 | | | | 1,030 | | | | 1,031,182 | |
Bellemeade Re Ltd., | | | | | | | | | | | | | | | | |
Series 2024-01, Class M1B, 144A, 30 Day Average SOFR + 3.200% (Cap N/A, Floor 3.150%) | | | 8.057(c) | | | | 08/25/34 | | | | 4,612 | | | | 4,668,037 | |
Chase Mortgage Finance Trust, | | | | | | | | | | | | | | | | |
Series 2007-A01, Class 1A3 | | | 6.554(cc) | | | | 02/25/37 | | | | 24 | | | | 23,487 | |
Citigroup Mortgage Loan Trust, | | | | | | | | | | | | | | | | |
Series 2024-RP02, Class A1, 144A | | | 4.100(cc) | | | | 02/25/63 | | | | 7,512 | | | | 7,000,924 | |
Series 2024-RP02, Class A2, 144A | | | 4.213(cc) | | | | 02/25/63 | | | | 593 | | | | 508,060 | |
Series 2024-RP02, Class B1, 144A | | | 0.000(cc) | | | | 02/25/63 | | | | 180 | | | | 134,836 | |
Series 2024-RP02, Class B2, 144A | | | 0.000(cc) | | | | 02/25/63 | | | | 65 | | | | 44,038 | |
Series 2024-RP02, Class B3, PO, 144A | | | 11.851(s) | | | | 02/25/63 | | | | 165 | | | | 20,160 | |
Series 2024-RP02, Class B4, PO, 144A | | | 15.714(s) | | | | 02/25/63 | | | | 299 | | | | 24,701 | |
Series 2024-RP02, Class M1, 144A | | | 4.213(cc) | | | | 02/25/63 | | | | 399 | | | | 332,934 | |
Series 2024-RP02, Class M2, 144A | | | 4.136(cc) | | | | 02/25/63 | | | | 304 | | | | 243,214 | |
Series 2024-RP02, Class SA, 144A | | | 0.000(cc) | | | | 02/25/63 | | | | 14 | | | | 12,124 | |
Series 2024-RP02, Class X, IO, 144A | | | 0.000(cc) | | | | 02/25/63 | | | | 9,517 | | | | 11,740 | |
See Notes to Financial Statements.
34
| | | | | | | | | | | | |
| | | | |
| Description | | Interest Rate | | Maturity Date | | Principal Amount (000)# | | | Value | |
| | |
RESIDENTIAL MORTGAGE-BACKED SECURITIES (Continued) | | | | | | | | |
Connecticut Avenue Securities Trust, | | | | | | | | | | | | |
Series 2021-R01, Class 1B1, 144A, 30 Day Average SOFR + 3.100% (Cap N/A, Floor 0.000%) | | 7.957%(c) | | 10/25/41 | | | 600 | | | $ | 615,916 | |
Series 2022-R01, Class 1B1, 144A, 30 Day Average SOFR + 3.150% (Cap N/A, Floor 0.000%) | | 8.007(c) | | 12/25/41 | | | 318 | | | | 325,950 | |
Series 2022-R02, Class 2M2, 144A, 30 Day Average SOFR + 3.000% (Cap N/A, Floor 0.000%) | | 7.857(c) | | 01/25/42 | | | 1,900 | | | | 1,948,498 | |
Series 2022-R03, Class 1B1, 144A, 30 Day Average SOFR + 6.250% (Cap N/A, Floor 0.000%) | | 11.107(c) | | 03/25/42 | | | 1,000 | | | | 1,099,012 | |
Series 2022-R04, Class 1B1, 144A, 30 Day Average SOFR + 5.250% (Cap N/A, Floor 0.000%) | | 10.107(c) | | 03/25/42 | | | 290 | | | | 312,605 | |
Series 2022-R04, Class 1M2, 144A, 30 Day Average SOFR + 3.100% (Cap N/A, Floor 0.000%) | | 7.957(c) | | 03/25/42 | | | 1,000 | | | | 1,038,630 | |
Series 2023-R05, Class 1M2, 144A, 30 Day Average SOFR + 3.100% (Cap N/A, Floor 3.100%) | | 7.957(c) | | 06/25/43 | | | 1,400 | | | | 1,463,635 | |
Series 2023-R08, Class 1M2, 144A, 30 Day Average SOFR + 2.500% (Cap N/A, Floor 0.000%) | | 7.357(c) | | 10/25/43 | | | 790 | | | | 810,994 | |
Series 2024-R05, Class 2M2, 144A, 30 Day Average SOFR + 1.700% (Cap N/A, Floor 1.900%) | | 6.557(c) | | 07/25/44 | | | 250 | | | | 251,191 | |
Eagle Re Ltd., | | | | | | | | | | | | |
Series 2021-02, Class M1C, 144A, 30 Day Average SOFR + 3.450% (Cap N/A, Floor 3.450%) | | 8.307(c) | | 04/25/34 | | | 910 | | | | 925,657 | |
Series 2023-01, Class M1A, 144A, 30 Day Average SOFR + 2.000% (Cap N/A, Floor 2.000%) | | 6.857(c) | | 09/26/33 | | | 369 | | | | 370,357 | |
FHLMC Structured Agency Credit Risk REMIC Trust, | | | | | | | | | | | | |
Series 2021-DNA06, Class M2, 144A, 30 Day Average SOFR + 1.500% (Cap N/A, Floor 0.000%) | | 6.357(c) | | 10/25/41 | | | 1,520 | | | | 1,524,850 | |
Series 2021-DNA07, Class M2, 144A, 30 Day Average SOFR + 1.800% (Cap N/A, Floor 0.000%) | | 6.657(c) | | 11/25/41 | | | 100 | | | | 100,813 | |
Series 2021-HQA03, Class M2, 144A, 30 Day Average SOFR + 2.100% (Cap N/A, Floor 0.000%) | | 6.957(c) | | 09/25/41 | | | 100 | | | | 100,811 | |
See Notes to Financial Statements.
PGIM Absolute Return Bond Fund 35
Schedule of Investments (continued)
as of October 31, 2024
| | | | | | | | | | | | |
| | | | |
| Description | | Interest Rate | | Maturity Date | | Principal Amount (000)# | | | Value | |
| | |
RESIDENTIAL MORTGAGE-BACKED SECURITIES (Continued) | | | | | | | | |
FHLMC Structured Agency Credit Risk REMIC Trust, (cont’d.) | | | | | | | | | | | | |
Series 2021-HQA04, Class M2, 144A, 30 Day Average SOFR + 2.350% (Cap N/A, Floor 0.000%) | | 7.207%(c) | | 12/25/41 | | | 100 | | | $ | 100,938 | |
Series 2022-DNA01, Class M1B, 144A, 30 Day Average SOFR + 1.850% (Cap N/A, Floor 0.000%) | | 6.707(c) | | 01/25/42 | | | 500 | | | | 505,000 | |
Series 2022-DNA01, Class M2, 144A, 30 Day Average SOFR + 2.500% (Cap N/A, Floor 0.000%) | | 7.357(c) | | 01/25/42 | | | 70 | | | | 71,269 | |
Series 2022-DNA02, Class M1B, 144A, 30 Day Average SOFR + 2.400% (Cap N/A, Floor 0.000%) | | 7.257(c) | | 02/25/42 | | | 1,400 | | | | 1,431,612 | |
Series 2022-DNA03, Class M1B, 144A, 30 Day Average SOFR + 2.900% (Cap N/A, Floor 0.000%) | | 7.757(c) | | 04/25/42 | | | 2,020 | | | | 2,089,632 | |
Series 2022-DNA04, Class M1B, 144A, 30 Day Average SOFR + 3.350% (Cap N/A, Floor 0.000%) | | 8.207(c) | | 05/25/42 | | | 200 | | | | 208,250 | |
Series 2022-HQA03, Class M2, 144A, 30 Day Average SOFR + 5.350% (Cap N/A, Floor 0.000%) | | 10.207(c) | | 08/25/42 | | | 600 | | | | 652,190 | |
JPMorgan Mortgage Trust, | | | | | | | | | | | | |
Series 2007-A01, Class 4A1 | | 7.203(cc) | | 07/25/35 | | | 7 | | | | 7,058 | |
Legacy Mortgage Asset Trust, | | | | | | | | | | | | |
Series 2021-SL02, Class A, 144A | | 4.875 | | 10/25/68 | | | 130 | | | | 129,283 | |
LHOME Mortgage Trust, | | | | | | | | | | | | |
Series 2024-RTL05, Class A1, 144A | | 5.323 | | 09/25/39 | | | 6,500 | | | | 6,437,909 | |
Lugo Funding DAC (Spain), | | | | | | | | | | | | |
Series 2024-01A, Class C, 144A | | 3.062(cc) | | 05/26/66 | | EUR | 3,100 | | | | 3,246,569 | |
New Residential Mortgage Loan Trust, | | | | | | | | | | | | |
Series 2018-04A, Class A1S, 144A, 1 Month SOFR + 0.864% (Cap N/A, Floor 0.750%) | | 5.602(c) | | 01/25/48 | | | 885 | | | | 866,900 | |
Oaktown Re VII Ltd., | | | | | | | | | | | | |
Series 2021-02, Class M1B, 144A, 30 Day Average SOFR + 2.900% (Cap N/A, Floor 2.900%) | | 7.757(c) | | 04/25/34 | | | 1,000 | | | | 1,016,313 | |
PMT Credit Risk Transfer Trust, | | | | | | | | | | | | |
Series 2024-01R, Class A, 144A, 30 Day Average SOFR + 3.500% (Cap N/A, Floor 0.000%) | | 8.357(c) | | 05/25/33 | | | 31,874 | | | | 32,186,899 | |
Series 2024-02R, Class A, 144A, 30 Day Average SOFR + 3.350% (Cap N/A, Floor 0.000%) | | 8.206(c) | | 03/29/27 | | | 8,512 | | | | 8,571,375 | |
PRPM, | | | | | | | | | | | | |
Series 2024-03, Class A1, 144A | | 6.994 | | 05/25/29 | | | 2,713 | | | | 2,714,624 | |
See Notes to Financial Statements.
36
| | | | | | | | | | | | | | | | |
| | | | |
| Description | | Interest Rate | | | Maturity Date | | | Principal Amount (000)# | | | Value | |
| | | | |
RESIDENTIAL MORTGAGE-BACKED SECURITIES (Continued) | | | | | | | | | | | | | | | | |
PRPM LLC, | | | | | | | | | | | | | | | | |
Series 2024-04, Class A1, 144A | | | 6.414% | | | | 08/25/29 | | | | 9,253 | | | $ | 9,263,893 | |
Series 2024-05, Class A1, 144A | | | 5.689 | | | | 09/25/29 | | | | 4,966 | | | | 4,920,769 | |
Radnor Re Ltd., | | | | | | | | | | | | | | | | |
Series 2021-02, Class M1B, 144A, 30 Day Average SOFR + 3.700% (Cap N/A, Floor 3.700%) | | | 8.557(c) | | | | 11/25/31 | | | | 862 | | | | 882,276 | |
Series 2023-01, Class M1A, 144A, 30 Day Average SOFR + 2.700% (Cap N/A, Floor 2.700%) | | | 7.557(c) | | | | 07/25/33 | | | | 702 | | | | 709,556 | |
Structured Asset Securities Corp. Mortgage Pass-Through Certificates, | | | | | | | | | | | | | | | | |
Series 2003-37A, Class 3A7 | | | 6.929(cc) | | | | 12/25/33 | | | | 177 | | | | 170,505 | |
| | | | | | | | | | | | | | | | |
| | | | |
TOTAL RESIDENTIAL MORTGAGE-BACKED SECURITIES | | | | | | | | | | | | | | | | |
(cost $99,939,594) | | | | | | | | | | | | | | | 101,127,176 | |
| | | | | | | | | | | | | | | | |
| | | | |
SOVEREIGN BONDS 4.1% | | | | | | | | | | | | | | | | |
Bermuda Government International Bond (Bermuda), | | | | | | | | | | | | | | | | |
Sr. Unsec’d. Notes, 144A | | | 2.375 | | | | 08/20/30 | | | | 685 | | | | 588,458 | |
Brazil Minas SPE via State of Minas Gerais (Brazil), | | | | | | | | | | | | | | | | |
Gov’t. Gtd. Notes | | | 5.333 | | | | 02/15/28 | | | | 1,316 | | | | 1,314,766 | |
Colombia Government International Bond (Colombia), | | | | | | | | | | | | | | | | |
Sr. Unsec’d. Notes | | | 7.500 | | | | 02/02/34 | | | | 1,375 | | | | 1,361,250 | |
Dominican Republic International Bond (Dominican Republic), | | | | | | | | | | | | | | | | |
Sr. Unsec’d. Notes | | | 5.500 | | | | 02/22/29 | | | | 261 | | | | 255,780 | |
Sr. Unsec’d. Notes, 144A | | | 5.500 | | | | 02/22/29 | | | | 1,915 | | | | 1,876,700 | |
Sr. Unsec’d. Notes, 144A | | | 5.950 | | | | 01/25/27 | | | | 1,570 | | | | 1,570,785 | |
Sr. Unsec’d. Notes, 144A | | | 6.600 | | | | 06/01/36 | | | | 3,340 | | | | 3,391,770 | |
Sr. Unsec’d. Notes, 144A | | | 6.875 | | | | 01/29/26 | | | | 550 | | | | 556,050 | |
Egypt Government International Bond (Egypt), | | | | | | | | | | | | | | | | |
Sr. Unsec’d. Notes, EMTN | | | 5.625 | | | | 04/16/30 | | | EUR | 1,800 | | | | 1,659,363 | |
Indonesia Government International Bond (Indonesia), | | | | | | | | | | | | | | | | |
Sr. Unsec’d. Notes | | | 1.450 | | | | 09/18/26 | | | EUR | 805 | | | | 844,991 | |
Sr. Unsec’d. Notes | | | 3.375 | | | | 07/30/25 | | | EUR | 2,655 | | | | 2,883,644 | |
Ivory Coast Government International Bond (Ivory Coast), | | | | | | | | | | | | | | | | |
Sr. Unsec’d. Notes | | | 5.250 | | | | 03/22/30 | | | EUR | 1,239 | | | | 1,273,598 | |
Sr. Unsec’d. Notes | | | 5.875 | | | | 10/17/31 | | | EUR | 2,566 | | | | 2,623,697 | |
Sr. Unsec’d. Notes, 144A | | | 7.625 | | | | 01/30/33 | | | | 3,025 | | | | 2,999,318 | |
See Notes to Financial Statements.
PGIM Absolute Return Bond Fund 37
Schedule of Investments (continued)
as of October 31, 2024
| | | | | | | | | | | | | | | | |
| | | | |
| Description | | Interest Rate | | | Maturity Date | | | Principal Amount (000)# | | | Value | |
| | | | |
SOVEREIGN BONDS (Continued) | | | | | | | | | | | | | | | | |
Morocco Government International Bond (Morocco), | | | | | | | | | | | | | | | | |
Sr. Unsec’d. Notes | | | 2.375% | | | | 12/15/27 | | | | 30,000 | | | $ | 27,330,000 | |
Panama Government International Bond (Panama), | | | | | | | | | | | | | | | | |
Sr. Unsec’d. Notes | | | 3.750 | | | | 03/16/25 | | | | 4,860 | | | | 4,822,031 | |
Republic of South Africa Government International Bond (South Africa), | | | | | | | | | | | | | | | | |
Sr. Unsec’d. Notes | | | 3.750 | | | | 07/24/26 | | | EUR | 20,000 | | | | 21,564,644 | |
Romanian Government International Bond (Romania), | | | | | | | | | | | | | | | | |
Sr. Unsec’d. Notes, 144A | | | 6.375 | | | | 01/30/34 | | | | 2,132 | | | | 2,128,002 | |
Sr. Unsec’d. Notes, 144A, MTN | | | 5.000 | | | | 09/27/26 | | | EUR | 4,200 | | | | 4,696,469 | |
Sr. Unsec’d. Notes, EMTN | | | 6.625 | | | | 09/27/29 | | | EUR | 4,500 | | | | 5,323,177 | |
Serbia International Bond (Serbia), | | | | | | | | | | | | | | | | |
Sr. Unsec’d. Notes | | | 1.500 | | | | 06/26/29 | | | EUR | 1,778 | | | | 1,738,804 | |
Sr. Unsec’d. Notes | | | 1.650 | | | | 03/03/33 | | | EUR | 758 | | | | 658,066 | |
Sr. Unsec’d. Notes | | | 3.125 | | | | 05/15/27 | | | EUR | 2,930 | | | | 3,136,313 | |
Sr. Unsec’d. Notes, 144A | | | 1.500 | | | | 06/26/29 | | | EUR | 4,320 | | | | 4,224,767 | |
Sr. Unsec’d. Notes, 144A | | | 1.650 | | | | 03/03/33 | | | EUR | 139 | | | | 120,674 | |
Sr. Unsec’d. Notes, 144A | | | 3.125 | | | | 05/15/27 | | | EUR | 2,829 | | | | 3,028,201 | |
Sr. Unsec’d. Notes, 144A | | | 6.000 | | | | 06/12/34 | | | | 1,942 | | | | 1,942,000 | |
Sr. Unsec’d. Notes, 144A | | | 6.250 | | | | 05/26/28 | | | | 520 | | | | 535,437 | |
Sr. Unsec’d. Notes, 144A | | | 6.500 | | | | 09/26/33 | | | | 915 | | | | 955,031 | |
Sr. Unsec’d. Notes, EMTN | | | 1.000 | | | | 09/23/28 | | | EUR | 2,890 | | | | 2,807,233 | |
Turkiye Government International Bond (Turkey), | | | | | | | | | | | | | | | | |
Sr. Unsec’d. Notes, Series 10Y | | | 7.625 | | | | 05/15/34 | | | | 3,135 | | | | 3,231,989 | |
| | | | | | | | | | | | | | | | |
| | | | |
TOTAL SOVEREIGN BONDS | | | | | | | | | | | | | | | | |
(cost $110,045,406) | | | | | | | | | | | | | | | 111,443,008 | |
| | | | | | | | | | | | | | | | |
| | | | |
U.S. GOVERNMENT AGENCY OBLIGATIONS 8.4% | | | | | | | | | | | | | | | | |
Federal Home Loan Mortgage Corp. | | | 2.000 | | | | 11/01/50 | | | | 2,241 | | | | 1,791,972 | |
Federal Home Loan Mortgage Corp. | | | 2.500 | | | | 09/01/46 | | | | 1,357 | | | | 1,147,478 | |
Federal Home Loan Mortgage Corp. | | | 2.500 | | | | 01/01/51 | | | | 488 | | | | 407,916 | |
Federal Home Loan Mortgage Corp. | | | 2.500 | | | | 03/01/51 | | | | 2,737 | | | | 2,276,387 | |
Federal Home Loan Mortgage Corp. | | | 2.500 | | | | 04/01/51 | | | | 6,388 | | | | 5,324,182 | |
Federal Home Loan Mortgage Corp. | | | 2.500 | | | | 05/01/51 | | | | 2,047 | | | | 1,701,655 | |
Federal Home Loan Mortgage Corp. | | | 2.500 | | | | 07/01/51 | | | | 482 | | | | 401,478 | |
Federal Home Loan Mortgage Corp. | | | 2.500 | | | | 07/01/51 | | | | 979 | | | | 812,105 | |
Federal Home Loan Mortgage Corp. | | | 2.500 | | | | 11/01/51 | | | | 3,652 | | | | 3,062,225 | |
Federal Home Loan Mortgage Corp. | | | 2.500 | | | | 01/01/52 | | | | 966 | | | | 810,760 | |
Federal Home Loan Mortgage Corp. | | | 2.500 | | | | 02/01/52 | | | | 1,793 | | | | 1,494,191 | |
Federal Home Loan Mortgage Corp. | | | 3.000 | | | | 07/01/46 | | | | 3,874 | | | | 3,456,924 | |
Federal Home Loan Mortgage Corp. | | | 3.000 | | | | 10/01/51 | | | | 1,400 | | | | 1,212,265 | |
Federal Home Loan Mortgage Corp. | | | 3.000 | | | | 11/01/51 | | | | 1,947 | | | | 1,686,437 | |
Federal Home Loan Mortgage Corp. | | | 3.000 | | | | 01/01/52 | | | | 1,692 | | | | 1,479,118 | |
See Notes to Financial Statements.
38
| | | | | | | | | | | | |
| | | | |
| Description | | Interest Rate | | Maturity Date | | Principal Amount (000)# | | | Value | |
| | |
U.S. GOVERNMENT AGENCY OBLIGATIONS (Continued) | | | | | | | | |
Federal Home Loan Mortgage Corp. | | 3.000% | | 02/01/52 | | | 2,706 | | | $ | 2,335,416 | |
Federal Home Loan Mortgage Corp. | | 3.000 | | 03/01/52 | | | 544 | | | | 475,186 | |
Federal Home Loan Mortgage Corp. | | 3.500 | | 10/01/45 | | | 2,595 | | | | 2,382,329 | |
Federal Home Loan Mortgage Corp. | | 3.500 | | 09/01/46 | | | 6,700 | | | | 6,150,564 | |
Federal Home Loan Mortgage Corp. | | 3.500 | | 01/01/52 | | | 8,143 | | | | 7,309,392 | |
Federal Home Loan Mortgage Corp. | | 3.500 | | 02/01/52 | | | 591 | | | | 530,612 | |
Federal Home Loan Mortgage Corp. | | 4.500 | | 09/01/42 | | | 10,975 | | | | 10,734,191 | |
Federal Home Loan Mortgage Corp. | | 4.500 | | 06/01/52 | | | 832 | | | | 790,014 | |
Federal Home Loan Mortgage Corp. | | 5.000 | | 07/01/52 | | | 4,557 | | | | 4,437,855 | |
Federal Home Loan Mortgage Corp. | | 5.500 | | 11/01/52 | | | 1,539 | | | | 1,524,560 | |
Federal Home Loan Mortgage Corp. | | 5.500 | | 10/01/54 | | | 3,976 | | | | 3,938,797 | |
Federal Home Loan Mortgage Corp. | | 6.000 | | 01/01/53 | | | 1,883 | | | | 1,896,546 | |
Federal Home Loan Mortgage Corp. | | 6.000 | | 03/01/53 | | | 1,881 | | | | 1,893,538 | |
Federal Home Loan Mortgage Corp. | | 6.000 | | 03/01/53 | | | 1,899 | | | | 1,929,614 | |
Federal Home Loan Mortgage Corp. | | 6.000 | | 04/01/53 | | | 1,436 | | | | 1,444,956 | |
Federal Home Loan Mortgage Corp. | | 6.000 | | 09/01/54 | | | 4,652 | | | | 4,682,215 | |
Federal National Mortgage Assoc. | | 2.000 | | 11/01/50 | | | 5,375 | | | | 4,299,999 | |
Federal National Mortgage Assoc. | | 2.000 | | 12/01/50 | | | 6,033 | | | | 4,825,059 | |
Federal National Mortgage Assoc. | | 2.000 | | 04/01/51 | | | 16,355 | | | | 13,050,779 | |
Federal National Mortgage Assoc. | | 2.500 | | 02/01/51 | | | 1,976 | | | | 1,651,512 | |
Federal National Mortgage Assoc. | | 2.500 | | 03/01/51 | | | 1,629 | | | | 1,354,314 | |
Federal National Mortgage Assoc. | | 3.000 | | 08/01/43 | | | 372 | | | | 331,063 | |
Federal National Mortgage Assoc. | | 3.000 | | 04/01/48 | | | 5,333 | | | | 4,749,651 | |
Federal National Mortgage Assoc. | | 3.000 | | 07/01/51 | | | 502 | | | | 436,446 | |
Federal National Mortgage Assoc. | | 3.000 | | 02/01/52 | | | 482 | | | | 416,122 | |
Federal National Mortgage Assoc. | | 3.500 | | TBA | | | 5,500 | | | | 4,916,922 | |
Federal National Mortgage Assoc. | | 3.500 | | 01/01/50 | | | 692 | | | | 634,641 | |
Federal National Mortgage Assoc. | | 3.500 | | 05/01/52 | | | 5,601 | | | | 5,011,725 | |
Federal National Mortgage Assoc. | | 3.500 | | 06/01/52 | | | 2,515 | | | | 2,260,360 | |
Federal National Mortgage Assoc. | | 4.000 | | TBA | | | 7,500 | | | | 6,929,029 | |
Federal National Mortgage Assoc. | | 4.000 | | 03/01/48 | | | 10,016 | | | | 9,492,690 | |
Federal National Mortgage Assoc. | | 4.000 | | 06/01/52 | | | 1,635 | | | | 1,512,475 | |
Federal National Mortgage Assoc. | | 4.500 | | TBA | | | 7,000 | | | | 6,645,136 | |
Federal National Mortgage Assoc. | | 4.500 | | 06/01/52 | | | 2,849 | | | | 2,705,967 | |
Federal National Mortgage Assoc. | | 5.000 | | TBA | | | 4,500 | | | | 4,372,338 | |
Federal National Mortgage Assoc. | | 5.000 | | 07/01/52 | | | 2,180 | | | | 2,120,809 | |
Federal National Mortgage Assoc. | | 5.500 | | 10/01/52 | | | 821 | | | | 814,977 | |
Federal National Mortgage Assoc.(k) | | 5.500 | | 11/01/52 | | | 24,032 | | | | 23,927,170 | |
Federal National Mortgage Assoc. | | 5.500 | | 12/01/52 | | | 5,380 | | | | 5,341,903 | |
Federal National Mortgage Assoc. | | 6.000 | | 11/01/52 | | | 978 | | | | 986,277 | |
Federal National Mortgage Assoc. | | 6.000 | | 12/01/52 | | | 1,294 | | | | 1,303,890 | |
Federal National Mortgage Assoc. | | 6.000 | | 04/01/53 | | | 1,402 | | | | 1,411,494 | |
Federal National Mortgage Assoc. | | 6.000 | | 08/01/54 | | | 2,648 | | | | 2,665,370 | |
Federal National Mortgage Assoc. | | 6.000 | | 09/01/54 | | | 3,572 | | | | 3,595,264 | |
Government National Mortgage Assoc. | | 2.000 | | 10/20/50 | | | 9,458 | | | | 7,725,269 | |
See Notes to Financial Statements.
PGIM Absolute Return Bond Fund 39
Schedule of Investments (continued)
as of October 31, 2024
| | | | | | | | | | | | |
| | | | |
| Description | | Interest
Rate | | Maturity
Date | | Principal
Amount (000)# | | | Value | |
| | | | |
U.S. GOVERNMENT AGENCY OBLIGATIONS (Continued) | | | | | | | | | | | | |
Government National Mortgage Assoc. | | 2.500% | | 09/20/51 | | | 3,028 | | | $ | 2,567,051 | |
Government National Mortgage Assoc. | | 3.500 | | 12/20/51 | | | 4,853 | | | | 4,395,524 | |
Government National Mortgage Assoc. | | 4.000 | | TBA | | | 6,500 | | | | 6,051,602 | |
Government National Mortgage Assoc. | | 4.000 | | 01/20/50 | | | 1,941 | | | | 1,823,967 | |
Government National Mortgage Assoc. | | 4.500 | | 08/20/52 | | | 5,245 | | | | 5,015,749 | |
Government National Mortgage Assoc. | | 6.500 | | TBA | | | 3,500 | | | | 3,555,749 | |
| | | | | | | | | | | | |
| | | | |
TOTAL U.S. GOVERNMENT AGENCY OBLIGATIONS
(cost $228,889,817) | | | | | | | | | | | 228,419,171 | |
| | | | | | | | | | | | |
| | | | |
U.S. TREASURY OBLIGATIONS 23.8% | | | | | | | | | | | | |
U.S. Treasury Bonds(k) | | 2.250 | | 05/15/41 | | | 21,500 | | | | 15,795,781 | |
U.S. Treasury Bonds | | 2.375 | | 11/15/49 | | | 41,450 | | | | 27,752,070 | |
U.S. Treasury Bonds | | 3.000 | | 02/15/49 | | | 4,085 | | | | 3,116,089 | |
U.S. Treasury Bonds(h) | | 3.375 | | 11/15/48 | | | 108,955 | | | | 89,138,809 | |
U.S. Treasury Bonds | | 3.625 | | 02/15/53 | | | 1,000 | | | | 858,125 | |
U.S. Treasury Bonds | | 4.625 | | 05/15/54 | | | 535 | | | | 547,456 | |
U.S. Treasury Notes | | 0.625 | | 07/31/26 | | | 117,305 | | | | 110,312,523 | |
U.S. Treasury Notes | | 0.750 | | 04/30/26 | | | 15,105 | | | | 14,348,570 | |
U.S. Treasury Notes | | 0.750 | | 05/31/26 | | | 121,975 | | | | 115,561,784 | |
U.S. Treasury Notes | | 3.875 | | 09/30/29 | | | 4,110 | | | | 4,056,698 | |
U.S. Treasury Notes | | 3.875 | | 12/31/29 | | | 11,595 | | | | 11,435,569 | |
U.S. Treasury Notes(h) | | 4.000 | | 12/15/25 | | | 190,845 | | | | 190,211,335 | |
U.S. Treasury Notes | | 4.250 | | 12/31/25 | | | 25,000 | | | | 24,984,375 | |
U.S. Treasury Notes | | 4.625 | | 09/30/30 | | | 23,860 | | | | 24,391,258 | |
U.S. Treasury Strips Coupon | | 3.019(s) | | 11/15/35 | | | 870 | | | | 531,618 | |
U.S. Treasury Strips Coupon(k) | | 3.512(s) | | 11/15/41 | | | 24,100 | | | | 10,704,731 | |
U.S. Treasury Strips Coupon | | 3.575(s) | | 08/15/41 | | | 165 | | | | 74,308 | |
U.S. Treasury Strips Coupon | | 4.663(s) | | 02/15/50 | | | 340 | | | | 103,886 | |
U.S. Treasury Strips Coupon | | 4.770(s) | | 11/15/49 | | | 580 | | | | 178,735 | |
| | | | | | | | | | | | |
| | | | |
TOTAL U.S. TREASURY OBLIGATIONS
(cost $649,717,860) | | | | | | | | | | | 644,103,720 | |
| | | | | | | | | | | | |
| | | | |
| | | | | | | Shares | | | | |
| | | | |
AFFILIATED EXCHANGE-TRADED FUNDS 5.3% | | | | | | | | | | | | |
PGIM AAA CLO ETF | | | | | | | 507,750 | | | | 26,037,420 | |
PGIM Ultra Short Bond ETF | | | | | | | 2,350,000 | | | | 116,912,500 | |
| | | | | | | | | | | | |
| | | | |
TOTAL AFFILIATED EXCHANGE-TRADED FUNDS
(cost $142,659,892)(wa) | | | | | | | | | | | 142,949,920 | |
| | | | | | | | | | | | |
See Notes to Financial Statements.
40
| | | | | | | | |
| | |
| Description | | Shares | | | Value | |
| | |
COMMON STOCKS 0.2% | | | | | | | | |
| | |
Chemicals 0.1% | | | | | | | | |
| | |
TPC Group, Inc. (original cost $609,113; purchased 12/15/22)*^(f) | | | 56,219 | | | $ | 2,136,322 | |
| | |
Entertainment 0.1% | | | | | | | | |
| | |
Codere Group Topco SA (Spain) (Class A1 Stock)*^ | | | 31,469 | | | | 855,760 | |
Codere Group Topco SA (Spain) (Class A2 Stock)*^ | | | 14,649 | | | | 398,361 | |
| | | | | | | | |
| | |
| | | | | | | 1,254,121 | |
| | |
Gas Utilities 0.0% | | | | | | | | |
| | |
Ferrellgas Partners LP (Class B Stock)^ | | | 6,534 | | | | 1,161,492 | |
| | |
Oil, Gas & Consumable Fuels 0.0% | | | | | | | | |
| | |
Expand Energy Corp. | | | 12,570 | | | | 1,064,930 | |
| | |
Wireless Telecommunication Services 0.0% | | | | | | | | |
| | |
Digicel International Finance Ltd. (Jamaica)
(original cost $178,523; purchased 01/29/24 - 01/30/24)*^(f) | | | 147,816 | | | | 371,018 | |
Intelsat Emergence SA (Luxembourg)* | | | 19,703 | | | | 596,834 | |
| | | | | | | | |
| | |
| | | | | | | 967,852 | |
| | | | | | | | |
| | |
TOTAL COMMON STOCKS
(cost $2,597,444) | | | | | | | 6,584,717 | |
| | | | | | | | |
| | |
PREFERRED STOCKS 0.0% | | | | | | | | |
| | |
Electronic Equipment, Instruments & Components 0.0% | | | | | | | | |
| | |
Ferrellgas Escrow LLC, 8.956%, Maturing 03/30/31^ | | | 545 | | | | 545,000 | |
| | |
Wireless Telecommunication Services 0.0% | | | | | | | | |
| | |
Digicel International Finance Ltd. (Jamaica) (original cost
$94,170; purchased 01/26/24 - 01/29/24)*^(f) | | | 15,636 | | | | 170,509 | |
| | | | | | | | |
| | |
TOTAL PREFERRED STOCKS
(cost $644,620) | | | | | | | 715,509 | |
| | | | | | | | |
See Notes to Financial Statements.
PGIM Absolute Return Bond Fund 41
Schedule of Investments (continued)
as of October 31, 2024
| | | | | | | | |
| | |
| Description | | Units | | | Value | |
| | |
WARRANTS* 0.0% | | | | | | | | |
| | |
Entertainment | | | | | | | | |
Codere Group Topco SA (Spain), expiring 09/30/34^
(cost $1,320) | | | 34 | | | $ | 370 | |
| | | | | | | | |
| | |
TOTAL LONG-TERM INVESTMENTS
(cost $2,672,033,318) | | | | | | | 2,667,495,390 | |
| | | | | | | | |
| | |
| | | Shares | | | | |
| | |
SHORT-TERM INVESTMENTS 3.2% | | | | | | | | |
| | |
AFFILIATED MUTUAL FUNDS 3.2% | | | | | | | | |
PGIM Core Government Money Market Fund (7-day effective yield 5.011%)(wa) | | | 77,461,364 | | | | 77,461,364 | |
PGIM Institutional Money Market Fund (7-day effective yield 5.096%)
(cost $10,364,860; includes $10,324,002 of cash collateral for securities on loan)(b)(wa) | | | 10,370,296 | | | | 10,365,111 | |
| | | | | | | | |
| | |
TOTAL AFFILIATED MUTUAL FUNDS
(cost $87,826,224) | | | | | | | 87,826,475 | |
| | | | | | | | |
| | |
OPTIONS PURCHASED*~ 0.0%
(cost $55,072) | | | | | | | 104,724 | |
| | | | | | | | |
| | |
TOTAL SHORT-TERM INVESTMENTS
(cost $87,881,296) | | | | | | | 87,931,199 | |
| | | | | | | | |
| | |
TOTAL INVESTMENTS, BEFORE OPTIONS WRITTEN 101.7%
(cost $2,759,914,614) | | | | | | | 2,755,426,589 | |
| | | | | | | | |
| | |
OPTIONS WRITTEN*~ (0.0)%
(premiums received $487,537) | | | | | | | (214,901 | ) |
| | | | | | | | |
| | |
TOTAL INVESTMENTS, NET OF OPTIONS WRITTEN 101.7%
(cost $2,759,427,077) | | | | | | | 2,755,211,688 | |
Liabilities in excess of other assets(z) (1.7)% | | | | | | | (47,251,976 | ) |
| | | | | | | | |
| | |
NET ASSETS 100.0% | | | | | | $ | 2,707,959,712 | |
| | | | | | | | |
Below is a list of the abbreviation(s) used in the annual report:
BRL—Brazilian Real
CLP—Chilean Peso
CNH—Chinese Renminbi
COP—Colombian Peso
CZK—Czech Koruna
EUR—Euro
GBP—British Pound
HUF—Hungarian Forint
IDR—Indonesian Rupiah
See Notes to Financial Statements.
42
INR—Indian Rupee
KRW—South Korean Won
MXN—Mexican Peso
PEN—Peruvian Nuevo Sol
PHP—Philippine Peso
PLN—Polish Zloty
SGD—Singapore Dollar
THB—Thai Baht
TRY—Turkish Lira
TWD—New Taiwanese Dollar
USD—US Dollar
ZAR—South African Rand
144A—Security was purchased pursuant to Rule 144A under the Securities Act of 1933 and, pursuant to the requirements of Rule 144A, may not be resold except to qualified institutional buyers.
A—Annual payment frequency for swaps
BABs—Build America Bonds
BARC—Barclays Bank PLC
BNP—BNP Paribas S.A.
BNYM—Bank of New York Mellon
BOA—Bank of America, N.A.
CDX—Credit Derivative Index
CGM—Citigroup Global Markets, Inc.
CITI—Citibank, N.A.
CLO—Collateralized Loan Obligation
CMS—Constant Maturity Swap
DAC—Designated Activity Company
DB—Deutsche Bank AG
EMTN—Euro Medium Term Note
ETF—Exchange-Traded Fund
EURIBOR—Euro Interbank Offered Rate
GMTN—Global Medium Term Note
GSI—Goldman Sachs International
HSBC—HSBC Bank PLC
iBoxx—Bond Market Indices
IO—Interest Only (Principal amount represents notional)
JPM—JPMorgan Chase Bank N.A.
LP—Limited Partnership
M—Monthly payment frequency for swaps
MASTR—Morgan Stanley Structured Asset Security
MSI—Morgan Stanley & Co International PLC
MTN—Medium Term Note
N/A—Not Applicable
OTC—Over-the-counter
PIK—Payment-in-Kind
PO—Principal Only
Q—Quarterly payment frequency for swaps
REITs—Real Estate Investment Trust
REMIC—Real Estate Mortgage Investment Conduit
SCB—Standard Chartered Bank
SOFR—Secured Overnight Financing Rate
SONIA—Sterling Overnight Index Average
SSB—State Street Bank & Trust Company
See Notes to Financial Statements.
PGIM Absolute Return Bond Fund 43
Schedule of Investments (continued)
as of October 31, 2024
T—Swap payment upon termination
TBA—To Be Announced
TD—The Toronto-Dominion Bank
UAG—UBS AG
UBS—UBS Securities LLC
USOIS—United States Overnight Index Swap
| * | Non-income producing security. |
| # | Principal or notional amount is shown in U.S. dollars unless otherwise stated. |
| ~ | See tables subsequent to the Schedule of Investments for options detail. Excludes centrally cleared swaptions. Options with maturity dates greater than one year from date of acquisition would be considered long-term investments. |
| ^ | Indicates a Level 3 instrument. The aggregate value of Level 3 instruments is $18,463,821 and 0.7% of net assets. |
| (a) | All or a portion of security is on loan. The aggregate market value of such securities, including those sold and pending settlement, is $10,119,362; cash collateral of $10,324,002 (included in liabilities) was received with which the Fund purchased highly liquid short-term investments. In the event of significant appreciation in value of securities on loan on the last business day of the reporting period, the Fund may reflect a collateral value that is less than the market value of the loaned securities and such shortfall is remedied the following business day. |
| (b) | Represents security, or portion thereof, purchased with cash collateral received for securities on loan and includes dividend reinvestment. |
| (c) | Variable rate instrument. The interest rate shown reflects the rate in effect at October 31, 2024. |
| (cc) | Variable rate instrument. The rate shown is based on the latest available information as of October 31, 2024. Certain variable rate securities are not based on a published reference rate and spread but are determined by the issuer or agent and are based on current market conditions. These securities do not indicate a reference rate and spread in their description. |
| (d) | Represents issuer in default on interest payments and/or principal repayment. Non-income producing security. Such securities may be post-maturity. |
| (f) | Indicates a restricted security that is acquired in unregistered, private sales from the issuing company or from an affiliate of the issuer and is considered restricted as to disposition under federal securities law; the aggregate original cost of such securities is $6,643,657. The aggregate value of $6,013,256 is 0.2% of net assets. |
| (ff) | Variable rate security. Security may be issued at a fixed coupon rate, which converts to a variable rate at a specified date. Rate shown is the rate in effect as of period end. |
| (h) | Represents security, or a portion thereof, segregated as collateral for OTC derivatives. |
| (k) | Represents security, or a portion thereof, segregated as collateral for centrally cleared/exchange-traded derivatives. |
| (oo) | Perpetual security. Maturity date represents next call date. |
| (p) | Represents a security with a delayed settlement and therefore the interest rate is not available until settlement which is after the period end. |
| (r) | Principal or notional amount is less than $500 par. |
| (s) | Represents zero coupon bond or principal only security. Rate represents yield to maturity at purchase date. |
| (wa) | Represents investments in Funds affiliated with the Manager. |
| (z) | Includes net unrealized appreciation/(depreciation) and/or market value of the below holdings which are excluded from the Schedule of Investments: |
Unfunded corporate bond commitment outstanding at October 31, 2024:
| | | | | | | | | | | | | | | | | | | | |
| | | Principal | | | | | | |
| | | Amount | | Current | | Unrealized | | Unrealized |
Issuer | | (000)# | | Value | | Appreciation | | Depreciation |
| | | | |
New Generation Gas Gathering LLC, Sr. Sec’d. Notes, 144A, —%(p), Maturity Date 09/30/29 (cost $934,418)^ | | | | 949 | | | | $ | 934,418 | | | | $ | — | | | | $ | — | |
| | | | | | | | | | | | | | | | | | | | |
See Notes to Financial Statements.
44
Unfunded loan commitment outstanding at October 31, 2024:
| | | | | | | | | | | | | | | | | | | | |
Borrower | | Principal
Amount
(000)# | | Current
Value | | Unrealized
Appreciation | | Unrealized
Depreciation |
| | | | |
Doncasters US Finance LLC, Delayed Draw Term Loan, 1.500%,
Maturity Date 04/23/30 (cost $352,757)^ | | | | 357 | | | | $ | 352,935 | | | | $ | 178 | | | | $ | — | |
| | | | | | | | | | | | | | | | | | | | |
Forward Commitment Contracts:
| | | | | | | | | | | | | | | | | | | | |
U.S. Government Agency Obligations | | Interest
Rate | | | Maturity
Date | | | Settlement
Date | | | Principal
Amount
(000)# | | | Value | |
| | | | | |
Federal National Mortgage Assoc. | | | 5.500% | | | | TBA | | | | 12/12/24 | | | $ | (33,000 | ) | | $ | (32,670,999 | ) |
Federal National Mortgage Assoc. | | | 6.000% | | | | TBA | | | | 11/14/24 | | | | (10,000 | ) | | | (10,063,748 | ) |
Federal National Mortgage Assoc. | | | 6.000% | | | | TBA | | | | 12/12/24 | | | | (10,500 | ) | | | (10,562,013 | ) |
| | | | | | | | | | | | | | | | | | | | |
| | | | | |
TOTAL FORWARD COMMITMENT CONTRACTS
(proceeds receivable $53,785,478) | | | | | | | | | | | | | | | | | | $ | (53,296,760 | ) |
| | | | | | | | | | | | | | | | | | | | |
Option Purchased:
OTC Traded
| | | | | | | | | | | | | | | | | | | | | | | | | | | | | | | | |
Description | | Call/
Put | | Counterparty | | Expiration
Date | | Strike | | Contracts | | Notional
Amount
(000)# | | Value |
| | | | | | | |
2-Year 10 CMS Curve CAP | | Call | | | | JPM | | | | | 01/02/25 | | | | | 0.19% | | | | | — | | | | | 37,180 | | | | $ | 12,947 | |
2-Year 10 CMS Curve CAP | | Call | | | | JPM | | | | | 01/21/25 | | | | | 0.13% | | | | | — | | | | | 24,790 | | | | | 15,791 | |
Currency Option USD vs TRY | | Call | | | | DB | | | | | 11/22/24 | | | | | 48.00 | | | | | — | | | | | 3,246 | | | | | 574 | |
Currency Option USD vs MXN | | Put | | | | CITI | | | | | 11/26/24 | | | | | 17.00 | | | | | — | | | | | 1,628 | | | | | 147 | |
Currency Option USD vs MXN | | Put | | | | DB | | | | | 11/26/24 | | | | | 17.00 | | | | | — | | | | | 1,638 | | | | | 148 | |
| | | | | | | | | | | | | | | | | | | | | | | | | | | | | | | | |
| | | | | | | |
Total OTC Traded (cost $55,072) | | | | | | | | | | | | | | | | | | | | | | | | | | | | | | $ | 29,607 | |
| | | | | | | | | | | | | | | | | | | | | | | | | | | | | | | | |
OTC Swaptions
| | | | | | | | | | | | | | | | | | | | | | | | | | | | | | | | | | |
Description | | Call/ Put | | Counterparty | | Expiration
Date | | Strike | | Receive | | Pay | | Notional
Amount
(000)# | | Value |
| | | | | | | | |
2-Year Interest Rate Swap, 01/08/27 | | Call | | CITI | | | | 01/06/25 | | | | | 2.83% | | | | | 2.83%(A) | | | |
| 1 Day SOFR(A)/
4.90% |
| | | | 26,570 | | | | $ | 10,136 | |
2-Year Interest Rate Swap, 11/13/26 | | Call | | JPM | | | | 11/08/24 | | | | | 3.44% | | | | | 3.44%(A) | | | |
| 1 Day SOFR(A)/
4.90% |
| | | | 26,570 | | | | | 605 | |
2-Year Interest Rate Swap, 11/13/26 | | Put | | JPM | | | | 11/08/24 | | | | | 3.84% | | | |
| 1 Day SOFR(A)/
4.90% |
| | | | 3.84%(A) | | | | | 26,570 | | | | | 64,376 | |
| | | | | | | | | | | | | | | | | | | | | | | | | | | | | | | | | | |
| | | | | | | | |
Total OTC Swaptions (cost $0) | | | | | | | | | | | | | | | | | | | | | | | | | | | | | | | | $ | 75,117 | |
| | | | | | | | | | | | | | | | | | | | | | | | | | | | | | | | | | |
| | | | | | | | |
Total Options Purchased (cost $55,072) | | | | | | | | | | | | | | | | | | | | | | | | | | | | | | | | $ | 104,724 | |
| | | | | | | | | | | | | | | | | | | | | | | | | | | | | | | | | | |
See Notes to Financial Statements.
PGIM Absolute Return Bond Fund 45
Schedule of Investments (continued)
as of October 31, 2024
Options Written:
OTC Traded
| | | | | | | | | | | | | | | | | | | | | | | | | | | | | | | | | | | |
Description | | Call/
Put | | Counterparty | | Expiration
Date | | Strike | | Contracts | | Notional
Amount
(000)# | | Value |
| | | | | | | |
2-Year 10 CMS Curve CAP | | | | Call | | | | | JPM | | | | | 01/02/25 | | | | | 0.49% | | | | | — | | | | | 37,180 | | | | $ | (2,333 | ) |
2-Year 10 CMS Curve CAP | | | | Call | | | | | JPM | | | | | 01/21/25 | | | | | 0.43% | | | | | — | | | | | 24,790 | | | | | (3,930 | ) |
Currency Option USD vs TRY | | | | Call | | | | | DB | | | | | 11/22/24 | | | | | 35.45 | | | | | — | | | | | 3,246 | | | | | (32,461 | ) |
Currency Option USD vs MXN | | | | Put | | | | | CITI | | | | | 11/26/24 | | | | | 19.50 | | | | | — | | | | | 1,628 | | | | | (22,952 | ) |
Currency Option USD vs MXN | | | | Put | | | | | DB | | | | | 11/26/24 | | | | | 20.00 | | | | | — | | | | | 1,638 | | | | | (40,472 | ) |
| | | | | | | | | | | | | | | | | | | | | | | | | | | | | | | | | | | |
| | | | | |
Total OTC Traded (premiums received $122,672) | | | | | | | | | | | | | | | | | | | | | | | | $ | (102,148 | ) |
| | | | | | | | | | | | | | | | | | | | | | | | | | | | | | | | | | | |
OTC Swaptions
| | | | | | | | | | | | | | | | | | | | | | | | | | |
Description | | Call/
Put | | Counterparty | | Expiration
Date | | Strike | | | Receive | | | Pay | | | Notional
Amount
(000)# | | | Value | |
| | | | | | | | |
2-Year Interest Rate Swap, 01/08/27 | | Call | | CITI | | 01/06/25 | | | 2.52% | | |
| 1 Day SOFR(A)/
4.90% |
| | | 2.52%(A) | | | | 53,140 | | | $ | (9,267 | ) |
2-Year Interest Rate Swap, 11/13/26 | | Call | | JPM | | 11/08/24 | | | 3.24% | | |
| 1 Day SOFR(A)/
4.90% |
| | | 3.24%(A) | | | | 53,140 | | | | (110 | ) |
2-Year Interest Rate Swap, 11/13/26 | | Put | | JPM | | 11/08/24 | | | 3.99% | | | | 3.99%(A) | | |
| 1 Day SOFR(A)/
4.90% |
| | | 53,140 | | | | (49,980 | ) |
CDX.NA.IG.43.V1, 06/20/29 | | Put | | BNP | | 11/20/24 | | | 0.70% | | | | 1.00%(Q) | | |
| CDX.NA.IG.43.
V1(Q) |
| | | 243,420 | | | | (32,637 | ) |
CDX.NA.IG.43.V1, 06/20/29 | | Put | | GSI | | 11/20/24 | | | 0.80% | | | | 1.00%(Q) | | |
| CDX.NA.IG.43.
V1(Q) |
| | | 249,000 | | | | (20,759 | ) |
| | | | | | | | | | | | | | | | | | | | | | | | | | |
| | | | | |
Total OTC Swaptions (premiums received $364,865) | | | | | | | | | | | | | | | | | | $ | (112,753 | ) |
| | | | | | | | | | | | | | | | | | | | | | | | | | |
| | | | | |
Total Options Written (premiums received $487,537) | | | | | | | | | | | | | | | | | | $ | (214,901 | ) |
| | | | | | | | | | | | | | | | | | | | | | | | | | |
Option Purchased
Centrally Cleared Swaptions
| | | | | | | | | | | | | | | | | | | | | | | | | | | | | | | | | | | | | |
Description | | Call/
Put | | Expiration
Date | | Strike | | Receive | | Pay | | Notional
Amount
(000)# | | Value at
October 31,
2024 | | Unrealized
Appreciation
(Depreciation) |
| | | | | | | | |
CDX.NA.HY.43.V1, 12/20/29 | | Put | | | | 01/15/25 | | | | | $106.00 | | | | | CDX.NA.HY.43. V1(Q) | | | | | 5.00%(Q) | | | | | 18,820 | | | | $ | 176,721 | | | | $ | 1,695 | |
| | | | | | | | | | | | | | | | | | | | | | | | | | | | | | | | | | | | | |
(cost $175,026) | | | | | | | | | | | | | | | | | | | | | | | | | | | | | | | | | | | | | |
See Notes to Financial Statements.
46
Options Written:
Centrally Cleared Swaptions
| | | | | | | | | | | | | | | | | | | | | | | | | | | | | | | | | | | | | | | | |
Description | | Call/
Put | | Expiration
Date | | Strike | | Receive | | Pay | | Notional
Amount
(000)# | | Value at
October 31,
2024 | | Unrealized
Appreciation
(Depreciation) |
| | | | | | | | |
CDX.NA.IG.43.V1, 12/20/29 | | | | Call | | | | | 01/15/25 | | | | | 0.50 | % | | |
| CDX.NA.IG.43.
V1(Q) |
| | | | 1.00%(Q) | | | | | 94,100 | | | | $ | (55,267 | ) | | | $ | 42,362 | |
CDX.NA.IG.43.V1, 12/20/29 | | | | Put | | | | | 01/15/25 | | | | | 0.75 | % | | | | 1.00%(Q) | | | |
| CDX.NA.IG.43.
V1(Q) |
| | | | 94,100 | | | | | (63,820 | ) | | | | 7,931 | |
| | | | | | | | | | | | | | | | | | | | | | | | | | | | | | | | | | | | | | | | |
| | | | |
Total Centrally Cleared Swaptions (premiums received $169,380) | | | | | | | | | | | | | | $ | (119,087 | ) | | | $ | 50,293 | |
| | | | | | | | | | | | | | | | | | | | | | | | | | | | | | | | | | | | | | | | |
Futures contracts outstanding at October 31, 2024:
| | | | | | | | | | | | | | | | | |
Number
of
Contracts | | Type | | Expiration
Date | | Current
Notional
Amount | | Value /
Unrealized
Appreciation
(Depreciation) |
| | | |
| Long Position: | | | | | | | | | | | | | | | |
511 | | 3 Month CME SOFR | | | | Dec. 2024 | | | | $ | 121,649,937 | | | | $ | 158,752 | |
| | | | | | | | | | | | | | | | | |
| | | |
| Short Positions: | | | | | | | | | | | | | | | |
93 | | 3 Month CME SOFR | | | | Mar. 2025 | | | | | 22,231,650 | | | | | 37,030 | |
93 | | 3 Month CME SOFR | | | | Jun. 2025 | | | | | 22,304,888 | | | | | 71,905 | |
1,736 | | 2 Year U.S. Treasury Notes | | | | Dec. 2024 | | | | | 357,521,062 | | | | | 1,860,918 | |
276 | | 5 Year Euro-Bobl | | | | Dec. 2024 | | | | | 35,470,875 | | | | | 289,439 | |
4,596 | | 5 Year U.S. Treasury Notes | | | | Dec. 2024 | | | | | 492,849,210 | | | | | 11,358,982 | |
46 | | 10 Year Euro-Bund | | | | Dec. 2024 | | | | | 6,594,811 | | | | | 89,774 | |
1,007 | | 10 Year U.S. Treasury Notes | | | | Dec. 2024 | | | | | 111,242,031 | | | | | 3,051,539 | |
517 | | 10 Year U.S. Ultra Treasury Notes | | | | Dec. 2024 | | | | | 58,808,750 | | | | | 1,350,774 | |
1,054 | | 20 Year U.S. Treasury Bonds | | | | Dec. 2024 | | | | | 124,339,062 | | | | | 6,710,379 | |
331 | | 30 Year U.S. Ultra Treasury Bonds | | | | Dec. 2024 | | | | | 41,581,875 | | | | | 786,610 | |
325 | | Euro Schatz Index | | | | Dec. 2024 | | | | | 37,663,888 | | | | | 36,847 | |
| | | | | | | | | | | | | | | | | |
| | | | | | | | | | | | | | | | 25,644,197 | |
| | | | | | | | | | | | | | | | | |
| | | | | | | | | | | | | | | $ | 25,802,949 | |
| | | | | | | | | | | | | | | | | |
Forward foreign currency exchange contracts outstanding at October 31, 2024:
| | | | | | | | | | | | | | | | | | | | | | | | | | | | |
Purchase Contracts | | Counterparty | | | Notional
Amount
(000) | | | Value at
Settlement
Date | | | Current
Value | | | Unrealized
Appreciation | | Unrealized
Depreciation |
| | | | | |
OTC Forward Foreign Currency Exchange Contracts: | | | | | | | | | | | | | | | | | | | | | |
Brazilian Real, | | | | | | | | | | | | | | | | | | | | | | | | | | | | |
Expiring 11/04/24 | | | BNP | | | | BRL | | | | 20,337 | | | $ | 3,550,000 | | | $ | 3,515,500 | | | $ | — | | | $ | (34,500 | ) |
Expiring 11/04/24 | | | GSI | | | | BRL | | | | 63,041 | | | | 11,333,756 | | | | 10,897,179 | | | | — | | | | (436,577 | ) |
Expiring 12/03/24 | | | BNYM | | | | BRL | | | | 83,647 | | | | 14,628,493 | | | | 14,412,406 | | | | — | | | | (216,087 | ) |
Chilean Peso, | | | | | | | | | | | | | | | | | | | | | | | | | | | | |
Expiring 12/18/24 | | | BARC | | | | CLP | | | | 1,463,802 | | | | 1,586,000 | | | | 1,522,067 | | | | — | | | | (63,933 | ) |
Expiring 12/18/24 | | | CITI | | | | CLP | | | | 3,163,979 | | | | 3,443,000 | | | | 3,289,917 | | | | — | | | | (153,083 | ) |
Expiring 12/18/24 | | | CITI | | | | CLP | | | | 1,203,626 | | | | 1,309,000 | | | | 1,251,534 | | | | — | | | | (57,466 | ) |
See Notes to Financial Statements.
PGIM Absolute Return Bond Fund 47
Schedule of Investments (continued)
as of October 31, 2024
Forward foreign currency exchange contracts outstanding at October 31, 2024 (continued):
| | | | | | | | | | | | | | | | | | | | | | | | | | | | |
Purchase Contracts | | Counterparty | | | Notional
Amount
(000) | | | Value at
Settlement
Date | | | Current
Value | | | Unrealized
Appreciation | | Unrealized
Depreciation |
| | | | |
OTC Forward Foreign Currency Exchange Contracts (cont’d.): | | | | | | | | | | | | | | | | | |
Chilean Peso (cont’d.), | | | | | | | | | | | | | | | | | | | | | | | | | | | | |
Expiring 12/18/24 | | | GSI | | | | CLP | | | | 1,703,763 | | | $ | 1,806,058 | | | $ | 1,771,579 | | | $ | — | | | $ | (34,479 | ) |
Chinese Renminbi, | | | | | | | | | | | | | | | | | | | | | | | | | | | | |
Expiring 11/12/24 | | | BARC | | | | CNH | | | | 10,979 | | | | 1,542,000 | | | | 1,543,038 | | | | 1,038 | | | | — | |
Expiring 11/12/24 | | | BOA | | | | CNH | | | | 39,889 | | | | 5,601,000 | | | | 5,606,209 | | | | 5,209 | | | | — | |
Expiring 11/12/24 | | | CITI | | | | CNH | | | | 33,697 | | | | 4,784,000 | | | | 4,735,864 | | | | — | | | | (48,136 | ) |
Expiring 11/12/24 | | | JPM | | | | CNH | | | | 67,530 | | | | 9,603,000 | | | | 9,490,949 | | | | — | | | | (112,051 | ) |
Expiring 11/12/24 | | | JPM | | | | CNH | | | | 28,368 | | | | 4,019,000 | | | | 3,986,921 | | | | — | | | | (32,079 | ) |
Colombian Peso, | | | | | | | | | | | | | | | | | | | | | | | | | | | | |
Expiring 12/18/24 | | | BARC | | | | COP | | | | 13,344,818 | | | | 3,074,000 | | | | 2,995,916 | | | | — | | | | (78,084 | ) |
Expiring 12/18/24 | | | CITI | | | | COP | | | | 9,639,834 | | | | 2,240,436 | | | | 2,164,146 | | | | — | | | | (76,290 | ) |
Expiring 12/18/24 | | | CITI | | | | COP | | | | 9,492,637 | | | | 2,181,965 | | | | 2,131,100 | | | | — | | | | (50,865 | ) |
Czech Koruna, | | | | | | | | | | | | | | | | | | | | | | | | | | | | |
Expiring 01/21/25 | | | MSI | | | | CZK | | | | 34,501 | | | | 1,483,000 | | | | 1,485,656 | | | | 2,656 | | | | — | |
Euro, | | | | | | | | | | | | | | | | | | | | | | | | | | | | |
Expiring 01/21/25 | | | JPM | | | | EUR | | | | 2,956 | | | | 3,216,156 | | | | 3,226,971 | | | | 10,815 | | | | — | |
Hungarian Forint, | | | | | | | | | | | | | | | | | | | | | | | | | | | | |
Expiring 01/21/25 | | | DB | | | | HUF | | | | 1,869,946 | | | | 4,998,999 | | | | 4,960,953 | | | | — | | | | (38,046 | ) |
Indian Rupee, | | | | | | | | | | | | | | | | | | | | | | | | | | | | |
Expiring 12/18/24 | | | BNP | | | | INR | | | | 449,932 | | | | 5,336,000 | | | | 5,340,587 | | | | 4,587 | | | | — | |
Expiring 12/18/24 | | | GSI | | | | INR | | | | 560,691 | | | | 6,684,000 | | | | 6,655,281 | | | | — | | | | (28,719 | ) |
Expiring 12/18/24 | | | HSBC | | | | INR | | | | 495,185 | | | | 5,874,497 | | | | 5,877,734 | | | | 3,237 | | | | — | |
Expiring 12/18/24 | | | HSBC | | | | INR | | | | 397,321 | | | | 4,724,000 | | | | 4,716,117 | | | | — | | | | (7,883 | ) |
Expiring 12/18/24 | | | UAG | | | | INR | | | | 520,429 | | | | 6,175,000 | | | | 6,177,376 | | | | 2,376 | | | | — | |
Indonesian Rupiah, | | | | | | | | | | | | | | | | | | | | | | | | | | | | |
Expiring 12/18/24 | | | BOA | | | | IDR | | | | 49,300,017 | | | | 3,233,000 | | | | 3,132,990 | | | | — | | | | (100,010 | ) |
Expiring 12/18/24 | | | DB | | | | IDR | | | | 23,567,224 | | | | 1,546,000 | | | | 1,497,684 | | | | — | | | | (48,316 | ) |
Expiring 12/18/24 | | | MSI | | | | IDR | | | | 234,504,000 | | | | 15,155,593 | | | | 14,902,604 | | | | — | | | | (252,989 | ) |
Expiring 12/18/24 | | | SCB | | | | IDR | | | | 54,942,132 | | | | 3,526,000 | | | | 3,491,543 | | | | — | | | | (34,457 | ) |
Mexican Peso, | | | | | | | | | | | | | | | | | | | | | | | | | | | | |
Expiring 12/18/24 | | | BARC | | | | MXN | | | | 133,632 | | | | 6,615,444 | | | | 6,622,639 | | | | 7,195 | | | | — | |
Philippine Peso, | | | | | | | | | | | | | | | | | | | | | | | | | | | | |
Expiring 12/18/24 | | | CITI | | | | PHP | | | | 117,874 | | | | 2,088,114 | | | | 2,022,035 | | | | — | | | | (66,079 | ) |
Expiring 12/18/24 | | | HSBC | | | | PHP | | | | 315,814 | | | | 5,598,051 | | | | 5,417,539 | | | | — | | | | (180,512 | ) |
Expiring 12/18/24 | | | HSBC | | | | PHP | | | | 275,440 | | | | 4,883,886 | | | | 4,724,962 | | | | — | | | | (158,924 | ) |
Expiring 12/18/24 | | | HSBC | | | | PHP | | | | 224,309 | | | | 3,900,000 | | | | 3,847,834 | | | | — | | | | (52,166 | ) |
Expiring 12/18/24 | | | JPM | | | | PHP | | | | 280,551 | | | | 4,880,000 | | | | 4,812,633 | | | | — | | | | (67,367 | ) |
Polish Zloty, | | | | | | | | | | | | | | | | | | | | | | | | | | | | |
Expiring 01/21/25 | | | DB | | | | PLN | | | | 24,771 | | | | 6,253,232 | | | | 6,170,026 | | | | — | | | | (83,206 | ) |
South African Rand, | | | | | | | | | | | | | | | | | | | | | | | | | | | | |
Expiring 12/18/24 | | | HSBC | | | | ZAR | | | | 18,404 | | | | 1,044,000 | | | | 1,039,547 | | | | — | | | | (4,453 | ) |
Expiring 12/18/24 | | | JPM | | | | ZAR | | | | 22,770 | | | | 1,303,000 | | | | 1,286,107 | | | | — | | | | (16,893 | ) |
Expiring 12/18/24 | | | MSI | | | | ZAR | | | | 57,351 | | | | 3,224,000 | | | | 3,239,383 | | | | 15,383 | | | | — | |
See Notes to Financial Statements.
48
Forward foreign currency exchange contracts outstanding at October 31, 2024 (continued):
| | | | | | | | | | | | | | | | | | | | | | | | | | | | | | | | | | | | | | | | | | | | | | |
Purchase Contracts | | Counterparty | | | | | Notional
Amount
(000) | | | Value at
Settlement
Date | | | Current
Value | | | Unrealized
Appreciation | | | Unrealized
Depreciation | |
| | | | | | |
OTC Forward Foreign Currency Exchange Contracts (cont’d.): | | | | | | | | | | | | | | | | | | | | | | | | | |
South African Rand (cont’d.), | | | | | | | | | | | | | | | | | | | | | | | | | | | | | | | | | | | | | | | | | | | | | | |
Expiring 12/18/24 | | | MSI | | | | | | ZAR | | | | 28,034 | | | $ | 1,595,000 | | | $ | 1,583,435 | | | | | | | $ | — | | | | | | | | | | | $ | (11,565 | ) | | | | |
Expiring 12/18/24 | | | SSB | | | | | | ZAR | | | | 55,729 | | | | 3,187,000 | | | | 3,147,735 | | | | | | | | — | | | | | | | | | | | | (39,265 | ) | | | | |
Expiring 12/18/24 | | | TD | | | | | | ZAR | | | | 27,928 | | | | 1,543,000 | | | | 1,577,493 | | | | | | | | 34,493 | | | | | | | | | | | | — | | | | | |
South Korean Won, | | | | | | | | | | | | | | | | | | | | | | | | | | | | | | | | | | | | | | | | | | | | | | |
Expiring 12/18/24 | | | CITI | | | | | | KRW | | | | 5,037,464 | | | | 3,777,000 | | | | 3,671,298 | | | | | | | | — | | | | | | | | | | | | (105,702 | ) | | | | |
Expiring 12/18/24 | | | CITI | | | | | | KRW | | | | 4,121,363 | | | | 3,115,000 | | | | 3,003,645 | | | | | | | | — | | | | | | | | | | | | (111,355 | ) | | | | |
Expiring 12/18/24 | | | HSBC | | | | | | KRW | | | | 5,012,360 | | | | 3,847,000 | | | | 3,653,003 | | | | | | | | — | | | | | | | | | | | | (193,997 | ) | | | | |
Thai Baht, | | | | | | | | | | | | | | | | | | | | | | | | | | | | | | | | | | | | | | | | | | | | | | |
Expiring 12/18/24 | | | CITI | | | | | | THB | | | | 50,172 | | | | 1,551,000 | | | | 1,491,782 | | | | | | | | — | | | | | | | | | | | | (59,218 | ) | | | | |
Expiring 12/18/24 | | | GSI | | | | | | THB | | | | 112,460 | | | | 3,365,000 | | | | 3,343,839 | | | | | | | | — | | | | | | | | | | | | (21,161 | ) | | | | |
Expiring 12/18/24 | | | HSBC | | | | | | THB | | | | 133,942 | | | | 4,007,000 | | | | 3,982,564 | | | | | | | | — | | | | | | | | | | | | (24,436 | ) | | | | |
Expiring 12/18/24 | | | HSBC | | | | | | THB | | | | 126,437 | | | | 3,931,000 | | | | 3,759,405 | | | | | | | | — | | | | | | | | | | | | (171,595 | ) | | | | |
Expiring 12/18/24 | | | JPM | | | | | | THB | | | | 110,716 | | | | 3,368,000 | | | | 3,291,986 | | | | | | | | — | | | | | | | | | | | | (76,014 | ) | | | | |
Expiring 12/18/24 | | | JPM | | | | | | THB | | | | 81,749 | | | | 2,475,734 | | | | 2,430,676 | | | | | | | | — | | | | | | | | | | | | (45,058 | ) | | | | |
Expiring 12/18/24 | | | SCB | | | | | | THB | | | | 109,776 | | | | 3,320,000 | | | | 3,264,019 | | | | | | | | — | | | | | | | | | | | | (55,981 | ) | | | | |
Turkish Lira, | | | | | | | | | | | | | | | | | | | | | | | | | | | | | | | | | | | | | | | | | | | | | | |
Expiring 11/05/24 | | | HSBC | | | | | | TRY | | | | 102,212 | | | | 2,880,423 | | | | 2,968,507 | | | | | | | | 88,084 | | | | | | | | | | | | — | | | | | |
Expiring 11/13/24 | | | CITI | | | | | | TRY | | | | 119,720 | | | | 3,366,794 | | | | 3,447,866 | | | | | | | | 81,072 | | | | | | | | | | | | — | | | | | |
Expiring 11/13/24 | | | HSBC | | | | | | TRY | | | | 133,889 | | | | 3,756,176 | | | | 3,855,928 | | | | | | | | 99,752 | | | | | | | | | | | | — | | | | | |
Expiring 11/20/24 | | | CITI | | | | | | TRY | | | | 121,057 | | | | 3,394,000 | | | | 3,460,320 | | | | | | | | 66,320 | | | | | | | | | | | | — | | | | | |
Expiring 11/20/24 | | | CITI | | | | | | TRY | | | | 121,057 | | | | 3,427,208 | | | | 3,460,321 | | | | | | | | 33,113 | | | | | | | | | | | | — | | | | | |
Expiring 12/05/24 | | | BOA | | | | | | TRY | | | | 267,214 | | | | 7,451,591 | | | | 7,518,937 | | | | | | | | 67,346 | | | | | | | | | | | | — | | | | | |
Expiring 12/11/24 | | | BARC | | | | | | TRY | | | | 82,459 | | | | 2,292,442 | | | | 2,306,138 | | | | | | | | 13,696 | | | | | | | | | | | | — | | | | | |
Expiring 12/12/24 | | | HSBC | | | | | | TRY | | | | 106,072 | | | | 2,972,860 | | | | 2,963,505 | | | | | | | | — | | | | | | | | | | | | (9,355 | ) | | | | |
Expiring 12/18/24 | | | BARC | | | | | | TRY | | | | 105,900 | | | | 2,731,214 | | | | 2,940,836 | | | | | | | | 209,622 | | | | | | | | | | | | — | | | | | |
Expiring 12/18/24 | | | BARC | | | | | | TRY | | | | 79,775 | | | | 2,059,549 | | | | 2,215,332 | | | | | | | | 155,783 | | | | | | | | | | | | — | | | | | |
| | | | | | | | | | | | | | | | | | | | | | | | | | | | | | | | | | | | | | | | | | | | | | |
| | | | | | | | | | | | | | | | $ | 245,857,671 | | | $ | 243,301,096 | | | | | | | | 901,777 | | | | | | | | | | | | (3,458,352 | ) | | | | |
| | | | | | | | | | | | | | | | | | | | | | | | | | | | | | | | | | | | | | | | | | | | | | |
| | | | | | | |
Sale
Contracts | | Counterparty | | | | | Notional
Amount
(000) | | | Value at
Settlement
Date | | | Current
Value | | | Unrealized
Appreciation | | | Unrealized
Depreciation | |
| | | | | | |
OTC Forward Foreign Currency Exchange Contracts: | | | | | | | | | | | | | | | | | | | | | | | | | |
Brazilian Real, | | | | | | | | | | | | | | | | | | | | | | | | | | | | | | | | | | | | | | | | | | | | | | |
Expiring 11/04/24 | | | BNYM | | | | | | BRL | | | | 83,378 | | | $ | 14,627,785 | | | $ | 14,412,678 | | | | | | | $ | 215,107 | | | | | | | | | | | $ | — | | | | | |
British Pound, | | | | | | | | | | | | | | | | | | | | | | | | | | | | | | | | | | | | | | | | | | | | | | |
Expiring 01/21/25 | | | HSBC | | | | | | GBP | | | | 35,981 | | | | 46,826,614 | | | | 46,383,914 | | | | | | | | 442,700 | | | | | | | | | | | | — | | | | | |
Chilean Peso, | | | | | | | | | | | | | | | | | | | | | | | | | | | | | | | | | | | | | | | | | | | | | | |
Expiring 12/18/24 | | | BARC | | | | | | CLP | | | | 1,659,464 | | | | 1,752,500 | | | | 1,725,517 | | | | | | | | 26,983 | | | | | | | | | | | | — | | | | | |
Expiring 12/18/24 | | | BARC | | | | | | CLP | | | | 1,654,031 | | | | 1,752,500 | | | | 1,719,868 | | | | | | | | 32,632 | | | | | | | | | | | | — | | | | | |
Expiring 12/18/24 | | | TD | | | | | | CLP | | | | 3,160,704 | | | | 3,467,000 | | | | 3,286,512 | | | | | | | | 180,488 | | | | | | | | | | | | — | | | | | |
See Notes to Financial Statements.
PGIM Absolute Return Bond Fund 49
Schedule of Investments (continued)
as of October 31, 2024
Forward foreign currency exchange contracts outstanding at October 31, 2024 (continued):
| | | | | | | | | | | | | | | | | | | | | | | | | | | | | | | | | | | | | | | | | | | | |
Sale
Contracts | | Counterparty | | | | Notional
Amount
(000) | | | Value at
Settlement
Date | | | Current
Value | | | Unrealized
Appreciation | | | Unrealized
Depreciation | |
| | | | | | | |
OTC Forward Foreign Currency Exchange Contracts (cont’d.): | | | | | | | | | | | | | | | | | | | | | | | | | | | | | |
Chinese Renminbi, | | | | | | | | | | | | | | | | | | | | | | | | | | | | | | | | | | | | | | | | | | | | |
Expiring 11/12/24 | | MSI | | | | | CNH | | | | 211,556 | | | $ | 29,704,222 | | | $ | 29,733,100 | | | | | | | $ | — | | | | | | | | | | | $ | (28,878 | ) | | | | |
Expiring 11/12/24 | | MSI | | | | | CNH | | | | 37,506 | | | | 5,264,000 | | | | 5,271,263 | | | | | | | | — | | | | | | | | | | | | (7,263 | ) | | | | |
Expiring 11/12/24 | | MSI | | | | | CNH | | | | 37,285 | | | | 5,235,000 | | | | 5,240,237 | | | | | | | | — | | | | | | | | | | | | (5,237 | ) | | | | |
Colombian Peso, | | | | | | | | | | | | | | | | | | | | | | | | | | | | | | | | | | | | | | | | | | | | |
Expiring 12/18/24 | | BARC | | | | | COP | | | | 6,588,575 | | | | 1,554,000 | | | | 1,479,137 | | | | | | | | 74,863 | | | | | | | | | | | | — | | | | | |
Expiring 12/18/24 | | DB | | | | | COP | | | | 9,101,534 | | | | 2,128,740 | | | | 2,043,297 | | | | | | | | 85,443 | | | | | | | | | | | | — | | | | | |
Expiring 12/18/24 | | DB | | | | | COP | | | | 8,807,871 | | | | 2,045,260 | | | | 1,977,370 | | | | | | | | 67,890 | | | | | | | | | | | | — | | | | | |
Expiring 12/18/24 | | GSI | | | | | COP | | | | 14,234,532 | | | | 3,380,000 | | | | 3,195,657 | | | | | | | | 184,343 | | | | | | | | | | | | — | | | | | |
Expiring 12/18/24 | | GSI | | | | | COP | | | | 10,323,864 | | | | 2,440,399 | | | | 2,317,711 | | | | | | | | 122,688 | | | | | | | | | | | | — | | | | | |
Czech Koruna, | | | | | | | | | | | | | | | | | | | | | | | | | | | | | | | | | | | | | | | | | | | | |
Expiring 01/21/25 | | BNP | | | | | CZK | | | | 189,077 | | | | 8,224,792 | | | | 8,141,915 | | | | | | | | 82,877 | | | | | | | | | | | | — | | | | | |
Expiring 01/21/25 | | CITI | | | | | CZK | | | | 189,077 | | | | 8,161,496 | | | | 8,141,916 | | | | | | | | 19,580 | | | | | | | | | | | | — | | | | | |
Expiring 01/21/25 | | UAG | | | | | CZK | | | | 79,378 | | | | 3,429,000 | | | | 3,418,132 | | | | | | | | 10,868 | | | | | | | | | | | | — | | | | | |
Euro, | | | | | | | | | | | | | | | | | | | | | | | | | | | | | | | | | | | | | | | | | | | | |
Expiring 01/21/25 | | BARC | | | | | EUR | | | | 109,187 | | | | 119,884,876 | | | | 119,195,943 | | | | | | | | 688,933 | | | | | | | | | | | | — | | | | | |
Expiring 01/21/25 | | CITI | | | | | EUR | | | | 2,956 | | | | 3,205,043 | | | | 3,226,972 | | | | | | | | — | | | | | | | | | | | | (21,929 | ) | | | | |
Expiring 01/21/25 | | GSI | | | | | EUR | | | | 103,369 | | | | 112,937,736 | | | | 112,844,429 | | | | | | | | 93,307 | | | | | | | | | | | | — | | | | | |
Expiring 01/21/25 | | SSB | | | | | EUR | | | | 85,849 | | | | 94,662,062 | | | | 93,718,356 | | | | | | | | 943,706 | | | | | | | | | | | | — | | | | | |
Hungarian Forint, | | | | | | | | | | | | | | | | | | | | | | | | | | | | | | | | | | | | | | | | | | | | |
Expiring 01/21/25 | | UAG | | | | | HUF | | | | 998,314 | | | | 2,710,158 | | | | 2,648,519 | | | | | | | | 61,639 | | | | | | | | | | | | — | | | | | |
New Taiwanese Dollar, | | | | | | | | | | | | | | | | | | | | | | | | | | | | | | | | | | | | | | | | | | | | |
Expiring 12/18/24 | | BOA | | | | | TWD | | | | 128,014 | | | | 4,042,000 | | | | 4,029,411 | | | | | | | | 12,589 | | | | | | | | | | | | — | | | | | |
Expiring 12/18/24 | | CITI | | | | | TWD | | | | 398,746 | | | | 12,400,756 | | | | 12,551,052 | | | | | | | | — | | | | | | | | | | | | (150,296 | ) | | | | |
Expiring 12/18/24 | | HSBC | | | | | TWD | | | | 172,033 | | | | 5,371,000 | | | | 5,414,964 | | | | | | | | — | | | | | | | | | | | | (43,964 | ) | | | | |
Expiring 12/18/24 | | JPM | | | | | TWD | | | | 188,974 | | | | 5,973,384 | | | | 5,948,198 | | | | | | | | 25,186 | | | | | | | | | | | | — | | | | | |
Expiring 12/18/24 | | JPM | | | | | TWD | | | | 150,250 | | | | 4,757,000 | | | | 4,729,307 | | | | | | | | 27,693 | | | | | | | | | | | | — | | | | | |
Expiring 12/18/24 | | MSI | | | | | TWD | | | | 261,847 | | | | 8,296,000 | | | | 8,241,959 | | | | | | | | 54,041 | | | | | | | | | | | | — | | | | | |
Peruvian Nuevo Sol, | | | | | | | | | | | | | | | | | | | | | | | | | | | | | | | | | | | | | | | | | | | | |
Expiring 12/18/24 | | BOA | | | | | PEN | | | | 16,872 | | | | 4,436,961 | | | | 4,468,860 | | | | | | | | — | | | | | | | | | | | | (31,899 | ) | | | | |
Philippine Peso, | | | | | | | | | | | | | | | | | | | | | | | | | | | | | | | | | | | | | | | | | | | | |
Expiring 12/18/24 | | CITI | | | | | PHP | | | | 408,513 | | | | 7,304,000 | | | | 7,007,711 | | | | | | | | 296,289 | | | | | | | | | | | | — | | | | | |
Expiring 12/18/24 | | HSBC | | | | | PHP | | | | 135,461 | | | | 2,412,306 | | | | 2,323,720 | | | | | | | | 88,586 | | | | | | | | | | | | — | | | | | |
Expiring 12/18/24 | | HSBC | | | | | PHP | | | | 131,805 | | | | 2,345,694 | | | | 2,261,002 | | | | | | | | 84,692 | | | | | | | | | | | | — | | | | | |
Singapore Dollar, | | | | | | | | | | | | | | | | | | | | | | | | | | | | | | | | | | | | | | | | | | | | |
Expiring 12/18/24 | | BOA | | | | | SGD | | | | 4,938 | | | | 3,835,000 | | | | 3,747,786 | | | | | | | | 87,214 | | | | | | | | | | | | — | | | | | |
Expiring 12/18/24 | | GSI | | | | | SGD | | | | 6,157 | | | | 4,691,000 | | | | 4,672,942 | | | | | | | | 18,058 | | | | | | | | | | | | — | | | | | |
Expiring 12/18/24 | | SCB | | | | | SGD | | | | 8,216 | | | | 6,321,701 | | | | 6,235,583 | | | | | | | | 86,118 | | | | | | | | | | | | — | | | | | |
South African Rand, | | | | | | | | | | | | | | | | | | | | | | | | | | | | | | | | | | | | | | | | | | | | |
Expiring 12/18/24 | | BARC | | | | | ZAR | | | | 25,597 | | | | 1,420,674 | | | | 1,445,788 | | | | | | | | — | | | | | | | | | | | | (25,114 | ) | | | | |
Expiring 12/18/24 | | JPM | | | | | ZAR | | | | 63,482 | | | | 3,583,000 | | | | 3,585,694 | | | | | | | | — | | | | | | | | | | | | (2,694 | ) | | | | |
South Korean Won, | | | | | | | | | | | | | | | | | | | | | | | | | | | | | | | | | | | | | | | | | | | | |
Expiring 12/18/24 | | BOA | | | | | KRW | | | | 5,626,898 | | | | 4,143,000 | | | | 4,100,877 | | | | | | | | 42,123 | | | | | | | | | | | | — | | | | | |
See Notes to Financial Statements.
50
Forward foreign currency exchange contracts outstanding at October 31, 2024 (continued):
| | | | | | | | | | | | | | | | | | | | | | | | | | | | | | | | | | | | | | | | | | | | |
Sale
Contracts | | Counterparty | | | | Notional
Amount
(000) | | | Value at
Settlement
Date | | | Current
Value | | | Unrealized
Appreciation | | | Unrealized
Depreciation | |
| | | | | | | |
OTC Forward Foreign Currency Exchange Contracts (cont’d.): | | | | | | | | | | | | | | | | | | | | | | | | | | | | | |
South Korean Won (cont’d.), | | | | | | | | | | | | | | | | | | | | | | | | | | | | | | | | | | | | | | | | | | | | |
Expiring 12/18/24 | | BOA | | | | | KRW | | | | 4,753,936 | | | $ | 3,523,000 | | | $ | 3,464,663 | | | | | | | $ | 58,337 | | | | | | | | | | | $ | — | | | | | |
Expiring 12/18/24 | | BOA | | | | | KRW | | | | 3,804,434 | | | | 2,843,969 | | | | 2,772,667 | | | | | | | | 71,302 | | | | | | | | | | | | — | | | | | |
Expiring 12/18/24 | | BOA | | | | | KRW | | | | 2,088,577 | | | | 1,551,000 | | | | 1,522,152 | | | | | | | | 28,848 | | | | | | | | | | | | — | | | | | |
Expiring 12/18/24 | | CITI | | | | | KRW | | | | 3,071,944 | | | | 2,332,000 | | | | 2,238,829 | | | | | | | | 93,171 | | | | | | | | | | | | — | | | | | |
Expiring 12/18/24 | | HSBC | | | | | KRW | | | | 4,889,097 | | | | 3,557,000 | | | | 3,563,168 | | | | | | | | — | | | | | | | | | | | | (6,168 | ) | | | | |
Expiring 12/18/24 | | MSI | | | | | KRW | | | | 8,898,505 | | | | 6,694,506 | | | | 6,485,220 | | | | | | | | 209,286 | | | | | | | | | | | | — | | | | | |
Thai Baht, | | | | | | | | | | | | | | | | | | | | | | | | | | | | | | | | | | | | | | | | | | | | |
Expiring 12/18/24 | | JPM | | | | | THB | | | | 458,138 | | | | 13,690,069 | | | | 13,622,052 | | | | | | | | 68,017 | | | | | | | | | | | | — | | | | | |
Expiring 12/18/24 | | JPM | | | | | THB | | | | 224,725 | | | | 6,703,221 | | | | 6,681,876 | | | | | | | | 21,345 | | | | | | | | | | | | — | | | | | |
Expiring 12/18/24 | | JPM | | | | | THB | | | | 115,768 | | | | 3,449,434 | | | | 3,442,178 | | | | | | | | 7,256 | | | | | | | | | | | | — | | | | | |
Turkish Lira, | | | | | | | | | | | | | | | | | | | | | | | | | | | | | | | | | | | | | | | | | | | | |
Expiring 11/05/24 | | HSBC | | | | | TRY | | | | 102,212 | | | | 2,973,867 | | | | 2,968,507 | | | | | | | | 5,360 | | | | | | | | | | | | — | | | | | |
Expiring 12/18/24 | | BARC | | | | | TRY | | | | 128,357 | | | | 3,478,000 | | | | 3,564,471 | | | | | | | | — | | | | | | | | | | | | (86,471 | ) | | | | |
| | | | | | | | | | | | | | | | | | | | | | | | | | | | | | | | | | | | | | | | | | | | |
| | | | | | | | | | | | |
| | | | | | | | | | | | | | $ | 605,522,725 | | | $ | 601,213,080 | | | | | | | | 4,719,558 | | | | | | | | | | | | (409,913 | ) | | | | |
| | | | | | | | | | | | | | | | | | | | | | | | | | | | | | | | | | | | | | | | | | | | |
| | | | | | | | | | | | |
| | | | | | | | | | | | | | | | | | | | | | | | | | $ | 5,621,335 | | | | | | | | | | | $ | (3,868,265 | ) | | | | |
| | | | | | | | | | | | | | | | | | | | | | | | | | | | | | | | | | | | | | | | | | | | |
Credit default swap agreements outstanding at October 31, 2024:
| | | | | | | | | | | | | | | | | | | | | | | | |
Reference
Entity/
Obligation | | Termination
Date | | Fixed
Rate | | | Notional
Amount
(000)#(3) | | Fair
Value | | | Upfront
Premiums
Paid
(Received) | | Unrealized
Appreciation
(Depreciation) | | Counterparty |
|
OTC Packaged Credit Default Swap Agreements on corporate and/or sovereign issues - Buy Protection(1)**: |
Arab Republic of Egypt | | 12/20/29 | | | 1.000%(Q | ) | | | 2,000 | | | $ | 391,613 | | | $ | 2,163 | | | $ | 389,450 | | | BARC |
Dominican Republic | | 12/20/29 | | | 1.000%(Q | ) | | | 2,000 | | | | 62,544 | | | | 2,163 | | | | 60,381 | | | BARC |
Emirate of Abu Dhabi | | 12/20/29 | | | 1.000%(Q | ) | | | 2,000 | | | | (55,920 | ) | | | 2,163 | | | | (58,083 | ) | | BARC |
Federal Republic of Nigeria | | 12/20/29 | | | 1.000%(Q | ) | | | 2,000 | | | | 375,683 | | | | 2,163 | | | | 373,520 | | | BARC |
Federation of Malaysia | | 12/20/29 | | | 1.000%(Q | ) | | | 3,000 | | | | (85,931 | ) | | | 3,245 | | | | (89,176 | ) | | BARC |
Federative Republic of Brazil | | 12/20/29 | | | 1.000%(Q | ) | | | 9,000 | | | | 220,042 | | | | 9,734 | | | | 210,308 | | | BARC |
Kingdom of Bahrain | | 12/20/29 | | | 1.000%(Q | ) | | | 2,000 | | | | 75,837 | | | | 2,163 | | | | 73,674 | | | BARC |
Kingdom of Morocco | | 12/20/29 | | | 1.000%(Q | ) | | | 2,000 | | | | (6,952 | ) | | | 2,163 | | | | (9,115 | ) | | BARC |
Kingdom of Saudi Arabia | | 12/20/29 | | | 1.000%(Q | ) | | | 5,000 | | | | (93,537 | ) | | | 5,408 | | | | (98,945 | ) | | BARC |
People’s Republic of China | | 12/20/29 | | | 1.000%(Q | ) | | | 9,000 | | | | (160,956 | ) | | | 9,734 | | | | (170,690 | ) | | BARC |
Republic of Argentina | | 12/20/29 | | | 1.000%(Q | ) | | | 2,000 | | | | 923,634 | | | | 2,163 | | | | 921,471 | | | BARC |
Republic of Chile | | 12/20/29 | | | 1.000%(Q | ) | | | 6,000 | | | | (120,700 | ) | | | 6,490 | | | | (127,190 | ) | | BARC |
Republic of Colombia | | 12/20/29 | | | 1.000%(Q | ) | | | 7,000 | | | | 352,247 | | | | 7,571 | | | | 344,676 | | | BARC |
See Notes to Financial Statements.
PGIM Absolute Return Bond Fund 51
Schedule of Investments (continued)
as of October 31, 2024
Credit default swap agreements outstanding at October 31, 2024 (continued):
| | | | | | | | | | | | | | | | | | | | | | | | | | | | | | | | | | | | | | | | |
Reference
Entity/
Obligation | | Termination
Date | | Fixed
Rate | | | Notional
Amount
(000)#(3) | | | Fair
Value | | | Upfront
Premiums
Paid
(Received) | | | Unrealized
Appreciation
(Depreciation) | | | Counterparty |
|
OTC Packaged Credit Default Swap Agreements on corporate and/or sovereign issues - Buy Protection(1)**(cont’d.): |
Republic of Indonesia | | 12/20/29 | | | 1.000%(Q | ) | | | 8,000 | | | $ | (121,107 | ) | | | | | | $ | 8,653 | | | | | | | | | | | $ | (129,760 | ) | | | | | | BARC |
Republic of Panama | | 12/20/29 | | | 1.000%(Q | ) | | | 2,000 | | | | 71,009 | | | | | | | | 2,163 | | | | | | | | | | | | 68,846 | | | | | | | BARC |
Republic of Peru | | 12/20/29 | | | 1.000%(Q | ) | | | 3,000 | | | | (29,688 | ) | | | | | | | 3,245 | | | | | | | | | | | | (32,933 | ) | | | | | | BARC |
Republic of Philippines | | 12/20/29 | | | 1.000%(Q | ) | | | 3,000 | | | | (58,750 | ) | | | | | | | 3,245 | | | | | | | | | | | | (61,995 | ) | | | | | | BARC |
Republic of South Africa | | 12/20/29 | | | 1.000%(Q | ) | | | 9,000 | | | | 356,361 | | | | | | | | 9,734 | | | | | | | | | | | | 346,627 | | | | | | | BARC |
Republic of Turkey | | 12/20/29 | | | 1.000%(Q | ) | | | 9,000 | | | | 642,668 | | | | | | | | 9,734 | | | | | | | | | | | | 632,934 | | | | | | | BARC |
State of Qatar | | 12/20/29 | | | 1.000%(Q | ) | | | 2,000 | | | | (56,438 | ) | | | | | | | 2,163 | | | | | | | | | | | | (58,601 | ) | | | | | | BARC |
Sultanate of Oman | | 12/20/29 | | | 1.000%(Q | ) | | | 2,000 | | | | (1,303 | ) | | | | | | | 2,163 | | | | | | | | | | | | (3,466 | ) | | | | | | BARC |
United Mexican States | | 12/20/29 | | | 1.000%(Q | ) | | | 9,000 | | | | 100,149 | | | | | | | | 9,734 | | | | | | | | | | | | 90,415 | | | | | | | BARC |
| | | | | | | | | | | | | | | | | | | | | | | | | | | | | | | | | | | | | | | | |
| | | | | | | | | | | |
| | | | | | | | | | | | $ | 2,780,505 | | | | | | | $ | 108,157 | | | | | | | | | | | $ | 2,672,348 | | | | | | | |
| | | | | | | | | | | | | | | | | | | | | | | | | | | | | | | | | | | | | | | | |
| | | | | | | | | | | | | | | | | | | | | | | | | | | | | | | | | | | | | | | | | | | | | | | | |
Reference
Entity/
Obligation | | Termination
Date | | | Fixed
Rate | | | Notional
Amount
(000)#(3) | | | Implied
Credit
Spread at
October 31,
2024(4) | | | Fair
Value | | | Upfront
Premiums
Paid
(Received) | | | Unrealized
Appreciation
(Depreciation) | | | Counterparty | |
| | |
OTC Packaged Credit Default Swap Agreement on credit indices— Sell Protection(2)**: | | | | | | | | | |
CDX.EM.42.V1 | | | 12/20/29 | | | | 1.000%(Q | ) | | | 100,000 | | | | 1.679% | | | $ | (2,903,284 | ) | | | | | | $ | (168,064 | ) | | | | | | | | | | $ | (2,735,220 | ) | | | | | | | BARC | |
| | | | | | | | | | | | | | | | | | | | | | | | | | | | | | | | | | | | | | | | | | | | | | | | |
| ** | The Fund entered into multiple credit default swap agreements in a packaged trade consisting of two parts. The Fund bought/sold protection on an Emerging Market CDX Index and bought/sold protection on the countries which comprise the index. The upfront premium is attached to the index of the trade for the Emerging Markets CDX package(s). Each swap is priced individually. If any of the component swaps are closed out early, the Index exposure will be reduced by an amount proportionate to the terminated swap(s). |
| | | | | | | | | | | | | | | | | | | | | | | | | | | | | | | | | | | | | | | | | | | | | | |
Reference
Entity/
Obligation | | Termination
Date | | | Fixed
Rate | | | Notional
Amount
(000)#(3) | | | Implied
Credit
Spread at
October 31,
2024(4) | | Fair
Value | | | Upfront
Premiums
Paid
(Received) | | | Unrealized
Appreciation
(Depreciation) | | | Counterparty | |
| | |
OTC Credit Default Swap Agreement on asset-backed and/or mortgage-backed securities - Sell Protection(2)^: | | | | | | | | | |
GS_24-PCA | | | 08/02/27 | | | | 1.650%(M | ) | | | 9,062 | | | * | | $ | 13,055 | | | | | | | $ | — | | | | | | | | | | | $ | 13,055 | | | | | | | | GSI | |
| | | | | | | | | | | | | | | | | | | | | | | | | | | | | | | | | | | | | | | | | | | | | | |
See Notes to Financial Statements.
52
Credit default swap agreements outstanding at October 31, 2024 (continued):
| | | | | | | | | | | | | | | | | | | | | | | | |
Reference
Entity/
Obligation | | Termination
Date | | Fixed
Rate | | | Notional
Amount
(000)#(3) | | | Fair
Value | | | Upfront
Premiums
Paid
(Received) | | | Unrealized
Appreciation
(Depreciation) | | Counterparty |
|
OTC Credit Default Swap Agreements on corporate and/or sovereign issues - Buy Protection(1): |
ADT Security Corp. | | 06/20/29 | | | 5.000%(Q | ) | | | 1,950 | | | $ | (330,445 | ) | | $ | (286,253 | ) | | $ | (44,192 | ) | | GSI |
Antero Resources Corp. | | 06/20/29 | | | 5.000%(Q | ) | | | 1,950 | | | | (325,309 | ) | | | (316,009 | ) | | | (9,300 | ) | | GSI |
Arab Republic of Egypt | | 06/20/30 | | | 1.000%(Q | ) | | | 1,800 | | | | 384,704 | | | | 382,483 | | | | 2,221 | | | GSI |
Bombardier, Inc. | | 06/20/29 | | | 5.000%(Q | ) | | | 1,950 | | | | (282,988 | ) | | | (205,572 | ) | | | (77,416 | ) | | GSI |
Caesars Entertainment, Inc. | | 06/20/29 | | | 5.000%(Q | ) | | | 1,950 | | | | (276,048 | ) | | | (229,836 | ) | | | (46,212 | ) | | GSI |
Chesapeake Energy Corp. | | 06/20/29 | | | 5.000%(Q | ) | | | 1,950 | | | | (361,002 | ) | | | (341,865 | ) | | | (19,137 | ) | | GSI |
Cleveland-Cliffs, Inc. | | 06/20/29 | | | 5.000%(Q | ) | | | 1,950 | | | | (208,082 | ) | | | (238,330 | ) | | | 30,248 | | | GSI |
EQM Midstream Partners LP | | 06/20/29 | | | 5.000%(Q | ) | | | 1,950 | | | | (347,652 | ) | | | (327,943 | ) | | | (19,709 | ) | | GSI |
Frontier Communications Holdings LLC | | 06/20/29 | | | 5.000%(Q | ) | | | 1,950 | | | | (367,442 | ) | | | (76,717 | ) | | | (290,725 | ) | | GSI |
Genworth Holdings, Inc. | | 06/20/29 | | | 5.000%(Q | ) | | | 1,950 | | | | (328,822 | ) | | | (297,883 | ) | | | (30,939 | ) | | GSI |
GFL Environmental, Inc. | | 06/20/29 | | | 5.000%(Q | ) | | | 1,950 | | | | (329,916 | ) | | | (301,486 | ) | | | (28,430 | ) | | GSI |
Hilton Domestic Operating Co., Inc. | | 06/20/29 | | | 5.000%(Q | ) | | | 1,950 | | | | (342,792 | ) | | | (319,668 | ) | | | (23,124 | ) | | GSI |
HUB International Ltd. | | 06/20/29 | | | 5.000%(Q | ) | | | 1,950 | | | | (294,965 | ) | | | (258,121 | ) | | | (36,844 | ) | | GSI |
Israel Electric Corp. Ltd. | | 09/20/28 | | | 1.000%(Q | ) | | | 3,000 | | | | 47,332 | | | | 56,545 | | | | (9,213 | ) | | BARC |
Kingdom of Morocco | | 12/20/27 | | | 1.000%(Q | ) | | | 15,000 | | | | (231,251 | ) | | | (124,205 | ) | | | (107,046 | ) | | GSI |
Kingdom of Morocco | | 12/20/27 | | | 1.000%(Q | ) | | | 10,000 | | | | (154,167 | ) | | | — | | | | (154,167 | ) | | BARC |
Kingdom of Morocco | | 12/20/27 | | | 1.000%(Q | ) | | | 5,000 | | | | (77,084 | ) | | | (41,402 | ) | | | (35,682 | ) | | GSI |
Louisiana-Pacific Corp. | | 06/20/29 | | | 5.000%(Q | ) | | | 1,950 | | | | (360,904 | ) | | | (334,419 | ) | | | (26,485 | ) | | GSI |
Medline Borrower LP | | 06/20/29 | | | 5.000%(Q | ) | | | 1,950 | | | | (338,638 | ) | | | (270,342 | ) | | | (68,296 | ) | | GSI |
Murphy Oil Corp. | | 06/20/29 | | | 1.000%(Q | ) | | | 1,950 | | | | 37,723 | | | | 7,800 | | | | 29,923 | | | GSI |
Organon & Co/Organon Foreign Debt Co-Issuer BV | | 06/20/29 | | | 5.000%(Q | ) | | | 1,950 | | | | (282,333 | ) | | | (229,836 | ) | | | (52,497 | ) | | GSI |
PG&E Corp. | | 06/20/29 | | | 5.000%(Q | ) | | | 1,950 | | | | (330,779 | ) | | | (278,270 | ) | | | (52,509 | ) | | GSI |
Post Holdings, Inc. | | 06/20/29 | | | 5.000%(Q | ) | | | 1,950 | | | | (316,345 | ) | | | (288,926 | ) | | | (27,419 | ) | | GSI |
Republic of Romania | | 12/20/29 | | | 1.000%(Q | ) | | EUR | 4,500 | | | | 86,173 | | | | 179,415 | | | | (93,242 | ) | | BARC |
See Notes to Financial Statements.
PGIM Absolute Return Bond Fund 53
Schedule of Investments (continued)
as of October 31, 2024
Credit default swap agreements outstanding at October 31, 2024 (continued):
| | | | | | | | | | | | | | | | | | | | | | | | | | | | | | | | | | |
Reference
Entity/
Obligation | | Termination
Date | | | Fixed
Rate | | | Notional
Amount
(000)#(3) | | | Fair
Value | | | Upfront
Premiums
Paid
(Received) | | | Unrealized
Appreciation
(Depreciation) | | | Counterparty |
|
OTC Credit Default Swap Agreements on corporate and/or sovereign issues - Buy Protection(1)(cont’d.): |
Republic of South Africa | | | 06/20/26 | | | | 1.000%(Q | ) | | | 20,000 | | | $ | (123,366 | ) | | $ | 98,238 | | | | | | | $ | (221,604 | ) | | | | | | GSI |
Safeway, Inc. | | | 06/20/29 | | | | 5.000%(Q | ) | | | 1,950 | | | | (353,514 | ) | | | (341,865 | ) | | | | | | | (11,649 | ) | | | | | | GSI |
Standard Industries, Inc. | | | 06/20/29 | | | | 5.000%(Q | ) | | | 1,950 | | | | (347,810 | ) | | | (319,668 | ) | | | | | | | (28,142 | ) | | | | | | GSI |
Tenet Healthcare Corp. | | | 06/20/29 | | | | 5.000%(Q | ) | | | 1,950 | | | | (335,734 | ) | | | (292,501 | ) | | | | | | | (43,233 | ) | | | | | | GSI |
U.S. Treasury Notes | | | 06/20/25 | | | | 0.250%(Q | ) | | EUR | 4,420 | | | | 266 | | | | (1,515 | ) | | | | | | | 1,781 | | | | | | | BARC |
U.S. Treasury Notes | | | 06/20/25 | | | | 0.250%(Q | ) | | EUR | 1,475 | | | | 88 | | | | (504 | ) | | | | | | | 592 | | | | | | | BARC |
Uber Technologies, Inc. | | | 06/20/29 | | | | 5.000%(Q | ) | | | 1,950 | | | | (376,781 | ) | | | (326,099 | ) | | | | | | | (50,682 | ) | | | | | | GSI |
United Mexican States | | | 12/20/24 | | | | 1.000%(Q | ) | | | 1,000 | | | | (2,118 | ) | | | (319 | ) | | | | | | | (1,799 | ) | | | | | | BARC |
United Mexican States | | | 12/20/24 | | | | 1.000%(Q | ) | | | 440 | | | | (932 | ) | | | 83 | | | | | | | | (1,015 | ) | | | | | | CITI |
United Rentals North America, Inc. | | | 06/20/29 | | | | 5.000%(Q | ) | | | 1,950 | | | | (355,051 | ) | | | (317,837 | ) | | | | | | | (37,214 | ) | | | | | | GSI |
Venture Global LNG, Inc. | | | 06/20/29 | | | | 5.000%(Q | ) | | | 1,950 | | | | (261,056 | ) | | | (223,929 | ) | | | | | | | (37,127 | ) | | | | | | GSI |
Weatherford International Ltd. | | | 06/20/29 | | | | 5.000%(Q | ) | | | 1,950 | | | | (307,403 | ) | | | (311,451 | ) | | | | | | | 4,048 | | | | | | | GSI |
| | | | | | | | | | | | | | | | | | | | | | | | | | | | | | | | | | |
| | | | | | | | | | | | | | $ | (7,794,443 | ) | | $ | (6,178,207 | ) | | | | | | $ | (1,616,236 | ) | | | | | | |
| | | | | | | | | | | | | | | | | | | | | | | | | | | | | | | | | | |
| | | | | | | | | | | | | | | | | | | | | | | | | | | | | | |
Reference
Entity/
Obligation | | Termination
Date | | | Fixed
Rate | | | Notional
Amount
(000)#(3) | | | Implied
Credit
Spread at
October 31,
2024(4) | | | Fair
Value | | | Upfront
Premiums
Paid
(Received) | | | Unrealized
Appreciation
(Depreciation) | | Counterparty |
| |
OTC Credit Default Swap Agreements on corporate and/or sovereign issues - Sell Protection(2): | | | |
Bank of America Corp. | | | 12/20/25 | | | | 1.000%(Q | ) | | | 3,030 | | | | 0.289% | | | $ | 27,573 | | | $ | 24,715 | | | | $ 2,858 | | | GSI |
BNP Paribas SA | | | 12/20/24 | | | | 1.000%(Q | ) | | EUR | 3,200 | | | | 0.192% | | | | 7,933 | | | | 3,964 | | | | 3,969 | | | BARC |
Citigroup, Inc. | | | 12/20/25 | | | | 1.000%(Q | ) | | | 3,030 | | | | 0.239% | | | | 29,277 | | | | 25,056 | | | | 4,221 | | | GSI |
General Motors Co. | | | 06/20/26 | | | | 5.000%(Q | ) | | | 2,230 | | | | 0.300% | | | | 179,622 | | | | 142,031 | | | | 37,591 | | | GSI |
Halliburton Co. | | | 12/20/26 | | | | 1.000%(Q | ) | | | 910 | | | | 0.308% | | | | 14,013 | | | | 3,724 | | | | 10,289 | | | GSI |
Lincoln National Corp. | | | 12/20/29 | | | | 1.000%(Q | ) | | | 5,300 | | | | 1.350% | | | | (77,717 | ) | | | (108,286 | ) | | | 30,569 | | | BARC |
Morgan Stanley | | | 12/20/25 | | | | 1.000%(Q | ) | | | 3,030 | | | | 0.254% | | | | 28,758 | | | | 24,715 | | | | 4,043 | | | GSI |
See Notes to Financial Statements.
54
Schedule of Investments (continued)
as of October 31, 2024
Credit default swap agreements outstanding at October 31, 2024 (continued):
| | | | | | | | | | | | | | | | | | | | | | | | | | | | | | | | | | | | | | |
Reference
Entity/
Obligation | | Termination
Date | | | Fixed
Rate | | | Notional
Amount
(000)#(3) | | | Implied
Credit
Spread at
October 31,
2024(4) | | | Fair
Value | | | Upfront
Premiums
Paid
(Received) | | | Unrealized
Appreciation
(Depreciation) | | | Counterparty |
| | |
OTC Credit Default Swap Agreements on corporate and/or sovereign issues - Sell Protection(2)(cont’d.): | | | | | | | |
Petroleos Mexicanos | | | 12/20/24 | | | | 1.000%(Q | ) | | | 1,000 | | | | 1.268% | | | $ | 798 | | | $ | (1,402 | ) | | | | | | $ | 2,200 | | | | | | | BARC |
Petroleos Mexicanos | | | 12/20/24 | | | | 1.000%(Q | ) | | | 440 | | | | 1.268% | | | | 351 | | | | (1,114 | ) | | | | | | | 1,465 | | | | | | | CITI |
Petroleos Mexicanos | | | 06/20/25 | | | | 1.000%(Q | ) | | | 1,230 | | | | 1.475% | | | | (2,233 | ) | | | (4,244 | ) | | | | | | | 2,011 | | | | | | | MSI |
Republic of Italy | | | 12/20/24 | | | | 1.000%(Q | ) | | | 4,850 | | | | 0.076% | | | | 11,811 | | | | 6,299 | | | | | | | | 5,512 | | | | | | | BARC |
Simon Property Group LP | | | 06/20/26 | | | | 1.000%(Q | ) | | | 1,980 | | | | 0.232% | | | | 26,485 | | | | 7,511 | | | | | | | | 18,974 | | | | | | | GSI |
U.S. Treasury Notes | | | 12/20/24 | | | | 0.250%(Q | ) | | EUR | 4,420 | | | | 0.189% | | | | 1,809 | | | | 965 | | | | | | | | 844 | | | | | | | BARC |
U.S. Treasury Notes | | | 12/20/24 | | | | 0.250%(Q | ) | | EUR | 1,545 | | | | 0.189% | | | | 633 | | | | 450 | | | | | | | | 183 | | | | | | | DB |
U.S. Treasury Notes | | | 12/20/24 | | | | 0.250%(Q | ) | | EUR | 1,475 | | | | 0.189% | | | | 603 | | | | 319 | | | | | | | | 284 | | | | | | | BARC |
U.S. Treasury Notes | | | 12/20/24 | | | | 0.250%(Q | ) | | EUR | 1,000 | | | | 0.189% | | | | 409 | | | | (284 | ) | | | | | | | 693 | | | | | | | BNP |
U.S. Treasury Notes | | | 03/20/25 | | | | 0.250%(Q | ) | | EUR | 2,995 | | | | 0.242% | | | | 1,055 | | | | 1,461 | | | | | | | | (406 | ) | | | | | | BARC |
UBS Group AG | | | 03/20/25 | | | | 1.000%(Q | ) | | EUR | 5,500 | | | | 0.186% | | | | 25,718 | | | | 18,268 | | | | | | | | 7,450 | | | | | | | GSI |
Verizon Communications, Inc. | | | 06/20/26 | | | | 1.000%(Q | ) | | | 680 | | | | 0.330% | | | | 8,027 | | | | 4,659 | | | | | | | | 3,368 | | | | | | | GSI |
| | | | | | | | | | | | | | | | | | | | | | | | | | | | | | | | | | | | | | |
| | | | | | | | | | |
| | | | | | | | | | | | | | | | | | $ | 284,925 | | | $ | 148,807 | | | | | | | $ | 136,118 | | | | | | | |
| | | | | | | | | | | | | | | | | | | | | | | | | | | | | | | | | | | | | | |
| | | | | | | | | | | | | | | | | | | | | | | | | | | | | | | | | | | | | | | | | | | | | | | | |
Reference
Entity/
Obligation | | Termination
Date | | Fixed
Rate | | | Notional
Amount
(000)#(3) | | | Implied Credit
Spread at
October 31,
2024(4) | | Value at
Trade Date | | | Value at
October 31,
2024 | | | Unrealized
Appreciation
(Depreciation) | |
| |
Centrally Cleared Credit Default Swap Agreement on credit indices - Sell Protection(2): | | | | | |
CDX.NA.IG.43.V1 | | 12/20/34 | | | 1.000%(Q | ) | | | 60,938 | | | 0.944% | | | | | | $ | 416,715 | | | | | | | | | | | $ | 339,907 | | | | | | | | | | | $ | (76,808 | ) | | | | |
| | | | | | | | | | | | | | | | | | | | | | | | | | | | | | | | | | | | | | | | | | | | | | | | |
The Fund entered into credit default swaps (“CDS”) to provide a measure of protection against defaults or to take an active long or short position with respect to the likelihood of a particular issuer’s default or the reference entity’s credit soundness. CDS contracts generally trade based on a spread which represents the cost a protection buyer has to pay the protection seller. The protection buyer is said to be short the credit as the value of the contract rises the more the credit deteriorates. The value of the CDS contract increases for the protection buyer if the spread increases.
| (1) | If the Fund is a buyer of protection, it pays the fixed rate. When a credit event occurs, as defined under the terms of that |
See Notes to Financial Statements.
PGIM Absolute Return Bond Fund 55
Schedule of Investments (continued)
as of October 31, 2024
| | particular swap agreement, the Fund will either (i) receive from the seller of protection an amount equal to the notional amount of the swap and make delivery of the referenced obligation or underlying securities comprising the referenced index or (ii) receive a net settlement amount in the form of cash or securities equal to the notional amount of the swap less the recovery value of the referenced obligation or underlying securities comprising the referenced index. |
| (2) | If the Fund is a seller of protection, it receives the fixed rate. When a credit event occurs, as defined under the terms of that particular swap agreement, the Fund will either (i) pay to the buyer of protection an amount equal to the notional amount of the swap and take delivery of the referenced obligation or underlying securities comprising the referenced index or (ii) pay a net settlement amount in the form of cash or securities equal to the notional amount of the swap less the recovery value of the referenced obligation or underlying securities comprising the referenced index. |
| (3) | Notional amount represents the maximum potential amount the Fund could be required to pay as a seller of credit protection or receive as a buyer of credit protection if a credit event occurs as defined under the terms of that particular swap agreement. |
| (4) | Implied credit spreads, represented in absolute terms, utilized in determining the fair value of credit default swap agreements where the Fund is the seller of protection as of the reporting date serve as an indicator of the current status of the payment/ performance risk and represent the likelihood of risk of default for the credit derivative. The implied credit spread of a particular referenced entity reflects the cost of buying/selling protection and may include up-front payments required to be made to enter into the agreement. Wider credit spreads represent a deterioration of the referenced entity’s credit soundness and a greater likelihood of risk of default or other credit event occurring as defined under the terms of the agreement. |
| * | When an implied credit spread is not available, reference the fair value of credit default swap agreements on credit indices and asset-backed securities. Where the Fund is the seller of protection, it serves as an indicator of the current status of the payment/performance risk and represents the likelihood of an expected liability (or profit) for the credit derivative should the notional amount of the swap agreement be closed/sold as of the reporting date. Increasing fair value in absolute terms, when compared to the notional amount of the swap, represents a deterioration of the referenced entity’s credit soundness and a greater likelihood of risk of default or other credit event occurring as defined under the terms of the agreement. |
Currency swap agreement outstanding at October 31, 2024:
| | | | | | | | | | | | | | | | | | | | | | | | | | | | | | | | | | | | | | | | | | | | | | |
Notional
Amount
(000)# | | Fund
Receives | | | Notional
Amount
(000)# | | | Fund Pays | | Counterparty | | | Termination
Date | | | Fair
Value | | | Upfront
Premiums
Paid
(Received) | | | Unrealized
Appreciation
(Depreciation) | |
| | | | | | | | | | |
OTC Currency Swap Agreement: | | | | | | | | | | | | | | | | | | | | | | | | | | | | | | | | | | | | | | | |
4,500 | | | 3.100%(A) | | | | EUR 4,883 | | | 1 Day SOFR(A)/ 4.900% | | | JPM | | | | 09/27/29 | | | $ | (113,652 | ) | | | | | | $ | — | | | | | | | | | | | $ | (113,652 | ) | | | | |
| | | | | | | | | | | | | | | | | | | | | | | | | | | | | | | | | | | | | | | | | | | | | | |
See Notes to Financial Statements.
56
Interest rate swap agreements outstanding at October 31, 2024:
| | | | | | | | | | | | | | | | | | | | | | | | | | | | | | | | | | | | | | | | | | | | | | | | | | |
Notional
Amount
(000)# | | Termination
Date | | | | | | Fixed
Rate | | | | | | Floating Rate | | | | Value at
Trade Date | | | Value at
October 31,
2024 | | | Unrealized Appreciation (Depreciation) | |
| | | | |
Centrally Cleared Interest Rate Swap Agreements: | | | | | | | | | | | | | | | | | |
GBP | | 2,090 | | | 05/08/26 | | | | | | | | 1.000%(A) | | | | | | | 1 Day SONIA(1)(A)/ 4.950% | | | | $ | (28,953 | ) | | | | | | $ | 183,103 | | | | | | | | | | | $ | 212,056 | | | | | |
GBP | | 15,780 | | | 05/08/27 | | | | | | | | 1.050%(A) | | | | | | | 1 Day SONIA(1)(A)/ 4.950% | | | | | 1,652,770 | | | | | | | | 1,895,233 | | | | | | | | | | | | 242,463 | | | | | |
GBP | | 1,340 | | | 05/08/31 | | | | | | | | 1.150%(A) | | | | | | | 1 Day SONIA(1)(A)/ 4.950% | | | | | (30,882 | ) | | | | | | | 309,614 | | | | | | | | | | | | 340,496 | | | | | |
| | 6,572 | | | 03/08/25 | | | | | | | | 4.946%(A) | | | | | | | 1 Day SOFR(2)(A)/ 4.900% | | | | | — | | | | | | | | (9,570 | ) | | | | | | | | | | | (9,570 | ) | | | | |
| | 8,268 | | | 03/09/25 | | | | | | | | 5.110%(A) | | | | | | | 1 Day SOFR(2)(A)/ 4.900% | | | | | — | | | | | | | | 1,723 | | | | | | | | | | | | 1,723 | | | | | |
| | 110,000 | | | 05/13/25 | | | | | | | | 5.140%(T) | | | | | | | 1 Day SOFR(1)(T)/ 4.900% | | | | | — | | | | | | | | (296,815 | ) | | | | | | | | | | | (296,815 | ) | | | | |
| | 24,570 | | | 08/31/25 | | | | | | | | 4.805%(A) | | | | | | | 1 Day SOFR(1)(A)/ 4.900% | | | | | — | | | | | | | | (94,206 | ) | | | | | | | | | | | (94,206 | ) | | | | |
| | 45,000 | | | 05/13/26 | | | | | | | | 4.735%(A) | | | | | | | 1 Day SOFR(1)(A)/ 4.900% | | | | | — | | | | | | | | (344,766 | ) | | | | | | | | | | | (344,766 | ) | | | | |
| | 12,090 | | | 09/25/26 | | | | | | | | 4.699%(A) | | | | | | | 1 Day SOFR(1)(A)/ 4.900% | | | | | 2,236 | | | | | | | | (160,511 | ) | | | | | | | | | | | (162,747 | ) | | | | |
| | 16,000 | | | 05/11/27 | | | | | | | | 0.700%(A) | | | | | | | 1 Day SOFR(1)(A)/ 4.900% | | | | | 1,776,548 | | | | | | | | 1,574,603 | | | | | | | | | | | | (201,945 | ) | | | | |
| | 10,000 | | | 12/15/27 | | | | | | | | 3.709%(A) | | | | | | | 1 Day SOFR(1)(A)/ 4.900% | | | | | — | | | | | | | | 182,047 | | | | | | | | | | | | 182,047 | | | | | |
| | 3,375 | | | 05/11/54 | | | | | | | | 1.350%(A) | | | | | | | 1 Day SOFR(1)(A)/ 4.900% | | | | | 1,540,576 | | | | | | | | 1,446,365 | | | | | | | | | | | | (94,211 | ) | | | | |
| | | | | | | | | | | | | | | | | | | | | | | | | | | | | | | | | | | | | | | | | | | | | | | | | | |
| | | | | | | | | | | | | | | | | | | | | | | | $ | 4,912,295 | | | | | | | $ | 4,686,820 | | | | | | | | | | | $ | (225,475 | ) | | | | |
| | | | | | | | | | | | | | | | | | | | | | | | | | | | | | | | | | | | | | | | | | | | | | | | | | |
| (1) | The Fund pays the fixed rate and receives the floating rate. |
| (2) | The Fund pays the floating rate and receives the fixed rate. |
Total return swap agreements outstanding at October 31, 2024:
| | | | | | | | | | | | | | | | | | | | | | | | | | | | | | | | | | | |
Reference Entity | | Financing
Rate | | Counterparty | | Termination
Date | | Long
(Short)
Notional
Amount
(000)#(1) | | Fair
Value | | Upfront
Premiums
Paid
(Received) | | Unrealized
Appreciation
(Depreciation)(2) |
| | | | | | |
OTC Total Return Swap Agreements: | | | | | | | | | | | | | | | | | | | | | | | | | | | | | | | |
iBoxx US Dollar Liquid Investment Grade Index(T) | | |
| 1 Day
SOFR(Q)/
4.900% |
| | | | JPM | | | | | 03/20/25 | | | | | (26,320) | | | | $ | 492,810 | | | | $ | — | | | | $ | 492,810 | |
See Notes to Financial Statements.
PGIM Absolute Return Bond Fund 57
Schedule of Investments (continued)
as of October 31, 2024
Total return swap agreements outstanding at October 31, 2024 (continued):
| | | | | | | | | | | | | | | | | | | | | | | | | | | | | | | | | | | |
Reference Entity | | Financing
Rate | | Counterparty | | Termination
Date | | Long
(Short)
Notional
Amount
(000)#(1) | | Fair
Value | | Upfront
Premiums
Paid
(Received) | | Unrealized
Appreciation
(Depreciation)(2) |
| | | | | |
OTC Total Return Swap Agreements (cont’d.): | | | | | | | | | | | | | | | | | | | | | | | | | | |
Total Return Benchmark Bond Index(T) | | |
| 1 Day USOIS
-40bps(T)/
4.430% |
| | | | GSI | | | | | 03/20/25 | | | | | (3,245) | | | | $ | 203,419 | | | | $ | — | | | | $ | 203,419 | |
Total Return Benchmark Bond Index(T)†† | | |
| 1 Day USOIS
-54bps(T)/
4.290% |
| | | | JPM | | | | | 03/20/25 | | | | | (59,681) | | | | | 3,343,070 | | | | | — | | | | | 3,343,070 | |
| | | | | | | | | | | | | | | | | | | | | | | | | | | | | | | | | | | |
| | | | | | | |
| | | | | | | | | | | | | | | | | | | | | | | $ | 4,039,299 | | | | $ | — | | | | $ | 4,039,299 | |
| | | | | | | | | | | | | | | | | | | | | | | | | | | | | | | | | | | |
| (1) | On a long total return swap, the Fund receives payments for any positive return on the reference entity (makes payments for any negative return) and pays the financing rate. On a short total return swap, the Fund makes payments for any positive return on the reference entity (receives payments for any negative return) and receives the financing rate. |
| (2) | Upfront/recurring fees or commissions, as applicable, are included in the net unrealized appreciation (depreciation). |
| †† | See the table below for the swap constituents. To the extent that any swap is composed of greater than 50 constituents, the Fund is only required to disclose the top 50. |
The following table represents the top 50 individual positions and related values of underlying securities of Total Return Benchmark Bond Index total return swap with JPM, as of October 31, 2024, termination date 03/20/2025:
Corporate Bond:
| | | | | | | | | | | | |
Reference Entity | | Shares | | | Market
Value | | | % of Total
Index Value |
| | | |
Sysco Corp. | | | 4,000,000 | | | $ | 4,507,517 | | | | 1.53 | % |
Morgan Stanley | | | 4,000,000 | | | | 4,191,980 | | | | 1.42 | % |
Dell International LLC | | | 4,000,000 | | | | 4,052,133 | | | | 1.38 | % |
Northrop Grumman Corp. | | | 4,000,000 | | | | 3,997,105 | | | | 1.36 | % |
United Parcel Service, Inc. | | | 4,000,000 | | | | 3,980,125 | | | | 1.35 | % |
Conagra Brands, Inc. | | | 4,000,000 | | | | 3,894,811 | | | | 1.32 | % |
FedEx Corp. | | | 4,000,000 | | | | 3,860,828 | | | | 1.31 | % |
Fox Corp. | | | 4,000,000 | | | | 3,852,339 | | | | 1.31 | % |
Telefonica Emisiones, S.A.U. | | | 4,000,000 | | | | 3,839,978 | | | | 1.30 | % |
Keurig Dr Pepper, Inc. | | | 4,000,000 | | | | 3,831,115 | | | | 1.30 | % |
TransCanada PipeLines Ltd. | | | 4,000,000 | | | | 3,804,246 | | | | 1.29 | % |
Wells Fargo & Co. | | | 4,000,000 | | | | 3,741,076 | | | | 1.27 | % |
HCA, Inc. | | | 4,000,000 | | | | 3,702,179 | | | | 1.26 | % |
The Walt Disney Co. | | | 4,000,000 | | | | 3,694,073 | | | | 1.26 | % |
Cigna Corp. | | | 4,000,000 | | | | 3,619,802 | | | | 1.23 | % |
Bristol-Myers Squibb Co. | | | 4,000,000 | | | | 3,475,924 | | | | 1.18 | % |
ExxonMobil Corp. | | | 4,000,000 | | | | 3,458,394 | | | | 1.18 | % |
Fiserv, Inc. | | | 4,000,000 | | | | 3,440,082 | | | | 1.17 | % |
Thermo Fisher Scientific, Inc. | | | 4,000,000 | | | | 3,400,872 | | | | 1.16 | % |
See Notes to Financial Statements.
58
Corporate Bond (continued):
| | | | | | | | | | | | | | | |
Reference Entity | | Shares | | Market
Value | | % of Total
Index Value |
| | | |
T-Mobile USA, Inc. | | | | 4,000,000 | | | | $ | 3,400,339 | | | | | 1.16 | % |
Eli Lilly and Co. | | | | 4,000,000 | | | | | 3,315,718 | | | | | 1.13 | % |
Bank of America Corp. | | | | 4,000,000 | | | | | 3,303,043 | | | | | 1.12 | % |
Johnson & Johnson | | | | 4,000,000 | | | | | 3,301,385 | | | | | 1.12 | % |
Enterprise Products Operating LLC | | | | 4,000,000 | | | | | 3,298,037 | | | | | 1.12 | % |
Intel Corp. | | | | 4,000,000 | | | | | 3,281,101 | | | | | 1.11 | % |
McDonald’s Corp. | | | | 4,000,000 | | | | | 3,280,431 | | | | | 1.11 | % |
Mastercard, Inc. | | | | 4,000,000 | | | | | 3,237,399 | | | | | 1.10 | % |
Progressive Corp. | | | | 4,000,000 | | | | | 3,227,235 | | | | | 1.10 | % |
Deere & Co. | | | | 4,000,000 | | | | | 3,226,229 | | | | | 1.10 | % |
Vodafone Group PLC | | | | 4,000,000 | | | | | 3,182,380 | | | | | 1.08 | % |
Union Electric Co. | | | | 4,000,000 | | | | | 3,169,445 | | | | | 1.08 | % |
Global Payments, Inc. | | | | 4,000,000 | | | | | 3,145,591 | | | | | 1.07 | % |
NVIDIA Corp. | | | | 4,000,000 | | | | | 3,126,323 | | | | | 1.06 | % |
Becton, Dickinson & Co. | | | | 4,000,000 | | | | | 3,124,093 | | | | | 1.06 | % |
Equinor ASA | | | | 4,000,000 | | | | | 3,117,383 | | | | | 1.06 | % |
Paramount Group, Inc. | | | | 4,000,000 | | | | | 3,066,519 | | | | | 1.04 | % |
Oracle Corp. | | | | 4,000,000 | | | | | 3,064,638 | | | | | 1.04 | % |
Dollar General Corp. | | | | 4,000,000 | | | | | 3,033,274 | | | | | 1.03 | % |
Southern California Edison Co. | | | | 4,000,000 | | | | | 3,019,926 | | | | | 1.03 | % |
Humana, Inc. | | | | 4,000,000 | | | | | 3,003,392 | | | | | 1.02 | % |
Entergy Corp. | | | | 4,000,000 | | | | | 2,999,035 | | | | | 1.02 | % |
eBay, Inc. | | | | 4,000,000 | | | | | 2,996,014 | | | | | 1.02 | % |
Carrier Global Corp. | | | | 4,000,000 | | | | | 2,985,419 | | | | | 1.01 | % |
Rogers Communications, Inc. | | | | 4,000,000 | | | | | 2,969,088 | | | | | 1.01 | % |
Altria Group, Inc. | | | | 4,000,000 | | | | | 2,961,079 | | | | | 1.01 | % |
Nike, Inc. | | | | 4,000,000 | | | | | 2,948,868 | | | | | 1.00 | % |
Starbucks Corp. | | | | 4,000,000 | | | | | 2,944,006 | | | | | 1.00 | % |
Verizon Communications, Inc. | | | | 4,000,000 | | | | | 2,939,079 | | | | | 1.00 | % |
Suncor Energy, Inc. | | | | 4,000,000 | | | | | 2,932,072 | | | | | 1.00 | % |
Dow Chemical Co. (The) | | | | 4,000,000 | | | | | 2,925,896 | | | | | 0.99 | % |
| | | | | | | | | | | | | | | |
| | | |
| | | | | | | | $ | 168,869,016 | | | | | | |
| | | | | | | | | | | | | | | |
Balances Reported in the Statement of Assets and Liabilities for OTC Swap Agreements:
| | | | | | | | |
| | | Premiums Paid | | Premiums Received | | Unrealized
Appreciation | | Unrealized
Depreciation |
| | | | |
| OTC Swap Agreements | | $1,096,858 | | $(7,186,165) | | $7,769,993 | | $(5,374,281) |
See Notes to Financial Statements.
PGIM Absolute Return Bond Fund 59
Schedule of Investments (continued)
as of October 31, 2024
Summary of Collateral for Centrally Cleared/Exchange-traded Derivatives:
Cash and securities segregated as collateral, including pending settlement for closed positions, to cover requirements for centrally cleared/exchange-traded derivatives are listed by broker as follows:
| | | | | | | | | | | | | | | | | | | | | | | | |
Broker | | Cash and/or Foreign Currency | | | Securities Market Value | |
| | | | | | |
CGM | | | | | | $ | — | | | | | | | | | | | $ | 23,835,076 | | | | | |
| | | | | | | | | | | | | | | | | | | | | | | | |
Fair Value Measurements:
Various inputs are used in determining the value of the Fund’s investments. These inputs are summarized in the three broad levels listed below.
Level 1—unadjusted quoted prices generally in active markets for identical securities.
Level 2—quoted prices for similar securities, interest rates and yield curves, prepayment speeds, foreign currency exchange rates and other observable inputs.
Level 3—unobservable inputs for securities valued in accordance with Board approved fair valuation procedures.
The following is a summary of the inputs used as of October 31, 2024 in valuing such portfolio securities:
| | | | | | | | | | | | |
| | | Level 1 | | | Level 2 | | | Level 3 | |
| | | |
Investments in Securities | | | | | | | | | | | | |
Assets | | | | | | | | | | | | |
Long-Term Investments | | | | | | | | | | | | |
Asset-Backed Securities | | | | | | | | | | | | |
Automobiles | | $ | — | | | $ | 28,038,996 | | | $ | — | |
Collateralized Loan Obligations | | | — | | | | 571,357,850 | | | | — | |
Consumer Loans | | | — | | | | 11,339,991 | | | | — | |
Equipment | | | — | | | | 1,518,919 | | | | — | |
Home Equity Loans | | | — | | | | 11,792,887 | | | | — | |
Other | | | — | | | | 8,478,666 | | | | — | |
Residential Mortgage-Backed Securities | | | — | | | | 5,246,654 | | | | 3,314,800 | |
Student Loans | | | — | | | | 3,063,114 | | | | — | |
Commercial Mortgage-Backed Securities | | | — | | | | 132,767,180 | | | | — | |
Corporate Bonds | | | — | | | | 620,363,921 | | | | 2,186,142 | |
Floating Rate and Other Loans | | | — | | | | 19,714,135 | | | | 6,279,632 | |
Municipal Bonds | | | — | | | | 6,688,912 | | | | — | |
Residential Mortgage-Backed Securities | | | — | | | | 100,095,994 | | | | 1,031,182 | |
Sovereign Bonds | | | — | | | | 111,443,008 | | | | — | |
U.S. Government Agency Obligations | | | — | | | | 228,419,171 | | | | — | |
U.S. Treasury Obligations | | | — | | | | 644,103,720 | | | | — | |
Affiliated Exchange-Traded Funds | | | 142,949,920 | | | | — | | | | — | |
Common Stocks | | | 1,064,930 | | | | 596,834 | | | | 4,922,953 | |
Preferred Stocks | | | — | | | | — | | | | 715,509 | |
Warrants | | | — | | | | — | | | | 370 | |
See Notes to Financial Statements.
60
| | | | | | | | | | | | |
| | | Level 1 | | | Level 2 | | | Level 3 | |
Investments in Securities (continued) | | | | | | | | | | | | |
Assets (continued) | | | | | | | | | | | | |
Short-Term Investments | | | | | | | | | | | | |
Affiliated Mutual Funds | | $ | 87,826,475 | | | $ | — | | | $ | — | |
Options Purchased | | | — | | | | 104,724 | | | | — | |
| | | | | | | | | | | | |
| | | |
Total | | $ | 231,841,325 | | | $ | 2,505,134,676 | | | $ | 18,450,588 | |
| | | | | | | | | | | | |
| | | |
Investment in Securities (continued) | | | | | | | | | | | | |
Liabilities | | | | | | | | | | | | |
Options Written | | $ | — | | | $ | (214,901 | ) | | $ | — | |
| | | | | | | | | | | | |
| | | |
Other Financial Instruments* | | | | | | | | | | | | |
Assets | | | | | | | | | | | | |
Unfunded Corporate Bond Commitment | | $ | — | | | $ | — | | | $ | —** | |
Unfunded Loan Commitment | | | — | | | | — | | | | 178 | |
Centrally Cleared Swaptions Purchased | | | — | | | | 1,695 | | | | — | |
Centrally Cleared Swaptions Written | | | — | | | | 50,293 | | | | — | |
Futures Contracts | | | 25,802,949 | | | | — | | | | — | |
OTC Forward Foreign Currency Exchange Contracts | | | — | | | | 5,621,335 | | | | — | |
OTC Packaged Credit Default Swap Agreements | | | — | | | | 3,571,787 | | | | — | |
OTC Credit Default Swap Agreements | | | — | | | | 921,161 | | | | 13,055 | |
Centrally Cleared Interest Rate Swap Agreements | | | — | | | | 978,785 | | | | — | |
OTC Total Return Swap Agreements | | | — | | | | 4,039,299 | | | | — | |
| | | | | | | | | | | | |
| | | |
Total | | $ | 25,802,949 | | | $ | 15,184,355 | | | $ | 13,233 | |
| | | | | | | | | | | | |
| | | |
Liabilities | | | | | | | | | | | | |
Forward Commitment Contracts | | $ | — | | | $ | (53,296,760 | ) | | $ | — | |
OTC Forward Foreign Currency Exchange Contracts | | | — | | | | (3,868,265 | ) | | | — | |
OTC Packaged Credit Default Swap Agreements | | | — | | | | (3,694,566 | ) | | | — | |
Centrally Cleared Credit Default Swap Agreement | | | — | | | | (76,808 | ) | | | — | |
OTC Credit Default Swap Agreements | | | — | | | | (8,430,679 | ) | | | — | |
OTC Currency Swap Agreement | | | — | | | | (113,652 | ) | | | — | |
Centrally Cleared Interest Rate Swap Agreements | | | — | | | | (1,204,260 | ) | | | — | |
| | | | | | | | | | | | |
| | | |
Total | | $ | — | | | $ | (70,684,990 | ) | | $ | — | |
| | | | | | | | | | | | |
| * | Other financial instruments are derivative instruments, with the exception of unfunded corporate bond commitments, unfunded loan commitments and forward commitment contracts, and are not reflected in the Schedule of Investments. Centrally cleared swaptions, futures, forwards, centrally cleared swap contracts, unfunded corporate bond commitments and unfunded loan commitments are recorded at unrealized appreciation (depreciation) and OTC swap contracts are recorded at fair value. Forward commitment contracts are recorded at market value. |
| ** | Includes Level 3 investments with an aggregate value of $0. |
See Notes to Financial Statements.
PGIM Absolute Return Bond Fund 61
Schedule of Investments (continued)
as of October 31, 2024
The following is a reconciliation of assets in which unobservable inputs (Level 3) were used in determining fair value:
| | | | | | | | | | | | | | | | | | | | | | | | | | | | | | | | |
| | | Asset-Backed
Securities-
Collateralized
Loan
Obligations | | | Asset-Backed
Securities-
Residential
Mortgage-Backed
Securities | | Corporate
Bonds | | | Floating Rate
and
Other Loans | | | Residential
Mortgage-
Backed
Securities | | | Common
Stocks | |
Balance as of 10/31/23 | | $ | 10,000,000 | | | | | | | $ | 4,219,918 | | | | | | | $ | 866,894 | | | $ | 3,048,360 | | | $ | — | | | $ | 1,236,818 | |
Realized gain (loss) | | | — | | | | | | | | (38,203 | ) | | | | | | | 4,931 | | | | (5,434 | ) | | | — | | | | — | |
Change in unrealized appreciation (depreciation) | | | 104,101 | | | | | | | | (74,038 | ) | | | | | | | 102,477 | | | | 162,665 | | | | 927 | | | | 2,141,640 | |
Purchases/Exchanges/Issuances | | | — | | | | | | | | — | | | | | | | | 1,217,887 | | | | 3,477,746 | | | | 1,150,001 | | | | 930,269 | |
Sales/Paydowns | | | — | | | | | | | | (792,877 | ) | | | | | | | (6,347 | ) | | | (386,776 | ) | | | (119,746 | ) | | | (502,595 | ) |
Accrued discount/premium | | | — | | | | | | | | — | | | | | | | | 300 | | | | 4,236 | | | | — | | | | — | |
Transfers into Level 3* | | | — | | | | | | | | — | | | | | | | | — | | | | — | | | | — | | | | 1,116,821 | |
Transfers out of Level 3* | | | (10,104,101 | ) | | | | | | | — | | | | | | | | — | | | | (21,165 | ) | | | — | | | | — | |
| | | | | | | | | | | | | | | | | | | | | | | | | | | | | | | | |
| | | | | | | | |
Balance as of 10/31/24 | | $ | — | | | | | | | $ | 3,314,800 | | | | | | | $ | 2,186,142 | | | $ | 6,279,632 | | | $ | 1,031,182 | | | $ | 4,922,953 | |
| | | | | | | | | | | | | | | | | | | | | | | | | | | | | | | | |
| | | | | | | | |
Change in unrealized appreciation (depreciation) relating to securities still held at reporting period end | | $ | — | | | | | | | $ | (74,038 | ) | | | | | | $ | 102,477 | | | $ | 159,638 | | | $ | 927 | | | $ | 2,141,640 | |
| | | | | | | | | | | | | | | | | | | | | | | | | | | | | | | | |
| | | | | | | | | | | | | | | | | | | | | | | | | | | | | | | | | | | | | | | | | | | | | | | | | | | | | | |
| | | Preferred
Bonds | | | Rights | | | Warrants | | Option Written | | Unfunded
Corporate
Bond
Commitments | | | Unfunded
Loan
Commitments | | | OTC Credit
Default
Swap
Agreements | |
Balance as of 10/31/23 | | $ | — | | | $ | 21,125 | | | | | | | $ | — | | | | | | | $ | (60 | ) | | | | | | | | $ | — | | | | | | | | | | | $ | (1,473 | ) | | | | | | $ | 6,651 | |
Realized gain (loss) | | | 11,278 | | | | (19,643 | ) | | | | | | | — | | | | | | | | — | | | | | | | | | | — | | | | | | | | | | | | — | | | | | | | | 1,842 | |
Change in unrealized appreciation (depreciation) | | | 70,889 | | | | (21,117 | ) | | | | | | | (950 | ) | | | | | | | 60 | | | | | | | | | | — | | | | | | | | | | | | 1,651 | | | | | | | | 8,606 | |
Purchases/Exchanges/Issuances | | | 962,930 | | | | 19,643 | | | | | | | | 1,320 | | | | | | | | — | | | | | | | | | | — | | | | | | | | | | | | — | | | | | | | | — | |
Sales/Paydowns | | | (329,588 | ) | | | (8 | ) | | | | | | | — | | | | | | | | — | | | | | | | | | | — | | | | | | | | | | | | — | | | | | | | | (4,044 | ) |
Accrued discount/premium | | | — | | | | — | | | | | | | | — | | | | | | | | — | | | | | | | | | | — | | | | | | | | | | | | — | | | | | | | | — | |
Transfers into Level 3* | | | — | | | | — | | | | | | | | — | | | | | | | | — | | | | | | | | | | — | | | | | | | | | | | | — | | | | | | | | — | |
Transfers out of Level 3* | | | — | | | | — | | | | | | | | — | | | | | | | | — | | | | | | | | | | — | | | | | | | | | | | | — | | | | | | | | — | |
| | | | | | | | | | | | | | | | | | | | | | | | | | | | | | | | | | | | | | | | | | | | | | | | | | | | | | |
| | | | | | | | | | | | | | | |
Balance as of 10/31/24 | | $ | 715,509 | | | $ | — | | | | | | | $ | 370 | | | | | | | $ | — | | | | | | | | | $ | — | | | | | | | | | | | $ | 178 | | | | | | | $ | 13,055 | |
| | | | | | | | | | | | | | | | | | | | | | | | | | | | | | | | | | | | | | | | | | | | | | | | | | | | | | |
| | | | | | | | | | | | | | | |
Change in unrealized appreciation (depreciation) relating to securities still held at reporting period end | | $ | 70,889 | | | $ | — | | | | | | | $ | (950 | ) | | | | | | $ | — | | | | | | | | | $ | — | | | | | | | | | | | $ | 178 | | | | | | | $ | 13,055 | |
| | | | | | | | | | | | | | | | | | | | | | | | | | | | | | | | | | | | | | | | | | | | | | | | | | | | | | |
| * | It is the Fund’s policy to recognize transfers in and transfers out at the securities’ fair values as of the beginning of period. Securities transferred between Level 2 and Level 3 are due to changes in the method utilized in valuing the investments. Transfers from Level 2 to Level 3 are typically a result of a change from the use of methods used by independent pricing services (Level 2) to the use of a single broker quote or valuation technique which utilizes significant unobservable inputs due to an absence of current or reliable market quotations (Level 3). Transfers from |
See Notes to Financial Statements.
62
| | Level 3 to Level 2 are a result of the availability of current and reliable market data provided by independent pricing services or other valuation techniques which utilize observable inputs. In accordance with the requirements of ASC 820, the amounts of transfers into and out of Level 3, if material, are disclosed in the Notes to the Schedule of Investments of the Fund. |
Level 3 securities as presented in the table above are being fair valued using pricing methodologies approved by the Board, which contain unobservable inputs as follows:
| | | | | | | | | | | | | |
Level 3 Securities** | | Fair Value as
of
October 31,
2024 | | Valuation Approach | | Valuation Methodology | | Unobservable Inputs | | Inputs (Range) |
Asset-Backed Securities-Residential Mortgage-Backed Securities | | | $ | 3,314,800 | | | Market | | Yield and Spread | | Adjusted Spread | | 400 bps |
Corporate Bonds | | | | 11,202 | | | Market | | Recovery Value | | Recovery Rate | | 0.68% - 100.00% |
Corporate Bonds | | | | 346,081 | | | Market | | Transaction Based | | Unadjusted Price | | NA |
Floating Rate and Other Loans | | | | 2,767,929 | | | Market | | Comparable Bond | | Yield Curve Spread Discount | | 350 bps |
Common Stocks | | | | 1,161,492 | | | Market | | Adjusted Trade Price | | Premium Rate | | 20% |
Common Stocks | | | | 371,018 | | | Market | | Enterprise Value | | EBITDA Multiple | | 4.0x |
Preferred Stocks | | | | 170,509 | | | Market | | Enterprise Value | | Recovery Rate | | 10.90% |
Preferred Stocks | | | | 545,000 | | | Market | | Transaction Based | | Unadjusted Price | | NA |
| | | | | | | | | | | | | |
| | | | | |
| | | $ | 8,688,031 | | | | | | | | | |
| | | | | | | | | | | | | |
| ** | The table does not include Level 3 securities and/or derivatives that are valued by independent pricing vendors or brokers. As of October 31, 2024, the aggregate value of these securities and/or derivatives was $9,775,790. The unobservable inputs for these investments were not developed by the Fund and are not readily available (e.g. single broker quotes). |
Industry Classification:
The industry classification of investments and liabilities in excess of other assets shown as a percentage of net assets as of October 31, 2024 were as follows:
| | | | |
U.S. Treasury Obligations | | | 23.8 | % |
Collateralized Loan Obligations | | | 21.1 | |
U.S. Government Agency Obligations | | | 8.4 | |
Affiliated Exchange-Traded Funds | | | 5.3 | |
Commercial Mortgage-Backed Securities | | | 4.9 | |
Banks | | | 4.5 | |
Sovereign Bonds | | | 4.1 | |
| | | | |
Residential Mortgage-Backed Securities | | | 4.0 | % |
Affiliated Mutual Funds (0.4% represents investments purchased with collateral from securities on loan) | | | 3.2 | |
Oil & Gas | | | 2.1 | |
Electric | | | 1.7 | |
Telecommunications | | | 1.5 | |
Foods | | | 1.3 | |
See Notes to Financial Statements.
PGIM Absolute Return Bond Fund 63
Schedule of Investments (continued)
as of October 31, 2024
Industry Classification (continued):
| | | | |
Chemicals | | | 1.2 | % |
Pipelines | | | 1.2 | |
Retail | | | 1.1 | |
Automobiles | | | 1.0 | |
Media | | | 0.8 | |
Aerospace & Defense | | | 0.7 | |
Diversified Financial Services | | | 0.5 | |
Engineering & Construction | | | 0.5 | |
Home Equity Loans | | | 0.5 | |
Real Estate Investment Trusts (REITs) | | | 0.4 | |
Computers | | | 0.4 | |
Auto Manufacturers | | | 0.4 | |
Consumer Loans | | | 0.4 | |
Leisure Time | | | 0.4 | |
Healthcare-Services | | | 0.4 | |
Entertainment | | | 0.4 | |
Commercial Services | | | 0.3 | |
Other | | | 0.3 | |
Lodging | | | 0.3 | |
Home Builders | | | 0.3 | |
Pharmaceuticals | | | 0.3 | |
Building Materials | | | 0.3 | |
Municipal Bonds | | | 0.3 | |
Mining | | | 0.3 | |
Auto Parts & Equipment | | | 0.2 | |
Transportation | | | 0.2 | |
Semiconductors | | | 0.2 | |
Agriculture | | | 0.2 | |
Trucking & Leasing | | | 0.2 | |
Office/Business Equipment | | | 0.2 | |
Packaging & Containers | | | 0.2 | |
Gas | | | 0.2 | |
Metal Fabricate/Hardware | | | 0.2 | |
| | | | |
Machinery-Diversified | | | 0.1 | % |
Forest Products & Paper | | | 0.1 | |
Insurance | | | 0.1 | |
Airlines | | | 0.1 | |
Internet | | | 0.1 | |
Iron/Steel | | | 0.1 | |
Student Loans | | | 0.1 | |
Cosmetics/Personal Care | | | 0.1 | |
Multi-National | | | 0.1 | |
Healthcare-Products | | | 0.1 | |
Equipment | | | 0.1 | |
Real Estate | | | 0.1 | |
Distribution/Wholesale | | | 0.1 | |
Gas Utilities | | | 0.0 | * |
Wireless Telecommunication Services | | | 0.0 | * |
Oil, Gas & Consumable Fuels | | | 0.0 | * |
Coal | | | 0.0 | * |
Housewares | | | 0.0 | * |
Apparel | | | 0.0 | * |
Electronic Equipment, Instruments & Components | | | 0.0 | * |
Environmental Control | | | 0.0 | * |
Options Purchased | | | 0.0 | * |
Oil & Gas Services | | | 0.0 | * |
| | | | |
| |
| | | 101.7 | |
Options Written | | | (0.0 | )* |
Liabilities in excess of other assets | | | (1.7 | ) |
| | | | |
| |
| | | 100.0 | % |
| | | | |
Effects of Derivative Instruments on the Financial Statements and Primary Underlying Risk Exposure:
The Fund invested in derivative instruments during the reporting period. The primary types of risk associated with these derivative instruments are credit risk, foreign exchange risk and interest rate risk. See the Notes to Financial Statements for additional detail regarding these derivative instruments and their risks. The effect of such derivative instruments on the Fund’s financial position and financial performance as reflected in the Statement of Assets and Liabilities and Statement of Operations is presented in the summary below.
Fair values of derivative instruments as of October 31, 2024 as presented in the Statement of Assets and Liabilities:
See Notes to Financial Statements.
64
| | | | | | | | | | | | |
| | | Asset Derivatives | | | Liability Derivatives | |
Derivatives not accounted for as hedging instruments, carried at fair value | | Statement of Assets and Liabilities Location | | Fair
Value | | | Statement of Assets and Liabilities Location | | Fair
Value | |
| | | | |
Credit contracts | | Due from/to broker-variation margin swaps and swaptions | | $ | 51,988* | | | Due from/to broker-variation margin swaps and swaptions | | $ | 76,808* | |
Credit contracts | | Premiums paid for OTC swap agreements | | | 1,096,858 | | | Premiums received for OTC swap agreements | | | 7,186,165 | |
Credit contracts | | — | | | — | | | Options written outstanding, at value | | | 53,396 | |
Credit contracts | | Unrealized appreciation on OTC swap agreements | | | 3,730,694 | | | Unrealized depreciation on OTC swap agreements | | | 5,260,629 | |
Foreign exchange contracts | | Unaffiliated investments | | | 869 | | | Options written outstanding, at value | | | 95,885 | |
Foreign exchange contracts | | Unrealized appreciation on OTC forward foreign currency exchange contracts | | | 5,621,335 | | | Unrealized depreciation on OTC forward foreign currency exchange contracts | | | 3,868,265 | |
Interest rate contracts | | Due from/to broker-variation margin futures | | | 25,802,949 | * | | — | | | — | |
Interest rate contracts | | Due from/to broker-variation margin swaps and swaptions | | | 978,785 | * | | Due from/to broker-variation margin swaps and swaptions | | | 1,204,260 | * |
Interest rate contracts | | Unaffiliated investments | | | 103,855 | | | Options written outstanding, at value | | | 65,620 | |
Interest rate contracts | | Unrealized appreciation on OTC swap agreements | | | 4,039,299 | | | Unrealized depreciation on OTC swap agreements | | | 113,652 | |
| | | | | | | | | | | | |
| | | | |
| | | | $ | 41,426,632 | | | | | $ | 17,924,680 | |
| | | | | | | | | | | | |
| * | Includes cumulative appreciation (depreciation) as reported in the schedule of open futures, centrally cleared swap contracts, and centrally cleared swaptions. Only unsettled variation margin receivable (payable) is reported within the Statement of Assets and Liabilities. |
The effects of derivative instruments on the Statement of Operations for the year ended October 31, 2024 are as follows:
| | | | | | | | | | | | | | | | | | | | | | | | | | | | |
Amount of Realized Gain (Loss) on Derivatives Recognized in Income | |
| | | | | |
Derivatives not accounted for as hedging instruments, carried at fair value | | Options Purchased(1) | | | Options
Written | | | Futures | | | Forward
& Cross
Currency
Exchange
Contracts | | | Swaps | |
| | | | | | | |
Credit contracts | | | | | | $ | (118,360 | ) | | | | | | $ | 332,186 | | | $ | — | | | $ | — | | | $ | 9,038,080 | |
Foreign exchange contracts | | | | | | | — | | | | | | | | — | | | | — | | | | (5,645,302 | ) | | | — | |
Interest rate contracts | | | | | | | — | | | | | | | | — | | | | (24,499,322 | ) | | | — | | | | (6,039,424 | ) |
| | | | | | | | | | | | | | | | | | | | | | | | | | | | |
| | | | | | | |
Total | | | | | | $ | (118,360 | ) | | | | | | $ | 332,186 | | | $ | (24,499,322 | ) | | $ | (5,645,302 | ) | | $ | 2,998,656 | |
| | | | | | | | | | | | | | | | | | | | | | | | | | | | |
See Notes to Financial Statements.
PGIM Absolute Return Bond Fund 65
Schedule of Investments (continued)
as of October 31, 2024
| (1) | Included in net realized gain (loss) on investment transactions in the Statement of Operations. |
| | | | | | | | | | | | | | | | | | | | | | | | | | | | |
Change in Unrealized Appreciation (Depreciation) on Derivatives Recognized in Income | |
| | | | | |
Derivatives not accounted for as hedging instruments, carried at fair value | | Options Purchased(2) | | | Options
Written | | | Futures | | | Forward
& Cross
Currency
Exchange
Contracts | | | Swaps | |
| | | | | | | |
Credit contracts | | | | | | $ | 1,695 | | | | | | | $ | 361,822 | | | $ | — | | | $ | — | | | $ | (1,238,537 | ) |
Foreign exchange contracts | | | | | | | 145 | | | | | | | | 12,410 | | | | — | | | | 1,354,657 | | | | — | |
Interest rate contracts | | | | | | | 49,507 | | | | | | | | (51,243 | ) | | | 10,558,617 | | | | — | | | | (2,287,720 | ) |
| | | | | | | | | | | | | | | | | | | | | | | | | | | | |
| | | | | | | |
Total | | | | | | $ | 51,347 | | | | | | | $ | 322,989 | | | $ | 10,558,617 | | | $ | 1,354,657 | | | $ | (3,526,257 | ) |
| | | | | | | | | | | | | | | | | | | | | | | | | | | | |
| (2) | Included in net change in unrealized appreciation (depreciation) on investments in the Statement of Operations. |
For the year ended October 31, 2024, the Fund’s average volume of derivative activities is as follows:
| | | | |
| Derivative Contract Type | | Average Volume of Derivative Activities* |
Options Purchased (1) | | | $ 69,692 | |
Options Written (2) | | | 214,392,400 | |
Futures Contracts - Long Positions (2) | | | 188,108,274 | |
Futures Contracts - Short Positions (2) | | | 932,486,073 | |
Forward Foreign Currency Exchange Contracts - Purchased (3) | | | 169,202,596 | |
Forward Foreign Currency Exchange Contracts - Sold (3) | | | 451,602,849 | |
Cross Currency Exchange Contracts (4) | | | 317,770 | |
Interest Rate Swap Agreements (2) | | | 469,017,897 | |
Credit Default Swap Agreements - Buy Protection (2) | | | 122,864,540 | |
Credit Default Swap Agreements - Sell Protection (2) | | | 185,674,978 | |
Currency Swap Agreements (2) | | | 3,600,000 | |
Total Return Swap Agreements (2) | | | 64,435,600 | |
| * | Average volume is based on average quarter end balances for the year ended October 31, 2024. |
| (2) | Notional Amount in USD. |
| (3) | Value at Settlement Date. |
Financial Instruments/Transactions—Summary of Offsetting and Netting Arrangements:
The Fund invested in OTC derivatives and entered into financial instruments/transactions during the reporting period that are either offset in accordance with current requirements or are subject to enforceable master netting arrangements or similar agreements that permit offsetting. The information about offsetting and related netting arrangements for OTC derivatives and financial instruments/transactions where the legal right to set-off exists is presented in the summary below.
See Notes to Financial Statements.
66
Offsetting of financial instrument/transaction assets and liabilities:
| | | | | | |
| Description | | Gross Market Value of Recognized Assets/(Liabilities) | | Collateral Pledged/(Received)(2) | | Net Amount |
Securities on Loan | | $10,119,362 | | $(10,119,362) | | $— |
Offsetting of OTC derivative assets and liabilities:
| | | | | | | | | | | | | | | | | | | | | | | | | | | | | | | | | | | | | | | | | | | | | | | | | | | | | | | | | | | | |
Counterparty | | Gross Amounts of Recognized Assets(1) | | | Gross Amounts of Recognized Liabilities(1) | | | Net Amounts of
Recognized Assets/(Liabilities) | | | Collateral
Pledged/(Received)(2) | | | Net Amount | |
| | | | | | | | | | | | | | | |
BARC | | | | | | $ | 5,125,923 | | | | | | | | | | | $ | (4,367,693 | ) | | | | | | | | | | $ | 758,230 | | | | | | | | | | | $ | (758,230 | ) | | | | | | | | | | $ | — | | | | | |
BNP | | | | | | | 88,157 | | | | | | | | | | | | (67,421 | ) | | | | | | | | | | | 20,736 | | | | | | | | | | | | — | | | | | | | | | | | | 20,736 | | | | | |
BNYM | | | | | | | 215,107 | | | | | | | | | | | | (216,087 | ) | | | | | | | | | | | (980 | ) | | | | | | | | | | | — | | | | | | | | | | | | (980 | ) | | | | |
BOA | | | | | | | 372,968 | | | | | | | | | | | | (131,909 | ) | | | | | | | | | | | 241,059 | | | | | | | | | | | | (241,059 | ) | | | | | | | | | | | — | | | | | |
CITI | | | | | | | 601,376 | | | | | | | | | | | | (934,767 | ) | | | | | | | | | | | (333,391 | ) | | | | | | | | | | | — | | | | | | | | | | | | (333,391 | ) | | | | |
DB | | | | | | | 154,688 | | | | | | | | | | | | (242,501 | ) | | | | | | | | | | | (87,813 | ) | | | | | | | | | | | — | | | | | | | | | | | | (87,813 | ) | | | | |
GSI | | | | | | | 1,529,304 | | | | | | | | | | | | (8,867,741 | ) | | | | | | | | | | | (7,338,437 | ) | | | | | | | | | | | 7,338,437 | | | | | | | | | | | | — | | | | | |
HSBC | | | | | | | 812,411 | | | | | | | | | | | | (853,453 | ) | | | | | | | | | | | (41,042 | ) | | | | | | | | | | | 41,042 | | | | | | | | | | | | — | | | | | |
JPM | | | | | | | 4,089,911 | | | | | | | | | | | | (522,161 | ) | | | | | | | | | | | 3,567,750 | | | | | | | | | | | | (3,567,750 | ) | | | | | | | | | | | — | | | | | |
MSI | | | | | | | 283,377 | | | | | | | | | | | | (310,176 | ) | | | | | | | | | | | (26,799 | ) | | | | | | | | | | | — | | | | | | | | | | | | (26,799 | ) | | | | |
SCB | | | | | | | 86,118 | | | | | | | | | | | | (90,438 | ) | | | | | | | | | | | (4,320 | ) | | | | | | | | | | | — | | | | | | | | | | | | (4,320 | ) | | | | |
SSB | | | | | | | 943,706 | | | | | | | | | | | | (39,265 | ) | | | | | | | | | | | 904,441 | | | | | | | | | | | | (904,441 | ) | | | | | | | | | | | — | | | | | |
TD | | | | | | | 214,981 | | | | | | | | | | | | — | | | | | | | | | | | | 214,981 | | | | | | | | | | | | — | | | | | | | | | | | | 214,981 | | | | | |
UAG | | | | | | | 74,883 | | | | | | | | | | | | — | | | | | | | | | | | | 74,883 | | | | | | | | | | | | — | | | | | | | | | | | | 74,883 | | | | | |
| | | | | | | | | | | | | | | | | | | | | | | | | | | | | | | | | | | | | | | | | | | | | | | | | | | | | | | | | | | | |
| | | | | | | | | | | | | | | |
| | | | | | $ | 14,592,910 | | | | | | | | | | | $ | (16,643,612 | ) | | | | | | | | | | $ | (2,050,702 | ) | | | | | | | | | | $ | 1,907,999 | | | | | | | | | | | $ | (142,703 | ) | | | | |
| | | | | | | | | | | | | | | | | | | | | | | | | | | | | | | | | | | | | | | | | | | | | | | | | | | | | | | | | | | | |
| (1) | Includes unrealized appreciation/(depreciation) on swaps and forwards, premiums paid/(received) on swap agreements and market value of purchased and written options, as represented on the Statement of Assets and Liabilities. |
| (2) | Collateral amount disclosed by the Fund is limited to the market value of financial instruments/transactions and the Fund’s OTC derivative exposure by counterparty. |
See Notes to Financial Statements.
PGIM Absolute Return Bond Fund 67
Statement of Assets and Liabilities
as of October 31, 2024
| | | | |
Assets | | | | |
| |
Investments at value, including securities on loan of $10,119,362: | | | | |
Unaffiliated investments (cost $2,529,428,498) | | $ | 2,524,650,194 | |
Affiliated investments (cost $230,486,116) | | | 230,776,395 | |
Foreign currency, at value (cost $5,210,629) | | | 5,219,394 | |
Receivable for investments sold | | | 84,100,296 | |
Dividends and interest receivable | | | 21,768,068 | |
Receivable for Fund shares sold | | | 11,370,863 | |
Unrealized appreciation on OTC swap agreements | | | 7,769,993 | |
Unrealized appreciation on OTC forward foreign currency exchange contracts | | | 5,621,335 | |
Due from broker—variation margin futures | | | 1,200,626 | |
Premiums paid for OTC swap agreements | | | 1,096,858 | |
Unrealized appreciation on unfunded loan commitment | | | 178 | |
Prepaid expenses | | | 20,455 | |
| | | | |
| |
Total Assets | | | 2,893,594,655 | |
| | | | |
| |
Liabilities | | | | |
| |
Payable for investments purchased | | | 92,040,403 | |
Forward commitment contracts, at value (proceeds receivable $53,785,478) | | | 53,296,760 | |
Payable for Fund shares purchased | | | 10,710,703 | |
Payable to broker for collateral for securities on loan | | | 10,324,002 | |
Premiums received for OTC swap agreements | | | 7,186,165 | |
Unrealized depreciation on OTC swap agreements | | | 5,374,281 | |
Unrealized depreciation on OTC forward foreign currency exchange contracts | | | 3,868,265 | |
Management fee payable | | | 1,303,729 | |
Dividends payable | | | 640,577 | |
Accrued expenses and other liabilities | | | 588,271 | |
Options written outstanding, at value (premiums received $487,537) | | | 214,901 | |
Distribution fee payable | | | 66,087 | |
Due to broker—variation margin swaps and swaptions | | | 14,137 | |
Trustees’ fees payable | | | 3,800 | |
Affiliated transfer agent fee payable | | | 2,862 | |
| | | | |
| |
Total Liabilities | | | 185,634,943 | |
| | | | |
| |
Net Assets | | $ | 2,707,959,712 | |
| | | | |
| |
| | | | |
| |
Net assets were comprised of: | | | | |
Shares of beneficial interest, at par | | $ | 296,034 | |
Paid-in capital in excess of par | | | 2,948,499,358 | |
Total distributable earnings (loss) | | | (240,835,680 | ) |
| | | | |
| |
Net assets, October 31, 2024 | | $ | 2,707,959,712 | |
| | | | |
See Notes to Financial Statements.
68
| | | | | | |
Class A | | | | | | |
| | |
Net asset value and redemption price per share, | | | | | | |
($155,239,908 ÷ 17,038,312 shares of beneficial interest issued and outstanding) | | $ | 9.11 | | | |
Maximum sales charge (3.25% of offering price) | | | 0.31 | | | |
| | | | | | |
| | |
Maximum offering price to public | | $ | 9.42 | | | |
| | | | | | |
| | |
Class C | | | | | | |
| | |
Net asset value, offering price and redemption price per share, | | | | | | |
($41,463,067 ÷ 4,536,812 shares of beneficial interest issued and outstanding) | | $ | 9.14 | | | |
| | | | | | |
| | |
Class Z | | | | | | |
| | |
Net asset value, offering price and redemption price per share, | | | | | | |
($2,384,670,470 ÷ 260,556,685 shares of beneficial interest issued and outstanding) | | $ | 9.15 | | | |
| | | | | | |
| | |
Class R6 | | | | | | |
| | |
Net asset value, offering price and redemption price per share, | | | | | | |
($126,586,267 ÷ 13,902,146 shares of beneficial interest issued and outstanding) | | $ | 9.11 | | | |
| | | | | | |
See Notes to Financial Statements.
PGIM Absolute Return Bond Fund 69
Statement of Operations
Year Ended October 31, 2024
| | | | |
Net Investment Income (Loss) | | | | |
| |
Income | | | | |
Interest income (net of $195 foreign withholding tax) | | $ | 112,960,822 | |
Affiliated dividend income | | | 10,487,236 | |
Unaffiliated dividend income | | | 2,031,081 | |
Income from securities lending, net (including affiliated income of $80,120) | | | 80,316 | |
| | | | |
Total income | | | 125,559,455 | |
| | | | |
| |
Expenses | | | | |
Management fee | | | 12,071,373 | |
Distribution fee(a) | | | 634,551 | |
Transfer agent’s fees and expenses (including affiliated expense of $17,806)(a) | | | 2,098,356 | |
Registration fees(a) | | | 196,287 | |
Custodian and accounting fees | | | 123,821 | |
Shareholders’ reports | | | 103,626 | |
Audit fee | | | 72,345 | |
Professional fees | | | 51,764 | |
Trustees’ fees | | | 36,336 | |
Miscellaneous | | | 49,074 | |
| | | | |
| |
Total expenses | | | 15,437,533 | |
Less: Fee waiver and/or expense reimbursement(a) | | | (50,281 | ) |
| | | | |
| |
Net expenses | | | 15,387,252 | |
| | | | |
| |
Net investment income (loss) | | | 110,172,203 | |
| | | | |
| |
Realized And Unrealized Gain (Loss) On Investment And Foreign Currency Transactions | | | | |
| |
Net realized gain (loss) on: | | | | |
Investment transactions (including affiliated of $177,343) | | | (12,280,964 | ) |
Futures transactions | | | (24,499,322 | ) |
Forward and cross currency contract transactions | | | (5,645,302 | ) |
Options written transactions | | | 332,186 | |
Swap agreement transactions | | | 2,998,656 | |
Foreign currency transactions | | | (1,920,148 | ) |
| | | | |
| | | (41,014,894 | ) |
| | | | |
Net change in unrealized appreciation (depreciation) on: | | | | |
Investments (including affiliated of $14,931) | | | 85,879,718 | |
Futures | | | 10,558,617 | |
Forward and cross currency contracts | | | 1,354,657 | |
Options written | | | 322,989 | |
Swap agreements | | | (3,526,257 | ) |
Foreign currencies | | | (640,948 | ) |
Unfunded loan commitment | | | 1,651 | |
| | | | |
| |
| | | 93,950,427 | |
| | | | |
| |
Net gain (loss) on investment and foreign currency transactions | | | 52,935,533 | |
| | | | |
| |
Net Increase (Decrease) In Net Assets Resulting From Operations | | $ | 163,107,736 | |
| | | | |
See Notes to Financial Statements.
70
| (a) | Class specific expenses and waivers were as follows: |
| | | | | | | | | | | | | | | | |
| | | Class A | | Class C | | | Class Z | | | Class R6 |
Distribution fee | | | 313,607 | | | | 320,944 | | | | — | | | | — | |
Transfer agent’s fees and expenses | | | 90,421 | | | | 28,492 | | | | 1,975,098 | | | | 4,345 | |
Registration fees | | | 28,091 | | | | 19,329 | | | | 120,359 | | | | 28,508 | |
Fee waiver and/or expense reimbursement | | | (2,833 | ) | | | (745 | ) | | | (44,361 | ) | | | (2,342 | ) |
See Notes to Financial Statements.
PGIM Absolute Return Bond Fund 71
Statements of Changes in Net Assets
| | | | | | | | |
| |
| | | Year Ended
October 31, | |
| | |
| | | 2024 | | | 2023 | |
| | |
Increase (Decrease) in Net Assets | | | | | | | | |
| | |
Operations | | | | | | | | |
Net investment income (loss) | | $ | 110,172,203 | | | $ | 58,108,808 | |
Net realized gain (loss) on investment and foreign currency transactions | | | (41,014,894 | ) | | | (17,861,388 | ) |
Net change in unrealized appreciation (depreciation) on investments and foreign currencies | | | 93,950,427 | | | | 34,623,481 | |
| | | | | | | | |
| | |
Net increase (decrease) in net assets resulting from operations | | | 163,107,736 | | | | 74,870,901 | |
| | | | | | | | |
| | |
Dividends and Distributions | | | | | | | | |
Distributions from distributable earnings | | | | | | | | |
Class A | | | (6,969,111 | ) | | | (5,217,195 | ) |
Class C | | | (1,518,338 | ) | | | (1,238,587 | ) |
Class Z | | | (103,063,732 | ) | | | (55,015,744 | ) |
Class R6 | | | (5,379,331 | ) | | | (3,332,132 | ) |
| | | | | | | | |
| | |
| | | (116,930,512 | ) | | | (64,803,658 | ) |
| | | | | | | | |
Tax return of capital distributions | | | | | | | | |
Class A | | | — | | | | (191,271 | ) |
Class C | | | — | | | | (45,409 | ) |
Class Z | | | — | | | | (2,016,965 | ) |
Class R6 | | | — | | | | (122,161 | ) |
| | | | | | | | |
| | |
| | | — | | | | (2,375,806 | ) |
| | | | | | | | |
| | |
Fund share transactions (Net of share conversions) | | | | | | | | |
Net proceeds from shares sold | | | 2,126,031,131 | | | | 963,435,107 | |
Net asset value of shares issued in reinvestment of dividends and distributions | | | 109,659,594 | | | | 60,324,388 | |
Cost of shares purchased | | | (885,479,718 | ) | | | (1,016,865,561 | ) |
| | | | | | | | |
| | |
Net increase (decrease) in net assets from Fund share transactions | | | 1,350,211,007 | | | | 6,893,934 | |
| | | | | | | | |
Total increase (decrease) | | | 1,396,388,231 | | | | 14,585,371 | |
| | |
Net Assets: | | | | | | | | |
| | |
Beginning of year | | | 1,311,571,481 | | | | 1,296,986,110 | |
| | | | | | | | |
| | |
End of year | | $ | 2,707,959,712 | | | $ | 1,311,571,481 | |
| | | | | | | | |
See Notes to Financial Statements.
72
Financial Highlights
| | | | | | | | | | | | | | | | | | | | |
| | | | | | |
Class A Shares | | | | | | | | | | | | | | | | | | | | |
| | | Year Ended October 31, | |
| | | | | | |
| | | 2024 | | | 2023 | | | 2022 | | | 2021 | | | 2020 | |
| | | | | | |
Per Share Operating Performance(a): | | | | | | | | | | | | | | | | | | | | |
Net Asset Value, Beginning of Year | | | $8.87 | | | | $8.79 | | | | $9.22 | | | | $8.94 | | | | $9.73 | |
Income (loss) from investment operations: | | | | | | | | | | | | | | | | | | | | |
Net investment income (loss) | | | 0.47 | | | | 0.41 | | | | 0.22 | | | | 0.21 | | | | 0.30 | |
Net realized and unrealized gain (loss) on investment and foreign currency transactions | | | 0.28 | | | | 0.14 | | | | (0.43 | ) | | | 0.30 | | | | (0.49 | ) |
Total from investment operations | | | 0.75 | | | | 0.55 | | | | (0.21 | ) | | | 0.51 | | | | (0.19 | ) |
Less Dividends and Distributions: | | | | | | | | | | | | | | | | | | | | |
Dividends from net investment income | | | (0.51 | ) | | | (0.45 | ) | | | (0.22 | ) | | | (0.22 | ) | | | (0.26 | ) |
Tax return of capital distributions | | | - | | | | (0.02 | ) | | | - | | | | (0.01 | ) | | | (0.04 | ) |
Distributions from net realized gains | | | - | | | | - | | | | - | | | | - | | | | (0.30 | ) |
Total dividends and distributions | | | (0.51 | ) | | | (0.47 | ) | | | (0.22 | ) | | | (0.23 | ) | | | (0.60 | ) |
Net asset value, end of year | | | $9.11 | | | | $8.87 | | | | $8.79 | | | | $9.22 | | | | $8.94 | |
Total Return(b): | | | 8.60 | % | | | 6.45 | % | | | (2.30 | )% | | | 5.71 | % | | | (1.96 | )% |
| | | | | | | | | | | | | | | | | | | | | |
Ratios/Supplemental Data: | | | | | | | | | | | | | | | | | | | | |
Net assets, end of year (000) | | | $155,240 | | | | $106,045 | | | | $94,351 | | | | $109,630 | | | | $93,597 | |
Average net assets (000) | | | $125,443 | | | | $100,819 | | | | $97,005 | | | | $98,531 | | | | $114,656 | |
Ratios to average net assets(c): | | | | | | | | | | | | | | | | | | | | |
Expenses after waivers and/or expense reimbursement | | | 0.95 | % | | | 0.98 | % | | | 0.98 | % | | | 0.97 | % | | | 0.97 | % |
Expenses before waivers and/or expense reimbursement | | | 0.95 | % | | | 0.98 | % | | | 0.98 | % | | | 0.97 | % | | | 0.97 | % |
Net investment income (loss) | | | 5.21 | % | | | 4.64 | % | | | 2.46 | % | | | 2.32 | % | | | 3.27 | % |
Portfolio turnover rate(d)(e) | | | 77 | % | | | 156 | % | | | 30 | % | | | 48 | % | | | 20 | % |
| (a) | Calculated based on average shares outstanding during the year. |
| (b) | Total return does not consider the effects of sales loads. Total return is calculated assuming a purchase of a share on the first day and a sale on the last day of each year reported and includes reinvestment of dividends and distributions, if any. Total returns may reflect adjustments to conform to GAAP. |
| (c) | Does not include expenses of the underlying funds in which the Fund invests. |
| (d) | The Fund accounts for mortgage dollar roll transactions, when applicable, as purchases and sales which, as a result, can increase its portfolio turnover rate. |
| (e) | The Fund’s portfolio turnover rate is calculated in accordance with regulatory requirements, without regard to transactions involving short-term investments, certain derivatives and in-kind transactions (if any). If such transactions were included, the Fund’s portfolio turnover rate may be higher. |
See Notes to Financial Statements.
PGIM Absolute Return Bond Fund 73
Financial Highlights (continued)
| | | | | | | | | | | | | | | | | | | | |
| | | | | | |
Class C Shares | | | | | | | | | | | | | | | | | | | | |
| | | Year Ended October 31, | |
| | | | | | |
| | | 2024 | | | 2023 | | | 2022 | | | 2021 | | | 2020 | |
| | | | | | |
Per Share Operating Performance(a): | | | | | | | | | | | | | | | | | | | | |
Net Asset Value, Beginning of Year | | | $8.89 | | | | $8.82 | | | | $9.25 | | | | $8.97 | | | | $9.76 | |
Income (loss) from investment operations: | | | | | | | | | | | | | | | | | | | | |
Net investment income (loss) | | | 0.40 | | | | 0.34 | | | | 0.15 | | | | 0.15 | | | | 0.23 | |
Net realized and unrealized gain (loss) on investment and foreign currency transactions | | | 0.28 | | | | 0.13 | | | | (0.43 | ) | | | 0.29 | | | | (0.48 | ) |
Total from investment operations | | | 0.68 | | | | 0.47 | | | | (0.28 | ) | | | 0.44 | | | | (0.25 | ) |
Less Dividends and Distributions: | | | | | | | | | | | | | | | | | | | | |
Dividends from net investment income | | | (0.43 | ) | | | (0.38 | ) | | | (0.15 | ) | | | (0.15 | ) | | | (0.20 | ) |
Tax return of capital distributions | | | - | | | | (0.02 | ) | | | - | | | | (0.01 | ) | | | (0.04 | ) |
Distributions from net realized gains | | | - | | | | - | | | | - | | | | - | | | | (0.30 | ) |
Total dividends and distributions | | | (0.43 | ) | | | (0.40 | ) | | | (0.15 | ) | | | (0.16 | ) | | | (0.54 | ) |
Net asset value, end of year | | | $9.14 | | | | $8.89 | | | | $8.82 | | | | $9.25 | | | | $8.97 | |
Total Return(b): | | | 7.85 | % | | | 5.49 | % | | | (3.04 | )% | | | 5.03 | % | | | (2.70 | )% |
| | | | | | | | | | | | | | | | | | | | |
Ratios/Supplemental Data: | | | | | | | | | | | | | | | | | | | | |
Net assets, end of year (000) | | | $41,463 | | | | $25,851 | | | | $31,871 | | | | $42,635 | | | | $66,396 | |
Average net assets (000) | | | $32,094 | | | | $28,227 | | | | $36,300 | | | | $52,974 | | | | $86,229 | |
Ratios to average net assets(c): | | | | | | | | | | | | | | | | | | | | |
Expenses after waivers and/or expense reimbursement | | | 1.76 | % | | | 1.78 | % | | | 1.75 | % | | | 1.73 | % | | | 1.73 | % |
Expenses before waivers and/or expense reimbursement | | | 1.76 | % | | | 1.78 | % | | | 1.75 | % | | | 1.73 | % | | | 1.73 | % |
Net investment income (loss) | | | 4.39 | % | | | 3.81 | % | | | 1.67 | % | | | 1.64 | % | | | 2.51 | % |
Portfolio turnover rate(d)(e) | | | 77 | % | | | 156 | % | | | 30 | % | | | 48 | % | | | 20 | % |
| (a) | Calculated based on average shares outstanding during the year. |
| (b) | Total return does not consider the effects of sales loads. Total return is calculated assuming a purchase of a share on the first day and a sale on the last day of each year reported and includes reinvestment of dividends and distributions, if any. Total returns may reflect adjustments to conform to GAAP. |
| (c) | Does not include expenses of the underlying funds in which the Fund invests. |
| (d) | The Fund accounts for mortgage dollar roll transactions, when applicable, as purchases and sales which, as a result, can increase its portfolio turnover rate. |
| (e) | The Fund’s portfolio turnover rate is calculated in accordance with regulatory requirements, without regard to transactions involving short-term investments, certain derivatives and in-kind transactions (if any). If such transactions were included, the Fund’s portfolio turnover rate may be higher. |
See Notes to Financial Statements.
74
| | | | | | | | | | | | | | | | | | | | |
| | | | | | |
Class Z Shares | | | | | | | | | | | | | | | | | | | | |
| | | Year Ended October 31, | |
| | | | | | |
| | | 2024 | | | 2023 | | | 2022 | | | 2021 | | | 2020 | |
| | | | | | |
Per Share Operating Performance(a): | | | | | | | | | | | | | | | | | | | | |
Net Asset Value, Beginning of Year | | | $8.91 | | | | $8.83 | | | | $9.26 | | | | $8.98 | | | | $9.77 | |
Income (loss) from investment operations: | | | | | | | | | | | | | | | | | | | | |
Net investment income (loss) | | | 0.49 | | | | 0.43 | | | | 0.25 | | | | 0.24 | | | | 0.32 | |
Net realized and unrealized gain (loss) on investment and foreign currency transactions | | | 0.28 | | | | 0.15 | | | | (0.44 | ) | | | 0.29 | | | | (0.48 | ) |
Total from investment operations | | | 0.77 | | | | 0.58 | | | | (0.19 | ) | | | 0.53 | | | | (0.16 | ) |
Less Dividends and Distributions: | | | | | | | | | | | | | | | | | | | | |
Dividends from net investment income | | | (0.53 | ) | | | (0.48 | ) | | | (0.24 | ) | | | (0.24 | ) | | | (0.29 | ) |
Tax return of capital distributions | | | - | | | | (0.02 | ) | | | - | | | | (0.01 | ) | | | (0.04 | ) |
Distributions from net realized gains | | | - | | | | - | | | | - | | | | - | | | | (0.30 | ) |
Total dividends and distributions | | | (0.53 | ) | | | (0.50 | ) | | | (0.24 | ) | | | (0.25 | ) | | | (0.63 | ) |
Net asset value, end of year | | | $9.15 | | | | $8.91 | | | | $8.83 | | | | $9.26 | | | | $8.98 | |
Total Return(b): | | | 8.84 | % | | | 6.71 | % | | | (2.03 | )% | | | 5.96 | % | | | (1.70 | )% |
| | | | | | | | | | | | | | | | | | | | |
Ratios/Supplemental Data: | | | | | | | | | | | | | | | | | | | | |
Net assets, end of year (000) | | | $2,384,670 | | | | $1,116,816 | | | | $1,108,186 | | | | $767,056 | | | | $1,071,124 | |
Average net assets (000) | | | $1,796,014 | | | | $1,020,990 | | | | $914,879 | | | | $833,908 | | | | $1,499,872 | |
Ratios to average net assets(c): | | | | | | | | | | | | | | | | | | | | |
Expenses after waivers and/or expense reimbursement | | | 0.73 | % | | | 0.73 | % | | | 0.72 | % | | | 0.73 | % | | | 0.73 | % |
Expenses before waivers and/or expense reimbursement | | | 0.73 | % | | | 0.74 | % | | | 0.72 | % | | | 0.73 | % | | | 0.74 | % |
Net investment income (loss) | | | 5.41 | % | | | 4.83 | % | | | 2.81 | % | | | 2.64 | % | | | 3.53 | % |
Portfolio turnover rate(d)(e) | | | 77 | % | | | 156 | % | | | 30 | % | | | 48 | % | | | 20 | % |
| (a) | Calculated based on average shares outstanding during the year. |
| (b) | Total return is calculated assuming a purchase of a share on the first day and a sale on the last day of each year reported and includes reinvestment of dividends and distributions, if any. Total returns may reflect adjustments to conform to GAAP. |
| (c) | Does not include expenses of the underlying funds in which the Fund invests. |
| (d) | The Fund accounts for mortgage dollar roll transactions, when applicable, as purchases and sales which, as a result, can increase its portfolio turnover rate. |
| (e) | The Fund’s portfolio turnover rate is calculated in accordance with regulatory requirements, without regard to transactions involving short-term investments, certain derivatives and in-kind transactions (if any). If such transactions were included, the Fund’s portfolio turnover rate may be higher. |
See Notes to Financial Statements.
PGIM Absolute Return Bond Fund 75
Financial Highlights (continued)
| | | | | | | | | | | | | | | | | | | | |
| | | | | | |
Class R6 Shares | | | | | | | | | | | | | | | | | | | | |
| | | Year Ended October 31, | |
| | | | | | |
| | | 2024 | | | 2023 | | | 2022 | | | 2021 | | | 2020 | |
| | | | | | |
Per Share Operating Performance(a): | | | | | | | | | | | | | | | | | | | | |
Net Asset Value, Beginning of Year | | | $8.86 | | | | $8.79 | | | | $9.21 | | | | $8.93 | | | | $9.72 | |
Income (loss) from investment operations: | | | | | | | | | | | | | | | | | | | | |
Net investment income (loss) | | | 0.50 | | | | 0.44 | | | | 0.25 | | | | 0.26 | | | | 0.32 | |
Net realized and unrealized gain (loss) on investment and foreign currency transactions | | | 0.28 | | | | 0.13 | | | | (0.42 | ) | | | 0.28 | | | | (0.48 | ) |
Total from investment operations | | | 0.78 | | | | 0.57 | | | | (0.17 | ) | | | 0.54 | | | | (0.16 | ) |
Less Dividends and Distributions: | | | | | | | | | | | | | | | | | | | | |
Dividends from net investment income | | | (0.53 | ) | | | (0.48 | ) | | | (0.25 | ) | | | (0.25 | ) | | | (0.29 | ) |
Tax return of capital distributions | | | - | | | | (0.02 | ) | | | - | | | | (0.01 | ) | | | (0.04 | ) |
Distributions from net realized gains | | | - | | | | - | | | | - | | | | - | | | | (0.30 | ) |
Total dividends and distributions | | | (0.53 | ) | | | (0.50 | ) | | | (0.25 | ) | | | (0.26 | ) | | | (0.63 | ) |
Net asset value, end of year | | | $9.11 | | | | $8.86 | | | | $8.79 | | | | $9.21 | | | | $8.93 | |
Total Return(b): | | | 9.06 | % | | | 6.69 | % | | | (1.87 | )% | | | 6.07 | % | | | (1.66 | )% |
| | | | | | | | | | | | | | | | | | | | |
Ratios/Supplemental Data: | | | | | | | | | | | | | | | | | | | | |
Net assets, end of year (000) | | | $126,586 | | | | $62,859 | | | | $62,579 | | | | $60,135 | | | | $127,864 | |
Average net assets (000) | | | $92,444 | | | | $60,732 | | | | $60,251 | | | | $97,518 | | | | $109,540 | |
Ratios to average net assets(c): | | | | | | | | | | | | | | | | | | | | |
Expenses after waivers and/or expense reimbursement | | | 0.64 | % | | | 0.65 | % | | | 0.65 | % | | | 0.64 | % | | | 0.65 | % |
Expenses before waivers and/or expense reimbursement | | | 0.64 | % | | | 0.65 | % | | | 0.65 | % | | | 0.64 | % | | | 0.65 | % |
Net investment income (loss) | | | 5.49 | % | | | 4.95 | % | | | 2.82 | % | | | 2.79 | % | | | 3.54 | % |
Portfolio turnover rate(d)(e) | | | 77 | % | | | 156 | % | | | 30 | % | | | 48 | % | | | 20 | % |
| (a) | Calculated based on average shares outstanding during the year. |
| (b) | Total return is calculated assuming a purchase of a share on the first day and a sale on the last day of each year reported and includes reinvestment of dividends and distributions, if any. Total returns may reflect adjustments to conform to GAAP. |
| (c) | Does not include expenses of the underlying funds in which the Fund invests. |
| (d) | The Fund accounts for mortgage dollar roll transactions, when applicable, as purchases and sales which, as a result, can increase its portfolio turnover rate. |
| (e) | The Fund’s portfolio turnover rate is calculated in accordance with regulatory requirements, without regard to transactions involving short-term investments, certain derivatives and in-kind transactions (if any). If such transactions were included, the Fund’s portfolio turnover rate may be higher. |
See Notes to Financial Statements.
76
Notes to Financial Statements
Prudential Investment Portfolios 9 (the “Registered Investment Company” or “RIC”) is registered under the Investment Company Act of 1940, as amended (“1940 Act”), as an open-end management investment company. The RIC is organized as a Delaware Statutory Trust. These financial statements relate only to the PGIM Absolute Return Bond Fund (the “Fund”), a series of the RIC. The Fund is classified as a diversified fund for purposes of the 1940 Act.
The investment objective of the Fund is to seek positive returns over the long term, regardless of market conditions.
The Fund follows the investment company accounting and reporting guidance of the Financial Accounting Standards Board (“FASB”) Accounting Standard Codification (“ASC”) Topic 946 Financial Services — Investment Companies. The following is a summary of significant accounting policies followed by the Fund in the preparation of its financial statements. The policies conform to U.S. generally accepted accounting principles (“GAAP”). The Fund consistently follows such policies in the preparation of its financial statements.
Securities Valuation: The Fund holds securities and other assets and liabilities that are fair valued as of the close of each day (generally, 4:00 PM Eastern time) the New York Stock Exchange (“NYSE”) is open for trading. As described in further detail below, the Fund’s investments are valued daily based on a number of factors, including the type of investment and whether market quotations are readily available. The RIC’s Board of Trustees (the “Board”) has approved the Fund’s valuation policies and procedures for security valuation and designated PGIM Investments LLC (“PGIM Investments” or the “Manager”) as the “Valuation Designee,” as defined by Rule 2a-5(b) under the 1940 Act, to perform the fair value determination relating to all Fund investments. Pursuant to the Board’s oversight, the Valuation Designee has established a Valuation Committee to perform the duties and responsibilities of the Valuation Designee under Rule 2a-5. The valuation procedures permit the Fund to utilize independent pricing vendor services, quotations from market makers, and alternative valuation methods when market quotations are either not readily available or not deemed representative of fair value. Fair value is the estimated price that would be received to sell an asset or paid to transfer a liability in an orderly transaction between market participants on the measurement date.
For the fiscal reporting year-end, securities and other assets and liabilities were fair valued at the close of the last U.S. business day. Trading in certain foreign securities may occur when the NYSE is closed (including weekends and holidays). Because such foreign securities
PGIM Absolute Return Bond Fund 77
Notes to Financial Statements (continued)
trade in markets that are open on weekends and U.S. holidays, the values of some of the Fund’s foreign investments may change on days when investors cannot purchase or redeem Fund shares.
Various inputs determine how the Fund’s investments are valued, all of which are categorized according to the three broad levels (Level 1, 2, or 3) detailed in the Schedule of Investments and referred to herein as the “fair value hierarchy” in accordance with FASB ASC Topic 820 Fair Value Measurement.
Common or preferred stocks, exchange-traded funds (“ETFs”) and derivative instruments, if applicable, that are traded on a national securities exchange are valued at the last sale price as of the close of trading on the applicable exchange where the security principally trades. Securities traded via NASDAQ are valued at the NASDAQ official closing price. To the extent these securities are valued at the last sale price or NASDAQ official closing price, they are classified as Level 1 in the fair value hierarchy. In the event that no sale or official closing price on a valuation date exists, these securities are generally valued at the mean between the last reported bid and ask prices, or at the last bid price in the absence of an ask price. These securities are classified as Level 2 in the fair value hierarchy.
Investments in open-end funds (other than ETFs) are valued at their net asset values as of the close of the NYSE on the date of valuation. These securities are classified as Level 1 in the fair value hierarchy since they may be purchased or sold at their net asset values on the date of valuation.
Fixed income securities traded in the OTC market are generally classified as Level 2 in the fair value hierarchy. Such fixed income securities are typically valued using the market approach which generally involves obtaining data from an approved independent third-party vendor source. The Fund utilizes the market approach as the primary method to value securities when market prices of identical or comparable instruments are available. The third-party vendors’ valuation techniques used to derive the evaluated bid price are based on evaluating observable inputs, including but not limited to, yield curves, yield spreads, credit ratings, deal terms, tranche level attributes, default rates, cash flows, prepayment speeds, broker/dealer quotations and reported trades. Certain Level 3 securities are also valued using the market approach when obtaining a single broker quote or when utilizing transaction prices for identical securities that have been used in excess of five business days. During the reporting period, there were no changes to report with respect to the valuation approach and/or valuation techniques discussed above.
Floating rate and other loans are generally valued at prices provided by approved independent pricing vendors. The pricing vendors utilize broker/dealer quotations and provide prices based on the average of such quotations. Floating rate and other loans valued
78
using such vendor prices are generally classified as Level 2 in the fair value hierarchy. Floating rate and other loans valued based on a single broker quote or at the original transaction price in excess of five business days are classified as Level 3 in the fair value hierarchy.
OTC and centrally cleared derivative instruments are generally classified as Level 2 in the fair value hierarchy. Such derivative instruments are typically valued using the market approach and/or income approach which generally involves obtaining data from an approved independent third-party vendor source. The Fund utilizes the market approach when quoted prices in broker-dealer markets are available but also includes consideration of alternative valuation approaches, including the income approach. In the absence of reliable market quotations, the income approach is typically utilized for purposes of valuing derivatives such as interest rate swaps based on a discounted cash flow analysis whereby the value of the instrument is equal to the present value of its future cash inflows or outflows. Such analysis includes projecting future cash flows and determining the discount rate (including the present value factors that affect the discount rate) used to discount the future cash flows. In addition, the third-party vendors’ valuation techniques used to derive the evaluated derivative price is based on evaluating observable inputs, including but not limited to, underlying asset prices, indices, spreads, interest rates and exchange rates. Certain derivatives may be classified as Level 3 when valued using the market approach by obtaining a single broker quote or when utilizing unobservable inputs in the income approach. During the reporting period, there were no changes to report with respect to the valuation approach and/or valuation techniques discussed above.
Securities and other assets that cannot be priced according to the methods described above are valued based on policies and procedures approved by the Board. In the event that unobservable inputs are used when determining such valuations, the securities will be classified as Level 3 in the fair value hierarchy. Altering one or more unobservable inputs may result in a significant change to a Level 3 security’s fair value measurement.
When determining the fair value of securities, some of the factors influencing the valuation include: the nature of any restrictions on disposition of the securities; assessment of the general liquidity of the securities; the issuer’s financial condition and the markets in which it does business; the cost of the investment; the size of the holding and the capitalization of the issuer; the prices of any recent transactions or bids/offers for such securities or any comparable securities; and any available analyst media or other reports or information deemed reliable by the Valuation Designee regarding the issuer or the markets or industry in which it operates. Using fair value to price securities may result in a value that is different from a security’s most recent closing price and from the price used by other unaffiliated mutual funds to calculate their net asset values.
Foreign Currency Translation: The books and records of the Fund are maintained in U.S. dollars. Foreign currency amounts are translated into U.S. dollars on the following basis:
PGIM Absolute Return Bond Fund 79
Notes to Financial Statements (continued)
(i) market value of investment securities, other assets and liabilities — at the exchange rate as of the valuation date;
(ii) purchases and sales of investment securities, income and expenses — at the rates of exchange prevailing on the respective dates of such transactions.
Although the net assets of the Fund are presented at the foreign exchange rates and market values at the close of the period, the Fund does not generally isolate that portion of the results of operations arising as a result of changes in the foreign exchange rates from the fluctuations arising from changes in the market prices of long-term portfolio securities held at the end of the period. Similarly, the Fund does not isolate the effect of changes in foreign exchange rates from the fluctuations arising from changes in the market prices of long-term portfolio securities sold during the period. Accordingly, holding period unrealized and realized foreign currency gains (losses) are included in the reported net change in unrealized appreciation (depreciation) on investments and net realized gains (losses) on investment transactions on the Statements of Operations. Notwithstanding the above, the Fund does isolate the effect of fluctuations in foreign currency exchange rates when determining the gain (loss) upon the sale or maturity of foreign currency denominated debt obligations; such amounts are included in net realized gains (losses) on foreign currency transactions.
Additionally, net realized gains (losses) on foreign currency transactions represent net foreign exchange gains (losses) from the disposition of holdings of foreign currencies, currency gains (losses) realized between the trade and settlement dates on investment transactions, and the difference between the amounts of interest, dividends and foreign withholding taxes recorded on the Fund’s books and the U.S. dollar equivalent amounts actually received or paid. Net unrealized currency gains (losses) arise from valuing foreign currency denominated assets and liabilities (other than investments) at period end exchange rates.
Forward and Cross Currency Contracts: A forward currency contract is a commitment to purchase or sell a foreign currency at a future date at a negotiated forward rate. The Fund enters into forward currency contracts, as defined in the prospectus, in order to hedge its exposure to changes in foreign currency exchange rates on its foreign portfolio holdings or on specific receivables and payables denominated in a foreign currency and to gain exposure to certain currencies. The contracts are valued daily at current forward exchange rates and any unrealized gain (loss) is included in net unrealized appreciation or depreciation on forward and cross currency contracts. Gain (loss) is realized on the settlement date of the contract equal to the difference between the settlement value of the original and negotiated forward contracts. This gain (loss), if any, is included in net realized gain (loss) on forward and cross currency contract transactions. Risks may arise upon
80
entering into these contracts from the potential inability of the counterparties to meet the terms of their contracts. Forward currency contracts involve risks from currency exchange rate and credit risk in excess of the amounts reflected on the Statement of Assets and Liabilities. The Fund’s maximum risk of loss from counterparty credit risk is the net value of the cash flows to be received from the counterparty at the end of the contract’s life. A cross currency contract is a forward contract where a specified amount of one foreign currency will be exchanged for a specified amount of another foreign currency.
Options: The Fund purchased and/or wrote options in order to hedge against adverse market movements or fluctuations in value caused by changes in prevailing interest rates, value of equities or foreign currency exchange rates with respect to securities or financial instruments which the Fund currently owns or intends to purchase. The Fund may also use options to gain additional market exposure. The Fund’s principal reason for writing options is to realize, through receipt of premiums, a greater current return than would be realized on the underlying security alone. When the Fund purchases an option, it pays a premium and an amount equal to that premium is recorded as an asset. When the Fund writes an option, it receives a premium and an amount equal to that premium is recorded as a liability. The asset or liability is adjusted daily to reflect the current market value of the option. If an option expires unexercised, the Fund realizes a gain (loss) to the extent of the premium received or paid. If an option is exercised, the premium received or paid is recorded as an adjustment to the proceeds from the sale or the cost of the purchase in determining whether the Fund has realized a gain (loss). The difference between the premium and the amount received or paid at the closing of a purchase or sale transaction is also treated as a realized gain (loss). Gain (loss) on purchased options is included in net realized gain (loss) on investment transactions. Gain (loss) on written options is presented separately as net realized gain (loss) on options written transactions.
The Fund, as writer of an option, may have no control over whether the underlying securities or financial instruments may be sold (called) or purchased (put). As a result, the Fund bears the market risk of an unfavorable change in the price of the security or financial instrument underlying the written option. The Fund, as purchaser of an OTC option, bears the risk of the potential inability of the counterparties to meet the terms of their contracts. With exchange-traded options contracts, there is minimal counterparty credit risk to the Fund since the exchanges’ clearinghouse acts as counterparty to all exchange-traded options and guarantees the options contracts against default.
When the Fund writes an option on a swap, an amount equal to any premium received by the Fund is recorded as a liability and is subsequently adjusted to the current market value of the written option on the swap. If a call option on a swap is exercised, the Fund becomes obligated to pay a fixed interest rate (noted as the strike price) and receive a variable interest rate on a notional amount. If a put option on a swap is exercised, the Fund becomes obligated to pay a variable interest rate and receive a fixed interest rate (noted as the strike price) on a notional amount. Premiums received from writing options on swaps that expire or are exercised are treated as realized gains upon the expiration or exercise of such options on swaps. The risk associated with writing put and call options on swaps is that the Fund will be
PGIM Absolute Return Bond Fund 81
Notes to Financial Statements (continued)
obligated to be party to a swap agreement if an option on a swap is exercised. The Fund entered into options on swaps that are executed through a central clearing facility, such as a registered exchange. Such options pay or receive an amount known as “variation margin”, based on daily changes in the valuation of the contract. The daily variation margin, rather than the contract market value, is recorded for financial statement purposes on the Statement of Assets and Liabilities.
Financial Futures Contracts: A financial futures contract is an agreement to purchase (long) or sell (short) an agreed amount of securities at a set price for delivery on a future date. Upon entering into a financial futures contract, the Fund is required to pledge to the broker an amount of cash and/or other assets equal to a certain percentage of the contract amount. This amount is known as the “initial margin.” Subsequent payments, known as “variation margin,” are made or received by the Fund each day, depending on the daily fluctuations in the value of the underlying security. Such variation margin is recorded for financial statement purposes on a daily basis as unrealized gain (loss). When the contract expires or is closed, the gain (loss) is realized and is presented in the Statement of Operations as net realized gain (loss) on futures transactions.
The Fund invested in financial futures contracts in order to hedge its existing portfolio securities, or securities the Fund intends to purchase, against fluctuations in value caused by changes in prevailing interest rates. Should interest rates move unexpectedly, the Fund may not achieve the anticipated benefits of the financial futures contracts and may realize a loss. The use of futures transactions involves the risk of imperfect correlation in movements in the price of futures contracts, interest rates and the underlying hedged assets. Since futures contracts are exchange-traded, there is minimal counterparty credit risk to the Fund since the exchanges’ clearinghouse acts as counterparty to all exchange-traded futures and guarantees the futures contracts against default.
Swap Agreements: The Fund entered into certain types of swap agreements detailed in the disclosures below. A swap agreement is an agreement to exchange the return generated by one instrument for the return generated by another instrument. Swap agreements are negotiated in the OTC market and may be executed either directly with a counterparty (“OTC-traded”) or through a central clearing facility, such as a registered exchange. Swap agreements are valued daily at current market value and any change in value is included in the net unrealized appreciation or depreciation on swap agreements. Centrally cleared swaps pay or receive an amount known as “variation margin”, based on daily changes in the valuation of the swap contract. For OTC-traded, upfront premiums paid and received are shown as swap premiums paid and swap premiums received in the Statement of Assets and Liabilities. Risk of loss may exceed amounts recognized on the Statement of Assets and Liabilities. Swap agreements outstanding at period end, if any, are listed on the Schedule of Investments.
82
Interest Rate Swaps: Interest rate swaps represent an agreement between counterparties to exchange cash flows based on the difference between two interest rates, applied to a notional principal amount for a specified period. The Fund is subject to interest rate risk exposure in the normal course of pursuing its investment objective. The Fund used interest rate swaps to maintain its ability to generate steady cash flow by receiving a stream of fixed rate payments or to increase exposure to prevailing market rates by receiving floating rate payments. The Fund’s maximum risk of loss from counterparty credit risk is the discounted net present value of the cash flows to be received from the counterparty over the contract’s remaining life.
Credit Default Swaps (“CDS”): CDS involve one party (the protection buyer) making a stream of payments to another party (the protection seller) in exchange for the right to receive a specified payment in the event of a default or as a result of a default (collectively a “credit event”) for the referenced entity (typically corporate issues or sovereign issues of an emerging country) on its obligation; or in the event of a write-down, principal shortfall, interest shortfall or default of all or part of the referenced entities comprising a credit index.
The Fund is subject to credit risk in the normal course of pursuing its investment objectives, and as such, has entered into CDS contracts to provide a measure of protection against defaults or to take an active long or short position with respect to the likelihood of a particular issuer’s default or the reference entity’s credit soundness. CDS contracts generally trade based on a spread which represents the cost a protection buyer has to pay the protection seller. The protection buyer is said to be “short the credit” because the higher the contract value rises, the more the credit deteriorates. The value of the CDS contract increases for the protection buyer if the spread increases. The Fund’s maximum risk of loss from counterparty credit risk for purchased CDS is the inability of the counterparty to honor the contract up to the notional value due to a credit event.
As a seller of protection on credit default swap agreements, the Fund generally receives an agreed upon payment from the buyer of protection throughout the term of the swap, provided no credit event occurs. As the seller, the Fund effectively increases its investment risk because, in addition to its total net assets, the Fund may be subject to investment exposure on the notional amount of the swap.
The maximum amount of the payment that the Fund, as a seller of protection, could be required to make under a credit default swap agreement would be equal to the notional amount of the underlying security or index contract as a result of a credit event. This potential amount will be partially offset by any recovery values of the respective referenced obligations or net amounts received from the settlement of buy protection credit default swap agreements which the Fund entered into for the same referenced entity or index. As a buyer of protection, the Fund generally receives an amount up to the notional value of the swap if a credit event occurs.
Implied credit spreads, represented in absolute terms, utilized in determining the market value of credit default swap agreements where the Fund is the seller of protection as of
PGIM Absolute Return Bond Fund 83
Notes to Financial Statements (continued)
period end are disclosed in the footnotes to the Schedule of Investments, if applicable. These spreads serve as indicators of the current status of the payment/performance risk and represent the likelihood of default risk for the credit derivative. The implied credit spread of a particular referenced entity reflects the cost of buying/selling protection and may include upfront payments required to enter into the agreement. Wider credit spreads and increased market value in absolute terms, when compared to the notional amount of the swap, represent a deterioration of the referenced entity’s credit soundness and a greater likelihood of risk of default or other credit event occurring as defined under the terms of the agreement.
Currency Swaps: The Fund entered into currency swap agreements primarily to gain yield exposure on foreign bonds. Currency swap agreements involve two parties exchanging two different currencies with an agreement to reverse the exchange at a later date at specified exchange rates.
Total Return Swaps: In a total return swap, one party receives payments based on the market value of the security or the commodity involved, or total return of a specific referenced asset, such as an equity, index or bond, and in return pays a defined amount. The Fund is subject to risk exposures associated with the referenced asset in the normal course of pursuing its investment objectives. The Fund entered into total return swaps to manage its exposure to a security or an index. The Fund’s maximum risk of loss from counterparty credit risk is the change in the value of the security, in the Fund’s favor, from the point of entering into the contract.
Floating Rate and Other Loans: The Fund invested in floating rate and other loans. Floating rate and other loans include loans that are privately negotiated between a corporate borrower and one or more financial institutions, including, but not limited to, term loans, revolvers, and other instruments issued in the floating rate and other loans market. The Fund acquires interests in loans directly (by way of assignment from the selling institution) and/or indirectly (by way of the purchase of a participation interest from the selling institution). Under a floating rate and other loans assignment, the Fund generally will succeed to all the rights and obligations of an assigning lending institution and becomes a lender under the loan agreement with the relevant borrower in connection with that loan. Under a floating rate and other loans participation, the Fund generally will have a contractual relationship only with the lender, not with the relevant borrower. As a result, the Fund generally will have the right to receive payments of principal, interest, and any fees to which it is entitled only from the lender selling the participation and only upon receipt by the lender of the payments from the relevant borrower. The Fund may not directly benefit from the collateral supporting the debt obligation in which it has purchased the participation. As a result, the Fund will assume the credit risk of both the borrower and the institution selling the participation to the Fund.
84
Mortgage-Backed and Asset-Backed Securities: Mortgage-backed securities are pass-through securities, meaning that principal and interest payments made by the borrower on the underlying mortgages are passed through to the Fund. Asset-backed securities directly or indirectly represent a participation interest in, or are secured by and payable from, a stream of payments generated by particular assets such as motor vehicle or credit card receivables. Asset-backed securities may be classified as pass-through certificates or collateralized obligations, such as collateralized bond obligations, collateralized loan obligations and other similarly structured securities. The value of mortgage-backed and asset-backed securities varies with changes in interest rates and may be affected by changes in credit quality or value of the mortgage loans or other assets that support the securities.
Stripped mortgage-backed securities are usually structured with two classes that receive different proportions of the interest (“IO”) and principal (“PO”) distributions on a pool of mortgage assets. Payments received for IOs are included in interest income on the Statements of Operations. Because no principal will be received at the maturity of an IO, adjustments are made to the cost of the security on a monthly basis until maturity. These adjustments are included in interest income on the Statements of Operations. Payments received for POs are treated as reductions to the cost and par value of the securities.
Master Netting Arrangements: The RIC, on behalf of the Fund, is subject to various Master Agreements, or netting arrangements, with select counterparties. These are agreements which a subadviser may have negotiated and entered into on behalf of all or a portion of the Fund. A master netting arrangement between the Fund and the counterparty permits the Fund to offset amounts payable by the Fund to the same counterparty against amounts to be received and by the receipt of collateral from the counterparty by the Fund to cover the Fund’s exposure to the counterparty. However, there is no assurance that such mitigating factors are easily enforceable. In addition to master netting arrangements, the right to set-off exists when all the conditions are met such that each of the parties owes the other determinable amounts, the reporting party has the right to set-off the amount owed with the amount owed by the other party, the reporting party intends to set-off and the right of set-off is enforceable by law.
The RIC, on behalf of the Fund, is a party to International Swaps and Derivatives Association, Inc. (“ISDA”) Master Agreements with certain counterparties that govern OTC derivative and foreign exchange contracts entered into from time to time. The Master Agreements may contain provisions regarding, among other things, the parties’ general obligations, representations, agreements, collateral requirements, events of default and early termination. With respect to certain counterparties, in accordance with the terms of the Master Agreements, collateral posted to the Fund is held in a segregated account by the Fund’s custodian and with respect to those amounts which can be sold or re-pledged, is presented in the Schedule of Investments. Collateral pledged by the Fund is segregated by the Fund’s custodian and identified in the Schedule of Investments. Collateral can be in the form of cash or debt securities issued by the U.S. Government or related agencies or other securities as agreed to by the Fund and the applicable counterparty. Collateral requirements
PGIM Absolute Return Bond Fund 85
Notes to Financial Statements (continued)
are determined based on the Fund’s net position with each counterparty. Termination events applicable to the Fund may occur upon a decline in the Fund’s net assets below a specified threshold over a certain period of time. Termination events applicable to counterparties may occur upon a decline in the counterparty’s long-term and short-term credit ratings below a specified level. In each case, upon occurrence, the other party may elect to terminate early and cause settlement of all derivative and foreign exchange contracts outstanding, including the payment of any losses and costs resulting from such early termination, as reasonably determined by the terminating party. Any decision by one or more of the Fund’s counterparties to elect early termination could impact the Fund’s future derivative activity.
In addition to each instrument’s primary underlying risk exposure (e.g. interest rate, credit, equity or foreign exchange, etc.), swap agreements involve, to varying degrees, elements of credit, market and documentation risk. Such risks involve the possibility that no liquid market for these agreements will exist, the counterparty to the agreement may default on its obligation to perform or disagree on the contractual terms of the agreement, and changes in net interest rates will be unfavorable. In connection with these agreements, securities in the portfolio may be identified or received as collateral from the counterparty in accordance with the terms of the respective swap agreements to provide or receive assets of value and to serve as recourse in the event of default or bankruptcy/insolvency of either party. Such OTC derivative agreements include conditions which, when materialized, give the counterparty the right to cause an early termination of the transactions under those agreements. Any election by the counterparty for early termination of the contract(s) may impact the amounts reported on financial statements.
Short sales and OTC contracts, including forward foreign currency exchange contracts, swaps, forward rate agreements and written options involve elements of both market and credit risk in excess of the amounts reflected on the Statement of Assets and Liabilities, if applicable. Such risks may be mitigated by engaging in master netting arrangements.
Warrants and Rights: The Fund held warrants and rights acquired either through a direct purchase or pursuant to corporate actions. Warrants and rights entitle the holder to buy a proportionate amount of common stock, or such other security that the issuer may specify, at a specific price and time through the expiration dates. Such warrants and rights are held as long positions by the Fund until exercised, sold or expired. Warrants and rights are valued at fair value in accordance with the Board approved fair valuation procedures.
Payment-In-Kind: The Fund invested in the open market or received pursuant to debt restructuring securities that pay-in-kind (“PIK”) the interest due on such debt instruments. The PIK interest, computed at the contractual rate specified, is added to the existing principal balance of the debt when issued bonds have the same terms as the bond or
86
recorded as a separate bond when terms are different from the existing debt, and is recorded as interest income.
Delayed-Delivery Transactions: The Fund purchased or sold securities on a when-issued or delayed-delivery and forward commitment basis, including TBA securities. These transactions involve a commitment by the Fund to purchase or sell securities for a predetermined price or yield, with payment and delivery taking place beyond the customary settlement period. When delayed-delivery purchases are outstanding, the Fund will set aside and maintain an amount of liquid assets sufficient to meet the purchase price in a segregated account until the settlement date. When purchasing a security on a delayed-delivery basis, the Fund assumes the rights and risks of ownership of the security, including the risk of price and yield fluctuations, and takes such fluctuations into account when determining its net asset value. The Fund may dispose of or renegotiate a delayed-delivery transaction subsequent to establishment, and may sell when-issued securities before they are delivered, which may result in a realized gain (loss). When selling a security on a delayed-delivery basis, the Fund forfeits its eligibility to realize future gains (losses) with respect to the security.
Securities Lending: The Fund lends its portfolio securities to banks and broker-dealers. The loans are secured by collateral at least equal to the market value of the securities loaned. Collateral pledged by each borrower is invested in an affiliated money market fund and is marked to market daily, based on the previous day’s market value, such that the value of the collateral exceeds the value of the loaned securities. In the event of significant appreciation in value of the securities on loan on the last business day of the reporting period, the financial statements may reflect a collateral value that is less than the market value of the loaned securities. Such shortfall is remedied as described above. Loans are subject to termination at the option of the borrower or the Fund. Upon termination of the loan, the borrower will return to the Fund securities identical to the loaned securities. The remaining open loans of the securities lending transactions are considered overnight and continuous. Should the borrower of the securities fail financially, the Fund has the right to repurchase the securities in the open market using the collateral.
The Fund recognizes income, net of any rebate and securities lending agent fees, for lending its securities in the form of fees or interest on the investment of any cash received as collateral. The borrower receives all interest and dividends from the securities loaned and such payments are passed back to the lender in amounts equivalent thereto, which are reflected in interest income or unaffiliated dividend income based on the nature of the payment on the Statement of Operations. The Fund also continues to recognize any unrealized gain (loss) in the market price of the securities loaned and on the change in the value of the collateral invested that may occur during the term of the loan. In addition, realized gain (loss) is recognized on changes in the value of the collateral invested upon liquidation of the collateral. Net earnings from securities lending are disclosed in the Statement of Operations.
PGIM Absolute Return Bond Fund 87
Notes to Financial Statements (continued)
Mortgage Dollar Rolls: The Fund entered into mortgage dollar rolls in which the Fund sell mortgage securities for delivery in the current month, realizing a gain (loss), and simultaneously enter into contracts to repurchase somewhat similar (same type, coupon and maturity) securities on a specified future date. During the roll period, the Fund forgoes principal and interest paid on the securities. The Fund is compensated by the interest earned on the cash proceeds of the initial sale and by the lower repurchase price at the future date. The difference between the sale proceeds and the lower repurchase price is recorded as a realized gain on investment transactions. The Fund maintains a segregated account, the dollar value of which is at least equal to its obligations, with respect to dollar rolls. The Fund is subject to the risk that the market value of the securities the Fund is obligated to repurchase under the agreement may decline below the repurchase price.
Securities Transactions and Net Investment Income: Securities transactions are recorded on the trade date. Realized gains (losses) from investment and currency transactions are calculated on the specific identification method. Dividend income is recorded on the ex-date, or for certain foreign securities, when the Fund becomes aware of such dividends. Interest income, including amortization of premium and accretion of discount on debt securities, as required, is recorded on the accrual basis. Expenses are recorded on an accrual basis, which may require the use of certain estimates by management that may differ from actual expense amounts. Net investment income or loss (other than class specific expenses and waivers, which are allocated as noted below) and unrealized and realized gains (losses) are allocated daily to each class of shares based upon the relative proportion of adjusted net assets of each class at the beginning of the day. Class specific expenses and waivers, where applicable, are charged to the respective share classes. Such class specific expenses and waivers include distribution fees and distribution fee waivers, shareholder servicing fees, transfer agent’s fees and expenses, registration fees and fee waivers and/or expense reimbursements, as applicable.
Taxes: It is the Fund’s policy to continue to meet the requirements of the Internal Revenue Code applicable to regulated investment companies and to distribute all of its taxable net investment income and capital gains, if any, to its shareholders. Therefore, no federal income tax provision is required. Withholding taxes on foreign dividends, interest and capital gains, if any, are recorded, net of reclaimable amounts, at the time the related income is earned.
Dividends and Distributions: Dividends and distributions to shareholders, which are determined in accordance with federal income tax regulations and which may differ from GAAP, are recorded on the ex-date. Permanent book/tax differences relating to income and gain (loss) are reclassified between total distributable earnings (loss) and paid-in capital in excess of par, as appropriate. The chart below sets forth the expected frequency of dividend and capital gains distributions to shareholders. Various factors may impact the frequency of
88
dividend distributions to shareholders, including but not limited to adverse market conditions or portfolio holding-specific events.
| | |
| Expected Distribution Schedule to Shareholders* | | Frequency |
Net Investment Income | | Monthly |
Short-Term Capital Gains | | Annually |
Long-Term Capital Gains | | Annually |
| * | Under certain circumstances, the Fund may make more than one distribution of short-term and/or long-term capital gains during a fiscal year. |
Estimates: The preparation of financial statements requires management to make estimates and assumptions that affect the reported amounts and disclosures in the financial statements. Actual results could differ from those estimates.
The RIC, on behalf of the Fund, has entered into a management agreement with the Manager pursuant to which it has responsibility for all investment advisory services, including supervision of the subadviser’s performance of such services, and for rendering administrative services.
The Manager has entered into a subadvisory agreement with PGIM, Inc., which provides subadvisory services to the Fund through its business unit PGIM Fixed Income, and PGIM Limited (collectively the “subadviser”). The Manager pays for the services of the subadviser.
Fees payable under the management agreement are computed daily and paid monthly. For the reporting period ended October 31, 2024, the contractual and effective management fee rates were as follows:
| | | | |
| | |
| Contractual Management Rate | | Effective Management Fee, before any waivers
and/or expense reimbursements | |
0.590% of average daily net assets up to $2.5 billion; | | | 0.59% | |
0.565% of average daily net assets from $2.5 billion to $5 billion; | | | | |
0.540% of average daily net assets over $5 billion. | | | | |
The Manager has contractually agreed, through February 28, 2026, to limit total annual operating expenses after fee waivers and/or expense reimbursements. This contractual waiver excludes interest, brokerage, taxes (such as income and foreign withholdings taxes, stamp duty and deferred tax expenses), acquired fund fees and expenses, extraordinary expenses, and certain other Fund expenses such as dividend and interest expense and broker charges on short sales.
Where applicable, the Manager agrees, to waive management fees or shared operating expenses on any share class to the same extent that it waives such expenses on any other share class and, in addition, total annual operating expenses for Class R6 shares will not exceed total annual operating expenses for Class Z shares. Fees and/or expenses waived
PGIM Absolute Return Bond Fund 89
Notes to Financial Statements (continued)
and/or reimbursed by the Manager for the purpose of preventing the expenses from exceeding a certain expense ratio limit may be recouped by the Manager within the same fiscal year during which such waiver and/or reimbursement is made if such recoupment can be realized without exceeding the expense limit in effect at the time of the waiver/reimbursement and/or recoupment for that fiscal year, as applicable. The expense limitations attributable to each class are as follows:
| | | | |
| Class | | Expense Limitations |
A | | | — | % |
C | | | — | |
Z | | | 0.73 | |
R6 | | | 0.70 | |
Separately, the Manager has contractually agreed that to the extent the Fund invests in an ETF advised by PGIM Investments (“PGIM ETF”), the Manager will waive any management fees it receives from the Fund in an amount equal to the unitary management fee received by PGIM Investments from the PGIM ETF attributable to the Fund’s investment in such PGIM ETF. This waiver will be effective at any time the Fund is invested in the PGIM ETF and will remain in effect for so long as the Fund is invested in the PGIM ETF, unless earlier terminated by agreement of the Board of the Fund.
The RIC, on behalf of the Fund, has a distribution agreement with Prudential Investment Management Services LLC (“PIMS”), which acts as the distributor of the Class A, Class C, Class Z and Class R6 shares of the Fund. The Fund compensates PIMS for distributing and servicing the Fund’s Class A and Class C shares, pursuant to the plans of distribution (the “Distribution Plans”), regardless of expenses actually incurred by PIMS.
Pursuant to the Distribution Plans, the Fund compensates PIMS for distribution related activities at an annual rate based on average daily net assets per class. The distribution fees are accrued daily and payable monthly.
The Fund’s annual gross and net distribution rates, where applicable, are as follows:
| | | | |
| Class | | Gross Distribution Fee | | Net Distribution Fee |
A | | 0.25% | | 0.25% |
C | | 1.00 | | 1.00 |
Z | | N/A | | N/A |
R6 | | N/A | | N/A |
For the year ended October 31, 2024, PIMS received front-end sales charges (“FESL”) resulting from sales of certain class shares and contingent deferred sales charges (“CDSC”) imposed upon redemptions by certain shareholders. From these fees, PIMS paid such sales
90
charges to broker-dealers, who in turn paid commissions to salespersons and incurred other distribution costs. The sales charges are as follows where applicable:
| | | | | | | | | | | | |
| Class | | FESL | | | | | | CDSC | |
A | | $ | 406,467 | | | | | | | $ | 8,496 | |
C | | | — | | | | | | | | 5,770 | |
PGIM Investments, PGIM, Inc., PGIM Limited and PIMS are indirect, wholly-owned subsidiaries of Prudential Financial, Inc. (“Prudential”).
| 4. | Other Transactions with Affiliates |
Prudential Mutual Fund Services LLC (“PMFS”), an affiliate of PGIM Investments and an indirect, wholly-owned subsidiary of Prudential, serves as the Fund’s transfer agent and shareholder servicing agent. Transfer agent’s and shareholder servicing agent’s fees and expenses in the Statement of Operations include certain out-of-pocket expenses paid to non-affiliates, where applicable.
The Fund may invest its overnight sweep cash in the PGIM Core Government Money Market Fund (the “Core Government Fund”), a series of the Prudential Government Money Market Fund, Inc., and its securities lending cash collateral in the PGIM Institutional Money Market Fund (the “Money Market Fund”), a series of Prudential Investment Portfolios 2, each registered under the 1940 Act and managed by PGIM Investments. The Fund may also invest in the PGIM Core Short-Term Bond Fund (together with the Core Government Fund, the “Core Funds”), a series of Prudential Investment Portfolios 2, registered under the 1940 Act and managed by PGIM Investments, pursuant to an exemptive order received from the Securities and Exchange Commission (“SEC”). PGIM Investments and/or its affiliates are paid fees or reimbursed for providing their services to the Core Funds and the Money Market Fund. In addition to the realized and unrealized gains on investments in the Core Funds and the Money Market Fund, earnings from such investments are disclosed on the Statement of Operations as “Affiliated dividend income” and “Income from securities lending, net”, respectively.
The Fund may enter into certain securities purchase or sale transactions under Board approved Rule 17a-7 procedures. Rule 17a-7 is an exemptive rule under the 1940 Act that, subject to certain conditions, permits purchase and sale transactions among affiliated investment companies, or between an investment company and a person that is affiliated solely by reason of having a common (or affiliated) investment adviser, common directors/trustees, and/or common officers. For the year ended October 31, 2024, no Rule 17a-7 transactions were entered into by the Fund.
PGIM Absolute Return Bond Fund 91
Notes to Financial Statements (continued)
The aggregate cost of purchases and proceeds from sales of portfolio securities (excluding short-term investments and U.S. Government securities) for the reporting period ended October 31, 2024, were as follows:
| | |
| Cost of Purchases | | Proceeds from Sales |
| |
$2,083,585,848 | | $1,219,600,906 |
A summary of the cost of purchases and proceeds from sales of shares of affiliated mutual funds for the year ended October 31, 2024, is presented as follows:
| | | | | | | | | | | | | | | | | | | | | | | | | | | | |
Value, Beginning of Year | | Cost of
Purchases | | | Proceeds
from Sales | | | Change in Unrealized Gain (Loss) | | | Realized Gain (Loss) | | | Value,
End of Year | | | Shares, End of Year | | | Income | |
|
Long-Term Investments - Affiliated Exchange-Traded Funds(1)(wa): | |
|
PGIM AAA CLO ETF | |
| $ — | | | $ 25,924,132 | | | | $ — | | | | $ 113,288 | | | $ | — | | | | $ 26,037,420 | | | | 507,750 | | | | $ 198,281 | |
|
PGIM Ultra Short Bond ETF | |
| $ — | | | $ 116,735,760 | | | | $ — | | | | $ 176,740 | | | $ | — | | | | $116,912,500 | | | | 2,350,000 | | | | $ 1,387,417 | |
| $ — | | | $ 142,659,892 | | | | $ — | | | | $ 290,028 | | | $ | — | | | | $142,949,920 | | | | | | | | $ 1,585,698 | |
|
Short-Term Investments - Affiliated Mutual Funds: | |
|
PGIM Core Government Money Market Fund (7-day effective yield 5.011%)(1)(wa) | |
| $ 14,738,696 | | | $1,234,703,759 | | | | $1,171,981,091 | | | | $ — | | | $ | — | | | | $ 77,461,364 | | | | 77,461,364 | | | | $ 3,179,017 | |
|
PGIM Core Short-Term Bond Fund(1)(wa) | |
| 115,751,574 | | | 4,573,041 | | | | 120,228,311 | | | | (262,326) | | | | 166,022 | | | | — | | | | — | | | | 5,722,521 | |
|
PGIM Institutional Money Market Fund (7-day effective yield 5.096%)(1)(b)(wa) | |
| 13,230,599 | | | 203,865,276 | | | | 206,729,314 | | | | (12,771 | ) | | | 11,321 | | | | 10,365,111 | | | | 10,370,296 | | | | 80,120 | (2) |
| $143,720,869 | | | $1,443,142,076 | | | | $1,498,938,716 | | | | $(275,097 | ) | | $ | 177,343 | | | | $ 87,826,475 | | | | | | | | $ 8,981,658 | |
| $143,720,869 | | | $1,585,801,968 | | | | $1,498,938,716 | | | | $ 14,931 | | | $ | 177,343 | | | | $230,776,395 | | | | | | | | $10,567,356 | |
| (1) | The Fund did not have any capital gain distributions during the reporting period. |
| (2) | The amount, or a portion thereof, represents the affiliated securities lending income shown on the Statement of Operations. |
| (b) | Represents security, or portion thereof, purchased with cash collateral received for securities on loan and includes dividend reinvestment. |
| (wa) | Represents investments in Funds affiliated with the Manager. |
| 6. | Distributions and Tax Information |
Distributions to shareholders, which are determined in accordance with federal income tax regulations and which may differ from GAAP, are recorded on the ex-date. In order to present total distributable earnings (loss) and paid-in capital in excess of par on the
92
Statement of Assets and Liabilities that more closely represent their tax character, certain adjustments have been made to total distributable earnings (loss) and paid-in capital in excess of par for the Fund. The adjustments were due to distribution in excess of income and prior year post financial statement adjustments.
For the year ended October 31, 2024, the adjustments were as follows:
| | |
Total Distributable Earnings (Loss) | | Paid-in Capital in Excess of Par |
$1,295,400 | | $(1,295,400) |
For the year ended October 31, 2024, the tax character of dividends paid as reflected in the Statement of Changes in Net Assets were as follows:
| | | | | | |
Ordinary Income | | Long-Term Capital Gains | | Tax Return of Capital | | Total Dividends and Distributions |
$116,930,512 | | $— | | $— | | $116,930,512 |
For the year ended October 31, 2023, the tax character of dividends paid as reflected in the Statement of Changes in Net Assets were as follows:
| | | | | | |
Ordinary Income | | Long-Term Capital Gains | | Tax Return of Capital | | Total Dividends and Distributions |
$64,803,658 | | $— | | $2,375,806 | | $67,179,464 |
As of October 31, 2024, there were no accumulated undistributed earnings on a tax basis.
The United States federal income tax basis of the Fund’s investments and the net unrealized depreciation as of October 31, 2024 were as follows:
| | | | | | | | |
| Tax Basis | | Gross Unrealized Appreciation | | Gross Unrealized Depreciation | | | | Net
Unrealized
Depreciation |
$2,733,690,980 | | $72,362,653 | | $(80,526,398) | | | | $(8,163,745) |
The differences between GAAP and tax basis were primarily attributable to deferred losses on wash sales, swaps, mark-to-market of futures and forwards contracts, difference in the treatment of premium amortization and investment in partnerships.
For federal income tax purposes, the Fund had an approximated capital loss carryforward as of October 31, 2024 which can be carried forward for an unlimited period. No capital gains distributions are expected to be paid to shareholders until net gains have been realized in excess of such losses.
| | |
Capital Loss Carryforward | | Capital Loss Carryforward Utilized |
$228,786,000 | | $— |
PGIM Absolute Return Bond Fund 93
Notes to Financial Statements (continued)
The Manager has analyzed the Fund’s tax positions taken on federal, state and local income tax returns for all open tax years and has concluded that no provision for income tax is required in the Fund’s financial statements for the current reporting period. Since tax authorities can examine previously filed tax returns, the Fund’s U.S. federal and state tax returns for each of the four fiscal years up to the most recent fiscal year ended October 31, 2024 are subject to such review.
The Fund offers Class A, Class C, Class Z and Class R6 shares. Class A shares are sold with a maximum front-end sales charge of 3.25%. Investors who purchase $500,000 or more of Class A shares and sell those shares within 12 months of purchase are subject to a CDSC of 1% on sales although these purchases are not subject to a front-end sales charge. The Class A CDSC is waived for certain retirement and/or benefit plans. A special exchange privilege is also available for shareholders who qualified to purchase Class A shares at net asset value. Class C shares are sold with a CDSC of 1% on sales made within 12 months of purchase. Class C shares will automatically convert to Class A shares on a monthly basis approximately eight years (ten years prior to January 22, 2021) after purchase. Class Z and Class R6 shares are not subject to any sales or redemption charges and are available exclusively for sale to a limited group of investors.
Under certain circumstances, an exchange may be made from specified share classes of the Fund to one or more other share classes of the Fund as presented in the table of transactions in shares of beneficial interest, below.
The RIC has authorized an unlimited number of shares of beneficial interest of the Fund at $0.001 par value per share, currently divided into four classes, designated Class A, Class C, Class Z and Class R6.
As of October 31, 2024, Prudential, through its affiliated entities, including affiliated funds (if applicable), owned shares of the Fund as follows:
| | | | |
| Class | | Number of Shares | | Percentage of Outstanding Shares |
Z | | 31,229 | | 0.1% |
At the reporting period end, the number of shareholders holding greater than 5% of the Fund are as follows:
| | | | |
| | | Number of Shareholders | | Percentage of Outstanding Shares |
Affiliated | | — | | —% |
Unaffiliated | | 9 | | 88.8 |
94
Transactions in shares of beneficial interest were as follows:
| | | | | | | | |
| | | |
| Share Class | | Shares | | | Amount | |
| | |
Class A | | | | | | | | |
Year ended October 31, 2024: | | | | | | | | |
Shares sold | | | 7,667,821 | | | $ | 69,410,971 | |
Shares issued in reinvestment of dividends and distributions | | | 689,023 | | | | 6,238,418 | |
Shares purchased | | | (3,703,995 | ) | | | (33,467,150 | ) |
Net increase (decrease) in shares outstanding before conversion | | | 4,652,849 | | | | 42,182,239 | |
Shares issued upon conversion from other share class(es) | | | 690,426 | | | | 6,243,460 | |
Shares purchased upon conversion into other share class(es) | | | (266,612 | ) | | | (2,410,198 | ) |
Net increase (decrease) in shares outstanding | | | 5,076,663 | | | $ | 46,015,501 | |
| | |
Year ended October 31, 2023: | | | | | | | | |
Shares sold | | | 3,273,563 | | | $ | 28,918,593 | |
Shares issued in reinvestment of dividends and distributions | | | 525,133 | | | | 4,640,379 | |
Shares purchased | | | (3,063,639 | ) | | | (27,039,908 | ) |
Net increase (decrease) in shares outstanding before conversion | | | 735,057 | | | | 6,519,064 | |
Shares issued upon conversion from other share class(es) | | | 917,128 | | | | 8,094,155 | |
Shares purchased upon conversion into other share class(es) | | | (422,422 | ) | | | (3,726,460 | ) |
Net increase (decrease) in shares outstanding | | | 1,229,763 | | | $ | 10,886,759 | |
| | |
Class C | | | | | | | | |
Year ended October 31, 2024: | | | | | | | | |
Shares sold | | | 2,412,933 | | | $ | 21,912,187 | |
Shares issued in reinvestment of dividends and distributions | | | 161,394 | | | | 1,465,899 | |
Shares purchased | | | (593,844 | ) | | | (5,375,653 | ) |
Net increase (decrease) in shares outstanding before conversion | | | 1,980,483 | | | | 18,002,433 | |
Shares purchased upon conversion into other share class(es) | | | (350,709 | ) | | | (3,181,503 | ) |
Net increase (decrease) in shares outstanding | | | 1,629,774 | | | $ | 14,820,930 | |
| | |
Year ended October 31, 2023: | | | | | | | | |
Shares sold | | | 585,316 | | | $ | 5,189,425 | |
Shares issued in reinvestment of dividends and distributions | | | 135,373 | | | | 1,199,267 | |
Shares purchased | | | (942,665 | ) | | | (8,339,381 | ) |
Net increase (decrease) in shares outstanding before conversion | | | (221,976 | ) | | | (1,950,689 | ) |
Shares purchased upon conversion into other share class(es) | | | (484,926 | ) | | | (4,289,276 | ) |
Net increase (decrease) in shares outstanding | | | (706,902 | ) | | $ | (6,239,965 | ) |
PGIM Absolute Return Bond Fund 95
Notes to Financial Statements (continued)
| | | | | | | | |
| | | |
| Share Class | | Shares | | | Amount | |
| | |
Class Z | | | | | | | | |
Year ended October 31, 2024: | | | | | | | | |
Shares sold | | | 214,807,755 | | | $ | 1,950,293,580 | |
Shares issued in reinvestment of dividends and distributions | | | 10,648,442 | | | | 96,907,781 | |
Shares purchased | | | (89,399,355 | ) | | | (811,168,765 | ) |
Net increase (decrease) in shares outstanding before conversion | | | 136,056,842 | | | | 1,236,032,596 | |
Shares issued upon conversion from other share class(es) | | | 391,872 | | | | 3,561,033 | |
Shares purchased upon conversion into other share class(es) | | | (1,301,938 | ) | | | (11,851,444 | ) |
Net increase (decrease) in shares outstanding | | | 135,146,776 | | | $ | 1,227,742,185 | |
| | |
Year ended October 31, 2023: | | | | | | | | |
Shares sold | | | 103,099,124 | | | $ | 915,661,477 | |
Shares issued in reinvestment of dividends and distributions | | | 5,754,672 | | | | 51,052,303 | |
Shares purchased | | | (108,685,294 | ) | | | (962,092,248 | ) |
Net increase (decrease) in shares outstanding before conversion | | | 168,502 | | | | 4,621,532 | |
Shares issued upon conversion from other share class(es) | | | 484,576 | | | | 4,293,372 | |
Shares purchased upon conversion into other share class(es) | | | (729,561 | ) | | | (6,491,946 | ) |
Net increase (decrease) in shares outstanding | | | (76,483 | ) | | $ | 2,422,958 | |
| | |
Class R6 | | | | | | | | |
Year ended October 31, 2024: | | | | | | | | |
Shares sold | | | 9,324,324 | | | $ | 84,414,393 | |
Shares issued in reinvestment of dividends and distributions | | | 557,532 | | | | 5,047,496 | |
Shares purchased | | | (3,916,990 | ) | | | (35,468,150 | ) |
Net increase (decrease) in shares outstanding before conversion | | | 5,964,866 | | | | 53,993,739 | |
Shares issued upon conversion from other share class(es) | | | 844,587 | | | | 7,654,250 | |
Shares purchased upon conversion into other share class(es) | | | (1,719 | ) | | | (15,598 | ) |
Net increase (decrease) in shares outstanding | | | 6,807,734 | | | $ | 61,632,391 | |
| | |
Year ended October 31, 2023: | | | | | | | | |
Shares sold | | | 1,546,836 | | | $ | 13,665,612 | |
Shares issued in reinvestment of dividends and distributions | | | 388,862 | | | | 3,432,439 | |
Shares purchased | | | (2,200,992 | ) | | | (19,394,024 | ) |
Net increase (decrease) in shares outstanding before conversion | | | (265,294 | ) | | | (2,295,973 | ) |
Shares issued upon conversion from other share class(es) | | | 237,980 | | | | 2,120,155 | |
Net increase (decrease) in shares outstanding | | | (27,314 | ) | | $ | (175,818 | ) |
The RIC, on behalf of the Fund, along with other affiliated registered investment companies (the “Participating Funds”), is a party to a Syndicated Credit Agreement (“SCA”) with a
96
group of banks. The purpose of the SCA is to provide an alternative source of temporary funding for capital share redemptions. The table below provides details of the current SCA in effect at the reporting period-end as well as the prior SCA.
| | | | |
| | | Current SCA | | Prior SCA |
Term of Commitment | | 9/27/2024 – 9/25/2025 | | 9/29/2023 – 9/26/2024 |
Total Commitment | | $ 1,200,000,000 | | $ 1,200,000,000 |
Annualized Commitment Fee on the Unused Portion of the SCA | | 0.15% | | 0.15% |
Annualized Interest Rate on Borrowings | | 1.00% plus the higher of (1)
the effective federal funds rate, (2) the daily SOFR rate plus 0.10% or (3) zero percent | | 1.00% plus the higher of (1)
the effective federal funds rate, (2) the daily SOFR rate plus 0.10% or (3) zero percent |
Certain affiliated registered investment companies that are parties to the SCA include portfolios that are subject to a predetermined mathematical formula used to manage certain benefit guarantees offered under variable annuity contracts. The formula may result in large scale asset flows into and out of these portfolios. Consequently, these portfolios may be more likely to utilize the SCA for purposes of funding redemptions. It may be possible for those portfolios to fully exhaust the committed amount of the SCA, thereby requiring the Manager to allocate available funding per a Board-approved methodology designed to treat the Participating Funds in the SCA equitably.
The Fund did not utilize the SCA during the year ended October 31, 2024.
| 9. | Risks of Investing in the Fund |
The Fund’s principal risks include, but are not limited to, some or all of the risks discussed below. For further information on the Fund’s risks, please refer to the Fund’s Prospectus and Statement of Additional Information.
Collateralized Loan Obligations (“CLOs”) Risk: CLOs are subject to credit, interest rate, valuation, and prepayment and extension risks. These securities also are subject to risk of default on the underlying asset, particularly during periods of economic downturn. The market value of CLOs may be affected by, among other things, changes in the market value of the underlying assets held by the CLO, changes in the distributions on the underlying assets, defaults and recoveries on the underlying assets, capital gains and losses on the underlying assets, prepayments on underlying assets and the availability, prices and interest rate of underlying assets.
“Covenant-Lite” Risk: Some of the loans or debt obligations in which the Fund may invest or get exposure to may be “covenant-lite”, which means the loans or obligations contain fewer financial maintenance covenants than other loans or obligations (in some cases, none) and do not include terms which allow the lender to monitor the borrower’s performance and declare a default if certain criteria are breached. An investment by the Fund in a covenant-lite loan may potentially hinder the ability to reprice credit risk associated with the
PGIM Absolute Return Bond Fund 97
Notes to Financial Statements (continued)
issuer and reduce the ability to restructure a problematic loan and mitigate potential loss. The Fund may also experience difficulty, expenses or delays in enforcing its rights on its holdings of covenant-lite loans or obligations. As a result of these risks, the Fund’s exposure to losses may be increased, which could result in an adverse impact on the Fund’s net income and NAV.
Credit Risk: This is the risk that the issuer, the guarantor or the insurer of a fixed income security, or the counterparty to a contract, may be unable or unwilling to make timely principal and interest payments, or to otherwise honor its obligations. Additionally, fixed income securities could lose value due to a loss of confidence in the ability of the issuer, guarantor, insurer or counterparty to pay back debt. The lower the credit quality of a bond, the more sensitive it is to credit risk.
Currency Risk: The Fund’s net asset value could decline as a result of changes in exchange rates, which could adversely affect the Fund’s investments in currencies, or in securities that trade in, and receive revenues related to, currencies, or in derivatives that provide exposure to currencies. Certain foreign countries may impose restrictions on the ability of issuers of foreign securities to make payment of principal and interest or dividends to investors located outside the country, due to blockage of foreign currency exchanges or otherwise.
Debt Obligations Risk: Debt obligations are fixed income investments that are subject to credit risk, market risk and interest rate risk. The Fund’s holdings, share price, yield and total return may also fluctuate in response to bond market movements. The value of bonds may decline for issuer-related reasons, including management performance, financial leverage and reduced demand for the issuer’s goods and services. Certain types of fixed income obligations also may be subject to “call and redemption risk,” which is the risk that the issuer may call a bond held by the Fund for redemption before it matures and the Fund may not be able to reinvest at the same rate of interest and therefore would earn less income.
Derivatives Risk: Derivatives involve special risks and costs and may result in losses to the Fund. The successful use of derivatives requires sophisticated management, and, to the extent that derivatives are used, the Fund will depend on the subadviser’s ability to analyze and manage derivatives transactions. The prices of derivatives may move in unexpected ways, especially in abnormal market conditions. Some derivatives are “leveraged” or may create economic leverage for the Fund and therefore may magnify or otherwise increase investment losses to the Fund. The Fund’s use of derivatives may also increase the amount of taxes payable by shareholders.
Other risks arise from the potential inability to terminate or sell derivatives positions. A liquid secondary market may not always exist for the Fund’s derivatives positions. In fact, many
98
over-the-counter derivative instruments will not have liquidity beyond the counterparty to the instrument. Over-the-counter derivative instruments also involve the risk that the other party will not meet its obligations to the Fund. The use of derivatives also exposes the Fund to operational issues, such as documentation and settlement issues, systems failures, inadequate control and human error.
Derivatives may also involve legal risks, such as insufficient documentation, the lack of capacity or authority of a counterparty to execute or settle a transaction, and the legality and enforceability of derivatives contracts. The U.S. Government and foreign governments have adopted (and may adopt further) regulations governing derivatives markets, including mandatory clearing of certain derivatives, margin and reporting requirements and risk exposure limitations. Regulation of derivatives may make derivatives more costly, limit their availability or utility to the Fund, or otherwise adversely affect their performance or disrupt markets.
Economic and Market Events Risk: Events in the U.S. and global financial markets, including actions taken by the U.S. Federal Reserve or foreign central banks to stimulate or stabilize economic growth or the functioning of the securities markets, or otherwise reduce inflation, may at times result in unusually high market volatility, which could negatively impact performance. Governmental efforts to curb inflation often have negative effects on the level of economic activity. Relatively reduced liquidity in credit and fixed income markets could adversely affect issuers worldwide.
Floating Rate and Other Loans Risk: The Fund’s ability to receive payments of principal and interest and other amounts in connection with loans (whether through participations, assignments or otherwise) will depend primarily on the financial condition of the borrower. The failure by the Fund to receive scheduled interest or principal payments on a loan because of a default, bankruptcy or any other reason would adversely affect the income of the Fund and would likely reduce the value of its assets. Even with loans secured by collateral, there is the risk that the value of the collateral may decline, may be insufficient to meet the obligations of the borrower, or be difficult to liquidate. In the event of a default, the Fund may have difficulty collecting on any collateral and would not have the ability to collect on any collateral for an uncollateralized loan. Further, the Fund’s access to collateral, if any, may be limited by bankruptcy laws. Due to the nature of the private syndication of senior loans, including, for example, lack of publicly-available information, some senior loans are not as easily purchased or sold as publicly-traded securities. In addition, loan participations generally are subject to restrictions on transfer, and only limited opportunities may exist to sell loan participations in secondary markets. As a result, it may be difficult for the Fund to value loans or sell loans at an acceptable price when it wants to sell them. Loans trade in an over-the-counter market, and confirmation and settlement, which are effected through standardized procedures and documentation, may take significantly longer than seven days to complete. Extended trade settlement periods may, in unusual market conditions with a high volume of shareholder redemptions, present a risk to shareholders regarding the Fund’s ability to pay redemption proceeds in a timely manner. In some instances, loans and loan participations are not rated by independent credit rating agencies; in such instances, a
PGIM Absolute Return Bond Fund 99
Notes to Financial Statements (continued)
decision by the Fund to invest in a particular loan or loan participation could depend exclusively on the subadviser’s credit analysis of the borrower, or in the case of a loan participation, of the intermediary holding the portion of the loan that the Fund has purchased. To the extent the Fund invests in loans of non-U.S. issuers, the risks of investing in non-U.S. issuers are applicable. Loans may not be considered to be “securities” and as a result may not benefit from the protections of the federal securities laws, including anti-fraud protections and those with respect to the use of material non-public information, so that purchasers, such as the Fund, may not have the benefit of these protections. If the Fund is in possession of material non-public information about a borrower as a result of its investment in such borrower’s loan, the Fund may not be able to enter into a transaction with respect to a publicly-traded security of the borrower when it would otherwise be advantageous to do so.
Foreign Securities Risk: Investments in securities of non-U.S. issuers (including those denominated in U.S. dollars) may involve more risk than investing in securities of U.S. issuers. Foreign political, economic and legal systems, especially those in developing and emerging market countries, may be less stable and more volatile than in the United States. Foreign legal systems generally have fewer regulatory requirements than the U.S. legal system, particularly those of emerging markets. In general, less information is publicly available with respect to non-U.S. companies than U.S. companies. Non-U.S. companies generally are not subject to the same accounting, auditing, and financial reporting standards as are U.S. companies. Additionally, the changing value of foreign currencies and changes in exchange rates could also affect the value of the assets the Fund holds and the Fund’s performance. Certain foreign countries may impose restrictions on the ability of issuers of foreign securities to make payment of principal and interest or dividends to investors located outside the country, due to blockage of foreign currency exchanges or otherwise. Investments in emerging markets are subject to greater volatility and price declines.
In addition, the Fund’s investments in non-U.S. securities may be subject to the risks of nationalization or expropriation of assets, imposition of currency exchange controls or restrictions on the repatriation of non-U.S. currency, confiscatory taxation and adverse diplomatic developments. Special U.S. tax considerations may apply.
Increase in Expenses Risk: Your actual cost of investing in the Fund may be higher than the expenses shown in the expense table in the Fund’s prospectus for a variety of reasons. For example, expense ratios may be higher than those shown if average net assets decrease. Net assets are more likely to decrease and Fund expense ratios are more likely to increase when markets are volatile. Active and frequent trading of Fund securities can increase expenses.
100
Interest Rate Risk: The value of your investment may go down when interest rates rise. A rise in rates tends to have a greater impact on the prices of longer term or duration debt securities. Similarly, a rise in interest rates may also have a greater negative impact on the value of equity securities whose issuers expect earnings further out in the future. For example, a fixed income security with a duration of three years is expected to decrease in value by approximately 3% if interest rates increase by 1%. This is referred to as “duration risk.” When interest rates fall, the issuers of debt obligations may prepay principal more quickly than expected, and the Fund may be required to reinvest the proceeds at a lower interest rate. This is referred to as “prepayment risk.” For premium bonds (bonds acquired at prices that exceed their par or principal value) purchased by the Fund, prepayment risk may be elevated. When interest rates rise, debt obligations may be repaid more slowly than expected, and the value of the Fund’s holdings may fall sharply. This is referred to as “extension risk.” The Fund may lose money if short-term or long-term interest rates rise sharply or in a manner not anticipated by the subadviser.
Junk Bonds Risk: High-yield, high-risk bonds have predominantly speculative characteristics, including particularly high credit risk. Junk bonds tend to have lower market liquidity than higher-rated securities. The liquidity of particular issuers or industries within a particular investment category may shrink or disappear suddenly and without warning. The non-investment grade bond market can experience sudden and sharp price swings and become illiquid due to a variety of factors, including changes in economic forecasts, stock market activity, large sustained sales by major investors, a high profile default or a change in the market’s psychology.
Large Shareholder and Large Scale Redemption Risk: Certain individuals, accounts, funds (including funds affiliated with the Manager) or institutions, including the Manager and its affiliates, may from time to time own or control a substantial amount of the Fund’s shares. There is no requirement that these entities maintain their investment in the Fund. There is a risk that such large shareholders or that the Fund’s shareholders generally may redeem all or a substantial portion of their investments in the Fund in a short period of time, which could have a significant negative impact on the Fund’s NAV, liquidity, and brokerage costs. Large redemptions could also result in tax consequences to shareholders and impact the Fund’s ability to implement its investment strategy. The Fund’s ability to pursue its investment objective after one or more large scale redemptions may be impaired and, as a result, the Fund may invest a larger portion of its assets in cash or cash equivalents.
Liquidity Risk: Liquidity risk is the risk that the Fund could not meet requests to redeem shares issued by the Fund without significant dilution of remaining investors’ interests in the Fund. The Fund may invest in instruments that trade in lower volumes and are more illiquid than other investments. If the Fund is forced to sell these investments to pay redemption proceeds or for other reasons, the Fund may lose money. In addition, when there is no willing buyer and investments cannot be readily sold at the desired time or price, the Fund may have to accept a lower price or may not be able to sell the instrument at all. An inability to sell a portfolio position can adversely affect the Fund’s value or prevent the Fund from being able to take advantage of other investment opportunities.
PGIM Absolute Return Bond Fund 101
Notes to Financial Statements (continued)
Management Risk: Actively managed funds are subject to management risk. The subadviser will apply investment techniques and risk analyses in making investment decisions for the Fund, but the subadviser’s judgments about the attractiveness, value or market trends affecting a particular security, industry or sector or about market movements may be incorrect. Additionally, the investments selected for the Fund may underperform the markets in general, the Fund’s benchmark and other funds with similar investment objectives.
Market Disruption and Geopolitical Risks: Market disruption can be caused by economic, financial or political events and factors, including but not limited to, international wars or conflicts (including Russia’s military invasion of Ukraine and the Israel-Hamas war), geopolitical developments (including trading and tariff arrangements, sanctions and cybersecurity attacks), instability in regions such as Asia, Eastern Europe and the Middle East, terrorism, natural disasters and public health epidemics (including the outbreak of COVID-19 globally).
The extent and duration of such events and resulting market disruptions cannot be predicted, but could be substantial and could magnify the impact of other risks to the Fund. These and other similar events could adversely affect the U.S. and foreign financial markets and lead to increased market volatility, reduced liquidity in the securities markets, significant negative impacts on issuers and the markets for certain securities and commodities and/or government intervention. They may also cause short- or long-term economic uncertainties in the United States and worldwide. As a result, whether or not the Fund invests in securities of issuers located in or with significant exposure to the countries directly affected, the value and liquidity of the Fund’s investments may be negatively impacted. Further, due to closures of certain markets and restrictions on trading certain securities, the value of certain securities held by the Fund could be significantly impacted, which could lead to such securities being valued at zero.
Market Risk: Securities markets may be volatile and the market prices of the Fund’s securities may decline. Securities fluctuate in price based on changes in an issuer’s financial condition and overall market and economic conditions. If the market prices of the securities owned by the Fund fall, the value of your investment in the Fund will decline.
Mortgage-Backed and Asset-Backed Securities Risk: Mortgage-backed and asset-backed securities tend to increase in value less than other debt securities when interest rates decline, but are subject to similar risk of decline in market value during periods of rising interest rates. The values of mortgage-backed and asset-backed securities become more volatile as interest rates rise. In a period of declining interest rates, the Fund may be required to reinvest more frequent prepayments on mortgage-backed and asset-backed securities in lower-yielding investments.
102
Portfolio Turnover Risk: The length of time the Fund has held a particular security is not generally a consideration in investment decisions. Under certain market conditions, the Fund’s turnover rate may be higher than that of other mutual funds. Portfolio turnover generally involves some expense to the Fund, including brokerage commissions or dealer mark-ups and other transaction costs on the sale of securities and reinvestment in other securities. These transactions may result in realization of taxable capital gains. The trading costs and tax effects associated with portfolio turnover may adversely affect the Fund’s investment performance.
Structured Products Risk: Holders of structured product securities bear risks of the underlying investments, index or reference obligation. Certain structured products may be thinly traded or have a limited trading market, and as a result may be characterized as illiquid. The possible lack of a liquid secondary market for structured securities and the resulting inability of the Fund to sell a structured security could expose the Fund to losses and could make structured securities more difficult for the Fund to value accurately, which may also result in additional costs. Structured products are also subject to credit risk; the assets backing the structured product may be insufficient to pay interest or principal. In addition to the general risks associated with investments in fixed income, structured products carry additional risks, including, but not limited to: the possibility that distributions from collateral securities will not be adequate to make interest or other payments; the quality of the collateral may decline in value or default; and the possibility that the structured products are subordinate to other classes. Structured securities are generally privately negotiated debt obligations where the principal and/or interest or value of the structured security is determined by reference to the performance of a specific asset, benchmark asset, market or interest rate (“reference instrument”), and changes in the reference instrument or security may cause significant price fluctuations, or could cause the interest rate on the structured security to be reduced to zero. Holders of structured products indirectly bear risks associated with the reference instrument, are subject to counterparty risk and typically do not have direct rights against the reference instrument. Structured products may also entail structural complexity and documentation risk and there is no guarantee that the courts or administrators will interpret the priority of principal and interest payments as expected.
U.S. Government and Agency Securities Risk: U.S. Treasury obligations are backed by the “full faith and credit” of the U.S. Government. Securities issued or guaranteed by federal agencies or authorities and U.S. Government-sponsored instrumentalities or enterprises may or may not be backed by the full faith and credit of the U.S. Government. For example, securities issued by the Federal Home Loan Mortgage Corporation, the Federal National Mortgage Association and the Federal Home Loan Banks are neither insured nor guaranteed by the U.S. Government. These securities may be supported by the ability to borrow from the U.S. Treasury or only by the credit of the issuing agency, authority, instrumentality or enterprise and, as a result, are subject to greater credit risk than securities issued or guaranteed by the U.S. Treasury. Further, the U.S. Government and its agencies, authorities, instrumentalities and enterprises do not guarantee the market value of their securities; consequently, the value of such securities will fluctuate. This may be the case
PGIM Absolute Return Bond Fund 103
Notes to Financial Statements (continued)
especially when there is any controversy or ongoing uncertainty regarding the status of negotiations in the U.S. Congress to increase the statutory debt ceiling. Such controversy or uncertainty could, among other things, result in the credit quality rating of the U.S. Government being downgraded and reduced prices of U.S. Treasury securities. If the U.S. Congress is unable to negotiate an adjustment to the statutory debt ceiling, there is also the risk that the U.S. Government may default on payments on certain U.S. Government securities, including those held by the Fund, which could have a negative impact on the Fund. An increase in demand for U.S. Government securities resulting from an increase in demand for government money market funds may lead to lower yields on such securities.
104
Report of Independent Registered Public Accounting Firm
To the Board of Trustees of Prudential Investment Portfolios 9 and Shareholders of PGIM Absolute Return Bond Fund
Opinion on the Financial Statements
We have audited the accompanying statement of assets and liabilities, including the schedule of investments, of PGIM Absolute Return Bond Fund (one of the funds constituting Prudential Investment Portfolios 9, referred to hereafter as the “Fund”) as of October 31, 2024, the related statement of operations for the year ended October 31, 2024, the statements of changes in net assets for each of the two years in the period ended October 31, 2024, including the related notes, and the financial highlights for each of the five years in the period ended October 31, 2024 (collectively referred to as the “financial statements”). In our opinion, the financial statements present fairly, in all material respects, the financial position of the Fund as of October 31, 2024, the results of its operations for the year then ended, the changes in its net assets for each of the two years in the period ended October 31, 2024 and the financial highlights for each of the five years in the period ended October 31, 2024 in conformity with accounting principles generally accepted in the United States of America.
Basis for Opinion
These financial statements are the responsibility of the Fund’s management. Our responsibility is to express an opinion on the Fund’s financial statements based on our audits. We are a public accounting firm registered with the Public Company Accounting Oversight Board (United States) (PCAOB) and are required to be independent with respect to the Fund in accordance with the U.S. federal securities laws and the applicable rules and regulations of the Securities and Exchange Commission and the PCAOB.
We conducted our audits of these financial statements in accordance with the standards of the PCAOB. Those standards require that we plan and perform the audit to obtain reasonable assurance about whether the financial statements are free of material misstatement, whether due to error or fraud.
Our audits included performing procedures to assess the risks of material misstatement of the financial statements, whether due to error or fraud, and performing procedures that respond to those risks. Such procedures included examining, on a test basis, evidence regarding the amounts and disclosures in the financial statements. Our audits also included evaluating the accounting principles used and significant estimates made by management, as well as evaluating the overall presentation of the financial statements. Our procedures included confirmation of securities owned as of October 31, 2024 by correspondence with the custodian, transfer agent and brokers. We believe that our audits provide a reasonable basis for our opinion.
/s/PricewaterhouseCoopers LLP
New York, New York
December 18, 2024
We have served as the auditor of one or more investment companies in the PGIM Retail Funds complex since 2020.
PGIM Absolute Return Bond Fund 105
Other Information
Form N-CSR Item 8 - Changes in and Disagreements with Accountants for Open-End Management Investment Companies - None.
Form N-CSR Item 9 - Proxy Disclosures for Open-End Management Investment Companies-None.
Form N-CSR Item 10 - Remuneration Paid to Directors, Officers, and Others of Open-End Management Investment Companies - Included within the Statement of Operations of the financial statements filed under Item 7 of this Form.
Form N-CSR Item 11 - Statement Regarding Basis for Approval of Investment Advisory Contract.
Approval of Advisory Agreements
PGIM Absolute Return Bond Fund
The Fund’s Board of Trustees
The Board of Trustees (the “Board”) of PGIM Absolute Return Bond Fund (the “Fund”)1 consists of ten individuals, eight of whom are not “interested persons” of the Fund, as defined in the Investment Company Act of 1940, as amended (the “1940 Act”) (the “Independent Trustees”). The Board is responsible for the oversight of the Fund and its operations, and performs the various duties imposed on the directors of investment companies by the 1940 Act. The Independent Trustees have retained independent legal counsel to assist them in connection with their duties. The Chair of the Board is an Independent Trustee. The Board has established five standing committees: the Audit Committee, the Nominating and Governance Committee, the Compliance Committee and two Investment Committees. Each committee is chaired by, and composed of, Independent Trustees.
Annual Approval of the Fund’s Advisory Agreements
As required under the 1940 Act, the Board determines annually whether to renew the Fund’s management agreement with PGIM Investments LLC (“PGIM Investments”), the Fund’s subadvisory agreement with PGIM, Inc. (“PGIM”) on behalf of its PGIM Fixed Income unit (“PGIM Fixed Income”), and the Fund’s sub-subadvisory agreement with PGIM Limited (“PGIML”). In considering the renewal of the agreements, the Board, including all of the Independent Trustees, met on May 28 and June 4-6, 2024 (the “Board Meeting”) and approved the renewal of the agreements through July 31, 2025, after concluding that the renewal of the agreements was in the best interests of the Fund and its shareholders.
In advance of the meetings, the Board requested and received materials relating to the agreements, and had the opportunity to ask questions and request further information in connection with its consideration. Among other things, the Board considered comparative fee information from PGIM Investments, PGIM, and where appropriate, affiliates of PGIM. Also, the Board considered comparisons with other mutual funds in relevant peer universes and peer groups, as is further discussed below.
In approving the agreements, the Board, including the Independent Trustees advised by independent legal counsel, considered the factors it deemed relevant, including the nature, quality and extent of services provided by PGIM Investments, the subadviser, and, as relevant, its affiliates, the performance of the Fund, the profitability of PGIM Investments and its affiliates, expenses and fees, and the potential for economies of scale that may be
| 1 | PGIM Absolute Return Bond Fund is a series of Prudential Investment Portfolios 9. |
PGIM Absolute Return Bond Fund
Approval of Advisory Agreements (continued)
shared with the Fund and its shareholders as the Fund’s assets grow. In their deliberations, the Trustees did not identify any single factor which alone was responsible for the Board’s decision to approve an agreement with respect to the Fund. In connection with its deliberations, the Board considered information provided by PGIM Investments throughout the year at regular and special Board meetings, presentations from portfolio managers and other information, as well as information furnished at or in advance of the Board Meeting.
The Trustees determined that the overall arrangements between the Fund and PGIM Investments, which serves as the Fund’s investment manager pursuant to a management agreement, between PGIM Investments and PGIM, which, through its PGIM Fixed Income unit, serves as the Fund’s subadviser pursuant to the terms of a subadvisory agreement with PGIM Investments, and between PGIM and PGIML, which serves as the Fund’s sub-subadviser pursuant to the terms of a sub-subadvisory agreement with PGIM, are in the best interests of the Fund and its shareholders in light of the services performed, fees charged and such other matters as the Trustees considered relevant in the exercise of their business judgment. The Board considered the approval of the agreements for the Fund as part of its consideration of agreements for multiple funds, but its approvals were made on a fund-by-fund basis.
The material factors and conclusions that formed the basis for the Trustees’ reaching their determinations to approve the continuance of the agreements are separately discussed below.
Nature, Quality and Extent of Services
The Board received and considered information regarding the nature, quality and extent of services provided to the Fund by PGIM Investments, PGIM Fixed Income, and PGIML. The Board noted that PGIM Fixed Income and PGIML are affiliated with PGIM Investments. The Board considered the services provided by PGIM Investments, including but not limited to the oversight of the subadviser and sub-subadviser for the Fund, as well as the provision of accounting oversight, fund recordkeeping, compliance and other services to the Fund, such as PGIM Investments’ role as administrator for the Fund’s liquidity risk management program and as valuation designee. With respect to PGIM Investments’ oversight of the subadviser and sub-subadviser, the Board noted that PGIM Investments’ Strategic Investment Research Group (“SIRG”), which is a business unit of PGIM Investments, is responsible for monitoring and reporting to PGIM Investments senior management on the performance and operations of the subadviser and sub-subadviser. The Board also considered that PGIM Investments pays the salaries of all of the officers and interested Trustees of the Fund who are part of Fund management. The Board also considered the investment subadvisory services provided by PGIM Fixed Income and PGIML, including investment research and security selection, as well as adherence to the Fund’s investment restrictions and compliance with applicable Fund policies and procedures. The Board
Visit our website at pgim.com/investments
considered PGIM Investments’ evaluation of the subadviser and sub-subadviser, as well as PGIM Investments’ recommendation, based on its review of the subadviser and sub-subadviser, to renew the subadvisory and sub-subadvisory agreements.
The Board considered the qualifications, backgrounds and responsibilities of PGIM Investments’ senior management responsible for the oversight of the Fund, PGIM Fixed Income, and PGIML, and also considered the qualifications, backgrounds and responsibilities of PGIM Fixed Income’s portfolio managers who are responsible for the day-to-day management of the Fund’s portfolio. The Board was provided with information pertaining to PGIM Investments’, PGIM Fixed Income’s, and PGIML’s organizational structure, senior management, investment operations, and other relevant information pertaining to PGIM Investments, PGIM Fixed Income, and PGIML. The Board also noted that it received favorable compliance reports from the Fund’s Chief Compliance Officer (“CCO”) as to PGIM Investments, PGIM Fixed Income, and PGIML.
The Board concluded that it was satisfied with the nature, extent and quality of the investment management services provided by PGIM Investments, the subadvisory services provided to the Fund by PGIM Fixed Income, and the sub-subadvisory services provided by PGIML, and that there was a reasonable basis on which to conclude that the Fund benefits from the services provided by PGIM Investments, PGIM Fixed Income, and PGIML under the management, subadvisory and sub-subadvisory agreements.
Costs of Services and Profits Realized by PGIM Investments
The Board was provided with information on the profitability of PGIM Investments and its affiliates in serving as the Fund’s investment manager. The Board discussed with PGIM Investments the methodology utilized in assembling the information regarding profitability and considered its reasonableness. The Board recognized that it is difficult to make comparisons of profitability from fund management contracts because comparative information is not generally publicly available and is affected by numerous factors, including the structure of the particular adviser, the types of funds it manages, its business mix, numerous assumptions regarding allocations of direct and indirect costs, and the adviser’s capital structure and cost of capital. Taking these factors into account, the Board concluded that the profitability of PGIM Investments and its affiliates in relation to the services rendered was not unreasonable.
Economies of Scale
The Board received and discussed information concerning economies of scale that PGIM Investments may realize as the Fund’s assets grow beyond current levels. The Board noted that the management fee schedule for the Fund includes breakpoints, which have the effect of decreasing the fee rate as assets increase. During the course of time, the Board
PGIM Absolute Return Bond Fund
Approval of Advisory Agreements (continued)
has considered information regarding the launch date of the Fund, the management fees of the Fund compared to those of similarly managed funds and PGIM Investments’ investment in the Fund over time. The Board noted that economies of scale can be shared with the Fund in other ways, including low management fees from inception, additional technological and personnel investments to enhance shareholder services, and maintaining existing expense structures in the face of a rising cost environment. The Board also considered PGIM Investments’ assertion that it continually evaluates the management fee schedule of the Fund and the potential to share economies of scale through breakpoints or fee waivers as asset levels increase.
The Board recognized the inherent limitations of any analysis of economies of scale, stemming largely from the Board’s understanding that most of PGIM Investments’ costs are not specific to individual funds, but rather are incurred across a variety of products and services.
Other Benefits to PGIM Investments, PGIM Fixed Income, and PGIML
The Board considered potential ancillary benefits that might be received by PGIM Investments, PGIM Fixed Income, PGIML and their affiliates as a result of their relationship with the Fund. The Board concluded that potential benefits to be derived by PGIM Investments included transfer agency fees received by the Fund’s transfer agent (which is affiliated with PGIM Investments), as well as benefits to its reputation or other intangible benefits resulting from PGIM Investments’ association with the Fund. The Board concluded that the potential benefits to be derived by PGIM Fixed Income and PGIML included the ability to use soft dollar credits, as well as the potential benefits consistent with those generally resulting from an increase in assets under management, specifically, potential access to additional research resources and benefits to their reputations. The Board concluded that the benefits derived by PGIM Investments, PGIM Fixed Income, and PGIML were consistent with the types of benefits generally derived by investment managers and subadvisers to mutual funds.
Performance of the Fund / Fees and Expenses
The Board considered certain additional factors and made related conclusions relating to the historical performance of the Fund for the one, three-, and five-year periods ended December 31, 2023.
The Board also considered the Fund’s actual management fee, as well as the Fund’s net total expense ratio, for the fiscal year ended October 31, 2023. The Board considered the management fee for the Fund as compared to the management fee charged by PGIM Investments to other funds and the fee charged by other advisers to comparable mutual funds in a peer group. The actual management fee represents the fee rate actually paid by Fund shareholders and includes any fee waivers or reimbursements. The net total expense ratio for the Fund represents the actual expense ratio incurred by Fund shareholders.
Visit our website at pgim.com/investments
The mutual funds included in the peer universe, which was used to consider performance, and the peer group, which was used to consider expenses and fees, were objectively determined by Broadridge, an independent provider of mutual fund data. In certain circumstances, PGIM Investments also provided supplemental peer universe or peer group information, for reasons addressed with the Board. The comparisons placed the Fund in various quartiles over various periods, with the first quartile being the best 25% of the mutual funds (for performance, the best performing mutual funds and, for expenses, the lowest cost mutual funds).
The section below summarizes key factors considered by the Board and the Board’s conclusions regarding the Fund’s performance, fees and overall expenses. The table sets forth net performance comparisons (which reflect the impact on performance of fund expenses, or any subsidies, expense caps or waivers that may be applicable) with the peer universe, actual management fees with the peer group (which reflect the impact of any subsidies or fee waivers), and net total expenses with the peer group, each of which were key factors considered by the Board.
| | | | | | | | |
| | | | | |
| Net Performance | | 1 Year | | 3 Years | | 5 Years | | 10 Years |
| | 2nd Quartile | | 1st Quartile | | 1st Quartile | | 1st Quartile |
| |
Actual Management Fees: 2nd Quartile |
| |
Net Total Expenses: 2nd Quartile |
| · | | The Board noted that the Fund outperformed its benchmark index over all periods. |
| · | | The Board and PGIM Investments agreed to a contractual expense cap, which (exclusive of certain fees and expenses) caps total annual operating expenses at 0.70% for Class R6 shares, and 0.73% for Class Z shares through February 28, 2025. |
| · | | In addition, PGIM Investments will waive management fees or shared operating expenses on any share class to the same extent that it waives such expenses on any other share class, and has agreed that total annual fund operating expenses for Class R6 shares will not exceed total annual fund operating expenses for Class Z shares. |
| · | | The Board concluded that, in light of the above, it would be in the best interests of the Fund and its shareholders to renew the agreements. |
| · | | The Board concluded that the management fees (including subadvisory fees) and total expenses were reasonable in light of the services provided. |
* * *
After full consideration of these factors, the Board concluded that the approval of the agreements was in the best interests of the Fund and its shareholders.
PGIM Absolute Return Bond Fund
| | |
| Item 12 – | | Disclosure of Proxy Voting Policies and Procedures for Closed-End Management Investment Companies – Not applicable. |
| |
| Item 13 – | | Portfolio Managers of Closed-End Management Investment Companies – Not applicable. |
| |
| Item 14 – | | Purchases of Equity Securities by Closed-End Management Investment Company and Affiliated Purchasers – Not applicable. |
| |
| Item 15 – | | Submission of Matters to a Vote of Security Holders – There have been no material changes to the procedures by which shareholders may recommend nominees to the registrant’s board of directors. |
| |
| Item 16 – | | Controls and Procedures |
| | (a) | It is the conclusion of the registrant’s principal executive officer and principal financial officer that the effectiveness of the registrant’s current disclosure controls and procedures (such disclosure controls and procedures having been evaluated within 90 days of the date of this filing) provide reasonable assurance that the information required to be disclosed by the registrant has been recorded, processed, summarized and reported within the time period specified in the Commission’s rules and forms and that the information required to be disclosed by the registrant has been accumulated and communicated to the registrant’s principal executive officer and principal financial officer in order to allow timely decisions regarding required disclosure. |
| | (b) | There has been no significant change in the registrant’s internal control over financial reporting (as defined in Rule 30a-3(d) under the Act (17 CFR 270.30a-3(d))) that occurred during the period covered by this report that has materially affected, or is reasonably likely to materially affect, the registrant’s internal control over financial reporting. |
| | |
| Item 17 – | | Disclosure of Securities Lending Activities for Closed-End Management Investment Companies – Not applicable. |
| |
| Item 18 – | | Recovery of Erroneously Awarded Compensation – Not applicable. |
| |
| Item 19 – | | Exhibits |
| | (a)(2) | Policy required by the listing standards adopted pursuant to Rule 10D-1 under the Securities Exchange Act of 1934 – Not applicable. |
| | (a)(4) | Any written solicitation to purchase securities under Rule 23c-1 under the Investment Company Act of 1940 – Not applicable. |
| | (a)(5) | Change in the registrant’s independent public accountant – Not applicable. |
SIGNATURES
Pursuant to the requirements of the Securities Exchange Act of 1934 and the Investment Company Act of 1940, the registrant has duly caused this report to be signed on its behalf by the undersigned, thereunto duly authorized.
| | | | | | |
| Registrant: | | Prudential Investment Portfolios 9 | | | | |
| | | |
| By: | | /s/ Andrew R. French | | | | |
| | Andrew R. French | | | | |
| | Secretary | | | | |
| | | |
| Date: | | December 18, 2024 | | | | |
Pursuant to the requirements of the Securities Exchange Act of 1934 and the Investment Company Act of 1940, this report has been signed below by the following persons on behalf of the registrant and in the capacities and on the dates indicated.
| | | | | | |
| By: | | /s/ Stuart S. Parker | | | | |
| | Stuart S. Parker | | | | |
| | President and Principal Executive Officer | | | | |
| | | |
| Date: | | December 18, 2024 | | | | |
| | | |
| By: | | /s/ Christian J. Kelly | | | | |
| | Christian J. Kelly | | | | |
| | Chief Financial Officer (Principal Financial Officer) | | | | |
| | | |
| Date: | | December 18, 2024 | | | | |