UNITED STATES
SECURITIES AND EXCHANGE COMMISSION
Washington, D.C. 20549
FORM N-CSR
CERTIFIED SHAREHOLDER REPORT OF REGISTERED MANAGEMENT INVESTMENT
COMPANIES
| | |
| Investment Company Act file number: | | 811-09101 |
| |
| Exact name of registrant as specified in charter: | | Prudential Investment Portfolios 9 |
| |
| Address of principal executive offices: | | 655 Broad Street, 17th Floor |
| | Newark, New Jersey 07102 |
| |
| Name and address of agent for service: | | Andrew R. French |
| | 655 Broad Street, 17th Floor |
| | Newark, New Jersey 07102 |
| |
| Registrant’s telephone number, including area code: | | 800-225-1852 |
| |
| Date of fiscal year end: | | 10/31/2021 |
| |
| Date of reporting period: | | 10/31/2021 |
Item 1 – Reports to Stockholders

PGIM ABSOLUTE RETURN BOND FUND
ANNUAL REPORT
OCTOBER 31, 2021

|
|
To enroll in e-delivery, go to pgim.com/investments/resource/edelivery |
Table of Contents
This report is not authorized for distribution to prospective investors unless preceded or accompanied by a current prospectus.
The views expressed in this report and information about the Fund’s portfolio holdings are for the period covered by this report and are subject to change thereafter.
Mutual funds are distributed by Prudential Investment Management Services LLC (PIMS), member SIPC. PGIM Fixed Income is a unit of PGIM, Inc. (PGIM), a registered investment adviser. PIMS and PGIM are Prudential Financial companies. © 2021 Prudential Financial, Inc. and its related entities. PGIM and the PGIM logo are service marks of Prudential Financial, Inc. and its related entities, registered in many jurisdictions worldwide.
| | |
| 2 | | Visit our website at pgim.com/investments |
Letter from the President
| | |
 | | Dear Shareholder: We hope you find the annual report for the PGIM Absolute Return Bond Fund informative and useful. The report covers performance for the 12-month period that ended October 31, 2021. The global economy and markets continued to recover throughout the period from the ongoing impact of the COVID-19 pandemic. The Federal Reserve slashed interest rates and kept them near zero to encourage borrowing. Congress passed stimulus bills worth several trillion dollars to help consumers and businesses. And several effective COVID-19 vaccines received regulatory approval. Those measures were enough to offset the fear of rising inflation and supply chain challenges that threatened to disrupt growth. |
At the start of the period, stocks had recovered most of the steep losses they had suffered at the onset of the pandemic. Equities rallied as states reopened their economies but became more volatile as investors worried that a surge in COVID-19 infections would stall the recovery. However, rising corporate profits and economic growth, the resolution of the US presidential election, and the global rollout of approved vaccines lifted equity markets to record levels, helping stocks around the globe post gains for the full period.
Throughout this volatile period, investors sought safety in fixed income. Investment-grade bonds in the US and the overall global bond market declined slightly during the period as the economy recovered, but emerging market debt rose. While the 10-year US Treasury yield hovered near record lows early in the period after a significant rally in interest rates, rates moved higher later on as investors began to focus on stronger economic growth and the prospects of higher inflation. The Fed also took several aggressive actions to keep the bond markets running smoothly, implementing many of the relief programs that proved to be successful in helping end the global financial crisis in 2008-09.
Regarding your investments with PGIM, we believe it is important to maintain a diversified portfolio of funds consistent with your tolerance for risk, time horizon, and financial goals. Your financial advisor can help you create a diversified investment plan that may include funds covering all the basic asset classes and that reflects your personal investor profile and risk tolerance. However, diversification and asset allocation strategies do not assure a profit or protect against loss in declining markets.
At PGIM Investments, we consider it a great privilege and responsibility to help investors participate in opportunities across global markets while meeting their toughest investment challenges. PGIM is a top-10 global investment manager with more than $1.5 trillion in assets under management. This scale and investment expertise allow us to deliver actively managed funds and strategies to meet the needs of investors around the globe.
Thank you for choosing our family of funds.
Sincerely,

Stuart S. Parker, President
PGIM Absolute Return Bond Fund
December 15, 2021
| | |
| PGIM Absolute Return Bond Fund | | 3 |
Your Fund’s Performance (unaudited)
Performance data quoted represent past performance. Past performance does not guarantee future results. The investment return and principal value of an investment will fluctuate so that an investor’s shares, when redeemed, may be worth more or less than their original cost. Current performance may be lower or higher than the past performance data quoted. An investor may obtain performance data as of the most recent month-end by visiting our website at pgim.com/investments or by calling (800) 225-1852.
| | | | | | | | | | | | |
| |
| | | Average Annual Total Returns as of 10/31/21 | |
| | | One Year (%) | | | Five Years (%) | | | Ten Years (%) | |
| | | |
Class A | | | | | | | | | | | | |
| | | |
(with sales charges) | | | 2.28 | | | | 2.60 | | | | 2.56 | |
| | | |
(without sales charges) | | | 5.71 | | | | 3.28 | | | | 2.90 | |
| | | |
Class C | | | | | | | | | | | | |
| | | |
(with sales charges) | | | 4.03 | | | | 2.50 | | | | 2.14 | |
| | | |
(without sales charges) | | | 5.03 | | | | 2.50 | | | | 2.14 | |
| | | |
Class Z | | | | | | | | | | | | |
| | | |
(without sales charges) | | | 5.96 | | | | 3.54 | | | | 3.17 | |
| | | |
Class R6 | | | | | | | | | | | | |
| | | |
(without sales charges) | | | 6.07 | | | | 3.56 | | | | 3.21 | |
| | |
ICE BofA USD 3-Month Deposit Offered Rate Constant Maturity Index | | | | | | | | | |
| | | |
| | | 0.19 | | | | 1.43 | | | | 0.90 | |
| | | |
Bloomberg US Aggregate Bond Index | | | | | | | | | | | | |
| | | |
| | | | -0.48 | | | | 3.10 | | | | 3.00 | |
| | |
| 4 | | Visit our website at pgim.com/investments |
Growth of a $10,000 Investment (unaudited)
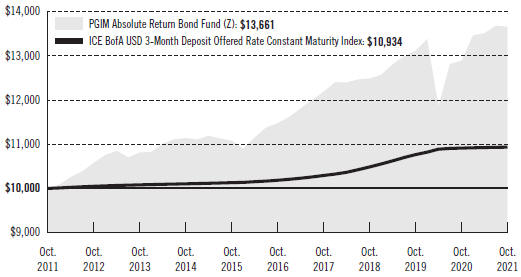
The graph compares a $10,000 investment in the Fund’s Class Z shares with a similar investment in the ICE BofA US Dollar 3-Month Deposit Offered Rate Constant Maturity Index by portraying the initial account values at the beginning of the 10-year period for Class Z shares (October 31, 2011) and the account values at the end of the current fiscal year (October 31, 2021), as measured on a quarterly basis. For purposes of the graph, and unless otherwise indicated, it has been assumed that (a) all recurring fees (including management fees) were deducted and (b) all dividends and distributions were reinvested. The line graph provides information for Class Z shares only. As indicated in the tables provided earlier, performance for other share classes will vary due to the differing fees and expenses applicable to each share class (as indicated in the following paragraphs). Without waiver of fees and/or expense reimbursements, if any, the returns would have been lower.
Past performance does not predict future performance. Total returns and the ending account values in the graph include changes in share price and reinvestment of dividends and capital gains distributions in a hypothetical investment for the periods shown. The Fund’s total returns do not reflect the deduction of income taxes on an individual’s investment. Taxes may reduce your actual investment returns on income or gains paid by the Fund or any gains you may realize if you sell your shares.
| | |
| PGIM Absolute Return Bond Fund | | 5 |
Your Fund’s Performance (continued)
The returns in the tables do not reflect the deduction of taxes that a shareholder would pay on Fund distributions or following the redemption of Fund shares. The average annual total returns take into account applicable sales charges, which are described for each share class in the table below.
| | | | | | | | |
| | | | | |
| | | Class A | | Class C | | Class Z | | Class R6 |
| | | | | |
| Maximum initial sales charge | | 3.25% of the public offering price | | None | | None | | None |
| Contingent deferred sales charge (CDSC) (as a percentage of the lower of the original purchase price or the net asset value at redemption) | | 1.00% on sales of $500,000 or more made within 12 months of purchase | | 1.00% on sales made within 12 months of purchase | | None | | None |
| Annual distribution and service (12b-1) fees (shown as a percentage of average daily net assets) | | 0.25% | | 1.00% | | None | | None |
Benchmark Definitions
ICE BofA US Dollar 3-Month Deposit Offered Rate Constant Maturity Index—The ICE BofA US Dollar 3-Month Deposit Offered Rate Constant Maturity Index is an unmanaged index which tracks the performance of a synthetic asset paying LIBOR to a stated maturity. The Index is based on the assumed purchase at par of a synthetic instrument having exactly its stated maturity and with a coupon equal to that day’s fixing rate. That issue is assumed to be sold the following business day (priced at a yield equal to the current day fixing rate) and rolled into a new instrument.
Source: ICE BofA, used with permission.
Bloomberg US Aggregate Bond Index—The Bloomberg US Aggregate Bond Index is unmanaged and represents securities that are taxable and dollar denominated. It covers the US investment-grade fixed rate bond market, with index components for government and corporate securities, mortgage pass-through securities, and asset-backed securities.
Investors cannot invest directly in an index. The returns for the Indexes would be lower if they included the effects of sales charges, operating expenses of a mutual fund, or taxes that may be paid by an investor.
| | |
| 6 | | Visit our website at pgim.com/investments |
| | | | | | |
| | | |
| Distributions and Yields as of 10/31/21 | | | | | | |
| | | |
| | | Total Distributions
Paid for 12 Months ($) | | SEC 30-Day
Subsidized
Yield* (%) | | SEC 30-Day
Unsubsidized
Yield** (%) |
| | | |
Class A | | 0.23 | | 2.22 | | 2.22 |
| | | |
Class C | | 0.16 | | 1.62 | | 1.62 |
| | | |
Class Z | | 0.25 | | 2.57 | | 2.65 |
| | | |
Class R6 | | 0.26 | | 2.70 | | 2.70 |
*SEC 30-Day Subsidized Yield (%)—A standardized yield calculation created by the Securities and Exchange Commission, it reflects the income earned during a 30-day period, after the deduction of the Fund’s net expenses (net of any expense waivers or reimbursements). The investor experience is represented by the SEC 30-Day Subsidized Yield.
**SEC 30-Day Unsubsidized Yield (%)—A standardized yield calculation created by the Securities and Exchange Commission, it reflects the income earned during a 30-day period, after the deduction of the Fund’s gross expenses. The investor experience is represented by the SEC 30-Day Subsidized Yield.
| | | | |
| |
| Credit Quality expressed as a percentage of total investments as of 10/31/21 (%) | | | |
| |
AAA | | | 26.4 | |
| |
AA | | | 7.4 | |
| |
A | | | 4.4 | |
| |
BBB | | | 15.7 | |
| |
BB | | | 14.7 | |
| |
B | | | 6.7 | |
| |
CCC | | | 4.3 | |
| |
CC | | | 0.3 | |
| |
Not Rated | | | 5.4 | |
| |
Cash/Cash Equivalents | | | 14.7 | |
| | |
| Total | | | 100.0 | |
Credit ratings reflect the highest rating assigned by a nationally recognized statistical rating organization (NRSRO) such as Moody’s Investors Service, Inc. (Moody’s), S&P Global Ratings (S&P), or Fitch, Inc. (Fitch). Credit ratings reflect the common nomenclature used by both S&P and Fitch. Where applicable, ratings are converted to the comparable S&P/Fitch rating tier nomenclature. These rating agencies are independent and are widely used. The Not Rated category consists of securities that have not been rated by an NRSRO. Credit ratings are subject to change.
| | |
| PGIM Absolute Return Bond Fund | | 7 |
Strategy and Performance Overview (unaudited)
How did the Fund perform?
The PGIM Absolute Return Bond Fund’s Class Z shares returned 5.96% in the 12-month reporting period that ended October 31, 2021, outperforming the 0.19% return of the ICE BofA US Dollar 3-Month Deposit Offered Rate Constant Maturity Index (the Index).
What were the market conditions?
| · | | The strong global rebound from the depths of the COVID-19 pandemic continued throughout the reporting period, as economies continued to respond to the unprecedented monetary and fiscal stimulus programs. The effective rollout of COVID-19 vaccines, along with clear messaging from both President Biden and the Federal Reserve (the Fed) on the potential for further stimulus, shifted the prospects for growth and inflation, kicking off a robust “reflation trade” in bond markets, which caused the US Treasury yield curve to steepen over the period. (A yield curve is a line graph that illustrates the relationship between the yields and maturities of fixed income securities. It is created by plotting the yields of different maturities for the same type of bonds.) |
| · | | Although yields for short-term Treasuries remained well anchored during the first quarter of 2021 by the Fed’s commitment to maintain its low-rate policy, longer-term Treasuries sold off sharply, with the yield on the benchmark US 10-year Treasury note rising from 0.92% on December 31, 2020 to 1.74% by March 31, 2021. Similarly, the yield on the 30-year Treasury bond rose from 1.65% to 2.41% over the same period. |
| · | | Market volatility for rates then eased in the second and third quarters of 2021, with long-term US Treasury yields declining gradually before rising again in late September after the Fed signaled it could begin tapering its monthly bond purchases shortly after its November meeting. The US 10-year and 30-year Treasury yields ended the period at 1.55% and 1.93%, respectively. Meanwhile, the yield on the 2-year Treasury note rose sharply the last month of the period as markets began pricing in two rate hikes in 2022, ending October 31, 2021 at 0.45%—a rise of 28 basis points (bps) over the period. (One basis point equals 0.01%.) Despite flattening over the last six months of the period as the market pulled forward its expectation for rate hikes, the US Treasury yield curve steepened during the period, with the 10-year and 2-year Treasury spread rising from 0.74% to 1.07% as of October 31, 2021. |
| · | | Spread markets continued to tighten, supported by the Fed’s monetary responses, fiscal stimulus, the rollout of COVID-19 vaccines, better-than-expected corporate earnings, and surging growth in the US, Europe, and some emerging market economies. (Spread markets are non-government-related sectors of the fixed income market, such as investment grade corporate bonds, high yield bonds, or asset-backed securities.) Strengthening economic fundamentals coupled with aggressive central bank measures (e.g., zero interest rate policies and asset purchases) drove corporate and securitized asset spreads tighter, with many sectors rallying to, or through, their pre-COVID-19 levels. |
| · | | The US investment grade corporate market performed well, with spreads tightening to near-historic levels by the end of the period, supported by better-than-expected |
| | |
| 8 | | Visit our website at pgim.com/investments |
| | corporate earnings, positive vaccination progress, and a favorable technical backdrop. Strengthening fundamentals generally kept securitized credit on a tightening trajectory as well, with commercial mortgage-backed securities (CMBS) spreads trading well below their pre-pandemic tights by the end of the period. US high yield bond spreads tightened as fundamentals remained supportive. Meanwhile, emerging market spreads tightened, boosting returns as investor appetite remained strong amid a global search for yield. |
What worked?
| · | | Security selection and sector allocation both contributed to the Fund’s performance over the reporting period. |
| · | | Within security selection, positions in high yield, emerging markets, investment grade corporates, CMBS, sovereigns, non-agency mortgage-backed securities, collateralized loan obligations (CLOs), bank loans, asset-backed securities (ABS), municipal bonds, and agency securities all contributed. |
| · | | Within sector allocation, allocations to high yield, CLOs, bank loans, emerging markets, municipal bonds, and ABS were the largest contributors. |
| · | | Within credit, positioning in upstream and midstream energy, foreign non-corporates, aerospace & defense, and gaming, lodging, & leisure were the largest contributors to performance. |
| · | | In individual security selection, the Fund benefited from positioning in Chesapeake Energy Corp. (upstream energy), Transocean Ltd. (upstream energy), and Ferrellgas Partners, LP (midstream energy). |
| · | | The Fund occasionally features a modest notional exposure to non-US-dollar currencies across a diversified basket of currencies in faster-growing emerging and developed countries. The Fund’s foreign-exchange currency market (FX) positioning was a contributor to performance for the period. |
What didn’t work?
| · | | During the reporting period, the Fund’s long duration bias, principally in emerging market rates, detracted from returns. (Duration measures the sensitivity of the price—the value of principal—of a bond to a change in interest rates.) The Fund’s yield curve flattener positioning also detracted as the curve steepened over the period. (A yield curve flattener is an interest rate environment in which long-term rates are decreasing more quickly than short-term rates.) |
| · | | Although overall sector allocation contributed to performance, allocations to CMBS and investment grade corporates detracted from results. |
| · | | Within credit, positions in consumer non-cyclicals, healthcare & pharmaceuticals, chemicals, and cable & satellite were the largest detractors from performance. |
| | |
| PGIM Absolute Return Bond Fund | | 9 |
Strategy and Performance Overview (continued)
| · | | In individual security selection, overweights to Ashland Global Holdings Inc. (chemicals), Kraft Heinz Foods Co. (consumer non-cyclical), and Sinclair Broadcast Group Inc. (media & entertainment) relative to the Index detracted from performance. |
Did the Fund use derivatives?
The Fund uses derivatives when they facilitate implementation of the overall investment approach. During the reporting period, the Fund used interest rate futures, options, and swaps to help manage duration positioning and yield curve exposure. Over the period, futures and options contributed to performance while swaps detracted. Credit default swaps and credit default swap index (CDX) positions were used to either add risk exposure to certain issuers or to hedge credit risk imposed by certain issuers. Overall, credit derivative exposure contributed during the period. In addition, the Fund traded foreign-exchange derivatives, which had a negative impact on performance over the period.
Current outlook
| · | | As the Fed’s tapering approached, PGIM Fixed Income believed the Fed would likely draw a clear distinction between the removal of accommodation via reduction in asset purchases and tightening of policy through rate hikes in the federal funds rate target. |
| · | | Looking beyond the next year or two, PGIM Fixed Income believes the secular fundamental drivers—such as aging demographics and high debt levels—that pushed rates lower for decades are likely to reassert themselves with even more downward force on rates in a post-COVID world of older populations and markedly higher debt levels. As a result, many central bankers may end up leaving administered rates near, or at, their effective lower bounds, and rate hike cycles will likely continue cresting at progressively lower levels. From that perspective, the third quarter 2021 increase in longer-term rates—which lifted them back up to levels that reflect a substantial and permanent rise in administered rates over the coming years—has probably already overshot fundamentals, in PGIM Fixed Income’s view. |
| · | | As for spread sectors, PGIM Fixed Income continues to expect the ongoing economic expansion to support credit fundamentals and, in turn, to allow credit products to continue outperforming. Given the relatively narrow level of spreads, however, excess returns are likely to be more modest, deriving primarily from incremental yield and rolling down the spread curve rather than from the kinds of wholesale spread compression seen since March 2020. (Roll-down return is a strategy for selling a bond as it approaches its maturity date. In general, as a bond’s maturity date grows closer, its interest rate moves closer to zero. Since there is an inverse relationship between bond yields and prices, bond prices increase as their interest rates decrease.) |
| · | | PGIM Fixed Income maintains its positive view of the spread sectors over the medium to long term, and the Fund holds allocations to an array of credit sectors, including investment grade and high yield corporates, high-quality structured products, and emerging markets. While valuations are now a bit full, with spreads in many sectors |
| | |
| 10 | | Visit our website at pgim.com/investments |
| | tighter than historical norms, PGIM Fixed Income generally expects ongoing spread sector outperformance. However, this outlook is not without caveats. First, the relatively narrow level of spreads diminishes the pace and magnitude of further outperformance. Additionally, narrower spreads leave little room for error, and the uncertain course of the long-term economic recovery warrants a discerning approach to credit selection. |
| · | | Within structured products, PGIM Fixed Income is biased to own the top of the capital structure, as near-zero policy rates and ongoing Fed purchases support a spread tightening environment. In investment grade corporates, PGIM Fixed Income is looking to take advantage of spread compression in select higher-yielding BBB-rated bonds, solid credits in stressed industries, and cyclicals. PGIM Fixed Income remains constructive on high yield over the medium term as improving fundamentals and a decline in defaults is expected to drive spread compression going forward, and it believes the prospects for emerging market debt performance are encouraging given the supportive backdrop, attractive valuations, and global search for yield. |
| | |
| PGIM Absolute Return Bond Fund | | 11 |
Fees and Expenses (unaudited)
As a shareholder of the Fund, you incur two types of costs: (1) transaction costs, including sales charges (loads) on purchase payments and redemptions, as applicable, and (2) ongoing costs, including management fees, distribution and/or service (12b-1) fees, and other Fund expenses, as applicable. This example is intended to help you understand your ongoing costs (in dollars) of investing in the Fund and to compare these costs with the ongoing costs of investing in other mutual funds.
The example is based on an investment of $1,000 held through the six-month period ended October 31, 2021. The example is for illustrative purposes only; you should consult the Prospectus for information on initial and subsequent minimum investment requirements.
Actual Expenses
The first line for each share class in the table on the following page provides information about actual account values and actual expenses. You may use the information on this line, together with the amount you invested, to estimate the expenses that you paid over the period. Simply divide your account value by $1,000 (for example, an $8,600 account value ÷ $1,000 = 8.6), then multiply the result by the number on the first line under the heading “Expenses Paid During the Six-Month Period” to estimate the expenses you paid on your account during this period.
Hypothetical Example for Comparison Purposes
The second line for each share class in the table on the following page provides information about hypothetical account values and hypothetical expenses based on the Fund’s actual expense ratio and an assumed rate of return of 5% per year before expenses, which is not the Fund’s actual return. The hypothetical account values and expenses may not be used to estimate the actual ending account balance or expenses you paid for the period. You may use this information to compare the ongoing costs of investing in the Fund and other funds. To do so, compare this 5% hypothetical example with the 5% hypothetical examples that appear in the shareholder reports of the other funds.
The Fund’s transfer agent may charge additional fees to holders of certain accounts that are not included in the expenses shown in the table on the following page. These fees apply to individual retirement accounts (IRAs) and Section 403(b) accounts. As of the close of the six-month period covered by the table, IRA fees included an annual maintenance fee of $15 per account (subject to a maximum annual maintenance fee of $25 for all accounts held by the same shareholder). Section 403(b) accounts are charged an annual $25 fiduciary maintenance fee. Some of the fees may vary in amount, or may be waived, based on your total account balance or the number of PGIM funds, including the Fund, that you own. You should consider the additional fees that were charged to your Fund account over the six-month period when you estimate the total ongoing expenses paid over the period and the impact of these fees on your ending account value, as these additional expenses are not reflected in the information
| | |
| 12 | | Visit our website at pgim.com/investments |
provided in the expense table. Additional fees have the effect of reducing investment returns.
Please note that the expenses shown in the table are meant to highlight your ongoing costs only and do not reflect any transactional costs such as sales charges (loads). Therefore, the second line for each share class in the table is useful in comparing ongoing costs only and will not help you determine the relative total costs of owning different funds. In addition, if these transactional costs were included, your costs would have been higher.
| | | | | | | | | | |
| | | | |
PGIM Absolute Return Bond Fund | | Beginning Account Value
May 1, 2021 | | Ending Account Value October 31, 2021 | | Annualized Expense Ratio Based on the Six-Month Period | | Expenses Paid During the
Six-Month Period* |
| | | | | |
Class A | | Actual | | $ 1,000.00 | | $ 1,009.70 | | 0.95% | | $ 4.81 |
| | Hypothetical | | $ 1,000.00 | | $ 1,020.42 | | 0.95% | | $ 4.84 |
| | | | | |
Class C | | Actual | | $ 1,000.00 | | $ 1,006.00 | | 1.69% | | $ 8.55 |
| | Hypothetical | | $ 1,000.00 | | $ 1,016.69 | | 1.69% | | $ 8.59 |
| | | | | |
Class Z | | Actual | | $ 1,000.00 | | $ 1,010.90 | | 0.72% | | $ 3.65 |
| | Hypothetical | | $ 1,000.00 | | $ 1,021.58 | | 0.72% | | $ 3.67 |
| | | | | |
Class R6 | | Actual | | $ 1,000.00 | | $ 1,010.30 | | 0.63% | | $ 3.19 |
| | | Hypothetical | | $ 1,000.00 | | $ 1,022.03 | | 0.63% | | $ 3.21 |
*Fund expenses (net of fee waivers or subsidies, if any) for each share class are equal to the annualized expense ratio for each share class (provided in the table), multiplied by the average account value over the period, multiplied by the 184 days in the six-month period ended October 31, 2021, and divided by the 365 days in the Fund’s fiscal year ended October 31, 2021 (to reflect the six-month period). Expenses presented in the table include the expenses of any underlying portfolios in which the Fund may invest.
| | |
| PGIM Absolute Return Bond Fund | | 13 |
Schedule of Investments
as of October 31, 2021
| | | | | | | | | | | | | | |
| | | | | |
| Description | | Interest
Rate | | Maturity
Date | | | | Principal Amount (000)# | | | Value | |
| | | | | |
LONG-TERM INVESTMENTS 85.4% | | | | | | | | | | | | | | |
| | | | | |
ASSET-BACKED SECURITIES 26.6% | | | | | | | | | | | | | | |
| | | | | |
Automobiles 0.2% | | | | | | | | | | | | | | |
| | | | | |
Hertz Vehicle Financing III LP, | | | | | | | | | | | | | | |
Series 2021-02A, Class B, 144A | | 2.120% | | 12/27/27 | | | | | 200 | | | $ | 199,207 | |
OneMain Direct Auto Receivables Trust, | | | | | | | | | | | | | | |
Series 2019-01A, Class B, 144A | | 3.950 | | 11/14/28 | | | | | 1,700 | | | | 1,834,128 | |
| | | | | | | | | | | | | | |
| | | | | |
| | | | | | | | | | | | | 2,033,335 | |
| | | | | |
Collateralized Loan Obligations 19.0% | | | | | | | | | | | | | | |
| | | | | |
Anchorage Credit Opportunities CLO Ltd. (Cayman Islands), | | | | | | | | | | | | | | |
Series 2019-01A, Class A1, 144A, 3 Month LIBOR + 1.950% (Cap N/A, Floor 1.950%) | | 2.082(c) | | 01/20/32 | | | | | 15,000 | | | | 15,026,886 | |
Ares European CLO DAC (Ireland), | | | | | | | | | | | | | | |
Series 2013-06A, Class B1RR, 144A, 3 Month EURIBOR + 1.250% (Cap N/A, Floor 1.250%) | | 1.250(c) | | 04/15/30 | | EUR | | | 2,500 | | | | 2,887,369 | |
Barings Euro CLO DAC (Ireland), | | | | | | | | | | | | | | |
Series 2020-01A, Class AR, 144A | | 0.000(cc) | | 10/21/34 | | EUR | | | 3,000 | | | | 3,468,000 | |
Brookside Mill CLO Ltd. (Cayman Islands), | | | | | | | | | | | | | | |
Series 2013-01A, Class BR, 144A, 3 Month LIBOR + 1.350% (Cap N/A, Floor 0.000%) | | 1.472(c) | | 01/17/28 | | | | | 4,000 | | | | 4,002,573 | |
Carlyle Euro CLO DAC (Ireland), | | | | | | | | | | | | | | |
Series 2019-01A, Class A1R, 144A, 3 Month EURIBOR + 0.750% (Cap N/A, Floor 0.750%) | | 0.750(c) | | 03/15/32 | | EUR | | | 1,750 | | | | 2,015,238 | |
Series 2019-01A, Class A2RB, 144A | | 2.100 | | 03/15/32 | | EUR | | | 6,500 | | | | 7,522,901 | |
Elevation CLO Ltd. (Cayman Islands), | | | | | | | | | | | | | | |
Series 2017-06A, Class A1, 144A, 3 Month LIBOR + 1.280% (Cap N/A, Floor 0.000%) | | 1.404(c) | | 07/15/29 | | | | | 2,500 | | | | 2,501,881 | |
Series 2017-07A, Class A, 144A, 3 Month LIBOR + 1.220% (Cap N/A, Floor 0.000%) | | 1.344(c) | | 07/15/30 | | | | | 4,000 | | | | 4,002,466 | |
Ellington CLO Ltd. (Cayman Islands), | | | | | | | | | | | | | | |
Series 2017-02A, Class A, 144A, 3 Month LIBOR + 1.700% (Cap N/A, Floor 1.700%) | | 1.825(c) | | 02/15/29 | | | | | 16,536 | | | | 16,537,723 | |
Generate CLO Ltd. (Cayman Islands), | | | | | | | | | | | | | | |
Series 02A, Class AR, 144A, 3 Month LIBOR + 1.150% (Cap N/A, Floor 0.000%) | | 1.278(c) | | 01/22/31 | | | | | 3,000 | | | | 2,999,997 | |
KKR CLO Ltd. (Cayman Islands), | | | | | | | | | | | | | | |
Series 11, Class AR, 144A, 3 Month LIBOR + 1.180% (Cap N/A, Floor 0.000%) | | 1.304(c) | | 01/15/31 | | | | | 8,000 | | | | 8,003,079 | |
Series 32A, Class A1, 144A, 3 Month LIBOR + 1.320% (Cap N/A, Floor 1.320%) | | 1.444(c) | | 01/15/32 | | | | | 5,000 | | | | 5,003,622 | |
| | |
| See Notes to Financial Statements. |
| PGIM Absolute Return Bond Fund | | 15 |
Schedule of Investments (continued)
as of October 31, 2021
| | | | | | | | | | | | | | |
| | | | | |
| Description | | Interest
Rate | | Maturity
Date | | | | Principal Amount (000)# | | | Value | |
| | | | | |
ASSET-BACKED SECURITIES (Continued) | | | | | | | | | | | | | | |
| | | | | |
Collateralized Loan Obligations (cont’d.) | | | | | | | | | | | | | | |
| | | | | |
Medalist Partners Corporate Finance CLO Ltd. (Cayman Islands), | | | | | | | | | | | | | | |
Series 2021-01A, Class A1A, 144A, 3 Month LIBOR + 1.230% (Cap N/A, Floor 1.230%) | | 1.441%(c) | | 10/20/34 | | | | | 5,000 | | | $ | 4,998,750 | |
MidOcean Credit CLO (Cayman Islands), | | | | | | | | | | | | | | |
Series 2014-03A, Class A1R, 144A, 3 Month LIBOR + 1.120% (Cap N/A, Floor 1.120%) | | 1.250(c) | | 04/21/31 | | | | | 7,411 | | | | 7,411,092 | |
Series 2014-03A, Class BR, 144A, 3 Month LIBOR + 1.800% (Cap N/A, Floor 1.800%) | | 1.930(c) | | 04/21/31 | | | | | 18,000 | | | | 17,982,437 | |
OZLM Ltd. (Cayman Islands), | | | | | | | | | | | | | | |
Series 2014-06A, Class A2AS, 144A, 3 Month LIBOR + 1.750% (Cap N/A, Floor 0.000%) | | 1.872(c) | | 04/17/31 | | | | | 4,000 | | | | 4,000,179 | |
Palmer Square CLO Ltd. (Cayman Islands), | | | | | | | | | | | | | | |
Series 2014-01A, Class A1R2, 144A, 3 Month LIBOR + 1.130% (Cap N/A, Floor 1.130%) | | 1.252(c) | | 01/17/31 | | | | | 5,000 | | | | 5,001,179 | |
Penta CLO DAC (Ireland), | | | | | | | | | | | | | | |
Series 2018-05A, Class B1R, 144A, 3 Month EURIBOR + 1.550% (Cap N/A, Floor 1.550%) | | 1.550(c) | | 04/20/35 | | EUR | | | 10,000 | | | | 11,538,694 | |
Romark CLO Ltd. (Cayman Islands), | | | | | | | | | | | | | | |
Series 2018-02A, Class A1, 144A, 3 Month LIBOR + 1.175% (Cap N/A, Floor 1.175%) | | 1.299(c) | | 07/25/31 | | | | | 5,000 | | | | 5,000,011 | |
Romark WM-R Ltd. (Cayman Islands), | | | | | | | | | | | | | | |
Series 2018-01A, Class A1, 144A, 3 Month LIBOR + 1.030% (Cap N/A, Floor 0.000%) | | 1.162(c) | | 04/20/31 | | | | | 1,484 | | | | 1,485,026 | |
Strata CLO Ltd. (Cayman Islands), | | | | | | | | | | | | | | |
Series 2018-01A, Class A, 144A, 3 Month LIBOR + 1.590% (Cap N/A, Floor 1.590%) | | 1.714(c) | | 01/15/31 | | | | | 19,000 | | | | 18,986,901 | |
Trinitas CLO Ltd. (Cayman Islands), | | | | | | | | | | | | | | |
Series 2017-07A, Class A, 144A, 3 Month LIBOR + 1.210% (Cap N/A, Floor 0.000%) | | 1.334(c) | | 01/25/31 | | | | | 4,500 | | | | 4,502,108 | |
Venture CLO Ltd. (Cayman Islands), | | | | | | | | | | | | | | |
Series 2015-21A, Class AR, 144A, 3 Month LIBOR + 0.880% (Cap N/A, Floor 0.000%) | | 1.004(c) | | 07/15/27 | | | | | 2,112 | | | | 2,111,988 | |
Voya CLO Ltd. (Cayman Islands), | | | | | | | | | | | | | | |
Series 2013-01A, Class A1AR, 144A, 3 Month LIBOR + 1.210% (Cap N/A, Floor 0.000%) | | 1.334(c) | | 10/15/30 | | | | | 2,739 | | | | 2,740,342 | |
Wellfleet CLO Ltd. (Cayman Islands), | | | | | | | | | | | | | | |
Series 2017-03A, Class A1, 144A, 3 Month LIBOR + 1.150% (Cap N/A, Floor 1.150%) | | 1.272(c) | | 01/17/31 | | | | | 10,500 | | | | 10,502,844 | |
|
See Notes to Financial Statements. 16 |
| | | | | | | | | | | | | | | | |
| | | | | |
| Description | | Interest Rate | | Maturity Date | | | | | Principal Amount (000)# | | | Value | |
| | | | | |
ASSET-BACKED SECURITIES (Continued) | | | | | | | | | | | | | | | | |
| | | | | |
Collateralized Loan Obligations (cont’d.) | | | | | | | | | | | | | | | | |
| | | | | |
Zais CLO Ltd. (Cayman Islands), | | | | | | | | | | | | | | | | |
Series 2015-03A, Class A2R, 144A, 3 Month LIBOR + 2.190% (Cap N/A, Floor 0.000%) | | 2.314%(c) | | 07/15/31 | | | | | | | 11,300 | | | $ | 11,305,248 | |
Series 2017-02A, Class A, 144A, 3 Month LIBOR + 1.290% (Cap N/A, Floor 0.000%) | | 1.414(c) | | 04/15/30 | | | | | | | 4,642 | | | | 4,637,749 | |
| | | | | | | | | | | | | | | | |
| | | | | |
| | | | | | | | | | | | | | | 186,176,283 | |
| | | | | |
Consumer Loans 1.0% | | | | | | | | | | | | | | | | |
| | | | | |
Lendmark Funding Trust, | | | | | | | | | | | | | | | | |
Series 2021-01A, Class C, 144A | | 3.410 | | 11/20/31 | | | | | | | 200 | | | | 204,157 | |
Oportun Funding XIII LLC, | | | | | | | | | | | | | | | | |
Series 2019-A, Class B, 144A | | 3.870 | | 08/08/25 | | | | | | | 4,860 | | | | 4,932,653 | |
PNMAC GMSR Issuer Trust, | | | | | | | | | | | | | | | | |
Series 2018-GT01, Class A, 144A, 1 Month LIBOR + 2.850% (Cap N/A, Floor 2.850%) | | 2.939(c) | | 02/25/23 | | | | | | | 1,650 | | | | 1,653,838 | |
Series 2018-GT02, Class A, 144A, 1 Month LIBOR + 2.650% (Cap N/A, Floor 0.000%) | | 2.739(c) | | 08/25/25 | | | | | | | 3,400 | | | | 3,398,982 | |
| | | | | | | | | | | | | | | | |
| | | | | |
| | | | | | | | | | | | | | | 10,189,630 | |
| | | | | |
Home Equity Loans 1.4% | | | | | | | | | | | | | | | | |
| | | | | |
Accredited Mortgage Loan Trust, | | | | | | | | | | | | | | | | |
Series 2004-03, Class 2A2, 1 Month LIBOR + 1.200% (Cap 13.000%, Floor 1.200%) | | 1.289(c) | | 10/25/34 | | | | | | | 1,324 | | | | 1,324,864 | |
Asset-Backed Securities Corp. Home Equity Loan Trust, | | | | | | | | | | | | | | | | |
Series 2003-HE06, Class A2, 1 Month LIBOR + 0.680% (Cap N/A, Floor 0.680%) | | 0.769(c) | | 11/25/33 | | | | | | | 1,758 | | | | 1,742,543 | |
Series 2003-HE06, Class A3B, 1 Month LIBOR + 0.960% (Cap N/A, Floor 0.960%) | | 1.049(c) | | 11/25/33 | | | | | | | 3,546 | | | | 3,485,428 | |
Bear Stearns Asset-Backed Securities I Trust, | | | | | | | | | | | | | | | | |
Series 2004-HE11, Class M2, 1 Month LIBOR + 1.575% (Cap N/A, Floor 1.575%) | | 1.664(c) | | 12/25/34 | | | | | | | 380 | | | | 380,776 | |
Bear Stearns Asset-Backed Securities Trust, | | | | | | | | | | | | | | | | |
Series 2002-02, Class A1, 1 Month LIBOR + 0.660% (Cap 11.000%, Floor 0.660%) | | 0.749(c) | | 10/25/32 | | | | | | | 460 | | | | 458,427 | |
Series 2003-03, Class A2, 1 Month LIBOR + 1.180% (Cap 11.000%, Floor 1.180%) | | 1.269(c) | | 06/25/43 | | | | | | | 83 | | | | 82,929 | |
Series 2003-HE01, Class M1, 1 Month LIBOR + 1.095% (Cap N/A, Floor 1.095%) | | 1.184(c) | | 01/25/34 | | | | | | | 2,418 | | | | 2,420,894 | |
| | |
| See Notes to Financial Statements. |
| PGIM Absolute Return Bond Fund | | 17 |
Schedule of Investments (continued)
as of October 31, 2021
| | | | | | | | | | | | | | | | |
| | | | | |
| Description | | Interest
Rate | | Maturity
Date | | | | | Principal
Amount
(000)# | | | Value | |
| | | | | |
ASSET-BACKED SECURITIES (Continued) | | | | | | | | | | | | | | | | |
| | | | | |
Home Equity Loans (cont’d.) | | | | | | | | | | | | | | | | |
| | | | | |
Home Equity Asset Trust, | | | | | | | | | | | | | | | | |
Series 2004-07, Class A2, 1 Month LIBOR + 0.840% (Cap N/A, Floor 0.840%) | | 0.929%(c) | | 01/25/35 | | | | | | | 1,050 | | | $ | 1,040,738 | |
MASTR Asset-Backed Securities Trust, | | | | | | | | | | | | | | | | |
Series 2003-WMC02, Class M2, 1 Month LIBOR + 2.475% (Cap N/A, Floor 2.475%) | | 2.564(c) | | 08/25/33 | | | | | | | 802 | | | | 813,634 | |
Morgan Stanley ABS Capital I, Inc. Trust, | | | | | | | | | | | | | | | | |
Series 2003-HE03, Class M1, 1 Month LIBOR + 1.020% (Cap N/A, Floor 1.020%) | | 1.109(c) | | 10/25/33 | | | | | | | 1,147 | | | | 1,148,596 | |
Series 2003-NC08, Class M1, 1 Month LIBOR + 1.050% (Cap N/A, Floor 1.050%) | | 1.139(c) | | 09/25/33 | | | | | | | 331 | | | | 331,446 | |
Series 2003-NC10, Class M1, 1 Month LIBOR + 1.020% (Cap N/A, Floor 1.020%) | | 1.109(c) | | 10/25/33 | | | | | | | 356 | | | | 356,135 | |
| | | | | | | | | | | | | | | | |
| | | | | |
| | | | | | | | | | | | | | | 13,586,410 | |
| | | | | |
Other 0.3% | | | | | | | | | | | | | | | | |
| | | | | |
PNMAC FMSR Issuer Trust, | | | | | | | | | | | | | | | | |
Series 2018-FT01, Class A, 144A, 1 Month LIBOR + 2.350% (Cap N/A, Floor 0.000%) | | 2.439(c) | | 04/25/23 | | | | | | | 3,200 | | | | 3,203,195 | |
| | | | | |
Residential Mortgage-Backed Securities 2.1% | | | | | | | | | | | | | | | | |
| | | | | |
Chase Funding Trust, | | | | | | | | | | | | | | | | |
Series 2002-03, Class 2A1, 1 Month LIBOR + 0.640% (Cap N/A, Floor 0.640%) | | 0.729(c) | | 08/25/32 | | | | | | | 245 | | | | 238,916 | |
Series 2003-04, Class 1A5 | | 5.014 | | 05/25/33 | | | | | | | 415 | | | | 419,717 | |
Citigroup Mortgage Loan Trust, Inc., | | | | | | | | | | | | | | | | |
Series 2005-OPT01, Class M1, 1 Month LIBOR + 0.630% (Cap N/A, Floor 0.630%) | | 0.719(c) | | 02/25/35 | | | | | | | 209 | | | | 206,190 | |
Series 2005-WF01, Class A5 | | 5.010(cc) | | 11/25/34 | | | | | | | 1 | | | | 577 | |
Countrywide Asset-Backed Certificates, | | | | | | | | | | | | | | | | |
Series 2003-BC04, Class M1, 1 Month LIBOR + 1.050% (Cap N/A, Floor 1.050%) | | 1.139(c) | | 07/25/33 | | | | | | | 472 | | | | 473,000 | |
Series 2004-01, Class M1, 1 Month LIBOR + 0.750% (Cap N/A, Floor 0.750%) | | 0.839(c) | | 03/25/34 | | | | | | | 22 | | | | 22,356 | |
Series 2004-BC04, Class M1, 1 Month LIBOR + 1.050% (Cap N/A, Floor 1.050%) | | 1.139(c) | | 11/25/34 | | | | | | | 224 | | | | 225,160 | |
Credit-Based Asset Servicing & Securitization LLC, | | | | | | | | | | | | | | | | |
Series 2003-CB03, Class AF1 | | 3.379 | | 12/25/32 | | | | | | | 89 | | | | 88,536 | |
Finance America Mortgage Loan Trust, | | | | | | | | | | | | | | | | |
Series 2003-01, Class M1, 1 Month LIBOR + 1.050% (Cap N/A, Floor 1.050%) | | 1.139(c) | | 09/25/33 | | | | | | | 1,243 | | | | 1,233,660 | |
|
See Notes to Financial Statements. 18 |
| | | | | | | | | | | | | | | | |
| | | | | |
| Description | | Interest Rate | | Maturity Date | | | | | Principal
Amount
(000)# | | | Value | |
| | | | | |
ASSET-BACKED SECURITIES (Continued) | | | | | | | | | | | | | | | | |
| | | | | |
Residential Mortgage-Backed Securities (cont’d.) | | | | | | | | | | | | | | | | |
| | | | | |
First Franklin Mortgage Loan Trust, | | | | | | | | | | | | | | | | |
Series 2004-FF05, Class A2, 1 Month LIBOR + 0.760% (Cap N/A, Floor 0.760%) | | 0.849%(c) | | 08/25/34 | | | | | | | 563 | | | $ | 564,311 | |
Fremont Home Loan Trust, | | | | | | | | | | | | | | | | |
Series 2004-04, Class M1, 1 Month LIBOR + 0.795% (Cap N/A, Floor 0.795%) | | 0.884(c) | | 03/25/35 | | | | | | | 1,934 | | | | 1,914,464 | |
Long Beach Mortgage Loan Trust, | | | | | | | | | | | | | | | | |
Series 2004-02, Class A1, 1 Month LIBOR + 0.440% (Cap N/A, Floor 0.440%) | | 0.529(c) | | 06/25/34 | | | | | | | 695 | | | | 681,901 | |
Morgan Stanley ABS Capital I, Inc. Trust, | | | | | | | | | | | | | | | | |
Series 2004-NC05, Class M1, 1 Month LIBOR + 0.900% (Cap N/A, Floor 0.900%) | | 0.989(c) | | 05/25/34 | | | | | | | 188 | | | | 184,465 | |
Rathlin Residential DAC (Ireland), | | | | | | | | | | | | | | | | |
Series 2021-01A, Class A, 144A, 1 Month EURIBOR + 2.000% | | 1.443(c) | | 09/27/75 | | | EUR | | | | 1,820 | | | | 2,062,964 | |
Structured Asset Investment Loan Trust, | | | | | | | | | | | | | | | | |
Series 2004-BNC01, Class A2, 1 Month LIBOR + 1.000% (Cap N/A, Floor 1.000%) | | 1.089(c) | | 09/25/34 | | | | | | | 1,942 | | | | 1,943,199 | |
TFS (Spain), | | | | | | | | | | | | | | | | |
Series 2018-03, Class A1, 1 Month EURIBOR + 3.000% | | 3.000(c) | | 04/16/23 | | | EUR | | | | 9,702 | | | | 9,814,059 | |
| | | | | | | | | | | | | | | | |
| | | | | |
| | | | | | | | | | | | | | | 20,073,475 | |
| | | | | |
Student Loans 2.6% | | | | | | | | | | | | | | | | |
| | | | | |
Laurel Road Prime Student Loan Trust, | | | | | | | | | | | | | | | | |
Series 2018-D, Class A, 144A | | 0.000(cc) | | 11/25/43 | | | | | | | 3,960 | | | | 4,099,169 | |
Series 2019-A, Class R, 144A | | 0.000 | | 10/25/48 | | | | | | | 3,087 | | | | 522,420 | |
SoFi Alternative Trust, | | | | | | | | | | | | | | | | |
Series 2019-B, Class PT, 144A | | 0.000(cc) | | 12/15/45 | | | | | | | 4,708 | | | | 4,860,605 | |
Series 2019-D, Class 1PT, 144A | | 2.847(cc) | | 01/16/46 | | | | | | | 4,952 | | | | 5,103,490 | |
Series 2019-F, Class PT1, 144A | | 3.932(cc) | | 02/15/45 | | | | | | | 5,780 | | | | 5,896,191 | |
SoFi RR Funding II Trust, | | | | | | | | | | | | | | | | |
Series 2019-01, Class A, 144A, 1 Month LIBOR + 1.250% (Cap N/A, Floor 1.250%) | | 1.336(c) | | 11/29/24 | | | | | | | 4,431 | | | | 4,426,192 | |
| | | | | | | | | | | | | | | | |
| | | | | |
| | | | | | | | | | | | | | | 24,908,067 | |
| | | | | | | | | | | | | | | | |
TOTAL ASSET-BACKED SECURITIES
(cost $261,030,618) | | | | | | | | | | | | | | | 260,170,395 | |
| | | | | | | | | | | | | | | | |
| | |
| See Notes to Financial Statements. |
| PGIM Absolute Return Bond Fund | | 19 |
Schedule of Investments (continued)
as of October 31, 2021
| | | | | | | | | | | | | | |
| | | | | |
| Description | | Interest Rate | | Maturity Date | | | | Principal
Amount
(000)# | | | Value | |
| | | | | |
BANK LOANS 1.7% | | | | | | | | | | | | | | |
| | | | | |
Airlines 0.0% | | | | | | | | | | | | | | |
| | | | | |
United Airlines, Inc., | | | | | | | | | | | | | | |
Class B Term Loan, 1 Month LIBOR + 3.750% | | 4.500%(c) | | 04/21/28 | | | | | 249 | | | $ | 251,948 | |
| | | | | |
Internet 0.3% | | | | | | | | | | | | | | |
| | | | | |
Speedster Bidco GmbH (Germany), | | | | | | | | | | | | | | |
Second Lien Term Loan, 6 Month EURIBOR + 6.000% (Cap N/A, Floor 0.000%) | | 6.000(c) | | 03/31/28 | | EUR | | | 2,400 | | | | 2,788,272 | |
| | | | | |
Media 0.0% | | | | | | | | | | | | | | |
| | | | | |
Diamond Sports Group LLC, | | | | | | | | | | | | | | |
Term Loan, 1 Month LIBOR + 3.250% | | 3.340(c) | | 08/24/26 | | | | | 378 | | | | 196,786 | |
| | | | | |
Oil & Gas 0.2% | | | | | | | | | | | | | | |
| | | | | |
Ascent Resources Utica Holdings LLC, | | | | | | | | | | | | | | |
Second Lien Term Loan, 3 Month LIBOR + 9.000% | | 10.000(c) | | 11/01/25 | | | | | 1,858 | | | | 2,032,652 | |
| | | | | |
Retail 0.9% | | | | | | | | | | | | | | |
| | | | | |
CD&R Firefly Bidco Ltd. (United Kingdom), | | | | | | | | | | | | | | |
Initial Term Loan, 3 Month GBP LIBOR + 8.356%^ | | 8.412(c) | | 06/21/26 | | GBP | | | 3,300 | | | | 4,516,215 | |
Constellation Automotive Group Ltd. (United Kingdom), | | | | | | | | | | | | | | |
Facility 1 Loan, 1 - 3 Month GBP LIBOR + 7.500% (Cap N/A, Floor 0.000%) | | 7.525(c) | | 07/16/29 | | GBP | | | 1,025 | | | | 1,423,805 | |
Stonegate Pub Co. Ltd., | | | | | | | | | | | | | | |
First Lien Initial Term B Loan, 3 Month GBP LIBOR + 8.500%^ | | 8.606(c) | | 03/06/28 | | GBP | | | 1,900 | | | | 2,587,243 | |
| | | | | | | | | | | | | | |
| | | | | |
| | | | | | | | | | | | | 8,527,263 | |
| | | | | |
Telecommunications 0.3% | | | | | | | | | | | | | | |
| | | | | |
Intelsat Jackson Holdings SA (Luxembourg), | | | | | | | | | | | | | | |
DIP Term Loan, 3 Month LIBOR + 4.750% | | 5.750(c) | | 07/13/22 | | | | | 921 | | | | 927,279 | |
West Corp., | | | | | | | | | | | | | | |
Initial Term B Loan, 3 Month LIBOR + 4.000% | | 5.000(c) | | 10/10/24 | | | | | 2,401 | | | | 2,358,472 | |
| | | | | | | | | | | | | | |
| | | | | |
| | | | | | | | | | | | | 3,285,751 | |
| | | | | | | | | | | | | | |
TOTAL BANK LOANS
(cost $16,437,499) | | | | | | | | | | | | | 17,082,672 | |
| | | | | | | | | | | | | | |
|
See Notes to Financial Statements. 20 |
| | | | | | | | | | | | | | | | |
| | | | | |
| Description | | Interest Rate | | Maturity Date | | | | | Principal
Amount
(000)# | | | Value | |
| | | | | |
COMMERCIAL MORTGAGE-BACKED SECURITIES 7.5% | | | | | | | | | | | | | | | | |
20 Times Square Trust, | | | | | | | | | | | | | | | | |
Series 2018-20TS, Class G, 144A | | 3.100%(cc) | | 05/15/35 | | | | | | | 2,700 | | | $ | 2,502,129 | |
Series 2018-20TS, Class H, 144A | | 3.100(cc) | | 05/15/35 | | | | | | | 2,700 | | | | 2,459,092 | |
Barclays Commercial Mortgage Securities Trust, | | | | | | | | | | | | | | | | |
Series 2018-TALL, Class D, 144A, 1 Month LIBOR + 1.449% (Cap N/A, Floor 1.449%) | | 1.539(c) | | 03/15/37 | | | | | | | 11,875 | | | | 11,427,823 | |
BX Commercial Mortgage Trust, | | | | | | | | | | | | | | | | |
Series 2019-XL, Class J, 144A, 1 Month LIBOR + 2.650% (Cap N/A, Floor 2.650%) | | 2.740(c) | | 10/15/36 | | | | | | | 5,653 | | | | 5,638,430 | |
Series 2020-BXLP, Class G, 144A, 1 Month LIBOR + 2.500% (Cap N/A, Floor 2.500%) | | 2.590(c) | | 12/15/36 | | | | | | | 3,414 | | | | 3,397,261 | |
Commercial Mortgage Trust, | | | | | | | | | | | | | | | | |
Series 2012-CR01, Class XA, IO | | 1.874(cc) | | 05/15/45 | | | | | | | 8,250 | | | | 20,906 | |
Series 2015-LC19, Class XB, IO, 144A | | 0.251(cc) | | 02/10/48 | | | | | | | 123,049 | | | | 979,876 | |
DBWF Mortgage Trust, | | | | | | | | | | | | | | | | |
Series 2016-85T, Class E, 144A | | 3.808(cc) | | 12/10/36 | | | | | | | 15,500 | | | | 14,959,530 | |
FHLMC Multifamily Structured Pass-Through Certificates, | | | | | | | | | | | | | | | | |
Series K018, Class X1, IO | | 1.234(cc) | | 01/25/22 | | | | | | | 7,813 | | | | 623 | |
Series K020, Class X1, IO | | 1.337(cc) | | 05/25/22 | | | | | | | 17,410 | | | | 73,325 | |
Series K021, Class X1, IO | | 1.376(cc) | | 06/25/22 | | | | | | | 3,666 | | | | 10,755 | |
Series K025, Class X1, IO | | 0.781(cc) | | 10/25/22 | | | | | | | 82,453 | | | | 506,229 | |
Series K055, Class X1, IO | | 1.356(cc) | | 03/25/26 | | | | | | | 22,308 | | | | 1,146,304 | |
Series KC02, Class X1, IO | | 0.373(cc) | | 03/25/24 | | | | | | | 141,070 | | | | 1,038,331 | |
GS Mortgage Securities Corp., | | | | | | | | | | | | | | | | |
Series 2013-GC10, Class XB, IO, 144A | | 0.487(cc) | | 02/10/46 | | | | | | | 103,126 | | | | 645,692 | |
GS Mortgage Securities Trust, | | | | | | | | | | | | | | | | |
Series 2014-GC20, Class XB, IO | | 0.427(cc) | | 04/10/47 | | | | | | | 28,307 | | | | 283,795 | |
Independence Plaza Trust, | | | | | | | | | | | | | | | | |
Series 2018-INDP, Class E, 144A | | 4.996 | | 07/10/35 | | | | | | | 5,200 | | | | 5,102,946 | |
JPMBB Commercial Mortgage Securities Trust, | | | | | | | | | | | | | | | | |
Series 2014-C21, Class XB, IO | | 0.301(cc) | | 08/15/47 | | | | | | | 45,056 | | | | 424,648 | |
Series 2015-C27, Class XB, IO | | 0.408(cc) | | 02/15/48 | | | | | | | 52,766 | | | | 702,173 | |
JPMorgan Chase Commercial Mortgage Securities Corp., | | | | | | | | | | | | | | | | |
Series 2018-AON, Class E, 144A | | 4.613(cc) | | 07/05/31 | | | | | | | 7,950 | | | | 8,138,641 | |
JPMorgan Chase Commercial Mortgage Securities Trust, | | | | | | | | | | | | | | | | |
Series 2013-LC11, Class XB, IO | | 0.509(cc) | | 04/15/46 | | | | | | | 34,956 | | | | 250,046 | |
Morgan Stanley Bank of America Merrill Lynch Trust, | | | | | | | | | | | | | | | | |
Series 2012-C05, Class XB, IO, 144A | | 0.210(cc) | | 08/15/45 | | | | | | | 65,968 | | | | 100,139 | |
Series 2013-C08, Class XB, IO, 144A | | 0.497(cc) | | 12/15/48 | | | | | | | 68,276 | | | | 338,895 | |
| | |
| See Notes to Financial Statements. |
| PGIM Absolute Return Bond Fund | | 21 |
Schedule of Investments (continued)
as of October 31, 2021
| | | | | | | | | | | | | | | | |
| | | | | |
| Description | | Interest Rate | | Maturity Date | | | | | Principal
Amount (000)# | | | Value | |
| | | | | |
COMMERCIAL MORTGAGE-BACKED SECURITIES (Continued) | | | | | | | | | | | | | | | | |
| | | | | |
Salus European Loan Conduit DAC (United Kingdom), | | | | | | | | | | | | | | | | |
Series 33A, Class A, 144A, 3 Month GBP LIBOR + 1.500% (Cap 6.500%, Floor 1.500%) | | 1.704%(c) | | 01/23/29 | | | GBP | | | | 9,500 | | | $ | 13,033,734 | |
| | | | | |
UBS-Barclays Commercial Mortgage Trust,
Series 2013-C06, Class XB, IO, 144A | | 0.373(cc) | | 04/10/46 | | | | | | | 140,883 | | | | 712,065 | |
| | | | | | | | | | | | | | | | |
| | | | | |
TOTAL COMMERCIAL MORTGAGE-BACKED SECURITIES
(cost $72,587,604) | | | | | | | | | | | | | | | 73,893,388 | |
| | | | | | | | | | | | | | | | |
| | | | | |
CONVERTIBLE BOND 0.0% | | | | | | | | | | | | | | | | |
| | | | | |
Telecommunications | | | | | | | | | | | | | | | | |
| | | | | |
Digicel Group Holdings Ltd. (Jamaica), | | | | | | | | | | | | | | | | |
Sub. Notes, 144A, Cash coupon 7.000% or PIK N/A | | | | | | | | | | | | | | | | |
(cost $4,307) | | 7.000 | | 11/15/21(oo) | | | | | | | 42 | | | | 38,328 | |
| | | | | | | | | | | | | | | | |
| | | | | |
CORPORATE BONDS 30.1% | | | | | | | | | | | | | | | | |
| | | | | |
Advertising 0.1% | | | | | | | | | | | | | | | | |
| | | | | |
National CineMedia LLC, | | | | | | | | | | | | | | | | |
Sr. Unsec’d. Notes | | 5.750 | | 08/15/26 | | | | | | | 1,100 | | | | 884,051 | |
| | | | | |
Aerospace & Defense 1.2% | | | | | | | | | | | | | | | | |
| | | | | |
Bombardier, Inc. (Canada), | | | | | | | | | | | | | | | | |
Sr. Unsec’d. Notes, 144A | | 7.500 | | 12/01/24 | | | | | | | 5,325 | | | | 5,543,131 | |
Sr. Unsec’d. Notes, 144A | | 7.875 | | 04/15/27 | | | | | | | 5,675 | | | | 5,901,824 | |
| | | | | | | | | | | | | | | | |
| | | | | |
| | | | | | | | | | | | | | | 11,444,955 | |
| | | | | |
Agriculture 0.1% | | | | | | | | | | | | | | | | |
| | | | | |
Vector Group Ltd., | | | | | | | | | | | | | | | | |
Sr. Sec’d. Notes, 144A | | 5.750 | | 02/01/29 | | | | | | | 475 | | | | 473,847 | |
| | | | | |
Airlines 0.5% | | | | | | | | | | | | | | | | |
| | | | | |
American Airlines 2013-1 Class A Pass-Through Trust, | | | | | | | | | | | | | | | | |
Pass-Through Certificates | | 4.000 | | 01/15/27 | | | | | | | 1,704 | | | | 1,656,477 | |
Continental Airlines 2007-1 Class A Pass-Through Trust, | | | | | | | | | | | | | | | | |
Pass-Through Certificates | | 5.983 | | 10/19/23 | | | | | | | 183 | | | | 185,949 | |
|
See Notes to Financial Statements. 22 |
| | | | | | | | | | | | | | | | |
| | | | | |
| Description | | Interest Rate | | Maturity Date | | | | | Principal Amount (000)# | | | Value | |
| | | | | |
CORPORATE BONDS (Continued) | | | | | | | | | | | | | | | | |
| | | | | |
Airlines (cont’d.) | | | | | | | | | | | | | | | | |
| | | | | |
Continental Airlines 2012-2 Class A Pass-Through Trust, | | | | | | | | | | | | | | | | |
Pass-Through Certificates | | 4.000% | | 04/29/26 | | | | | | | 75 | | | $ | 78,632 | |
United Airlines 2013-1 Class A Pass-Through Trust, | | | | | | | | | | | | | | | | |
Pass-Through Certificates | | 4.300 | | 02/15/27 | | | | | | | 1,600 | | | | 1,701,803 | |
United Airlines, Inc., | | | | | | | | | | | | | | | | |
Sr. Sec’d. Notes, 144A | | 4.375 | | 04/15/26 | | | | | | | 645 | | | | 667,849 | |
Sr. Sec’d. Notes, 144A | | 4.625 | | 04/15/29 | | | | | | | 170 | | | | 175,311 | |
| | | | | | | | | | | | | | | | |
| | | | | |
| | | | | | | | | | | | | | | 4,466,021 | |
| | | | | |
Auto Manufacturers 0.2% | | | | | | | | | | | | | | | | |
| | | | | |
General Motors Co., | | | | | | | | | | | | | | | | |
Sr. Unsec’d. Notes | | 6.250 | | 10/02/43 | | | | | | | 1,555 | | | | 2,121,312 | |
| | | | | |
Auto Parts & Equipment 0.6% | | | | | | | | | | | | | | | | |
| | | | | |
Adient Global Holdings Ltd., | | | | | | | | | | | | | | | | |
Gtd. Notes, 144A(a) | | 4.875 | | 08/15/26 | | | | | | | 1,900 | | | | 1,935,869 | |
American Axle & Manufacturing, Inc., | | | | | | | | | | | | | | | | |
Gtd. Notes | | 6.250 | | 03/15/26 | | | | | | | 2,200 | | | | 2,260,557 | |
Cooper-Standard Automotive, Inc., | | | | | | | | | | | | | | | | |
Gtd. Notes, 144A(a) | | 5.625 | | 11/15/26 | | | | | | | 1,800 | | | | 1,443,801 | |
Nemak SAB de CV (Mexico), | | | | | | | | | | | | | | | | |
Sr. Unsec’d. Notes, 144A | | 3.625 | | 06/28/31 | | | | | | | 350 | | | | 327,307 | |
| | | | | | | | | | | | | | | | |
| | | | | |
| | | | | | | | | | | | | | | 5,967,534 | |
| | | | | |
Banks 5.5% | | | | | | | | | | | | | | | | |
| | | | | |
Banco de Credito del Peru (Peru), | | | | | | | | | | | | | | | | |
Sub. Notes, 144A, MTN | | 3.250(ff) | | 09/30/31 | | | | | | | 1,055 | | | | 1,044,122 | |
Bangkok Bank PCL (Thailand), | | | | | | | | | | | | | | | | |
Sub. Notes, 144A | | 3.466(ff) | | 09/23/36 | | | | | | | 945 | | | | 939,425 | |
Bank of America Corp., | | | | | | | | | | | | | | | | |
Jr. Sub. Notes, Series JJ | | 5.125(ff) | | 06/20/24(oo) | | | | | | | 6,850 | | | | 7,225,874 | |
Jr. Sub. Notes, Series MM | | 4.300(ff) | | 01/28/25(oo) | | | | | | | 5,545 | | | | 5,637,138 | |
Sr. Unsec’d. Notes, MTN | | 4.271(ff) | | 07/23/29 | | | | | | | 1,450 | | | | 1,628,805 | |
Citigroup, Inc., | | | | | | | | | | | | | | | | |
Sr. Unsec’d. Notes | | 2.976(ff) | | 11/05/30 | | | | | | | 870 | | | | 905,772 | |
Sr. Unsec’d. Notes | | 3.200 | | 10/21/26 | | | | | | | 1,145 | | | | 1,217,316 | |
Sr. Unsec’d. Notes | | 3.887(ff) | | 01/10/28 | | | | | | | 980 | | | | 1,067,242 | |
Sr. Unsec’d. Notes | | 8.125 | | 07/15/39 | | | | | | | 620 | | | | 1,051,929 | |
Sub. Notes | | 4.400 | | 06/10/25 | | | | | | | 405 | | | | 443,081 | |
| | |
| See Notes to Financial Statements. |
| PGIM Absolute Return Bond Fund | | 23 |
Schedule of Investments (continued)
as of October 31, 2021
| | | | | | | | | | | | | | | | |
| | | | | |
| Description | | Interest Rate | | Maturity Date | | | | | Principal Amount (000)# | | | Value | |
| | | | | |
CORPORATE BONDS (Continued) | | | | | | | | | | | | | | | | |
| | | | | |
Banks (cont’d.) | | | | | | | | | | | | | | | | |
| | | | | |
Credit Suisse Group AG (Switzerland), | | | | | | | | | | | | | | | | |
Sr. Unsec’d. Notes | | 3.750% | | 03/26/25 | | | | | | | 1,200 | | | $ | 1,285,441 | |
Development Bank of the Republic of Belarus JSC (Belarus), | | | | | | | | | | | | | | | | |
Sr. Unsec’d. Notes, 144A(a) | | 6.750 | | 05/02/24 | | | | | | | 1,505 | | | | 1,418,811 | |
Goldman Sachs Group, Inc. (The), | | | | | | | | | | | | | | | | |
Sr. Unsec’d. Notes | | 3.814(ff) | | 04/23/29 | | | | | | | 35 | | | | 38,328 | |
Sr. Unsec’d. Notes | | 3.850 | | 01/26/27 | | | | | | | 3,940 | | | | 4,265,567 | |
Sr. Unsec’d. Notes | | 4.223(ff) | | 05/01/29 | | | | | | | 135 | | | | 151,218 | |
Grupo Aval Ltd. (Colombia), | | | | | | | | | | | | | | | | |
Gtd. Notes, 144A | | 4.375 | | 02/04/30 | | | | | | | 2,170 | | | | 2,121,175 | |
JPMorgan Chase & Co., | | | | | | | | | | | | | | | | |
Jr. Sub. Notes, Series FF | | 5.000(ff) | | 08/01/24(oo) | | | | | | | 1,500 | | | | 1,554,035 | |
Jr. Sub. Notes, Series HH | | 4.600(ff) | | 02/01/25(oo) | | | | | | | 15,325 | | | | 15,655,417 | |
Jr. Sub. Notes, Series I, 3 Month LIBOR + 3.470% | | 3.599(c) | | 01/30/22(oo) | | | | | | | 64 | | | | 64,230 | |
Mizrahi Tefahot Bank Ltd. (Israel), | | | | | | | | | | | | | | | | |
Sub. Notes, 144A(a) | | 3.077(ff) | | 04/07/31 | | | | | | | 1,555 | | | | 1,553,088 | |
Morgan Stanley, | | | | | | | | | | | | | | | | |
Sr. Unsec’d. Notes(a) | | 4.375 | | 01/22/47 | | | | | | | 1,260 | | | | 1,591,966 | |
Sr. Unsec’d. Notes, GMTN | | 3.772(ff) | | 01/24/29 | | | | | | | 1,750 | | | | 1,920,584 | |
Sr. Unsec’d. Notes, GMTN | | 3.875 | | 01/27/26 | | | | | | | 605 | | | | 660,390 | |
People’s United Bank NA, | | | | | | | | | | | | | | | | |
Sub. Notes | | 4.000 | | 07/15/24 | | | | | | | 325 | | | | 344,343 | |
| | | | | | | | | | | | | | | | |
| | | | | |
| | | | | | | | | | | | | | | 53,785,297 | |
| | | | | |
Beverages 0.0% | | | | | | | | | | | | | | | | |
| | | | | |
Anheuser-Busch InBev Worldwide, Inc. (Belgium), | | | | | | | | | | | | | | | | |
Gtd. Notes | | 8.200 | | 01/15/39 | | | | | | | 250 | | | | 411,934 | |
| | | | | |
Building Materials 0.1% | | | | | | | | | | | | | | | | |
| | | | | |
Cemex SAB de CV (Mexico), | | | | | | | | | | | | | | | | |
Gtd. Notes, 144A | | 5.450 | | 11/19/29 | | | | | | | 1,180 | | | | 1,277,589 | |
| | | | | |
Chemicals 1.6% | | | | | | | | | | | | | | | | |
| | | | | |
Ashland LLC, | | | | | | | | | | | | | | | | |
Gtd. Notes | | 6.875 | | 05/15/43 | | | | | | | 4,100 | | | | 5,322,197 | |
Ashland Services BV, | | | | | | | | | | | | | | | | |
Gtd. Notes | | 2.000 | | 01/30/28 | | | EUR | | | | 1,200 | | | | 1,423,614 | |
Braskem Netherlands Finance BV (Brazil), | | | | | | | | | | | | | | | | |
Gtd. Notes, 144A | | 4.500 | | 01/10/28 | | | | | | | 1,630 | | | | 1,666,620 | |
|
See Notes to Financial Statements. 24 |
| | | | | | | | | | | | | | | | |
| | | | | |
| Description | | Interest
Rate | | Maturity
Date | | | | | Principal
Amount
(000)# | | | Value | |
| | | | | |
CORPORATE BONDS (Continued) | | | | | | | | | | | | | | | | |
| | | | | |
Chemicals (cont’d.) | | | | | | | | | | | | | | | | |
| | | | | |
LYB International Finance BV, | | | | | | | | | | | | | | | | |
Gtd. Notes | | 5.250% | | 07/15/43 | | | | | | | 175 | | | $ | 226,007 | |
Nutrien Ltd. (Canada), | | | | | | | | | | | | | | | | |
Sr. Unsec’d. Notes | | 4.900 | | 06/01/43 | | | | | | | 1,350 | | | | 1,722,399 | |
Sasol Financing International Ltd. (South Africa), | | | | | | | | | | | | | | | | |
Gtd. Notes(a) | | 4.500 | | 11/14/22 | | | | | | | 2,415 | | | | 2,468,807 | |
Sasol Financing USA LLC (South Africa), | | | | | | | | | | | | | | | | |
Gtd. Notes | | 4.375 | | 09/18/26 | | | | | | | 350 | | | | 356,059 | |
TPC Group, Inc., | | | | | | | | | | | | | | | | |
Sr. Sec’d. Notes, 144A | | 10.500 | | 08/01/24 | | | | | | | 1,700 | | | | 1,540,359 | |
Sr. Sec’d. Notes, 144A | | 10.875 | | 08/01/24 | | | | | | | 419 | | | | 446,955 | |
| | | | | | | | | | | | | | | | |
| | | | | |
| | | | | | | | | | | | | | | 15,173,017 | |
| | | | | |
Commercial Services 0.9% | | | | | | | | | | | | | | | | |
| | | | | |
ERAC USA Finance LLC, | | | | | | | | | | | | | | | | |
Gtd. Notes, 144A | | 6.700 | | 06/01/34 | | | | | | | 110 | | | | 152,789 | |
Gtd. Notes, 144A(h) | | 7.000 | | 10/15/37 | | | | | | | 1,725 | | | | 2,569,559 | |
Nexi SpA (Italy), | | | | | | | | | | | | | | | | |
Sr. Unsec’d. Notes | | 2.125 | | 04/30/29 | | | EUR | | | | 4,060 | | | | 4,640,950 | |
United Rentals North America, Inc., | | | | | | | | | | | | | | | | |
Gtd. Notes | | 3.750 | | 01/15/32 | | | | | | | 325 | | | | 324,357 | |
Gtd. Notes | | 5.250 | | 01/15/30 | | | | | | | 1,200 | | | | 1,299,666 | |
| | | | | | | | | | | | | | | | |
| | | | | |
| | | | | | | | | | | | | | | 8,987,321 | |
| | | | | |
Computers 0.0% | | | | | | | | | | | | | | | | |
| | | | | |
CA Magnum Holdings (India), | | | | | | | | | | | | | | | | |
Sr. Sec’d. Notes, 144A | | 5.375 | | 10/31/26 | | | | | | | 215 | | | | 221,468 | |
| | | | | |
Diversified Financial Services 0.3% | | | | | | | | | | | | | | | | |
| | | | | |
Jefferies Group LLC, | | | | | | | | | | | | | | | | |
Sr. Unsec’d. Notes | | 6.500 | | 01/20/43 | | | | | | | 175 | | | | 244,360 | |
OneMain Finance Corp., | | | | | | | | | | | | | | | | |
Gtd. Notes | | 3.875 | | 09/15/28 | | | | | | | 1,200 | | | | 1,170,804 | |
Power Finance Corp. Ltd. (India), | | | | | | | | | | | | | | | | |
Sr. Unsec’d. Notes, EMTN | | 5.250 | | 08/10/28 | | | | | | | 1,100 | | | | 1,230,516 | |
| | | | | | | | | | | | | | | | |
| | | | | |
| | | | | | | | | | | | | | | 2,645,680 | |
| | | | | |
Electric 1.5% | | | | | | | | | | | | | | | | |
| | | | | |
AES Panama Generation Holdings SRL (Panama), | | | | | | | | | | | | | | | | |
Sr. Sec’d. Notes, 144A | | 4.375 | | 05/31/30 | | | | | | | 1,065 | | | | 1,095,249 | |
| | |
| See Notes to Financial Statements. |
| PGIM Absolute Return Bond Fund | | 25 |
Schedule of Investments (continued)
as of October 31, 2021
| | | | | | | | | | | | | | | | |
| | | | | |
| Description | | Interest
Rate | | Maturity
Date | | | | | Principal
Amount
(000)# | | | Value | |
| | | | | |
CORPORATE BONDS (Continued) | | | | | | | | | | | | | | | | |
| | | | | |
Electric (cont’d.) | | | | | | | | | | | | | | | | |
| | | | | |
Calpine Corp., | | | | | | | | | | | | | | | | |
Sr. Unsec’d. Notes, 144A(a) | | 4.625% | | 02/01/29 | | | | | | | 1,500 | | | $ | 1,458,447 | |
Sr. Unsec’d. Notes, 144A | | 5.000 | | 02/01/31 | | | | | | | 2,275 | | | | 2,228,903 | |
Clean Renewable Power Mauritius Pte Ltd. (India), | | | | | | | | | | | | | | | | |
Sr. Sec’d. Notes, 144A | | 4.250 | | 03/25/27 | | | | | | | 475 | | | | 483,678 | |
Duke Energy Carolinas LLC, | | | | | | | | | | | | | | | | |
First Ref. Mortgage | | 4.000 | | 09/30/42 | | | | | | | 50 | | | | 57,651 | |
Eskom Holdings SOC Ltd. (South Africa), | | | | | | | | | | | | | | | | |
Sr. Unsec’d. Notes, 144A | | 7.125 | | 02/11/25 | | | | | | | 2,145 | | | | 2,237,693 | |
Sr. Unsec’d. Notes, 144A, MTN | | 6.750 | | 08/06/23 | | | | | | | 200 | | | | 206,553 | |
Evergy Kansas Central, Inc., | | | | | | | | | | | | | | | | |
First Mortgage | | 4.100 | | 04/01/43 | | | | | | | 325 | | | | 383,308 | |
FEL Energy VI Sarl (Mexico), | | | | | | | | | | | | | | | | |
Sr. Sec’d. Notes, 144A | | 5.750 | | 12/01/40 | | | | | | | 1,865 | | | | 1,845,808 | |
Instituto Costarricense de Electricidad (Costa Rica), | | | | | | | | | | | | | | | | |
Sr. Unsec’d. Notes, 144A | | 6.950 | | 11/10/21 | | | | | | | 500 | | | | 500,623 | |
Mong Duong Finance Holdings BV (Vietnam), | | | | | | | | | | | | | | | | |
Sr. Sec’d. Notes | | 5.125 | | 05/07/29 | | | | | | | 1,295 | | | | 1,288,133 | |
NRG Energy, Inc., | | | | | | | | | | | | | | | | |
Gtd. Notes, 144A | | 3.625 | | 02/15/31 | | | | | | | 1,000 | | | | 973,967 | |
Gtd. Notes, 144A | | 3.875 | | 02/15/32 | | | | | | | 500 | | | | 489,973 | |
Vistra Corp., | | | | | | | | | | | | | | | | |
Jr. Sub. Notes, 144A | | 8.000(ff) | | 10/15/26(oo) | | | | | | | 1,575 | | | | 1,653,269 | |
| | | | | | | | | | | | | | | | |
| | | | | |
| | | | | | | | | | | | | | | 14,903,255 | |
| | | | | |
Electronics 0.0% | | | | | | | | | | | | | | | | |
| | | | | |
Jabil, Inc., | | | | | | | | | | | | | | | | |
Sr. Unsec’d. Notes | | 4.700 | | 09/15/22 | | | | | | | 80 | | | | 82,785 | |
| | | | | |
Energy-Alternate Sources 0.3% | | | | | | | | | | | | | | | | |
| | | | | |
Aydem Yenilenebilir Enerji A/S (Turkey), | | | | | | | | | | | | | | | | |
Sr. Sec’d. Notes, 144A | | 7.750 | | 02/02/27 | | | | | | | 830 | | | | 788,962 | |
Greenko Dutch BV (India), | | | | | | | | | | | | | | | | |
Gtd. Notes, 144A | | 3.850 | | 03/29/26 | | | | | | | 1,803 | | | | 1,818,831 | |
| | | | | | | | | | | | | | | | |
| | | | | |
| | | | | | | | | | | | | | | 2,607,793 | |
| | | | | |
Engineering & Construction 0.4% | | | | | | | | | | | | | | | | |
| | | | | |
Cellnex Finance Co. SA (Spain), | | | | | | | | | | | | | | | | |
Gtd. Notes, EMTN | | 2.000 | | 02/15/33 | | | EUR | | | | 1,100 | | | | 1,213,293 | |
|
See Notes to Financial Statements. 26 |
| | | | | | | | | | | | | | | | |
| | | | | |
| Description | | Interest
Rate | | Maturity
Date | | | | | Principal
Amount
(000)# | | | Value | |
| | | | | |
CORPORATE BONDS (Continued) | | | | | | | | | | | | | | | | |
| | | | | |
Engineering & Construction (cont’d.) | | | | | | | | | | | | | | | | |
| | | | | |
Cellnex Telecom SA (Spain), | | | | | | | | | | | | | | | | |
Sr. Unsec’d. Notes, EMTN | | 1.750% | | 10/23/30 | | | EUR | | | | 700 | | | $ | 781,222 | |
Mexico City Airport Trust (Mexico), | | | | | | | | | | | | | | | | |
Sr. Sec’d. Notes, 144A | | 3.875 | | 04/30/28 | | | | | | | 2,000 | | | | 2,071,129 | |
| | | | | | | | | | | | | | | | |
| | | | | |
| | | | | | | | | | | | | | | 4,065,644 | |
| | | | | |
Entertainment 0.6% | | | | | | | | | | | | | | | | |
| | | | | |
AMC Entertainment Holdings, Inc., | | | | | | | | | | | | | | | | |
Sec’d. Notes, 144A, Cash coupon 10.000% or PIK 12.000% or Cash coupon 5.000% and PIK 6.000% | | 12.000 | | 06/15/26 | | | | | | | 480 | | | | 476,802 | |
Codere Finance 2 Luxembourg SA (Spain), | | | | | | | | | | | | | | | | |
Sr. Sec’d. Notes, Cash coupon 4.500% and PIK 6.250% | | 10.750 | | 11/01/23(d) | | | EUR | | | | 2,414 | | | | 1,741,868 | |
Sr. Sec’d. Notes, 144A | | 10.750 | | 09/30/23(d) | | | EUR | | | | 1,216 | | | | 1,528,323 | |
Sr. Sec’d. Notes, 144A | | 10.750 | | 09/30/23(d) | | | EUR | | | | 421 | | | | 522,688 | |
Premier Entertainment Sub LLC/Premier Entertainment Finance Corp., | | | | | | | | | | | | | | | | |
Gtd. Notes, 144A | | 5.625 | | 09/01/29 | | | | | | | 525 | | | | 534,842 | |
Gtd. Notes, 144A | | 5.875 | | 09/01/31 | | | | | | | 700 | | | | 714,023 | |
Scientific Games International, Inc., | | | | | | | | | | | | | | | | |
Gtd. Notes, 144A | | 8.250 | | 03/15/26 | | | | | | | 450 | | | | 477,539 | |
| | | | | | | | | | | | | | | | |
| | | | | |
| | | | | | | | | | | | | | | 5,996,085 | |
| | | | | |
Foods 1.1% | | | | | | | | | | | | | | | | |
| | | | | |
Bellis Finco PLC (United Kingdom), | | | | | | | | | | | | | | | | |
Gtd. Notes(a) | | 4.000 | | 02/16/27 | | | GBP | | | | 2,700 | | | | 3,484,057 | |
JBS USA Food Co., | | | | | | | | | | | | | | | | |
Gtd. Notes, 144A | | 5.750 | | 01/15/28 | | | | | | | 1,950 | | | | 2,035,853 | |
Kraft Heinz Foods Co., | | | | | | | | | | | | | | | | |
Gtd. Notes | | 4.625 | | 10/01/39 | | | | | | | 440 | | | | 515,511 | |
Gtd. Notes | | 4.875 | | 10/01/49 | | | | | | | 2,980 | | | | 3,696,493 | |
Lamb Weston Holdings, Inc., | | | | | | | | | | | | | | | | |
Gtd. Notes, 144A | | 4.125 | | 01/31/30 | | | | | | | 350 | | | | 350,410 | |
Gtd. Notes, 144A | | 4.375 | | 01/31/32 | | | | | | | 350 | | | | 350,473 | |
| | | | | | | | | | | | | | | | |
| | | | | |
| | | | | | | | | | | | | | | 10,432,797 | |
| | |
| See Notes to Financial Statements. |
| PGIM Absolute Return Bond Fund | | 27 |
Schedule of Investments (continued)
as of October 31, 2021
| | | | | | | | | | | | | | | | |
| | | | | |
| Description | | Interest
Rate | | Maturity
Date | | | | | Principal
Amount
(000)# | | | Value | |
| | | | | |
CORPORATE BONDS (Continued) | | | | | | | | | | | | | | | | |
| | | | | |
Forest Products & Paper 0.2% | | | | | | | | | | | | | | | | |
| | | | | |
Georgia-Pacific LLC, | | | | | | | | | | | | | | | | |
Sr. Unsec’d. Notes | | 7.375% | | 12/01/25 | | | | | | | 400 | | | $ | 492,945 | |
Suzano Austria GmbH (Brazil), | | | | | | | | | | | | | | | | |
Gtd. Notes | | 6.000 | | 01/15/29 | | | | | | | 1,000 | | | | 1,149,375 | |
| | | | | | | | | | | | | | | | |
| | | | | |
| | | | | | | | | | | | | | | 1,642,320 | |
| | | | | |
Gas 0.7% | | | | | | | | | | | | | | | | |
| | | | | |
AmeriGas Partners LP/AmeriGas Finance Corp., | | | | | | | | | | | | | | | | |
Sr. Unsec’d. Notes | | 5.500 | | 05/20/25 | | | | | | | 2,900 | | | | 3,147,939 | |
CenterPoint Energy Resources Corp., | | | | | | | | | | | | | | | | |
Sr. Unsec’d. Notes(a) | | 5.850 | | 01/15/41 | | | | | | | 700 | | | | 967,660 | |
ENN Clean Energy International Investment Ltd. (China), | | | | | | | | | | | | | | | | |
Gtd. Notes, 144A | | 3.375 | | 05/12/26 | | | | | | | 1,350 | | | | 1,339,817 | |
Southern Co. Gas Capital Corp., | | | | | | | | | | | | | | | | |
Gtd. Notes | | 4.400 | | 06/01/43 | | | | | | | 1,375 | | | | 1,606,949 | |
| | | | | | | | | | | | | | | | |
| | | | | |
| | | | | | | | | | | | | | | 7,062,365 | |
| | | | | |
Healthcare-Products 0.4% | | | | | | | | | | | | | | | | |
| | | | | |
Medtronic Global Holdings SCA, | | | | | | | | | | | | | | | | |
Gtd. Notes | | 1.625 | | 03/07/31 | | | EUR | | | | 160 | | | | 199,971 | |
Gtd. Notes | | 2.250 | | 03/07/39 | | | EUR | | | | 705 | | | | 948,623 | |
Mozart Debt Merger Sub, Inc., | | | | | | | | | | | | | | | | |
Sr. Sec’d. Notes, 144A | | 3.875 | | 04/01/29 | | | | | | | 250 | | | | 248,799 | |
Sr. Unsec’d. Notes, 144A | | 5.250 | | 10/01/29 | | | | | | | 150 | | | | 152,458 | |
Thermo Fisher Scientific, Inc., | | | | | | | | | | | | | | | | |
Sr. Unsec’d. Notes, EMTN | | 1.500 | | 10/01/39 | | | EUR | | | | 1,250 | | | | 1,479,039 | |
Sr. Unsec’d. Notes, EMTN | | 1.875 | | 10/01/49 | | | EUR | | | | 825 | | | | 1,015,554 | |
| | | | | | | | | | | | | | | | |
| | | | | |
| | | | | | | | | | | | | | | 4,044,444 | |
| | | | | |
Healthcare-Services 0.3% | | | | | | | | | | | | | | | | |
| | | | | |
Aetna, Inc., | | | | | | | | | | | | | | | | |
Sr. Unsec’d. Notes | | 2.750 | | 11/15/22 | | | | | | | 450 | | | | 457,813 | |
Sr. Unsec’d. Notes | | 4.500 | | 05/15/42 | | | | | | | 530 | | | | 634,350 | |
Anthem, Inc., | | | | | | | | | | | | | | | | |
Sr. Unsec’d. Notes | | 4.101 | | 03/01/28 | | | | | | | 700 | | | | 786,703 | |
Sr. Unsec’d. Notes | | 4.650 | | 01/15/43 | | | | | | | 120 | | | | 148,419 | |
Sr. Unsec’d. Notes | | 5.100 | | 01/15/44 | | | | | | | 515 | | | | 674,213 | |
|
See Notes to Financial Statements. 28 |
| | | | | | | | | | | | | | | | |
| | | | | |
| Description | | Interest
Rate | | Maturity
Date | | | | | Principal
Amount
(000)# | | | Value | |
| | | | | |
CORPORATE BONDS (Continued) | | | | | | | | | | | | | | | | |
| | | | | |
Healthcare-Services (cont’d.) | | | | | | | | | | | | | | | | |
| | | | | |
Memorial Sloan-Kettering Cancer Center, | | | | | | | | | | | | | | | | |
Sr. Unsec’d. Notes | | 4.125% | | 07/01/52 | | | | | | | 75 | | | $ | 95,326 | |
Tenet Healthcare Corp., | | | | | | | | | | | | | | | | |
Sec’d. Notes, 144A | | 6.250 | | 02/01/27 | | | | | | | 25 | | | | 25,965 | |
| | | | | | | | | | | | | | | | |
| | | | | |
| | | | | | | | | | | | | | | 2,822,789 | |
| | | | | |
Home Builders 0.7% | | | | | | | | | | | | | | | | |
| | | | | |
Beazer Homes USA, Inc., | | | | | | | | | | | | | | | | |
Gtd. Notes(a) | | 7.250 | | 10/15/29 | | | | | | | 3,625 | | | | 3,960,909 | |
Taylor Morrison Communities, Inc., | | | | | | | | | | | | | | | | |
Gtd. Notes, 144A | | 5.875 | | 06/15/27 | | | | | | | 2,560 | | | | 2,873,554 | |
| | | | | | | | | | | | | | | | |
| | | | | |
| | | | | | | | | | | | | | | 6,834,463 | |
| | | | | |
Insurance 1.2% | | | | | | | | | | | | | | | | |
| | | | | |
Hartford Financial Services Group, Inc. (The), | | | | | | | | | | | | | | | | |
Sr. Unsec’d. Notes | | 5.950 | | 10/15/36 | | | | | | | 215 | | | | 291,171 | |
Sr. Unsec’d. Notes | | 6.100 | | 10/01/41 | | | | | | | 280 | | | | 396,959 | |
Liberty Mutual Group, Inc., | | | | | | | | | | | | | | | | |
Gtd. Notes, 144A | | 4.250 | | 06/15/23 | | | | | | | 436 | | | | 459,514 | |
Gtd. Notes, 144A | | 4.569 | | 02/01/29 | | | | | | | 1,614 | | | | 1,861,394 | |
Lincoln National Corp., | | | | | | | | | | | | | | | | |
Sr. Unsec’d. Notes | | 7.000 | | 06/15/40 | | | | | | | 695 | | | | 1,062,399 | |
Markel Corp., | | | | | | | | | | | | | | | | |
Sr. Unsec’d. Notes | | 5.000 | | 03/30/43 | | | | | | | 3,125 | | | | 3,801,540 | |
Principal Financial Group, Inc., | | | | | | | | | | | | | | | | |
Gtd. Notes | | 4.350 | | 05/15/43 | | | | | | | 975 | | | | 1,179,265 | |
Teachers Insurance & Annuity Association of America, | | | | | | | | | | | | | | | | |
Sub. Notes, 144A | | 4.900 | | 09/15/44 | | | | | | | 1,950 | | | | 2,551,784 | |
Sub. Notes, 144A | | 6.850 | | 12/16/39 | | | | | | | 54 | | | | 81,157 | |
| | | | | | | | | | | | | | | | |
| | | | | |
| | | | | | | | | | | | | | | 11,685,183 | |
| | | | | |
Lodging 0.3% | | | | | | | | | | | | | | | | |
| | | | | |
Gohl Capital Ltd. (Malaysia), | | | | | | | | | | | | | | | | |
Gtd. Notes | | 4.250 | | 01/24/27 | | | | | | | 1,510 | | | | 1,568,120 | |
Marriott International, Inc., | | | | | | | | | | | | | | | | |
Sr. Unsec’d. Notes | | 3.250 | | 09/15/22 | | | | | | | 75 | | | | 76,169 | |
| | |
| See Notes to Financial Statements. |
| PGIM Absolute Return Bond Fund | | 29 |
Schedule of Investments (continued)
as of October 31, 2021
| | | | | | | | | | | | | | | | |
| | | | | |
| Description | | Interest
Rate | | Maturity
Date | | | | | Principal
Amount
(000)# | | | Value | |
| | | | | |
CORPORATE BONDS (Continued) | | | | | | | | | | | | | | | | |
| | | | | |
Lodging (cont’d.) | | | | | | | | | | | | | | | | |
| | | | | |
MGM China Holdings Ltd. (Macau), | | | | | | | | | | | | | | | | |
Sr. Unsec’d. Notes, 144A | | 4.750% | | 02/01/27 | | | | | | | 700 | | | $ | 671,671 | |
Sands China Ltd. (Macau), | | | | | | | | | | | | | | | | |
Sr. Unsec’d. Notes(a) | | 5.125 | | 08/08/25 | | | | | | | 1,000 | | | | 1,062,607 | |
| | | | | | | | | | | | | | | | |
| | | | | |
| | | | | | | | | | | | | | | 3,378,567 | |
| | | | | |
Media 1.1% | | | | | | | | | | | | | | | | |
| | | | | |
CCO Holdings LLC/CCO Holdings Capital Corp., | | | | | | | | | | | | | | | | |
Sr. Unsec’d. Notes, 144A | | 4.750 | | 03/01/30 | | | | | | | 1,300 | | | | 1,343,718 | |
Charter Communications Operating LLC/Charter Communications Operating Capital, | | | | | | | | | | | | | | | | |
Sr. Sec’d. Notes | | 6.384 | | 10/23/35 | | | | | | | 2,640 | | | | 3,429,708 | |
Sr. Sec’d. Notes | | 6.484 | | 10/23/45 | | | | | | | 585 | | | | 805,697 | |
CSC Holdings LLC, | | | | | | | | | | | | | | | | |
Gtd. Notes, 144A | | 5.500 | | 04/15/27 | | | | | | | 1,500 | | | | 1,548,824 | |
Diamond Sports Group LLC/Diamond Sports Finance Co., | | | | | | | | | | | | | | | | |
Gtd. Notes, 144A | | 6.625 | | 08/15/27 | | | | | | | 2,785 | | | | 832,937 | |
Virgin Media Secured Finance PLC (United Kingdom), | | | | | | | | | | | | | | | | |
Sr. Sec’d. Notes | | 4.125 | | 08/15/30 | | | GBP | | | | 700 | | | | 949,603 | |
Sr. Sec’d. Notes | | 4.250 | | 01/15/30 | | | GBP | | | | 600 | | | | 817,090 | |
Ziggo BV (Netherlands), | | | | | | | | | | | | | | | | |
Sr. Sec’d. Notes | | 2.875 | | 01/15/30 | | | EUR | | | | 1,270 | | | | 1,464,751 | |
| | | | | | | | | | | | | | | | |
| | | | | |
| | | | | | | | | | | | | | | 11,192,328 | |
| | | | | |
Mining 0.3% | | | | | | | | | | | | | | | | |
| | | | | |
AngloGold Ashanti Holdings PLC (Tanzania), | | | | | | | | | | | | | | | | |
Gtd. Notes | | 3.375 | | 11/01/28 | | | | | | | 730 | | | | 726,551 | |
Indonesia Asahan Aluminium Persero PT (Indonesia), | | | | | | | | | | | | | | | | |
Sr. Unsec’d. Notes | | 6.530 | | 11/15/28 | | | | | | | 1,650 | | | | 1,990,037 | |
| | | | | | | | | | | | | | | | |
| | | | | |
| | | | | | | | | | | | | | | 2,716,588 | |
| | | | | |
Oil & Gas 2.1% | | | | | | | | | | | | | | | | |
| | | | | |
Ascent Resources Utica Holdings LLC/ARU Finance Corp., | | | | | | | | | | | | | | | | |
Gtd. Notes, 144A | | 7.000 | | 11/01/26 | | | | | | | 1,225 | | | | 1,264,733 | |
Gtd. Notes, 144A | | 9.000 | | 11/01/27 | | | | | | | 974 | | | | 1,331,930 | |
|
See Notes to Financial Statements. 30 |
| | | | | | | | | | | | | | | | |
| | | | | |
| Description | | Interest
Rate | | Maturity
Date | | | | | Principal
Amount
(000)# | | | Value | |
| | | | | |
CORPORATE BONDS (Continued) | | | | | | | | | | | | | | | | |
| | | | | |
Oil & Gas (cont’d.) | | | | | | | | | | | | | | | | |
| | | | | |
Cenovus Energy, Inc. (Canada), | | | | | | | | | | | | | | | | |
Sr. Unsec’d. Notes | | 5.400% | | 06/15/47 | | | | | | | 1,835 | | | $ | 2,299,814 | |
Citgo Holding, Inc., | | | | | | | | | | | | | | | | |
Sr. Sec’d. Notes, 144A | | 9.250 | | 08/01/24 | | | | | | | 450 | | | | 459,563 | |
ConocoPhillips, | | | | | | | | | | | | | | | | |
Gtd. Notes, 144A | | 4.875 | | 10/01/47 | | | | | | | 275 | | | | 365,038 | |
Ecopetrol SA (Colombia), | | | | | | | | | | | | | | | | |
Sr. Unsec’d. Notes | | 4.625 | | 11/02/31 | | | | | | | 900 | | | | 892,596 | |
Energean Israel Finance Ltd. (Israel), | | | | | | | | | | | | | | | | |
Sr. Sec’d. Notes, 144A | | 4.875 | | 03/30/26 | | | | | | | 450 | | | | 457,806 | |
Sr. Sec’d. Notes, 144A | | 5.375 | | 03/30/28 | | | | | | | 720 | | | | 729,030 | |
Hilcorp Energy I LP/Hilcorp Finance Co., | | | | | | | | | | | | | | | | |
Sr. Unsec’d. Notes, 144A | | 6.250 | | 11/01/28 | | | | | | | 700 | | | | 718,177 | |
Leviathan Bond Ltd. (Israel), | | | | | | | | | | | | | | | | |
Sr. Sec’d. Notes, 144A | | 6.750 | | 06/30/30 | | | | | | | 2,020 | | | | 2,235,736 | |
Petrobras Global Finance BV (Brazil), | | | | | | | | | | | | | | | | |
Gtd. Notes | | 5.375 | | 10/01/29 | | | GBP | | | | 800 | | | | 1,170,705 | |
Petroleos Mexicanos (Mexico), | | | | | | | | | | | | | | | | |
Gtd. Notes | | 4.750 | | 02/26/29 | | | EUR | | | | 795 | | | | 909,145 | |
Gtd. Notes | | 6.350 | | 02/12/48 | | | | | | | 1,238 | | | | 1,054,605 | |
Gtd. Notes | | 6.500 | | 03/13/27 | | | | | | | 260 | | | | 277,160 | |
Gtd. Notes | | 6.840 | | 01/23/30 | | | | | | | 405 | | | | 423,140 | |
Gtd. Notes, EMTN | | 4.875 | | 02/21/28 | | | EUR | | | | 250 | | | | 290,837 | |
Qatar Energy (Qatar), | | | | | | | | | | | | | | | | |
Sr. Unsec’d. Notes, 144A | | 3.125 | | 07/12/41 | | | | | | | 425 | | | | 431,408 | |
Range Resources Corp., | | | | | | | | | | | | | | | | |
Gtd. Notes | | 9.250 | | 02/01/26 | | | | | | | 850 | | | | 920,381 | |
Transocean, Inc., | | | | | | | | | | | | | | | | |
Gtd. Notes, 144A | | 7.250 | | 11/01/25 | | | | | | | 3,025 | | | | 2,494,302 | |
Tullow Oil PLC (Ghana), | | | | | | | | | | | | | | | | |
Sr. Sec’d. Notes, 144A | | 10.250 | | 05/15/26 | | | | | | | 1,605 | | | | 1,687,246 | |
| | | | | | | | | | | | | | | | |
| | | | | |
| | | | | | | | | | | | | | | 20,413,352 | |
| | | | | |
Oil & Gas Services 0.0% | | | | | | | | | | | | | | | | |
| | | | | |
Cameron International Corp., | | | | | | | | | | | | | | | | |
Gtd. Notes | | 5.950 | | 06/01/41 | | | | | | | 100 | | | | 128,657 | |
| | |
| See Notes to Financial Statements. |
| PGIM Absolute Return Bond Fund | | 31 |
Schedule of Investments (continued)
as of October 31, 2021
| | | | | | | | | | | | | | | | |
| | | | | |
| Description | | Interest
Rate | | Maturity
Date | | | | | Principal
Amount
(000)# | | | Value | |
| | | | | |
CORPORATE BONDS (Continued) | | | | | | | | | | | | | | | | |
| | | | | |
Packaging & Containers 0.6% | | | | | | | | | | | | | | | | |
| | | | | |
ARD Finance SA (Luxembourg), | | | | | | | | | | | | | | | | |
Sr. Sec’d. Notes, 144A, Cash coupon 5.000% or PIK 5.750% | | 5.000% | | 06/30/27 | | | EUR | | | | 3,000 | | | $ | 3,565,650 | |
Verallia SA (France), | | | | | | | | | | | | | | | | |
Gtd. Notes | | 1.625 | | 05/14/28 | | | EUR | | | | 1,900 | | | | 2,245,819 | |
| | | | | | | | | | | | | | | | |
| | | | | |
| | | | | | | | | | | | | | | 5,811,469 | |
| | | | | |
Pharmaceuticals 1.9% | | | | | | | | | | | | | | | | |
| | | | | |
AbbVie, Inc., | | | | | | | | | | | | | | | | |
Sr. Unsec’d. Notes | | 4.050 | | 11/21/39 | | | | | | | 905 | | | | 1,037,599 | |
Sr. Unsec’d. Notes(h) | | 4.550 | | 03/15/35 | | | | | | | 4,155 | | | | 4,947,202 | |
Bausch Health Cos., Inc., | | | | | | | | | | | | | | | | |
Gtd. Notes, 144A | | 5.000 | | 01/30/28 | | | | | | | 400 | | | | 370,364 | |
Gtd. Notes, 144A | | 6.250 | | 02/15/29 | | | | | | | 1,200 | | | | 1,162,491 | |
Bristol-Myers Squibb Co., | | | | | | | | | | | | | | | | |
Sr. Unsec’d. Notes(h) | | 4.125 | | 06/15/39 | | | | | | | 615 | | | | 735,125 | |
Cigna Corp., | | | | | | | | | | | | | | | | |
Gtd. Notes(h) | | 4.375 | | 10/15/28 | | | | | | | 3,990 | | | | 4,573,406 | |
CVS Health Corp., | | | | | | | | | | | | | | | | |
Sr. Unsec’d. Notes | | 5.125 | | 07/20/45 | | | | | | | 1,315 | | | | 1,724,962 | |
Sr. Unsec’d. Notes | | 5.300 | | 12/05/43 | | | | | | | 485 | | | | 639,715 | |
Utah Acquisition Sub, Inc., | | | | | | | | | | | | | | | | |
Gtd. Notes | | 5.250 | | 06/15/46 | | | | | | | 520 | | | | 646,194 | |
Viatris, Inc., | | | | | | | | | | | | | | | | |
Gtd. Notes | | 4.000 | | 06/22/50 | | | | | | | 2,190 | | | | 2,372,429 | |
| | | | | | | | | | | | | | | | |
| | | | | |
| | | | | | | | | | | | | | | 18,209,487 | |
| | | | | |
Pipelines 1.7% | | | | | | | | | | | | | | | | |
| | | | | |
AI Candelaria Spain SLU (Colombia), | | | | | | | | | | | | | | | | |
Sr. Sec’d. Notes, 144A | | 5.750 | | 06/15/33 | | | | | | | 920 | | | | 905,304 | |
Eastern Gas Transmission & Storage, Inc., | | | | | | | | | | | | | | | | |
Sr. Unsec’d. Notes, 144A | | 4.600 | | 12/15/44 | | | | | | | 125 | | | | 151,280 | |
Energy Transfer LP, | | | | | | | | | | | | | | | | |
Jr. Sub. Notes, Series G | | 7.125(ff) | | 05/15/30(oo) | | | | | | | 3,360 | | | | 3,512,010 | |
Sr. Unsec’d. Notes | | 5.150 | | 03/15/45 | | | | | | | 55 | | | | 64,069 | |
Sr. Unsec’d. Notes | | 5.300 | | 04/15/47 | | | | | | | 125 | | | | 147,863 | |
Sr. Unsec’d. Notes | | 5.400 | | 10/01/47 | | | | | | | 60 | | | | 72,306 | |
Sr. Unsec’d. Notes | | 6.250 | | 04/15/49 | | | | | | | 75 | | | | 99,786 | |
Enterprise Products Operating LLC, | | | | | | | | | | | | | | | | |
Gtd. Notes | | 4.950 | | 10/15/54 | | | | | | | 1,825 | | | | 2,343,486 | |
|
See Notes to Financial Statements. 32 |
| | | | | | | | | | | | | | | | |
| | | | | |
| Description | | Interest
Rate | | Maturity
Date | | | | | Principal
Amount
(000)# | | | Value | |
| | | | | |
CORPORATE BONDS (Continued) | | | | | | | | | | | | | | | | |
| | | | | |
Pipelines (cont’d.) | | | | | | | | | | | | | | | | |
| | | | | |
Magellan Midstream Partners LP, | | | | | | | | | | | | | | | | |
Sr. Unsec’d. Notes | | 4.200% | | 12/01/42 | | | | | | | 125 | | | $ | 133,757 | |
Sr. Unsec’d. Notes(h) | | 5.150 | | 10/15/43 | | | | | | | 1,350 | | | | 1,642,525 | |
MPLX LP, | | | | | | | | | | | | | | | | |
Sr. Unsec’d. Notes | | 5.200 | | 03/01/47 | | | | | | | 145 | | | | 178,674 | |
NGPL PipeCo LLC, | | | | | | | | | | | | | | | | |
Sr. Unsec’d. Notes, 144A | | 4.875 | | 08/15/27 | | | | | | | 500 | | | | 561,996 | |
ONEOK, Inc., | | | | | | | | | | | | | | | | |
Gtd. Notes | | 4.950 | | 07/13/47 | | | | | | | 1,060 | | | | 1,257,693 | |
Rockies Express Pipeline LLC, | | | | | | | | | | | | | | | | |
Sr. Unsec’d. Notes, 144A | | 3.600 | | 05/15/25 | | | | | | | 775 | | | | 807,118 | |
Sr. Unsec’d. Notes, 144A | | 6.875 | | 04/15/40 | | | | | | | 1,850 | | | | 2,097,627 | |
Tallgrass Energy Partners LP/Tallgrass Energy Finance Corp., | | | | | | | | | | | | | | | | |
Gtd. Notes, 144A | | 5.500 | | 01/15/28 | | | | | | | 1,000 | | | | 1,003,384 | |
Gtd. Notes, 144A | | 7.500 | | 10/01/25 | | | | | | | 125 | | | | 135,172 | |
Venture Global Calcasieu Pass LLC, | | | | | | | | | | | | | | | | |
Sr. Sec’d. Notes, 144A | | 3.875 | | 08/15/29 | | | | | | | 75 | | | | 76,391 | |
Sr. Sec’d. Notes, 144A | | 4.125 | | 08/15/31 | | | | | | | 75 | | | | 77,688 | |
Western Midstream Operating LP, | | | | | | | | | | | | | | | | |
Sr. Unsec’d. Notes | | 5.300 | | 03/01/48 | | | | | | | 910 | | | | 1,064,460 | |
| | | | | | | | | | | | | | | | |
| | | | | |
| | | | | | | | | | | | | | | 16,332,589 | |
| | | | | |
Real Estate 0.5% | | | | | | | | | | | | | | | | |
| | | | | |
Arabian Centres Sukuk Ltd. (Saudi Arabia), | | | | | | | | | | | | | | | | |
Gtd. Notes, 144A | | 5.375 | | 11/26/24 | | | | | | | 995 | | | | 1,036,684 | |
Greystar Real Estate Partners LLC, | | | | | | | | | | | | | | | | |
Sr. Sec’d. Notes, 144A | | 5.750 | | 12/01/25 | | | | | | | 3,575 | | | | 3,636,941 | |
| | | | | | | | | | | | | | | | |
| | | | | |
| | | | | | | | | | | | | | | 4,673,625 | |
| | | | | |
Real Estate Investment Trusts (REITs) 0.1% | | | | | | | | | | | | | | | | |
| | | | | |
Diversified Healthcare Trust, | | | | | | | | | | | | | | | | |
Gtd. Notes | | 4.375 | | 03/01/31 | | | | | | | 1,000 | | | | 971,952 | |
| | | | | |
Retail 1.0% | | | | | | | | | | | | | | | | |
| | | | | |
Brinker International, Inc., | | | | | | | | | | | | | | | | |
Gtd. Notes, 144A | | 5.000 | | 10/01/24 | | | | | | | 1,000 | | | | 1,059,263 | |
eG Global Finance PLC (United Kingdom), | | | | | | | | | | | | | | | | |
Sr. Sec’d. Notes | | 6.250 | | 10/30/25 | | | EUR | | | | 250 | | | | 293,268 | |
Sr. Sec’d. Notes, 144A | | 4.375 | | 02/07/25 | | | EUR | | | | 4,700 | | | | 5,360,737 | |
| | |
| See Notes to Financial Statements. |
| PGIM Absolute Return Bond Fund | | 33 |
Schedule of Investments (continued)
as of October 31, 2021
| | | | | | | | | | | | | | | | |
| | | | | |
| Description | | Interest
Rate | | Maturity
Date | | | | | Principal
Amount
(000)# | | | Value | |
| | | | | |
CORPORATE BONDS (Continued) | | | | | | | | | | | | | | | | |
| | | | | |
Retail (cont’d.) | | | | | | | | | | | | | | | | |
| | | | | |
Falabella SA (Chile), | | | | | | | | | | | | | | | | |
Sr. Unsec’d. Notes, 144A | | 3.375% | | 01/15/32 | | | | | | | 1,200 | | | $ | 1,190,624 | |
JSM Global Sarl (Brazil), | | | | | | | | | | | | | | | | |
Gtd. Notes, 144A | | 4.750 | | 10/20/30 | | | | | | | 1,800 | | | | 1,712,701 | |
Macy’s Retail Holdings LLC, | | | | | | | | | | | | | | | | |
Gtd. Notes | | 4.300 | | 02/15/43 | | | | | | | 705 | | | | 605,133 | |
| | | | | | | | | | | | | | | | |
| | | | | |
| | | | | | | | | | | | | | | 10,221,726 | |
| | | | | |
Savings & Loans 0.0% | | | | | | | | | | | | | | | | |
| | | | | |
People’s United Financial, Inc., | | | | | | | | | | | | | | | | |
Sr. Unsec’d. Notes | | 3.650 | | 12/06/22 | | | | | | | 325 | | | | 332,758 | |
| | | | | |
Telecommunications 2.0% | | | | | | | | | | | | | | | | |
| | | | | |
AT&T, Inc., | | | | | | | | | | | | | | | | |
Sr. Unsec’d. Notes | | 2.550 | | 12/01/33 | | | | | | | 1,542 | | | | 1,495,471 | |
Sr. Unsec’d. Notes | | 3.500 | | 09/15/53 | | | | | | | 929 | | | | 942,571 | |
Sr. Unsec’d. Notes | | 3.650 | | 09/15/59 | | | | | | | 318 | | | | 323,219 | |
Digicel Group Holdings Ltd. (Jamaica), | | | | | | | | | | | | | | | | |
Sr. Sec’d. Notes, Cash coupon 8.000% and PIK 2.000% | | 10.000 | | 04/01/24 | | | | | | | 809 | | | | 816,322 | |
Sr. Unsec’d. Notes, 144A, Cash coupon 5.000% and PIK 3.000% | | 8.000 | | 04/01/25 | | | | | | | 251 | | | | 242,774 | |
Digicel International Finance Ltd./Digicel International Holdings Ltd. (Jamaica), Gtd. Notes, 144A | | 8.000 | | 12/31/26 | | | | | | | 454 | | | | 443,311 | |
Gtd. Notes, 144A, Cash coupon 6.000% and PIK 7.000% | | 13.000 | | 12/31/25 | | | | | | | 625 | | | | 640,393 | |
Sr. Sec’d. Notes, 144A(a) | | 8.750 | | 05/25/24 | | | | | | | 1,138 | | | | 1,181,680 | |
Digicel Ltd. (Jamaica), | | | | | | | | | | | | | | | | |
Gtd. Notes, 144A | | 6.750 | | 03/01/23 | | | | | | | 2,050 | | | | 1,982,545 | |
Intelsat Jackson Holdings SA (Luxembourg), | | | | | | | | | | | | | | | | |
Gtd. Notes | | 5.500 | | 08/01/23(d) | | | | | | | 2,000 | | | | 1,009,590 | |
Gtd. Notes, 144A | | 8.500 | | 10/15/24(d) | | | | | | | 50 | | | | 25,928 | |
Gtd. Notes, 144A | | 9.750 | | 07/15/25(d) | | | | | | | 50 | | | | 25,783 | |
Kaixo Bondco Telecom SA (Spain), | | | | | | | | | | | | | | | | |
Sr. Unsec’d. Notes, 144A | | 5.125 | | 09/30/29 | | | EUR | | | | 2,600 | | | | 2,981,097 | |
Level 3 Financing, Inc., | | | | | | | | | | | | | | | | |
Sr. Sec’d. Notes, 144A | | 3.400 | | 03/01/27 | | | | | | | 465 | | | | 484,496 | |
Lumen Technologies, Inc., | | | | | | | | | | | | | | | | |
Sr. Unsec’d. Notes, Series P(a) | | 7.600 | | 09/15/39 | | | | | | | 825 | | | | 911,036 | |
|
See Notes to Financial Statements. 34 |
| | | | | | | | | | | | | | | | |
| | | | | |
| Description | | Interest
Rate | | Maturity
Date | | | | | Principal
Amount
(000)# | | | Value | |
| | | | | |
CORPORATE BONDS (Continued) | | | | | | | | | | | | | | | | |
| | | | | |
Telecommunications (cont’d.) | | | | | | | | | | | | | | | | |
| | | | | |
Millicom International Cellular SA (Colombia), | | | | | | | | | | | | | | | | |
Sr. Unsec’d. Notes, 144A | | 4.500% | | 04/27/31 | | | | | | | 515 | | | $ | 529,633 | |
Sprint Corp., | | | | | | | | | | | | | | | | |
Gtd. Notes | | 7.125 | | 06/15/24 | | | | | | | 2,000 | | | | 2,259,593 | |
Gtd. Notes | | 7.625 | | 02/15/25 | | | | | | | 1,150 | | | | 1,337,784 | |
Total Play Telecomunicaciones SA de CV (Mexico), | | | | | | | | | | | | | | | | |
Gtd. Notes, 144A | | 6.375 | | 09/20/28 | | | | | | | 480 | | | | 473,153 | |
Verizon Communications, Inc., | | | | | | | | | | | | | | | | |
Sr. Unsec’d. Notes | | 3.400 | | 03/22/41 | | | | | | | 1,575 | | | | 1,651,071 | |
| | | | | | | | | | | | | | | | |
| | | | | |
| | | | | | | | | | | | | | | 19,757,450 | |
| | | | | |
Textiles 0.0% | | | | | | | | | | | | | | | | |
| | | | | |
Mohawk Industries, Inc., | | | | | | | | | | | | | | | | |
Sr. Unsec’d. Notes | | 3.850 | | 02/01/23 | | | | | | | 104 | | | | 107,274 | |
| | | | | | | | | | | | | | | | |
| | | | | |
TOTAL CORPORATE BONDS
(cost $281,573,410) | | | | | | | | | | | | | | | 294,287,771 | |
| | | | | | | | | | | | | | | | |
| | | | | |
MUNICIPAL BONDS 1.9% | | | | | | | | | | | | | | | | |
| | | | | |
California 0.5% | | | | | | | | | | | | | | | | |
| | | | | |
Bay Area Toll Authority, | | | | | | | | | | | | | | | | |
Revenue Bonds, BABs, Series F2 | | 6.263 | | 04/01/49 | | | | | | | 550 | | | | 904,347 | |
Los Angeles Department of Water & Power, Water | | | | | | | | | | | | | | | | |
System Revenue, | | | | | | | | | | | | | | | | |
Taxable, Revenue Bonds, BABs, Series C | | 6.008 | | 07/01/39 | | | | | | | 1,730 | | | | 2,267,844 | |
University of California, | | | | | | | | | | | | | | | | |
Taxable, Revenue Bonds, Series AP | | 3.931 | | 05/15/45 | | | | | | | 625 | | | | 722,173 | |
Taxable, Revenue Bonds, Series J | | 4.131 | | 05/15/45 | | | | | | | 675 | | | | 807,828 | |
| | | | | | | | | | | | | | | | |
| | | | | |
| | | | | | | | | | | | | | | 4,702,192 | |
| | | | | |
Colorado 0.2% | | | | | | | | | | | | | | | | |
| | | | | |
Regional Transportation District Sales Tax Revenue, | | | | | | | | | | | | | | | | |
Revenue Bonds, BABs, Series B | | 5.844 | | 11/01/50 | | | | | | | 1,190 | | | | 1,914,795 | |
| | | | | |
Illinois 0.1% | | | | | | | | | | | | | | | | |
| | | | | |
Chicago O’Hare International Airport, | | | | | | | | | | | | | | | | |
Revenue Bonds, BABs, Series B | | 6.395 | | 01/01/40 | | | | | | | 360 | | | | 544,438 | |
State of Illinois, | | | | | | | | | | | | | | | | |
General Obligation Unlimited, Taxable, Pension | | 5.100 | | 06/01/33 | | | | | | | 865 | | | | 1,005,431 | |
| | | | | | | | | | | | | | | | |
| | | | | |
| | | | | | | | | | | | | | | 1,549,869 | |
| | |
| See Notes to Financial Statements. |
| PGIM Absolute Return Bond Fund | | 35 |
Schedule of Investments (continued)
as of October 31, 2021
| | | | | | | | | | | | | | | | |
| | | | | |
| Description | | Interest Rate | | Maturity Date | | | | | Principal
Amount
(000)# | | | Value | |
| | | | | |
MUNICIPAL BONDS (Continued) | | | | | | | | | | | | | | | | |
| | | | | |
New Jersey 0.4% | | | | | | | | | | | | | | | | |
| | | | | |
New Jersey Turnpike Authority, | | | | | | | | | | | | | | | | |
Taxable, Revenue Bonds, BABs, Series F | | 7.414% | | 01/01/40 | | | | | | | 2,000 | | | $ | 3,287,586 | |
Rutgers The State University of New Jersey, | | | | | | | | | | | | | | | | |
Taxable, Revenue Bonds, BABs, Series H | | 5.665 | | 05/01/40 | | | | | | | 200 | | | | 273,487 | |
| | | | | | | | | | | | | | | | |
| | | | | |
| | | | | | | | | | | | | | | 3,561,073 | |
| | | | | |
Ohio 0.0% | | | | | | | | | | | | | | | | |
| | | | | |
Ohio State University (The), | | | | | | | | | | | | | | | | |
Taxable, Revenue Bonds, Series A | | 4.800 | | 06/01/2111 | | | | | | | 180 | | | | 275,609 | |
| | | | | |
Puerto Rico 0.7% | | | | | | | | | | | | | | | | |
Puerto Rico Sales Tax Financing Corp. Sales Tax Revenue, | | | | | | | | | | | | | | | | |
Revenue Bonds, Restructured, Series A-1 | | 4.750 | | 07/01/53 | | | | | | | 5,846 | | | | 6,502,482 | |
| | | | | |
Texas 0.0% | | | | | | | | | | | | | | | | |
| | | | | |
City of San Antonio TX Electric & Gas Systems Revenue, | | | | | | | | | | | | | | | | |
Taxable, Revenue Bonds | | 4.427 | | 02/01/42 | | | | | | | 120 | | | | 148,064 | |
| | | | | | | | | | | | | | | | |
| | | | | |
TOTAL MUNICIPAL BONDS
(cost $15,861,615) | | | | | | | | | | | | | | | 18,654,084 | |
| | | | | | | | | | | | | | | | |
| | | | |
RESIDENTIAL MORTGAGE-BACKED SECURITIES 2.5% | | | | | | | | | | | | | | |
Banc of America Funding Corp., | | | | | | | | | | | | | | | | |
Series 2015-R03, Class 1A1, 144A, 1 Month LIBOR + 0.190% | | 0.279(c) | | 03/27/36 | | | | | | | 2,002 | | | | 1,992,925 | |
Banc of America Funding Trust, | | | | | | | | | | | | | | | | |
Series 2014-R05, Class 1A1, 144A, 6 Month LIBOR + 1.500% (Cap 11.000%, Floor 1.500%) | | 1.655(c) | | 09/26/45 | | | | | | | 509 | | | | 513,465 | |
Bellemeade Re Ltd. (Bermuda), | | | | | | | | | | | | | | | | |
Series 2018-01A, Class M1B, 144A, 1 Month LIBOR + 1.600% (Cap N/A, Floor 0.000%) | | 1.689(c) | | 04/25/28 | | | | | | | 573 | | | | 572,727 | |
Series 2018-03A, Class M1B, 144A, 1 Month LIBOR + 1.850% (Cap N/A, Floor 1.850%) | | 1.939(c) | | 10/25/28 | | | | | | | 1,795 | | | | 1,795,423 | |
Series 2021-01A, Class M1C, 144A, 30 Day | | | | | | | | | | | | | | | | |
Average SOFR + 2.950% (Cap N/A, Floor 2.950%) | | 2.999(c) | | 03/25/31 | | | | | | | 960 | | | | 993,609 | |
Chase Mortgage Finance Trust, | | | | | | | | | | | | | | | | |
Series 2007-A01, Class 1A3 | | 2.363(cc) | | 02/25/37 | | | | | | | 54 | | | | 54,652 | |
|
See Notes to Financial Statements. 36 |
| | | | | | | | | | | | | | | | |
| | | | | |
| Description | | Interest Rate | | Maturity Date | | | | | Principal Amount (000)# | | | Value | |
| | | | |
RESIDENTIAL MORTGAGE-BACKED SECURITIES (Continued) | | | | | | | | | | | | | | |
Connecticut Avenue Securities Trust, | | | | | | | | | | | | | | | | |
Series 2020-R01, Class 1M2, 144A, 1 Month LIBOR + 2.050% (Cap N/A, Floor 2.050%) | | 2.139%(c) | | 01/25/40 | | | | | | | 116 | | | $ | 116,173 | |
Series 2021-R01, Class 1B1, 144A, 30 Day Average SOFR + 3.100% (Cap N/A, Floor 0.000%) | | 3.150(c) | | 10/25/41 | | | | | | | 990 | | | | 994,412 | |
Eagle Re Ltd. (Bermuda), | | | | | | | | | | | | | | | | |
Series 2018-01, Class M1, 144A, 1 Month LIBOR + 1.700% (Cap N/A, Floor 1.700%) | | 1.789(c) | | 11/25/28 | | | | | | | 1,893 | | | | 1,894,585 | |
Series 2021-02, Class M1C, 144A, 30 Day Average SOFR + 3.450% (Cap N/A, Floor 3.450%) | | 3.499(c) | | 04/25/34 | | | | | | | 910 | | | | 910,000 | |
FHLMC Structured Agency Credit Risk Debt Notes, | | | | | | | | | | | | | | | | |
Series 2021-DNA02, Class B1, 144A, 30 Day Average SOFR + 3.400% (Cap N/A, Floor 0.000%) | | 3.449(c) | | 08/25/33 | | | | | | | 3,260 | | | | 3,344,305 | |
FHLMC Structured Agency Credit Risk REMIC Trust, | | | | | | | | | | | | | | | | |
Series 2021-DNA05, Class B1, 144A, 30 Day Average SOFR + 3.050% (Cap N/A, Floor 0.000%) | | 3.099(c) | | 01/25/34 | | | | | | | 600 | | | | 606,750 | |
Series 2021-HQA03, Class B1, 144A, 30 Day Average SOFR + 3.350% (Cap N/A, Floor 0.000%) | | 3.399(c) | | 09/25/41 | | | | | | | 570 | | | | 564,553 | |
GSMSC Resecuritization Trust, | | | | | | | | | | | | | | | | |
Series 2015-03R, Class 1A2, 144A, 1 Month LIBOR + 0.140% (Cap N/A, Floor 0.140%) | | 0.229(c) | | 01/26/37 | | | | | | | 512 | | | | 509,103 | |
Series 2015-03R, Class 2A1, 144A, 1 Month LIBOR + 0.140% (Cap N/A, Floor 0.140%) | | 0.229(c) | | 10/26/36 | | | | | | | 258 | | | | 256,827 | |
Series 2015-03R, Class 2A2, 144A, 1 Month LIBOR + 0.140% (Cap N/A, Floor 0.140%) | | 0.229(c) | | 10/26/36 | | | | | | | 1,400 | | | | 1,371,716 | |
Home Re Ltd. (Bermuda), | | | | | | | | | | | | | | | | |
Series 2018-01, Class M1, 144A, 1 Month LIBOR + 1.600% (Cap N/A, Floor 0.000%) | | 1.689(c) | | 10/25/28 | | | | | | | 550 | | | | 551,213 | |
JPMorgan Mortgage Trust, | | | | | | | | | | | | | | | | |
Series 2007-A01, Class 4A1 | | 2.307(cc) | | 07/25/35 | | | | | | | 45 | | | | 44,870 | |
New Residential Mortgage Loan Trust, | | | | | | | | | | | | | | | | |
Series 2018-04A, Class A1S, 144A, 1 Month LIBOR + 0.750% (Cap N/A, Floor 0.750%) | | 0.839(c) | | 01/25/48 | | | | | | | 2,104 | | | | 2,103,516 | |
Oaktown Re II Ltd. (Bermuda), | | | | | | | | | | | | | | | | |
Series 2018-01A, Class M1, 144A, 1 Month LIBOR + 1.550% (Cap N/A, Floor 0.000%) | | 1.639(c) | | 07/25/28 | | | | | | | 310 | | | | 309,840 | |
| | |
| See Notes to Financial Statements. |
| PGIM Absolute Return Bond Fund | | 37 |
Schedule of Investments (continued)
as of October 31, 2021
| | | | | | | | | | | | | | | | |
| | | | | |
| Description | | Interest Rate | | Maturity Date | | | | | Principal Amount (000)# | | | Value | |
| | | | |
RESIDENTIAL MORTGAGE-BACKED SECURITIES (Continued) | | | | | | | | | | | | | | |
Oaktown Re VII Ltd. (Bermuda), | | | | | | | | | | | | | | | | |
Series 2021-02, Class M1B, 144A, 30 Day Average SOFR + 2.900% (Cap N/A, Floor 2.900%) | | 2.950%(c) | | 04/25/34 | | | | | | | 1,000 | | | $ | 1,000,000 | |
Radnor Re Ltd. (Bermuda), | | | | | | | | | | | | | | | | |
Series 2018-01, Class M1, 144A, 1 Month LIBOR + 1.400% (Cap N/A, Floor 0.000%) | | 1.489(c) | | 03/25/28 | | | | | | | 92 | | | | 92,282 | |
Series 2018-01, Class M2, 144A, 1 Month LIBOR + 2.700% (Cap N/A, Floor 0.000%) | | 2.789(c) | | 03/25/28 | | | | | | | 1,240 | | | | 1,248,118 | |
Series 2020-02, Class M1C, 144A, 1 Month LIBOR + 4.600% (Cap N/A, Floor 4.600%) | | 4.689(c) | | 10/25/30 | | | | | | | 773 | | | | 774,359 | |
Retiro Mortgage Securities DAC (Ireland), | | | | | | | | | | | | | | | | |
Series 01A, Class A1, 144A, 3 Month EURIBOR + 2.000% (Cap 5.000%, Floor 0.000%) | | 1.453(c) | | 07/30/75 | | | EUR | | | | 1,741 | | | | 2,002,122 | |
Structured Asset Securities Corp., | | | | | | | | | | | | | | | | |
Series 2003-37A, Class 3A7 | | 2.345(cc) | | 12/25/33 | | | | | | | 310 | | | | 314,538 | |
| | | | | | | | | | | | | | | | |
| | | | | |
TOTAL RESIDENTIAL MORTGAGE-BACKED SECURITIES
(cost $24,436,512) | | | | | | | | | | | | | | | 24,932,083 | |
| | | | | | | | | | | | | | | | |
| | | | | |
SOVEREIGN BONDS 3.8% | | | | | | | | | | | | | | | | |
1MDB Global Investments Ltd. (Malaysia), | | | | | | | | | | | | | | | | |
Sr. Unsec’d. Notes | | 4.400 | | 03/09/23 | | | | | | | 1,000 | | | | 1,004,326 | |
Argentine Republic Government International Bond (Argentina), | | | | | | | | | | | | | | | | |
Sr. Unsec’d. Notes | | 0.500(cc) | | 07/09/30 | | | | | | | 494 | | | | 169,431 | |
Bermuda Government International Bond (Bermuda), | | | | | | | | | | | | | | | | |
Sr. Unsec’d. Notes, 144A | | 2.375 | | 08/20/30 | | | | | | | 685 | | | | 680,139 | |
Brazil Loan Trust 1 (Brazil), | | | | | | | | | | | | | | | | |
Gov’t. Gtd. Notes | | 5.477 | | 07/24/23 | | | | | | | 307 | | | | 316,137 | |
Brazil Minas SPE via State of Minas Gerais (Brazil), | | | | | | | | | | | | | | | | |
Gov’t. Gtd. Notes | | 5.333 | | 02/15/28 | | | | | | | 2,303 | | | | 2,442,938 | |
Dominican Republic International Bond (Dominican Republic), | | | | | | | | | | | | | | | | |
Sr. Unsec’d. Notes, 144A | | 5.950 | | 01/25/27 | | | | | | | 1,570 | | | | 1,752,251 | |
Hellenic Republic Government International Bond (Greece), | | | | | | | | | | | | | | | | |
Sr. Unsec’d. Notes | | 5.200 | | 07/17/34 | | | EUR | | | | 5,485 | | | | 8,975,230 | |
Sr. Unsec’d. Notes | | 6.140 | | 04/14/28 | | | EUR | | | | 2,000 | | | | 3,023,839 | |
Hungary Government International Bond (Hungary), | | | | | | | | | | | | | | | | |
Sr. Unsec’d. Notes, 144A | | 3.125 | | 09/21/51 | | | | | | | 220 | | | | 215,107 | |
Indonesia Government International Bond (Indonesia), | | | | | | | | | | | | | | | | |
Sr. Unsec’d. Notes | | 1.100 | | 03/12/33 | | | EUR | | | | 410 | | | | 454,999 | |
|
See Notes to Financial Statements. 38 |
| | | | | | | | | | | | | | | | |
| | | | | |
| Description | | Interest Rate | | Maturity Date | | | | | Principal Amount (000)# | | | Value | |
| | | | | |
SOVEREIGN BONDS (Continued) | | | | | | | | | | | | | | | | |
Indonesia Government International Bond (Indonesia), (cont’d.) | | | | | | | | | | | | | | | | |
Sr. Unsec’d. Notes | | 1.450% | | 09/18/26 | | | EUR | | | | 805 | | | $ | 958,497 | |
Sr. Unsec’d. Notes | | 3.375 | | 07/30/25 | | | EUR | | | | 2,655 | | | | 3,371,818 | |
Ivory Coast Government International Bond (Ivory Coast), | | | | | | | | | | | | | | | | |
Sr. Unsec’d. Notes | | 5.125 | | 06/15/25 | | | EUR | | | | 500 | | | | 632,626 | |
Sr. Unsec’d. Notes, 144A | | 5.125 | | 06/15/25 | | | EUR | | | | 1,650 | | | | 2,087,666 | |
Romanian Government International Bond (Romania), | | | | | | | | | | | | | | | | |
Sr. Unsec’d. Notes, EMTN | | 4.125 | | 03/11/39 | | | EUR | | | | 1,759 | | | | 2,226,551 | |
Serbia International Bond (Serbia), | | | | | | | | | | | | | | | | |
Sr. Unsec’d. Notes, 144A | | 1.500 | | 06/26/29 | | | EUR | | | | 1,660 | | | | 1,881,332 | |
Ukraine Government International Bond (Ukraine), | | | | | | | | | | | | | | | | |
Sr. Unsec’d. Notes | | 8.994 | | 02/01/24 | | | | | | | 350 | | | | 382,891 | |
Sr. Unsec’d. Notes, 144A | | 4.375 | | 01/27/30 | | | EUR | | | | 1,465 | | | | 1,577,082 | |
Sr. Unsec’d. Notes, 144A | | 7.750 | | 09/01/22 | | | | | | | 1,960 | | | | 2,031,144 | |
Sr. Unsec’d. Notes, 144A | | 8.994 | | 02/01/24 | | | | | | | 800 | | | | 875,179 | |
Sr. Unsec’d. Notes, 144A | | 9.750 | | 11/01/28 | | | | | | | 1,800 | | | | 2,089,611 | |
| | | | | | | | | | | | | | | | |
| | | | | |
TOTAL SOVEREIGN BONDS
(cost $32,572,161) | | | | | | | | | | | | | | | 37,148,794 | |
| | | | | | | | | | | | | | | | |
| | | | | |
U.S. TREASURY OBLIGATIONS 9.5% | | | | | | | | | | | | | | | | |
U.S. Treasury Bonds(h)(k) | | 1.375 | | 11/15/40 | | | | | | | 15,930 | | | | 14,391,759 | |
U.S. Treasury Bonds | | 2.250 | | 05/15/41 | | | | | | | 3,925 | | | | 4,101,012 | |
U.S. Treasury Bonds | | 2.375 | | 05/15/51 | | | | | | | 2,155 | | | | 2,369,490 | |
U.S. Treasury Bonds(h)(k) | | 2.500 | | 02/15/45 | | | | | | | 3,505 | | | | 3,837,975 | |
U.S. Treasury Bonds(k) | | 3.625 | | 08/15/43 | | | | | | | 1,920 | | | | 2,479,200 | |
U.S. Treasury Notes | | 0.375 | | 01/31/26 | | | | | | | 31,300 | | | | 30,358,555 | |
U.S. Treasury Notes | | 1.375 | | 01/31/25 | | | | | | | 32,840 | | | | 33,412,135 | |
U.S. Treasury Notes(k) | | 2.250 | | 11/15/24 | | | | | | | 395 | | | | 412,559 | |
U.S. Treasury Notes | | 2.250 | | 11/15/27 | | | | | | | 150 | | | | 157,852 | |
U.S. Treasury Strips Coupon(k) | | 2.415(s) | | 11/15/40 | | | | | | | 1,200 | | | | 802,781 | |
U.S. Treasury Strips Coupon(k) | | 3.019(s) | | 11/15/35 | | | | | | | 870 | | | | 670,987 | |
| | | | | | | | | | | | | | | | |
| | | | | |
TOTAL U.S. TREASURY OBLIGATIONS
(cost $92,630,876) | | | | | | | | | | | | | | | 92,994,305 | |
| | | | | | | | | | | | | | | | |
| | | | | |
| | | | | | | | | | Shares | | | | |
| | | | | |
COMMON STOCKS 1.8% | | | | | | | | | | | | | | | | |
| | | | | |
Gas Utilities 0.5% | | | | | | | | | | | | | | | | |
| | | | | |
Ferrellgas Partners LP (Class B Stock) | | | | | | | | | | | 17,034 | | | | 4,386,255 | |
| | |
| See Notes to Financial Statements. |
| PGIM Absolute Return Bond Fund | | 39 |
Schedule of Investments (continued)
as of October 31, 2021
| | | | | | | | | | |
| | | |
| Description | | | | Shares | | | Value | |
| | | |
COMMON STOCKS (Continued) | | | | | | | | | | |
| | | |
Oil, Gas & Consumable Fuels 1.3% | | | | | | | | | | |
| | | |
Chesapeake Energy Corp. | | | | | 202,044 | | | $ | 12,878,285 | |
Chesapeake Energy Corp. Backstop Commitment | | | | | 1,449 | | | | 92,359 | |
| | | | | | | | | | |
| | | |
| | | | | | | | | 12,970,644 | |
| | | | | | | | | | |
| | | |
TOTAL COMMON STOCKS
(cost $6,277,660) | | | | | | | | | 17,356,899 | |
| | | | | | | | | | |
| | | |
| | | | | Units | | | | |
| | | |
WARRANTS* 0.0% | | | | | | | | | | |
| | | |
Chemicals | | | | | | | | | | |
| | | |
TPC Group, Inc., expiring 08/01/24^
(cost $0) | | | | | 1,190,967 | | | | 5,598 | |
| | | | | | | | | | |
| | | |
TOTAL LONG-TERM INVESTMENTS
(cost $803,412,262) | | | | | | | | | 836,564,317 | |
| | | | | | | | | | |
| | | |
| | | | | Shares | | | | |
| | | |
SHORT-TERM INVESTMENTS 14.7% | | | | | | | | | | |
| | | |
AFFILIATED MUTUAL FUNDS 14.5% | | | | | | | | | | |
PGIM Core Ultra Short Bond Fund(wa) | | | | | 127,420,190 | | | | 127,420,190 | |
PGIM Institutional Money Market Fund | | | | | | | | | | |
(cost $14,739,985; includes $14,739,294 of cash collateral for securities on loan)(b)(wa) | | | | | 14,759,135 | | | | 14,750,279 | |
| | | | | | | | | | |
| | | |
TOTAL AFFILIATED MUTUAL FUNDS
(cost $142,160,175) | | | | | | | | | 142,170,469 | |
| | | | | | | | | | |
| | | |
OPTIONS PURCHASED*~ 0.2%
(cost $9,001,625) | | | | | | | | | 1,693,327 | |
| | | | | | | | | | |
| | | |
TOTAL SHORT-TERM INVESTMENTS
(cost $151,161,800) | | | | | | | | | 143,863,796 | |
| | | | | | | | | | |
| | | |
TOTAL INVESTMENTS, BEFORE OPTIONS WRITTEN 100.1%
(cost $954,574,062) | | | | | | | | | 980,428,113 | |
| | | | | | | | | | |
|
See Notes to Financial Statements. 40 |
| | | | |
| |
| Description | | Value | |
| |
OPTIONS WRITTEN*~ (0.2)% | | | | |
(premiums received $10,279,599) | | $ | (1,766,841 | ) |
| | | | |
| |
TOTAL INVESTMENTS, NET OF OPTIONS WRITTEN 99.9%
(cost $944,294,463) | | | 978,661,272 | |
| |
Other assets in excess of liabilities(z) 0.1% | | | 794,738 | |
| | | | |
| |
NET ASSETS 100.0% | | $ | 979,456,010 | |
| | | | |
Below is a list of the abbreviation(s) used in the annual report:
AUD—Australian Dollar
BRL—Brazilian Real
CAD—Canadian Dollar
CLP—Chilean Peso
CNH—Chinese Renminbi
COP—Colombian Peso
CZK—Czech Koruna
EUR—Euro
GBP—British Pound
HUF—Hungarian Forint
IDR—Indonesian Rupiah
ILS—Israeli Shekel
INR—Indian Rupee
JPY—Japanese Yen
KRW—South Korean Won
MXN—Mexican Peso
NZD—New Zealand Dollar
PEN—Peruvian Nuevo Sol
PHP—Philippine Peso
PLN—Polish Zloty
RUB—Russian Ruble
SGD—Singapore Dollar
THB—Thai Baht
TRY—Turkish Lira
TWD—New Taiwanese Dollar
USD—US Dollar
ZAR—South African Rand
144A—Security was purchased pursuant to Rule 144A under the Securities Act of 1933 and, pursuant to the requirements of Rule 144A, may not be resold except to qualified institutional buyers.
A—Annual payment frequency for swaps
ABS—Asset-Backed Security
BABs—Build America Bonds
BBR—New Zealand Bank Bill Rate
BROIS—Brazil Overnight Index Swap
BUBOR—Budapest Interbank Offered Rate
CDX—Credit Derivative Index
CLO—Collateralized Loan Obligation
CLOIS—Sinacofi Chile Interbank Rate Average
CMBX—Commercial Mortgage-Backed Index
COOIS—Colombia Overnight Interbank Reference Rate
| | |
| See Notes to Financial Statements. |
| PGIM Absolute Return Bond Fund | | 41 |
Schedule of Investments (continued)
as of October 31, 2021
CPI—Consumer Price Index
DIP—Debtor-In-Possession
EMTN—Euro Medium Term Note
EURIBOR—Euro Interbank Offered Rate
FHLMC—Federal Home Loan Mortgage Corporation
GMTN—Global Medium Term Note
IO—Interest Only (Principal amount represents notional)
JIBAR—Johannesburg Interbank Agreed Rate
LIBOR—London Interbank Offered Rate
LP—Limited Partnership
M—Monthly payment frequency for swaps
MASTR—Morgan Stanley Structured Asset Security
MTN—Medium Term Note
NSA—Non-Seasonally Adjusted
OTC—Over-the-counter
PIK—Payment-in-Kind
Q—Quarterly payment frequency for swaps
REITs—Real Estate Investment Trust
REMICS—Real Estate Mortgage Investment Conduit Security
S—Semiannual payment frequency for swaps
SOFR—Secured Overnight Financing Rate
SONIA—Sterling Overnight Index Average
Strips—Separate Trading of Registered Interest and Principal of Securities
T—Swap payment upon termination
WIBOR—Warsaw Interbank Offered Rate
| * | Non-income producing security. |
| # | Principal or notional amount is shown in U.S. dollars unless otherwise stated. |
| ~ | See tables subsequent to the Schedule of Investments for options detail. |
| ^ | Indicates a Level 3 instrument. The aggregate value of Level 3 instruments is $7,052,669 and 0.7% of net assets. |
| (a) | All or a portion of security is on loan. The aggregate market value of such securities, including those sold and pending settlement, is $14,303,258; cash collateral of $14,739,294 (included in liabilities) was received with which the Fund purchased highly liquid short-term investments. In the event of significant appreciation in value of securities on loan on the last business day of the reporting period, the Fund may reflect a collateral value that is less than the market value of the loaned securities and such shortfall is remedied the following business day. |
| (b) | Represents security, or portion thereof, purchased with cash collateral received for securities on loan and includes dividend reinvestment. |
| (c) | Variable rate instrument. The interest rate shown reflects the rate in effect at October 31, 2021. |
| (cc) | Variable rate instrument. The rate shown is based on the latest available information as of October 31, 2021. Certain variable rate securities are not based on a published reference rate and spread but are determined by the issuer or agent and are based on current market conditions. These securities do not indicate a reference rate and spread in their description. |
| (d) | Represents issuer in default on interest payments and/or principal repayment. Non-income producing security. Such securities may be post-maturity. |
| (ff) | Variable rate security. Security may be issued at a fixed coupon rate, which converts to a variable rate at a specified date. Rate shown is the rate in effect as of period end. |
| (h) | Represents security, or a portion thereof, segregated as collateral for OTC derivatives. |
| (k) | Represents security, or a portion thereof, segregated as collateral for centrally cleared/exchange-traded derivatives. |
| (oo) | Perpetual security. Maturity date represents next call date. |
| (s) | Represents zero coupon bond or principal only security. Rate represents yield to maturity at purchase date. |
| (wa) | PGIM Investments LLC, the manager of the Fund, also serves as manager of the PGIM Core Ultra Short Bond Fund and PGIM Institutional Money Market Fund, if applicable. |
|
See Notes to Financial Statements. 42 |
| (z) | Includes net unrealized appreciation/(depreciation) and/or market value of the below holdings which are excluded from the Schedule of Investments: |
Unfunded loan commitment outstanding at October 31, 2021:
| | | | | | | | | | | | | | | | | | | | |
Borrower | | Principal Amount (000)# | | Current Value | | Unrealized Appreciation | | Unrealized Depreciation |
| | | | |
Intelsat Jackson Holdings SA, DIP Term Loan, 3 Month LIBOR + 3.600%, 3.600%(c), Maturity Date 07/13/22 (cost $182,194) | | | | 184 | | | | $ | 185,456 | | | | $ | 3,262 | | | | $ | — | |
| | | | | | | | | | | | | | | | | | | | |
Options Purchased:
OTC Traded
| | | | | | | | | | | | | | | | | | | | | | | | | | | | |
Description | | Call/
Put | | Counterparty | | Expiration
Date | | | Strike | | | Contracts | | | Notional
Amount
(000)# | | | Value | |
| | | | | | | | |
Currency Option EUR vs USD | | Call | | Deutsche Bank AG | | | 11/18/21 | | | | 1.21 | | | | — | | | | EUR | | | | 6,563 | | | $ | 61 | |
Currency Option EUR vs USD | | Call | | Bank of America, N.A. | | | 11/18/21 | | | | 1.31 | | | | — | | | | EUR | | | | 26,250 | | | | — | |
Currency Option USD vs JPY | | Call | | Barclays Bank PLC | | | 10/27/23 | | | | 115.00 | | | | — | | | | | | | | 39,000 | | | | 1,016,122 | |
Currency Option USD vs MXN | | Call | | Goldman Sachs International | | | 02/23/22 | | | | 26.00 | | | | — | | | | | | | | 34,500 | | | | 28,568 | |
Currency Option USD vs MXN | | Call | | Barclays Bank PLC | | | 02/23/22 | | | | 31.50 | | | | — | | | | | | | | 69,000 | | | | 8,020 | |
Currency Option USD vs MXN | | Call | | Goldman Sachs International | | | 02/23/22 | | | | 36.00 | | | | — | | | | | | | | 28,000 | | | | 1,110 | |
Currency Option AUD vs JPY | | Put | | BNP Paribas S.A. | | | 01/26/22 | | | | 55.00 | | | | — | | | | AUD | | | | 144,000 | | | | 671 | |
Currency Option AUD vs JPY | | Put | | Deutsche Bank AG | | | 01/26/22 | | | | 63.00 | | | | — | | | | AUD | | | | 72,000 | | | | 2,174 | |
Currency Option USD vs TWD | | Put | | Deutsche Bank AG | | | 12/21/21 | | | | 24.30 | | | | — | | | | | | | | 60,000 | | | | 402 | |
Currency Option USD vs TWD | | Put | | JPMorgan Chase Bank, N.A. | | | 12/21/21 | | | | 25.80 | | | | — | | | | | | | | 20,000 | | | | 1,120 | |
| | | | | | | | | | | | | | | | | | | | | | | | | | | | |
| | | | | | |
Total OTC Traded (cost $ 8,438,466) | | | | | | | | | | | | | | | | | | | | | | $ | 1,058,248 | |
| | | | | | | | | | | | | | | | | | | | | | | | | | | | |
OTC Swaptions
| | | | | | | | | | | | | | | | | | | | | | | | | | |
Description | | Call/
Put | | Counterparty | | Expiration
Date | | Strike | | | Receive | | | Pay | | | Notional
Amount
(000)# | | | Value | |
| | | | | | | | |
CDX.NA.IG.37.V1, 12/20/26 | | Call | | Barclays Bank PLC | | 12/15/21 | | | 0.35% | | | | 1.00%(Q) | | | | CDX.NA.IG.37. V1(Q) | | | | 52,430 | | | $ | 18 | |
CDX.NA.IG.37.V1, 12/20/26 | | Call | | Goldman Sachs International | | 12/15/21 | | | 0.35% | | | | 1.00%(Q) | | | | CDX.NA.IG.37. V1(Q) | | | | 52,430 | | | | 18 | |
| | |
| See Notes to Financial Statements. |
| PGIM Absolute Return Bond Fund | | 43 |
Schedule of Investments (continued)
as of October 31, 2021
Options Purchased (continued):
OTC Swaptions
| | | | | | | | | | | | | | | | | | | | | | | | | | |
Description | | Call/
Put | | | Counterparty | | Expiration
Date | | | Strike | | | Receive | | Pay | | Notional
Amount
(000)# | | | Value | |
| | | | | | | | |
CDX.NA.IG.37.V1, 12/20/26 | | | Call | | | BNP Paribas S.A. | | | 01/19/22 | | | | 0.35% | | | 1.00%(Q) | | CDX.NA.IG.37. V1(Q) | | | 44,120 | | | $ | 52 | |
CDX.NA.IG.37.V1, 12/20/26 | | | Call | | | Morgan Stanley &
Co. International PLC | | | 01/19/22 | | | | 0.35% | | | 1.00%(Q) | | CDX.NA.IG.37. V1(Q) | | | 51,150 | | | | 60 | |
CDX.NA.IG.37.V1, 12/20/26 | | | Call | | | Deutsche Bank AG | | | 02/16/22 | | | | 0.35% | | | 1.00%(Q) | | CDX.NA.IG.37. V1(Q) | | | 51,150 | | | | 118 | |
CDX.NA.IG.37.V1, 12/20/26 | | | Call | | | Morgan Stanley &
Co. International PLC | | | 02/16/22 | | | | 0.35% | | | 1.00%(Q) | | CDX.NA.IG.37. V1(Q) | | | 52,430 | | | | 121 | |
CDX.NA.IG.37.V1, 12/20/26 | | | Put | | | Barclays Bank PLC | | | 12/15/21 | | | | 0.55% | | | CDX.NA.IG.37. V1(Q) | | 1.00%(Q) | | | 52,430 | | | | 70,826 | |
CDX.NA.IG.37.V1, 12/20/26 | | | Put | | | Goldman Sachs
International | | | 12/15/21 | | | | 0.55% | | | CDX.NA.IG.37. V1(Q) | | 1.00%(Q) | | | 52,430 | | | | 70,826 | |
CDX.NA.IG.37.V1, 12/20/26 | | | Put | | | BNP Paribas S.A. | | | 01/19/22 | | | | 0.55% | | | CDX.NA.IG.37. V1(Q) | | 1.00%(Q) | | | 44,120 | | | | 95,523 | |
CDX.NA.IG.37.V1, 12/20/26 | | | Put | | | Morgan Stanley &
Co. International PLC | | | 01/19/22 | | | | 0.55% | | | CDX.NA.IG.37. V1(Q) | | 1.00%(Q) | | | 51,150 | | | | 110,743 | |
CDX.NA.IG.37.V1, 12/20/26 | | | Put | | | Deutsche Bank AG | | | 02/16/22 | | | | 0.55% | | | CDX.NA.IG.37. V1(Q) | | 1.00%(Q) | | | 51,150 | | | | 141,615 | |
CDX.NA.IG.37.V1, 12/20/26 | | | Put | | | Morgan Stanley &
Co. International PLC | | | 02/16/22 | | | | 0.55% | | | CDX.NA.IG.37. V1(Q) | | 1.00%(Q) | | | 52,430 | | | | 145,159 | |
| | | | | | | | | | | | | | | | | | | | | | | | | | |
| | | | | | |
Total OTC Swaptions (cost $563,159) | | | | | | | | | | | | | | | | | | $ | 635,079 | |
| | | | | | | | | | | | | | | | | | | | | | | | | | |
| | | | | | |
Total Options Purchased (cost $9,001,625) | | | | | | | | | | | | | | | | | | $ | 1,693,327 | |
| | | | | | | | | | | | | | | | | | | | | | | | | | |
Options Written:
OTC Traded
| | | | | | | | | | | | | | | | | | | | | | | | | | |
Description | | Call/
Put | | | Counterparty | | Expiration
Date | | Strike | | | Contracts | | Notional
Amount
(000)# | | | Value | |
| | | | | | | | |
Currency Option EUR vs USD | | | Call | | | Bank of America, N.A. | | 11/18/21 | | | 1.21 | | | — | | | EUR | | | | 6,563 | | | $ | (61 | ) |
Currency Option EUR vs USD | | | Call | | | Deutsche Bank AG | | 11/18/21 | | | 1.31 | | | — | | | EUR | | | | 26,250 | | | | — | |
Currency Option USD vs JPY | | | Call | | | Bank of America, N.A. | | 10/27/23 | | | 115.00 | | | — | | | | | | | 39,000 | | | | (1,016,122 | ) |
Currency Option USD vs MXN | | | Call | | | Barclays Bank PLC | | 02/23/22 | | | 26.00 | | | — | | | | | | | 34,500 | | | | (28,568 | ) |
|
See Notes to Financial Statements. 44 |
Options Written (continued):
OTC Traded
| | | | | | | | | | | | | | | | | | | | | | | | |
Description | | Call/ Put | | Counterparty | | Expiration
Date | | Strike | | | Contracts | | Notional
Amount
(000)# | | | Value | |
Currency Option USD vs MXN | | Call | | Goldman Sachs International | | 02/23/22 | | | 31.50 | | | — | | | | | | | 69,000 | | | $ | (8,020 | ) |
Currency Option USD vs MXN | | Call | | Citibank, N.A. | | 02/23/22 | | | 36.00 | | | — | | | | | | | 28,000 | | | | (1,110 | ) |
Currency Option AUD vs JPY | | Put | | Deutsche Bank AG | | 01/26/22 | | | 55.00 | | | — | | | AUD | | | | 144,000 | | | | (671 | ) |
Currency Option AUD vs JPY | | Put | | BNP Paribas S.A. | | 01/26/22 | | | 63.00 | | | — | | | AUD | | | | 72,000 | | | | (2,174 | ) |
Currency Option USD vs TWD | | Put | | JPMorgan Chase Bank, N.A. | | 12/21/21 | | | 24.30 | | | — | | | | | | | 60,000 | | | | (402 | ) |
Currency Option USD vs TWD | | Put | | Deutsche Bank AG | | 12/21/21 | | | 25.80 | | | — | | | | | | | 20,000 | | | | (1,120 | ) |
| | | | | | | | | | | | | | | | | | | | | | | | |
| | | | | | |
Total OTC Traded (premiums received $9,491,139) | | | | | | | | | | | | | | | | | | $ | (1,058,248 | ) |
| | | | | | | | | | | | | | | | | | | | | | | | |
OTC Swaptions
| | | | | | | | | | | | | | | | | | | | | | |
Description | | Call/
Put | | Counterparty | | Expiration
Date | | Strike | | Receive | | Pay | | | Notional
Amount
(000)# | | | Value | |
| | | | | | | | |
CDX.NA.IG.37.V1, 12/20/26 | | Call | | Barclays Bank PLC | | 12/15/21 | | 0.50% | | CDX.NA.IG.37.V1(Q) | | | 1.00%(Q) | | | | 52,430 | | | $ | (24,085 | ) |
CDX.NA.IG.37.V1, 12/20/26 | | Call | | Goldman Sachs International | | 12/15/21 | | 0.50% | | CDX.NA.IG.37.V1(Q) | | | 1.00%(Q) | | | | 52,430 | | | | (24,085 | ) |
CDX.NA.IG.37.V1, 12/20/26 | | Call | | BNP Paribas S.A. | | 01/19/22 | | 0.50% | | CDX.NA.IG.37.V1(Q) | | | 1.00%(Q) | | | | 44,120 | | | | (33,605 | ) |
CDX.NA.IG.37.V1, 12/20/26 | | Call | | Morgan Stanley & Co. International PLC | | 01/19/22 | | 0.50% | | CDX.NA.IG.37.V1(Q) | | | 1.00%(Q) | | | | 51,150 | | | | (38,960 | ) |
CDX.NA.IG.37.V1, 12/20/26 | | Call | | Deutsche Bank AG | | 02/16/22 | | 0.50% | | CDX.NA.IG.37.V1(Q) | | | 1.00%(Q) | | | | 51,150 | | | | (49,159 | ) |
CDX.NA.IG.37.V1, 12/20/26 | | Call | | Morgan Stanley & Co. International PLC | | 02/16/22 | | 0.50% | | CDX.NA.IG.37.V1(Q) | | | 1.00%(Q) | | | | 52,430 | | | | (50,389 | ) |
CDX.NA.HY.37.V1, 12/20/26 | | Put | | Barclays Bank PLC | | 11/17/21 | | $107.00 | | 5.00%(Q) | | | CDX.NA.HY.37.V1(Q) | | | | 10,250 | | | | (14,446 | ) |
CDX.NA.IG.37.V1, 12/20/26 | | Put | | Barclays Bank PLC | | 12/15/21 | | 0.65% | | 1.00%(Q) | | | CDX.NA.IG.37.V1(Q) | | | | 52,430 | | | | (32,550 | ) |
CDX.NA.IG.37.V1, 12/20/26 | | Put | | Goldman Sachs International | | 12/15/21 | | 0.65% | | 1.00%(Q) | | | CDX.NA.IG.37.V1(Q) | | | | 52,430 | | | | (32,550 | ) |
CDX.NA.IG.37.V1, 12/20/26 | | Put | | BNP Paribas S.A. | | 01/19/22 | | 0.70% | | 1.00%(Q) | | | CDX.NA.IG.37.V1(Q) | | | | 44,120 | | | | (43,908 | ) |
| | |
| See Notes to Financial Statements. |
| PGIM Absolute Return Bond Fund | | 45 |
Schedule of Investments (continued)
as of October 31, 2021
Options Written (continued):
OTC Swaptions
| | | | | | | | | | | | | | | | | | | | | | | | |
Description | | Call/
Put | | Counterparty | | Expiration
Date | | Strike | | Receive | | | Pay | | | Notional
Amount
(000)# | | | Value | |
| | | | | | | | |
CDX.NA.IG.37.V1, 12/20/26 | | Put | | Morgan Stanley & Co. International PLC | | 01/19/22 | | 0.70% | | | 1.00%(Q) | | | | CDX.NA.IG.37. V1(Q) | | | | 51,150 | | | $ | (50,904 | ) |
CDX.NA.IG.37.V1, 12/20/26 | | Put | | Deutsche Bank AG | | 02/16/22 | | 0.70% | | | 1.00%(Q) | | | | CDX.NA.IG.37. V1(Q) | | | | 51,150 | | | | (73,606 | ) |
CDX.NA.IG.37.V1, 12/20/26 | | Put | | Morgan Stanley & Co. International PLC | | 02/16/22 | | 0.70% | | | 1.00%(Q) | | | | CDX.NA.IG.37. V1(Q) | | | | 52,430 | | | | (75,448 | ) |
GS_21-PJA†† ^ | | Put | | Goldman Sachs International | | 06/17/24 | | 0.25% | | | 0.25%(M) | | | | GS_21-PJA(M) | | | | 16,440 | | | | (2,317 | ) |
iTraxx.XO.35. V1, 06/20/26 | | Put | | Barclays Bank PLC | | 06/15/22 | | 7.00% | | | 5.00%(Q) | | | | iTraxx.XO.35. V1(Q) | | | EUR | 10,130 | | | | (59,808 | ) |
iTraxx.XO.35. V1, 06/20/26 | | Put | | Barclays Bank PLC | | 06/15/22 | | 9.00% | | | 5.00%(Q) | | | | iTraxx.XO.35. V1(Q) | | | EUR | 9,710 | | | | (36,584 | ) |
iTraxx.XO.36. V1, 12/20/26 | | Put | | Morgan Stanley & Co. International PLC | | 01/19/22 | | 5.00% | | | 5.00%(Q) | | | | iTraxx.XO.36. V1(Q) | | | EUR | 4,200 | | | | (8,123 | ) |
iTraxx.XO.36. V1, 12/20/26^ | | Put | | Barclays Bank PLC | | 09/21/22 | | 9.00% | | | 5.00%(Q) | | | | iTraxx.XO.36. V1(Q) | | | EUR | 8,170 | | | | (58,066 | ) |
| | | | | | | | | | | | | | | | | | | | | | | | |
| | | | | |
Total OTC Swaptions (premiums received $788,460) | | | | | | | | | | | | | | | | $ | (708,593 | ) |
| | | | | | | | | | | | | | | | | | | | | | | | |
| | | | | |
Total Options Written (premiums received $10,279,599) | | | | | | | | | | | | | | | | $ | (1,766,841 | ) |
| | | | | | | | | | | | | | | | | | | | | | | | |
†† The value of the contract, GS_21-PJA, is derived from a pool of senior prime jumbo mortgages.
Futures contracts outstanding at October 31, 2021:
| | | | | | | | | | | | | | | | | | | | |
Number
of
Contracts | | | Type | | Expiration
Date | | | Current
Notional
Amount | | | Value /
Unrealized
Appreciation
(Depreciation) | |
| | Long Positions: | | | | | | | | | | | | | | | | |
| | 80 | | | 5 Year U.S. Treasury Notes | | | Dec. 2021 | | | $ | 9,740,000 | | | | | | | $ | (135,944 | ) |
| | 117 | | | 10 Year U.S. Ultra Treasury Notes | | | Dec. 2021 | | | | 16,968,656 | | | | | | | | (203,534 | ) |
| | | | | | | | | | | | | | | | | | | | |
| | | | | |
| | | | | | | | | | | | | | | | | | | (339,478 | ) |
| | | | | | | | | | | | | | | | | | | | |
| | Short Positions: | | | | | | | | | | | | | | | | |
| | 10 | | | 30 Day Federal Funds | | | Apr. 2022 | | | | 4,161,583 | | | | | | | | 7,693 | |
| | 58 | | | 30 Day Federal Funds | | | May 2022 | | | | 24,127,513 | | | | | | | | 55,492 | |
| | 48 | | | 30 Day Federal Funds | | | Jun. 2022 | | | | 19,957,596 | | | | | | | | 54,925 | |
| | 14 | | | 30 Day Federal Funds | | | Jul. 2022 | | | | 5,817,757 | | | | | | | | 19,520 | |
| | 3,270 | | | 2 Year U.S. Treasury Notes | | | Dec. 2021 | | | | 716,947,500 | | | | | | | | 3,046,789 | |
|
See Notes to Financial Statements. 46 |
Futures contracts outstanding at October 31, 2021 (continued):
| | | | | | | | | | | | | | | | | | | | |
Number
of
Contracts | | | Type | | Expiration
Date | | | Current
Notional
Amount | | | Value /
Unrealized
Appreciation
(Depreciation) | |
| | | | |
| | Short Positions (cont’d): | | | | | | | | | | | | | | | | |
| | 217 | | | 5 Year Euro-Bobl | | | Dec. 2021 | | | $ | 33,553,964 | | | | | | | $ | 483,693 | |
| | 177 | | | 10 Year Euro-Bund | | | Dec. 2021 | | | | 34,399,369 | | | | | | | | 883,568 | |
| | 810 | | | 10 Year U.S. Treasury Notes | | | Dec. 2021 | | | | 105,869,535 | | | | | | | | 1,608,901 | |
| | 247 | | | 20 Year U.S. Treasury Bonds | | | Dec. 2021 | | | | 39,728,406 | | | | | | | | 562,043 | |
| | 24 | | | 30 Year U.S. Ultra Treasury Bonds | | | Dec. 2021 | | | | 4,713,750 | | | | | | | | 39,153 | |
| | 137 | | | Euro Schatz Index | | | Dec. 2021 | | | | 17,731,329 | | | | | | | | 50,036 | |
| | | | | | | | | | | | | | | | | | | | |
| | | | | | | | | | | | | | | | | | | 6,811,813 | |
| | | | | | | | | | | | | | | | | | | | |
| | | | | | | | | | | | | | | | | | $ | 6,472,335 | |
| | | | | | | | | | | | | | | | | | | | |
Forward foreign currency exchange contracts outstanding at October 31, 2021:
| | | | | | | | | | | | | | | | | | | | | | | | | | | | | | |
Purchase Contracts | | Counterparty | | Notional
Amount
(000) | | | Value at
Settlement
Date | | | Current
Value | | | Unrealized
Appreciation | | | Unrealized
Depreciation | |
| | | | | |
OTC Forward Foreign Currency Exchange Contracts: | | | | | | | | | | | | | | | | | | | | | |
Australian Dollar, | | | | | | | | | | | | | | | | | | | | | | | | | | | | | | |
Expiring 01/19/22 | | HSBC Bank PLC | | | AUD | | | | 822 | | | $ | 605,115 | | | $ | 618,839 | | | $ | 13,724 | | | | | | | $ | — | |
Expiring 01/28/22 | | Citibank, N.A. | | | AUD | | | | 1,415 | | | | 929,273 | | | | 1,064,689 | | | | 135,416 | | | | | | | | — | |
Expiring 01/28/22 | | Morgan Stanley & Co. International PLC | | | AUD | | | | 5,569 | | | | 4,204,659 | | | | 4,190,294 | | | | — | | | | | | | | (14,365 | ) |
Expiring 01/28/22 | | Morgan Stanley & Co. International PLC | | | AUD | | | | 108 | | | | 79,085 | | | | 81,590 | | | | 2,505 | | | | | | | | — | |
Expiring 10/31/23 | | JPMorgan Chase Bank, N.A. | | | AUD | | | | 3,180 | | | | 2,208,097 | | | | 2,364,845 | | | | 156,748 | | | | | | | | — | |
Brazilian Real, | | | | | | | | | | | | | | | | | | | | | | | | | | | | | | |
Expiring 11/03/21 | | Credit Suisse International | | | BRL | | | | 28,416 | | | | 5,336,767 | | | | 5,029,746 | | | | — | | | | | | | | (307,021 | ) |
Expiring 11/03/21 | | Deutsche Bank AG | | | BRL | | | | 2,198 | | | | 395,000 | | | | 388,984 | | | | — | | | | | | | | (6,016 | ) |
Expiring 11/03/21 | | Goldman Sachs International | | | BRL | | | | 2,709 | | | | 490,000 | | | | 479,544 | | | | — | | | | | | | | (10,456 | ) |
Expiring 11/03/21 | | JPMorgan Chase Bank, N.A. | | | BRL | | | | 2,179 | | | | 401,000 | | | | 385,703 | | | | — | | | | | | | | (15,297 | ) |
Expiring 11/03/21 | | JPMorgan Chase Bank, N.A. | | | BRL | | | | 1,387 | | | | 261,000 | | | | 245,461 | | | | — | | | | | | | | (15,539 | ) |
Expiring 12/02/21 | | Credit Suisse International | | | BRL | | | | 36,888 | | | | 6,482,222 | | | | 6,492,376 | | | | 10,154 | | | | | | | | — | |
Expiring 01/28/22 | | Citibank, N.A. | | | BRL | | | | 2,966 | | | | 560,000 | | | | 514,910 | | | | — | | | | | | | | (45,090 | ) |
Expiring 01/28/22 | | Deutsche Bank AG | | | BRL | | | | 25,948 | | | | 4,434,000 | | | | 4,504,157 | | | | 70,157 | | | | | | | | — | |
Expiring 01/28/22 | | JPMorgan Chase Bank, N.A. | | | BRL | | | | 15,244 | | | | 2,727,534 | | | | 2,646,171 | | | | — | | | | | | | | (81,363 | ) |
| | |
| See Notes to Financial Statements. |
| PGIM Absolute Return Bond Fund | | 47 |
Schedule of Investments (continued)
as of October 31, 2021
Forward foreign currency exchange contracts outstanding at October 31, 2021 (continued):
| | | | | | | | | | | | | | | | | | | | | | | | |
Purchase Contracts | | Counterparty | | Notional
Amount
(000) | | | Value at
Settlement
Date | | | Current
Value | | | Unrealized
Appreciation | | | Unrealized
Depreciation | |
| | | | |
OTC Forward Foreign Currency Exchange Contracts (cont’d.): | | | | | | | | | | | | | | | | | |
Brazilian Real (cont’d.), | | | | | | | | | | | | | | | | | | | | | | |
Expiring 01/28/22 | | Morgan Stanley & Co. International PLC | | BRL | | | 19,492 | | | $ | 3,580,779 | | | $ | 3,383,524 | | | $ | — | | | $ | (197,255 | ) |
British Pound, | | | | | | | | | | | | | | | | | | | | | | | | |
Expiring 01/28/22 | | Morgan Stanley & Co. International PLC | | GBP | | | 625 | | | | 862,819 | | | | 855,540 | | | | — | | | | (7,279 | ) |
Canadian Dollar, | | | | | | | | | | | | | | | | | | | | | | | | |
Expiring 01/19/22 | | JPMorgan Chase Bank, N.A. | | CAD | | | 3,484 | | | | 2,794,258 | | | | 2,815,508 | | | | 21,250 | | | | — | |
Chilean Peso, | | | | | | | | | | | | | | | | | | | | | | | | |
Expiring 12/15/21 | | Barclays Bank PLC | | CLP | | | 532,326 | | | | 653,000 | | | | 650,901 | | | | — | | | | (2,099 | ) |
Expiring 12/15/21 | | BNP Paribas S.A. | | CLP | | | 425,309 | | | | 514,000 | | | | 520,047 | | | | 6,047 | | | | — | |
Expiring 12/15/21 | | BNP Paribas S.A. | | CLP | | | 318,630 | | | | 390,000 | | | | 389,605 | | | | — | | | | (395 | ) |
Expiring 12/15/21 | | BNP Paribas S.A. | | CLP | | | 221,341 | | | | 265,000 | | | | 270,645 | | | | 5,645 | | | | — | |
Expiring 12/15/21 | | BNP Paribas S.A. | | CLP | | | 207,823 | | | | 257,000 | | | | 254,115 | | | | — | | | | (2,885 | ) |
Expiring 12/15/21 | | Citibank, N.A. | | CLP | | | 377,340 | | | | 474,000 | | | | 461,392 | | | | — | | | | (12,608 | ) |
Expiring 12/15/21 | | Citibank, N.A. | | CLP | | | 285,344 | | | | 356,000 | | | | 348,904 | | | | — | | | | (7,096 | ) |
Expiring 12/15/21 | | JPMorgan Chase Bank, N.A. | | CLP | | | 209,022 | | | | 264,000 | | | | 255,581 | | | | — | | | | (8,419 | ) |
Expiring 12/15/21 | | UBS AG | | CLP | | | 1,798,903 | | | | 2,247,000 | | | | 2,199,607 | | | | — | | | | (47,393 | ) |
Chinese Renminbi, | | | | | | | | | | | | | | | | | | | | | | | | |
Expiring 11/18/21 | | Citibank, N.A. | | CNH | | | 2,200 | | | | 339,000 | | | | 342,789 | | | | 3,789 | | | | — | |
Expiring 11/18/21 | | JPMorgan Chase Bank, N.A. | | CNH | | | 51,258 | | | | 7,853,509 | | | | 7,987,948 | | | | 134,439 | | | | — | |
Expiring 11/18/21 | | JPMorgan Chase Bank, N.A. | | CNH | | | 5,895 | | | | 914,000 | | | | 918,646 | | | | 4,646 | | | | — | |
Expiring 11/18/21 | | JPMorgan Chase Bank, N.A. | | CNH | | | 5,812 | | | | 902,000 | | | | 905,753 | | | | 3,753 | | | | — | |
Expiring 11/18/21 | | JPMorgan Chase Bank, N.A. | | CNH | | | 4,241 | | | | 657,000 | | | | 660,892 | | | | 3,892 | | | | — | |
Expiring 11/18/21 | | Standard Chartered Bank | | CNH | | | 7,985 | | | | 1,247,000 | | | | 1,244,409 | | | | — | | | | (2,591 | ) |
Expiring 01/28/22 | | JPMorgan Chase Bank, N.A. | | CNH | | | 3,291 | | | | 497,363 | | | | 509,558 | | | | 12,195 | | | | — | |
Expiring 01/28/22 | | The Toronto-Dominion Bank | | CNH | | | 6,956 | | | | 1,066,738 | | | | 1,077,212 | | | | 10,474 | | | | — | |
Colombian Peso, | | | | | | | | | | | | | | | | | | | | | | | | |
Expiring 12/15/21 | | BNP Paribas S.A. | | COP | | | 2,343,356 | | | | 615,999 | | | | 620,287 | | | | 4,288 | | | | — | |
Expiring 12/15/21 | | Goldman Sachs International | | COP | | | 1,464,762 | | | | 386,000 | | | | 387,724 | | | | 1,724 | | | | — | |
Czech Koruna, | | | | | | | | | | | | | | | | | | | | | | | | |
Expiring 01/19/22 | | BNP Paribas S.A. | | CZK | | | 10,763 | | | | 484,999 | | | | 483,263 | | | | — | | | | (1,736 | ) |
|
See Notes to Financial Statements. 48 |
Forward foreign currency exchange contracts outstanding at October 31, 2021 (continued):
| | | | | | | | | | | | | | | | | | | | | | | | | | |
Purchase Contracts | | Counterparty | | Notional
Amount
(000) | | | Value at
Settlement
Date | | | Current
Value | | | Unrealized
Appreciation | | | Unrealized
Depreciation | |
| | | | |
OTC Forward Foreign Currency Exchange Contracts (cont’d.): | | | | | | | | | | | | | | | | | |
Euro, | | | | | | | | | | | | | | | | | | | | | | | | | | |
Expiring 11/22/21 | | Bank of America, N.A. | | | EUR | | | | 952 | | | $ | 1,122,313 | | | $ | 1,101,010 | | | $ | — | | | $ | (21,303 | ) |
Expiring 11/22/21 | | Deutsche Bank AG | | | EUR | | | | 417 | | | | 496,797 | | | | 482,270 | | | | — | | | | (14,527 | ) |
Expiring 01/19/22 | | Bank of America, N.A. | | | EUR | | | | 3,687 | | | | 4,284,293 | | | | 4,270,764 | | | | — | | | | (13,529 | ) |
Hungarian Forint, | | | | | | | | | | | | | | | | | | | | | | | | | | |
Expiring 01/19/22 | | Goldman Sachs International | | | HUF | | | | 157,231 | | | | 506,000 | | | | 503,397 | | | | — | | | | (2,603 | ) |
Expiring 01/19/22 | | HSBC Bank PLC | | | HUF | | | | 172,203 | | | | 554,000 | | | | 551,329 | | | | — | | | | (2,671 | ) |
Expiring 01/19/22 | | HSBC Bank PLC | | | HUF | | | | 166,685 | | | | 534,000 | | | | 533,665 | | | | — | | | | (335 | ) |
Indian Rupee, | | | | | | | | | | | | | | | | | | | | | | | | | | |
Expiring 12/15/21 | | Citibank, N.A. | | | INR | | | | 112,970 | | | | 1,530,091 | | | | 1,498,402 | | | | — | | | | (31,689 | ) |
Expiring 12/15/21 | | Citibank, N.A. | | | INR | | | | 57,525 | | | | 780,000 | | | | 762,997 | | | | — | | | | (17,003 | ) |
Expiring 12/15/21 | | HSBC Bank PLC | | | INR | | | | 55,618 | | | | 754,000 | | | | 737,704 | | | | — | | | | (16,296 | ) |
Expiring 12/15/21 | | HSBC Bank PLC | | | INR | | | | 52,603 | | | | 713,000 | | | | 697,713 | | | | — | | | | (15,287 | ) |
Expiring 12/15/21 | | JPMorgan Chase Bank, N.A. | | | INR | | | | 44,313 | | | | 596,000 | | | | 587,751 | | | | — | | | | (8,249 | ) |
Expiring 12/15/21 | | JPMorgan Chase Bank, N.A. | | | INR | | | | 43,988 | | | | 592,000 | | | | 583,450 | | | | — | | | | (8,550 | ) |
Expiring 12/15/21 | | JPMorgan Chase Bank, N.A. | | | INR | | | | 27,641 | | | | 372,000 | | | | 366,620 | | | | — | | | | (5,380 | ) |
Expiring 12/15/21 | | Morgan Stanley & Co. International PLC | | | INR | | | | 48,088 | | | | 637,999 | | | | 637,826 | | | | — | | | | (173 | ) |
Expiring 12/15/21 | | Morgan Stanley & Co. International PLC | | | INR | | | | 48,027 | | | | 640,000 | | | | 637,020 | | | | — | | | | (2,980 | ) |
Expiring 12/15/21 | | Morgan Stanley & Co. International PLC | | | INR | | | | 47,883 | | | | 639,000 | | | | 635,102 | | | | — | | | | (3,898 | ) |
Expiring 12/15/21 | | Morgan Stanley & Co. International PLC | | | INR | | | | 47,800 | | | | 633,000 | | | | 634,012 | | | | 1,012 | | | | — | |
Expiring 12/15/21 | | Morgan Stanley & Co. International PLC | | | INR | | | | 35,590 | | | | 479,000 | | | | 472,053 | | | | — | | | | (6,947 | ) |
Expiring 12/15/21 | | Morgan Stanley & Co. International PLC | | | INR | | | | 29,175 | | | | 389,000 | | | | 386,970 | | | | — | | | | (2,030 | ) |
Expiring 12/15/21 | | Standard Chartered | | | | | | | | | | | | | | | | | | | | | | | | |
| | Bank | | | INR | | | | 76,711 | | | | 1,017,000 | | | | 1,017,472 | | | | 472 | | | | — | |
Expiring 12/15/21 | | UBS AG | | | INR | | | | 47,356 | | | | 636,000 | | | | 628,117 | | | | — | | | | (7,883 | ) |
Expiring 02/25/22 | | JPMorgan Chase Bank, N.A. | | | INR | | | | 139,894 | | | | 1,830,000 | | | | 1,838,023 | | | | 8,023 | | | | — | |
Expiring 02/25/22 | | Standard Chartered Bank | | | INR | | | | 200,001 | | | | 2,673,214 | | | | 2,627,748 | | | | — | | | | (45,466 | ) |
Indonesian Rupiah, | | | | | | | | | | | | | | | | | | | | | | | | | | |
Expiring 12/15/21 | | Barclays Bank PLC | | | IDR | | | | 5,446,791 | | | | 378,000 | | | | 381,012 | | | | 3,012 | | | | — | |
Expiring 12/15/21 | | Citibank, N.A. | | | IDR | | | | 28,653,210 | | | | 1,963,086 | | | | 2,004,337 | | | | 41,251 | | | | — | |
| | |
| See Notes to Financial Statements. |
| PGIM Absolute Return Bond Fund | | 49 |
Schedule of Investments (continued)
as of October 31, 2021
Forward foreign currency exchange contracts outstanding at October 31, 2021 (continued):
| | | | | | | | | | | | | | | | | | | | | | | | | | |
Purchase Contracts | | Counterparty | | Notional
Amount
(000) | | | Value at
Settlement
Date | | | Current
Value | | | Unrealized
Appreciation | | | Unrealized
Depreciation | |
| | | |
OTC Forward Foreign Currency Exchange Contracts (cont’d.): | | | | | | | | | | | | | |
Indonesian Rupiah (cont’d.), | | | | | | | | | | | | | | | | | | | | | | | | |
Expiring 12/15/21 | | Goldman Sachs International | | | IDR | | | | 5,575,560 | | | $ | 388,000 | | | $ | 390,019 | | | $ | 2,019 | | | $ | — | |
Expiring 12/15/21 | | Goldman Sachs International | | | IDR | | | | 5,279,184 | | | | 366,000 | | | | 369,287 | | | | 3,287 | | | | — | |
Expiring 12/15/21 | | HSBC Bank PLC | | | IDR | | | | 7,683,462 | | | | 533,000 | | | | 537,470 | | | | 4,470 | | | | — | |
Expiring 12/15/21 | | HSBC Bank PLC | | | IDR | | | | 5,452,537 | | | | 378,000 | | | | 381,414 | | | | 3,414 | | | | — | |
Expiring 12/15/21 | | HSBC Bank PLC | | | IDR | | | | 3,755,520 | | | | 256,000 | | | | 262,705 | | | | 6,705 | | | | — | |
Expiring 12/15/21 | | JPMorgan Chase Bank, N.A. | | | IDR | | | | 5,319,120 | | | | 370,000 | | | | 372,081 | | | | 2,081 | | | | — | |
Expiring 12/15/21 | | JPMorgan Chase Bank, N.A. | | | IDR | | | | 3,853,036 | | | | 268,000 | | | | 269,526 | | | | 1,526 | | | | — | |
Expiring 12/15/21 | | JPMorgan Chase Bank, N.A. | | | IDR | | | | 3,790,248 | | | | 264,000 | | | | 265,134 | | | | 1,134 | | | | — | |
Expiring 12/15/21 | | Morgan Stanley & Co. International PLC | | | IDR | | | | 7,561,250 | | | | 526,000 | | | | 528,921 | | | | 2,921 | | | | — | |
Expiring 12/15/21 | | Morgan Stanley & Co. International PLC | | | IDR | | | | 7,317,639 | | | | 509,000 | | | | 511,880 | | | | 2,880 | | | | — | |
Expiring 12/15/21 | | Morgan Stanley & Co. International PLC | | | IDR | | | | 5,750,741 | | | | 401,000 | | | | 402,274 | | | | 1,274 | | | | — | |
Expiring 12/15/21 | | Morgan Stanley & Co. International PLC | | | IDR | | | | 3,710,245 | | | | 253,000 | | | | 259,538 | | | | 6,538 | | | | — | |
Israeli Shekel, | | | | | | | | | | | | | | | | | | | | | | | | | | |
Expiring 12/15/21 | | Citibank, N.A. | | | ILS | | | | 1,222 | | | | 382,000 | | | | 386,465 | | | | 4,465 | | | | — | |
Japanese Yen, | | | | | | | | | | | | | | | | | | | | | | | | | | |
Expiring 01/19/22 | | Barclays Bank PLC | | | JPY | | | | 132,979 | | | | 1,170,238 | | | | 1,167,964 | | | | — | | | | (2,274 | ) |
Expiring 01/28/22 | | Citibank, N.A. | | | JPY | | | | 538,981 | | | | 5,262,454 | | | | 4,734,270 | | | | — | | | | (528,184 | ) |
Expiring 01/28/22 | | Deutsche Bank AG | | | JPY | | | | 406,777 | | | | 3,862,000 | | | | 3,573,025 | | | | — | | | | (288,975 | ) |
Expiring 01/28/22 | | Deutsche Bank AG | | | JPY | | | | 153,253 | | | | 1,470,000 | | | | 1,346,133 | | | | — | | | | (123,867 | ) |
Expiring 01/28/22 | | Deutsche Bank AG | | | JPY | | | | 102,273 | | | | 944,000 | | | | 898,340 | | | | — | | | | (45,660 | ) |
Expiring 05/31/22 | | Citibank, N.A. | | | JPY | | | | 92,578 | | | | 849,426 | | | | 814,455 | | | | — | | | | (34,971 | ) |
Expiring 05/31/22 | | Deutsche Bank AG | | | JPY | | | | 662,163 | | | | 6,130,000 | | | | 5,825,376 | | | | — | | | | (304,624 | ) |
Expiring 10/31/23 | | Barclays Bank PLC | | | JPY | | | | 487,838 | | | | 5,118,000 | | | | 4,368,747 | | | | — | | | | (749,253 | ) |
Expiring 10/31/23 | | Deutsche Bank AG | | | JPY | | | | 498,249 | | | | 5,219,999 | | | | 4,461,984 | | | | — | | | | (758,015 | ) |
Expiring 10/31/23 | | Goldman Sachs International | | | JPY | | | | 874,045 | | | | 8,971,000 | | | | 7,827,359 | | | | — | | | | (1,143,641 | ) |
Expiring 10/31/23 | | Morgan Stanley & Co. International PLC | | | JPY | | | | 855,296 | | | | 8,262,958 | | | | 7,659,460 | | | | — | | | | (603,498 | ) |
Mexican Peso, | | | | | | | | | | | | | | | | | | | | | | | | | | |
Expiring 12/15/21 | | BNP Paribas S.A. | | | MXN | | | | 8,182 | | | | 407,000 | | | | 394,532 | | | | — | | | | (12,468 | ) |
Expiring 12/15/21 | | Citibank, N.A. | | | MXN | | | | 13,408 | | | | 660,000 | | | | 646,539 | | | | — | | | | (13,461 | ) |
Expiring 12/15/21 | | Citibank, N.A. | | | MXN | | | | 11,320 | | | | 537,000 | | | | 545,863 | | | | 8,863 | | | | — | |
|
See Notes to Financial Statements. 50 |
Forward foreign currency exchange contracts outstanding at October 31, 2021 (continued):
| | | | | | | | | | | | | | | | | | | | | | | | | | |
Purchase Contracts | | Counterparty | | Notional
Amount
(000) | | | Value at
Settlement
Date | | | Current
Value | | | Unrealized
Appreciation | | | Unrealized
Depreciation | |
OTC Forward Foreign Currency Exchange Contracts (cont’d.): | | | | | | | | | | | | | | | | | |
Mexican Peso (cont’d.), | | | | | | | | | | | | | | | | | | | | | | | | |
Expiring 12/15/21 | | Goldman Sachs International | | | MXN | | | | 46,753 | | | $ | 2,310,602 | | | $ | 2,254,497 | | | $ | — | | | $ | (56,105 | ) |
Expiring 12/15/21 | | Goldman Sachs International | | | MXN | | | | 15,561 | | | | 766,000 | | | | 750,371 | | | | — | | | | (15,629 | ) |
Expiring 12/15/21 | | Goldman Sachs International | | | MXN | | | | 12,102 | | | | 594,000 | | | | 583,558 | | | | — | | | | (10,442 | ) |
Expiring 12/15/21 | | Goldman Sachs International | | | MXN | | | | 11,575 | | | | 556,000 | | | | 558,176 | | | | 2,176 | | | | — | |
Expiring 12/15/21 | | Goldman Sachs International | | | MXN | | | | 7,720 | | | | 375,000 | | | | 372,271 | | | | — | | | | (2,729 | ) |
Expiring 12/15/21 | | JPMorgan Chase Bank, N.A. | | | MXN | | | | 7,360 | | | | 365,000 | | | | 354,914 | | | | — | | | | (10,086 | ) |
Expiring 12/15/21 | | Morgan Stanley & Co. International PLC | | | MXN | | | | 46,753 | | | | 2,309,369 | | | | 2,254,496 | | | | — | | | | (54,873 | ) |
Expiring 02/25/22 | | Bank of America, N.A. | | | MXN | | | | 47,307 | | | | 2,005,107 | | | | 2,254,225 | | | | 249,118 | | | | — | |
Expiring 02/25/22 | | Morgan Stanley & Co. International PLC | | | MXN | | | | 28,900 | | | | 1,360,406 | | | | 1,377,101 | | | | 16,695 | | | | — | |
Expiring 04/28/23 | | JPMorgan Chase Bank, N.A. | | | MXN | | | | 72,679 | | | | 3,006,698 | | | | 3,202,592 | | | | 195,894 | | | | — | |
Expiring 04/28/23 | | Morgan Stanley & Co. International PLC | | | MXN | | | | 231,058 | | | | 9,739,000 | | | | 10,181,479 | | | | 442,479 | | | | — | |
New Taiwanese Dollar, | | | | | | | | | | | | | | | | | | | | | | | | |
Expiring 12/15/21 | | Standard Chartered Bank | | | TWD | | | | 34,611 | | | | 1,252,164 | | | | 1,246,584 | | | | — | | | | (5,580 | ) |
Expiring 12/15/21 | | UBS AG | | | TWD | | | | 20,270 | | | | 737,000 | | | | 730,079 | | | | — | | | | (6,921 | ) |
Expiring 12/23/21 | | Citibank, N.A. | | | TWD | | | | 21,613 | | | | 789,307 | | | | 778,823 | | | | — | | | | (10,484 | ) |
Expiring 12/23/21 | | Deutsche Bank AG | | | TWD | | | | 18,134 | | | | 651,000 | | | | 653,473 | | | | 2,473 | | | | — | |
Peruvian Nuevo Sol, | | | | | | | | | | | | | | | | | | | | | | | | | | |
Expiring 12/15/21 | | Goldman Sachs International | | | PEN | | | | 1,067 | | | | 259,000 | | | | 266,825 | | | | 7,825 | | | | — | |
Philippine Peso, | | | | | | | | | | | | | | | | | | | | | | | | | | |
Expiring 12/15/21 | | HSBC Bank PLC | | | PHP | | | | 39,163 | | | | 767,000 | | | | 773,178 | | | | 6,178 | | | | — | |
Expiring 12/15/21 | | HSBC Bank PLC | | | PHP | | | | 37,900 | | | | 743,000 | | | | 748,251 | | | | 5,251 | | | | — | |
Expiring 12/15/21 | | JPMorgan Chase Bank, N.A. | | | PHP | | | | 99,753 | | | | 1,978,239 | | | | 1,969,373 | | | | — | | | | (8,866 | ) |
Expiring 12/15/21 | | JPMorgan Chase Bank, N.A. | | | PHP | | | | 53,146 | | | | 1,038,000 | | | | 1,049,230 | | | | 11,230 | | | | — | |
Expiring 12/15/21 | | JPMorgan Chase Bank, N.A. | | | PHP | | | | 39,538 | | | | 776,000 | | | | 780,581 | | | | 4,581 | | | | — | |
Expiring 12/15/21 | | Morgan Stanley & Co. International PLC | | | PHP | | | | 33,340 | | | | 648,000 | | | | 658,209 | | | | 10,209 | | | | — | |
| | |
| See Notes to Financial Statements. |
| PGIM Absolute Return Bond Fund | | 51 |
Schedule of Investments (continued)
as of October 31, 2021
Forward foreign currency exchange contracts outstanding at October 31, 2021 (continued):
| | | | | | | | | | | | | | | | | | | | | | | | | | |
Purchase Contracts | | Counterparty | | Notional
Amount
(000) | | | Value at
Settlement
Date | | | Current
Value | | | Unrealized
Appreciation | | | Unrealized
Depreciation | |
| | | | |
OTC Forward Foreign Currency Exchange Contracts (cont’d.): | | | | | | | | | | | | | | | | | |
Philippine Peso (cont’d.), | | | | | | | | | | | | | | | | | | | | | | | | |
Expiring 12/15/21 | | Standard Chartered Bank | | | PHP | | | | 52,471 | | | $ | 1,027,000 | | | $ | 1,035,921 | | | $ | 8,921 | | | $ | — | |
Polish Zloty, | | | | | | | | | | | | | | | | | | | | | | | | | | |
Expiring 01/19/22 | | Citibank, N.A. | | | PLN | | | | 2,495 | | | | 632,000 | | | | 624,254 | | | | — | | | | (7,746 | ) |
Expiring 01/19/22 | | Morgan Stanley & Co. International PLC | | | PLN | | | | 1,993 | | | | 505,000 | | | | 498,546 | | | | — | | | | (6,454 | ) |
Russian Ruble, | | | | | | | | | | | | | | | | | | | | | | | | | | |
Expiring 11/22/21 | | Deutsche Bank AG | | | RUB | | | | 153,565 | | | | 1,982,000 | | | | 2,155,239 | | | | 173,239 | | | | — | |
Expiring 11/22/21 | | Morgan Stanley & Co. International PLC | | | RUB | | | | 176,513 | | | | 2,206,000 | | | | 2,477,303 | | | | 271,303 | | | | — | |
Expiring 12/15/21 | | Barclays Bank PLC | | | RUB | | | | 236,162 | | | | 3,171,065 | | | | 3,294,876 | | | | 123,811 | | | | — | |
Expiring 12/15/21 | | Barclays Bank PLC | | | RUB | | | | 18,663 | | | | 251,000 | | | | 260,378 | | | | 9,378 | | | | — | |
Expiring 12/15/21 | | Credit Suisse International | | | RUB | | | | 21,090 | | | | 285,000 | | | | 294,249 | | | | 9,249 | | | | — | |
Expiring 12/15/21 | | Goldman Sachs International | | | RUB | | | | 17,092 | | | | 232,000 | | | | 238,464 | | | | 6,464 | | | | — | |
Expiring 12/15/21 | | Morgan Stanley & Co. International PLC | | | RUB | | | | 236,162 | | | | 3,185,737 | | | | 3,294,876 | | | | 109,139 | | | | — | |
Singapore Dollar, | | | | | | | | | | | | | | | | | | | | | | | | | | |
Expiring 12/15/21 | | Goldman Sachs International | | | SGD | | | | 532 | | | | 395,000 | | | | 394,176 | | | | — | | | | (824 | ) |
Expiring 12/15/21 | | JPMorgan Chase Bank, N.A. | | | SGD | | | | 1,195 | | | | 881,000 | | | | 885,734 | | | | 4,734 | | | | — | |
Expiring 12/15/21 | | JPMorgan Chase Bank, N.A. | | | SGD | | | | 530 | | | | 395,000 | | | | 393,227 | | | | — | | | | (1,773 | ) |
South African Rand, | | | | | | | | | | | | | | | | | | | | | | | | | | |
Expiring 12/15/21 | | Barclays Bank PLC | | | ZAR | | | | 7,122 | | | | 476,000 | | | | 463,513 | | | | — | | | | (12,487 | ) |
Expiring 12/15/21 | | Barclays Bank PLC | | | ZAR | | | | 5,757 | | | | 389,000 | | | | 374,660 | | | | — | | | | (14,340 | ) |
Expiring 12/15/21 | | Goldman Sachs International | | | ZAR | | | | 5,476 | | | | 375,000 | | | | 356,391 | | | | — | | | | (18,609 | ) |
Expiring 12/15/21 | | Goldman Sachs International | | | ZAR | | | | 3,856 | | | | 261,000 | | | | 250,943 | | | | — | | | | (10,057 | ) |
Expiring 12/15/21 | | JPMorgan Chase Bank, N.A. | | | ZAR | | | | 8,946 | | | | 589,001 | | | | 582,219 | | | | — | | | | (6,782 | ) |
Expiring 12/15/21 | | JPMorgan Chase Bank, N.A. | | | ZAR | | | | 8,774 | | | | 592,000 | | | | 571,056 | | | | — | | | | (20,944 | ) |
Expiring 12/15/21 | | JPMorgan Chase Bank, N.A. | | | ZAR | | | | 7,140 | | | | 476,000 | | | | 464,708 | | | | — | | | | (11,292 | ) |
Expiring 12/15/21 | | JPMorgan Chase Bank, N.A. | | | ZAR | | | | 5,422 | | | | 356,000 | | | | 352,872 | | | | — | | | | (3,128 | ) |
Expiring 12/15/21 | | JPMorgan Chase Bank, N.A. | | | ZAR | | | | 4,014 | | | | 266,000 | | | | 261,241 | | | | — | | | | (4,759 | ) |
|
See Notes to Financial Statements. 52 |
Forward foreign currency exchange contracts outstanding at October 31, 2021 (continued):
| | | | | | | | | | | | | | | | | | | | | | | | | | |
Purchase Contracts | | Counterparty | | Notional
Amount
(000) | | | Value at
Settlement
Date | | | Current
Value | | | Unrealized
Appreciation | | | Unrealized
Depreciation | |
| | | | |
OTC Forward Foreign Currency Exchange Contracts (cont’d.): | | | | | | | | | | | | | | | | | |
South African Rand (cont’d.), | | | | | | | | | | | | | | | | | | | | | | | | |
Expiring 12/23/21 | | Goldman Sachs International | | | ZAR | | | | 73,237 | | | $ | 3,878,000 | | | $ | 4,761,175 | | | $ | 883,175 | | | $ | — | |
Expiring 05/31/22 | | Morgan Stanley & Co. International PLC | | | ZAR | | | | 10,977 | | | | 706,260 | | | | 698,825 | | | | — | | | | (7,435 | ) |
Expiring 05/31/22 | | Morgan Stanley & Co. International PLC | | | ZAR | | | | 7,904 | | | | 515,310 | | | | 503,147 | | | | — | | | | (12,163 | ) |
South Korean Won, | | | | | | | | | | | | | | | | | | | | | | | | | | |
Expiring 12/15/21 | | Goldman Sachs International | | | KRW | | | | 448,640 | | | | 382,000 | | | | 381,523 | | | | — | | | | (477 | ) |
Expiring 12/15/21 | | HSBC Bank PLC | | | KRW | | | | 761,919 | | | | 645,000 | | | | 647,935 | | | | 2,935 | | | | — | |
Expiring 12/15/21 | | Morgan Stanley & Co. International PLC | | | KRW | | | | 5,270,607 | | | | 4,500,407 | | | | 4,482,118 | | | | — | | | | (18,289 | ) |
Expiring 12/15/21 | | Standard Chartered Bank | | | KRW | | | | 759,252 | | | | 649,000 | | | | 645,667 | | | | — | | | | (3,333 | ) |
Thai Baht, | | | | | | | | | | | | | | | | | | | | | | | | | | |
Expiring 12/15/21 | | HSBC Bank PLC | | | THB | | | | 21,934 | | | | 666,000 | | | | 660,805 | | | | — | | | | (5,195 | ) |
Expiring 12/15/21 | | JPMorgan Chase Bank, N.A. | | | THB | | | | 14,618 | | | | 444,000 | | | | 440,403 | | | | — | | | | (3,597 | ) |
Expiring 12/15/21 | | Standard Chartered Bank | | | THB | | | | 22,196 | | | | 658,000 | | | | 668,706 | | | | 10,706 | | | | — | |
Expiring 12/15/21 | | Standard Chartered Bank | | | THB | | | | 16,836 | | | | 515,000 | | | | 507,209 | | | | — | | | | (7,791 | ) |
Expiring 12/15/21 | | UBS AG | | | THB | | | | 19,460 | | | | 585,000 | | | | 586,262 | | | | 1,262 | | | | — | |
| | | | | | | | | | | | | | | | | | | | | | | | | | |
| | | | | | | | | | | | $ | 201,340,756 | | | $ | 198,635,591 | | | | 3,274,618 | | | | (5,979,783 | ) |
| | | | | | | | | | | | | | | | | | | | | | | | | | |
| | | | | | |
Sale Contracts | | Counterparty | | Notional
Amount
(000) | | | Value at
Settlement
Date | | | Current
Value | | | Unrealized
Appreciation | | | Unrealized
Depreciation | |
| | | | |
OTC Forward Foreign Currency Exchange Contracts: | | | | | | | | | | | | | | | | | |
Australian Dollar, | | | | | | | | | | | | | | | | | | | | | | | | | | |
Expiring 01/19/22 | | Morgan Stanley & Co. International PLC | | | AUD | | | | 4,407 | | | $ | 3,248,017 | | | $ | 3,316,252 | | | $ | — | | | $ | (68,235 | ) |
Expiring 05/31/22 | | Morgan Stanley & Co. International PLC | | | AUD | | | | 1,263 | | | | 953,616 | | | | 949,581 | | | | 4,035 | | | | — | |
Brazilian Real, | | | | | | | | | | | | | | | | | | | | | | | | | | |
Expiring 11/03/21 | | Credit Suisse International | | | BRL | | | | 36,888 | | | | 6,517,382 | | | | 6,529,437 | | | | — | | | | (12,055 | ) |
Expiring 01/28/22 | | Citibank, N.A. | | | BRL | | | | 24,184 | | | | 4,311,000 | | | | 4,197,914 | | | | 113,086 | | | | — | |
Expiring 01/28/22 | | Citibank, N.A. | | | BRL | | | | 2,181 | | | | 414,751 | | | | 378,556 | | | | 36,195 | | | | — | |
Expiring 01/28/22 | | Deutsche Bank AG | | | BRL | | | | 37,286 | | | | 8,109,155 | | | | 6,472,292 | | | | 1,636,863 | | | | — | |
| | |
| See Notes to Financial Statements. |
| PGIM Absolute Return Bond Fund | | 53 |
Schedule of Investments (continued)
as of October 31, 2021
Forward foreign currency exchange contracts outstanding at October 31, 2021 (continued):
| | | | | | | | | | | | | | | | | | | | | | | | | | |
Sale Contracts | | Counterparty | | Notional
Amount
(000) | | | Value at
Settlement
Date | | | Current
Value | | | Unrealized
Appreciation | | | Unrealized
Depreciation | |
|
OTC Forward Foreign Currency Exchange Contracts (cont’d.): | |
British Pound, | | | | | | | | | | | | | | | | | | | | | | | | | | |
Expiring 01/19/22 | | Barclays Bank PLC | | | GBP | | | | 19,964 | | | $ | 27,142,596 | | | $ | 27,329,102 | | | $ | — | | | $ | (186,506 | ) |
Expiring 01/28/22 | | JPMorgan Chase Bank, N.A. | | | GBP | | | | 625 | | | | 817,100 | | | | 855,539 | | | | — | | | | (38,439 | ) |
Chilean Peso, | | | | | | | | | | | | | | | | | | | | | | | | | | |
Expiring 12/15/21 | | BNP Paribas S.A. | | | CLP | | | | 1,387,039 | | | | 1,772,822 | | | | 1,696,000 | | | | 76,822 | | | | — | |
Expiring 12/15/21 | | Citibank, N.A. | | | CLP | | | | 206,180 | | | | 261,000 | | | | 252,106 | | | | 8,894 | | | | — | |
Expiring 12/15/21 | | Morgan Stanley & Co. International PLC | | | CLP | | | | 413,687 | | | | 507,001 | | | | 505,836 | | | | 1,165 | | | | — | |
Expiring 12/15/21 | | UBS AG | | | CLP | | | | 506,184 | | | | 626,000 | | | | 618,936 | | | | 7,064 | | | | — | |
Chinese Renminbi, | | | | | | | | | | | | | | | | | | | | | | | | | | |
Expiring 11/18/21 | | Citibank, N.A. | | | CNH | | | | 8,844 | | | | 1,357,000 | | | | 1,378,263 | | | | — | | | | (21,263 | ) |
Expiring 11/18/21 | | Citibank, N.A. | | | CNH | | | | 3,878 | | | | 607,000 | | | | 604,413 | | | | 2,587 | | | | — | |
Expiring 11/18/21 | | Citibank, N.A. | | | CNH | | | | 3,294 | | | | 506,000 | | | | 513,396 | | | | — | | | | (7,396 | ) |
Expiring 11/18/21 | | Citibank, N.A. | | | CNH | | | | 2,904 | | | | 447,000 | | | | 452,492 | | | | — | | | | (5,492 | ) |
Expiring 11/18/21 | | Citibank, N.A. | | | CNH | | | | 2,654 | | | | 409,000 | | | | 413,669 | | | | — | | | | (4,669 | ) |
Expiring 11/18/21 | | HSBC Bank PLC | | | CNH | | | | 4,190 | | | | 647,000 | | | | 652,964 | | | | — | | | | (5,964 | ) |
Expiring 11/18/21 | | HSBC Bank PLC | | | CNH | | | | 4,096 | | | | 640,000 | | | | 638,285 | | | | 1,715 | | | | — | |
Expiring 11/18/21 | | HSBC Bank PLC | | | CNH | | | | 3,349 | | | | 513,000 | | | | 521,852 | | | | — | | | | (8,852 | ) |
Expiring 11/18/21 | | JPMorgan Chase Bank, N.A. | | | CNH | | | | 4,224 | | | | 647,000 | | | | 658,215 | | | | — | | | | (11,215 | ) |
Expiring 11/18/21 | | JPMorgan Chase Bank, N.A. | | | CNH | | | | 3,317 | | | | 507,000 | | | | 516,852 | | | | — | | | | (9,852 | ) |
Expiring 11/18/21 | | JPMorgan Chase Bank, N.A. | | | CNH | | | | 2,628 | | | | 405,000 | | | | 409,528 | | | | — | | | | (4,528 | ) |
Expiring 11/18/21 | | JPMorgan Chase Bank, N.A. | | | CNH | | | | 2,486 | | | | 383,000 | | | | 387,375 | | | | — | | | | (4,375 | ) |
Expiring 11/18/21 | | JPMorgan Chase Bank, N.A. | | | CNH | | | | 2,478 | | | | 382,000 | | | | 386,104 | | | | — | | | | (4,104 | ) |
Expiring 11/18/21 | | Morgan Stanley & Co. International PLC | | | CNH | | | | 5,050 | | | | 772,000 | | | | 787,020 | | | | — | | | | (15,020 | ) |
Expiring 01/28/22 | | Deutsche Bank AG | | | CNH | | | | 6,953 | | | | 1,068,913 | | | | 1,076,731 | | | | — | | | | (7,818 | ) |
Expiring 01/28/22 | | Deutsche Bank AG | | | CNH | | | | 3,291 | | | | 478,000 | | | | 509,557 | | | | — | | | | (31,557 | ) |
Colombian Peso, | | | | | | | | | | | | | | | | | | | | | | | | | | |
Expiring 12/15/21 | | BNP Paribas S.A. | | | COP | | | | 2,151,528 | | | | 571,000 | | | | 569,511 | | | | 1,489 | | | | — | |
Expiring 12/15/21 | | BNP Paribas S.A. | | | COP | | | | 1,481,126 | | | | 384,000 | | | | 392,055 | | | | — | | | | (8,055 | ) |
Expiring 12/15/21 | | Citibank, N.A. | | | COP | | | | 2,438,872 | | | | 633,000 | | | | 645,571 | | | | — | | | | (12,571 | ) |
Expiring 12/15/21 | | Goldman Sachs International | | | COP | | | | 1,821,307 | | | | 481,000 | | | | 482,101 | | | | — | | | | (1,101 | ) |
Expiring 12/15/21 | | JPMorgan Chase Bank, N.A. | | | COP | | | | 5,357,160 | | | | 1,417,932 | | | | 1,418,044 | | | | — | | | | (112 | ) |
Expiring 12/15/21 | | Morgan Stanley & Co. International PLC | | | COP | | | | 2,068,364 | | | | 535,000 | | | | 547,497 | | | | — | | | | (12,497 | ) |
|
See Notes to Financial Statements. 54 |
Forward foreign currency exchange contracts outstanding at October 31, 2021 (continued):
| | | | | | | | | | | | | | | | | | | | | | |
Sale Contracts | | Counterparty | | Notional
Amount
(000) | | | Value at
Settlement
Date | | | Current
Value | | | Unrealized
Appreciation | | | Unrealized
Depreciation | |
| | | | |
OTC Forward Foreign Currency Exchange Contracts (cont’d.): | | | | | | | | | | | | | | | | | |
Colombian Peso (cont’d.), | | | | | | | | | | | | | | | | | | | | |
Expiring 12/15/21 | | Morgan Stanley & Co. International PLC | | COP | 1,488,096 | | | $ | 386,000 | | | $ | 393,900 | | | $ | — | | | $ | (7,900 | ) |
Expiring 12/15/21 | | UBS AG | | COP | 2,435,155 | | | | 631,000 | | | | 644,587 | | | | — | | | | (13,587 | ) |
Expiring 12/15/21 | | UBS AG | | COP | 1,958,986 | | | | 519,000 | | | | 518,545 | | | | 455 | | | | — | |
Expiring 12/15/21 | | UBS AG | | COP | 978,435 | | | | 255,000 | | | | 258,992 | | | | — | | | | (3,992 | ) |
Expiring 12/15/21 | | UBS AG | | COP | 963,840 | | | | 251,000 | | | | 255,129 | | | | — | | | | (4,129 | ) |
Czech Koruna, | | | | | | | | | | | | | | | | | | | | | | |
Expiring 01/19/22 | | Barclays Bank PLC | | CZK | 16,066 | | | | 728,772 | | | | 721,353 | | | | 7,419 | | | | — | |
Euro, | | | | | | | | | | | | | | | | | | | | | | |
Expiring 11/22/21 | | Citibank, N.A. | | EUR | 509 | | | | 606,703 | | | | 589,108 | | | | 17,595 | | | | — | |
Expiring 11/22/21 | | Morgan Stanley & Co. International PLC | | EUR | 860 | | | | 1,025,453 | | | | 994,172 | | | | 31,281 | | | | — | |
Expiring 01/19/22 | | Goldman Sachs International | | EUR | 19,825 | | | | 22,953,384 | | | | 22,966,121 | | | | — | | | | (12,737 | ) |
Expiring 01/19/22 | | HSBC Bank PLC | | EUR | 22,337 | | | | 25,865,866 | | | | 25,876,442 | | | | — | | | | (10,576 | ) |
Expiring 01/19/22 | | Morgan Stanley & Co. International PLC | | EUR | 1,627 | | | | 1,890,584 | | | | 1,885,012 | | | | 5,572 | | | | — | |
Expiring 01/19/22 | | UBS AG | | EUR | 22,097 | | | | 25,605,008 | | | | 25,598,478 | | | | 6,530 | | | | — | |
Expiring 01/19/22 | | UBS AG | | EUR | 13,273 | | | | 15,378,645 | | | | 15,375,625 | | | | 3,020 | | | | — | |
Hungarian Forint, | | | | | | | | | | | | | | | | | | | | | | |
Expiring 01/19/22 | | Goldman Sachs International | | HUF | 791,308 | | | | 2,529,999 | | | | 2,533,475 | | | | — | | | | (3,476 | ) |
Expiring 01/19/22 | | HSBC Bank PLC | | HUF | 791,308 | | | | 2,530,889 | | | | 2,533,475 | | | | — | | | | (2,586 | ) |
Indian Rupee, | | | | | | | | | | | | | | | | | | | | | | |
Expiring 12/15/21 | | Citibank, N.A. | | INR | 36,297 | | | | 486,000 | | | | 481,433 | | | | 4,567 | | | | — | |
Expiring 12/15/21 | | Credit Suisse International | | INR | 47,829 | | | | 634,000 | | | | 634,392 | | | | — | | | | (392 | ) |
Expiring 12/15/21 | | Credit Suisse International | | INR | 39,129 | | | | 517,000 | | | | 518,999 | | | | — | | | | (1,999 | ) |
Expiring 12/15/21 | | Goldman Sachs International | | INR | 49,953 | | | | 668,000 | | | | 662,565 | | | | 5,435 | | | | — | |
Expiring 12/15/21 | | HSBC Bank PLC | | INR | 78,190 | | | | 1,032,000 | | | | 1,037,092 | | | | — | | | | (5,092 | ) |
Expiring 12/15/21 | | JPMorgan Chase Bank, N.A. | | INR | 59,517 | | | | 783,000 | | | | 789,424 | | | | — | | | | (6,424 | ) |
Expiring 12/15/21 | | JPMorgan Chase Bank, N.A. | | INR | 46,506 | | | | 620,000 | | | | 616,839 | | | | 3,161 | | | | — | |
Expiring 12/15/21 | | JPMorgan Chase Bank, N.A. | | INR | 44,514 | | | | 595,000 | | | | 590,419 | | | | 4,581 | | | | — | |
Expiring 12/15/21 | | Morgan Stanley & Co. International PLC | | INR | 67,718 | | | | 892,000 | | | | 898,194 | | | | — | | | | (6,194 | ) |
Expiring 12/15/21 | | Standard Chartered Bank | | INR | 49,272 | | | | 648,000 | | | | 653,537 | | | | — | | | | (5,537 | ) |
| | |
| See Notes to Financial Statements. |
| PGIM Absolute Return Bond Fund | | 55 |
Schedule of Investments (continued)
as of October 31, 2021
Forward foreign currency exchange contracts outstanding at October 31, 2021 (continued):
| | | | | | | | | | | | | | | | | | | | | | |
Sale Contracts | | Counterparty | | Notional
Amount
(000) | | | Value at
Settlement
Date | | | Current
Value | | | Unrealized
Appreciation | | | Unrealized
Depreciation | |
|
OTC Forward Foreign Currency Exchange Contracts (cont’d.): | |
Indian Rupee (cont’d.), | | | | | | | | | | | | | | | | | |
Expiring 12/15/21 | | UBS AG | | INR | 48,815 | | | $ | 650,000 | | | $ | 647,470 | | | $ | 2,530 | | | $ | — | |
Expiring 02/25/22 | | JPMorgan Chase Bank, N.A. | | INR | 179,467 | | | | 2,319,000 | | | | 2,357,960 | | | | — | | | | (38,960 | ) |
Expiring 02/25/22 | | Morgan Stanley & Co. International PLC | | INR | 164,184 | | | | 2,095,000 | | | | 2,157,158 | | | | — | | | | (62,158 | ) |
Indonesian Rupiah, | | | | | | | | | | | | | | | | | | | | | | |
Expiring 12/15/21 | | HSBC Bank PLC | | IDR | 19,410,860 | | | | 1,366,000 | | | | 1,357,821 | | | | 8,179 | | | | — | |
Expiring 12/15/21 | | Morgan Stanley & Co. International PLC | | IDR | 3,779,587 | | | | 259,000 | | | | 264,388 | | | | — | | | | (5,388 | ) |
Expiring 12/15/21 | | Standard Chartered Bank | | IDR | 8,507,632 | | | | 592,000 | | | | 595,122 | | | | — | | | | (3,122 | ) |
Israeli Shekel, | | | | | | | | | | | | | | | | | | | | | | |
Expiring 12/15/21 | | Bank of America, N.A. | | ILS | 1,248 | | | | 388,000 | | | | 394,555 | | | | — | | | | (6,555 | ) |
Expiring 12/15/21 | | Barclays Bank PLC | | ILS | 4,190 | | | | 1,300,000 | | | | 1,324,696 | | | | — | | | | (24,696 | ) |
Expiring 12/15/21 | | Barclays Bank PLC | | ILS | 1,982 | | | | 617,000 | | | | 626,455 | | | | — | | | | (9,455 | ) |
Expiring 12/15/21 | | BNP Paribas S.A. | | ILS | 1,440 | | | | 447,505 | | | | 455,094 | | | | — | | | | (7,589 | ) |
Expiring 12/15/21 | | Citibank, N.A. | | ILS | 2,855 | | | | 888,000 | | | | 902,538 | | | | — | | | | (14,538 | ) |
Expiring 12/15/21 | | Citibank, N.A. | | ILS | 1,257 | | | | 390,000 | | | | 397,437 | | | | — | | | | (7,437 | ) |
Expiring 12/15/21 | | Citibank, N.A. | | ILS | 1,248 | | | | 386,000 | | | | 394,681 | | | | — | | | | (8,681 | ) |
Expiring 12/15/21 | | Goldman Sachs International | | ILS | 1,237 | | | | 384,000 | | | | 390,900 | | | | — | | | | (6,900 | ) |
Expiring 12/15/21 | | JPMorgan Chase Bank, N.A. | | ILS | 1,678 | | | | 518,000 | | | | 530,312 | | | | — | | | | (12,312 | ) |
Japanese Yen, | | | | | | | | | | | | | | | | | | | | | | |
Expiring 01/28/22 | | Citibank, N.A. | | JPY | 634,903 | | | | 5,972,189 | | | | 5,576,833 | | | | 395,356 | | | | — | |
Expiring 01/28/22 | | Citibank, N.A. | | JPY | 601,760 | | | | 5,760,948 | | | | 5,285,708 | | | | 475,240 | | | | — | |
Expiring 01/28/22 | | Citibank, N.A. | | JPY | 410,350 | | | | 3,967,301 | | | | 3,604,410 | | | | 362,891 | | | | — | |
Expiring 01/28/22 | | Citibank, N.A. | | JPY | 93,027 | | | | 852,053 | | | | 817,127 | | | | 34,926 | | | | — | |
Expiring 05/31/22 | | Citibank, N.A. | | JPY | 293,864 | | | | 2,846,550 | | | | 2,585,265 | | | | 261,285 | | | | — | |
Expiring 05/31/22 | | Deutsche Bank AG | | JPY | 349,393 | | | | 3,323,000 | | | | 3,073,781 | | | | 249,219 | | | | — | |
Expiring 10/31/23 | | Bank of America, N.A. | | JPY | 1,325,555 | | | | 12,988,000 | | | | 11,870,787 | | | | 1,117,213 | | | | — | |
Expiring 10/31/23 | | Bank of America, N.A. | | JPY | 1,168,753 | | | | 11,585,000 | | | | 10,466,568 | | | | 1,118,432 | | | | — | |
Expiring 10/31/23 | | Citibank, N.A. | | JPY | 399,802 | | | | 4,148,827 | | | | 3,580,357 | | | | 568,470 | | | | — | |
Expiring 10/31/23 | | Citibank, N.A. | | JPY | 46,713 | | | | 447,401 | | | | 418,332 | | | | 29,069 | | | | — | |
Mexican Peso, | | | | | | | | | | | | | | | | | | | | | | |
Expiring 12/15/21 | | JPMorgan Chase Bank, N.A. | | MXN | 12,152 | | | | 596,000 | | | | 585,964 | | | | 10,036 | | | | — | |
Expiring 12/15/21 | | JPMorgan Chase Bank, N.A. | | MXN | 11,990 | | | | 592,000 | | | | 578,195 | | | | 13,805 | | | | — | |
Expiring 12/15/21 | | JPMorgan Chase Bank, N.A. | | MXN | 11,975 | | | | 594,000 | | | | 577,427 | | | | 16,573 | | | | — | |
Expiring 02/25/22 | | Barclays Bank PLC | | MXN | 45,503 | | | | 1,924,000 | | | | 2,168,240 | | | | — | | | | (244,240 | ) |
|
See Notes to Financial Statements. 56 |
Forward foreign currency exchange contracts outstanding at October 31, 2021 (continued):
| | | | | | | | | | | | | | | | | | | | | | |
Sale Contracts | | Counterparty | | Notional
Amount
(000) | | | Value at
Settlement
Date | | | Current
Value | | | Unrealized
Appreciation | | | Unrealized
Depreciation | |
| | | | |
OTC Forward Foreign Currency Exchange Contracts (cont’d.): | | | | | | | | | | | | | | | | | |
Mexican Peso (cont’d.), | | | | | | | | | | | | | | | | | |
Expiring 02/25/22 | | Deutsche Bank AG | | MXN | 16,101 | | | $ | 750,000 | | | $ | 767,209 | | | $ | — | | | $ | (17,209 | ) |
Expiring 02/25/22 | | Goldman Sachs International | | MXN | 14,604 | | | | 589,000 | | | | 695,876 | | | | — | | | | (106,876 | ) |
Expiring 04/28/23 | | Morgan Stanley & Co. International PLC | | MXN | 303,737 | | | | 13,188,761 | | | | 13,384,071 | | | | — | | | | (195,310 | ) |
New Taiwanese Dollar, | | | | | | | | | | | | | | | | | |
Expiring 12/15/21 | | Credit Suisse International | | TWD | 17,586 | | | | 635,000 | | | | 633,382 | | | | 1,618 | | | | — | |
Expiring 12/15/21 | | Credit Suisse International | | TWD | 12,830 | | | | 466,000 | | | | 462,102 | | | | 3,898 | | | | — | |
Expiring 12/15/21 | | Goldman Sachs International | | TWD | 17,681 | | | | 636,000 | | | | 636,808 | | | | — | | | | (808 | ) |
Expiring 12/15/21 | | JPMorgan Chase Bank, N.A. | | TWD | 34,481 | | | | 1,241,000 | | | | 1,241,906 | | | | — | | | | (906 | ) |
Expiring 12/15/21 | | JPMorgan Chase Bank, N.A. | | TWD | 18,392 | | | | 663,000 | | | | 662,409 | | | | 591 | | | | — | |
Expiring 12/23/21 | | JPMorgan Chase Bank, N.A. | | TWD | 39,747 | | | | 1,509,000 | | | | 1,432,296 | | | | 76,704 | | | | — | |
Peruvian Nuevo Sol, | | | | | | | | | | | | | | | | | | | | | | |
Expiring 12/15/21 | | Standard Chartered Bank | | PEN | 1,500 | | | | 379,000 | | | | 375,149 | | | | 3,851 | | | | — | |
Philippine Peso, | | | | | | | | | | | | | | | | | | | | | | |
Expiring 12/15/21 | | Citibank, N.A. | | PHP | 44,660 | | | | 876,000 | | | | 881,707 | | | | — | | | | (5,707 | ) |
Expiring 12/15/21 | | Citibank, N.A. | | PHP | 19,764 | | | | 393,000 | | | | 390,191 | | | | 2,809 | | | | — | |
Expiring 12/15/21 | | Goldman Sachs International | | PHP | 32,585 | | | | 645,000 | | | | 643,319 | | | | 1,681 | | | | — | |
Expiring 12/15/21 | | JPMorgan Chase Bank, N.A. | | PHP | 38,927 | | | | 769,000 | | | | 768,514 | | | | 486 | | | | — | |
Expiring 12/15/21 | | JPMorgan Chase Bank, N.A. | | PHP | 19,419 | | | | 386,000 | | | | 383,371 | | | | 2,629 | | | | — | |
Russian Ruble, | | | | | | | | | | | | | | | | | | | | | | |
Expiring 11/22/21 | | Citibank, N.A. | | RUB | 41,475 | | | | 556,999 | | | | 582,084 | | | | — | | | | (25,085 | ) |
Expiring 11/22/21 | | Deutsche Bank AG | | RUB | 273,335 | | | | 3,606,000 | | | | 3,836,164 | | | | — | | | | (230,164 | ) |
Expiring 11/22/21 | | Deutsche Bank AG | | RUB | 14,383 | | | | 190,000 | | | | 201,861 | | | | — | | | | (11,861 | ) |
Expiring 12/15/21 | | Bank of America, N.A. | | RUB | 26,811 | | | | 364,000 | | | | 374,058 | | | | — | | | | (10,058 | ) |
Expiring 12/15/21 | | Bank of America, N.A. | | RUB | 19,290 | | | | 265,000 | | | | 269,124 | | | | — | | | | (4,124 | ) |
Expiring 12/15/21 | | Citibank, N.A. | | RUB | 52,617 | | | | 714,000 | | | | 734,102 | | | | — | | | | (20,102 | ) |
Expiring 12/15/21 | | Citibank, N.A. | | RUB | 45,984 | | | | 623,000 | | | | 641,560 | | | | — | | | | (18,560 | ) |
Expiring 12/15/21 | | Citibank, N.A. | | RUB | 44,037 | | | | 595,000 | | | | 614,392 | | | | — | | | | (19,392 | ) |
Expiring 12/15/21 | | Citibank, N.A. | | RUB | 29,455 | | | | 399,000 | | | | 410,946 | | | | — | | | | (11,946 | ) |
Expiring 12/15/21 | | Citibank, N.A. | | RUB | 21,627 | | | | 293,000 | | | | 301,732 | | | | — | | | | (8,732 | ) |
| | |
| See Notes to Financial Statements. |
| PGIM Absolute Return Bond Fund | | 57 |
Schedule of Investments (continued)
as of October 31, 2021
Forward foreign currency exchange contracts outstanding at October 31, 2021 (continued):
| | | | | | | | | | | | | | | | | | | | | | |
Sale Contracts | | Counterparty | | Notional
Amount
(000) | | | Value at
Settlement
Date | | | Current
Value | | | Unrealized
Appreciation | | | Unrealized
Depreciation | |
OTC Forward Foreign Currency Exchange Contracts (cont’d.): | |
Russian Ruble (cont’d.), | | | | | | | | | | | | | | | | | |
Expiring 12/15/21 | | Credit Suisse International | | RUB | 49,436 | | | $ | 670,000 | | | $ | 689,719 | | | $ | — | | | $ | (19,719 | ) |
Expiring 12/15/21 | | Credit Suisse International | | RUB | 37,609 | | | | 517,000 | | | | 524,707 | | | | — | | | | (7,707 | ) |
Expiring 12/15/21 | | Morgan Stanley & Co. International PLC | | RUB | 38,528 | | | | 521,000 | | | | 537,529 | | | | — | | | | (16,529 | ) |
Expiring 12/15/21 | | Morgan Stanley & Co. International PLC | | RUB | 35,399 | | | | 498,000 | | | | 493,879 | | | | 4,121 | | | | — | |
Expiring 12/15/21 | | Morgan Stanley & Co. International PLC | | RUB | 18,176 | | | | 244,000 | | | | 253,590 | | | | — | | | | (9,590 | ) |
Expiring 12/15/21 | | Standard Chartered Bank | | RUB | 37,687 | | | | 513,000 | | | | 525,804 | | | | — | | | | (12,804 | ) |
Expiring 12/15/21 | | Standard Chartered Bank | | RUB | 18,744 | | | | 254,000 | | | | 261,511 | | | | — | | | | (7,511 | ) |
Singapore Dollar, | | | | | | | | | | | | | | | | | | | | | | |
Expiring 12/15/21 | | BNP Paribas S.A. | | SGD | 846 | | | | 625,000 | | | | 627,586 | | | | — | | | | (2,586 | ) |
Expiring 12/15/21 | | Citibank, N.A. | | SGD | 547 | | | | 405,000 | | | | 405,712 | | | | — | | | | (712 | ) |
Expiring 12/15/21 | | Goldman Sachs International | | SGD | 11,835 | | | | 8,804,147 | | | | 8,774,332 | | | | 29,815 | | | | — | |
Expiring 12/15/21 | | Goldman Sachs International | | SGD | 894 | | | | 665,000 | | | | 662,578 | | | | 2,422 | | | | — | |
Expiring 12/15/21 | | Goldman Sachs International | | SGD | 546 | | | | 404,000 | | | | 404,923 | | | | — | | | | (923 | ) |
Expiring 12/15/21 | | JPMorgan Chase Bank, N.A. | | SGD | 1,043 | | | | 774,000 | | | | 773,591 | | | | 409 | | | | — | |
Expiring 12/15/21 | | JPMorgan Chase Bank, N.A. | | SGD | 811 | | | | 596,000 | | | | 601,426 | | | | — | | | | (5,426 | ) |
Expiring 12/15/21 | | JPMorgan Chase Bank, N.A. | | SGD | 808 | | | | 596,000 | | | | 598,769 | | | | — | | | | (2,769 | ) |
Expiring 12/15/21 | | JPMorgan Chase Bank, N.A. | | SGD | 568 | | | | 420,000 | | | | 421,460 | | | | — | | | | (1,460 | ) |
Expiring 12/15/21 | | UBS AG | | SGD | 934 | | | | 694,000 | | | | 692,299 | | | | 1,701 | | | | — | |
Expiring 12/15/21 | | UBS AG | | SGD | 890 | | | | 656,000 | | | | 659,809 | | | | — | | | | (3,809 | ) |
South African Rand, | | | | | | | | | | | | | | | | | | | | | | |
Expiring 12/15/21 | | Barclays Bank PLC | | ZAR | 80,810 | | | | 5,534,237 | | | | 5,259,380 | | | | 274,857 | | | | — | |
Expiring 12/15/21 | | Citibank, N.A. | | ZAR | 49,122 | | | | 3,397,708 | | | | 3,196,992 | | | | 200,716 | | | | — | |
Expiring 12/15/21 | | HSBC Bank PLC | | ZAR | 88,474 | | | | 6,132,717 | | | | 5,758,168 | | | | 374,549 | | | | — | |
Expiring 12/15/21 | | JPMorgan Chase Bank, N.A. | | ZAR | 9,109 | | | | 596,000 | | | | 592,855 | | | | 3,145 | | | | — | |
Expiring 12/15/21 | | JPMorgan Chase Bank, N.A. | | ZAR | 9,042 | | | | 595,000 | | | | 588,480 | | | | 6,520 | | | | — | |
Expiring 12/23/21 | | Barclays Bank PLC | | ZAR | 44,623 | | | | 2,407,116 | | | | 2,900,979 | | | | — | | | | (493,863 | ) |
|
See Notes to Financial Statements. 58 |
Forward foreign currency exchange contracts outstanding at October 31, 2021 (continued):
| | | | | | | | | | | | | | | | | | | | | | |
Sale Contracts | | Counterparty | | Notional
Amount
(000) | | | Value at
Settlement
Date | | | Current
Value | | | Unrealized
Appreciation | | | Unrealized
Depreciation | |
OTC Forward Foreign Currency Exchange Contracts (cont’d.): | |
South African Rand (cont’d.), | | | | | | | | | | | | | | | | | | | | |
Expiring 12/23/21 | | Goldman Sachs International | | ZAR | 7,752 | | | $ | 489,000 $ | | | | 503,945 | | | $ | — | | | $ | (14,945 | ) |
Expiring 12/23/21 | | Morgan Stanley & Co. International PLC | | ZAR | 20,862 | | | | 1,363,884 | | | | 1,356,251 | | | | 7,633 | | | | — | |
Expiring 05/31/22 | | JPMorgan Chase Bank, N.A. | | ZAR | 10,977 | | | | 652,000 | | | | 698,825 | | | | — | | | | (46,825 | ) |
Expiring 05/31/22 | | JPMorgan Chase Bank, N.A. | | ZAR | 7,904 | | | | 507,000 | | | | 503,147 | | | | 3,853 | | | | — | |
Thai Baht, | | | | | | | | | | | | | | | | | | | | | | |
Expiring 12/15/21 | | Citibank, N.A. | | THB | 16,460 | | | | 501,000 | | | | 495,884 | | | | 5,116 | | | | — | |
Expiring 12/15/21 | | Credit Suisse International | | THB | 4,322 | | | | 129,274 | | | | 130,205 | | | | — | | | | (931 | ) |
Expiring 12/15/21 | | HSBC Bank PLC | | THB | 137,641 | | | | 4,236,543 | | | | 4,146,697 | | | | 89,846 | | | | — | |
Expiring 12/15/21 | | JPMorgan Chase Bank, N.A. | | THB | 21,412 | | | | 640,000 | | | | 645,082 | | | | — | | | | (5,082 | ) |
Expiring 12/15/21 | | JPMorgan Chase Bank, N.A. | | THB | 17,212 | | | | 523,000 | | | | 518,542 | | | | 4,458 | | | | — | |
Expiring 12/15/21 | | JPMorgan Chase Bank, N.A. | | THB | 17,097 | | | | 512,000 | | | | 515,071 | | | | — | | | | (3,071 | ) |
Expiring 12/15/21 | | JPMorgan Chase Bank, N.A. | | THB | 17,058 | | | | 501,000 | | | | 513,898 | | | | — | | | | (12,898 | ) |
Expiring 12/15/21 | | Morgan Stanley & Co. International PLC | | THB | 15,502 | | | | 463,726 | | | | 467,024 | | | | — | | | | (3,298 | ) |
Expiring 12/15/21 | | Standard Chartered Bank | | THB | 38,421 | | | | 1,175,000 | | | | 1,157,515 | | | | 17,485 | | | | — | |
Expiring 12/15/21 | | Standard Chartered Bank | | THB | 30,758 | | | | 918,000 | | | | 926,631 | | | | — | | | | (8,631 | ) |
Expiring 12/15/21 | | Standard Chartered Bank | | THB | 29,650 | | | | 916,000 | | | | 893,274 | | | | 22,726 | | | | — | |
Expiring 12/15/21 | | Standard Chartered Bank | | THB | 23,793 | | | | 736,000 | | | | 716,799 | | | | 19,201 | | | | — | |
Turkish Lira, | | | | | | | | | | | | | | | | | | | | | | |
Expiring 12/15/21 | | Morgan Stanley & Co. International PLC | | TRY | 11,752 | | | | 1,345,558 | | | | 1,194,853 | | | | 150,705 | | | | — | |
| | | | | | | | | | | | | | | | | | | | | | |
| | | | | | | | $ | 327,560,032 | | | $ | 321,989,989 | | | | 7,956,300 | | | | (2,386,257 | ) |
| | | | | | | | | | | | | | | | | | | | | | |
| | | | | | | | | | | | | | | | $ | 11,230,918 | | | $ | (8,366,040 | ) |
| | | | | | | | | | | | | | | | | | | | | | |
| | |
| See Notes to Financial Statements. |
| PGIM Absolute Return Bond Fund | | 59 |
Schedule of Investments (continued)
as of October 31, 2021
Cross currency exchange contracts outstanding at October 31, 2021:
| | | | | | | | | | | | | | | | | | | | | | | | | | | | | | | | | | | | |
Settlement | | Type | | | Notional
Amount
(000) | | | In Exchange
For (000) | | | Unrealized
Appreciation | | | Unrealized
Depreciation | | | Counterparty | |
| | | | | | | | | | | | | | | | | | | | | | | | | | | | | | |
|
OTC Cross Currency Exchange Contracts: | |
01/28/22 | | | Buy | | | | JPY | | | | 95,923 | | | | AUD | | | | 1,415 | | | | | $ | — | | | | | $ | (222,127) | | | | Deutsche Bank AG | |
01/28/22 | | | Buy | | | | JPY | | | | 162,036 | | | | AUD | | | | 2,167 | | | | | | — | | | | | | (207,230) | | | | Deutsche Bank AG | |
01/28/22 | | | Buy | | | | JPY | | | | 274,921 | | | | AUD | | | | 3,510 | | | | | | — | | | | | | (226,196) | | | | BNP Paribas S.A. | |
05/31/22 | | | Buy | | | | AUD | | | | 4,921 | | | | JPY | | | | 375,226 | | | | | | 398,777 | | | | | | — | | | | Deutsche Bank AG | |
05/31/22 | | | Buy | | | | JPY | | | | 263,742 | | | | AUD | | | | 3,658 | | | | | | — | | | | | | (429,981) | | |
| Goldman Sachs
International |
|
10/31/23 | | | Buy | | | | AUD | | | | 6,309 | | | | JPY | | | | 422,703 | | | | | | 906,318 | | | | | | — | | | | Deutsche Bank AG | |
10/31/23 | | | Buy | | | | JPY | | | | 648,099 | | | | AUD | | | | 9,489 | | | | | | — | | | | | | (1,252,669) | | |
| Morgan Stanley & Co.
International PLC |
|
| | | | | | | | | | | | | | | | | | | | | | | | | | | | | | | | | | | | |
| | | | | | | | | | |
| | | | | | | | | | | | | | | | | | | | | | | | $ | 1,305,095 | | | | | $ | (2,338,203) | | | | | |
| | | | | | | | | | | | | | | | | | | | | | | | | | | | | | | | | | | | |
Credit default swap agreements outstanding at October 31, 2021:
| | | | | | | | | | | | | | | | | | | | | | | | | | | | | | | | | | | | | | | | |
Reference Entity/ Obligation | | Termination
Date | | | Fixed
Rate | | | Notional
Amount
(000)#(3) | | | Implied
Credit
Spread at
October 31,
2021(4) | | | Fair
Value | | Upfront
Premiums
Paid
(Received) | | Unrealized
Appreciation (Depreciation) | | Counterparty | |
| | | | | | | | | | | | | | | | | | | | | | | | | | |
OTC Credit Default Swap Agreement on asset-backed and/or mortgage-backed securities - Sell Protection(2)^: | |
GS_21-PJA†† | | | 11/14/21 | | | | 0.250%(M) | | | | 16,440 | | | | * | | | | | $3,996 | | | | | | $(799) | | | | | | $ | 4,795 | | | | | | Goldman Sachs International | |
| | | | | | | | | | | | | | | | | | | | | | | | | | | | | | | | | | | | | | | | |
| †† | The value of the contract, GS_21-PJA, is derived from a pool of senior prime jumbo mortgages. |
| | | | | | | | | | | | | | | | | | | | | | | | | | | | |
Reference Entity/ Obligation | | Termination
Date | | | Fixed
Rate | | | Notional
Amount
(000)#(3) | | | Fair
Value | | | Upfront
Premiums
Paid
(Received) | | | Unrealized
Appreciation
(Depreciation) | | | Counterparty | |
| | | | | | | | | | | | | | | | | | | | | | | | | | | | |
|
OTC Credit Default Swap Agreements on corporate and/or sovereign issues - Buy Protection(1): | |
Federal Republic of Brazil | | | 12/20/26 | | | | 1.000%(Q) | | | | 3,200 | | | $ | 218,478 | | | $ | 218,760 | | | $ | (282 | ) | | | Barclays Bank PLC | |
Republic of France | | | 12/20/26 | | | | 0.250%(Q) | | | | 1,225 | | | | (2,437 | ) | | | (2,479 | ) | | | 42 | | | | Deutsche Bank AG | |
United Mexican States | | | 06/20/23 | | | | 1.000%(Q) | | | | 1,400 | | | | (16,047 | ) | | | 2,908 | | | | (18,955 | ) | | | Citibank, N.A. | |
United Mexican States | | | 06/20/23 | | | | 1.000%(Q) | | | | 1,385 | | | | (15,875 | ) | | | 7,139 | | | | (23,014 | ) | | | Citibank, N.A. | |
United Mexican States | | | 06/20/23 | | | | 1.000%(Q) | | | | 460 | | | | (5,272 | ) | | | 2,660 | | | | (7,932 | ) | | | Citibank, N.A. | |
United Mexican States | | | 06/20/23 | | | | 1.000%(Q) | | | | 460 | | | | (5,273 | ) | | | 2,438 | | | | (7,711 | ) | | | Citibank, N.A. | |
United Mexican States | | | 06/20/23 | | | | 1.000%(Q) | | | | 455 | | | | (5,215 | ) | | | 879 | | | | (6,094 | ) | | | Citibank, N.A. | |
United Mexican States | | | 06/20/23 | | | | 1.000%(Q) | | | | 240 | | | | (2,750 | ) | | | 499 | | | | (3,249 | ) | | | Citibank, N.A. | |
|
See Notes to Financial Statements. 60 |
Credit default swap agreements outstanding at October 31, 2021 (continued):
| | | | | | | | | | | | | | | | | | | | | | | | | | | | | | | | | | |
Reference Entity/ Obligation | | Termination
Date | | | Fixed
Rate | | | Notional
Amount
(000)#(3) | | | Fair
Value | | | Upfront Premiums Paid (Received) | | | Unrealized
Appreciation
(Depreciation) | | | Counterparty |
| | | | | | | | | | | | | | | | | | | | | | | | | |
|
OTC Credit Default Swap Agreements on corporate and/or sovereign issues - Buy Protection(1)(cont’d.): |
United Mexican States | | | 12/20/24 | | | | 1.000%(Q) | | | | 1,000 | | | $ | (14,233 | ) | | | | $ | (7,465 | ) | | | | $ | (6,768 | ) | | | | | | Barclays Bank PLC |
United Mexican States | | | 12/20/24 | | | | 1.000%(Q) | | | | 440 | | | | (6,263 | ) | | | | | 1,944 | | | | | | (8,207 | ) | | | | | | Citibank, N.A. |
| | | | | | | | | | | | | | | | | | | | | | | | | | | | | | | | | | |
| | | | | | | | | | | | | | $ | 145,113 | | | | | $ | 227,283 | | | | | $ | (82,170 | ) | | | | | | |
| | | | | | | | | | | | | | | | | | | | | | | | | | | | | | | | | | |
| | | | | | | | | | | | | | | | | | | | | | | | | | | | | | | | |
Reference Entity/ Obligation | | Termination
Date | | Fixed Rate | | Notional
Amount
(000)#(3) | | Implied
Credit
Spread at
October 31,
2021(4) | | Fair
Value | | Upfront Premiums Paid (Received) | | | Unrealized Appreciation (Depreciation) | | | Counterparty |
| | | | | | | | | | | | | | | | | | | | | | | | | |
OTC Credit Default Swap Agreements on corporate and/or sovereign issues - Sell Protection(2): |
AT&T Inc. | | 06/20/22 | | 1.000%(Q) | | | 2,810 | | | 0.256% | | $ | 16,851 | | | $ | 13,878 | | | | | | | $ | 2,973 | | | | | | | Goldman Sachs International |
Bank of America Corp. | | 06/20/22 | | 1.000%(Q) | | | 4,690 | | | 0.207% | | | 29,616 | | | | 23,465 | | | | | | | | 6,151 | | | | | | | Goldman Sachs International |
Boeing Co. | | 12/20/21 | | 1.000%(Q) | | | 5,300 | | | 0.331% | | | 11,301 | | | | 3,870 | | | | | | | | 7,431 | | | | | | | Bank of America, N.A. |
Boeing Co. | | 06/20/24 | | 1.000%(Q) | | | 1,460 | | | 0.674% | | | 14,239 | | | | 5,323 | | | | | | | | 8,916 | | | | | | | Goldman Sachs International |
Casino Guichard Perrachon SA | | 06/20/24 | | 5.000%(Q) | | EUR | 1,490 | | | 5.042% | | | 8,250 | | | | 25,471 | | | | | | | | (17,221 | ) | | | | | | Goldman Sachs International |
Casino Guichard Perrachon SA | | 06/20/24 | | 5.000%(Q) | | EUR | 220 | | | 5.042% | | | 1,218 | | | | 3,900 | | | | | | | | (2,682 | ) | | | | | | Goldman Sachs International |
Citigroup, Inc. | | 06/20/22 | | 1.000%(Q) | | | 2,920 | | | 0.244% | | | 17,739 | | | | 14,422 | | | | | | | | 3,317 | | | | | | | Goldman Sachs International |
Delta Air Lines, Inc. | | 06/20/22 | | 5.000%(Q) | | | 680 | | | 0.719% | | | 22,821 | | | | 17,339 | | | | | | | | 5,482 | | | | | | | Credit Suisse International |
Devon Energy Corp. | | 12/20/21 | | 1.000%(Q) | | | 2,000 | | | 0.333% | | | 4,260 | | | | 1,832 | | | | | | | | 2,428 | | | | | | | Barclays Bank PLC |
Devon Energy Corp. | | 12/20/21 | | 1.000%(Q) | | | 1,390 | | | 0.333% | | | 2,961 | | | | 1,437 | | | | | | | | 1,524 | | | | | | | Goldman Sachs International |
Devon Energy Corp. | | 12/20/21 | | 1.000%(Q) | | | 1,000 | | | 0.333% | | | 2,129 | | | | 915 | | | | | | | | 1,214 | | | | | | | Morgan Stanley & Co. International PLC |
Electricite de France SA | | 12/20/22 | | 1.000%(Q) | | EUR | 1,820 | | | 0.148% | | | 23,275 | | | | 19,033 | | | | | | | | 4,242 | | | | | | | Goldman Sachs International |
EQT Corp. | | 06/20/22 | | 5.000%(Q) | | | 770 | | | 1.068% | | | 24,057 | | | | 17,693 | | | | | | | | 6,364 | | | | | | | Credit Suisse International |
General Electric Co. | | 06/20/22 | | 1.000%(Q) | | | 2,780 | | | 0.164% | | | 18,326 | | | | 12,466 | | | | | | | | 5,860 | | | | | | | Morgan Stanley & Co. International PLC |
| | |
| See Notes to Financial Statements. |
| PGIM Absolute Return Bond Fund | | 61 |
Schedule of Investments (continued)
as of October 31, 2021
Credit default swap agreements outstanding at October 31, 2021 (continued):
| | | | | | | | | | | | | | | | | | | | | | | | | | | | | | | | | | |
Reference Entity/ Obligation | | Termination
Date | | Fixed
Rate | | | Notional
Amount
(000)#(3) | | Implied
Credit
Spread at
October 31,
2021(4) | | Fair
Value | | Upfront
Premiums
Paid
(Received) | | Unrealized
Appreciation
(Depreciation) | | | Counterparty |
| | | | | | | | | | | | | | | | | | | | | | | | | | | | | | | | | | | |
OTC Credit Default Swap Agreements on corporate and/or sovereign issues - Sell Protection(2)(cont’d.): |
General Motors Co. | | 06/20/26 | | | 5.000%(Q) | | | | 2,230 | | | 0.906% | | $ | 424,333 | | | $ | 403,216 | | | | | | | $ | 21,117 | | | | | | | Goldman Sachs International |
Goldman Sachs Group, Inc. (The) | | 12/20/21 | | | 1.000%(Q) | | | | 2,250 | | | 0.243% | | | 5,083 | | | | 2,479 | | | | | | | | 2,604 | | | | | | | Barclays Bank PLC |
Halliburton Co. | | 12/20/26 | | | 1.000%(Q) | | | | 910 | | | 0.713% | | | 14,089 | | | | 8,963 | | | | | | | | 5,126 | | | | | | | Goldman Sachs International |
Host Hotels & Resorts LP | | 06/20/24 | | | 1.000%(Q) | | | | 500 | | | 0.588% | | | 6,007 | | | | 5,110 | | | | | | | | 897 | | | | | | | Goldman Sachs International |
JPMorgan Chase & Co. | | 12/20/21 | | | 1.000%(Q) | | | | 1,500 | | | 0.206% | | | 3,469 | | | | 1,756 | | | | | | | | 1,713 | | | | | | | Barclays Bank PLC |
Naturgy Energy Group SA | | 06/20/22 | | | 1.000%(Q) | | | | EUR 4,950 | | | 0.192% | | | 36,777 | | | | 28,075 | | | | | | | | 8,702 | | | | | | | Goldman Sachs International |
Ovintiv, Inc. | | 12/20/21 | | | 1.000%(Q) | | | | 1,140 | | | 0.367% | | | 2,372 | | | | 1,044 | | | | | | | | 1,328 | | | | | | | Barclays Bank PLC |
Petroleos Mexicanos | | 06/20/23 | | | 1.000%(Q) | | | | 9,450 | | | 1.708% | | | (98,385 | ) | | | (464,085 | ) | | | | | | | 365,700 | | | | | | | BNP Paribas S.A. |
Petroleos Mexicanos | | 06/20/23 | | | 1.000%(Q) | | | | 1,165 | | | 1.708% | | | (12,129 | ) | | | (24,403 | ) | | | | | | | 12,274 | | | | | | | Citibank, N.A. |
Petroleos Mexicanos | | 06/20/23 | | | 1.000%(Q) | | | | 1,155 | | | 1.708% | | | (12,025 | ) | | | (29,041 | ) | | | | | | | 17,016 | | | | | | | Citibank, N.A. |
Petroleos Mexicanos | | 06/20/23 | | | 1.000%(Q) | | | | 385 | | | 1.708% | | | (4,008 | ) | | | (9,920 | ) | | | | | | | 5,912 | | | | | | | Citibank, N.A. |
Petroleos Mexicanos | | 06/20/23 | | | 1.000%(Q) | | | | 385 | | | 1.708% | | | (4,009 | ) | | | (9,741 | ) | | | | | | | 5,732 | | | | | | | Citibank, N.A. |
Petroleos Mexicanos | | 06/20/23 | | | 1.000%(Q) | | | | 380 | | | 1.708% | | | (3,956 | ) | | | (7,997 | ) | | | | | | | 4,041 | | | | | | | Citibank, N.A. |
Petroleos Mexicanos | | 06/20/23 | | | 1.000%(Q) | | | | 195 | | | 1.708% | | | (2,030 | ) | | | (4,082 | ) | | | | | | | 2,052 | | | | | | | Citibank, N.A. |
Petroleos Mexicanos | | 12/20/24 | | | 1.000%(Q) | | | | 1,000 | | | 2.372% | | | (40,507 | ) | | | (32,755 | ) | | | | | | | (7,752 | ) | | | | | | Barclays Bank PLC |
Petroleos Mexicanos | | 12/20/24 | | | 1.000%(Q) | | | | 440 | | | 2.372% | | | (17,824 | ) | | | (26,043 | ) | | | | | | | 8,219 | | | | | | | Citibank, N.A. |
Pioneer Natural Resources Co. | | 06/20/22 | | | 1.000%(Q) | | | | 3,750 | | | 0.156% | | | 24,924 | | | | 19,004 | | | | | | | | 5,920 | | | | | | | Goldman Sachs International |
Republic of France | | 12/20/26 | | | 0.250%(Q) | | | | 1,225 | | | 0.217% | | | 2,438 | | | | 9,812 | | | | | | | | (7,374 | ) | | | | | | Deutsche Bank AG |
Simon Property Group LP | | 06/20/26 | | | 1.000%(Q) | | | | 1,980 | | | 0.578% | | | 40,319 | | | | 21,324 | | | | | | | | 18,995 | | | | | | | Goldman Sachs International |
|
See Notes to Financial Statements. 62 |
Credit default swap agreements outstanding at October 31, 2021 (continued):
| | | | | | | | | | | | | | | | | | | | | | | | | | | | | | | | | | | | | | |
Reference Entity/ Obligation | | Termination
Date | | | Fixed
Rate | | | Notional
Amount
(000)#(3) | | | Implied
Credit
Spread at
October 31,
2021(4) | | | Fair
Value | | | Upfront Premiums Paid (Received) | | | Unrealized Appreciation (Depreciation) | | | Counterparty |
| | | | | | | | | | | | | | | | | | | | | | | | | | | | | | | | | | | | | | | |
OTC Credit Default Swap Agreements on corporate and/or sovereign issues - Sell Protection(2)(cont’d.): |
Teva Pharmaceutical Industries Ltd. | | | 12/20/21 | | | | 1.000%(Q) | | | | 190 | | | | 1.111% | | | $ | 192 | | | | | | | $ | 65 | | | | | | | $ | 127 | | | Barclays Bank PLC |
T-Mobile USA, Inc. | | | 12/20/21 | | | | 5.000%(Q) | | | | 730 | | | | 0.488% | | | | 9,012 | | | | | | | | 4,682 | | | | | | | | 4,330 | | | Barclays Bank PLC |
Verizon Communications, Inc. | | | 06/20/26 | | | | 1.000%(Q) | | | | 680 | | | | 0.488% | | | | 16,676 | | | | | | | | 13,226 | | | | | | | | 3,450 | | | Goldman Sachs International |
| | | | | | | | | | | | | | | | | | | | | | | | | | | | | | | | | | | | | | |
| | | | | | | | | | |
| | | | | | | | | | | | | | | | | | $ | 587,861 | | | | | | | $ | 71,733 | | | | | | | $ | 516,128 | | | |
| | | | | | | | | | | | | | | | | | | | | | | | | | | | | | | | | | | | | | |
| | | | | | | | | | | | | | | | | | | | | | | | | | | | | | |
Reference Entity/ Obligation | | Termination
Date | | Fixed
Rate | | Notional
Amount
(000)#(3) | | Value at
Trade Date | | Value at
October 31,
2021 | | Unrealized
Appreciation
(Depreciation) |
| | | | | | | | | | | | | | | | | | | | | | | | | | | | | | | |
Centrally Cleared Credit Default Swap Agreement on credit indices - Buy Protection(1): | |
CDX.NA.IG.37.V1 | | | | 12/20/26 | | | | | 1.000 | %(Q) | | | | 54,460 | | | | $ | (1,336,962 | ) | | | $ | (1,361,453 | ) | | | $ | (24,491 | ) |
| | | | | | | | | | | | | | | | | | | | | | | | | | | | | | |
| | | | | | | | | | | | | | | | | | | | | | | | | | | | |
Reference Entity/ Obligation | | Termination
Date | | | Fixed
Rate | | | Notional
Amount
(000)#(3) | | | Fair
Value | | | Upfront
Premiums
Paid
(Received) | | | Unrealized Appreciation (Depreciation) | | | Counterparty |
| | | | | | | | | | | | | | | | | | | | | | | | | | |
OTC Credit Default Swap Agreements on credit indices - Buy Protection(1): |
CMBX.NA.13.AAA | | | 12/16/72 | | | | 0.500%(M) | | | | 25,000 | | | $ | (59,316 | ) | | $ | 697,453 | | | | | $ | (756,769 | ) | | Morgan Stanley &Co. International PLC |
CMBX.NA.13.AAA | | | 12/16/72 | | | | 0.500%(M) | | | | 22,500 | | | | (53,384 | ) | | | 234,238 | | | | | | (287,622 | ) | | Citigroup Global Markets, Inc. |
CMBX.NA.13.AAA | | | 12/16/72 | | | | 0.500%(M) | | | | 10,000 | | | | (23,727 | ) | | | 200,175 | | | | | | (223,902 | ) | | Goldman Sachs International |
CMBX.NA.13.AAA | | | 12/16/72 | | | | 0.500%(M) | | | | 7,000 | | | | (17,484 | ) | | | 33,431 | | | | | | (50,915 | ) | | Morgan Stanley &Co. International PLC |
| | | | | | | | | | | | | | | | | | | | | | | | | | | | |
| | | | | | | | | | | | | | $ | (153,911 | ) | | $ | 1,165,297 | | | | | $ | (1,319,208 | ) | | |
| | | | | | | | | | | | | | | | | | | | | | | | | | | | |
The Fund entered into credit default swaps (“CDS”) to provide a measure of protection against defaults or to take an active long or short position with respect to the likelihood of a particular issuer’s default or the reference entity’s credit soundness.
| | |
| See Notes to Financial Statements. |
| PGIM Absolute Return Bond Fund | | 63 |
Schedule of Investments (continued)
as of October 31, 2021
CDS contracts generally trade based on a spread which represents the cost a protection buyer has to pay the protection seller. The protection buyer is said to be short the credit as the value of the contract rises the more the credit deteriorates. The value of the CDS contract increases for the protection buyer if the spread increases.
| (1) | If the Fund is a buyer of protection, it pays the fixed rate. When a credit event occurs, as defined under the terms of that particular swap agreement, the Fund will either (i) receive from the seller of protection an amount equal to the notional amount of the swap and make delivery of the referenced obligation or underlying securities comprising the referenced index or (ii) receive a net settlement amount in the form of cash or securities equal to the notional amount of the swap less the recovery value of the referenced obligation or underlying securities comprising the referenced index. |
| (2) | If the Fund is a seller of protection, it receives the fixed rate. When a credit event occurs, as defined under the terms of that particular swap agreement, the Fund will either (i) pay to the buyer of protection an amount equal to the notional amount of the swap and take delivery of the referenced obligation or underlying securities comprising the referenced index or (ii) pay a net settlement amount in the form of cash or securities equal to the notional amount of the swap less the recovery value of the referenced obligation or underlying securities comprising the referenced index. |
| (3) | Notional amount represents the maximum potential amount the Fund could be required to pay as a seller of credit protection or receive as a buyer of credit protection if a credit event occurs as defined under the terms of that particular swap agreement. |
| (4) | Implied credit spreads, represented in absolute terms, utilized in determining the fair value of credit default swap agreements where the Fund is the seller of protection as of the reporting date serve as an indicator of the current status of the payment/ performance risk and represent the likelihood of risk of default for the credit derivative. The implied credit spread of a particular referenced entity reflects the cost of buying/selling protection and may include up-front payments required to be made to enter into the agreement. Wider credit spreads represent a deterioration of the referenced entity’s credit soundness and a greater likelihood of risk of default or other credit event occurring as defined under the terms of the agreement. |
| * | When an implied credit spread is not available, reference the fair value of credit default swap agreements on credit indices and asset-backed securities. Where the Fund is the seller of protection, it serves as an indicator of the current status of the payment/performance risk and represents the likelihood of an expected liability (or profit) for the credit derivative should the notional amount of the swap agreement be closed/sold as of the reporting date. Increasing fair value in absolute terms, when compared to the notional amount of the swap, represents a deterioration of the referenced entity’s credit soundness and a greater likelihood of risk of default or other credit event occurring as defined under the terms of the agreement. |
Inflation swap agreements outstanding at October 31, 2021:
| | | | | | | | | | | | | | | | | | | | |
Notional
Amount
(000)# | | | Termination Date | | Fixed
Rate | | | Floating Rate | | Value at Trade Date | | Value at
October 31,
2021 | | Unrealized Appreciation (Depreciation) |
| | | | | | | | | | | | | | | | | |
| | Centrally Cleared Inflation Swap Agreements: |
| | 3,095 | | | 01/12/26 | | | 2.185%(T) | | | U.S. CPI Urban Consumers NSA Index(2)(T) | | | | $— | | | | $ (233,498) | | $ (233,498) |
|
See Notes to Financial Statements. 64 |
Inflation swap agreements outstanding at October 31, 2021 (continued):
| | | | | | | | | | | | | | | | | | | | | | | | | | | | | | | | | | | | | | | | | | | | | | | | |
Notional
Amount
(000)# | | | Termination
Date | | | Fixed
Rate | | | Floating Rate | | Value at Trade Date | | | Value at October 31, 2021 | | | Unrealized
Appreciation
(Depreciation) | |
| | | | | | | | | | | | | | | | | | | | | | | | | | | | | | | | | | | | | | | | | | | | | | | | |
| | Centrally Cleared Inflation Swap Agreements (cont’d): | | | | | |
| | 800 | | | | 01/13/31 | | | | 2.229%(T) | | | U.S. CPI Urban Consumers NSA Index(2)(T) | | | | | | $ | — | | | | | | | | | | | $ | (72,223 | ) | | | | | | | | | | $ | (72,223 | ) | | | | |
| | 2,650 | | | | 01/13/31 | | | | 2.230%(T) | | | U.S. CPI Urban Consumers NSA Index(2)(T) | | | | | | | — | | | | | | | | | | | | (238,951 | ) | | | | | | | | | | | (238,951 | ) | | | | |
| | 3,710 | | | | 04/07/31 | | | | 2.469%(T) | | | U.S. CPI Urban Consumers NSA Index(2)(T) | | | | | | | — | | | | | | | | | | | | (227,019 | ) | | | | | | | | | | | (227,019 | ) | | | | |
| | 1,050 | | | | 04/09/31 | | | | 2.435%(T) | | | U.S. CPI Urban Consumers NSA Index(2)(T) | | | | | | | — | | | | | | | | | | | | (68,003 | ) | | | | | | | | | | | (68,003 | ) | | | | |
| | 2,110 | | | | 04/09/31 | | | | 2.448%(T) | | | U.S. CPI Urban Consumers NSA Index(2)(T) | | | | | | | — | | | | | | | | | | | | (133,756 | ) | | | | | | | | | | | (133,756 | ) | | | | |
| | 2,170 | | | | 04/13/31 | | | | 2.445%(T) | | | U.S. CPI Urban Consumers NSA Index(2)(T) | | | | | | | — | | | | | | | | | | | | (137,718 | ) | | | | | | | | | | | (137,718 | ) | | | | |
| | 1,330 | | | | 04/13/31 | | | | 2.450%(T) | | | U.S. CPI Urban Consumers NSA Index(2)(T) | | | | | | | — | | | | | | | | | | | | (83,677 | ) | | | | | | | | | | | (83,677 | ) | | | | |
| | 1,355 | | | | 04/14/31 | | | | 2.450%(T) | | | U.S. CPI Urban Consumers NSA Index(2)(T) | | | | | | | — | | | | | | | | | | | | (85,058 | ) | | | | | | | | | | | (85,058 | ) | | | | |
| | 1,120 | | | | 04/15/31 | | | | 2.460%(T) | | | U.S. CPI Urban Consumers NSA Index(2)(T) | | | | | | | — | | | | | | | | | | | | (68,998 | ) | | | | | | | | | | | (68,998 | ) | | | | |
| | 2,165 | | | | 04/15/31 | | | | 2.465%(T) | | | U.S. CPI Urban Consumers NSA Index(2)(T) | | | | | | | — | | | | | | | | | | | | (132,184 | ) | | | | | | | | | | | (132,184 | ) | | | | |
| | | | | | | | | | | | | | | | | | | | | | | | | | | | | | | | | | | | | | | | | | | | | | | | |
| | | | | | | | | | | | | | | | | | $ | — | | | | | | | | | | | $ | (1,481,085 | ) | | | | | | | | | | $ | (1,481,085 | ) | | | | |
| | | | | | | | | | | | | | | | | | | | | | | | | | | | | | | | | | | | | | | | | | | | | | | | |
| (1) | The Fund pays the fixed rate and receives the floating rate. |
| (2) | The Fund pays the floating rate and receives the fixed rate. |
Interest rate swap agreements outstanding at October 31, 2021:
| | | | | | | | | | | | | | | | | | |
Notional
Amount
(000)# | | Termination Date | | Fixed
Rate | | Floating Rate | | Value at Trade Date | | | Value at
October 31,
2021 | | | Unrealized Appreciation (Depreciation) | |
| | | | | | | | | | | | | | | | | | | |
Centrally Cleared Interest Rate Swap Agreements: | |
| BRL 66,745 | | 01/02/25 | | 5.902%(T) | | 1 Day BROIS(2)(T) | | $ | — | | | $ | (1,539,413 | ) | | | $ (1,539,413) | |
| BRL 24,233 | | 01/02/25 | | 6.343%(T) | | 1 Day BROIS(2)(T) | | | — | | | | (605,127 | ) | | | (605,127) | |
| | |
| See Notes to Financial Statements. |
| PGIM Absolute Return Bond Fund | | 65 |
Schedule of Investments (continued)
as of October 31, 2021
Interest rate swap agreements outstanding at October 31, 2021 (continued):
| | | | | | | | | | | | | | | | | | | | | | |
Notional Amount (000)# | | | Termination
Date | | | Fixed Rate | | Floating Rate | | Value at Trade Date | | | Value at October 31, 2021 | | | Unrealized Appreciation (Depreciation) | |
| | | | | | | | | | | | | | | | | |
|
| Centrally Cleared Interest Rate Swap Agreements (cont’d.): | |
| BRL | 25,971 | | | | 01/02/25 | | | 6.343%(T) | | 1 Day BROIS(2)(T) | | $ | — | | | $ | (649,848 | ) | | $ | (649,848 | ) |
| BRL | 41,334 | | | | 01/02/25 | | | 6.359%(T) | | 1 Day BROIS(2)(T) | | | — | | | | (1,031,249 | ) | | | (1,031,249 | ) |
| BRL | 18,614 | | | | 01/02/25 | | | 6.640%(T) | | 1 Day BROIS(2)(T) | | | — | | | | (311,694 | ) | | | (311,694 | ) |
| BRL | 21,128 | | | | 01/02/25 | | | 6.670%(T) | | 1 Day BROIS(2)(T) | | | — | | | | (347,908 | ) | | | (347,908 | ) |
| BRL | 13,418 | | | | 01/04/27 | | | 6.845%(T) | | 1 Day BROIS(2)(T) | | | — | | | | (491,137 | ) | | | (491,137 | ) |
| BRL | 8,342 | | | | 01/04/27 | | | 6.890%(T) | | 1 Day BROIS(2)(T) | | | — | | | | (302,389 | ) | | | (302,389 | ) |
| BRL | 14,674 | | | | 01/04/27 | | | 6.890%(T) | | 1 Day BROIS(2)(T) | | | — | | | | (532,669 | ) | | | (532,669 | ) |
| BRL | 17,000 | | | | 01/04/27 | | | 6.912%(T) | | 1 Day BROIS(2)(T) | | | — | | | | (511,726 | ) | | | (511,726 | ) |
| CLP | 14,295,000 | | | | 01/25/26 | | | 1.634%(S) | | 1 Day CLOIS(2)(S) | | | — | | | | (2,483,100 | ) | | | (2,483,100 | ) |
| COP | 11,070,000 | | | | 02/18/25 | | | 4.505%(Q) | | 1 Day COOIS(2)(Q) | | | — | | | | (101,965 | ) | | | (101,965 | ) |
| COP | 12,642,920 | | | | 02/21/25 | | | 4.565%(Q) | | 1 Day COOIS(2)(Q) | | | — | | | | (111,707 | ) | | | (111,707 | ) |
| COP | 7,380,000 | | | | 01/20/26 | | | 3.085%(Q) | | 1 Day COOIS(2)(Q) | | | — | | | | (215,692 | ) | | | (215,692 | ) |
| COP | 11,208,000 | | | | 02/03/26 | | | 3.080%(Q) | | 1 Day COOIS(2)(Q) | | | — | | | | (322,895 | ) | | | (322,895 | ) |
| COP | 7,821,000 | | | | 02/18/30 | | | 5.072%(Q) | | 1 Day COOIS(2)(Q) | | | — | | | | (170,018 | ) | | | (170,018 | ) |
| COP | 5,472,000 | | | | 02/18/30 | | | 5.081%(Q) | | 1 Day COOIS(2)(Q) | | | — | | | | (118,028 | ) | | | (118,028 | ) |
| COP | 7,813,000 | | | | 02/24/30 | | | 5.078%(Q) | | 1 Day COOIS(2)(Q) | | | — | | | | (170,588 | ) | | | (170,588 | ) |
| GBP | 6,090 | | | | 05/08/26 | | | 1.000%(A) | | 1 Day SONIA(1)(A) | | | (84,366 | ) | | | (13,139 | ) | | | 71,227 | |
| GBP | 1,340 | | | | 05/08/31 | | | 1.150%(A) | | 1 Day SONIA(1)(A) | | | (30,882 | ) | | | (38,378 | ) | | | (7,496 | ) |
| HUF | 2,500,000 | | | | 02/14/30 | | | 1.605%(A) | | 6 Month BUBOR(2)(S) | | | — | | | | (1,167,856 | ) | | | (1,167,856 | ) |
| MXN | 81,700 | | | | 01/12/28 | | | 5.020%(M) | | 28 Day Mexican Interbank Rate(2)(M) | | | (58 | ) | | | (514,069 | ) | | | (514,011 | ) |
|
See Notes to Financial Statements. 66 |
Interest rate swap agreements outstanding at October 31, 2021 (continued):
| | | | | | | | | | | | | | | | | | | | | | | | |
Notional
Amount
(000)# | | | Termination
Date | | | Fixed
Rate | | | Floating Rate | | Value at
Trade Date | | | Value at
October 31,
2021 | | | Unrealized Appreciation (Depreciation) | |
| | | | |
|
|
| |
|
|
| | | |
|
|
| |
|
|
| |
|
|
|
| |
| Centrally Cleared Interest Rate Swap Agreements (cont’d.): | | | | |
| MXN | 11,550 | | | | 01/03/31 | | | | 5.550%(M) | | | 28 Day Mexican Interbank Rate(2)(M) | | $ | (50 | ) | | $ | (79,063 | ) | | $ | (79,013 | ) |
| MXN | 32,290 | | | | 01/13/31 | | | | 5.460%(M) | | | 28 Day Mexican Interbank Rate(2)(M) | | | (42 | ) | | | (230,841 | ) | | | (230,799 | ) |
| MXN | 112,300 | | | | 01/15/31 | | | | 5.450%(M) | | | 28 Day Mexican Interbank Rate(2)(M) | | | (144 | ) | | | (807,188 | ) | | | (807,044 | ) |
| MXN | 28,860 | | | | 01/03/33 | | | | 5.715%(M) | | | 28 Day Mexican Interbank Rate(2)(M) | | | (48 | ) | | | (215,458 | ) | | | (215,410 | ) |
| MXN | 8,665 | | | | 12/28/35 | | | | 6.000%(M) | | | 28 Day Mexican Interbank Rate(2)(M) | | | (53 | ) | | | (69,779 | ) | | | (69,726 | ) |
| NZD | 6,000 | | | | 02/14/30 | | | | 1.522%(S) | | | 3 Month BBR(2)(Q) | | | — | | | | (372,286 | ) | | | (372,286 | ) |
| NZD | 1,600 | | | | 01/19/31 | | | | 1.090%(S) | | | 3 Month BBR(2)(Q) | | | — | | | | (150,504 | ) | | | (150,504 | ) |
| NZD | 5,740 | | | | 01/19/31 | | | | 1.096%(S) | | | 3 Month BBR(2)(Q) | | | 2,454 | | | | (537,817 | ) | | | (540,271 | ) |
| NZD | 2,100 | | | | 01/26/31 | | | | 1.098%(S) | | | 3 Month BBR(2)(Q) | | | — | | | | (197,174 | ) | | | (197,174 | ) |
| PLN | 7,000 | | | | 01/19/31 | | | | 1.200%(A) | | | 6 Month WIBOR(2)(S) | | | 2,551 | | | | (205,815 | ) | | | (208,366 | ) |
| PLN | 26,290 | | | | 01/21/31 | | | | 1.170%(A) | | | 6 Month WIBOR(2)(S) | | | (21,990 | ) | | | (791,131 | ) | | | (769,141 | ) |
| PLN | 1,650 | | | | 08/02/31 | | | | 1.650%(S) | | | 6 Month WIBOR(2)(A) | | | (4,034 | ) | | | (37,782 | ) | | | (33,748 | ) |
| | 7,400 | | | | 08/15/28 | | | | 1.220%(A) | | | 1 DAY SOFR(1)(A) | | | — | | | | (22,179 | ) | | | (22,179 | ) |
| ZAR | 99,200 | | | | 02/28/30 | | | | 7.500%(Q) | | | 3 Month JIBAR(2)(Q) | | | (25,545 | ) | | | (3,161 | ) | | | 22,384 | |
| ZAR | 54,300 | | | | 03/12/30 | | | | 7.840%(Q) | | | 3 Month JIBAR(2)(Q) | | | (425 | ) | | | 68,391 | | | | 68,816 | |
| ZAR | 100,000 | | | | 03/18/30 | | | | 10.650%(Q) | | | 3 Month JIBAR(2)(Q) | | | — | | | | 378,368 | | | | 378,368 | |
| ZAR | 10,700 | | | | 03/27/30 | | | | 9.150%(Q) | | | 3 Month JIBAR(2)(Q) | | | (190 | ) | | | 70,420 | | | | 70,610 | |
| ZAR | 114,100 | | | | 07/07/30 | | | | 7.040%(Q) | | | 3 Month JIBAR(2)(Q) | | | (2,775 | ) | | | (290,045 | ) | | | (287,270 | ) |
| ZAR | 7,000 | | | | 08/03/30 | | | | 7.030%(Q) | | | 3 Month JIBAR(2)(Q) | | | (96 | ) | | | (15,872 | ) | | | (15,776 | ) |
| | |
| See Notes to Financial Statements. |
| PGIM Absolute Return Bond Fund | | 67 |
Schedule of Investments (continued)
as of October 31, 2021
Interest rate swap agreements outstanding at October 31, 2021 (continued):
| | | | | | | | | | | | | | | | | | | | | | | | |
Notional Amount (000)# | | | Termination Date | | | Fixed Rate | | | Floating Rate | | Value at Trade Date | | | Value at October 31, 2021 | | | Unrealized Appreciation (Depreciation) | |
| | | | | | | | | | | | | | | | | | |
| | |
| Centrally Cleared Interest Rate Swap Agreements (cont’d.): | | | | | | | |
| ZAR | 3,800 | | | | 01/15/31 | | | | 6.765%(Q) | | | 3 Month JIBAR(2)(Q) | | $ | (79 | ) | | $ | (16,323 | ) | | $ | (16,244 | ) |
| ZAR | 19,300 | | | | 10/28/31 | | | | 7.780%(Q) | | | 3 Month JIBAR(2)(Q) | | | (4,243 | ) | | | 425 | | | | 4,668 | |
| | | | | | | | | | | | | | | | | | | | | | | | |
| | | | | | |
| | | | | | | | | | | | | | $ | (170,015 | ) | | $ | (15,275,409 | ) | | $ | (15,105,394 | ) |
| | | | | | | | | | | | | | | | | | | | | | | | |
| (1) | The Fund pays the fixed rate and receives the floating rate. |
| (2) | The Fund pays the floating rate and receives the fixed rate. |
Balances Reported in the Statement of Assets and Liabilities for OTC Swap Agreements:
| | | | | | | | | | | | | | | | | | | | |
| | | Premiums Paid | | Premiums Received | | Unrealized Appreciation | | Unrealized Depreciation |
| | | | |
OTC Swap Agreements | | | $ | 2,082,324 | | | | $ | (618,810 | ) | | | $ | 555,994 | | | | $ | (1,436,449 | ) |
Summary of Collateral for Centrally Cleared/Exchange-traded Derivatives:
Cash and securities segregated as collateral, including pending settlement for closed positions, to cover requirements for centrally cleared/exchange-traded derivatives are listed by broker as follows:
| | | | | | | | | | |
Broker | | Cash and/or Foreign Currency | | Securities Market Value |
| | |
| Citigroup Global Markets, Inc. | | | $ | 7,429,000 | | | | $ | 6,320,771 | |
| | | | | | | | | | |
Fair Value Measurements:
Various inputs are used in determining the value of the Fund’s investments. These inputs are summarized in the three broad levels listed below.
Level 1—unadjusted quoted prices generally in active markets for identical securities.
Level 2—quoted prices for similar securities, interest rates and yield curves, prepayment speeds, foreign currency exchange rates and other observable inputs.
Level 3—unobservable inputs for securities valued in accordance with Board approved fair valuation procedures.
|
See Notes to Financial Statements. 68 |
The following is a summary of the inputs used as of October 31, 2021 in valuing such portfolio securities:
| | | | | | | | | | | | |
| | | Level 1 | | | Level 2 | | | Level 3 | |
| | | |
Investments in Securities | | | | | | | | | | | | |
Assets | | | | | | | | | | | | |
Long-Term Investments | | | | | | | | | | | | |
Asset-Backed Securities | | | | | | | | | | | | |
Automobiles | | $ | — | | | $ | 2,033,335 | | | $ | — | |
Collateralized Loan Obligations | | | — | | | | 186,176,283 | | | | — | |
Consumer Loans | | | — | | | | 10,189,630 | | | | — | |
Home Equity Loans | | | — | | | | 13,586,410 | | | | — | |
Other | | | — | | | | 3,203,195 | | | | — | |
Residential Mortgage-Backed Securities | | | — | | | | 20,073,475 | | | | — | |
Student Loans | | | — | | | | 24,908,067 | | | | — | |
Bank Loans | | | — | | | | 9,979,214 | | | | 7,103,458 | |
Commercial Mortgage-Backed Securities | | | — | | | | 73,893,388 | | | | — | |
Convertible Bond | | | — | | | | 38,328 | | | | — | |
Corporate Bonds | | | — | | | | 294,287,771 | | | | — | |
Municipal Bonds | | | — | | | | 18,654,084 | | | | — | |
Residential Mortgage-Backed Securities | | | — | | | | 24,932,083 | | | | — | |
Sovereign Bonds | | | — | | | | 37,148,794 | | | | — | |
U.S. Treasury Obligations | | | — | | | | 92,994,305 | | | | — | |
Common Stocks | | | 12,878,285 | | | | 4,478,614 | | | | — | |
Warrants | | | — | | | | — | | | | 5,598 | |
Short-Term Investments | | | | | | | | | | | | |
Affiliated Mutual Funds | | | 142,170,469 | | | | — | | | | — | |
Options Purchased | | | — | | | | 1,693,327 | | | | — | |
| | | | | | | | | | | | |
| | | |
Total | | $ | 155,048,754 | | | $ | 818,270,303 | | | $ | 7,109,056 | |
| | | | | | | | | | | | |
| | | |
Liabilities | | | | | | | | | | | | |
Options Written | | $ | — | | | $ | (1,706,458 | ) | | $ | (60,383 | ) |
| | | | | | | | | | | | |
| | | |
Other Financial Instruments* | | | | | | | | | | | | |
Assets | | | | | | | | | | | | |
Unfunded Loan Commitment | | $ | — | | | $ | 3,262 | | | $ | — | |
Futures Contracts | | | 6,811,813 | | | | — | | | | — | |
OTC Forward Foreign Currency Exchange Contracts | | | — | | | | 11,230,918 | | | | — | |
OTC Cross Currency Exchange Contracts | | | — | | | | 1,305,095 | | | | — | |
OTC Credit Default Swap Agreements | | | — | | | | 1,001,212 | | | | 3,996 | |
Centrally Cleared Interest Rate Swap Agreements | | | — | | | | 616,073 | | | | — | |
| | | | | | | | | | | | |
| | | |
Total | | $ | 6,811,813 | | | $ | 14,156,560 | | | $ | 3,996 | |
| | | | | | | | | | | | |
| | | |
Liabilities | | | | | | | | | | | | |
Futures Contracts | | $ | (339,478 | ) | | $ | — | | | $ | — | |
OTC Forward Foreign Currency Exchange Contracts | | | — | | | | (8,366,040 | ) | | | — | |
OTC Cross Currency Exchange Contracts | | | — | | | | (2,338,203 | ) | | | — | |
Centrally Cleared Credit Default Swap Agreement | | | — | | | | (24,491 | ) | | | — | |
OTC Credit Default Swap Agreements | | | — | | | | (422,149 | ) | | | — | |
| | |
| See Notes to Financial Statements. |
| PGIM Absolute Return Bond Fund | | 69 |
Schedule of Investments (continued)
as of October 31, 2021
| | | | | | | | | | | | |
| | | Level 1 | | | Level 2 | | | Level 3 | |
| | | |
Other Financial Instruments* (continued) | | | | | | | | | | | | |
Liabilities (continued) | | | | | | | | | | | | |
Centrally Cleared Inflation Swap Agreements | | $ | — | | | $ | (1,481,085 | ) | | $ | — | |
Centrally Cleared Interest Rate Swap Agreements | | | — | | | | (15,721,467 | ) | | | — | |
| | | | | | | | | | | | |
| | | |
Total | | $ | (339,478 | ) | | $ | (28,353,435 | ) | | $ | — | |
| | | | | | | | | | | | |
| * | Other financial instruments are derivative instruments, with the exception of unfunded loan commitments, and are not reflected in the Schedule of Investments. Futures, forwards, centrally cleared swap contracts and unfunded loan commitments are recorded at net unrealized appreciation (depreciation) and OTC swap contracts are recorded at fair value. |
The following is a reconciliation of assets in which unobservable inputs (Level 3) were used in determining fair value:
| | | | | | | | | | | | |
| | | Bank Loans | | | Residential
Mortgage-Backed
Securities | | | Warrants | |
| | | |
Balance as of 10/31/20 | | $ | 12,449,038 | | | $ | 17,302,975 | | | $ | — | |
Realized gain (loss) | | | 1,414,688 | | | | — | | | | — | |
Change in unrealized appreciation (depreciation) | | | 1,333,114 | | | | 144,816 | | | | 5,598 | |
Purchases/Exchanges/Issuances | | | 4,610,390 | | | | — | | | | — | |
Sales/Paydowns | | | (12,706,462 | ) | | | (17,447,791 | ) | | | — | |
Accrued discount/premium | | | 2,690 | | | | — | | | | — | |
Transfers into Level 3* | | | — | | | | — | | | | — | |
Transfers out of Level 3* | | | — | | | | — | | | | — | |
| | | | | | | | | | | | |
Balance as of 10/31/21 | | $ | 7,103,458 | | | $ | — | | | $ | 5,598 | |
| | | | | | | | | | | | |
Change in unrealized appreciation (depreciation) relating to securities still held at reporting period end | | $ | 1,262,825 | | | $ | — | | | $ | 5,598 | |
| | | | | | | | | | | | |
| | | | | | | | | | |
| | | Options Written | | OTC Credit Default Swap Agreements |
Balance as of 10/31/20 | | | $ | — | | | | $ | (476 | ) |
Realized gain (loss) | | | | — | | | | | 21,815 | |
Change in unrealized appreciation (depreciation) | | | | (4,745 | ) | | | | 3,996 | |
Purchases/Exchanges/Issuances | | | | — | | | | | — | |
Sales/Paydowns | | | | (55,638 | ) | | | | (21,339 | ) |
Accrued discount/premium | | | | — | | | | | — | |
Transfers into Level 3* | | | | — | | | | | — | |
Transfers out of Level 3* | | | | — | | | | | — | |
| | | | | | | | | | |
Balance as of 10/31/21 | | | $ | (60,383 | ) | | | $ | 3,996 | |
| | | | | | | | | | |
| | |
Change in unrealized appreciation (depreciation) relating to securities still held at reporting period end | | | $ | (4,745 | ) | | | $ | 3,996 | |
| | | | | | | | | | |
| | * | It is the Fund’s policy to recognize transfers in and transfers out at the fair value as of the beginning of period. Securities transferred levels due to a change in observable and/or unobservable inputs. |
|
See Notes to Financial Statements. 70 |
As of October 31, 2021, the aggregate value of Level 3 securities and/or derivatives that are valued by independent pricing vendors or brokers was $7,052,669. The unobservable inputs for these investments were not developed by the Fund and are not readily available.
Industry Classification:
The industry classification of investments and other assets in excess of liabilities shown as a percentage of net assets as of October 31, 2021 were as follows (unaudited):
| | | | |
Collateralized Loan Obligations | | | 19.0 | % |
Affiliated Mutual Funds (1.5% represents investments purchased with collateral from securities on loan) | | | 14.5 | |
U.S. Treasury Obligations | | | 9.5 | |
Commercial Mortgage-Backed Securities | | | 7.5 | |
Banks | | | 5.5 | |
Residential Mortgage-Backed Securities | | | 4.6 | |
Sovereign Bonds | | | 3.8 | |
Student Loans | | | 2.6 | |
Telecommunications | | | 2.3 | |
Oil & Gas | | | 2.3 | |
Retail | | | 1.9 | |
Municipal Bonds | | | 1.9 | |
Pharmaceuticals | | | 1.9 | |
Pipelines | | | 1.7 | |
Chemicals | | | 1.6 | |
Electric | | | 1.5 | |
Home Equity Loans | | | 1.4 | |
Oil, Gas & Consumable Fuels | | | 1.3 | |
Insurance | | | 1.2 | |
Aerospace & Defense | | | 1.2 | |
Media | | | 1.1 | |
Foods | | | 1.1 | |
Consumer Loans | | | 1.0 | |
Commercial Services | | | 0.9 | |
Gas | | | 0.7 | |
Home Builders | | | 0.7 | |
Entertainment | | | 0.6 | |
Auto Parts & Equipment | | | 0.6 | |
Packaging & Containers | | | 0.6 | |
Airlines | | | 0.5 | |
Real Estate | | | 0.5 | |
| | | | |
Gas Utilities | | | 0.5 | % |
Engineering & Construction | | | 0.4 | |
Healthcare-Products | | | 0.4 | |
Lodging | | | 0.3 | |
Other | | | 0.3 | |
Healthcare-Services | | | 0.3 | |
Internet | | | 0.3 | |
Mining | | | 0.3 | |
Diversified Financial Services | | | 0.3 | |
Energy-Alternate Sources | | | 0.3 | |
Auto Manufacturers | | | 0.2 | |
Automobiles | | | 0.2 | |
Options Purchased | | | 0.2 | |
Forest Products & Paper | | | 0.2 | |
Building Materials | | | 0.1 | |
Real Estate Investment Trusts (REITs) | | | 0.1 | |
Advertising | | | 0.1 | |
Agriculture | | | 0.1 | |
Beverages | | | 0.0 | * |
Savings & Loans | | | 0.0 | * |
Computers | | | 0.0 | * |
Oil & Gas Services | | | 0.0 | * |
Textiles | | | 0.0 | * |
Electronics | | | 0.0 | * |
| | | | |
| |
| | | 100.1 | |
Options Written | | | (0.2 | ) |
Other assets in excess of liabilities | | | 0.1 | |
| | | | |
| |
| | | 100.0 | % |
| | | | |
Effects of Derivative Instruments on the Financial Statements and Primary Underlying Risk Exposure:
The Fund invested in derivative instruments during the reporting period. The primary types of risk associated with these derivative instruments are credit contracts risk, foreign exchange contracts risk and interest rate contracts risk. See the
| | |
| See Notes to Financial Statements. |
| PGIM Absolute Return Bond Fund | | 71 |
Schedule of Investments (continued)
as of October 31, 2021
Notes to Financial Statements for additional detail regarding these derivative instruments and their risks. The effect of such derivative instruments on the Fund’s financial position and financial performance as reflected in the Statement of Assets and Liabilities and Statement of Operations is presented in the summary below.
Fair values of derivative instruments as of October 31, 2021 as presented in the Statement of Assets and Liabilities:
| | | | | | | | | | | | | | | | |
| | | Asset Derivatives | | | Liability Derivatives | |
Derivatives not accounted for as hedging instruments, carried at fair value | | Statement of Assets and Liabilities Location | | | | Fair
Value | | | Statement of Assets and
Liabilities Location | | | | Fair
Value | |
Credit contracts | | — | | | | $ | — | | | Due from/to broker-variation margin swaps | | | | $ | 24,491 | * |
Credit contracts | | Premiums paid for OTC swap agreements | | | | | 2,082,324 | | | Premiums received for OTC swap agreements | | | | | 618,810 | |
Credit contracts | | Unaffiliated investments | | | | | 635,079 | | | Options written outstanding, at value | | | | | 708,593 | |
Credit contracts | | Unrealized appreciation on OTC swap agreements | | | | | 555,994 | | | Unrealized depreciation on OTC swap agreements | | | | | 1,436,449 | |
Foreign exchange contracts | | Unaffiliated investments | | | | | 1,058,248 | | | Options written outstanding, at value | | | | | 1,058,248 | |
Foreign exchange contracts | | Unrealized appreciation on OTC cross currency exchange contracts | | | | | 1,305,095 | | | Unrealized depreciation on OTC cross currency exchange contracts | | | | | 2,338,203 | |
Foreign exchange contracts | | Unrealized appreciation on OTC forward foreign currency exchange contracts | | | | | 11,230,918 | | | Unrealized depreciation on OTC forward foreign currency exchange contracts | | | | | 8,366,040 | |
Interest rate contracts | | Due from/to broker-variation margin futures | | | | | 6,811,813 | * | | Due from/to broker-variation margin futures | | | | | 339,478 | * |
Interest rate contracts | | Due from/to broker-variation margin swaps | | | | | 616,073 | * | | Due from/to broker-variation margin swaps | | | | | 17,202,552 | * |
| | | | | | | | | | | | | | | | |
| | | | | | $ | 24,295,544 | | | | | | | $ | 32,092,864 | |
| | | | | | | | | | | | | | | | |
| * | Includes cumulative appreciation (depreciation) as reported in the schedule of open futures and centrally cleared swap contracts. Only unsettled variation margin receivable (payable) is reported within the Statement of Assets and Liabilities. |
|
See Notes to Financial Statements. 72 |
The effects of derivative instruments on the Statement of Operations for the year ended October 31, 2021 are as follows:
| | | | | | | | | | | | | | | | | | | | | | | | | |
Amount of Realized Gain (Loss) on Derivatives Recognized in Income |
| | | | | |
Derivatives not accounted for as hedging instruments, carried at fair value | | Options
Purchased(1) | | Options
Written | | Futures | | Forward
& Cross
Currency
Exchange
Contracts | | Swaps |
| | | | | |
Credit contracts | | | $ | (762,620 | ) | | | $ | 725,453 | | | | $ | — | | | | $ | — | | | | $ | (187,331 | ) |
| | | | | |
Foreign exchange contracts | | | | (116,414,198 | ) | | | | 113,673,865 | | | | | — | | | | | 1,564,217 | | | | | — | |
| | | | | |
Interest rate contracts | | | | 3,166,857 | | | | | — | | | | | (3,253,947 | ) | | | | — | | | | | 2,292,058 | |
| | | | | |
| | | | | | | | | | | | | | | | | | | | | | | | | |
| | | | | |
Total | | | $ | (114,009,961 | ) | | | $ | 114,399,318 | | | | $ | (3,253,947 | ) | | | $ | 1,564,217 | | | | $ | 2,104,727 | |
| | | | | | | | | | | | | | | | | | | | | | | | | |
| (1) | Included in net realized gain (loss) on investment transactions in the Statement of Operations. |
| | | | | | | | | | | | | | | | | | | | | | | | | |
Change in Unrealized Appreciation (Depreciation) on Derivatives Recognized in Income |
| | | | | |
Derivatives not accounted for as hedging instruments, carried at fair value | | Options
Purchased(2) | | Options
Written | | Futures | | Forward
& Cross
Currency
Exchange
Contracts | | Swaps |
| | | | | |
Credit contracts | | | $ | 71,920 | | | | $ | 79,867 | | | | $ | — | | | | $ | — | | | | $ | (4,188,403 | ) |
| | | | | |
Foreign exchange contracts | | | | (1,004,944 | ) | | | | 2,789,006 | | | | | — | | | | | (1,417,925 | ) | | | | — | |
| | | | | |
Interest rate contracts | | | | (3,364,556 | ) | | | | — | | | | | 9,324,573 | | | | | — | | | | | (20,270,627 | ) |
| | | | | |
| | | | | | | | | | | | | | | | | | | | | | | | | |
Total | | | $ | (4,297,580 | ) | | | $ | 2,868,873 | | | | $ | 9,324,573 | | | | $ | (1,417,925 | ) | | | $ | (24,459,030 | ) |
| | | | | | | | | | | | | | | | | | | | | | | | | |
| (2) | Included in net change in unrealized appreciation (depreciation) on investments in the Statement of Operations. |
| | |
| See Notes to Financial Statements. |
| PGIM Absolute Return Bond Fund | | 73 |
Schedule of Investments (continued)
as of October 31, 2021
For the year ended October 31, 2021, the Fund’s average volume of derivative activities is as follows:
| | | | | | | | |
Options
Purchased(1) | | Options
Written(2) | | Futures
Contracts—
Long
Positions(2) | | Futures
Contracts—
Short
Positions(2) | | Forward Foreign
Currency Exchange
Contracts—Purchased(3) |
| | | | |
| $49,009,399 | | $2,169,100,251 | | $48,995,558 | | $1,249,229,501 | | $427,239,059 |
| | | | | | |
Forward Foreign
Currency Exchange
Contracts—Sold(3) | | Cross
Currency
Exchange
Contracts(4) | | Interest Rate
Swap
Agreements(2) | | Credit Default
Swap Agreements—
Buy Protection(2) |
| | | |
| $555,775,648 | | $65,299,228 | | $241,453,191 | | $380,190,943 |
| | | | |
Credit Default
Swap Agreements—
Sell Protection(2) | | Total Return
Swap
Agreements(2) | | Inflation Swap
Agreements(2) |
| | |
| $176,888,767 | | $1,386,620 | | $14,242,000 |
| (2) | Notional Amount in USD. |
| (3) | Value at Settlement Date. |
Average volume is based on average quarter end balances as noted for the year ended October 31, 2021.
Financial Instruments/Transactions—Summary of Offsetting and Netting Arrangements:
The Fund invested in OTC derivatives and entered into financial instruments/transactions during the reporting period that are either offset in accordance with current requirements or are subject to enforceable master netting arrangements or similar agreements that permit offsetting. The information about offsetting and related netting arrangements for OTC derivatives and financial instruments/transactions where the legal right to set-off exists is presented in the summary below.
Offsetting of financial instrument/transaction assets and liabilities:
| | | | | | | | | | | | | | | | | | | | | | | | | | | | |
Description | | Gross Market Value of Recognized
Assets/(Liabilities) | | Collateral
Pledged/(Received)(2) | | | Net Amount |
Securities on Loan | | | | $ | 14,303,258 | | | | | | | | | $ | (14,303,258 | ) | | | | | | | | $ | — | | | |
| | | | | | | | | | | | | | | | | | | | | | | | | | | | |
|
See Notes to Financial Statements. 74 |
Offsetting of OTC derivative assets and liabilities:
| | | | | | | | | | | | | | | | | | | | | | | | | | | | | | | | | | | | | | | | | | |
Counterparty | | Gross Amounts of
Recognized
Assets(1) | | Gross Amounts of
Recognized
Liabilities(1) | | | Net Amounts of
Recognized
Assets/(Liabilities) | | Collateral Pledged/(Received)(2) | | Net Amount |
Bank of America, N.A. | | | | $ | 2,496,064 | | | | | | | $ | (1,071,752 | ) | | | | | | | | $ | 1,424,312 | | | | | | | $ | (1,424,312 | ) | | | | | | $ | — | | | |
Barclays Bank PLC | | | | | 1,756,611 | | | | | | | | (2,048,342 | ) | | | | | | | | | (291,731 | ) | | | | | | | 291,731 | | | | | | | | — | | | |
BNP Paribas S.A. | | | | | 556,237 | | | | | | | | (805,682 | ) | | | | | | | | | (249,445 | ) | | | | | | | 249,445 | | | | | | | | — | | | |
Citibank, N.A. | | | | | 2,786,299 | | | | | | | | (1,088,114 | ) | | | | | | | | | 1,698,185 | | | | | | | | (1,280,000 | ) | | | | | | | 418,185 | | | |
Citigroup Global Markets, Inc. | | | | | 234,238 | | | | | | | | (287,622 | ) | | | | | | | | | (53,384 | ) | | | | | | | — | | | | | | | | (53,384 | ) | | |
Credit Suisse International | | | | | 71,797 | | | | | | | | (349,824 | ) | | | | | | | | | (278,027 | ) | | | | | | | 278,027 | | | | | | | | — | | | |
Deutsche Bank AG | | | | | 3,591,270 | | | | | | | | (2,404,059 | ) | | | | | | | | | 1,187,211 | | | | | | | | (1,152,527 | ) | | | | | | | 34,684 | | | |
Goldman Sachs International | | | | | 1,948,692 | | | | | | | | (2,160,895 | ) | | | | | | | | | (212,203 | ) | | | | | | | 212,203 | | | | | | | | — | | | |
HSBC Bank PLC | | | | | 516,966 | | | | | | | | (72,854 | ) | | | | | | | | | 444,112 | | | | | | | | — | | | | | | | | 444,112 | | | |
JPMorgan Chase Bank, N.A. | | | | | 714,197 | | | | | | | | (423,184 | ) | | | | | | | | | 291,013 | | | | | | | | (291,013 | ) | | | | | | | — | | | |
Morgan Stanley & Co. International PLC | | | | | 2,078,889 | | | | | | | | (3,623,935 | ) | | | | | | | | | (1,545,046 | ) | | | | | | | 1,545,046 | | | | | | | | — | | | |
Standard Chartered Bank | | | | | 83,362 | | | | | | | | (102,366 | ) | | | | | | | | | (19,004 | ) | | | | | | | — | | | | | | | | (19,004 | ) | | |
The Toronto-Dominion Bank | | | | | 10,474 | | | | | | | | — | | | | | | | | | | 10,474 | | | | | | | | — | | | | | | | | 10,474 | | | |
UBS AG | | | | | 22,562 | | | | | | | | (87,714 | ) | | | | | | | | | (65,152 | ) | | | | | | | 65,152 | | | | | | | | — | | | |
| | | | | | | | | | | | | | | | | | | | | | | | | | | | | | | | | | | | | | | | | | |
| | | | $ | 16,867,658 | | | | | | | $ | (14,526,343 | ) | | | | | | | | $ | 2,341,315 | | | | | | | $ | (1,506,248 | ) | | | | | | $ | 835,067 | | | |
| | | | | | | | | | | | | | | | | | | | | | | | | | | | | | | | | | | | | | | | | | |
| (1) | Includes unrealized appreciation/(depreciation) on swaps and forwards, premiums paid/(received) on swap agreements and market value of purchased and written options, as represented on the Statement of Assets and Liabilities. |
| (2) | Collateral amount disclosed by the Fund is limited to the market value of financial instruments/transactions and the Fund’s OTC derivative exposure by counterparty. |
| | |
| See Notes to Financial Statements. |
| PGIM Absolute Return Bond Fund | | 75 |
Statement of Assets and Liabilities
as of October 31, 2021
| | | | |
Assets | | | | |
| |
Investments at value, including securities on loan of $14,303,258: | | | | |
Unaffiliated investments (cost $812,413,887) | | $ | 838,257,644 | |
Affiliated investments (cost $142,160,175) | | | 142,170,469 | |
Cash | | | 15,769 | |
Foreign currency, at value (cost $1,315,451) | | | 1,323,419 | |
Receivable for Fund shares sold | | | 13,585,275 | |
Unrealized appreciation on OTC forward foreign currency exchange contracts | | | 11,230,918 | |
Deposit with broker for centrally cleared/exchange-traded derivatives | | | 7,429,000 | |
Dividends and interest receivable | | | 6,268,901 | |
Premiums paid for OTC swap agreements | | | 2,082,324 | |
Unrealized appreciation on OTC cross currency exchange contracts | | | 1,305,095 | |
Receivable for investments sold | | | 906,696 | |
Due from broker—variation margin swaps | | | 606,246 | |
Unrealized appreciation on OTC swap agreements | | | 555,994 | |
Due from broker—variation margin futures | | | 274,309 | |
Unrealized appreciation on unfunded loan commitment | | | 3,262 | |
Prepaid expenses | | | 6,159 | |
| | | | |
Total Assets | | | 1,026,021,480 | |
| | | | |
| |
Liabilities | | | | |
| |
Payable to broker for collateral for securities on loan | | | 14,739,294 | |
Payable for investments purchased | | | 12,194,606 | |
Unrealized depreciation on OTC forward foreign currency exchange contracts | | | 8,366,040 | |
Payable for Fund shares purchased | | | 3,692,716 | |
Unrealized depreciation on OTC cross currency exchange contracts | | | 2,338,203 | |
Options written outstanding, at value (premiums received $10,279,599) | | | 1,766,841 | |
Unrealized depreciation on OTC swap agreements | | | 1,436,449 | |
Premiums received for OTC swap agreements | | | 618,810 | |
Accrued expenses and other liabilities | | | 560,946 | |
Management fee payable | | | 537,847 | |
Dividends payable | | | 249,143 | |
Distribution fee payable | | | 60,021 | |
Affiliated transfer agent fee payable | | | 3,154 | |
Trustees’ fees payable | | | 1,400 | |
| | | | |
| |
Total Liabilities | | | 46,565,470 | |
| | | | |
| |
Net Assets | | $ | 979,456,010 | |
| | | | |
| | | | |
Net assets were comprised of: | | | | |
Shares of beneficial interest, at par | | $ | 105,881 | |
Paid-in capital in excess of par | | | 1,225,910,236 | |
Total distributable earnings (loss) | | | (246,560,107 | ) |
| | | | |
Net assets, October 31, 2021 | | $ | 979,456,010 | |
| | | | |
|
See Notes to Financial Statements. 76 |
| | | | | | |
Class A | | | | | | |
| | |
Net asset value and redemption price per share, ($109,630,095 ÷ 11,893,892 shares of beneficial interest issued and outstanding) | | $ | 9.22 | | | |
Maximum sales charge (3.25% of offering price) | | | 0.31 | | | |
| | | | | | |
| | |
Maximum offering price to public | | $ | 9.53 | | | |
| | | | | | |
| | |
Class C | | | | | | |
| | |
Net asset value, offering price and redemption price per share, ($42,634,572 ÷ 4,611,233 shares of beneficial interest issued and outstanding) | | $ | 9.25 | | | |
| | | | | | |
| | |
Class Z | | | | | | |
| | |
Net asset value, offering price and redemption price per share, ($767,056,452 ÷ 82,847,889 shares of beneficial interest issued and outstanding) | | $ | 9.26 | | | |
| | | | | | |
| | |
Class R6 | | | | | | |
| | |
Net asset value, offering price and redemption price per share, ($60,134,891 ÷ 6,527,580 shares of beneficial interest issued and outstanding) | | $ | 9.21 | | | |
| | | | | | |
| | |
| See Notes to Financial Statements. |
| PGIM Absolute Return Bond Fund | | 77 |
Statement of Operations
Year Ended October 31, 2021
| | | | |
Net Investment Income (Loss) | | | | |
| |
Income | | | | |
Interest income | | $ | 36,106,719 | |
Unaffiliated dividend income (net of $120 foreign withholding tax) | | | 173,647 | |
Affiliated dividend income | | | 112,512 | |
Income from securities lending, net (including affiliated income of $14,988) | | | 32,744 | |
| | | | |
| |
Total income | | | 36,425,622 | |
| | | | |
| |
Expenses | | | | |
Management fee | | | 6,389,292 | |
Distribution fee(a) | | | 776,070 | |
Transfer agent’s fees and expenses (including affiliated expense of $21,201)(a) | | | 925,600 | |
Custodian and accounting fees | | | 181,997 | |
Registration fees(a) | | | 71,049 | |
Audit fee | | | 69,803 | |
Shareholders’ reports | | | 30,665 | |
Legal fees and expenses | | | 24,362 | |
Trustees’ fees | | | 22,663 | |
Miscellaneous | | | 56,530 | |
| | | | |
| |
Total expenses | | | 8,548,031 | |
| | | | |
| |
Net investment income (loss) | | | 27,877,591 | |
| | | | |
| |
Realized And Unrealized Gain (Loss) On Investment And Foreign Currency Transactions | | | | |
| |
Net realized gain (loss) on: | | | | |
Investment transactions (including affiliated of $26,854) | | | (90,827,017 | ) |
Futures transactions | | | (3,253,947 | ) |
Forward and cross currency contract transactions | | | 1,564,217 | |
Options written transactions | | | 114,399,318 | |
Swap agreement transactions | | | 2,104,727 | |
Foreign currency transactions | | | 9,559,480 | |
| | | | |
| | | 33,546,778 | |
| | | | |
Net change in unrealized appreciation (depreciation) on: | | | | |
Investments (including affiliated of $(36,187)) | | | 25,635,029 | |
Futures | | | 9,324,573 | |
Forward and cross currency contracts | | | (1,417,925 | ) |
Options written | | | 2,868,873 | |
Swap agreements | | | (24,459,030 | ) |
Foreign currencies | | | 260,984 | |
Unfunded loan commitments | | | 3,262 | |
| | | | |
| | | 12,215,766 | |
| | | | |
Net gain (loss) on investment and foreign currency transactions | | | 45,762,544 | |
| | | | |
Net Increase (Decrease) In Net Assets Resulting From Operations | | $ | 73,640,135 | |
| | | | |
|
See Notes to Financial Statements. 78 |
| (a) | Class specific expenses and waivers were as follows: |
| | | | | | | | | | | | | | | | |
| | | Class A | | | Class C | | | Class Z | | | Class R6 |
Distribution fee | | | 246,327 | | | | 529,743 | | | | — | | | | — | |
Transfer agent’s fees and expenses | | | 75,742 | | | | 42,222 | | | | 803,205 | | | | 4,431 | |
Registration fees | | | 18,185 | | | | 11,911 | | | | 30,970 | | | | 9,983 | |
| | |
| See Notes to Financial Statements. |
| PGIM Absolute Return Bond Fund | | 79 |
Statements of Changes in Net Assets
| | | | | | | | |
| |
| | | Year Ended
October 31, | |
| | |
| | | 2021 | | | 2020 | |
| | |
Increase (Decrease) in Net Assets | | | | | | | | |
| | |
Operations | | | | | | | | |
Net investment income (loss) | | $ | 27,877,591 | | | $ | 62,708,667 | |
Net realized gain (loss) on investment and foreign currency transactions | | | 33,546,778 | | | | (311,138,134 | ) |
Net change in unrealized appreciation (depreciation) on investments and foreign currencies | | | 12,215,766 | | | | 162,610,301 | |
| | | | | | | | |
| | |
Net increase (decrease) in net assets resulting from operations | | | 73,640,135 | | | | (85,819,166 | ) |
| | | | | | | | |
| | |
Dividends and Distributions | | | | | | | | |
Distributions from distributable earnings | | | | | | | | |
Class A | | | (2,322,399 | ) | | | (7,578,227 | ) |
Class C | | | (886,038 | ) | | | (5,063,142 | ) |
Class Z | | | (21,959,534 | ) | | | (109,217,140 | ) |
Class R6 | | | (2,674,791 | ) | | | (6,149,143 | ) |
| | | | | | | | |
| | |
| | | (27,842,762 | ) | | | (128,007,652 | ) |
| | | | | | | | |
Tax return of capital distributions | | | | | | | | |
Class A | | | (104,437 | ) | | | (456,184 | ) |
Class C | | | (39,845 | ) | | | (304,784 | ) |
Class Z | | | (987,511 | ) | | | (6,574,503 | ) |
Class R6 | | | (120,284 | ) | | | (370,157 | ) |
| | | | | | | | |
| | |
| | | (1,252,077 | ) | | | (7,705,628 | ) |
| | | | | | | | |
Fund share transactions (Net of share conversions) | | | | | | | | |
Net proceeds from shares sold | | | 358,440,154 | | | | 611,310,436 | |
Net asset value of shares issued in reinvestment of dividends and distributions | | | 25,054,049 | | | | 115,714,362 | |
Cost of shares purchased | | | (807,564,899 | ) | | | (1,516,009,999 | ) |
| | | | | | | | |
| | |
Net increase (decrease) in net assets from Fund share transactions | | | (424,070,696 | ) | | | (788,985,201 | ) |
| | | | | | | | |
| | |
Total increase (decrease) | | | (379,525,400 | ) | | | (1,010,517,647 | ) |
| | |
Net Assets: | | | | | | | | |
| | |
Beginning of year | | | 1,358,981,410 | | | | 2,369,499,057 | |
| | | | | | | | |
End of year | | $ | 979,456,010 | | | $ | 1,358,981,410 | |
| | | | | | | | |
|
See Notes to Financial Statements. 80 |
Financial Highlights
| | | | | | | | | | | | | | | | | | | | |
| | | | | | |
| Class A Shares | | | | | | | | | | | | | | | |
| | | | |
| | | | | | Year Ended October 31, | | | | |
| | | | | | |
| | | 2021 | | | 2020 | | | 2019 | | | 2018 | | | 2017 | |
| | | | | | |
Per Share Operating Performance(a): | | | | | | | | | | | | | | | | | | | | |
Net Asset Value, Beginning of Year | | | $8.94 | | | | $9.73 | | | | $9.82 | | | | $9.93 | | | | $9.59 | |
Income (loss) from investment operations: | | | | | | | | | | | | | | | | | | | | |
Net investment income (loss) | | | 0.21 | | | | 0.30 | | | | 0.31 | | | | 0.27 | | | | 0.23 | |
Net realized and unrealized gain (loss) on investment and foreign currency transactions | | | 0.30 | | | | (0.49 | ) | | | 0.13 | | | | (0.05 | ) | | | 0.33 | |
Total from investment operations | | | 0.51 | | | | (0.19 | ) | | | 0.44 | | | | 0.22 | | | | 0.56 | |
Less Dividends and Distributions: | | | | | | | | | | | | | | | | | | | | |
Dividends from net investment income | | | (0.22 | ) | | | (0.26 | ) | | | (0.53 | ) | | | (0.33 | ) | | | (0.22 | ) |
Tax return of capital distributions | | | (0.01 | ) | | | (0.04 | ) | | | - | | | | - | | | | - | |
Distributions from net realized gains | | | - | | | | (0.30 | ) | | | - | | | | - | | | | - | |
Total dividends and distributions | | | (0.23 | ) | | | (0.60 | ) | | | (0.53 | ) | | | (0.33 | ) | | | (0.22 | ) |
Net asset value, end of year | | | $9.22 | | | | $8.94 | | | | $9.73 | | | | $9.82 | | | | $9.93 | |
Total Return(b): | | | 5.71 | % | | | (1.96 | )% | | | 4.71 | % | | | 2.21 | % | | | 5.95 | % |
| | | | | | | | | | | | | | | | | | | | | |
| Ratios/Supplemental Data: | | | | | | | | | | | | | | | |
Net assets, end of year (000) | | | $109,630 | | | | $93,597 | | | | $142,879 | | | | $148,609 | | | | $119,969 | |
Average net assets (000) | | | $98,531 | | | | $114,656 | | | | $147,612 | | | | $142,613 | | | | $145,290 | |
Ratios to average net assets(c)(d): | | | | | | | | | | | | | | | | | | | | |
Expenses after waivers and/or expense reimbursement | | | 0.97 | % | | | 0.97 | % | | | 1.02 | % | | | 1.03 | % | | | 1.15 | % |
Expenses before waivers and/or expense reimbursement | | | 0.97 | % | | | 0.97 | % | | | 1.02 | % | | | 1.04 | % | | | 1.22 | % |
Net investment income (loss) | | | 2.32 | % | | | 3.27 | % | | | 3.24 | % | | | 2.72 | % | | | 2.31 | % |
Portfolio turnover rate(e) | | | 48 | % | | | 20 | % | | | 50 | % | | | 52 | % | | | 72 | % |
| (a) | Calculated based on average shares outstanding during the year. |
| (b) | Total return does not consider the effects of sales loads. Total return is calculated assuming a purchase of a share on the first day and a sale on the last day of each year reported and includes reinvestment of dividends and distributions, if any. Total returns may reflect adjustments to conform to GAAP. |
| (c) | Does not include expenses of the underlying funds in which the Fund invests. |
| (d) | Effective August 1, 2017, class specific expenses include transfer agent fees and expenses and registration fees, which are charged to their respective share class. |
| (e) | The Fund’s portfolio turnover rate is calculated in accordance with regulatory requirements, without regard to transactions involving short-term investments and certain derivatives. If such transactions were included, the Fund’s portfolio turnover rate may be higher. |
| | |
| See Notes to Financial Statements. |
| PGIM Absolute Return Bond Fund | | 81 |
Financial Highlights (continued)
| | | | | | | | | | | | | | | | | | | | |
| | | | | | |
| Class C Shares | | | | | | | | | | | | | | | |
| | | | | | Year Ended October 31, | | | | |
| | | | | | |
| | | 2021 | | | 2020 | | | 2019 | | | 2018 | | | 2017 | |
| | | | | | |
Per Share Operating Performance(a): | | | | | | | | | | | | | | | | | | | | |
Net Asset Value, Beginning of Year | | | $8.97 | | | | $9.76 | | | | $9.85 | | | | $9.96 | | | | $9.62 | |
Income (loss) from investment operations: | | | | | | | | | | | | | | | | | | | | |
Net investment income (loss) | | | 0.15 | | | | 0.23 | | | | 0.24 | | | | 0.19 | | | | 0.15 | |
Net realized and unrealized gain (loss) on investment and foreign currency transactions | | | 0.29 | | | | (0.48 | ) | | | 0.13 | | | | (0.05 | ) | | | 0.34 | |
Total from investment operations | | | 0.44 | | | | (0.25 | ) | | | 0.37 | | | | 0.14 | | | | 0.49 | |
Less Dividends and Distributions: | | | | | | | | | | | | | | | | | | | | |
Dividends from net investment income | | | (0.15 | ) | | | (0.20 | ) | | | (0.46 | ) | | | (0.25 | ) | | | (0.15 | ) |
Tax return of capital distributions | | | (0.01 | ) | | | (0.04 | ) | | | - | | | | - | | | | - | |
Distributions from net realized gains | | | - | | | | (0.30 | ) | | | - | | | | - | | | | - | |
Total dividends and distributions | | | (0.16 | ) | | | (0.54 | ) | | | (0.46 | ) | | | (0.25 | ) | | | (0.15 | ) |
Net asset value, end of year | | | $9.25 | | | | $8.97 | | | | $9.76 | | | | $9.85 | | | | $9.96 | |
Total Return(b): | | | 5.03 | % | | | (2.70 | )% | | | 3.80 | % | | | 1.43 | % | | | 5.16 | % |
| | | | | | | | | | | | | | | | | | | | | |
| Ratios/Supplemental Data: | | | | | | | | | | | | | | | |
Net assets, end of year (000) | | | $42,635 | | | | $66,396 | | | | $103,133 | | | | $106,734 | | | | $98,789 | |
Average net assets (000) | | | $52,974 | | | | $86,229 | | | | $107,605 | | | | $102,866 | | | | $106,174 | |
Ratios to average net assets(c)(d): | | | | | | | | | | | | | | | | | | | | |
Expenses after waivers and/or expense reimbursement | | | 1.73 | % | | | 1.73 | % | | | 1.78 | % | | | 1.79 | % | | | 1.90 | % |
Expenses before waivers and/or expense reimbursement | | | 1.73 | % | | | 1.73 | % | | | 1.78 | % | | | 1.80 | % | | | 1.97 | % |
Net investment income (loss) | | | 1.64 | % | | | 2.51 | % | | | 2.46 | % | | | 1.93 | % | | | 1.58 | % |
Portfolio turnover rate(e) | | | 48 | % | | | 20 | % | | | 50 | % | | | 52 | % | | | 72 | % |
| (a) | Calculated based on average shares outstanding during the year. |
| (b) | Total return does not consider the effects of sales loads. Total return is calculated assuming a purchase of a share on the first day and a sale on the last day of each year reported and includes reinvestment of dividends and distributions, if any. Total returns may reflect adjustments to conform to GAAP. |
| (c) | Does not include expenses of the underlying funds in which the Fund invests. |
| (d) | Effective August 1, 2017, class specific expenses include transfer agent fees and expenses and registration fees, which are charged to their respective share class. |
| (e) | The Fund’s portfolio turnover rate is calculated in accordance with regulatory requirements, without regard to transactions involving short-term investments and certain derivatives. If such transactions were included, the Fund’s portfolio turnover rate may be higher. |
|
See Notes to Financial Statements. 82 |
| | | | | | | | | | | | | | | | | | | | |
| | | | | | |
| Class Z Shares | | | | | | | | | | | | | | | |
| | | | | | Year Ended October 31, | | | | |
| | | | | | |
| | | 2021 | | | 2020 | | | 2019 | | | 2018 | | | 2017 | |
| | | | | | |
Per Share Operating Performance(a): | | | | | | | | | | | | | | | | | | | | |
Net Asset Value, Beginning of Year | | | $8.98 | | | | $9.77 | | | | $9.86 | | | | $9.97 | | | | $9.64 | |
Income (loss) from investment operations: | | | | | | | | | | | | | | | | | | | | |
Net investment income (loss) | | | 0.24 | | | | 0.32 | | | | 0.34 | | | | 0.30 | | | | 0.25 | |
Net realized and unrealized gain (loss) on investment and foreign currency transactions | | | 0.29 | | | | (0.48 | ) | | | 0.13 | | | | (0.06 | ) | | | 0.33 | |
Total from investment operations | | | 0.53 | | | | (0.16 | ) | | | 0.47 | | | | 0.24 | | | | 0.58 | |
Less Dividends and Distributions: | | | | | | | | | | | | | | | | | | | | |
Dividends from net investment income | | | (0.24 | ) | | | (0.29 | ) | | | (0.56 | ) | | | (0.35 | ) | | | (0.25 | ) |
Tax return of capital distributions | | | (0.01 | ) | | | (0.04 | ) | | | - | | | | - | | | | - | |
Distributions from net realized gains | | | - | | | | (0.30 | ) | | | - | | | | - | | | | - | |
Total dividends and distributions | | | (0.25 | ) | | | (0.63 | ) | | | (0.56 | ) | | | (0.35 | ) | | | (0.25 | ) |
Net asset value, end of year | | | $9.26 | | | | $8.98 | | | | $9.77 | | | | $9.86 | | | | $9.97 | |
Total Return(b): | | | 5.96 | % | | | (1.70 | )% | | | 5.00 | % | | | 2.48 | % | | | 6.08 | % |
| | | | | | | | | | | | | | | | | | | | | |
| Ratios/Supplemental Data: | | | | | | | | | | | | | | | |
Net assets, end of year (000) | | | $767,056 | | | | $1,071,124 | | | | $2,040,949 | | | | $2,159,518 | | | | $1,277,401 | |
Average net assets (000) | | | $833,908 | | | | $1,499,872 | | | | $2,155,699 | | | | $1,679,461 | | | | $1,121,943 | |
Ratios to average net assets(c)(d): | | | | | | | | | | | | | | | | | | | | |
Expenses after waivers and/or expense reimbursement | | | 0.73 | % | | | 0.73 | % | | | 0.73 | % | | | 0.75 | % | | | 0.90 | % |
Expenses before waivers and/or expense reimbursement | | | 0.73 | % | | | 0.74 | % | | | 0.79 | % | | | 0.81 | % | | | 0.96 | % |
Net investment income (loss) | | | 2.64 | % | | | 3.53 | % | | | 3.51 | % | | | 3.01 | % | | | 2.59 | % |
Portfolio turnover rate(e) | | | 48 | % | | | 20 | % | | | 50 | % | | | 52 | % | | | 72 | % |
| (a) | Calculated based on average shares outstanding during the year. |
| (b) | Total return is calculated assuming a purchase of a share on the first day and a sale on the last day of each year reported and includes reinvestment of dividends and distributions, if any. Total returns may reflect adjustments to conform to GAAP. |
| (c) | Does not include expenses of the underlying funds in which the Fund invests. |
| (d) | Effective August 1, 2017, class specific expenses include transfer agent fees and expenses and registration fees, which are charged to their respective share class. |
| (e) | The Fund’s portfolio turnover rate is calculated in accordance with regulatory requirements, without regard to transactions involving short-term investments and certain derivatives. If such transactions were included, the Fund’s portfolio turnover rate may be higher. |
| | |
| See Notes to Financial Statements. |
| PGIM Absolute Return Bond Fund | | 83 |
Financial Highlights (continued)
| | | | | | | | | | | | | | | | | | | | |
| | | | | | |
| Class R6 Shares | | | | | | | | | | | | | | | |
| | | | | | Year Ended October 31, | | | | |
| | | | | | |
| | | 2021 | | | 2020 | | | 2019 | | | 2018 | | | 2017 | |
| | | | | | |
Per Share Operating Performance(a): | | | | | | | | | | | | | | | | | | | | |
Net Asset Value, Beginning of Year | | | $8.93 | | | | $9.72 | | | | $9.82 | | | | $9.94 | | | | $9.61 | |
Income (loss) from investment operations: | | | | | | | | | | | | | | | | | | | | |
Net investment income (loss) | | | 0.26 | | | | 0.32 | | | | 0.35 | | | | 0.29 | | | | 0.26 | |
Net realized and unrealized gain (loss) on investment and foreign currency transactions | | | 0.28 | | | | (0.48 | ) | | | 0.12 | | | | (0.05 | ) | | | 0.32 | |
Total from investment operations | | | 0.54 | | | | (0.16 | ) | | | 0.47 | | | | 0.24 | | | | 0.58 | |
Less Dividends and Distributions: | | | | | | | | | | | | | | | | | | | | |
Dividends from net investment income | | | (0.25 | ) | | | (0.29 | ) | | | (0.57 | ) | | | (0.36 | ) | | | (0.25 | ) |
Tax return of capital distributions | | | (0.01 | ) | | | (0.04 | ) | | | - | | | | - | | | | - | |
Distributions from net realized gains | | | - | | | | (0.30 | ) | | | - | | | | - | | | | - | |
Total dividends and distributions | | | (0.26 | ) | | | (0.63 | ) | | | (0.57 | ) | | | (0.36 | ) | | | (0.25 | ) |
Net asset value, end of year | | | $9.21 | | | | $8.93 | | | | $9.72 | | | | $9.82 | | | | $9.94 | |
Total Return(b): | | | 6.07 | % | | | (1.66 | )% | | | 4.94 | % | | | 2.42 | % | | | 6.15 | % |
| | | | | | | | | | | | | | | | | | | | | |
| Ratios/Supplemental Data: | | | | | | | | | | | | | | | |
Net assets, end of year (000) | | | $60,135 | | | | $127,864 | | | | $82,538 | | | | $203,372 | | | | $346,253 | |
Average net assets (000) | | | $97,518 | | | | $109,540 | | | | $88,570 | | | | $329,668 | | | | $270,229 | |
Ratios to average net assets(c)(d): | | | | | | | | | | | | | | | | | | | | |
Expenses after waivers and/or expense reimbursement | | | 0.64 | % | | | 0.65 | % | | | 0.70 | % | | | 0.74 | % | | | 0.90 | % |
Expenses before waivers and/or expense reimbursement | | | 0.64 | % | | | 0.65 | % | | | 0.71 | % | | | 0.75 | % | | | 0.90 | % |
Net investment income (loss) | | | 2.79 | % | | | 3.54 | % | | | 3.59 | % | | | 2.95 | % | | | 2.64 | % |
Portfolio turnover rate(e) | | | 48 | % | | | 20 | % | | | 50 | % | | | 52 | % | | | 72 | % |
| (a) | Calculated based on average shares outstanding during the year. |
| (b) | Total return is calculated assuming a purchase of a share on the first day and a sale on the last day of each year reported and includes reinvestment of dividends and distributions, if any. Total returns may reflect adjustments to conform to GAAP. |
| (c) | Does not include expenses of the underlying funds in which the Fund invests. |
| (d) | Effective August 1, 2017, class specific expenses include transfer agent fees and expenses and registration fees, which are charged to their respective share class. |
| (e) | The Fund’s portfolio turnover rate is calculated in accordance with regulatory requirements, without regard to transactions involving short-term investments and certain derivatives. If such transactions were included, the Fund’s portfolio turnover rate may be higher. |
|
See Notes to Financial Statements. 84 |
Notes to Financial Statements
Prudential Investment Portfolios 9 (the “Registered Investment Company” or “RIC”) is registered under the Investment Company Act of 1940, as amended (“1940 Act”), as an open-end management investment company. The RIC is organized as a Delaware Statutory Trust and currently consists of five separate funds: PGIM Absolute Return Bond Fund, PGIM International Bond Fund, PGIM QMA Large-Cap Core Equity Fund, PGIM Real Estate Income Fund and PGIM Select Real Estate Fund. These financial statements relate only to the PGIM Absolute Return Bond Fund (the “Fund”). The Fund is classified as a diversified fund for purposes of the 1940 Act.
The investment objective of the Fund is to seek positive returns over the long term, regardless of market conditions.
The Fund follows the investment company accounting and reporting guidance of the Financial Accounting Standards Board (“FASB”) Accounting Standard Codification (“ASC”) Topic 946 Financial Services — Investment Companies. The following is a summary of significant accounting policies followed by the Fund in the preparation of its financial statements. The policies conform to U.S. generally accepted accounting principles (“GAAP”). The Fund consistently follows such policies in the preparation of its financial statements.
Securities Valuation: The Fund holds securities and other assets and liabilities that are fair valued as of the close of each day (generally, 4:00 PM Eastern time) the New York Stock Exchange (“NYSE”) is open for trading. As described in further detail below, the Fund’s investments are valued daily based on a number of factors, including the type of investment and whether market quotations are readily available. The RIC’s Board of Trustees (the “Board”) has adopted valuation procedures for security valuation under which fair valuation responsibilities have been delegated to PGIM Investments LLC (“PGIM Investments” or the “Manager”). Pursuant to the Board’s delegation, the Manager has established a Valuation Committee responsible for supervising the fair valuation of portfolio securities and other assets and liabilities. The valuation procedures permit the Fund to utilize independent pricing vendor services, quotations from market makers, and alternative valuation methods when market quotations are either not readily available or not deemed representative of fair value. Fair value is the price that would be received to sell an asset or paid to transfer a liability in an orderly transaction between market participants on the measurement date. A record of the Valuation Committee’s actions is subject to the Board’s review at its first quarterly meeting following the quarter in which such actions take place.
| | |
| PGIM Absolute Return Bond Fund | | 85 |
Notes to Financial Statements (continued)
For the fiscal reporting year-end, securities and other assets and liabilities were fair valued at the close of the last U.S. business day. Trading in certain foreign securities may occur when the NYSE is closed (including weekends and holidays). Because such foreign securities trade in markets that are open on weekends and U.S. holidays, the values of some of the Fund’s foreign investments may change on days when investors cannot purchase or redeem Fund shares.
Various inputs determine how the Fund’s investments are valued, all of which are categorized according to the three broad levels (Level 1, 2, or 3) detailed in the Schedule of Investments and referred to herein as the “fair value hierarchy” in accordance with FASB ASC Topic 820 - Fair Value Measurements and Disclosures.
Common or preferred stocks, exchange-traded funds and derivative instruments, if applicable, that are traded on a national securities exchange are valued at the last sale price as of the close of trading on the applicable exchange where the security principally trades. Securities traded via NASDAQ are valued at the NASDAQ official closing price. To the extent these securities are valued at the last sale price or NASDAQ official closing price, they are classified as Level 1 in the fair value hierarchy. In the event that no sale or official closing price on valuation date exists, these securities are generally valued at the mean between the last reported bid and ask prices, or at the last bid price in the absence of an ask price. These securities are classified as Level 2 in the fair value hierarchy.
Investments in open-end funds (other than exchange-traded funds) are valued at their net asset values as of the close of the NYSE on the date of valuation. These securities are classified as Level 1 in the fair value hierarchy since they may be purchased or sold at their net asset values on the date of valuation.
Fixed income securities traded in the OTC market are generally classified as Level 2 in the fair value hierarchy. Such fixed income securities are typically valued using the market approach which generally involves obtaining data from an approved independent third-party vendor source. The Fund utilizes the market approach as the primary method to value securities when market prices of identical or comparable instruments are available. The third-party vendors’ valuation techniques used to derive the evaluated bid price are based on evaluating observable inputs, including but not limited to, yield curves, yield spreads, credit ratings, deal terms, tranche level attributes, default rates, cash flows, prepayment speeds, broker/dealer quotations and reported trades. Certain Level 3 securities are also valued using the market approach when obtaining a single broker quote or when utilizing transaction prices for identical securities that have been used in excess of five business days. During the reporting period, there were no changes to report with respect to the valuation approach and/or valuation techniques discussed above.
86
Bank loans are generally valued at prices provided by approved independent pricing vendors. The pricing vendors utilize broker/dealer quotations and provide prices based on the average of such quotations. Bank loans valued using such vendor prices are generally classified as Level 2 in the fair value hierarchy. Bank loans valued based on a single broker quote or at the original transaction price in excess of five business days are classified as Level 3 in the fair value hierarchy.
OTC and centrally cleared derivative instruments are generally classified as Level 2 in the fair value hierarchy. Such derivative instruments are typically valued using the market approach and/or income approach which generally involves obtaining data from an approved independent third-party vendor source. The Fund utilizes the market approach when quoted prices in broker-dealer markets are available but also includes consideration of alternative valuation approaches, including the income approach. In the absence of reliable market quotations, the income approach is typically utilized for purposes of valuing derivatives such as interest rate swaps based on a discounted cash flow analysis whereby the value of the instrument is equal to the present value of its future cash inflows or outflows. Such analysis includes projecting future cash flows and determining the discount rate (including the present value factors that affect the discount rate) used to discount the future cash flows. In addition, the third-party vendors’ valuation techniques used to derive the evaluated derivative price is based on evaluating observable inputs, including but not limited to, underlying asset prices, indices, spreads, interest rates and exchange rates. Certain derivatives may be classified as Level 3 when valued using the market approach by obtaining a single broker quote or when utilizing unobservable inputs in the income approach. During the reporting period, there were no changes to report with respect to the valuation approach and/or valuation techniques discussed above.
Securities and other assets that cannot be priced according to the methods described above are valued based on pricing methodologies approved by the Board. In the event that unobservable inputs are used when determining such valuations, the securities will be classified as Level 3 in the fair value hierarchy. Altering one or more unobservable inputs may result in a significant change to a Level 3 security’s fair value measurement.
When determining the fair value of securities, some of the factors influencing the valuation include: the nature of any restrictions on disposition of the securities; assessment of the general liquidity of the securities; the issuer’s financial condition and the markets in which it does business; the cost of the investment; the size of the holding and the capitalization of the issuer; the prices of any recent transactions or bids/offers for such securities or any comparable securities; any available analyst media or other reports or information deemed reliable by the Manager regarding the issuer or the markets or industry in which it operates. Using fair value to price securities may result in a value that is different from a security’s most recent closing price and from the price used by other unaffiliated mutual funds to calculate their net asset values.
Foreign Currency Translation: The books and records of the Fund are maintained in U.S. dollars. Foreign currency amounts are translated into U.S. dollars on the following basis:
| | |
| PGIM Absolute Return Bond Fund | | 87 |
Notes to Financial Statements (continued)
(i) market value of investment securities, other assets and liabilities — at the exchange rate as of the valuation date;
(ii) purchases and sales of investment securities, income and expenses — at the rates of exchange prevailing on the respective dates of such transactions.
Although the net assets of the Fund are presented at the foreign exchange rates and market values at the close of the period, the Fund does not generally isolate that portion of the results of operations arising as a result of changes in the foreign exchange rates from the fluctuations arising from changes in the market prices of long-term portfolio securities held at the end of the period. Similarly, the Fund does not isolate the effect of changes in foreign exchange rates from the fluctuations arising from changes in the market prices of long-term portfolio securities sold during the period. Accordingly, holding period unrealized and realized foreign currency gains (losses) are included in the reported Net change in unrealized appreciation (depreciation) on investments and Net realized gains (losses) on investment transactions on the Statements of Operations. Notwithstanding the above, the Fund does isolate the effect of fluctuations in foreign currency exchange rates when determining the gain (loss) upon the sale or maturity of foreign currency denominated debt obligations; such amounts are included in net realized gains (losses) on foreign currency transactions.
Additionally, net realized gains (losses) on foreign currency transactions represent net foreign exchange gains (losses) from the disposition of holdings of foreign currencies, currency gains (losses) realized between the trade and settlement dates on investment transactions, and the difference between the amounts of interest, dividends and foreign withholding taxes recorded on the Fund’s books and the U.S. dollar equivalent amounts actually received or paid. Net unrealized currency gains (losses) arise from valuing foreign currency denominated assets and liabilities (other than investments) at period end exchange rates.
Forward and Cross Currency Contracts: A forward currency contract is a commitment to purchase or sell a foreign currency at a future date at a negotiated forward rate. The Fund enters into forward currency contracts, as defined in the prospectus, in order to hedge its exposure to changes in foreign currency exchange rates on its foreign portfolio holdings or on specific receivables and payables denominated in a foreign currency and to gain exposure to certain currencies. The contracts are valued daily at current forward exchange rates and any unrealized gain (loss) is included in net unrealized appreciation or depreciation on forward and cross currency contracts. Gain (loss) is realized on the settlement date of the contract equal to the difference between the settlement value of the original and negotiated forward contracts. This gain (loss), if any, is included in net realized gain (loss) on forward and cross currency contract transactions. Risks may arise upon
88
entering into these contracts from the potential inability of the counterparties to meet the terms of their contracts. Forward currency contracts involve risks from currency exchange rate and credit risk in excess of the amounts reflected on the Statement of Assets and Liabilities. The Fund’s maximum risk of loss from counterparty credit risk is the net value of the cash flows to be received from the counterparty at the end of the contract’s life. A cross currency contract is a forward contract where a specified amount of one foreign currency will be exchanged for a specified amount of another foreign currency.
Options: The Fund purchased and/or wrote options in order to hedge against adverse market movements or fluctuations in value caused by changes in prevailing interest rates, value of equities or foreign currency exchange rates with respect to securities or financial instruments which the Fund currently owns or intends to purchase. The Fund may also use options to gain additional market exposure. The Fund’s principal reason for writing options is to realize, through receipt of premiums, a greater current return than would be realized on the underlying security alone. When the Fund purchases an option, it pays a premium and an amount equal to that premium is recorded as an asset. When the Fund writes an option, it receives a premium and an amount equal to that premium is recorded as a liability. The asset or liability is adjusted daily to reflect the current market value of the option. If an option expires unexercised, the Fund realizes a gain (loss) to the extent of the premium received or paid. If an option is exercised, the premium received or paid is recorded as an adjustment to the proceeds from the sale or the cost of the purchase in determining whether the Fund has realized a gain (loss). The difference between the premium and the amount received or paid at the closing of a purchase or sale transaction is also treated as a realized gain (loss). Gain (loss) on purchased options is included in net realized gain (loss) on investment transactions. Gain (loss) on written options is presented separately as net realized gain (loss) on options written transactions.
The Fund, as writer of an option, may have no control over whether the underlying securities or financial instruments may be sold (called) or purchased (put). As a result, the Fund bears the market risk of an unfavorable change in the price of the security or financial instrument underlying the written option. The Fund, as purchaser of an OTC option, bears the risk of the potential inability of the counterparties to meet the terms of their contracts. With exchange-traded options contracts, there is minimal counterparty credit risk to the Fund since the exchanges’ clearinghouse acts as counterparty to all exchange-traded options and guarantees the options contracts against default.
When the Fund writes an option on a swap, an amount equal to any premium received by the Fund is recorded as a liability and is subsequently adjusted to the current market value of the written option on the swap. If a call option on a swap is exercised, the Fund becomes obligated to pay a fixed interest rate (noted as the strike price) and receive a variable interest rate on a notional amount. If a put option on a swap is exercised, the Fund becomes obligated to pay a variable interest rate and receive a fixed interest rate (noted as the strike price) on a notional amount. Premiums received from writing options on swaps that expire or are exercised are treated as realized gains upon the expiration or exercise of such options on
| | |
| PGIM Absolute Return Bond Fund | | 89 |
Notes to Financial Statements (continued)
swaps. The risk associated with writing put and call options on swaps is that the Fund will be obligated to be party to a swap agreement if an option on a swap is exercised.
Financial Futures Contracts: A financial futures contract is an agreement to purchase (long) or sell (short) an agreed amount of securities at a set price for delivery on a future date. Upon entering into a financial futures contract, the Fund is required to pledge to the broker an amount of cash and/or other assets equal to a certain percentage of the contract amount. This amount is known as the “initial margin.” Subsequent payments, known as “variation margin,” are made or received by the Fund each day, depending on the daily fluctuations in the value of the underlying security. Such variation margin is recorded for financial statement purposes on a daily basis as unrealized gain (loss). When the contract expires or is closed, the gain (loss) is realized and is presented in the Statement of Operations as net realized gain (loss) on futures transactions.
The Fund invested in financial futures contracts in order to hedge its existing portfolio securities, or securities the Fund intends to purchase, against fluctuations in value caused by changes in prevailing interest rates. Should interest rates move unexpectedly, the Fund may not achieve the anticipated benefits of the financial futures contracts and may realize a loss. The use of futures transactions involves the risk of imperfect correlation in movements in the price of futures contracts, interest rates and the underlying hedged assets. Since futures contracts are exchange-traded, there is minimal counterparty credit risk to the Fund since the exchanges’ clearinghouse acts as counterparty to all exchange-traded futures and guarantees the futures contracts against default.
Swap Agreements: The Fund entered into certain types of swap agreements detailed in the disclosures below. A swap agreement is an agreement to exchange the return generated by one instrument for the return generated by another instrument. Swap agreements are negotiated in the OTC market and may be executed either directly with a counterparty (“OTC-traded”) or through a central clearing facility, such as a registered exchange. Swap agreements are valued daily at current market value and any change in value is included in the net unrealized appreciation or depreciation on swap agreements. Centrally cleared swaps pay or receive an amount known as “variation margin”, based on daily changes in the valuation of the swap contract. For OTC-traded, upfront premiums paid and received are shown as swap premiums paid and swap premiums received in the Statement of Assets and Liabilities. Risk of loss may exceed amounts recognized on the Statement of Assets and Liabilities. Swap agreements outstanding at period end, if any, are listed on the Schedule of Investments.
Interest Rate Swaps: Interest rate swaps represent an agreement between counterparties to exchange cash flows based on the difference between two interest rates, applied to a notional principal amount for a specified period. The Fund is subject to interest rate risk
90
exposure in the normal course of pursuing its investment objective. The Fund used interest rate swaps to maintain its ability to generate steady cash flow by receiving a stream of fixed rate payments or to increase exposure to prevailing market rates by receiving floating rate payments. The Fund’s maximum risk of loss from counterparty credit risk is the discounted net present value of the cash flows to be received from the counterparty over the contract’s remaining life.
Inflation Swaps: The Fund entered into inflation swap agreements to protect against fluctuations in inflation rates. Inflation swaps are characterized by one party paying a fixed rate in exchange for a floating rate that is derived from an inflation index, such as the Consumer Price Index or UK Retail Price Index. Inflation swaps subject the Fund to interest rate risk.
Credit Default Swaps (“CDS”): CDS involve one party (the protection buyer) making a stream of payments to another party (the protection seller) in exchange for the right to receive a specified payment in the event of a default or as a result of a default (collectively a “credit event”) for the referenced entity (typically corporate issues or sovereign issues of an emerging country) on its obligation; or in the event of a write-down, principal shortfall, interest shortfall or default of all or part of the referenced entities comprising a credit index.
The Fund is subject to credit risk in the normal course of pursuing its investment objectives, and as such, has entered into CDS contracts to provide a measure of protection against defaults or to take an active long or short position with respect to the likelihood of a particular issuer’s default or the reference entity’s credit soundness. CDS contracts generally trade based on a spread which represents the cost a protection buyer has to pay the protection seller. The protection buyer is said to be short the credit as the value of the contract rises the more the credit deteriorates. The value of the CDS contract increases for the protection buyer if the spread increases. The Fund’s maximum risk of loss from counterparty credit risk for purchased CDS is the inability of the counterparty to honor the contract up to the notional value due to a credit event.
As a seller of protection on credit default swap agreements, the Fund generally receives an agreed upon payment from the buyer of protection throughout the term of the swap, provided no credit event occurs. As the seller, the Fund effectively increases its investment risk because, in addition to its total net assets, the Fund may be subject to investment exposure on the notional amount of the swap.
The maximum amount of the payment that the Fund, as a seller of protection, could be required to make under a credit default swap agreement would be equal to the notional amount of the underlying security or index contract as a result of a credit event. This potential amount will be partially offset by any recovery values of the respective referenced obligations, or net amounts received from the settlement of buy protection credit default swap agreements which the Fund entered into for the same referenced entity or index. As a buyer of protection, the Fund generally receives an amount up to the notional value of the swap if a credit event occurs.
| | |
| PGIM Absolute Return Bond Fund | | 91 |
Notes to Financial Statements (continued)
Implied credit spreads, represented in absolute terms, utilized in determining the market value of credit default swap agreements where the Fund is the seller of protection as of period end are disclosed in the footnotes to the Schedule of Investments, if applicable. These spreads serve as indicators of the current status of the payment/performance risk and represent the likelihood of default risk for the credit derivative. The implied credit spread of a particular referenced entity reflects the cost of buying/selling protection and may include upfront payments required to enter into the agreement. Wider credit spreads and increased market value in absolute terms, when compared to the notional amount of the swap, represent a deterioration of the referenced entity’s credit soundness and a greater likelihood of risk of default or other credit event occurring as defined under the terms of the agreement.
Total Return Swaps: In a total return swap, one party receives payments based on the market value of the security or the commodity involved, or total return of a specific referenced asset, such as an equity, index or bond, and in return pays a defined amount. The Fund is subject to risk exposures associated with the referenced asset in the normal course of pursuing its investment objectives. The Fund entered into total return swaps to manage its exposure to a security or an index. The Fund’s maximum risk of loss from counterparty credit risk is the change in the value of the security, in the Fund’s favor, from the point of entering into the contract.
Bank Loans: The Fund invested in bank loans. Bank loans include fixed and floating rate loans that are privately negotiated between a corporate borrower and one or more financial institutions, including, but not limited to, term loans, revolvers, and other instruments issued in the bank loan market. The Fund acquires interests in loans directly (by way of assignment from the selling institution) and/or indirectly (by way of the purchase of a participation interest from the selling institution). Under a bank loan assignment, the Fund generally will succeed to all the rights and obligations of an assigning lending institution and becomes a lender under the loan agreement with the relevant borrower in connection with that loan. Under a bank loan participation, the Fund generally will have a contractual relationship only with the lender, not with the relevant borrower. As a result, the Fund generally will have the right to receive payments of principal, interest, and any fees to which it is entitled only from the lender selling the participation and only upon receipt by the lender of the payments from the relevant borrower. The Fund may not directly benefit from the collateral supporting the debt obligation in which it has purchased the participation. As a result, the Fund will assume the credit risk of both the borrower and the institution selling the participation to the Fund.
Mortgage-Backed and Asset-Backed Securities: Mortgage-backed securities are pass-through securities, meaning that principal and interest payments made by the borrower on the underlying mortgages are passed through to the Fund. Asset-backed securities directly or indirectly represent a participation interest in, or are secured by and
92
payable from, a stream of payments generated by particular assets such as motor vehicle or credit card receivables. Asset-backed securities may be classified as pass-through certificates or collateralized obligations, such as collateralized bond obligations, collateralized loan obligations and other similarly structured securities. The value of mortgage-backed and asset-backed securities varies with changes in interest rates and may be affected by changes in credit quality or value of the mortgage loans or other assets that support the securities.
Stripped mortgage-backed securities are usually structured with two classes that receive different proportions of the interest (“IO”) and principal (“PO”) distributions on a pool of mortgage assets. Payments received for IOs are included in interest income on the Statements of Operations. Because no principal will be received at the maturity of an IO, adjustments are made to the cost of the security on a monthly basis until maturity. These adjustments are included in interest income on the Statements of Operations. Payments received for POs are treated as reductions to the cost and par value of the securities.
Master Netting Arrangements: The RIC, on behalf of the Fund, is subject to various Master Agreements, or netting arrangements, with select counterparties. These are agreements which a subadviser may have negotiated and entered into on behalf of all or a portion of the Fund. A master netting arrangement between the Fund and the counterparty permits the Fund to offset amounts payable by the Fund to the same counterparty against amounts to be received; and by the receipt of collateral from the counterparty by the Fund to cover the Fund’s exposure to the counterparty. However, there is no assurance that such mitigating factors are easily enforceable. In addition to master netting arrangements, the right to set-off exists when all the conditions are met such that each of the parties owes the other determinable amounts, the reporting party has the right to set-off the amount owed with the amount owed by the other party, the reporting party intends to set-off and the right of set-off is enforceable by law.
The RIC, on behalf of the Fund, is a party to International Swaps and Derivatives Association, Inc. (“ISDA”) Master Agreements with certain counterparties that govern OTC derivative and foreign exchange contracts entered into from time to time. The Master Agreements may contain provisions regarding, among other things, the parties’ general obligations, representations, agreements, collateral requirements, events of default and early termination. With respect to certain counterparties, in accordance with the terms of the Master Agreements, collateral posted to the Fund is held in a segregated account by the Fund’s custodian and with respect to those amounts which can be sold or re-pledged, is presented in the Schedule of Investments. Collateral pledged by the Fund is segregated by the Fund’s custodian and identified in the Schedule of Investments. Collateral can be in the form of cash or debt securities issued by the U.S. Government or related agencies or other securities as agreed to by the Fund and the applicable counterparty. Collateral requirements are determined based on the Fund’s net position with each counterparty. Termination events applicable to the Fund may occur upon a decline in the Fund’s net assets below a specified threshold over a certain period of time. Termination events applicable to counterparties may occur upon a decline in the counterparty’s long-term and short-term credit ratings below a
| | |
| PGIM Absolute Return Bond Fund | | 93 |
Notes to Financial Statements (continued)
specified level. In each case, upon occurrence, the other party may elect to terminate early and cause settlement of all derivative and foreign exchange contracts outstanding, including the payment of any losses and costs resulting from such early termination, as reasonably determined by the terminating party. Any decision by one or more of the Fund’s counterparties to elect early termination could impact the Fund’s future derivative activity.
In addition to each instrument’s primary underlying risk exposure (e.g. interest rate, credit, equity or foreign exchange, etc.), swap agreements involve, to varying degrees, elements of credit, market and documentation risk. Such risks involve the possibility that no liquid market for these agreements will exist, the counterparty to the agreement may default on its obligation to perform or disagree on the contractual terms of the agreement, and changes in net interest rates will be unfavorable. In connection with these agreements, securities in the portfolio may be identified or received as collateral from the counterparty in accordance with the terms of the respective swap agreements to provide or receive assets of value and to serve as recourse in the event of default or bankruptcy/insolvency of either party. Such OTC derivative agreements include conditions which, when materialized, give the counterparty the right to cause an early termination of the transactions under those agreements. Any election by the counterparty for early termination of the contract(s) may impact the amounts reported on financial statements.
Short sales and OTC contracts, including forward foreign currency exchange contracts, swaps, forward rate agreements and written options involve elements of both market and credit risk in excess of the amounts reflected on the Statement of Assets and Liabilities, if applicable. Such risks may be mitigated by engaging in master netting arrangements.
Warrants: The Fund held warrants acquired either through a direct purchase or pursuant to corporate actions. Warrants entitle the holder to buy a proportionate amount of common stock, or such other security that the issuer may specify, at a specific price and time through the expiration dates. Such warrants are held as long positions by the Fund until exercised, sold or expired. Warrants are valued at fair value in accordance with the Board approved fair valuation procedures.
Payment-In-Kind: The Fund invested in the open market or received pursuant to debt restructuring, securities that pay-in-kind (PIK) the interest due on such debt instruments. The PIK interest, computed at the contractual rate specified, is added to the existing principal balance of the debt when issued bonds have same terms as the bond or recorded as a separate bond when terms are different from the existing debt, and is recorded as interest income.
Securities Lending: The Fund lends its portfolio securities to banks and broker-dealers. The loans are secured by collateral at least equal to the market value of the securities loaned.
94
Collateral pledged by each borrower is invested in an affiliated money market fund and is marked to market daily, based on the previous day’s market value, such that the value of the collateral exceeds the value of the loaned securities. In the event of significant appreciation in value of securities on loan on the last business day of the reporting period, the financial statements may reflect a collateral value that is less than the market value of the loaned securities. Such shortfall is remedied as described above. Loans are subject to termination at the option of the borrower or the Fund. Upon termination of the loan, the borrower will return to the Fund securities identical to the loaned securities. The remaining maturities of the securities lending transactions are considered overnight and continuous. Should the borrower of the securities fail financially, the Fund has the right to repurchase the securities in the open market using the collateral.
The Fund recognizes income, net of any rebate and securities lending agent fees, for lending its securities in the form of fees or interest on the investment of any cash received as collateral. The borrower receives all interest and dividends from the securities loaned and such payments are passed back to the lender in amounts equivalent thereto, which are reflected in interest income or unaffiliated dividend income based on the nature of the payment on the Statement of Operations. The Fund also continues to recognize any unrealized gain (loss) in the market price of the securities loaned and on the change in the value of the collateral invested that may occur during the term of the loan. In addition, realized gain (loss) is recognized on changes in the value of the collateral invested upon liquidation of the collateral. Net earnings from securities lending are disclosed in the Statement of Operations.
Securities Transactions and Net Investment Income: Securities transactions are recorded on the trade date. Realized gains (losses) from investment and currency transactions are calculated on the specific identification method. Dividend income is recorded on the ex-date, or for certain foreign securities, when the Fund becomes aware of such dividends. Interest income, including amortization of premium and accretion of discount on debt securities, as required, is recorded on the accrual basis. Expenses are recorded on an accrual basis, which may require the use of certain estimates by management that may differ from actual. Net investment income or loss (other than class specific expenses and waivers, which are allocated as noted below) and unrealized and realized gains (losses) are allocated daily to each class of shares based upon the relative proportion of adjusted net assets of each class at the beginning of the day. Class specific expenses and waivers, where applicable, are charged to the respective share classes. Such class specific expenses and waivers include distribution fees and distribution fee waivers, shareholder servicing fees, transfer agent’s fees and expenses, registration fees and fee waivers and/or expense reimbursements, as applicable.
Taxes: It is the Fund’s policy to continue to meet the requirements of the Internal Revenue Code applicable to regulated investment companies and to distribute all of its taxable net investment income and capital gains, if any, to its shareholders. Therefore, no federal
| | |
| PGIM Absolute Return Bond Fund | | 95 |
Notes to Financial Statements (continued)
income tax provision is required. Withholding taxes on foreign dividends, interest and capital gains, if any, are recorded, net of reclaimable amounts, at the time the related income is earned.
Dividends and Distributions: The Fund expects to declare dividends of its net investment income daily and pay such dividends monthly. Distributions of net realized capital and currency gains, if any, are declared and paid at least annually. Dividends and distributions to shareholders, which are determined in accordance with federal income tax regulations and which may differ from GAAP, are recorded on the ex-date. Permanent book/tax differences relating to income and gain (loss) are reclassified between total distributable earnings (loss) and paid-in capital in excess of par, as appropriate.
Estimates: The preparation of financial statements requires management to make estimates and assumptions that affect the reported amounts and disclosures in the financial statements. Actual results could differ from those estimates.
The RIC, on behalf of the Fund, has a management agreement with the Manager. Pursuant to this agreement, the Manager has responsibility for all investment advisory services and supervises the subadvisers’ performance of such services.
The Manager has entered into a subadvisory agreement with PGIM, Inc., which provides subadvisory services to the Fund through its business unit PGIM Fixed Income, and PGIM Limited (each a “subadviser” and collectively the “subadvisers”). The Manager pays for the services of the subadvisers.
The management fee paid to the Manager is accrued daily and payable monthly at an annual rate of 0.59% of the Fund’s average daily net assets up to and including $2.5 billion, 0.565% of the next $2.5 billion and 0.54% of the average daily net in excess of $5 billion. The effective management fee rate before any waivers and/or expense reimbursements was 0.59% for the year ended October 31, 2021.
The Manager has contractually agreed, through February 28, 2023, to limit total annual operating expenses after fee waivers and/or expense reimbursements to 0.73% of average daily net assets for Class Z shares and 0.70% of average daily net assets for Class R6 shares. This contractual waiver excludes interest, brokerage, taxes (such as income and foreign withholdings taxes, stamp duty and deferred tax expenses), acquired fund fees and expenses, extraordinary expenses, and certain other Fund expenses such as dividend and interest expense and broker charges on short sales.
96
Where applicable, the Manager agrees to waive management fees or shared operating expenses on any share class to the same extent that it waives such expenses on any other share class. In addition, total annual operating expenses for Class R6 shares will not exceed total annual operating expenses for Class Z shares. Fees and/or expenses waived and/or reimbursed by the Manager may be recouped by the Manager within the same fiscal year during which such waiver and/or reimbursement is made if such recoupment can be realized without exceeding the expense limit in effect at the time of the recoupment for that fiscal year.
The RIC, on behalf of the Fund, has a distribution agreement with Prudential Investment Management Services LLC (“PIMS”), which acts as the distributor of the Class A, Class C, Class Z and Class R6 shares of the Fund. The Fund compensates PIMS for distributing and servicing the Fund’s Class A and Class C shares, pursuant to the plans of distribution (the “Distribution Plans”), regardless of expenses actually incurred by PIMS.
Pursuant to the Distribution Plans, the Fund compensates PIMS for distribution related activities at an annual rate of up to 0.25% and 1% of the average daily net assets of the Class A and Class C shares, respectively. The distribution fees are accrued daily and payable monthly. No distribution or service fees are paid to PIMS as distributor of the Class Z or Class R6 shares of the Fund.
For the year ended October 31, 2021, PIMS received $33,354 in front-end sales charges resulting from sales of Class A shares. Additionally, for the year ended October 31, 2021, PIMS received $2,808 and $1,523 in contingent deferred sales charges imposed upon redemptions by certain Class A and Class C shareholders, respectively. From these fees, PIMS paid such sales charges to broker-dealers, who in turn paid commissions to salespersons and incurred other distribution costs.
PGIM Investments, PGIM, Inc., PGIM Limited and PIMS are indirect, wholly-owned subsidiaries of Prudential Financial, Inc. (“Prudential”).
| 4. | Other Transactions with Affiliates |
Prudential Mutual Fund Services LLC (“PMFS”), an affiliate of PGIM Investments and an indirect, wholly-owned subsidiary of Prudential, serves as the Fund’s transfer agent. Transfer agent’s fees and expenses in the Statement of Operations include certain out-of-pocket expenses paid to non-affiliates, where applicable.
The Fund may invest its overnight sweep cash in the PGIM Core Ultra Short Bond Fund (the “Core Fund”), and its securities lending cash collateral in the PGIM Institutional Money Market Fund (the “Money Market Fund”), each a fund of Prudential Investment Portfolios 2, registered under the 1940 Act and managed by PGIM Investments. PGIM Investments and/or its affiliates are paid fees or reimbursed for providing their services to the Core Fund and the Money Market Fund. In addition to the realized and unrealized gains on investments in the Core Fund and Money Market Fund, earnings from such investments are disclosed on
| | |
| PGIM Absolute Return Bond Fund | | 97 |
Notes to Financial Statements (continued)
the Statement of Operations as “Affiliated dividend income” and “Income from securities lending, net”, respectively.
The Fund may enter into certain securities purchase or sale transactions under Board approved Rule 17a-7 procedures. Rule 17a-7 is an exemptive rule under the 1940 Act, that subject to certain conditions, permits purchase and sale transactions among affiliated investment companies, or between an investment company and a person that is affiliated solely by reason of having a common (or affiliated) investment adviser, common directors/trustees, and/or common officers. For the year ended October 31, 2021, no 17a-7 transactions were entered into by the Fund.
The aggregate cost of purchases and proceeds from sales of portfolio securities (excluding short-term investments and U.S. Government securities) for the year ended October 31, 2021, were $330,970,152 and $893,690,548, respectively.
A summary of the cost of purchases and proceeds from sales of shares of affiliated mutual funds for the year ended October 31, 2021, is presented as follows:
| | | | | | | | | | | | | | | | | | | | | | | | | | | | | | | | | | | | | | | | | | | | | | | | | | | | | | | | | | | | | | | | | | |
Value,
Beginning of Year | | Cost of
Purchases | | | Proceeds
from Sales | | | Change in
Unrealized
Gain (Loss) | | | Realized
Gain (Loss) | | | Value,
End of Year | | | Shares, End of Year | | | | | | Income | |
| | | | | | | | | | | | | | | | | | | | | | | | | | | |
Short-Term Investments - Affiliated Mutual Funds: | | | | | | | | | | | | | | | | | |
PGIM Core Ultra Short Bond Fund (1)(wa) | | | | | | | | | | | | | | | | | |
$ 55,453,161 | | | | $ | 565,841,806 | | | | | | | | | $ | 493,874,777 | | | | | | | | | $ | — | | | | | | | | | $ | — | | | | | | | | | | | | | $ | 127,420,190 | | | | | | | | 127,420,190 | | | | | | | $ | 112,512 | |
PGIM Institutional Money Market Fund (1)(b)(wa) | | | | | | | | | | | | | | | | | | | | | | | | | | | | | | | | | | | | | | | | | | | | | | | | | | | |
67,705,814 | | | | | 107,439,789 | | | | | | | | | | 160,385,991 | | | | | | | | | | (36,187 | ) | | | | | | | | | 26,854 | | | | | | | | | | | | | | 14,750,279 | | | | | | | | 14,759,135 | | | | | | | | 14,988 | (2) |
| | | | | | | | | | | | | | | | | | | | | | | | | | | | | | | | | | | | | | | | | | | | | | | | | | | | | | | | | | | | | | | | | | |
$123,158,975 | | | | $ | 673,281,595 | | | | | | | | | $ | 654,260,768 | | | | | | | | | $ | (36,187 | ) | | | | | | | | $ | 26,854 | | | | | | | | | | | | | $ | 142,170,469 | | | | | | | | | | | | | | | $ | 127,500 | |
| | | | | | | | | | | | | | | | | | | | | | | | | | | | | | | | | | | | | | | | | | | | | | | | | | | | | | | | | | | | | | | | | | |
| (1) | The Fund did not have any capital gain distributions during the reporting period. |
| (2) | The amount, or a portion thereof, represents the affiliated securities lending income shown on the Statement of Operations. |
| (b) | Represents security, or portion thereof, purchased with cash collateral received for securities on loan and includes dividend reinvestment. |
| (wa) | PGIM Investments LLC, the manager of the Fund, also serves as manager of the PGIM Core Ultra Short Bond Fund and PGIM Institutional Money Market Fund, if applicable. |
| 6. | Distributions and Tax Information |
Distributions to shareholders, which are determined in accordance with federal income tax regulations and which may differ from GAAP, are recorded on the ex-date.
98
For the year ended October 31, 2021, the tax character of dividends paid by the Fund were $27,842,762 of ordinary income and $1,252,077 of tax return of capital. For the year ended October 31, 2020, the tax character of dividends paid by the Fund were $77,796,085 of ordinary income, $50,211,567 of long-term capital gains and $7,705,628 of tax return of capital.
As of October 31, 2021, there were no accumulated undistributed earnings on a tax basis.
The United States federal income tax basis of the Fund’s investments and the net unrealized appreciation as of October 31, 2021 were as follows:
| | | | | | |
| Tax Basis | | Gross
Unrealized
Appreciation | | Gross
Unrealized
Depreciation | | Net
Unrealized
Appreciation |
| | | |
| $961,539,979 | | $75,171,853 | | $(65,771,104) | | $9,400,749 |
The differences between GAAP and tax basis were primarily attributable to deferred losses on wash sales, straddle loss deferral, future and forward contracts, difference in the treatment of premium amortization and other cost basis differences between financial and tax accounting.
For federal income tax purposes, the Fund had a capital loss carryforward as of October 31, 2021 of approximately $255,711,000 which can be carried forward for an unlimited period. The Fund utilized approximately $31,192,000 of its capital loss carryforward to offset net taxable gains realized in the fiscal year ended October 31, 2021. No capital gains distributions are expected to be paid to shareholders until net gains have been realized in excess of such losses.
The Manager has analyzed the Fund’s tax positions taken on federal, state and local income tax returns for all open tax years and has concluded that no provision for income tax is required in the Fund’s financial statements for the current reporting period. Since tax authorities can examine previously filed tax returns, the Fund’s U.S. federal and state tax returns for each of the four fiscal years up to the most recent fiscal year ended October 31, 2021 are subject to such review.
The Fund offers Class A, Class C, Class Z and Class R6 shares. Class A shares are sold with a maximum front-end sales charge of 3.25%. Investors who purchase $500,000 or more of Class A shares and sell those shares within 12 months of purchase are subject to a contingent deferred sales charge (“CDSC”) of 1.00% on sales although these purchases are not subject to a front-end sales charge. The Class A CDSC is waived for certain retirement and/or benefit plans. A special exchange privilege is also available for shareholders who qualified to purchase Class A shares at net asset value. Class C shares are sold with a CDSC of 1% on sales made within 12 months of purchase. Class C shares will automatically convert to Class A shares on a monthly basis approximately eight years (ten years prior to
| | |
| PGIM Absolute Return Bond Fund | | 99 |
Notes to Financial Statements (continued)
January 22, 2021) after purchase. Class Z and Class R6 shares are not subject to any sales or redemption charges and are available exclusively for sale to a limited group of investors.
Under certain circumstances, an exchange may be made from specified share classes of the Fund to one or more other share classes of the Fund as presented in the table of transactions in shares of beneficial interest, below.
The RIC has authorized an unlimited number of shares of beneficial interest of the Fund at $0.001 par value per share, currently divided into four classes, designated Class A, Class C, Class Z and Class R6.
As of October 31, 2021, Prudential, through its affiliated entities, including affiliated funds (if applicable), owned shares of the Fund as follows:
| | | | |
| | | Number of Shares | | Percentage of
Outstanding Shares |
Class A | | 1,230 | | 0.1% |
Class R6 | | 496 | | 0.1% |
At the reporting period end, the number of shareholders holding greater than 5% of the Fund are as follows:
| | | | | | |
| Affiliated | | Unaffiliated |
Number of Shareholders | | Percentage of Outstanding Shares | | Number of Shareholders | | Percentage of Outstanding Shares |
— | | —% | | 8 | | 85.1% |
Transactions in shares of beneficial interest were as follows:
| | | | | | | | |
Class A | | Shares | | | Amount | |
Year ended October 31, 2021: | | | | | | | | |
Shares sold | | | 2,519,737 | | | $ | 23,342,981 | |
Shares issued in reinvestment of dividends and distributions | | | 219,481 | | | | 2,028,875 | |
Shares purchased | | | (2,990,518 | ) | | | (27,622,965 | ) |
| | | | | | | | |
Net increase (decrease) in shares outstanding before conversion | | | (251,300 | ) | | | (2,251,109 | ) |
Shares issued upon conversion from other share class(es) | | | 2,491,992 | | | | 23,060,684 | |
Shares purchased upon conversion into other share class(es) | | | (818,387 | ) | | | (7,550,819 | ) |
| | | | | | | | |
Net increase (decrease) in shares outstanding | | | 1,422,305 | | | $ | 13,258,756 | |
| | | | | | | | |
Year ended October 31, 2020: | | | | | | | | |
Shares sold | | | 2,243,953 | | | $ | 21,064,704 | |
Shares issued in reinvestment of dividends and distributions | | | 702,042 | | | | 6,493,794 | |
Shares purchased | | | (8,361,282 | ) | | | (75,010,614 | ) |
| | | | | | | | |
Net increase (decrease) in shares outstanding before conversion | | | (5,415,287 | ) | | | (47,452,116 | ) |
Shares issued upon conversion from other share class(es) | | | 1,958,960 | | | | 17,647,740 | |
Shares purchased upon conversion into other share class(es) | | | (758,117 | ) | | | (6,884,424 | ) |
| | | | | | | | |
Net increase (decrease) in shares outstanding | | | (4,214,444 | ) | | $ | (36,688,800 | ) |
| | | | | | | | |
100
| | | | | | | | |
Class C | | Shares | | | Amount | |
Year ended October 31, 2021: | | | | | | | | |
Shares sold | | | 522,542 | | | $ | 4,851,562 | |
Shares issued in reinvestment of dividends and distributions | | | 92,283 | | | | 855,331 | |
Shares purchased | | | (1,354,330 | ) | | | (12,530,754 | ) |
| | | | | | | | |
Net increase (decrease) in shares outstanding before conversion | | | (739,505 | ) | | | (6,823,861 | ) |
Shares purchased upon conversion into other share class(es) | | | (2,055,211 | ) | | | (19,078,475 | ) |
| | | | | | | | |
Net increase (decrease) in shares outstanding | | | (2,794,716 | ) | | $ | (25,902,336 | ) |
| | | | | | | | |
Year ended October 31, 2020: | | | | | | | | |
Shares sold | | | 1,044,937 | | | $ | 9,891,988 | |
Shares issued in reinvestment of dividends and distributions | | | 484,618 | | | | 4,503,808 | |
Shares purchased | | | (3,370,027 | ) | | | (30,048,689 | ) |
| | | | | | | | |
Net increase (decrease) in shares outstanding before conversion | | | (1,840,472 | ) | | | (15,652,893 | ) |
Shares purchased upon conversion into other share class(es) | | | (1,323,308 | ) | | | (11,991,854 | ) |
| | | | | | | | |
Net increase (decrease) in shares outstanding | | | (3,163,780 | ) | | $ | (27,644,747 | ) |
| | | | | | | | |
Class Z | | | | | | |
Year ended October 31, 2021: | | | | | | | | |
Shares sold | | | 35,120,093 | | | $ | 326,191,894 | |
Shares issued in reinvestment of dividends and distributions | | | 2,091,073 | | | | 19,407,546 | |
Shares purchased | | | (72,927,948 | ) | | | (678,007,297 | ) |
| | | | | | | | |
Net increase (decrease) in shares outstanding before conversion | | | (35,716,782 | ) | | | (332,407,857 | ) |
Shares issued upon conversion from other share class(es) | | | 1,152,690 | | | | 10,687,873 | |
Shares purchased upon conversion into other share class(es) | | | (1,888,354 | ) | | | (17,538,221 | ) |
| | | | | | | | |
Net increase (decrease) in shares outstanding | | | (36,452,446 | ) | | $ | (339,258,205 | ) |
| | | | | | | | |
Year ended October 31, 2020: | | | | | | | | |
Shares sold | | | 55,818,116 | | | $ | 514,284,414 | |
Shares issued in reinvestment of dividends and distributions | | | 10,545,887 | | | | 98,207,067 | |
Shares purchased | | | (156,061,496 | ) | | | (1,385,774,048 | ) |
| | | | | | | | |
Net increase (decrease) in shares outstanding before conversion | | | (89,697,493 | ) | | | (773,282,567 | ) |
Shares issued upon conversion from other share class(es) | | | 1,109,004 | | | | 10,112,512 | |
Shares purchased upon conversion into other share class(es) | | | (993,497 | ) | | | (8,975,234 | ) |
| | | | | | | | |
Net increase (decrease) in shares outstanding | | | (89,581,986 | ) | | $ | (772,145,289 | ) |
| | | | | | | | |
Class R6 | | | | | | |
Year ended October 31, 2021: | | | | | | | | |
Shares sold | | | 444,812 | | | $ | 4,053,717 | |
Shares issued in reinvestment of dividends and distributions | | | 299,248 | | | | 2,762,297 | |
Shares purchased | | | (9,656,641 | ) | | | (89,403,883 | ) |
| | | | | | | | |
Net increase (decrease) in shares outstanding before conversion | | | (8,912,581 | ) | | | (82,587,869 | ) |
Shares issued upon conversion from other share class(es) | | | 1,126,351 | | | | 10,418,958 | |
| | | | | | | | |
Net increase (decrease) in shares outstanding | | | (7,786,230 | ) | | $ | (72,168,911 | ) |
| | | | | | | | |
Year ended October 31, 2020: | | | | | | | | |
Shares sold | | | 7,945,717 | | | $ | 66,069,330 | |
Shares issued in reinvestment of dividends and distributions | | | 714,105 | | | | 6,509,693 | |
Shares purchased | | | (2,844,041 | ) | | | (25,176,648 | ) |
| | | | | | | | |
| | |
Net increase (decrease) in shares outstanding before conversion | | | 5,815,781 | | | | 47,402,375 | |
Shares issued upon conversion from other share class(es) | | | 10,839 | | | | 92,181 | |
Shares purchased upon conversion into other share class(es) | | | (110 | ) | | | (921 | ) |
| | | | | | | | |
Net increase (decrease) in shares outstanding | | | 5,826,510 | | | $ | 47,493,635 | |
| | | | | | | | |
| | |
| PGIM Absolute Return Bond Fund | | 101 |
Notes to Financial Statements (continued)
The RIC, on behalf of the Fund, along with other affiliated registered investment companies (the “Participating Funds”), is a party to a Syndicated Credit Agreement (“SCA”) with a group of banks. The purpose of the SCA is to provide an alternative source of temporary funding for capital share redemptions. The table below provides details of the current SCA in effect at the reporting period-end as well as the prior SCA.
| | | | |
| | | Current SCA | | Prior SCA |
Term of Commitment | | 10/1/2021 – 9/29/2022 | | 10/2/2020 – 9/30/2021 |
Total Commitment | | $ 1,200,000,000 | | $ 1,200,000,000 |
Annualized Commitment Fee on the Unused Portion of the SCA | | 0.15% | | 0.15% |
Annualized Interest Rate on Borrowings | | 1.20% plus the higher of (1) the effective federal funds rate, (2) the one-month LIBOR rate or (3) zero percent | | 1.30% plus the higher of (1) the effective federal funds rate, (2) the one-month LIBOR rate or (3) zero percent |
Certain affiliated registered investment companies that are parties to the SCA include portfolios that are subject to a predetermined mathematical formula used to manage certain benefit guarantees offered under variable annuity contracts. The formula may result in large scale asset flows into and out of these portfolios. Consequently, these portfolios may be more likely to utilize the SCA for purposes of funding redemptions. It may be possible for those portfolios to fully exhaust the committed amount of the SCA, thereby requiring the Manager to allocate available funding per a Board-approved methodology designed to treat the Participating Funds in the SCA equitably.
The Fund utilized the SCA during the year ended October 31, 2021. The average daily balance for the 2 days that the Fund had loans outstanding during the period was approximately $7,803,500, borrowed at a weighted average interest rate of 1.41%. The maximum loan outstanding amount during the period was $11,280,000. At October 31, 2021, the Fund did not have an outstanding loan amount.
| 9. | Risks of Investing in the Fund |
The Fund’s risks include, but are not limited to, some or all of the risks discussed below. For further information on the Fund’s risks, please refer to the Fund’s Prospectus and Statement of Additional Information.
Bank Loan Investments Risk: The Fund’s ability to receive payments of principal and interest and other amounts in connection with loans (whether through participations, assignments or otherwise) will depend primarily on the financial condition of the borrower. The failure by the Fund to receive scheduled interest or principal payments on a loan
102
because of a default, bankruptcy or any other reason would adversely affect the income of the Fund and would likely reduce the value of its assets. Even with loans secured by collateral, there is the risk that the value of the collateral may decline, may be insufficient to meet the obligations of the borrower, or be difficult to liquidate. In the event of a default, the Fund may have difficulty collecting on any collateral and would not have the ability to collect on any collateral for an uncollateralized loan. Further, the Fund’s access to collateral, if any, may be limited by bankruptcy laws. Due to the nature of the private syndication of senior loans, including, for example, lack of publicly-available information, some senior loans are not as easily purchased or sold as publicly-traded securities. In addition, loan participations generally are subject to restrictions on transfer, and only limited opportunities may exist to sell loan participations in secondary markets. As a result, it may be difficult for the Fund to value loans or sell loans at an acceptable price when it wants to sell them. Loans trade in an over-the-counter market, and confirmation and settlement, which are effected through standardized procedures and documentation, may take significantly longer than seven days to complete. Extended trade settlement periods may, in unusual market conditions with a high volume of shareholder redemptions, present a risk to shareholders regarding the Fund’s ability to pay redemption proceeds in a timely manner. In some instances, loans and loan participations are not rated by independent credit rating agencies; in such instances, a decision by the Fund to invest in a particular loan or loan participation could depend exclusively on the subadviser’s credit analysis of the borrower, or in the case of a loan participation, of the intermediary holding the portion of the loan that the Fund has purchased. To the extent the Fund invests in loans of non-U.S. issuers, the risks of investing in non-U.S. issuers are applicable. Loans may not be considered to be “securities” and as a result may not benefit from the protections of the federal securities laws, including anti-fraud protections and those with respect to the use of material non-public information, so that purchasers, such as the Fund, may not have the benefit of these protections. If the Fund is in possession of material non-public information about a borrower as a result of its investment in such borrower’s loan, the Fund may not be able to enter into a transaction with respect to a publicly-traded security of the borrower when it would otherwise be advantageous to do so.
Credit Risk: This is the risk that the issuer, the guarantor or the insurer of a fixed income security, or the counterparty to a contract, may be unable or unwilling to make timely principal and interest payments, or to otherwise honor its obligations. Additionally, fixed income securities could lose value due to a loss of confidence in the ability of the issuer, guarantor, insurer or counterparty to pay back debt. The longer the maturity and the lower the credit quality of a bond, the more sensitive it is to credit risk.
Currency Risk: The Fund’s net asset value could decline as a result of changes in exchange rates, which could adversely affect the Fund’s investments in currencies, or in securities that trade in, and receive revenues related to, currencies, or in derivatives that provide exposure to currencies. Certain foreign countries may impose restrictions on the ability of issuers of foreign securities to make payment of principal and interest or dividends to investors located outside the country, due to blockage of foreign currency exchanges or otherwise.
| | |
| PGIM Absolute Return Bond Fund | | 103 |
Notes to Financial Statements (continued)
Debt Obligations Risk: Debt obligations are subject to credit risk, market risk and interest rate risk. The Fund’s holdings, share price, yield and total return may also fluctuate in response to bond market movements. The value of bonds may decline for issuer-related reasons, including management performance, financial leverage and reduced demand for the issuer’s goods and services. Certain types of fixed income obligations also may be subject to “call and redemption risk,” which is the risk that the issuer may call a bond held by the Fund for redemption before it matures and the Fund may lose income.
Economic and Market Events Risk: Events in the U.S. and global financial markets, including actions taken by the U.S. Federal Reserve or foreign central banks to stimulate or stabilize economic growth or the functioning of the securities markets, may at times result in unusually high market volatility, which could negatively impact performance. Relatively reduced liquidity in credit and fixed income markets could adversely affect issuers worldwide.
Foreign Securities Risk: Investments in securities of non-U.S. issuers (including those denominated in U.S. dollars) may involve more risk than investing in securities of U.S. issuers. Foreign political, economic and legal systems, especially those in developing and emerging market countries, may be less stable and more volatile than in the United States. Foreign legal systems generally have fewer regulatory requirements than the U.S. legal system, particularly those of emerging markets. In general, less information is publicly available with respect to non-U.S. companies than U.S. companies. Non-U.S. companies generally are not subject to the same accounting, auditing, and financial reporting standards as are U.S. companies. Additionally, the changing value of foreign currencies and changes in exchange rates could also affect the value of the assets the Fund holds and the Fund’s performance. Certain foreign countries may impose restrictions on the ability of issuers of foreign securities to make payment of principal and interest or dividends to investors located outside the country, due to blockage of foreign currency exchanges or otherwise.
Investments in emerging markets are subject to greater volatility and price declines.
In addition, the Fund’s investments in non-U.S. securities may be subject to the risks of nationalization or expropriation of assets, imposition of currency exchange controls or restrictions on the repatriation of non-U.S. currency, confiscatory taxation and adverse diplomatic developments. Special U.S. tax considerations may apply.
Increase in Expenses Risk: Your actual cost of investing in the Fund may be higher than the expenses shown in the expense table in the Fund’s prospectus for a variety of reasons. For example, expense ratios may be higher than those shown if average net assets decrease. Net assets are more likely to decrease and Fund expense ratios are more likely to increase when markets are volatile. Active and frequent trading of Fund securities can increase expenses.
104
Interest Rate Risk: The value of your investment may go down when interest rates rise. A rise in rates tends to have a greater impact on the prices of longer term or duration debt securities. For example, a fixed income security with a duration of three years is expected to decrease in value by approximately 3% if interest rates increase by 1%. This is referred to as “duration risk.” When interest rates fall, the issuers of debt obligations may prepay principal more quickly than expected, and the Fund may be required to reinvest the proceeds at a lower interest rate. This is referred to as “prepayment risk.” When interest rates rise, debt obligations may be repaid more slowly than expected, and the value of the Fund’s holdings may fall sharply. This is referred to as “extension risk.” The Fund may lose money if short-term or long-term interest rates rise sharply or in a manner not anticipated by the subadviser.
Junk Bonds Risk: High-yield, high-risk bonds have predominantly speculative characteristics, including particularly high credit risk. Junk bonds tend to have lower market liquidity than higher-rated securities. The liquidity of particular issuers or industries within a particular investment category may shrink or disappear suddenly and without warning. The non-investment grade bond market can experience sudden and sharp price swings and become illiquid due to a variety of factors, including changes in economic forecasts, stock market activity, large sustained sales by major investors, a high profile default or a change in the market’s psychology.
Large Shareholder and Large Scale Redemption Risk: Certain individuals, accounts, funds (including funds affiliated with the Manager) or institutions, including the Manager and its affiliates, may from time to time own or control a substantial amount of the Fund’s shares. There is no requirement that these entities maintain their investment in the Fund. There is a risk that such large shareholders or that the Fund’s shareholders generally may redeem all or a substantial portion of their investments in the Fund in a short period of time, which could have a significant negative impact on the Fund’s NAV, liquidity, and brokerage costs. Large redemptions could also result in tax consequences to shareholders and impact the Fund’s ability to implement its investment strategy. The Fund’s ability to pursue its investment objective after one or more large scale redemptions may be impaired and, as a result, the Fund may invest a larger portion of its assets in cash or cash equivalents.
LIBOR Risk: Many financial instruments use or may use a floating rate based on the London Interbank Offered Rate, or “LIBOR,” which is the offered rate for short-term Eurodollar deposits between major international banks. Over the course of the last several years, global regulators have indicated an intent to phase out the use of LIBOR and similar interbank offering rates (IBOR). There still remains uncertainty regarding the nature of any replacement rates for LIBOR and the other IBORs as well as around fallback approaches for instruments extending beyond the any phase-out of these reference rates. The lack of consensus around replacement rates and the uncertainty of the phase out of LIBOR and other IBORs may result in increased volatility in corporate or governmental debt, bank loans, derivatives and other instruments invested in by the Fund as well as loan facilities used by the Fund.
| | |
| PGIM Absolute Return Bond Fund | | 105 |
Notes to Financial Statements (continued)
The potential effect of a transition away from LIBOR on the Fund or the financial instruments in which the Fund invests cannot yet be determined. The elimination of LIBOR or changes to other reference rates or any other changes or reforms to the determination or supervision of reference rates could have an adverse impact on the market for, or value of, any securities or payments linked to those reference rates, which may adversely affect the Fund’s performance and/or net asset value. Certain proposed replacement rates to LIBOR, such as the Secured Overnight Financing Rate (“SOFR”), are materially different from LIBOR, and changes in the applicable spread for instruments previously linked to LIBOR will need to be made in order for instruments to pay similar rates. Uncertainty and risk also remain regarding the willingness and ability of issuers and lenders to include revised provisions in new and existing contracts or instruments. Consequently, the transition away from LIBOR to other reference rates may lead to reduced coupons on debt held by the Fund, higher rates required to be paid by the Fund on bank lines of credit due to increases in spreads, increased volatility and illiquidity in markets that are tied to LIBOR, fluctuations in values of LIBOR-related investments or investments in issuers that utilize LIBOR, increased difficulty in borrowing or refinancing and diminished effectiveness of hedging strategies, adversely affecting the Fund’s performance. Furthermore, the risks associated with the expected discontinuation of LIBOR and transition may be exacerbated if the work necessary to effect an orderly transition to an alternative reference rate is not completed in a timely manner.
Because the usefulness of LIBOR and the other IBORs as benchmarks could deteriorate during the transition period, these effects could begin to be experienced by the end of 2021 and beyond until the anticipated discontinuance date in 2023 for the majority of the LIBOR rates.
Liquidity Risk: Liquidity risk is the risk that the Fund could not meet requests to redeem shares issued by the Fund without significant dilution of remaining investors’ interests in the Fund. The Fund may invest in instruments that trade in lower volumes and are more illiquid than other investments. If the Fund is forced to sell these investments to pay redemption proceeds or for other reasons, the Fund may lose money. In addition, when there is no willing buyer and investments cannot be readily sold at the desired time or price, the Fund may have to accept a lower price or may not be able to sell the instrument at all. An inability to sell a portfolio position can adversely affect the Fund’s value or prevent the Fund from being able to take advantage of other investment opportunities.
Management Risk: The value of your investment may decrease if judgments by the subadviser about the attractiveness, value or market trends affecting a particular security, industry or sector or about market movements are incorrect.
Market Disruption and Geopolitical Risks: International wars or conflicts and geopolitical developments in foreign countries, along with instability in regions such as Asia, Eastern
106
Europe, and the Middle East, possible terrorist attacks in the United States or around the world, public health epidemics such as the outbreak of infectious diseases like the outbreak of COVID-19 globally in 2020 or the 2014–2016 outbreak in West Africa of the Ebola virus, and other similar events could adversely affect the U.S. and foreign financial markets, including increases in market volatility, reduced liquidity in the securities markets and government intervention, and may cause further long-term economic uncertainties in the United States and worldwide generally. The coronavirus pandemic and the related governmental and public responses have had and may continue to have an impact on the Fund’s investments and net asset value and have led and may continue to lead to increased market volatility and the potential for illiquidity in certain classes of securities and sectors of the market. Preventative or protective actions that governments may take in respect of pandemic or epidemic diseases may result in periods of business disruption, business closures, inability to obtain raw materials, supplies and component parts, and reduced or disrupted operations for the issuers in which the Fund invests. Government intervention in markets may impact interest rates, market volatility and security pricing. The occurrence, reoccurrence and pendency of such diseases could adversely affect the economies (including through changes in business activity and increased unemployment) and financial markets either in specific countries or worldwide.
Market Risk: Securities markets may be volatile and the market prices of the Fund’s securities may decline. Securities fluctuate in price based on changes in an issuer’s financial condition and overall market and economic conditions. If the market prices of the securities owned by the Fund fall, the value of your investment in the Fund will decline.
Mortgage-Backed and Asset-Backed Securities Risk: Mortgage-backed and asset-backed securities tend to increase in value less than other debt securities when interest rates decline, but are subject to similar risk of decline in market value during periods of rising interest rates. The values of mortgage-backed and asset-backed securities become more volatile as interest rates rise. In a period of declining interest rates, the Fund may be required to reinvest more frequent prepayments on mortgage-backed and asset-backed securities in lower-yielding investments.
| 10. | Recent Accounting Pronouncement and Regulatory Developments |
In March 2020, the FASB issued Accounting Standard Update (“ASU”) No. 2020-04, which provides optional guidance for applying GAAP to contract modifications, hedging relationships and other transactions affected by the reference rate reform if certain criteria are met. ASU 2020-04 is elective and is effective on March 12, 2020 through December 31, 2022. At this time, management is evaluating the implications of certain provisions of the ASU and any impact on the financial statement disclosures has not yet been determined.
On December 3, 2020, the SEC announced that it voted to adopt a new rule that establishes an updated regulatory framework for fund valuation practices (the “Rule”). The Rule, in part, provides (i) a framework for determining fair value in good faith and (ii) provides for a fund Board’s assignment of its responsibility for the execution of valuation-related activities
| | |
| PGIM Absolute Return Bond Fund | | 107 |
Notes to Financial Statements (continued)
to a fund’s investment adviser. Further, the SEC is rescinding previously issued guidance on related issues. The Rule took effect on March 8, 2021, with a compliance date of September 8, 2022. Management is currently evaluating the Rule and its impact to the Fund.
108
Report of Independent Registered Public Accounting Firm
To the Board of Trustees of Prudential Investment Portfolios 9 and Shareholders of PGIM Absolute Return Bond Fund
Opinion on the Financial Statements
We have audited the accompanying statement of assets and liabilities, including the schedule of investments, of PGIM Absolute Return Bond Fund (one of the funds constituting Prudential Investment Portfolios 9, referred to hereafter as the “Fund”) as of October 31, 2021, the related statement of operations for the year ended October 31, 2021, the statement of changes in net assets for each of the two years in the period ended October 31, 2021, including the related notes, and financial highlights for each of the two years in the period ended October 31, 2021 (collectively referred to as the “financial statements”). In our opinion, the financial statements present fairly, in all material respects, the financial position of the Fund as of October 31, 2021, the results of its operations for the year then ended, and the changes in its net assets and the financial highlights for each of the two years in the period ended October 31, 2021 in conformity with accounting principles generally accepted in the United States of America.
The financial statements of the Fund as of and for the year ended October 31, 2019 and the financial highlights for each of the periods ended on or prior to October 31, 2019 (not presented herein, other than the financial highlights) were audited by other auditors whose report dated December 19, 2019 expressed an unqualified opinion on those financial statements and financial highlights.
Basis for Opinion
These financial statements are the responsibility of the Fund’s management. Our responsibility is to express an opinion on the Fund’s financial statements based on our audits. We are a public accounting firm registered with the Public Company Accounting Oversight Board (United States) (PCAOB) and are required to be independent with respect to the Fund in accordance with the U.S. federal securities laws and the applicable rules and regulations of the Securities and Exchange Commission and the PCAOB.
We conducted our audits of these financial statements in accordance with the standards of the PCAOB. Those standards require that we plan and perform the audit to obtain reasonable assurance about whether the financial statements are free of material misstatement, whether due to error or fraud.
Our audits included performing procedures to assess the risks of material misstatement of the financial statements, whether due to error or fraud, and performing procedures that respond to those risks. Such procedures included examining, on a test basis, evidence regarding the amounts and disclosures in the financial statements. Our audits also included evaluating the accounting principles used and significant estimates made by management, as well as evaluating the overall presentation of the financial statements. Our procedures included confirmation of securities owned as of October 31, 2021 by correspondence with the custodian, transfer agent and brokers; when replies were not received from brokers, we performed other auditing procedures. We believe that our audits provide a reasonable basis for our opinion.
/s/PricewaterhouseCoopers LLP
New York, New York
December 17, 2021
We have served as the auditor of one or more investment companies in the PGIM Retail Funds complex since 2020.
| | | | |
PGIM Absolute Return Bond Fund | | | 109 | |
Tax Information (unaudited)
For the year ended October 31, 2021, the Fund reports the maximum amount allowable but not less than 66.38% as interest related dividends in accordance with Section 871(k)(1) and 881(e)(1) of the Internal Revenue Code.
In January 2022, you will be advised on IRS Form 1099-DIV or substitute Form 1099-DIV as to the federal tax status of the distributions received by you in calendar year 2021.
We are required by Massachusetts, Missouri and Oregon to inform you that dividends which have been derived from interest on federal obligations are not taxable to shareholders provided the Fund meets certain requirements mandated by the respective state’s taxing authorities. We are pleased to report that 3.34% of the dividends paid by the Fund qualifies for such deduction.
Please consult your tax adviser or state/local authorities to properly report this information on your tax return. If you have any questions concerning the amounts listed above, please call your financial adviser.
INFORMATION ABOUT BOARD MEMBERS AND OFFICERS (unaudited)
Information about Board Members and Officers of the Fund is set forth below. Board Members who are not deemed to be “interested persons” of the Fund, as defined in the 1940 Act, are referred to as “Independent Board Members.” Board Members who are deemed to be “interested persons” of the Fund are referred to as “Interested Board Members.” The Board Members are responsible for the overall supervision of the operations of the Fund and perform the various duties imposed on the directors of investment companies by the 1940 Act. The Board in turn elects the Officers, who are responsible for administering the day-to-day operations of the Fund.
| | | | | | |
| Independent Board Members |
| | | | |
Name Year of Birth Position(s) Portfolios Overseen | | Principal Occupation(s) During Past Five Years | | Other Directorships Held During Past Five Years | | Length of
Board Service |
| | | | |
Ellen S. Alberding 1958 Board Member Portfolios Overseen: 95 | | President and Board Member, The Joyce Foundation (charitable foundation) (since 2002); formerly Vice Chair, City Colleges of Chicago (community college system) (2011-2015); Trustee, National Park Foundation (charitable foundation for national park system) (2009-2018); Trustee, Economic Club of Chicago (2009-2016); Trustee, Loyola University (since 2018). | | None. | | Since September 2013 |
| | | | |
Kevin J. Bannon 1952 Board Member Portfolios Overseen: 95 | | Retired; formerly Managing Director (April 2008-May 2015) and Chief Investment Officer (October 2008-November 2013) of Highmount Capital LLC (registered investment adviser); formerly Executive Vice President and Chief Investment Officer (April 1993-August 2007) of Bank of New York Company; President (May 2003-May 2007) of BNY Hamilton Family of Mutual Funds. | | Director of Urstadt Biddle Properties (equity real estate investment trust) (since September 2008). | | Since July 2008 |
PGIM Absolute Return Bond Fund
| | | | | | |
| Independent Board Members |
| | | | |
Name Year of Birth Position(s) Portfolios Overseen | | Principal Occupation(s) During Past Five Years | | Other Directorships Held During Past Five Years | | Length of
Board Service |
| | | | |
Linda W. Bynoe 1952 Board Member Portfolios Overseen: 92 | | President and Chief Executive Officer (since March 1995) and formerly Chief Operating Officer (December 1989-February 1995) of Telemat Limited LLC (formerly Telemat Ltd) (management consulting); formerly Vice President (January 1985-June 1989) at Morgan Stanley & Co. (broker-dealer). | | Trustee of Equity Residential (residential real estate) (since December 2009); Director of Northern Trust Corporation (financial services) (since April 2006); formerly Director of Anixter International, Inc. (communication products distributor) (January 2006-June 2020). | | Since March 2005 |
| | | | |
Barry H. Evans 1960 Board Member Portfolios Overseen: 94 | | Retired; formerly President (2005-2016), Global Chief Operating Officer (2014-2016), Chief Investment Officer - Global Head of Fixed Income (1998-2014), and various portfolio manager roles (1986-2006), Manulife Asset Management (asset management). | | Formerly Director, Manulife Trust Company (2011-2018); formerly Director, Manulife Asset Management Limited (2015-2017); formerly Chairman of the Board of Directors of Manulife Asset Management U.S. (2005-2016); formerly Chairman of the Board, Declaration Investment Management and Research (2008-2016). | | Since September 2017 |
| | | | |
Keith F. Hartstein 1956 Board Member & Independent Chair Portfolios Overseen: 95 | | Retired; Executive Committee of the Independent Directors Council (IDC) Board of Governors (since October 2019); Member (since November 2014) of the Governing Council of the IDC (organization of independent mutual fund directors); formerly President and Chief Executive Officer (2005-2012), Senior Vice President (2004-2005), Senior Vice President of Sales and Marketing (1997-2004), and various executive management positions (1990-1997), John Hancock Funds, LLC (asset management); Chairman, Investment Company Institute’s Sales Force Marketing Committee (2003-2008). | | None. | | Since September 2013 |
Visit our website at pgim.com/investments
| | | | | | |
| Independent Board Members |
| | | | |
Name Year of Birth Position(s) Portfolios Overseen | | Principal Occupation(s) During Past Five Years | | Other Directorships Held During Past Five Years | | Length of
Board Service |
| | | | |
Laurie Simon Hodrick 1962 Board Member Portfolios Overseen: 91 | | A. Barton Hepburn Professor Emerita of Economics in the Faculty of Business, Columbia Business School (since 2018); Visiting Fellow at the Hoover Institution, Stanford University (since 2015); Sole Member, ReidCourt LLC (since 2008) (a consulting firm); formerly Visiting Professor of Law, Stanford Law School (2015-2021); formerly A. Barton Hepburn Professor of Economics in the Faculty of Business, Columbia Business School (1996-2017); formerly Managing Director, Global Head of Alternative Investment Strategies, Deutsche Bank (2006-2008). | | Independent Director, Roku (since December 2020) (communication services); formerly Independent Director, Synnex Corporation (2019-2021) (information technology); formerly Independent Director, Kabbage, Inc. (2018-2020) (financial services); formerly Independent Director, Corporate Capital Trust (2017-2018) (a business development company). | | Since September 2017 |
| | | | |
Brian K. Reid 1961 Board Member Portfolios Overseen: 94 | | Retired; formerly Chief Economist for the Investment Company Institute (ICI) (2005-2017); formerly Senior Economist and Director of Industry and Financial Analysis at the ICI (1998-2004); formerly Senior Economist, Industry and Financial Analysis at the ICI (1996-1998); formerly Staff Economist at the Federal Reserve Board (1989-1996); Director, ICI Mutual Insurance Company (2012-2017). | | None. | | Since March 2018 |
PGIM Absolute Return Bond Fund
| | | | | | |
| Independent Board Members |
| | | | |
Name Year of Birth Position(s) Portfolios Overseen | | Principal Occupation(s) During Past Five Years | | Other Directorships Held During Past Five Years | | Length of
Board Service |
| | | | |
Grace C. Torres 1959 Board Member Portfolios Overseen: 94 | | Retired; formerly Treasurer and Principal Financial and Accounting Officer of the PGIM Funds, Target Funds, Advanced Series Trust, Prudential Variable Contract Accounts and The Prudential Series Fund (1998-June 2014); Assistant Treasurer (March 1999-June 2014) and Senior Vice President (September 1999-June 2014) of PGIM Investments LLC; Assistant Treasurer (May 2003-June 2014) and Vice President (June 2005-June 2014) of AST Investment Services, Inc.; Senior Vice President and Assistant Treasurer (May 2003-June 2014) of Prudential Annuities Advisory Services, Inc. | | Director (since January 2018) of OceanFirst Financial Corp. and OceanFirst Bank; formerly Director (July 2015-January 2018) of Sun Bancorp, Inc. N.A. and Sun National Bank. | | Since November 2014 |
| | | | | | |
| Interested Board Members |
| | | | |
Name Year of Birth Position(s) Portfolios Overseen | | Principal Occupation(s) During Past Five Years | | Other Directorships Held During Past Five Years | | Length of
Board Service |
| | | | |
Stuart S. Parker 1962 Board Member & President Portfolios Overseen: 94 | | President, Chief Executive Officer, Chief Operating Officer and Officer in Charge of PGIM Investments LLC (formerly known as Prudential Investments LLC) (since January 2012); formerly Executive Vice President of Jennison Associates LLC and Head of Retail Distribution of PGIM Investments LLC (June 2005-December 2011); Investment Company Institute - Board of Governors (since May 2012). | | None. | | Since January 2012 |
Visit our website at pgim.com/investments
| | | | | | |
| Interested Board Members |
| | | | |
Name Year of Birth Position(s) Portfolios Overseen | | Principal Occupation(s) During Past Five Years | | Other Directorships Held During Past Five Years | | Length of
Board Service |
| | | | |
Scott E. Benjamin 1973 Board Member & Vice President Portfolios Overseen: 95 | | Executive Vice President (since May 2009) of PGIM Investments LLC; Vice President (since June 2012) of Prudential Investment Management Services LLC; Executive Vice President (since September 2009) of AST Investment Services, Inc.; Senior Vice President of Product Development and Marketing, PGIM Investments (since February 2006); formerly Vice President of Product Development and Product Management, PGIM Investments LLC (2003-2006). | | None. | | Since March 2010 |
(1) The year that each Board Member joined the Board is as follows:
Ellen S. Alberding, 2013; Kevin J. Bannon, 2008; Linda W. Bynoe, 2005; Barry H. Evans, 2017; Keith F. Hartstein, 2013; Laurie Simon Hodrick, 2017; Michael S. Hyland, 2008; Richard A. Redeker, 1993; Stephen G. Stoneburn, 2003; Stuart S. Parker, Board Member since 2012 and President since 2012; Scott E. Benjamin, Board Member since 2010 and Vice President since 2009; Grace C. Torres, 2014.
| | | | |
| Fund Officers(a) | | | | |
| | | |
Name Year of Birth Fund Position | | Principal Occupation(s) During Past Five Years | | Length of
Service as Fund
Officer |
| | | |
Claudia DiGiacomo 1974 Chief Legal Officer | | Chief Legal Officer, Executive Vice President and Secretary of PGIM Investments LLC (since August 2020); Chief Legal Officer of Prudential Mutual Fund Services LLC (since August 2020); Chief Legal Officer of PIFM Holdco, LLC (since August 2020); Vice President and Corporate Counsel (since January 2005) of Prudential; and Corporate Counsel of AST Investment Services, Inc. (since August 2020); formerly Vice President and Assistant Secretary of PGIM Investments LLC (2005-2020); formerly Associate at Sidley Austin Brown & Wood LLP (1999-2004). | | Since December 2005 |
PGIM Absolute Return Bond Fund
| | | | |
| Fund Officers(a) | | | | |
| | | |
Name Year of Birth Fund Position | | Principal Occupation(s) During Past Five Years | | Length of Service as Fund Officer |
| | | |
Dino Capasso 1974 Chief Compliance Officer | | Chief Compliance Officer (since July 2019) of PGIM Investments LLC; Chief Compliance Officer (since July 2019) of the PGIM Funds, Target Funds, Advanced Series Trust, The Prudential Series Fund, Prudential’s Gibraltar Fund, Inc., PGIM Global High Yield Fund, Inc., PGIM High Yield Bond Fund, Inc., and PGIM Short Duration High Yield Opportunities Fund; Vice President and Deputy Chief Compliance Officer (June 2017-2019) of PGIM Investments LLC; formerly Senior Vice President and Senior Counsel (January 2016-June 2017), and Vice President and Counsel (February 2012-December 2015) of Pacific Investment Management Company LLC. | | Since July 2019 |
| | | |
Andrew R. French 1962 Secretary | | Vice President (since December 2018) of PGIM Investments LLC; formerly Vice President and Corporate Counsel (2010-2018) of Prudential; formerly Director and Corporate Counsel (2006-2010) of Prudential; Vice President and Assistant Secretary (since January 2007) of PGIM Investments LLC; Vice President and Assistant Secretary (since January 2007) of Prudential Mutual Fund Services LLC. | | Since October 2006 |
| | | |
Diana N. Huffman 1982 Assistant Secretary | | Vice President and Corporate Counsel (since September 2015) of Prudential; Vice President and Assistant Secretary (since August 2020) of PGIM Investments LLC; formerly Associate at Willkie Farr & Gallagher LLP (2009-2015). | | Since March 2019 |
| | | |
Melissa Gonzalez 1980 Assistant Secretary | | Vice President and Corporate Counsel (since September 2018) of Prudential; Vice President and Assistant Secretary (since August 2020) of PGIM Investments LLC; formerly Director and Corporate Counsel (March 2014-September 2018) of Prudential. | | Since March 2020 |
| | | |
Patrick E. McGuinness 1986 Assistant Secretary | | Vice President and Assistant Secretary (since August 2020) of PGIM Investments LLC; Director and Corporate Counsel (since February 2017) of Prudential; and Corporate Counsel (2012-2017) of IIL, Inc. | | Since June 2020 |
| | | |
Debra Rubano 1975 Assistant Secretary | | Vice President and Corporate Counsel (since November 2020) of Prudential; formerly Director and Senior Counsel of Allianz Global Investors U.S. Holdings LLC (2010-2020) and Assistant Secretary of numerous funds in the Allianz fund complex (2015-2020). | | Since December 2020 |
| | | |
Kelly A. Coyne 1968 Assistant Secretary | | Director, Investment Operations of Prudential Mutual Fund Services LLC (since 2010). | | Since March 2015 |
Visit our website at pgim.com/investments
| | | | |
| Fund Officers(a) | | | | |
| | | |
Name Year of Birth Fund Position | | Principal Occupation(s) During Past Five Years | | Length of Service as Fund Officer |
| | | |
Christian J. Kelly 1975 Treasurer and Principal Financial and Accounting Officer | | Vice President, Head of Fund Administration of PGIM Investments LLC (since November 2018); formerly Director of Fund Administration of Lord Abbett & Co. LLC (2009-2018), Treasurer and Principal Accounting Officer of the Lord Abbett Family of Funds (2017-2018); Director of Accounting, Avenue Capital Group (2008-2009); Senior Manager, Investment Management Practice of Deloitte & Touche LLP (1998-2007). | | Since January 2019 |
| | | |
Lana Lomuti 1967 Assistant Treasurer | | Vice President (since 2007) and Director (2005-2007), within PGIM Investments Fund Administration; formerly Assistant Treasurer (December 2007-February 2014) of The Greater China Fund, Inc. | | Since April 2014 |
| | | |
Russ Shupak 1973 Assistant Treasurer | | Vice President (since 2017) and Director (2013-2017), within PGIM Investments Fund Administration. | | Since September 2019 |
| | | |
Deborah Conway 1969 Assistant Treasurer | | Vice President (since 2017) and Director (2007-2017), within PGIM Investments Fund Administration. | | Since September 2019 |
| | | |
Elyse M. McLaughlin 1974 Assistant Treasurer | | Vice President (since 2017) and Director (2011-2017), within PGIM Investments Fund Administration. | | Since September 2019 |
| | | |
Jonathan Corbett 1983 Anti-Money Laundering Compliance Officer | | Vice President, Corporate Compliance, Global Compliance Programs and Compliance Risk Management (since August 2019) of Prudential; formerly Vice President and Head of Key Risk Areas Compliance (March 2016 to July 2019), Chief Privacy Officer (March 2016 to July 2019) and Head of Global Financial Crimes Unit (April 2014 to March 2016) at MetLife. | | Since October 2021 |
(a) Excludes Mr. Parker and Mr. Benjamin, interested Board Members who also serve as President and Vice President, respectively.
Explanatory Notes to Tables:
| ∎ | | Board Members are deemed to be “Interested,” as defined in the 1940 Act, by reason of their affiliation with PGIM Investments LLC and/or an affiliate of PGIM Investments LLC. |
| ∎ | | Unless otherwise noted, the address of all Board Members and Officers is c/o PGIM Investments LLC, 655 Broad Street, Newark, New Jersey 07102-4410. |
| ∎ | | There is no set term of office for Board Members or Officers. The Board Members have adopted a retirement policy, which calls for the retirement of Board Members on December 31 of the year in which they reach the age of 75. |
| ∎ | | “Other Directorships Held” includes all directorships of companies required to register or file reports with the SEC under the 1934 Act (that is, “public companies”) or other investment companies registered under the 1940 Act. |
| ∎ | | “Portfolios Overseen” includes all investment companies managed by PGIM Investments LLC. The investment companies for which PGIM Investments LLC serves as manager include the PGIM Funds, Target Funds, The Prudential Variable Contract Accounts, PGIM ETF Trust, PGIM High Yield Bond Fund, Inc., PGIM Global High Yield Fund, Inc., PGIM Short Duration High Yield Opportunities Fund, The Prudential Series Fund, Prudential’s Gibraltar Fund, Inc. and the Advanced Series Trust. |
| ∎ | | As used in the Fund Officers table “Prudential” means The Prudential Insurance Company of America. |
PGIM Absolute Return Bond Fund
Approval of Advisory Agreements (unaudited)
The Fund’s Board of Trustees
The Board of Trustees (the “Board”) of PGIM Absolute Return Bond Fund (the “Fund”)1 consists of ten individuals, eight of whom are not “interested persons” of the Fund, as defined in the Investment Company Act of 1940, as amended (the “1940 Act”) (the “Independent Trustees”). The Board is responsible for the oversight of the Fund and its operations, and performs the various duties imposed on the directors of investment companies by the 1940 Act. The Independent Trustees have retained independent legal counsel to assist them in connection with their duties. The Chair of the Board is an Independent Trustee. The Board has established four standing committees: the Audit Committee, the Nominating and Governance Committee, and two Investment Committees. Each committee is chaired by, and composed of, Independent Trustees.
Annual Approval of the Fund’s Advisory Agreements
As required under the 1940 Act, the Board determines annually whether to renew the Fund’s management agreement with PGIM Investments LLC (“PGIM Investments”), the Fund’s subadvisory agreement with PGIM, Inc. (“PGIM”) on behalf of its PGIM Fixed Income unit (“PGIM Fixed Income”), and the Fund’s sub-subadvisory agreement with PGIM Limited (“PGIML”). In considering the renewal of the agreements, the Board, including all of the Independent Trustees, met on June 7-10, 2021 and approved the renewal of the agreements through July 31, 2022, after concluding that the renewal of the agreements was in the best interests of the Fund and its shareholders.
In advance of the meetings, the Board requested and received materials relating to the agreements, and had the opportunity to ask questions and request further information in connection with its consideration. Among other things, the Board considered comparative fee information from PGIM Investments, PGIM, and where appropriate, affiliates of PGIM. Also, the Board considered comparisons with other mutual funds in relevant Peer Universes and Peer Groups, as is further discussed below.
In approving the agreements, the Board, including the Independent Trustees advised by independent legal counsel, considered the factors it deemed relevant, including the nature, quality and extent of services provided by PGIM Investments, the subadviser, and, as relevant, its affiliates, the performance of the Fund, the profitability of PGIM Investments and its affiliates, expenses and fees, and the potential for economies of scale that may be shared with the Fund and its shareholders as the Fund’s assets grow. In their deliberations, the Trustees did not identify any single factor which alone was responsible for the Board’s decision to approve the agreements with respect to the Fund. In connection with its deliberations, the Board considered information provided by PGIM Investments throughout the year at regular Board meetings, presentations from portfolio managers and other information, as well as information furnished at or in advance of the meetings on June 7-10, 2021.
| 1 | PGIM Absolute Return Bond Fund is a series of Prudential Investment Portfolios 9. |
| | |
| PGIM Absolute Return Bond Fund |
Approval of Advisory Agreements (continued)
The Trustees determined that the overall arrangements between the Fund and PGIM Investments, which serves as the Fund’s investment manager pursuant to a management agreement, between PGIM Investments and PGIM, which, through its PGIM Fixed Income unit, serves as the Fund’s subadviser pursuant to the terms of a subadvisory agreement with PGIM Investments, and between PGIM and PGIML, which serves as the Fund’s sub-subadviser pursuant to the terms of a sub-subadvisory agreement with PGIM, are in the best interests of the Fund and its shareholders in light of the services performed, fees charged and such other matters as the Trustees considered relevant in the exercise of their business judgment.
The material factors and conclusions that formed the basis for the Trustees’ reaching their determinations to approve the continuance of the agreements are separately discussed below.
Nature, Quality and Extent of Services
The Board received and considered information regarding the nature, quality and extent of services provided to the Fund by PGIM Investments, PGIM Fixed Income, and PGIML. The Board noted that PGIM Fixed Income and PGIML are affiliated with PGIM Investments. The Board considered the services provided by PGIM Investments, including but not limited to the oversight of the subadviser and sub-subadviser for the Fund, as well as the provision of fund recordkeeping, compliance and other services to the Fund, and PGIM Investments’ role as administrator for the Fund’s liquidity risk management program. With respect to PGIM Investments’ oversight of the subadviser and sub-subadviser, the Board noted that PGIM Investments’ Strategic Investment Research Group (“SIRG”), which is a business unit of PGIM Investments, is responsible for monitoring and reporting to PGIM Investments’ senior management on the performance and operations of the subadviser and sub-subadviser. The Board also considered that PGIM Investments pays the salaries of all of the officers and interested Trustees of the Fund who are part of Fund management. The Board also considered the investment subadvisory services provided by PGIM Fixed Income and PGIML, including investment research and security selection, as well as adherence to the Fund’s investment restrictions and compliance with applicable Fund policies and procedures. The Board considered PGIM Investments’ evaluation of the subadviser and sub-subadviser, as well as PGIM Investments’ recommendation, based on its review of the subadviser and sub-subadviser, to renew the subadvisory and sub-subadvisory agreements.
The Board considered the qualifications, backgrounds and responsibilities of PGIM Investments’ senior management responsible for the oversight of the Fund, PGIM Fixed Income, and PGIML, and also considered the qualifications, backgrounds and responsibilities of PGIM Fixed Income’s portfolio managers who are responsible for the day-to-day management of the Fund’s portfolio. The Board was provided with information pertaining to PGIM Investments’, PGIM Fixed Income’s, and PGIML’s organizational structure, senior management, investment operations, and other relevant
Visit our website at pgim.com/investments
information pertaining to PGIM Investments, PGIM Fixed Income, and PGIML. The Board also noted that it received favorable compliance reports from the Fund’s Chief Compliance Officer (“CCO”) as to PGIM Investments, PGIM Fixed Income, and PGIML.
The Board concluded that it was satisfied with the nature, extent and quality of the investment management services provided by PGIM Investments, the subadvisory services provided to the Fund by PGIM Fixed Income, and the sub-subadvisory services provided by PGIML, and that there was a reasonable basis on which to conclude that the Fund benefits from the services provided by PGIM Investments, PGIM Fixed Income, and PGIML under the management, subadvisory and sub-subadvisory agreements.
Costs of Services and Profits Realized by PGIM Investments
The Board was provided with information on the profitability of PGIM Investments and its affiliates in serving as the Fund’s investment manager. The Board discussed with PGIM Investments the methodology utilized in assembling the information regarding profitability and considered its reasonableness. The Board recognized that it is difficult to make comparisons of profitability from fund management contracts because comparative information is not generally publicly available and is affected by numerous factors, including the structure of the particular adviser, the types of funds it manages, its business mix, numerous assumptions regarding allocations and the adviser’s capital structure and cost of capital. Taking these factors into account, the Board concluded that the profitability of PGIM Investments and its affiliates in relation to the services rendered was not unreasonable.
Economies of Scale
The Board received and discussed information concerning economies of scale that PGIM Investments may realize as the Fund’s assets grow beyond current levels. The Board noted that the management fee schedule for the Fund includes breakpoints, which have the effect of decreasing the fee rate as assets increase. During the course of time, the Board has considered information regarding the launch date of the Fund, the management fees of the Fund compared to those of similarly managed funds and PGIM Investments’ investment in the Fund over time. The Board noted that economies of scale can be shared with the Fund in other ways, including low management fees from inception, additional technological and personnel investments to enhance shareholder services, and maintaining existing expense structures in the face of a rising cost environment. The Board also considered PGIM Investments’ assertion that it continually evaluates the management fee schedule of the Fund and the potential to share economies of scale through breakpoints or fee waivers as asset levels increase.
The Board recognized the inherent limitations of any analysis of economies of scale, stemming largely from the Board’s understanding that most of PGIM Investments’ costs are not specific to individual funds, but rather are incurred across a variety of products and services.
|
| PGIM Absolute Return Bond Fund |
Approval of Advisory Agreements (continued)
Other Benefits to PGIM Investments, PGIM Fixed Income, and PGIML
The Board considered potential ancillary benefits that might be received by PGIM Investments, PGIM Fixed Income, PGIML and their affiliates as a result of their relationship with the Fund. The Board concluded that potential benefits to be derived by PGIM Investments included transfer agency fees received by the Fund’s transfer agent (which is affiliated with PGIM Investments), as well as benefits to its reputation or other intangible benefits resulting from PGIM Investments’ association with the Fund. The Board concluded that the potential benefits to be derived by PGIM Fixed Income and PGIML included the ability to use soft dollar credits, as well as the potential benefits consistent with those generally resulting from an increase in assets under management, specifically, potential access to additional research resources and benefits to their reputations. The Board concluded that the benefits derived by PGIM Investments, PGIM Fixed Income, and PGIML were consistent with the types of benefits generally derived by investment managers and subadvisers to mutual funds.
Performance of the Fund / Fees and Expenses
The Board considered certain additional factors and made related conclusions relating to the historical performance of the Fund for the one, three-, and five-year periods ended December 31, 2020.
The Board also considered the Fund’s actual management fee, as well as the Fund’s net total expense ratio, for the fiscal year ended October 31, 2020. The Board considered the management fee for the Fund as compared to the management fee charged by PGIM Investments to other funds and the fee charged by other advisers to comparable mutual funds in a Peer Group. The actual management fee represents the fee rate actually paid by Fund shareholders and includes any fee waivers or reimbursements. The net total expense ratio for the Fund represents the actual expense ratio incurred by Fund shareholders.
The mutual funds included in the Peer Universe, which was used to consider performance, and the Peer Group, which was used to consider expenses and fees, were objectively determined by Broadridge, an independent provider of mutual fund data. In certain circumstances, PGIM Investments also provided supplemental Peer Universe or Peer Group information, for reasons addressed with the Board. The comparisons placed the Fund in various quartiles over various periods, with the first quartile being the best 25% of the mutual funds (for performance, the best performing mutual funds and, for expenses, the lowest cost mutual funds).
The section below summarizes key factors considered by the Board and the Board’s conclusions regarding the Fund’s performance, fees and overall expenses. The table sets forth net performance comparisons (which reflect the impact on performance of fund expenses, or any subsidies, expense caps or waivers that may be applicable) with the Peer Universe, actual management fees with the Peer Group (which reflect the
Visit our website at pgim.com/investments
impact of any subsidies or fee waivers), and net total expenses with the Peer Group, each of which were key factors considered by the Board.
| | | | | | | | |
| | | | | |
Net Performance | | 1 Year | | 3 Years | | 5 Years | | 10 Years |
| | | | | |
| | | 4th Quartile | | 3rd Quartile | | 3rd Quartile | | N/A |
| |
Actual Management Fees: 2nd Quartile |
| |
Net Total Expenses: 1st Quartile |
| | · | | The Board noted that the Fund outperformed its benchmark index over the three-and five-year periods, though it underperformed over the one-year period. |
| | · | | The Board considered PGIM Investments’ assertion that the Fund’s low-duration credit profile was out of favor over the one-year period, and as this changes, PGIM Investments expects the Fund to outperform. In this regard, the Board considered that the Fund outperformed its benchmark index for all periods and its peer group for the one-year period ended March 31, 2021. |
| | · | | The Board and PGIM Investments agreed to retain the existing contractual expense cap, which (exclusive of certain fees and expenses) caps total annual operating expenses at 0.70% for Class R6 shares, and 0.73% for Class Z shares through February 28, 2022. |
| | · | | In addition, PGIM Investments will waive management fees or shared operating expenses on any share class to the same extent that it waives such expenses on any other share class and has agreed that total annual fund operating expenses for Class R6 shares will not exceed total annual fund operating expenses for Class Z shares. |
| | · | | The Board concluded that, in light of the above, it would be in the best interests of the Fund and its shareholders to renew the agreements. |
| | · | | The Board concluded that the management fees (including subadvisory fees) and total expenses were reasonable in light of the services provided. |
* * *
After full consideration of these factors, the Board concluded that the approval of the agreements was in the best interests of the Fund and its shareholders.
|
| PGIM Absolute Return Bond Fund |
| | | | |
| | | |
∎ MAIL | | ∎ TELEPHONE | | ∎ WEBSITE |
| | | |
655 Broad Street | | (800) 225-1852 | | pgim.com/investments |
| | | |
Newark, NJ 07102 | | | | |
PROXY VOTING
The Board of Trustees of the Fund has delegated to the Fund’s subadviser the responsibility for voting any proxies and maintaining proxy recordkeeping with respect to the Fund. A description of these proxy voting policies and procedures is available without charge, upon request, by calling (800) 225-1852 or by visiting the Securities and Exchange Commission’s website at sec.gov. Information regarding how the Fund voted proxies relating to portfolio securities during the most recent 12-month period ended June 30 is available on the Fund’s website and on the Securities and Exchange Commission’s website.
TRUSTEES
Ellen S. Alberding · Kevin J. Bannon · Scott E. Benjamin · Linda W. Bynoe · Barry H. Evans · Keith F. Hartstein · Laurie Simon Hodrick · Stuart S. Parker · Brian K. Reid · Grace C. Torres
OFFICERS
Stuart S. Parker, President · Scott E. Benjamin, Vice President · Christian J. Kelly, Treasurer and Principal Financial and Accounting Officer · Claudia DiGiacomo, Chief Legal Officer · Dino Capasso, Chief Compliance Officer · Jonathan Corbett, Anti-Money Laundering Compliance Officer · Andrew R. French, Secretary · Melissa Gonzalez, Assistant Secretary · Diana N. Huffman, Assistant Secretary · Kelly A. Coyne, Assistant Secretary · Patrick E. McGuinness, Assistant Secretary · Debra Rubano, Assistant Secretary · Lana Lomuti, Assistant Treasurer · Russ Shupak, Assistant Treasurer · Elyse M. McLaughlin, Assistant Treasurer · Deborah Conway, Assistant Treasurer
| | | | |
| | |
| MANAGER | | PGIM Investments LLC | | 655 Broad Street Newark, NJ 07102 |
| | |
| SUBADVISER | | PGIM Fixed Income | | 655 Broad Street Newark, NJ 07102 |
| | |
| | | PGIM Limited | | Grand Buildings, 1-3 Strand Trafalgar Square London, WC2N 5HR United Kingdom |
| | |
| DISTRIBUTOR | | Prudential Investment Management Services LLC | | 655 Broad Street Newark, NJ 07102 |
| | |
| CUSTODIAN | | The Bank of New York Mellon | | 240 Greenwich Street New York, NY 10286 |
| | |
| TRANSFER AGENT | | Prudential Mutual Fund Services LLC | | PO Box 9658 Providence, RI 02940 |
| | |
INDEPENDENT REGISTERED PUBLIC ACCOUNTING FIRM | | PricewaterhouseCoopers LLP | | 300 Madison Avenue New York, NY 10017 |
| | |
| FUND COUNSEL | | Willkie Farr & Gallagher LLP | | 787 Seventh Avenue New York, NY 10019 |
An investor should consider the investment objectives, risks, charges, and expenses of the Fund carefully before investing. The prospectus and summary prospectus contain this and other information about the Fund. An investor may obtain the prospectus and summary prospectus by visiting our website at pgim.com/investments or by calling (800) 225-1852. The prospectus and summary prospectus should be read carefully before investing.
E-DELIVERY
To receive your mutual fund documents online, go to pgim.com/investments/resource/edelivery and enroll. Instead of receiving printed documents by mail, you will receive notification via email when new materials are available. You can cancel your enrollment or change your email address at any time by visiting the website address above.
SHAREHOLDER COMMUNICATIONS WITH TRUSTEES
Shareholders can communicate directly with the Board of Trustees by writing to the Chair of the Board, PGIM Absolute Return Bond Fund, PGIM Investments, Attn: Board of Trustees, 655 Broad Street, Newark, NJ 07102. Shareholders can communicate directly with an individual Trustee by writing to that Trustee at the same address. Communications are not screened before being delivered to the addressee.
AVAILABILITY OF PORTFOLIO HOLDINGS
The Fund files its complete schedule of portfolio holdings with the Securities and Exchange Commission for the first and third quarters of each fiscal year as an exhibit to its reports on Form N-PORT. The Fund’s Form N-PORT filings are available on the Commission’s website at sec.gov.
The Fund’s Statement of Additional Information contains additional information about the Fund’s Trustees and is available without charge, upon request, by calling (800) 225-1852.
Mutual Funds:
| | | | |
| | | |
ARE NOT INSURED BY THE FDIC OR ANY FEDERAL GOVERNMENT AGENCY | | MAY LOSE VALUE | | ARE NOT A DEPOSIT OF OR GUARANTEED BY ANY BANK OR ANY BANK AFFILIATE |

PGIM ABSOLUTE RETURN BOND FUND
| | | | | | | | |
| | | | |
| SHARE CLASS | | A | | C | | Z | | R6 |
| | | | |
NASDAQ | | PADAX | | PADCX | | PADZX | | PADQX |
| | | | |
CUSIP | | 74441J852 | | 74441J845 | | 74441J829 | | 74441J837 |
MF213E

PGIM QMA LARGE-CAP CORE EQUITY FUND
[Effective 12/29/21, fund name changes to PGIM Quant Solutions Large-Cap Core Fund]
ANNUAL REPORT
OCTOBER 31, 2021

|
|
To enroll in e-delivery, go to pgim.com/investments/resource/edelivery |
Table of Contents
This report is not authorized for distribution to prospective investors unless preceded or accompanied by a current prospectus.
The views expressed in this report and information about the Fund’s portfolio holdings are for the period covered by this report and are subject to change thereafter.
Mutual funds are distributed by Prudential Investment Management Services LLC, a Prudential Financial company, member SIPC. PGIM Quantitative Solutions is the primary business name of PGIM Quantitative Solutions LLC (formerly known as QMA LLC), a wholly owned subsidiary of PGIM, Inc. (PGIM), a registered investment adviser and Prudential Financial company. © 2021 Prudential Financial, Inc. and its related entities. PGIM and the PGIM logo are service marks of Prudential Financial, Inc. and its related entities, registered in many jurisdictions worldwide.
| | |
| 2 | | Visit our website at pgim.com/investments |
Letter from the President
| | |
 | | Dear Shareholder: We hope you find the annual report for the PGIM QMA Large-Cap Core Equity Fund informative and useful. The report covers performance for the 12-month period that ended October 31, 2021. The global economy and markets continued to recover throughout the period from the ongoing impact of the COVID-19 pandemic. The Federal Reserve slashed interest rates and kept them near zero to encourage borrowing. Congress passed stimulus bills worth several trillion dollars to help consumers and businesses. And several effective COVID-19 |
vaccines received regulatory approval. Those measures were enough to offset the fear of rising inflation and supply chain challenges that threatened to disrupt growth.
At the start of the period, stocks had recovered most of the steep losses they had suffered at the onset of the pandemic. Equities rallied as states reopened their economies but became more volatile as investors worried that a surge in COVID-19 infections would stall the recovery. However, rising corporate profits and economic growth, the resolution of the US presidential election, and the global rollout of approved vaccines lifted equity markets to record levels, helping stocks around the globe post gains for the full period.
Throughout this volatile period, investors sought safety in fixed income. Investment-grade bonds in the US and the overall global bond market declined slightly during the period as the economy recovered, but emerging market debt rose. While the 10-year US Treasury yield hovered near record lows early in the period after a significant rally in interest rates, rates moved higher later on as investors began to focus on stronger economic growth and the prospects of higher inflation. The Fed also took several aggressive actions to keep the bond markets running smoothly, implementing many of the relief programs that proved to be successful in helping end the global financial crisis in 2008-09.
Regarding your investments with PGIM, we believe it is important to maintain a diversified portfolio of funds consistent with your tolerance for risk, time horizon, and financial goals. Your financial advisor can help you create a diversified investment plan that may include funds covering all the basic asset classes and that reflects your personal investor profile and risk tolerance. However, diversification and asset allocation strategies do not assure a profit or protect against loss in declining markets.
At PGIM Investments, we consider it a great privilege and responsibility to help investors participate in opportunities across global markets while meeting their toughest investment challenges. PGIM is a top-10 global investment manager with more than $1.5 trillion in assets under management. This scale and investment expertise allow us to deliver actively managed funds and strategies to meet the needs of investors around the globe.
Thank you for choosing our family of funds.
Sincerely,

Stuart S. Parker, President
PGIM QMA Large-Cap Core Equity Fund
December 15, 2021
| | | | |
PGIM QMA Large-Cap Core Equity Fund | | | 3 | |
Your Fund’s Performance (unaudited)
Performance data quoted represent past performance. Past performance does not guarantee future results. The investment return and principal value of an investment will fluctuate so that an investor’s shares, when redeemed, may be worth more or less than their original cost. Current performance may be lower or higher than the past performance data quoted. An investor may obtain performance data as of the most recent month-end by visiting our website at pgim.com/investments or by calling (800) 225-1852.
| | | | | | | | |
| |
| | | Average Annual Total Returns as of 10/31/21 |
| | One Year (%) | | Five Years (%) | | Ten Years (%) | | Since Inception (%) |
| | | | |
| Class A | | | | | | | | |
| (with sales charges) | | 34.42 | | 15.31 | | 14.23 | | — |
| (without sales charges) | | 42.24 | | 16.62 | | 14.87 | | — |
| | | | |
| Class C | | | | | | | | |
| (with sales charges) | | 40.25 | | 15.77 | | 14.02 | | — |
| (without sales charges) | | 41.25 | | 15.77 | | 14.02 | | — |
| | | | |
| Class Z | | | | | | | | |
| (without sales charges) | | 42.44 | | 16.88 | | 15.14 | | — |
| | | | |
| Class R6 | | | | | | | | |
| (without sales charges) | | 42.79 | | N/A | | N/A | | 16.06 (12/28/2016) |
| | | | |
| S&P 500 Index | | | | | | | | |
| | | 42.90 | | 18.92 | | 16.20 | | — |
| | | | |
|
| Average Annual Total Returns as of 10/31/21 Since Inception (%) |
| | | | | Class R6
(12/28/2016) |
| | |
S&P 500 Index | | | | 18.26 |
Since Inception returns are provided for any share class with less than 10 fiscal years of returns. Since Inception returns for the Index are measured from the closest month-end to the class’ inception date.
| | |
| 4 | | Visit our website at pgim.com/investments |
Growth of a $10,000 Investment (unaudited)
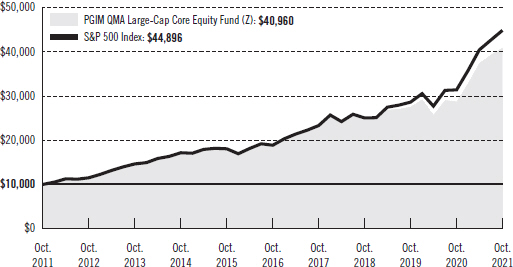
The graph compares a $10,000 investment in the Fund’s Class Z shares with a similar investment in the S&P 500 Index by portraying the initial account values at the beginning of the 10-year period for Class Z shares (October 31, 2011) and the account values at the end of the current fiscal year (October 31, 2021), as measured on a quarterly basis. For purposes of the graph, and unless otherwise indicated, it has been assumed that (a) all recurring fees (including management fees) were deducted and (b) all dividends and distributions were reinvested. The line graph provides information for Class Z shares only. As indicated in the tables provided earlier, performance for other share classes will vary due to the differing fees and expenses applicable to each share class (as indicated in the following paragraphs). Without waiver of fees and/or expense reimbursements, if any, the returns would have been lower.
Past performance does not predict future performance. Total returns and the ending account values in the graph include changes in share price and reinvestment of dividends and capital gains distributions in a hypothetical investment for the periods shown. The Fund’s total returns do not reflect the deduction of income taxes on an individual’s investment. Taxes may reduce your actual investment returns on income or gains paid by the Fund or any gains you may realize if you sell your shares.
| | | | |
PGIM QMA Large-Cap Core Equity Fund | | | 5 | |
Your Fund’s Performance (continued)
The returns in the tables do not reflect the deduction of taxes that a shareholder would pay on Fund distributions or following the redemption of Fund shares. The average annual total returns take into account applicable sales charges, which are described for each share class in the table below.
| | | | | | | | |
| | | | | |
| | | Class A | | Class C | | Class Z | | Class R6 |
| Maximum initial sales charge | | 5.50% of the public offering price | | None | | None | | None |
| Contingent deferred sales charge (CDSC) (as a percentage of the lower of the original purchase price or the net asset value at redemption) | | 1.00% on sales of $1 million or more made within 12 months of purchase | | 1.00% on sales made within 12 months of purchase | | None | | None |
| Annual distribution and service (12b-1) fees (shown as a percentage of average daily net assets) | | 0.30% (0.25% currently) | | 1.00% | | None | | None |
Benchmark Definitions
S&P 500 Index*—The S&P 500 Index is an unmanaged index of over 500 stocks of large US public companies. It gives a broad look at how stock prices in the United States have performed.
*The S&P 500 Index (“Index”) is a product of S&P Dow Jones Indices LLC and/or its affiliates and has been licensed for use by PGIM, Inc. and/or its affiliates. Copyright © 2021 S&P Dow Jones Indices LLC, a division of S&P Global, Inc., and/or its affiliates. All rights reserved. Redistribution or reproduction in whole or in part are prohibited without written permission of S&P Dow Jones Indices LLC. For more information on any of S&P Dow Jones Indices LLC’s indices please visit www.spdji.com. S&P® is a registered trademark of S&P Global and Dow Jones® is a registered trademark of Dow Jones Trademark Holdings LLC.
Investors cannot invest directly in an index. The returns for the Index would be lower if they included the effects of sales charges, operating expenses of a mutual fund, or taxes that may be paid by an investor.
| | |
| 6 | | Visit our website at pgim.com/investments |
Presentation of Fund Holdings as of 10/31/21
| | | | |
| | |
| Ten Largest Holdings | | Line of Business | | % of Net Assets |
Microsoft Corp. | | Software | | 6.9% |
Apple, Inc. | | Technology Hardware, Storage & Peripherals | | 5.3% |
Amazon.com, Inc. | | Internet & Direct Marketing Retail | | 3.2% |
Alphabet, Inc. (Class A Stock) | | Interactive Media & Services | | 2.6% |
Alphabet, Inc. (Class C Stock) | | Interactive Media & Services | | 2.3% |
Meta Platforms, Inc. (Class A Stock) | | Interactive Media & Services | | 2.2% |
Tesla, Inc. | | Automobiles | | 2.1% |
Johnson & Johnson | | Pharmaceuticals | | 1.5% |
Visa, Inc. (Class A Stock) | | IT Services | | 1.3% |
Adobe, Inc. | | Software | | 1.3% |
Holdings reflect only long-term investments and are subject to change.
| | | | | | | | |
| | | PGIM QMA Large-Cap Core Equity Fund | | | | 7 | |
Strategy and Performance Overview (unaudited)
How did the Fund perform?
The PGIM QMA Large-Cap Core Equity Fund’s Class Z shares returned 42.44% in the 12-month reporting period that ended October 31, 2021, performing in line with the 42.90% return of the S&P 500 Index (the Index).
What were the market conditions?
| ● | The reporting period was headlined by the COVID-19 pandemic, which led to several positive and negative shocks to global markets. Equity investors mostly shrugged off the negative news, with the Index rising more than 40% over the period. |
| ● | COVID-19 vaccine approvals during the period provided a boost to equities, though risks remain with new variants of the virus appearing as existing ones become less dominant. |
| ● | As economies reopened from the lockdowns that characterized 2020, cyclical stocks with positive fundamentals in general performed well. |
What worked?
Overweighting “cheap” stocks (i.e., those that are inexpensive compared to industry peers) with positive quality attributes relative to the Index, while underweighting expensive stocks with negative quality traits, benefited the Fund over the reporting period.
What didn’t work?
Cheap stocks, or value companies, outperformed the fast-growth segment of the market over the period. While this ultimately benefited the Fund overall due to its tilt toward cheap stocks, growth factors modestly detracted from performance.
Did the Fund use derivatives?
The Fund held futures contracts on the Index. PGIM Quantitative Solutions used these instruments primarily to manage daily cash flows, provide liquidity, and equitize cash—not as a means of adding to performance. Consequently, the effect on Fund performance was minimal.
Current outlook
| ● | PGIM Quantitative Solutions believes the recovery from the pandemic-induced market decline in the first quarter of 2020 should continue into 2022, albeit at a slower pace than in 2021. |
| ● | Inflation is an active concern for investors, and central banks are planning actions to alleviate rising prices. This includes higher interest rates, which PGIM Quantitative Solutions feels could make fixed income investments more attractive than they have been in recent years. |
| ● | Nevertheless, in PGIM Quantitative Solutions’ view, corporate earnings should continue to be strong in 2022, driving robust economic growth. Additionally, PGIM |
| | |
| 8 | | Visit our website at pgim.com/investments |
Quantitative Solutions believes cyclical stocks with positive fundamentals are attractively valued, and this segment of the market should outperform in 2022 if pandemic fears soften.
| | | | |
PGIM QMA Large-Cap Core Equity Fund | | | 9 | |
Fees and Expenses (unaudited)
As a shareholder of the Fund, you incur two types of costs: (1) transaction costs, including sales charges (loads) on purchase payments and redemptions, as applicable, and (2) ongoing costs, including management fees, distribution and/or service (12b-1) fees, and other Fund expenses, as applicable. This example is intended to help you understand your ongoing costs (in dollars) of investing in the Fund and to compare these costs with the ongoing costs of investing in other mutual funds.
The example is based on an investment of $1,000 held through the six-month period ended October 31, 2021. The example is for illustrative purposes only; you should consult the Prospectus for information on initial and subsequent minimum investment requirements.
Actual Expenses
The first line for each share class in the table on the following page provides information about actual account values and actual expenses. You may use the information on this line, together with the amount you invested, to estimate the expenses that you paid over the period. Simply divide your account value by $1,000 (for example, an $8,600 account value ÷ $1,000 = 8.6), then multiply the result by the number on the first line under the heading “Expenses Paid During the Six-Month Period” to estimate the expenses you paid on your account during this period.
Hypothetical Example for Comparison Purposes
The second line for each share class in the table on the following page provides information about hypothetical account values and hypothetical expenses based on the Fund’s actual expense ratio and an assumed rate of return of 5% per year before expenses, which is not the Fund’s actual return. The hypothetical account values and expenses may not be used to estimate the actual ending account balance or expenses you paid for the period. You may use this information to compare the ongoing costs of investing in the Fund and other funds. To do so, compare this 5% hypothetical example with the 5% hypothetical examples that appear in the shareholder reports of the other funds.
The Fund’s transfer agent may charge additional fees to holders of certain accounts that are not included in the expenses shown in the table on the following page. These fees apply to individual retirement accounts (IRAs) and Section 403(b) accounts. As of the close of the six-month period covered by the table, IRA fees included an annual maintenance fee of $15 per account (subject to a maximum annual maintenance fee of $25 for all accounts held by the same shareholder). Section 403(b) accounts are charged an annual $25 fiduciary maintenance fee. Some of the fees may vary in amount, or may be waived, based on your total account balance or the number of PGIM funds, including the Fund, that you own. You should consider the additional fees that were charged to your Fund account over the six-month period when you estimate the total ongoing expenses paid over the period and the impact of these fees on your ending account value, as these additional expenses are not reflected in the information
| | |
| 10 | | Visit our website at pgim.com/investments |
provided in the expense table. Additional fees have the effect of reducing investment returns.
Please note that the expenses shown in the table are meant to highlight your ongoing costs only and do not reflect any transactional costs such as sales charges (loads). Therefore, the second line for each share class in the table is useful in comparing ongoing costs only and will not help you determine the relative total costs of owning different funds. In addition, if these transactional costs were included, your costs would have been higher.
| | | | | | | | | | |
| | | | |
PGIM QMA Large-Cap Core
Equity Fund | | Beginning
Account Value
May 1, 2021 | | Ending
Account Value
October 31, 2021 | | Annualized
Expense
Ratio Based on
the
Six-Month Period | | Expenses Paid
During the
Six-Month Period* |
| Class A | | Actual | | $1,000.00 | | $1,091.10 | | 0.72% | | $3.79 |
| | Hypothetical | | $1,000.00 | | $1,021.58 | | 0.72% | | $3.67 |
| Class C | | Actual | | $1,000.00 | | $1,087.50 | | 1.44% | | $7.58 |
| | Hypothetical | | $1,000.00 | | $1,017.95 | | 1.44% | | $7.32 |
| Class Z | | Actual | | $1,000.00 | | $1,091.70 | | 0.53% | | $2.79 |
| | Hypothetical | | $1,000.00 | | $1,022.53 | | 0.53% | | $2.70 |
| Class R6 | | Actual | | $1,000.00 | | $1,093.00 | | 0.35% | | $1.85 |
| | | Hypothetical | | $1,000.00 | | $1,023.44 | | 0.35% | | $1.79 |
*Fund expenses (net of fee waivers or subsidies, if any) for each share class are equal to the annualized expense ratio for each share class (provided in the table), multiplied by the average account value over the period, multiplied by the 184 days in the six-month period ended October 31, 2021, and divided by the 365 days in the Fund’s fiscal year ended October 31, 2021 (to reflect the six-month period). Expenses presented in the table include the expenses of any underlying portfolios in which the Fund may invest.
| | | | |
PGIM QMA Large-Cap Core Equity Fund | | | 11 | |
Schedule of Investments
as of October 31, 2021
| | | | | | | | |
| | |
| Description | | Shares | | | Value | |
| | |
LONG-TERM INVESTMENTS 98.6% | | | | | | | | |
| | |
COMMON STOCKS | | | | | | | | |
| | |
Aerospace & Defense 1.6% | | | | | | | | |
| | |
General Dynamics Corp. | | | 22,100 | | | $ | 4,480,775 | |
Lockheed Martin Corp. | | | 16,033 | | | | 5,328,086 | |
Northrop Grumman Corp. | | | 804 | | | | 287,205 | |
Raytheon Technologies Corp. | | | 41,250 | | | | 3,665,475 | |
| | | | | | | | |
| | |
| | | | | | | 13,761,541 | |
| | |
Air Freight & Logistics 0.3% | | | | | | | | |
| | |
FedEx Corp. | | | 8,100 | | | | 1,907,793 | |
United Parcel Service, Inc. (Class B Stock) | | | 2,200 | | | | 469,634 | |
| | | | | | | | |
| | |
| | | | | | | 2,377,427 | |
| | |
Automobiles 2.2% | | | | | | | | |
| | |
Tesla, Inc.* | | | 16,400 | | | | 18,269,600 | |
Thor Industries, Inc. | | | 4,500 | | | | 458,820 | |
| | | | | | | | |
| | |
| | | | | | | 18,728,420 | |
| | |
Banks 3.7% | | | | | | | | |
| | |
Bank of America Corp. | | | 60,100 | | | | 2,871,578 | |
Citigroup, Inc. | | | 84,078 | | | | 5,814,835 | |
JPMorgan Chase & Co. | | | 40,281 | | | | 6,843,339 | |
Popular, Inc. (Puerto Rico) | | | 5,200 | | | | 423,488 | |
Regions Financial Corp. | | | 121,700 | | | | 2,881,856 | |
Signature Bank | | | 7,100 | | | | 2,114,522 | |
U.S. Bancorp | | | 24,600 | | | | 1,485,102 | |
Wells Fargo & Co. | | | 189,100 | | | | 9,674,356 | |
| | | | | | | | |
| | |
| | | | | | | 32,109,076 | |
| | |
Beverages 2.0% | | | | | | | | |
| | |
Coca-Cola Co. (The) | | | 161,000 | | | | 9,075,570 | |
PepsiCo, Inc. | | | 52,400 | | | | 8,467,840 | |
| | | | | | | | |
| | |
| | | | | | | 17,543,410 | |
| | |
Biotechnology 1.2% | | | | | | | | |
| | |
AbbVie, Inc. | | | 56,151 | | | | 6,438,835 | |
Gilead Sciences, Inc. | | | 14,672 | | | | 951,919 | |
Regeneron Pharmaceuticals, Inc.* | | | 4,100 | | | | 2,623,754 | |
Vertex Pharmaceuticals, Inc.* | | | 3,900 | | | | 721,227 | |
| | | | | | | | |
| | |
| | | | | | | 10,735,735 | |
See Notes to Financial Statements.
| | | | |
| PGIM QMA Large-Cap Core Equity Fund | | | 13 | |
Schedule of Investments (continued)
as of October 31, 2021
| | | | | | | | |
| | |
| Description | | Shares | | | Value | |
| | |
COMMON STOCKS (Continued) | | | | | | | | |
| | |
Building Products 0.4% | | | | | | | | |
| | |
Carrier Global Corp. | | | 45,000 | | | $ | 2,350,350 | |
UFP Industries, Inc. | | | 14,033 | | | | 1,148,320 | |
| | | | | | | | |
| | |
| | | | | | | 3,498,670 | |
| | |
Capital Markets 2.6% | | | | | | | | |
| | |
Ares Management Corp. (Class A Stock) | | | 3,800 | | | | 322,012 | |
Goldman Sachs Group, Inc. (The) | | | 22,477 | | | | 9,290,868 | |
Morgan Stanley | | | 10,400 | | | | 1,068,912 | |
Northern Trust Corp. | | | 25,600 | | | | 3,149,824 | |
Raymond James Financial, Inc. | | | 17,400 | | | | 1,715,466 | |
State Street Corp. | | | 54,800 | | | | 5,400,540 | |
Stifel Financial Corp. | | | 17,200 | | | | 1,253,364 | |
| | | | | | | | |
| | |
| | | | | | | 22,200,986 | |
| | |
Chemicals 1.6% | | | | | | | | |
| | |
CF Industries Holdings, Inc. | | | 14,600 | | | | 829,280 | |
Chemours Co. (The) | | | 9,200 | | | | 257,784 | |
Corteva, Inc. | | | 33,300 | | | | 1,436,895 | |
Dow, Inc. | | | 87,000 | | | | 4,869,390 | |
DuPont de Nemours, Inc. | | | 69,600 | | | | 4,844,160 | |
Westlake Chemical Corp. | | | 20,200 | | | | 1,966,268 | |
| | | | | | | | |
| | |
| | | | | | | 14,203,777 | |
| | |
Commercial Services & Supplies 0.2% | | | | | | | | |
| | |
ABM Industries, Inc. | | | 10,200 | | | | 448,902 | |
Clean Harbors, Inc.* | | | 7,800 | | | | 877,812 | |
| | | | | | | | |
| | |
| | | | | | | 1,326,714 | |
| | |
Communications Equipment 0.5% | | | | | | | | |
| | |
Cisco Systems, Inc. | | | 61,382 | | | | 3,435,551 | |
Ubiquiti, Inc. | | | 1,800 | | | | 549,954 | |
| | | | | | | | |
| | |
| | | | | | | 3,985,505 | |
| | |
Construction & Engineering 0.1% | | | | | | | | |
| | |
EMCOR Group, Inc. | | | 7,577 | | | | 920,530 | |
| | |
Consumer Finance 1.3% | | | | | | | | |
| | |
Capital One Financial Corp. | | | 37,300 | | | | 5,633,419 | |
Discover Financial Services | | | 2,200 | | | | 249,304 | |
LendingClub Corp.* | | | 34,200 | | | | 1,571,832 | |
See Notes to Financial Statements.
| | | | | | | | |
| | |
| Description | | Shares | | | Value | |
| | |
COMMON STOCKS (Continued) | | | | | | | | |
| | |
Consumer Finance (cont’d.) | | | | | | | | |
| | |
OneMain Holdings, Inc. | | | 39,600 | | | $ | 2,091,276 | |
Synchrony Financial | | | 45,100 | | | | 2,094,895 | |
| | | | | | | | |
| | |
| | | | | | | 11,640,726 | |
| | |
Distributors 0.7% | | | | | | | | |
| | |
Genuine Parts Co. | | | 21,200 | | | | 2,779,532 | |
LKQ Corp.* | | | 60,900 | | | | 3,354,372 | |
| | | | | | | | |
| | |
| | | | | | | 6,133,904 | |
| | |
Diversified Financial Services 0.9% | | | | | | | | |
| | |
Berkshire Hathaway, Inc. (Class B Stock)* | | | 26,274 | | | | 7,540,901 | |
| | |
Diversified Telecommunication Services 1.5% | | | | | | | | |
| | |
AT&T, Inc. | | | 211,135 | | | | 5,333,270 | |
Verizon Communications, Inc. | | | 138,950 | | | | 7,362,961 | |
| | | | | | | | |
| | |
| | | | | | | 12,696,231 | |
| | |
Electric Utilities 0.8% | | | | | | | | |
| | |
Entergy Corp. | | | 7,400 | | | | 762,348 | |
Exelon Corp. | | | 95,645 | | | | 5,087,358 | |
FirstEnergy Corp. | | | 6,800 | | | | 262,004 | |
PPL Corp. | | | 32,000 | | | | 921,600 | |
| | | | | | | | |
| | |
| | | | | | | 7,033,310 | |
| | |
Electrical Equipment 1.3% | | | | | | | | |
| | |
AMETEK, Inc. | | | 11,000 | | | | 1,456,400 | |
Atkore, Inc.* | | | 28,321 | | | | 2,677,184 | |
Emerson Electric Co. | | | 55,100 | | | | 5,345,251 | |
Generac Holdings, Inc.* | | | 700 | | | | 348,992 | |
Regal Rexnord Corp. | | | 9,900 | | | | 1,508,067 | |
| | | | | | | | |
| | |
| | | | | | | 11,335,894 | |
| | |
Electronic Equipment, Instruments & Components 0.5% | | | | | | | | |
| | |
CDW Corp. | | | 13,900 | | | | 2,594,435 | |
SYNNEX Corp. | | | 14,600 | | | | 1,533,000 | |
| | | | | | | | |
| | |
| | | | | | | 4,127,435 | |
See Notes to Financial Statements.
| | | | |
| PGIM QMA Large-Cap Core Equity Fund | | | 15 | |
Schedule of Investments (continued)
as of October 31, 2021
| | | | | | | | |
| | |
| Description | | Shares | | | Value | |
| | |
COMMON STOCKS (Continued) | | | | | | | | |
| | |
Energy Equipment & Services 0.5% | | | | | | | | |
| | |
Halliburton Co. | | | 84,500 | | | $ | 2,111,655 | |
Schlumberger NV | | | 54,000 | | | | 1,742,040 | |
| | | | | | | | |
| | |
| | | | | | | 3,853,695 | |
| | |
Entertainment 1.9% | | | | | | | | |
| | |
Activision Blizzard, Inc. | | | 59,300 | | | | 4,636,667 | |
Live Nation Entertainment, Inc.* | | | 3,600 | | | | 364,140 | |
Netflix, Inc.* | | | 15,300 | | | | 10,561,743 | |
Walt Disney Co. (The)* | | | 6,000 | | | | 1,014,420 | |
| | | | | | | | |
| | |
| | | | | | | 16,576,970 | |
| | |
Equity Real Estate Investment Trusts (REITs) 1.7% | | | | | | | | |
| | |
Apple Hospitality REIT, Inc. | | | 71,300 | | | | 1,120,123 | |
DiamondRock Hospitality Co.* | | | 32,200 | | | | 291,088 | |
Extra Space Storage, Inc. | | | 6,000 | | | | 1,184,220 | |
Park Hotels & Resorts, Inc.* | | | 28,000 | | | | 518,840 | |
PotlatchDeltic Corp. | | | 25,000 | | | | 1,306,750 | |
Prologis, Inc. | | | 25,700 | | | | 3,725,472 | |
SBA Communications Corp. | | | 14,800 | | | | 5,110,884 | |
Welltower, Inc. | | | 9,200 | | | | 739,680 | |
Weyerhaeuser Co. | | | 29,500 | | | | 1,053,740 | |
| | | | | | | | |
| | |
| | | | | | | 15,050,797 | |
| | |
Food & Staples Retailing 0.8% | | | | | | | | |
| | |
Kroger Co. (The) | | | 31,700 | | | | 1,268,634 | |
Walgreens Boots Alliance, Inc. | | | 9,600 | | | | 451,392 | |
Walmart, Inc. | | | 36,693 | | | | 5,482,668 | |
| | | | | | | | |
| | |
| | | | | | | 7,202,694 | |
| | |
Food Products 1.2% | | | | | | | | |
| | |
Archer-Daniels-Midland Co. | | | 19,600 | | | | 1,259,104 | |
Ingredion, Inc. | | | 2,900 | | | | 276,167 | |
Kraft Heinz Co. (The) | | | 71,700 | | | | 2,573,313 | |
Mondelez International, Inc. (Class A Stock) | | | 10,800 | | | | 655,992 | |
Sanderson Farms, Inc. | | | 5,000 | | | | 947,250 | |
Tyson Foods, Inc. (Class A Stock) | | | 61,100 | | | | 4,886,167 | |
| | | | | | | | |
| | |
| | | | | | | 10,597,993 | |
| | |
Health Care Equipment & Supplies 3.9% | | | | | | | | |
Abbott Laboratories | | | 30,900 | | | | 3,982,701 | |
See Notes to Financial Statements.
| | | | | | | | |
| | |
| Description | | Shares | | | Value | |
| | |
COMMON STOCKS (Continued) | | | | | | | | |
| | |
Health Care Equipment & Supplies (cont’d.) | | | | | | | | |
| | |
Align Technology, Inc.* | | | 1,600 | | | $ | 998,992 | |
Baxter International, Inc. | | | 14,000 | | | | 1,105,440 | |
Becton, Dickinson & Co. | | | 10,400 | | | | 2,491,736 | |
Boston Scientific Corp.* | | | 114,600 | | | | 4,942,698 | |
DENTSPLY SIRONA, Inc. | | | 40,600 | | | | 2,322,726 | |
Edwards Lifesciences Corp.* | | | 9,300 | | | | 1,114,326 | |
Envista Holdings Corp.* | | | 6,800 | | | | 265,880 | |
Intuitive Surgical, Inc.* | | | 8,400 | | | | 3,033,492 | |
Medtronic PLC | | | 63,800 | | | | 7,647,068 | |
Stryker Corp. | | | 20,700 | | | | 5,507,649 | |
| | | | | | | | |
| | |
| | | | | | | 33,412,708 | |
| | |
Health Care Providers & Services 2.5% | | | | | | | | |
| | |
Anthem, Inc. | | | 14,200 | | | | 6,178,846 | |
CVS Health Corp. | | | 44,200 | | | | 3,946,176 | |
HCA Healthcare, Inc. | | | 10,100 | | | | 2,529,646 | |
McKesson Corp. | | | 3,800 | | | | 789,944 | |
UnitedHealth Group, Inc. | | | 17,400 | | | | 8,012,178 | |
| | | | | | | | |
| | |
| | | | | | | 21,456,790 | |
| | |
Hotels, Restaurants & Leisure 2.7% | | | | | | | | |
| | |
Booking Holdings, Inc.* | | | 2,200 | | | | 5,325,716 | |
Marriott International, Inc. (Class A Stock)* | | | 25,300 | | | | 4,048,506 | |
McDonald’s Corp. | | | 30,700 | | | | 7,538,385 | |
Starbucks Corp. | | | 41,100 | | | | 4,359,477 | |
Yum! Brands, Inc. | | | 13,100 | | | | 1,636,714 | |
| | | | | | | | |
| | |
| | | | | | | 22,908,798 | |
| | |
Household Durables 0.2% | | | | | | | | |
| | |
Lennar Corp. (Class A Stock) | | | 10,400 | | | | 1,039,272 | |
Toll Brothers, Inc. | | | 10,800 | | | | 649,836 | |
Tri Pointe Homes, Inc.* | | | 10,300 | | | | 249,157 | |
| | | | | | | | |
| | |
| | | | | | | 1,938,265 | |
| | |
Household Products 0.6% | | | | | | | | |
| | |
Procter & Gamble Co. (The) | | | 33,386 | | | | 4,773,864 | |
See Notes to Financial Statements.
| | | | |
| PGIM QMA Large-Cap Core Equity Fund | | | 17 | |
Schedule of Investments (continued)
as of October 31, 2021
| | | | | | | | |
| | |
| Description | | Shares | | | Value | |
| | |
COMMON STOCKS (Continued) | | | | | | | | |
| | |
Independent Power & Renewable Electricity Producers 0.7% | | | | | | | | |
| | |
AES Corp. (The) | | | 186,500 | | | $ | 4,686,745 | |
Vistra Corp. | | | 57,400 | | | | 1,124,466 | |
| | | | | | | | |
| | |
| | | | | | | 5,811,211 | |
| | |
Industrial Conglomerates 1.4% | | | | | | | | |
| | |
3M Co. | | | 27,400 | | | | 4,895,832 | |
Honeywell International, Inc. | | | 34,300 | | | | 7,498,666 | |
| | | | | | | | |
| | |
| | | | | | | 12,394,498 | |
| | |
Insurance 2.1% | | | | | | | | |
| | |
American International Group, Inc.(a) | | | 67,300 | | | | 3,976,757 | |
Chubb Ltd. | | | 23,600 | | | | 4,610,968 | |
MetLife, Inc. | | | 85,840 | | | | 5,390,752 | |
Old Republic International Corp. | | | 70,500 | | | | 1,821,015 | |
Reinsurance Group of America, Inc. | | | 18,000 | | | | 2,125,440 | |
| | | | | | | | |
| | |
| | | | | | | 17,924,932 | |
| | |
Interactive Media & Services 7.1% | | | | | | | | |
| | |
Alphabet, Inc. (Class A Stock)* | | | 7,494 | | | | 22,189,134 | |
Alphabet, Inc. (Class C Stock)* | | | 6,868 | | | | 20,366,436 | |
Meta Platforms, Inc. (Class A Stock)* | | | 59,580 | | | | 19,278,301 | |
| | | | | | | | |
| | |
| �� | | | | | | 61,833,871 | |
| | |
Internet & Direct Marketing Retail 3.2% | | | | | | | | |
| | |
Amazon.com, Inc.* | | | 8,102 | | | | 27,323,428 | |
eBay, Inc. | | | 3,800 | | | | 291,536 | |
| | | | | | | | |
| | |
| | | | | | | 27,614,964 | |
| | |
IT Services 5.0% | | | | | | | | |
| | |
Accenture PLC (Class A Stock) | | | 27,559 | | | | 9,887,894 | |
Automatic Data Processing, Inc. | | | 10,500 | | | | 2,357,145 | |
Cognizant Technology Solutions Corp. (Class A Stock) | | | 34,700 | | | | 2,709,723 | |
EPAM Systems, Inc.* | | | 5,800 | | | | 3,904,792 | |
Fidelity National Information Services, Inc. | | | 4,400 | | | | 487,256 | |
Fiserv, Inc.* | | | 2,600 | | | | 256,074 | |
Gartner, Inc.* | | | 5,300 | | | | 1,759,123 | |
International Business Machines Corp. | | | 30,630 | | | | 3,831,813 | |
Mastercard, Inc. (Class A Stock) | | | 13,200 | | | | 4,428,864 | |
See Notes to Financial Statements.
| | | | | | | | |
| | |
| Description | | Shares | | | Value | |
| | |
COMMON STOCKS (Continued) | | | | | | | | |
| | |
IT Services (cont’d.) | | | | | | | | |
| | |
PayPal Holdings, Inc.* | | | 10,300 | | | $ | 2,395,677 | |
Visa, Inc. (Class A Stock) | | | 54,725 | | | | 11,589,113 | |
| | | | | | | | |
| | |
| | | | | | | 43,607,474 | |
| | |
Leisure Products 0.4% | | | | | | | | |
| | |
Brunswick Corp. | | | 29,200 | | | | 2,718,228 | |
Smith & Wesson Brands, Inc. | | | 52,800 | | | | 1,135,200 | |
| | | | | | | | |
| | |
| | | | | | | 3,853,428 | |
| | |
Life Sciences Tools & Services 2.5% | | | | | | | | |
| | |
Danaher Corp. | | | 11,400 | | | | 3,554,178 | |
Illumina, Inc.* | | | 900 | | | | 373,554 | |
IQVIA Holdings, Inc.* | | | 17,300 | | | | 4,522,566 | |
Mettler-Toledo International, Inc.* | | | 2,400 | | | | 3,554,112 | |
Thermo Fisher Scientific, Inc. | | | 14,114 | | | | 8,935,150 | |
Waters Corp.* | | | 2,800 | | | | 1,029,140 | |
| | | | | | | | |
| | |
| | | | | | | 21,968,700 | |
| | |
Machinery 2.2% | | | | | | | | |
| | |
AGCO Corp. | | | 17,800 | | | | 2,175,338 | |
Cummins, Inc. | | | 20,500 | | | | 4,916,720 | |
Deere & Co. | | | 12,100 | | | | 4,141,951 | |
Hillenbrand, Inc. | | | 18,600 | | | | 845,556 | |
Otis Worldwide Corp. | | | 17,900 | | | | 1,437,549 | |
Parker-Hannifin Corp. | | | 6,400 | | | | 1,898,176 | |
Stanley Black & Decker, Inc. | | | 20,500 | | | | 3,684,465 | |
| | | | | | | | |
| | |
| | | | | | | 19,099,755 | |
| | |
Media 0.9% | | | | | | | | |
| | |
Comcast Corp. (Class A Stock) | | | 159,100 | | | | 8,182,513 | |
| | |
Metals & Mining 0.4% | | | | | | | | |
| | |
Freeport-McMoRan, Inc. | | | 58,600 | | | | 2,210,392 | |
Nucor Corp. | | | 5,500 | | | | 614,075 | |
Reliance Steel & Aluminum Co. | | | 7,000 | | | | 1,023,120 | |
| | | | | | | | |
| | |
| | | | | | | 3,847,587 | |
| | |
Multiline Retail 0.3% | | | | | | | | |
| | |
Target Corp. | | | 10,300 | | | | 2,674,086 | |
See Notes to Financial Statements.
| | | | |
| PGIM QMA Large-Cap Core Equity Fund | | | 19 | |
Schedule of Investments (continued)
as of October 31, 2021
| | | | | | | | |
| | |
| Description | | Shares | | | Value | |
| | |
COMMON STOCKS (Continued) | | | | | | | | |
| | |
Multi-Utilities 0.3% | | | | | | | | |
| | |
MDU Resources Group, Inc. | | | 41,200 | | | $ | 1,266,076 | |
Sempra Energy | | | 9,000 | | | | 1,148,670 | |
| | | | | | | | |
| | |
| | | | | | | 2,414,746 | |
| | |
Oil, Gas & Consumable Fuels 3.1% | | | | | | | | |
| | |
Cheniere Energy, Inc.* | | | 20,700 | | | | 2,140,380 | |
Chevron Corp. | | | 57,000 | | | | 6,525,930 | |
ConocoPhillips | | | 30,800 | | | | 2,294,292 | |
Diamondback Energy, Inc. | | | 3,900 | | | | 418,041 | |
EOG Resources, Inc. | | | 34,700 | | | | 3,208,362 | |
Exxon Mobil Corp. | | | 167,400 | | | | 10,792,278 | |
Occidental Petroleum Corp. | | | 47,400 | | | | 1,589,322 | |
| | | | | | | | |
| | |
| | | | | | | 26,968,605 | |
| | |
Personal Products 0.0% | | | | | | | | |
| | |
Medifast, Inc. | | | 1,300 | | | | 255,151 | |
| | |
Pharmaceuticals 3.4% | | | | | | | | |
| | |
Bristol-Myers Squibb Co. | | | 110,400 | | | | 6,447,360 | |
Johnson & Johnson | | | 82,258 | | | | 13,398,183 | |
Merck & Co., Inc. | | | 37,600 | | | | 3,310,680 | |
Pfizer, Inc. | | | 131,600 | | | | 5,756,184 | |
Zoetis, Inc. | | | 3,500 | | | | 756,700 | |
| | | | | | | | |
| | |
| | | | | | | 29,669,107 | |
| | |
Professional Services 0.3% | | | | | | | | |
| | |
Korn Ferry | | | 16,200 | | | | 1,250,802 | |
ManpowerGroup, Inc. | | | 14,300 | | | | 1,382,095 | |
| | | | | | | | |
| | |
| | | | | | | 2,632,897 | |
| | |
Real Estate Management & Development 0.1% | | | | | | | | |
| | |
CBRE Group, Inc. (Class A Stock)* | | | 11,500 | | | | 1,196,920 | |
| | |
Road & Rail 0.4% | | | | | | | | |
| | |
AMERCO | | | 1,200 | | | | 884,388 | |
Union Pacific Corp. | | | 9,800 | | | | 2,365,720 | |
| | | | | | | | |
| | |
| | | | | | | 3,250,108 | |
| | |
Semiconductors & Semiconductor Equipment 6.2% | | | | | | | | |
| | |
Analog Devices, Inc. | | | 35,300 | | | | 6,124,197 | |
See Notes to Financial Statements.
| | | | | | | | |
| | |
| Description | | Shares | | | Value | |
| | |
COMMON STOCKS (Continued) | | | | | | | | |
| | |
Semiconductors & Semiconductor Equipment (cont’d.) | | | | | | | | |
| | |
Applied Materials, Inc. | | | 60,200 | | | $ | 8,226,330 | |
Broadcom, Inc. | | | 16,600 | | | | 8,825,722 | |
Cirrus Logic, Inc.* | | | 6,700 | | | | 541,427 | |
Intel Corp. | | | 163,041 | | | | 7,989,009 | |
Lam Research Corp. | | | 5,700 | | | | 3,212,349 | |
NVIDIA Corp. | | | 28,600 | | | | 7,312,162 | |
QUALCOMM, Inc. | | | 56,800 | | | | 7,556,672 | |
Texas Instruments, Inc. | | | 18,800 | | | | 3,524,624 | |
| | | | | | | | |
| | |
| | | | | | | 53,312,492 | |
| | |
Software 10.6% | | | | | | | | |
| | |
Adobe, Inc.* | | | 16,983 | | | | 11,045,064 | |
Autodesk, Inc.* | | | 2,300 | | | | 730,503 | |
Black Knight, Inc.* | | | 16,600 | | | | 1,163,826 | |
Dolby Laboratories, Inc. (Class A Stock) | | | 17,600 | | | | 1,554,960 | |
Intuit, Inc. | | | 1,800 | | | | 1,126,782 | |
Manhattan Associates, Inc.* | | | 8,900 | | | | 1,615,706 | |
McAfee Corp. (Class A Stock) | | | 11,900 | | | | 254,303 | |
Microsoft Corp. | | | 180,884 | | | | 59,984,752 | |
Oracle Corp. | | | 28,279 | | | | 2,713,087 | |
Paycom Software, Inc.* | | | 3,400 | | | | 1,862,690 | |
salesforce.com, Inc.* | | | 15,900 | | | | 4,765,071 | |
SS&C Technologies Holdings, Inc. | | | 30,200 | | | | 2,399,994 | |
Synopsys, Inc.* | | | 8,200 | | | | 2,732,076 | |
| | | | | | | | |
| | |
| | | | | | | 91,948,814 | |
| | |
Specialty Retail 1.9% | | | | | | | | |
| | |
Asbury Automotive Group, Inc.* | | | 2,900 | | | | 567,559 | |
AutoNation, Inc.* | | | 16,600 | | | | 2,010,592 | |
AutoZone, Inc.* | | | 700 | | | | 1,249,388 | |
Best Buy Co., Inc. | | | 2,800 | | | | 342,272 | |
Foot Locker, Inc. | | | 62,100 | | | | 2,960,307 | |
Group 1 Automotive, Inc. | | | 4,300 | | | | 773,140 | |
Home Depot, Inc. (The) | | | 10,000 | | | | 3,717,400 | |
Ross Stores, Inc. | | | 10,200 | | | | 1,154,640 | |
TJX Cos., Inc. (The) | | | 52,800 | | | | 3,457,872 | |
| | | | | | | | |
| | |
| | | | | | | 16,233,170 | |
See Notes to Financial Statements.
| | | | |
| PGIM QMA Large-Cap Core Equity Fund | | | 21 | |
Schedule of Investments (continued)
as of October 31, 2021
| | | | | | | | |
| | |
| Description | | Shares | | | Value | |
| | |
COMMON STOCKS (Continued) | | | | | | | | |
| | |
Technology Hardware, Storage & Peripherals 5.6% | | | | | | | | |
| | |
Apple, Inc. | | | 304,780 | | | $ | 45,656,044 | |
Western Digital Corp.* | | | 46,000 | | | | 2,405,340 | |
| | | | | | | | |
| | |
| | | | | | | 48,061,384 | |
| | |
Textiles, Apparel & Luxury Goods 0.4% | | | | | | | | |
| | |
Capri Holdings Ltd.* | | | 51,800 | | | | 2,757,832 | |
Tapestry, Inc. | | | 23,200 | | | | 904,336 | |
| | | | | | | | |
| | |
| | | | | | | 3,662,168 | |
| | |
Tobacco 0.5% | | | | | | | | |
| | |
Altria Group, Inc. | | | 93,341 | | | | 4,117,271 | |
| | |
Trading Companies & Distributors 0.2% | | | | | | | | |
| | |
Applied Industrial Technologies, Inc. | | | 2,900 | | | | 282,692 | |
GMS, Inc.* | | | 8,500 | | | | 421,005 | |
Herc Holdings, Inc. | | | 4,700 | | | | 855,588 | |
| | | | | | | | |
| | |
| | | | | | | 1,559,285 | |
| | |
TOTAL LONG-TERM INVESTMENTS | | | | | | | | |
(cost $616,019,482) | | | | | | | 853,767,903 | |
| | | | | | | | |
| | |
SHORT-TERM INVESTMENTS 2.0% | | | | | | | | |
| | |
AFFILIATED MUTUAL FUNDS 1.9% | | | | | | | | |
PGIM Core Ultra Short Bond Fund(wa) | | | 15,957,883 | | | | 15,957,883 | |
PGIM Institutional Money Market Fund | | | | | | | | |
(cost $602,941; includes $602,470 of cash collateral for securities on loan)(b)(wa) | | | 603,303 | | | | 602,941 | |
| | | | | | | | |
| | |
TOTAL AFFILIATED MUTUAL FUNDS | | | | | | | | |
(cost $16,560,824) | | | | | | | 16,560,824 | |
| | | | | | | | |
See Notes to Financial Statements.
| | | | | | | | | | | | |
| Description | | Interest
Rate | | Maturity
Date | | Principal
Amount
(000)# | | | Value | |
| | | | |
U.S. TREASURY OBLIGATION(k)(n) 0.1% | | | | | | | | | | | | |
U.S. Treasury Bills
(cost $999,960) | | 0.037% | | 12/09/21 | | | 1,000 | | | $ | 999,930 | |
| | | | | | | | | | | | |
| | | | |
TOTAL SHORT-TERM INVESTMENTS
(cost $17,560,784) | | | | | | | | | | | 17,560,754 | |
| | | | | | | | | | | | |
| | | |
TOTAL INVESTMENTS 100.6%
(cost $633,580,266) | | | | | | | | | 871,328,657 | |
Liabilities in excess of other assets(z) (0.6)% | | | | | | | | | | | (5,179,506 | ) |
| | | | | | | | | | | | |
| | | | |
NET ASSETS 100.0% | | | | | | | | | | $ | 866,149,151 | |
| | | | | | | | | | | | |
Below is a list of the abbreviation(s) used in the annual report:
USD—US Dollar
LIBOR—London Interbank Offered Rate
OTC—Over-the-counter
REITs—Real Estate Investment Trust
S&P—Standard & Poor’s
| * | Non-income producing security. |
| # | Principal amount is shown in U.S. dollars unless otherwise stated. |
| (a) | All or a portion of security is on loan. The aggregate market value of such securities, including those sold and pending settlement, is $587,173; cash collateral of $602,470 (included in liabilities) was received with which the Fund purchased highly liquid short-term investments. In the event of significant appreciation in value of securities on loan on the last business day of the reporting period, the Fund may reflect a collateral value that is less than the market value of the loaned securities and such shortfall is remedied the following business day. |
| (b) | Represents security, or portion thereof, purchased with cash collateral received for securities on loan and includes dividend reinvestment. |
| (k) | Represents security, or a portion thereof, segregated as collateral for centrally cleared/exchange-traded derivatives. (n) Rate shown reflects yield to maturity at purchased date. |
| (wa) | PGIM Investments LLC, the manager of the Fund, also serves as manager of the PGIM Core Ultra Short Bond Fund and PGIM Institutional Money Market Fund, if applicable. |
| (z) | Includes net unrealized appreciation/(depreciation) and/or market value of the below holdings which are excluded from the Schedule of Investments: |
Futures contracts outstanding at October 31, 2021:
| | | | | | | | | | | | | | | | | |
Number of
Contracts | | Type | | Expiration
Date | | Current
Notional
Amount | | Value /
Unrealized
Appreciation
(Depreciation) |
Long Position: | | | | | | | | | | | | | | | | | |
| 58 | | S&P 500 E-Mini Index | | | | Dec. 2021 | | | | $ | 13,331,300 | | | | | $575,174 | |
| | | | | | | | | | | | | | | | | |
See Notes to Financial Statements.
| | | | | | | | |
| | | | PGIM QMA Large-Cap Core Equity Fund | | | 23 | |
Schedule of Investments (continued)
as of October 31, 2021
Summary of Collateral for Centrally Cleared/Exchange-traded Derivatives:
Cash and securities segregated as collateral, including pending settlement for closed positions, to cover requirements for centrally cleared/exchange-traded derivatives are listed by broker as follows:
| | | | | | | | | | |
Broker | | Cash and/or Foreign Currency | | Securities Market Value |
Goldman Sachs & Co. LLC | | | $ | — | | | | $ | 999,930 | |
| | | | | | | | | | |
Fair Value Measurements:
Various inputs are used in determining the value of the Fund’s investments. These inputs are summarized in the three broad levels listed below.
Level 1—unadjusted quoted prices generally in active markets for identical securities.
Level 2—quoted prices for similar securities, interest rates and yield curves, prepayment speeds, foreign currency exchange rates and other observable inputs.
Level 3—unobservable inputs for securities valued in accordance with Board approved fair valuation procedures.
The following is a summary of the inputs used as of October 31, 2021 in valuing such portfolio securities:
| | | | | | | | | | | | | | | |
| | | Level 1 | | Level 2 | | Level 3 |
Investments in Securities | | | | | | | | | | | | | | | |
Assets | | | | | | | | | | | | | | | |
Long-Term Investments | | | | | | | | | | | | | | | |
Common Stocks | | | | | | | | | | | | | | | |
Aerospace & Defense | | | $ | 13,761,541 | | | | $ | — | | | | $ | — | |
Air Freight & Logistics | | | | 2,377,427 | | | | | — | | | | | — | |
Automobiles | | | | 18,728,420 | | | | | — | | | | | — | |
Banks | | | | 32,109,076 | | | | | — | | | | | — | |
Beverages | | | | 17,543,410 | | | | | — | | | | | — | |
Biotechnology | | | | 10,735,735 | | | | | — | | | | | — | |
Building Products | | | | 3,498,670 | | | | | — | | | | | — | |
Capital Markets | | | | 22,200,986 | | | | | — | | | | | — | |
Chemicals | | | | 14,203,777 | | | | | — | | | | | — | |
Commercial Services & Supplies | | | | 1,326,714 | | | | | — | | | | | — | |
Communications Equipment | | | | 3,985,505 | | | | | — | | | | | — | |
Construction & Engineering | | | | 920,530 | | | | | — | | | | | — | |
Consumer Finance | | | | 11,640,726 | | | | | — | | | | | — | |
Distributors | | | | 6,133,904 | | | | | — | | | | | — | |
Diversified Financial Services | | | | 7,540,901 | | | | | — | | | | | — | |
Diversified Telecommunication Services | | | | 12,696,231 | | | | | — | | | | | — | |
Electric Utilities | | | | 7,033,310 | | | | | — | | | | | — | |
Electrical Equipment | | | | 11,335,894 | | | | | — | | | | | — | |
Electronic Equipment, Instruments & Components | | | | 4,127,435 | | | | | — | | | | | — | |
Energy Equipment & Services | | | | 3,853,695 | | | | | — | | | | | — | |
Entertainment | | | | 16,576,970 | | | | | — | | | | | — | |
Equity Real Estate Investment Trusts (REITs) | | | | 15,050,797 | | | | | — | | | | | — | |
Food & Staples Retailing | | | | 7,202,694 | | | | | — | | | | | — | |
See Notes to Financial Statements.
| | | | | | | | | | | | | | | |
| | | Level 1 | | Level 2 | | Level 3 |
Investments in Securities (continued) | | | | | | | | | | | | | | | |
Assets (continued) | | | | | | | | | | | | | | | |
Long-Term Investments (continued) | | | | | | | | | | | | | | | |
Common Stocks (continued) | | | | | | | | | | | | | | | |
Food Products | | | $ | 10,597,993 | | | | $ | — | | | | $ | — | |
Health Care Equipment & Supplies | | | | 33,412,708 | | | | | — | | | | | — | |
Health Care Providers & Services | | | | 21,456,790 | | | | | — | | | | | — | |
Hotels, Restaurants & Leisure | | | | 22,908,798 | | | | | — | | | | | — | |
Household Durables | | | | 1,938,265 | | | | | — | | | | | — | |
Household Products | | | | 4,773,864 | | | | | — | | | | | — | |
Independent Power & Renewable Electricity Producers | | | | 5,811,211 | | | | | — | | | | | — | |
Industrial Conglomerates | | | | 12,394,498 | | | | | — | | | | | — | |
Insurance | | | | 17,924,932 | | | | | — | | | | | — | |
Interactive Media & Services. | | | | 61,833,871 | | | | | — | | | | | — | |
Internet & Direct Marketing Retail | | | | 27,614,964 | | | | | — | | | | | — | |
IT Services | | | | 43,607,474 | | | | | — | | | | | — | |
Leisure Products | | | | 3,853,428 | | | | | — | | | | | — | |
Life Sciences Tools & Services | | | | 21,968,700 | | | | | — | | | | | — | |
Machinery | | | | 19,099,755 | | | | | — | | | | | — | |
Media | | | | 8,182,513 | | | | | — | | | | | — | |
Metals & Mining | | | | 3,847,587 | | | | | — | | | | | — | |
Multiline Retail | | | | 2,674,086 | | | | | — | | | | | — | |
Multi-Utilities | | | | 2,414,746 | | | | | — | | | | | — | |
Oil, Gas & Consumable Fuels | | | | 26,968,605 | | | | | — | | | | | — | |
Personal Products | | | | 255,151 | | | | | — | | | | | — | |
Pharmaceuticals | | | | 29,669,107 | | | | | — | | | | | — | |
Professional Services | | | | 2,632,897 | | | | | — | | | | | — | |
Real Estate Management & Development | | | | 1,196,920 | | | | | — | | | | | — | |
Road & Rail | | | | 3,250,108 | | | | | — | | | | | — | |
Semiconductors & Semiconductor Equipment | | | | 53,312,492 | | | | | — | | | | | — | |
Software | | | | 91,948,814 | | | | | — | | | | | — | |
Specialty Retail | | | | 16,233,170 | | | | | — | | | | | — | |
Technology Hardware, Storage & Peripherals | | | | 48,061,384 | | | | | — | | | | | — | |
Textiles, Apparel & Luxury Goods | | | | 3,662,168 | | | | | — | | | | | — | |
Tobacco | | | | 4,117,271 | | | | | — | | | | | — | |
Trading Companies & Distributors | | | | 1,559,285 | | | | | — | | | | | — | |
Short-Term Investments | | | | | | | | | | | | | | | |
Affiliated Mutual Funds | | | | 16,560,824 | | | | | — | | | | | — | |
U.S. Treasury Obligation | | | | — | | | | | 999,930 | | | | | — | |
| | | | | | | | | | | | | | | |
Total | | | $ | 870,328,727 | | | | $ | 999,930 | | | | $ | — | |
| | | | | | | | | | | | | | | |
| | | |
Other Financial Instruments* | | | | | | | | | | | | | | | |
Assets | | | | | | | | | | | | | | | |
Futures Contracts | | | $ | 575,174 | | | | $ | — | | | | $ | — | |
| | | | | | | | | | | | | | | |
See Notes to Financial Statements.
| | | | | | |
| | PGIM QMA Large-Cap Core Equity Fund | | | 25 | |
Schedule of Investments (continued)
as of October 31, 2021
| * | Other financial instruments are derivative instruments not reflected in the Schedule of Investments, such as futures, forwards and centrally cleared swap contracts, which are recorded at the unrealized appreciation (depreciation) on the instrument, and OTC swap contracts which are recorded at fair value. |
Industry Classification:
The industry classification of investments and liabilities in excess of other assets shown as a percentage of net assets as of October 31, 2021 were as follows (unaudited):
| | | | |
Software | | | 10.6 | % |
Interactive Media & Services | | | 7.1 | |
Semiconductors & Semiconductor Equipment | | | 6.2 | |
Technology Hardware, Storage & Peripherals | | | 5.6 | |
IT Services | | | 5.0 | |
Health Care Equipment & Supplies | | | 3.9 | |
Banks | | | 3.7 | |
Pharmaceuticals | | | 3.4 | |
Internet & Direct Marketing Retail | | | 3.2 | |
Oil, Gas & Consumable Fuels | | | 3.1 | |
Hotels, Restaurants & Leisure | | | 2.7 | |
Capital Markets | | | 2.6 | |
Life Sciences Tools & Services | | | 2.5 | |
Health Care Providers & Services | | | 2.5 | |
Machinery | | | 2.2 | |
Automobiles | | | 2.2 | |
Insurance | | | 2.1 | |
Beverages | | | 2.0 | |
Entertainment | | | 1.9 | |
Affiliated Mutual Funds (0.1% represents investments purchased with collateral from securities on loan) | | | 1.9 | |
Specialty Retail | | | 1.9 | |
Equity Real Estate Investment Trusts (REITs) | | | 1.7 | |
Chemicals | | | 1.6 | |
Aerospace & Defense | | | 1.6 | |
Diversified Telecommunication Services | | | 1.5 | |
Industrial Conglomerates | | | 1.4 | |
Consumer Finance | | | 1.3 | |
Electrical Equipment | | | 1.3 | |
Biotechnology | | | 1.2 | |
Food Products | | | 1.2 | |
Media | | | 0.9 | |
Diversified Financial Services | | | 0.9 | |
| | | | |
Food & Staples Retailing | | | 0.8 | % |
Electric Utilities | | | 0.8 | |
Distributors | | | 0.7 | |
Independent Power & Renewable Electricity Producers | | | 0.7 | |
Household Products | | | 0.6 | |
Electronic Equipment, Instruments & Components | | | 0.5 | |
Tobacco | | | 0.5 | |
Communications Equipment | | | 0.5 | |
Energy Equipment & Services | | | 0.5 | |
Leisure Products | | | 0.4 | |
Metals & Mining | | | 0.4 | |
Textiles, Apparel & Luxury Goods | | | 0.4 | |
Building Products | | | 0.4 | |
Road & Rail | | | 0.4 | |
Multiline Retail | | | 0.3 | |
Professional Services | | | 0.3 | |
Multi-Utilities | | | 0.3 | |
Air Freight & Logistics | | | 0.3 | |
Household Durables | | | 0.2 | |
Trading Companies & Distributors | | | 0.2 | |
Commercial Services & Supplies | | | 0.2 | |
Real Estate Management & Development | | | 0.1 | |
U.S. Treasury Obligation | | | 0.1 | |
Construction & Engineering | | | 0.1 | |
Personal Products | | | 0.0 | * |
| | | | |
| | | 100.6 | |
Liabilities in excess of other assets | | | (0.6 | ) |
| | | | |
| |
| | | 100.0 | % |
| | | | |
See Notes to Financial Statements.
Effects of Derivative Instruments on the Financial Statements and Primary Underlying Risk Exposure:
The Fund invested in derivative instruments during the reporting period. The primary type of risk associated with these derivative instruments is equity contracts risk. See the Notes to Financial Statements for additional detail regarding these derivative instruments and their risks. The effect of such derivative instruments on the Fund’s financial position and financial performance as reflected in the Statement of Assets and Liabilities and Statement of Operations is presented in the summary below.
Fair values of derivative instruments as of October 31, 2021 as presented in the Statement of Assets and Liabilities:
| | | | | | | | |
| | | Asset Derivatives | | Liability Derivatives |
Derivatives not accounted for as
hedging instruments, carried at
fair value | | Statement of
Assets and
Liabilities Location | | Fair
Value | | Statement of
Assets and
Liabilities Location | | Fair
Value |
| Equity contracts | | Due from/to broker-variation margin futures | | $575,174* | | — | | $— |
| | | | | | | | |
| * | Includes cumulative appreciation (depreciation) as reported in the schedule of open futures and centrally cleared swap contracts. Only unsettled variation margin receivable (payable) is reported within the Statement of Assets and Liabilities. |
The effects of derivative instruments on the Statement of Operations for the year ended October 31, 2021 are as follows:
| | | | |
Amount of Realized Gain (Loss) on Derivatives Recognized in Income | |
Derivatives not accounted for as hedging
instruments, carried at fair value | | Futures | |
Equity contracts | | $ | 4,367,353 | |
| | | | |
| | | | |
Change in Unrealized Appreciation (Depreciation) on Derivatives Recognized in Income | |
Derivatives not accounted for
as hedging instruments,
carried at fair value | | Futures | |
Equity contracts | | $ | 737,817 | |
| | | | |
See Notes to Financial Statements.
| | | | |
| PGIM QMA Large-Cap Core Equity Fund | | | 27 | |
Schedule of Investments (continued)
as of October 31, 2021
For the year ended October 31, 2021, the Fund’s average volume of derivative activities is as follows:
|
Futures
Contracts—
Long
Positions(1) |
| $13,023,216 |
| (1) | Notional Amount in USD. |
Average volume is based on average quarter end balances as noted for the year ended October 31, 2021.
Financial Instruments/Transactions—Summary of Offsetting and Netting Arrangements:
The Fund entered into financial instruments/transactions during the reporting period that are either offset in accordance with current requirements or are subject to enforceable master netting arrangements or similar agreements that permit offsetting. The information about offsetting and related netting arrangements for financial instruments/transactions where the legal right to set-off exists is presented in the summary below.
Offsetting of financial instrument/transaction assets and liabilities:
| | | | | | |
Description | | Gross Market
Value of
Recognized
Assets/(Liabilities) | | Collateral
Pledged/(Received)(1) | | Net
Amount |
Securities on Loan | | $587,173 | | $(587,173) | | $— |
| | | | | | |
| (1) | Collateral amount disclosed by the Fund is limited to the market value of financial instruments/transactions. |
See Notes to Financial Statements.
Statement of Assets and Liabilities
as of October 31, 2021
| | | | |
Assets | | | | |
| |
Investments at value, including securities on loan of $587,173: | | | | |
Unaffiliated investments (cost $617,019,442) | | $ | 854,767,833 | |
Affiliated investments (cost $16,560,824) | | | 16,560,824 | |
Receivable for investments sold | | | 12,071,763 | |
Receivable for Fund shares sold | | | 964,356 | |
Dividends receivable | | | 632,225 | |
Due from broker—variation margin futures | | | 27,550 | |
Prepaid expenses and other assets | | | 47,315 | |
| | | | |
| |
Total Assets | | | 885,071,866 | |
| | | | |
| |
Liabilities | | | | |
Payable for investments purchased | | | 14,457,718 | |
Payable for Fund shares purchased | | | 3,340,024 | |
Payable to broker for collateral for securities on loan | | | 602,470 | |
Management fee payable | | | 238,513 | |
Distribution fee payable | | | 126,748 | |
Accrued expenses and other liabilities | | | 95,328 | |
Affiliated transfer agent fee payable | | | 60,551 | |
Trustees’ fees payable | | | 1,363 | |
| | | | |
| |
Total Liabilities | | | 18,922,715 | |
| | | | |
| |
Net Assets | | $ | 866,149,151 | |
| | | | |
| |
| | | | | |
| |
Net assets were comprised of: | | | | |
Shares of beneficial interest, at par | | $ | 40,686 | |
Paid-in capital in excess of par | | | 510,863,834 | |
Total distributable earnings (loss) | | | 355,244,631 | |
| | | | |
Net assets, October 31, 2021 | | $ | 866,149,151 | |
| | | | |
See Notes to Financial Statements.
| | | | |
| PGIM QMA Large-Cap Core Equity Fund | | | 29 | |
Statement of Assets and Liabilities
as of October 31, 2021
| | | | |
Class A | | | | |
Net asset value and redemption price per share,
($ 522,600,782 ÷ 24,781,802 shares of beneficial interest issued and outstanding) | | $ | 21.09 | |
Maximum sales charge (5.50% of offering price) | | | 1.23 | |
| | | | |
Maximum offering price to public | | $ | 22.32 | |
| | | | |
| |
Class C | | | | |
Net asset value, offering price and redemption price per share,
($ 22,453,221 ÷ 1,212,590 shares of beneficial interest issued and outstanding) | | $ | 18.52 | |
| | | | |
| |
Class Z | | | | |
Net asset value, offering price and redemption price per share,
($ 25,663,489 ÷ 1,177,582 shares of beneficial interest issued and outstanding) | | $ | 21.79 | |
| | | | |
| |
Class R6 | | | | |
Net asset value, offering price and redemption price per share,
($ 295,431,659 ÷ 13,514,122 shares of beneficial interest issued and outstanding) | | $ | 21.86 | |
| | | | |
See Notes to Financial Statements.
Statement of Operations
Year Ended October 31, 2021
| | | | |
Net Investment Income (Loss) | | | | |
| |
Income | | | | |
Unaffiliated dividend income (net of $1,236 foreign withholding tax) | | $ | 11,791,552 | |
Affiliated dividend income | | | 21,778 | |
Income from securities lending, net (including affiliated income of $1,934) | | | 2,275 | |
Interest income | | | 661 | |
| | | | |
Total income | | | 11,816,266 | |
| | | | |
| |
Expenses | | | | |
Management fee | | | 2,668,036 | |
Distribution fee(a) | | | 1,649,392 | |
Transfer agent’s fees and expenses (including affiliated expense of $318,855)(a) | | | 715,864 | |
Custodian and accounting fees | | | 83,725 | |
Registration fees(a) | | | 56,097 | |
Shareholders’ reports | | | 40,453 | |
Audit fee | | | 26,155 | |
Legal fees and expenses | | | 23,038 | |
Trustees’ fees | | | 18,325 | |
Miscellaneous | | | 29,005 | |
| | | | |
Total expenses | | | 5,310,090 | |
Less: Fee waiver and/or expense reimbursement(a) | | | (312,982 | ) |
Distribution fee waiver(a) | | | (237,661 | ) |
| | | | |
Net expenses | | | 4,759,447 | |
| | | | |
Net investment income (loss) | | | 7,056,819 | |
| | | | |
| |
| Realized And Unrealized Gain (Loss) On Investments | | | |
Net realized gain (loss) on: | | | | |
Investment transactions (including affiliated of $6,381) | | | 108,024,418 | |
Futures transactions | | | 4,367,353 | |
| | | | |
| | | 112,391,771 | |
| | | | |
Net change in unrealized appreciation (depreciation) on: | | | | |
Investments (including affiliated of $(7,761)) | | | 133,242,810 | |
Futures | | | 737,817 | |
| | | | |
| | | 133,980,627 | |
| | | | |
Net gain (loss) on investment transactions | | | 246,372,398 | |
| | | | |
Net Increase (Decrease) In Net Assets Resulting From Operations | | $ | 253,429,217 | |
| | | | |
| (a) | Class specific expenses and waivers were as follows: |
| | | | | | | | | | | | | | | | |
| | | Class A | | | Class C | | | Class Z | | | Class R6 | |
Distribution fee | | | 1,425,967 | | | | 223,425 | | | | — | | | | — | |
Transfer agent’s fees and expenses | | | 594,369 | | | | 35,320 | | | | 84,742 | | | | 1,433 | |
Registration fees | | | 17,971 | | | | 11,739 | | | | 17,774 | | | | 8,613 | |
Fee waiver and/or expense reimbursement | | | (177,780 | ) | | | (33,352 | ) | | | (35,072 | ) | | | (66,778 | ) |
Distribution fee waiver | | | (237,661 | ) | | | — | | | | — | | | | — | |
See Notes to Financial Statements.
| | | | |
| PGIM QMA Large-Cap Core Equity Fund | | | 31 | |
Statements of Changes in Net Assets
| | | | | | | | |
| |
| | | Year Ended
October 31, | |
| | | 2021 | | | 2020 | |
| | |
Increase (Decrease) in Net Assets | | | | | | | | |
| | |
Operations | | | | | | | | |
Net investment income (loss) | | $ | 7,056,819 | | | $ | 7,732,239 | |
Net realized gain (loss) on investment transactions | | | 112,391,771 | | | | 7,851,246 | |
Net change in unrealized appreciation (depreciation) on investments | | | 133,980,627 | | | | 11,587,045 | |
| | | | | | | | |
Net increase (decrease) in net assets resulting from operations | | | 253,429,217 | | | | 27,170,530 | |
| | | | | | | | |
| | |
Dividends and Distributions | | | | | | | | |
Distributions from distributable earnings | | | | | | | | |
Class A | | | (9,498,862 | ) | | | (16,111,961 | ) |
Class B | | | — | | | | (283,506 | ) |
Class C | | | (464,608 | ) | | | (1,067,236 | ) |
Class Z | | | (1,395,424 | ) | | | (2,719,310 | ) |
Class R6 | | | (3,717,913 | ) | | | (3,898,963 | ) |
| | | | | | | | |
| | | (15,076,807 | ) | | | (24,080,976 | ) |
| | | | | | | | |
| | |
Fund share transactions (Net of share conversions) | | | | | | | | |
Net proceeds from shares sold | | | 187,786,089 | | | | 140,184,209 | |
Net asset value of shares issued in reinvestment of dividends and distributions | | | 14,909,423 | | | | 23,767,624 | |
Cost of shares purchased | | | (158,286,541 | ) | | | (177,202,460 | ) |
| | | | | | | | |
Net increase (decrease) in net assets from Fund share transactions | | | 44,408,971 | | | | (13,250,627 | ) |
| | | | | | | | |
Total increase (decrease) | | | 282,761,381 | | | | (10,161,073 | ) |
| | |
Net Assets: | | | | | | | | |
Beginning of year | | | 583,387,770 | | | | 593,548,843 | |
| | | | | | | | |
End of year | | $ | 866,149,151 | | | $ | 583,387,770 | |
| | | | | | | | |
See Notes to Financial Statements.
Financial Highlights
| | | | | | | | | | | | | | | | | | | | |
| Class A Shares | |
| | | | | | Year Ended October 31, | | | | |
| | | 2021 | | | 2020 | | | 2019 | | | 2018 | | | 2017 | |
| Per Share Operating Performance(a): | | | | | | | | | | | | | | | | | | | | |
| Net Asset Value, Beginning of Year | | | $15.17 | | | | $15.17 | | | | $16.76 | | | | $18.37 | | | | $15.49 | |
| Income (loss) from investment operations: | | | | | | | | | | | | | | | | | | | | |
| Net investment income (loss) | | | 0.16 | | | | 0.19 | | | | 0.18 | | | | 0.20 | | | | 0.19 | |
| Net realized and unrealized gain (loss) on investment transactions | | | 6.14 | | | | 0.43 | | | | 1.19 | | | | 0.80 | | | | 3.51 | |
| Total from investment operations | | | 6.30 | | | | 0.62 | | | | 1.37 | | | | 1.00 | | | | 3.70 | |
| Less Dividends and Distributions: | | | | | | | | | | | | | | | | | | | | |
| Dividends from net investment income | | | (0.19 | ) | | | (0.19 | ) | | | (0.22 | ) | | | (0.18 | ) | | | (0.15 | ) |
| Distributions from net realized gains | | | (0.19 | ) | | | (0.43 | ) | | | (2.74 | ) | | | (2.43 | ) | | | (0.67 | ) |
| Total dividends and distributions | | | (0.38 | ) | | | (0.62 | ) | | | (2.96 | ) | | | (2.61 | ) | | | (0.82 | ) |
| Net asset value, end of year | | | $21.09 | | | | $15.17 | | | | $15.17 | | | | $16.76 | | | | $18.37 | |
| Total Return(b): | | | 42.24 | % | | | 4.02 | % | | | 10.61 | % | | | 5.67 | % | | | 24.73 | % |
| | | | | | | | | | | | | | | | | | | | | |
| Ratios/Supplemental Data: | | | | | | | | | | | | | | | |
| Net assets, end of year (000) | | | $522,601 | | | | $382,165 | | | | $400,634 | | | | $105,855 | | | | $113,343 | |
| Average net assets (000) | | | $475,322 | | | | $389,009 | | | | $302,864 | | | | $112,391 | | | | $101,852 | |
| Ratios to average net assets(c)(d): | | | | | | | | | | | | | | | | | | | | |
| Expenses after waivers and/or expense reimbursement | | | 0.72 | % | | | 0.72 | % | | | 0.74 | % | | | 0.72 | % | | | 0.77 | % |
| Expenses before waivers and/or expense reimbursement | | | 0.81 | % | | | 0.83 | % | | | 0.87 | % | | | 0.86 | % | | | 0.93 | % |
| Net investment income (loss) | | | 0.84 | % | | | 1.26 | % | | | 1.27 | % | | | 1.14 | % | | | 1.13 | % |
| Portfolio turnover rate(e)(f) | | | 101 | % | | | 92 | % | | | 88 | % | | | 95 | % | | | 89 | % |
| (a) | Calculated based on average shares outstanding during the year. |
| (b) | Total return does not consider the effects of sales loads. Total return is calculated assuming a purchase of a share on the first day and a sale on the last day of each year reported and includes reinvestment of dividends and distributions, if any. Total returns may reflect adjustments to conform to GAAP. |
| (c) | Does not include expenses of the underlying funds in which the Fund invests. |
| (d) | Effective November 1, 2017, class specific expenses include transfer agent fees and expenses and registration fees, which are charged to their respective share class. |
| (e) | The Fund’s portfolio turnover rate is calculated in accordance with regulatory requirements, without regard to transactions involving short-term investments and certain derivatives. If such transactions were included, the Fund’s portfolio turnover rate may be higher. |
| (f) | Portfolio turnover excludes the value of portfolio securities received or delivered as a result of in-kind fund share transactions (if any). |
See Notes to Financial Statements.
| | | | |
| PGIM QMA Large-Cap Core Equity Fund | | | 33 | |
Financial Highlights (continued)
| | | | | | | | | | | | | | | | | | | | |
| Class C Shares | |
| | | | | | Year Ended October 31, | | | | |
| | | 2021 | | | 2020 | | | 2019 | | | 2018 | | | 2017 | |
| Per Share Operating Performance(a): | | | | | | | | | | | | | | | | | | | | |
| Net Asset Value, Beginning of Year | | | $13.38 | | | | $13.46 | | | | $15.20 | | | | $16.89 | | | | $14.31 | |
| Income (loss) from investment operations: | | | | | | | | | | | | | | | | | | | | |
| Net investment income (loss) | | | 0.02 | | | | 0.07 | | | | 0.08 | | | | 0.07 | | | | 0.06 | |
| Net realized and unrealized gain (loss) on investment transactions | | | 5.42 | | | | 0.38 | | | | 1.03 | | | | 0.73 | | | | 3.24 | |
| Total from investment operations | | | 5.44 | | | | 0.45 | | | | 1.11 | | | | 0.80 | | | | 3.30 | |
| Less Dividends and Distributions: | | | | | | | | | | | | | | | | | | | | |
| Dividends from net investment income | | | (0.11 | ) | | | (0.10 | ) | | | (0.11 | ) | | | (0.06 | ) | | | (0.05 | ) |
| Distributions from net realized gains | | | (0.19 | ) | | | (0.43 | ) | | | (2.74 | ) | | | (2.43 | ) | | | (0.67 | ) |
| Total dividends and distributions | | | (0.30 | ) | | | (0.53 | ) | | | (2.85 | ) | | | (2.49 | ) | | | (0.72 | ) |
| Net asset value, end of year | | | $18.52 | | | | $13.38 | | | | $13.46 | | | | $15.20 | | | | $16.89 | |
| Total Return(b): | | | 41.25 | % | | | 3.27 | % | | | 9.77 | % | | | 4.91 | % | | | 23.80 | % |
| | | | | | | | | | | | | | | | | | | | | |
| Ratios/Supplemental Data: | | | | | | | | | | | | | | | |
| Net assets, end of year (000) | | | $22,453 | | | | $21,047 | | | | $27,333 | | | | $29,930 | | | | $31,518 | |
| Average net assets (000) | | | $22,342 | | | | $24,287 | | | | $36,812 | | | | $31,783 | | | | $34,697 | |
| Ratios to average net assets(c)(d): | | | | | | | | | | | | | | | | | | | | |
| Expenses after waivers and/or expense reimbursement | | | 1.44 | % | | | 1.44 | % | | | 1.47 | % | | | 1.44 | % | | | 1.53 | % |
| Expenses before waivers and/or expense reimbursement | | | 1.59 | % | | | 1.59 | % | | | 1.54 | % | | | 1.55 | % | | | 1.64 | % |
| Net investment income (loss) | | | 0.14 | % | | | 0.56 | % | | | 0.59 | % | | | 0.43 | % | | | 0.40 | % |
| Portfolio turnover rate(e)(f) | | | 101 | % | | | 92 | % | | | 88 | % | | | 95 | % | | | 89 | % |
| (a) | Calculated based on average shares outstanding during the year. |
| (b) | Total return does not consider the effects of sales loads. Total return is calculated assuming a purchase of a share on the first day and a sale on the last day of each year reported and includes reinvestment of dividends and distributions, if any. Total returns may reflect adjustments to conform to GAAP. |
| (c) | Does not include expenses of the underlying funds in which the Fund invests. |
| (d) | Effective November 1, 2017, class specific expenses include transfer agent fees and expenses and registration fees, which are charged to their respective share class. |
| (e) | The Fund’s portfolio turnover rate is calculated in accordance with regulatory requirements, without regard to transactions involving short-term investments and certain derivatives. If such transactions were included, the Fund’s portfolio turnover rate may be higher. |
| (f) | Portfolio turnover excludes the value of portfolio securities received or delivered as a result of in-kind fund share transactions (if any). |
See Notes to Financial Statements.
| | | | | | | | | | | | | | | | | | | | |
| Class Z Shares | | | | | | | | | | | | | | | |
| | | Year Ended October 31, | |
| | | 2021 | | | 2020 | | | 2019 | | | 2018 | | | 2017 | |
| Per Share Operating Performance(a): | | | | | | | | | | | | | | | | | | | | |
| Net Asset Value, Beginning of Year | | | $15.67 | | | | $15.65 | | | | $17.20 | | | | $18.78 | | | | $15.83 | |
| Income (loss) from investment operations: | | | | | | | | | | | | | | | | | | | | |
| Net investment income (loss) | | | 0.21 | | | | 0.23 | | | | 0.24 | | | | 0.25 | | | | 0.24 | |
| Net realized and unrealized gain (loss) on investment transactions | | | 6.32 | | | | 0.44 | | | | 1.21 | | | | 0.82 | | | | 3.57 | |
| Total from investment operations | | | 6.53 | | | | 0.67 | | | | 1.45 | | | | 1.07 | | | | 3.81 | |
| Less Dividends and Distributions: | | | | | | | | | | | | | | | | | | | | |
| Dividends from net investment income | | | (0.22 | ) | | | (0.22 | ) | | | (0.26 | ) | | | (0.22 | ) | | | (0.19 | ) |
| Distributions from net realized gains | | | (0.19 | ) | | | (0.43 | ) | | | (2.74 | ) | | | (2.43 | ) | | | (0.67 | ) |
| Total dividends and distributions | | | (0.41 | ) | | | (0.65 | ) | | | (3.00 | ) | | | (2.65 | ) | | | (0.86 | ) |
| Net asset value, end of year | | | $21.79 | | | | $15.67 | | | | $15.65 | | | | $17.20 | | | | $18.78 | |
| Total Return(b): | | | 42.44 | % | | | 4.27 | % | | | 10.91 | % | | | 5.98 | % | | | 24.93 | % |
| | | | | | | | | | | | | | | | | | | | | |
| Ratios/Supplemental Data: | | | | | | | | | | | | | | | |
| Net assets, end of year (000) | | | $25,663 | | | | $47,730 | | | | $67,192 | | | | $61,857 | | | | $56,066 | |
| Average net assets (000) | | | $60,616 | | | | $64,099 | | | | $65,923 | | | | $62,456 | | | | $54,787 | |
| Ratios to average net assets(c)(d): | | | | | | | | | | | | | | | | | | | | |
| Expenses after waivers and/or expense reimbursement | | | 0.49 | % | | | 0.48 | % | | | 0.48 | % | | | 0.46 | % | | | 0.54 | % |
| Expenses before waivers and/or expense reimbursement | | | 0.55 | % | | | 0.55 | % | | | 0.54 | % | | | 0.55 | % | | | 0.64 | % |
| Net investment income (loss) | | | 1.10 | % | | | 1.54 | % | | | 1.59 | % | | | 1.40 | % | | | 1.42 | % |
| Portfolio turnover rate(e)(f) | | | 101 | % | | | 92 | % | | | 88 | % | | | 95 | % | | | 89 | % |
| (a) | Calculated based on average shares outstanding during the year. |
| (b) | Total return is calculated assuming a purchase of a share on the first day and a sale on the last day of each year reported and includes reinvestment of dividends and distributions, if any. Total returns may reflect adjustments to conform to GAAP. |
| (c) | Does not include expenses of the underlying funds in which the Fund invests. |
| (d) | Effective November 1, 2017, class specific expenses include transfer agent fees and expenses and registration fees, which are charged to their respective share class. |
| (e) | The Fund’s portfolio turnover rate is calculated in accordance with regulatory requirements, without regard to transactions involving short-term investments and certain derivatives. If such transactions were included, the Fund’s portfolio turnover rate may be higher. |
| (f) | Portfolio turnover excludes the value of portfolio securities received or delivered as a result of in-kind fund share transactions (if any). |
See Notes to Financial Statements.
| | | | |
| PGIM QMA Large-Cap Core Equity Fund | | | 35 | |
Financial Highlights (continued)
| | | | | | | | | | | | | | | | | | | | | | | | |
| Class R6 Shares | | | | | | | | | | | | | | | | | | |
| | | Year Ended October 31, | | | | | | December 28, 2016(a)
through October 31, 2017 | |
| | | 2021 | | | 2020 | | | 2019 | | | 2018 | |
| Per Share Operating Performance(b): | | | | | | | | | | | | | | | | | | | | | | | | |
| Net Asset Value, Beginning of Period | | | $15.70 | | | | $15.68 | | | | $17.23 | | | | $18.81 | | | | | | | | $16.06 | |
| Income (loss) from investment operations: | | | | | | | | | | | | | | | | | | | | | | | | |
| Net investment income (loss) | | | 0.23 | | | | 0.25 | | | | 0.26 | | | | 0.27 | | | | | | | | 0.21 | |
| Net realized and unrealized gain (loss) on investment transactions | | | 6.36 | | | | 0.44 | | | | 1.21 | | | | 0.82 | | | | | | | | 2.54 | |
| Total from investment operations | | | 6.59 | | | | 0.69 | | | | 1.47 | | | | 1.09 | | | | | | | | 2.75 | |
| Less Dividends and Distributions: | | | | | | | | | | | | | | | | | | | | | | | | |
| Dividends from net investment income | | | (0.24 | ) | | | (0.24 | ) | | | (0.28 | ) | | | (0.24 | ) | | | | | | | - | |
| Distributions from net realized gains | | | (0.19 | ) | | | (0.43 | ) | | | (2.74 | ) | | | (2.43 | ) | | | | | | | - | |
| Total dividends and distributions | | | (0.43 | ) | | | (0.67 | ) | | | (3.02 | ) | | | (2.67 | ) | | | | | | | - | |
| Net asset value, end of period | | | $21.86 | | | | $15.70 | | | | $15.68 | | | | $17.23 | | | | | | | | $18.81 | |
| Total Return(c): | | | 42.79 | % | | | 4.39 | % | | | 11.05 | % | | | 6.10 | % | | | | | | | 17.12 | % |
| | | | | | | | | | | | | | | | | | | | | | | | | |
| Ratios/Supplemental Data: | | | | | | | | | | | | | | | | | | |
| Net assets, end of period (000) | | | $295,432 | | | | $132,446 | | | | $90,722 | | | | $76,551 | | | | | | | | $58,304 | |
| Average net assets (000) | | | $204,016 | | | | $105,498 | | | | $86,249 | | | | $71,390 | | | | | | | | $40,448 | |
| Ratios to average net assets(d)(e): | | | | | | | | | | | | | | | | | | | | | | | | |
| Expenses after waivers and/or expense reimbursement | | | 0.35 | % | | | 0.35 | % | | | 0.35 | % | | | 0.35 | % | | | | | | | 0.35 | %(f) |
| Expenses before waivers and/or expense reimbursement | | | 0.38 | % | | | 0.40 | % | | | 0.41 | % | | | 0.44 | % | | | | | | | 0.47 | %(f) |
| Net investment income (loss) | | | 1.17 | % | | | 1.60 | % | | | 1.72 | % | | | 1.51 | % | | | | | | | 1.44 | %(f) |
| Portfolio turnover rate(g)(h) | | | 101 | % | | | 92 | % | | | 88 | % | | | 95 | % | | | | | | | 89 | % |
| (a) | Commencement of offering. |
| (b) | Calculated based on average shares outstanding during the period. |
| (c) | Total return is calculated assuming a purchase of a share on the first day and a sale on the last day of each period reported and includes reinvestment of dividends and distributions, if any. Total returns may reflect adjustments to conform to GAAP. Total returns for periods less than one full year are not annualized. |
| (d) | Does not include expenses of the underlying funds in which the Fund invests. |
| (e) | Effective November 1, 2017, class specific expenses include transfer agent fees and expenses and registration fees, which are charged to their respective share class. |
| (g) | The Fund’s portfolio turnover rate is calculated in accordance with regulatory requirements, without regard to transactions involving short-term investments and certain derivatives. If such transactions were included, the Fund’s portfolio turnover rate may be higher. |
| (h) | Portfolio turnover excludes the value of portfolio securities received or delivered as a result of in-kind fund share transactions (if any). |
See Notes to Financial Statements.
Notes to Financial Statements
1. Organization
Prudential Investment Portfolios 9 (the “Registered Investment Company” or “RIC”) is registered under the Investment Company Act of 1940, as amended (“1940 Act”), as an open-end management investment company. The RIC is organized as a Delaware Statutory Trust and currently consists of five separate funds: PGIM Absolute Return Bond Fund, PGIM International Bond Fund, PGIM QMA Large-Cap Core Equity Fund, PGIM Real Estate Income Fund and PGIM Select Real Estate Fund. These financial statements relate only to the PGIM QMA Large-Cap Core Equity Fund (the “Fund”). The Fund is classified as a diversified fund for purposes of the 1940 Act.
The investment objective of the Fund is to seek long-term growth of capital.
2. Accounting Policies
The Fund follows the investment company accounting and reporting guidance of the Financial Accounting Standards Board (“FASB”) Accounting Standard Codification (“ASC”) Topic 946 Financial Services — Investment Companies. The following is a summary of significant accounting policies followed by the Fund in the preparation of its financial statements. The policies conform to U.S. generally accepted accounting principles (“GAAP”). The Fund consistently follows such policies in the preparation of its financial statements.
Securities Valuation: The Fund holds securities and other assets and liabilities that are fair valued as of the close of each day (generally, 4:00 PM Eastern time) the New York Stock Exchange (“NYSE”) is open for trading. As described in further detail below, the Fund’s investments are valued daily based on a number of factors, including the type of investment and whether market quotations are readily available. The RIC’s Board of Trustees (the “Board”) has adopted valuation procedures for security valuation under which fair valuation responsibilities have been delegated to PGIM Investments LLC (“PGIM Investments” or the “Manager”). Pursuant to the Board’s delegation, the Manager has established a Valuation Committee responsible for supervising the fair valuation of portfolio securities and other assets and liabilities. The valuation procedures permit the Fund to utilize independent pricing vendor services, quotations from market makers, and alternative valuation methods when market quotations are either not readily available or not deemed representative of fair value. Fair value is the price that would be received to sell an asset or paid to transfer a liability in an orderly transaction between market participants on the measurement date. A record of the Valuation Committee’s actions is subject to the Board’s review at its first quarterly meeting following the quarter in which such actions take place.
For the fiscal reporting year-end, securities and other assets and liabilities were fair valued at the close of the last U.S. business day. Trading in certain foreign securities may occur when
| | | | |
| PGIM QMA Large-Cap Core Equity Fund | | | 37 | |
Notes to Financial Statements (continued)
the NYSE is closed (including weekends and holidays). Because such foreign securities trade in markets that are open on weekends and U.S. holidays, the values of some of the Fund’s foreign investments may change on days when investors cannot purchase or redeem Fund shares.
Various inputs determine how the Fund’s investments are valued, all of which are categorized according to the three broad levels (Level 1, 2, or 3) detailed in the Schedule of Investments and referred to herein as the “fair value hierarchy” in accordance with FASB ASC Topic 820 - Fair Value Measurements and Disclosures.
Common or preferred stocks, exchange-traded funds and derivative instruments, if applicable, that are traded on a national securities exchange are valued at the last sale price as of the close of trading on the applicable exchange where the security principally trades. Securities traded via NASDAQ are valued at the NASDAQ official closing price. To the extent these securities are valued at the last sale price or NASDAQ official closing price, they are classified as Level 1 in the fair value hierarchy. In the event that no sale or official closing price on valuation date exists, these securities are generally valued at the mean between the last reported bid and ask prices, or at the last bid price in the absence of an ask price. These securities are classified as Level 2 in the fair value hierarchy.
Foreign equities traded on foreign securities exchanges are generally valued using pricing vendor services that provide model prices derived using adjustment factors based on information such as local closing price, relevant general and sector indices, currency fluctuations, depositary receipts, and futures, as applicable. Securities valued using such model prices are classified as Level 2 in the fair value hierarchy. The models generate an evaluated adjustment factor for each security, which is applied to the local closing price to adjust it for post closing market movements up to the time the Fund is valued. Utilizing that evaluated adjustment factor, the vendor provides an evaluated price for each security. If the vendor does not provide an evaluated price, securities are valued in accordance with exchange-traded common and preferred stock valuation policies discussed above.
Investments in open-end funds (other than exchange-traded funds) are valued at their net asset values as of the close of the NYSE on the date of valuation. These securities are classified as Level 1 in the fair value hierarchy since they may be purchased or sold at their net asset values on the date of valuation.
Securities and other assets that cannot be priced according to the methods described above are valued based on pricing methodologies approved by the Board. In the event that unobservable inputs are used when determining such valuations, the securities will be classified as Level 3 in the fair value hierarchy. Altering one or more unobservable inputs may result in a significant change to a Level 3 security’s fair value measurement.
When determining the fair value of securities, some of the factors influencing the valuation include: the nature of any restrictions on disposition of the securities; assessment of the general liquidity of the securities; the issuer’s financial condition and the markets in which it does business; the cost of the investment; the size of the holding and the capitalization of the issuer; the prices of any recent transactions or bids/offers for such securities or any comparable securities; any available analyst media or other reports or information deemed reliable by the Manager regarding the issuer or the markets or industry in which it operates. Using fair value to price securities may result in a value that is different from a security’s most recent closing price and from the price used by other unaffiliated mutual funds to calculate their net asset values.
Financial Futures Contracts: A financial futures contract is an agreement to purchase (long) or sell (short) an agreed amount of securities at a set price for delivery on a future date. Upon entering into a financial futures contract, the Fund is required to pledge to the broker an amount of cash and/or other assets equal to a certain percentage of the contract amount. This amount is known as the “initial margin.” Subsequent payments, known as “variation margin,” are made or received by the Fund each day, depending on the daily fluctuations in the value of the underlying security. Such variation margin is recorded for financial statement purposes on a daily basis as unrealized gain (loss). When the contract expires or is closed, the gain (loss) is realized and is presented in the Statement of Operations as net realized gain (loss) on futures transactions.
The Fund invested in financial futures contracts in order to hedge its existing portfolio securities, or securities the Fund intends to purchase, against fluctuations in value caused by changes in prevailing interest rates. Should interest rates move unexpectedly, the Fund may not achieve the anticipated benefits of the financial futures contracts and may realize a loss. The use of futures transactions involves the risk of imperfect correlation in movements in the price of futures contracts and the underlying hedged assets. Since futures contracts are exchange-traded, there is minimal counterparty credit risk to the Fund since the exchanges’ clearinghouse acts as counterparty to all exchange-traded futures and guarantees the futures contracts against default.
Master Netting Arrangements: The RIC, on behalf of the Fund, is subject to various Master Agreements, or netting arrangements, with select counterparties. These are agreements which a subadviser may have negotiated and entered into on behalf of all or a portion of the Fund. A master netting arrangement between the Fund and the counterparty permits the Fund to offset amounts payable by the Fund to the same counterparty against amounts to be received; and by the receipt of collateral from the counterparty by the Fund to cover the Fund’s exposure to the counterparty. However, there is no assurance that such mitigating factors are easily enforceable. In addition to master netting arrangements, the right to set-off exists when all the conditions are met such that each of the parties owes the other determinable amounts, the reporting party has the right to set-off the amount owed with the amount owed by the other party, the reporting party intends to set-off and the right of set-off is enforceable by law.
| | | | |
| PGIM QMA Large-Cap Core Equity Fund | | | 39 | |
Notes to Financial Statements (continued)
Securities Lending: The Fund lends its portfolio securities to banks and broker-dealers. The loans are secured by collateral at least equal to the market value of the securities loaned. Collateral pledged by each borrower is invested in an affiliated money market fund and is marked to market daily, based on the previous day’s market value, such that the value of the collateral exceeds the value of the loaned securities. In the event of significant appreciation in value of securities on loan on the last business day of the reporting period, the financial statements may reflect a collateral value that is less than the market value of the loaned securities. Such shortfall is remedied as described above. Loans are subject to termination at the option of the borrower or the Fund. Upon termination of the loan, the borrower will return to the Fund securities identical to the loaned securities. The remaining maturities of the securities lending transactions are considered overnight and continuous. Should the borrower of the securities fail financially, the Fund has the right to repurchase the securities in the open market using the collateral.
The Fund recognizes income, net of any rebate and securities lending agent fees, for lending its securities in the form of fees or interest on the investment of any cash received as collateral. The borrower receives all interest and dividends from the securities loaned and such payments are passed back to the lender in amounts equivalent thereto, which are reflected in interest income or unaffiliated dividend income based on the nature of the payment on the Statement of Operations. The Fund also continues to recognize any unrealized gain (loss) in the market price of the securities loaned and on the change in the value of the collateral invested that may occur during the term of the loan. In addition, realized gain (loss) is recognized on changes in the value of the collateral invested upon liquidation of the collateral. Net earnings from securities lending are disclosed in the Statement of Operations.
Equity and Mortgage Real Estate Investment Trusts (collectively REITs): The Fund invested in REITs, which report information on the source of their distributions annually. Based on current and historical information, a portion of distributions received from REITs during the period is estimated to be dividend income, capital gain or return of capital and recorded accordingly. When material, these estimates are adjusted periodically when the actual source of distributions is disclosed by the REITs.
Securities Transactions and Net Investment Income: Securities transactions are recorded on the trade date. Realized gains (losses) from investment and currency transactions are calculated on the specific identification method. Dividend income is recorded on the ex-date, or for certain foreign securities, when the Fund becomes aware of such dividends. Expenses are recorded on an accrual basis, which may require the use of certain estimates by management that may differ from actual. Net investment income or loss (other than class specific expenses and waivers, which are allocated as noted below) and unrealized and realized gains (losses) are allocated daily to each class of shares based upon the relative
proportion of adjusted net assets of each class at the beginning of the day. Class specific expenses and waivers, where applicable, are charged to the respective share classes. Such class specific expenses and waivers include distribution fees and distribution fee waivers, shareholder servicing fees, transfer agent’s fees and expenses, registration fees and fee waivers and/or expense reimbursements, as applicable.
Taxes: It is the Fund’s policy to continue to meet the requirements of the Internal Revenue Code applicable to regulated investment companies and to distribute all of its taxable net investment income and capital gains, if any, to its shareholders. Therefore, no federal income tax provision is required. Withholding taxes on foreign dividends, interest and capital gains, if any, are recorded, net of reclaimable amounts, at the time the related income is earned.
Dividends and Distributions: The Fund expects to pay dividends from net investment income and distributions from net realized capital gains, if any, annually. Dividends and distributions to shareholders, which are determined in accordance with federal income tax regulations and which may differ from GAAP, are recorded on the ex-date. Permanent book/tax differences relating to income and gain (loss) are reclassified between total distributable earnings (loss) and paid-in capital in excess of par, as appropriate.
Estimates: The preparation of financial statements requires management to make estimates and assumptions that affect the reported amounts and disclosures in the financial statements. Actual results could differ from those estimates.
3. Agreements
The RIC, on behalf of the Fund, has a management agreement with the Manager. Pursuant to this agreement, the Manager has responsibility for all investment advisory services and supervises the subadviser’s performance of such services.
The Manager has entered into a subadvisory agreement with PGIM Quantitative Solutions LLC (formerly known as QMA LLC) (“PGIM Quantitative Solutions” or the “subadviser”). The Manager pays for the services of PGIM Quantitative Solutions.
The management fee paid to the Manager is accrued daily and payable monthly at an annual rate of 0.35% of the Fund’s average daily net assets up to and including $5 billion and 0.34% of the Fund’s average daily net assets in excess of $5 billion. The effective management fee rate before any waivers and/or expense reimbursements was 0.35% for the year ended October 31, 2021.
The Manager has contractually agreed through February 28, 2023, to limit net annual Fund operating expenses, exclusive of distribution and service (12b-1) fees, shareholder servicing fee and transfer agency expenses (including sub-transfer agency and networking fees), of each class of shares to 0.35% of the Fund’s average daily net assets. Separately, the Manager has contractually agreed, through February 28, 2023, to limit total annual
| | | | |
| PGIM QMA Large-Cap Core Equity Fund | | | 41 | |
Notes to Financial Statements (continued)
operating expenses after fee waivers and/or expense reimbursements to 0.72% of average daily net assets for Class A shares and 1.44% of average daily net assets for Class C shares. This contractual waiver exclude interest, brokerage, taxes (such as income and foreign withholding taxes, stamp duty and deferred tax expenses), acquired fund fees and expenses, extraordinary expenses, and certain other Fund expenses such as dividend and interest expense and broker charges on short sales.
Where applicable, the Manager agrees to waive management fees or shared operating expenses on any share class to the same extent that it waives such expenses on any other share class. In addition, total annual operating expenses for Class R6 shares will not exceed total annual operating expenses for Class Z shares. Fees and/or expenses waived and/or reimbursed by the Manager may be recouped by the Manager within the same fiscal year during which such waiver and/or reimbursement is made if such recoupment can be realized without exceeding the expense limit in effect at the time of the recoupment for that fiscal year.
The RIC, on behalf of the Fund, has a distribution agreement with Prudential Investment Management Services LLC (“PIMS”), which acts as the distributor of the Class A, Class C, Class Z and Class R6 shares of the Fund. The Fund compensates PIMS for distributing and servicing the Fund’s Class A and Class C shares, pursuant to the plans of distribution (the “Distribution Plans”), regardless of expenses actually incurred by PIMS.
Pursuant to the Distribution Plans, the Fund compensates PIMS for distribution related activities at an annual rate of up to 0.30% and 1% of the average daily net assets of the Class A and Class C shares, respectively. PIMS has contractually agreed through February 28, 2023 to limit such fees to 0.25% of the average daily net assets of the Class A shares.The distribution fees are accrued daily and payable monthly. No distribution or service fees are paid to PIMS as distributor of the Class Z and Class R6 shares of the Fund.
For the year ended October 31, 2021, PIMS received $243,105 in front-end sales charges resulting from sales of Class A shares. Additionally, for the year ended October 31, 2021, PIMS received $1,000 and $752 in contingent deferred sales charges imposed upon redemptions by certain Class A and Class C shareholders, respectively. From these fees, PIMS paid such sales charges to broker-dealers, who in turn paid commissions to salespersons and incurred other distribution costs.
PGIM Investments, PIMS and PGIM Quantitative Solutions are indirect, wholly-owned subsidiaries of Prudential Financial, Inc. (“Prudential”).
4. Other Transactions with Affiliates
Prudential Mutual Fund Services LLC (“PMFS”), an affiliate of PGIM Investments and an indirect, wholly-owned subsidiary of Prudential, serves as the Fund’s transfer agent. Transfer agent’s fees and expenses in the Statement of Operations include certain out-of-pocket expenses paid to non-affiliates, where applicable.
The Fund may invest its overnight sweep cash in the PGIM Core Ultra Short Bond Fund (the “Core Fund”), and its securities lending cash collateral in the PGIM Institutional Money Market Fund (the “Money Market Fund”), each a fund of Prudential Investment Portfolios 2, registered under the 1940 Act and managed by PGIM Investments. PGIM Investments and/or its affiliates are paid fees or reimbursed for providing their services to the Core Fund and the Money Market Fund. In addition to the realized and unrealized gains on investments in the Core Fund and Money Market Fund, earnings from such investments are disclosed on the Statement of Operations as “Affiliated dividend income” and “Affiliated income from securities lending, net”, respectively.
The Fund may enter into certain securities purchase or sale transactions under Board approved Rule 17a-7 procedures. Rule 17a-7 is an exemptive rule under the 1940 Act, that subject to certain conditions, permits purchase and sale transactions among affiliated investment companies, or between an investment company and a person that is affiliated solely by reason of having a common (or affiliated) investment adviser, common directors/trustees, and/or common officers. For the year ended October 31, 2021, no 17a-7 transactions were entered into by the Fund.
5. Portfolio Securities
The aggregate cost of purchases and proceeds from sales of portfolio securities (excluding short-term investments and U.S. Government securities) for the year ended October 31, 2021, were $786,002,652 and $744,972,455, respectively.
A summary of the cost of purchases and proceeds from sales of shares of affiliated mutual funds for the year ended October 31, 2021, is presented as follows:
| | | | | | | | | | | | | | | | | | | | | | | | | | | | | | |
Value,
Beginning
of Year | | | Cost of
Purchases | | | Proceeds
from Sales | | | Change in
Unrealized
Gain
(Loss) | | | Realized
Gain
(Loss) | | | Value,
End of Year | | | Shares,
End
of Year | | | Income | |
|
| | Short-Term Investments - Affiliated Mutual Funds: | |
| | | | |
| | PGIM Core Ultra Short Bond Fund (1)(wa) | | | | | | | | | | | | | | | | | |
| $ | 8,552,288 | | | $ | 116,371,800 | | | $ | 108,966,205 | | | $ | — | | | $ | — | | | $ | 15,957,883 | | | | 15,957,883 | | | $ | 21,778 | |
| | | | |
| | PGIM Institutional Money Market Fund (1)(b)(wa) | | | | | | | | | | | | | | | | | |
| | 13,754,517 | | | | 85,176,568 | | | | 98,326,764 | | | | (7,761 | ) | | | 6,381 | | | | 602,941 | | | | 603,303 | | | | 1,934 | (2) |
| | | | | | | | | | | | | | | | | | | | | | | | | | | | | | |
| $ | 22,306,805 | | | $ | 201,548,368 | | | $ | 207,292,969 | | | | $(7,761) | | | $ | 6,381 | | | $ | 16,560,824 | | | | | | | $ | 23,712 | |
| | | | | | | | | | | | | | | | | | | | | | | | | | | | | | |
| (1) | The Fund did not have any capital gain distributions during the reporting period. |
| | | | | | |
| PGIM QMA Large-Cap Core Equity Fund | | | 43 | |
Notes to Financial Statements (continued)
| (2) | The amount, or a portion thereof, represents the affiliated securities lending income shown on the Statement of Operations. |
| (b) | Represents security, or portion thereof, purchased with cash collateral received for securities on loan and includes dividend reinvestment. |
| (wa) | PGIM Investments LLC, the manager of the Fund, also serves as manager of the PGIM Core Ultra Short Bond Fund and PGIM Institutional Money Market Fund, if applicable. |
6. Distributions and Tax Information
Distributions to shareholders, which are determined in accordance with federal income tax regulations and which may differ from GAAP, are recorded on the ex-date.
For the year ended October 31, 2021, the tax character of dividends paid by the Fund were $7,619,643 of ordinary income and $7,457,164 of long-term capital gains. For the year ended October 31, 2020, the tax character of dividends paid by the Fund were $7,298,211 of ordinary income $16,782,765 of long-term capital gains.
As of October 31, 2021, the accumulated undistributed earnings on a tax basis were $71,131,694 of ordinary income and $47,471,197 of long-term capital gains.
The United States federal income tax basis of the Fund’s investments and the net unrealized appreciation as of October 31, 2021 were as follows:
| | | | | | |
| Tax Basis | | Gross
Unrealized
Appreciation | | Gross
Unrealized
Depreciation | | Net
Unrealized
Appreciation |
$635,262,091 | | $247,420,548 | | $(10,778,808) | | $236,641,740 |
The difference between GAAP and tax basis were primarily attributable to deferred losses on wash sales and other cost basis differences between GAAP and tax accounting.
The Manager has analyzed the Fund’s tax positions taken on federal, state and local income tax returns for all open tax years and has concluded that no provision for income tax is required in the Fund’s financial statements for the current reporting period. Since tax authorities can examine previously filed tax returns, the Fund’s U.S. federal and state tax returns for each of the four fiscal years up to the most recent fiscal year ended October 31, 2021 are subject to such review.
7. Capital and Ownership
The Fund offers Class A, Class C, Class Z and Class R6 shares. Class A shares are sold with a maximum front-end sales charge of 5.50%. Investors who purchase $1 million or more of Class A shares and sell these shares within 12 months of purchase are subject to a contingent deferred sales charge (“CDSC”) of 1%, although they are not subject to an initial
sales charge. The Class A CDSC is waived for certain retirement and/or benefit plans. A special exchange privilege is also available for shareholders who qualified to purchase Class A shares at net asset value. Class C shares are sold with a CDSC of 1% on sales made within 12 months of purchase. Class C shares will automatically convert to Class A shares on a monthly basis approximately eight years (ten years prior to January 22, 2021) after purchase. Class Z and Class R6 shares are not subject to any sales or redemption charges and are available exclusively for sale to a limited group of investors.
Under certain circumstances, an exchange may be made from specified share classes of the Fund to one or more other share classes of the Fund as presented in the table of transactions in shares of beneficial interest, below.
The RIC has authorized an unlimited number of shares of beneficial interest of the Fund at $0.001 par value per share, currently divided into four classes, designated Class A, Class C, Class Z and Class R6.
As of October 31, 2021, Prudential, through its affiliated entities, including affiliated funds (if applicable), owned shares of the Fund as follows:
| | | | |
| | | Number of Shares | | Percentage of Outstanding Shares |
Class A | | 2,620 | | 0.1% |
Class C | | 3 | | 0.1% |
Class R6 | | 8,747,216 | | 64.7% |
At the reporting period end, the number of shareholders holding greater than 5% of the Fund are as follows:
| | | | | | |
| Affiliated | | Unaffiliated |
Number of
Shareholders | | Percentage of
Outstanding Shares | | Number of
Shareholders | | Percentage of
Outstanding Shares |
| 1 | | 5.8% | | 2 | | 33.8% |
| | | | | | |
| PGIM QMA Large-Cap Core Equity Fund | | | 45 | |
Notes to Financial Statements (continued)
Transactions in shares of beneficial interest were as follows:
| | | | | | | | |
Class A | | Shares | | | Amount | |
Year ended October 31, 2021: | | | | | | | | |
Shares sold | | | 2,091,107 | | | $ | 38,400,935 | |
Shares issued in reinvestment of dividends and distributions | �� | | 566,431 | | | | 9,351,778 | |
Shares purchased | | | (3,160,671 | ) | | | (58,723,676 | ) |
| | | | | | | | |
Net increase (decrease) in shares outstanding before conversion | | | (503,133 | ) | | | (10,970,963 | ) |
Shares issued upon conversion from other share class(es) | | | 242,510 | | | | 4,439,967 | |
Shares purchased upon conversion into other share class(es) | | | (151,501 | ) | | | (2,826,352 | ) |
| | | | | | | | |
Net increase (decrease) in shares outstanding | | | (412,124 | ) | | $ | (9,357,348 | ) |
| | | | | | | | |
Year ended October 31, 2020: | | | | | | | | |
Shares sold | | | 1,056,005 | | | $ | 15,252,702 | |
Shares issued in reinvestment of dividends and distributions | | | 1,034,820 | | | | 15,853,443 | |
Shares purchased | | | (3,820,412 | ) | | | (56,302,552 | ) |
| | | | | | | | |
Net increase (decrease) in shares outstanding before conversion | | | (1,729,587 | ) | | | (25,196,407 | ) |
Shares issued upon conversion from other share class(es) | | | 614,387 | | | | 8,880,281 | |
Shares purchased upon conversion into other share class(es) | | | (106,717 | ) | | | (1,594,324 | ) |
| | | | | | | | |
Net increase (decrease) in shares outstanding | | | (1,221,917 | ) | | $ | (17,910,450 | ) |
| | | | | | | | |
Class B | | | | | | |
Period ended June 26, 2020*: | | | | | | | | |
Shares sold | | | 39 | | | $ | 733 | |
Shares issued in reinvestment of dividends and distributions | | | 20,811 | | | | 282,819 | |
Shares purchased | | | (39,382 | ) | | | (516,184 | ) |
| | | | | | | | |
Net increase (decrease) in shares outstanding before conversion | | | (18,532 | ) | | | (232,632 | ) |
Shares purchased upon conversion into other share class(es) | | | (552,420 | ) | | | (7,017,536 | ) |
| | | | | | | | |
Net increase (decrease) in shares outstanding | | | (570,952 | ) | | $ | (7,250,168 | ) |
| | | | | | | | |
Class C | | | | | | |
Year ended October 31, 2021: | | | | | | | | |
Shares sold | | | 75,244 | | | $ | 1,234,291 | |
Shares issued in reinvestment of dividends and distributions | | | 31,819 | | | | 464,240 | |
Shares purchased | | | (182,947 | ) | | | (2,971,760 | ) |
| | | | | | | | |
Net increase (decrease) in shares outstanding before conversion | | | (75,884 | ) | | | (1,273,229 | ) |
Shares purchased upon conversion into other share class(es) | | | (284,445 | ) | | | (4,601,367 | ) |
| | | | | | | | |
Net increase (decrease) in shares outstanding | | | (360,329 | ) | | $ | (5,874,596 | ) |
| | | | | | | | |
Year ended October 31, 2020: | | | | | | | | |
Shares sold | | | 193,697 | | | $ | 2,503,431 | |
Shares issued in reinvestment of dividends and distributions | | | 77,367 | | | | 1,052,190 | |
Shares purchased | | | (477,763 | ) | | | (6,055,470 | ) |
| | | | | | | | |
Net increase (decrease) in shares outstanding before conversion | | | (206,699 | ) | | | (2,499,849 | ) |
Shares purchased upon conversion into other share class(es) | | | (251,439 | ) | | | (3,300,159 | ) |
| | | | | | | | |
Net increase (decrease) in shares outstanding | | | (458,138 | ) | | $ | (5,800,008 | ) |
| | | | | | | | |
| | | | | | | | |
Class Z | | Shares | | | Amount | |
Year ended October 31, 2021: | | | | | | | | |
Shares sold | | | 2,430,335 | | | $ | 45,745,515 | |
Shares issued in reinvestment of dividends and distributions | | | 80,721 | | | | 1,375,492 | |
Shares purchased | | | (824,320 | ) | | | (15,996,802 | ) |
| | | | | | | | |
Net increase (decrease) in shares outstanding before conversion | | | 1,686,736 | | | | 31,124,205 | |
Shares issued upon conversion from other share class(es) | | | 146,046 | | | | 2,809,035 | |
Shares purchased upon conversion into other share class(es) | | | (3,701,600 | ) | | | (77,197,081 | ) |
| | | | | | | | |
Net increase (decrease) in shares outstanding | | | (1,868,818 | ) | | $ | (43,263,841 | ) |
| | | | | | | | |
Year ended October 31, 2020: | | | | | | | | |
Shares sold | | | 2,132,508 | | | $ | 31,936,340 | |
Shares issued in reinvestment of dividends and distributions | | | 169,741 | | | | 2,680,209 | |
Shares purchased | | | (3,734,913 | ) | | | (59,942,110 | ) |
| | | | | | | | |
Net increase (decrease) in shares outstanding before conversion | | | (1,432,664 | ) | | | (25,325,561 | ) |
Shares issued upon conversion from other share class(es) | | | 190,651 | | | | 2,932,932 | |
Shares purchased upon conversion into other share class(es) | | | (6,248 | ) | | | (94,422 | ) |
| | | | | | | | |
Net increase (decrease) in shares outstanding | | | (1,248,261 | ) | | $ | (22,487,051 | ) |
| | | | | | | | |
Class R6 | | | | | | |
Year ended October 31, 2021: | | | | | | | | |
Shares sold | | | 5,207,231 | | | $ | 102,405,348 | |
Shares issued in reinvestment of dividends and distributions | | | 217,932 | | | | 3,717,913 | |
Shares purchased | | | (4,048,357 | ) | | | (80,594,303 | ) |
| | | | | | | | |
Net increase (decrease) in shares outstanding before conversion | | | 1,376,806 | | | | 25,528,958 | |
Shares issued upon conversion from other share class(es) | | | 3,703,938 | | | | 77,392,006 | |
Shares purchased upon conversion into other share class(es) | | | (758 | ) | | | (16,208 | ) |
| | | | | | | | |
Net increase (decrease) in shares outstanding | | | 5,079,986 | | | $ | 102,904,756 | |
| | | | | | | | |
Year ended October 31, 2020: | | | | | | | | |
Shares sold | | | 6,113,252 | | | $ | 90,491,003 | |
Shares issued in reinvestment of dividends and distributions | | | 246,614 | | | | 3,898,963 | |
Shares purchased | | | (3,724,806 | ) | | | (54,386,144 | ) |
| | | | | | | | |
Net increase (decrease) in shares outstanding before conversion | | | 2,635,060 | | | | 40,003,822 | |
Shares issued upon conversion from other share class(es) | | | 12,349 | | | | 193,228 | |
| | | | | | | | |
Net increase (decrease) in shares outstanding | | | 2,647,409 | | | $ | 40,197,050 | |
| | | | | | | | |
| * | Effective June 26, 2020, all of the issued and outstanding Class B shares of the Fund converted into Class A shares. |
8. Borrowings
The RIC, on behalf of the Fund, along with other affiliated registered investment companies (the “Participating Funds”), is a party to a Syndicated Credit Agreement (“SCA”) with a group of banks. The purpose of the SCA is to provide an alternative source of temporary funding for capital share redemptions. The table below provides details of the current SCA in effect at the reporting period-end as well as the prior SCA.
| | | | |
| | | Current SCA | | Prior SCA |
Term of Commitment | | 10/1/2021 – 9/29/2022 | | 10/2/2020 – 9/30/2021 |
Total Commitment | | $ 1,200,000,000 | | $ 1,200,000,000 |
| Annualized Commitment Fee on the Unused Portion of the SCA | | 0.15% | | 0.15% |
| | | | | | |
| PGIM QMA Large-Cap Core Equity Fund | | | 47 | |
Notes to Financial Statements (continued)
| | | | |
| | | Current SCA | | Prior SCA |
| Annualized Interest Rate on Borrowings | | 1.20% plus the higher of (1) the effective federal funds rate, (2) the one-month LIBOR rate or (3) zero percent | | 1.30% plus the higher of (1) the effective federal funds rate, (2) the one-month LIBOR rate or (3) zero percent |
Certain affiliated registered investment companies that are parties to the SCA include portfolios that are subject to a predetermined mathematical formula used to manage certain benefit guarantees offered under variable annuity contracts. The formula may result in large scale asset flows into and out of these portfolios. Consequently, these portfolios may be more likely to utilize the SCA for purposes of funding redemptions. It may be possible for those portfolios to fully exhaust the committed amount of the SCA, thereby requiring the Manager to allocate available funding per a Board-approved methodology designed to treat the Participating Funds in the SCA equitably.
The Fund utilized the SCA during the year ended October 31, 2021. The average daily balance for the 2 days that the Fund had loans outstanding during the period was approximately $4,256,000, borrowed at a weighted average interest rate of 1.40%. The maximum loan outstanding amount during the period was $4,256,000. At October 31, 2021, the Fund did not have an outstanding loan amount.
9. Risks of Investing in the Fund
The Fund’s risks include, but are not limited to, some or all of the risks discussed below. For further information on the Fund’s risks, please refer to the Fund’s Prospectus and Statement of Additional Information.
Blend Style Risk: The Fund’s blend investment style may subject the Fund to risks of both value and growth investing. The portion of the Fund’s portfolio that makes investments pursuant to a growth strategy may be subject to above-average fluctuations as a result of seeking high quality stocks with good future growth prospects. The portion of the Fund’s portfolio that makes investments pursuant to a value strategy may be subject to the risk that the market may not recognize a security’s intrinsic value for long periods of time or that a stock judged to be undervalued may actually be appropriately priced. Issuers of value stocks may have experienced adverse business developments or may be subject to special risks that have caused the stock to be out of favor. If the Fund’s assessment of market conditions or a company’s value is inaccurate, the Fund could suffer losses or produce poor performance relative to other funds. Historically, growth stocks have performed best during later stages of economic expansion and value stocks have performed best during periods of economic recovery. Therefore, both styles may over time go in and out of favor with the markets. At times when a style is out of favor, that portion of the portfolio may lag the other
portion of the portfolio, which may cause the Fund to underperform the market in general, its benchmark and other mutual funds. Growth and value stocks have historically produced similar long-term results, though each category has periods when it outperforms the other.
Economic and Market Events Risk: Events in the U.S. and global financial markets, including actions taken by the U.S. Federal Reserve or foreign central banks to stimulate or stabilize economic growth or the functioning of the securities markets, may at times result in unusually high market volatility, which could negatively impact performance. Relatively reduced liquidity in credit and fixed income markets could adversely affect issuers worldwide.
Equity and Equity-Related Securities Risk: Equity and equity-related securities may be subject to changes in value, and their values may be more volatile than those of other asset classes. In addition to an individual security losing value, the value of the equity markets or a sector in which the Fund invests could go down. Different parts of a market can react differently to adverse issuer, market, regulatory, political and economic developments.
Increase in Expenses Risk: Your actual cost of investing in the Fund may be higher than the expenses shown in the expense table in the Fund’s prospectus for a variety of reasons. For example, expense ratios may be higher than those shown if average net assets decrease. Net assets are more likely to decrease and Fund expense ratios are more likely to increase when markets are volatile. Active and frequent trading of Fund securities can increase expenses.
Large Capitalization Company Risk: Companies with large market capitalizations go in and out of favor based on market and economic conditions. Larger companies tend to be less volatile than companies with smaller market capitalizations. In exchange for this potentially lower risk, the Fund’s value may not rise or fall as much as the value of funds that emphasize companies with smaller market capitalizations.
Large Shareholder and Large Scale Redemption Risk: Certain individuals, accounts, funds (including funds affiliated with the Manager) or institutions, including the Manager and its affiliates, may from time to time own or control a substantial amount of the Fund’s shares. There is no requirement that these entities maintain their investment in the Fund. There is a risk that such large shareholders or that the Fund’s shareholders generally may redeem all or a substantial portion of their investments in the Fund in a short period of time, which could have a significant negative impact on the Fund’s NAV, liquidity, and brokerage costs. Large redemptions could also result in tax consequences to shareholders and impact the Fund’s ability to implement its investment strategy. The Fund’s ability to pursue its investment objective after one or more large scale redemptions may be impaired and, as a result, the Fund may invest a larger portion of its assets in cash or cash equivalents.
Management Risk: Actively managed mutual funds are subject to management risk. The subadviser will apply investment techniques and risk analyses in making investment decisions for the Fund, but there can be no guarantee that these techniques will produce
| | | | | | |
| PGIM QMA Large-Cap Core Equity Fund | | | 49 | |
Notes to Financial Statements (continued)
the desired results. Additionally, the investments selected by the subadviser may underperform the markets in general, the Fund’s benchmark and other mutual funds with similar investment objectives.
Market Disruption and Geopolitical Risks: International wars or conflicts and geopolitical developments in foreign countries, along with instability in regions such as Asia, Eastern Europe, and the Middle East, possible terrorist attacks in the United States or around the world, public health epidemics such as the outbreak of infectious diseases like the outbreak of COVID-19 globally in 2020 or the 2014–2016 outbreak in West Africa of the Ebola virus, and other similar events could adversely affect the U.S. and foreign financial markets, including increases in market volatility, reduced liquidity in the securities markets and government intervention, and may cause further long-term economic uncertainties in the United States and worldwide generally. The coronavirus pandemic and the related governmental and public responses have had and may continue to have an impact on the Fund’s investments and net asset value and have led and may continue to lead to increased market volatility and the potential for illiquidity in certain classes of securities and sectors of the market. Preventative or protective actions that governments may take in respect of pandemic or epidemic diseases may result in periods of business disruption, business closures, inability to obtain raw materials, supplies and component parts, and reduced or disrupted operations for the issuers in which the Fund invests. Government intervention in markets may impact interest rates, market volatility and security pricing. The occurrence, reoccurrence and pendency of such diseases could adversely affect the economies (including through changes in business activity and increased unemployment) and financial markets either in specific countries or worldwide.
Market Risk: Securities markets may be volatile and the market prices of the Fund’s securities may decline. Securities fluctuate in price based on changes in an issuer’s financial condition and overall market and economic conditions. If the market prices of the securities owned by the Fund fall, the value of your investment in the Fund will decline.
Model Design Risk: The subadviser uses certain quantitative models to help guide its investment decisions. The design of the underlying models may be flawed or incomplete. The investment models the subadviser uses are based on historical and theoretical underpinnings that it believes are sound. There can be no guarantee, however, that these underpinnings will correlate with security price behavior in the manner assumed by the subadviser’s models. Additionally, the quantitative techniques that underlie the subadviser’s portfolio construction processes may fail to fully anticipate important risks.
Model Implementation Risk: While the subadviser strives to mitigate the likelihood of material implementation errors, it is impossible to completely eliminate the risk of error in
the implementation of the computer models that guide the subadviser’s quantitative investment processes. Additionally, it may be difficult to implement model recommendations in volatile and rapidly changing market conditions.
10. Recent Regulatory Developments
On December 3, 2020, the SEC announced that it voted to adopt a new rule that establishes an updated regulatory framework for fund valuation practices (the “Rule”). The Rule, in part, provides (i) a framework for determining fair value in good faith and (ii) provides for a fund Board’s assignment of its responsibility for the execution of valuation-related activities to a fund’s investment adviser. Further, the SEC is rescinding previously issued guidance on related issues. The Rule took effect on March 8, 2021, with a compliance date of September 8, 2022. Management is currently evaluating the Rule and its impact to the Fund.
11. Subsequent Event
Effective December 29, 2021, the Fund’s name will change from PGIM QMA Large-Cap Core Equity Fund to PGIM Quant Solutions Large-Cap Core Equity Fund.
| | | | | | |
| PGIM QMA Large-Cap Core Equity Fund | | | 51 | |
Report of Independent Registered Public Accounting Firm
To the Board of Trustees of Prudential Investment Portfolios 9 and Shareholders of PGIM QMA Large-Cap Core Equity Fund
Opinion on the Financial Statements
We have audited the accompanying statement of assets and liabilities, including the schedule of investments, of PGIM QMA Large-Cap Core Equity Fund (one of the funds constituting Prudential Investment Portfolios 9, referred to hereafter as the “Fund”) as of October 31, 2021, the related statement of operations for the year ended October 31, 2021, the statement of changes in net assets for each of the two years in the period ended October 31, 2021, including the related notes, and financial highlights for each of the two years in the period ended October 31, 2021 (collectively referred to as the “financial statements”). In our opinion, the financial statements present fairly, in all material respects, the financial position of the Fund as of October 31, 2021, the results of its operations for the year then ended, and the changes in its net assets and the financial highlights for each of the two years in the period ended October 31, 2021 in conformity with accounting principles generally accepted in the United States of America.
The financial statements of the Fund as of and for the year ended October 31, 2019 and the financial highlights for each of the periods ended on or prior to October 31, 2019 (not presented herein, other than the financial highlights) were audited by other auditors whose report dated December 19, 2019 expressed an unqualified opinion on those financial statements and financial highlights.
Basis for Opinion
These financial statements are the responsibility of the Fund’s management. Our responsibility is to express an opinion on the Fund’s financial statements based on our audits. We are a public accounting firm registered with the Public Company Accounting Oversight Board (United States) (PCAOB) and are required to be independent with respect to the Fund in accordance with the U.S. federal securities laws and the applicable rules and regulations of the Securities and Exchange Commission and the PCAOB.
We conducted our audits of these financial statements in accordance with the standards of the PCAOB. Those standards require that we plan and perform the audit to obtain reasonable assurance about whether the financial statements are free of material misstatement, whether due to error or fraud.
Our audits included performing procedures to assess the risks of material misstatement of the financial statements, whether due to error or fraud, and performing procedures that respond to those risks. Such procedures included examining, on a test basis, evidence regarding the amounts and disclosures in the financial statements. Our audits also included evaluating the accounting principles used and significant estimates made by management, as well as evaluating the overall presentation of the financial statements. Our procedures included confirmation of securities owned as of October 31, 2021 by correspondence with the custodian, transfer agent and brokers; when replies were not received from brokers, we performed other auditing procedures. We believe that our audits provide a reasonable basis for our opinion.
/s/PricewaterhouseCoopers LLP
New York, New York
December 16, 2021
We have served as the auditor of one or more investment companies in the PGIM Retail Funds complex since 2020.
Tax Information (unaudited)
We are advising you that during the fiscal year ended October 31, 2021, the Fund reports the maximum amount allowed per share but not less than $0.19 for Class A, C, Z and R6 shares as a capital gain distribution in accordance with Section 852(b)(3)(C) of the Internal Revenue Code.
For the year ended October 31, 2021, the Fund reports the maximum amount allowable under Section 854 of the Internal Revenue Code, but not less than, the following percentages of the ordinary income dividends paid as 1) qualified dividend income (QDI); and 2) eligible for corporate dividends received deduction (DRD):
| | | | | | | | |
| | | QDI | | | DRD | |
PGIM QMA Large-Cap Core Equity Fund | | | 86.20 | % | | | 86.22 | % |
In January 2022, you will be advised on IRS Form 1099-DIV or substitute 1099-DIV, as to the federal tax status of dividends and distributions received by you in calendar year 2021.
| | | | |
PGIM QMA Large-Cap Core Equity Fund | | | 53 | |
INFORMATION ABOUT BOARD MEMBERS AND OFFICERS (unaudited)
Information about Board Members and Officers of the Fund is set forth below. Board Members who are not deemed to be “interested persons” of the Fund, as defined in the 1940 Act, are referred to as “Independent Board Members.” Board Members who are deemed to be “interested persons” of the Fund are referred to as “Interested Board Members.” The Board Members are responsible for the overall supervision of the operations of the Fund and perform the various duties imposed on the directors of investment companies by the 1940 Act. The Board in turn elects the Officers, who are responsible for administering the day-to-day operations of the Fund.
| | | | | | |
| Independent Board Members | | | | |
| | | | |
Name Year of Birth Position(s) Portfolios Overseen | | Principal Occupation(s) During Past Five Years | | Other Directorships Held During Past Five Years | | Length of
Board Service |
| | | | |
Ellen S. Alberding 1958 Board Member Portfolios Overseen: 95 | | President and Board Member, The Joyce Foundation (charitable foundation) (since 2002); formerly Vice Chair, City Colleges of Chicago (community college system) (2011-2015); Trustee, National Park Foundation (charitable foundation for national park system) (2009-2018); Trustee, Economic Club of Chicago (2009-2016); Trustee, Loyola University (since 2018). | | None. | | Since September 2013 |
| | | | |
Kevin J. Bannon 1952 Board Member Portfolios Overseen: 95 | | Retired; formerly Managing Director (April 2008-May 2015) and Chief Investment Officer (October 2008-November 2013) of Highmount Capital LLC (registered investment adviser); formerly Executive Vice President and Chief Investment Officer (April 1993-August 2007) of Bank of New York Company; President (May 2003-May 2007) of BNY Hamilton Family of Mutual Funds. | | Director of Urstadt Biddle Properties (equity real estate investment trust) (since September 2008). | | Since July 2008 |
PGIM QMA Large-Cap Core Equity Fund
| | | | | | |
| Independent Board Members | | | | |
| | | | |
Name Year of Birth Position(s) Portfolios Overseen | | Principal Occupation(s) During Past Five Years | | Other Directorships Held During Past Five Years | | Length of
Board Service |
| | | | |
Linda W. Bynoe 1952 Board Member Portfolios Overseen: 92 | | President and Chief Executive Officer (since March 1995) and formerly Chief Operating Officer (December 1989-February 1995) of Telemat Limited LLC (formerly Telemat Ltd) (management consulting); formerly Vice President (January 1985-June 1989) at Morgan Stanley & Co. (broker-dealer). | | Trustee of Equity Residential (residential real estate) (since December 2009); Director of Northern Trust Corporation (financial services) (since April 2006); formerly Director of Anixter International, Inc. (communication products distributor) (January 2006-June 2020). | | Since March 2005 |
| | | | |
Barry H. Evans 1960 Board Member Portfolios Overseen: 94 | | Retired; formerly President (2005-2016), Global Chief Operating Officer (2014-2016), Chief Investment Officer - Global Head of Fixed Income (1998-2014), and various portfolio manager roles (1986-2006), Manulife Asset Management (asset management). | | Formerly Director, Manulife Trust Company (2011-2018); formerly Director, Manulife Asset Management Limited (2015-2017); formerly Chairman of the Board of Directors of Manulife Asset Management U.S. (2005-2016); formerly Chairman of the Board, Declaration Investment Management and Research (2008-2016). | | Since September 2017 |
| | | | |
Keith F. Hartstein 1956 Board Member & Independent Chair Portfolios Overseen: 95 | | Retired; Executive Committee of the Independent Directors Council (IDC) Board of Governors (since October 2019); Member (since November 2014) of the Governing Council of the IDC (organization of independent mutual fund directors); formerly President and Chief Executive Officer (2005-2012), Senior Vice President (2004-2005), Senior Vice President of Sales and Marketing (1997-2004), and various executive management positions (1990-1997), John Hancock Funds, LLC (asset management); Chairman, Investment Company Institute’s Sales Force Marketing Committee (2003-2008). | | None. | | Since September 2013 |
Visit our website at pgim.com/investments
| | | | | | |
| Independent Board Members | | | | |
| | | | |
Name Year of Birth Position(s) Portfolios Overseen | | Principal Occupation(s) During Past Five Years | | Other Directorships Held During Past Five Years | | Length of
Board Service |
| | | | |
Laurie Simon Hodrick 1962 Board Member Portfolios Overseen: 91 | | A. Barton Hepburn Professor Emerita of Economics in the Faculty of Business, Columbia Business School (since 2018); Visiting Fellow at the Hoover Institution, Stanford University (since 2015); Sole Member, ReidCourt LLC (since 2008) (a consulting firm); formerly Visiting Professor of Law, Stanford Law School (2015-2021); formerly A. Barton Hepburn Professor of Economics in the Faculty of Business, Columbia Business School (1996-2017); formerly Managing Director, Global Head of Alternative Investment Strategies, Deutsche Bank (2006-2008). | | Independent Director, Roku (since December 2020) (communication services); formerly Independent Director, Synnex Corporation (2019-2021) (information technology); formerly Independent Director, Kabbage, Inc. (2018-2020) (financial services); formerly Independent Director, Corporate Capital Trust (2017-2018) (a business development company). | | Since September 2017 |
| | | | |
Brian K. Reid 1961 Board Member Portfolios Overseen: 94 | | Retired; formerly Chief Economist for the Investment Company Institute (ICI) (2005-2017); formerly Senior Economist and Director of Industry and Financial Analysis at the ICI (1998-2004); formerly Senior Economist, Industry and Financial Analysis at the ICI (1996-1998); formerly Staff Economist at the Federal Reserve Board (1989-1996); Director, ICI Mutual Insurance Company (2012-2017). | | None. | | Since March 2018 |
PGIM QMA Large-Cap Core Equity Fund
| | | | | | |
| Independent Board Members | | | | |
| | | | |
Name Year of Birth Position(s) Portfolios Overseen | | Principal Occupation(s) During Past Five Years | | Other Directorships Held During Past Five Years | | Length of
Board Service |
| | | | |
Grace C. Torres 1959 Board Member Portfolios Overseen: 94 | | Retired; formerly Treasurer and Principal Financial and Accounting Officer of the PGIM Funds, Target Funds, Advanced Series Trust, Prudential Variable Contract Accounts and The Prudential Series Fund (1998-June 2014); Assistant Treasurer (March 1999-June 2014) and Senior Vice President (September 1999-June 2014) of PGIM Investments LLC; Assistant Treasurer (May 2003-June 2014) and Vice President (June 2005-June 2014) of AST Investment Services, Inc.; Senior Vice President and Assistant Treasurer (May 2003-June 2014) of Prudential Annuities Advisory Services, Inc. | | Director (since January 2018) of OceanFirst Financial Corp. and OceanFirst Bank; formerly Director (July 2015-January 2018) of Sun Bancorp, Inc. N.A. and Sun National Bank. | | Since November 2014 |
| | | | | | |
| Interested Board Members | | | | |
| | | | |
Name Year of Birth Position(s) Portfolios Overseen | | Principal Occupation(s) During Past Five Years | | Other Directorships Held During Past Five Years | | Length of
Board Service |
| | | | |
Stuart S. Parker 1962 Board Member & President Portfolios Overseen: 94 | | President, Chief Executive Officer, Chief Operating Officer and Officer in Charge of PGIM Investments LLC (formerly known as Prudential Investments LLC) (since January 2012); formerly Executive Vice President of Jennison Associates LLC and Head of Retail Distribution of PGIM Investments LLC (June 2005-December 2011); Investment Company Institute - Board of Governors (since May 2012). | | None. | | Since January 2012 |
Visit our website at pgim.com/investments
| | | | | | |
| Interested Board Members | | | | |
| | | | |
Name Year of Birth Position(s)
Portfolios Overseen | | Principal Occupation(s) During Past Five Years | | Other Directorships Held During Past Five Years | | Length of
Board Service |
| | | | |
Scott E. Benjamin 1973 Board Member & Vice President Portfolios Overseen: 95 | | Executive Vice President (since May 2009) of PGIM Investments LLC; Vice President (since June 2012) of Prudential Investment Management Services LLC; Executive Vice President (since September 2009) of AST Investment Services, Inc.; Senior Vice President of Product Development and Marketing, PGIM Investments (since February 2006); formerly Vice President of Product Development and Product Management, PGIM Investments LLC (2003-2006). | | None. | | Since March 2010 |
(1) The year that each Board Member joined the Board is as follows:
Ellen S. Alberding, 2013; Kevin J. Bannon, 2008; Linda W. Bynoe, 2005; Barry H. Evans, 2017; Keith F. Hartstein, 2013; Laurie Simon Hodrick, 2017; Michael S. Hyland, 2008; Richard A. Redeker, 1993; Stephen G. Stoneburn, 2003; Stuart S. Parker, Board Member since 2012 and President since 2012; Scott E. Benjamin, Board Member since 2010 and Vice President since 2009; Grace C. Torres, 2014.
| | | | |
| Fund Officers(a) | | | | |
| | | |
Name Year of Birth Fund Position | | Principal Occupation(s) During Past Five Years | | Length of
Service as Fund
Officer |
| | | |
Claudia DiGiacomo 1974 Chief Legal Officer | | Chief Legal Officer, Executive Vice President and Secretary of PGIM Investments LLC (since August 2020); Chief Legal Officer of Prudential Mutual Fund Services LLC (since August 2020); Chief Legal Officer of PIFM Holdco, LLC (since August 2020); Vice President and Corporate Counsel (since January 2005) of Prudential; and Corporate Counsel of AST Investment Services, Inc. (since August 2020); formerly Vice President and Assistant Secretary of PGIM Investments LLC (2005-2020); formerly Associate at Sidley Austin Brown & Wood LLP (1999-2004). | | Since December 2005 |
PGIM QMA Large-Cap Core Equity Fund
| | | | |
| Fund Officers(a) | | | | |
| | | |
Name Year of Birth Fund Position | | Principal Occupation(s) During Past Five Years | | Length of Service as Fund Officer |
| | | |
Dino Capasso 1974 Chief Compliance Officer | | Chief Compliance Officer (since July 2019) of PGIM Investments LLC; Chief Compliance Officer (since July 2019) of the PGIM Funds, Target Funds, Advanced Series Trust, The Prudential Series Fund, Prudential’s Gibraltar Fund, Inc., PGIM Global High Yield Fund, Inc., PGIM High Yield Bond Fund, Inc., and PGIM Short Duration High Yield Opportunities Fund; Vice President and Deputy Chief Compliance Officer (June 2017-2019) of PGIM Investments LLC; formerly Senior Vice President and Senior Counsel (January 2016-June 2017), and Vice President and Counsel (February 2012-December 2015) of Pacific Investment Management Company LLC. | | Since July 2019 |
| | | |
Andrew R. French 1962 Secretary | | Vice President (since December 2018) of PGIM Investments LLC; formerly Vice President and Corporate Counsel (2010-2018) of Prudential; formerly Director and Corporate Counsel (2006-2010) of Prudential; Vice President and Assistant Secretary (since January 2007) of PGIM Investments LLC; Vice President and Assistant Secretary (since January 2007) of Prudential Mutual Fund Services LLC. | | Since October 2006 |
| | | |
Diana N. Huffman 1982 Assistant Secretary | | Vice President and Corporate Counsel (since September 2015) of Prudential; Vice President and Assistant Secretary (since August 2020) of PGIM Investments LLC; formerly Associate at Willkie Farr & Gallagher LLP (2009-2015). | | Since March 2019 |
| | | |
Melissa Gonzalez 1980 Assistant Secretary | | Vice President and Corporate Counsel (since September 2018) of Prudential; Vice President and Assistant Secretary (since August 2020) of PGIM Investments LLC; formerly Director and Corporate Counsel (March 2014-September 2018) of Prudential. | | Since March 2020 |
| | | |
Patrick E. McGuinness 1986 Assistant Secretary | | Vice President and Assistant Secretary (since August 2020) of PGIM Investments LLC; Director and Corporate Counsel (since February 2017) of Prudential; and Corporate Counsel (2012-2017) of IIL, Inc. | | Since June 2020 |
| | | |
Debra Rubano 1975 Assistant Secretary | | Vice President and Corporate Counsel (since November 2020) of Prudential; formerly Director and Senior Counsel of Allianz Global Investors U.S. Holdings LLC (2010-2020) and Assistant Secretary of numerous funds in the Allianz fund complex (2015-2020). | | Since December 2020 |
| | | |
Kelly A. Coyne 1968 Assistant Secretary | | Director, Investment Operations of Prudential Mutual Fund Services LLC (since 2010). | | Since March 2015 |
Visit our website at pgim.com/investments
| | | | |
| Fund Officers(a) | | | | |
| | | |
Name Year of Birth Fund Position | | Principal Occupation(s) During Past Five Years | | Length of
Service as Fund
Officer |
| | | |
Christian J. Kelly 1975 Treasurer and Principal Financial and Accounting Officer | | Vice President, Head of Fund Administration of PGIM Investments LLC (since November 2018); formerly Director of Fund Administration of Lord Abbett & Co. LLC (2009-2018), Treasurer and Principal Accounting Officer of the Lord Abbett Family of Funds (2017-2018); Director of Accounting, Avenue Capital Group (2008-2009); Senior Manager, Investment Management Practice of Deloitte & Touche LLP (1998-2007). | | Since January 2019 |
| | | |
Lana Lomuti 1967 Assistant Treasurer | | Vice President (since 2007) and Director (2005-2007), within PGIM Investments Fund Administration; formerly Assistant Treasurer (December 2007-February 2014) of The Greater China Fund, Inc. | | Since April 2014 |
| | | |
Russ Shupak 1973 Assistant Treasurer | | Vice President (since 2017) and Director (2013-2017), within PGIM Investments Fund Administration. | | Since September 2019 |
| | | |
Deborah Conway 1969 Assistant Treasurer | | Vice President (since 2017) and Director (2007-2017), within PGIM Investments Fund Administration. | | Since September 2019 |
| | | |
Elyse M. McLaughlin 1974 Assistant Treasurer | | Vice President (since 2017) and Director (2011-2017), within PGIM Investments Fund Administration. | | Since September 2019 |
| | | |
Jonathan Corbett 1983 Anti-Money Laundering Compliance Officer | | Vice President, Corporate Compliance, Global Compliance Programs and Compliance Risk Management (since August 2019) of Prudential; formerly Vice President and Head of Key Risk Areas Compliance (March 2016 to July 2019), Chief Privacy Officer (March 2016 to July 2019) and Head of Global Financial Crimes Unit (April 2014 to March 2016) at MetLife. | | Since October 2021 |
(a) Excludes Mr. Parker and Mr. Benjamin, interested Board Members who also serve as President and Vice President, respectively.
Explanatory Notes to Tables:
| ∎ | | Board Members are deemed to be “Interested,” as defined in the 1940 Act, by reason of their affiliation with PGIM Investments LLC and/or an affiliate of PGIM Investments LLC. |
| ∎ | | Unless otherwise noted, the address of all Board Members and Officers is c/o PGIM Investments LLC, 655 Broad Street, Newark, New Jersey 07102-4410. |
| ∎ | | There is no set term of office for Board Members or Officers. The Board Members have adopted a retirement policy, which calls for the retirement of Board Members on December 31 of the year in which they reach the age of 75. |
| ∎ | | “Other Directorships Held” includes all directorships of companies required to register or file reports with the SEC under the 1934 Act (that is, “public companies”) or other investment companies registered under the 1940 Act. |
| ∎ | | “Portfolios Overseen” includes all investment companies managed by PGIM Investments LLC. The investment companies for which PGIM Investments LLC serves as manager include the PGIM Funds, Target Funds, The Prudential Variable Contract Accounts, PGIM ETF Trust, PGIM High Yield Bond Fund, Inc., PGIM Global High Yield Fund, Inc., PGIM Short Duration High Yield Opportunities Fund, The Prudential Series Fund, Prudential’s Gibraltar Fund, Inc. and the Advanced Series Trust. |
| ∎ | | As used in the Fund Officers table “Prudential” means The Prudential Insurance Company of America. |
PGIM QMA Large-Cap Core Equity Fund
Approval of Advisory Agreements (unaudited)
The Fund’s Board of Trustees
The Board of Trustees (the “Board”) of PGIM QMA Large-Cap Core Equity Fund (the “Fund”)1 consists of ten individuals, eight of whom are not “interested persons” of the Fund, as defined in the Investment Company Act of 1940, as amended (the “1940 Act”) (the “Independent Trustees”). The Board is responsible for the oversight of the Fund and its operations, and performs the various duties imposed on the directors of investment companies by the 1940 Act. The Independent Trustees have retained independent legal counsel to assist them in connection with their duties. The Chair of the Board is an Independent Trustee. The Board has established four standing committees: the Audit Committee, the Nominating and Governance Committee, and two Investment Committees. Each committee is chaired by, and composed of, Independent Trustees.
Annual Approval of the Fund’s Advisory Agreements
As required under the 1940 Act, the Board determines annually whether to renew the Fund’s management agreement with PGIM Investments LLC (“PGIM Investments”) and the Fund’s subadvisory agreement with QMA LLC (“QMA”). In considering the renewal of the agreements, the Board, including all of the Independent Trustees, met on June 7-10, 2021 and approved the renewal of the agreements through July 31, 2022, after concluding that the renewal of the agreements was in the best interests of the Fund and its shareholders.
In advance of the meetings, the Board requested and received materials relating to the agreements, and had the opportunity to ask questions and request further information in connection with its consideration. Among other things, the Board considered comparative fee information from PGIM Investments and QMA. Also, the Board considered comparisons with other mutual funds in relevant Peer Universes and Peer Groups, as is further discussed below.
In approving the agreements, the Board, including the Independent Trustees advised by independent legal counsel, considered the factors it deemed relevant, including the nature, quality and extent of services provided by PGIM Investments and the subadviser, the performance of the Fund, the profitability of PGIM Investments and its affiliates, expenses and fees, and the potential for economies of scale that may be shared with the Fund and its shareholders as the Fund’s assets grow. In their deliberations, the Trustees did not identify any single factor which alone was responsible for the Board’s decision to approve the agreements with respect to the Fund. In connection with its deliberations, the Board considered information provided by PGIM Investments throughout the year at regular Board meetings, presentations from portfolio managers and other information, as well as information furnished at or in advance of the meetings on June 7-10, 2021.
The Trustees determined that the overall arrangements between the Fund and PGIM Investments, which serves as the Fund’s investment manager pursuant to a
| 1 | PGIM QMA Large-Cap Core Equity Fund is a series of Prudential Investment Portfolios 9. |
PGIM QMA Large-Cap Core Equity Fund
Approval of Advisory Agreements (continued)
management agreement, and between PGIM Investments and QMA, which serves as the Fund’s subadviser pursuant to the terms of a subadvisory agreement with PGIM Investments, are in the best interests of the Fund and its shareholders in light of the services performed, fees charged and such other matters as the Trustees considered relevant in the exercise of their business judgment.
The material factors and conclusions that formed the basis for the Trustees’ reaching their determinations to approve the continuance of the agreements are separately discussed below.
Nature, Quality and Extent of Services
The Board received and considered information regarding the nature, quality and extent of services provided to the Fund by PGIM Investments and QMA. The Board noted that QMA is affiliated with PGIM Investments. The Board considered the services provided by PGIM Investments, including but not limited to the oversight of the subadviser for the Fund, as well as the provision of fund recordkeeping, compliance and other services to the Fund, and PGIM Investments’ role as administrator for the Fund’s liquidity risk management program. With respect to PGIM Investments’ oversight of the subadviser, the Board noted that PGIM Investments’ Strategic Investment Research Group (“SIRG”), which is a business unit of PGIM Investments, is responsible for monitoring and reporting to PGIM Investments’ senior management on the performance and operations of the subadviser. The Board also considered that PGIM Investments pays the salaries of all of the officers and interested Trustees of the Fund who are part of Fund management. The Board also considered the investment subadvisory services provided by QMA, including investment research and security selection, as well as adherence to the Fund’s investment restrictions and compliance with applicable Fund policies and procedures. The Board considered PGIM Investments’ evaluation of the subadviser, as well as PGIM Investments’ recommendation, based on its review of the subadviser, to renew the subadvisory agreement.
The Board considered the qualifications, backgrounds and responsibilities of PGIM Investments’ senior management responsible for the oversight of the Fund and QMA, and also considered the qualifications, backgrounds and responsibilities of QMA’s portfolio managers who are responsible for the day-to-day management of the Fund’s portfolio. The Board was provided with information pertaining to PGIM Investments’ and QMA’s organizational structure, senior management, investment operations, and other relevant information pertaining to both PGIM Investments and QMA. The Board also noted that it received favorable compliance reports from the Fund’s Chief Compliance Officer (“CCO”) as to both PGIM Investments and QMA.
The Board concluded that it was satisfied with the nature, extent and quality of the investment management services provided by PGIM Investments and the subadvisory services provided to the Fund by QMA, and that there was a reasonable basis on which to conclude that the Fund benefits from the services provided by PGIM Investments and QMA under the management and subadvisory agreements.
Visit our website at pgim.com/investments
Costs of Services and Profits Realized by PGIM Investments
The Board was provided with information on the profitability of PGIM Investments and its affiliates in serving as the Fund’s investment manager. The Board discussed with PGIM Investments the methodology utilized in assembling the information regarding profitability and considered its reasonableness. The Board recognized that it is difficult to make comparisons of profitability from fund management contracts because comparative information is not generally publicly available and is affected by numerous factors, including the structure of the particular adviser, the types of funds it manages, its business mix, numerous assumptions regarding allocations and the adviser’s capital structure and cost of capital. However, the Board considered that the cost of services provided by PGIM Investments during the year ended December 31, 2020 exceeded the management fees paid by the Fund, resulting in an operating loss to PGIM Investments. Taking these factors into account, the Board concluded that the profitability of PGIM Investments and its affiliates in relation to the services rendered was not unreasonable.
Economies of Scale
The Board received and discussed information concerning economies of scale that PGIM Investments may realize as the Fund’s assets grow beyond current levels. The Board noted that the management fee schedule for the Fund includes breakpoints, which have the effect of decreasing the fee rate as assets increase. During the course of time, the Board has considered information regarding the launch date of the Fund, the management fees of the Fund compared to those of similarly managed funds and PGIM Investments’ investment in the Fund over time. The Board noted that economies of scale can be shared with the Fund in other ways, including low management fees from inception, additional technological and personnel investments to enhance shareholder services, and maintaining existing expense structures in the face of a rising cost environment. The Board also considered PGIM Investments’ assertion that it continually evaluates the management fee schedule of the Fund and the potential to share economies of scale through breakpoints or fee waivers as asset levels increase.
The Board recognized the inherent limitations of any analysis of economies of scale, stemming largely from the Board’s understanding that most of PGIM Investments’ costs are not specific to individual funds, but rather are incurred across a variety of products and services.
Other Benefits to PGIM Investments and QMA
The Board considered potential ancillary benefits that might be received by PGIM Investments, QMA and their affiliates as a result of their relationship with the Fund. The Board concluded that potential benefits to be derived by PGIM Investments included transfer agency fees received by the Fund’s transfer agent (which is affiliated with PGIM Investments), and benefits to its reputation as well as other intangible benefits resulting from PGIM Investments’ association with the Fund. The Board concluded that the potential benefits to be derived by QMA included its ability to use soft dollar credits, as
PGIM QMA Large-Cap Core Equity Fund
Approval of Advisory Agreements (continued)
well as the potential benefits consistent with those generally resulting from an increase in assets under management, specifically, potential access to additional research resources and benefits to its reputation. The Board concluded that the benefits derived by PGIM Investments and QMA were consistent with the types of benefits generally derived by investment managers and subadvisers to mutual funds.
Performance of the Fund / Fees and Expenses
The Board considered certain additional factors and made related conclusions relating to the historical performance of the Fund for the one-, three-, five- and ten-year periods ended December 31, 2020.
The Board also considered the Fund’s actual management fee, as well as the Fund’s net total expense ratio, for the fiscal year ended October 31, 2020. The Board considered the management fee for the Fund as compared to the management fee charged by PGIM Investments to other funds and the fee charged by other advisers to comparable mutual funds in a Peer Group. The actual management fee represents the fee rate actually paid by Fund shareholders and includes any fee waivers or reimbursements. The net total expense ratio for the Fund represents the actual expense ratio incurred by Fund shareholders.
The mutual funds included in the Peer Universe, which was used to consider performance, and the Peer Group, which was used to consider expenses and fees, were objectively determined by Broadridge, an independent provider of mutual fund data. In certain circumstances, PGIM Investments also provided supplemental Peer Universe or Peer Group information for reasons addressed with the Board. The comparisons placed the Fund in various quartiles over various periods, with the first quartile being the best 25% of the mutual funds (for performance, the best performing mutual funds and, for expenses, the lowest cost mutual funds).
The section below summarizes key factors considered by the Board and the Board’s conclusions regarding the Fund’s performance, fees and overall expenses. The table sets forth net performance comparisons (which reflect the impact on performance of fund expenses, or any subsidies, expense caps or waivers that may be applicable) with the Peer Universe, actual management fees with the Peer Group (which reflect the impact of any subsidies or fee waivers), and net total expenses with the Peer Group, each of which were key factors considered by the Board.
| | | | | | | | |
| Net Performance | | 1 Year | | 3 Years | | 5 Years | | 10 Years |
| | | 4th Quartile | | 4th Quartile | | 3rd Quartile | | 2nd Quartile |
| Actual Management Fees: 1st Quartile |
| Net Total Expenses: 1st Quartile |
| | ● | The Board noted that the Fund underperformed its benchmark index over all periods. |
Visit our website at pgim.com/investments
| ● | The Board considered PGIM Investments’ assertions that the Fund’s underperformance was primarily driven by the Fund’s bias toward the value style factor. |
| ● | The Board also considered the addition of a new portfolio manager to the portfolio management team in February 2021. |
| ● | The Board noted that PGIM Investments expects relative returns to improve as markets normalize. In this regard, the Board also considered that the Fund outperformed its benchmark index and peer group (ranking in the 8th percentile) for the first quarter of 2021 and outperformed its benchmark index and peer group for the one-year period ended March 31, 2021. |
| ● | The Board and PGIM Investments agreed to retain the existing contractual expense cap, which (exclusive of certain fees and expenses) caps the Fund’s net annual operating expenses at 0.35% for each class of the Fund’s shares through February 28, 2022. |
| ● | The Board and PGIM Investments also agreed to a contractual expense cap that (exclusive of certain fees and expenses) limits the Fund’s total annual operating expenses to 0.72% of the average daily net assets for Class A shares, and 1.44% of the average daily net assets for Class C shares, through February 28, 2022. |
| ● | In addition, PGIM Investments will waive management fees or shared operating expenses on any share class to the same extent that it waives such expenses on any other share class, and has agreed that total annual fund operating expenses for Class R6 shares will not exceed total annual fund operating expenses for Class Z shares. |
| ● | The Board concluded that, in light of the above, it would be in the best interests of the Fund and its shareholders to renew the agreements. |
| ● | The Board concluded that the management fees (including subadvisory fees) and total expenses were reasonable in light of the services provided. |
* * *
After full consideration of these factors, the Board concluded that the approval of the agreements was in the best interests of the Fund and its shareholders.
PGIM QMA Large-Cap Core Equity Fund
| | | | |
| | | |
| ∎ MAIL | | ∎ TELEPHONE | | ∎ WEBSITE |
655 Broad Street Newark, NJ 07102 | | (800) 225-1852 | | pgim.com/investments |
|
| PROXY VOTING |
| The Board of Trustees of the Fund has delegated to the Fund’s subadviser the responsibility for voting any proxies and maintaining proxy recordkeeping with respect to the Fund. A description of these proxy voting policies and procedures is available without charge, upon request, by calling (800) 225-1852 or by visiting the Securities and Exchange Commission’s website at sec.gov. Information regarding how the Fund voted proxies relating to portfolio securities during the most recent 12-month period ended June 30 is available on the Fund’s website and on the Securities and Exchange Commission’s website. |
|
| TRUSTEES |
| Ellen S. Alberding ● Kevin J. Bannon ● Scott E. Benjamin ● Linda W. Bynoe ● Barry H. Evans ● Keith F. Hartstein ● Laurie Simon Hodrick ● Stuart S. Parker ● Brian K. Reid ● Grace C. Torres |
|
| OFFICERS |
| Stuart S. Parker, President ● Scott E. Benjamin, Vice President ● Christian J. Kelly, Treasurer and Principal Financial and Accounting Officer ● Claudia DiGiacomo, Chief Legal Officer ● Dino Capasso, Chief Compliance Officer ● Jonathan Corbett, Anti-Money Laundering Compliance Officer ● Andrew R. French, Secretary ● Melissa Gonzalez, Assistant Secretary ● Diana N. Huffman, Assistant Secretary ● Kelly A. Coyne, Assistant Secretary ● Patrick E. McGuinness, Assistant Secretary ● Debra Rubano, Assistant Secretary ● Lana Lomuti, Assistant Treasurer ● Russ Shupak, Assistant Treasurer ● Elyse M. McLaughlin, Assistant Treasurer ● Deborah Conway, Assistant Treasurer |
| | | | |
| MANAGER | | PGIM Investments LLC | | 655 Broad Street Newark, NJ 07102 |
|
| SUBADVISER | | PGIM Quantitative
Solutions LLC | | Gateway Center Two
100 Mulberry Street
Newark, NJ 07102 |
|
| DISTRIBUTOR | | Prudential Investment Management Services LLC | | 655 Broad Street
Newark, NJ 07102 |
|
| CUSTODIAN | | The Bank of New York
Mellon | | 240 Greenwich Street
New York, NY 10286 |
|
| TRANSFER AGENT | | Prudential Mutual Fund Services LLC | | PO Box 9658
Providence, RI 02940 |
|
INDEPENDENT REGISTERED
PUBLIC ACCOUNTING FIRM | | PricewaterhouseCoopers
LLP | | 300 Madison Avenue
New York, NY 10017 |
|
| FUND COUNSEL | | Willkie Farr & Gallagher
LLP | | 787 Seventh Avenue
New York, NY 10019 |
|
|
| An investor should consider the investment objectives, risks, charges, and expenses of the Fund carefully before investing. The prospectus and summary prospectus contain this and other information about the Fund. An investor may obtain the prospectus and summary prospectus by visiting our website at pgim.com/investments or by calling (800) 225-1852. The prospectus and summary prospectus should be read carefully before investing. |
|
| E-DELIVERY |
| To receive your mutual fund documents online, go to pgim.com/investments/resource/edelivery and enroll. Instead of receiving printed documents by mail, you will receive notification via email when new materials are available. You can cancel your enrollment or change your email address at any time by visiting the website address above. |
|
| SHAREHOLDER COMMUNICATIONS WITH TRUSTEES |
| Shareholders can communicate directly with the Board of Trustees by writing to the Chair of the Board, PGIM QMA Large-Cap Core Equity Fund, PGIM Investments, Attn: Board of Trustees, 655 Broad Street, Newark, NJ 07102. Shareholders can communicate directly with an individual Trustee by writing to that Trustee at the same address. Communications are not screened before being delivered to the addressee. |
|
| AVAILABILITY OF PORTFOLIO HOLDINGS |
| The Fund files its complete schedule of portfolio holdings with the Securities and Exchange Commission for the first and third quarters of each fiscal year as an exhibit to its reports on Form N-PORT. The Fund’s Form N-PORT filings are available on the Commission’s website at sec.gov. |
|
| The Fund’s Statement of Additional Information contains additional information about the Fund’s Trustees and is available without charge, upon request, by calling (800) 225-1852. |
Mutual Funds:
| | | | |
ARE NOT INSURED BY THE FDIC OR ANY
FEDERAL GOVERNMENT AGENCY | | MAY LOSE VALUE | | ARE NOT A DEPOSIT OF OR GUARANTEED
BY ANY BANK OR ANY BANK AFFILIATE |

PGIM QMA LARGE-CAP CORE EQUITY FUND
| | | | | | | | |
| SHARE CLASS | | A | | C | | Z | | R6 |
| NASDAQ | | PTMAX | | PTMCX | | PTEZX | | PTMQX |
| CUSIP | | 74441J100 | | 74441J308 | | 74441J407 | | 74441J688 |
MF187E

PGIM SELECT REAL ESTATE FUND
ANNUAL REPORT
OCTOBER 31, 2021

|
To enroll in e-delivery, go to pgim.com/investments/resource/edelivery |
Table of Contents
This report is not authorized for distribution to prospective investors unless preceded or accompanied by a current prospectus.
The views expressed in this report and information about the Fund’s portfolio holdings are for the period covered by this report and are subject to change thereafter.
Mutual funds are distributed by Prudential Investment Management Services LLC (PIMS), member SIPC. PGIM Real Estate is a unit of PGIM, Inc. (PGIM), a registered investment adviser. PIMS and PGIM are Prudential Financial companies. © 2021 Prudential Financial, Inc. and its related entities. PGIM Real Estate, PGIM, and the PGIM logo are service marks of Prudential Financial, Inc. and its related entities, registered in many jurisdictions worldwide.
| | |
| 2 | | Visit our website at pgim.com/investments |
Letter from the President
| | |
 | | Dear Shareholder: |
| | We hope you find the annual report for the PGIM Select Real Estate Fund informative and useful. The report covers performance for the 12-month period that ended October 31, 2021. |
| | The global economy and markets continued to recover throughout the period from the ongoing impact of the COVID-19 pandemic. The Federal Reserve slashed interest rates and kept them near zero to encourage borrowing. Congress passed stimulus bills worth several trillion dollars to help consumers and businesses. And several effective COVID-19 vaccines received regulatory approval. Those measures were enough to offset the fear of rising inflation and supply chain challenges that threatened to disrupt growth. |
At the start of the period, stocks had recovered most of the steep losses they had suffered at the onset of the pandemic. Equities rallied as states reopened their economies but became more volatile as investors worried that a surge in COVID-19 infections would stall the recovery. However, rising corporate profits and economic growth, the resolution of the US presidential election, and the global rollout of approved vaccines lifted equity markets to record levels, helping stocks around the globe post gains for the full period.
Throughout this volatile period, investors sought safety in fixed income. Investment-grade bonds in the US and the overall global bond market declined slightly during the period as the economy recovered, but emerging market debt rose. While the 10-year US Treasury yield hovered near record lows early in the period after a significant rally in interest rates, rates moved higher later on as investors began to focus on stronger economic growth and the prospects of higher inflation. The Fed also took several aggressive actions to keep the bond markets running smoothly, implementing many of the relief programs that proved to be successful in helping end the global financial crisis in 2008-09.
Regarding your investments with PGIM, we believe it is important to maintain a diversified portfolio of funds consistent with your tolerance for risk, time horizon, and financial goals. Your financial advisor can help you create a diversified investment plan that may include funds covering all the basic asset classes and that reflects your personal investor profile and risk tolerance. However, diversification and asset allocation strategies do not assure a profit or protect against loss in declining markets.
At PGIM Investments, we consider it a great privilege and responsibility to help investors participate in opportunities across global markets while meeting their toughest investment challenges. PGIM is a top-10 global investment manager with more than $1.5 trillion in assets under management. This scale and investment expertise allow us to deliver actively managed funds and strategies to meet the needs of investors around the globe.
Thank you for choosing our family of funds.
Sincerely,

Stuart S. Parker, President
PGIM Select Real Estate Fund
December 15, 2021
| | |
| PGIM Select Real Estate Fund | | 3 |
Your Fund’s Performance (unaudited)
Performance data quoted represent past performance. Past performance does not guarantee future results. The investment return and principal value of an investment will fluctuate so that an investor’s shares, when redeemed, may be worth more or less than their original cost. Current performance may be lower or higher than the past performance data quoted. An investor may obtain performance data as of the most recent month-end by visiting our website at pgim.com/investments or by calling (800) 225-1852.
| | | | | | | | | | |
| |
| | | Average Annual Total Returns as of 10/31/21 | |
| | | |
| | | One Year (%) | | Five Years (%) | | Since Inception (%) |
| | | |
Class A | | | | | | | | | | |
| | | |
(with sales charges) | | 30.05 | | | 11.71 | | | | 9.08 (08/01/2014) | |
| | | |
(without sales charges) | | 37.61 | | | 12.98 | | | | 9.94 (08/01/2014) | |
| | | |
Class C | | | | | | | | | | |
| | | |
(with sales charges) | | 35.64 | | | 12.10 | | | | 9.10 (08/01/2014) | |
| | | |
(without sales charges) | | 36.64 | | | 12.10 | | | | 9.10 (08/01/2014) | |
| | | |
Class Z | | | | | | | | | | |
| | | |
(without sales charges) | | 38.04 | | | 13.23 | | | | 10.20 (08/01/2014) | |
| | | |
Class R6 | | | | | | | | | | |
| | | |
(without sales charges) | | 38.10 | | | 13.26 | | | | 10.21 (08/01/2014) | |
| | | |
FTSE EPRA/NAREIT Developed Index | | | | | | | | | | |
| | | |
| | 42.12 | | | 7.00 | | | | 5.60 | |
| | | |
S&P 500 Index | | | | | | | | | | |
| | | |
| | | 42.90 | | | 18.92 | | | | 14.95 | |
Since Inception returns are provided since the Fund has less than 10 fiscal years of returns. Since Inception returns for the Indexes are measured from the closest month-end to the Fund’s inception date.
| | |
| 4 | | Visit our website at pgim.com/investments |
Growth of a $10,000 Investment (unaudited)
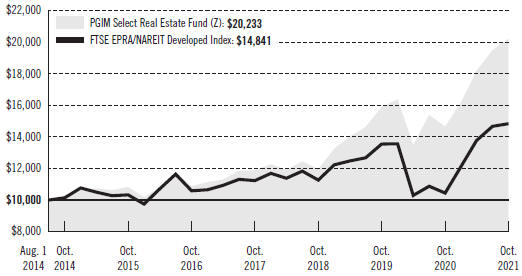
The graph compares a $10,000 investment in the Fund’s Class Z shares with a similar investment in the FTSE EPRA/NAREIT Developed Index, by portraying the initial account values at the commencement of operations for Class Z shares (August 1, 2014) and the account values at the end of the current fiscal year (October 31, 2021), as measured on a quarterly basis. For purposes of the graph, and unless otherwise indicated, it has been assumed that (a) all recurring fees (including management fees) were deducted and (b) all dividends and distributions were reinvested. The line graph provides information for Class Z shares only. As indicated in the tables provided earlier, performance for other share classes will vary due to the differing fees and expenses applicable to each share class (as indicated in the following paragraphs). Without waiver of fees and/or expense reimbursements, if any, the returns would have been lower.
Past performance does not predict future performance. Total returns and the ending account values in the graph include changes in share price and reinvestment of dividends and capital gains distributions in a hypothetical investment for the periods shown. The Fund’s total returns do not reflect the deduction of income taxes on an individual’s investment. Taxes may reduce your actual investment returns on income or gains paid by the Fund or any gains you may realize if you sell your shares.
| | |
| PGIM Select Real Estate Fund | | 5 |
Your Fund’s Performance (continued)
The returns in the tables do not reflect the deduction of taxes that a shareholder would pay on Fund distributions or following the redemption of Fund shares. The average annual total returns take into account applicable sales charges, which are described for each share class in the table below.
| | | | | | | | |
| | | | | |
| | | Class A | | Class C | | Class Z | | Class R6 |
| | | | | |
Maximum initial sales charge | | 5.50% of the public offering price | | None | | None | | None |
| | | | | |
| Contingent deferred sales charge (CDSC) (as a percentage of the lower of the original purchase price or the net asset value at redemption) | | 1.00% on sales of $1 million or more made within 12 months of purchase | | 1.00% on sales made within 12 months of purchase | | None | | None |
| | | | | |
| Annual distribution and service (12b-1) fees (shown as a percentage of average daily net assets) | | 0.30% (0.25% currently) | | 1.00% | | None | | None |
Benchmark Definitions
FTSE EPRA/NAREIT Developed Index—The Financial Times Stock Exchange European Public Real Estate Association/National Association of Real Estate Investment Trusts (FTSE EPRA/NAREIT) Developed Index reflects the stock performance of companies engaged in specific aspects of the major real estate markets/regions of the world.
S&P 500 Index*—The S&P 500 Index is an unmanaged index of over 500 stocks of large US public companies. It gives a broad look at how stock prices in the United States have performed.
*The S&P 500 Index (“Index”) is a product of S&P Dow Jones Indices LLC and/or its affiliates and has been licensed for use by PGIM, Inc. and/or its affiliates. Copyright © 2021 S&P Dow Jones Indices LLC, a division of S&P Global, Inc., and/or its affiliates. All rights reserved. Redistribution or reproduction in whole or in part are prohibited without written permission of S&P Dow Jones Indices LLC. For more information on any of S&P Dow Jones Indices LLC’s indices please visit www.spdji.com. S&P® is a registered trademark of S&P Global and Dow Jones® is a registered trademark of Dow Jones Trademark Holdings LLC.
Investors cannot invest directly in an index. The returns for the Indexes would be lower if they included the effects of sales charges, operating expenses of a mutual fund, or taxes that may be paid by an investor.
| | |
| 6 | | Visit our website at pgim.com/investments |
Presentation of Fund Holdings as of 10/31/21
| | | | |
| | |
| Ten Largest Holdings | | Real Estate Sectors | | % of Net Assets |
| | |
Prologis, Inc. | | Industrial REITs | | 6.9% |
| | |
Welltower, Inc. | | Health Care REITs | | 5.8% |
| | |
Life Storage, Inc. | | Specialized REITs | | 5.6% |
| | |
Equity Residential | | Residential REITs | | 4.9% |
| | |
Rexford Industrial Realty, Inc. | | Industrial REITs | | 4.3% |
| | |
Simon Property Group, Inc. | | Retail REITs | | 4.2% |
| | |
Camden Property Trust | | Residential REITs | | 4.0% |
| | |
American Homes 4 Rent (Class A Stock) | | Residential REITs | | 3.5% |
| | |
Essex Property Trust, Inc. | | Residential REITs | | 3.5% |
| | |
Segro PLC (United Kingdom) | | Industrial REITs | | 3.4% |
Holdings reflect only long-term investments and are subject to change.
| | |
| PGIM Select Real Estate Fund | | 7 |
Strategy and Performance Overview (unaudited)
How did the Fund perform?
The PGIM Select Real Estate Fund’s Class Z shares returned 38.04% in the 12-month reporting period that ended October 31, 2021, underperforming the 42.12% return of the FTSE EPRA/NAREIT Developed Index (the Index).
What were conditions like in the global real estate securities market?
| · | | Conditions in the US real estate investment trust (REIT) market during the reporting period can be characterized by a robust recovery in fundamentals following the devastating impact of the COVID-19 pandemic. After the US commercial real estate market experienced one of its worst years ever, Pfizer Inc. announced strong efficacy results for its COVID-19 vaccine in November 2020, which kicked off a massive recovery in fundamentals and stock valuations for the REIT sector. Overall, the US REIT market rallied more than 50% during the period, with some of the harder-hit sectors, such as strip malls and shopping malls, up more than 100%. A successful vaccination effort in the US, combined with record levels of government stimulus, resulted in a highly favorable operating environment for nearly every sector in the US REIT market. |
| · | | Europe’s US-dollar total return during the period was strongly positive at 33.8%, with COVID-19 vaccines helping the region’s economies start to recover from the pandemic. Europe was the second-best-performing global region during the period, ahead of Asia but trailing North America. The United Kingdom (UK) was the quickest country to implement a vaccination program, but other countries in continental Europe rolled out successful programs as well by the summer of 2021. Sweden was the best-performing European market during the period, as its economy benefited from a less-severe recession than other countries in the region. Sweden had resisted locking down its economy, and its companies enjoyed a strong profit rebound aided by record-low interest rates and higher leverage. France was the next-best performer, with its heavily discounted and dominant retail sector experiencing a strong bounce-back as the economy emerged from lockdown. The UK’s return exceeded the European average return for the period due to its early vaccine distribution and subsequent early emergence from lockdown. The weakest European markets during the period were Germany and Finland, both heavily dominated by the multifamily residential sector. Germany, the leading performer in Europe in 2020, lagged for most of 2021 as its residential sector struggled against regulation pressures and the headwind of anticipated interest rate tightening. |
| · | | Asia recovered moderately in 2021 as the market struggled to break out of numerous macro-economic, policy, and pandemic setbacks. In Japan, riskier sectors such as developers, hotel, and office REITs outperformed, benefiting from expectations of pandemic recovery. Despite numerous states of emergency, strong residential demand and relatively resilient office occupancy for the major developers helped solidify expectations of an earnings recovery. Hospitality JREITs (i.e., a REIT established in Japan) also outperformed during the period despite a slow recovery in their fundamentals. Japanese developers and REITs with a reopening tilt (i.e., hotel and office sectors) looked well-positioned for a strong recovery with the Liberal |
| | |
| 8 | | Visit our website at pgim.com/investments |
| | Democratic Party’s successful election and dwindling COVID-19 cases. Reopening was also a significant reason for outperformance in retail, office, and residential REITs in Australia. Residential REITs benefited from government subsidies for home purchases, while numerous retail tenants received mandated rent relief programs. Hong Kong commercial landlords also staged a meaningful recovery, as investors’ expectations reset from pandemic lockdowns to the eventual reopening of borders. Despite strong residential fundamentals in Hong Kong due to negative real interest rates and the lack of meaningful new supply, developers suffered from fears of the regulatory and policy tightening that affected numerous sectors in China. Investors also were concerned during the period about the financial distress of major Chinese developer China Evergrande Group, albeit these worries have abated somewhat due to some successful financing deals. In Singapore, domestic retail-centric REITs outperformed as the nation successfully vaccinated more than 80% of its population. |
What worked and didn’t work?
| · | | The Fund underperformed the Index during the reporting period. While North America outperformed, Europe and Asia underperformed on a relative basis, resulting in the Fund’s overall underperformance. |
| · | | Within North America, the US healthcare and net lease sectors made the most significant contribution to performance due to favorable security selection. Several other sectors also performed well, including data centers and storage. Data centers benefited due to an underweight position relative to the Index, as well as sound stock selection. The storage sector performed well due to positive stock selection. The specialty housing, office, and shopping centers sectors detracted from performance. |
| · | | Europe’s underperformance for the period was the result of weak stock picking in Sweden and the United Kingdom. An underweight exposure to France also negatively impacted the Fund. Strong stock selection in Belgium contributed to performance, as did a lack of exposure to Switzerland. |
| · | | The Asia Pacific region’s underperformance was driven by notably unfavorable stock selection in Hong Kong. |
Current outlook
| · | | PGIM Real Estate views the US REIT market as well positioned for the remainder of 2021 and into 2022. In PGIM Real Estate’s view, despite strong year-to-date performance, this market’s average implied capitalization rate (i.e., the rate of return expected to be generated on a real estate investment property) remains attractive at 4.5%, a roughly 310 basis points (bps) spread relative to the 10-year US Treasury yield. (One basis point equals 0.01%.) While this spread is consistent with the long-term average, given the current depressed net operating income (NOI) levels of most REITs, PGIM Real Estate expects this spread to compress much further before reverting to its long-term average. Despite some near-term disruption to NOI growth in certain sectors, PGIM Real Estate anticipates funds-from-operations per-share growth of 7.7% in 2021 and 9.7% in 2022 (Source: PGIM). In PGIM Real Estate’s view, the |
| | |
| PGIM Select Real Estate Fund | | 9 |
Strategy and Performance Overview (continued)
| | recent improvement in REITs’ equity valuations has allowed many REITs to issue new equity for acquisitions and development. A favorable cost of capital and a faster pace of economies reopening bode well for PGIM Real Estate’s higher near-term earnings expectations. Capital markets continue to be active in the REIT sector, with the market already witnessing eight REIT takeovers in 2021 across a variety of sectors, representing both public-to-public and take-private transactions. Attractive debt and equity capital, combined with a multi-year recovery outlook in fundamentals, is likely to keep private equity interest focused on additional REIT market opportunities, in PGIM Real Estate’s view. PGIM Real Estate remains diligent in its value-based investment process, emphasizing individual stock selection and looking to capitalize on sectors expected to benefit from economic reopening. PGIM Real Estate has increased its overweight allocation to the retail sectors (malls and shopping centers) on the expectation that robust consumer spending will boost fundamentals in 2021 and 2022. PGIM Real Estate has further increased its underweight allocation to data centers, given a challenged internal growth outlook and full valuation, while adding to the storage sector given the strong operating environment and upward valuation revisions. Finally, the Fund remains underweight relative to the Index to the office sector, given a challenging long-term growth outlook. |
| · | | Europe began ending remaining lockdown measures during the period that had been implemented by many countries in the region, as COVID-19 vaccinations gained momentum across the continent. More than 80% of the UK’s adult population was fully vaccinated at the end of the period, and most countries in continental Europe have largely caught up with the UK. The UK ended all remaining social distancing measures in the middle of July 2021, and continental European countries followed. While the spread of the Delta variant remains a concern, the hope is that an expected increase in cases during the winter can be managed with high vaccination rates, including booster shots. The UK REIT sector is trading around a 9% discount to its one-year forward net asset value (NAV), and continental Europe trades on a slightly lower NAV discount of 6%. However, there are wide divergences across individual sub-sectors, with retail trading at the highest discount and industrial/logistics at a significant premium. The UK trades at a 3.9% implied capitalization rate, an approximately 300-bps spread to 10-year UK bonds, while the continent trades at a 4.0% rate, a 420-bps spread to German 10-year government yields. Dividend yields on offer are still attractive at 2.7% in the UK and 3.1% on the continent. PGIM Real Estate retains a careful stance on the retail sector, given the structural challenges it still faces and the price recovery already seen in many retail shares. PGIM Real Estate has a broadly neutral weight relative to the Index in the offices sector and retains a preference for industrial/logistics and alternatives. PGIM Real Estate is still cautious on the German residential sector following the uncertain outcome of Germany’s federal elections at the end of September 2021 and the impact this could have on future regulation of the residential rental market there. |
| · | | PGIM Real Estate believes Asia should witness a more sustained recovery heading into 2022. The COVID-19 pandemic has ushered in a period of unprecedented global |
| | |
| 10 | | Visit our website at pgim.com/investments |
| | monetary easing and fiscal stimulus as countries cope with the economic fallout. As Asia emerges from the depths of the Delta variant, there is optimism ahead with a focus now on reopening and recovery. Sectors that witnessed a significant contraction in demand (e.g., hospitality and retail) will likely see a gradual recovery in the coming months, in PGIM Real Estate’s view. Equity market investors are also looking beyond the Federal Reserve’s expected tapering of its monthly bond purchases as the Fed also considers when it might start raising interest rates. This is somewhat complicated by the current market focus on supply-chain disruption leading to stagflation concerns. In PGIM Real Estate’s view, the following themes could be in focus in the near term: (1) recovery from the COVID-19 pandemic, (2) stagflation concerns, (3) bond yield spike on inflation expectations, (4) recovery in retail and hospitality, and (5) US-China geopolitical relations. PGIM Real Estate remains positive on the Australian manufacturing housing and self-storage sectors, with demographic and market consolidation trends providing structural tailwinds. PGIM Real Estate has a slightly underweight allocation relative to the Index to Hong Kong with a preference toward non-discretionary retail, and an overweight allocation relative to the Index to Japanese developers with a preference for retail and hospitality exposures that are levered to a bigger COVID-19 recovery. PGIM Real Estate also has an overweight allocation relative to the Index to JREITs with a preference for hospitality and diversified companies that could benefit from easing COVID-19 restrictions, and an overweight to logistic JREITs given their consistent drive for accretive acquisition growth. In Singapore, PGIM Real Estate has an underweight relative to the Index allocation to developers given a lack of growth catalysts and its preference for recovery opportunities in other countries. For REITs, PGIM Real Estate favors logistic and suburban retail companies that offer resilient demand. Markets are improving but global reopening remains fraught with the risk of a subsequent wave of COVID-19 outbreaks amid growing economic and social marginalization. The effectiveness of incremental vaccine delivery via booster shots and childrens’ vaccinations likely will shape domestic recovery and determine when borders might reopen, in PGIM Real Estate’s view. At the same time, a strong recovery in the US could stoke inflationary pressures beyond what many economists currently say is a transitory trend, which could raise expectations for interest rate hikes. Supply-chain concerns could also hamper growth while creating an inflation spiral. Within PGIM Real Estate’s individual sector holdings, a sharp rise in long-term real interest rates could negatively impact regional REIT valuations. |
| | |
| PGIM Select Real Estate Fund | | 11 |
Comments on Largest Holdings (unaudited)
7.0% Prologis, Inc., Industrial REITs
Prologis is an owner, operator, and developer of industrial real estate, focusing on global and regional markets across the Americas, Europe, and Asia. The company also leases modern distribution facilities to customers, including manufacturers, retailers, transportation companies, third-party logistics providers, and other enterprises.
5.7% Welltower, Inc., Healthcare REITs
Welltower invests in senior housing and healthcare real estate properties.
5.6% Life Storage, Inc., Specialized REITs
Life Storage acquires and manages self-storage properties in the US.
4.9% Equity Residential, Residential REITs
Equity Residential acquires, develops, and manages apartment complexes in the US.
4.3% Rexford Industrial Realty, Inc., Industrial REITs
Rexford acquires, owns, and operates industrial properties in southern California markets.
| | |
| 12 | | Visit our website at pgim.com/investments |
Fees and Expenses (unaudited)
As a shareholder of the Fund, you incur two types of costs: (1) transaction costs, including sales charges (loads) on purchase payments and redemptions, as applicable, and (2) ongoing costs, including management fees, distribution and/or service (12b-1) fees, and other Fund expenses, as applicable. This example is intended to help you understand your ongoing costs (in dollars) of investing in the Fund and to compare these costs with the ongoing costs of investing in other mutual funds.
The example is based on an investment of $1,000 held through the six-month period ended October 31, 2021. The example is for illustrative purposes only; you should consult the Prospectus for information on initial and subsequent minimum investment requirements.
Actual Expenses
The first line for each share class in the table on the following page provides information about actual account values and actual expenses. You may use the information on this line, together with the amount you invested, to estimate the expenses that you paid over the period. Simply divide your account value by $1,000 (for example, an $8,600 account value ÷ $1,000 = 8.6), then multiply the result by the number on the first line under the heading “Expenses Paid During the Six-Month Period” to estimate the expenses you paid on your account during this period.
Hypothetical Example for Comparison Purposes
The second line for each share class in the table on the following page provides information about hypothetical account values and hypothetical expenses based on the Fund’s actual expense ratio and an assumed rate of return of 5% per year before expenses, which is not the Fund’s actual return. The hypothetical account values and expenses may not be used to estimate the actual ending account balance or expenses you paid for the period. You may use this information to compare the ongoing costs of investing in the Fund and other funds. To do so, compare this 5% hypothetical example with the 5% hypothetical examples that appear in the shareholder reports of the other funds.
The Fund’s transfer agent may charge additional fees to holders of certain accounts that are not included in the expenses shown in the table on the following page. These fees apply to individual retirement accounts (IRAs) and Section 403(b) accounts. As of the close of the six-month period covered by the table, IRA fees included an annual maintenance fee of $15 per account (subject to a maximum annual maintenance fee of $25 for all accounts held by the same shareholder). Section 403(b) accounts are charged an annual $25 fiduciary maintenance fee. Some of the fees may vary in amount, or may be waived, based on your total account balance or the number of PGIM funds, including the Fund, that you own. You should consider the additional fees that were charged to your Fund account over the six-month period when you estimate the total ongoing expenses paid over the period and the impact of these fees on your ending account value, as these additional expenses are not reflected in the information
| | |
| PGIM Select Real Estate Fund | | 13 |
Fees and Expenses (continued)
provided in the expense table. Additional fees have the effect of reducing investment returns.
Please note that the expenses shown in the table are meant to highlight your ongoing costs only and do not reflect any transactional costs such as sales charges (loads). Therefore, the second line for each share class in the table is useful in comparing ongoing costs only and will not help you determine the relative total costs of owning different funds. In addition, if these transactional costs were included, your costs would have been higher.
| | | | | | | | | | | | |
| | | | | |
| PGIM Select Real Estate Fund | | Beginning Account Value May 1, 2021 | | Ending Account Value
October 31, 2021 | | Annualized Expense Ratio Based on the Six-Month Period | | Expenses Paid
During the Six-Month Period* |
| | | | | |
Class A | | Actual | | $1,000.00 | | $1,110.90 | | 1.30% | | | $ 6.92 | |
| | Hypothetical | | $1,000.00 | | $1,018.65 | | 1.30% | | | $ 6.61 | |
Class C | | Actual | | $1,000.00 | | $1,106.30 | | 2.05% | | | $10.88 | |
| | Hypothetical | | $1,000.00 | | $1,014.87 | | 2.05% | | | $10.41 | |
Class Z | | Actual | | $1,000.00 | | $1,112.40 | | 1.04% | | | $ 5.54 | |
| | Hypothetical | | $1,000.00 | | $1,019.96 | | 1.04% | | | $ 5.30 | |
Class R6 | | Actual | | $1,000.00 | | $1,112.50 | | 0.91% | | | $ 4.85 | |
| | | Hypothetical | | $1,000.00 | | $1,020.62 | | 0.91% | | | $ 4.63 | |
*Fund expenses (net of fee waivers or subsidies, if any) for each share class are equal to the annualized expense ratio for each share class (provided in the table), multiplied by the average account value over the period, multiplied by the 184 days in the six-month period ended October 31, 2021, and divided by the 365 days in the Fund’s fiscal year ended October 31, 2021 (to reflect the six-month period). Expenses presented in the table include the expenses of any underlying portfolios in which the Fund may invest.
| | |
| 14 | | Visit our website at pgim.com/investments |
Schedule of Investments
as of October 31, 2021
| | | | | | | | |
| | |
| Description | | Shares | | | Value | |
| | |
LONG-TERM INVESTMENTS 99.3% | | | | | | | | |
| | |
COMMON STOCKS | | | | | | | | |
| | |
Diversified Real Estate Activities 4.1% | | | | | | | | |
| | |
Sumitomo Realty & Development Co. Ltd. (Japan) | | | 251,922 | | | $ | 9,111,532 | |
Sun Hung Kai Properties Ltd. (Hong Kong) | | | 341,942 | | | | 4,545,527 | |
| | | | | | | | |
| | |
| | | | | | | 13,657,059 | |
| | |
Diversified REITs 5.4% | | | | | | | | |
| | |
Daiwa House REIT Investment Corp. (Japan) | | | 2,258 | | | | 6,490,082 | |
Essential Properties Realty Trust, Inc. | | | 206,524 | | | | 6,152,350 | |
Stockland (Australia) | | | 1,470,580 | | | | 5,046,431 | |
| | | | | | | | |
| | |
| | | | | | | 17,688,863 | |
| | |
Health Care REITs 5.8% | | | | | | | | |
| | |
Welltower, Inc. | | | 235,784 | | | | 18,957,034 | |
| | |
Hotel & Resort REITs 8.2% | | | | | | | | |
| | |
Invincible Investment Corp. (Japan) | | | 14,131 | | | | 5,597,874 | |
Japan Hotel REIT Investment Corp. (Japan) | | | 7,957 | | | | 4,817,188 | |
Park Hotels & Resorts, Inc.* | | | 321,728 | | | | 5,961,620 | |
Pebblebrook Hotel Trust | | | 281,600 | | | | 6,324,736 | |
Xenia Hotels & Resorts, Inc.* | | | 238,589 | | | | 4,246,884 | |
| | | | | | | | |
| | |
| | | | | | | 26,948,302 | |
| | |
Industrial REITs 19.4% | | | | | | | | |
| | |
Nippon Prologis REIT, Inc. (Japan) | | | 2,234 | | | | 7,459,931 | |
Prologis, Inc. | | | 157,731 | | | | 22,864,686 | |
Rexford Industrial Realty, Inc. | | | 209,815 | | | | 14,099,568 | |
Segro PLC (United Kingdom) | | | 640,465 | | | | 11,338,312 | |
Summit Industrial Income REIT (Canada) | | | 220,037 | | | | 4,203,034 | |
Tritax Big Box REIT PLC (United Kingdom) | | | 1,280,071 | | | | 3,943,923 | |
| | | | | | | | |
| | |
| | | | | | | 63,909,454 | |
| | |
Railroads 1.2% | | | | | | | | |
| | |
Seibu Holdings, Inc. (Japan)* | | | 357,234 | | | | 3,898,843 | |
| | |
Real Estate Operating Companies 8.2% | | | | | | | | |
| | |
Kojamo OYJ (Finland) | | | 285,122 | | | | 6,385,926 | |
Pandox AB (Sweden)* | | | 386,416 | | | | 6,817,309 | |
VGP NV (Belgium) | | | 27,201 | | | | 7,049,948 | |
| | |
| See Notes to Financial Statements. |
| PGIM Select Real Estate Fund | | 15 |
Schedule of Investments (continued)
as of October 31, 2021
| | | | | | | | |
| | |
| Description | | Shares | | | Value | |
| | |
COMMON STOCKS (Continued) | | | | | | | | |
| | |
Real Estate Operating Companies (cont’d.) | | | | | | | | |
| | |
Vonovia SE (Germany) | | | 73,009 | | | $ | 4,426,527 | |
Wharf Real Estate Investment Co. Ltd. (Hong Kong) | | | 427,311 | | | | 2,414,204 | |
| | | | | | | | |
| | |
| | | | | | | 27,093,914 | |
| | |
Residential REITs 19.8% | | | | | | | | |
| | |
American Homes 4 Rent (Class A Stock) | | | 285,313 | | | | 11,583,708 | |
Camden Property Trust | | | 81,076 | | | | 13,223,496 | |
Equity Residential | | | 185,109 | | | | 15,993,417 | |
Essex Property Trust, Inc. | | | 33,509 | | | | 11,390,714 | |
Ingenia Communities Group (Australia) | | | 977,135 | | | | 4,791,470 | |
InterRent Real Estate Investment Trust (Canada) | | | 396,678 | | | | 5,811,063 | |
Invitation Homes, Inc. | | | 52,799 | | | | 2,177,959 | |
| | | | | | | | |
| | |
| | | | | | | 64,971,827 | |
| | |
Retail REITs 13.4% | | | | | | | | |
| | |
Acadia Realty Trust | | | 287,353 | | | | 6,143,607 | |
Capital & Counties Properties PLC (United Kingdom) | | | 2,115,625 | | | | 4,786,380 | |
Kimco Realty Corp. | | | 276,132 | | | | 6,240,583 | |
Link REIT (Hong Kong) | | | 611,122 | | | | 5,426,076 | |
Phillips Edison & Co., Inc. | | | 101,192 | | | | 3,049,927 | |
Simon Property Group, Inc. | | | 95,024 | | | | 13,928,618 | |
Unibail-Rodamco-Westfield (France)* | | | 60,637 | | | | 4,335,705 | |
| | | | | | | | |
| | |
| | | | | | | 43,910,896 | |
| | |
Specialized REITs 13.8% | | | | | | | | |
| | |
Big Yellow Group PLC (United Kingdom) | | | 177,848 | | | | 3,611,154 | |
Digital Realty Trust, Inc. | | | 49,950 | | | | 7,882,609 | |
EPR Properties | | | 118,652 | | | | 5,957,517 | |
Life Storage, Inc. | | | 137,207 | | | | 18,359,669 | |
MGM Growth Properties LLC (Class A Stock) | | | 100,376 | | | | 3,952,807 | |
National Storage REIT (Australia) | | | 3,088,879 | | | | 5,563,831 | |
| | | | | | | | |
| | |
| | | | | | | 45,327,587 | |
| | | | | | | | |
| | |
TOTAL LONG-TERM INVESTMENTS | | | | | | | | |
(cost $291,713,913) | | | | | | | 326,363,779 | |
| | | | | | | | |
|
See Notes to Financial Statements. 16 |
| | | | | | | | |
| | |
| Description | | Shares | | | Value | |
| | |
SHORT-TERM INVESTMENT 0.9% | | | | | | | | |
| | |
AFFILIATED MUTUAL FUND | | | | | | | | |
PGIM Core Ultra Short Bond Fund
(cost $2,866,302)(wa) | | | 2,866,302 | | | $ | 2,866,302 | |
| | | | | | | | |
| | |
TOTAL INVESTMENTS 100.2% | | | | | | | | |
(cost $294,580,215) | | | | | | | 329,230,081 | |
Liabilities in excess of other assets (0.2)% | | | | | | | (722,686 | ) |
| | | | | | | | |
| | |
NET ASSETS 100.0% | | | | | | $ | 328,507,395 | |
| | | | | | | | |
Below is a list of the abbreviation(s) used in the annual report:
LIBOR—London Interbank Offered Rate
REITs—Real Estate Investment Trust
| * | Non-income producing security. |
| (wa) | PGIM Investments LLC, the manager of the Fund, also serves as manager of the PGIM Core Ultra Short Bond Fund and PGIM Institutional Money Market Fund, if applicable. |
Fair Value Measurements:
Various inputs are used in determining the value of the Fund’s investments. These inputs are summarized in the three broad levels listed below.
Level 1—unadjusted quoted prices generally in active markets for identical securities.
Level 2—quoted prices for similar securities, interest rates and yield curves, prepayment speeds, foreign currency exchange rates and other observable inputs.
Level 3—unobservable inputs for securities valued in accordance with Board approved fair valuation procedures.
The following is a summary of the inputs used as of October 31, 2021 in valuing such portfolio securities:
| | | | | | | | | | | | |
| | | Level 1 | | | Level 2 | | | Level 3 |
Investments in Securities | | | | | | | | | | | | |
Assets | | | | | | | | | | | | |
Long-Term Investments | | | | | | | | | | | | |
Common Stocks | | | | | | | | | | | | |
Australia | | $ | — | | | $ | 15,401,732 | | | | $— | |
Belgium | | | — | | | | 7,049,948 | | | | — | |
Canada | | | 10,014,097 | | | | — | | | | — | |
Finland | | | — | | | | 6,385,926 | | | | — | |
France | | | — | | | | 4,335,705 | | | | — | |
Germany | | | — | | | | 4,426,527 | | | | — | |
Hong Kong | | | — | | | | 12,385,807 | | | | — | |
Japan | | | — | | | | 37,375,450 | | | | — | |
Sweden | | | — | | | | 6,817,309 | | | | — | |
United Kingdom | | | — | | | | 23,679,769 | | | | — | |
United States | | | 198,491,509 | | | | — | | | | — | |
| | |
| See Notes to Financial Statements. |
| PGIM Select Real Estate Fund | | 17 |
Schedule of Investments (continued)
as of October 31, 2021
| | | | | | | | | | | | |
| | | Level 1 | | | Level 2 | | | Level 3 |
Investments in Securities (continued) | | | | | | | | | | | | |
| | | |
Assets (continued) | | | | | | | | | | | | |
Short-Term Investment | | | | | | | | | | | | |
Affiliated Mutual Fund | | $ | 2,866,302 | | | $ | — | | | | $— | |
| | | | | | | | | | | | |
| | | |
Total | | $ | 211,371,908 | | | $ | 117,858,173 | | | | $— | |
| | | | | | | | | | | | |
Sector Classification:
The sector classification of investments and liabilities in excess of other assets shown as a percentage of net assets as of October 31, 2021 were as follows (unaudited):
| | | | |
Residential REITs | | | 19.8 | % |
Industrial REITs | | | 19.4 | |
Specialized REITs | | | 13.8 | |
Retail REITs | | | 13.4 | |
Hotel & Resort REITs | | | 8.2 | |
Real Estate Operating Companies | | | 8.2 | |
Health Care REITs | | | 5.8 | |
Diversified REITs | | | 5.4 | |
| | | | |
Diversified Real Estate Activities | | | 4.1 | % |
Railroads | | | 1.2 | |
Affiliated Mutual Fund | | | 0.9 | |
| | | | |
| |
| | | 100.2 | |
Liabilities in excess of other assets | | | (0.2 | ) |
| | | | |
| |
| | | 100.0 | % |
| | | | |
|
See Notes to Financial Statements. 18 |
Statement of Assets and Liabilities
as of October 31, 2021
| | | | |
| |
Assets | | | | |
| |
Investments at value: | | | | |
Unaffiliated investments (cost $291,713,913) | | $ | 326,363,779 | |
Affiliated investments (cost $2,866,302) | | | 2,866,302 | |
Foreign currency, at value (cost $16,062) | | | 15,902 | |
Receivable for Fund shares sold | | | 2,060,969 | |
Receivable for investments sold | | | 980,515 | |
Dividends receivable | | | 183,422 | |
Tax reclaim receivable | | | 63,538 | |
Prepaid expenses | | | 1,791 | |
| | | | |
Total Assets | | | 332,536,218 | |
| | | | |
| |
Liabilities | | | | |
| |
Payable for investments purchased | | | 2,585,608 | |
Payable for Fund shares purchased | | | 1,129,634 | |
Management fee payable | | | 220,394 | |
Accrued expenses and other liabilities | | | 87,969 | |
Distribution fee payable | | | 2,599 | |
Affiliated transfer agent fee payable | | | 1,539 | |
Trustees’ fees payable | | | 1,080 | |
| | | | |
Total Liabilities | | | 4,028,823 | |
| | | | |
| |
Net Assets | | $ | 328,507,395 | |
| | | | |
| |
| | | | | |
| |
Net assets were comprised of: | | | | |
Shares of beneficial interest, at par | | $ | 21,212 | |
Paid-in capital in excess of par | | | 284,210,455 | |
Total distributable earnings (loss) | | | 44,275,728 | |
| | | | |
Net assets, October 31, 2021 | | $ | 328,507,395 | |
| | | | |
| | |
| See Notes to Financial Statements. |
| PGIM Select Real Estate Fund | | 19 |
Statement of Assets and Liabilities
as of October 31, 2021
| | | | | | | | | | |
| | |
Class A | | | | | | | | |
| | |
Net asset value and redemption price per share, ($6,732,704 ÷ 433,338 shares of beneficial interest issued and outstanding) | | $ | 15.54 | | | | | |
Maximum sales charge (5.50% of offering price) | | | 0.90 | | | | | |
| | | | | | | | | | |
| | |
Maximum offering price to public | | $ | 16.44 | | | | | |
| | | | | | | | | | |
| | |
Class C | | | | | | | | |
| | |
Net asset value, offering price and redemption price per share, ($1,636,248 ÷ 106,706 shares of beneficial interest issued and outstanding) | | $ | 15.33 | | | | | |
| | | | | | | | | | |
| | |
Class Z | | | | | | | | |
| | |
Net asset value, offering price and redemption price per share, ($226,285,601 ÷ 14,542,088 shares of beneficial interest issued and outstanding) | | $ | 15.56 | | | | | |
| | | | | | | | | | |
| | |
Class R6 | | | | | | | | |
| | |
Net asset value, offering price and redemption price per share, ($93,852,842 ÷ 6,130,118 shares of beneficial interest issued and outstanding) | | $ | 15.31 | | | | | |
| | | | | | | | | | |
|
See Notes to Financial Statements. 20 |
Statement of Operations
Year Ended October 31, 2021
| | | | |
| |
Net Investment Income (Loss) | | | | |
| |
Income | | | | |
Unaffiliated dividend income (net of $139,494 foreign withholding tax) | | $ | 3,752,802 | |
Affiliated dividend income | | | 4,710 | |
Income from securities lending, net (including affiliated income of $21) | | | 30 | |
| | | | |
| |
Total income | | | 3,757,542 | |
| | | | |
| |
Expenses | | | | |
Management fee | | | 1,525,192 | |
Distribution fee(a) | | | 24,617 | |
Transfer agent’s fees and expenses (including affiliated expense of $7,481)(a) | | | 156,395 | |
Custodian and accounting fees | | | 100,475 | |
Registration fees(a) | | | 59,089 | |
Audit fee | | | 33,803 | |
Legal fees and expenses | | | 20,889 | |
Shareholders’ reports | | | 12,689 | |
Trustees’ fees | | | 11,820 | |
Miscellaneous | | | 21,112 | |
| | | | |
| |
Total expenses | | | 1,966,081 | |
| |
Less: Fee waiver and/or expense reimbursement(a) | | | (19,702 | ) |
Distribution fee waiver(a) | | | (2,402 | ) |
| | | | |
| |
Net expenses | | | 1,943,977 | |
| | | | |
| |
Net investment income (loss) | | | 1,813,565 | |
| | | | |
| |
Realized And Unrealized Gain (Loss) On Investment And Foreign Currency Transactions | | | | |
| |
Net realized gain (loss) on: | | | | |
Investment transactions (including affiliated of $49) | | | 14,126,786 | |
Foreign currency transactions | | | (38,979 | ) |
| | | | |
| |
| | | 14,087,807 | |
| | | | |
Net change in unrealized appreciation (depreciation) on: | | | | |
Investments | | | 32,755,017 | |
Foreign currencies | | | (6,617 | ) |
| | | | |
| |
| | | 32,748,400 | |
| | | | |
| |
Net gain (loss) on investment and foreign currency transactions | | | 46,836,207 | |
| | | | |
| |
Net Increase (Decrease) In Net Assets Resulting From Operations | | $ | 48,649,772 | |
| | | | |
| (a) | Class specific expenses and waivers were as follows: |
| | | | | | | | | | | | | | | | |
| | | Class A | | | Class C | | | Class Z | | | Class R6 | |
Distribution fee | | | 14,410 | | | | 10,207 | | | | — | | | | — | |
Transfer agent’s fees and expenses | | | 6,403 | | | | 1,420 | | | | 148,142 | | | | 430 | |
Registration fees | | | 10,325 | | | | 9,150 | | | | 21,824 | | | | 17,790 | |
Fee waiver and/or expense reimbursement | | | (10,543) | | | | (9,159) | | | | — | | | | — | |
Distribution fee waiver | | | (2,402) | | | | — | | | | — | | | | — | |
| | |
| See Notes to Financial Statements. |
| PGIM Select Real Estate Fund | | 21 |
Statements of Changes in Net Assets
| | | | | | | | |
| |
| | | Year Ended October 31, | |
| | |
| | | 2021 | | | 2020 | |
| | |
Increase (Decrease) in Net Assets | | | | | | | | |
| | |
Operations | | | | | | | | |
Net investment income (loss) | | $ | 1,813,565 | | | $ | 509,865 | |
Net realized gain (loss) on investment and foreign currency transactions | | | 14,087,807 | | | | (3,157,913 | ) |
Net change in unrealized appreciation (depreciation) on investments and foreign currencies | | | 32,748,400 | | | | (896,188 | ) |
| | | | | | | | |
| | |
Net increase (decrease) in net assets resulting from operations | | | 48,649,772 | | | | (3,544,236 | ) |
| | | | | | | | |
| | |
Dividends and Distributions | | | | | | | | |
Distributions from distributable earnings | | | | | | | | |
Class A | | | (70,197 | ) | | | (249,514 | ) |
Class C | | | (5,910 | ) | | | (22,861 | ) |
Class Z | | | (1,699,095 | ) | | | (568,118 | ) |
Class R6 | | | (918,302 | ) | | | (959,853 | ) |
| | | | | | | | |
| | |
| | | (2,693,504 | ) | | | (1,800,346 | ) |
| | | | | | | | |
Fund share transactions (Net of share conversions) | | | | | | | | |
Net proceeds from shares sold | | | 269,891,981 | | | | 41,530,766 | |
Net asset value of shares issued in reinvestment of dividends and distributions | | | 2,689,833 | | | | 1,798,710 | |
Cost of shares purchased | | | (39,255,864 | ) | | | (17,061,180 | ) |
| | | | | | | | |
| | |
Net increase (decrease) in net assets from Fund share transactions | | | 233,325,950 | | | | 26,268,296 | |
| | | | | | | | |
| | |
Total increase (decrease) | | | 279,282,218 | | | | 20,923,714 | |
| | |
Net Assets: | | | | | | | | |
| | |
Beginning of year | | | 49,225,177 | | | | 28,301,463 | |
| | | | | | | | |
| | |
End of year | | $ | 328,507,395 | | | $ | 49,225,177 | |
| | | | | | | | |
|
See Notes to Financial Statements. 22 |
Financial Highlights
| | | | | | | | | | | | | | | | | | | | |
| Class A Shares | | | | | | | | | | | | | | | | | | | | |
| | | Year Ended October 31, | |
| | | 2021 | | | 2020 | | | 2019 | | | 2018 | | | 2017 | |
| | | | | | |
| Per Share Operating Performance(a): | | | | | | | | | | | | | | | | | | | | |
| Net Asset Value, Beginning of Year | | | $11.48 | | | | $13.18 | | | | $10.33 | | | | $10.54 | | | | $10.00 | |
| Income (loss) from investment operations: | | | | | | | | | | | | | | | | | | | | |
| Net investment income (loss) | | | 0.10 | | | | 0.15 | | | | 0.16 | | | | 0.12 | | | | 0.12 | |
| Net realized and unrealized gain (loss) on investment and foreign currency transactions | | | 4.18 | | | | (1.16 | ) | | | 3.10 | | | | (0.08 | ) | | | 0.76 | |
| Total from investment operations | | | 4.28 | | | | (1.01 | ) | | | 3.26 | | | | 0.04 | | | | 0.88 | |
| Less Dividends and Distributions: | | | | | | | | | | | | | | | | | | | | |
| Dividends from net investment income | | | (0.22 | ) | | | (0.43 | ) | | | (0.21 | ) | | | (0.25 | ) | | | (0.11 | ) |
| Distributions from net realized gains | | | - | | | | (0.26 | ) | | | (0.20 | ) | | | - | | | | (0.23 | ) |
| Total dividends and distributions | | | (0.22 | ) | | | (0.69 | ) | | | (0.41 | ) | | | (0.25 | ) | | | (0.34 | ) |
| Net asset value, end of year | | | $15.54 | | | | $11.48 | | | | $13.18 | | | | $10.33 | | | | $10.54 | |
| Total Return(b): | | | 37.61 | % | | | (7.90 | )% | | | 32.64 | % | | | 0.37 | % | | | 9.08 | % |
| | | | | | | | | | | | | | | | | | | | | |
| Ratios/Supplemental Data: | | | | | | | | | | | | | | | | | | | | |
| Net assets, end of year (000) | | | $6,733 | | | | $3,878 | | | | $4,447 | | | | $2,612 | | | | $256 | |
| Average net assets (000) | | | $4,803 | | | | $4,534 | | | | $3,205 | | | | $1,645 | | | | $242 | |
| Ratios to average net assets(c)(d): | | | | | | | | | | | | | | | | | | | | |
| Expenses after waivers and/or expense reimbursement | | | 1.30 | % | | | 1.30 | % | | | 1.30 | % | | | 1.30 | % | | | 1.30 | % |
| Expenses before waivers and/or expense reimbursement | | | 1.57 | % | | | 2.11 | % | | | 3.04 | % | | | 4.02 | % | | | 4.63 | % |
| Net investment income (loss) | | | 0.74 | % | | | 1.26 | % | | | 1.36 | % | | | 1.14 | % | | | 1.15 | % |
| Portfolio turnover rate(e) | | | 165 | % | | | 313 | % | | | 242 | % | | | 202 | % | | | 142 | % |
| (a) | Calculated based on average shares outstanding during the year. |
| (b) | Total return does not consider the effects of sales loads. Total return is calculated assuming a purchase of a share on the first day and a sale on the last day of each year reported and includes reinvestment of dividends and distributions, if any. Total returns may reflect adjustments to conform to GAAP. |
| (c) | Does not include expenses of the underlying funds in which the Fund invests. |
| (d) | Effective November 1, 2017, class specific expenses include transfer agent fees and expenses and registration fees, which are charged to their respective share class. |
| (e) | The Fund’s portfolio turnover rate is calculated in accordance with regulatory requirements, without regard to transactions involving short-term investments and certain derivatives. If such transactions were included, the Fund’s portfolio turnover rate may be higher. |
| | |
| See Notes to Financial Statements. |
| PGIM Select Real Estate Fund | | 23 |
Financial Highlights (continued)
| | | | | | | | | | | | | | | | | | | | |
| Class C Shares | | | | | | | | | | | | | | | | | | | | |
| | | Year Ended October 31, | |
| | | 2021 | | | 2020 | | | 2019 | | | 2018 | | | 2017 | |
| | | | | | |
| Per Share Operating Performance(a): | | | | | | | | | | | | | | | | | | | | |
| Net Asset Value, Beginning of Year | | | $11.35 | | | | $13.03 | | | | $10.23 | | | | $10.44 | | | | $9.94 | |
| Income (loss) from investment operations: | | | | | | | | | | | | | | | | | | | | |
| Net investment income (loss) | | | (0.01 | )(b) | | | 0.06 | | | | 0.06 | | | | 0.09 | | | | 0.04 | |
| Net realized and unrealized gain (loss) on investment and foreign currency transactions | | | 4.12 | | | | (1.13 | ) | | | 3.08 | | | | (0.12 | ) | | | 0.75 | |
| Total from investment operations | | | 4.11 | | | | (1.07 | ) | | | 3.14 | | | | (0.03 | ) | | | 0.79 | |
| Less Dividends and Distributions: | | | | | | | | | | | | | | | | | | | | |
| Dividends from net investment income | | | (0.13 | ) | | | (0.35 | ) | | | (0.14 | ) | | | (0.18 | ) | | | (0.06 | ) |
| Distributions from net realized gains | | | - | | | | (0.26 | ) | | | (0.20 | ) | | | - | | | | (0.23 | ) |
| Total dividends and distributions | | | (0.13 | ) | | | (0.61 | ) | | | (0.34 | ) | | | (0.18 | ) | | | (0.29 | ) |
| Net asset value, end of year | | | $15.33 | | | | $11.35 | | | | $13.03 | | | | $10.23 | | | | $10.44 | |
| Total Return(c): | | | 36.64 | % | | | (8.60 | )% | | | 31.59 | % | | | (0.34 | )% | | | 8.11 | % |
| | | | | | | | | | | | | | | | | | | | | |
| Ratios/Supplemental Data: | | | | | | | | | | | | | | | | | | | | |
| Net assets, end of year (000) | | | $1,636 | | | | $605 | | | | $351 | | | | $56 | | | | $69 | |
| Average net assets (000) | | | $1,021 | | | | $532 | | | | $148 | | | | $64 | | | | $70 | |
| Ratios to average net assets(d)(e): | | | | | | | | | | | | | | | | | | | | |
| Expenses after waivers and/or expense reimbursement | | | 2.05 | % | | | 2.05 | % | | | 2.05 | % | | | 2.05 | % | | | 2.05 | % |
| Expenses before waivers and/or expense reimbursement | | | 2.95 | % | | | 5.31 | % | | | 11.73 | % | | | 29.08 | % | | | 5.33 | % |
| Net investment income (loss) | | | (0.06 | )% | | | 0.55 | % | | | 0.54 | % | | | 0.91 | % | | | 0.36 | % |
| Portfolio turnover rate(f) | | | 165 | % | | | 313 | % | | | 242 | % | | | 202 | % | | | 142 | % |
| (a) | Calculated based on average shares outstanding during the year. |
| (b) | The per share amount of net investment income (loss) does not directly correlate to the amounts reported in the Statement of Operations due to class specific expenses. |
| (c) | Total return does not consider the effects of sales loads. Total return is calculated assuming a purchase of a share on the first day and a sale on the last day of each year reported and includes reinvestment of dividends and distributions, if any. Total returns may reflect adjustments to conform to GAAP. |
| (d) | Does not include expenses of the underlying funds in which the Fund invests. |
| (e) | Effective November 1, 2017, class specific expenses include transfer agent fees and expenses and registration fees, which are charged to their respective share class. |
| (f) | The Fund’s portfolio turnover rate is calculated in accordance with regulatory requirements, without regard to transactions involving short-term investments and certain derivatives. If such transactions were included, the Fund’s portfolio turnover rate may be higher. |
See Notes to Financial Statements.
| | | | | | | | | | | | | | | | | | | | |
| Class Z Shares | | | | | | | | | | | | | | | | | | | | |
| | | Year Ended October 31, | |
| | | 2021 | | | 2020 | | | 2019 | | | 2018 | | | 2017 | |
| | | | | | |
| Per Share Operating Performance(a): | | | | | | | | | | | | | | | | | | | | |
| Net Asset Value, Beginning of Year | | | $11.49 | | | | $13.20 | | | | $10.34 | | | | $10.56 | | | | $10.02 | |
| Income (loss) from investment operations: | | | | | | | | | | | | | | | | | | | | |
| Net investment income (loss) | | | 0.13 | | | | 0.16 | | | | 0.19 | | | | 0.22 | | | | 0.15 | |
| Net realized and unrealized gain (loss) on investment and foreign currency transactions | | | 4.19 | | | | (1.15 | ) | | | 3.11 | | | | (0.16 | ) | | | 0.76 | |
| Total from investment operations | | | 4.32 | | | | (0.99 | ) | | | 3.30 | | | | 0.06 | | | | 0.91 | |
| Less Dividends and Distributions: | | | | | | | | | | | | | | | | | | | | |
| Dividends from net investment income | | | (0.25 | ) | | | (0.46 | ) | | | (0.24 | ) | | | (0.28 | ) | | | (0.14 | ) |
| Distributions from net realized gains | | | - | | | | (0.26 | ) | | | (0.20 | ) | | | - | | | | (0.23 | ) |
| Total dividends and distributions | | | (0.25 | ) | | | (0.72 | ) | | | (0.44 | ) | | | (0.28 | ) | | | (0.37 | ) |
| Net asset value, end of year | | | $15.56 | | | | $11.49 | | | | $13.20 | | | | $10.34 | | | | $10.56 | |
| Total Return(b): | | | 38.04 | % | | | (7.73 | )% | | | 33.02 | % | | | 0.51 | % | | | 9.32 | % |
| | | | | | | | | | | | | | | | | | | | | |
| Ratios/Supplemental Data: | | | | | | | | | | | | | | | | | | | | |
| Net assets, end of year (000) | | | $226,286 | | | | $29,056 | | | | $6,366 | | | | $65 | | | | $154 | |
| Average net assets (000) | | | $126,992 | | | | $14,227 | | | | $1,621 | | | | $145 | | | | $148 | |
| Ratios to average net assets(c)(d): | | | | | | | | | | | | | | | | | | | | |
| Expenses after waivers and/or expense reimbursement | | | 1.04 | % | | | 1.05 | % | | | 1.05 | % | | | 1.05 | % | | | 1.05 | % |
| Expenses before waivers and/or expense reimbursement | | | 1.04 | % | | | 1.61 | % | | | 2.85 | % | | | 14.17 | % | | | 4.35 | % |
| Net investment income (loss) | | | 0.92 | % | | | 1.40 | % | | | 1.48 | % | | | 2.07 | % | | | 1.43 | % |
| Portfolio turnover rate(e) | | | 165 | % | | | 313 | % | | | 242 | % | | | 202 | % | | | 142 | % |
| (a) | Calculated based on average shares outstanding during the year. |
| (b) | Total return is calculated assuming a purchase of a share on the first day and a sale on the last day of each year reported and includes reinvestment of dividends and distributions, if any. Total returns may reflect adjustments to conform to GAAP. |
| (c) | Does not include expenses of the underlying funds in which the Fund invests. |
| (d) | Effective November 1, 2017, class specific expenses include transfer agent fees and expenses and registration fees, which are charged to their respective share class. |
| (e) | The Fund’s portfolio turnover rate is calculated in accordance with regulatory requirements, without regard to transactions involving short-term investments and certain derivatives. If such transactions were included, the Fund’s portfolio turnover rate may be higher. |
| | |
| See Notes to Financial Statements. |
| PGIM Select Real Estate Fund | | 25 |
Financial Highlights (continued)
| | | | | | | | | | | | | | | | | | | | |
| Class R6 Shares | | | | | | | | | | | | | | | | | | | | |
| | | Year Ended October 31, | |
| | | 2021 | | | 2020 | | | 2019 | | | 2018 | | | 2017 | |
| | | | | | |
| Per Share Operating Performance(a): | | | | | | | | | | | | | | | | | | | | |
| Net Asset Value, Beginning of Year | | | $11.31 | | | | $13.00 | | | | $10.19 | | | | $10.40 | | | | $9.88 | |
| Income (loss) from investment operations: | | | | | | | | | | | | | | | | | | | | |
| Net investment income (loss) | | | 0.15 | | | | 0.18 | | | | 0.18 | | | | 0.20 | | | | 0.14 | |
| Net realized and unrealized gain (loss) on investment and foreign currency transactions | | | 4.11 | | | | (1.15 | ) | | | 3.07 | | | | (0.13 | ) | | | 0.75 | |
| Total from investment operations | | | 4.26 | | | | (0.97 | ) | | | 3.25 | | | | 0.07 | | | | 0.89 | |
| Less Dividends and Distributions: | | | | | | | | | | | | | | | | | | | | |
| Dividends from net investment income | | | (0.26 | ) | | | (0.46 | ) | | | (0.24 | ) | | | (0.28 | ) | | | (0.14 | ) |
| Distributions from net realized gains | | | - | | | | (0.26 | ) | | | (0.20 | ) | | | - | | | | (0.23 | ) |
| Total dividends and distributions | | | (0.26 | ) | | | (0.72 | ) | | | (0.44 | ) | | | (0.28 | ) | | | (0.37 | ) |
| Net asset value, end of year | | | $15.31 | | | | $11.31 | | | | $13.00 | | | | $10.19 | | | | $10.40 | |
| Total Return(b): | | | 38.10 | % | | | (7.70 | )% | | | 33.02 | % | | | 0.62 | % | | | 9.25 | % |
| | | | | | | | | | | | | | | | | | | | | |
| Ratios/Supplemental Data: | | | | | | | | | | | | | | | | | | | | |
| Net assets, end of year (000) | | | $93,853 | | | | $15,686 | | | | $17,138 | | | | $5,970 | | | | $5,932 | |
| Average net assets (000) | | | $57,833 | | | | $16,060 | | | | $8,739 | | | | $6,039 | | | | $5,687 | |
| Ratios to average net assets(c)(d): | | | | | | | | | | | | | | | | | | | | |
| Expenses after waivers and/or expense reimbursement | | | 0.94 | % | | | 1.05 | % | | | 1.05 | % | | | 1.05 | % | | | 1.05 | % |
| Expenses before waivers and/or expense reimbursement | | | 0.94 | % | | | 1.42 | % | | | 2.25 | % | | | 3.07 | % | | | 4.02 | % |
| Net investment income (loss) | | | 1.06 | % | | | 1.56 | % | | | 1.56 | % | | | 1.89 | % | | | 1.42 | % |
| Portfolio turnover rate(e) | | | 165 | % | | | 313 | % | | | 242 | % | | | 202 | % | | | 142 | % |
| (a) | Calculated based on average shares outstanding during the year. |
| (b) | Total return is calculated assuming a purchase of a share on the first day and a sale on the last day of each year reported and includes reinvestment of dividends and distributions, if any. Total returns may reflect adjustments to conform to GAAP. |
| (c) | Does not include expenses of the underlying funds in which the Fund invests. |
| (d) | Effective November 1, 2017, class specific expenses include transfer agent fees and expenses and registration fees, which are charged to their respective share class. |
| (e) | The Fund’s portfolio turnover rate is calculated in accordance with regulatory requirements, without regard to transactions involving short-term investments and certain derivatives. If such transactions were included, the Fund’s portfolio turnover rate may be higher. |
See Notes to Financial Statements.
Notes to Financial Statements
Prudential Investment Portfolios 9 (the “Registered Investment Company” or “RIC”) is registered under the Investment Company Act of 1940, as amended (“1940 Act”), as an open-end management investment company. The RIC is organized as a Delaware Statutory Trust and currently consists of five separate funds: PGIM Absolute Return Bond Fund, PGIM International Bond Fund, PGIM QMA Large-Cap Core Equity Fund, PGIM Real Estate Income Fund and PGIM Select Real Estate Fund. These financial statements relate only to the PGIM Select Real Estate Fund (the “Fund”). The Fund is classified as a diversified fund for purposes of the 1940 Act.
The investment objective of the Fund is to seek income and capital appreciation.
The Fund follows the investment company accounting and reporting guidance of the Financial Accounting Standards Board (“FASB”) Accounting Standard Codification (“ASC”) Topic 946 Financial Services — Investment Companies. The following is a summary of significant accounting policies followed by the Fund in the preparation of its financial statements. The policies conform to U.S. generally accepted accounting principles (“GAAP”). The Fund consistently follows such policies in the preparation of its financial statements.
Securities Valuation: The Fund holds securities and other assets and liabilities that are fair valued as of the close of each day (generally, 4:00 PM Eastern time) the New York Stock Exchange (“NYSE”) is open for trading. As described in further detail below, the Fund’s investments are valued daily based on a number of factors, including the type of investment and whether market quotations are readily available. The RIC’s Board of Trustees (the “Board”) has adopted valuation procedures for security valuation under which fair valuation responsibilities have been delegated to PGIM Investments LLC (“PGIM Investments” or the “Manager”). Pursuant to the Board’s delegation, the Manager has established a Valuation Committee responsible for supervising the fair valuation of portfolio securities and other assets and liabilities. The valuation procedures permit the Fund to utilize independent pricing vendor services, quotations from market makers, and alternative valuation methods when market quotations are either not readily available or not deemed representative of fair value. Fair value is the price that would be received to sell an asset or paid to transfer a liability in an orderly transaction between market participants on the measurement date. A record of the Valuation Committee’s actions is subject to the Board’s review at its first quarterly meeting following the quarter in which such actions take place.
For the fiscal reporting year-end, securities and other assets and liabilities were fair valued at the close of the last U.S. business day. Trading in certain foreign securities may occur when
| | |
| PGIM Select Real Estate Fund | | 27 |
Notes to Financial Statements (continued)
the NYSE is closed (including weekends and holidays). Because such foreign securities trade in markets that are open on weekends and U.S. holidays, the values of some of the Fund’s foreign investments may change on days when investors cannot purchase or redeem Fund shares.
Various inputs determine how the Fund’s investments are valued, all of which are categorized according to the three broad levels (Level 1, 2, or 3) detailed in the Schedule of Investments and referred to herein as the “fair value hierarchy” in accordance with FASB ASC Topic 820 - Fair Value Measurements and Disclosures.
Common or preferred stocks, exchange-traded funds and derivative instruments, if applicable, that are traded on a national securities exchange are valued at the last sale price as of the close of trading on the applicable exchange where the security principally trades. Securities traded via NASDAQ are valued at the NASDAQ official closing price. To the extent these securities are valued at the last sale price or NASDAQ official closing price, they are classified as Level 1 in the fair value hierarchy. In the event that no sale or official closing price on valuation date exists, these securities are generally valued at the mean between the last reported bid and ask prices, or at the last bid price in the absence of an ask price. These securities are classified as Level 2 in the fair value hierarchy.
Foreign equities traded on foreign securities exchanges are generally valued using pricing vendor services that provide model prices derived using adjustment factors based on information such as local closing price, relevant general and sector indices, currency fluctuations, depositary receipts, and futures, as applicable. Securities valued using such model prices are classified as Level 2 in the fair value hierarchy. The models generate an evaluated adjustment factor for each security, which is applied to the local closing price to adjust it for post closing market movements up to the time the Fund is valued. Utilizing that evaluated adjustment factor, the vendor provides an evaluated price for each security. If the vendor does not provide an evaluated price, securities are valued in accordance with exchange-traded common and preferred stock valuation policies discussed above.
Investments in open-end funds (other than exchange-traded funds) are valued at their net asset values as of the close of the NYSE on the date of valuation. These securities are classified as Level 1 in the fair value hierarchy since they may be purchased or sold at their net asset values on the date of valuation.
Securities and other assets that cannot be priced according to the methods described above are valued based on pricing methodologies approved by the Board. In the event that unobservable inputs are used when determining such valuations, the securities will be classified as Level 3 in the fair value hierarchy. Altering one or more unobservable inputs may result in a significant change to a Level 3 security’s fair value measurement.
28
When determining the fair value of securities, some of the factors influencing the valuation include: the nature of any restrictions on disposition of the securities; assessment of the general liquidity of the securities; the issuer’s financial condition and the markets in which it does business; the cost of the investment; the size of the holding and the capitalization of the issuer; the prices of any recent transactions or bids/offers for such securities or any comparable securities; any available analyst media or other reports or information deemed reliable by the Manager regarding the issuer or the markets or industry in which it operates. Using fair value to price securities may result in a value that is different from a security’s most recent closing price and from the price used by other unaffiliated mutual funds to calculate their net asset values.
Foreign Currency Translation: The books and records of the Fund are maintained in U.S. dollars. Foreign currency amounts are translated into U.S. dollars on the following basis:
(i) market value of investment securities, other assets and liabilities — at the exchange rate as of the valuation date;
(ii) purchases and sales of investment securities, income and expenses — at the rates of exchange prevailing on the respective dates of such transactions.
Although the net assets of the Fund are presented at the foreign exchange rates and market values at the close of the period, the Fund does not generally isolate that portion of the results of operations arising as a result of changes in the foreign exchange rates from the fluctuations arising from changes in the market prices of long-term portfolio securities held at the end of the period. Similarly, the Fund does not isolate the effect of changes in foreign exchange rates from the fluctuations arising from changes in the market prices of long-term portfolio securities sold during the period. Accordingly, holding period unrealized and realized foreign currency gains (losses) are included in the reported Net change in unrealized appreciation (depreciation) on investments and Net realized gains (losses) on investment transactions on the Statements of Operations.
Net realized gains (losses) on foreign currency transactions represent net foreign exchange gains (losses) from the disposition of holdings of foreign currencies, currency gains (losses) realized between the trade and settlement dates on investment transactions, and the difference between the amounts of interest, dividends and foreign withholding taxes recorded on the Fund’s books and the U.S. dollar equivalent amounts actually received or paid. Net unrealized currency gains (losses) arise from valuing foreign currency denominated assets and liabilities (other than investments) at period end exchange rates.
Master Netting Arrangements: The RIC, on behalf of the Fund, is subject to various Master Agreements, or netting arrangements, with select counterparties. These are agreements which a subadviser may have negotiated and entered into on behalf of all or a portion of the Fund. A master netting arrangement between the Fund and the counterparty permits the Fund to offset amounts payable by the Fund to the same counterparty against amounts to be received; and by the receipt of collateral from the counterparty by the Fund to cover the
| | |
| PGIM Select Real Estate Fund | | 29 |
Notes to Financial Statements (continued)
Fund’s exposure to the counterparty. However, there is no assurance that such mitigating factors are easily enforceable. In addition to master netting arrangements, the right to set-off exists when all the conditions are met such that each of the parties owes the other determinable amounts, the reporting party has the right to set-off the amount owed with the amount owed by the other party, the reporting party intends to set-off and the right of set-off is enforceable by law.
Securities Lending: The Fund lends its portfolio securities to banks and broker-dealers. The loans are secured by collateral at least equal to the market value of the securities loaned. Collateral pledged by each borrower is invested in an affiliated money market fund and is marked to market daily, based on the previous day’s market value, such that the value of the collateral exceeds the value of the loaned securities. In the event of significant appreciation in value of securities on loan on the last business day of the reporting period, the financial statements may reflect a collateral value that is less than the market value of the loaned securities. Such shortfall is remedied as described above. Loans are subject to termination at the option of the borrower or the Fund. Upon termination of the loan, the borrower will return to the Fund securities identical to the loaned securities. The remaining maturities of the securities lending transactions are considered overnight and continuous. Should the borrower of the securities fail financially, the Fund has the right to repurchase the securities in the open market using the collateral.
The Fund recognizes income, net of any rebate and securities lending agent fees, for lending its securities in the form of fees or interest on the investment of any cash received as collateral. The borrower receives all interest and dividends from the securities loaned and such payments are passed back to the lender in amounts equivalent thereto, which are reflected in interest income or unaffiliated dividend income based on the nature of the payment on the Statement of Operations. The Fund also continues to recognize any unrealized gain (loss) in the market price of the securities loaned and on the change in the value of the collateral invested that may occur during the term of the loan. In addition, realized gain (loss) is recognized on changes in the value of the collateral invested upon liquidation of the collateral. Net earnings from securities lending are disclosed in the Statement of Operations.
Equity and Mortgage Real Estate Investment Trusts (collectively REITs): The Fund invested in REITs, which report information on the source of their distributions annually. Based on current and historical information, a portion of distributions received from REITs during the period is estimated to be dividend income, capital gain or return of capital and recorded accordingly. When material, these estimates are adjusted periodically when the actual source of distributions is disclosed by the REITs.
30
Securities Transactions and Net Investment Income: Securities transactions are recorded on the trade date. Realized gains (losses) from investment and currency transactions are calculated on the specific identification method. Dividend income is recorded on the ex-date, or for certain foreign securities, when the Fund becomes aware of such dividends. Expenses are recorded on an accrual basis, which may require the use of certain estimates by management that may differ from actual. Net investment income or loss (other than class specific expenses and waivers, which are allocated as noted below) and unrealized and realized gains (losses) are allocated daily to each class of shares based upon the relative proportion of adjusted net assets of each class at the beginning of the day. Class specific expenses and waivers, where applicable, are charged to the respective share classes. Such class specific expenses and waivers include distribution fees and distribution fee waivers, shareholder servicing fees, transfer agent’s fees and expenses, registration fees and fee waivers and/or expense reimbursements, as applicable.
Taxes: It is the Fund’s policy to continue to meet the requirements of the Internal Revenue Code applicable to regulated investment companies and to distribute all of its taxable net investment income and capital gains, if any, to its shareholders. Therefore, no federal income tax provision is required. Withholding taxes on foreign dividends, interest and capital gains, if any, are recorded, net of reclaimable amounts, at the time the related income is earned.
Tax reform legislation commonly referred to as the Tax Cuts and Jobs Act permits a direct REIT shareholder to claim a 20% “qualified business income” deduction for ordinary REIT dividends. The tax legislation did not expressly permit regulated investment companies (“RICs”) paying dividends attributable to such income to pass through this special treatment to its shareholders. On January 18, 2019, the Internal Revenue Service issued final regulations that permit RICs to pass through “qualified REIT dividends” to their shareholders.
Dividends and Distributions: The Fund expects to pay dividends from net investment income quarterly. Distributions from net realized capital and currency gains, if any, are declared and paid annually. Dividends and distributions to shareholders, which are determined in accordance with federal income tax regulations and which may differ from GAAP, are recorded on the ex-date. Permanent book/tax differences relating to income and gain (loss) are reclassified between total distributable earnings (loss) and paid-in capital in excess of par, as appropriate.
Estimates: The preparation of financial statements requires management to make estimates and assumptions that affect the reported amounts and disclosures in the financial statements. Actual results could differ from those estimates.
| | |
| PGIM Select Real Estate Fund | | 31 |
Notes to Financial Statements (continued)
The RIC, on behalf of the Fund, has a management agreement with the Manager. Pursuant to this agreement, the Manager has responsibility for all investment advisory services and supervises the subadviser’s performance of such services.
The Manager has entered into a subadvisory agreement with PGIM, Inc., which provides subadvisory services to the Fund through its business unit, PGIM Real Estate, and PGIM Real Estate (UK) Limited, an indirect wholly-owned subsidiary of PGIM, Inc. (collectively referred to herein as the “subadviser”). The Manager pays for the services of subadviser.
The management fee paid to the Manager is accrued daily and payable monthly at an annual rate of 0.80% of the Fund’s average daily net assets up to and including $1 billion, 0.78% of the next $2 billion, 0.76% of the next $2 billion, 0.75% of the next $5 billion and 0.74% of the Fund’s average daily net assets in excess of $10 billion. The effective management fee rate before any waivers and/or expense reimbursements was 0.80% for the year ended October 31, 2021.
The Manager has contractually agreed, through February 28, 2023, to limit total annual operating expenses after fee waivers and/or expense reimbursements to 1.30% of average daily net assets for Class A shares, 2.05% of average daily net assets for Class C shares, 1.05% of average daily net assets for Class Z shares and 1.05% of average daily net assets for Class R6 shares. This contractual waiver excludes interest, brokerage, taxes (such as income and foreign withholding taxes, stamp duty and deferred tax expenses), acquired fund fees and expenses, extraordinary expenses, and certain other Fund expenses such as dividend and interest expense and broker charges on short sales.
Where applicable, the Manager agrees to waive management fees or shared operating expenses on any share class to the same extent that it waives such expenses on any other share class. In addition, total annual operating expenses for Class R6 shares will not exceed total annual operating expenses for Class Z shares. Fees and/or expenses waived and/or reimbursed by the Manager may be recouped by the Manager within the same fiscal year during which such waiver/reimbursement is made if such recoupment can be realized without exceeding the expense limit in effect at the time of the recoupment for that fiscal year.
The RIC, on behalf of the Fund, has a distribution agreement with Prudential Investment Management Services LLC (“PIMS”), which acts as the distributor of the Class A, Class C, Class Z and Class R6 shares of the Fund. The Fund compensates PIMS for distributing and servicing the Fund’s Class A and Class C shares, pursuant to the plans of distribution (the “Distribution Plans”), regardless of expenses actually incurred by PIMS.
32
Pursuant to the Distribution Plans, the Fund compensates PIMS for distribution related activities at an annual rate of up to 0.30% and 1% of the average daily net assets of the Class A and Class C shares, respectively. PIMS has contractually agreed through February 28, 2023 to limit such fees to 0.25% of the average daily net assets of the Class A shares.The distribution fees are accrued daily and payable monthly. No distribution or service fees are paid to PIMS as distributor of the Class Z or Class R6 shares of the Fund.
For the year ended October 31, 2021, PIMS received $17,899 in front-end sales charges resulting from sales of Class A shares. Additionally, for the year ended October 31, 2021, PIMS received $49 in contingent deferred sales charges imposed upon redemptions by certain Class C shareholders. From these fees, PIMS paid such sales charges to broker-dealers, who in turn paid commissions to salespersons and incurred other distribution costs.
PGIM Investments, PGIM, Inc., PGIM Real Estate (UK) Limited and PIMS are indirect, wholly-owned subsidiaries of Prudential Financial, Inc. (“Prudential”).
| 4. | Other Transactions with Affiliates |
Prudential Mutual Fund Services LLC (“PMFS”), an affiliate of PGIM Investments and an indirect, wholly-owned subsidiary of Prudential, serves as the Fund’s transfer agent. Transfer agent’s fees and expenses in the Statement of Operations include certain out-of-pocket expenses paid to non-affiliates, where applicable.
The Fund may invest its overnight sweep cash in the PGIM Core Ultra Short Bond Fund (the “Core Fund”), and its securities lending cash collateral in the PGIM Institutional Money Market Fund (the “Money Market Fund”), each a fund of Prudential Investment Portfolios 2, registered under the 1940 Act and managed by PGIM Investments. PGIM Investments and/or its affiliates are paid fees or reimbursed for providing their services to the Core Fund and the Money Market Fund. In addition to the realized and unrealized gains on investments in the Core Fund and Money Market Fund, earnings from such investments are disclosed on the Statement of Operations as “Affiliated dividend income” and “Income from securities lending, net”, respectively.
The Fund may enter into certain securities purchase or sale transactions under Board approved Rule 17a-7 procedures. Rule 17a-7 is an exemptive rule under the 1940 Act, that subject to certain conditions, permits purchase and sale transactions among affiliated investment companies, or between an investment company and a person that is affiliated solely by reason of having a common (or affiliated) investment adviser, common directors/trustees, and/or common officers. For the year ended October 31, 2021, no 17a-7 transactions were entered into by the Fund.
| | |
| PGIM Select Real Estate Fund | | 33 |
Notes to Financial Statements (continued)
The aggregate cost of purchases and proceeds from sales of portfolio securities (excluding short-term investments and U.S. Government securities) for the year ended October 31, 2021, were $539,960,136 and $308,251,860, respectively.
A summary of the cost of purchases and proceeds from sales of shares of affiliated mutual funds for the year ended October 31, 2021, is presented as follows:
| | | | | | | | | | | | | | | | | | | | | | | | | | | | | | | | | | | | | | | | | | | | | | | | | | | | | | | | | | | | | | | | |
Value, Beginning of Year | | Cost of Purchases | | | Proceeds from Sales | | Change in Unrealized Gain (Loss) | | | Realized Gain (Loss) | | | Value, End of Year | | | Shares, End of Year | | | Income | |
| |
Short-Term Investments - Affiliated Mutual Funds: | | | | | |
| | |
PGIM Core Ultra Short Bond Fund (1)(wa) | | | | | | | | |
$1,636,468 | | | | | | $ | 167,603,128 | | | | | | | | | | | $ | 166,373,294 | | | | | | | $ | — | | | | | | | | | | | $ | — | | | | | | | | | $ | 2,866,302 | | | | 2,866,302 | | | | | $ | 4,710 | | | | | |
| | |
PGIM Institutional Money Market Fund (1)(b)(wa) | | | | | | | | |
— | | | | | | | 2,079,687 | | | | | | | | | | | | 2,079,736 | | | | | | | | — | | | | | | | | | | | | 49 | | | | | | | | | | — | | | | — | | | | | | 21 | (2) | | | | |
| | | | | | | | | | | | | | | | | | | | | | | | | | | | | | | | | | | | | | | | | | | | | | | | | | | | | | | | | | | | | | | | |
$1,636,468 | | | | | | $ | 169,682,815 | | | | | | | | | | | $ | 168,453,030 | | | | | | | $ | — | | | | | | | | | | | $ | 49 | | | | | | | | | $ | 2,866,302 | | | | | | | | | $ | 4,731 | | | | | |
| | | | | | | | | | | | | | | | | | | | | | | | | | | | | | | | | | | | | | | | | | | | | | | | | | | | | | | | | | | | | | | | |
| (1) | The Fund did not have any capital gain distributions during the reporting period. |
| (2) | The amount, or a portion thereof, represents the affiliated securities lending income shown on the Statement of Operations. |
| (b) | Represents security, or portion thereof, purchased with cash collateral received for securities on loan and includes dividend reinvestment. |
| (wa) | PGIM Investments LLC, the manager of the Fund, also serves as manager of the PGIM Core Ultra Short Bond Fund and PGIM Institutional Money Market Fund, if applicable. |
| 6. | Distributions and Tax Information |
Distributions to shareholders, which are determined in accordance with federal income tax regulations and which may differ from GAAP, are recorded on the ex-date.
For the year ended October 31, 2021, the tax character of dividends paid by the Fund was $2,693,504 of ordinary income. For the year ended October 31, 2020, the tax character of dividends paid by the Fund were $1,670,983 of ordinary income and $129,363 of long-term capital gains.
As of October 31, 2021, the accumulated undistributed earnings on a tax basis were $11,148,349 of ordinary income and $1,759,316 of long-term capital gains.
34
The United States federal income tax basis of the Fund’s investments and the net unrealized appreciation as of October 31, 2021 were as follows:
| | | | | | | | |
| Tax Basis | | Gross Unrealized Appreciation | | Gross Unrealized Depreciation | | Net Unrealized Appreciation | | |
| | | | |
$297,862,018 | | $39,260,591 | | $(7,892,528) | | $31,368,063 | | |
The GAAP basis differs from tax basis primarily due to deferred losses on wash sales, investments in passive foreign investment companies and other cost basis differences between financial and tax accounting.
The Fund utilized approximately $3,113,761 of its capital loss carryforward to offset net taxable gains realized in the fiscal year ended October 31, 2021.
The Manager has analyzed the Fund’s tax positions taken on federal, state and local income tax returns for all open tax years and has concluded that no provision for income tax is required in the Fund’s financial statements for the current reporting period. Since tax authorities can examine previously filed tax returns, the Fund’s U.S. federal and state tax returns for each of the four fiscal years up to the most recent fiscal year ended October 31, 2021 are subject to such review.
The Fund offers Class A, Class C, Class Z and Class R6 shares. Class A shares are sold with a maximum front-end sales charge of 5.50%. Investors who purchase $1 million or more of Class A shares and sell these shares within 12 months of purchase are subject to a contingent deferred sales charge (“CDSC”) of 1%, although they are not subject to an initial sales charge. The Class A CDSC is waived for certain retirement and/or benefit plans. A special exchange privilege is also available for shareholders who qualified to purchase Class A shares at net asset value. Class C shares are sold with a CDSC of 1% on sales made within 12 months of purchase. Class C shares will automatically convert to Class A shares on a monthly basis approximately eight years (ten years prior to January 22, 2021) after purchase. Class Z and Class R6 shares are not subject to any sales or redemption charges and are available exclusively for sale to a limited group of investors.
Under certain circumstances, an exchange may be made from specified share classes of the Fund to one or more other share classes of the Fund as presented in the table of transactions in shares of beneficial interest, below.
The RIC has authorized an unlimited number of shares of beneficial interest of the Fund at $0.001 par value per share, currently divided into four classes, designated Class A, Class C, Class Z and Class R6.
| | |
| PGIM Select Real Estate Fund | | 35 |
Notes to Financial Statements (continued)
As of October 31, 2021, Prudential, through its affiliated entities, including affiliated funds (if applicable), owned shares of the Fund as follows:
| | | | |
| | | Number of Shares | | Percentage of
Outstanding Shares |
Class A | | 211,305 | | 48.8% |
Class C | | 1,227 | | 1.1% |
Class R6 | | 1,132,456 | | 18.5% |
At the reporting period end, the number of shareholders holding greater than 5% of the Fund are as follows:
| | | | | | |
| Affiliated | | Unaffiliated |
Number of
Shareholders | | Percentage of
Outstanding Shares | | Number of
Shareholders | | Percentage of
Outstanding Shares |
— | | —% | | 2 | | 74.6% |
Transactions in shares of beneficial interest were as follows:
| | | | | | | | | | | | |
Class A | | Shares | | | | | | Amount | |
| | | |
Year ended October 31, 2021: | | | | | | | | | | | | |
Shares sold | | | 198,267 | | | | | | | $ | 2,874,733 | |
Shares issued in reinvestment of dividends and distributions | | | 5,277 | | | | | | | | 69,387 | |
Shares purchased | | | (94,647 | ) | | | | | | | (1,279,321 | ) |
| | | | | | | | | | | | |
| | | |
Net increase (decrease) in shares outstanding before conversion | | | 108,897 | | | | | | | | 1,664,799 | |
Shares issued upon conversion from other share class(es) | | | 183 | | | | | | | | 2,546 | |
Shares purchased upon conversion into other share class(es) | | | (13,661 | ) | | | | | | | (205,052 | ) |
| | | | | | | | | | | | |
| | | |
Net increase (decrease) in shares outstanding | | | 95,419 | | | | | | | $ | 1,462,293 | |
| | | | | | | | | | | | |
Year ended October 31, 2020: | | | | | | | | | | | | |
Shares sold | | | 196,557 | | | | | | | $ | 2,367,915 | |
Shares issued in reinvestment of dividends and distributions | | | 20,428 | | | | | | | | 248,038 | |
Shares purchased | | | (216,412 | ) | | | | | | | (2,521,929 | ) |
| | | | | | | | | | | | |
| | | |
Net increase (decrease) in shares outstanding before conversion | | | 573 | | | | | | | | 94,024 | |
Shares purchased upon conversion into other share class(es) | | | (86 | ) | | | | | | | (1,034 | ) |
| | | | | | | | | | | | |
| | | |
Net increase (decrease) in shares outstanding | | | 487 | | | | | | | $ | 92,990 | |
| | | | | | | | | | | | |
36
| | | | | | | | | | | | |
| Class C | | Shares | | | | | | Amount | |
Year ended October 31, 2021: | | | | | | | | | | | | |
Shares sold | | | 71,343 | | | | | | | $ | 998,329 | |
Shares issued in reinvestment of dividends and distributions | | | 443 | | | | | | | | 5,538 | |
Shares purchased | | | (13,215 | ) | | | | | | | (175,530 | ) |
| | | | | | | | | | | | |
| | | |
Net increase (decrease) in shares outstanding before conversion | | | 58,571 | | | | | | | | 828,337 | |
Shares purchased upon conversion into other share class(es) | | | (5,162 | ) | | | | | | | (65,704 | ) |
| | | | | | | | | | | | |
| | | |
Net increase (decrease) in shares outstanding | | | 53,409 | | | | | | | $ | 762,633 | |
| | | | | | | | | | | | |
Year ended October 31, 2020: | | | | | | | | | | | | |
Shares sold | | | 34,038 | | | | | | | $ | 412,624 | |
Shares issued in reinvestment of dividends and distributions | | | 1,883 | | | | | | | | 22,791 | |
Shares purchased | | | (9,292 | ) | | | | | | | (106,072 | ) |
| | | | | | | | | | | | |
| | | |
Net increase (decrease) in shares outstanding before conversion | | | 26,629 | | | | | | | | 329,343 | |
Shares purchased upon conversion into other share class(es) | | | (255 | ) | | | | | | | (2,886 | ) |
| | | | | | | | | | | | |
| | | |
Net increase (decrease) in shares outstanding | | | 26,374 | | | | | | | $ | 326,457 | |
| | | | | | | | | | | | |
Class Z | | | | | | | | | | | | |
Year ended October 31, 2021: | | | | | | | | | | | | |
Shares sold | | | 13,350,960 | | | | | | | $ | 186,168,605 | |
Shares issued in reinvestment of dividends and distributions | | | 121,767 | | | | | | | | 1,696,608 | |
Shares purchased | | | (1,477,815 | ) | | | | | | | (21,446,422 | ) |
| | | | | | | | | | | | |
| | | |
Net increase (decrease) in shares outstanding before conversion | | | 11,994,912 | | | | | | | | 166,418,791 | |
Shares issued upon conversion from other share class(es) | | | 19,401 | | | | | | | | 280,074 | |
| | | | | | | | | | | | |
| | | |
Net increase (decrease) in shares outstanding | | | 12,014,313 | | | | | | | $ | 166,698,865 | |
| | | | | | | | | | | | |
Year ended October 31, 2020: | | | | | | | | | | | | |
Shares sold | | | 2,983,690 | | | | | | | $ | 35,135,075 | |
Shares issued in reinvestment of dividends and distributions | | | 47,282 | | | | | | | | 568,028 | |
Shares purchased | | | (985,863 | ) | | | | | | | (10,853,079 | ) |
| | | | | | | | | | | | |
| | | |
Net increase (decrease) in shares outstanding before conversion | | | 2,045,109 | | | | | | | | 24,850,024 | |
Shares issued upon conversion from other share class(es) | | | 337 | | | | | | | | 3,920 | |
| | | | | | | | | | | | |
| | | |
Net increase (decrease) in shares outstanding | | | 2,045,446 | | | | | | | $ | 24,853,944 | |
| | | | | | | | | | | | |
Class R6 | | | | | | | | | | | | |
Year ended October 31, 2021: | | | | | | | | | | | | |
Shares sold | | | 5,802,725 | | | | | | | $ | 79,850,314 | |
Shares issued in reinvestment of dividends and distributions | | | 67,943 | | | | | | | | 918,300 | |
Shares purchased | | | (1,126,477 | ) | | | | | | | (16,354,591 | ) |
| | | | | | | | | | | | |
| | | |
Net increase (decrease) in shares outstanding before conversion | | | 4,744,191 | | | | | | | | 64,414,023 | |
Shares purchased upon conversion into other share class(es) | | | (877 | ) | | | | | | | (11,864 | ) |
| | | | | | | | | | | | |
| | | |
Net increase (decrease) in shares outstanding | | | 4,743,314 | | | | | | | $ | 64,402,159 | |
| | | | | | | | | | | | |
Year ended October 31, 2020: | | | | | | | | | | | | |
Shares sold | | | 329,001 | | | | | | | $ | 3,615,152 | |
Shares issued in reinvestment of dividends and distributions | | | 80,324 | | | | | | | | 959,853 | |
Shares purchased | | | (341,140 | ) | | | | | | | (3,580,100 | ) |
| | | | | | | | | | | | |
| | | |
Net increase (decrease) in shares outstanding | | | 68,185 | | | | | | | $ | 994,905 | |
| | | | | | | | | | | | |
The RIC, on behalf of the Fund, along with other affiliated registered investment companies (the “Participating Funds”), is a party to a Syndicated Credit Agreement (“SCA”) with a group of banks. The purpose of the SCA is to provide an alternative source of temporary
| | |
| PGIM Select Real Estate Fund | | 37 |
Notes to Financial Statements (continued)
funding for capital share redemptions. The table below provides details of the current SCA in effect at the reporting period-end as well as the prior SCA.
| | | | |
| | | |
| | | Current SCA | | Prior SCA |
| | | |
| Term of Commitment | | 10/1/2021 – 9/29/2022 | | 10/2/2020 – 9/30/2021 |
| | | |
| Total Commitment | | $ 1,200,000,000 | | $ 1,200,000,000 |
| | | |
| Annualized Commitment Fee on the Unused Portion of the SCA | | 0.15% | | 0.15% |
| | | |
| Annualized Interest Rate on Borrowings | | 1.20% plus the higher of (1) the effective federal funds rate, (2) the one-month LIBOR rate or (3) zero percent | | 1.30% plus the higher of (1) the effective federal funds rate, (2) the one-month LIBOR rate or (3) zero percent |
Certain affiliated registered investment companies that are parties to the SCA include portfolios that are subject to a predetermined mathematical formula used to manage certain benefit guarantees offered under variable annuity contracts. The formula may result in large scale asset flows into and out of these portfolios. Consequently, these portfolios may be more likely to utilize the SCA for purposes of funding redemptions. It may be possible for those portfolios to fully exhaust the committed amount of the SCA, thereby requiring the Manager to allocate available funding per a Board-approved methodology designed to treat the Participating Funds in the SCA equitably.
The Fund did not utilize the SCA during the year ended October 31, 2021.
| 9. | Risks of Investing in the Fund |
The Fund’s risks include, but are not limited to, some or all of the risks discussed below. For further information on the Fund’s risks, please refer to the Fund’s Prospectus and Statement of Additional Information.
Active Trading Risk: The Fund actively and frequently trades its portfolio securities. High portfolio turnover results in higher transaction costs, which can affect the Fund’s performance and have adverse tax consequences. In addition, high portfolio turnover may also mean that a proportionately greater amount of distributions to shareholders will be taxed as ordinary income rather than long-term capital gains compared to investment companies with lower portfolio turnover.
Distribution Risk: The Fund’s distributions may consist of net investment income, if any, and net realized gains, if any, from the sale of investments and/or return of capital. The Fund will provide to shareholders early in each calendar year the final tax character of the Fund’s distributions for the previous year. Also, at such time that the Fund distribution is expected to be from sources other than current or accumulated net income, a notice to shareholders may be required.
38
Economic and Market Events Risk: Events in the U.S. and global financial markets, including actions taken by the U.S. Federal Reserve or foreign central banks to stimulate or stabilize economic growth or the functioning of the securities markets, may at times result in unusually high market volatility, which could negatively impact performance. Relatively reduced liquidity in credit and fixed income markets could adversely affect issuers worldwide.
Emerging Markets Risk: The risks of foreign investments are greater for investments in or exposed to emerging markets. Emerging market countries typically have economic and political systems that are less fully developed, and can be expected to be less stable, than those of more developed countries. For example, the economies of such countries can be subject to rapid and unpredictable rates of inflation or deflation. Low trading volumes may result in a lack of liquidity and price volatility. Emerging market countries may have policies that restrict investment by non-U.S. investors, or that prevent non-U.S. investors from withdrawing their money at will.
The Fund may invest in some emerging markets that subject it to risks such as those associated with illiquidity, custody of assets, different settlement and clearance procedures and asserting legal title under a developing legal and regulatory regime to a greater degree than in developed markets or even in other emerging markets.
Equity and Equity-Related Securities Risk: Equity and equity-related securities may be subject to changes in value, and their values may be more volatile than those of other asset classes. In addition to an individual security losing value, the value of the equity markets or a sector in which the Fund invests could go down. Different parts of a market can react differently to adverse issuer, market, regulatory, political and economic developments.
Foreign Securities Risk: Investments in securities of non-U.S. issuers (including those denominated in U.S. dollars) may involve more risk than investing in securities of U.S. issuers. Foreign political, economic and legal systems, especially those in developing and emerging market countries, may be less stable and more volatile than in the United States. Foreign legal systems generally have fewer regulatory requirements than the U.S. legal system, particularly those of emerging markets. In general, less information is publicly available with respect to non-U.S. companies than U.S. companies. Non-U.S. companies generally are not subject to the same accounting, auditing, and financial reporting standards as are U.S. companies. Additionally, the changing value of foreign currencies and changes in exchange rates could also affect the value of the assets the Fund holds and the Fund’s performance. Certain foreign countries may impose restrictions on the ability of issuers of foreign securities to make payment of principal and interest or dividends to investors located outside the country, due to blockage of foreign currency exchanges or otherwise. Investments in emerging markets are subject to greater volatility and price declines.
In addition, the Fund’s investments in non-U.S. securities may be subject to the risks of nationalization or expropriation of assets, imposition of currency exchange controls or
| | |
| PGIM Select Real Estate Fund | | 39 |
Notes to Financial Statements (continued)
restrictions on the repatriation of non-U.S. currency, confiscatory taxation and adverse diplomatic developments. Special U.S. tax considerations may apply.
Increase in Expenses Risk: Your actual cost of investing in the Fund may be higher than the expenses shown in the expense table in the Fund’s Prospectus for a variety of reasons. For example, expense ratios may be higher than those shown if average net assets decrease. Net assets are more likely to decrease and Fund expense ratios are more likely to increase when markets are volatile. Active and frequent trading of Fund securities can increase expenses.
Large Shareholder and Large Scale Redemption Risk: Certain individuals, accounts, funds (including funds affiliated with the Manager) or institutions, including the Manager and its affiliates, may from time to time own or control a substantial amount of the Fund’s shares. There is no requirement that these entities maintain their investment in the Fund. There is a risk that such large shareholders or that the Fund’s shareholders generally may redeem all or a substantial portion of their investments in the Fund in a short period of time, which could have a significant negative impact on the Fund’s NAV, liquidity, and brokerage costs. Large redemptions could also result in tax consequences to shareholders and impact the Fund’s ability to implement its investment strategy. The Fund’s ability to pursue its investment objective after one or more large scale redemptions may be impaired and, as a result, the Fund may invest a larger portion of its assets in cash or cash equivalents.
Market Capitalization Risk: The Fund may invest in companies of any market capitalization. Generally, the stock prices of small- and mid-cap companies are less stable than the prices of large-cap stocks and may present greater risks. Large capitalization companies as a group could fall out of favor with the market, causing the Fund to underperform compared to investments that focus on smaller capitalized companies.
Market Disruption and Geopolitical Risks: International wars or conflicts and geopolitical developments in foreign countries, along with instability in regions such as Asia, Eastern Europe, and the Middle East, possible terrorist attacks in the United States or around the world, public health epidemics such as the outbreak of infectious diseases like the outbreak of COVID-19 globally in 2020 or the 2014–2016 outbreak in West Africa of the Ebola virus, and other similar events could adversely affect the U.S. and foreign financial markets, including increases in market volatility, reduced liquidity in the securities markets and government intervention, and may cause further long-term economic uncertainties in the United States and worldwide generally. The coronavirus pandemic and the related governmental and public responses have had and may continue to have an impact on the Fund’s investments and net asset value and have led and may continue to lead to increased market volatility and the potential for illiquidity in certain classes of securities and sectors of the market. Preventative or protective actions that governments may take in respect of
40
pandemic or epidemic diseases may result in periods of business disruption, business closures, inability to obtain raw materials, supplies and component parts, and reduced or disrupted operations for the issuers in which the Fund invests. Government intervention in markets may impact interest rates, market volatility and security pricing. The occurrence, reoccurrence and pendency of such diseases could adversely affect the economies (including through changes in business activity and increased unemployment) and financial markets either in specific countries or worldwide.
Market Risk: Securities markets may be volatile and the market prices of the Fund’s securities may decline. Securities fluctuate in price based on changes in an issuer’s financial condition and overall market and economic conditions. If the market prices of the securities owned by the Fund fall, the value of your investment in the Fund will decline.
Real Estate Investment Trust (REIT) Risk: Investing in REITs involves certain unique risks in addition to those risks associated with investing in the real estate industry in general. REITs may be affected by changes in the value of the underlying property owned by the REITs, while mortgage REITs may be affected by the quality of any credit extended. REITs are dependent upon management skills, may not be diversified geographically or by property/mortgage asset type, and are subject to heavy cash flow dependency, default by borrowers and self-liquidation. REITs may be more volatile and/or more illiquid than other types of equity securities. REITs (especially mortgage REITs) are subject to interest rate risks. REITs may incur significant amounts of leverage. The Fund will indirectly bear a portion of the expenses, including management fees, paid by each REIT in which it invests, in addition to the expenses of the Fund.
REITs must also meet certain requirements under the Internal Revenue Code of 1986, as amended (the Code) to avoid entity level tax and be eligible to pass-through certain tax attributes of their income to shareholders. REITs are consequently subject to the risk of failing to meet these requirements for favorable tax treatment and of failing to maintain their exemptions from registration under the Investment Company Act of 1940. REITs are subject to the risks of changes in the Code affecting their tax status.
Real Estate Related Securities Risk: Because the Fund invests in real estate securities, including REITs, the Fund is subject to the risks of investing in the real estate industry, such as changes in general and local economic conditions, the supply and demand for real estate and changes in zoning and tax laws. Since the Fund concentrates in the real estate industry, its holdings can vary significantly from broad market indices. As a result, the Fund’s performance can deviate from the performance of such indices. Because the Fund invests in stocks, there is the risk that the price of a particular stock owned by the Fund could go down or pay lower-than-expected or no dividends. In addition to an individual stock losing value, the value of the equity markets or of companies comprising the real estate industry could go down. An investment in the Fund will be closely linked to the performance of the real estate markets. Real estate securities are subject to the same risks as direct investments in real estate and mortgages, and their value will depend on the value of the underlying properties or the underlying loans or interests. The underlying loans may be
| | |
| PGIM Select Real Estate Fund | | 41 |
Notes to Financial Statements (continued)
subject to the risks of default or of prepayments that occur earlier or later than expected, and such loans may also include so-called “subprime” mortgages. The value of these securities will rise and fall in response to many factors, including economic conditions, the demand for rental property and interest rates. In particular, the value of these securities may decline when interest rates rise and will also be affected by the real estate market and by the management of the underlying properties.
Selection Risk: Selection risk is the risk that the securities selected by the subadviser will underperform the market, the relevant indices, or other funds with similar investment objectives and investment strategies. Individual REIT prices may drop because of the failure of borrowers to pay their loans, a dividend reduction, a disruption to the real estate investment sales market, changes in federal or state taxation policies affecting REITs, or poor management of a REIT.
Value Style Risk: Since the Fund follows a value investment style, there is the risk that the value style may be out of favor for long periods of time, that the market will not recognize a security’s intrinsic value for a long time or at all, or that a stock judged to be undervalued may actually be appropriately priced or overvalued. Issuers of value stocks may have experienced adverse business developments or may be subject to special risks that have caused the stock to be out of favor. In addition, the Fund’s value investment style may go out of favor with investors, negatively affecting the Fund’s performance. If the Fund’s assessment of market conditions or a company’s value is inaccurate, the Fund could suffer losses or produce poor performance relative to other funds.
| 10. | Recent Regulatory Developments |
On December 3, 2020, the SEC announced that it voted to adopt a new rule that establishes an updated regulatory framework for fund valuation practices (the “Rule”). The Rule, in part, provides (i) a framework for determining fair value in good faith and (ii) provides for a fund Board’s assignment of its responsibility for the execution of valuation-related activities to a fund’s investment adviser. Further, the SEC is rescinding previously issued guidance on related issues. The Rule took effect on March 8, 2021, with a compliance date of September 8, 2022. Management is currently evaluating the Rule and its impact to the Fund.
42
Report of Independent Registered Public Accounting Firm
To the Board of Trustees of Prudential Investment Portfolios 9 and Shareholders of PGIM Select Real Estate Fund
Opinion on the Financial Statements
We have audited the accompanying statement of assets and liabilities, including the schedule of investments, of PGIM Select Real Estate Fund (one of the funds constituting Prudential Investment Portfolios 9, referred to hereafter as the “Fund”) as of October 31, 2021, the related statement of operations for the year ended October 31, 2021, the statement of changes in net assets for each of the two years in the period ended October 31, 2021, including the related notes, and financial highlights for each of the two years in the period ended October 31, 2021 (collectively referred to as the “financial statements”). In our opinion, the financial statements present fairly, in all material respects, the financial position of the Fund as of October 31, 2021, the results of its operations for the year then ended, and the changes in its net assets and the financial highlights for each of the two years in the period ended October 31, 2021 in conformity with accounting principles generally accepted in the United States of America.
The financial statements of the Fund as of and for the year ended October 31, 2019 and the financial highlights for each of the periods ended on or prior to October 31, 2019 (not presented herein, other than the financial highlights) were audited by other auditors whose report dated December 19, 2019 expressed an unqualified opinion on those financial statements and financial highlights.
Basis for Opinion
These financial statements are the responsibility of the Fund’s management. Our responsibility is to express an opinion on the Fund’s financial statements based on our audits. We are a public accounting firm registered with the Public Company Accounting Oversight Board (United States) (PCAOB) and are required to be independent with respect to the Fund in accordance with the U.S. federal securities laws and the applicable rules and regulations of the Securities and Exchange Commission and the PCAOB.
We conducted our audits of these financial statements in accordance with the standards of the PCAOB. Those standards require that we plan and perform the audit to obtain reasonable assurance about whether the financial statements are free of material misstatement, whether due to error or fraud.
Our audits included performing procedures to assess the risks of material misstatement of the financial statements, whether due to error or fraud, and performing procedures that respond to those risks. Such procedures included examining, on a test basis, evidence regarding the amounts and disclosures in the financial statements. Our audits also included evaluating the accounting principles used and significant estimates made by management, as well as evaluating the overall presentation of the financial statements. Our procedures included confirmation of securities owned as of October 31, 2021 by correspondence with the custodian, transfer agent and brokers; when replies were not received from brokers, we performed other auditing procedures. We believe that our audits provide a reasonable basis for our opinion.
/s/PricewaterhouseCoopers LLP
New York, New York
December 16, 2021
We have served as the auditor of one or more investment companies in the PGIM Retail Funds complex since 2020.
| | | | |
PGIM Select Real Estate Fund | | | 43 | |
Tax Information (unaudited)
For the year ended October 31, 2021, the Fund reports the maximum amount allowable under Section 854 of the Internal Revenue Code, but not less than 10.68% of the ordinary income dividends paid during the year as qualified dividend income.
In January 2022, you will be advised on IRS Form 1099-DIV or substitute 1099-DIV as to the federal tax status of the distributions received by you in calendar year 2021.
INFORMATION ABOUT BOARD MEMBERS AND OFFICERS (unaudited)
Information about Board Members and Officers of the Fund is set forth below. Board Members who are not deemed to be “interested persons” of the Fund, as defined in the 1940 Act, are referred to as “Independent Board Members.” Board Members who are deemed to be “interested persons” of the Fund are referred to as “Interested Board Members.” The Board Members are responsible for the overall supervision of the operations of the Fund and perform the various duties imposed on the directors of investment companies by the 1940 Act. The Board in turn elects the Officers, who are responsible for administering the day-to-day operations of the Fund.
| | | | | | |
| |
| Independent Board Members |
| | | | |
Name Year of Birth Position(s) Portfolios Overseen | | Principal Occupation(s) During Past Five Years | | Other Directorships Held During Past Five Years | | Length of Board Service |
| | | | |
Ellen S. Alberding 1958 Board Member Portfolios Overseen: 95 | | President and Board Member, The Joyce Foundation (charitable foundation) (since 2002); formerly Vice Chair, City Colleges of Chicago (community college system) (2011-2015); Trustee, National Park Foundation (charitable foundation for national park system) (2009-2018); Trustee, Economic Club of Chicago (2009-2016); Trustee, Loyola University (since 2018). | | None. | | Since September 2013 |
| | | | |
Kevin J. Bannon 1952 Board Member Portfolios Overseen: 95 | | Retired; formerly Managing Director (April 2008-May 2015) and Chief Investment Officer (October 2008-November 2013) of Highmount Capital LLC (registered investment adviser); formerly Executive Vice President and Chief Investment Officer (April 1993-August 2007) of Bank of New York Company; President (May 2003-May 2007) of BNY Hamilton Family of Mutual Funds. | | Director of Urstadt Biddle Properties (equity real estate investment trust) (since September 2008). | | Since July 2008 |
PGIM Select Real Estate Fund
| | | | | | |
| |
Independent Board Members |
| | | | |
Name Year of Birth Position(s) Portfolios Overseen | | Principal Occupation(s) During Past Five Years | | Other Directorships Held During Past Five Years | | Length of Board Service |
| | | | |
Linda W. Bynoe 1952 Board Member Portfolios Overseen: 92 | | President and Chief Executive Officer (since March 1995) and formerly Chief Operating Officer (December 1989-February 1995) of Telemat Limited LLC (formerly Telemat Ltd) (management consulting); formerly Vice President (January 1985-June 1989) at Morgan Stanley & Co. (broker-dealer). | | Trustee of Equity Residential (residential real estate) (since December 2009); Director of Northern Trust Corporation (financial services) (since April 2006); formerly Director of Anixter International, Inc. (communication products distributor) (January 2006-June 2020). | | Since March 2005 |
| | | | |
Barry H. Evans 1960 Board Member Portfolios Overseen: 94 | | Retired; formerly President (2005-2016), Global Chief Operating Officer (2014-2016), Chief Investment Officer - Global Head of Fixed Income (1998-2014), and various portfolio manager roles (1986-2006), Manulife Asset Management (asset management). | | Formerly Director, Manulife Trust Company (2011-2018); formerly Director, Manulife Asset Management Limited (2015-2017); formerly Chairman of the Board of Directors of Manulife Asset Management U.S. (2005-2016); formerly Chairman of the Board, Declaration Investment Management and Research (2008-2016). | | Since September 2017 |
| | | | |
Keith F. Hartstein 1956 Board Member & Independent Chair Portfolios Overseen: 95 | | Retired; Executive Committee of the Independent Directors Council (IDC) Board of Governors (since October 2019); Member (since November 2014) of the Governing Council of the IDC (organization of independent mutual fund directors); formerly President and Chief Executive Officer (2005-2012), Senior Vice President (2004-2005), Senior Vice President of Sales and Marketing (1997-2004), and various executive management positions (1990-1997), John Hancock Funds, LLC (asset management); Chairman, Investment Company Institute’s Sales Force Marketing Committee (2003-2008). | | None. | | Since September 2013 |
Visit our website at pgim.com/investments
| | | | | | |
| | | |
| Independent Board Members | | | | |
| | | | |
Name Year of Birth Position(s) Portfolios Overseen | | Principal Occupation(s) During Past Five Years | | Other Directorships Held During Past Five Years | | Length of Board Service |
| | | | |
Laurie Simon Hodrick 1962 Board Member Portfolios Overseen: 91 | | A. Barton Hepburn Professor Emerita of Economics in the Faculty of Business, Columbia Business School (since 2018); Visiting Fellow at the Hoover Institution, Stanford University (since 2015); Sole Member, ReidCourt LLC (since 2008) (a consulting firm); formerly Visiting Professor of Law, Stanford Law School (2015-2021); formerly A. Barton Hepburn Professor of Economics in the Faculty of Business, Columbia Business School (1996-2017); formerly Managing Director, Global Head of Alternative Investment Strategies, Deutsche Bank (2006-2008). | | Independent Director, Roku (since December 2020) (communication services); formerly Independent Director, Synnex Corporation (2019-2021) (information technology); formerly Independent Director, Kabbage, Inc. (2018-2020) (financial services); formerly Independent Director, Corporate Capital Trust (2017-2018) (a business development company). | | Since September 2017 |
| | | | |
Brian K. Reid 1961 Board Member Portfolios Overseen: 94 | | Retired; formerly Chief Economist for the Investment Company Institute (ICI) (2005-2017); formerly Senior Economist and Director of Industry and Financial Analysis at the ICI (1998-2004); formerly Senior Economist, Industry and Financial Analysis at the ICI (1996-1998); formerly Staff Economist at the Federal Reserve Board (1989-1996); Director, ICI Mutual Insurance Company (2012-2017). | | None. | | Since March 2018 |
PGIM Select Real Estate Fund
| | | | | | |
| | | |
| Independent Board Members | | | | |
| | | | |
Name Year of Birth Position(s) Portfolios Overseen | | Principal Occupation(s) During Past Five Years | | Other Directorships Held During Past Five Years | | Length of Board Service |
| | | | |
Grace C. Torres 1959 Board Member Portfolios Overseen: 94 | | Retired; formerly Treasurer and Principal Financial and Accounting Officer of the PGIM Funds, Target Funds, Advanced Series Trust, Prudential Variable Contract Accounts and The Prudential Series Fund (1998-June 2014); Assistant Treasurer (March 1999-June 2014) and Senior Vice President (September 1999-June 2014) of PGIM Investments LLC; Assistant Treasurer (May 2003-June 2014) and Vice President (June 2005-June 2014) of AST Investment Services, Inc.; Senior Vice President and Assistant Treasurer (May 2003-June 2014) of Prudential Annuities Advisory Services, Inc. | | Director (since January 2018) of OceanFirst Financial Corp. and OceanFirst Bank; formerly Director (July 2015-January 2018) of Sun Bancorp, Inc. N.A. and Sun National Bank. | | Since November 2014 |
| | | | | | |
| | | |
| Interested Board Members | | | | |
| | | | |
Name Year of Birth Position(s) Portfolios Overseen | | Principal Occupation(s) During Past Five Years | | Other Directorships Held During Past Five Years | | Length of Board Service |
| | | | |
Stuart S. Parker 1962 Board Member & President Portfolios Overseen: 94 | | President, Chief Executive Officer, Chief Operating Officer and Officer in Charge of PGIM Investments LLC (formerly known as Prudential Investments LLC) (since January 2012); formerly Executive Vice President of Jennison Associates LLC and Head of Retail Distribution of PGIM Investments LLC (June 2005-December 2011); Investment Company Institute - Board of Governors (since May 2012). | | None. | | Since January 2012 |
Visit our website at pgim.com/investments
| | | | | | |
| | | |
| Interested Board Members | | | | |
| | | | |
Name Year of Birth Position(s) Portfolios Overseen | | Principal Occupation(s) During Past Five Years | | Other Directorships Held During Past Five Years | | Length of Board Service |
| | | | |
Scott E. Benjamin 1973 Board Member & Vice President Portfolios Overseen: 95 | | Executive Vice President (since May 2009) of PGIM Investments LLC; Vice President (since June 2012) of Prudential Investment Management Services LLC; Executive Vice President (since September 2009) of AST Investment Services, Inc.; Senior Vice President of Product Development and Marketing, PGIM Investments (since February 2006); formerly Vice President of Product Development and Product Management, PGIM Investments LLC (2003-2006). | | None. | | Since March 2010 |
(1) The year that each Board Member joined the Board is as follows:
Ellen S. Alberding, 2013; Kevin J. Bannon, 2008; Linda W. Bynoe, 2005; Barry H. Evans, 2017; Keith F. Hartstein, 2013; Laurie Simon Hodrick, 2017; Michael S. Hyland, 2008; Richard A. Redeker, 1993; Stephen G. Stoneburn, 2003; Stuart S. Parker, Board Member since 2012 and President since 2012; Scott E. Benjamin, Board Member since 2010 and Vice President since 2009; Grace C. Torres, 2014.
| | | | |
| | | |
| Fund Officers(a) | | | | |
| | | |
Name Year of Birth Fund Position | | Principal Occupation(s) During Past Five Years | | Length of
Service as Fund
Officer |
| | | |
Claudia DiGiacomo 1974 Chief Legal Officer | | Chief Legal Officer, Executive Vice President and Secretary of PGIM Investments LLC (since August 2020); Chief Legal Officer of Prudential Mutual Fund Services LLC (since August 2020); Chief Legal Officer of PIFM Holdco, LLC (since August 2020); Vice President and Corporate Counsel (since January 2005) of Prudential; and Corporate Counsel of AST Investment Services, Inc. (since August 2020); formerly Vice President and Assistant Secretary of PGIM Investments LLC (2005-2020); formerly Associate at Sidley Austin Brown & Wood LLP (1999-2004). | | Since December 2005 |
PGIM Select Real Estate Fund
| | | | |
| | | |
| Fund Officers(a) | | | | |
| | | |
Name Year of Birth Fund Position | | Principal Occupation(s) During Past Five Years | | Length of Service as Fund Officer |
| | | |
Dino Capasso 1974 Chief Compliance Officer | | Chief Compliance Officer (since July 2019) of PGIM Investments LLC; Chief Compliance Officer (since July 2019) of the PGIM Funds, Target Funds, Advanced Series Trust, The Prudential Series Fund, Prudential’s Gibraltar Fund, Inc., PGIM Global High Yield Fund, Inc., PGIM High Yield Bond Fund, Inc., and PGIM Short Duration High Yield Opportunities Fund; Vice President and Deputy Chief Compliance Officer (June 2017-2019) of PGIM Investments LLC; formerly Senior Vice President and Senior Counsel (January 2016-June 2017), and Vice President and Counsel (February 2012-December 2015) of Pacific Investment Management Company LLC. | | Since July 2019 |
| | | |
Andrew R. French 1962 Secretary | | Vice President (since December 2018) of PGIM Investments LLC; formerly Vice President and Corporate Counsel (2010-2018) of Prudential; formerly Director and Corporate Counsel (2006-2010) of Prudential; Vice President and Assistant Secretary (since January 2007) of PGIM Investments LLC; Vice President and Assistant Secretary (since January 2007) of Prudential Mutual Fund Services LLC. | | Since October 2006 |
| | | |
Diana N. Huffman 1982 Assistant Secretary | | Vice President and Corporate Counsel (since September 2015) of Prudential; Vice President and Assistant Secretary (since August 2020) of PGIM Investments LLC; formerly Associate at Willkie Farr & Gallagher LLP (2009-2015). | | Since March 2019 |
| | | |
Melissa Gonzalez 1980 Assistant Secretary | | Vice President and Corporate Counsel (since September 2018) of Prudential; Vice President and Assistant Secretary (since August 2020) of PGIM Investments LLC; formerly Director and Corporate Counsel (March 2014-September 2018) of Prudential. | | Since March 2020 |
| | | |
Patrick E. McGuinness 1986 Assistant Secretary | | Vice President and Assistant Secretary (since August 2020) of PGIM Investments LLC; Director and Corporate Counsel (since February 2017) of Prudential; and Corporate Counsel (2012-2017) of IIL, Inc. | | Since June 2020 |
| | | |
Debra Rubano 1975 Assistant Secretary | | Vice President and Corporate Counsel (since November 2020) of Prudential; formerly Director and Senior Counsel of Allianz Global Investors U.S. Holdings LLC (2010-2020) and Assistant Secretary of numerous funds in the Allianz fund complex (2015-2020). | | Since December 2020 |
| | | |
Kelly A. Coyne 1968 Assistant Secretary | | Director, Investment Operations of Prudential Mutual Fund Services LLC (since 2010). | | Since March 2015 |
Visit our website at pgim.com/investments
| | | | |
| | | |
| Fund Officers(a) | | | | |
| | | |
Name Year of Birth Fund Position | | Principal Occupation(s) During Past Five Years | | Length of Service as Fund Officer |
| | | |
Christian J. Kelly 1975 Treasurer and Principal Financial and Accounting Officer | | Vice President, Head of Fund Administration of PGIM Investments LLC (since November 2018); formerly Director of Fund Administration of Lord Abbett & Co. LLC (2009-2018), Treasurer and Principal Accounting Officer of the Lord Abbett Family of Funds (2017-2018); Director of Accounting, Avenue Capital Group (2008-2009); Senior Manager, Investment Management Practice of Deloitte & Touche LLP (1998-2007). | | Since January 2019 |
| | | |
Lana Lomuti 1967 Assistant Treasurer | | Vice President (since 2007) and Director (2005-2007), within PGIM Investments Fund Administration; formerly Assistant Treasurer (December 2007-February 2014) of The Greater China Fund, Inc. | | Since April 2014 |
| | | |
Russ Shupak 1973 Assistant Treasurer | | Vice President (since 2017) and Director (2013-2017), within PGIM Investments Fund Administration. | | Since September 2019 |
| | | |
Deborah Conway 1969 Assistant Treasurer | | Vice President (since 2017) and Director (2007-2017), within PGIM Investments Fund Administration. | | Since September 2019 |
| | | |
Elyse M. McLaughlin 1974 Assistant Treasurer | | Vice President (since 2017) and Director (2011-2017), within PGIM Investments Fund Administration. | | Since September 2019 |
| | | |
Jonathan Corbett 1983 Anti-Money Laundering Compliance Officer | | Vice President, Corporate Compliance, Global Compliance Programs and Compliance Risk Management (since August 2019) of Prudential; formerly Vice President and Head of Key Risk Areas Compliance (March 2016 to July 2019), Chief Privacy Officer (March 2016 to July 2019) and Head of Global Financial Crimes Unit (April 2014 to March 2016) at MetLife. | | Since October 2021 |
(a) Excludes Mr. Parker and Mr. Benjamin, interested Board Members who also serve as President and Vice President, respectively.
Explanatory Notes to Tables:
| ∎ | | Board Members are deemed to be “Interested,” as defined in the 1940 Act, by reason of their affiliation with PGIM Investments LLC and/or an affiliate of PGIM Investments LLC. |
| ∎ | | Unless otherwise noted, the address of all Board Members and Officers is c/o PGIM Investments LLC, 655 Broad Street, Newark, New Jersey 07102-4410. |
| ∎ | | There is no set term of office for Board Members or Officers. The Board Members have adopted a retirement policy, which calls for the retirement of Board Members on December 31 of the year in which they reach the age of 75. |
| ∎ | | “Other Directorships Held” includes all directorships of companies required to register or file reports with the SEC under the 1934 Act (that is, “public companies”) or other investment companies registered under the 1940 Act. |
| ∎ | | “Portfolios Overseen” includes all investment companies managed by PGIM Investments LLC. The investment companies for which PGIM Investments LLC serves as manager include the PGIM Funds, Target Funds, The Prudential Variable Contract Accounts, PGIM ETF Trust, PGIM High Yield Bond Fund, Inc., PGIM Global High Yield Fund, Inc., PGIM Short Duration High Yield Opportunities Fund, The Prudential Series Fund, Prudential’s Gibraltar Fund, Inc. and the Advanced Series Trust. |
| ∎ | | As used in the Fund Officers table “Prudential” means The Prudential Insurance Company of America. |
PGIM Select Real Estate Fund
Approval of Advisory Agreements (unaudited)
The Fund’s Board of Trustees
The Board of Trustees (the “Board”) of PGIM Select Real Estate Fund (the “Fund”)1 consists of ten individuals, eight of whom are not “interested persons” of the Fund, as defined in the Investment Company Act of 1940, as amended (the “1940 Act”) (the “Independent Trustees”). The Board is responsible for the oversight of the Fund and its operations, and performs the various duties imposed on the directors of investment companies by the 1940 Act. The Independent Trustees have retained independent legal counsel to assist them in connection with their duties. The Chair of the Board is an Independent Trustee. The Board has established four standing committees: the Audit Committee, the Nominating and Governance Committee, and two Investment Committees. Each committee is chaired by, and composed of, Independent Trustees.
Annual Approval of the Fund’s Advisory Agreements
As required under the 1940 Act, the Board determines annually whether to renew the Fund’s management agreement with PGIM Investments LLC (“PGIM Investments”) and the Fund’s subadvisory agreement with PGIM, Inc. (“PGIM”) on behalf of its PGIM Real Estate unit (“PGIM Real Estate”), and PGIM Real Estate (UK) Limited (“PGIM RE (UK)”). In considering the renewal of the agreements, the Board, including all of the Independent Trustees, met on June 7-10, 2021 and approved the renewal of the agreements through July 31, 2022, after concluding that the renewal of the agreements was in the best interests of the Fund and its shareholders.
In advance of the meetings, the Board requested and received materials relating to the agreements, and had the opportunity to ask questions and request further information in connection with its consideration. Among other things, the Board considered comparative fee information from PGIM Investments, PGIM and PGIM RE (UK). Also, the Board considered comparisons with other mutual funds in relevant Peer Universes and Peer Groups, as is further discussed below.
In approving the agreements, the Board, including the Independent Trustees advised by independent legal counsel, considered the factors it deemed relevant, including the nature, quality and extent of services provided by PGIM Investments and the subadvisers, the performance of the Fund, the profitability of PGIM Investments and its affiliates, expenses and fees, and the potential for economies of scale that may be shared with the Fund and its shareholders as the Fund’s assets grow. In their deliberations, the Trustees did not identify any single factor which alone was responsible for the Board’s decision to approve the agreements with respect to the Fund. In connection with its deliberations, the Board considered information provided by PGIM Investments throughout the year at regular Board meetings, presentations from portfolio managers and other information, as well as information furnished at or in advance of the meetings on June 7-10, 2021.
| 1 | PGIM Select Real Estate Fund is a series of Prudential Investment Portfolios 9. |
|
| PGIM Select Real Estate Fund |
Approval of Advisory Agreements (continued)
The Trustees determined that the overall arrangements between the Fund and PGIM Investments, which serves as the Fund’s investment manager pursuant to a management agreement, and between PGIM Investments and each of PGIM, which, through its PGIM Real Estate unit, and PGIM RE (UK), serve as the Fund’s subadvisers pursuant to the terms of a subadvisory agreement with PGIM Investments, are in the best interests of the Fund and its shareholders in light of the services performed, fees charged and such other matters as the Trustees considered relevant in the exercise of their business judgment.
The material factors and conclusions that formed the basis for the Trustees’ reaching their determinations to approve the continuance of the agreements are separately discussed below.
Nature, Quality and Extent of Services
The Board received and considered information regarding the nature, quality and extent of services provided to the Fund by PGIM Investments, PGIM Real Estate and PGIM RE (UK). The Board noted that PGIM Real Estate and PGIM RE (UK) are affiliated with PGIM Investments. The Board considered the services provided by PGIM Investments, including but not limited to the oversight of the subadvisers for the Fund, as well as the provision of fund recordkeeping, compliance and other services to the Fund, and PGIM Investments’ role as the administrator for the Fund’s liquidity risk management program. With respect to PGIM Investments’ oversight of the subadvisers, the Board noted that PGIM Investments’ Strategic Investment Research Group (“SIRG”), which is a business unit of PGIM Investments, is responsible for monitoring and reporting to PGIM Investments’ senior management on the performance and operations of the subadvisers. The Board also considered that PGIM Investments pays the salaries of all of the officers and interested Trustees of the Fund who are part of Fund management. The Board also considered the investment subadvisory services provided by PGIM Real Estate and PGIM RE (UK), including investment research and security selection, as well as adherence to the Fund’s investment restrictions and compliance with applicable Fund policies and procedures. The Board considered PGIM Investments’ evaluation of the subadvisers, as well as PGIM Investments’ recommendation, based on its review of the subadvisers, to renew the subadvisory agreement.
The Board considered the qualifications, backgrounds and responsibilities of PGIM Investments’ senior management responsible for the oversight of the Fund, PGIM Real Estate and PGIM RE (UK), and also considered the qualifications, backgrounds and responsibilities of the PGIM Real Estate and PGIM RE (UK) portfolio managers who are responsible for the day-to-day management of the Fund’s portfolio. The Board was provided with information pertaining to PGIM Investments’, PGIM Real Estate’s, PGIM’s and PGIM RE (UK)’s organizational structure, senior management, investment operations, and other relevant information pertaining to PGIM Investments, PGIM Real Estate, PGIM and PGIM RE (UK). The Board also noted that it received favorable
Visit our website at pgim.com/investments
compliance reports from the Fund’s Chief Compliance Officer (“CCO”) as to PGIM Investments, PGIM Real Estate, PGIM and PGIM RE (UK).
The Board concluded that it was satisfied with the nature, extent and quality of the investment management services provided by PGIM Investments and the subadvisory services provided to the Fund by PGIM Real Estate and PGIM RE (UK), and that there was a reasonable basis on which to conclude that the Fund benefits from the services provided by PGIM Investments, PGIM Real Estate and PGIM RE (UK) under the management and subadvisory agreements.
Costs of Services and Profits Realized by PGIM Investments
The Board was provided with information on the profitability of PGIM Investments and its affiliates in serving as the Fund’s investment manager. The Board discussed with PGIM Investments the methodology utilized in assembling the information regarding profitability and considered its reasonableness. The Board recognized that it is difficult to make comparisons of profitability from fund management contracts because comparative information is not generally publicly available and is affected by numerous factors, including the structure of the particular adviser, the types of funds it manages, its business mix, numerous assumptions regarding allocations and the adviser’s capital structure and cost of capital. However, the Board considered that the cost of services provided by PGIM Investments to the Fund during the year ended December 31, 2020 exceeded the management fees paid by the Fund, resulting in an operating loss to PGIM Investments. Taking these factors into account, the Board concluded that the profitability of PGIM Investments and its affiliates in relation to the services rendered was not unreasonable.
Economies of Scale
The Board received and discussed information concerning economies of scale that PGIM Investments may realize as the Fund’s assets grow beyond current levels. The Board noted that the management fee schedule for the Fund includes breakpoints, which have the effect of decreasing the fee rate as assets increase. During the course of time, the Board has considered information regarding the launch date of the Fund, the management fees of the Fund compared to those of similarly managed funds and PGIM Investments’ investment in the Fund over time. The Board noted that economies of scale, can be shared with the Fund in other ways, including low management fees from inception, additional technological and personnel investments to enhance shareholder services, and maintaining existing expense structures in the face of a rising cost environment. The Board considered PGIM Investments’ assertion that it continually evaluates the management fee schedule of the Fund and the potential to share economies of scale through breakpoints or fee waivers as asset levels increase.
The Board recognized the inherent limitations of any analysis of economies of scale, stemming largely from the Board’s understanding that most of PGIM Investments’ costs are not specific to individual funds, but rather are incurred across a variety of products and services.
|
| PGIM Select Real Estate Fund |
Approval of Advisory Agreements (continued)
Other Benefits to PGIM Investments, PGIM Real Estate and PGIM RE (UK)
The Board considered potential ancillary benefits that might be received by PGIM Investments, PGIM Real Estate, PGIM RE (UK) and their affiliates as a result of their relationship with the Fund. The Board concluded that potential benefits to be derived by PGIM Investments included transfer agency fees received by the Fund’s transfer agent (which is affiliated with PGIM Investments), and benefits to its reputation as well as other intangible benefits resulting from PGIM Investments’ association with the Fund. The Board concluded that the potential benefits to be derived by PGIM Real Estate and PGIM RE (UK) included their ability to use soft dollar credits, as well as the potential benefits consistent with those generally resulting from an increase in assets under management, specifically, potential access to additional research resources and benefits to its reputation. The Board concluded that the benefits derived by PGIM Investments, PGIM Real Estate and PGIM RE (UK) were consistent with the types of benefits generally derived by investment managers and subadvisers to mutual funds.
Performance of the Fund / Fees and Expenses
The Board considered certain additional factors and made related conclusions relating to the historical performance of the Fund for the one-, three- and five-year periods ended December 31, 2020. The Board considered that the Fund commenced investment operations on August 1, 2014 and that longer-term performance was not yet available.
The Board also considered the Fund’s actual management fee, as well as the Fund’s net total expense ratio, for the fiscal year ended October 31, 2020. The Board considered the management fee for the Fund as compared to the management fee charged by PGIM Investments to other funds and the fee charged by other advisers to comparable mutual funds in a Peer Group. The actual management fee represents the fee rate actually paid by Fund shareholders and includes any fee waivers or reimbursements. The net total expense ratio for the Fund represents the actual expense ratio incurred by Fund shareholders.
The mutual funds included in the Peer Universe, which was used to consider performance, and the Peer Group, which was used to consider expenses and fees, were objectively determined by Broadridge, an independent provider of mutual fund data. In certain circumstances, PGIM Investments also provided supplemental Peer Universe or Peer Group information for reasons addressed with the Board. The comparisons placed the Fund in various quartiles over various periods, with the first quartile being the best 25% of the mutual funds (for performance, the best performing mutual funds and, for expenses, the lowest cost mutual funds).
The section below summarizes key factors considered by the Board and the Board’s conclusions regarding the Fund’s performance, fees and overall expenses. The table sets forth net performance comparisons (which reflect the impact on performance of fund expenses, or any subsidies, expense caps or waivers that may be applicable) with the Peer Universe, actual management fees with the Peer Group (which reflect the
Visit our website at pgim.com/investments
impact of any subsidies or fee waivers), and net total expenses with the Peer Group, each of which were key factors considered by the Board.
| | | | | | | | |
| Net Performance | | 1 Year | | 3 Years | | 5 Years | | 10 Years |
| | 1st Quartile | | 1st Quartile | | 1st Quartile | | N/A |
| Actual Management Fees: 1st Quartile | | |
Net Total Expenses: 3rd Quartile |
| | · | | The Board noted that the Fund outperformed its benchmark index over all periods. |
| | · | | The Board and PGIM Investments contractually agreed to an expense cap that (exclusive of certain fees and expenses) caps total annual operating expenses at 1.30% for Class A shares, 2.05% for Class C shares, 1.05% for Class R6 shares, and 1.05% for Class Z shares through February 28, 2022. |
| | · | | In addition, PGIM Investments will waive management fees or shared operating expenses on any share class to the same extent that it waives such expenses on any other share class, and has agreed that total annual fund operating expenses for Class R6 shares will not exceed total annual fund operating expenses for Class Z shares. |
| | · | | The Board concluded that, in light of the above, it would be in the best interests of the Fund and its shareholders to renew the agreements. |
| | · | | The Board concluded that the management fees (including subadvisory fees) and total expenses were reasonable in light of the services provided. |
* * *
After full consideration of these factors, the Board concluded that the approval of the agreements was in the best interests of the Fund and its shareholders.
|
| PGIM Select Real Estate Fund |
| | | | |
| ∎ MAIL | | ∎ TELEPHONE | | ∎ WEBSITE |
| 655 Broad Street | | (800) 225-1852 | | pgim.com/investments |
Newark, NJ 07102 | | | | |
|
| |
| PROXY VOTING |
| |
The Board of Trustees of the Fund has delegated to the Fund’s subadvisers the responsibility for voting any proxies and maintaining proxy recordkeeping with respect to the Fund. A description of these proxy voting policies and procedures is available without charge, upon request, by calling (800) 225-1852 or by visiting the Securities and Exchange Commission’s website at sec.gov. Information regarding how the Fund voted proxies relating to portfolio securities during the most recent 12-month period ended June 30 is available on the Fund’s website and on the Securities and Exchange Commission’s website. |
| |
| |
| TRUSTEES |
| |
Ellen S. Alberding · Kevin J. Bannon · Scott E. Benjamin · Linda W. Bynoe · Barry H. Evans · Keith F. Hartstein · Laurie Simon Hodrick · Stuart S. Parker · Brian K. Reid · Grace C. Torres |
| |
| |
| OFFICERS |
| |
Stuart S. Parker, President · Scott E. Benjamin, Vice President · Christian J. Kelly, Treasurer and Principal Financial and Accounting Officer · Claudia DiGiacomo, Chief Legal Officer · Dino Capasso, Chief Compliance Officer · Jonathan Corbett, Anti-Money Laundering Compliance Officer · Andrew R. French, Secretary · Melissa Gonzalez, Assistant Secretary · Diana N. Huffman, Assistant Secretary · Kelly A. Coyne, Assistant Secretary · Patrick E. McGuinness, Assistant Secretary · Debra Rubano, Assistant Secretary · Lana Lomuti, Assistant Treasurer · Russ Shupak, Assistant Treasurer · Elyse M. McLaughlin, Assistant Treasurer · Deborah Conway, Assistant Treasurer |
| | | | |
| MANAGER | | PGIM Investments LLC | | 655 Broad Street |
| | | | | Newark, NJ 07102 |
| | |
| SUBADVISERS | | PGIM Real Estate | | 7 Giralda Farms |
| | | | Madison, NJ 07940 |
| | |
| | PGIM Real Estate (UK) | | Grand Buildings, 1-3 Strand |
| | Limited | | Trafalgar Square |
| | | | London, WC2N 5HR |
| | | | | United Kingdom |
| | |
| DISTRIBUTOR | | Prudential Investment | | 655 Broad Street |
| | | Management Services LLC | | Newark, NJ 07102 |
| | |
| CUSTODIAN | | The Bank of New York | | 240 Greenwich Street |
| | | Mellon | | New York, NY 10286 |
| | |
| TRANSFER AGENT | | Prudential Mutual Fund | | PO Box 9658 |
| | | Services LLC | | Providence, RI 02940 |
| | |
| INDEPENDENT REGISTERED | | PricewaterhouseCoopers | | 300 Madison Avenue |
| PUBLIC ACCOUNTING FIRM | | LLP | | New York, NY 10017 |
| | |
| FUND COUNSEL | | Willkie Farr & Gallagher | | 787 Seventh Avenue |
| | | LLP | | New York, NY 10019 |
|
| |
An investor should consider the investment objectives, risks, charges, and expenses of the Fund carefully before investing. The prospectus and summary prospectus contain this and other information about the Fund. An investor may obtain the prospectus and summary prospectus by visiting our website at pgim.com/investments or by calling (800) 225-1852. The prospectus and summary prospectus should be read carefully before investing. |
| |
| |
| E-DELIVERY |
| |
To receive your mutual fund documents online, go to pgim.com/investments/resource/edelivery and enroll. Instead of receiving printed documents by mail, you will receive notification via email when new materials are available. You can cancel your enrollment or change your email address at any time by visiting the website address above. |
| |
| |
| SHAREHOLDER COMMUNICATIONS WITH TRUSTEES |
| |
Shareholders can communicate directly with the Board of Trustees by writing to the Chair of the Board, PGIM Select Real Estate Fund, PGIM Investments, Attn: Board of Trustees, 655 Broad Street, Newark, NJ 07102. Shareholders can communicate directly with an individual Trustee by writing to that Trustee at the same address. Communications are not screened before being delivered to the addressee. |
| |
| AVAILABILITY OF PORTFOLIO HOLDINGS |
| |
The Fund files its complete schedule of portfolio holdings with the Securities and Exchange Commission for the first and third quarters of each fiscal year as an exhibit to its reports on Form N-PORT. The Fund’s Form N-PORT filings are available on the Commission’s website at sec.gov. |
| |
| |
The Fund’s Statement of Additional Information contains additional information about the Fund’s Trustees and is available without charge, upon request, by calling (800) 225-1852. |
| | | | |
Mutual Funds: | | | | |
ARE NOT INSURED BY THE FDIC OR ANY
FEDERAL GOVERNMENT AGENCY | | MAY LOSE VALUE | | ARE NOT A DEPOSIT OF OR GUARANTEED BY ANY BANK OR ANY BANK AFFILIATE |
| | | | | | | | |
PGIM SELECT REAL ESTATE FUND |
| | | | |
| SHARE CLASS | | A | | C | | Z | | R6 |
| | | | |
NASDAQ | | SREAX | | SRECX | | SREZX | | SREQX |
| | | | |
CUSIP | | 74441J811 | | 74441J795 | | 74441J779 | | 74441J787 |
MF223E

PGIM INTERNATIONAL BOND FUND
ANNUAL REPORT
OCTOBER 31, 2021

|
|
| To enroll in e-delivery, go to pgim.com/investments/resource/edelivery |
Table of Contents
This report is not authorized for distribution to prospective investors unless preceded or accompanied by a current prospectus.
The views expressed in this report and information about the Fund’s portfolio holdings are for the period covered by this report and are subject to change thereafter.
Mutual funds are distributed by Prudential Investment Management Services LLC (PIMS), member SIPC. PGIM Fixed Income is a unit of PGIM, Inc. (PGIM), a registered investment adviser. PIMS and PGIM are Prudential Financial companies. © 2021 Prudential Financial, Inc. and its related entities. PGIM and the PGIM logo are service marks of Prudential Financial, Inc. and its related entities, registered in many jurisdictions worldwide.
2 Visit our website at pgim.com/investments
Letter from the President
| | |
 | | Dear Shareholder: |
| | We hope you find the annual report for the PGIM International Bond Fund informative and useful. The report covers performance for the 12-month period that ended October 31, 2021. |
| | The global economy and markets continued to recover throughout the period from the ongoing impact of the COVID-19 pandemic. The Federal Reserve slashed interest rates and kept them near zero to encourage borrowing. Congress passed stimulus bills worth several trillion dollars to help consumers and businesses. And several effective COVID-19 vaccines received regulatory approval. Those measures were enough to offset the fear of rising inflation and supply chain challenges that threatened to disrupt growth. |
At the start of the period, stocks had recovered most of the steep losses they had suffered at the onset of the pandemic. Equities rallied as states reopened their economies but became more volatile as investors worried that a surge in COVID-19 infections would stall the recovery. However, rising corporate profits and economic growth, the resolution of the US presidential election, and the global rollout of approved vaccines lifted equity markets to record levels, helping stocks around the globe post gains for the full period.
Throughout this volatile period, investors sought safety in fixed income. Investment-grade bonds in the US and the overall global bond market declined slightly during the period as the economy recovered, but emerging market debt rose. While the 10-year US Treasury yield hovered near record lows early in the period after a significant rally in interest rates, rates moved higher later on as investors began to focus on stronger economic growth and the prospects of higher inflation. The Fed also took several aggressive actions to keep the bond markets running smoothly, implementing many of the relief programs that proved to be successful in helping end the global financial crisis in 2008-09.
Regarding your investments with PGIM, we believe it is important to maintain a diversified portfolio of funds consistent with your tolerance for risk, time horizon, and financial goals. Your financial advisor can help you create a diversified investment plan that may include funds covering all the basic asset classes and that reflects your personal investor profile and risk tolerance. However, diversification and asset allocation strategies do not assure a profit or protect against loss in declining markets.
At PGIM Investments, we consider it a great privilege and responsibility to help investors participate in opportunities across global markets while meeting their toughest investment challenges. PGIM is a top-10 global investment manager with more than $1.5 trillion in assets under management. This scale and investment expertise allow us to deliver actively managed funds and strategies to meet the needs of investors around the globe.
|
| Thank you for choosing our family of funds. |
|
| Sincerely, |

|
| Stuart S. Parker, President |
|
| PGIM International Bond Fund |
| December 15, 2021 |
PGIM International Bond Fund 3
Your Fund’s Performance (unaudited)
Performance data quoted represent past performance. Past performance does not guarantee future results. The investment return and principal value of an investment will fluctuate so that an investor’s shares, when redeemed, may be worth more or less than their original cost. Current performance may be lower or higher than the past performance data quoted. An investor may obtain performance data as of the most recent month-end by visiting our website at pgim.com/investments or by calling (800) 225-1852.
| | | | |
| |
| | | Average Annual Total Returns as of 10/31/21 |
| | | One Year (%) | | Since Inception (%) |
| | |
Class A | | | | |
| | |
(with sales charges) | | -5.11 | | 3.98 (12/14/2016) |
| | |
(without sales charges) | | -1.93 | | 4.68 (12/14/2016) |
| | |
Class C | | | | |
| | |
(with sales charges) | | -3.62 | | 3.90 (12/14/2016) |
| | |
(without sales charges) | | -2.66 | | 3.90 (12/14/2016) |
| | |
Class Z | | | | |
| | |
(without sales charges) | | -1.57 | | 4.99 (12/14/2016) |
| | |
Class R6 | | | | |
| | |
(without sales charges) | | -1.53 | | 5.01 (12/14/2016) |
| | |
Bloomberg Global Aggregate ex-USD (USD Hedged) Index | | | | |
| | |
| | | -1.26 | | 3.14 |
Since Inception returns are provided since the Fund has less than 10 fiscal years of returns. Since Inception returns for the Index are measured from the closest month-end to the Fund’s inception date.
4 Visit our website at pgim.com/investments
Growth of a $10,000 Investment (unaudited)
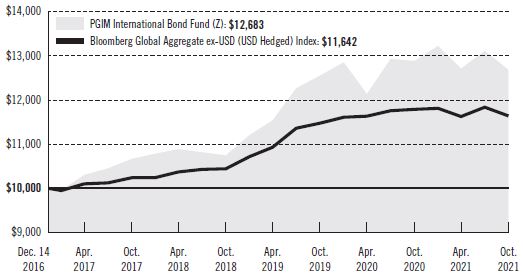
The graph compares a $10,000 investment in the Fund’s Class Z shares with a similar investment in the Bloomberg Global Aggregate ex-USD (USD Hedged) Index by portraying the initial account values at the commencement of operations for Class Z shares (December 14, 2016) and the account values at the end of the current fiscal year (October 31, 2021), as measured on a quarterly basis. For purposes of the graph, and unless otherwise indicated, it has been assumed that (a) all recurring fees (including management fees) were deducted and (b) all dividends and distributions were reinvested. The line graph provides information for Class Z shares only. As indicated in the tables provided earlier, performance for other share classes will vary due to the differing fees and expenses applicable to each share class (as indicated in the following paragraphs). Without waiver of fees and/or expense reimbursements, if any, the returns would have been lower.
Past performance does not predict future performance. Total returns and the ending account values in the graph include changes in share price and reinvestment of dividends and capital gains distributions in a hypothetical investment for the periods shown. The Fund’s total returns do not reflect the deduction of income taxes on an individual’s investment. Taxes may reduce your actual investment returns on income or gains paid by the Fund or any gains you may realize if you sell your shares.
PGIM International Bond Fund 5
Your Fund’s Performance (continued)
The returns in the tables do not reflect the deduction of taxes that a shareholder would pay on Fund distributions or following the redemption of Fund shares. The average annual total returns take into account applicable sales charges, which are described for each share class in the table below.
| | | | | | | | |
| | | | | |
| | | Class A | | Class C | | Class Z | | Class R6 |
| | | | | |
Maximum initial sales charge | | 3.25% of the public offering price | | None | | None | | None |
Contingent deferred sales charge (CDSC) (as a percentage of the lower of the original purchase price or the net asset value at redemption) | | 1.00% on sales of $500,000 or more made within 12 months of purchase | | 1.00% on sales made within 12 months of purchase | | None | | None |
Annual distribution and service (12b-1) fees (shown as a percentage of average daily net assets) | | 0.25% | | 1.00% | | None | | None |
Benchmark Definitions
Bloomberg Global Aggregate ex-USD (USD Hedged) Index—The Bloomberg Global Aggregate ex-USD (USD Hedged) Index provides a broad-based measure of the global investment-grade fixed income markets, with index components for the Pan-European Aggregate and the Asian-Pacific Aggregate excluding US dollar-denominated components.
Investors cannot invest directly in an index. The returns for the Index would be lower if they included the effects of sales charges, operating expenses of a mutual fund, or taxes that may be paid by an investor.
6 Visit our website at pgim.com/investments
| | | | | | |
|
| Distributions and Yields as of 10/31/21 |
| | | |
| | | Total Distributions Paid for 12 Months ($) | | SEC 30-Day Subsidized Yield* (%) | | SEC 30-Day Unsubsidized Yield** (%) |
| | | |
Class A | | 0.29 | | 0.82 | | 2.24 |
| | | |
Class C | | 0.22 | | 0.13 | | 2.90 |
| | | |
Class Z | | 0.33 | | 1.21 | | 1.10 |
| | | |
Class R6 | | 0.33 | | 1.26 | | 0.89 |
*SEC 30-Day Subsidized Yield (%)—A standardized yield calculation created by the Securities and Exchange Commission, it reflects the income earned during a 30-day period, after the deduction of the Fund’s net expenses (net of any expense waivers or reimbursements). The investor experience is represented by the SEC 30-Day Subsidized Yield.
**SEC 30-Day Unsubsidized Yield (%)—A standardized yield calculation created by the Securities and Exchange Commission, it reflects the income earned during a 30-day period, after the deduction of the Fund’s gross expenses. The investor experience is represented by the SEC 30-Day Subsidized Yield.
| | | | |
| |
| Credit Quality expressed as a percentage of total investments as of 10/31/21 (%) | | |
| |
AAA | | | 6.2 | |
| |
AA | | | 2.9 | |
| |
A | | | 16.3 | |
| |
BBB | | | 43.4 | |
| |
BB | | | 15.2 | |
| |
B | | | 8.5 | |
| |
CCC | | | 0.8 | |
| |
Not Rated | | | 3.9 | |
| |
Cash/Cash Equivalents | | | 2.8 | |
| | |
| Total | | | 100.0 | |
Credit ratings reflect the highest rating assigned by a nationally recognized statistical rating organization (NRSRO) such as Moody’s Investors Service, Inc. (Moody’s), S&P Global Ratings (S&P), or Fitch, Inc. (Fitch). Credit ratings reflect the common nomenclature used by both S&P and Fitch. Where applicable, ratings are converted to the comparable S&P/Fitch rating tier nomenclature. These rating agencies are independent and are widely used. The Not Rated category consists of securities that have not been rated by an NRSRO. Credit ratings are subject to change.
PGIM International Bond Fund 7
Strategy and Performance Overview (unaudited)
How did the Fund perform?
The PGIM International Bond Fund’s Class Z shares returned -1.57% in the 12-month reporting period that ended October 31, 2021, underperforming the -1.26% return of the Bloomberg Global Aggregate ex-USD (USD Hedged) Index (the Index).
What were the market conditions?
| · | | The strong global rebound from the depths of the COVID-19 pandemic continued throughout the reporting period, as economies continued to respond to the unprecedented monetary and fiscal stimulus programs. The effective rollout of COVID-19 vaccines, along with clear messaging from both President Biden and the Federal Reserve (the Fed) on the potential for further stimulus, shifted the prospects for growth and inflation, kicking off a robust “reflation trade” in bond markets, which caused the US Treasury yield curve to steepen over the period. (A yield curve is a line graph that illustrates the relationship between the yields and maturities of fixed income securities. It is created by plotting the yields of different maturities for the same type of bonds.) |
| · | | Although yields for short-term Treasuries remained well anchored during the first quarter of 2021 by the Fed’s commitment to maintain its low-rate policy, longer-term Treasuries sold off sharply, with the yield on the benchmark US 10-year Treasury note rising from 0.92% on December 31, 2020, to 1.74% by March 31, 2021. Similarly, the yield on the 30-year Treasury bond rose from 1.65% to 2.41% over the same period. |
| · | | Market volatility for rates then eased in the second and third quarters of 2021, with long-term US Treasury yields declining gradually before rising again in late September after the Fed signaled it could begin tapering its monthly bond purchases shortly after its November meeting. The US 10-year and 30-year Treasury yields ended the period at 1.55% and 1.93%, respectively. Meanwhile, the yield on the 2-year Treasury note rose sharply the last month of the period as markets began pricing in two rate hikes in 2022, ending October 31, 2021, at 0.45%—a rise of 28 basis points (bps) over the period. (One basis point equals 0.01%.) Despite flattening over the last six months of the period as the market pulled forward its expectation for rate hikes, the US Treasury yield curve steepened during the period, with the 10-year and 2-year Treasury spread rising from 0.74% to 1.07% as of October 31, 2021. |
| · | | In Europe, German 10-year bond yields rose to end the period at -0.10%, as rate hike expectations were brought forward amid concerns about prolonged inflation even as the European Central Bank continued to signal rate hikes in 2022 were unlikely. Similarly, United Kingdom (UK) 10-year bond yields rose over the period to end October 31, 2021, at 1.03% amid inflation concerns driven by demand and supply-chain bottlenecks. |
| · | | Spread markets continued to tighten, supported by the Fed’s monetary responses, fiscal stimulus, the rollout of COVID-19 vaccines, better-than-expected corporate earnings, and surging growth in the US, Europe, and some emerging market economies. (Spread markets are non-government-related sectors of the fixed income |
8 Visit our website at pgim.com/investments
| | market, such as investment grade corporate bonds, high yield bonds, or asset-backed securities.) Strengthening economic fundamentals coupled with aggressive central bank measures (e.g., zero interest rate policies and asset purchases) drove corporate and securitized asset spreads tighter, with many sectors rallying to, or through, their pre-COVID-19 levels. |
| · | | The US investment grade corporate market performed well, with spreads tightening to near-historic levels by the end of the period, supported by better-than-expected corporate earnings, positive vaccination progress, and a favorable technical backdrop. Strengthening fundamentals generally kept securitized credit on a tightening trajectory as well, with commercial mortgage-backed securities (CMBS) spreads trading well below their pre-pandemic tights by the end of the period. US high yield bond spreads tightened as fundamentals remained supportive. Meanwhile, emerging market spreads tightened, boosting returns as investor appetite remained strong amid a global search for yield. |
What worked?
| · | | Security selection and sector allocation both contributed to the Fund’s performance over the reporting period. |
| · | | Within security selection, positions in developed high yield, emerging sovereigns, emerging agencies, developed sovereigns, developed CMBS, and developed investment grade corporate were the largest contributors for the period. |
| · | | Within sector allocation, overweights to emerging sovereigns, developed asset-backed securities (ABS), developed high yield, and developed CMBS relative to the Index were the largest contributors to performance. |
| · | | Within credit, positioning in foreign non-corporates, retailers & restaurants, capital goods, and telecom contributed. |
| · | | In individual security selection, the Fund benefited from overweights to Ukraine, Greece, and Indonesia sovereign bonds relative to the Index, along with an overweight to Petroleos Mexicanos SA de CV (foreign non-corporate). |
What didn’t work?
| · | | During the reporting period, the Fund’s long duration bias, principally in emerging market rates, detracted from returns. (Duration measures the sensitivity of the price—the value of principal—of a bond to a change in interest rates.) The Fund’s yield curve flattener positioning in US rates also detracted as the curve steepened over the period. (A yield curve flattener is an interest rate environment in which long-term rates are decreasing more quickly than short-term rates.) |
| · | | Although overall security selection contributed to performance, positioning in emerging LIBOR (London Interbank Offered Rate) derivatives, developed LIBOR derivatives, emerging Treasuries, and developed ABS detracted from performance. |
PGIM International Bond Fund 9
Strategy and Performance Overview (continued)
Within sector allocation, an underweight to developed investment grade corporates and developed local authorities, along with an overweight to emerging treasuries relative to the Index detracted from performance.
| · | | In individual security selection, an underweight to Japan and United Kingdom sovereign bonds, along with overweights to Holdco Ltd. (food), and Cooperatieve Rabobank U.A. (banking) relative to the Index detracted from performance. |
Did the Fund use derivatives?
The Fund uses derivatives when they facilitate implementation of the overall investment approach. During the reporting period, the Fund used interest rate futures, options, and swaps to help manage duration positioning and yield curve exposure. Over the period, futures and options contributed to performance while swaps detracted. Credit default swaps and credit default swap index (CDX) positions were used to either add risk exposure to certain issuers or to hedge credit risk imposed by certain issuers. Overall, credit derivative exposure contributed during the period. In addition, the Fund traded foreign-exchange derivatives, which had a negative impact on performance over the period.
Current outlook
| · | | As the Fed’s tapering approached, PGIM Fixed Income believed the Fed would likely draw a clear distinction between the removal of accommodation via reduction in asset purchases and tightening of policy through rate hikes in the federal funds rate target. |
| · | | Looking beyond the next year or two, PGIM Fixed Income believes the secular fundamental drivers—such as aging demographics and high debt levels—that pushed rates lower for decades are likely to reassert themselves with even more downward force on rates in a post-COVID world of older populations and markedly higher debt levels. As a result, many central bankers may end up leaving administered rates near, or at, their effective lower bounds, and rate hike cycles will likely continue cresting at progressively lower levels. From that perspective, the third quarter 2021 increase in longer-term rates—which lifted them back up to levels that reflect a substantial and permanent rise in administered rates over the coming years—has probably already overshot fundamentals, in PGIM Fixed Income’s view. |
| · | | As for spread sectors, PGIM Fixed Income continues to expect the ongoing economic expansion to support credit fundamentals and, in turn, to allow credit products to continue outperforming. Given the relatively narrow level of spreads, however, excess returns are likely to be more modest, deriving primarily from incremental yield and rolling down the spread curve, rather than from the kinds of wholesale spread compression seen since March 2020. (Roll-down return is a strategy for selling a bond as it approaches its maturity date. In general, as a bond’s maturity date grows closer, its interest rate moves closer to zero. Since there is an inverse relationship between bond yields and prices, bond prices increase as their interest rates decrease.) |
10 Visit our website at pgim.com/investments
| · | | PGIM Fixed Income maintains its positive view of the spread sectors over the medium to long term, and the Fund holds allocations to an array of credit sectors, including both investment-grade and high yield corporates, high-quality structured products, and emerging markets. While valuations are now a bit full, with spreads in many sectors tighter than historical norms, PGIM Fixed Income generally expects ongoing spread sector outperformance. However, this outlook is not without caveats. First, the relatively narrow level of spreads diminishes the pace and magnitude of further outperformance. Additionally, narrower spreads leave little room for error, and the uncertain course of the long-term economic recovery warrants a discerning approach to credit selection. |
| · | | Within structured products, PGIM Fixed Income is biased to own the top of the capital structure, as near-zero policy rates and ongoing Fed purchases support a spread tightening environment. In investment grade corporates, PGIM Fixed Income is looking to take advantage of spread compression in select higher-yielding BBB-rated bonds, solid credits in stressed industries, and cyclicals. PGIM Fixed Income remains constructive on high yield over the medium term as improving fundamentals and a decline in defaults is expected to drive spread compression going forward, and it believes the prospects for emerging market debt performance are encouraging given the supportive backdrop, attractive valuations, and global search for yield. |
PGIM International Bond Fund 11
Fees and Expenses (unaudited)
As a shareholder of the Fund, you incur two types of costs: (1) transaction costs, including sales charges (loads) on purchase payments and redemptions, as applicable, and (2) ongoing costs, including management fees, distribution and/or service (12b-1) fees, and other Fund expenses, as applicable. This example is intended to help you understand your ongoing costs (in dollars) of investing in the Fund and to compare these costs with the ongoing costs of investing in other mutual funds.
The example is based on an investment of $1,000 held through the six-month period ended October 31, 2021. The example is for illustrative purposes only; you should consult the Prospectus for information on initial and subsequent minimum investment requirements.
Actual Expenses
The first line for each share class in the table on the following page provides information about actual account values and actual expenses. You may use the information on this line, together with the amount you invested, to estimate the expenses that you paid over the period. Simply divide your account value by $1,000 (for example, an $8,600 account value ÷ $1,000 = 8.6), then multiply the result by the number on the first line under the heading “Expenses Paid During the Six-Month Period” to estimate the expenses you paid on your account during this period.
Hypothetical Example for Comparison Purposes
The second line for each share class in the table on the following page provides information about hypothetical account values and hypothetical expenses based on the Fund’s actual expense ratio and an assumed rate of return of 5% per year before expenses, which is not the Fund’s actual return. The hypothetical account values and expenses may not be used to estimate the actual ending account balance or expenses you paid for the period. You may use this information to compare the ongoing costs of investing in the Fund and other funds. To do so, compare this 5% hypothetical example with the 5% hypothetical examples that appear in the shareholder reports of the other funds.
The Fund’s transfer agent may charge additional fees to holders of certain accounts that are not included in the expenses shown in the table on the following page. These fees apply to individual retirement accounts (IRAs) and Section 403(b) accounts. As of the close of the six-month period covered by the table, IRA fees included an annual maintenance fee of $15 per account (subject to a maximum annual maintenance fee of $25 for all accounts held by the same shareholder). Section 403(b) accounts are charged an annual $25 fiduciary maintenance fee. Some of the fees may vary in amount, or may be waived, based on your total account balance or the number of PGIM funds, including the Fund, that you own. You should consider the additional fees that were charged to your Fund account over the six-month period when you estimate the total ongoing expenses paid over the period and the impact of these fees on your ending account value, as these additional expenses are not reflected in the information
12 Visit our website at pgim.com/investments
provided in the expense table. Additional fees have the effect of reducing investment returns.
Please note that the expenses shown in the table are meant to highlight your ongoing costs only and do not reflect any transactional costs such as sales charges (loads). Therefore, the second line for each share class in the table is useful in comparing ongoing costs only and will not help you determine the relative total costs of owning different funds. In addition, if these transactional costs were included, your costs would have been higher.
| | | | | | | | | | | | |
| | | | | |
| PGIM International Bond Fund | | Beginning Account Value May 1, 2021 | | Ending Account Value October 31, 2021 | | Annualized Expense Ratio Based on the Six-Month Period | | Expenses Paid During the Six-Month Period* |
| | | | | |
Class A | | Actual | | $1,000.00 | | | $ 996.00 | | | 0.99% | | $4.98 |
| | Hypothetical | | $1,000.00 | | | $1,020.21 | | | 0.99% | | $5.04 |
| | | | | |
Class C | | Actual | | $1,000.00 | | | $ 992.20 | | | 1.74% | | $8.74 |
| | Hypothetical | | $1,000.00 | | | $1,016.43 | | | 1.74% | | $8.84 |
| | | | | |
Class Z | | Actual | | $1,000.00 | | | $ 997.80 | | | 0.63% | | $3.17 |
| | Hypothetical | | $1,000.00 | | | $1,022.03 | | | 0.63% | | $3.21 |
| | | | | |
Class R6 | | Actual | | $1,000.00 | | | $ 998.00 | | | 0.58% | | $2.92 |
| | | Hypothetical | | $1,000.00 | | | $1,022.28 | | | 0.58% | | $2.96 |
*Fund expenses (net of fee waivers or subsidies, if any) for each share class are equal to the annualized expense ratio for each share class (provided in the table), multiplied by the average account value over the period, multiplied by the 184 days in the six-month period ended October 31, 2021, and divided by the 365 days in the Fund’s fiscal year ended October 31, 2021 (to reflect the six-month period). Expenses presented in the table include the expenses of any underlying portfolios in which the Fund may invest.
PGIM International Bond Fund 13
Schedule of Investments
as of October 31, 2021
| | | | | | | | | | | | | | | | | | | | |
| | | | | |
| Description | | Interest Rate | | | Maturity Date | | | | | | Principal Amount
(000)# | | | Value | |
| | | | | |
LONG-TERM INVESTMENTS 95.7% | | | | | | | | | | | | | | | | | | | | |
| | | | | |
ASSET-BACKED SECURITIES 4.8% | | | | | | | | | | | | | | | | | | | | |
| | | | | |
Cayman Islands 3.6% | | | | | | | | | | | | | | | | | | | | |
| | | | | |
HPS Loan Management Ltd., | | | | | | | | | | | | | | | | | | | | |
Series 10A-16, Class A1RR, 144A, 3 Month LIBOR + 1.140% (Cap N/A, Floor 1.140%) | | | 1.274%(c) | | | | 04/20/34 | | | | | | | | 500 | | | $ | 498,276 | |
Series 15A-19, Class A1, 144A, 3 Month LIBOR + 1.320% (Cap N/A, Floor 1.320%) | | | 1.448(c) | | | | 07/22/32 | | | | | | | | 250 | | | | 250,038 | |
Mountain View CLO Ltd., | | | | | | | | | | | | | | | | | | | | |
Series 2019-01A, Class A1R, 144A, 3 Month LIBOR + 1.250% (Cap N/A, Floor 1.250%) | | | 1.374(c) | | | | 10/15/34 | | | | | | | | 250 | | | | 250,048 | |
Silver Creek CLO Ltd., | | | | | | | | | | | | | | | | | | | | |
Series 2014-01A, Class AR, 144A, 3 Month LIBOR + 1.240% (Cap N/A, Floor 0.000%) | | | 1.372(c) | | | | 07/20/30 | | | | | | | | 246 | | | | 246,347 | |
| | | | | | | | | | | | | | | | | | | | |
| | | | | |
| | | | | | | | | | | | | | | | | | | 1,244,709 | |
| | | | | |
United States 1.2% | | | | | | | | | | | | | | | | | | | | |
| | | | | |
Oportun Funding XIII LLC, | | | | | | | | | | | | | | | | | | | | |
Series 2019-A, Class B, 144A | | | 3.870 | | | | 08/08/25 | | | | | | | | 100 | | | | 101,495 | |
PNMAC GMSR Issuer Trust, | | | | | | | | | | | | | | | | | | | | |
Series 2018-GT02, Class A, 144A, 1 Month LIBOR + 2.650% (Cap N/A, Floor 0.000%) | | | 2.739(c) | | | | 08/25/25 | | | | | | | | 100 | | | | 99,970 | |
SoFi Alternative Trust, | | | | | | | | | | | | | | | | | | | | |
Series 2019-D, Class 1PT, 144A | | | 2.847(cc) | | | | 01/16/46 | | | | | | | | 82 | | | | 84,355 | |
TH MSR Issuer Trust, | | | | | | | | | | | | | | | | | | | | |
Series 2019-FT01, Class A, 144A, 1 Month LIBOR + 2.800% (Cap N/A, Floor 2.800%) | | | 2.889(c) | | | | 06/25/24 | | | | | | | | 150 | | | | 149,633 | |
| | | | | | | | | | | | | | | | | | | | |
| | | | | |
| | | | | | | | | | | | | | | | | | | 435,453 | |
| | | | | | | | | | | | | | | | | | | | |
| | | | | |
TOTAL ASSET-BACKED SECURITIES
(cost $1,680,330) | | | | | | | | | | | | | | | | | | | 1,680,162 | |
| | | | | | | | | | | | | | | | | | | | |
| | | |
COMMERCIAL MORTGAGE-BACKED SECURITIES 6.3% | | | | | | | | | | | | | |
| | | | | |
Canada 0.1% | | | | | | | | | | | | | | | | | | | | |
| | | | | |
Real Estate Asset Liquidity Trust, | | | | | | | | | | | | | | | | | | | | |
Series 2020-01A, Class A1, 144A | | | 2.381(cc) | | | | 02/12/55 | | | | CAD | | | | 23 | | | | 18,881 | |
| | | | | | | | | | | | | | | | | | | | |
| | | | | |
Ireland 1.2% | | | | | | | | | | | | | | | | | | | | |
| | | | | |
Taurus DAC, | | | | | | | | | | | | | | | | | | | | |
Series 2021-UK4A, Class B, 144A, SONIA + 1.500% | | | 1.550(c) | | | | 08/17/31 | | | | GBP | | | | 100 | | | | 136,594 | |
See Notes to Financial Statements.
PGIM International Bond Fund 15
Schedule of Investments (continued)
as of October 31, 2021
| | | | | | | | | | | | | | | | | | | | |
| | | | | |
| Description | | Interest Rate | | | Maturity Date | | | | | | Principal Amount
(000)# | | | Value | |
| | | |
COMMERCIAL MORTGAGE-BACKED SECURITIES (Continued) | | | | | | | | | | | | | |
| | | | | |
Ireland (cont’d.) | | | | | | | | | | | | | | | | | | | | |
| | | | | |
Taurus DAC, (cont’d.) | | | | | | | | | | | | | | | | | | | | |
Series 2021-UK4A, Class C, 144A, SONIA + 1.750% | | | 1.800%(c) | | | | 08/17/31 | | | | GBP | | | | 100 | | | $ | 136,566 | |
Series 2021-UK4A, Class D, 144A, SONIA + 2.100% | | | 2.150(cc) | | | | 08/17/31 | | | | GBP | | | | 100 | | | | 136,608 | |
| | | | | | | | | | | | | | | | | | | | |
| | | | | |
| | | | | | | | | | | | | | | | | | | 409,768 | |
| | | | | |
United Kingdom 0.8% | | | | | | | | | | | | | | | | | | | | |
| | | | | |
Salus European Loan Conduit DAC, | | | | | | | | | | | | | | | | | | | | |
Series 33A, Class A, 144A, 3 Month GBP LIBOR + 1.500% (Cap 6.500%, Floor 1.500%) | | | 1.704(c) | | | | 01/23/29 | | | | GBP | | | | 200 | | | | 274,395 | |
| | | | | | | | | | | | | | | | | | | | |
| | | | | |
United States 4.2% | | | | | | | | | | | | | | | | | | | | |
| | | | | |
BX Commercial Mortgage Trust, | | | | | | | | | | | | | | | | | | | | |
Series 2019-XL, Class J, 144A, 1 Month LIBOR + 2.650% (Cap N/A, Floor 2.650%) | | | 2.740(c) | | | | 10/15/36 | | | | | | | | 255 | | | | 254,365 | |
Cold Storage Trust, | | | | | | | | | | | | | | | | | | | | |
Series 2020-ICE05, Class E, 144A, 1 Month LIBOR + 2.766% (Cap N/A, Floor 2.833%) | | | 2.856(c) | | | | 11/15/37 | | | | | | | | 98 | | | | 98,240 | |
FHLMC Multifamily Structured Pass-Through Certificates, | | | | | | | | | | | | | | | | | | | | |
Series K111, Class X1, IO | | | 1.572(cc) | | | | 05/25/30 | | | | | | | | 399 | | | | 46,426 | |
Series K113, Class X1, IO | | | 1.387(cc) | | | | 06/25/30 | | | | | | | | 1,155 | | | | 119,800 | |
Series KG03, Class X1, IO | | | 1.381(cc) | | | | 06/25/30 | | | | | | | | 1,290 | | | | 130,334 | |
MKT Mortgage Trust, | | | | | | | | | | | | | | | | | | | | |
Series 2020-525M, Class F, 144A | | | 2.941(cc) | | | | 02/12/40 | | | | | | | | 250 | | | | 231,687 | |
Morgan Stanley Capital I Trust, | | | | | | | | | | | | | | | | | | | | |
Series 2019-MEAD, Class E, 144A | | | 3.177(cc) | | | | 11/10/36 | | | | | | | | 300 | | | | 287,044 | |
One New York Plaza Trust, | | | | | | | | | | | | | | | | | | | | |
Series 2020-01NYP, Class C, 144A, 1 Month LIBOR + 2.200% (Cap N/A, Floor 2.200%) | | | 2.290(c) | | | | 01/15/26 | | | | | | | | 100 | | | | 100,381 | |
Series 2020-01NYP, Class D, 144A, 1 Month LIBOR + 2.750% (Cap N/A, Floor 2.750%) | | | 2.840(c) | | | | 01/15/26 | | | | | | | | 100 | | | | 100,501 | |
Wells Fargo Commercial Mortgage Trust, | | | | | | | | | | | | | | | | | | | | |
Series 2021-FCMT, Class C, 144A, 1 Month LIBOR + 2.400% (Cap N/A, Floor 2.400%) | | | 2.490(c) | | | | 05/15/31 | | | | | | | | 100 | | | | 100,031 | |
| | | | | | | | | | | | | | | | | | | | |
| | | | | |
| | | | | | | | | | | | | | | | | | | 1,468,809 | |
| | | | | | | | | | | | | | | | | | | | |
| | | | |
TOTAL COMMERCIAL MORTGAGE-BACKED SECURITIES
(cost $2,148,907) | | | | | | | | | | | | | | | | 2,171,853 | |
| | | | | | | | | | | | | | | | | | | | |
See Notes to Financial Statements.
16
| | | | | | | | | | | | | | | | | | | | |
| | | | | |
| Description | | Interest Rate | | | Maturity Date | | | | | | Principal Amount
(000)# | | | Value | |
| | | | | |
CORPORATE BONDS 31.1% | | | | | | | | | | | | | | | | | | | | |
| | | | | |
Australia 0.4% | | | | | | | | | | | | | | | | | | | | |
| | | | | |
Transurban Finance Co. Pty Ltd.,
Sr. Sec’d. Notes, EMTN | | | 2.000% | | | | 08/28/25 | | | | EUR | | | | 100 | | | $ | 122,989 | |
| | | | | |
Belgium 0.2% | | | | | | | | | | | | | | | | | | | | |
| | | | | |
Anheuser-Busch Cos. LLC/Anheuser-Busch InBev Worldwide, Inc.,
Gtd. Notes | | | 4.900 | | | | 02/01/46 | | | | | | | | 60 | | | | 76,525 | |
| | | | | |
Brazil 0.4% | | | | | | | | | | | | | | | | | | | | |
| | | | | |
Petrobras Global Finance BV,
Gtd. Notes | | | 6.625 | | | | 01/16/34 | | | | GBP | | | | 100 | | | | 153,753 | |
| | | | | |
Bulgaria 0.3% | | | | | | | | | | | | | | | | | | | | |
| | | | | |
Bulgarian Energy Holding EAD,
Sr. Unsec’d. Notes | | | 2.450 | | | | 07/22/28 | | | | EUR | | | | 100 | | | | 114,870 | |
| | | | | |
China 0.3% | | | | | | | | | | | | | | | | | | | | |
| | | | | |
Aircraft Finance Co. Ltd.,
Sr. Sec’d. Notes, Series B | | | 4.100 | | | | 03/29/26 | | | | | | | | 92 | | | | 94,139 | |
| | | | | |
France 2.3% | | | | | | | | | | | | | | | | | | | | |
| | | | | |
Altice France SA, | | | | | | | | | | | | | | | | | | | | |
Sr. Sec’d. Notes | | | 3.375 | | | | 01/15/28 | | | | EUR | | | | 100 | | | | 110,890 | |
Sr. Sec’d. Notes, 144A | | | 2.500 | | | | 01/15/25 | | | | EUR | | | | 100 | | | | 113,288 | |
Sr. Sec’d. Notes, 144A | | | 3.375 | | | | 01/15/28 | | | | EUR | | | | 100 | | | | 110,890 | |
Iliad Holding SAS, | | | | | | | | | | | | | | | | | | | | |
Sr. Sec’d. Notes, 144A | | | 5.125 | | | | 10/15/26 | | | | EUR | | | | 100 | | | | 118,938 | |
La Poste SA, | | | | | | | | | | | | | | | | | | | | |
Sr. Unsec’d. Notes, EMTN | | | 1.375 | | | | 04/21/32 | | | | EUR | | | | 100 | | | | 122,998 | |
SNCF Reseau, | | | | | | | | | | | | | | | | | | | | |
Sr. Unsec’d. Notes, Series MPLE | | | 4.700 | | | | 06/01/35 | | | | CAD | | | | 100 | | | | 96,161 | |
Verallia SA, | | | | | | | | | | | | | | | | | | | | |
Gtd. Notes | | | 1.625 | | | | 05/14/28 | | | | EUR | | | | 100 | | | | 118,201 | |
| | | | | | | | | | | | | | | | | | | | |
| | | | | |
| | | | | | | | | | | | | | | | | | | 791,366 | |
| | | | | |
Germany 3.1% | | | | | | | | | | | | | | | | | | | | |
| | | | | |
Allianz SE, | | | | | | | | | | | | | | | | | | | | |
Jr. Sub. Notes | | | 3.375(ff) | | | | 09/18/24(oo) | | | | EUR | | | | 200 | | | | 248,536 | |
Techem Verwaltungsgesellschaft 674 mbH, | | | | | | | | | | | | | | | | | | | | |
Sr. Sec’d. Notes | | | 6.000 | | | | 07/30/26 | | | | EUR | | | | 88 | | | | 104,297 | |
See Notes to Financial Statements.
PGIM International Bond Fund 17
Schedule of Investments (continued)
as of October 31, 2021
| | | | | | | | | | | | | | | | | | | | |
| | | | | |
| Description | | Interest Rate | | | Maturity Date | | | | | | Principal Amount
(000)# | | | Value | |
| | | | | |
CORPORATE BONDS (Continued) | | | | | | | | | | | | | | | | | | | | |
| | | | | |
Germany (cont’d.) | | | | | | | | | | | | | | | | | | | | |
| | | | | |
thyssenkrupp AG,
Sr. Unsec’d. Notes | | | 1.375% | | | | 03/03/22 | | | | EUR | | | | 150 | | | $ | 173,566 | |
TK Elevator Holdco GmbH, | | | | | | | | | | | | | | | | | | | | |
Sr. Unsec’d. Notes, 144A | | | 6.625 | | | | 07/15/28 | | | | EUR | | | | 90 | | | | 108,915 | |
TK Elevator Midco GmbH, | | | | | | | | | | | | | | | | | | | | |
Sr. Sec’d. Notes, 144A | | | 4.375 | | | | 07/15/27 | | | | EUR | | | | 100 | | | | 118,977 | |
Volkswagen International Finance NV, | | | | | | | | | | | | | | | | | | | | |
Gtd. Notes | | | 2.700(ff) | | | | 12/14/22(oo) | | | | EUR | | | | 100 | | | | 118,399 | |
Gtd. Notes | | | 4.625(ff) | | | | 03/24/26(oo) | | | | EUR | | | | 150 | | | | 194,194 | |
| | | | | | | | | | | | | | | | | | | | |
| | | | | |
| | | | | | | | | | | | | | | | | | | 1,066,884 | |
| | | | | |
Hong Kong 0.8% | | | | | | | | | | | | | | | | | | | | |
| | | | | |
HKT Capital No. 3 Ltd., | | | | | | | | | | | | | | | | | | | | |
Gtd. Notes | | | 1.650 | | | | 04/10/27 | | | | EUR | | | | 100 | | | | 120,295 | |
Sun Hung Kai Properties Capital Market Ltd., | | | | | | | | | | | | | | | | | | | | |
Gtd. Notes, EMTN | | | 3.200 | | | | 08/14/27 | | | | CNH | | | | 1,000 | | | | 153,601 | |
| | | | | | | | | | | | | | | | | | | | |
| | | | | |
| | | | | | | | | | | | | | | | | | | 273,896 | |
| | | | | |
Hungary 0.4% | | | | | | | | | | | | | | | | | | | | |
| | | | | |
MFB Magyar Fejlesztesi Bank Zrt, | | | | | | | | | | | | | | | | | | | | |
Gov’t. Gtd. Notes | | | 1.375 | | | | 06/24/25 | | | | EUR | | | | 100 | | | | 120,414 | |
| | | | | |
Iceland 0.3% | | | | | | | | | | | | | | | | | | | | |
| | | | | |
Landsvirkjun, | | | | | | | | | | | | | | | | | | | | |
Gov’t. Gtd. Notes, EMTN | | | 0.000(cc) | | | | 07/24/26 | | | | EUR | | | | 100 | | | | 114,237 | |
| | | | | |
India 0.4% | | | | | | | | | | | | | | | | | | | | |
| | | | | |
NTPC Ltd., | | | | | | | | | | | | | | | | | | | | |
Sr. Unsec’d. Notes, EMTN | | | 2.750 | | | | 02/01/27 | | | | EUR | | | | 100 | | | | 122,650 | |
| | | | | |
Indonesia 0.3% | | | | | | | | | | | | | | | | | | | | |
| | | | | |
Perusahaan Listrik Negara PT, | | | | | | | | | | | | | | | | | | | | |
Sr. Unsec’d. Notes, 144A | | | 1.875 | | | | 11/05/31 | | | | EUR | | | | 100 | | | | 112,396 | |
See Notes to Financial Statements.
18
| | | | | | | | | | | | | | | | | | | | |
| | | | | |
| Description | | Interest Rate | | | Maturity Date | | | | | | Principal Amount
(000)# | | | Value | |
| | | | | |
CORPORATE BONDS (Continued) | | | | | | | | | | | | | | | | | | | | |
| | | | | |
Italy 1.1% | | | | | | | | | | | | | | | | | | | | |
| | | | | |
Assicurazioni Generali SpA, | | | | | | | | | | | | | | | | | | | | |
Sub. Notes, EMTN | | | 5.500%(ff) | | | | 10/27/47 | | | | EUR | | | | 100 | | | $ | 139,876 | |
Nexi SpA, | | | | | | | | | | | | | | | | | | | | |
Sr. Unsec’d. Notes | | | 2.125 | | | | 04/30/29 | | | | EUR | | | | 200 | | | | 228,618 | |
| | | | | | | | | | | | | | | | | | | | |
| | | | | |
| | | | | | | | | | | | | | | | | | | 368,494 | |
| | | | | |
Kazakhstan 0.5% | | | | | | | | | | | | | | | | | | | | |
| | | | | |
Kazakhstan Temir Zholy National Co. JSC, | | | | | | | | | | | | | | | | | | | | |
Gtd. Notes | | | 3.250 | | | | 12/05/23 | | | | CHF | | | | 50 | | | | 57,526 | |
Gtd. Notes | | | 3.638 | | | | 06/20/22 | | | | CHF | | | | 100 | | | | 111,485 | |
| | | | | | | | | | | | | | | | | | | | |
| | | | | |
| | | | | | | | | | | | | | | | | | | 169,011 | |
| | | | | |
Luxembourg 1.3% | | | | | | | | | | | | | | | | | | | | |
| | | | | |
ARD Finance SA, | | | | | | | | | | | | | | | | | | | | |
Sr. Sec’d. Notes, Cash coupon 5.000% or PIK 5.750% | | | 5.000 | | | | 06/30/27 | | | | EUR | | | | 100 | | | | 118,855 | |
Sr. Sec’d. Notes, 144A, Cash coupon 5.000% or PIK 5.750% | | | 5.000 | | | | 06/30/27 | | | | EUR | | | | 100 | | | | 118,855 | |
Matterhorn Telecom SA,
Sr. Sec’d. Notes | | | 3.125 | | | | 09/15/26 | | | | EUR | | | | 200 | | | | 228,876 | |
| | | | | | | | | | | | | | | | | | | | |
| | | | | |
| | | | | | | | | | | | | | | | | | | 466,586 | |
| | | | | |
Mexico 1.3% | | | | | | | | | | | | | | | | | | | | |
| | | | | |
Petroleos Mexicanos, | | | | | | | | | | | | | | | | | | | | |
Gtd. Notes | | | 3.625 | | | | 11/24/25 | | | | EUR | | | | 200 | | | | 233,498 | |
Gtd. Notes, EMTN | | | 4.875 | | | | 02/21/28 | | | | EUR | | | | 200 | | | | 232,669 | |
| | | | | | | | | | | | | | | | | | | | |
| | | | | |
| | | | | | | | | | | | | | | | | | | 466,167 | |
| | | | | |
Netherlands 2.0% | | | | | | | | | | | | | | | | | | | | |
| | | | | |
Cooperatieve Rabobank UA,
Sr. Unsec’d. Notes, GMTN | | | 3.500 | | | | 12/14/26 | | | | AUD | | | | 100 | | | | 76,646 | |
OCI NV,
Sr. Sec’d. Notes | | | 3.625 | | | | 10/15/25 | | | | EUR | | | | 150 | | | | 178,860 | |
United Group BV,
Sr. Sec’d. Notes, 144A | | | 3.125 | | | | 02/15/26 | | | | EUR | | | | 200 | | | | 222,530 | |
Ziggo Bond Co. BV,
Gtd. Notes, 144A | | | 3.375 | | | | 02/28/30 | | | | EUR | | | | 200 | | | | 227,732 | |
| | | | | | | | | | | | | | | | | | | | |
| | | | | |
| | | | | | | | | | | | | | | | | | | 705,768 | |
See Notes to Financial Statements.
PGIM International Bond Fund 19
Schedule of Investments (continued)
as of October 31, 2021
| | | | | | | | | | | | | | | | | | | | |
| | | | | |
| Description | | Interest Rate | | | Maturity Date | | | | | | Principal Amount
(000)# | | | Value | |
| | | | | |
CORPORATE BONDS (Continued) | | | | | | | | | | | | | | | | | | | | |
| | | | | |
Peru 0.3% | | | | | | | | | | | | | | | | | | | | |
| | | | | |
Peru Enhanced Pass-Through Finance Ltd.,
Pass-Through Certificates | | | 1.963%(s) | | | | 06/02/25 | | | | | | | | 119 | | | $ | 112,963 | |
| | | | | |
Poland 0.9% | | | | | | | | | | | | | | | | | | | | |
| | | | | |
Bank Gospodarstwa Krajowego,
Gov’t. Gtd. Notes | | | 1.625 | | | | 04/30/28 | | | | EUR | | | | 250 | | | | 309,830 | |
| | | | | |
Russia 1.5% | | | | | | | | | | | | | | | | | | | | |
| | | | | |
Gazprom PJSC Via Gaz Capital SA,
Sr. Unsec’d. Notes | | | 2.500 | | | | 03/21/26 | | | | EUR | | | | 200 | | | | 241,427 | |
Russian Railways Via RZD Capital PLC, | | | | | | | | | | | | | | | | | | | | |
Sr. Unsec’d. Notes | | | 0.898 | | | | 10/03/25 | | | | CHF | | | | 100 | | | | 109,140 | |
Sr. Unsec’d. Notes | | | 7.487 | | | | 03/25/31 | | | | GBP | | | | 100 | | | | 181,623 | |
| | | | | | | | | | | | | | | | | | | | |
| | | | | |
| | | | | | | | | | | | | | | | | | | 532,190 | |
| | | | | |
Spain 1.2% | | | | | | | | | | | | | | | | | | | | |
| | | | | |
Amadeus IT Group SA,
Sr. Unsec’d. Notes, EMTN | | | 1.875 | | | | 09/24/28 | | | | EUR | | | | 200 | | | | 244,733 | |
Cellnex Finance Co. SA,
Gtd. Notes, EMTN | | | 2.000 | | | | 02/15/33 | | | | EUR | | | | 100 | | | | 110,299 | |
Codere Finance 2 Luxembourg SA,
Sr. Sec’d. Notes, 144A | | | 10.750 | | | | 09/30/23(d) | | | | EUR | | | | 35 | | | | 43,990 | |
| | | | | | | | | | | | | | | | | | | | |
| | | | | |
| | | | | | | | | | | | | | | | | | | 399,022 | |
| | | | | |
Supranational Bank 0.4% | | | | | | | | | | | | | | | | | | | | |
| | | | | |
European Bank for Reconstruction & Development,
Sr. Unsec’d. Notes, GMTN | | | 6.450 | | | | 12/13/22 | | | | IDR | | | | 408,000 | | | | 29,403 | |
European Investment Bank,
Sr. Unsec’d. Notes, 144A, EMTN | | | 5.400 | | | | 01/05/45 | | | | CAD | | | | 100 | | | | 113,280 | |
| | | | | | | | | | | | | | | | | | | | |
| | | | | |
| | | | | | | | | | | | | | | | | | | 142,683 | |
| | | | | |
United Arab Emirates 1.0% | | | | | | | | | | | | | | | | | | | | |
| | | | | |
Abu Dhabi National Energy Co. PJSC,
Sr. Unsec’d. Notes, GMTN | | | 2.750 | | | | 05/02/24 | | | | EUR | | | | 100 | | | | 122,721 | |
DP World PLC,
Sr. Unsec’d. Notes | | | 4.250 | | | | 09/25/30 | | | | GBP | | | | 100 | | | | 152,481 | |
Emirates NBD Bank PJSC,
Sr. Unsec’d. Notes, MTN | | | 4.750 | | | | 02/09/28 | | | | AUD | | | | 100 | | | | 81,898 | |
| | | | | | | | | | | | | | | | | | | | |
| | | | | |
| | | | | | | | | | | | | | | | | | | 357,100 | |
See Notes to Financial Statements.
20
| | | | | | | | | | | | | | | | | | | | |
| | | | | |
| Description | | Interest Rate | | | Maturity Date | | | | | | Principal Amount
(000)# | | | Value | |
| | | | | |
CORPORATE BONDS (Continued) | | | | | | | | | | | | | | | | | | | | |
| | | | | |
United Kingdom 4.8% | | | | | | | | | | | | | | | | | | | | |
| | | | | |
Barclays PLC,
Sub. Notes, EMTN | | | 2.000%(ff) | | | | 02/07/28 | | | | EUR | | | | 100 | | | $ | 117,838 | |
Bellis Acquisition Co. PLC,
Sr. Sec’d. Notes, 144A | | | 3.250 | | | | 02/16/26 | | | | GBP | | | | 200 | | | | 262,163 | |
Bellis Finco PLC,
Sr. Unsec’d. Notes, 144A | | | 4.000 | | | | 02/16/27 | | | | GBP | | | | 100 | | | | 129,039 | |
Co-operative Group Ltd.,
Sr. Unsec’d. Notes | | | 5.125 | | | | 05/17/24 | | | | GBP | | | | 100 | | | | 143,597 | |
eG Global Finance PLC, | | | | | | | | | | | | | | | | | | | | |
Sr. Sec’d. Notes | | | 6.250 | | | | 10/30/25 | | | | EUR | | | | 100 | | | | 117,307 | |
Sr. Sec’d. Notes, 144A | | | 6.250 | | | | 10/30/25 | | | | EUR | | | | 100 | | | | 117,307 | |
HSBC Holdings PLC,
Sr. Unsec’d. Notes, EMTN | | | 3.350(ff) | | | | 02/16/24 | | | | AUD | | | | 200 | | | | 154,659 | |
InterContinental Hotels Group PLC,
Gtd. Notes, EMTN | | | 1.625 | | | | 10/08/24 | | | | EUR | | | | 200 | | | | 239,119 | |
Pinewood Finance Co. Ltd.,
Sr. Sec’d. Notes, 144A | | | 3.250 | | | | 09/30/25 | | | | GBP | | | | 100 | | | | 137,155 | |
Tesco PLC,
Sr. Unsec’d. Notes, EMTN | | | 5.000 | | | | 03/24/23 | | | | GBP | | | | 80 | | | | 115,227 | |
Virgin Media Secured Finance PLC,
Sr. Sec’d. Notes | | | 5.000 | | | | 04/15/27 | | | | GBP | | | | 100 | | | | 141,303 | |
| | | | | | | | | | | | | | | | | | | | |
| | | | | |
| | | | | | | | | | | | | | | | | | | 1,674,714 | |
| | | | | |
United States 5.6% | | | | | | | | | | | | | | | | | | | | |
| | | | | |
American International Group, Inc.,
Sr. Unsec’d. Notes | | | 1.875 | | | | 06/21/27 | | | | EUR | | | | 100 | | | | 123,017 | |
Ardagh Packaging Finance PLC/Ardagh Holdings USA, Inc.,
Sr. Sec’d. Notes | | | 2.125 | | | | 08/15/26 | | | | EUR | | | | 150 | | | | 171,113 | |
Avantor Funding, Inc.,
Sr. Sec’d. Notes | | | 2.625 | | | | 11/01/25 | | | | EUR | | | | 150 | | | | 177,301 | |
Banff Merger Sub, Inc.,
Sr. Unsec’d. Notes | | | 8.375 | | | | 09/01/26 | | | | EUR | | | | 100 | | | | 120,343 | |
Broadcom, Inc.,
Gtd. Notes, 144A | | | 3.500 | | | | 02/15/41 | | | | | | | | 30 | | | | 29,925 | |
Citigroup, Inc.,
Sr. Unsec’d. Notes, GMTN | | | 2.210 | | | | 08/23/22 | | | | HKD | | | | 1,000 | | | | 129,743 | |
Fidelity National Information Services, Inc.,
Sr. Unsec’d. Notes | | | 1.500 | | | | 05/21/27 | | | | EUR | | | | 100 | | | | 121,194 | |
Goldman Sachs Group, Inc. (The),
Sr. Unsec’d. Notes, EMTN | | | 0.000(cc) | | | | 08/12/25 | | | | EUR | | | | 100 | | | | 114,448 | |
See Notes to Financial Statements.
PGIM International Bond Fund 21
Schedule of Investments (continued)
as of October 31, 2021
| | | | | | | | | | | | | | | | | | | | |
| | | | | |
| Description | | Interest Rate | | | Maturity Date | | | | | | Principal Amount
(000)# | | | Value | |
| | | | | |
CORPORATE BONDS (Continued) | | | | | | | | | | | | | | | | | | | | |
| | | | | |
United States (cont’d.) | | | | | | | | | | | | | | | | | | | | |
| | | | | |
JPMorgan Chase Bank, NA,
Sr. Unsec’d. Notes | | | 4.762%(s) | | | | 03/17/48 | | | | ITL(jj | ) | | | 100,000 | | | $ | 15,634 | |
Morgan Guaranty Trust Co.,
Sr. Unsec’d. Notes | | | 1.388(s) | | | | 01/21/27 | | | | ITL(jj | ) | | | 50,000 | | | | 27,995 | |
Morgan Stanley,
Sr. Unsec’d. Notes | | | 1.102(ff) | | | | 04/29/33 | | | | EUR | | | | 100 | | | | 115,244 | |
Mozart Debt Merger Sub, Inc.,
Sr. Sec’d. Notes, 144A | | | 3.875 | | | | 04/01/29 | | | | | | | | 25 | | | | 24,880 | |
MPT Operating Partnership LP/MPT Finance Corp.,
Gtd. Notes | | | 3.375 | | | | 04/24/30 | | | | GBP | | | | 150 | | | | 211,341 | |
Spectrum Brands, Inc.,
Gtd. Notes | | | 4.000 | | | | 10/01/26 | | | | EUR | | | | 100 | | | | 117,634 | |
Stryker Corp.,
Sr. Unsec’d. Notes | | | 2.625 | | | | 11/30/30 | | | | EUR | | | | 100 | | | | 133,650 | |
VEREIT Operating Partnership LP, | | | | | | | | | | | | | | | | | | | | |
Gtd. Notes | | | 2.200 | | | | 06/15/28 | | | | | | | | 5 | | | | 5,016 | |
Gtd. Notes | | | 2.850 | | | | 12/15/32 | | | | | | | | 5 | | | | 5,178 | |
Verizon Communications, Inc.,
Sr. Unsec’d. Notes | | | 1.250 | | | | 04/08/30 | | | | EUR | | | | 100 | | | | 120,096 | |
Vistra Corp.,
Jr. Sub. Notes, 144A | | | 8.000(ff) | | | | 10/15/26(oo) | | | | | | | | 50 | | | | 52,485 | |
Zimmer Biomet Holdings, Inc.,
Sr. Unsec’d. Notes | | | 2.425 | | | | 12/13/26 | | | | EUR | | | | 100 | | | | 125,759 | |
| | | | | | | | | | | | | | | | | | | | |
| | | | | |
| | | | | | | | | | | | | | | | | | | 1,941,996 | |
| | | | | | | | | | | | | | | | | | | | |
| | | | | |
TOTAL CORPORATE BONDS
(cost $10,522,143) | | | | | | | | | | | | | | | | | | | 10,810,643 | |
| | | | | | | | | | | | | | | | | | | | |
| | | | | |
RESIDENTIAL MORTGAGE-BACKED SECURITIES 1.6% | | | | | | | | | | | | | | | | | | | | |
| | | | | |
Bermuda 0.5% | | | | | | | | | | | | | | | | | | | | |
| | | | | |
Bellemeade Re Ltd., | | | | | | | | | | | | | | | | | | | | |
Series 2018-01A, Class M1B, 144A, 1 Month LIBOR + 1.600% (Cap N/A, Floor 0.000%) | | | 1.689(c) | | | | 04/25/28 | | | | | | | | 45 | | | | 44,548 | |
Series 2021-01A, Class M1A, 144A, 30 Day Average SOFR + 1.750% (Cap N/A, Floor 1.750%) | | | 1.799(c) | | | | 03/25/31 | | | | | | | | 150 | | | | 150,366 | |
| | | | | | | | | | | | | | | | | | | | |
| | | | | |
| | | | | | | | | | | | | | | | | | | 194,914 | |
See Notes to Financial Statements.
22
| | | | | | | | | | | | | | | | | | | | |
| | | | | |
| Description | | Interest Rate | | | Maturity Date | | | | | | Principal Amount
(000)# | | | Value | |
| | | |
RESIDENTIAL MORTGAGE-BACKED SECURITIES (Continued) | | | | | | | | | | | | | |
| | | | | |
Ireland 0.3% | | | | | | | | | | | | | | | | | | | | |
| | | | | |
Retiro Mortgage Securities DAC,
| | | | | | | | | | | | | | | | | | | | |
Series 01A, Class A1, 144A, 3 Month EURIBOR + 2.000% (Cap 5.000%, Floor 0.000%) | | | 1.453 | %(c) | | | 07/30/75 | | | | EUR | | | | 89 | | | $ | 101,889 | |
| | | | | |
United States 0.8% | | | | | | | | | | | | | | | | | | | | |
| | | | | |
FHLMC Structured Agency Credit Risk Debt Notes,
| | | | | | | | | | | | | | | | | | | | |
Series 2020-HQA05, Class B1, 144A, 30 Day Average SOFR + 4.000% (Cap N/A, Floor 0.000%) | | | 4.049(c) | | | | 11/25/50 | | | | | | | | 10 | | | | 10,481 | |
Series 2020-HQA05, Class M2, 144A, 30 Day Average SOFR + 2.600% (Cap N/A, Floor 0.000%) | | | 2.649(c) | | | | 11/25/50 | | | | | | | | 60 | | | | 60,678 | |
Legacy Mortgage Asset Trust,
Series 2020-GS01, Class A1, 144A | | | 2.882 | | | | 10/25/59 | | | | | | | | 83 | | | | 83,190 | |
PMT Credit Risk Transfer Trust, | | | | | | | | | | | | | | | | | | | | |
Series 2020-02R, Class A, 144A, 1 Month LIBOR + 3.815% (Cap N/A, Floor 3.815%) | | | 3.903(c) | | | | 12/25/22 | | | | | | | | 114 | | | | 114,899 | |
| | | | | | | | | | | | | | | | | | | | |
| | | | | |
| | | | | | | | | | | | | | | | | | | 269,248 | |
| | | | | | | | | | | | | | | | | | | | |
| | | | | |
TOTAL RESIDENTIAL MORTGAGE-BACKED SECURITIES
(cost $566,704) | | | | | | | | | | | | | | | | | | | 566,051 | |
| | | | | | | | | | | | | | | | | | | | |
| | | | | |
SOVEREIGN BONDS 51.9% | | | | | | | | | | | | | | | | | | | | |
| | | | | |
Brazil 1.5% | | | | | | | | | | | | | | | | | | | | |
| | | | | |
Brazil Loan Trust 1,
Gov’t. Gtd. Notes | | | 5.477 | | | | 07/24/23 | | | | | | | | 46 | | | | 47,659 | |
Brazil Minas SPE via State of Minas Gerais,
Gov’t. Gtd. Notes | | | 5.333 | | | | 02/15/28 | | | | | | | | 455 | | | | 482,647 | |
| | | | | | | | | | | | | | | | | | | | |
| | | | | |
| | | | | | | | | | | | | | | | | | | 530,306 | |
| | | | | |
Bulgaria 0.5% | | | | | | | | | | | | | | | | | | | | |
| | | | | |
Bulgaria Government International Bond,
Sr. Unsec’d. Notes, GMTN | | | 3.125 | | | | 03/26/35 | | | | EUR | | | | 115 | | | | 164,916 | |
| | | | | |
Canada 0.7% | | | | | | | | | | | | | | | | | | | | |
| | | | | |
City of Toronto,
Sr. Unsec’d. Notes | | | 3.500 | | | | 06/02/36 | | | | CAD | | | | 100 | | | | 88,062 | |
See Notes to Financial Statements.
PGIM International Bond Fund 23
Schedule of Investments (continued)
as of October 31, 2021
| | | | | | | | | | | | | | | | | | | | |
| | | | | |
| Description | | Interest Rate | | | Maturity Date | | | | | | Principal Amount
(000)# | | | Value | |
| | | | | |
SOVEREIGN BONDS (Continued) | | | | | | | | | | | | | | | | | | | | |
| | | | | |
Canada (cont’d.) | | | | | | | | | | | | | | | | | | | | |
| | | | | |
Province of Nova Scotia,
Unsec’d. Notes | | | 3.450% | | | | 06/01/45 | | | | CAD | | | | 100 | | | $ | 89,333 | |
Province of Saskatchewan,
Unsec’d. Notes | | | 2.750 | | | | 12/02/46 | | | | CAD | | | | 100 | | | | 79,611 | |
| | | | | | | | | | | | | | | | | | | | |
| | | | | |
| | | | | | | | | | | | | | | | | | | 257,006 | |
| | | | | |
China 3.6% | | | | | | | | | | | | | | | | | | | | |
| | | | | |
China Government Bond,
Sr. Unsec’d. Notes | | | 3.900 | | | | 07/04/36 | | | | CNH | | | | 1,000 | | | | 169,742 | |
China Government International Bond,
Sr. Unsec’d. Notes | | | 0.250 | | | | 11/25/30 | | | | EUR | | | | 100 | | | | 112,818 | |
Export-Import Bank of China (The),
Sr. Unsec’d. Notes | | | 4.400 | | | | 05/14/24 | | | | CNH | | | | 6,000 | | | | 969,922 | |
| | | | | | | | | | | | | | | | | | | | |
| | | | | |
| | | | | | | | | | | | | | | | | | | 1,252,482 | |
| | | | | |
Colombia 2.2% | | | | | | | | | | | | | | | | | | | | |
| | | | | |
Colombia Government International Bond,
Sr. Unsec’d. Notes, EMTN | | | 3.875 | | | | 03/22/26 | | | | EUR | | | | 600 | | | | 761,388 | |
| | | | | |
Croatia 0.8% | | | | | | | | | | | | | | | | | | | | |
| | | | | |
Croatia Government International Bond,
Sr. Unsec’d. Notes | | | 2.700 | | | | 06/15/28 | | | | EUR | | | | 200 | | | | 262,698 | |
| | | | | |
Cyprus 2.3% | | | | | | | | | | | | | | | | | | | | |
| | | | | |
Cyprus Government International Bond,
Notes, EMTN | | | 1.500 | | | | 04/16/27 | | | | EUR | | | | 200 | | | | 248,025 | |
Sr. Unsec’d. Notes, EMTN | | | 2.375 | | | | 09/25/28 | | | | EUR | | | | 200 | | | | 264,852 | |
Sr. Unsec’d. Notes, EMTN | | | 2.750 | | | | 02/26/34 | | | | EUR | | | | 200 | | | | 285,333 | |
| | | | | | | | | | | | | | | | | | | | |
| | | | | |
| | | | | | | | | | | | | | | | | | | 798,210 | |
| | | | | |
France 0.3% | | | | | | | | | | | | | | | | | | | | |
| | | | | |
Caisse Francaise de Financement Local,
Covered Bonds, EMTN | | | 4.680 | | | | 03/09/29 | | | | CAD | | | | 100 | | | | 93,533 | |
| | | | | |
Greece 4.8% | | | | | | | | | | | | | | | | | | | | |
| | | | | |
Hellenic Republic Government Bond, | | | | | | | | | | | | | | | | | | | | |
Bonds | | | 4.200 | | | | 01/30/42 | | | | EUR | | | | 100 | | | | 171,270 | |
Bonds | | | 4.300 | | | | 02/24/24 | | | | EUR | | | | 75 | | | | 94,375 | |
Bonds | | | 4.300 | | | | 02/24/25 | | | | EUR | | | | 85 | | | | 110,358 | |
See Notes to Financial Statements.
24
| | | | | | | | | | | | | | | | | | | | |
| | | | | |
| Description | | Interest Rate | | | Maturity Date | | | | | | Principal Amount
(000)# | | | Value | |
| | | | | |
SOVEREIGN BONDS (Continued) | | | | | | | | | | | | | | | | | | | | |
| | | | | |
Greece (cont’d.) | | | | | | | | | | | | | | | | | | | | |
| | | | | |
Hellenic Republic Government Bond, (cont’d.) | | | | | | | | | | | | | | | | | | | | |
Bonds | | | 4.300% | | | | 02/24/26 | | | | EUR | | | | 85 | | | $ | 112,542 | |
Bonds | | | 4.300 | | | | 02/24/27 | | | | EUR | | | | 195 | | | | 265,114 | |
Bonds | | | 4.300 | | | | 02/24/28 | | | | EUR | | | | 177 | | | | 246,010 | |
Bonds | | | 4.300 | | | | 02/24/29 | | | | EUR | | | | 50 | | | | 70,096 | |
Bonds | | | 4.300 | | | | 02/24/30 | | | | EUR | | | | 200 | | | | 283,394 | |
Bonds | | | 4.300 | | | | 02/24/31 | | | | EUR | | | | 140 | | | | 200,312 | |
Bonds | | | 4.300 | | | | 02/24/42 | | | | EUR | | | | 5 | | | | 8,356 | |
Hellenic Republic Government International Bond,
Sr. Unsec’d. Notes | | | 5.200 | | | | 07/17/34 | | | | EUR | | | | 60 | | | | 98,180 | |
| | | | | | | | | | | | | | | | | | | | |
| | | | | |
| | | | | | | | | | | | | | | | | | | 1,660,007 | |
| | | | | |
Hungary 0.4% | | | | | | | | | | | | | | | | | | | | |
| | | | | |
Hungary Government International Bond, | | | | | | | | | | | | | | | | | | | | |
Sr. Unsec’d. Notes | | | 1.750 | | | | 06/05/35 | | | | EUR | | | | 100 | | | | 120,125 | |
Sr. Unsec’d. Notes | | | 4.300 | | | | 12/19/21 | | | | CNH | | | | 200 | | | | 31,257 | |
| | | | | | | | | | | | | | | | | | | | |
| | | | | |
| | | | | | | | | | | | | | | | | | | 151,382 | |
| | | | | |
Indonesia 3.7% | | | | | | | | | | | | | | | | | | | | |
| | | | | |
Indonesia Government International Bond, | | | | | | | | | | | | | | | | | | | | |
Sr. Unsec’d. Notes | | | 0.900 | | | | 02/14/27 | | | | EUR | | | | 100 | | | | 115,456 | |
Sr. Unsec’d. Notes | | | 1.400 | | | | 10/30/31 | | | | EUR | | | | 100 | | | | 115,651 | |
Sr. Unsec’d. Notes | | | 1.450 | | | | 09/18/26 | | | | EUR | | | | 300 | | | | 357,204 | |
Sr. Unsec’d. Notes | | | 1.750 | | | | 04/24/25 | | | | EUR | | | | 200 | | | | 239,797 | |
Sr. Unsec’d. Notes, EMTN | | | 2.150 | | | | 07/18/24 | | | | EUR | | | | 140 | | | | 169,310 | |
Sr. Unsec’d. Notes, EMTN | | | 3.750 | | | | 06/14/28 | | | | EUR | | | | 200 | | | | 269,348 | |
| | | | | | | | | | | | | | | | | | | | |
| | | | | |
| | | | | | | | | | | | | | | | | | | 1,266,766 | |
| | | | | |
Israel 0.7% | | | | | | | | | | | | | | | | | | | | |
| | | | | |
Israel Government International Bond,
Sr. Unsec’d. Notes, EMTN | | | 1.500 | | | | 01/16/29 | | | | EUR | | | | 200 | | | | 250,964 | |
| | | | | |
Italy 8.1% | | | | | | | | | | | | | | | | | | | | |
| | | | | |
Italy Buoni Poliennali Del Tesoro,
Bonds, 144A | | | 2.800 | | | | 03/01/67 | | | | EUR | | | | 150 | | | | 202,491 | |
Sr. Unsec’d. Notes, 144A | | | 1.450 | | | | 03/01/36 | | | | EUR | | | | 145 | | | | 167,907 | |
Sr. Unsec’d. Notes, 144A | | | 3.350 | | | | 03/01/35 | | | | EUR | | | | 340 | | | | 485,780 | |
Region of Lazio,
Sr. Unsec’d. Notes | | | 3.088 | | | | 03/31/43 | | | | EUR | | | | 89 | | | | 117,641 | |
See Notes to Financial Statements.
PGIM International Bond Fund 25
Schedule of Investments (continued)
as of October 31, 2021
| | | | | | | | | | | | | | | | | | | | |
| | | | | |
| Description | | Interest Rate | | | Maturity Date | | | | | | Principal
Amount
(000)# | | | Value | |
| | | | | |
SOVEREIGN BONDS (Continued) | | | | | | | | | | | | | | | | | | | | |
| | | | | |
Italy (cont’d.) | | | | | | | | | | | | | | | | | | | | |
| | | | | |
Repubic of Italy Government International Bond Coupon Strips,
Sr. Unsec’d. Notes | | | 1.737%(s) | | | | 02/20/31 | | | | EUR | | | | 35 | | | $ | 35,885 | |
Republic of Italy Government International Bond, | | | | | | | | | | | | | | | | | | | | |
Sr. Unsec’d. Notes | | | 2.875 | | | | 10/17/29 | | | | | | | | 200 | | | | 204,317 | |
Sr. Unsec’d. Notes, EMTN | | | 5.345 | | | | 01/27/48 | | | | EUR | | | | 50 | | | | 95,252 | |
Sr. Unsec’d. Notes, EMTN | | | 6.000 | | | | 08/04/28 | | | | GBP | | | | 205 | | | | 351,909 | |
Sr. Unsec’d. Notes, MTN | | | 5.125 | | | | 07/31/24 | | | | EUR | | | | 875 | | | | 1,145,969 | |
| | | | | | | | | | | | | | | | | | | | |
| | | | | |
| | | | | | | | | | | | | | | | | | | 2,807,151 | |
| | | | | |
Kazakhstan 0.4% | | | | | | | | | | | | | | | | | | | | |
| | | | | |
Kazakhstan Government International Bond,
Sr. Unsec’d. Notes, EMTN | | | 2.375 | | | | 11/09/28 | | | | EUR | | | | 115 | | | | 147,248 | |
| | | | | |
Mexico 2.0% | | | | | | | | | | | | | | | | | | | | |
| | | | | |
Mexico Government International Bond, | | | | | | | | | | | | | | | | | | | | |
Sr. Unsec’d. Notes | | | 2.875 | | | | 04/08/39 | | | | EUR | | | | 100 | | | | 117,476 | |
Sr. Unsec’d. Notes, EMTN | | | 1.750 | | | | 04/17/28 | | | | EUR | | | | 300 | | | | 360,672 | |
Sr. Unsec’d. Notes, GMTN | | | 1.625 | | | | 03/06/24 | | | | EUR | | | | 185 | | | | 221,301 | |
| | | | | | | | | | | | | | | | | | | | |
| | | | | |
| | | | | | | | | | | | | | | | | | | 699,449 | |
| | | | | |
New Zealand 0.2% | | | | | | | | | | | | | | | | | | | | |
| | | | | |
New Zealand Local Government Funding Agency Bond,
Local Gov’t. Gtd. Notes | | | 2.000 | | | | 04/15/37 | | | | NZD | | | | 100 | | | | 59,597 | |
| | | | | |
Peru 1.6% | | | | | | | | | | | | | | | | | | | | |
| | | | | |
Peruvian Government International Bond, | | | | | | | | | | | | | | | | | | | | |
Sr. Unsec’d. Notes | | | 2.750 | | | | 01/30/26 | | | | EUR | | | | 100 | | | | 127,607 | |
Sr. Unsec’d. Notes | | | 3.750 | | | | 03/01/30 | | | | EUR | | | | 300 | | | | 410,533 | |
Sr. Unsec’d. Notes | | | 6.900 | | | | 08/12/37 | | | | PEN | | | | 100 | | | | 25,347 | |
| | | | | | | | | | | | | | | | | | | | |
| | | | | |
| | | | | | | | | | | | | | | | | | | 563,487 | |
| | | | | |
Philippines 1.3% | | | | | | | | | | | | | | | | | | | | |
| | | | | |
Philippine Government International Bond, | | | | | | | | | | | | | | | | | | | | |
Sr. Unsec’d. Notes | | | 0.700 | | | | 02/03/29 | | | | EUR | | | | 300 | | | | 343,145 | |
Sr. Unsec’d. Notes, EMTN | | | 0.875 | | | | 05/17/27 | | | | EUR | | | | 100 | | | | 116,900 | |
| | | | | | | | | | | | | | | | | | | | |
| | | | | |
| | | | | | | | | | | | | | | | | | | 460,045 | |
See Notes to Financial Statements.
26
| | | | | | | | | | | | | | | | | | | | |
| | | | | |
| Description | | Interest Rate | | | Maturity Date | | | | | | Principal
Amount
(000)# | | | Value | |
| | | | | |
SOVEREIGN BONDS (Continued) | | | | | | | | | | | | | | | | | | | | |
| | | | | |
Portugal 4.0% | | | | | | | | | | | | | | | | | | | | |
| | | | | |
Portugal Government International Bond,
Sr. Unsec’d. Notes | | | 4.090% | | | | 06/03/22 | | | | CNH | | | | 600 | | | $ | 93,898 | |
Portugal Obrigacoes do Tesouro OT, | | | | | | | | | | | | | | | | | | | | |
Sr. Unsec’d. Notes, 144A | | | 4.100 | | | | 04/15/37 | | | | EUR | | | | 515 | | | | 881,656 | |
Sr. Unsec’d. Notes, 144A | | | 4.100 | | | | 02/15/45 | | | | EUR | | | | 150 | | | | 283,943 | |
Unsec’d. Notes, 144A | | | 1.000 | | | | 04/12/52 | | | | EUR | | | | 105 | | | | 112,957 | |
| | | | | | | | | | | | | | | | | | | | |
| | | | | |
| | | | | | | | | | | | | | | | | | | 1,372,454 | |
| | | | | |
Romania 1.0% | | | | | | | | | | | | | | | | | | | | |
| | | | | |
Romanian Government International Bond, | | | | | | | | | | | | | | | | | | | | |
Sr. Unsec’d. Notes, 144A, MTN | | | 2.500 | | | | 02/08/30 | | | | EUR | | | | 100 | | | | 118,490 | |
Sr. Unsec’d. Notes, EMTN | | | 3.500 | | | | 04/03/34 | | | | EUR | | | | 50 | | | | 61,794 | |
Sr. Unsec’d. Notes, EMTN | | | 3.875 | | | | 10/29/35 | | | | EUR | | | | 100 | | | | 125,789 | |
Unsec’d. Notes, 144A, MTN | | | 2.124 | | | | 07/16/31 | | | | EUR | | | | 40 | | | | 45,303 | |
| | | | | | | | | | | | | | | | | | | | |
| | | | | |
| | | | | | | | | | | | | | | | | | | 351,376 | |
| | | | | |
Russia 0.7% | | | | | | | | | | | | | | | | | | | | |
Russian Foreign Bond - Eurobond,
Sr. Unsec’d. Notes | | | 2.875 | | | | 12/04/25 | | | | EUR | | | | 200 | | | | 252,900 | |
| | | | | |
Saudi Arabia 0.4% | | | | | | | | | | | | | | | | | | | | |
Saudi Government International Bond,
Sr. Unsec’d. Notes, 144A | | | 2.000 | | | | 07/09/39 | | | | EUR | | | | 125 | | | | 151,152 | |
| | | | | |
Serbia 0.9% | | | | | | | | | | | | | | | | | | | | |
Serbia International Bond,
Sr. Unsec’d. Notes | | | 3.125 | | | | 05/15/27 | | | | EUR | | | | 250 | | | | 313,565 | |
| | | | | |
Spain 7.2% | | | | | | | | | | | | | | | | | | | | |
Autonomous Community of Catalonia,
Sr. Unsec’d. Notes, EMTN | | | 6.350 | | | | 11/30/41 | | | | EUR | | | | 50 | | | | 98,532 | |
Instituto de Credito Oficial,
Gov’t. Gtd. Notes, GMTN | | | 0.963 | | | | 09/22/22 | | | | SEK | | | | 1,000 | | | | 117,374 | |
Spain Government Bond, | | | | | | | | | | | | | | | | | | | | |
Bonds, 144A | | | 5.150 | | | | 10/31/28(k) | | | | EUR | | | | 185 | | | | 287,202 | |
Sr. Unsec’d. Notes, 144A | | | 0.500 | | | | 04/30/30 | | | | EUR | | | | 25 | | | | 29,124 | |
Sr. Unsec’d. Notes, 144A | | | 1.000 | | | | 10/31/50(k) | | | | EUR | | | | 310 | | | | 332,239 | |
Sr. Unsec’d. Notes, 144A | | | 1.400 | | | | 04/30/28(k) | | | | EUR | | | | 70 | | | | 87,317 | |
Sr. Unsec’d. Notes, 144A | | | 1.850 | | | | 07/30/35(k) | | | | EUR | | | | 325 | | | | 425,534 | |
Sr. Unsec’d. Notes, 144A | | | 3.450 | | | | 07/30/66 | | | | EUR | | | | 50 | | | | 90,330 | |
See Notes to Financial Statements.
PGIM International Bond Fund 27
Schedule of Investments (continued)
as of October 31, 2021
| | | | | | | | | | | | | | | | | | | | |
| | | | | |
| Description | | Interest Rate | | | Maturity Date | | | | | | Principal
Amount
(000)# | | | Value | |
| | | | | |
SOVEREIGN BONDS (Continued) | | | | | | | | | | | | | | | | | | | | |
| | | | | |
Spain (cont’d.) | | | | | | | | | | | | | | | | | | | | |
| | | | | |
Spain Government International Bond,
Sr. Unsec’d. Notes, EMTN | | | 5.250% | | | | 04/06/29 | | | | GBP | | | | 615 | | | $ | 1,040,443 | |
| | | | | | | | | | | | | | | | | | | | |
| | | | | |
| | | | | | | | | | | | | | | | | | | 2,508,095 | |
| | | | | |
Ukraine 2.1% | | | | | | | | | | | | | | | | | | | | |
| | | | | |
Ukraine Government International Bond, | | | | | | | | | | | | | | | | | | | | |
Sr. Unsec’d. Notes | | | 6.750 | | | | 06/20/26 | | | | EUR | | | | 500 | | | | 622,044 | |
Sr. Unsec’d. Notes, 144A | | | 4.375 | | | | 01/27/30 | | | | EUR | | | | 100 | | | | 107,651 | |
| | | | | | | | | | | | | | | | | | | | |
| | | | | |
| | | | | | | | | | | | | | | | | | | 729,695 | |
| | | | | |
United Kingdom 0.5% | | | | | | | | | | | | | | | | | | | | |
| | | | | |
Transport for London,
Sr. Unsec’d. Notes, EMTN | | | 3.875 | | | | 07/23/42 | | | | GBP | | | | 100 | | | | 178,078 | |
| | | | | | | | | | | | | | | | | | | | |
| | | | | |
TOTAL SOVEREIGN BONDS | | | | | | | | | | | | | | | | | | | | |
(cost $16,879,776) | | | | | | | | | | | | | | | | | | | 18,043,950 | |
| | | | | | | | | | | | | | | | | | | | |
| | | | | |
TOTAL LONG-TERM INVESTMENTS | | | | | | | | | | | | | | | | | | | | |
(cost $31,797,860) | | | | | | | | | | | | | | | | | | | 33,272,659 | |
| | | | | | | | | | | | | | | | | | | | |
| | | | | |
| | | | | | | | | | | | Shares | | | | |
| | | | | |
SHORT-TERM INVESTMENTS 0.1% | | | | | | | | | | | | | | | | | | | | |
| | | | | |
AFFILIATED MUTUAL FUND 0.1% | | | | | | | | | | | | | | | | | | | | |
PGIM Core Ultra Short Bond Fund
(cost $30,869)(wb) | | | | | | | | | | | | | | | 30,869 | | | | 30,869 | |
| | | | | | | | | | | | | | | | | | | | |
| | | | | |
OPTIONS PURCHASED*~ 0.0% | | | | | | | | | | | | | | | | | | | | |
(cost $6,300) | | | | | | | | | | | | | | | | | | | 6,446 | |
| | | | | | | | | | | | | | | | | | | | |
| | | | | |
TOTAL SHORT-TERM INVESTMENTS | | | | | | | | | | | | | | | | | | | | |
(cost $37,169) | | | | | | | | | | | | | | | | | | | 37,315 | |
| | | | | | | | | | | | | | | | | | | | |
See Notes to Financial Statements.
28
| | | | | | | | | | | | | | | | | | | | |
| | | | | |
| Description | | | | | | | | | | | | | | Value | |
| | | | | |
TOTAL INVESTMENTS, BEFORE OPTION WRITTEN 95.8% | | | | | | | | | | | | | | | | | | | | |
(cost $31,835,029) | | | | | | | | | | | | | | | | | | $ | 33,309,974 | |
| | | | | | | | | | | | | | | | | | | | |
| | | | | |
OPTIONS WRITTEN*~ (0.0)% | | | | | | | | | | | | | | | | | | | | |
(premiums received $7,500) | | | | | | | | | | | | | | | | | | | (8,144 | ) |
| | | | | | | | | | | | | | | | | | | | |
| | | | | |
TOTAL INVESTMENTS, NET OF OPTION WRITTEN 95.8% | | | | | | | | | | | | | | | | | | | | |
(cost $31,827,529) | | | | | | | | | | | | | | | | | | | 33,301,830 | |
Other assets in excess of liabilities(z) 4.2% | | | | | | | | | | | | | | | | | | | 1,468,922 | |
| | | | | | | | | | | | | | | | | | | | |
| | | | | |
NET ASSETS 100.0% | | | | | | | | | | | | | | | | | | $ | 34,770,752 | |
| | | | | | | | | | | | | | | | | | | | |
Below is a list of the abbreviation(s) used in the annual report:
AUD—Australian Dollar
BRL—Brazilian Real
CAD—Canadian Dollar
CHF—Swiss Franc
CLP—Chilean Peso
CNH—Chinese Renminbi
COP—Colombian Peso
CZK—Czech Koruna
EUR—Euro
GBP—British Pound
HKD—Hong Kong Dollar
HUF—Hungarian Forint
IDR—Indonesian Rupiah
ILS—Israeli Shekel
ITL—Italian Lira
JPY—Japanese Yen
KRW—South Korean Won
MXN—Mexican Peso
MYR—Malaysian Ringgit
NOK—Norwegian Krone
NZD—New Zealand Dollar
PEN—Peruvian Nuevo Sol
PLN—Polish Zloty
RUB—Russian Ruble
SAR—Saudi Arabian Riyal
SEK—Swedish Krona
SGD—Singapore Dollar
THB—Thai Baht
USD—US Dollar
ZAR—South African Rand
144A—Security was purchased pursuant to Rule 144A under the Securities Act of 1933 and, pursuant to the requirements of Rule 144A, may not be resold except to qualified institutional buyers.
A—Annual payment frequency for swaps
BBR—New Zealand Bank Bill Rate
BBSW—Australian Bank Bill Swap Reference Rate
BROIS—Brazil Overnight Index Swap
BUBOR—Budapest Interbank Offered Rate
See Notes to Financial Statements.
PGIM International Bond Fund 29
Schedule of Investments (continued)
as of October 31, 2021
CDOR—Canadian Dollar Offered Rate
CDX—Credit Derivative Index
CLO—Collateralized Loan Obligation
CLOIS—Sinacofi Chile Interbank Rate Average
CME—Chicago Mercantile Exchange
COOIS—Colombia Overnight Interbank Reference Rate
CPI—Consumer Price Index
EMTN—Euro Medium Term Note
ESTR—Euro Short-Term Rate
EURIBOR—Euro Interbank Offered Rate
FHLMC—Federal Home Loan Mortgage Corporation
GMTN—Global Medium Term Note
HICP—Harmonised Index of Consumer Prices
IO—Interest Only (Principal amount represents notional)
JIBAR—Johannesburg Interbank Agreed Rate
KLIBOR—Kuala Lumpur Interbank Offered Rate
KWCDC—Korean Won Certificate of Deposit
LIBOR—London Interbank Offered Rate
LP—Limited Partnership
M—Monthly payment frequency for swaps
MosPRIME—Moscow Prime Offered Rate
MPLE—Maple Bonds
MTN—Medium Term Note
NIBOR—Norwegian Interbank Offered Rate
NSA—Non-Seasonally Adjusted
OAT—Obligations Assimilables du Tresor
OTC—Over-the-counter
PIK—Payment-in-Kind
PJSC—Public Joint-Stock Company
PRIBOR—Prague Interbank Offered Rate
Q—Quarterly payment frequency for swaps
S—Semiannual payment frequency for swaps
SOFR—Secured Overnight Financing Rate
SONIA—Sterling Overnight Index Average
SORA—Singapore Overnight Rate Average
STIBOR—Stockholm Interbank Offered Rate
Strips—Separate Trading of Registered Interest and Principal of Securities
T—Swap payment upon termination
TELBOR—Tel Aviv Interbank Offered Rate
THBFIX—Thai Baht Interest Rate Fixing
USOIS—United States Overnight Index Swap
WIBOR—Warsaw Interbank Offered Rate
| * | Non-income producing security. |
| # | Principal or notional amount is shown in U.S. dollars unless otherwise stated. |
| ~ | See tables subsequent to the Schedule of Investments for options detail. |
| (c) | Variable rate instrument. The interest rate shown reflects the rate in effect at October 31, 2021. |
| (cc) | Variable rate instrument. The rate shown is based on the latest available information as of October 31, 2021. Certain variable rate securities are not based on a published reference rate and spread but are determined by the issuer or agent and are based on current market conditions. These securities do not indicate a reference rate and spread in their description. |
| (d) | Represents issuer in default on interest payments and/or principal repayment. Non-income producing security. Such securities may be post-maturity. |
See Notes to Financial Statements.
30
| (ff) | Variable rate security. Security may be issued at a fixed coupon rate, which converts to a variable rate at a specified date. Rate shown is the rate in effect as of period end. |
| (jj) | Represents original contract currency denomination, settlement to occur in Euro currency. |
| (k) | Represents security, or a portion thereof, segregated as collateral for centrally cleared/exchange-traded derivatives. |
| (oo) | Perpetual security. Maturity date represents next call date. |
| (s) | Represents zero coupon bond or principal only security. Rate represents yield to maturity at purchase date. |
| (wb) | PGIM Investments LLC, the manager of the Fund, also serves as manager of the PGIM Core Ultra Short Bond Fund. |
| (z) | Includes net unrealized appreciation/(depreciation) and/or market value of the below holdings which are excluded from the Schedule of Investments: |
Options Purchased:
OTC Swaptions
| | | | | | | | | | | | | | | | | | | | | | | | | | | | | | |
Description | | Call/
Put | | | Counterparty | | Expiration
Date | | | Strike | | | Receive | | | Pay | | | Notional
Amount
(000)# | | | Value | |
| | | | | | | | |
2- Year Interest Rate Swap, 05/21/25 | | | Call | | | Deutsche Bank AG | | | 05/17/23 | | | | 2.05% | | | | 2.05%(A) | | |
| 3 Month
SAIBOR(Q) |
| | | SAR 1,875 | | | $ | 1,483 | |
2- Year Interest Rate Swap, 05/21/25 | | | Put | | | Deutsche Bank AG | | | 05/17/23 | | | | 2.05% | | | | 3 Month SAIBOR(Q) | | | | 2.05%(A) | | | | SAR 1,875 | | | | 4,963 | |
| | | | | | | | | | | | | | | | | | | | | | | | | | | | | | |
| | | | | |
| Total Options Purchased (cost $6,300) | | | | | | | | | | | | | | | | | | | $ | 6,446 | |
| | | | | | | | | | | | | | | | | | | | | | | | | | | | | | |
| | | | | | | | |
| Options Written: | | | | | | | | | | | | | | | | | | | | | | | | | | | | | | |
| | | | | | | | |
| OTC Swaptions | | | | | | | | | | | | | | | | | | | | | | | | | | | | | | |
| | | | | | | | | | | | | | | | | | | | | | | | | | | | |
| | | | | | | | |
Description | | Call/
Put | | | Counterparty | | Expiration
Date | | Strike | | | Receive | | | Pay | | | Notional
Amount
(000)# | | | Value | |
| | | | | | | | |
2- Year Interest Rate Swap, 05/19/25 | | | Call | | | Deutsche Bank AG | | 05/17/23 | | | 1.13% | | |
| 3 Month
LIBOR(Q) |
| | | 1.13%(S) | | | | 500 | | | $ | (2,340 | ) |
2- Year Interest Rate Swap, 05/19/25 | | | Put | | | Deutsche Bank AG | | 05/17/23 | | | 1.13% | | | | 1.13%(S) | | |
| 3 Month
LIBOR(Q) |
| | | 500 | | | | (5,804 | ) |
| | | | | | | | | | | | | | | | | | | | | | | | | | | | |
| | | | |
| Total Options Written (premiums received $7,500) | | | | | | | | | | | | | | | $ | (8,144 | ) |
| | | | | | | | | | | | | | | | | | | | | | | | | | | | |
Futures contracts outstanding at October 31, 2021:
| | | | | | | | | | | | | | | | | | | | | | |
Number of Contracts | | Type | | Expiration
Date | | | Current
Notional
Amount | | | Value /
Unrealized
Appreciation
(Depreciation) | |
| | |
Long Positions: | | | | | | | | | |
3 | | 10 Year Australian Treasury Bonds | | | Dec. 2021 | | | $ | 304,326 | | | | | | | $ | (20,618 | ) | | | | |
1 | | 10 Year Canadian Government Bonds | | | Dec. 2021 | | | | 113,890 | | | | | | | | (4,744 | ) | | | | |
8 | | 10 Year U.S. Ultra Treasury Notes | | | Dec. 2021 | | | | 1,160,250 | | | | | | | | (13,514 | ) | | | | |
16 | | 20 Year U.S. Treasury Bonds | | | Dec. 2021 | | | | 2,573,500 | | | | | | | | (27,831 | ) | | | | |
3 | | 30 Year Euro Buxl | | | Dec. 2021 | | | | 724,743 | | | | | | | | (5,759 | ) | | | | |
See Notes to Financial Statements.
PGIM International Bond Fund 31
Schedule of Investments (continued)
as of October 31, 2021
Futures contracts outstanding at October 31, 2021 (continued):
| | | | | | | | | | | | | | | | | | | | |
Number of Contracts | | Type | | Expiration
Date | | | Current
Notional
Amount | | | Value /
Unrealized
Appreciation
(Depreciation) | |
| | | |
Long Positions (cont’d): | | | | | | | | | | | |
6 | | 30 Year U.S. Ultra Treasury Bonds | | | Dec. 2021 | | | $ | 1,178,438 | | | | | $ | (5,218 | ) | | | | |
6 | | Euro-OAT | | | Dec. 2021 | | | | 1,137,504 | | | | | | (33,969 | ) | | | | |
| | | | | | | | | | | | | | | | | | | | |
| | | | | | |
| | | | | | | | | | | | | | | (111,653 | ) | | | | |
| | | | | | | | | | | | | | | | | | | | |
Short Positions: | | | | | | | | | | | | | | | |
39 | | 2 Year U.S.Treasury Notes | | | Dec. 2021 | | | | 8,550,750 | | | | | | 33,710 | | | | | |
3 | | 3 Month CME SOFR | | | Jun. 2022 | | | | 749,100 | | | | | | 1,045 | | | | | |
33 | | 5 Year Euro-Bobl | | | Dec. 2021 | | | | 5,102,676 | | | | | | 72,256 | | | | | |
4 | | 5 Year U.S.Treasury Notes | | | Dec. 2021 | | | | 487,000 | | | | | | 276 | | | | | |
30 | | 10 Year Euro-Bund | | | Dec. 2021 | | | | 5,830,402 | | | | | | 150,404 | | | | | |
4 | | 10 Year U.K. Gilt | | | Dec. 2021 | | | | 683,837 | | | | | | 8,672 | | | | | |
4 | | 10 Year U.S. Treasury Notes | | | Dec. 2021 | | | | 522,813 | | | | | | 3,305 | | | | | |
163 | | Euro Currency | | | Dec. 2021 | | | | 23,570,819 | | | | | | 520,736 | | | | | |
44 | | Euro Schatz Index | | | Dec. 2021 | | | | 5,694,733 | | | | | | 17,226 | | | | | |
| | | | | | | | | | | | | | | | | | | | |
| | | | | | |
| | | | | | | | | | | | | | | 807,630 | | | | | |
| | | | | | | | | | | | | | | | | | | | |
| | | | | | |
| | | | | | | | | | | | | | $ | 695,977 | | | | | |
| | | | | | | | | | | | | | | | | | | | |
Forward foreign currency exchange contracts outstanding at October 31, 2021:
| | | | | | | | | | | | | | | | | | | | | | | | | | | | | | | | | | |
Purchase Contracts | | Counterparty | | Notional Amount (000) | | Value at
Settlement
Date | | | Current
Value | | | Unrealized
Appreciation | | Unrealized
Depreciation | |
| |
OTC Forward Foreign Currency Exchange Contracts: | | | | | |
Australian Dollar, | | | | | | | | | | | | | | | | | | | | | | | | | | | | | | |
Expiring 01/19/22 | | Bank of America, N.A. | | AUD | | 72 | | $ | 53,793 | | | $ | 53,863 | | | | | $ | 70 | | | | | | | | | $ | — | | | | | |
Brazilian Real, | | | | | | | | | | | | | | | | | | | | | | | | | | | | | | | | | | |
Expiring 12/02/21 | | Citibank, N.A. | | BRL | | 933 | | | 166,146 | | | | 164,187 | | | | | | — | | | | | | | | | | (1,959 | ) | | | | |
British Pound, | | | | | | | | | | | | | | | | | | | | | | | | | | | | | | | | | | |
Expiring 11/02/21 | | BNP Paribas S.A. | | GBP | | 2,892 | | | 3,988,107 | | | | 3,957,885 | | | | | | — | | | | | | | | | | (30,222 | ) | | | | |
Chilean Peso, | | | | | | | | | | | | | | | | | | | | | | | | | | | | | | | | | | |
Expiring 12/15/21 | | Citibank, N.A. | | CLP | | 28,015 | | | 34,614 | | | | 34,255 | | | | | | — | | | | | | | | | | (359 | ) | | | | |
Expiring 12/15/21 | | HSBC Bank PLC | | CLP | | 27,651 | | | 35,362 | | | | 33,811 | | | | | | — | | | | | | | | | | (1,551 | ) | | | | |
Chinese Renminbi, | | | | | | | | | | | | | | | | | | | | | | | | | | | | | | | | | | |
Expiring 11/18/21 | | Goldman Sachs International | | CNH | | 296 | | | 46,153 | | | | 46,103 | | | | | | — | | | | | | | | | | (50 | ) | | | | |
Euro, | | | | | | | | | | | | | | | | | | | | | | | | | | | | | | | | | | |
Expiring 11/02/21 | | Bank of America, N.A. | | EUR | | 143 | | | 165,407 | | | | 165,856 | | | | | | 449 | | | | | | | | | | — | | | | | |
Expiring 11/02/21 | | JPMorgan Chase Bank, N.A. | | EUR | | 244 | | | 283,410 | | | | 282,517 | | | | | | — | | | | | | | | | | (893 | ) | | | | |
Expiring 11/02/21 | | JPMorgan Chase Bank, N.A. | | EUR | | 16 | | | 19,036 | | | | 18,976 | | | | | | — | | | | | | | | | | (60 | ) | | | | |
Expiring 11/02/21 | | Standard Chartered Bank | | EUR | | 615 | | | 720,326 | | | | 711,123 | | | | | | — | | | | | | | | | | (9,203 | ) | | | | |
Expiring 12/02/21 | | Bank of America, N.A. | | EUR | | 956 | | | 1,110,741 | | | | 1,105,653 | | | | | | — | | | | | | | | | | (5,088 | ) | | | | |
Expiring 12/02/21 | | Morgan Stanley & Co. International PLC | | EUR | | 28 | | | 32,388 | | | | 32,390 | | | | | | 2 | | | | | | | | | | — | | | | | |
See Notes to Financial Statements.
32
Forward foreign currency exchange contracts outstanding at October 31, 2021 (continued):
| | | | | | | | | | | | | | | | | | | | | | | | | | | | | | | | |
Purchase Contracts | | Counterparty | | Notional Amount (000) | | Value at
Settlement
Date | | | Current
Value | | | Unrealized
Appreciation | | Unrealized
Depreciation | |
| |
OTC Forward Foreign Currency Exchange Contracts (cont’d.): | | | | | |
Euro (cont’d.), | | | | | |
Expiring 01/19/22 | | Goldman Sachs International | | EUR | | 42 | | $ | 48,286 | | | $ | 48,236 | | | | | $ — | | | | | | | | $ | (50 | ) | | | | |
Israeli Shekel, | | | | | | | | | | | | | | | | | | | | | | | | | | | | | | | | |
Expiring 12/15/21 | | Bank of America, N.A. | | ILS | | 55 | | | 17,434 | | | | 17,393 | | | | | — | | | | | | | | | (41 | ) | | | | |
Japanese Yen, | | | | | | | | | | | | | | | | | | | | | | | | | | | | | | | | |
Expiring 11/02/21 | | Citibank, N.A. | | JPY | | 44,451 | | | 390,895 | | | | 390,015 | | | | | — | | | | | | | | | (880 | ) | | | | |
Expiring 11/02/21 | | UBS AG | | JPY | | 96,242 | | | 847,026 | | | | 844,438 | | | | | — | | | | | | | | | (2,588 | ) | | | | |
Mexican Peso, | | | | | | | | | | | | | | | | | | | | | | | | | | | | | | | | |
Expiring 12/15/21 | | HSBC Bank PLC | | MXN | | 392 | | | 18,884 | | | | 18,906 | | | | | 22 | | | | | | | | | — | | | | | |
New Zealand Dollar, | | | | | | | | | | | | | | | | | | | | | | | | | | | | | | | | |
Expiring 01/19/22 | | Bank of America, N.A. | | NZD | | 66 | | | 47,508 | | | | 47,563 | | | | | 55 | | | | | | | | | — | | | | | |
Norwegian Krone, | | | | | | | | | | | | | | | | | | | | | | | | | | | | | | | | |
Expiring 01/19/22 | | Citibank, N.A. | | NOK | | 191 | | | 22,186 | | | | 22,540 | | | | | 354 | | | | | | | | | — | | | | | |
Polish Zloty, | | | | | | | | | | | | | | | | | | | | | | | | | | | | | | | | |
Expiring 01/19/22 | | Barclays Bank PLC | | PLN | | 150 | | | 37,954 | | | | 37,623 | | | | | — | | | | | | | | | (331 | ) | | | | |
Russian Ruble, | | | | | | | | | | | | | | | | | | | | | | | | | | | | | | | | |
Expiring 12/15/21 | | Citibank, N.A. | | RUB | | 1,846 | | | 25,814 | | | | 25,749 | | | | | — | | | | | | | | | (65 | ) | | | | |
South African Rand, | | | | | | | | | | | | | | | | | | | | | | | | | | | | | | | | |
Expiring 12/15/21 | | Barclays Bank PLC | | ZAR | | 282 | | | 18,537 | | | | 18,329 | | | | | — | | | | | | | | | (208 | ) | | | | |
Expiring 12/15/21 | | Citibank, N.A. | | ZAR | | 285 | | | 18,636 | | | | 18,531 | | | | | — | | | | | | | | | (105 | ) | | | | |
South Korean Won, | | | | | | | | | | | | | | | | | | | | | | | | | | | | | | | | |
Expiring 12/15/21 | | Citibank, N.A. | | KRW | | 28,440 | | | 24,202 | | | | 24,186 | | | | | — | | | | | | | | | (16 | ) | | | | |
Swedish Krona, | | | | | | | | | | | | | | | | | | | | | | | | | | | | | | | | |
Expiring 01/19/22 | | Citibank, N.A. | | SEK | | 188 | | | 21,937 | | | | 21,937 | | | | | — | | | | | | | | | — | | | | | |
| | | | | | | | | | | | | | | | | | | | | | | | | | | | | | | | |
| | | | | | | | | | | |
| | | | | | | | $ | 8,194,782 | | | $ | 8,142,065 | | | | | 952 | | | | | | | | | (53,669 | ) | | | | |
| | | | | | | | | | | | | | | | | | | | | | | | | | | | | | | | |
| | | | | | | | | | | | | | | | | | | | | | | | | | | | | | | | | | | | | | |
Sale Contracts | | Counterparty | | Notional
Amount
(000) | | Value at
Settlement
Date | | | Current
Value | | | Unrealized
Appreciation | | | Unrealized
Depreciation | |
| | | | | | | | |
OTC Forward Foreign Currency Exchange Contracts: | | | | | | | | | | | | | | | | | | | | | | | | | | | | | | | | |
Australian Dollar, | | | | | | | | | | | | | | | | | | | | | | | | | | | | | | | | |
Expiring 01/19/22 | | Morgan Stanley & Co. International PLC | | AUD | | 579 | | $ | 426,612 | | | $ | 435,575 | | | | | | | $ | — | | | | | | | | | | | $ | (8,963 | ) | | | | |
British Pound, | | | | | | | | | | | | | | | | | | | | | | | | | | | | | | | | | | | | | | |
Expiring 11/02/21 | | Bank of America, N.A. | | GBP | | 116 | | | 158,109 | | | | 159,293 | | | | | | | | — | | | | | | | | | | | | (1,184 | ) | | | | |
Expiring 11/02/21 | | BNP Paribas S.A. | | GBP | | 2,741 | | | 3,752,926 | | | | 3,750,939 | | | | | | | | 1,987 | | | | | | | | | | | | — | | | | | |
Expiring 11/02/21 | | Morgan Stanley & Co. International PLC | | GBP | | 35 | | | 47,899 | | | | 47,653 | | | | | | | | 246 | | | | | | | | | | | | — | | | | | |
Expiring 12/02/21 | | BNP Paribas S.A. | | GBP | | 2,892 | | | 3,988,080 | | | | 3,958,071 | | | | | | | | 30,009 | | | | | | | | | | | | — | | | | | |
See Notes to Financial Statements.
PGIM International Bond Fund 33
Schedule of Investments (continued)
as of October 31, 2021
Forward foreign currency exchange contracts outstanding at October 31, 2021 (continued):
| | | | | | | | | | | | | | | | | | | | | | | | | | | | | | | | | | | | | | | | | | |
Sale Contracts | | Counterparty | | Notional
Amount
(000) | | | Value at
Settlement
Date | | | Current
Value | | | Unrealized
Appreciation | | | Unrealized
Depreciation | |
| |
OTC Forward Foreign Currency Exchange Contracts (cont’d.): | | | | | |
Canadian Dollar, | | | | | |
Expiring 01/19/22 | | JPMorgan Chase Bank, N.A. | | | CAD | | | | 822 | | | $ | 658,955 | | | $ | 663,967 | | | | | | | $ | — | | | | | | | | | | | $ | (5,012 | ) | | | | |
Chinese Renminbi, | | | | | | | | | | | | | | | | | | | | | | | | | | | | | | | | | | | | | | | | | | |
Expiring 11/18/21 | | Barclays Bank PLC | | | CNH | | | | 242 | | | | 37,323 | | | | 37,761 | | | | | | | | — | | | | | | | | | | | | (438 | ) | | | | |
Expiring 11/18/21 | | HSBC Bank PLC | | | CNH | | | | 8,532 | | | | 1,306,720 | | | | 1,329,557 | | | | | | | | — | | | | | | | | | | | | (22,837 | ) | | | | |
Expiring 11/18/21 | | HSBC Bank PLC | | | CNH | | | | 956 | | | | 146,156 | | | | 149,023 | | | | | | | | — | | | | | | | | | | | | (2,867 | ) | | | | |
Colombian Peso, | | | | | | | | | | | | | | | | | | | | | | | | | | | | | | | | | | | | | | | | | | |
Expiring 12/15/21 | | JPMorgan Chase Bank, N.A. | | | COP | | | | 53,534 | | | | 14,169 | | | | 14,170 | | | | | | | | — | | | | | | | | | | | | (1 | ) | | | | |
Euro, | | | | | | | | | | | | | | | | | | | | | | | | | | | | | | | | | | | | | | | | | | |
Expiring 11/02/21 | | Bank of America, N.A. | | | EUR | | | | 956 | | | | 1,110,109 | | | | 1,104,971 | | | | | | | | 5,138 | | | | | | | | | | | | — | | | | | |
Expiring 11/02/21 | | Goldman Sachs International | | | EUR | | | | 64 | | | | 74,064 | | | | 73,502 | | | | | | | | 562 | | | | | | | | | | | | — | | | | | |
Expiring 12/02/21 | | Citibank, N.A. | | | EUR | | | | 93 | | | | 107,611 | | | | 107,184 | | | | | | | | 427 | | | | | | | | | | | | — | | | | | |
Hong Kong Dollar, | | | | | | | | | | | | | | | | | | | | | | | | | | | | | | | | | | | | | | | | | | |
Expiring 11/18/21 | | HSBC Bank PLC | | | HKD | | | | 1,026 | | | | 131,945 | | | | 131,924 | | | | | | | | 21 | | | | | | | | | | | | — | | | | | |
Indonesian Rupiah, | | | | | | | | | | | | | | | | | | | | | | | | | | | | | | | | | | | | | | | | | | |
Expiring 12/15/21 | | Citibank, N.A. | | | IDR | | | | 2,724,990 | | | | 186,694 | | | | 190,617 | | | | | | | | — | | | | | | | | | | | | (3,923 | ) | | | | |
Israeli Shekel, | | | | | | | | | | | | | | | | | | | | | | | | | | | | | | | | | | | | | | | | | | |
Expiring 12/15/21 | | Goldman Sachs International | | | ILS | | | | 23 | | | | 7,148 | | | | 7,226 | | | | | | | | — | | | | | | | | | | | | (78 | ) | | | | |
Japanese Yen, | | | | | | | | | | | | | | | | | | | | | | | | | | | | | | | | | | | | | | | | | | |
Expiring 11/02/21 | | Citibank, N.A. | | | JPY | | | | 140,693 | | | | 1,272,885 | | | | 1,234,453 | | | | | | | | 38,432 | | | | | | | | | | | | — | | | | | |
Expiring 12/02/21 | | Citibank, N.A. | | | JPY | | | | 44,451 | | | | 390,971 | | | | 390,110 | | | | | | | | 861 | | | | | | | | | | | | — | | | | | |
Malaysian Ringgit, | | | | | | | | | | | | | | | | | | | | | | | | | | | | | | | | | | | | | | | | | | |
Expiring 12/15/21 | | Barclays Bank PLC | | | MYR | | | | 94 | | | | 22,553 | | | | 22,671 | | | | | | | | — | | | | | | | | | | | | (118 | ) | | | | |
Mexican Peso, | | | | | | | | | | | | | | | | | | | | | | | | | | | | | | | | | | | | | | | | | | |
Expiring 12/15/21 | | HSBC Bank PLC | | | MXN | | | | 365 | | | | 18,082 | | | | 17,620 | | | | | | | | 462 | | | | | | | | | | | | — | | | | | |
New Zealand Dollar, | | | | | | | | | | | | | | | | | | | | | | | | | | | | | | | | | | | | | | | | | | |
Expiring 01/19/22 | | HSBC Bank PLC | | | NZD | | | | 178 | | | | 123,292 | | | | 127,169 | | | | | | | | — | | | | | | | | | | | | (3,877 | ) | | | | |
Peruvian Nuevo Sol, | | | | | | | | | | | | | | | | | | | | | | | | | | | | | | | | | | | | | | | | | | |
Expiring 12/15/21 | | Citibank, N.A. | | | PEN | | | | 93 | | | | 22,546 | | | | 23,181 | | | | | | | | — | | | | | | | | | | | | (635 | ) | | | | |
Polish Zloty, | | | | | | | | | | | | | | | | | | | | | | | | | | | | | | | | | | | | | | | | | | |
Expiring 01/19/22 | | Barclays Bank PLC | | | PLN | | | | 154 | | | | 38,744 | | | | 38,580 | | | | | | | | 164 | | | | | | | | | | | | — | | | | | |
Singapore Dollar, | | | | | | | | | | | | | | | | | | | | | | | | | | | | | | | | | | | | | | | | | | |
Expiring 12/15/21 | | Goldman Sachs International | | | SGD | | | | 30 | | | | 22,329 | | | | 22,253 | | | | | | | | 76 | | | | | | | | | | | | — | | | | | |
South African Rand, | | | | | | | | | | | | | | | | | | | | | | | | | | | | | | | | | | | | | | | | | | |
Expiring 12/15/21 | | UBS AG | | | ZAR | | | | 1,448 | | | | 99,177 | | | | 94,239 | | | | | | | | 4,938 | | | | | | | | | | | | — | | | | | |
Swedish Krona, | | | | | | | | | | | | | | | | | | | | | | | | | | | | | | | | | | | | | | | | | | |
Expiring 01/19/22 | | Morgan Stanley & Co. International PLC | | | SEK | | | | 1,538 | | | | 175,536 | | | | 179,344 | | | | | | | | — | | | | | | | | | | | | (3,808 | ) | | | | |
See Notes to Financial Statements.
34
Forward foreign currency exchange contracts outstanding at October 31, 2021 (continued):
| | | | | | | | | | | | | | | | | | | | | | | | | | | | | | | | | | | | | | | | | | |
Sale Contracts | | Counterparty | | Notional
Amount
(000) | | | Value at
Settlement
Date | | | Current
Value | | | Unrealized
Appreciation | | | Unrealized
Depreciation | |
| | |
OTC Forward Foreign Currency Exchange Contracts (cont’d.): | | | | | | | | | |
Swiss Franc, | | | | | | | | | | | | | | | | | | | | | | | | | | | | | | | | | | | | | | | | |
Expiring 01/19/22 | | Barclays Bank PLC | | | CHF | | | | 316 | | | $ | 342,147 | | | $ | 346,003 | | | | | | | $ | — | | | | | | | | | | | $ | (3,856 | ) | | | | |
| | | | | | | | | | | | | | | | | | | | | | | | | | | | | | | | | | | | | | | | | | |
| | | | | | | | | | | |
| | | | | | | | | | | | $ | 14,682,782 | | | $ | 14,657,056 | | | | | | | | 83,323 | | | | | | | | | | | | (57,597 | ) | | | | |
| | | | | | | | | | | | | | | | | | | | | | | | | | | | | | | | | | | | | | | | | | |
| | | | | | | | | | | |
| | | | | | | | | | | | | | | | | | | | | | | | $ | 84,275 | | | | | | | | | | | $ | (111,266 | ) | | | | |
| | | | | | | | | | | | | | | | | | | | | | | | | | | | | | | | | | | | | | | | | | |
Credit default swap agreements outstanding at October 31, 2021:
| | | | | | | | | | | | | | | | | | | | | | | | | | | | | | | | | | | | | | | | |
Reference Entity/ Obligation | | Termination
Date | | | Fixed
Rate | | | Notional
Amount
(000)#(3) | | | Fair Value | | Upfront Premiums Paid (Received) | | Unrealized Appreciation (Depreciation) | | Counterparty | |
|
OTC Credit Default Swap Agreements on corporate and/or sovereign issues - Buy Protection(1): | |
Republic of France | | | 12/20/26 | | | | 0.250%(Q) | | | | 60 | | | | | $ | (119 | ) | | | | | | $ | (121 | ) | | | | | | $ | 2 | | | | | | Barclays Bank PLC | |
Republic of Italy | | | 06/20/28 | | | | 1.000%(Q) | | | EUR | 105 | | | | | | (2,614 | ) | | | | | | | 4,342 | | | | | | | | (6,956 | ) | | | | | Barclays Bank PLC | |
| | | | | | | | | | | | | | | | | | | | | | | | | | | | | | | | | | | | | | | | |
| | | | | | | | | | | | | |
| | | | | | | | | | | | | | | | $ | (2,733 | ) | | | | | | $ | 4,221 | | | | | | | $ | (6,954 | ) | | | | | | |
| | | | | | | | | | | | | | | | | | | | | | | | | | | | | | | | | | | | | | | | |
| | | | | | | | | | | | | | | | | | | | | | | | | | | | | | | | | | | | | | |
Reference Entity/ Obligation | | Termination
Date | | Fixed
Rate | | | Notional
Amount
(000)#(3) | | | Implied
Credit
Spread at
October 31,
2021(4) | | Fair
Value | | | Upfront Premiums Paid (Received) | | | Unrealized
Appreciation
(Depreciation) | | | Counterparty |
| | | | | | | | | | | | | | | | | | | | | | | | | | | | | |
|
OTC Credit Default Swap Agreements on corporate and/or sovereign issues - Sell Protection(2): |
Boeing Co. | | 12/20/21 | | | 1.000%(Q) | | | | 100 | | | 0.331% | | $ | 213 | | | | | | | $ | 73 | | | | | | | | | | | $ | 140 | | | Bank of America, N.A. |
Boeing Co. | | 12/20/21 | | | 1.000%(Q) | | | | 50 | | | 0.331% | | | 107 | | | | | | | | 31 | | | | | | | | | | | | 76 | | | Goldman Sachs International |
Devon Energy Corp. | | 12/20/21 | | | 1.000%(Q) | | | | 50 | | | 0.333% | | | 107 | | | | | | | | 52 | | | | | | | | | | | | 55 | | | Goldman Sachs International |
DP World PLC | | 12/20/24 | | | 1.000%(Q) | | | | 100 | | | 0.577% | | | 1,443 | | | | | | | | 295 | | | | | | | | | | | | 1,148 | | | Barclays Bank PLC |
Electricite de France S.A. | | 12/20/22 | | | 1.000%(Q) | | | EUR | 60 | | | 0.148% | | | 767 | | | | | | | | 627 | | | | | | | | | | | | 140 | | | Goldman Sachs International |
EQT Corp. | | 06/20/22 | | | 5.000%(Q) | | | | 30 | | | 1.068% | | | 937 | | | | | | | | 689 | | | | | | | | | | | | 248 | | | Credit Suisse International |
General Electric Co. | | 06/20/22 | | | 1.000%(Q) | | | | 110 | | | 0.164% | | | 725 | | | | | | | | 493 | | | | | | �� | | | | | | 232 | | | Morgan Stanley & Co.
International PLC |
Generalitat de Cataluna | | 12/20/22 | | | 1.000%(Q) | | | | 110 | | | * | | | 804 | | | | | | | | (3,584 | ) | | | | | | | | | | | 4,388 | | | Citibank, N.A. |
See Notes to Financial Statements.
PGIM International Bond Fund 35
Schedule of Investments (continued)
as of October 31, 2021
Credit default swap agreements outstanding at October 31, 2021 (continued):
| | | | | | | | | | | | | | | | | | | | | | | | | | |
Reference Entity/ Obligation | | Termination
Date | | Fixed
Rate | | | Notional
Amount
(000)#(3) | | | Implied
Credit
Spread at
October 31,
2021(4) | | Fair
Value | | | Upfront
Premiums
Paid
(Received) | | Unrealized
Appreciation
(Depreciation) | | Counterparty |
|
OTC Credit Default Swap Agreements on corporate and/or sovereign issues - Sell Protection(2)(cont’d.): |
Goldman Sachs Group, Inc. | | 12/20/21 | | | 1.000%(Q) | | | | 80 | | | 0.243% | | | $ 181 | | | | $ 88 | | | | $ 93 | | | Barclays Bank PLC |
Halliburton Co. | | 12/20/26 | | | 1.000%(Q) | | | | 30 | | | 0.713% | | | 464 | | | | 295 | | | | 169 | | | Goldman Sachs International |
Hellenic Republic | | 12/20/27 | | | 1.000%(Q) | | | | 140 | | | 1.027% | | | (55 | ) | | | 566 | | | | (621 | ) | | Barclays Bank PLC |
JPMorgan Chase & Co. | | 12/20/21 | | | 1.000%(Q) | | | | 50 | | | 0.206% | | | 116 | | | | 59 | | | | 57 | | | Barclays Bank PLC |
Naturgy Energy Group S.A. | | 06/20/22 | | | 1.000%(Q) | | | | EUR 200 | | | 0.192% | | | 1,486 | | | | 1,134 | | | | 352 | | | Goldman Sachs International |
Republic of Chile | | 12/20/21 | | | 1.000%(Q) | | | | 40 | | | 0.236% | | | 91 | | | | 47 | | | | 44 | | | Citibank, N.A. |
Republic of France | | 12/20/26 | | | 0.250%(Q) | | | | 60 | | | 0.217% | | | 119 | | | | 473 | | | | (354 | ) | | Barclays Bank PLC |
Republic of Hungary | | 06/20/22 | | | 1.000%(Q) | | | | 450 | | | 0.125% | | | 3,083 | | | | (353 | ) | | | 3,436 | | | Citibank, N.A. |
Republic of Indonesia | | 06/20/23 | | | 1.000%(Q) | | | | 220 | | | 0.292% | | | 2,835 | | | | (462 | ) | | | 3,297 | | | Citibank, N.A. |
Republic of Ireland | | 06/20/27 | | | 1.000%(Q) | | | | 100 | | | 0.170% | | | 4,728 | | | | 1,417 | | | | 3,311 | | | Morgan Stanley & Co. International PLC |
Republic of Italy | | 06/20/23 | | | 1.000%(Q) | | | | 350 | | | 0.294% | | | 4,497 | | | | (6,416 | ) | | | 10,913 | | | Bank of America, N.A. |
Republic of Kazakhstan | | 06/20/23 | | | 1.000%(Q) | | | | 115 | | | 0.241% | | | 1,581 | | | | — | | | | 1,581 | | | Citibank, N.A. |
Republic of Panama | | 06/20/22 | | | 1.000%(Q) | | | | 100 | | | 0.295% | | | 575 | | | | 113 | | | | 462 | | | Citibank, N.A. |
Republic of Panama | | 12/20/26 | | | 1.000%(Q) | | | | 80 | | | 0.933% | | | 362 | | | | 237 | | | | 125 | | | Citibank, N.A. |
Republic of Portugal | | 12/20/23 | | | 1.000%(Q) | | | | 100 | | | 0.130% | | | 1,994 | | | | (24 | ) | | | 2,018 | | | Morgan Stanley & Co. International PLC |
Republic of Serbia | | 12/20/21 | | | 1.000%(Q) | | | | 50 | | | 0.110% | | | 122 | | | | 58 | | | | 64 | | | BNP Paribas S.A. |
Republic of South Africa | | 12/20/23 | | | 1.000%(Q) | | | | 400 | | | 1.048% | | | 53 | | | | (9,193 | ) | | | 9,246 | | | Bank of America, N.A. |
Republic of Ukraine | | 12/20/23 | | | 5.000%(Q) | | | | 100 | | | 3.212% | | | 4,289 | | | | 3,056 | | | | 1,233 | | | Deutsche Bank AG |
Republic of Ukraine | | 06/20/25 | | | 5.000%(Q) | | | | 30 | | | 3.810% | | | 1,376 | | | | (244 | ) | | | 1,620 | | | Barclays Bank PLC |
Republic of Ukraine | | 12/20/25 | | | 5.000%(Q) | | | | 85 | | | 3.952% | | | 3,847 | | | | (1,467 | ) | | | 5,314 | | | Barclays Bank PLC |
See Notes to Financial Statements.
36
Credit default swap agreements outstanding at October 31, 2021 (continued):
| | | | | | | | | | | | | | | | | | | | | | | | | | | | | | | | | | | | | | | | | | | | | | |
Reference Entity/ Obligation | | Termination
Date | | | Fixed
Rate | | | Notional
Amount
(000)#(3) | | | Implied
Credit
Spread at
October 31,
2021(4) | | | Fair
Value | | | Upfront Premiums Paid (Received) | | | Unrealized
Appreciation
(Depreciation) | | | Counterparty |
|
OTC Credit Default Swap Agreements on corporate and/or sovereign issues - Sell Protection(2)(cont’d.): |
Russian Federation | | | 12/20/22 | | | | 1.000%(Q) | | | | 50 | | | | 0.260% | | | $ | 486 | | | | | | | $ | (30 | ) | | | | | | | | | | $ | 516 | | | | | | | Citibank, N.A. |
Russian Federation | | | 06/20/23 | | | | 1.000%(Q) | | | | 200 | | | | 0.330% | | | | 2,450 | | | | | | | | (1,257 | ) | | | | | | | | | | | 3,707 | | | | | | | Morgan Stanley & Co. International PLC |
Russian Federation | | | 06/20/23 | | | | 1.000%(Q) | | | | 150 | | | | 0.330% | | | | 1,838 | | | | | | | | (790 | ) | | | | | | | | | | | 2,628 | | | | | | | Morgan Stanley & Co. International PLC |
Russian Federation | | | 06/20/23 | | | | 1.000%(Q) | | | | 60 | | | | 0.330% | | | | 735 | | | | | | | | (371 | ) | | | | | | | | | | | 1,106 | | | | | | | BNP Paribas S.A. |
Russian Federation | | | 12/20/26 | | | | 1.000%(Q) | | | | 100 | | | | 0.830% | | | | 970 | | | | | | | | (5,760 | ) | | | | | | | | | | | 6,730 | | | | | | | Barclays Bank PLC |
Simon Property Group LP | | | 06/20/26 | | | | 1.000%(Q) | | | | 80 | | | | 0.578% | | | | 1,629 | | | | | | | | 862 | | | | | | | | | | | | 767 | | | | | | | Goldman Sachs International |
State of Illinois | | | 12/20/22 | | | | 1.000%(Q) | | | | 100 | | | | 0.403% | | | | 802 | | | | | | | | (901 | ) | | | | | | | | | | | 1,703 | | | | | | | Citibank, N.A. |
State of Illinois | | | 12/20/24 | | | | 1.000%(Q) | | | | 100 | | | | 0.700% | | | | 1,035 | | | | | | | | (3,115 | ) | | | | | | | | | | | 4,150 | | | | | | | Goldman Sachs International |
Teck Resources Ltd. | | | 06/20/26 | | | | 5.000%(Q) | | | | 100 | | | | 1.084% | | | | 18,162 | | | | | | | | 17,410 | | | | | | | | | | | | 752 | | | | | | | Barclays Bank PLC |
Teva Pharmaceutical Industries Ltd. | | | 12/20/21 | | | | 1.000%(Q) | | | | 10 | | | | 1.111% | | | | 10 | | | | | | | | 3 | | | | | | | | | | | | 7 | | | | | | | Barclays Bank PLC |
T-Mobile USA, Inc. | | | 12/20/21 | | | | 5.000%(Q) | | | | 30 | | | | 0.488% | | | | 370 | | | | | | | | 192 | | | | | | | | | | | | 178 | | | | | | | Barclays Bank PLC |
| | | | | | | | | | | | | | | | | | | | | | | | | | | | | | | | | | | | | | | | | | | | | | |
| | | | | | | | | | | | |
| | | | | | | | | | | | | | | | | | $ | 65,334 | | | | | | | $ | (5,697 | ) | | | | | | | | | | $ | 71,031 | | | | | | | |
| | | | | | | | | | | | | | | | | | | | | | | | | | | | | | | | | | | | | | | | | | | | | | |
| | | | | | | | | | | | | | | | | | | | | | | | | | | | | | | | | | | | | | | | | | |
Reference Entity/ Obligation | | Termination Date | | Fixed Rate | | Notional Amount (000)#(3) | | Implied Credit Spread at October 31, 2021(4) | | Value at Trade Date | | | Value at October 31, 2021 | | | Unrealized Appreciation (Depreciation) | |
|
| Centrally Cleared Credit Default Swap Agreement on credit indices - Sell Protection(2): | |
iTraxx.X0.36.V1 | | 12/20/26 | | 5.000%(Q) | | EUR 400 | | 2.616% | | | | $ | 52,825 | | | | | | | | | | | $ | 54,476 | | | | | | | | | | | $ | 1,651 | | | | | |
| | | | | | | | | | | | | | | | | | | | | | | | | | | | | | | | | | | | | | | | | | |
See Notes to Financial Statements.
PGIM International Bond Fund 37
Schedule of Investments (continued)
as of October 31, 2021
Credit default swap agreements outstanding at October 31, 2021 (continued):
| | | | | | | | | | | | | | | | | | | | | | | | | | | | | | | | | | | | | | | | | | | | | | | | |
Reference Entity/ Obligation | | Termination
Date | | Fixed
Rate | | Notional Amount (000)#(3) | | Implied Credit Spread at October 31, 2021(4) | | Fair Value | | | Upfront Premiums Paid (Received) | | | Unrealized
Appreciation
(Depreciation) | | | Counterparty | |
| | | | | | | | | | | | | | | | | | | | | |
| | |
OTC Credit Default Swap Agreement on credit indices - Sell Protection(2): | | | | | | | | | |
CDX.NA.HY.BB.36.V1 | | 06/20/26 | | 5.000%(Q) | | 100 | | 1.775% | | | | | | $ | 14,648 | | | | | | | | | | | $ | 14,270 | | | | | | | | | | | $ | 378 | | | | | | | | Citibank, N.A. | |
| | | | | | | | | | | | | | | | | | | | | | | | | | | | | | | | | | | | | | | | | | | | | | | | |
The Fund entered into credit default swaps (“CDS”) to provide a measure of protection against defaults or to take an active long or short position with respect to the likelihood of a particular issuer’s default or the reference entity’s credit soundness. CDS contracts generally trade based on a spread which represents the cost a protection buyer has to pay the protection seller. The protection buyer is said to be short the credit as the value of the contract rises the more the credit deteriorates. The value of the CDS contract increases for the protection buyer if the spread increases.
| (1) | If the Fund is a buyer of protection, it pays the fixed rate. When a credit event occurs, as defined under the terms of that particular swap agreement, the Fund will either (i) receive from the seller of protection an amount equal to the notional amount of the swap and make delivery of the referenced obligation or underlying securities comprising the referenced index or (ii) receive a net settlement amount in the form of cash or securities equal to the notional amount of the swap less the recovery value of the referenced obligation or underlying securities comprising the referenced index. |
| (2) | If the Fund is a seller of protection, it receives the fixed rate. When a credit event occurs, as defined under the terms of that particular swap agreement, the Fund will either (i) pay to the buyer of protection an amount equal to the notional amount of the swap and take delivery of the referenced obligation or underlying securities comprising the referenced index or (ii) pay a net settlement amount in the form of cash or securities equal to the notional amount of the swap less the recovery value of the referenced obligation or underlying securities comprising the referenced index. |
| (3) | Notional amount represents the maximum potential amount the Fund could be required to pay as a seller of credit protection or receive as a buyer of credit protection if a credit event occurs as defined under the terms of that particular swap agreement. |
| (4) | Implied credit spreads, represented in absolute terms, utilized in determining the fair value of credit default swap agreements where the Fund is the seller of protection as of the reporting date serve as an indicator of the current status of the payment/ performance risk and represent the likelihood of risk of default for the credit derivative. The implied credit spread of a particular referenced entity reflects the cost of buying/selling protection and may include up-front payments required to be made to enter into the agreement. Wider credit spreads represent a deterioration of the referenced entity’s credit soundness and a greater likelihood of risk of default or other credit event occurring as defined under the terms of the agreement. |
| * | When an implied credit spread is not available, reference the fair value of credit default swap agreements on credit indices and asset-backed securities. Where the Fund is the seller of protection, it serves as an indicator of the current status of the payment/performance risk and represents the likelihood of an expected liability (or profit) for the credit |
See Notes to Financial Statements.
38
| | derivative should the notional amount of the swap agreement be closed/sold as of the reporting date. Increasing fair value in absolute terms, when compared to the notional amount of the swap, represents a deterioration of the referenced entity’s credit soundness and a greater likelihood of risk of default or other credit event occurring as defined under the terms of the agreement. |
Currency swap agreement outstanding at October 31, 2021:
| | | | | | | | | | | | | | | | | | | | | | | | | | | | | | | | | | | | | | | | | | | | | | | | | | |
Notional Amount (000)# | | Fund
Receives | | Notional
Amount
(000)# | | Fund
Pays | | Counterparty | | | Termination
Date | | | Fair Value | | | Upfront
Premiums
Paid
(Received) | | | Unrealized
Appreciation
(Depreciation) | |
| | | | | | | | | | | | | | | | | | | | | | |
| | | | | | | | | | | | | | | | | | | | | | |
| | | | | | | | | | | |
OTC Currency Swap Agreement: | | | | | | | | | | | | | | | | | | | | | | | | | | | | | | | | | | | | | | | | | | | | |
| IDR 2,000,000 | | 8.22%(S) | | 138 | | 6 Month
LIBOR(S) | | | Citibank, N.A. | | | | 11/29/23 | | | | | | | $ | 17,925 | | | | | | | | | | | $ | — | | | | | | | | | | | $ | 17,925 | | | | | |
| | | | | | | | | | | | | | | | | | | | | | | | | | | | | | | | | | | | | | | | | | | | | | | | | | |
Inflation swap agreements outstanding at October 31, 2021:
| | | | | | | | | | | | | | | | | | | | | | | | | | | | | | | | | | | | | | | | | | | | | | | | |
Notional Amount (000)# | | | Termination
Date | | | Fixed
Rate | | | | Floating Rate | | Value at Trade Date | | | Value at October 31, 2021 | | | Unrealized Appreciation (Depreciation) | |
| | | | | | | | | | | | | | | | | | | | |
|
Centrally Cleared Inflation Swap Agreements: | |
EUR | | | 200 | | | | 05/15/23 | | | 1.485%(T) | | | | France CPI ex Tobacco Household(1)(T) | | | | $ | — | | | | | | | | | | | $ | (2,994 | ) | | | | | | | | | | $ | (2,994 | ) | | | | |
EUR | | | 200 | | | | 05/15/23 | | | 1.510%(T) | | | | Eurostat Eurozone HICP ex Tobacco(2)(T) | | | | | — | | | | | | | | | | | | (2,219 | ) | | | | | | | | | | | (2,219 | ) | | | | |
| | | 100 | | | | 01/13/31 | | | 2.230%(T) | | | | U.S. CPI Urban Consumers NSA Index(2)(T) | | | | | — | | | | | | | | | | | | (9,017 | ) | | | | | | | | | | | (9,017 | ) | | | | |
| | | 110 | | | | 04/07/31 | | | 2.469%(T) | | | | U.S. CPI Urban Consumers NSA Index(2)(T) | | | | | — | | | | | | | | | | | | (6,731 | ) | | | | | | | | | | | (6,731 | ) | | | | |
| | | 40 | | | | 04/09/31 | | | 2.435%(T) | | | | U.S. CPI Urban Consumers NSA Index(2)(T) | | | | | — | | | | | | | | | | | | (2,591 | ) | | | | | | | | | | | (2,591 | ) | | | | |
| | | 80 | | | | 04/09/31 | | | 2.448%(T) | | | | U.S. CPI Urban Consumers NSA Index(2)(T) | | | | | — | | | | | | | | | | | | (5,071 | ) | | | | | | | | | | | (5,071 | ) | | | | |
| | | 70 | | | | 04/13/31 | | | 2.450%(T) | | | | U.S. CPI Urban Consumers NSA Index(2)(T) | | | | | — | | | | | | | | | | | | (4,404 | ) | | | | | | | | | | | (4,404 | ) | | | | |
| | | 70 | | | | 04/14/31 | | | 2.450%(T) | | | | U.S. CPI Urban Consumers NSA Index(2)(T) | | | | | — | | | | | | | | | | | | (4,394 | ) | | | | | | | | | | | (4,394 | ) | | | | |
| | | 160 | | | | 04/15/31 | | | 2.465%(T) | | | | U.S. CPI Urban Consumers NSA Index(2)(T) | | | | | — | | | | | | | | | | | | (9,769 | ) | | | | | | | | | | | (9,769 | ) | | | | |
| | | | | | | | | | | | | | | | | | | | | | | | | | | | | | | | | | | | | | | | | | | | | | | | |
| | | | | | | | | | | | | | |
| | | | | | | | | | | | | | | | | | $ | — | | | | | | | | | | | $ | (47,190 | ) | | | | | | | | | | $ | (47,190 | ) | | | | |
| | | | | | | | | | | | | | | | | | | | | | | | | | | | | | | | | | | | | | | | | | | | | | | | |
| (1) | The Fund pays the fixed rate and receives the floating rate. |
| (2) | The Fund pays the floating rate and receives the fixed rate. |
See Notes to Financial Statements.
PGIM International Bond Fund 39
Schedule of Investments (continued)
as of October 31, 2021
Interest rate swap agreements outstanding at October 31, 2021:
| | | | | | | | | | | | | | | | | | | | |
Notional Amount (000)# | | Termination Date | | Fixed Rate | | Floating
Rate | | Value at
Trade Date | | Value at
October 31,
2021 | | Unrealized Appreciation (Depreciation) |
| | | | | | | | | | | | | | | |
| | |
Centrally Cleared Interest Rate Swap Agreements: | | | | | | | | | |
AUD | | 560 | | 09/25/22 | | 2.958%(S) | | 6 Month BBSW(2)(S) | | | $ — | | | | $ 11,239 | | | | $ 11,239 | |
AUD | | 380 | | 11/27/28 | | 2.847%(S) | | 6 Month BBSW(2)(S) | | | (4 | ) | | | 20,690 | | | | 20,694 | |
AUD | | 350 | | 12/03/29 | | 2.700%(S) | | 6 Month BBSW(2)(S) | | | 27,515 | | | | 16,271 | | | | (11,244 | ) |
AUD | | 150 | | 05/09/32 | | 3.140%(S) | | 6 Month BBSW(2)(S) | | | (3 | ) | | | 12,170 | | | | 12,173 | |
AUD | | 165 | | 07/19/32 | | 3.130%(S) | | 6 Month BBSW(2)(S) | | | (4 | ) | | | 12,639 | | | | 12,643 | |
BRL | | 6,910 | | 01/02/24 | | 4.920%(T) | | 1 Day BROIS(2)(T) | | | — | | | | (147,662 | ) | | | (147,662 | ) |
BRL | | 287 | | 01/02/25 | | 6.540%(T) | | 1 Day BROIS(2)(T) | | | — | | | | (5,067 | ) | | | (5,067 | ) |
BRL | | 1,710 | | 01/02/25 | | 6.670%(T) | | 1 Day BROIS(2)(T) | | | — | | | | (28,186 | ) | | | (28,186 | ) |
BRL | | 657 | | 01/02/25 | | 9.475%(T) | | 1 Day BROIS(2)(T) | | | — | | | | 12,845 | | | | 12,845 | |
BRL | | 724 | | 01/02/25 | | 9.943%(T) | | 1 Day BROIS(2)(T) | | | — | | | | 20,951 | | | | 20,951 | |
BRL | | 305 | | 01/02/25 | | 11.080%(T) | | 1 Day BROIS(2)(T) | | | — | | | | 12,264 | | | | 12,264 | |
BRL | | 98 | | 01/02/25 | | 12.090%(T) | | 1 Day BROIS(2)(T) | | | — | | | | 5,120 | | | | 5,120 | |
BRL | | 1,008 | | 01/04/27 | | 6.490%(T) | | 1 Day BROIS(2)(T) | | | — | | | | (35,350 | ) | | | (35,350 | ) |
BRL | | 1,027 | | 01/04/27 | | 6.493%(T) | | 1 Day BROIS(2)(T) | | | — | | | | (35,762 | ) | | | (35,762 | ) |
BRL | | 991 | | 01/04/27 | | 6.820%(T) | | 1 Day BROIS(2)(T) | | | — | | | | (34,345 | ) | | | (34,345 | ) |
BRL | | 1,091 | | 01/02/29 | | 7.250%(T) | | 1 Day BROIS(2)(T) | | | — | | | | (44,901 | ) | | | (44,901 | ) |
CAD | | 620 | | 04/05/22 | | 1.445%(S) | | 3 Month CDOR(2)(S) | | | (2,515 | ) | | | 2,253 | | | | 4,768 | |
CAD | | 500 | | 09/03/25 | | 0.733%(S) | | 3 Month CDOR(2)(S) | | | (2 | ) | | | (17,239 | ) | | | (17,237 | ) |
CAD | | 200 | | 12/03/28 | | 2.600%(S) | | 3 Month CDOR(2)(S) | | | 1,408 | | | | 7,417 | | | | 6,009 | |
CAD | | 320 | | 05/30/37 | | 2.240%(S) | | 3 Month CDOR(2)(S) | | | (13,839 | ) | | | (1,749 | ) | | | 12,090 | |
CAD | | 50 | | 01/09/38 | | 2.720%(S) | | 3 Month CDOR(2)(S) | | | (1 | ) | | | 2,320 | | | | 2,321 | |
CAD | | 160 | | 12/03/40 | | 2.800%(S) | | 3 Month CDOR(1)(S) | | | (26,736 | ) | | | (9,419 | ) | | | 17,317 | |
CAD | | 150 | | 05/30/47 | | 2.240%(S) | | 3 Month CDOR(2)(S) | | | (7,322 | ) | | | (2,722 | ) | | | 4,600 | |
CHF | | 140 | | 01/31/29 | | 0.260%(A) | | 6 Month CHF LIBOR(2)(S) | | | — | | | | 2,019 | | | | 2,019 | |
CHF | | 80 | | 04/03/33 | | 0.687%(A) | | 6 Month CHF LIBOR(2)(S) | | | 2,738 | | | | 4,154 | | | | 1,416 | |
CLP | | 47,300 | | 07/12/29 | | 3.135%(S) | | 1 Day CLOIS(2)(S) | | | — | | | | (8,537 | ) | | | (8,537 | ) |
CLP | | 91,000 | | 11/22/29 | | 3.203%(S) | | 1 Day CLOIS(2)(S) | | | — | | | | (17,291 | ) | | | (17,291 | ) |
CLP | | 100,000 | | 02/10/30 | | 3.010%(S) | | 1 Day CLOIS(2)(S) | | | — | | | | (21,087 | ) | | | (21,087 | ) |
CLP | | 164,000 | | 11/17/30 | | 2.420%(S) | | 1 Day CLOIS(2)(S) | | | — | | | | (44,745 | ) | | | (44,745 | ) |
CNH | | 800 | | 08/15/23 | | 3.115%(Q) | | 7 Day China Fixing Repo Rates(2)(Q) | | | (4 | ) | | | 1,774 | | | | 1,778 | |
CNH | | 800 | | 03/13/24 | | 2.945%(Q) | | 7 Day China Fixing Repo Rates(2)(Q) | | | (1 | ) | | | 1,518 | | | | 1,519 | |
CNH | | 1,400 | | 04/01/24 | | 2.923%(Q) | | 7 Day China Fixing Repo Rates(2)(Q) | | | — | | | | 2,522 | | | | 2,522 | |
CNH | | 2,440 | | 06/20/24 | | 2.900%(Q) | | 7 Day China Fixing Repo Rates(2)(Q) | | | 2 | | | | 4,287 | | | | 4,285 | |
CNH | | 2,300 | | 09/03/24 | | 2.860%(Q) | | 7 Day China Fixing Repo Rates(2)(Q) | | | (3 | ) | | | 3,956 | | | | 3,959 | |
CNH | | 2,600 | | 10/10/24 | | 2.860%(Q) | | 7 Day China Fixing Repo Rates(2)(Q) | | | (1 | ) | | | 4,202 | | | | 4,203 | |
See Notes to Financial Statements.
40
Interest rate swap agreements outstanding at October 31, 2021 (continued):
| | | | | | | | | | | | | | | | | | | | |
Notional Amount
(000)# | | Termination Date | | Fixed Rate | | Floating Rate | | Value at Trade Date | | Value at October 31, 2021 | | Unrealized Appreciation (Depreciation) |
| | | | | | | | | | | | | | | |
| | |
Centrally Cleared Interest Rate Swap Agreements (cont’d.): | | | | | | | | | |
CNH | | 1,780 | | 11/01/24 | | 3.120%(Q) | | 7 Day China Fixing Repo Rates(2)(Q) | | | $ (6) | | | | $ 5,486 | | | | $ 5,492 | |
CNH | | 2,500 | | 02/04/25 | | 2.600%(Q) | | 7 Day China Fixing Repo Rates(2)(Q) | | | — | | | | 1,238 | | | | 1,238 | |
CNH | | 3,900 | | 03/06/25 | | 2.425%(Q) | | 7 Day China Fixing Repo Rates(2)(Q) | | | (9) | | | | (2,022) | | | | (2,013) | |
CNH | | 6,000 | | 03/12/25 | | 2.400%(Q) | | 7 Day China Fixing Repo Rates(2)(Q) | | | (2) | | | | (4,147 | ) | | | (4,145) | |
CNH | | 2,880 | | 06/01/25 | | 1.973%(Q) | | 7 Day China Fixing Repo Rates(2)(Q) | | | 2 | | | | (9,118) | | | | (9,120) | |
CNH | | 5,039 | | 08/06/25 | | 2.555%(Q) | | 7 Day China Fixing Repo Rates(2)(Q) | | | (7) | | | | 15 | | | | 22 | |
CNH | | 11,480 | | 11/02/25 | | 2.588%(Q) | | 7 Day China Fixing Repo Rates(2)(Q) | | | 26 | | | | 1,657 | | | | 1,631 | |
CNH | | 1,270 | | 04/12/26 | | 2.810%(Q) | | 7 Day China Fixing Repo Rates(2)(Q) | | | (5) | | | | 1,691 | | | | 1,696 | |
COP | | 690,000 | | 04/20/26 | | 4.190%(Q) | | 1 Day COOIS(2)(Q) | | | — | | | | (13,227 | ) | | | (13,227) | |
COP | | 907,840 | | 07/27/28 | | 6.200%(Q) | | 1 Day COOIS(2)(Q) | | | 8,048 | | | | (1,321 | ) | | | (9,369) | |
CZK | | 3,300 | | 06/29/27 | | 1.175%(A) | | 6 Month PRIBOR(2)(S) | | | (5,546) | | | | (14,562 | ) | | | (9,016) | |
EUR | | 620 | | 05/11/22 | | (0.250)%(A) | | 1 Day ESTR(2)(A) | | | (953) | | | | 2,295 | | | | 3,248 | |
EUR | | 225 | | 04/27/30 | | (0.016)%(A) | | 6 Month EURIBOR(2)(S) | | | — | | | | (5,093 | ) | | | (5,093) | |
EUR | | 171 | | 08/15/30 | | (0.191)%(A) | | 1 Day ESTR(2)(A) | | | (81) | | | | (3,740 | ) | | | (3,659) | |
EUR | | 130 | | 05/11/31 | | 0.750%(A) | | 1 Day ESTR(1)(A) | | | 888 | | | | (11,037 | ) | | | (11,925) | |
EUR | | 1,335 | | 06/28/32 | | 0.785%(A) | | 6 Month EURIBOR(2)(S) | | | (72,175) | | | | 86,542 | | | | 158,717 | |
EUR | | 60 | | 05/11/49 | | 1.450%(A) | | 6 Month EURIBOR(2)(S) | | | 1,589 | | | | 21,597 | | | | 20,008 | |
GBP | | 50 | | 05/08/29 | | 1.100%(A) | | 1 Day SONIA(2)(A) | | | 2,237 | | | | 645 | | | | (1,592) | |
GBP | | 190 | | 05/08/31 | | 1.150%(A) | | 1 Day SONIA(2)(A) | | | 9,557 | | | | 5,458 | | | | (4,099) | |
GBP | | 100 | | 09/30/40 | | 0.262%(A) | | 1 Day SONIA(2)(A) | | | (4,066) | | | | (15,099 | ) | | | (11,033) | |
GBP | | 525 | | 05/08/46 | | 1.250%(A) | | 1 Day SONIA(2)(A) | | | 125,600 | | | | 68,015 | | | | (57,585) | |
GBP | | 80 | | 09/03/50 | | 0.328%(A) | | 1 Day SONIA(2)(A) | | | (1) | | | | (13,018 | ) | | | (13,017) | |
HUF | | 95,000 | | 01/12/27 | | 4.150%(A) | | 6 Month BUBOR(2)(S) | | | — | | | | 5,534 | | | | 5,534 | |
HUF | | 99,345 | | 06/12/28 | | 3.750%(A) | | 6 Month BUBOR(2)(S) | | | — | | | | (2,153 | ) | | | (2,153) | |
HUF | | 26,000 | | 07/15/29 | | 1.650%(A) | | 6 Month BUBOR(2)(S) | | | — | | | | (11,564 | ) | | | (11,564) | |
HUF | | 57,000 | | 09/03/30 | | 1.705%(A) | | 6 Month BUBOR(2)(S) | | | — | | | | (28,636 | ) | | | (28,636) | |
See Notes to Financial Statements.
PGIM International Bond Fund 41
Schedule of Investments (continued)
as of October 31, 2021
Interest rate swap agreements outstanding at October 31, 2021 (continued):
| | | | | | | | | | | | | | | | | | | | |
Notional Amount
(000)# | | Termination Date | | Fixed Rate | | Floating Rate | | Value at Trade Date | | Value at October 31, 2021 | | Unrealized Appreciation (Depreciation) |
| | | | | | | | | | | | | | | |
| | | | | | | | | | | | | | | |
| | |
Centrally Cleared Interest Rate Swap Agreements (cont’d.): | | | | | | | | | |
JPY | | 301,250 | | 12/20/24 | | 0.126%(S) | | 6 Month JPY LIBOR(2)(S) | | | $ (3,419) | | | | $ 9,465 | | | | $ 12,884 | |
JPY | | 46,500 | | 07/04/28 | | 0.282%(S) | | 6 Month JPY LIBOR(2)(S) | | | 2,907 | | | | 6,101 | | | | 3,194 | |
JPY | | 100,000 | | 11/12/28 | | 0.011%(S) | | 6 Month JPY LIBOR(2)(S) | | | — | | | | (4,116) | | | | (4,116) | |
JPY | | 57,765 | | 12/03/28 | | 0.200%(S) | | 6 Month JPY LIBOR(2)(S) | | | 3,819 | | | | 4,757 | | | | 938 | |
JPY | | 70,000 | | 12/22/36 | | 0.641%(S) | | 6 Month JPY LIBOR(2)(S) | | | — | | | | 36,276 | | | | 36,276 | |
JPY | | 95,000 | | 07/26/37 | | 0.676%(S) | | 6 Month JPY LIBOR(2)(S) | | | — | | | | 53,751 | | | | 53,751 | |
JPY | | 35,000 | | 02/06/40 | | 0.223%(S) | | 6 Month JPY LIBOR(2)(S) | | | — | | | | (6,338) | | | | (6,338) | |
JPY | | 45,000 | | 12/22/41 | | 0.731%(S) | | 6 Month JPY LIBOR(2)(S) | | | — | | | | 28,504 | | | | 28,504 | |
JPY | | 90,000 | | 11/24/47 | | 0.888%(S) | | 6 Month JPY LIBOR(2)(S) | | | 51,581 | | | | 85,317 | | | | 33,736 | |
KRW | | 75,700 | | 04/17/29 | | 1.740%(Q) | | 3 Month KWCDC(2)(Q) | | | — | | | | (2,114) | | | | (2,114) | |
KRW | | 184,000 | | 04/27/30 | | 1.065%(Q) | | 3 Month KWCDC(2)(Q) | | | — | | | | (14,311) | | | | (14,311) | |
MXN | | 6,545 | | 03/19/26 | | 6.050%(M) | | 28 Day Mexican Interbank Rate(2)(M) | | | (13) | | | | (17,527) | | | | (17,514) | |
MXN | | 2,080 | | 06/11/27 | | 7.210%(M) | | 28 Day Mexican Interbank Rate(2)(M) | | | 162 | | | | (1,496) | | | | (1,658) | |
MXN | | 4,020 | | 02/27/29 | | 8.260%(M) | | 28 Day Mexican Interbank Rate(2)(M) | | | 733 | | | | 7,810 | | | | 7,077 | |
NOK | | 1,500 | | 12/11/28 | | 2.177%(A) | | 6 Month NIBOR(2)(S) | | | — | | | | 6,263 | | | | 6,263 | |
NOK | | 500 | | 02/07/29 | | 2.083%(A) | | 6 Month NIBOR(2)(S) | | | 668 | | | | 1,508 | | | | 840 | |
NOK | | 3,360 | | 01/19/31 | | 1.346%(A) | | 6 Month NIBOR(2)(S) | | | — | | | | (16,311) | | | | (16,311) | |
NZD | | 470 | | 01/10/27 | | 3.420%(S) | | 3 Month BBR(2)(Q) | | | — | | | | 16,472 | | | | 16,472 | |
NZD | | 70 | | 11/28/28 | | 2.950%(S) | | 3 Month BBR(2)(Q) | | | 1,390 | | | | 1,486 | | | | 96 | |
NZD | | 90 | | 07/22/29 | | 1.768%(S) | | 3 Month BBR(2)(Q) | | | — | | | | (3,882) | | | | (3,882) | |
NZD | | 80 | | 11/05/29 | | 1.393%(S) | | 3 Month BBR(2)(Q) | | | — | | | | (5,127) | | | | (5,127) | |
NZD | | 220 | | 03/01/31 | | 2.098%(S) | | 3 Month BBR(2)(Q) | | | 2,339 | | | | (7,797) | | | | (10,136) | |
See Notes to Financial Statements.
42
Interest rate swap agreements outstanding at October 31, 2021 (continued):
| | | | | | | | | | | | | | | | | | | | | | | | | | | | | | | | | | | | | | | | | | | | |
Notional Amount
(000)# | | | Termination Date | | Fixed Rate | | Floating Rate | | Value at Trade Date | | | Value at October 31, 2021 | | | Unrealized Appreciation (Depreciation) | |
| | | | | | | | | | | | | | | | | | | | | | | | | | | | | | | | | | | | |
| | | | | |
Centrally Cleared Interest Rate Swap Agreements (cont’d.): | | | | | | | | | | | | | | | | | | | | | |
PLN | | | 1,120 | | | 08/24/23 | | 2.390%(A) | | 6 Month WIBOR(2)(S) | | | | $ | — | | | | | | | | | | | $ | 1,917 | | | | | | | | | | | $ | 1,917 | | | | | |
PLN | | | 935 | | | 11/13/23 | | 2.570%(A) | | 6 Month WIBOR(2)(S) | | | | | — | | | | | | | | | | | | 6,391 | | | | | | | | | | | | 6,391 | | | | | |
PLN | | | 500 | | | 04/11/24 | | 2.020%(A) | | 6 Month WIBOR(2)(S) | | | | | — | | | | | | | | | | | | 49 | | | | | | | | | | | | 49 | | | | | |
PLN | | | 1,300 | | | 06/21/24 | | 1.750%(A) | | 6 Month WIBOR(2)(S) | | | | | — | | | | | | | | | | | | (4,292 | ) | | | | | | | | | | | (4,292 | ) | | | | |
PLN | | | 1,000 | | | 01/10/27 | | 3.030%(A) | | 6 Month WIBOR(2)(S) | | | | | — | | | | | | | | | | | | 10,379 | | | | | | | | | | | | 10,379 | | | | | |
PLN | | | 515 | | | 04/27/31 | | 1.788%(A) | | 6 Month WIBOR(2)(S) | | | | | — | | | | | | | | | | | | (9,349 | ) | | | | | | | | | | | (9,349 | ) | | | | |
SEK | | | 2,500 | | | 12/30/26 | | 1.106%(A) | | 3 Month STIBOR(2)(Q) | | | | | — | | | | | | | | | | | | 7,316 | | | | | | | | | | | | 7,316 | | | | | |
SEK | | | 300 | | | 07/11/28 | | 1.141%(A) | | 3 Month STIBOR(2)(Q) | | | | | 378 | | | | | | | | | | | | 695 | | | | | | | | | | | | 317 | | | | | |
SEK | | | 990 | | | 11/28/28 | | 1.188%(A) | | 3 Month STIBOR(2)(Q) | | | | | — | | | | | | | | | | | | 3,463 | | | | | | | | | | | | 3,463 | | | | | |
SEK | | | 1,000 | | | 06/20/29 | | 0.550%(A) | | 3 Month STIBOR(2)(Q) | | | | | — | | | | | | | | | | | | (3,166 | ) | | | | | | | | | | | (3,166 | ) | | | | |
SEK | | | 1,500 | | | 01/24/30 | | 0.605%(A) | | 3 Month STIBOR(2)(Q) | | | | | — | | | | | | | | | | | | (4,258 | ) | | | | | | | | | | | (4,258 | ) | | | | |
SGD | | | 250 | | | 07/29/31 | | 1.120%(S) | | 1 Day SORA(2)(S) | | | | | — | | | | | | | | | | | | (12,161 | ) | | | | | | | | | | | (12,161 | ) | | | | |
THB | | | 4,200 | | | 07/03/30 | | 1.028%(S) | | 6 Month THBFIX(2)(S) | | | | | — | | | | | | | | | | | | (6,795 | ) | | | | | | | | | | | (6,795 | ) | | | | |
| | | 1,155 | | | 03/10/22 | | 0.330%(A) | | 1 Day USOIS(1)(A) | | | | | — | | | | | | | | | | | | (2,949 | ) | | | | | | | | | | | (2,949 | ) | | | | |
| | | 1,160 | | | 05/29/22 | | 0.014%(A) | | 1 Day USOIS(1)(A) | | | | | — | | | | | | | | | | | | 975 | | | | | | | | | | | | 975 | | | | | |
| | | 680 | | | 11/09/22 | | 0.050%(A) | | 1 Day USOIS(1)(A) | | | | | — | | | | | | | | | | | | 1,301 | | | | | | | | | | | | 1,301 | | | | | |
| | | 4,000 | | | 11/09/22 | | 0.061%(A) | | 1 Day SOFR(1)(A) | | | | | — | | | | | | | | | | | | 4,162 | | | | | | | | | | | | 4,162 | | | | | |
| | | 2,220 | | | 10/30/23 | | 0.072%(A) | | 1 Day USOIS(1)(A) | | | | | — | | | | | | | | | | | | 20,752 | | | | | | | | | | | | 20,752 | | | | | |
| | | 3,165 | | | 11/02/23 | | 0.070%(A) | | 1 Day USOIS(1)(A) | | | | | — | | | | | | | | | | | | 30,105 | | | | | | | | | | | | 30,105 | | | | | |
| | | 2,754 | | | 11/06/23 | | 0.063%(A) | | 1 Day USOIS(1)(A) | | | | | — | | | | | | | | | | | | 27,063 | | | | | | | | | | | | 27,063 | | | | | |
| | | 1,950 | | | 11/09/23 | | 0.064%(A) | | 1 Day USOIS(1)(A) | | | | | — | | | | | | | | | | | | 19,276 | | | | | | | | | | | | 19,276 | | | | | |
| | | 247 | | | 08/15/28 | | 1.220%(A) | | 1 Day SOFR(1)(A) | | | | | — | | | | | | | | | | | | (740 | ) | | | | | | | | | | | (740 | ) | | | | |
ZAR | | | 3,500 | | | 07/16/28 | | 8.170%(Q) | | 3 Month JIBAR(2)(Q) | | | | | 6 | | | | | | | | | | | | 11,183 | | | | | | | | | | | | 11,177 | | | | | |
ZAR | | | 11,910 | | | 09/15/30 | | 6.940%(Q) | | 3 Month JIBAR(2)(Q) | | | | | (125 | ) | | | | | | | | | | | (36,008 | ) | | | | | | | | | | | (35,883 | ) | | | | |
ZAR | | | 830 | | | 10/07/31 | | 7.670%(Q) | | 3 Month JIBAR(2)(Q) | | | | | (6) | | | | | | | | | | | | (675 | ) | | | | | | | | | | | (669) | | | | | |
| | | | | | | | | | | | | | | | | | | | | | | | | | | | | | | | | | | | | | | | | | | | |
| | | | | | | | | | | | | |
| | | | | | | | | | | | | | $ | 106,744 | | | | | | | | | | | $ | 15,310 | | | | | | | | | | | $ | (91,434 | ) | | | | |
| | | | | | | | | | | | | | | | | | | | | | | | | | | | | | | | | | | | | | | | | | | | |
See Notes to Financial Statements.
PGIM International Bond Fund 43
Schedule of Investments (continued)
as of October 31, 2021
Interest rate swap agreements outstanding at October 31, 2021 (continued):
| | | | | | | | | | | | | | | | | | | | | | | | |
Notional Amount (000)# | | | Termination
Date | | | Fixed Rate | | Floating Rate | | Fair
Value | | | Upfront
Premiums
Paid(Received) | | Unrealized
Appreciation
(Depreciation) | | Counterparty |
| | | | | | | | | | | | | | | | | | | | |
|
OTC Interest Rate Swap Agreements: |
CLP | | | 85,000 | | | | 11/15/27 | | | 4.130%(S) | | 1 Day CLOIS(2)(S) | | $ | (5,703 | ) | | $— | | | $ (5,703 | ) | | Morgan Stanley & Co. International PLC |
CLP | | | 55,000 | | | | 12/20/27 | | | 4.260%(S) | | 1 Day CLOIS(2)(S) | | | (3,759 | ) | | — | | | (3,759 | ) | | Morgan Stanley & Co. International PLC |
CLP | | | 19,100 | | | | 01/23/28 | | | 4.245%(S) | | 1 Day CLOIS(2)(S) | | | (1,329 | ) | | — | | | (1,329 | ) | | Morgan Stanley & Co. International PLC |
CLP | | | 33,000 | | | | 01/26/28 | | | 4.210%(S) | | 1 Day CLOIS(2)(S) | | | (2,425 | ) | | — | | | (2,425 | ) | | Morgan Stanley & Co. International PLC |
CLP | | | 23,000 | | | | 05/17/28 | | | 4.270%(S) | | 1 Day CLOIS(2)(S) | | | (1,475 | ) | | — | | | (1,475 | ) | | Citibank, N.A. |
CNH | | | 500 | | | | 04/02/26 | | | 3.120%(Q) | | 7 Day China Fixing Repo Rates(2)(Q) | | | 1,697 | | | (1) | | | 1,698 | | | Citibank, N.A. |
COP | | | 123,000 | | | | 01/23/28 | | | 6.035%(Q) | | 1 Day COOIS(2)(Q) | | | (337 | ) | | — | | | (337 | ) | | Morgan Stanley & Co. International PLC |
COP | | | 336,000 | | | | 01/26/28 | | | 6.000%(Q) | | 1 Day COOIS(2)(Q) | | | (1,080 | ) | | — | | | (1,080 | ) | | Morgan Stanley & Co. International PLC |
COP | | | 263,000 | | | | 02/01/28 | | | 6.020%(Q) | | 1 Day COOIS(2)(Q) | | | (100 | ) | | — | | | (100 | ) | | Morgan Stanley & Co. International PLC |
COP | | | 118,000 | | | | 07/12/29 | | | 5.165%(Q) | | 1 Day COOIS(2)(Q) | | | (2,325 | ) | | — | | | (2,325 | ) | | Morgan Stanley & Co. International PLC |
ILS | | | 200 | | | | 09/07/27 | | | 0.488%(A) | | 3 Month TELBOR(2)(Q) | | | (2,332 | ) | | — | | | (2,332 | ) | | Morgan Stanley & Co. International PLC |
ILS | | | 390 | | | | 07/16/28 | | | 2.045%(A) | | 3 Month TELBOR(2)(Q) | | | 7,248 | | | — | | | 7,248 | | | JPMorgan Chase Bank, N.A. |
ILS | | | 115 | | | | 02/07/29 | | | 1.965%(A) | | 3 Month TELBOR(2)(Q) | | | 2,264 | | | — | | | 2,264 | | | JPMorgan Chase Bank, N.A. |
ILS | | | 450 | | | | 04/24/30 | | | 0.710%(A) | | 3 Month TELBOR(2)(Q) | | | (6,912 | ) | | (4) | | | (6,908 | ) | | Goldman Sachs International |
ILS | | | 800 | | | | 05/07/30 | | | 0.810%(A) | | 3 Month TELBOR(2)(Q) | | | (10,343 | ) | | — | | | (10,343 | ) | | Goldman Sachs International |
KRW | | | 850,000 | | | | 01/06/27 | | | 1.800%(Q) | | 3 Month KWCDC(2)(Q) | | | (14,380 | ) | | (10) | | | (14,370 | ) | | Citibank, N.A. |
MYR | | | 1,000 | | | | 11/27/23 | | | 3.900%(Q) | | 3 Month KLIBOR(2)(Q) | | | 7,096 | | | (2) | | | 7,098 | | | Citibank, N.A. |
See Notes to Financial Statements.
44
Interest rate swap agreements outstanding at October 31, 2021 (continued):
| | | | | | | | | | | | | | | | | | | | | | | | | | | | | | | | | | | | | | | | | | | | | | |
Notional Amount (000)# | | | Termination
Date | | | Fixed
Rate | | | Floating Rate | | Fair
Value | | | Upfront Premiums
Paid(Received) | | | Unrealized Appreciation (Depreciation) | | | Counterparty | |
| | | | | | | | | | | | | | | | | | | | | | |
|
OTC Interest Rate Swap Agreements (cont’d.): | |
| MYR | | | 200 | | | | 11/19/29 | | | | 3.245%(Q) | | | 3 Month KLIBOR(2)(Q) | | $ | (194 | ) | | | | | | $ | — | | | | | | | | | | | $ | (194 | ) | | | | | |
| Morgan Stanley &
Co. International PLC |
|
MYR | | | 200 | | | | 02/04/30 | | | | 3.060%(Q) | | | 3 Month KLIBOR(2)(Q) | | | (937 | ) | | | | | | | — | | | | | | | | | | | | (937 | ) | | | | | |
| Morgan Stanley &
Co. International PLC |
|
RUB | | | 19,000 | | | | 01/12/26 | | | | 6.360%(A) | | | 3 Month MosPRIME(2)(Q) | | | (14,713 | ) | | | | | | | — | | | | | | | | | | | | (14,713 | ) | | | | | |
| Morgan Stanley &
Co. International PLC |
|
RUB | | | 20,000 | | | | 02/27/26 | | | | 6.680%(A) | | | 3 Month MosPRIME(2)(Q) | | | (12,765 | ) | | | | | | | — | | | | | | | | | | | | (12,765 | ) | | | | | |
| Morgan Stanley &
Co. International PLC |
|
THB | | | 5,000 | | | | 05/07/25 | | | | 0.795%(S) | | | 6 Month THBFIX(2)(S) | | | (1,593 | ) | | | | | | | 1 | | | | | | | | | | | | (1,594 | ) | | | | | | | HSBC Bank PLC | |
THB | | | 3,500 | | | | 02/14/29 | | | | 2.180%(S) | | | 6 Month THBFIX(2)(S) | | | 4,557 | | | | | | | | — | | | | | | | | | | | | 4,557 | | | | | | | | Citibank, N.A. | |
ZAR | | | 3,300 | | | | 09/22/42 | | | | 8.020%(Q) | | | 3 Month JIBAR(2)(Q) | | | (12,265 | ) | | | | | | | (24 | ) | | | | | | | | | | | (12,241 | ) | | | | | | | Citibank, N.A. | |
ZAR | | | 3,100 | | | | 09/22/47 | | | | 7.890%(Q) | | | 3 Month JIBAR(1)(Q) | | | 16,758 | | | | | | | | 20 | | | | | | | | | | | | 16,738 | | | | | | | | Citibank, N.A. | |
| | | | | | | | | | | | | | | | | | | | | | | | | | | | | | | | | | | | | | | | | | | | | | |
| | | | | | | | | | | | |
| | | | | | | | | | | | | | | | $ | (55,347 | ) | | | | | | $ | (20 | ) | | | | | | | | | | $ | (55,327 | ) | | | | | | | | |
| | | | | | | | | | | | | | | | | | | | | | | | | | | | | | | | | | | | | | | | | | | | | | |
| (1) | The Fund pays the fixed rate and receives the floating rate. |
| (2) | The Fund pays the floating rate and receives the fixed rate. |
Balances Reported in the Statement of Assets and Liabilities for OTC Swap Agreements:
| | | | | | | | |
| | | Premiums Paid | | Premiums Received | | Unrealized Appreciation | | Unrealized Depreciation |
| | | | |
OTC Swap Agreements | | $46,903 | | $(34,129) | | $129,914 | | $(102,861) |
Summary of Collateral for Centrally Cleared/Exchange-traded Derivatives:
Cash and securities segregated as collateral, including pending settlement for closed positions, to cover requirements for centrally cleared/exchange-traded derivatives are listed by broker as follows:
| | | | | | | | | | |
Broker | | Cash and/or Foreign Currency | | Securities Market Value |
| | |
Citigroup Global Markets, Inc. | | | $ | — | | | | $ | 1,046,553 | |
J.P. Morgan Securities LLC | | | | 870,000 | | | | | — | |
| | | | | | | | | | |
| | |
Total | | | $ | 870,000 | | | | $ | 1,046,553 | |
| | | | | | | | | | |
See Notes to Financial Statements.
PGIM International Bond Fund 45
Schedule of Investments (continued)
as of October 31, 2021
Fair Value Measurements:
Various inputs are used in determining the value of the Fund’s investments. These inputs are summarized in the three broad levels listed below.
Level 1—unadjusted quoted prices generally in active markets for identical securities.
Level 2—quoted prices for similar securities, interest rates and yield curves, prepayment speeds, foreign currency exchange rates and other observable inputs.
Level 3—unobservable inputs for securities valued in accordance with Board approved fair valuation procedures.
The following is a summary of the inputs used as of October 31, 2021 in valuing such portfolio securities:
| | | | | | | | | | | | |
| | | Level 1 | | | Level 2 | | | Level 3 |
Investments in Securities | | | | | | | | | | | | |
Assets | | | | | | | | | | | | |
Long-Term Investments | | | | | | | | | | | | |
Asset-Backed Securities | | | | | | | | | | | | |
Cayman Islands | | $ | — | | | $ | 1,244,709 | | | | $— | |
United States | | | — | | | | 435,453 | | | | — | |
Commercial Mortgage-Backed Securities | | | | | | | | | | | | |
Canada | | | — | | | | 18,881 | | | | — | |
Ireland | | | — | | | | 409,768 | | | | — | |
United Kingdom | | | — | | | | 274,395 | | | | — | |
United States | | | — | | | | 1,468,809 | | | | — | |
Corporate Bonds | | | | | | | | | | | | |
Australia | | | — | | | | 122,989 | | | | — | |
Belgium | | | — | | | | 76,525 | | | | — | |
Brazil | | | — | | | | 153,753 | | | | — | |
Bulgaria | | | — | | | | 114,870 | | | | — | |
China | | | — | | | | 94,139 | | | | — | |
France | | | — | | | | 791,366 | | | | — | |
Germany | | | — | | | | 1,066,884 | | | | — | |
Hong Kong | | | — | | | | 273,896 | | | | — | |
Hungary | | | — | | | | 120,414 | | | | — | |
Iceland | | | — | | | | 114,237 | | | | — | |
India | | | — | | | | 122,650 | | | | — | |
Indonesia | | | — | | | | 112,396 | | | | — | |
Italy | | | — | | | | 368,494 | | | | — | |
Kazakhstan | | | — | | | | 169,011 | | | | — | |
Luxembourg | | | — | | | | 466,586 | | | | — | |
Mexico | | | — | | | | 466,167 | | | | — | |
Netherlands | | | — | | | | 705,768 | | | | — | |
Peru | | | — | | | | 112,963 | | | | — | |
Poland | | | — | | | | 309,830 | | | | — | |
Russia | | | — | | | | 532,190 | | | | — | |
Spain | | | — | | | | 399,022 | | | | — | |
Supranational Bank | | | — | | | | 142,683 | | | | — | |
United Arab Emirates | | | — | | | | 357,100 | | | | — | |
United Kingdom | | | — | | | | 1,674,714 | | | | — | |
United States | | | — | | | | 1,941,996 | | | | — | |
Residential Mortgage-Backed Securities | | | | | | | | | | | | |
Bermuda | | | — | | | | 194,914 | | | | — | |
Ireland | | | — | | | | 101,889 | | | | — | |
United States | | | — | | | | 269,248 | | | | — | |
Sovereign Bonds | | | | | | | | | | | | |
Brazil | | | — | | | | 530,306 | | | | — | |
Bulgaria | | | — | | | | 164,916 | | | | — | |
See Notes to Financial Statements.
46
| | | | | | | | | | | | | | | | |
| | | Level 1 | | | Level 2 | | | Level 3 |
Investments in Securities (continued) | | | | | | | | | | | | | | | | |
Assets (continued) | | | | | | | | | | | | | | | | |
Long-Term Investments (continued) | | | | | | | | | | | | | | | | |
Sovereign Bonds (continued) | | | | | | | | | | | | | | | | |
Canada | | $ | — | | | $ | 257,006 | | | | | $ | — | | | |
China | | | — | | | | 1,252,482 | | | | | | — | | | |
Colombia | | | — | | | | 761,388 | | | | | | — | | | |
Croatia | | | — | | | | 262,698 | | | | | | — | | | |
Cyprus | | | — | | | | 798,210 | | | | | | — | | | |
France | | | — | | | | 93,533 | | | | | | — | | | |
Greece | | | — | | | | 1,660,007 | | | | | | — | | | |
Hungary | | | — | | | | 151,382 | | | | | | — | | | |
Indonesia | | | — | | | | 1,266,766 | | | | | | — | | | |
Israel | | | — | | | | 250,964 | | | | | | — | | | |
Italy | | | — | | | | 2,807,151 | | | | | | — | | | |
Kazakhstan | | | — | | | | 147,248 | | | | | | — | | | |
Mexico | | | — | | | | 699,449 | | | | | | — | | | |
New Zealand | | | — | | | | 59,597 | | | | | | — | | | |
Peru | | | — | | | | 563,487 | | | | | | — | | | |
Philippines | | | — | | | | 460,045 | | | | | | — | | | |
Portugal | | | — | | | | 1,372,454 | | | | | | — | | | |
Romania | | | — | | | | 351,376 | | | | | | — | | | |
Russia | | | — | | | | 252,900 | | | | | | — | | | |
Saudi Arabia | | | — | | | | 151,152 | | | | | | — | | | |
Serbia | | | — | | | | 313,565 | | | | | | — | | | |
Spain | | | — | | | | 2,508,095 | | | | | | — | | | |
Ukraine | | | — | | | | 729,695 | | | | | | — | | | |
United Kingdom | | | — | | | | 178,078 | | | | | | — | | | |
Short-Term Investments | | | | | | | | | | | | | | | | |
Affiliated Mutual Fund | | | 30,869 | | | | — | | | | | | — | | | |
Options Purchased | | | — | | | | 6,446 | | | | | | — | | | |
| | | | | | | | | | | | | | | | |
| | | | | |
Total | | $ | 30,869 | | | $ | 33,279,105 | | | | | $ | — | | | |
| | | | | | | | | | |
| | | | | |
Liabilities | | | | | | | | | | | | | | | | |
Options Written | | $ | — | | | $ | (8,144 | ) | | | | $ | — | | | |
| | | | | | | | | | |
Other Financial Instruments* | | | | | | | | | | | | | | | | |
Assets | | | | | | | | | | | | | | | | |
Futures Contracts | | $ | 807,630 | | | $ | — | | | | | $ | — | | | |
OTC Forward Foreign Currency Exchange Contracts | | | — | | | | 84,275 | | | | | | — | | | |
Centrally Cleared Credit Default Swap Agreement | | | — | | | | 1,651 | | | | | | — | | | |
OTC Credit Default Swap Agreements | | | — | | | | 80,037 | | | | | | — | | | |
OTC Currency Swap Agreement | | | — | | | | 17,925 | | | | | | — | | | |
Centrally Cleared Interest Rate Swap Agreements | | | — | | | | 718,995 | | | | | | — | | | |
OTC Interest Rate Swap Agreements | | | — | | | | 39,620 | | | | | | — | | | |
| | | | | | | | | | | | | | | | |
| | | | | |
Total | | $ | 807,630 | | | $ | 942,503 | | | | | $ | — | | | |
| | | | | | | | | | |
| | | | | |
Liabilities | | | | | | | | | | | | | | | | |
Futures Contracts | | $ | (111,653 | ) | | $ | — | | | | | $ | — | | | |
OTC Forward Foreign Currency Exchange Contracts | | | — | | | | (111,266 | ) | | | | | — | | | |
OTC Credit Default Swap Agreements | | | — | | | | (2,788 | ) | | | | | — | | | |
Centrally Cleared Inflation Swap Agreements | | | — | | | | (47,190 | ) | | | | | — | | | |
Centrally Cleared Interest Rate Swap Agreements | | | — | | | | (810,429 | ) | | | | | — | | | |
OTC Interest Rate Swap Agreements | | | — | | | | (94,967 | ) | | | | | — | | | |
| | | | | | | | | | | | | | | | |
| | | | | |
Total | | $ | (111,653 | ) | | $ | (1,066,640 | ) | | | | $ | — | | | |
| | | | | | | | | | |
See Notes to Financial Statements.
PGIM International Bond Fund 47
Schedule of Investments (continued)
as of October 31, 2021
| * | Other financial instruments are derivative instruments not reflected in the Schedule of Investments, such as futures, forwards and centrally cleared swap contracts, which are recorded at the unrealized appreciation (depreciation) on the instrument, and OTC swap contracts which are recorded at fair value. |
Industry Classification:
The industry classification of investments and other assets in excess of liabilities shown as a percentage of net assets as of October 31, 2021 were as follows (unaudited):
| | | | |
Sovereign Bonds | | | 51.9 | % |
Commercial Mortgage-Backed Securities | | | 6.3 | |
Banks | | | 3.6 | |
Collateralized Loan Obligations | | | 3.6 | |
Telecommunications | | | 2.7 | |
Commercial Services | | | 2.5 | |
Oil & Gas | | | 2.4 | |
Transportation | | | 2.0 | |
Foods | | | 1.9 | |
Electric | | | 1.9 | |
Residential Mortgage-Backed Securities | | | 1.6 | |
Insurance | | | 1.5 | |
Packaging & Containers | | | 1.4 | |
Healthcare-Products | | | 1.4 | |
Media | | | 1.1 | |
Auto Manufacturers | | | 0.9 | |
Lodging | | | 0.7 | |
Machinery-Diversified | | | 0.7 | |
Retail | | | 0.6 | |
Internet | | | 0.6 | |
Real Estate Investment Trusts (REITs) | | | 0.6 | |
Diversified Financial Services | | | 0.6 | |
Consumer Loans | | | 0.6 | |
Entertainment | | | 0.6 | |
| | | | |
Chemicals | | | 0.5 | % |
Iron/Steel | | | 0.5 | |
Real Estate | | | 0.4 | |
Other | | | 0.4 | |
Multi-National | | | 0.4 | |
Software | | | 0.4 | |
Computers | | | 0.3 | |
Household Products/Wares | | | 0.3 | |
Engineering & Construction | | | 0.3 | |
Student Loan | | | 0.2 | |
Beverages | | | 0.2 | |
Affiliated Mutual Fund | | | 0.1 | |
Semiconductors | | | 0.1 | |
Options Purchased | | | 0.0 | * |
| | | | |
| |
| | | 95.8 | |
Options Written | | | (0.0 | )* |
Other assets in excess of liabilities | | | 4.2 | |
| | | | |
| |
| | | 100.0 | % |
| | | | |
* Less than +/- 0.05%
Effects of Derivative Instruments on the Financial Statements and Primary Underlying Risk Exposure:
The Fund invested in derivative instruments during the reporting period. The primary types of risk associated with these derivative instruments are credit contracts risk, foreign exchange contracts risk and interest rate contracts risk. See the Notes to Financial Statements for additional detail regarding these derivative instruments and their risks. The effect of such derivative instruments on the Fund’s financial position and financial performance as reflected in the Statement of Assets and Liabilities and Statement of Operations is presented in the summary below.
Fair values of derivative instruments as of October 31, 2021 as presented in the Statement of Assets and Liabilities:
See Notes to Financial Statements.
48
| | | | | | | | | | | | | | | | | | | | |
| | | | | Asset Derivatives | | | Liability Derivatives | |
Derivatives not accounted for as hedging instruments, carried at fair value | | | | Statement of Assets and Liabilities Location | | | | | Fair
Value | | | Statement of Assets and Liabilities Location | | | | Fair
Value | |
| | | | | | | |
Credit contracts | | | | Due from/to broker-variation margin swaps | | | | | | $ | 1,651 | * | | — | | | | $ | — | |
Credit contracts | | | | Premiums paid for OTC swap agreements | | | | | | | 46,882 | | | Premiums received for OTC swap agreements | | | | | 34,088 | |
Credit contracts | | | | Unrealized appreciation on OTC swap agreements | | | | | | | 72,386 | | | Unrealized depreciation on OTC swap agreements | | | | | 7,931 | |
Foreign exchange contracts | | | | Due from/to broker-variation margin futures | | | | | | | 520,736 | * | | — | | | | | — | |
Foreign exchange contracts | | | | Unrealized appreciation on OTC forward foreign currency exchange contracts | | | | | | | 84,275 | | | Unrealized depreciation on OTC forward foreign currency exchange contracts | | | | | 111,266 | |
Interest rate contracts | | | | Due from/to broker-variation margin futures | | | | | | | 286,894 | * | | Due from/to broker-variation margin futures | | | | | 111,653 | * |
Interest rate contracts | | | | Due from/to broker-variation margin swaps | | | | | | | 718,995 | * | | Due from/to broker-variation margin swaps | | | | | 857,619 | * |
Interest rate contracts | | | | Premiums paid for OTC swap agreements | | | | | | | 21 | | | Premiums received for OTC swap agreements | | | | | 41 | |
Interest rate contracts | | | | Unaffiliated investments | | | | | | | 6,446 | | | Options written outstanding, at value | | | | | 8,144 | |
Interest rate contracts | | | | Unrealized appreciation on OTC swap agreements | | | | | | | 57,528 | | | Unrealized depreciation on OTC swap agreements | | | | | 94,930 | |
| | | | | | | | | | | | | | | | | | | | |
| | | | | | | |
| | | | | | | | | | $ | 1,795,814 | | | | | | | $ | 1,225,672 | |
| | | | | | | | | | | | | | | | | | | | |
| * | Includes cumulative appreciation (depreciation) as reported in the schedule of open futures and centrally cleared swap contracts. Only unsettled variation margin receivable (payable) is reported within the Statement of Assets and Liabilities. |
See Notes to Financial Statements.
PGIM International Bond Fund 49
Schedule of Investments (continued)
as of October 31, 2021
The effects of derivative instruments on the Statement of Operations for the year ended October 31, 2021 are as follows:
| | | | | | | | | | | | | | | | | | | | | | | | | | | |
| Amount of Realized Gain (Loss) on Derivatives Recognized in Income |
Derivatives not accounted for as hedging instruments, carried at fair value | | Options Purchased(1) | | Options
Written | | Futures | | Forward
& Cross
Currency
Exchange
Contracts | | | | Swaps |
| | | | | | |
Credit contracts | | | $ | (3,760 | ) | | | $ | 4,302 | | | | $ | — | | | | $ | — | | | | | | $ | 255,178 | |
Foreign exchange contracts | | | | 934 | | | | | 6,416 | | | | | 60,643 | | | | | (646,855 | ) | | | | | | — | |
Interest rate contracts | | | | — | | | | | — | | | | | (684,418 | ) | | | | — | | | | | | | 457,831 | |
| | | | | | | | | | | | | | | | | | | | | | | | | | | |
| | | | | | |
Total | | | $ | (2,826 | ) | | | $ | 10,718 | | | | $ | (623,775 | ) | | | $ | (646,855 | ) | | | | | $ | 713,009 | |
| | | | | | | | | | | | | | | | | | | | | | | | | | | |
|
| (1) Included in net realized gain (loss) on investment transactions in the Statement of Operations. | |
| | | | | | | | | | | | | | | | | | | | | | | | | | | |
|
| Change in Unrealized Appreciation (Depreciation) on Derivatives Recognized in Income |
Derivatives not accounted for as hedging instruments, carried at fair value | | Options Purchased(2) | | Options
Written | | Futures | | Forward & Cross Currency Exchange Contracts | | | | Swaps |
| | | | | | |
Credit contracts | | | $ | — | | | | $ | — | | | | $ | — | | | | $ | — | | | | | | $ | 140,095 | |
Foreign exchange contracts | | | | 38 | | | | | (835 | ) | | | | 308,671 | | | | | 13,359 | | | | | | | — | |
Interest rate contracts | | | | 146 | | | | | (644 | ) | | | | 505,423 | | | | | — | | | | | | | (1,899,180 | ) |
| | | | | | | | | | | | | | | | | | | | | | | | | | | |
| | | | | | |
Total | | | $ | 184 | | | | $ | (1,479 | ) | | | $ | 814,094 | | | | $ | 13,359 | | | | | | $ | (1,759,085 | ) |
| | | | | | | | | | | | | | | | | | | | | | | | | | | |
(2) Included in net change in unrealized appreciation (depreciation) on investments in the Statement of Operations.
See Notes to Financial Statements.
50
For the year ended October 31, 2021, the Fund’s average volume of derivative activities is as follows:
| | | | | | | | | | | | | | | | | | | | | | | |
Options
Purchased(1) | | Options
Written(2) | | Futures
Contracts—
Long
Positions(2) | | Futures
Contracts—
Short
Positions(2) | | Forward Foreign
Currency Exchange
Contracts— Purchased(3) |
| | | | |
| $2,938 | | | $ | 596,563 | | | | $ | 9,679,177 | | | | $ | 61,337,230 | | | $8,102,276 | |
| | | | | | | | | | | | | | | |
Forward Foreign Currency Exchange Contracts—Sold(3) | | Cross
Currency
Exchange
Contracts(4) | | Interest Rate
Swap
Agreements(2) | | Credit Default
Swap Agreements—
Buy Protection(2) |
| | | |
$18,292,515 | | $6,127 | | $56,442,284 | | $3,551,257 |
| | | | | | | | | | | | | |
Credit Default
Swap Agreements— | | Currency
Swap | | Inflation Swap |
Sell Protection(2) | | Agreements(2) | | Agreements(2) |
| | |
| $9,403,400 | | $138,169 | | $871,816 |
| (2) | Notional Amount in USD. |
| (3) | Value at Settlement Date. |
Average volume is based on average quarter end balances as noted for the year ended October 31, 2021.
Financial Instruments/Transactions—Summary of Offsetting and Netting Arrangements:
The Fund invested in OTC derivatives during the reporting period that are either offset in accordance with current requirements or are subject to enforceable master netting arrangements or similar agreements that permit offsetting. The information about offsetting and related netting arrangements for OTC derivatives where the legal right to set-off exists is presented in the summary below.
Offsetting of OTC derivative assets and liabilities:
| | | | | | | | | | | | | | | | | | | | | | | | | |
| Counterparty | | Gross Amounts of
Recognized
Assets(1) | | Gross Amounts of
Recognized
Liabilities(1) | | Net Amounts of
Recognized
Assets/(Liabilities) | | Collateral
Pledged/(Received)(2) | | Net Amount |
| | | | | |
Bank of America, N.A. | | | $ | 26,084 | | | | $ | (21,922 | ) | | | $ | 4,162 | | | | $ | — | | | | $ | 4,162 | |
Barclays Bank PLC | | | | 39,493 | | | | | (20,474 | ) | | | | 19,019 | | | | | — | | | | | 19,019 | |
BNP Paribas S.A. | | | | 33,224 | | | | | (30,593 | ) | | | | 2,631 | | | | | — | | | | | 2,631 | |
Citibank, N.A. | | | | 118,707 | | | | | (41,395 | ) | | | | 77,312 | | | | | — | | | | | 77,312 | |
Credit Suisse International | | | | 937 | | | | | — | | | | | 937 | | | | | — | | | | | 937 | |
Deutsche Bank AG | | | | 10,735 | | | | | (8,144 | ) | | | | 2,591 | | | | | — | | | | | 2,591 | |
See Notes to Financial Statements.
PGIM International Bond Fund 51
Schedule of Investments (continued)
as of October 31, 2021
| | | | | | | | | | | | | | | | | | | | | | | | | |
| Counterparty | | Gross Amounts of
Recognized
Assets(1) | | Gross Amounts of
Recognized
Liabilities(1) | | Net Amounts of
Recognized
Assets/(Liabilities) | | Collateral
Pledged/(Received)(2) | | Net Amount |
| | | | | |
Goldman Sachs International | | | $ | 9,348 | | | | $ | (20,548 | ) | | | $ | (11,200 | ) | | | $ | — | | | | $ | (11,200 | ) |
HSBC Bank PLC | | | | 506 | | | | | (32,726 | ) | | | | (32,220 | ) | | | | — | | | | | (32,220 | ) |
JPMorgan Chase Bank, N.A. | | | | 9,512 | | | | | (5,966 | ) | | | | 3,546 | | | | | — | | | | | 3,546 | |
Morgan Stanley & Co. International PLC | | | | 14,054 | | | | | (62,841 | ) | | | | (48,787 | ) | | | | — | | | | | (48,787 | ) |
Standard Chartered Bank | | | | — | | | | | (9,203 | ) | | | | (9,203 | ) | | | | — | | | | | (9,203 | ) |
UBS AG | | | | 4,938 | | | | | (2,588 | ) | | | | 2,350 | | | | | — | | | | | 2,350 | |
| | | | | | | | | | | | | | | | | | | | | | | | | |
| | | | | |
| | | $ | 267,538 | | | | $ | (256,400 | ) | | | $ | 11,138 | | | | $ | — | | | | $ | 11,138 | |
| | | | | | | | | | | | | | | | | | | | | | | | | |
| (1) | Includes unrealized appreciation/(depreciation) on swaps and forwards, premiums paid/(received) on swap agreements and market value of purchased and written options, as represented on the Statement of Assets and Liabilities. |
| (2) | Collateral amount disclosed by the Fund is limited to the market value of financial instruments/transactions and the Fund’s OTC derivative exposure by counterparty. |
See Notes to Financial Statements.
52
Statement of Assets and Liabilities
as of October 31, 2021
| | | | |
Assets | | | | |
| |
Investments at value: | | | | |
Unaffiliated investments (cost $31,804,160) | | $ | 33,279,105 | |
Affiliated investments (cost $30,869) | | | 30,869 | |
| |
Cash | | | 677 | |
Foreign currency, at value (cost $37,505) | | | 37,346 | |
Deposit with broker for centrally cleared/exchange-traded derivatives | | | 870,000 | |
Dividends and interest receivable | | | 388,027 | |
Due from broker—variation margin futures | | | 315,359 | |
Unrealized appreciation on OTC swap agreements | | | 129,914 | |
Unrealized appreciation on OTC forward foreign currency exchange contracts | | | 84,275 | |
Premiums paid for OTC swap agreements | | | 46,903 | |
Receivable for Fund shares sold | | | 15,197 | |
Prepaid expenses | | | 1,756 | |
| | | | |
| |
Total Assets | | | 35,199,428 | |
| | | | |
| |
Liabilities | | | | |
| |
Unrealized depreciation on OTC forward foreign currency exchange contracts | | | 111,266 | |
Unrealized depreciation on OTC swap agreements | | | 102,861 | |
Accrued expenses and other liabilities | | | 55,920 | |
Audit fee payable | | | 50,501 | |
Payable for Fund shares purchased | | | 39,728 | |
Premiums received for OTC swap agreements | | | 34,129 | |
Due to broker—variation margin swaps | | | 19,990 | |
Options written outstanding, at value (premiums received $7,500) | | | 8,144 | |
Management fee payable | | | 5,035 | |
Trustees’ fees payable | | | 803 | |
Distribution fee payable | | | 149 | |
Affiliated transfer agent fee payable | | | 134 | |
Dividends payable | | | 16 | |
| | | | |
| |
Total Liabilities | | | 428,676 | |
| | | | |
| |
Net Assets | | $ | 34,770,752 | |
| | | | |
| | | | | |
| |
Net assets were comprised of: | | | | |
Shares of beneficial interest, at par | | $ | 3,601 | |
Paid-in capital in excess of par | | | 34,487,431 | |
Total distributable earnings (loss) | | | 279,720 | |
| | | | |
| |
Net assets, October 31, 2021 | | $ | 34,770,752 | |
| | | | |
See Notes to Financial Statements.
PGIM International Bond Fund 53
Statement of Assets and Liabilities
as of October 31, 2021
| | | | | | | | |
Class A | | | | | | | | |
| | |
Net asset value and redemption price per share, ($275,313 ÷ 28,520 shares of beneficial interest issued and outstanding) | | $ | 9.65 | | | | | |
| | |
Maximum sales charge (3.25% of offering price) | | | 0.32 | | | | | |
| | | | | | | | |
| | |
Maximum offering price to public | | $ | 9.97 | | | | | |
| | | | | | | | |
| | |
Class C | | | | | | | | |
| | |
Net asset value, offering price and redemption price per share, ($95,432 ÷ 9,892 shares of beneficial interest issued and outstanding) | | $ | 9.65 | | | | | |
| | | | | | | | |
| | |
Class Z | | | | | | | | |
| | |
Net asset value, offering price and redemption price per share, ($2,537,117 ÷ 262,817 shares of beneficial interest issued and outstanding) | | $ | 9.65 | | | | | |
| | | | | | | | |
| | |
Class R6 | | | | | | | | |
| | |
Net asset value, offering price and redemption price per share, ($31,862,890 ÷ 3,300,107 shares of beneficial interest issued and outstanding) | | $ | 9.66 | | | | | |
| | | | | | | | |
See Notes to Financial Statements.
54
Statement of Operations
Year Ended October 31, 2021
| | | | |
Net Investment Income (Loss) | | | | |
| |
Income | | | | |
Interest income (net of $143 foreign withholding tax) | | $ | 898,446 | |
Affiliated dividend income | | | 987 | |
| | | | |
| |
Total income | | | 899,433 | |
| | | | |
| |
Expenses | | | | |
Management fee | | | 199,036 | |
Distribution fee(a) | | | 3,494 | |
Custodian and accounting fees | | | 77,141 | |
Audit fee | | | 52,305 | |
Registration fees(a) | | | 30,589 | |
Legal fees and expenses | | | 20,450 | |
Shareholders’ reports | | | 13,137 | |
Transfer agent’s fees and expenses (including affiliated expense of $794)(a) | | | 12,033 | |
Trustees’ fees | | | 10,019 | |
Miscellaneous | | | 29,271 | |
| | | | |
| |
Total expenses | | | 447,475 | |
Less: Fee waiver and/or expense reimbursement(a) | | | (207,255 | ) |
| | | | |
| |
Net expenses | | | 240,220 | |
| | | | |
| |
Net investment income (loss) | | | 659,213 | |
| | | | |
| |
Realized And Unrealized Gain (Loss) On Investment And Foreign Currency Transactions | | | | |
| |
Net realized gain (loss) on: | | | | |
Investment transactions | | | 1,001,552 | |
Futures transactions | | | (623,775 | ) |
Forward currency contract transactions | | | (646,855 | ) |
Options written transactions | | | 10,718 | |
Swap agreement transactions | | | 713,009 | |
Foreign currency transactions | | | 1,167,299 | |
| | | | |
| |
| | | 1,621,948 | |
| | | | |
| |
Net change in unrealized appreciation (depreciation) on: | | | | |
Investments | | | (1,671,896 | ) |
Futures | | | 814,094 | |
Forward and cross currency contracts | | | 13,359 | |
Options written | | | (1,479 | ) |
Swap agreements | | | (1,759,085 | ) |
Foreign currencies | | | (35,027 | ) |
| | | | |
| |
| | | (2,640,034 | ) |
| | | | |
| |
Net gain (loss) on investment and foreign currency transactions | | | (1,018,086 | ) |
| | | | |
| |
Net Increase (Decrease) In Net Assets Resulting From Operations | | $ | (358,873 | ) |
| | | | |
See Notes to Financial Statements.
PGIM International Bond Fund 55
Statement of Operations
Year Ended October 31, 2021
| (a) | Class specific expenses and waivers were as follows: |
| | | | | | | | | | | | | | | | |
| | | Class A | | Class C | | Class Z | | Class R6 |
| | | | |
Distribution fee | | | 992 | | | | 2,502 | | | | — | | | | — | |
Registration fees | | | 7,103 | | | | 5,702 | | | | 10,831 | | | | 6,953 | |
Transfer agent’s fees and expenses | | | 1,155 | | | | 363 | | | | 10,388 | | | | 127 | |
Fee waiver and/or expense reimbursement | | | (9,332 | ) | | | (6,750 | ) | | | (46,738 | ) | | | (144,435 | ) |
See Notes to Financial Statements.
56
Statements of Changes in Net Assets
| | | | | | | | |
| |
| | | Year Ended October 31, | |
| | |
| | | 2021 | | | 2020 | |
| | |
Increase (Decrease) in Net Assets | | | | | | | | |
| | |
Operations | | | | | | | | |
Net investment income (loss) | | $ | 659,213 | | | $ | 774,803 | |
Net realized gain (loss) on investment and foreign currency transactions | | | 1,621,948 | | | | (2,408,363 | ) |
Net change in unrealized appreciation (depreciation) on investments and foreign currencies | | | (2,640,034 | ) | | | 2,560,740 | |
| | | | | | | | |
| | |
Net increase (decrease) in net assets resulting from operations | | | (358,873 | ) | | | 927,180 | |
| | | | | | | | |
| | |
Dividends and Distributions | | | | | | | | |
Distributions from distributable earnings | | | | | | | | |
Class A | | | (11,618 | ) | | | (20,297 | ) |
Class C | | | (5,396 | ) | | | (6,132 | ) |
Class Z | | | (221,194 | ) | | | (433,454 | ) |
Class R6 | | | (1,074,118 | ) | | | (2,110,870 | ) |
| | | | | | | | |
| | |
| | | (1,312,326 | ) | | | (2,570,753 | ) |
| | | | | | | | |
Tax return of capital distributions | | | | | | | | |
Class A | | | — | | | | (7,942 | ) |
Class C | | | — | | | | (2,400 | ) |
Class Z | | | — | | | | (169,614 | ) |
Class R6 | | | — | | | | (825,998 | ) |
| | | | | | | | |
| | |
| | | — | | | | (1,005,954 | ) |
| | | | | | | | |
| | |
Fund share transactions (Net of share conversions) | | | | | | | | |
Net proceeds from shares sold | | | 2,351,743 | | | | 22,469,556 | |
Net asset value of shares issued in reinvestment of dividends and distributions | | | 1,312,012 | | | | 3,575,887 | |
Cost of shares purchased | | | (16,437,684 | ) | | | (9,379,252 | ) |
| | | | | | | | |
| | |
Net increase (decrease) in net assets from Fund share transactions | | | (12,773,929 | ) | | | 16,666,191 | |
| | | | | | | | |
| | |
Total increase (decrease) | | | (14,445,128 | ) | | | 14,016,664 | |
| | |
Net Assets: | | | | | | | | |
| | |
Beginning of year | | | 49,215,880 | | | | 35,199,216 | |
| | | | | | | | |
| | |
End of year | | $ | 34,770,752 | | | $ | 49,215,880 | |
| | | | | | | | |
See Notes to Financial Statements.
PGIM International Bond Fund 57
Financial Highlights
| | | | | | | | | | | | | | | | | | | | | | | | |
| | | | |
| Class A Shares | | | | | | | | |
| | | Year Ended October 31, | | | December 14, 2016(a)
through October 31,
2017 | | | |
| | | 2021 | | | 2020 | | | 2019 | | | 2018 | |
Per Share Operating Performance(b): | | | | | | | | | | | | | | | | | | | | | | | | |
Net Asset Value, Beginning of Period | | | $10.13 | | | | $10.83 | | | | $10.22 | | | | $10.44 | | | | $10.00 | | | | | |
Income (loss) from investment operations: | | | | | | | | | | | | | | | | | | | | | | | | |
Net investment income (loss) | | | 0.13 | | | | 0.14 | | | | 0.14 | | | | 0.12 | | | | 0.07 | | | | | |
| Net realized and unrealized gain (loss) on investment and foreign currency transactions | | | (0.32 | ) | | | 0.10 | | | | 1.43 | | | | (0.08 | ) | | | 0.57 | | | | | |
Total from investment operations | | | (0.19 | ) | | | 0.24 | | | | 1.57 | | | | 0.04 | | | | 0.64 | | | | | |
Less Dividends and Distributions: | | | | | | | | | | | | | | | | | | | | | | | | |
Dividends from net investment income | | | (0.29 | ) | | | (0.53 | ) | | | (0.96 | ) | | | (0.26 | ) | | | - | | | | | |
Tax return of capital distributions | | | - | | | | (0.24 | ) | | | - | | | | - | | | | (0.20 | ) | | | | |
Distributions from net realized gains | | | - | | | | (0.17 | ) | | | - | | | | - | | | | - | | | | | |
Total dividends and distributions | | | (0.29 | ) | | | (0.94 | ) | | | (0.96 | ) | | | (0.26 | ) | | | (0.20 | ) | | | | |
Net asset value, end of period | | | $9.65 | | | | $10.13 | | | | $10.83 | | | | $10.22 | | | | $10.44 | | | | | |
Total Return(c): | | | (1.93 | )% | | | 2.30 | % | | | 16.52 | % | | | 0.40 | % | | | 6.42 | % | | | | |
| | | | | | | | | | | | | | | | | | | | | | | | | |
| | | | | | | |
| Ratios/Supplemental Data: | | | | | | | | | | | | | | | | | |
Net assets, end of period (000) | | | $275 | | | | $523 | | | | $267 | | | | $103 | | | | $91 | | | | | |
Average net assets (000) | | | $397 | | | | $383 | | | | $163 | | | | $99 | | | | $38 | | | | | |
Ratios to average net assets(d)(e): | | | | | | | | | | | | | | | | | | | | | | | | |
Expenses after waivers and/or expense reimbursement | | | 0.99 | % | | | 0.99 | % | | | 0.99 | % | | | 0.99 | % | | | 0.99 | %(f) | | | | |
| Expenses before waivers and/or expense reimbursement | | | 3.34 | % | | | 4.24 | % | | | 9.63 | % | | | 17.44 | % | | | 3.39 | %(f) | | | | |
Net investment income (loss) | | | 1.29 | % | | | 1.42 | % | | | 1.35 | % | | | 1.14 | % | | | 0.85 | %(f) | | | | |
Portfolio turnover rate(g) | | | 29 | % | | | 16 | % | | | 49 | % | | | 35 | % | | | 66 | % | | | | |
| (a) | Commencement of operations. |
| (b) | Calculated based on average shares outstanding during the period. |
| (c) | Total return does not consider the effects of sales loads. Total return is calculated assuming a purchase of a share on the first day and a sale on the last day of each period reported and includes reinvestment of dividends and distributions, if any. Total returns may reflect adjustments to conform to GAAP. Total returns for periods less than one full year are not annualized. |
| (d) | Does not include expenses of the underlying funds in which the Fund invests. |
| (e) | Effective November 1, 2017, class specific expenses include transfer agent fees and expenses and registration fees, which are charged to their respective share class. |
| (g) | The Fund’s portfolio turnover rate is calculated in accordance with regulatory requirements, without regard to transactions involving short-term investments and certain derivatives. If such transactions were included, the Fund’s portfolio turnover rate may be higher. |
See Notes to Financial Statements.
58
| | | | | | | | | | | | | | | | | | | | | | | | |
| | | | |
| Class C Shares | | | | | | | | |
| | | Year Ended October 31, | | | December 14, 2016(a)
through October 31, | | | |
| | | 2021 | | | 2020 | | | 2019 | | | 2018 | | | 2017 |
Per Share Operating Performance(b): | | | | | | | | | | | | | | | | | | | | | | | | |
Net Asset Value, Beginning of Period | | | $10.13 | | | | $10.83 | | | | $10.22 | | | | $10.44 | | | | $10.00 | | | | | |
Income (loss) from investment operations: | | | | | | | | | | | | | | | | | | | | | | | | |
| Net investment income (loss) | | | 0.05 | | | | 0.06 | | | | 0.03 | | | | 0.04 | | | | - | | | | | |
| Net realized and unrealized gain (loss) on investment and foreign currency transactions | | | (0.31 | ) | | | 0.10 | | | | 1.46 | | | | (0.07 | ) | | | 0.57 | | | | | |
Total from investment operations | | | (0.26 | ) | | | 0.16 | | | | 1.49 | | | | (0.03 | ) | | | 0.57 | | | | | |
Less Dividends and Distributions: | | | | | | | | | | | | | | | | | | | | | | | | |
Dividends from net investment income | | | (0.22 | ) | | | (0.45 | ) | | | (0.88 | ) | | | (0.19 | ) | | | - | | | | | |
Tax return of capital distributions | | | - | | | | (0.24 | ) | | | - | | | | - | | | | (0.13 | ) | | | | |
Distributions from net realized gains | | | - | | | | (0.17 | ) | | | - | | | | - | | | | - | | | | | |
Total dividends and distributions | | | (0.22 | ) | | | (0.86 | ) | | | (0.88 | ) | | | (0.19 | ) | | | (0.13 | ) | | | | |
Net asset value, end of period | | | $9.65 | | | | $10.13 | | | | $10.83 | | | | $10.22 | | | | $10.44 | | | | | |
Total Return(c): | | | (2.66 | )% | | | 1.61 | % | | | 15.65 | % | | | (0.34 | )% | | | 5.73 | % | | | | |
| | | | | | | | | | | | | | | | | | | | | | | | | |
| | | | | | | |
| Ratios/Supplemental Data: | | | | | | | | | | | | | | | | | |
Net assets, end of period (000) | | | $95 | | | | $311 | | | | $45 | | | | $16 | | | | $11 | | | | | |
Average net assets (000) | | | $250 | | | | $222 | | | | $31 | | | | $13 | | | | $10 | | | | | |
Ratios to average net assets(d)(e): | | | | | | | | | | | | | | | | | | | | | | | | |
| Expenses after waivers and/or expense reimbursement | | | 1.74 | % | | | 1.74 | % | | | 1.74 | % | | | 1.74 | % | | | 1.74 | %(f) | | | | |
| Expenses before waivers and/or expense reimbursement | | | 4.44 | % | | | 6.58 | % | | | 43.49 | % | | | 124.78 | % | | | 3.26 | %(f) | | | | |
Net investment income (loss) | | | 0.54 | % | | | 0.63 | % | | | 0.33 | % | | | 0.41 | % | | | 0.06 | %(f) | | | | |
Portfolio turnover rate(g) | | | 29 | % | | | 16 | % | | | 49 | % | | | 35 | % | | | 66 | % | | | | |
| (a) | Commencement of operations. |
| (b) | Calculated based on average shares outstanding during the period. |
| (c) | Total return does not consider the effects of sales loads. Total return is calculated assuming a purchase of a share on the first day and a sale on the last day of each period reported and includes reinvestment of dividends and distributions, if any. Total returns may reflect adjustments to conform to GAAP. Total returns for periods less than one full year are not annualized. |
| (d) | Does not include expenses of the underlying funds in which the Fund invests. |
| (e) | Effective November 1, 2017, class specific expenses include transfer agent fees and expenses and registration fees, which are charged to their respective share class. |
| (g) | The Fund’s portfolio turnover rate is calculated in accordance with regulatory requirements, without regard to transactions involving short-term investments and certain derivatives. If such transactions were included, the Fund’s portfolio turnover rate may be higher. |
See Notes to Financial Statements.
PGIM International Bond Fund 59
Financial Highlights (continued)
| | | | | | | | | | | | | | | | | | | | | | | | |
| | | | |
| Class Z Shares | | | | | | | | |
| | | | | | December 14, 2016(a) | | | |
| | | Year Ended October 31, | | | through October 31, | | | |
| | | | | | | |
| | | 2021 | | | 2020 | | | 2019 | | | 2018 | | | 2017 | | | |
Per Share Operating Performance(b): | | | | | | | | | | | | | | | | | | | | | | | | |
Net Asset Value, Beginning of Period | | | $10.13 | | | | $10.83 | | | | $10.23 | | | | $10.44 | | | | $10.00 | | | | | |
Income (loss) from investment operations: | | | | | | | | | | | | | | | | | | | | | | | | |
Net investment income (loss) | | | 0.17 | | | | 0.18 | | | | 0.14 | | | | 0.15 | | | | 0.09 | | | | | |
| Net realized and unrealized gain (loss) on investment and foreign currency transactions | | | (0.32 | ) | | | 0.09 | | | | 1.45 | | | | (0.07 | ) | | | 0.57 | | | | | |
Total from investment operations | | | (0.15 | ) | | | 0.27 | | | | 1.59 | | | | 0.08 | | | | 0.66 | | | | | |
Less Dividends and Distributions: | | | | | | | | | | | | | | | | | | | | | | | | |
Dividends from net investment income | | | (0.33 | ) | | | (0.56 | ) | | | (0.99 | ) | | | (0.29 | ) | | | - | | | | | |
Tax return of capital distributions | | | - | | | | (0.24 | ) | | | - | | | | - | | | | (0.22 | ) | | | | |
Distributions from net realized gains | | | - | | | | (0.17 | ) | | | - | | | | - | | | | - | | | | | |
Total dividends and distributions | | | (0.33 | ) | | | (0.97 | ) | | | (0.99 | ) | | | (0.29 | ) | | | (0.22 | ) | | | | |
Net asset value, end of period | | | $9.65 | | | | $10.13 | | | | $10.83 | | | | $10.23 | | | | $10.44 | | | | | |
Total Return(c): | | | (1.57 | )% | | | 2.66 | % | | | 16.80 | % | | | 0.75 | % | | | 6.67 | % | | | | |
| | | | | | | | | | | | | | | | | | | | | | | | | |
| | | | | | | |
| Ratios/Supplemental Data: | | | | | | | | | | | | | | | | | |
Net assets, end of period (000) | | | $2,537 | | | | $16,104 | | | | $3,466 | | | | $160 | | | | $11 | | | | | |
Average net assets (000) | | | $6,683 | | | | $10,840 | | | | $1,763 | | | | $140 | | | | $10 | | | | | |
Ratios to average net assets(d)(e): | | | | | | | | | | | | | | | | | | | | | | | | |
Expenses after waivers and/or expense reimbursement | | | 0.63 | % | | | 0.63 | % | | | 0.74 | % | | | 0.74 | % | | | 0.74 | %(f) | | | | |
Expenses before waivers and/or expense reimbursement | | | 1.33 | % | | | 1.31 | % | | | 2.16 | % | | | 12.47 | % | | | 2.24 | %(f) | | | | |
Net investment income (loss) | | | 1.66 | % | | | 1.74 | % | | | 1.28 | % | | | 1.43 | % | | | 1.09 | %(f) | | | | |
Portfolio turnover rate(g) | | | 29 | % | | | 16 | % | | | 49 | % | | | 35 | % | | | 66 | % | | | | |
| (a) | Commencement of operations. |
| (b) | Calculated based on average shares outstanding during the period. |
| (c) | Total return is calculated assuming a purchase of a share on the first day and a sale on the last day of each period reported and includes reinvestment of dividends and distributions, if any. Total returns may reflect adjustments to conform to GAAP. Total returns for periods less than one full year are not annualized. |
| (d) | Does not include expenses of the underlying funds in which the Fund invests. |
| (e) | Effective November 1, 2017, class specific expenses include transfer agent fees and expenses and registration fees, which are charged to their respective share class. |
| (g) | The Fund’s portfolio turnover rate is calculated in accordance with regulatory requirements, without regard to transactions involving short-term investments and certain derivatives. If such transactions were included, the Fund’s portfolio turnover rate may be higher. |
See Notes to Financial Statements.
60
| | | | | | | | | | | | | | | | | | | | | | | | |
| | | | |
| Class R6 Shares | | | | | | | | |
| | | | | | December 14, 2016(a) | | | |
| | | Year Ended October 31, | | | through October 31, | | | |
| | | | | | | |
| | | 2021 | | | 2020 | | | 2019 | | | 2018 | | | 2017 | | | |
Per Share Operating Performance(b): | | | | | | | | | | | | | | | | | | | | | | | | |
Net Asset Value, Beginning of Period | | | $10.13 | | | | $10.84 | | | | $10.23 | | | | $10.44 | | | | $10.00 | | | | | |
Income (loss) from investment operations: | | | | | | | | | | | | | | | | | | | | | | | | |
Net investment income (loss) | | | 0.17 | | | | 0.19 | | | | 0.18 | | | | 0.14 | | | | 0.09 | | | | | |
| Net realized and unrealized gain (loss) on investment and foreign currency transactions | | | (0.31 | ) | | | 0.08 | | | | 1.42 | | | | (0.06 | ) | | | 0.57 | | | | | |
Total from investment operations | | | (0.14 | ) | | | 0.27 | | | | 1.60 | | | | 0.08 | | | | 0.66 | | | | | |
Less Dividends and Distributions: | | | | | | | | | | | | | | | | | | | | | | | | |
Dividends from net investment income | | | (0.33 | ) | | | (0.57 | ) | | | (0.99 | ) | | | (0.29 | ) | | | - | | | | | |
Tax return of capital distributions | | | - | | | | (0.24 | ) | | | - | | | | - | | | | (0.22 | ) | | | | |
Distributions from net realized gains | | | - | | | | (0.17 | ) | | | - | | | | - | | | | - | | | | | |
Total dividends and distributions | | | (0.33 | ) | | | (0.98 | ) | | | (0.99 | ) | | | (0.29 | ) | | | (0.22 | ) | | | | |
Net asset value, end of period | | | $9.66 | | | | $10.13 | | | | $10.84 | | | | $10.23 | | | | $10.44 | | | | | |
Total Return(c): | | | (1.53 | )% | | | 2.71 | % | | | 16.81 | % | | | 0.75 | % | | | 6.65 | % | | | | |
| | | | | | | | | | | | | | | | | | | | | | | | | |
| | | | | | | |
| Ratios/Supplemental Data: | | | | | | | | | | | | | | | | | |
Net assets, end of period (000) | | | $31,863 | | | | $32,278 | | | | $31,421 | | | | $26,850 | | | | $26,654 | | | | | |
Average net assets (000) | | | $32,477 | | | | $31,522 | | | | $29,104 | | | | $26,854 | | | | $25,767 | | | | | |
Ratios to average net assets(d)(e): | | | | | | | | | | | | | | | | | | | | | | | | |
Expenses after waivers and/or expense reimbursement | | | 0.58 | % | | | 0.59 | % | | | 0.74 | % | | | 0.74 | % | | | 0.74 | %(f) | | | | |
Expenses before waivers and/or expense reimbursement | | | 1.02 | % | | | 1.13 | % | | | 1.40 | % | | | 1.55 | % | | | 1.99 | %(f) | | | | |
Net investment income (loss) | | | 1.67 | % | | | 1.84 | % | | | 1.75 | % | | | 1.39 | % | | | 1.07 | %(f) | | | | |
Portfolio turnover rate(g) | | | 29 | % | | | 16 | % | | | 49 | % | | | 35 | % | | | 66 | % | | | | |
| (a) | Commencement of operations. |
| (b) | Calculated based on average shares outstanding during the period. |
| (c) | Total return is calculated assuming a purchase of a share on the first day and a sale on the last day of each period reported and includes reinvestment of dividends and distributions, if any. Total returns may reflect adjustments to conform to GAAP. Total returns for periods less than one full year are not annualized. |
| (d) | Does not include expenses of the underlying funds in which the Fund invests. |
| (e) | Effective November 1, 2017, class specific expenses include transfer agent fees and expenses and registration fees, which are charged to their respective share class. |
| (g) | The Fund’s portfolio turnover rate is calculated in accordance with regulatory requirements, without regard to transactions involving short-term investments and certain derivatives. If such transactions were included, the Fund’s portfolio turnover rate may be higher. |
See Notes to Financial Statements.
PGIM International Bond Fund 61
Notes to Financial Statements
Prudential Investment Portfolios 9 (the “Registered Investment Company” or “RIC”) is registered under the Investment Company Act of 1940, as amended (“1940 Act”), as an open-end management investment company. The RIC is organized as a Delaware Statutory Trust and currently consists of five separate funds: PGIM Absolute Return Bond Fund, PGIM International Bond Fund, PGIM QMA Large-Cap Core Equity Fund, PGIM Real Estate Income Fund and PGIM Select Real Estate Fund. These financial statements relate only to the PGIM International Bond Fund (the “Fund”). The Fund is classified as a non-diversified fund for purposes of the 1940 Act.
The investment objective of the Fund is to seek total return, made up of current income and capital appreciation.
The Fund follows the investment company accounting and reporting guidance of the Financial Accounting Standards Board (“FASB”) Accounting Standard Codification (“ASC”) Topic 946 Financial Services — Investment Companies. The following is a summary of significant accounting policies followed by the Fund in the preparation of its financial statements. The policies conform to U.S. generally accepted accounting principles (“GAAP”). The Fund consistently follows such policies in the preparation of its financial statements.
Securities Valuation: The Fund holds securities and other assets and liabilities that are fair valued as of the close of each day (generally, 4:00 PM Eastern time) the New York Stock Exchange (“NYSE”) is open for trading. As described in further detail below, the Fund’s investments are valued daily based on a number of factors, including the type of investment and whether market quotations are readily available. The RIC’s Board of Trustees (the “Board”) has adopted valuation procedures for security valuation under which fair valuation responsibilities have been delegated to PGIM Investments LLC (“PGIM Investments” or the “Manager”). Pursuant to the Board’s delegation, the Manager has established a Valuation Committee responsible for supervising the fair valuation of portfolio securities and other assets and liabilities. The valuation procedures permit the Fund to utilize independent pricing vendor services, quotations from market makers, and alternative valuation methods when market quotations are either not readily available or not deemed representative of fair value. Fair value is the price that would be received to sell an asset or paid to transfer a liability in an orderly transaction between market participants on the measurement date. A record of the Valuation Committee’s actions is subject to the Board’s review at its first quarterly meeting following the quarter in which such actions take place.
62
For the fiscal reporting year-end, securities and other assets and liabilities were fair valued at the close of the last U.S. business day. Trading in certain foreign securities may occur when the NYSE is closed (including weekends and holidays). Because such foreign securities trade in markets that are open on weekends and U.S. holidays, the values of some of the Fund’s foreign investments may change on days when investors cannot purchase or redeem Fund shares.
Various inputs determine how the Fund’s investments are valued, all of which are categorized according to the three broad levels (Level 1, 2, or 3) detailed in the Schedule of Investments and referred to herein as the “fair value hierarchy” in accordance with FASB ASC Topic 820 - Fair Value Measurements and Disclosures.
Common or preferred stocks, exchange-traded funds and derivative instruments, if applicable, that are traded on a national securities exchange are valued at the last sale price as of the close of trading on the applicable exchange where the security principally trades. Securities traded via NASDAQ are valued at the NASDAQ official closing price. To the extent these securities are valued at the last sale price or NASDAQ official closing price, they are classified as Level 1 in the fair value hierarchy. In the event that no sale or official closing price on valuation date exists, these securities are generally valued at the mean between the last reported bid and ask prices, or at the last bid price in the absence of an ask price. These securities are classified as Level 2 in the fair value hierarchy.
Investments in open-end funds (other than exchange-traded funds) are valued at their net asset values as of the close of the NYSE on the date of valuation. These securities are classified as Level 1 in the fair value hierarchy since they may be purchased or sold at their net asset values on the date of valuation.
Fixed income securities traded in the OTC market are generally classified as Level 2 in the fair value hierarchy. Such fixed income securities are typically valued using the market approach which generally involves obtaining data from an approved independent third-party vendor source. The Fund utilizes the market approach as the primary method to value securities when market prices of identical or comparable instruments are available. The third-party vendors’ valuation techniques used to derive the evaluated bid price are based on evaluating observable inputs, including but not limited to, yield curves, yield spreads, credit ratings, deal terms, tranche level attributes, default rates, cash flows, prepayment speeds, broker/dealer quotations and reported trades. Certain Level 3 securities are also valued using the market approach when obtaining a single broker quote or when utilizing transaction prices for identical securities that have been used in excess of five business days. During the reporting period, there were no changes to report with respect to the valuation approach and/or valuation techniques discussed above.
OTC and centrally cleared derivative instruments are generally classified as Level 2 in the fair value hierarchy. Such derivative instruments are typically valued using the market approach and/or income approach which generally involves obtaining data from an approved independent third-party vendor source. The Fund utilizes the market approach
PGIM International Bond Fund 63
Notes to Financial Statements (continued)
when quoted prices in broker-dealer markets are available but also includes consideration of alternative valuation approaches, including the income approach. In the absence of reliable market quotations, the income approach is typically utilized for purposes of valuing derivatives such as interest rate swaps based on a discounted cash flow analysis whereby the value of the instrument is equal to the present value of its future cash inflows or outflows. Such analysis includes projecting future cash flows and determining the discount rate (including the present value factors that affect the discount rate) used to discount the future cash flows. In addition, the third-party vendors’ valuation techniques used to derive the evaluated derivative price is based on evaluating observable inputs, including but not limited to, underlying asset prices, indices, spreads, interest rates and exchange rates. Certain derivatives may be classified as Level 3 when valued using the market approach by obtaining a single broker quote or when utilizing unobservable inputs in the income approach. During the reporting period, there were no changes to report with respect to the valuation approach and/or valuation techniques discussed above.
Securities and other assets that cannot be priced according to the methods described above are valued based on pricing methodologies approved by the Board. In the event that unobservable inputs are used when determining such valuations, the securities will be classified as Level 3 in the fair value hierarchy. Altering one or more unobservable inputs may result in a significant change to a Level 3 security’s fair value measurement.
When determining the fair value of securities, some of the factors influencing the valuation include: the nature of any restrictions on disposition of the securities; assessment of the general liquidity of the securities; the issuer’s financial condition and the markets in which it does business; the cost of the investment; the size of the holding and the capitalization of the issuer; the prices of any recent transactions or bids/offers for such securities or any comparable securities; any available analyst media or other reports or information deemed reliable by the Manager regarding the issuer or the markets or industry in which it operates. Using fair value to price securities may result in a value that is different from a security’s most recent closing price and from the price used by other unaffiliated mutual funds to calculate their net asset values.
Foreign Currency Translation: The books and records of the Fund are maintained in U.S. dollars. Foreign currency amounts are translated into U.S. dollars on the following basis:
(i) market value of investment securities, other assets and liabilities — at the exchange rate as of the valuation date;
(ii) purchases and sales of investment securities, income and expenses — at the rates of exchange prevailing on the respective dates of such transactions.
64
Although the net assets of the Fund are presented at the foreign exchange rates and market values at the close of the period, the Fund does not generally isolate that portion of the results of operations arising as a result of changes in the foreign exchange rates from the fluctuations arising from changes in the market prices of long-term portfolio securities held at the end of the period. Similarly, the Fund does not isolate the effect of changes in foreign exchange rates from the fluctuations arising from changes in the market prices of long-term portfolio securities sold during the period. Accordingly, holding period unrealized and realized foreign currency gains (losses) are included in the reported Net change in unrealized appreciation (depreciation) on investments and Net realized gains (losses) on investment transactions on the Statements of Operations. Notwithstanding the above, the Fund does isolate the effect of fluctuations in foreign currency exchange rates when determining the gain (loss) upon the sale or maturity of foreign currency denominated debt obligations; such amounts are included in net realized gains (losses) on foreign currency transactions.
Additionally, net realized gains (losses) on foreign currency transactions represent net foreign exchange gains (losses) from the disposition of holdings of foreign currencies, currency gains (losses) realized between the trade and settlement dates on investment transactions, and the difference between the amounts of interest, dividends and foreign withholding taxes recorded on the Fund’s books and the U.S. dollar equivalent amounts actually received or paid. Net unrealized currency gains (losses) arise from valuing foreign currency denominated assets and liabilities (other than investments) at period end exchange rates.
Forward and Cross Currency Contracts: A forward currency contract is a commitment to purchase or sell a foreign currency at a future date at a negotiated forward rate. The Fund enters into forward currency contracts, as defined in the prospectus, in order to hedge its exposure to changes in foreign currency exchange rates on its foreign portfolio holdings or on specific receivables and payables denominated in a foreign currency and to gain exposure to certain currencies. The contracts are valued daily at current forward exchange rates and any unrealized gain (loss) is included in net unrealized appreciation or depreciation on forward and cross currency contracts. Gain (loss) is realized on the settlement date of the contract equal to the difference between the settlement value of the original and negotiated forward contracts. This gain (loss), if any, is included in net realized gain (loss) on forward and cross currency contract transactions. Risks may arise upon entering into these contracts from the potential inability of the counterparties to meet the terms of their contracts. Forward currency contracts involve risks from currency exchange rate and credit risk in excess of the amounts reflected on the Statement of Assets and Liabilities. The Fund’s maximum risk of loss from counterparty credit risk is the net value of the cash flows to be received from the counterparty at the end of the contract’s life. A cross currency contract is a forward contract where a specified amount of one foreign currency will be exchanged for a specified amount of another foreign currency.
Options: The Fund purchased and/or wrote options in order to hedge against adverse market movements or fluctuations in value caused by changes in prevailing interest rates,
PGIM International Bond Fund 65
Notes to Financial Statements (continued)
value of equities or foreign currency exchange rates with respect to securities or financial instruments which the Fund currently owns or intends to purchase. The Fund may also use options to gain additional market exposure. The Fund’s principal reason for writing options is to realize, through receipt of premiums, a greater current return than would be realized on the underlying security alone. When the Fund purchases an option, it pays a premium and an amount equal to that premium is recorded as an asset. When the Fund writes an option, it receives a premium and an amount equal to that premium is recorded as a liability. The asset or liability is adjusted daily to reflect the current market value of the option. If an option expires unexercised, the Fund realizes a gain (loss) to the extent of the premium received or paid. If an option is exercised, the premium received or paid is recorded as an adjustment to the proceeds from the sale or the cost of the purchase in determining whether the Fund has realized a gain (loss). The difference between the premium and the amount received or paid at the closing of a purchase or sale transaction is also treated as a realized gain (loss). Gain (loss) on purchased options is included in net realized gain (loss) on investment transactions. Gain (loss) on written options is presented separately as net realized gain (loss) on options written transactions.
The Fund, as writer of an option, may have no control over whether the underlying securities or financial instruments may be sold (called) or purchased (put). As a result, the Fund bears the market risk of an unfavorable change in the price of the security or financial instrument underlying the written option. The Fund, as purchaser of an OTC option, bears the risk of the potential inability of the counterparties to meet the terms of their contracts. With exchange-traded options contracts, there is minimal counterparty credit risk to the Fund since the exchanges’ clearinghouse acts as counterparty to all exchange-traded options and guarantees the options contracts against default.
When the Fund writes an option on a swap, an amount equal to any premium received by the Fund is recorded as a liability and is subsequently adjusted to the current market value of the written option on the swap. If a call option on a swap is exercised, the Fund becomes obligated to pay a fixed interest rate (noted as the strike price) and receive a variable interest rate on a notional amount. If a put option on a swap is exercised, the Fund becomes obligated to pay a variable interest rate and receive a fixed interest rate (noted as the strike price) on a notional amount. Premiums received from writing options on swaps that expire or are exercised are treated as realized gains upon the expiration or exercise of such options on swaps. The risk associated with writing put and call options on swaps is that the Fund will be obligated to be party to a swap agreement if an option on a swap is exercised.
Financial Futures Contracts: A financial futures contract is an agreement to purchase (long) or sell (short) an agreed amount of securities at a set price for delivery on a future date. Upon entering into a financial futures contract, the Fund is required to pledge to the broker an amount of cash and/or other assets equal to a certain percentage of the contract amount.
66
This amount is known as the “initial margin.” Subsequent payments, known as “variation margin,” are made or received by the Fund each day, depending on the daily fluctuations in the value of the underlying security. Such variation margin is recorded for financial statement purposes on a daily basis as unrealized gain (loss). When the contract expires or is closed, the gain (loss) is realized and is presented in the Statement of Operations as net realized gain (loss) on futures transactions.
The Fund invested in financial futures contracts in order to hedge its existing portfolio securities, or securities the Fund intends to purchase, against fluctuations in value caused by changes in prevailing interest rates. Should interest rates move unexpectedly, the Fund may not achieve the anticipated benefits of the financial futures contracts and may realize a loss. The use of futures transactions involves the risk of imperfect correlation in movements in the price of futures contracts, interest rates and the underlying hedged assets. Since futures contracts are exchange-traded, there is minimal counterparty credit risk to the Fund since the exchanges’ clearinghouse acts as counterparty to all exchange-traded futures and guarantees the futures contracts against default.
Swap Agreements: The Fund entered into certain types of swap agreements detailed in the disclosures below. A swap agreement is an agreement to exchange the return generated by one instrument for the return generated by another instrument. Swap agreements are negotiated in the OTC market and may be executed either directly with a counterparty (“OTC-traded”) or through a central clearing facility, such as a registered exchange. Swap agreements are valued daily at current market value and any change in value is included in the net unrealized appreciation or depreciation on swap agreements. Centrally cleared swaps pay or receive an amount known as “variation margin”, based on daily changes in the valuation of the swap contract. For OTC-traded, upfront premiums paid and received are shown as swap premiums paid and swap premiums received in the Statement of Assets and Liabilities. Risk of loss may exceed amounts recognized on the Statement of Assets and Liabilities. Swap agreements outstanding at period end, if any, are listed on the Schedule of Investments.
Interest Rate Swaps: Interest rate swaps represent an agreement between counterparties to exchange cash flows based on the difference between two interest rates, applied to a notional principal amount for a specified period. The Fund is subject to interest rate risk exposure in the normal course of pursuing its investment objective. The Fund used interest rate swaps to maintain its ability to generate steady cash flow by receiving a stream of fixed rate payments or to increase exposure to prevailing market rates by receiving floating rate payments. The Fund’s maximum risk of loss from counterparty credit risk is the discounted net present value of the cash flows to be received from the counterparty over the contract’s remaining life.
Inflation Swaps: The Fund entered into inflation swap agreements to protect against fluctuations in inflation rates. Inflation swaps are characterized by one party paying a fixed
PGIM International Bond Fund 67
Notes to Financial Statements (continued)
rate in exchange for a floating rate that is derived from an inflation index, such as the Consumer Price Index or UK Retail Price Index. Inflation swaps subject the Fund to interest rate risk.
Credit Default Swaps (“CDS”): CDS involve one party (the protection buyer) making a stream of payments to another party (the protection seller) in exchange for the right to receive a specified payment in the event of a default or as a result of a default (collectively a “credit event”) for the referenced entity (typically corporate issues or sovereign issues of an emerging country) on its obligation; or in the event of a write-down, principal shortfall, interest shortfall or default of all or part of the referenced entities comprising a credit index.
The Fund is subject to credit risk in the normal course of pursuing its investment objectives, and as such, has entered into CDS contracts to provide a measure of protection against defaults or to take an active long or short position with respect to the likelihood of a particular issuer’s default or the reference entity’s credit soundness. CDS contracts generally trade based on a spread which represents the cost a protection buyer has to pay the protection seller. The protection buyer is said to be short the credit as the value of the contract rises the more the credit deteriorates. The value of the CDS contract increases for the protection buyer if the spread increases. The Fund’s maximum risk of loss from counterparty credit risk for purchased CDS is the inability of the counterparty to honor the contract up to the notional value due to a credit event.
As a seller of protection on credit default swap agreements, the Fund generally receives an agreed upon payment from the buyer of protection throughout the term of the swap, provided no credit event occurs. As the seller, the Fund effectively increases its investment risk because, in addition to its total net assets, the Fund may be subject to investment exposure on the notional amount of the swap.
The maximum amount of the payment that the Fund, as a seller of protection, could be required to make under a credit default swap agreement would be equal to the notional amount of the underlying security or index contract as a result of a credit event. This potential amount will be partially offset by any recovery values of the respective referenced obligations, or net amounts received from the settlement of buy protection credit default swap agreements which the Fund entered into for the same referenced entity or index. As a buyer of protection, the Fund generally receives an amount up to the notional value of the swap if a credit event occurs.
Implied credit spreads, represented in absolute terms, utilized in determining the market value of credit default swap agreements where the Fund is the seller of protection as of period end are disclosed in the footnotes to the Schedule of Investments, if applicable. These spreads serve as indicators of the current status of the payment/performance risk and
68
represent the likelihood of default risk for the credit derivative. The implied credit spread of a particular referenced entity reflects the cost of buying/selling protection and may include upfront payments required to enter into the agreement. Wider credit spreads and increased market value in absolute terms, when compared to the notional amount of the swap, represent a deterioration of the referenced entity’s credit soundness and a greater likelihood of risk of default or other credit event occurring as defined under the terms of the agreement.
Currency Swaps: The Fund entered into currency swap agreements primarily to gain yield exposure on foreign bonds. Currency swap agreements involve two parties exchanging two different currencies with an agreement to reverse the exchange at a later date at specified exchange rates.
Mortgage-Backed and Asset-Backed Securities: Mortgage-backed securities are pass-through securities, meaning that principal and interest payments made by the borrower on the underlying mortgages are passed through to the Fund. Asset-backed securities directly or indirectly represent a participation interest in, or are secured by and payable from, a stream of payments generated by particular assets such as motor vehicle or credit card receivables. Asset-backed securities may be classified as pass-through certificates or collateralized obligations, such as collateralized bond obligations, collateralized loan obligations and other similarly structured securities. The value of mortgage-backed and asset-backed securities varies with changes in interest rates and may be affected by changes in credit quality or value of the mortgage loans or other assets that support the securities.
Stripped mortgage-backed securities are usually structured with two classes that receive different proportions of the interest (“IO”) and principal (“PO”) distributions on a pool of mortgage assets. Payments received for IOs are included in interest income on the Statements of Operations. Because no principal will be received at the maturity of an IO, adjustments are made to the cost of the security on a monthly basis until maturity. These adjustments are included in interest income on the Statements of Operations. Payments received for POs are treated as reductions to the cost and par value of the securities.
Master Netting Arrangements: The RIC, on behalf of the Fund, is subject to various Master Agreements, or netting arrangements, with select counterparties. These are agreements which a subadviser may have negotiated and entered into on behalf of all or a portion of the Fund. A master netting arrangement between the Fund and the counterparty permits the Fund to offset amounts payable by the Fund to the same counterparty against amounts to be received; and by the receipt of collateral from the counterparty by the Fund to cover the Fund’s exposure to the counterparty. However, there is no assurance that such mitigating factors are easily enforceable. In addition to master netting arrangements, the right to set-off exists when all the conditions are met such that each of the parties owes the other determinable amounts, the reporting party has the right to set-off the amount owed with the amount owed by the other party, the reporting party intends to set-off and the right of set-off is enforceable by law.
PGIM International Bond Fund 69
Notes to Financial Statements (continued)
The RIC, on behalf of the Fund, is a party to International Swaps and Derivatives Association, Inc. (“ISDA”) Master Agreements with certain counterparties that govern OTC derivative and foreign exchange contracts entered into from time to time. The Master Agreements may contain provisions regarding, among other things, the parties’ general obligations, representations, agreements, collateral requirements, events of default and early termination. With respect to certain counterparties, in accordance with the terms of the Master Agreements, collateral posted to the Fund is held in a segregated account by the Fund’s custodian and with respect to those amounts which can be sold or re-pledged, is presented in the Schedule of Investments. Collateral pledged by the Fund is segregated by the Fund’s custodian and identified in the Schedule of Investments. Collateral can be in the form of cash or debt securities issued by the U.S. Government or related agencies or other securities as agreed to by the Fund and the applicable counterparty. Collateral requirements are determined based on the Fund’s net position with each counterparty. Termination events applicable to the Fund may occur upon a decline in the Fund’s net assets below a specified threshold over a certain period of time. Termination events applicable to counterparties may occur upon a decline in the counterparty’s long-term and short-term credit ratings below a specified level. In each case, upon occurrence, the other party may elect to terminate early and cause settlement of all derivative and foreign exchange contracts outstanding, including the payment of any losses and costs resulting from such early termination, as reasonably determined by the terminating party. Any decision by one or more of the Fund’s counterparties to elect early termination could impact the Fund’s future derivative activity.
In addition to each instrument’s primary underlying risk exposure (e.g. interest rate, credit, equity or foreign exchange, etc.), swap agreements involve, to varying degrees, elements of credit, market and documentation risk. Such risks involve the possibility that no liquid market for these agreements will exist, the counterparty to the agreement may default on its obligation to perform or disagree on the contractual terms of the agreement, and changes in net interest rates will be unfavorable. In connection with these agreements, securities in the portfolio may be identified or received as collateral from the counterparty in accordance with the terms of the respective swap agreements to provide or receive assets of value and to serve as recourse in the event of default or bankruptcy/insolvency of either party. Such OTC derivative agreements include conditions which, when materialized, give the counterparty the right to cause an early termination of the transactions under those agreements. Any election by the counterparty for early termination of the contract(s) may impact the amounts reported on financial statements.
Short sales and OTC contracts, including forward foreign currency exchange contracts, swaps, forward rate agreements and written options involve elements of both market and credit risk in excess of the amounts reflected on the Statement of Assets and Liabilities, if applicable. Such risks may be mitigated by engaging in master netting arrangements.
70
Payment-In-Kind: The Fund invested in the open market or received pursuant to debt restructuring, securities that pay-in-kind (PIK) the interest due on such debt instruments. The PIK interest, computed at the contractual rate specified, is added to the existing principal balance of the debt when issued bonds have same terms as the bond or recorded as a separate bond when terms are different from the existing debt, and is recorded as interest income.
Securities Transactions and Net Investment Income: Securities transactions are recorded on the trade date. Realized gains (losses) from investment and currency transactions are calculated on the specific identification method. Dividend income is recorded on the ex-date, or for certain foreign securities, when the Fund becomes aware of such dividends. Interest income, including amortization of premium and accretion of discount on debt securities, as required, is recorded on the accrual basis. Expenses are recorded on an accrual basis, which may require the use of certain estimates by management that may differ from actual. Net investment income or loss (other than class specific expenses and waivers, which are allocated as noted below) and unrealized and realized gains (losses) are allocated daily to each class of shares based upon the relative proportion of adjusted net assets of each class at the beginning of the day. Class specific expenses and waivers, where applicable, are charged to the respective share classes. Such class specific expenses and waivers include distribution fees and distribution fee waivers, shareholder servicing fees, transfer agent’s fees and expenses, registration fees and fee waivers and/or expense reimbursements, as applicable.
Taxes: It is the Fund’s policy to continue to meet the requirements of the Internal Revenue Code applicable to regulated investment companies and to distribute all of its taxable net investment income and capital gains, if any, to its shareholders. Therefore, no federal income tax provision is required. Withholding taxes on foreign dividends, interest and capital gains, if any, are recorded, net of reclaimable amounts, at the time the related income is earned.
Dividends and Distributions: The Fund expects to declare dividends of its net investment income daily and pay such dividends monthly. Distributions of net realized capital and currency gains, if any, are declared and paid at least annually. Dividends and distributions to shareholders, which are determined in accordance with federal income tax regulations and which may differ from GAAP, are recorded on the ex-date. Permanent book/tax differences relating to income and gain (loss) are reclassified between total distributable earnings (loss) and paid-in capital in excess of par, as appropriate.
Estimates: The preparation of financial statements requires management to make estimates and assumptions that affect the reported amounts and disclosures in the financial statements. Actual results could differ from those estimates.
PGIM International Bond Fund 71
Notes to Financial Statements (continued)
The RIC, on behalf of the Fund, has a management agreement with the Manager. Pursuant to this agreement, the Manager has responsibility for all investment advisory services and supervises the subadviser’s performance of such services.
The Manager has entered into a subadvisory agreement with PGIM, Inc., which provides subadvisory services to the Fund through its business unit PGIM Fixed Income, and PGIM Limited (collectively referred to herein as the “subadviser). The Manager pays for the services of the subadviser.
The management fee paid to the Manager is accrued daily and payable monthly at an annual rate of 0.50% of the Fund’s average daily net assets up to $2 billion and 0.485% of such assets in excess of $2 billion. The effective management fee rate before any waivers and/or expense reimbursements was 0.50% for the year ended October 31, 2021.
The Manager has contractually agreed, through February 28, 2023, to limit total annual operating expenses after fee waivers and/or expense reimbursements to 0.99% of average daily net assets for Class A shares, 1.74% of average daily net assets for Class C shares, 0.63% of average daily net assets for Class Z shares and 0.58% of average daily net assets for Class R6 shares. This contractual waiver excludes interest, brokerage, taxes (such as income and foreign withholding taxes, stamp duty and deferred tax expenses), acquired fund fees and expenses, extraordinary expenses, and certain other Fund expenses such as dividend and interest expense and broker charges on short sales.
Where applicable, the Manager agrees to waive management fees or shared operating expenses on any share class to the same extent that it waives such expenses on any other share class. In addition, total annual operating expenses for Class R6 shares will not exceed total annual operating expenses for Class Z shares. Fees and/or expenses waived and/or reimbursed by the Manager may be recouped by the Manager within the same fiscal year during which such waiver and/or reimbursement is made if such recoupment can be realized without exceeding the expense limit in effect at the time of the recoupment for the fiscal year.
The RIC, on behalf of the Fund, has a distribution agreement with Prudential Investment Management Services LLC (”PIMS“), which acts as the distributor of the Class A, Class C, Class Z and Class R6 shares of the Fund. The Fund compensates PIMS for distributing and servicing the Fund’s Class A and Class C shares, pursuant to the plans of distribution (the “Distribution Plans”), regardless of expenses actually incurred by PIMS.
Pursuant to the Distribution Plans, the Fund compensates PIMS for distribution related activities at an annual rate of up to 0.25% and 1% of the average daily net assets of the
72
Class A and Class C shares, respectively. The distribution fees are accrued daily and payable monthly. No distribution or service fees are paid to PIMS as distributor of the Class Z or Class R6 shares of the Fund.
For the year ended October 31, 2021, PIMS received $458 in front-end sales charges resulting from sales of Class A shares. Additionally, for the year ended October 31, 2021, PIMS did not receive any contingent deferred sales charges imposed upon redemptions by certain Class A and Class C shareholders, respectively. From these fees, PIMS paid such sales charges to broker-dealers, who in turn paid commissions to salespersons and incurred other distribution costs.
PGIM Investments, PGIM, Inc., PGIM Limited and PIMS are indirect, wholly-owned subsidiaries of Prudential Financial, Inc. (“Prudential”).
| 4. | Other Transactions with Affiliates |
Prudential Mutual Fund Services LLC (“PMFS”), an affiliate of PGIM Investments and an indirect, wholly-owned subsidiary of Prudential, serves as the Fund’s transfer agent. Transfer agent’s fees and expenses in the Statement of Operations include certain out-of-pocket expenses paid to non-affiliates, where applicable.
The Fund may invest its overnight sweep cash in the PGIM Core Ultra Short Bond Fund (the “Core Fund”), a fund of Prudential Investment Portfolios 2, registered under the 1940 Act and managed by PGIM Investments. PGIM Investments and/or its affiliates are paid fees or reimbursed for providing their services to the Core Fund. In addition to the realized and unrealized gains on investments in the Core Fund, earnings from such investments are disclosed on the Statement of Operations as “Affiliated dividend income”.
The Fund may enter into certain securities purchase or sale transactions under Board approved Rule 17a-7 procedures. Rule 17a-7 is an exemptive rule under the 1940 Act, that subject to certain conditions, permits purchase and sale transactions among affiliated investment companies, or between an investment company and a person that is affiliated solely by reason of having a common (or affiliated) investment adviser, common directors/trustees, and/or common officers. For the year ended October 31, 2021, no 17a-7 transactions were entered into by the Fund.
The aggregate cost of purchases and proceeds from sales of portfolio securities (excluding short-term investments and U.S. Government securities) for the year ended October 31, 2021, were $10,648,796 and $22,916,769, respectively.
A summary of the cost of purchases and proceeds from sales of shares of an affiliated mutual fund for the year ended October 31, 2021, is presented as follows:
PGIM International Bond Fund 73
Notes to Financial Statements (continued)
| | | | | | | | | | | | | | | | | | | | | | | | | | | | | | | | | | | | | | | | | | | | | | | | | | | | | | | | | | | | | | | | | | | | | | |
Value,
Beginning of Year | | | Cost of Purchases | | | Proceeds
from Sales | | | Change in Unrealized Gain (Loss) | | | Realized Gain (Loss) | | | Value, End of Year | | | Shares,
End
of Year | | | Income | |
| | | | | | | | | | | | | | | | | | | | | | | |
| | | | | | | | |
| | Short-Term Investments - Affiliated Mutual Fund: | | | | | | | | | | | | | | | | | | | | | | | | | | | | | | | | | |
| | | | | | | | |
| | PGIM Core Ultra Short Bond Fund (1)(wb) | | | | | | | | | | | | | | | | | | | | | | | | | | | | | | | | | |
| $ | 2,608,423 | | | | | | | $ | 16,463,989 | | | | | | | $ | 19,041,543 | | | | | | | $ | — | | | | | | | | | | | $ | — | | | | | | | | | | | $ | 30,869 | | | | | | | | 30,869 | | | | | | | $ | 987 | | | | | |
| | | | | | | | | | | | | | | | | | | | | | | | | | | | | | | | | | | | | | | | | | | | | | | | | | | | | | | | | | | | | | | | | | | | | | |
| (1) | The Fund did not have any capital gain distributions during the reporting period. |
| (wb) | PGIM Investments LLC, the manager of the Fund, also serves as manager of the PGIM Core Ultra Short Bond Fund. |
| 6. | Distributions and Tax Information |
Distributions to shareholders, which are determined in accordance with federal income tax regulations and which may differ from GAAP, are recorded on the ex-date.
For the year ended October 31, 2021, the tax character of dividends paid by the Fund was $1,312,326 of ordinary income. For the year ended October 31, 2020, the tax character of dividends paid by the Fund were $2,448,226 of ordinary income, $122,527 of long-term capital gains and $1,005,954 of tax return of capital.
As of October 31, 2021, the accumulated undistributed earnings on a tax basis was $654,548 of ordinary income.
The United States federal income tax basis of the Fund’s investments and the net unrealized appreciation as of October 31, 2021 were as follows:
| | | | | | |
| Tax Basis | | Gross Unrealized Appreciation | | Gross Unrealized Depreciation | | Net Unrealized Appreciation |
$33,577,189 | | $3,570,970 | | $(3,274,489) | | $296,481 |
The differences between GAAP and tax basis were primarily attributable to forward foreign currency exchange contracts, straddles, premium on bonds and other cost basis differences between financial and tax accounting.
For federal income tax purposes, the Fund had a capital loss carryforward as of October 31, 2021 of approximately $671,000 which can be carried forward for an unlimited period. The Fund utilized approximately $909,000 of its capital loss carryforward to offset net taxable gains realized in the fiscal year ended October 31, 2021. No capital gains distributions are expected to be paid to shareholders until net gains have been realized in excess of such losses.
74
The Manager has analyzed the Fund’s tax positions taken on federal, state and local income tax returns for all open tax years and has concluded that no provision for income tax is required in the Fund’s financial statements for the current reporting period. Since tax authorities can examine previously filed tax returns, the Fund’s U.S. federal and state tax returns for each of the four fiscal years up to the most recent fiscal year ended October 31, 2021 are subject to such review.
The Fund offers Class A, Class C, Class Z and Class R6 shares. Class A shares are sold with a maximum front-end sales charge of 3.25%. Investors who purchase $500,000 or more of Class A shares and sell those shares within 12 months of purchase are subject to a contingent deferred sales charge (“CDSC”) of 1.00% on sales although these purchases are not subject to a front-end sales charge. The Class A CDSC is waived for certain retirement and/or benefit plans. A special exchange privilege is also available for shareholders who qualified to purchase Class A shares at net asset value. Class C shares are sold with a CDSC of 1% on sales made within 12 months of purchase. Class C shares will automatically convert to Class A shares on a monthly basis approximately eight years (ten years prior to January 22, 2021) after purchase. Class Z and Class R6 shares are not subject to any sales or redemption charges and are available exclusively for sale to a limited group of investors.
Under certain circumstances, an exchange may be made from specified share classes of the Fund to one or more other share classes of the Fund as presented in the table of transactions in shares of beneficial interest, below.
The RIC has authorized an unlimited number of shares of beneficial interest of the Fund at $0.001 par value per share, currently divided into four classes, designated Class A, Class C, Class Z and Class R6.
As of October 31, 2021, Prudential, through its affiliated entities, including affiliated funds (if applicable), owned shares of the Fund as follows:
| | | | |
| | | Number of Shares | | Percentage of Outstanding Shares |
Class C | | 1,249 | | 12.6% |
Class R6 | | 3,287,950 | | 99.6% |
At the reporting period end, the number of shareholders holding greater than 5% of the Fund are as follows:
| | | | | | |
| Affiliated | | Unaffiliated |
Number of Shareholders | | Percentage of Outstanding Shares | | Number of Shareholders | | Percentage of Outstanding Shares |
1 | | 91.3% | | — | | —% |
PGIM International Bond Fund 75
Notes to Financial Statements (continued)
Transactions in shares of beneficial interest were as follows:
| | | | | | | | | | |
Class A | | Shares | | | | | Amount | |
| | | |
Year ended October 31, 2021: | | | | | | | | | | |
| | | |
Shares sold | | | 21,689 | | | | | $ | 223,463 | |
Shares issued in reinvestment of dividends and distributions | | | 1,136 | | | | | | 11,418 | |
Shares purchased | | | (45,960 | ) | | | | | (468,504 | ) |
| | | | | | | | | | |
| | | |
Net increase (decrease) in shares outstanding | | | (23,135 | ) | | | | $ | (233,623 | ) |
| | | | | | | | | | |
| | | |
Year ended October 31, 2020: | | | | | | | | | | |
Shares sold | | | 65,742 | | | | | $ | 672,165 | |
Shares issued in reinvestment of dividends and distributions | | | 2,691 | | | | | | 27,494 | |
Shares purchased | | | (41,452 | ) | | | | | (410,400 | ) |
| | | | | | | | | | |
| | | |
Net increase (decrease) in shares outstanding | | | 26,981 | | | | | $ | 289,259 | |
| | | | | | | | | | |
Class C | | | | | | | | | | |
| | | |
Year ended October 31, 2021: | | | | | | | | | | |
Shares issued in reinvestment of dividends and distributions | | | 532 | | | | | $ | 5,336 | |
Shares purchased | | | (12,035 | ) | | | | | (119,657 | ) |
| | | | | | | | | | |
| | | |
Net increase (decrease) in shares outstanding before conversion | | | (11,503 | ) | | | | | (114,321 | ) |
Shares purchased upon conversion into other share class(es) | | | (9,268 | ) | | | | | (92,894 | ) |
| | | | | | | | | | |
| | | |
Net increase (decrease) in shares outstanding | | | (20,771 | ) | | | | $ | (207,215 | ) |
| | | | | | | | | | |
| | | |
Year ended October 31, 2020: | | | | | | | | | | |
Shares sold | | | 26,752 | | | | | $ | 271,956 | |
Shares issued in reinvestment of dividends and distributions | | | 843 | | | | | | 8,536 | |
Shares purchased | | | (1,108 | ) | | | | | (10,959 | ) |
| | | | | | | | | | |
| | | |
Net increase (decrease) in shares outstanding | | | 26,487 | | | | | $ | 269,533 | |
| | | | | | | | | | |
Class Z | | | | | | | | | | |
| | | |
Year ended October 31, 2021: | | | | | | | | | | |
Shares sold | | | 203,980 | | | | | $ | 2,083,183 | |
Shares issued in reinvestment of dividends and distributions | | | 21,985 | | | | | | 221,149 | |
Shares purchased | | | (1,559,263 | ) | | | | | (15,844,416 | ) |
| | | | | | | | | | |
| | | |
Net increase (decrease) in shares outstanding before conversion | | | (1,333,298 | ) | | | | | (13,540,084 | ) |
Shares issued upon conversion from other share class(es) | | | 6,534 | | | | | | 65,645 | |
| | | | | | | | | | |
| | | |
Net increase (decrease) in shares outstanding | | | (1,326,764 | ) | | | | $ | (13,474,439 | ) |
| | | | | | | | | | |
| | | |
Year ended October 31, 2020: | | | | | | | | | | |
Shares sold | | | 2,113,296 | | | | | $ | 21,478,375 | |
Shares issued in reinvestment of dividends and distributions | | | 59,329 | | | | | | 602,980 | |
Shares purchased | | | (902,952 | ) | | | | | (8,900,228 | ) |
| | | | | | | | | | |
| | | |
Net increase (decrease) in shares outstanding | | | 1,269,673 | | | | | $ | 13,181,127 | |
| | | | | | | | | | |
76
| | | | | | | | | | |
Class R6 | | Shares | | | | | Amount | |
| | | |
Year ended October 31, 2021: | | | | | | | | | | |
Shares sold | | | 4,585 | | | | | $ | 45,097 | |
Shares issued in reinvestment of dividends and distributions | | | 107,453 | | | | | | 1,074,109 | |
Shares purchased | | | (518 | ) | | | | | (5,107 | ) |
| | | | | | | | | | |
| | | |
Net increase (decrease) in shares outstanding before conversion | | | 111,520 | | | | | | 1,114,099 | |
Shares issued upon conversion from other share class(es) | | | 2,733 | | | | | | 27,249 | |
| | | | | | | | | | |
| | | |
Net increase (decrease) in shares outstanding | | | 114,253 | | | | | $ | 1,141,348 | |
| | | | | | | | | | |
Year ended October 31, 2020: | | | | | | | | | | |
Shares sold | | | 4,643 | | | | | $ | 47,060 | |
Shares issued in reinvestment of dividends and distributions | | | 286,988 | | | | | | 2,936,877 | |
Shares purchased | | | (5,688 | ) | | | | | (57,665 | ) |
| | | | | | | | | | |
| | | |
Net increase (decrease) in shares outstanding | | | 285,943 | | | | | $ | 2,926,272 | |
| | | | | | | | | | |
The RIC, on behalf of the Fund, along with other affiliated registered investment companies (the “Participating Funds”), is a party to a Syndicated Credit Agreement (“SCA”) with a group of banks. The purpose of the SCA is to provide an alternative source of temporary funding for capital share redemptions. The table below provides details of the current SCA in effect at the reporting period-end as well as the prior SCA.
| | | | |
| | | Current SCA | | Prior SCA |
Term of Commitment | | 10/1/2021 – 9/29/2022 | | 10/2/2020 – 9/30/2021 |
Total Commitment | | $ 1,200,000,000 | | $ 1,200,000,000 |
Annualized Commitment Fee on the Unused Portion of the SCA | | 0.15% | | 0.15% |
Annualized Interest Rate on Borrowings | | 1.20% plus the higher of (1) the effective federal funds rate, (2) the one-month LIBOR rate or (3) zero percent | | 1.30% plus the higher of (1) the effective federal funds rate, (2) the one-month LIBOR rate or (3) zero percent |
Certain affiliated registered investment companies that are parties to the SCA include portfolios that are subject to a predetermined mathematical formula used to manage certain benefit guarantees offered under variable annuity contracts. The formula may result in large scale asset flows into and out of these portfolios. Consequently, these portfolios may be more likely to utilize the SCA for purposes of funding redemptions. It may be possible for those portfolios to fully exhaust the committed amount of the SCA, thereby requiring the Manager to allocate available funding per a Board-approved methodology designed to treat the Participating Funds in the SCA equitably.
The Fund utilized the SCA during the year ended October 31, 2021. The average daily balance for the 18 days that the Fund had loans outstanding during the period was approximately $2,038,722, borrowed at a weighted average interest rate of 1.44%. The maximum loan outstanding amount during the period was $7,013,000. At October 31, 2021, the Fund did not have an outstanding loan amount.
PGIM International Bond Fund 77
Notes to Financial Statements (continued)
| 9. | Risks of Investing in the Fund |
The Fund’s risks include, but are not limited to, some or all of the risks discussed below. For further information on the Fund’s risks, please refer to the Fund’s Prospectus and Statement of Additional Information.
Credit Risk: This is the risk that the issuer, the guarantor or the insurer of a fixed income security, or the counterparty to a contract, may be unable or unwilling to make timely principal and interest payments, or to otherwise honor its obligations. Additionally, fixed income securities could lose value due to a loss of confidence in the ability of the issuer, guarantor, insurer or counterparty to pay back debt. The longer the maturity and the lower the credit quality of a bond, the more sensitive it is to credit risk.
Credit Risk/Counterparty Risk: The ability, or perceived ability, of the issuer or guarantor of a debt security, or the counterparty (the party on the other side of the transaction) to a derivatives contract or other financial contract to meet its financial obligations will affect the value of the security or derivative. Counterparty and credit risk are especially important in the context of privately negotiated instruments. The Fund expects to enter into certain privately negotiated agreements where the counterparty assumes the physical settlement obligations of the Fund under such transactions. Under this type of arrangement, there is a risk that the relevant counterparty or intermediary would, due to insolvency or other reasons, be unable to or fail to assume the physical settlement obligations of the Fund, in which case the Fund could be required to sell portfolio instruments at unfavorable times or prices or could have insufficient assets to satisfy its physical settlement obligations.
Credit ratings are intended to provide a measure of credit risk. However, credit ratings are only the opinions of the credit rating agency issuing the ratings and are not guarantees as to quality. The lower the rating of a debt security held by the Fund, the greater the degree of credit risk that is perceived to exist by the credit rating agency with respect to that security. Increasing the amount of Fund assets allocated to lower-rated securities generally will increase the credit risk to which the Fund is subject. Not all securities in which the Fund invests are rated. The longer the maturity and the lower the credit quality of a bond, the more sensitive it is to credit risk.
Currency Risk: The Fund’s net asset value could decline as a result of changes in exchange rates, which could adversely affect the Fund’s investments in currencies, or in securities that trade in, and receive revenues related to, currencies, or in derivatives that provide exposure to currencies. Certain foreign countries may impose restrictions on the ability of issuers of foreign securities to make payment of principal and interest or dividends to investors located outside the country, due to blockage of foreign currency exchanges or otherwise.
78
Debt Obligations Risk: Debt obligations are subject to credit risk, market risk and interest rate risk. The Fund’s holdings, share price, yield and total return may also fluctuate in response to bond market movements. The value of bonds may decline for issuer-related reasons, including management performance, financial leverage and reduced demand for the issuer’s goods and services. Certain types of fixed income obligations also may be subject to “call and redemption risk,” which is the risk that the issuer may call a bond held by the Fund for redemption before it matures and the Fund may lose income.
Derivatives Risk: Derivatives involve special risks and costs and may result in losses to the Fund. The successful use of derivatives requires sophisticated management, and, to the extent that derivatives are used, the Fund will depend on the subadviser’s ability to analyze and manage derivatives transactions. The prices of derivatives may move in unexpected ways, especially in abnormal market conditions. Some derivatives are “leveraged” and therefore may magnify or otherwise increase investment losses to the Fund. The Fund’s use of derivatives may also increase the amount of taxes payable by shareholders. Other risks arise from the potential inability to terminate or sell derivatives positions. A liquid secondary market may not always exist for the Fund’s derivatives positions. In fact, many over-the-counter derivative instruments will not have liquidity beyond the counterparty to the instrument. Over-the-counter derivative instruments also involve the risk that the other party will not meet its obligations to the Fund.
The U.S. Government and foreign governments have adopted (and may adopt further) regulations governing derivatives markets, including mandatory clearing of certain derivatives, margin and reporting requirements and risk exposure limitations. The ultimate impact of the regulations remains unclear. Additional regulation of derivatives may make derivatives more costly, limit their availability or utility, or otherwise adversely affect their performance or disrupt markets.
Economic and Market Events Risk: Events in the U.S. and global financial markets, including actions taken by the U.S. Federal Reserve or foreign central banks to stimulate or stabilize economic growth or the functioning of the securities markets, may at times result in unusually high market volatility, which could negatively impact performance. Relatively reduced liquidity in credit and fixed income markets could adversely affect issuers worldwide.
Emerging Markets Risk: The risks of foreign investments are greater for investments in or exposed to emerging markets. Emerging market countries typically have economic and political systems that are less fully developed, and can be expected to be less stable, than those of more developed countries. For example, the economies of such countries can be subject to rapid and unpredictable rates of inflation or deflation. Low trading volumes may result in a lack of liquidity and price volatility. Emerging market countries may have policies that restrict investment by non-U.S. investors, or that prevent non-U.S. investors from withdrawing their money at will.
PGIM International Bond Fund 79
Notes to Financial Statements (continued)
The Fund may invest in some emerging markets that subject it to risks such as those associated with illiquidity, custody of assets, different settlement and clearance procedures and asserting legal title under a developing legal and regulatory regime to a greater degree than in developed markets or even in other emerging markets.
Foreign Securities Risk: Investments in securities of non-U.S. issuers (including those denominated in U.S. dollars) may involve more risk than investing in securities of U.S. issuers. Foreign political, economic and legal systems, especially those in developing and emerging market countries, may be less stable and more volatile than in the United States. Foreign legal systems generally have fewer regulatory requirements than the U.S. legal system, particularly those of emerging markets. In general, less information is publicly available with respect to non-U.S. companies than U.S. companies. Non-U.S. companies generally are not subject to the same accounting, auditing, and financial reporting standards as are U.S. companies. Additionally, the changing value of foreign currencies and changes in exchange rates could also affect the value of the assets the Fund holds and the Fund’s performance. Certain foreign countries may impose restrictions on the ability of issuers of foreign securities to make payment of principal and interest or dividends to investors located outside the country, due to blockage of foreign currency exchanges or otherwise. Investments in emerging markets are subject to greater volatility and price declines.
In addition, the Fund’s investments in non-U.S. securities may be subject to the risks of nationalization or expropriation of assets, imposition of currency exchange controls or restrictions on the repatriation of non-U.S. currency, confiscatory taxation and adverse diplomatic developments. Special U.S. tax considerations may apply.
Futures and Forward Contracts Risk: The primary risks associated with the use of futures or forward contracts are (a) the imperfect correlation between the change in market value of the instruments held by the Fund and the price of the futures or forward contract; (b) possible lack of a liquid secondary market for a futures or forward contract and the resulting inability to close a futures or forward contract when desired; (c) losses caused by unanticipated market movements, which are potentially unlimited; (d) the failure to predict correctly the direction of securities or commodities prices, interest rates, currency exchange rates and other economic factors; and (e) the possibility that the counterparty to the futures or forward contract will default in the performance of its obligations. Additionally, not all forward contracts require a counterparty to post collateral, which may expose the Fund to greater losses in the event of a default by a counterparty.
Increase in Expenses Risk: Your actual cost of investing in the Fund may be higher than the expenses shown in the expense table in the Fund’s prospectus for a variety of reasons. For example, expense ratios may be higher than those shown if average net assets decrease.
80
Net assets are more likely to decrease and Fund expense ratios are more likely to increase when markets are volatile. Active and frequent trading of Fund securities can increase expenses.
Interest Rate Risk: The value of your investment may go down when interest rates rise. A rise in rates tends to have a greater impact on the prices of longer term or duration debt securities. For example, a fixed income security with a duration of three years is expected to decrease in value by approximately 3% if interest rates increase by 1%. This is referred to as “duration risk.” When interest rates fall, the issuers of debt obligations may prepay principal more quickly than expected, and the Fund may be required to reinvest the proceeds at a lower interest rate. This is referred to as “prepayment risk.” When interest rates rise, debt obligations may be repaid more slowly than expected, and the value of the Fund’s holdings may fall sharply. This is referred to as “extension risk.” The Fund may lose money if short-term or long-term interest rates rise sharply or in a manner not anticipated by the subadviser.
Junk Bonds Risk: High-yield, high-risk bonds have predominantly speculative characteristics, including particularly high credit risk. Junk bonds tend to have lower market liquidity than higher-rated securities. The liquidity of particular issuers or industries within a particular investment category may shrink or disappear suddenly and without warning. The non-investment grade bond market can experience sudden and sharp price swings and become illiquid due to a variety of factors, including changes in economic forecasts, stock market activity, large sustained sales by major investors, a high profile default or a change in the market’s psychology.
Large Shareholder and Large Scale Redemption Risk: Certain individuals, accounts, funds (including funds affiliated with the Manager) or institutions, including the Manager and its affiliates, may from time to time own or control a substantial amount of the Fund’s shares. There is no requirement that these entities maintain their investment in the Fund. There is a risk that such large shareholders or that the Fund’s shareholders generally may redeem all or a substantial portion of their investments in the Fund in a short period of time, which could have a significant negative impact on the Fund’s NAV, liquidity, and brokerage costs. Large redemptions could also result in tax consequences to shareholders and impact the Fund’s ability to implement its investment strategy. The Fund’s ability to pursue its investment objective after one or more large scale redemptions may be impaired and, as a result, the Fund may invest a larger portion of its assets in cash or cash equivalents.
Leverage Risk: Certain transactions in which the Fund may engage may give rise to leverage. The use of leverage exaggerates the effect of any increase or decrease in the value of the Fund’s holdings, and makes any change in the Fund’s net asset value (“NAV”) greater than it would be without the use of leverage. This could result in increased volatility of investment return. There is a possibility that segregation involving a large percentage of the assets of the Fund could impede portfolio management or the Fund’s ability to meet redemption requests or other current obligations or that the Fund may be required to dispose of some of its investments at unfavorable prices or times.
PGIM International Bond Fund 81
Notes to Financial Statements (continued)
Liquidity Risk: Liquidity risk is the risk that the Fund could not meet requests to redeem shares issued by the Fund without significant dilution of remaining investors’ interests in the Fund. The Fund may invest in instruments that trade in lower volumes and are more illiquid than other investments. If the Fund is forced to sell these investments to pay redemption proceeds or for other reasons, the Fund may lose money. In addition, when there is no willing buyer and investments cannot be readily sold at the desired time or price, the Fund may have to accept a lower price or may not be able to sell the instrument at all. An inability to sell a portfolio position can adversely affect the Fund’s value or prevent the Fund from being able to take advantage of other investment opportunities.
Management Risk: The value of your investment may decrease if judgments by the subadviser about the attractiveness, value or market trends affecting a particular security, industry or sector or about market movements are incorrect.
Market Disruption and Geopolitical Risks: International wars or conflicts and geopolitical developments in foreign countries, along with instability in regions such as Asia, Eastern Europe, and the Middle East, possible terrorist attacks in the United States or around the world, public health epidemics such as the outbreak of infectious diseases like the outbreak of COVID-19 globally in 2020 or the 2014–2016 outbreak in West Africa of the Ebola virus, and other similar events could adversely affect the U.S. and foreign financial markets, including increases in market volatility, reduced liquidity in the securities markets and government intervention, and may cause further long-term economic uncertainties in the United States and worldwide generally. The coronavirus pandemic and the related governmental and public responses have had and may continue to have an impact on the Fund’s investments and net asset value and have led and may continue to lead to increased market volatility and the potential for illiquidity in certain classes of securities and sectors of the market. Preventative or protective actions that governments may take in respect of pandemic or epidemic diseases may result in periods of business disruption, business closures, inability to obtain raw materials, supplies and component parts, and reduced or disrupted operations for the issuers in which the Fund invests. Government intervention in markets may impact interest rates, market volatility and security pricing. The occurrence, reoccurrence and pendency of such diseases could adversely affect the economies (including through changes in business activity and increased unemployment) and financial markets either in specific countries or worldwide.
Market Risk: Securities markets may be volatile and the market prices of the Fund’s securities may decline. Securities fluctuate in price based on changes in an issuer’s financial condition and overall market and economic conditions. If the market prices of the securities owned by the Fund fall, the value of your investment in the Fund will decline.
82
Mortgage-Backed and Asset-Backed Securities Risk: Mortgage-backed and asset-backed securities tend to increase in value less than other debt securities when interest rates decline, but are subject to similar risk of decline in market value during periods of rising interest rates. The values of mortgage-backed and asset-backed securities become more volatile as interest rates rise. In a period of declining interest rates, the Fund may be required to reinvest more frequent prepayments on mortgage-backed and asset-backed securities in lower-yielding investments.
Non-Diversified Investment Company Risk: The Fund is non-diversified for purposes of the Investment Company Act of 1940 (1940 Act). This means that the Fund may invest a greater percentage of its assets in the securities of a single company or other issuer than a diversified fund. Investing in a non-diversified fund involves greater risk than investing in a diversified fund because a loss resulting from the decline in value of any one security may represent a greater portion of the total assets of a non-diversified fund.
Short Position Risk: The Fund may take short positions in derivative instruments that present various risks, including credit/counterparty risk and leverage risk. A short position on a derivative instrument involves the risk of a theoretically unlimited increase in the value of the underlying security or instrument and, thus, the risk of a theoretically unlimited loss for the Fund. Short positions also involve transaction and other costs that will reduce potential Fund gains and increase potential Fund losses.
Sovereign Debt Risk: The Fund may invest in sovereign debt issued by governments, their agencies or instrumentalities, or other government-related entities. Holders of sovereign debt may be requested to participate in the rescheduling of such debt and to extend further loans to governmental entities. In addition, there is no bankruptcy proceeding by which defaulted sovereign debt may be collected.
| 10. | Recent Accounting Pronouncement and Regulatory Developments |
In March 2020, the FASB issued Accounting Standard Update (“ASU”) No. 2020-04, which provides optional guidance for applying GAAP to contract modifications, hedging relationships and other transactions affected by the reference rate reform if certain criteria are met. ASU 2020-04 is elective and is effective on March 12, 2020 through December 31, 2022. At this time, management is evaluating the implications of certain provisions of the ASU and any impact on the financial statement disclosures has not yet been determined.
On December 3, 2020, the SEC announced that it voted to adopt a new rule that establishes an updated regulatory framework for fund valuation practices (the “Rule”). The Rule, in part, provides (i) a framework for determining fair value in good faith and (ii) provides for a fund Board’s assignment of its responsibility for the execution of valuation-related activities to a fund’s investment adviser. Further, the SEC is rescinding previously issued guidance on related issues. The Rule took effect on March 8, 2021, with a compliance date of September 8, 2022. Management is currently evaluating the Rule and its impact to the Fund.
PGIM International Bond Fund 83
Report of Independent Registered Public Accounting Firm
To the Board of Trustees of Prudential Investment Portfolios 9 and Shareholders of PGIM International Bond Fund
Opinion on the Financial Statements
We have audited the accompanying statement of assets and liabilities, including the schedule of investments, of PGIM International Bond Fund (one of the funds constituting Prudential Investment Portfolios 9, referred to hereafter as the “Fund”) as of October 31, 2021, the related statement of operations for the year ended October 31, 2021, the statement of changes in net assets for each of the two years in the period ended October 31, 2021, including the related notes, and financial highlights for each of the two years in the period ended October 31, 2021 (collectively referred to as the “financial statements”). In our opinion, the financial statements present fairly, in all material respects, the financial position of the Fund as of October 31, 2021, the results of its operations for the year then ended, and the changes in its net assets and the financial highlights for each of the two years in the period ended October 31, 2021 in conformity with accounting principles generally accepted in the United States of America.
The financial statements of the Fund as of and for the year ended October 31, 2019 and the financial highlights for each of the periods ended on or prior to October 31, 2019 (not presented herein, other than the financial highlights) were audited by other auditors whose report dated December 19, 2019 expressed an unqualified opinion on those financial statements and financial highlights.
Basis for Opinion
These financial statements are the responsibility of the Fund’s management. Our responsibility is to express an opinion on the Fund’s financial statements based on our audits. We are a public accounting firm registered with the Public Company Accounting Oversight Board (United States) (PCAOB) and are required to be independent with respect to the Fund in accordance with the U.S. federal securities laws and the applicable rules and regulations of the Securities and Exchange Commission and the PCAOB.
We conducted our audits of these financial statements in accordance with the standards of the PCAOB. Those standards require that we plan and perform the audit to obtain reasonable assurance about whether the financial statements are free of material misstatement, whether due to error or fraud.
Our audits included performing procedures to assess the risks of material misstatement of the financial statements, whether due to error or fraud, and performing procedures that respond to those risks. Such procedures included examining, on a test basis, evidence regarding the amounts and disclosures in the financial statements. Our audits also included evaluating the accounting principles used and significant estimates made by management, as well as evaluating the overall presentation of the financial statements. Our procedures included confirmation of securities owned as of October 31, 2021 by correspondence with the custodian, transfer agent and brokers; when replies were not received from brokers, we performed other auditing procedures. We believe that our audits provide a reasonable basis for our opinion.
/s/PricewaterhouseCoopers LLP
New York, New York
December 16, 2021
We have served as the auditor of one or more investment companies in the PGIM Retail Funds complex since 2020.
Tax Information (unaudited)
For the year ended October 31, 2021, the Fund reports the maximum amount allowable but not less than 6.19% as interest-related dividends in accordance with Section 871(k)(1) and 881(e)(1) of the Internal Revenue Code.
In January 2022, you will be advised on IRS Form 1099-DIV or substitute 1099-DIV, as to the federal tax status of dividends and distributions received by you in calendar year 2021.
| | | | |
PGIM International Bond Fund | | | 85 | |
INFORMATION ABOUT BOARD MEMBERS AND OFFICERS (unaudited)
Information about Board Members and Officers of the Fund is set forth below. Board Members who are not deemed to be “interested persons” of the Fund, as defined in the 1940 Act, are referred to as “Independent Board Members.” Board Members who are deemed to be “interested persons” of the Fund are referred to as “Interested Board Members.” The Board Members are responsible for the overall supervision of the operations of the Fund and perform the various duties imposed on the directors of investment companies by the 1940 Act. The Board in turn elects the Officers, who are responsible for administering the day-to-day operations of the Fund.
| | | | | | |
| Independent Board Members | | | | |
| | | | |
Name Year of Birth Position(s) Portfolios Overseen | | Principal Occupation(s) During Past Five Years | | Other Directorships Held During Past Five Years | | Length of
Board Service |
| | | | |
Ellen S. Alberding 1958 Board Member Portfolios Overseen: 95 | | President and Board Member, The Joyce Foundation (charitable foundation) (since 2002); formerly Vice Chair, City Colleges of Chicago (community college system) (2011-2015); Trustee, National Park Foundation (charitable foundation for national park system) (2009-2018); Trustee, Economic Club of Chicago (2009-2016); Trustee, Loyola University (since 2018). | | None. | | Since September 2013 |
| | | | |
Kevin J. Bannon 1952 Board Member Portfolios Overseen: 95 | | Retired; formerly Managing Director (April 2008-May 2015) and Chief Investment Officer (October 2008-November 2013) of Highmount Capital LLC (registered investment adviser); formerly Executive Vice President and Chief Investment Officer (April 1993-August 2007) of Bank of New York Company; President (May 2003-May 2007) of BNY Hamilton Family of Mutual Funds. | | Director of Urstadt Biddle Properties (equity real estate investment trust) (since September 2008). | | Since July 2008 |
PGIM International Bond Fund
| | | | | | |
Independent Board Members | | | | |
| | | | |
Name Year of Birth Position(s) Portfolios Overseen | | Principal Occupation(s) During Past Five Years | | Other Directorships Held During Past Five Years | | Length of
Board Service |
| | | | |
Linda W. Bynoe 1952 Board Member Portfolios Overseen: 92 | | President and Chief Executive Officer (since March 1995) and formerly Chief Operating Officer (December 1989-February 1995) of Telemat Limited LLC (formerly Telemat Ltd) (management consulting); formerly Vice President (January 1985-June 1989) at Morgan Stanley & Co. (broker-dealer). | | Trustee of Equity Residential (residential real estate) (since December 2009); Director of Northern Trust Corporation (financial services) (since April 2006); formerly Director of Anixter International, Inc. (communication products distributor) (January 2006-June 2020). | | Since March 2005 |
| | | | |
Barry H. Evans 1960 Board Member Portfolios Overseen: 94 | | Retired; formerly President (2005-2016), Global Chief Operating Officer (2014-2016), Chief Investment Officer - Global Head of Fixed Income (1998-2014), and various portfolio manager roles (1986-2006), Manulife Asset Management (asset management). | | Formerly Director, Manulife Trust Company (2011-2018); formerly Director, Manulife Asset Management Limited (2015-2017); formerly Chairman of the Board of Directors of Manulife Asset Management U.S. (2005-2016); formerly Chairman of the Board, Declaration Investment Management and Research (2008-2016). | | Since September 2017 |
| | | | |
Keith F. Hartstein 1956 Board Member & Independent Chair Portfolios Overseen: 95 | | Retired; Executive Committee of the Independent Directors Council (IDC) Board of Governors (since October 2019); Member (since November 2014) of the Governing Council of the IDC (organization of independent mutual fund directors); formerly President and Chief Executive Officer (2005-2012), Senior Vice President (2004-2005), Senior Vice President of Sales and Marketing (1997-2004), and various executive management positions (1990-1997), John Hancock Funds, LLC (asset management); Chairman, Investment Company Institute’s Sales Force Marketing Committee (2003-2008). | | None. | | Since September 2013 |
Visit our website at pgim.com/investments
| | | | | | |
| Independent Board Members | | | | |
| | | | |
Name Year of Birth Position(s) Portfolios Overseen | | Principal Occupation(s) During Past Five Years | | Other Directorships Held During Past Five Years | | Length of
Board Service |
| | | | |
Laurie Simon Hodrick 1962 Board Member Portfolios Overseen: 91 | | A. Barton Hepburn Professor Emerita of Economics in the Faculty of Business, Columbia Business School (since 2018); Visiting Fellow at the Hoover Institution, Stanford University (since 2015); Sole Member, ReidCourt LLC (since 2008) (a consulting firm); formerly Visiting Professor of Law, Stanford Law School (2015-2021); formerly A. Barton Hepburn Professor of Economics in the Faculty of Business, Columbia Business School (1996-2017); formerly Managing Director, Global Head of Alternative Investment Strategies, Deutsche Bank (2006-2008). | | Independent Director, Roku (since December 2020) (communication services); formerly Independent Director, Synnex Corporation (2019-2021) (information technology); formerly Independent Director, Kabbage, Inc. (2018-2020) (financial services); formerly Independent Director, Corporate Capital Trust (2017-2018) (a business development company). | | Since September 2017 |
| | | | |
Brian K. Reid 1961 Board Member Portfolios Overseen: 94 | | Retired; formerly Chief Economist for the Investment Company Institute (ICI) (2005-2017); formerly Senior Economist and Director of Industry and Financial Analysis at the ICI (1998-2004); formerly Senior Economist, Industry and Financial Analysis at the ICI (1996-1998); formerly Staff Economist at the Federal Reserve Board (1989-1996); Director, ICI Mutual Insurance Company (2012-2017). | | None. | | Since March 2018 |
PGIM International Bond Fund
| | | | | | |
| Independent Board Members | | | | |
| | | | |
Name Year of Birth Position(s) Portfolios Overseen | | Principal Occupation(s) During Past Five Years | | Other Directorships Held During Past Five Years | | Length of
Board Service |
| | | | |
Grace C. Torres 1959 Board Member Portfolios Overseen: 94 | | Retired; formerly Treasurer and Principal Financial and Accounting Officer of the PGIM Funds, Target Funds, Advanced Series Trust, Prudential Variable Contract Accounts and The Prudential Series Fund (1998-June 2014); Assistant Treasurer (March 1999-June 2014) and Senior Vice President (September 1999-June 2014) of PGIM Investments LLC; Assistant Treasurer (May 2003-June 2014) and Vice President (June 2005-June 2014) of AST Investment Services, Inc.; Senior Vice President and Assistant Treasurer (May 2003-June 2014) of Prudential Annuities Advisory Services, Inc. | | Director (since January 2018) of OceanFirst Financial Corp. and OceanFirst Bank; formerly Director (July 2015-January 2018) of Sun Bancorp, Inc. N.A. and Sun National Bank. | | Since November 2014 |
| | | | | | |
| Interested Board Members | | | | |
| | | | |
Name Year of Birth Position(s) Portfolios Overseen | | Principal Occupation(s) During Past Five Years | | Other Directorships Held During Past Five Years | | Length of
Board Service |
| | | | |
Stuart S. Parker 1962 Board Member & President Portfolios Overseen: 94 | | President, Chief Executive Officer, Chief Operating Officer and Officer in Charge of PGIM Investments LLC (formerly known as Prudential Investments LLC) (since January 2012); formerly Executive Vice President of Jennison Associates LLC and Head of Retail Distribution of PGIM Investments LLC (June 2005-December 2011); Investment Company Institute - Board of Governors (since May 2012). | | None. | | Since January 2012 |
Visit our website at pgim.com/investments
| | | | | | |
| Interested Board Members | | | | |
| | | | |
Name Year of Birth Position(s) Portfolios Overseen | | Principal Occupation(s) During Past Five Years | | Other Directorships Held During Past Five Years | | Length of
Board Service |
| | | | |
Scott E. Benjamin 1973 Board Member & Vice President Portfolios Overseen: 95 | | Executive Vice President (since May 2009) of PGIM Investments LLC; Vice President (since June 2012) of Prudential Investment Management Services LLC; Executive Vice President (since September 2009) of AST Investment Services, Inc.; Senior Vice President of Product Development and Marketing, PGIM Investments (since February 2006); formerly Vice President of Product Development and Product Management, PGIM Investments LLC (2003-2006). | | None. | | Since March 2010 |
(1) The year that each Board Member joined the Board is as follows:
Ellen S. Alberding, 2013; Kevin J. Bannon, 2008; Linda W. Bynoe, 2005; Barry H. Evans, 2017; Keith F. Hartstein, 2013; Laurie Simon Hodrick, 2017; Michael S. Hyland, 2008; Richard A. Redeker, 1993; Stephen G. Stoneburn, 2003; Stuart S. Parker, Board Member since 2012 and President since 2012; Scott E. Benjamin, Board Member since 2010 and Vice President since 2009; Grace C. Torres, 2014.
| | | | |
| Fund Officers(a) | | | | |
| | | |
Name Year of Birth Fund Position | | Principal Occupation(s) During Past Five Years | | Length of
Service as Fund Officer |
| | | |
Claudia DiGiacomo 1974 Chief Legal Officer | | Chief Legal Officer, Executive Vice President and Secretary of PGIM Investments LLC (since August 2020); Chief Legal Officer of Prudential Mutual Fund Services LLC (since August 2020); Chief Legal Officer of PIFM Holdco, LLC (since August 2020); Vice President and Corporate Counsel (since January 2005) of Prudential; and Corporate Counsel of AST Investment Services, Inc. (since August 2020); formerly Vice President and Assistant Secretary of PGIM Investments LLC (2005-2020); formerly Associate at Sidley Austin Brown & Wood LLP (1999-2004). | | Since December 2005 |
PGIM International Bond Fund
| | | | |
| Fund Officers(a) | | | | |
| | | |
Name Year of Birth Fund Position | | Principal Occupation(s) During Past Five Years | | Length of Service as Fund Officer |
| | | |
Dino Capasso 1974 Chief Compliance Officer | | Chief Compliance Officer (since July 2019) of PGIM Investments LLC; Chief Compliance Officer (since July 2019) of the PGIM Funds, Target Funds, Advanced Series Trust, The Prudential Series Fund, Prudential’s Gibraltar Fund, Inc., PGIM Global High Yield Fund, Inc., PGIM High Yield Bond Fund, Inc., and PGIM Short Duration High Yield Opportunities Fund; Vice President and Deputy Chief Compliance Officer (June 2017-2019) of PGIM Investments LLC; formerly Senior Vice President and Senior Counsel (January 2016-June 2017), and Vice President and Counsel (February 2012-December 2015) of Pacific Investment Management Company LLC. | | Since July 2019 |
| | | |
Andrew R. French 1962 Secretary | | Vice President (since December 2018) of PGIM Investments LLC; formerly Vice President and Corporate Counsel (2010-2018) of Prudential; formerly Director and Corporate Counsel (2006-2010) of Prudential; Vice President and Assistant Secretary (since January 2007) of PGIM Investments LLC; Vice President and Assistant Secretary (since January 2007) of Prudential Mutual Fund Services LLC. | | Since October 2006 |
| | | |
Diana N. Huffman 1982 Assistant Secretary | | Vice President and Corporate Counsel (since September 2015) of Prudential; Vice President and Assistant Secretary (since August 2020) of PGIM Investments LLC; formerly Associate at Willkie Farr & Gallagher LLP (2009-2015). | | Since March 2019 |
| | | |
Melissa Gonzalez 1980 Assistant Secretary | | Vice President and Corporate Counsel (since September 2018) of Prudential; Vice President and Assistant Secretary (since August 2020) of PGIM Investments LLC; formerly Director and Corporate Counsel (March 2014-September 2018) of Prudential. | | Since March 2020 |
| | | |
Patrick E. McGuinness 1986 Assistant Secretary | | Vice President and Assistant Secretary (since August 2020) of PGIM Investments LLC; Director and Corporate Counsel (since February 2017) of Prudential; and Corporate Counsel (2012-2017) of IIL, Inc. | | Since June 2020 |
| | | |
Debra Rubano 1975 Assistant Secretary | | Vice President and Corporate Counsel (since November 2020) of Prudential; formerly Director and Senior Counsel of Allianz Global Investors U.S. Holdings LLC (2010-2020) and Assistant Secretary of numerous funds in the Allianz fund complex (2015-2020). | | Since December 2020 |
| | | |
Kelly A. Coyne 1968 Assistant Secretary | | Director, Investment Operations of Prudential Mutual Fund Services LLC (since 2010). | | Since March 2015 |
Visit our website at pgim.com/investments
| | | | |
| Fund Officers(a) | | | | |
| | | |
Name Year of Birth Fund Position | | Principal Occupation(s) During Past Five Years | | Length of Service as Fund Officer |
| | | |
Christian J. Kelly 1975 Treasurer and Principal Financial and Accounting Officer | | Vice President, Head of Fund Administration of PGIM Investments LLC (since November 2018); formerly Director of Fund Administration of Lord Abbett & Co. LLC (2009-2018), Treasurer and Principal Accounting Officer of the Lord Abbett Family of Funds (2017-2018); Director of Accounting, Avenue Capital Group (2008-2009); Senior Manager, Investment Management Practice of Deloitte & Touche LLP (1998-2007). | | Since January 2019 |
| | | |
Lana Lomuti 1967 Assistant Treasurer | | Vice President (since 2007) and Director (2005-2007), within PGIM Investments Fund Administration; formerly Assistant Treasurer (December 2007-February 2014) of The Greater China Fund, Inc. | | Since April 2014 |
| | | |
Russ Shupak 1973 Assistant Treasurer | | Vice President (since 2017) and Director (2013-2017), within PGIM Investments Fund Administration. | | Since September 2019 |
| | | |
Deborah Conway 1969 Assistant Treasurer | | Vice President (since 2017) and Director (2007-2017), within PGIM Investments Fund Administration. | | Since September 2019 |
| | | |
Elyse M. McLaughlin 1974 Assistant Treasurer | | Vice President (since 2017) and Director (2011-2017), within PGIM Investments Fund Administration. | | Since September 2019 |
| | | |
Jonathan Corbett 1983 Anti-Money Laundering Compliance Officer | | Vice President, Corporate Compliance, Global Compliance Programs and Compliance Risk Management (since August 2019) of Prudential; formerly Vice President and Head of Key Risk Areas Compliance (March 2016 to July 2019), Chief Privacy Officer (March 2016 to July 2019) and Head of Global Financial Crimes Unit (April 2014 to March 2016) at MetLife. | | Since October 2021 |
(a) Excludes Mr. Parker and Mr. Benjamin, interested Board Members who also serve as President and Vice President, respectively.
Explanatory Notes to Tables:
| ∎ | | Board Members are deemed to be “Interested,” as defined in the 1940 Act, by reason of their affiliation with PGIM Investments LLC and/or an affiliate of PGIM Investments LLC. |
| ∎ | | Unless otherwise noted, the address of all Board Members and Officers is c/o PGIM Investments LLC, 655 Broad Street, Newark, New Jersey 07102-4410. |
| ∎ | | There is no set term of office for Board Members or Officers. The Board Members have adopted a retirement policy, which calls for the retirement of Board Members on December 31 of the year in which they reach the age of 75. |
| ∎ | | “Other Directorships Held” includes all directorships of companies required to register or file reports with the SEC under the 1934 Act (that is, “public companies”) or other investment companies registered under the 1940 Act. |
| ∎ | | “Portfolios Overseen” includes all investment companies managed by PGIM Investments LLC. The investment companies for which PGIM Investments LLC serves as manager include the PGIM Funds, Target Funds, The Prudential Variable Contract Accounts, PGIM ETF Trust, PGIM High Yield Bond Fund, Inc., PGIM Global High Yield Fund, Inc., PGIM Short Duration High Yield Opportunities Fund, The Prudential Series Fund, Prudential’s Gibraltar Fund, Inc. and the Advanced Series Trust. |
| ∎ | | As used in the Fund Officers table “Prudential” means The Prudential Insurance Company of America. |
PGIM International Bond Fund
Approval of Advisory Agreements (unaudited)
The Fund’s Board of Trustees
The Board of Trustees (the “Board”) of PGIM International Bond Fund (the “Fund”)1 consists of ten individuals, eight of whom are not “interested persons” of the Fund, as defined in the Investment Company Act of 1940, as amended (the “1940 Act”) (the “Independent Trustees”). The Board is responsible for the oversight of the Fund and its operations, and performs the various duties imposed on the directors of investment companies by the 1940 Act. The Independent Trustees have retained independent legal counsel to assist them in connection with their duties. The Chair of the Board is an Independent Trustee. The Board has established four standing committees: the Audit Committee, the Nominating and Governance Committee, and two Investment Committees. Each committee is chaired by, and composed of, Independent Trustees.
Annual Approval of the Fund’s Advisory Agreements
As required under the 1940 Act, the Board determines annually whether to renew the Fund’s management agreement with PGIM Investments LLC (“PGIM Investments”) and the Fund’s subadvisory agreement with PGIM, Inc. (“PGIM”) on behalf of its PGIM Fixed Income unit (“PGIM Fixed Income”) and PGIM Limited (“PGIML”). In considering the renewal of the agreements, the Board, including all of the Independent Trustees, met on June 7-10, 2021 and approved the renewal of the agreements through July 31, 2022, after concluding that the renewal of the agreements was in the best interests of the Fund and its shareholders.
In advance of the meetings, the Board requested and received materials relating to the agreements, and had the opportunity to ask questions and request further information in connection with its consideration. Among other things, the Board considered comparative fee information from PGIM Investments, PGIM and PGIML. Also, the Board considered comparisons with other mutual funds in relevant Peer Universes and Peer Groups, as is further discussed below.
In approving the agreements, the Board, including the Independent Trustees advised by independent legal counsel, considered the factors it deemed relevant, including the nature, quality and extent of services provided by PGIM Investments and the subadvisers, the performance of the Fund, the profitability of PGIM Investments and its affiliates, expenses and fees, and the potential for economies of scale that may be shared with the Fund and its shareholders as the Fund’s assets grow. In their deliberations, the Trustees did not identify any single factor which alone was responsible for the Board’s decision to approve the agreements with respect to the Fund. In connection with its deliberations, the Board considered information provided by PGIM Investments throughout the year at regular Board meetings, presentations from portfolio managers and other information, as well as information furnished at or in advance of the meetings on June 7-10, 2021.
| 1 | PGIM International Bond Fund is a series of Prudential Investment Portfolios 9. |
PGIM International Bond Fund
Approval of Advisory Agreements (continued)
The Trustees determined that the overall arrangements between the Fund and PGIM Investments, which serves as the Fund’s investment manager pursuant to a management agreement, and between each of PGIM Investments and PGIM, which, through its PGIM Fixed Income unit, and PGIML, which serve as the Fund’s subadvisers pursuant to the terms of a subadvisory agreement with PGIM Investments, are in the best interests of the Fund and its shareholders in light of the services performed, fees charged and such other matters as the Trustees considered relevant in the exercise of their business judgment.
The material factors and conclusions that formed the basis for the Trustees’ reaching their determinations to approve the continuance of the agreements are separately discussed below.
Nature, Quality and Extent of Services
The Board received and considered information regarding the nature, quality and extent of services provided to the Fund by PGIM Investments, PGIM Fixed Income, and PGIML. The Board noted that PGIM Fixed Income and PGIML are affiliated with PGIM Investments. The Board considered the services provided by PGIM Investments, including but not limited to the oversight of the subadvisers for the Fund, as well as the provision of fund recordkeeping, compliance and other services to the Fund, and PGIM Investments’ role as administrator for the Fund’s liquidity risk management program. With respect to PGIM Investments’ oversight of the subadvisers, the Board noted that PGIM Investments’ Strategic Investment Research Group (“SIRG”), which is a business unit of PGIM Investments, is responsible for monitoring and reporting to PGIM Investments senior management on the performance and operations of the subadvisers. The Board also considered that PGIM Investments pays the salaries of all of the officers and interested Trustees of the Fund who are part of Fund management. The Board also considered the investment subadvisory services provided by PGIM Fixed Income and PGIML, including investment research and security selection, as well as adherence to the Fund’s investment restrictions and compliance with applicable Fund policies and procedures. The Board considered PGIM Investments’ evaluation of the subadvisers, as well as PGIM Investments’ recommendation, based on its review of the subadvisers, to renew the subadvisory agreement.
The Board considered the qualifications, backgrounds and responsibilities of PGIM Investments’ senior management responsible for the oversight of the Fund, PGIM Fixed Income, and PGIML, and also considered the qualifications, backgrounds and responsibilities of PGIM Fixed Income’s portfolio managers who are responsible for the day-to-day management of the Fund’s portfolio. The Board was provided with information pertaining to PGIM Investments’, PGIM Fixed Income’s, and PGIML’s organizational structure, senior management, investment operations, and other relevant information pertaining to PGIM Investments, PGIM Fixed Income, and PGIML. The Board also noted that it received favorable compliance reports from the Fund’s Chief Compliance Officer (“CCO”) as to PGIM Investments, PGIM Fixed Income, and PGIML.
Visit our website at pgim.com/investments
The Board concluded that it was satisfied with the nature, extent and quality of the investment management services provided by PGIM Investments, the subadvisory services provided to the Fund by PGIM Fixed Income and PGIML, and that there was a reasonable basis on which to conclude that the Fund benefits from the services provided by PGIM Investments, PGIM Fixed Income, and PGIML under the management and subadvisory agreements.
Costs of Services and Profits Realized by PGIM Investments
The Board was provided with information on the profitability of PGIM Investments and its affiliates in serving as the Fund’s investment manager. The Board discussed with PGIM Investments the methodology utilized in assembling the information regarding profitability and considered its reasonableness. The Board recognized that it is difficult to make comparisons of profitability from fund management contracts because comparative information is not generally publicly available and is affected by numerous factors, including the structure of the particular adviser, the types of funds it manages, its business mix, numerous assumptions regarding allocations and the adviser’s capital structure and cost of capital. Taking these factors into account, the Board concluded that the profitability of PGIM Investments and its affiliates in relation to the services rendered was not unreasonable.
Economies of Scale
The Board received and discussed information concerning economies of scale that PGIM Investments may realize as the Fund’s assets grow beyond current levels. The Board noted that the management fee schedule for the Fund includes breakpoints, which have the effect of decreasing the fee rate as assets increase. During the course of time, the Board has considered information regarding the launch date of the Fund, the management fees of the Fund compared to those of similarly managed funds and PGIM Investments’ investment in the Fund over time. The Board noted that economies of scale can be shared with the Fund in other ways, including low management fees from inception, additional technological and personnel investments to enhance shareholder services, and maintaining existing expense structures in the face of a rising cost environment. The Board also considered PGIM Investments’ assertion that it continually evaluates the management fee schedule of the Fund and the potential to share economies of scale through breakpoints or fee waivers as asset levels increase.
The Board recognized the inherent limitations of any analysis of economies of scale, stemming largely from the Board’s understanding that most of PGIM Investments’ costs are not specific to individual funds, but rather are incurred across a variety of products and services.
Other Benefits to PGIM Investments, PGIM Fixed Income, and PGIML
The Board considered potential ancillary benefits that might be received by PGIM Investments, PGIM Fixed Income, PGIML and their affiliates as a result of their relationship with the Fund. The Board concluded that potential benefits to be derived by PGIM Investments included transfer agency fees received by the Fund’s transfer agent
PGIM International Bond Fund
Approval of Advisory Agreements (continued)
(which is affiliated with PGIM Investments), as well as benefits to its reputation or other intangible benefits resulting from PGIM Investments’ association with the Fund. The Board concluded that the potential benefits to be derived by PGIM Fixed Income and PGIML included the ability to use soft dollar credits, as well as the potential benefits consistent with those generally resulting from an increase in assets under management, specifically, potential access to additional research resources and benefits to their reputations. The Board concluded that the benefits derived by PGIM Investments, PGIM Fixed Income, and PGIML were consistent with the types of benefits generally derived by investment managers and subadvisers to mutual funds.
Performance of the Fund / Fees and Expenses
The Board considered certain additional factors and made related conclusions relating to the historical performance of the Fund for the one-year and the three-year periods ended December 31, 2020. The Board considered that the Fund commenced operations on December 14, 2016 and that longer-term performance was not yet available.
The Board also considered the Fund’s actual management fee, as well as the Fund’s net total expense ratio, for the fiscal year ended October 31, 2020. The Board considered the management fee for the Fund as compared to the management fee charged by PGIM Investments to other funds and the fee charged by other advisers to comparable mutual funds in a Peer Group. The actual management fee represents the fee rate actually paid by Fund shareholders and includes any fee waivers or reimbursements. The net total expense ratio for the Fund represents the actual expense ratio incurred by Fund shareholders.
The mutual funds included in the Peer Universe, which was used to consider performance, and the Peer Group, which was used to consider expenses and fees, were objectively determined by Broadridge, an independent provider of mutual fund data. In certain circumstances, PGIM Investments also provided supplemental Peer Universe or Peer Group information, for reasons addressed with the Board. The comparisons placed the Fund in various quartiles over various periods, with the first quartile being the best 25% of the mutual funds (for performance, the best performing mutual funds and, for expenses, the lowest cost mutual funds).
The section below summarizes key factors considered by the Board and the Board’s conclusions regarding the Fund’s performance, fees and overall expenses. The table sets forth net performance comparisons (which reflect the impact on performance of fund expenses, or any subsidies, expense caps or waivers that may be applicable) with the Peer Universe, actual management fees with the Peer Group (which reflect the impact of any subsidies or fee waivers), and net total expenses with the Peer Group, each of which were key factors considered by the Board.
Visit our website at pgim.com/investments
| | | | | | | | |
| Net Performance | | 1 Year | | 3 Years | | 5 Years | | 10 Years |
| | | 3rd Quartile | | 1st Quartile | | N/A | | N/A |
Actual Management Fees: 1st Quartile |
Net Total Expenses: 1st Quartile |
| | · | | The Board noted that the Fund outperformed its benchmark index over all periods. |
| | · | | The Board considered that the Fund commenced operations on December 14, 2016 and that longer-term performance was not yet available. |
| | · | | The Board and PGIM Investments agreed to retain the existing contractual expense cap that (exclusive of certain fees and expenses) caps total annual operating expenses at 0.99% for Class A shares, 1.74% for Class C shares, 0.58% for Class R6 shares and 0.63% for Class Z shares through February 28, 2022. |
| | · | | In addition, PGIM Investments will waive management fees or shared operating expenses on any share class to the same extent that it waives such expenses on any other share class, and has agreed that total annual fund operating expenses for Class R6 shares will not exceed total annual fund operating expenses for Class Z shares. |
| | · | | The Board concluded that, in light of the above, it would be in the best interests of the Fund and its shareholders to continue to allow the Fund to create a longer-term performance record, and to renew the agreements. |
| | · | | The Board concluded that the management fees (including subadvisory fees) and total expenses were reasonable in light of the services provided. |
* * *
After full consideration of these factors, the Board concluded that the approval of the agreements was in the best interests of the Fund and its shareholders.
PGIM International Bond Fund
| | | | |
| ∎ MAIL | | ∎ TELEPHONE | | ∎ WEBSITE |
| | | |
655 Broad Street | | (800) 225-1852 | | pgim.com/investments |
Newark, NJ 07102 | | | | |
|
PROXY VOTING The Board of Trustees of the Fund has delegated to the Fund’s subadvisers the responsibility for voting any proxies and maintaining proxy recordkeeping with respect to the Fund. A description of these proxy voting policies and procedures is available without charge, upon request, by calling (800) 225-1852 or by visiting the Securities and Exchange Commission’s website at sec.gov. Information regarding how the Fund voted proxies relating to portfolio securities during the most recent 12-month period ended June 30 is available on the Fund’s website and on the Securities and Exchange Commission’s website. |
|
TRUSTEES Ellen S. Alberding · Kevin J. Bannon • Scott E. Benjamin · Linda W. Bynoe · Barry H. Evans · Keith F. Hartstein · Laurie Simon Hodrick · Stuart S. Parker · Brian K. Reid · Grace C. Torres |
|
OFFICERS Stuart S. Parker, President · Scott E. Benjamin, Vice President · Christian J. Kelly, Treasurer and Principal Financial and Accounting Officer · Claudia DiGiacomo, Chief Legal Officer · Dino Capasso, Chief Compliance Officer · Jonathan Corbett, Anti-Money Laundering Compliance Officer · Andrew R. French, Secretary · Melissa Gonzalez, Assistant Secretary · Diana N. Huffman, Assistant Secretary · Kelly A. Coyne, Assistant Secretary · Patrick E. McGuinness, Assistant Secretary · Debra Rubano, Assistant Secretary · Lana Lomuti, Assistant Treasurer · Russ Shupak, Assistant Treasurer · Elyse M. McLaughlin, Assistant Treasurer · Deborah Conway, Assistant Treasurer |
| | | | |
| MANAGER | | PGIM Investments LLC | | 655 Broad Street |
| | | | | Newark, NJ 07102 |
| | |
| SUBADVISERS | | PGIM Fixed Income | | 655 Broad Street |
| | | | Newark, NJ 07102 |
| | |
| | PGIM Limited | | Grand Buildings, 1-3 Strand |
| | | | Tragalgar Square |
| | | | London, WC2N 5HR |
| | | | | United Kingdom |
| | |
| DISTRIBUTOR | | Prudential Investment | | 655 Broad Street |
| | | Management Services LLC | | Newark, NJ 07102 |
| | |
| CUSTODIAN | | The Bank of New York | | 240 Greenwich Street |
| | | Mellon | | New York, NY 10286 |
| | |
| TRANSFER AGENT | | Prudential Mutual Fund | | PO Box 9658 |
| | | Services LLC | | Providence, RI 02940 |
| | |
| INDEPENDENT REGISTERED | | PricewaterhouseCoopers | | 300 Madison Avenue |
| PUBLIC ACCOUNTING FIRM | | LLP | | New York, NY 10017 |
| | |
| FUND COUNSEL | | Willkie Farr & Gallagher LLP | | 787 Seventh Avenue |
| | | | | New York, NY 10019 |
|
| |
| An investor should consider the investment objectives, risks, charges, and expenses of the Fund carefully before investing. The prospectus and summary prospectus contain this and other information about the Fund. An investor may obtain the prospectus and summary prospectus by visiting our website at pgim.com/investments or by calling (800) 225-1852. The prospectus and summary prospectus should be read carefully before investing. |
|
| |
E-DELIVERY To receive your mutual fund documents online, go to pgim.com/investments/resource/edelivery and enroll. Instead of receiving printed documents by mail, you will receive notification via email when new materials are available. You can cancel your enrollment or change your email address at any time by visiting the website address above. |
|
| |
SHAREHOLDER COMMUNICATIONS WITH TRUSTEES Shareholders can communicate directly with the Board of Trustees by writing to the Chair of the Board, PGIM International Bond Fund, PGIM Investments, Attn: Board of Trustees, 655 Broad Street, Newark, NJ 07102. Shareholders can communicate directly with an individual Trustee by writing to that Trustee at the same address. Communications are not screened before being delivered to the addressee. |
|
| |
AVAILABILITY OF PORTFOLIO HOLDINGS The Fund files its complete schedule of portfolio holdings with the Securities and Exchange Commission for the first and third quarters of each fiscal year as an exhibit to its reports on Form N-PORT. The Fund’s Form N-PORT filings are available on the Commission’s website at sec.gov. |
|
| |
The Fund’s Statement of Additional Information contains additional information about the Fund’s Trustees and is available without charge, upon request, by calling (800) 225-1852. |
Mutual Funds:
| | | | |
| | | |
| ARE NOT INSURED BY THE FDIC OR ANY FEDERAL GOVERNMENT AGENCY | | MAY LOSE VALUE | | ARE NOT A DEPOSIT OF OR GUARANTEED BY ANY BANK OR ANY BANK AFFILIATE |

PGIM INTERNATIONAL BOND FUND
| | | | | | | | |
| | | | |
SHARE CLASS | | A | | C | | Z | | R6 |
| | | | |
NASDAQ | | PXBAX | | PXBCX | | PXBZX | | PXBQX |
| | | | |
CUSIP | | 74441J738 | | 74441J720 | | 74441J696 | | 74441J712 |
MF234E

PGIM REAL ESTATE INCOME FUND
ANNUAL REPORT
OCTOBER 31, 2021

To enroll in e-delivery, go to pgim.com/investments/resource/edelivery
Table of Contents
This report is not authorized for distribution to prospective investors unless preceded or accompanied by a current prospectus.
The views expressed in this report and information about the Fund’s portfolio holdings are for the period covered by this report and are subject to change thereafter.
Mutual funds are distributed by Prudential Investment Management Services LLC (PIMS), member SIPC. PGIM Real Estate is a unit of PGIM, Inc. (PGIM), a registered investment adviser. PIMS and PGIM are Prudential Financial companies. © 2021 Prudential Financial, Inc. and its related entities. PGIM Real Estate, PGIM, and the PGIM logo are service marks of Prudential Financial, Inc. and its related entities, registered in many jurisdictions worldwide.
| | |
| 2 | | Visit our website at pgim.com/investments |
Letter from the President
| | | | |
 | | | | Dear Shareholder: We hope you find the annual report for the PGIM Real Estate Income Fund informative and useful. The report covers performance for the 12-month period that ended October 31, 2021. The global economy and markets continued to recover throughout the period from the ongoing impact of the COVID-19 pandemic. The Federal Reserve slashed interest rates and kept them near zero to encourage borrowing. Congress passed stimulus bills worth several trillion dollars to help consumers and businesses. And several |
effective COVID-19 vaccines received regulatory approval. Those measures were enough to offset the fear of rising inflation and supply chain challenges that threatened to disrupt growth.
At the start of the period, stocks had recovered most of the steep losses they had suffered at the onset of the pandemic. Equities rallied as states reopened their economies but became more volatile as investors worried that a surge in COVID-19 infections would stall the recovery. However, rising corporate profits and economic growth, the resolution of the US presidential election, and the global rollout of approved vaccines lifted equity markets to record levels, helping stocks around the globe post gains for the full period.
Throughout this volatile period, investors sought safety in fixed income. Investment-grade bonds in the US and the overall global bond market declined slightly during the period as the economy recovered, but emerging market debt rose. While the 10-year US Treasury yield hovered near record lows early in the period after a significant rally in interest rates, rates moved higher later on as investors began to focus on stronger economic growth and the prospects of higher inflation. The Fed also took several aggressive actions to keep the bond markets running smoothly, implementing many of the relief programs that proved to be successful in helping end the global financial crisis in 2008-09.
Regarding your investments with PGIM, we believe it is important to maintain a diversified portfolio of funds consistent with your tolerance for risk, time horizon, and financial goals. Your financial advisor can help you create a diversified investment plan that may include funds covering all the basic asset classes and that reflects your personal investor profile and risk tolerance. However, diversification and asset allocation strategies do not assure a profit or protect against loss in declining markets.
At PGIM Investments, we consider it a great privilege and responsibility to help investors participate in opportunities across global markets while meeting their toughest investment challenges. PGIM is a top-10 global investment manager with more than $1.5 trillion in assets under management. This scale and investment expertise allow us to deliver actively managed funds and strategies to meet the needs of investors around the globe.
Thank you for choosing our family of funds.
Sincerely,

Stuart S. Parker, President
PGIM Real Estate Income Fund
December 15, 2021
| | | | |
PGIM Real Estate Income Fund | | | 3 | |
Your Fund’s Performance (unaudited)
Performance data quoted represent past performance. Past performance does not guarantee future results. The investment return and principal value of an investment will fluctuate so that an investor’s shares, when redeemed, may be worth more or less than their original cost. Current performance may be lower or higher than the past performance data quoted. An investor may obtain performance data as of the most recent month-end by visiting our website at pgim.com/investments or by calling (800) 225-1852.
| | | | | | |
| |
| | | Average Annual Total Returns as of 10/31/21 |
| | | One Year (%) | | Five Years (%) | | Since Inception (%) |
| | | |
| Class A | | | | | | |
| | | |
| (with sales charges) | | 31.20 | | 5.73 | | 5.11 (06/03/2015) |
| | | |
| (without sales charges) | | 38.84 | | 6.94 | | 6.04 (06/03/2015) |
| | | |
| Class C | | | | | | |
| | | |
| (with sales charges) | | 36.84 | | 6.15 | | 5.27 (06/03/2015) |
| | | |
| (without sales charges) | | 37.84 | | 6.15 | | 5.27 (06/03/2015) |
| | | |
| Class Z | | | | | | |
| | | |
| (without sales charges) | | 39.19 | | 7.25 | | 6.34 (06/03/2015) |
| | | |
| Class R6 | | | | | | |
| | | |
| (without sales charges) | | 39.11 | | N/A | | 8.00 (12/28/2016) |
| | | |
| Custom Blend Index | | | | | | |
| | | 34.24 | | 6.91 | | — |
| | | | |
|
| Average Annual Total Returns as of 10/31/21 Since Inception (%) |
| | | Class A, Class C, Class Z (06/03/2015) | | Class R6 (12/28/2016) |
| | |
| Custom Blend Index | | 6.02 | | 7.35 |
Since Inception returns are provided since the Fund has less than 10 fiscal years of returns. Since Inception returns for the Index are measured from the closest month-end to the class’ inception date.
| | |
| 4 | | Visit our website at pgim.com/investments |
Growth of a $10,000 Investment (unaudited)
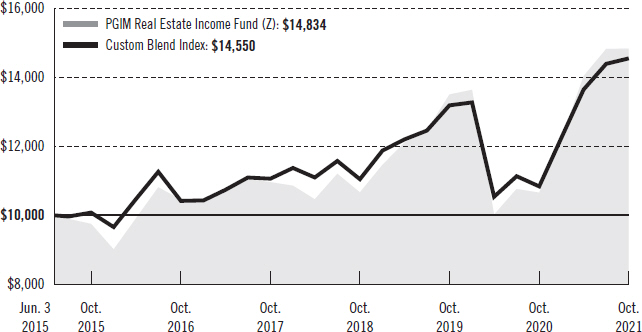
The graph compares a $10,000 investment in the Fund’s Class Z shares with a similar investment in the Custom Blend Index by portraying the initial account values at the commencement of operations for Class Z shares (June 3, 2015) and the account values at the end of the current fiscal year (October 31, 2021), as measured on a quarterly basis. For purposes of the graph, and unless otherwise indicated, it has been assumed that (a) all recurring fees (including management fees) were deducted and (b) all dividends and distributions were reinvested. The line graph provides information for Class Z shares only. As indicated in the tables provided earlier, performance for other share classes will vary due to the differing fees and expenses applicable to each share class (as indicated in the following paragraphs). Without waiver of fees and/or expense reimbursements, if any, the returns would have been lower.
Past performance does not predict future performance. Total returns and the ending account values in the graph include changes in share price and reinvestment of dividends and capital gains distributions in a hypothetical investment for the periods shown. The Fund’s total returns do not reflect the deduction of income taxes on an individual’s investment. Taxes may reduce your actual investment returns on income or gains paid by the Fund or any gains you may realize if you sell your shares.
| | | | |
PGIM Real Estate Income Fund | | | 5 | |
Your Fund’s Performance (continued)
The returns in the tables do not reflect the deduction of taxes that a shareholder would pay on Fund distributions or following the redemption of Fund shares. The average annual total returns take into account applicable sales charges, which are described for each share class in the table below.
| | | | | | | | |
| | | | | |
| | | Class A | | Class C | | Class Z | | Class R6 |
| Maximum initial sales charge | | 5.50% of the public offering price | | None | | None | | None |
| Contingent deferred sales charge (CDSC) (as a percentage of the lower of the original purchase price or the net asset value at redemption) | | 1.00% on sales of $1 million or more made within 12 months of purchase | | 1.00% on sales made within 12 months of purchase | | None | | None |
| Annual distribution and service (12b-1) fees (shown as a percentage of average daily net assets) | | 0.30% (0.25% currently) | | 1.00% | | None | | None |
Benchmark Definitions
Custom Blend Index—The Custom Blend Index is a model portfolio consisting of the FTSE EPRA/NAREIT Developed Index (80%), which is an unmanaged index and reflects the stock performance of companies engaged in specific aspects of the major real estate markets/regions of the world, and the ICE BofA Merrill Lynch 7% Constrained REIT Preferred Securities Index (20%), which is an unmanaged index that is a subset of the ICE BofA Merrill Lynch Fixed Rate Preferred Securities Index including all REIT-issued preferred securities.
Investors cannot invest directly in an index. The returns for the Index would be lower if they included the effects of sales charges, operating expenses of a mutual fund, or taxes that may be paid by an investor.
| | |
| 6 | | Visit our website at pgim.com/investments |
Presentation of Fund Holdings as of 10/31/21
| | | | |
| | |
Ten Largest Holdings | | Real Estate Sectors | | % of Net Assets |
| Global Medical REIT, Inc. | | Health Care REITs | | 6.7% |
| | |
| EPR Properties | | Specialized REITs | | 5.5% |
| | |
| Omega Healthcare Investors, Inc. | | Health Care REITs | | 5.1% |
| | |
| Postal Realty Trust, Inc. (Class A Stock) | | Office REITs | | 4.9% |
| | |
| Spirit Realty Capital, Inc. | | Retail REITs | | 4.6% |
| | |
| Simon Property Group, Inc. | | Retail REITs | | 4.5% |
| | |
| EPR Properties, Series G | | Specialized REITs | | 4.0% |
| | |
| NETSTREIT Corp. | | Retail REITs | | 3.8% |
| | |
| Highwoods Properties, Inc. | | Office REITs | | 3.8% |
| | |
| Community Healthcare Trust, Inc. | | Health Care REITs | | 3.6% |
Holdings reflect only long-term investments and are subject to change.
| | | | |
PGIM Real Estate Income Fund | | | 7 | |
Strategy and Performance Overview (unaudited)
How did the Fund perform?
The PGIM Real Estate Income Fund’s Class Z shares returned 39.19% in the 12-month reporting period that ended October 31, 2021, outperforming the 34.24% return of the Custom Blend Index (the Index). The Index is a model portfolio consisting of the FTSE EPRA/NAREIT Developed Index (80%) and the BofA Merrill Lynch 7% Constrained REIT Preferred Securities Index (20%).
What were conditions like in the global real estate securities market?
| • | | Conditions in the US real estate investment trust (REIT) market during the reporting period can be characterized by a robust recovery in fundamentals following the devastating impact of the COVID-19 pandemic. After the US commercial real estate market experienced one of its worst years ever, Pfizer Inc. announced strong efficacy results for its COVID-19 vaccine in November 2020, which kicked off a massive recovery in fundamentals and stock valuations for the REIT sector. Overall, the US REIT market rallied more than 50% during the period, with some of the harder-hit sectors, such as strip malls and shopping malls, up more than 100%. A successful vaccination effort in the US, combined with record levels of government stimulus, resulted in a highly favorable operating environment for nearly every sector in the US REIT market. |
| • | | Europe’s US-dollar total return during the period was strongly positive at 33.8%, with COVID-19 vaccines helping the region’s economies start to recover from the pandemic. Europe was the second-best-performing global region during the period, ahead of Asia but trailing North America. The United Kingdom (UK) was the quickest country to implement a vaccination program, but other countries in continental Europe rolled out successful programs as well by the summer of 2021. Sweden was the best-performing European market during the period, as its economy benefited from a less-severe recession than other countries in the region. Sweden had resisted locking down its economy, and its companies enjoyed a strong profit rebound aided by record-low interest rates and higher leverage. France was the next-best performer, with its heavily discounted and dominant retail sector experiencing a strong bounce-back as the economy emerged from lockdown. The UK’s return exceeded the European average return for the period due to its early vaccine distribution and subsequent early emergence from lockdown. The weakest European markets during the period were Germany and Finland, both heavily dominated by the multifamily residential sector. Germany, the leading performer in Europe in 2020, lagged for most of 2021 as its residential sector struggled against regulation pressures and the headwind of anticipated interest rate tightening. |
| • | | Asia recovered moderately in 2021 as the market struggled to break out of numerous macro-economic, policy, and pandemic setbacks. In Japan, riskier sectors such as developers, hotel, and office REITs outperformed, benefiting from expectations of pandemic recovery. Despite numerous states of emergency, strong residential demand and relatively resilient office occupancy for the major developers helped solidify expectations of an earnings recovery. Hospitality JREITs (i.e., a REIT established in Japan) also outperformed during the period despite a slow recovery in |
| | |
| 8 | | Visit our website at pgim.com/investments |
| | their fundamentals. Japanese developers and REITs with a reopening tilt (i.e., hotel and office sectors) looked well-positioned for a strong recovery with the Liberal Democratic Party’s successful election and dwindling COVID-19 cases. Reopening was also a significant reason for outperformance in retail, office, and residential REITs in Australia. Residential REITs benefited from government subsidies for home purchases, while numerous retail tenants received mandated rent relief programs. Hong Kong commercial landlords also staged a meaningful recovery, as investors’ expectations reset from pandemic lockdowns to the eventual reopening of borders. Despite strong residential fundamentals in Hong Kong due to negative real interest rates and the lack of meaningful new supply, developers suffered from fears of the regulatory and policy tightening that affected numerous sectors in China. Investors also were concerned during the period about the financial distress of major Chinese developer China Evergrande Group, albeit these worries have abated somewhat due to some successful financing deals. In Singapore, domestic retail-centric REITs outperformed as the nation successfully vaccinated more than 80% of its population. |
What worked and didn’t work?
| • | | The Fund outperformed the Index during the reporting period. North America and Europe saw positive relative performance while Asia slightly lagged. |
| • | | Within North America, numerous sectors performed well. The net lease sector’s contribution to performance was noteworthy and was the result of positive stock selection. The gaming, healthcare, and office sectors positively impacted results, also due to strong security selection. An underweight position in data centers relative to the Index was beneficial to relative performance, as was a relative overweight position to malls. The residential, industrial, and hotels sectors underperformed for the period, detracting from performance. |
| • | | Europe’s outperformance came largely from Germany, as an underweight allocation relative to the index yet strong stock selection in the country’s REIT market produced favorable relative results. France was the largest detractor due to an underweight position relative to the index and weak security selection. |
| • | | Asia lagged the Index for the period. Hong Kong and Singapore negatively impacted performance due to a combination of asset allocation and unfavorable stock selection in both countries’ REIT markets. Conversely, Japan contributed positively to relative performance as a result of an underweight position. |
Current outlook
| • | | PGIM Real Estate views the US REIT market as well positioned for the remainder of 2021 and into 2022. In PGIM Real Estate’s view, despite strong year-to-date performance, this market’s average implied capitalization rate (i.e., the rate of return expected to be generated on a real estate investment property) remains attractive at 4.5%, a roughly 310 basis points (bps) spread relative to the 10-year US Treasury yield. (One basis point equals 0.01%.) While this spread is consistent with the long-term average, given the current depressed net operating income (NOI) levels of |
| | | | |
PGIM Real Estate Income Fund | | | 9 | |
Strategy and Performance Overview (continued)
| | most REITs, PGIM Real Estate expects this spread to compress much further before reverting to its long-term average. Despite some near-term disruption to NOI growth in certain sectors, PGIM Real Estate anticipates funds-from-operations per-share growth of 7.7% in 2021 and 9.7% in 2022 (Source: PGIM). In PGIM Real Estate’s view, the recent improvement in REITs’ equity valuations has allowed many REITs to issue new equity for acquisitions and development. A favorable cost of capital and a faster pace of economies reopening bode well for PGIM Real Estate’s higher near-term earnings expectations. Capital markets continue to be active in the REIT sector, with the market already witnessing eight REIT takeovers in 2021 across a variety of sectors, representing both public-to-public and take-private transactions. Attractive debt and equity capital, combined with a multi-year recovery outlook in fundamentals, is likely to keep private equity interest focused on additional REIT market opportunities, in PGIM Real Estate’s view. PGIM Real Estate remains diligent in its value-based investment process, emphasizing individual stock selection and looking to capitalize on sectors expected to benefit from economic reopening. PGIM Real Estate has increased its overweight allocation to the retail sectors (malls and shopping centers) on the expectation that robust consumer spending will boost fundamentals in 2021 and 2022. PGIM Real Estate has further increased its underweight allocation to data centers, given a challenged internal growth outlook and full valuation, while adding to the storage sector given the strong operating environment and upward valuation revisions. Finally, the Fund remains underweight to the office sector, given a challenging long-term growth outlook. |
| | • | | Europe began ending remaining lockdown measures during the period that had been implemented by many countries in the region, as COVID-19 vaccinations gained momentum across the continent. More than 80% of the UK’s adult population was fully vaccinated at the end of the period, and most countries in continental Europe have largely caught up with the UK. The UK ended all remaining social distancing measures in the middle of July 2021, and continental European countries followed. While the spread of the Delta variant remains a concern, the hope is that an expected increase in cases during the winter can be managed with high vaccination rates, including booster shots. The UK REIT sector is trading around a 9% discount to its one-year forward net asset value (NAV), and continental Europe trades on a slightly lower NAV discount of 6%. However, there are wide divergences across individual sub-sectors, with retail trading at the highest discount and industrial/logistics at a significant premium. The UK trades at a 3.9% implied capitalization rate, an approximately 300-bps spread to 10-year UK bonds, while the continent trades at a 4.0% rate, a 420-bps spread to German 10-year government yields. Dividend yields on offer are still attractive at 2.7% in the UK and 3.1% on the continent. PGIM Real Estate retains a careful stance on the retail sector, given the structural challenges it still faces and the price recovery already seen in many retail shares. PGIM Real Estate has a broadly neutral weight relative to the Index in the offices sector and retains a preference for industrial/logistics and alternatives. PGIM Real Estate is still cautious |
| | |
| 10 | | Visit our website at pgim.com/investments |
| | on the German residential sector following the uncertain outcome of Germany’s federal elections at the end of September 2021 and the impact this could have on future regulation of the residential rental market there. |
| | • | | PGIM Real Estate believes Asia should witness a more sustained recovery heading into 2022. The COVID-19 pandemic has ushered in a period of unprecedented global monetary easing and fiscal stimulus as countries cope with the economic fallout. As Asia emerges from the depths of the Delta variant, there is optimism ahead with a focus now on reopening and recovery. Sectors that witnessed a significant contraction in demand (e.g., hospitality and retail) will likely see a gradual recovery in the coming months, in PGIM Real Estate’s view. Equity market investors are also looking beyond the Federal Reserve’s expected tapering of its monthly bond purchases as the Fed also considers when it might start raising interest rates. This is somewhat complicated by the current market focus on supply-chain disruption leading to stagflation concerns. In PGIM Real Estate’s view, the following themes could be in focus in the near term: (1) recovery from the COVID-19 pandemic, (2) stagflation concerns, (3) bond yield spike on inflation expectations, (4) recovery in retail and hospitality, and (5) US-China geopolitical relations. PGIM Real Estate remains positive on the Australian manufacturing housing and self-storage sectors, with demographic and market consolidation trends providing structural tailwinds. PGIM Real Estate has a slightly underweight allocation relative to the Index to Hong Kong with a preference toward non-discretionary retail, and an overweight allocation relative to the Index to Japanese developers with a preference for retail and hospitality exposures that are levered to a bigger COVID-19 recovery. PGIM Real Estate also has an overweight allocation relative to the Index to JREITs with a preference for hospitality and diversified companies that could benefit from easing COVID-19 restrictions, and an overweight to logistic JREITs given their consistent drive for accretive acquisition growth. In Singapore, PGIM Real Estate has an underweight relative to the Index allocation to developers given a lack of growth catalysts and its preference for recovery opportunities in other countries. For REITs, PGIM Real Estate favors logistic and suburban retail companies that offer resilient demand. Markets are improving but global reopening remains fraught with the risk of a subsequent wave of COVID-19 outbreaks amid growing economic and social marginalization. The effectiveness of incremental vaccine delivery via booster shots and childrens’ vaccinations likely will shape domestic recovery and determine when borders might reopen, in PGIM Real Estate’s view. At the same time, a strong recovery in the US could stoke inflationary pressures beyond what many economists currently say is a transitory trend, which could raise expectations for interest rate hikes. Supply-chain concerns could also hamper growth while creating an inflation spiral. Within PGIM Real Estate’s individual sector holdings, a sharp rise in long-term real interest rates could negatively impact regional REIT valuations. |
| | | | |
PGIM Real Estate Income Fund | | | 11 | |
Comments on Largest Holdings (unaudited)
6.7% Global Medical REIT, Inc., Healthcare REITs
Global Medical acquires and manages real estate assets in the healthcare industry, including the real estate of hospitals, medical centers, nursing facilities, and retirement homes.
5.5% EPR Properties, Specialized REITs
EPR Properties acquires and develops properties leased to entertainment and entertainment-related business operators, generally under long-term triple net leases. The company plans to focus primarily on megaplex theaters and entertainment-themed retail centers.
5.1% Omega Healthcare Investors, Inc., Healthcare REITs
Omega Healthcare invests in and provides financing to the long-term care industry. It operates healthcare facilities in the US that are run by independent healthcare operating companies.
4.9% Postal Realty Trust, Inc. (Class A Stock), Office REITs
Postal Realty owns, operates, leases, and manages properties, and it also offers fee-based third-party property management services.
4.6% Spirit Realty Capital, Inc., Retail REITs
Spirit Realty Capital invests in single-tenant and triple-net basis real estate properties in the US that are engaged in retail, service, and distribution industries.
| | |
| 12 | | Visit our website at pgim.com/investments |
Fees and Expenses (unaudited)
As a shareholder of the Fund, you incur two types of costs: (1) transaction costs, including sales charges (loads) on purchase payments and redemptions, as applicable, and (2) ongoing costs, including management fees, distribution and/or service (12b-1) fees, and other Fund expenses, as applicable. This example is intended to help you understand your ongoing costs (in dollars) of investing in the Fund and to compare these costs with the ongoing costs of investing in other mutual funds.
The example is based on an investment of $1,000 held through the six-month period ended October 31, 2021. The example is for illustrative purposes only; you should consult the Prospectus for information on initial and subsequent minimum investment requirements.
Actual Expenses
The first line for each share class in the table on the following page provides information about actual account values and actual expenses. You may use the information on this line, together with the amount you invested, to estimate the expenses that you paid over the period. Simply divide your account value by $1,000 (for example, an $8,600 account value ÷ $1,000 = 8.6), then multiply the result by the number on the first line under the heading “Expenses Paid During the Six-Month Period” to estimate the expenses you paid on your account during this period.
Hypothetical Example for Comparison Purposes
The second line for each share class in the table on the following page provides information about hypothetical account values and hypothetical expenses based on the Fund’s actual expense ratio and an assumed rate of return of 5% per year before expenses, which is not the Fund’s actual return. The hypothetical account values and expenses may not be used to estimate the actual ending account balance or expenses you paid for the period. You may use this information to compare the ongoing costs of investing in the Fund and other funds. To do so, compare this 5% hypothetical example with the 5% hypothetical examples that appear in the shareholder reports of the other funds.
The Fund’s transfer agent may charge additional fees to holders of certain accounts that are not included in the expenses shown in the table on the following page. These fees apply to individual retirement accounts (IRAs) and Section 403(b) accounts. As of the close of the six-month period covered by the table, IRA fees included an annual maintenance fee of $15 per account (subject to a maximum annual maintenance fee of $25 for all accounts held by the same shareholder). Section 403(b) accounts are charged an annual $25 fiduciary maintenance fee. Some of the fees may vary in amount, or may be waived, based on your total account balance or the number of PGIM funds, including the Fund, that you own. You should consider the additional fees that were charged to your Fund account over the six-month period when you estimate the total ongoing expenses paid over the period and the impact of these fees on your ending account value, as these additional expenses are not reflected in the information
| | | | |
PGIM Real Estate Income Fund | | | 13 | |
Fees and Expenses (continued)
provided in the expense table. Additional fees have the effect of reducing investment returns.
Please note that the expenses shown in the table are meant to highlight your ongoing costs only and do not reflect any transactional costs such as sales charges (loads). Therefore, the second line for each share class in the table is useful in comparing ongoing costs only and will not help you determine the relative total costs of owning different funds. In addition, if these transactional costs were included, your costs would have been higher.
| | | | | | | | | | |
| | | | |
| PGIM Real Estate Income Fund | | Beginning
Account Value
May 1, 2021 | | Ending Account Value
October 31, 2021 | | Annualized Expense
Ratio Based on the Six-Month Period | | Expenses Paid During the Six-Month Period* |
| | | | | |
| Class A | | Actual | | $1,000.00 | | $1,055.60 | | 1.35% | | $ 6.99 |
| | Hypothetical | | $1,000.00 | | $1,018.40 | | 1.35% | | $ 6.87 |
| | | | | |
| Class C | | Actual | | $1,000.00 | | $1,051.70 | | 2.10% | | $10.86 |
| | Hypothetical | | $1,000.00 | | $1,014.62 | | 2.10% | | $10.66 |
| | | | | |
| Class Z | | Actual | | $1,000.00 | | $1,056.70 | | 1.10% | | $ 5.70 |
| | Hypothetical | | $1,000.00 | | $1,019.66 | | 1.10% | | $ 5.60 |
| | | | | |
| Class R6 | | Actual | | $1,000.00 | | $1,056.80 | | 1.10% | | $ 5.70 |
| | | Hypothetical | | $1,000.00 | | $1,019.66 | | 1.10% | | $ 5.60 |
*Fund expenses (net of fee waivers or subsidies, if any) for each share class are equal to the annualized expense ratio for each share class (provided in the table), multiplied by the average account value over the period, multiplied by the 184 days in the six-month period ended October 31, 2021, and divided by the 365 days in the Fund’s fiscal year ended October 31, 2021 (to reflect the six-month period). Expenses presented in the table include the expenses of any underlying portfolios in which the Fund may invest.
| | |
| 14 | | Visit our website at pgim.com/investments |
Schedule of Investments
as of October 31, 2021
| | | | | | | | |
| | |
| Description | | Shares | | | Value | |
| | |
| LONG-TERM INVESTMENTS 99.5% | | | | | | |
| | |
| COMMON STOCKS 80.5% | | | | | | |
| | |
| Diversified Real Estate Activities 1.9% | | | | | | |
Sun Hung Kai Properties Ltd. (Hong Kong) | | | 61,136 | | | $ | 812,697 | |
| | |
| Diversified REITs 10.7% | | | | | | |
Activia Properties, Inc. (Japan) | | | 117 | | | | 479,803 | |
Daiwa House REIT Investment Corp. (Japan) | | | 144 | | | | 413,894 | |
Essential Properties Realty Trust, Inc. | | | 20,114 | | | | 599,196 | |
Nexus Real Estate Investment Trust (Canada) | | | 86,838 | | | | 931,109 | |
Nomura Real Estate Master Fund, Inc. (Japan) | | | 488 | | | | 730,508 | |
Stockland (Australia) | | | 402,393 | | | | 1,380,849 | |
| | | | | | | | |
| | |
| | | | | | | 4,535,359 | |
| | |
| Health Care REITs 20.3% | | | | | | |
Community Healthcare Trust, Inc. | | | 32,038 | | | | 1,532,698 | |
Global Medical REIT, Inc. | | | 172,195 | | | | 2,854,993 | |
Healthcare Trust of America, Inc. (Class A Stock) | | | 36,340 | | | | 1,213,392 | |
Omega Healthcare Investors, Inc. | | | 73,866 | | | | 2,168,706 | |
Welltower, Inc. | | | 10,482 | | | | 842,753 | |
| | | | | | | | |
| | |
| | | | | | | 8,612,542 | |
| | |
| Industrial REITs 2.7% | | | | | | |
Mapletree Logistics Trust (Singapore) | | | 772,578 | | | | 1,160,132 | |
| | |
| Office REITs 10.5% | | | | | | |
Boston Properties, Inc. | | | 6,625 | | | | 752,865 | |
Highwoods Properties, Inc. | | | 36,280 | | | | 1,626,795 | |
Postal Realty Trust, Inc. (Class A Stock) | | | 106,720 | | | | 2,073,570 | |
| | | | | | | | |
| | |
| | | | | | | 4,453,230 | |
| | |
| Real Estate Operating Companies 2.8% | | | | | | |
Swire Properties Ltd. (Hong Kong) | | | 443,076 | | | | 1,191,245 | |
| | |
| Retail REITs 24.1% | | | | | | |
Federal Realty Investment Trust | | | 8,539 | | | | 1,027,669 | |
Kimco Realty Corp. | | | 21,669 | | | | 489,719 | |
Link REIT (Hong Kong) | | | 149,136 | | | | 1,324,160 | |
NETSTREIT Corp. | | | 67,153 | | | | 1,627,789 | |
Phillips Edison & Co., Inc. | | | 33,309 | | | | 1,003,933 | |
Regency Centers Corp. | | | 4,385 | | | | 308,748 | |
Simon Property Group, Inc. | | | 12,872 | | | | 1,886,778 | |
See Notes to Financial Statements.
| | | | |
PGIM Real Estate Income Fund | | | 15 | |
Schedule of Investments (continued)
as of October 31, 2021
| | | | | | | | |
| | |
| Description | | Shares | | | Value | |
| | |
| COMMON STOCKS (Continued) | | | | | | |
| | |
| Retail REITs (cont’d.) | | | | | | |
Spirit Realty Capital, Inc. | | | 40,106 | | | $ | 1,962,386 | |
Supermarket Income REIT PLC (United Kingdom) | | | 354,600 | | | | 577,407 | |
| | | | | | | | |
| | |
| | | | | | | 10,208,589 | |
| | |
| Specialized REITs 7.5% | | | | | | |
EPR Properties | | | 46,599 | | | | 2,339,736 | |
MGM Growth Properties LLC (Class A Stock) | | | 21,977 | | | | 865,454 | |
| | | | | | | | |
| | |
| | | | | | | 3,205,190 | |
| | | | | | | | |
| | |
TOTAL COMMON STOCKS
(cost $31,868,697) | | | | | | | 34,178,984 | |
| | | | | | | | |
| | |
| PREFERRED STOCKS 19.0% | | | | | | |
| | |
| Diversified REITs 5.3% | | | | | | |
Armada Hoffler Properties, Inc., Series A, 6.750%, Maturing 06/18/24(oo) | | | 31,474 | | | | 876,866 | |
Gladstone Commercial Corp., Series G, 6.000%, Maturing 06/28/26(oo) | | | 50,000 | | | | 1,370,500 | |
| | | | | | | | |
| | |
| | | | | | | 2,247,366 | |
| | |
| Hotel & Resort REITs 3.4% | | | | | | |
Pebblebrook Hotel Trust, Series H, 5.700%, Maturing 07/27/26(oo) | | | 55,000 | | | | 1,431,650 | |
| | |
| Residential REITs 6.3% | | | | | | |
American Homes 4 Rent, Series G, 5.875%, Maturing 07/17/22(oo) | | | 45,180 | | | | 1,183,716 | |
Centerspace, Series C, 6.625%, Maturing 10/02/22(oo) | | | 27,444 | | | | 719,170 | |
UMH Properties, Inc., Series C, 6.750%, Maturing 07/26/22(oo) | | | 28,516 | | | | 749,686 | |
| | | | | | | | |
| | |
| | | | | | | 2,652,572 | |
| | |
| Specialized REITs 4.0% | | | | | | |
EPR Properties, Series G, 5.750%, Maturing 11/30/22(oo) | | | 65,611 | | | | 1,712,447 | |
| | | | | | | | |
| | |
TOTAL PREFERRED STOCKS
(cost $7,438,194) | | | | | | | 8,044,035 | |
| | | | | | | | |
| | |
TOTAL LONG-TERM INVESTMENTS
(cost $39,306,891) | | | | | | | 42,223,019 | |
| | | | | | | | |
See Notes to Financial Statements.
| | | | | | | | |
| | |
| Description | | Shares | | | Value | |
| | |
| SHORT-TERM INVESTMENT 0.2% | | | | | | |
| | |
| AFFILIATED MUTUAL FUND | | | | | | |
PGIM Core Ultra Short Bond Fund | | | | | | | | |
(cost $108,325)(wa) | | | 108,325 | | | $ | 108,325 | |
| | | | | | | | |
| | |
TOTAL INVESTMENTS 99.7%
(cost $39,415,216) | | | | | | | 42,331,344 | |
Other assets in excess of liabilities 0.3% | | | | | | | 111,375 | |
| | | | | | | | |
| | |
NET ASSETS 100.0% | | | | | | $ | 42,442,719 | |
| | | | | | | | |
Below is a list of the abbreviation(s) used in the annual report:
LIBOR—London Interbank Offered Rate
REITs—Real Estate Investment Trust
| (oo) | Perpetual security. Maturity date represents next call date. |
| (wa) | PGIM Investments LLC, the manager of the Fund, also serves as manager of the PGIM Core Ultra Short Bond Fund and PGIM Institutional Money Market Fund, if applicable. |
Fair Value Measurements:
Various inputs are used in determining the value of the Fund’s investments. These inputs are summarized in the three broad levels listed below.
Level 1—unadjusted quoted prices generally in active markets for identical securities.
Level 2—quoted prices for similar securities, interest rates and yield curves, prepayment speeds, foreign currency exchange rates and other observable inputs.
Level 3—unobservable inputs for securities valued in accordance with Board approved fair valuation procedures.
The following is a summary of the inputs used as of October 31, 2021 in valuing such portfolio securities:
| | | | | | | | | | | | |
| | | Level 1 | | | Level 2 | | | Level 3 | |
Investments in Securities | | | | | | | | | | | | |
Assets | | | | | | | | | | | | |
Long-Term Investments | | | | | | | | | | | | |
Common Stocks | | | | | | | | | | | | |
Diversified Real Estate Activities | | $ | — | | | $ | 812,697 | | | $ | — | |
Diversified REITs | | | 1,530,305 | | | | 3,005,054 | | | | — | |
Health Care REITs | | | 8,612,542 | | | | — | | | | — | |
Industrial REITs | | | — | | | | 1,160,132 | | | | — | |
Office REITs | | | 4,453,230 | | | | — | | | | — | |
Real Estate Operating Companies | | | — | | | | 1,191,245 | | | | — | |
Retail REITs | | | 8,307,022 | | | | 1,901,567 | | | | — | |
Specialized REITs | | | 3,205,190 | | | | — | | | | — | |
Preferred Stocks | | | | | | | | | | | | |
Diversified REITs | | | 2,247,366 | | | | — | | | | — | |
Hotel & Resort REITs | | | 1,431,650 | | | | — | | | | — | |
Residential REITs | | | 1,933,402 | | | | 719,170 | | | | — | |
See Notes to Financial Statements.
| | | | |
PGIM Real Estate Income Fund | | | 17 | |
Schedule of Investments (continued)
as of October 31, 2021
| | | | | | | | | | | | |
| | | Level 1 | | | Level 2 | | | Level 3 | |
Investments in Securities (continued) | | | | | | | | | | | | |
Assets (continued) | | | | | | | | | | | | |
Long-Term Investments (continued) | | | | | | | | | | | | |
Preferred Stocks (continued) | | | | | | | | | | | | |
Specialized REITs | | $ | 1,712,447 | | | $ | — | | | | $— | |
Short-Term Investment | | | | | | | | | | | | |
Affiliated Mutual Fund | | | 108,325 | | | | — | | | | — | |
| | | | | | | | | | | | |
Total | | $ | 33,541,479 | | | $ | 8,789,865 | | | | $— | |
| | | | | | | | | | | | |
Sector Classification:
The sector classification of investments and other assets in excess of liabilities shown as a percentage of net assets as of October 31, 2021 were as follows (unaudited):
| | | | |
Retail REITs | | | 24.1 | % |
Health Care REITs | | | 20.3 | |
Diversified REITs | | | 16.0 | |
Specialized REITs | | | 11.5 | |
Office REITs | | | 10.5 | |
Residential REITs | | | 6.3 | |
Hotel & Resort REITs | | | 3.4 | |
Real Estate Operating Companies | | | 2.8 | |
| | | | |
Industrial REITs | | | 2.7 | % |
Diversified Real Estate Activities | | | 1.9 | |
Affiliated Mutual Fund | | | 0.2 | |
| | | | |
| | | 99.7 | |
Other assets in excess of liabilities | | | 0.3 | |
| | | | |
| | | 100.0 | % |
| | | | |
See Notes to Financial Statements.
Statement of Assets and Liabilities
as of October 31, 2021
| | | | |
Assets | | | | |
Investments at value: | | | | |
Unaffiliated investments (cost $39,306,891) | | $ | 42,223,019 | |
Affiliated investments (cost $108,325) | | | 108,325 | |
Receivable for investments sold | | | 3,026,539 | |
Receivable for Fund shares sold | | | 73,450 | |
Dividends receivable | | | 54,808 | |
Tax reclaim receivable | | | 4,928 | |
Prepaid expenses | | | 1,450 | |
| | | | |
Total Assets | | | 45,492,519 | |
| | | | |
| |
| Liabilities | | | |
Payable for investments purchased | | | 2,891,080 | |
Accrued expenses and other liabilities | | | 61,374 | |
Payable for Fund shares purchased | | | 49,991 | |
Management fee payable | | | 45,512 | |
Trustees’ fees payable | | | 963 | |
Distribution fee payable | | | 572 | |
Affiliated transfer agent fee payable | | | 288 | |
Payable to custodian | | | 20 | |
| | | | |
Total Liabilities | | | 3,049,800 | |
| | | | |
| |
Net Assets | | $ | 42,442,719 | |
| | | | |
| | | | |
Net assets were comprised of: | | | | |
Shares of beneficial interest, at par | | $ | 4,130 | |
Paid-in capital in excess of par | | | 32,190,419 | |
Total distributable earnings (loss) | | | 10,248,170 | |
| | | | |
Net assets, October 31, 2021 | | $ | 42,442,719 | |
| | | | |
See Notes to Financial Statements.
| | | | |
PGIM Real Estate Income Fund | | | 19 | |
Statement of Assets and Liabilities
as of October 31, 2021
| | | | |
Class A | | | | |
Net asset value and redemption price per share,
($1,581,733 ÷ 154,160 shares of beneficial interest issued and outstanding) | | $ | 10.26 | |
Maximum sales charge (5.50% of offering price) | | | 0.60 | |
| | | | |
Maximum offering price to public | | $ | 10.86 | |
| | | | |
| |
| Class C | | | |
Net asset value, offering price and redemption price per share,
($277,164 ÷ 27,024 shares of beneficial interest issued and outstanding) | | $ | 10.26 | |
| | | | |
| |
| Class Z | | | |
Net asset value, offering price and redemption price per share,
($10,941,398 ÷ 1,063,084 shares of beneficial interest issued and outstanding) | | $ | 10.29 | |
| | | | |
| |
| Class R6 | | | |
Net asset value, offering price and redemption price per share,
($29,642,424 ÷ 2,886,220 shares of beneficial interest issued and outstanding) | | $ | 10.27 | |
| | | | |
See Notes to Financial Statements.
Statement of Operations
Year Ended October 31, 2021
| | | | | | | |
Net Investment Income (Loss) | | | | | | | |
Income | | | | | | | |
Unaffiliated dividend income (net of $23,499 foreign withholding tax) | | | $ | 1,837,697 | | | |
Income from securities lending, net (including affiliated income of $8) | | | | 1,515 | | | |
Affiliated dividend income | | | | 747 | | | |
| | | | | | | |
Total income | | | | 1,839,959 | | | |
| | | | | | | |
| | |
Expenses | | | | | | | |
Management fee | | | | 372,916 | | | |
Distribution fee(a) | | | | 7,306 | | | |
Custodian and accounting fees | | | | 58,245 | | | |
Audit fee | | | | 33,703 | | | |
Registration fees(a) | | | | 27,404 | | | |
Transfer agent’s fees and expenses (including affiliated expense of $1,598)(a) | | | | 21,216 | | | |
Legal fees and expenses | | | | 19,317 | | | |
Trustees’ fees | | | | 10,193 | | | |
Shareholders’ reports | | | | 8,911 | | | |
Miscellaneous | | | | 27,747 | | | |
| | | | | | | |
Total expenses | | | | 586,958 | | | |
Less: Fee waiver and/or expense reimbursement(a) | | | | (65,863 | ) | | |
Distribution fee waiver(a) | | | | (714 | ) | | |
| | | | | | | |
Net expenses | | | | 520,381 | | | |
| | | | | | | |
Net investment income (loss) | | | | 1,319,578 | | | |
| | | | | | | |
| | |
| Realized And Unrealized Gain (Loss) On Investment And Foreign Currency Transactions | | | | |
Net realized gain (loss) on: | | | | | | | |
Investment transactions | | | | 9,194,907 | | | |
Foreign currency transactions | | | | (10,597 | ) | | |
| | | | | | | |
| | | | 9,184,310 | | | |
| | | | | | | |
Net change in unrealized appreciation (depreciation) on: | | | | | | | |
Investments | | | | 4,313,041 | | | |
Foreign currencies | | | | (712 | ) | | |
| | | | | | | |
| | | | 4,312,329 | | | |
| | | | | | | |
Net gain (loss) on investment and foreign currency transactions | | | | 13,496,639 | | | |
| | | | | | | |
Net Increase (Decrease) In Net Assets Resulting From Operations | | | $ | 14,816,217 | | | |
| | | | | | | |
| (a) | Class specific expenses and waivers were as follows: |
| | | | | | | | | | | | | | | | |
| | | Class A | | | Class C | | | Class Z | | | Class R6 | |
Distribution fee | | | 4,285 | | | | 3,021 | | | | — | | | | — | |
Registration fees | | | 7,628 | | | | 5,878 | | | | 8,819 | | | | 5,079 | |
Transfer agent’s fees and expenses | | | 2,634 | | | | 564 | | | | 17,885 | | | | 133 | |
Fee waiver and/or expense reimbursement | | | (10,869 | ) | | | (6,565 | ) | | | (31,123 | ) | | | (17,306 | ) |
Distribution fee waiver | | | (714 | ) | | | — | | | | — | | | | — | |
See Notes to Financial Statements.
| | | | |
PGIM Real Estate Income Fund | | | 21 | |
Statements of Changes in Net Assets
| | | | | | | | |
| |
| | | Year Ended
October 31, | |
| | |
| | | 2021 | | | 2020 | |
| | |
Increase (Decrease) in Net Assets | | | | | | | | |
Operations | | | | | | | | |
Net investment income (loss) | | $ | 1,319,578 | | | $ | 419,247 | |
Net realized gain (loss) on investment and foreign currency transactions | | | 9,184,310 | | | | (870,363 | ) |
Net change in unrealized appreciation (depreciation) on investments and foreign currencies | | | 4,312,329 | | | | (2,992,877 | ) |
| | | | | | | | |
Net increase (decrease) in net assets resulting from operations | | | 14,816,217 | | | | (3,443,993 | ) |
| | | | | | | | |
Dividends and Distributions | | | | | | | | |
Distributions from distributable earnings | | | | | | | | |
Class A | | | (54,882 | ) | | | (63,029 | ) |
Class C | | | (9,354 | ) | | | (42,882 | ) |
Class Z | | | (433,149 | ) | | | (975,513 | ) |
Class R6 | | | (1,310,830 | ) | | | (18,654 | ) |
| | | | | | | | |
| | | (1,808,215 | ) | | | (1,100,078 | ) |
| | | | | | | | |
Tax return of capital distributions | | | | | | | | |
Class A | | | — | | | | (10,694 | ) |
Class C | | | — | | | | (7,275 | ) |
Class Z | | | — | | | | (165,505 | ) |
Class R6 | | | — | | | | (3,165 | ) |
| | | | | | | | |
| | | — | | | | (186,639 | ) |
| | | | | | | | |
Fund share transactions (Net of share conversions) | | | | | | | | |
Net proceeds from shares sold | | | 21,122,631 | | | | 28,004,160 | |
Net asset value of shares issued in reinvestment of dividends and distributions | | | 1,805,219 | | | | 1,279,740 | |
Cost of shares purchased | | | (25,640,300 | ) | | | (10,568,326 | ) |
| | | | | | | | |
Net increase (decrease) in net assets from Fund share transactions | | | (2,712,450 | ) | | | 18,715,574 | |
| | | | | | | | |
Total increase (decrease) | | | 10,295,552 | | | | 13,984,864 | |
| | |
Net Assets: | | | | | | | | |
Beginning of year | | | 32,147,167 | | | | 18,162,303 | |
| | | | | | | | |
End of year | | $ | 42,442,719 | | | $ | 32,147,167 | |
| | | | | | | | |
See Notes to Financial Statements.
Financial Highlights
| | | | | | | | | | | | | | | | | | | | |
| Class A Shares | |
| | | Year Ended October 31, | |
| | | 2021 | | | 2020 | | | 2019 | | | 2018 | | | 2017 | |
| Per Share Operating Performance(a): | | | | | | | | | | | | | | | | | | | | |
| Net Asset Value, Beginning of Year | | | $7.67 | | | | $10.66 | | | | $8.76 | | | | $9.62 | | | | $9.66 | |
| Income (loss) from investment operations: | | | | | | | | | | | | | | | | | | | | |
| Net investment income (loss) | | | 0.25 | | | | 0.27 | | | | 0.28 | | | | 0.34 | | | | 0.39 | |
| Net realized and unrealized gain (loss) on investment and foreign currency transactions | | | 2.70 | | | | (2.43 | ) | | | 1.97 | | | | (0.63 | ) | | | 0.05 | |
| Total from investment operations | | | 2.95 | | | | (2.16 | ) | | | 2.25 | | | | (0.29 | ) | | | 0.44 | |
| Less Dividends and Distributions: | | | | | | | | | | | | | | | | | | | | |
| Dividends from net investment income | | | (0.36 | ) | | | (0.63 | ) | | | (0.35 | ) | | | (0.50 | ) | | | (0.48 | ) |
| Tax return of capital distributions | | | - | | | | (0.14 | ) | | | - | | | | (0.07 | ) | | | - | |
| Distributions from net realized gains | | | - | | | | (0.06 | ) | | | - | | | | - | | | | - | |
| Total dividends and distributions | | | (0.36 | ) | | | (0.83 | ) | | | (0.35 | ) | | | (0.57 | ) | | | (0.48 | ) |
| Net asset value, end of year | | | $10.26 | | | | $7.67 | | | | $10.66 | | | | $8.76 | | | | $9.62 | |
| Total Return(b): | | | 38.84 | % | | | (21.25 | )% | | | 26.26 | % | | | (3.15 | )% | | | 4.60 | % |
| |
| Ratios/Supplemental Data: | |
| Net assets, end of year (000) | | | $1,582 | | | | $866 | | | | $915 | | | | $621 | | | | $914 | |
| Average net assets (000) | | | $1,428 | | | | $796 | | | | $677 | | | | $878 | | | | $744 | |
| Ratios to average net assets(c)(d): | | | | | | | | | | | | | | | | | | | | |
| Expenses after waivers and/or expense reimbursement | | | 1.35 | % | | | 1.36 | % | | | 1.35 | % | | | 1.36 | % | | | 1.35 | % |
| Expenses before waivers and/or expense reimbursement | | | 2.16 | % | | | 4.78 | % | | | 4.65 | % | | | 4.85 | % | | | 3.30 | % |
| Net investment income (loss) | | | 2.56 | % | | | 3.18 | % | | | 2.91 | % | | | 3.73 | % | | | 4.00 | % |
| Portfolio turnover rate(e)(f) | | | 201 | % | | | 235 | % | | | 257 | % | | | 153 | % | | | 137 | % |
| (a) | Calculated based on average shares outstanding during the year. |
| (b) | Total return does not consider the effects of sales loads. Total return is calculated assuming a purchase of a share on the first day and a sale on the last day of each year reported and includes reinvestment of dividends and distributions, if any. Total returns may reflect adjustments to conform to GAAP. |
| (c) | Does not include expenses of the underlying funds in which the Fund invests. |
| (d) | Effective November 1, 2017, class specific expenses include transfer agent fees and expenses and registration fees, which are charged to their respective share class. |
| (e) | The Fund’s portfolio turnover rate is calculated in accordance with regulatory requirements, without regard to transactions involving short-term investments and certain derivatives. If such transactions were included, the Fund’s portfolio turnover rate may be higher. |
| (f) | Portfolio turnover excludes the value of portfolio securities received or delivered as a result of in-kind fund share transactions (if any). |
See Notes to Financial Statements.
| | | | |
PGIM Real Estate Income Fund | | | 23 | |
Financial Highlights (continued)
| | | | | | | | | | | | | | | | | | | | |
| Class C Shares | |
| | | Year Ended October 31, | |
| | | 2021 | | | 2020 | | | 2019 | | | 2018 | | | 2017 | |
| Per Share Operating Performance(a): | | | | | | | | | | | | | | | | | | | | |
| Net Asset Value, Beginning of Year | | | $7.67 | | | | $10.66 | | | | $8.76 | | | | $9.62 | | | | $9.66 | |
| Income (loss) from investment operations: | | | | | | | | | | | | | | | | | | | | |
| Net investment income (loss) | | | 0.18 | | | | 0.23 | | | | 0.21 | | | | 0.27 | | | | 0.32 | |
| Net realized and unrealized gain (loss) on investment and foreign currency transactions | | | 2.70 | | | | (2.45 | ) | | | 1.97 | | | | (0.63 | ) | | | 0.05 | |
| Total from investment operations | | | 2.88 | | | | (2.22 | ) | | | 2.18 | | | | (0.36 | ) | | | 0.37 | |
| Less Dividends and Distributions: | | | | | | | | | | | | | | | | | | | | |
| Dividends from net investment income | | | (0.29 | ) | | | (0.57 | ) | | | (0.28 | ) | | | (0.44 | ) | | | (0.41 | ) |
| Tax return of capital distributions | | | - | | | | (0.14 | ) | | | - | | | | (0.06 | ) | | | - | |
| Distributions from net realized gains | | | - | | | | (0.06 | ) | | | - | | | | - | | | | - | |
| Total dividends and distributions | | | (0.29 | ) | | | (0.77 | ) | | | (0.28 | ) | | | (0.50 | ) | | | (0.41 | ) |
| Net asset value, end of year | | | $10.26 | | | | $7.67 | | | | $10.66 | | | | $8.76 | | | | $9.62 | |
| Total Return(b): | | | 37.84 | % | | | (21.86 | )% | | | 25.34 | % | | | (3.85 | )% | | | 3.83 | % |
| |
| Ratios/Supplemental Data: | |
| Net assets, end of year (000) | | | $277 | | | | $268 | | | | $639 | | | | $336 | | | | $293 | |
| Average net assets (000) | | | $302 | | | | $500 | | | | $510 | | | | $314 | | | | $309 | |
| Ratios to average net assets(c)(d): | | | | | | | | | | | | | | | | | | | | |
| Expenses after waivers and/or expense reimbursement | | | 2.10 | % | | | 2.11 | % | | | 2.10 | % | | | 2.11 | % | | | 2.10 | % |
| Expenses before waivers and/or expense reimbursement | | | 4.27 | % | | | 6.45 | % | | | 5.86 | % | | | 8.85 | % | | | 4.00 | % |
| Net investment income (loss) | | | 1.92 | % | | | 2.62 | % | | | 2.21 | % | | | 2.98 | % | | | 3.29 | % |
| Portfolio turnover rate(e)(f) | | | 201 | % | | | 235 | % | | | 257 | % | | | 153 | % | | | 137 | % |
| (a) | Calculated based on average shares outstanding during the year. |
| (b) | Total return does not consider the effects of sales loads. Total return is calculated assuming a purchase of a share on the first day and a sale on the last day of each year reported and includes reinvestment of dividends and distributions, if any. Total returns may reflect adjustments to conform to GAAP. |
| (c) | Does not include expenses of the underlying funds in which the Fund invests. |
| (d) | Effective November 1, 2017, class specific expenses include transfer agent fees and expenses and registration fees, which are charged to their respective share class. |
| (e) | The Fund’s portfolio turnover rate is calculated in accordance with regulatory requirements, without regard to transactions involving short-term investments and certain derivatives. If such transactions were included, the Fund’s portfolio turnover rate may be higher. |
| (f) | Portfolio turnover excludes the value of portfolio securities received or delivered as a result of in-kind fund share transactions (if any). |
See Notes to Financial Statements.
| | | | | | | | | | | | | | | | | | | | |
| Class Z Shares | |
| | | Year Ended October 31, | |
| | | 2021 | | | 2020 | | | 2019 | | | 2018 | | | 2017 | |
| Per Share Operating Performance(a): | | | | | | | | | | | | | | | | | | | | |
| Net Asset Value, Beginning of Year | | | $7.69 | | | | $10.69 | | | | $8.78 | | | | $9.62 | | | | $9.66 | |
| Income (loss) from investment operations: | | | | | | | | | | | | | | | | | | | | |
| Net investment income (loss) | | | 0.28 | | | | 0.34 | | | | 0.31 | | | | 0.39 | | | | 0.40 | |
| Net realized and unrealized gain (loss) on investment and foreign currency transactions | | | 2.71 | | | | (2.49 | ) | | | 1.98 | | | | (0.64 | ) | | | 0.06 | |
| Total from investment operations | | | 2.99 | | | | (2.15 | ) | | | 2.29 | | | | (0.25 | ) | | | 0.46 | |
| Less Dividends and Distributions: | | | | | | | | | | | | | | | | | | | | |
| Dividends from net investment income | | | (0.39 | ) | | | (0.65 | ) | | | (0.38 | ) | | | (0.52 | ) | | | (0.50 | ) |
| Tax return of capital distributions | | | - | | | | (0.14 | ) | | | - | | | | (0.07 | ) | | | - | |
| Distributions from net realized gains | | | - | | | | (0.06 | ) | | | - | | | | - | | | | - | |
| Total dividends and distributions | | | (0.39 | ) | | | (0.85 | ) | | | (0.38 | ) | | | (0.59 | ) | | | (0.50 | ) |
| Net asset value, end of year | | | $10.29 | | | | $7.69 | | | | $10.69 | | | | $8.78 | | | | $9.62 | |
| Total Return(b): | | | 39.19 | % | | | (21.08 | )% | | | 26.62 | % | | | (2.70 | )% | | | 4.85 | % |
| |
| Ratios/Supplemental Data: | |
| Net assets, end of year (000) | | | $10,941 | | | | $7,797 | | | | $16,451 | | | | $6,951 | | | | $10,681 | |
| Average net assets (000) | | | $11,287 | | | | $9,743 | | | | $12,060 | | | | $8,632 | | | | $8,961 | |
| Ratios to average net assets(c)(d): | | | | | | | | | | | | | | | | | | | | |
| Expenses after waivers and/or expense reimbursement | | | 1.10 | % | | | 1.11 | % | | | 1.10 | % | | | 0.98 | % | | | 1.10 | % |
| Expenses before waivers and/or expense reimbursement | | | 1.38 | % | | | 2.54 | % | | | 2.31 | % | | | 2.81 | % | | | 2.96 | % |
| Net investment income (loss) | | | 2.92 | % | | | 3.81 | % | | | 3.17 | % | | | 4.25 | % | | | 4.17 | % |
| Portfolio turnover rate(e)(f) | | | 201 | % | | | 235 | % | | | 257 | % | | | 153 | % | | | 137 | % |
| (a) | Calculated based on average shares outstanding during the year. |
| (b) | Total return is calculated assuming a purchase of a share on the first day and a sale on the last day of each year reported and includes reinvestment of dividends and distributions, if any. Total returns may reflect adjustments to conform to GAAP. |
| (c) | Does not include expenses of the underlying funds in which the Fund invests. |
| (d) | Effective November 1, 2017, class specific expenses include transfer agent fees and expenses and registration fees, which are charged to their respective share class. |
| (e) | The Fund’s portfolio turnover rate is calculated in accordance with regulatory requirements, without regard to transactions involving short-term investments and certain derivatives. If such transactions were included, the Fund’s portfolio turnover rate may be higher. |
| (f) | Portfolio turnover excludes the value of portfolio securities received or delivered as a result of in-kind fund share transactions (if any). |
See Notes to Financial Statements.
| | | | |
PGIM Real Estate Income Fund | | | 25 | |
Financial Highlights (continued)
| | | | | | | | | | | | | | | | | | | | | | | | |
| Class R6 Shares | | | | | | | | | | | | | | | | | | | |
| | | | | | | | | | | | | | | | | December 28, 2016(a) | | | |
| | | Year Ended October 31, | | | | | through October 31, | | | |
| | | 2021 | | | 2020 | | | 2019 | | | 2018 | | | | | 2017 | | | |
| Per Share Operating Performance(b): | | | | | | | | | | | | | | | | | | | | | | | | |
| Net Asset Value, Beginning of Period | | | $7.68 | | | | $10.67 | | | | $8.76 | | | | $9.62 | | | | | | $9.33 | | | |
| Income (loss) from investment operations: | | | | | | | | | | | | | | | | | | | | | | | | |
| Net investment income (loss) | | | 0.27 | | | | 0.12 | | | | 0.31 | | | | 0.25 | | | | | | 0.31 | | | |
| Net realized and unrealized gain (loss) on investment and foreign currency transactions | | | 2.71 | | | | (2.26 | ) | | | 1.98 | | | | (0.52 | ) | | | | | 0.38 | | | |
| Total from investment operations | | | 2.98 | | | | (2.14 | ) | | | 2.29 | | | | (0.27 | ) | | | | | 0.69 | | | |
| Less Dividends and Distributions: | | | | | | | | | | | | | | | | | | | | | | | | |
| Dividends from net investment income | | | (0.39 | ) | | | (0.65 | ) | | | (0.38 | ) | | | (0.50 | ) | | | | | (0.40) | | | |
| Tax return of capital distributions | | | - | | | | (0.14 | ) | | | - | | | | (0.09 | ) | | | | | - | | | |
| Distributions from net realized gains | | | - | | | | (0.06 | ) | | | - | | | | - | | | | | | - | | | |
| Total dividends and distributions | | | (0.39 | ) | | | (0.85 | ) | | | (0.38 | ) | | | (0.59 | ) | | | | | (0.40) | | | |
| Net asset value, end of period | | | $10.27 | | | | $7.68 | | | | $10.67 | | | | $8.76 | | | | | | $9.62 | | | |
| Total Return(c): | | | 39.11 | % | | | (21.03 | )% | | | 26.54 | % | | | (2.92 | )% | | | | | 7.43% | | | |
| | | | | | | | | | | | | | | | | | | | | | | | | |
| Ratios/Supplemental Data: | | | | | | | | | | | | | | | | | | | |
| Net assets, end of period (000) | | | $29,642 | | | | $23,216 | | | | $158 | | | | $70 | | | | | | $11 | | | |
| Average net assets (000) | | | $33,597 | | | | $675 | | | | $115 | | | | $17 | | | | | | $11 | | | |
| Ratios to average net assets(d)(e): | | | | | | | | | | | | | | | | | | | | | | | | |
| Expenses after waivers and/or expense reimbursement | | | 1.10 | % | | | 1.10 | % | | | 1.10 | % | | | 1.10 | % | | | | | 1.10%(f) | | | |
| Expenses before waivers and/or expense reimbursement | | | 1.15 | % | | | 3.80 | % | | | 8.55 | % | | | 91.97 | % | | | | | 2.79%(f) | | | |
| Net investment income (loss) | | | 2.82 | % | | | 1.36 | % | | | 3.15 | % | | | 2.70 | % | | | | | 3.78%(f) | | | |
| Portfolio turnover rate(g)(h) | | | 201 | % | | | 235 | % | | | 257 | % | | | 153 | % | | | | | 137% | | | |
| (a) | Commencement of offering. |
| (b) | Calculated based on average shares outstanding during the period. |
| (c) | Total return is calculated assuming a purchase of a share on the first day and a sale on the last day of each period reported and includes reinvestment of dividends and distributions, if any. Total returns may reflect adjustments to conform to GAAP. Total returns for periods less than one full year are not annualized. |
| (d) | Does not include expenses of the underlying funds in which the Fund invests. |
| (e) | Effective November 1, 2017, class specific expenses include transfer agent fees and expenses and registration fees, which are charged to their respective share class. |
| (g) | The Fund’s portfolio turnover rate is calculated in accordance with regulatory requirements, without regard to transactions involving short-term investments and certain derivatives. If such transactions were included, the Fund’s portfolio turnover rate may be higher. |
| (h) | Portfolio turnover excludes the value of portfolio securities received or delivered as a result of in-kind fund share transactions (if any). |
See Notes to Financial Statements.
Notes to Financial Statements
1. Organization
Prudential Investment Portfolios 9 (the “Registered Investment Company” or “RIC”) is registered under the Investment Company Act of 1940, as amended (“1940 Act”), as an open-end management investment company. The RIC is organized as a Delaware Statutory Trust and currently consists of five separate funds: PGIM Absolute Return Bond Fund, PGIM International Bond Fund, PGIM QMA Large-Cap Core Equity Fund, PGIM Real Estate Income Fund and PGIM Select Real Estate Fund. These financial statements relate only to the PGIM Real Estate Income Fund (the “Fund”). The Fund is classified as a non-diversified fund for purposes of the 1940 Act.
The investment objective of the Fund is to seek income and capital appreciation.
2. Accounting Policies
The Fund follows the investment company accounting and reporting guidance of the Financial Accounting Standards Board (“FASB”) Accounting Standard Codification (“ASC”) Topic 946 Financial Services — Investment Companies. The following is a summary of significant accounting policies followed by the Fund in the preparation of its financial statements. The policies conform to U.S. generally accepted accounting principles (“GAAP”). The Fund consistently follows such policies in the preparation of its financial statements.
Securities Valuation: The Fund holds securities and other assets and liabilities that are fair valued as of the close of each day (generally, 4:00 PM Eastern time) the New York Stock Exchange (“NYSE”) is open for trading. As described in further detail below, the Fund’s investments are valued daily based on a number of factors, including the type of investment and whether market quotations are readily available. The RIC’s Board of Trustees (the “Board”) has adopted valuation procedures for security valuation under which fair valuation responsibilities have been delegated to PGIM Investments LLC (“PGIM Investments” or the “Manager”). Pursuant to the Board’s delegation, the Manager has established a Valuation Committee responsible for supervising the fair valuation of portfolio securities and other assets and liabilities. The valuation procedures permit the Fund to utilize independent pricing vendor services, quotations from market makers, and alternative valuation methods when market quotations are either not readily available or not deemed representative of fair value. Fair value is the price that would be received to sell an asset or paid to transfer a liability in an orderly transaction between market participants on the measurement date. A record of the Valuation Committee’s actions is subject to the Board’s review at its first quarterly meeting following the quarter in which such actions take place.
For the fiscal reporting year-end, securities and other assets and liabilities were fair valued at the close of the last U.S. business day. Trading in certain foreign securities may occur when
| | | | |
PGIM Real Estate Income Fund | | | 27 | |
Notes to Financial Statements (continued)
the NYSE is closed (including weekends and holidays). Because such foreign securities trade in markets that are open on weekends and U.S. holidays, the values of some of the Fund’s foreign investments may change on days when investors cannot purchase or redeem Fund shares.
Various inputs determine how the Fund’s investments are valued, all of which are categorized according to the three broad levels (Level 1, 2, or 3) detailed in the Schedule of Investments and referred to herein as the “fair value hierarchy” in accordance with FASB ASC Topic 820 - Fair Value Measurements and Disclosures.
Common or preferred stocks, exchange-traded funds and derivative instruments, if applicable, that are traded on a national securities exchange are valued at the last sale price as of the close of trading on the applicable exchange where the security principally trades. Securities traded via NASDAQ are valued at the NASDAQ official closing price. To the extent these securities are valued at the last sale price or NASDAQ official closing price, they are classified as Level 1 in the fair value hierarchy. In the event that no sale or official closing price on valuation date exists, these securities are generally valued at the mean between the last reported bid and ask prices, or at the last bid price in the absence of an ask price. These securities are classified as Level 2 in the fair value hierarchy.
Foreign equities traded on foreign securities exchanges are generally valued using pricing vendor services that provide model prices derived using adjustment factors based on information such as local closing price, relevant general and sector indices, currency fluctuations, depositary receipts, and futures, as applicable. Securities valued using such model prices are classified as Level 2 in the fair value hierarchy. The models generate an evaluated adjustment factor for each security, which is applied to the local closing price to adjust it for post closing market movements up to the time the Fund is valued. Utilizing that evaluated adjustment factor, the vendor provides an evaluated price for each security. If the vendor does not provide an evaluated price, securities are valued in accordance with exchange-traded common and preferred stock valuation policies discussed above.
Investments in open-end funds (other than exchange-traded funds) are valued at their net asset values as of the close of the NYSE on the date of valuation. These securities are classified as Level 1 in the fair value hierarchy since they may be purchased or sold at their net asset values on the date of valuation.
Securities and other assets that cannot be priced according to the methods described above are valued based on pricing methodologies approved by the Board. In the event that unobservable inputs are used when determining such valuations, the securities will be classified as Level 3 in the fair value hierarchy. Altering one or more unobservable inputs may result in a significant change to a Level 3 security’s fair value measurement.
When determining the fair value of securities, some of the factors influencing the valuation include: the nature of any restrictions on disposition of the securities; assessment of the general liquidity of the securities; the issuer’s financial condition and the markets in which it does business; the cost of the investment; the size of the holding and the capitalization of the issuer; the prices of any recent transactions or bids/offers for such securities or any comparable securities; any available analyst media or other reports or information deemed reliable by the Manager regarding the issuer or the markets or industry in which it operates. Using fair value to price securities may result in a value that is different from a security’s most recent closing price and from the price used by other unaffiliated mutual funds to calculate their net asset values.
Foreign Currency Translation: The books and records of the Fund are maintained in U.S. dollars. Foreign currency amounts are translated into U.S. dollars on the following basis:
(i) market value of investment securities, other assets and liabilities — at the exchange rate as of the valuation date;
(ii) purchases and sales of investment securities, income and expenses — at the rates of exchange prevailing on the respective dates of such transactions.
Although the net assets of the Fund are presented at the foreign exchange rates and market values at the close of the period, the Fund does not generally isolate that portion of the results of operations arising as a result of changes in the foreign exchange rates from the fluctuations arising from changes in the market prices of long-term portfolio securities held at the end of the period. Similarly, the Fund does not isolate the effect of changes in foreign exchange rates from the fluctuations arising from changes in the market prices of long-term portfolio securities sold during the period. Accordingly, holding period unrealized and realized foreign currency gains (losses) are included in the reported Net change in unrealized appreciation (depreciation) on investments and Net realized gains (losses) on investment transactions on the Statements of Operations.
Net realized gains (losses) on foreign currency transactions represent net foreign exchange gains (losses) from the disposition of holdings of foreign currencies, currency gains (losses) realized between the trade and settlement dates on investment transactions, and the difference between the amounts of interest, dividends and foreign withholding taxes recorded on the Fund’s books and the U.S. dollar equivalent amounts actually received or paid. Net unrealized currency gains (losses) arise from valuing foreign currency denominated assets and liabilities (other than investments) at period end exchange rates.
Master Netting Arrangements: The RIC, on behalf of the Fund, is subject to various Master Agreements, or netting arrangements, with select counterparties. These are agreements which a subadviser may have negotiated and entered into on behalf of all or a portion of the Fund. A master netting arrangement between the Fund and the counterparty permits the Fund to offset amounts payable by the Fund to the same counterparty against amounts to be received; and by the receipt of collateral from the counterparty by the Fund to cover the
| | | | |
PGIM Real Estate Income Fund | | | 29 | |
Notes to Financial Statements (continued)
Fund’s exposure to the counterparty. However, there is no assurance that such mitigating factors are easily enforceable. In addition to master netting arrangements, the right to set-off exists when all the conditions are met such that each of the parties owes the other determinable amounts, the reporting party has the right to set-off the amount owed with the amount owed by the other party, the reporting party intends to set-off and the right of set-off is enforceable by law.
Securities Lending: The Fund lends its portfolio securities to banks and broker-dealers. The loans are secured by collateral at least equal to the market value of the securities loaned. Collateral pledged by each borrower is invested in an affiliated money market fund and is marked to market daily, based on the previous day’s market value, such that the value of the collateral exceeds the value of the loaned securities. In the event of significant appreciation in value of securities on loan on the last business day of the reporting period, the financial statements may reflect a collateral value that is less than the market value of the loaned securities. Such shortfall is remedied as described above. Loans are subject to termination at the option of the borrower or the Fund. Upon termination of the loan, the borrower will return to the Fund securities identical to the loaned securities. The remaining maturities of the securities lending transactions are considered overnight and continuous. Should the borrower of the securities fail financially, the Fund has the right to repurchase the securities in the open market using the collateral.
The Fund recognizes income, net of any rebate and securities lending agent fees, for lending its securities in the form of fees or interest on the investment of any cash received as collateral. The borrower receives all interest and dividends from the securities loaned and such payments are passed back to the lender in amounts equivalent thereto, which are reflected in interest income or unaffiliated dividend income based on the nature of the payment on the Statement of Operations. The Fund also continues to recognize any unrealized gain (loss) in the market price of the securities loaned and on the change in the value of the collateral invested that may occur during the term of the loan. In addition, realized gain (loss) is recognized on changes in the value of the collateral invested upon liquidation of the collateral. Net earnings from securities lending are disclosed in the Statement of Operations.
Equity and Mortgage Real Estate Investment Trusts (collectively REITs): The Fund invested in REITs, which report information on the source of their distributions annually. Based on current and historical information, a portion of distributions received from REITs during the period is estimated to be dividend income, capital gain or return of capital and recorded accordingly. When material, these estimates are adjusted periodically when the actual source of distributions is disclosed by the REITs.
Securities Transactions and Net Investment Income: Securities transactions are recorded on the trade date. Realized gains (losses) from investment and currency transactions are calculated on the specific identification method. Dividend income is recorded on the ex-date, or for certain foreign securities, when the Fund becomes aware of such dividends. Expenses are recorded on an accrual basis, which may require the use of certain estimates by management that may differ from actual. Net investment income or loss (other than class specific expenses and waivers, which are allocated as noted below) and unrealized and realized gains (losses) are allocated daily to each class of shares based upon the relative proportion of adjusted net assets of each class at the beginning of the day. Class specific expenses and waivers, where applicable, are charged to the respective share classes. Such class specific expenses and waivers include distribution fees and distribution fee waivers, shareholder servicing fees, transfer agent’s fees and expenses, registration fees and fee waivers and/or expense reimbursements, as applicable.
Taxes: It is the Fund’s policy to continue to meet the requirements of the Internal Revenue Code applicable to regulated investment companies and to distribute all of its taxable net investment income and capital gains, if any, to its shareholders. Therefore, no federal income tax provision is required. Withholding taxes on foreign dividends, interest and capital gains, if any, are recorded, net of reclaimable amounts, at the time the related income is earned.
Tax reform legislation commonly referred to as the Tax Cuts and Jobs Act permits a direct REIT shareholder to claim a 20% “qualified business income” deduction for ordinary REIT dividends. The tax legislation did not expressly permit regulated investment companies (“RICs”) paying dividends attributable to such income to pass through this special treatment to its shareholders. On January 18, 2019, the Internal Revenue Service issued final regulations that permit RICs to pass through “qualified REIT dividends” to their shareholders.
Dividends and Distributions: The Fund expects to pay dividends from net investment income quarterly. Distributions from net realized capital and currency gains, if any, are declared and paid annually. Dividends and distributions to shareholders, which are determined in accordance with federal income tax regulations and which may differ from GAAP, are recorded on the ex-date. Permanent book/tax differences relating to income and gain (loss) are reclassified between total distributable earnings (loss) and paid-in capital in excess of par, as appropriate.
Estimates: The preparation of financial statements requires management to make estimates and assumptions that affect the reported amounts and disclosures in the financial statements. Actual results could differ from those estimates.
| | | | |
PGIM Real Estate Income Fund | | | 31 | |
Notes to Financial Statements (continued)
3. Agreements
The RIC, on behalf of the Fund, has a management agreement with the Manager. Pursuant to this agreement, the Manager has responsibility for all investment advisory services and supervises the subadviser’s performance of such services.
The Manager has entered into a subadvisory agreement with PGIM, Inc., which provides subadvisory services to the Fund through its business unit, PGIM Real Estate, and PGIM Real Estate (UK) Limited, an indirect wholly-owned subsidiary of PGIM, Inc. (collectively referred to herein as the “subadviser”). The Manager pays for the services of the subadviser.
The management fee paid to the Manager is accrued daily and payable monthly at an annual rate of 0.80% of the Fund’s average daily net assets up to and including $1 billion, 0.78% of the next $2 billion, 0.76% of the next $2 billion, 0.75% of the next $5 billion and 0.74% of the Fund’s average daily net assets in excess of $10 billion. The effective management fee rate before any waivers and/or expense reimbursements was 0.80% for the year ended October 31, 2021.
The Manager has contractually agreed, through February 28, 2023, to limit total annual operating expenses after fee waivers and/or expense reimbursements to 1.35% of average daily net assets for Class A shares, 2.10% of average daily net assets for Class C shares, 1.10% of average daily net assets for Class Z shares and 1.10% of average daily net assets for Class R6 shares. This contractual waiver excludes interest, brokerage, taxes (such as income and foreign withholding taxes, stamp duty and deferred tax expenses), acquired fund fees and expenses, extraordinary expenses, and certain other Fund expenses such as dividend and interest expense and broker charges on short sales.
Where applicable, the Manager agrees to waive management fees or shared operating expenses on any share class to the same extent that it waives such expenses on any other share class. In addition, total annual operating expenses for Class R6 shares will not exceed total annual operating expenses for Class Z shares. Fees and/or expenses waived and/or reimbursed by the Manager may be recouped by the Manager within the same fiscal year during which such waiver/reimbursement is made if such recoupment can be realized without exceeding the expense limit in effect at the time of the recoupment for that fiscal year.
The RIC, on behalf of the Fund, has a distribution agreement with Prudential Investment Management Services LLC (“PIMS”), which acts as the distributor of the Class A, Class C, Class Z and Class R6 shares of the Fund. The Fund compensates PIMS for distributing and servicing the Fund’s Class A and Class C shares, pursuant to the plans of distribution (the “Distribution Plans”), regardless of expenses actually incurred by PIMS.
Pursuant to the Distribution Plans, the Fund compensates PIMS for distribution related activities at an annual rate of up to 0.30% and 1% of the average daily net assets of the Class A and Class C shares, respectively. PIMS has contractually agreed through February 28, 2023 to limit such fees to 0.25% of the average daily net assets of Class A shares. The distribution fees are accrued daily and payable monthly. No distribution or service fees are paid to PIMS as distributor of the Class Z or Class R6 shares of the Fund.
For the year ended October 31, 2021, PIMS received $17,458 in front-end sales charges resulting from sales of Class A shares. Additionally, for the year ended October 31, 2021, PIMS did not receive any contingent deferred sales charges imposed upon redemptions by certain Class A and Class C shareholders. From these fees, PIMS paid such sales charges to broker-dealers, who in turn paid commissions to salespersons and incurred other distribution costs.
PGIM Investments, PGIM, Inc., PGIM Real Estate (UK) Limited and PIMS are indirect, wholly-owned subsidiaries of Prudential Financial, Inc. (“Prudential”).
4. Other Transactions with Affiliates
Prudential Mutual Fund Services LLC (“PMFS”), an affiliate of PGIM Investments and an indirect, wholly-owned subsidiary of Prudential, serves as the Fund’s transfer agent. Transfer agent’s fees and expenses in the Statement of Operations include certain out-of-pocket expenses paid to non-affiliates, where applicable.
The Fund may invest its overnight sweep cash in the PGIM Core Ultra Short Bond Fund (the “Core Fund”), and its securities lending cash collateral in the PGIM Institutional Money Market Fund (the “Money Market Fund”), each a fund of Prudential Investment Portfolios 2, registered under the 1940 Act and managed by PGIM Investments. PGIM Investments and/or its affiliates are paid fees or reimbursed for providing their services to the Core Fund and the Money Market Fund. In addition to the realized and unrealized gains on investments in the Core Fund and Money Market Fund, earnings from such investments are disclosed on the Statement of Operations as “Affiliated dividend income” and “Income from securities lending, net”, respectively.
The Fund may enter into certain securities purchase or sale transactions under Board approved Rule 17a-7 procedures. Rule 17a-7 is an exemptive rule under the 1940 Act, that subject to certain conditions, permits purchase and sale transactions among affiliated investment companies, or between an investment company and a person that is affiliated solely by reason of having a common (or affiliated) investment adviser, common directors/trustees, and/or common officers. For the year ended October 31, 2021, no 17a-7 transactions were entered into by the Fund.
| | | | |
PGIM Real Estate Income Fund | | | 33 | |
Notes to Financial Statements (continued)
5. Portfolio Securities
The aggregate cost of purchases and proceeds from sales of portfolio securities (excluding short-term investments and U.S. Government securities) for the year ended October 31, 2021, were $91,612,672 and $94,524,283, respectively.
A summary of the cost of purchases and proceeds from sales of shares of affiliated mutual funds for the year ended October 31, 2021, is presented as follows:
| | | | | | | | | | | | | | | | | | | | | | | | | | | | | | |
Value,
Beginning
of Year | | | Cost of Purchases | | | Proceeds from Sales | | | Change in
Unrealized
Gain
(Loss) | | | Realized
Gain
(Loss) | | | Value, End of Year | | | Shares, End of Year | | | Income | |
| | | | | | | | | | | | | | | | | | | | | | | | | | | | | | |
|
| | Short-Term Investments - Affiliated Mutual Funds: | |
|
| | PGIM Core Ultra Short Bond Fund (1)(wa) | |
| | $36,440 | | | | $31,245,981 | | | | $31,174,096 | | | | $— | | | | $— | | | | $108,325 | | | | 108,325 | | | | $747 | |
|
| | PGIM Institutional Money Market Fund (1)(b)(wa) | |
| | — | | | | 993,000 | | | | 993,000 | | | | — | | | | — | | | | — | | | | — | | | | 8 | (2) |
| | | | | | | | | | | | | | | | | | | | | | | | | | | | | | |
| | $36,440 | | | | $32,238,981 | | | | $32,167,096 | | | | $— | | | | $— | | | | $108,325 | | | | | | | | $755 | |
| | | | | | | | | | | | | | | | | | | | | | | | | | | | | | |
| (1) | The Fund did not have any capital gain distributions during the reporting period. |
| (2) | The amount, or a portion thereof, represents the affiliated securities lending income shown on the Statement of Operations. |
| (b) | Represents security, or portion thereof, purchased with cash collateral received for securities on loan and includes dividend reinvestment. |
| (wa) | PGIM Investments LLC, the manager of the Fund, also serves as manager of the PGIM Core Ultra Short Bond Fund and PGIM Institutional Money Market Fund, if applicable. |
6. Distributions and Tax Information
Distributions to shareholders, which are determined in accordance with federal income tax regulations and which may differ from GAAP, are recorded on the ex-date.
For the year ended October 31, 2021, the tax character of dividends paid by the Fund was $1,808,215 of ordinary income. For the year ended October 31, 2020, the tax character of dividends paid by the Fund were $1,100,078 of ordinary income and $186,639 of tax return of capital.
As of October 31, 2021, the accumulated undistributed earnings on a tax basis was $7,532,936 of ordinary income.
The United States federal income tax basis of the Fund’s investments and the net unrealized appreciation as of October 31, 2021 were as follows:
| | | | | | |
| Tax Basis | | Gross Unrealized Appreciation | | Gross Unrealized Depreciation | | Net Unrealized Appreciation |
| $39,613,539 | | $3,842,167 | | $(1,124,362) | | $2,717,805 |
The difference between GAAP and tax basis were primarily due to deferred losses on wash sales and book/tax differences in the treatment of passive foreign investment companies.
The Fund utilized approximately $1,286,000 of its capital loss carryforward to offset net taxable gains realized in the fiscal year ended October 31, 2021.
The Manager has analyzed the Fund’s tax positions taken on federal, state and local income tax returns for all open tax years and has concluded that no provision for income tax is required in the Fund’s financial statements for the current reporting period. Since tax authorities can examine previously filed tax returns, the Fund’s U.S. federal and state tax returns for each of the four fiscal years up to the most recent fiscal year ended October 31, 2021 are subject to such review.
7. Capital and Ownership
The Fund offers Class A, Class C, Class Z and Class R6 shares. Class A shares are sold with a maximum front-end sales charge of 5.50%. Investors who purchase $1 million or more of Class A shares and sell these shares within 12 months of purchase are subject to a contingent deferred sales charge (“CDSC”) of 1%, although they are not subject to an initial sales charge. The Class A CDSC is waived for certain retirement and/or benefit plans. A special exchange privilege is also available for shareholders who qualified to purchase Class A shares at net asset value. Class C shares are sold with a CDSC of 1% on sales made within 12 months of purchase. Class C shares will automatically convert to Class A shares on a monthly basis approximately eight years (ten years prior to January 22, 2021) after purchase. Class Z and Class R6 shares are not subject to any sales or redemption charges and are available exclusively for sale to a limited group of investors.
Under certain circumstances, an exchange may be made from specified share classes of the Fund to one or more other share classes of the Fund as presented in the table of transactions in shares of beneficial interest, below.
The RIC has authorized an unlimited number of shares of beneficial interest of the Fund at $0.001 par value per share, currently divided into four classes, designated Class A, Class C, Class Z and Class R6.
| | | | |
PGIM Real Estate Income Fund | | | 35 | |
Notes to Financial Statements (continued)
As of October 31, 2021, Prudential, through its affiliated entities, including affiliated funds (if applicable), owned shares of the Fund as follows:
| | | | | | | | | | |
| | | Number of Shares | | Percentage of
Outstanding Shares |
Class Z | | | | 720,800 | | | | | 67.8% | |
Class R6 | | | | 2,629,619 | | | | | 91.1% | |
At the reporting period end, the number of shareholders holding greater than 5% of the Fund are as follows:
| | | | | | |
| Affiliated | | Unaffiliated |
Number of Shareholders | | Percentage of
Outstanding Shares | | Number of
Shareholders | | Percentage of Outstanding Shares |
| 2 | | 81.1% | | 1 | | 15.8% |
Transactions in shares of beneficial interest were as follows:
| | | | | | | | |
Class A | | Shares | | | Amount | |
Year ended October 31, 2021: | | | | | | | | |
Shares sold | | | 79,927 | | | $ | 748,083 | |
Shares issued in reinvestment of dividends and distributions | | | 5,448 | | | | 53,702 | |
Shares purchased | | | (47,077 | ) | | | (456,874 | ) |
| | | | | | | | |
Net increase (decrease) in shares outstanding before conversion | | | 38,298 | | | | 344,911 | |
Shares issued upon conversion from other share class(es) | | | 2,962 | | | | 28,998 | |
| | | | | | | | |
Net increase (decrease) in shares outstanding | | | 41,260 | | | $ | 373,909 | |
| | | | | | | | |
Year ended October 31, 2020: | | | | | | | | |
Shares sold | | | 73,503 | | | $ | 633,458 | |
Shares issued in reinvestment of dividends and distributions | | | 7,918 | | | | 70,705 | |
Shares purchased | | | (54,331 | ) | | | (478,284 | ) |
| | | | | | | | |
Net increase (decrease) in shares outstanding | | | 27,090 | | | $ | 225,879 | |
| | | | | | | | |
Class C | | | | | | |
Year ended October 31, 2021: | | | | | | | | |
Shares sold | | | 3,450 | | | $ | 34,123 | |
Shares issued in reinvestment of dividends and distributions | | | 961 | | | | 9,354 | |
Shares purchased | | | (9,335 | ) | | | (94,421 | ) |
| | | | | | | | |
Net increase (decrease) in shares outstanding before conversion | | | (4,924 | ) | | | (50,944 | ) |
Shares purchased upon conversion into other share class(es) | | | (2,962 | ) | | | (28,998 | ) |
| | | | | | | | |
Net increase (decrease) in shares outstanding | | | (7,886 | ) | | $ | (79,942 | ) |
| | | | | | | | |
Year ended October 31, 2020: | | | | | | | | |
Shares sold | | | 16,306 | | | $ | 169,704 | |
Shares issued in reinvestment of dividends and distributions | | | 5,405 | | | | 50,157 | |
Shares purchased | | | (46,711 | ) | | | (387,442 | ) |
| | | | | | | | |
Net increase (decrease) in shares outstanding | | | (25,000 | ) | | $ | (167,581 | ) |
| | | | | | | | |
| | | | | | | | |
Class Z | | Shares | | | Amount | |
Year ended October 31, 2021: | | | | | | | | |
Shares sold | | | 450,856 | | | $ | 4,063,420 | |
Shares issued in reinvestment of dividends and distributions | | | 44,107 | | | | 431,334 | |
Shares purchased | | | (217,541 | ) | | | (2,132,230 | ) |
| | | | | | | | |
Net increase (decrease) in shares outstanding before conversion | | | 277,422 | | | | 2,362,524 | |
Shares purchased upon conversion into other share class(es) | | | (227,572 | ) | | | (2,384,950 | ) |
| | | | | | | | |
Net increase (decrease) in shares outstanding | | | 49,850 | | | $ | (22,426 | ) |
| | | | | | | | |
Year ended October 31, 2020: | | | | | | | | |
Shares sold | | | 317,921 | | | $ | 2,882,817 | |
Shares issued in reinvestment of dividends and distributions | | | 122,355 | | | | 1,137,059 | |
Shares purchased | | | (966,399 | ) | | | (9,534,838 | ) |
| | | | | | | | |
Net increase (decrease) in shares outstanding | | | (526,123 | ) | | $ | (5,514,962 | ) |
| | | | | | | | |
Class R6 | | | | | | |
Year ended October 31, 2021: | | | | | | | | |
Shares sold | | | 1,745,152 | | | $ | 16,277,005 | |
Shares issued in reinvestment of dividends and distributions | | | 134,512 | | | | 1,310,829 | |
Shares purchased | | | (2,245,276 | ) | | | (22,956,775 | ) |
| | | | | | | | |
Net increase (decrease) in shares outstanding before conversion | | | (365,612 | ) | | | (5,368,941 | ) |
Shares issued upon conversion from other share class(es) | | | 228,225 | | | | 2,384,950 | |
| | | | | | | | |
Net increase (decrease) in shares outstanding | | | (137,387 | ) | | $ | (2,983,991 | ) |
| | | | | | | | |
Year ended October 31, 2020: | | | | | | | | |
Shares sold | | | 3,027,301 | | | $ | 24,318,181 | |
Shares issued in reinvestment of dividends and distributions | | | 2,578 | | | | 21,819 | |
Shares purchased | | | (21,124 | ) | | | (167,762 | ) |
| | | | | | | | |
Net increase (decrease) in shares outstanding | | | 3,008,755 | | | $ | 24,172,238 | |
| | | | | | | | |
8. Borrowings
The RIC, on behalf of the Fund, along with other affiliated registered investment companies (the “Participating Funds”), is a party to a Syndicated Credit Agreement (“SCA”) with a group of banks. The purpose of the SCA is to provide an alternative source of temporary funding for capital share redemptions. The table below provides details of the SCA.
| | | | |
| | | Current SCA | | Prior SCA |
Term of Commitment | | 10/1/2021 – 9/29/2022 | | 10/2/2020 – 9/30/2021 |
| | | |
Total Commitment | | $ 1,200,000,000 | | $ 1,200,000,000 |
| | | |
| Annualized Commitment Fee on the Unused Portion of the SCA | | 0.15% | | 0.15% |
| | | |
| Annualized Interest Rate on Borrowings | | 1.20% plus the higher of (1) the effective federal funds rate, (2) the one-month LIBOR rate or (3) zero percent | | 1.30% plus the higher of (1) the effective federal funds rate, (2) the one-month LIBOR rate or (3) zero percent |
Certain affiliated registered investment companies that are parties to the SCA include portfolios that are subject to a predetermined mathematical formula used to manage certain benefit guarantees offered under variable annuity contracts. The formula may result in large scale asset flows into and out of these portfolios. Consequently, these portfolios may be more likely to utilize the SCA for purposes of funding redemptions. It may be possible for those
| | | | |
PGIM Real Estate Income Fund | | | 37 | |
Notes to Financial Statements (continued)
portfolios to fully exhaust the committed amount of the SCA, thereby requiring the Manager to allocate available funding per a Board-approved methodology designed to treat the Participating Funds in the SCA equitably.
The Fund utilized the SCA during the year ended October 31, 2021. The average daily balance for the 25 days that the Fund had loans outstanding during the period was approximately $1,075,040, borrowed at a weighted average interest rate of 1.38%. The maximum loan outstanding amount during the period was $14,783,000. At October 31, 2021, the Fund did not have an outstanding loan amount.
9. Risks of Investing in the Fund
The Fund’s risks include, but are not limited to, some or all of the risks discussed below. For further information on the Fund’s risks, please refer to the Fund’s Prospectus and Statement of Additional Information.
Active Trading Risk: The Fund actively and frequently trades its portfolio securities. High portfolio turnover results in higher transaction costs, which can affect the Fund’s performance and have adverse tax consequences. In addition, high portfolio turnover may also mean that a proportionately greater amount of distributions to shareholders will be taxed as ordinary income rather than long-term capital gains compared to investment companies with lower portfolio turnover.
Distribution Risk: The Fund’s distributions may consist of net investment income, if any, and net realized gains, if any, from the sale of investments and/or return of capital. The Fund will provide to shareholders early in each calendar year the final tax character of the Fund’s distributions for the previous year. Also, at such time that the Fund distribution is expected to be from sources other than current or accumulated net income, a notice to shareholders may be required.
Economic and Market Events Risk: Events in the U.S. and global financial markets, including actions taken by the U.S. Federal Reserve or foreign central banks to stimulate or stabilize economic growth or the functioning of the securities markets, may at times result in unusually high market volatility, which could negatively impact performance. Relatively reduced liquidity in credit and fixed income markets could adversely affect issuers worldwide.
Emerging Markets Risk: The risks of foreign investments are greater for investments in or exposed to emerging markets. Emerging market countries typically have economic and political systems that are less fully developed, and can be expected to be less stable, than those of more developed countries. For example, the economies of such countries can be
subject to rapid and unpredictable rates of inflation or deflation. Low trading volumes may result in a lack of liquidity and price volatility. Emerging market countries may have policies that restrict investment by non-U.S. investors, or that prevent non-U.S. investors from withdrawing their money at will.
The Fund may invest in some emerging markets that subject it to risks such as those associated with illiquidity, custody of assets, different settlement and clearance procedures and asserting legal title under a developing legal and regulatory regime to a greater degree than in developed markets or even in other emerging markets.
Equity and Equity-Related Securities Risk: Equity and equity-related securities may be subject to changes in value, and their values may be more volatile than those of other asset classes. In addition to an individual security losing value, the value of the equity markets or a sector in which the Fund invests could go down. Different parts of a market can react differently to adverse issuer, market, regulatory, political and economic developments.
Foreign Securities Risk: Investments in securities of non-U.S. issuers (including those denominated in U.S. dollars) may involve more risk than investing in securities of U.S. issuers. Foreign political, economic and legal systems, especially those in developing and emerging market countries, may be less stable and more volatile than in the United States. Foreign legal systems generally have fewer regulatory requirements than the U.S. legal system, particularly those of emerging markets. In general, less information is publicly available with respect to non-U.S. companies than U.S. companies. Non-U.S. companies generally are not subject to the same accounting, auditing, and financial reporting standards as are U.S. companies. Additionally, the changing value of foreign currencies and changes in exchange rates could also affect the value of the assets the Fund holds and the Fund’s performance. Certain foreign countries may impose restrictions on the ability of issuers of foreign securities to make payment of principal and interest or dividends to investors located outside the country, due to blockage of foreign currency exchanges or otherwise. Investments in emerging markets are subject to greater volatility and price declines.
In addition, the Fund’s investments in non-U.S. securities may be subject to the risks of nationalization or expropriation of assets, imposition of currency exchange controls or restrictions on the repatriation of non-U.S. currency, confiscatory taxation and adverse diplomatic developments. Special U.S. tax considerations may apply.
Increase in Expenses Risk: Your actual cost of investing in the Fund may be higher than the expenses shown in the expense table in the Fund’s prospectus for a variety of reasons. For example, expense ratios may be higher than those shown if average net assets decrease. Net assets are more likely to decrease and Fund expense ratios are more likely to increase when markets are volatile. Active and frequent trading of Fund securities can increase expenses.
Large Shareholder and Large Scale Redemption Risk: Certain individuals, accounts, funds (including funds affiliated with the Manager) or institutions, including the Manager and its
| | | | |
PGIM Real Estate Income Fund | | | 39 | |
Notes to Financial Statements (continued)
affiliates, may from time to time own or control a substantial amount of the Fund’s shares. There is no requirement that these entities maintain their investment in the Fund. There is a risk that such large shareholders or that the Fund’s shareholders generally may redeem all or a substantial portion of their investments in the Fund in a short period of time, which could have a significant negative impact on the Fund’s NAV, liquidity, and brokerage costs. Large redemptions could also result in tax consequences to shareholders and impact the Fund’s ability to implement its investment strategy. The Fund’s ability to pursue its investment objective after one or more large scale redemptions may be impaired and, as a result, the Fund may invest a larger portion of its assets in cash or cash equivalents.
Market Capitalization Risk: The Fund may invest in companies of any market capitalization. Generally, the stock prices of small- and mid-cap companies are less stable than the prices of large-cap stocks and may present greater risks. Large capitalization companies as a group could fall out of favor with the market, causing the Fund to underperform compared to investments that focus on smaller capitalized companies.
Market Disruption and Geopolitical Risks: International wars or conflicts and geopolitical developments in foreign countries, along with instability in regions such as Asia, Eastern Europe, and the Middle East, possible terrorist attacks in the United States or around the world, public health epidemics such as the outbreak of infectious diseases like the outbreak of COVID-19 globally in 2020 or the 2014–2016 outbreak in West Africa of the Ebola virus, and other similar events could adversely affect the U.S. and foreign financial markets, including increases in market volatility, reduced liquidity in the securities markets and government intervention, and may cause further long-term economic uncertainties in the United States and worldwide generally. The coronavirus pandemic and the related governmental and public responses have had and may continue to have an impact on the Fund’s investments and net asset value and have led and may continue to lead to increased market volatility and the potential for illiquidity in certain classes of securities and sectors of the market. Preventative or protective actions that governments may take in respect of pandemic or epidemic diseases may result in periods of business disruption, business closures, inability to obtain raw materials, supplies and component parts, and reduced or disrupted operations for the issuers in which the Fund invests. Government intervention in markets may impact interest rates, market volatility and security pricing. The occurrence, reoccurrence and pendency of such diseases could adversely affect the economies (including through changes in business activity and increased unemployment) and financial markets either in specific countries or worldwide.
Market Risk: Securities markets may be volatile and the market prices of the Fund’s securities may decline. Securities fluctuate in price based on changes in an issuer’s financial condition and overall market and economic conditions. If the market prices of the securities owned by the Fund fall, the value of your investment in the Fund will decline.
Non-Diversified Investment Company Risk: The Fund is non-diversified for purposes of the Investment Company Act of 1940 (1940 Act). This means that the Fund may invest a greater percentage of its assets in the securities of a single company or other issuer than a diversified fund. Investing in a non-diversified fund involves greater risk than investing in a diversified fund because a loss resulting from the decline in value of any one security may represent a greater portion of the total assets of a non-diversified fund.
Real Estate Investment Trust (REIT) Risk: Investing in REITs involves certain unique risks in addition to those risks associated with investing in the real estate industry in general. REITs may be affected by changes in the value of the underlying property owned by the REITs, while mortgage REITs may be affected by the quality of any credit extended. REITs are dependent upon management skills, may not be diversified geographically or by property/mortgage asset type, and are subject to heavy cash flow dependency, default by borrowers and self-liquidation. REITs may be more volatile and/or more illiquid than other types of equity securities. REITs (especially mortgage REITs) are subject to interest rate risks. REITs may incur significant amounts of leverage. The Fund will indirectly bear a portion of the expenses, including management fees, paid by each REIT in which it invests, in addition to the expenses of the Fund.
REITs must also meet certain requirements under the Internal Revenue Code of 1986, as amended (the Code) to avoid entity level tax and be eligible to pass-through certain tax attributes of their income to shareholders. REITs are consequently subject to the risk of failing to meet these requirements for favorable tax treatment and of failing to maintain their exemptions from registration under the Investment Company Act of 1940. REITs are subject to the risks of changes in the Code affecting their tax status.
Real Estate Related Securities Risk: Because the Fund invests in real estate securities, including REITs, the Fund is subject to the risks of investing in the real estate industry, such as changes in general and local economic conditions, the supply and demand for real estate and changes in zoning and tax laws. Since the Fund concentrates in the real estate industry, its holdings can vary significantly from broad market indices. As a result, the Fund’s performance can deviate from the performance of such indices. Because the Fund invests in stocks, there is the risk that the price of a particular stock owned by the Fund could go down or pay lower-than-expected or no dividends. In addition to an individual stock losing value, the value of the equity markets or of companies comprising the real estate industry could go down. An investment in the Fund will be closely linked to the performance of the real estate markets. Real estate securities are subject to the same risks as direct investments in real estate and mortgages, and their value will depend on the value of the underlying properties or the underlying loans or interests. The underlying loans may be subject to the risks of default or of prepayments that occur earlier or later than expected, and such loans may also include so-called “subprime” mortgages. The value of these securities will rise and fall in response to many factors, including economic conditions, the demand for rental property and interest rates. In particular, the value of these securities may decline when interest rates rise and will also be affected by the real estate market and by the management of the underlying properties.
| | | | |
PGIM Real Estate Income Fund | | | 41 | |
Notes to Financial Statements (continued)
Selection Risk: Selection risk is the risk that the securities selected by the subadviser will underperform the market, the relevant indices, or other funds with similar investment objectives and investment strategies. Individual REIT prices may drop because of the failure of borrowers to pay their loans, a dividend reduction, a disruption to the real estate investment sales market, changes in federal or state taxation policies affecting REITs, or poor management of a REIT.
Value Style Risk: Since the Fund follows a value investment style, there is the risk that the value style may be out of favor for long periods of time, that the market will not recognize a security’s intrinsic value for a long time or at all, or that a stock judged to be undervalued may actually be appropriately priced or overvalued. Issuers of value stocks may have experienced adverse business developments or may be subject to special risks that have caused the stock to be out of favor. In addition, the Fund’s value investment style may go out of favor with investors, negatively affecting the Fund’s performance. If the Fund’s assessment of market conditions or a company’s value is inaccurate, the Fund could suffer losses or produce poor performance relative to other funds.
10. Recent Regulatory Developments
On December 3, 2020, the SEC announced that it voted to adopt a new rule that establishes an updated regulatory framework for fund valuation practices (the “Rule”). The Rule, in part, provides (i) a framework for determining fair value in good faith and (ii) provides for a fund Board’s assignment of its responsibility for the execution of valuation-related activities to a fund’s investment adviser. Further, the SEC is rescinding previously issued guidance on related issues. The Rule took effect on March 8, 2021, with a compliance date of September 8, 2022. Management is currently evaluating the Rule and its impact to the Fund.
Report of Independent Registered Public Accounting Firm
To the Board of Trustees of Prudential Investment Portfolios 9 and Shareholders of PGIM Real Estate Income Fund
Opinion on the Financial Statements
We have audited the accompanying statement of assets and liabilities, including the schedule of investments, of PGIM Real Estate Income Fund (one of the funds constituting Prudential Investment Portfolios 9, referred to hereafter as the “Fund”) as of October 31, 2021, the related statement of operations for the year ended October 31, 2021, the statement of changes in net assets for each of the two years in the period ended October 31, 2021, including the related notes, and financial highlights for each of the two years in the period ended October 31, 2021 (collectively referred to as the “financial statements”). In our opinion, the financial statements present fairly, in all material respects, the financial position of the Fund as of October 31, 2021, the results of its operations for the year then ended, and the changes in its net assets and the financial highlights for each of the two years in the period ended October 31, 2021 in conformity with accounting principles generally accepted in the United States of America.
The financial statements of the Fund as of and for the year ended October 31, 2019 and the financial highlights for each of the periods ended on or prior to October 31, 2019 (not presented herein, other than the financial highlights) were audited by other auditors whose report dated December 16, 2019 expressed an unqualified opinion on those financial statements and financial highlights.
Basis for Opinion
These financial statements are the responsibility of the Fund’s management. Our responsibility is to express an opinion on the Fund’s financial statements based on our audits. We are a public accounting firm registered with the Public Company Accounting Oversight Board (United States) (PCAOB) and are required to be independent with respect to the Fund in accordance with the U.S. federal securities laws and the applicable rules and regulations of the Securities and Exchange Commission and the PCAOB.
We conducted our audits of these financial statements in accordance with the standards of the PCAOB. Those standards require that we plan and perform the audit to obtain reasonable assurance about whether the financial statements are free of material misstatement, whether due to error or fraud.
Our audits included performing procedures to assess the risks of material misstatement of the financial statements, whether due to error or fraud, and performing procedures that respond to those risks. Such procedures included examining, on a test basis, evidence regarding the amounts and disclosures in the financial statements. Our audits also included evaluating the accounting principles used and significant estimates made by management, as well as evaluating the overall presentation of the financial statements. Our procedures included confirmation of securities owned as of October 31, 2021 by correspondence with the custodian, transfer agent and brokers; when replies were not received from brokers, we performed other auditing procedures. We believe that our audits provide a reasonable basis for our opinion.
/s/PricewaterhouseCoopers LLP
New York, New York
December 16, 2021
We have served as the auditor of one or more investment companies in the PGIM Retail Funds complex since 2020.
| | | | |
PGIM Real Estate Income Fund | | | 43 | |
Tax Information (unaudited)
For the year ended October 31, 2021, the Fund reports the maximum amount allowable, but not less than 1.38% of the ordinary income dividends paid during the year as qualified dividend income in accordance with Section 854 of the Internal Revenue Code.
In January 2022, you will be advised on IRS Form 1099-DIV or substitute 1099-DIV as to the federal tax status of the dividends received by you in calendar year 2021.
INFORMATION ABOUT BOARD MEMBERS AND OFFICERS (unaudited)
Information about Board Members and Officers of the Fund is set forth below. Board Members who are not deemed to be “interested persons” of the Fund, as defined in the 1940 Act, are referred to as “Independent Board Members.” Board Members who are deemed to be “interested persons” of the Fund are referred to as “Interested Board Members.” The Board Members are responsible for the overall supervision of the operations of the Fund and perform the various duties imposed on the directors of investment companies by the 1940 Act. The Board in turn elects the Officers, who are responsible for administering the day-to-day operations of the Fund.
| | | | | | |
| Independent Board Members | | | | |
| | | | |
Name Year of Birth Position(s) Portfolios Overseen | | Principal Occupation(s) During Past Five Years | | Other Directorships Held During Past Five Years | | Length of
Board Service |
| | | | |
Ellen S. Alberding 1958 Board Member Portfolios Overseen: 95 | | President and Board Member, The Joyce Foundation (charitable foundation) (since 2002); formerly Vice Chair, City Colleges of Chicago (community college system) (2011-2015); Trustee, National Park Foundation (charitable foundation for national park system) (2009-2018); Trustee, Economic Club of Chicago (2009-2016); Trustee, Loyola University (since 2018). | | None. | | Since September 2013 |
| | | | |
Kevin J. Bannon 1952 Board Member Portfolios Overseen: 95 | | Retired; formerly Managing Director (April 2008-May 2015) and Chief Investment Officer (October 2008-November 2013) of Highmount Capital LLC (registered investment adviser); formerly Executive Vice President and Chief Investment Officer (April 1993-August 2007) of Bank of New York Company; President (May 2003-May 2007) of BNY Hamilton Family of Mutual Funds. | | Director of Urstadt Biddle Properties (equity real estate investment trust) (since September 2008). | | Since July 2008 |
PGIM Real Estate Income Fund
| | | | | | |
| Independent Board Members | | | | |
| | | | |
Name Year of Birth Position(s) Portfolios Overseen | | Principal Occupation(s) During Past Five Years | | Other Directorships Held During Past Five Years | | Length of
Board Service |
| | | | |
Linda W. Bynoe 1952 Board Member Portfolios Overseen: 92 | | President and Chief Executive Officer (since March 1995) and formerly Chief Operating Officer (December 1989-February 1995) of Telemat Limited LLC (formerly Telemat Ltd) (management consulting); formerly Vice President (January 1985-June 1989) at Morgan Stanley & Co. (broker-dealer). | | Trustee of Equity Residential (residential real estate) (since December 2009); Director of Northern Trust Corporation (financial services) (since April 2006); formerly Director of Anixter International, Inc. (communication products distributor) (January 2006-June 2020). | | Since March 2005 |
| | | | |
Barry H. Evans 1960 Board Member Portfolios Overseen: 94 | | Retired; formerly President (2005-2016), Global Chief Operating Officer (2014-2016), Chief Investment Officer - Global Head of Fixed Income (1998-2014), and various portfolio manager roles (1986-2006), Manulife Asset Management (asset management). | | Formerly Director, Manulife Trust Company (2011-2018); formerly Director, Manulife Asset Management Limited (2015-2017); formerly Chairman of the Board of Directors of Manulife Asset Management U.S. (2005-2016); formerly Chairman of the Board, Declaration Investment Management and Research (2008-2016). | | Since September 2017 |
| | | | |
Keith F. Hartstein 1956 Board Member & Independent Chair Portfolios Overseen: 95 | | Retired; Executive Committee of the Independent Directors Council (IDC) Board of Governors (since October 2019); Member (since November 2014) of the Governing Council of the IDC (organization of independent mutual fund directors); formerly President and Chief Executive Officer (2005-2012), Senior Vice President (2004-2005), Senior Vice President of Sales and Marketing (1997-2004), and various executive management positions (1990-1997), John Hancock Funds, LLC (asset management); Chairman, Investment Company Institute’s Sales Force Marketing Committee (2003-2008). | | None. | | Since September 2013 |
Visit our website at pgim.com/investments
| | | | | | |
| Independent Board Members | | | | |
| | | | |
Name Year of Birth Position(s) Portfolios Overseen | | Principal Occupation(s) During Past Five Years | | Other Directorships Held During Past Five Years | | Length of
Board Service |
| | | | |
Laurie Simon Hodrick 1962 Board Member Portfolios Overseen: 91 | | A. Barton Hepburn Professor Emerita of Economics in the Faculty of Business, Columbia Business School (since 2018); Visiting Fellow at the Hoover Institution, Stanford University (since 2015); Sole Member, ReidCourt LLC (since 2008) (a consulting firm); formerly Visiting Professor of Law, Stanford Law School (2015-2021); formerly A. Barton Hepburn Professor of Economics in the Faculty of Business, Columbia Business School (1996-2017); formerly Managing Director, Global Head of Alternative Investment Strategies, Deutsche Bank (2006-2008). | | Independent Director, Roku (since December 2020) (communication services); formerly Independent Director, Synnex Corporation (2019-2021) (information technology); formerly Independent Director, Kabbage, Inc. (2018-2020) (financial services); formerly Independent Director, Corporate Capital Trust (2017-2018) (a business development company). | | Since September 2017 |
| | | | |
Brian K. Reid 1961 Board Member Portfolios Overseen: 94 | | Retired; formerly Chief Economist for the Investment Company Institute (ICI) (2005-2017); formerly Senior Economist and Director of Industry and Financial Analysis at the ICI (1998-2004); formerly Senior Economist, Industry and Financial Analysis at the ICI (1996-1998); formerly Staff Economist at the Federal Reserve Board (1989-1996); Director, ICI Mutual Insurance Company (2012-2017). | | None. | | Since March 2018 |
PGIM Real Estate Income Fund
| | | | | | |
| Independent Board Members | | | | |
| | | | |
Name Year of Birth Position(s) Portfolios Overseen | | Principal Occupation(s) During Past Five Years | | Other Directorships Held During Past Five Years | | Length of
Board Service |
| | | | |
Grace C. Torres 1959 Board Member Portfolios Overseen: 94 | | Retired; formerly Treasurer and Principal Financial and Accounting Officer of the PGIM Funds, Target Funds, Advanced Series Trust, Prudential Variable Contract Accounts and The Prudential Series Fund (1998-June 2014); Assistant Treasurer (March 1999-June 2014) and Senior Vice President (September 1999-June 2014) of PGIM Investments LLC; Assistant Treasurer (May 2003-June 2014) and Vice President (June 2005-June 2014) of AST Investment Services, Inc.; Senior Vice President and Assistant Treasurer (May 2003-June 2014) of Prudential Annuities Advisory Services, Inc. | | Director (since January 2018) of OceanFirst Financial Corp. and OceanFirst Bank; formerly Director (July 2015-January 2018) of Sun Bancorp, Inc. N.A. and Sun National Bank. | | Since November 2014 |
| | | | | | |
| Interested Board Members | | | | |
| | | | |
Name Year of Birth Position(s) Portfolios Overseen | | Principal Occupation(s) During Past Five Years | | Other Directorships Held During Past Five Years | | Length of
Board Service |
| | | | |
Stuart S. Parker 1962 Board Member & President Portfolios Overseen: 94 | | President, Chief Executive Officer, Chief Operating Officer and Officer in Charge of PGIM Investments LLC (formerly known as Prudential Investments LLC) (since January 2012); formerly Executive Vice President of Jennison Associates LLC and Head of Retail Distribution of PGIM Investments LLC (June 2005-December 2011); Investment Company Institute - Board of Governors (since May 2012). | | None. | | Since January 2012 |
Visit our website at pgim.com/investments
| | | | | | |
| Interested Board Members | | | | |
| | | | |
Name Year of Birth Position(s) Portfolios Overseen | | Principal Occupation(s) During Past Five Years | | Other Directorships Held During Past Five Years | | Length of
Board Service |
| | | | |
Scott E. Benjamin 1973 Board Member & Vice President Portfolios Overseen: 95 | | Executive Vice President (since May 2009) of PGIM Investments LLC; Vice President (since June 2012) of Prudential Investment Management Services LLC; Executive Vice President (since September 2009) of AST Investment Services, Inc.; Senior Vice President of Product Development and Marketing, PGIM Investments (since February 2006); formerly Vice President of Product Development and Product Management, PGIM Investments LLC (2003-2006). | | None. | | Since March 2010 |
(1) The year that each Board Member joined the Board is as follows:
Ellen S. Alberding, 2013; Kevin J. Bannon, 2008; Linda W. Bynoe, 2005; Barry H. Evans, 2017; Keith F. Hartstein, 2013; Laurie Simon Hodrick, 2017; Michael S. Hyland, 2008; Richard A. Redeker, 1993; Stephen G. Stoneburn, 2003; Stuart S. Parker, Board Member since 2012 and President since 2012; Scott E. Benjamin, Board Member since 2010 and Vice President since 2009; Grace C. Torres, 2014.
| | | | |
| Fund Officers(a) | | | | |
| | | |
Name Year of Birth Fund Position | | Principal Occupation(s) During Past Five Years | | Length of Service as Fund Officer |
| | | |
Claudia DiGiacomo 1974 Chief Legal Officer | | Chief Legal Officer, Executive Vice President and Secretary of PGIM Investments LLC (since August 2020); Chief Legal Officer of Prudential Mutual Fund Services LLC (since August 2020); Chief Legal Officer of PIFM Holdco, LLC (since August 2020); Vice President and Corporate Counsel (since January 2005) of Prudential; and Corporate Counsel of AST Investment Services, Inc. (since August 2020); formerly Vice President and Assistant Secretary of PGIM Investments LLC (2005-2020); formerly Associate at Sidley Austin Brown & Wood LLP (1999-2004). | | Since December 2005 |
PGIM Real Estate Income Fund
| | | | |
| Fund Officers(a) | | | | |
| | | |
Name Year of Birth Fund Position | | Principal Occupation(s) During Past Five Years | | Length of
Service as Fund
Officer |
| | | |
Dino Capasso 1974 Chief Compliance Officer | | Chief Compliance Officer (since July 2019) of PGIM Investments LLC; Chief Compliance Officer (since July 2019) of the PGIM Funds, Target Funds, Advanced Series Trust, The Prudential Series Fund, Prudential’s Gibraltar Fund, Inc., PGIM Global High Yield Fund, Inc., PGIM High Yield Bond Fund, Inc., and PGIM Short Duration High Yield Opportunities Fund; Vice President and Deputy Chief Compliance Officer (June 2017-2019) of PGIM Investments LLC; formerly Senior Vice President and Senior Counsel (January 2016-June 2017), and Vice President and Counsel (February 2012-December 2015) of Pacific Investment Management Company LLC. | | Since July 2019 |
| | | |
Andrew R. French 1962 Secretary | | Vice President (since December 2018) of PGIM Investments LLC; formerly Vice President and Corporate Counsel (2010-2018) of Prudential; formerly Director and Corporate Counsel (2006-2010) of Prudential; Vice President and Assistant Secretary (since January 2007) of PGIM Investments LLC; Vice President and Assistant Secretary (since January 2007) of Prudential Mutual Fund Services LLC. | | Since October 2006 |
| | | |
Diana N. Huffman 1982 Assistant Secretary | | Vice President and Corporate Counsel (since September 2015) of Prudential; Vice President and Assistant Secretary (since August 2020) of PGIM Investments LLC; formerly Associate at Willkie Farr & Gallagher LLP (2009-2015). | | Since March 2019 |
| | | |
Melissa Gonzalez 1980 Assistant Secretary | | Vice President and Corporate Counsel (since September 2018) of Prudential; Vice President and Assistant Secretary (since August 2020) of PGIM Investments LLC; formerly Director and Corporate Counsel (March 2014-September 2018) of Prudential. | | Since March 2020 |
| | | |
Patrick E. McGuinness 1986 Assistant Secretary | | Vice President and Assistant Secretary (since August 2020) of PGIM Investments LLC; Director and Corporate Counsel (since February 2017) of Prudential; and Corporate Counsel (2012-2017) of IIL, Inc. | | Since June 2020 |
| | | |
Debra Rubano 1975 Assistant Secretary | | Vice President and Corporate Counsel (since November 2020) of Prudential; formerly Director and Senior Counsel of Allianz Global Investors U.S. Holdings LLC (2010-2020) and Assistant Secretary of numerous funds in the Allianz fund complex (2015-2020). | | Since December 2020 |
| | | |
Kelly A. Coyne 1968 Assistant Secretary | | Director, Investment Operations of Prudential Mutual Fund Services LLC (since 2010). | | Since March 2015 |
Visit our website at pgim.com/investments
| | | | |
| Fund Officers(a) | | | | |
| | | |
Name Year of Birth Fund Position | | Principal Occupation(s) During Past Five Years | | Length of
Service as Fund
Officer |
| | | |
Christian J. Kelly 1975 Treasurer and Principal Financial and Accounting Officer | | Vice President, Head of Fund Administration of PGIM Investments LLC (since November 2018); formerly Director of Fund Administration of Lord Abbett & Co. LLC (2009-2018), Treasurer and Principal Accounting Officer of the Lord Abbett Family of Funds (2017-2018); Director of Accounting, Avenue Capital Group (2008-2009); Senior Manager, Investment Management Practice of Deloitte & Touche LLP (1998-2007). | | Since January 2019 |
| | | |
Lana Lomuti 1967 Assistant Treasurer | | Vice President (since 2007) and Director (2005-2007), within PGIM Investments Fund Administration; formerly Assistant Treasurer (December 2007-February 2014) of The Greater China Fund, Inc. | | Since April 2014 |
| | | |
Russ Shupak 1973 Assistant Treasurer | | Vice President (since 2017) and Director (2013-2017), within PGIM Investments Fund Administration. | | Since September 2019 |
| | | |
Deborah Conway 1969 Assistant Treasurer | | Vice President (since 2017) and Director (2007-2017), within PGIM Investments Fund Administration. | | Since September 2019 |
| | | |
Elyse M. McLaughlin 1974 Assistant Treasurer | | Vice President (since 2017) and Director (2011-2017), within PGIM Investments Fund Administration. | | Since September 2019 |
| | | |
Jonathan Corbett 1983 Anti-Money Laundering Compliance Officer | | Vice President, Corporate Compliance, Global Compliance Programs and Compliance Risk Management (since August 2019) of Prudential; formerly Vice President and Head of Key Risk Areas Compliance (March 2016 to July 2019), Chief Privacy Officer (March 2016 to July 2019) and Head of Global Financial Crimes Unit (April 2014 to March 2016) at MetLife. | | Since October 2021 |
(a) Excludes Mr. Parker and Mr. Benjamin, interested Board Members who also serve as President and Vice President, respectively.
Explanatory Notes to Tables:
| ∎ | | Board Members are deemed to be “Interested,” as defined in the 1940 Act, by reason of their affiliation with PGIM Investments LLC and/or an affiliate of PGIM Investments LLC. |
| ∎ | | Unless otherwise noted, the address of all Board Members and Officers is c/o PGIM Investments LLC, 655 Broad Street, Newark, New Jersey 07102-4410. |
| ∎ | | There is no set term of office for Board Members or Officers. The Board Members have adopted a retirement policy, which calls for the retirement of Board Members on December 31 of the year in which they reach the age of 75. |
| ∎ | | “Other Directorships Held” includes all directorships of companies required to register or file reports with the SEC under the 1934 Act (that is, “public companies”) or other investment companies registered under the 1940 Act. |
| ∎ | | “Portfolios Overseen” includes all investment companies managed by PGIM Investments LLC. The investment companies for which PGIM Investments LLC serves as manager include the PGIM Funds, Target Funds, The Prudential Variable Contract Accounts, PGIM ETF Trust, PGIM High Yield Bond Fund, Inc., PGIM Global High Yield Fund, Inc., PGIM Short Duration High Yield Opportunities Fund, The Prudential Series Fund, Prudential’s Gibraltar Fund, Inc. and the Advanced Series Trust. |
| ∎ | | As used in the Fund Officers table “Prudential” means The Prudential Insurance Company of America. |
PGIM Real Estate Income Fund
Approval of Advisory Agreements (unaudited)
The Fund’s Board of Trustees
The Board of Trustees (the “Board”) of PGIM Real Estate Income Fund (the “Fund”)1 consists of ten individuals, eight of whom are not “interested persons” of the Fund, as defined in the Investment Company Act of 1940, as amended (the “1940 Act”) (the “Independent Trustees”). The Board is responsible for the oversight of the Fund and its operations, and performs the various duties imposed on the directors of investment companies by the 1940 Act. The Independent Trustees have retained independent legal counsel to assist them in connection with their duties. The Chair of the Board is an Independent Trustee. The Board has established four standing committees: the Audit Committee, the Nominating and Governance Committee, and two Investment Committees. Each committee is chaired by, and composed of, Independent Trustees.
Annual Approval of the Fund’s Advisory Agreements
As required under the 1940 Act, the Board determines annually whether to renew the Fund’s management agreement with PGIM Investments LLC (“PGIM Investments”) and the Fund’s subadvisory agreement with PGIM Real Estate (UK) Limited (“PGIM RE (UK)”) and PGIM, Inc. (“PGIM”) on behalf of its PGIM Real Estate unit (“PGIM Real Estate”). In considering the renewal of the agreements, the Board, including all of the Independent Trustees, met on June 7-10, 2021 and approved the renewal of the agreements through July 31, 2022, after concluding that the renewal of the agreements was in the best interests of the Fund and its shareholders.
In advance of the meetings, the Board requested and received materials relating to the agreements, and had the opportunity to ask questions and request further information in connection with its consideration. Among other things, the Board considered comparative fee information from PGIM Investments, PGIM RE (UK) and PGIM. Also, the Board considered comparisons with other mutual funds in relevant Peer Universes and Peer Groups, as is further discussed below.
In approving the agreements, the Board, including the Independent Trustees advised by independent legal counsel, considered the factors it deemed relevant, including the nature, quality and extent of services provided by PGIM Investments and the subadvisers, the performance of the Fund, the profitability of PGIM Investments and its affiliates, expenses and fees, and the potential for economies of scale that may be shared with the Fund and its shareholders as the Fund’s assets grow. In their deliberations, the Trustees did not identify any single factor which alone was responsible for the Board’s decision to approve the agreements with respect to the Fund. In connection with its deliberations, the Board considered information provided by PGIM Investments throughout the year at regular Board meetings, presentations from portfolio managers and other information, as well as information furnished at or in advance of the meetings on June 7-10, 2021.
| 1 | PGIM Real Estate Income Fund is a series of Prudential Investment Portfolios 9. |
PGIM Real Estate Income Fund
Approval of Advisory Agreements (continued)
The Trustees determined that the overall arrangements between the Fund and PGIM Investments, which serves as the Fund’s investment manager pursuant to a management agreement, and between PGIM Investments and each of PGIM RE (UK) and PGIM, which serve as the Fund’s subadvisers pursuant to the terms of a subadvisory agreement with PGIM Investments, are in the best interests of the Fund and its shareholders in light of the services performed, fees charged and such other matters as the Trustees considered relevant in the exercise of their business judgment.
The material factors and conclusions that formed the basis for the Trustees’ reaching their determinations to approve the continuance of the agreements are separately discussed below.
Nature, Quality and Extent of Services
The Board received and considered information regarding the nature, quality and extent of services provided to the Fund by PGIM Investments, PGIM RE (UK) and PGIM Real Estate. The Board noted that PGIM Real Estate and PGIM RE (UK) are affiliated with PGIM Investments. The Board considered the services provided by PGIM Investments, including but not limited to the oversight of the subadvisers for the Fund, as well as the provision of fund recordkeeping, compliance and other services to the Fund and PGIM Investments’ role as the administrator for the Fund’s liquidity risk management program. With respect to PGIM Investments’ oversight of the subadvisers, the Board noted that PGIM Investments’ Strategic Investment Research Group (“SIRG”), which is a business unit of PGIM Investments, is responsible for monitoring and reporting to PGIM Investments’ senior management on the performance and operations of the subadvisers. The Board also considered that PGIM Investments pays the salaries of all of the officers and interested Trustees of the Fund who are part of Fund management. The Board also considered the investment subadvisory services provided by PGIM Real Estate and PGIM RE (UK), including investment research and security selection, as well as adherence to the Fund’s investment restrictions and compliance with applicable Fund policies and procedures. The Board considered PGIM Investments’ evaluation of the subadvisers, as well as PGIM Investments’ recommendation, based on its review of the subadvisers, to renew the subadvisory agreement.
The Board considered the qualifications, backgrounds and responsibilities of PGIM Investments’ senior management responsible for the oversight of the Fund, PGIM RE (UK) and PGIM Real Estate, and also considered the qualifications, backgrounds and responsibilities of the PGIM RE (UK) and PGIM Real Estate portfolio managers who are responsible for the day-to-day management of the Fund’s portfolio. The Board was provided with information pertaining to PGIM Investments’, PGIM Real Estate’s, PGIM RE (UK)’s and PGIM’s organizational structure, senior management, investment operations, and other relevant information pertaining to PGIM Investments, PGIM Real Estate, PGIM RE (UK) and PGIM. The Board also noted that it received favorable compliance reports from the Fund’s Chief Compliance Officer (“CCO”) as to PGIM Investments, PGIM Real Estate, PGIM RE (UK) and PGIM.
Visit our website at pgim.com/investments
The Board concluded that it was satisfied with the nature, extent and quality of the investment management services provided by PGIM Investments and the subadvisory services provided to the Fund by PGIM Real Estate and PGIM RE (UK), and that there was a reasonable basis on which to conclude that the Fund benefits from the services provided by PGIM Investments, PGIM RE (UK) and PGIM Real Estate under the management and subadvisory agreements.
Costs of Services and Profits Realized by PGIM Investments
The Board was provided with information on the profitability of PGIM Investments and its affiliates in serving as the Fund’s investment manager. The Board discussed with PGIM Investments the methodology utilized in assembling the information regarding profitability and considered its reasonableness. The Board recognized that it is difficult to make comparisons of profitability from fund management contracts because comparative information is not generally publicly available and is affected by numerous factors, including the structure of the particular adviser, the types of funds it manages, its business mix, numerous assumptions regarding allocations and the adviser’s capital structure and cost of capital. However, the Board considered that the cost of services provided by PGIM Investments to the Fund during the year ended December 31, 2020 exceeded the management fees paid by the Fund, resulting in an operating loss to PGIM Investments. Taking these factors into account, the Board concluded that the profitability of PGIM Investments and its affiliates in relation to the services rendered was not unreasonable.
Economies of Scale
The Board received and discussed information concerning economies of scale that PGIM Investments may realize as the Fund’s assets grow beyond current levels. The Board noted that the management fee schedule for the Fund includes breakpoints, which have the effect of decreasing the fee rate as assets increase. During the course of time, the Board has considered information regarding the launch date of the Fund, the management fees of the Fund compared to those of similarly managed funds and PGIM Investments’ investment in the Fund over time. The Board noted that economies of scale can be shared with the Fund in other ways, including low management fees from inception, additional technological and personnel investments to enhance shareholder services, and maintaining existing expense structures in the face of a rising cost environment. The Board also considered PGIM Investments’ assertion that it continually evaluates the management fee schedule of the Fund and the potential to share economies of scale through breakpoints or fee waivers as asset levels increase.
The Board recognized the inherent limitations of any analysis of economies of scale, stemming largely from the Board’s understanding that most of PGIM Investments’ costs are not specific to individual funds, but rather are incurred across a variety of products and services.
PGIM Real Estate Income Fund
Approval of Advisory Agreements (continued)
Other Benefits to PGIM Investments, PGIM RE (UK) and PGIM Real Estate
The Board considered potential ancillary benefits that might be received by PGIM Investments, PGIM Real Estate, PGIM RE (UK) and their affiliates as a result of their relationship with the Fund. The Board concluded that potential benefits to be derived by PGIM Investments included transfer agency fees received by the Fund’s transfer agent (which is affiliated with PGIM Investments), and benefits to its reputation as well as other intangible benefits resulting from PGIM Investments’ association with the Fund. The Board concluded that the potential benefits to be derived by PGIM Real Estate and PGIM RE (UK) included the ability to use soft dollar credits, as well as the potential benefits consistent with those generally resulting from an increase in assets under management, specifically, potential access to additional research resources and benefits to its reputation. The Board concluded that the benefits derived by PGIM Investments, PGIM Real Estate and PGIM RE (UK) were consistent with the types of benefits generally derived by investment managers and subadvisers to mutual funds.
Performance of the Fund / Fees and Expenses
The Board considered certain additional factors and made related conclusions relating to the historical performance of the Fund for the one-, three- and five-year periods ended December 31, 2020. The Board considered that the Fund commenced operations on June 3, 2015 and that longer-term performance was not yet available.
The Board also considered the Fund’s actual management fee, as well as the Fund’s net total expense ratio, for the fiscal year ended October 31, 2020. The Board considered the management fee for the Fund as compared to the management fee charged by PGIM Investments to other funds and the fee charged by other advisers to comparable mutual funds in a Peer Group. The actual management fee represents the fee rate actually paid by Fund shareholders and includes any fee waivers or reimbursements. The net total expense ratio for the Fund represents the actual expense ratio incurred by Fund shareholders.
The mutual funds included in the Peer Universe, which was used to consider performance, and the Peer Group, which was used to consider expenses and fees, were objectively determined by Broadridge, an independent provider of mutual fund data. In certain circumstances, PGIM Investments also provided supplemental Peer Universe or Peer Group information for reasons addressed with the Board. The comparisons placed the Fund in various quartiles over various periods, with the first quartile being the best 25% of the mutual funds (for performance, the best performing mutual funds and, for expenses, the lowest cost mutual funds).
The section below summarizes key factors considered by the Board and the Board’s conclusions regarding the Fund’s performance, fees and overall expenses. The table sets forth net performance comparisons (which reflect the impact on performance of fund expenses, or any subsidies, expense caps or waivers that may be applicable) with the Peer Universe, actual management fees with the Peer Group (which reflect the
Visit our website at pgim.com/investments
impact of any subsidies or fee waivers), and net total expenses with the Peer Group, each of which were key factors considered by the Board.
| | | | | | | | |
| Net Performance | | 1 Year | | 3 Years | | 5 Years | | 10 Years |
| | | 4th Quartile | | 3rd Quartile | | 2nd Quartile | | N/A |
| Actual Management Fees: 1st Quartile |
| Net Total Expenses: 3rd Quartile |
| | ● | | The Board noted that the Fund underperformed its benchmark index over the one-year period and outperformed over the three- and five-year periods. |
| | ● | | The Board considered that the Fund outperformed its benchmark index and peer group for the fourth quarter of 2020 and first quarter of 2021 (ranking in the 44th and 22nd percentile, respectively) and also outperformed its benchmark index and peer group for all rolling periods ended March 31, 2021. |
| | ● | | The Board and PGIM Investments agreed to retain the Fund’s existing contractual expense cap, which (exclusive of certain fees and expenses) caps the Fund’s annual operating expenses at 1.35% for Class A shares, 2.10% for Class C shares, 1.10% for Class R6 shares, and 1.10% for Class Z shares through February 28, 2022. |
| | ● | | In addition, PGIM Investments will waive management fees or shared operating expenses on any share class to the same extent that it waives such expenses on any other share class, and has agreed that total annual fund operating expenses for Class R6 shares will not exceed total annual fund operating expenses for Class Z shares. |
| | ● | | The Board concluded that, in light of the above, it would be in the best interests of the Fund and its shareholders to renew the agreements. |
| | ● | | The Board concluded that the management fees (including subadvisory fees) and total expenses were reasonable in light of the services provided. |
* * *
After full consideration of these factors, the Board concluded that the approval of the agreements was in the best interests of the Fund and its shareholders.
PGIM Real Estate Income Fund
| | | | |
| | | |
| ∎ MAIL | | ∎ TELEPHONE | | ∎ WEBSITE |
655 Broad Street Newark, NJ 07102 | | (800) 225-1852 | | pgim.com/investments |
|
| PROXY VOTING |
| The Board of Trustees of the Fund has delegated to the Fund’s subadvisers the responsibility for voting any proxies and maintaining proxy recordkeeping with respect to the Fund. A description of these proxy voting policies and procedures is available without charge, upon request, by calling (800) 225-1852 or by visiting the Securities and Exchange Commission’s website at sec.gov. Information regarding how the Fund voted proxies relating to portfolio securities during the most recent 12-month period ended June 30 is available on the Fund’s website and on the Securities and Exchange Commission’s website. |
| |
|
| TRUSTEES |
| Ellen S. Alberding • Kevin J. Bannon • Scott E. Benjamin • Linda W. Bynoe • Barry H. Evans • Keith F. Hartstein • Laurie Simon Hodrick • Stuart S. Parker • Brian K. Reid • Grace C. Torres |
| |
|
| OFFICERS |
| Stuart S. Parker, President • Scott E. Benjamin, Vice President • Christian J. Kelly, Treasurer and Principal Financial and Accounting Officer • Claudia DiGiacomo, Chief Legal Officer • Dino Capasso, Chief Compliance Officer • Jonathan Corbett, Anti-Money Laundering Compliance Officer • Andrew R. French, Secretary • Melissa Gonzalez, Assistant Secretary • Diana N. Huffman, Assistant Secretary • Kelly A. Coyne, Assistant Secretary • Patrick E. McGuinness, Assistant Secretary • Debra Rubano, Assistant Secretary • Lana Lomuti, Assistant Treasurer • Russ Shupak, Assistant Treasurer • Elyse M. McLaughlin, Assistant Treasurer • Deborah Conway, Assistant Treasurer |
| |
| | | | |
| MANAGER | | PGIM Investments LLC | | 655 Broad Street Newark, NJ 07102 |
|
| SUBADVISERS | | PGIM Real Estate PGIM Real Estate (UK) Limited | | 7 Giralda Farms Madison, NJ 07940 Grand Buildings, 1-3 Strand Trafalgar Square London, WC2N 5HR United Kingdom |
|
| DISTRIBUTOR | | Prudential Investment Management Services LLC | | 655 Broad Street Newark, NJ 07102 |
|
| CUSTODIAN | | The Bank of New York Mellon | | 240 Greenwich Street New York, NY 10286 |
|
| TRANSFER AGENT | | Prudential Mutual Fund Services LLC | | PO Box 9658 Providence, RI 02940 |
|
| INDEPENDENT REGISTERED PUBLIC ACCOUNTING FIRM | | PricewaterhouseCoopers LLP | | 300 Madison Avenue New York, NY 10017 |
|
| FUND COUNSEL | | Willkie Farr & Gallagher LLP | | 787 Seventh Avenue New York, NY 10019 |
|
|
| An investor should consider the investment objectives, risks, charges, and expenses of the Fund carefully before investing. The prospectus and summary prospectus contain this and other information about the Fund. An investor may obtain the prospectus and summary prospectus by visiting our website at pgim.com/investments or by calling (800) 225-1852. The prospectus and summary prospectus should be read carefully before investing. |
|
| E-DELIVERY |
| To receive your mutual fund documents online, go to pgim.com/investments/resource/edelivery and enroll. Instead of receiving printed documents by mail, you will receive notification via email when new materials are available. You can cancel your enrollment or change your email address at any time by visiting the website address above. |
|
| SHAREHOLDER COMMUNICATIONS WITH TRUSTEES |
| Shareholders can communicate directly with the Board of Trustees by writing to the Chair of the Board, PGIM Real Estate Income Fund, PGIM Investments, Attn: Board of Trustees, 655 Broad Street, Newark, NJ 07102. Shareholders can communicate directly with an individual Trustee by writing to that Trustee at the same address. Communications are not screened before being delivered to the addressee. |
|
| AVAILABILITY OF PORTFOLIO HOLDINGS |
| The Fund files its complete schedule of portfolio holdings with the Securities and Exchange Commission for the first and third quarters of each fiscal year as an exhibit to its reports on Form N-PORT. The Fund’s Form N-PORT filings are available on the Commission’s website at sec.gov. |
|
| The Fund’s Statement of Additional Information contains additional information about the Fund’s Trustees and is available without charge, upon request, by calling (800) 225-1852. |
Mutual Funds:
| | | | |
ARE NOT INSURED BY THE FDIC OR ANY FEDERAL GOVERNMENT AGENCY | | MAY LOSE VALUE | | ARE NOT A DEPOSIT OF OR GUARANTEED BY ANY BANK OR ANY BANK AFFILIATE |

| | | | | | | | |
PGIM REAL ESTATE INCOME FUND |
| SHARE CLASS | | A | | C | | Z | | R6 |
| NASDAQ | | PRKAX | | PRKCX | | PRKZX | | PRKQX |
| CUSIP | | 74441J761 | | 74441J753 | | 74441J746 | | 74441J670 |
MF228E
Item 2 – Code of Ethics — See Exhibit (a)
As of the end of the period covered by this report, the registrant has adopted a code of ethics (the “Section 406 Standards for Investment Companies – Ethical Standards for Principal Executive and Financial Officers”) that applies to the registrant’s Principal Executive Officer and Principal Financial Officer; the registrant’s Principal Financial Officer also serves as the Principal Accounting Officer.
The registrant hereby undertakes to provide any person, without charge, upon request, a copy of the code of ethics. To request a copy of the code of ethics, contact the registrant 800-225-1852, and ask for a copy of the Section 406 Standards for Investment Companies - Ethical Standards for Principal Executive and Financial Officers.
Item 3 – Audit Committee Financial Expert –
The registrant’s Board has determined that Ms. Grace C. Torres, member of the Board’s Audit Committee is an “audit committee financial expert,” and that she is “independent,” for purposes of this item.
Item 4 – Principal Accountant Fees and Services –
(a) Audit Fees
For the fiscal year ended October 31, 2021 and October 31, 2020, PricewaterhouseCoopers LLP (“PwC”), the Registrant’s principal accountant, billed the Registrant $206,750 and $206,750 respectively, for professional services rendered for the audit of the Registrant’s annual financial statements or services that are normally provided in connection with statutory and regulatory filings.
(b) Audit-Related Fees
For the fiscal years ended October 31, 2021 and October 31, 2020, PwC did not bill the Registrant for audit-related services.
For the fiscal year ended October 31, 2020, fees of $10,057 were billed to the Registrant for services rendered by KPMG LLP (the Registrant’s prior principal accountant) in connection with the auditor transition.
(c) Tax Fees
For the fiscal years ended October 31, 2021 and October 31, 2020: none.
(d) All Other Fees
For the fiscal years ended October 31, 2021 and October 31, 2020: none.
(e) (1) Audit Committee Pre-Approval Policies and Procedures
THE PGIM MUTUAL FUNDS
AUDIT COMMITTEE POLICY
on
Pre-Approval of Services Provided by the Independent
Accountants
The Audit Committee of each PGIM Mutual Fund is charged with the responsibility to monitor the independence of the Fund’s independent accountants. As part of this responsibility, the Audit Committee must pre-approve the independent accounting firm’s engagement to render audit and/or permissible non-audit services, as required by law. In evaluating a proposed engagement of the independent accountants, the Audit Committee will assess the effect that the engagement might reasonably be expected to have on the accountant’s independence. The Committee’s evaluation will be based on:
| | • | | a review of the nature of the professional services expected to be provided, |
| | • | | a review of the safeguards put into place by the accounting firm to safeguard independence, and |
| | • | | periodic meetings with the accounting firm. |
Policy for Audit and Non-Audit Services Provided to the Funds
On an annual basis, the scope of audits for each Fund, audit fees and expenses, and audit-related and non-audit services (and fees proposed in respect thereof) proposed to be performed by the Fund’s independent accountants will be presented by the Treasurer and the independent accountants to the Audit Committee for review and, as appropriate, approval prior to the initiation of such services.
Such presentation shall be accompanied by confirmation by both the Treasurer and the independent accountants that the proposed
non-audit services will not adversely affect the independence of the independent accountants. Such proposed non-audit services shall be described in sufficient detail to enable the Audit Committee to assess the appropriateness of such services and fees, and the compatibility of the provision of such services with the auditor’s independence. The Committee shall receive periodic reports on the progress of the audit and other services which are approved by the Committee or by the Committee Chair pursuant to authority delegated in this Policy.
The categories of services enumerated under “Audit Services”, “Audit-related Services”, and “Tax Services” are intended to provide guidance to the Treasurer and the independent accountants as to those categories of services which the Committee believes are generally consistent with the independence of the independent accountants and which the Committee (or the Committee Chair) would expect upon the presentation of specific proposals to pre-approve. The enumerated categories are not intended as an exclusive list of audit, audit-related or tax services, which the Committee (or the Committee Chair) would consider for pre-approval.
Audit Services
The following categories of audit services are considered to be consistent with the role of the Fund’s independent accountants:
| | • | | Annual Fund financial statement audits |
| | • | | Seed audits (related to new product filings, as required) |
| | • | | SEC and regulatory filings and consents |
Audit-related Services
The following categories of audit-related services are considered to be consistent with the role of the Fund’s independent accountants:
| | • | | Accounting consultations |
| | • | | Fund merger support services |
| | • | | Agreed Upon Procedure Reports |
| | • | | Other Internal Control Reports |
Individual audit-related services that fall within one of these categories (except for fund merger support services) and are not presented to the Audit Committee as part of the annual pre-approval process are subject to an authorized pre-approval by the Audit Committee so long as the estimated fee for those services does not exceed $30,000. Any services provided under such pre-approval will be reported to the Audit Committee at its next regular meeting. Should the amount of such services exceed $30,000 any additional fees will be subject to pre-approval by the Committee Chair (or any other Committee member on whom this responsibility has been delegated). Fees related to fund merger support services are subject to a separate authorized pre-approval by the Audit Committee with fees determined on a per occurrence and merger complexity basis.
Tax Services
The following categories of tax services are considered to be consistent with the role of the Fund’s independent accountants:
| | • | | Tax compliance services related to the filing or amendment of the following: |
| | • | | Federal, state and local income tax compliance; and, |
| | • | | Sales and use tax compliance |
| | • | | Timely RIC qualification reviews |
| | • | | Tax distribution analysis and planning |
| | • | | Tax authority examination services |
| | • | | Tax appeals support services |
| | • | | Accounting methods studies |
| | • | | Fund merger support services |
| | • | | Tax consulting services and related projects |
Individual tax services that fall within one of these categories and are not presented to the Audit Committee as part of the annual pre-approval process are subject to an authorized pre-approval by the Audit Committee so long as the estimated fee for those services does not exceed $30,000. Any services provided under such pre-approval will be reported to the Audit Committee at its next regular meeting. Should the amount of such services exceed $30,000 any additional fees will be subject to pre-approval by the Committee Chair (or any other Committee member on whom this responsibility has been delegated).
Other Non-Audit Services
Certain non-audit services that the independent accountants are legally permitted to render will be subject to pre-approval by the Committee or by one or more Committee members to whom the Committee has delegated this authority and who will report to the full Committee any pre-approval decisions made pursuant to this Policy. Non-audit services presented for pre-approval pursuant to this paragraph will be accompanied by a confirmation from both the Treasurer and the independent accountants that the proposed services will not adversely affect the independence of the independent accountants.
Proscribed Services
The Fund’s independent accountants will not render services in the following categories of non-audit services:
| | • | | Bookkeeping or other services related to the accounting records or financial statements of the Fund |
| | • | | Financial information systems design and implementation |
| | • | | Appraisal or valuation services, fairness opinions, or contribution-in-kind reports |
| | • | | Internal audit outsourcing services |
| | • | | Management functions or human resources |
| | • | | Broker or dealer, investment adviser, or investment banking services |
| | • | | Legal services and expert services unrelated to the audit |
| | • | | Any other service that the Public Company Accounting Oversight Board determines, by regulation, is impermissible. |
Pre-approval of Non-Audit Services Provided to Other Entities Within the PGIM Fund Complex
Certain non-audit services provided to PGIM Investments LLC or any of its affiliates that also provide ongoing services to the PGIM Mutual Funds will be subject to pre-approval by the Audit Committee. The only non-audit services provided to these entities that will require pre-approval are those related directly to the operations and financial reporting of the Funds. Individual projects that are not presented to the Audit Committee as part of the annual pre-approval process will be subject
to pre-approval by the Committee Chair (or any other Committee member on whom this responsibility has been delegated) so long as the estimated fee for those services does not exceed $30,000. Services presented for pre-approval pursuant to this paragraph will be accompanied by a confirmation from both the Treasurer and the independent accountants that the proposed services will not adversely affect the independence of the independent accountants.
Although the Audit Committee will not pre-approve all services provided to PGIM Investments LLC and its affiliates, the Committee will receive an annual report from the Fund’s independent accounting firm showing the aggregate fees for all services provided to PGIM Investments and its affiliates.
(e) (2) Percentage of services referred to in 4(b) – 4(d) that were approved by the audit committee –
For the fiscal years ended October 31, 2021 and October 31, 2020, 100% of the services referred to in Item 4(b) was approved by the audit committee.
(f) Percentage of hours expended attributable to work performed by other than full time employees of principal accountant if greater than 50%.
The percentage of hours expended on the principal accountant’s engagement to audit the registrant’s financial statements for the most recent fiscal year that were attributed to work performed by persons other than the principal accountant’s full-time, permanent employees was 0%.
(g) Non-Audit Fees
The aggregate non-audit fees billed by the Registrant’s principal accountant for services rendered to the registrant’s investment adviser and any entity controlling, controlled by, or under common control with the investment adviser that provides ongoing services to the registrant for the fiscal years ended October 31, 2021 and October 31, 2020 was $0 and $0, respectively.
(h) Principal Accountant’s Independence
Not applicable as the Registrant’s principal accountant has not provided non-audit services to the registrant’s investment adviser and any entity controlling, controlled by, or under common control with the investment adviser that provides ongoing services to the registrant that were not pre-approved pursuant to Rule 2-01(c)(7)(ii) of Regulation S-X.
| Item 5 – | Audit Committee of Listed Registrants – Not applicable. |
| Item 6 – | Schedule of Investments – The schedule is included as part of the report to shareholders filed under Item 1 of this Form. |
| Item 7 – | Disclosure of Proxy Voting Policies and Procedures for Closed-End Management Investment Companies – Not applicable. |
| Item 8 – | Portfolio Managers of Closed-End Management Investment Companies – Not applicable. |
| Item 9 – | Purchases of Equity Securities by Closed-End Management Investment Company and Affiliated Purchasers – Not applicable. |
| Item 10 – | Submission of Matters to a Vote of Security Holders – There have been no material changes to these procedures. |
| Item 11 – | Controls and Procedures |
| | (a) | It is the conclusion of the registrant’s principal executive officer and principal financial officer that the effectiveness of the registrant’s current disclosure controls and procedures (such disclosure controls and procedures having been evaluated within 90 days of the date of this filing) provide reasonable assurance that the information required to be disclosed by the registrant has been recorded, processed, summarized and reported within the time period specified in the Commission’s rules and forms and that the information |
| | required to be disclosed by the registrant has been accumulated and communicated to the registrant’s principal executive officer and principal financial officer in order to allow timely decisions regarding required disclosure. |
| | (b) | There has been no significant change in the registrant’s internal control over financial reporting that occurred during the registrant’s most recent fiscal quarter of the period covered by this report that has materially affected, or is likely to materially affect, the registrant’s internal control over financial reporting. |
Item 12 – Controls and Procedures - Disclosure of Securities Lending Activities for Closed-End Management Investment Companies – Not applicable.
Item 13 – Exhibits
| | | (3) Any written solicitation to purchase securities under Rule 23c-1 – Not applicable. |
SIGNATURES
Pursuant to the requirements of the Securities Exchange Act of 1934 and the Investment Company Act of 1940, the registrant has duly caused this report to be signed on its behalf by the undersigned, thereunto duly authorized.
| | |
| Registrant: | | Prudential Investment Portfolios 9 |
| |
| By: | | /s/ Andrew R. French |
| | Andrew R. French |
| | Secretary |
| |
| Date: | | December 17, 2021 |
Pursuant to the requirements of the Securities Exchange Act of 1934 and the Investment Company Act of 1940, this report has been signed below by the following persons on behalf of the registrant and in the capacities and on the dates indicated.
| | |
| By: | | /s/ Stuart S. Parker |
| | Stuart S. Parker |
| | President and Principal Executive Officer |
| |
| Date: | | December 17, 2021 |
| |
| By: | | /s/ Christian J. Kelly |
| | Christian J. Kelly |
| | Treasurer and Principal Financial and Accounting Officer |
| |
| Date: | | December 17, 2021 |