UNITED STATES
SECURITIES AND EXCHANGE COMMISSION
Washington, D.C. 20549
FORM N-CSR
CERTIFIED SHAREHOLDER REPORT OF REGISTERED MANAGEMENT INVESTMENT COMPANIES
| | |
| Investment Company Act file number: | | 811-09101 |
| |
| Exact name of registrant as specified in charter: | | Prudential Investment Portfolios 9 |
| |
| Address of principal executive offices: | | 655 Broad Street, 6th Floor |
| | Newark, New Jersey 07102 |
| |
| Name and address of agent for service: | | Andrew R. French |
| | 655 Broad Street, 6th Floor |
| | Newark, New Jersey 07102 |
| |
| Registrant’s telephone number, including area code: | | 800-225-1852 |
| |
| Date of fiscal year end: | | 10/31/2023 |
| |
| Date of reporting period: | | 10/31/2023 |
Item 1 – Reports to Stockholders

PGIM ABSOLUTE RETURN BOND FUND
ANNUAL REPORT
OCTOBER 31, 2023

To enroll in e-delivery, go to pgim.com/investments/resource/edelivery
Table of Contents
This report is not authorized for distribution to prospective investors unless preceded or accompanied by a current prospectus.
The views expressed in this report and information about the Fund’s portfolio holdings are for the period covered by this report and are subject to change thereafter.
Mutual funds are distributed by Prudential Investment Management Services LLC (PIMS), member SIPC. PGIM Fixed Income is a unit of PGIM, Inc. (PGIM), a registered investment adviser. PIMS and PGIM are Prudential Financial companies. © 2023 Prudential Financial, Inc. and its related entities. PGIM and the PGIM logo are service marks of Prudential Financial, Inc. and its related entities, registered in many jurisdictions worldwide.
2 Visit our website at pgim.com/investments
Letter from the President
| | |
 | | Dear Shareholder: We hope you find the annual report for the PGIM Absolute Return Bond Fund informative and useful. The report covers performance for the 12-month period that ended October 31, 2023. Although central banks raised interest rates aggressively to tame surging inflation during the period, the global economy and financial markets demonstrated resilience. Employers continued hiring, consumers continued spending, home prices rose, and recession fears receded. |
Early in the period, stocks began a rally that eventually ended a bear market and continued to rise globally for much of 2023 as inflation cooled and the Federal Reserve (the Fed) slowed the pace of its rate hikes. However, stocks declined late in the period when the Fed signaled that rates may remain elevated longer than investors had expected. For the entire period, large-cap US stocks and equities in international markets posted gains, while small-cap US stocks declined.
Bond markets benefited during the period as the Fed moderated its rate-hiking cycle, and the higher level of interest rates offered investors an additional cushion from fixed income volatility. US and global investment-grade bonds, along with US high yield corporate bonds and emerging market debt, all posted gains.
Regarding your investments with PGIM, we believe it is important to maintain a diversified portfolio of funds consistent with your tolerance for risk, time horizon, and financial goals. Your financial advisor can help you create a diversified investment plan that may include funds covering all the basic asset classes and that reflects your personal investor profile and risk tolerance. However, diversification and asset allocation strategies do not assure a profit or protect against loss in declining markets.
At PGIM Investments, we provide access to active investment strategies across the global markets in the pursuit of consistent outperformance for investors. PGIM is the world’s 14th-largest investment manager with more than $1.3 trillion in assets under management. Our scale and investment expertise allow us to deliver a diversified suite of actively managed solutions across a broad spectrum of asset classes and investment styles.
Thank you for choosing our family of funds.
Sincerely,

Stuart S. Parker, President
PGIM Absolute Return Bond Fund
December 15, 2023
PGIM Absolute Return Bond Fund 3
Your Fund’s Performance (unaudited)
Performance data quoted represent past performance. Past performance does not guarantee future results. The investment return and principal value of an investment will fluctuate so that an investor’s shares, when redeemed, may be worth more or less than their original cost. Current performance may be lower or higher than the past performance data quoted. An investor may obtain performance data as of the most recent month-end by visiting our website at pgim.com/investments or by calling (800) 225-1852.
| | | | | | |
| |
| | | Average Annual Total Returns as of 10/31/23 |
| | | |
| | | One Year (%) | | Five Years (%) | | Ten Years (%) |
| | | |
Class A | | | | | | |
| | | |
(with sales charges) | | 3.00 | | 1.77 | | 2.22 |
| | | |
(without sales charges) | | 6.45 | | 2.45 | | 2.56 |
| | | |
Class C | | | | | | |
| | | |
(with sales charges) | | 4.49 | | 1.64 | | 1.78 |
| | | |
(without sales charges) | | 5.49 | | 1.64 | | 1.78 |
| | | |
Class Z | | | | | | |
| | | |
(without sales charges) | | 6.71 | | 2.71 | | 2.82 |
| | | |
Class R6 | | | | | | |
| | | |
(without sales charges) | | 6.69 | | 2.76 | | 2.87 |
| | | |
ICE BofA US 3-Month Treasury Bill Index | | | | | | |
| | | |
| | 4.77 | | 1.77 | | 1.16 |
| | | |
Bloomberg US Aggregate Bond Index | | | | | | |
| | | |
| | | 0.36 | | -0.06 | | 0.88 |
4 Visit our website at pgim.com/investments
Growth of a $10,000 Investment (unaudited)
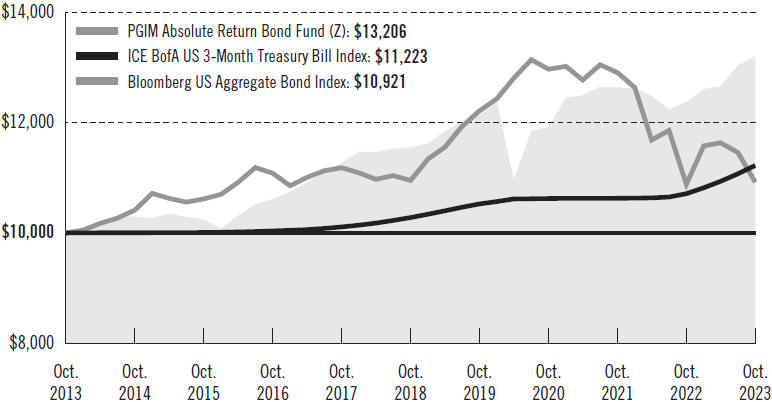
The graph compares a $10,000 investment in the Fund’s Class Z shares with a similar investment in the ICE BofA US 3-Month Treasury Bill Index and Bloomberg US Aggregate Bond Index by portraying the initial account values at the beginning of the 10-year period for Class Z shares (October 31, 2013) and the account values at the end of the current fiscal year (October 31, 2023), as measured on a quarterly basis. For purposes of the graph, and unless otherwise indicated, it has been assumed that (a) all recurring fees (including management fees) were deducted and (b) all dividends and distributions were reinvested. The line graph provides information for Class Z shares only. As indicated in the tables provided earlier, performance for other share classes will vary due to the differing fees and expenses applicable to each share class (as indicated in the following paragraphs). Without waiver of fees and/or expense reimbursements, if any, the returns would have been lower.
Past performance does not predict future performance. Total returns and the ending account values in the graphs include changes in share price and reinvestment of dividends and capital gains distributions in a hypothetical investment for the periods shown. The Fund’s total returns do not reflect the deduction of income taxes on an individual’s investment. Taxes may reduce your actual investment returns on income or gains paid by the Fund or any gains you may realize if you sell your shares.
PGIM Absolute Return Bond Fund 5
Your Fund’s Performance (continued)
The returns in the tables do not reflect the deduction of taxes that a shareholder would pay on Fund distributions or following the redemption of Fund shares. The average annual total returns take into account applicable sales charges, which are described for each share class in the table below.
| | | | | | | | |
| | | | | |
| | | Class A | | Class C | | Class Z | | Class R6 |
| | | | | |
| Maximum initial sales charge | | 3.25% of the public offering price | | None | | None | | None |
| | | | | |
| Contingent deferred sales charge (CDSC) (as a percentage of the lower of the original purchase price or the net asset value at redemption) | | 1.00% on sales of $500,000 or more made within 12 months of purchase | | 1.00% on sales made within 12 months of purchase | | None | | None |
| | | | | |
| Annual distribution and service (12b-1) fees (shown as a percentage of average daily net assets) | | 0.25% | | 1.00% | | None | | None |
Benchmark Definitions
ICE BofA US 3-Month Treasury Bill Index—The ICE BofA US 3-Month Treasury Bill Index tracks the performance of US dollar-denominated US Treasury bills publicly issued in the US domestic market with a remaining term to final maturity of 3 months.
Source: ICE BofA, used with permission.
Bloomberg US Aggregate Bond Index—The Bloomberg US Aggregate Bond Index is unmanaged and represents securities that are taxable and US dollar denominated. It covers the US investment-grade fixed rate bond market, with index components for government and corporate securities, mortgage pass-through securities, and asset-backed securities.
Investors cannot invest directly in an index. The returns for the Indexes would be lower if they included the effects of sales charges, operating expenses of a mutual fund, or taxes that may be paid by an investor.
6 Visit our website at pgim.com/investments
| | | | |
| |
| Credit Quality expressed as a percentage of total investments as of 10/31/23 (%) | | | |
| |
AAA | | | 44.1 | |
| |
AA | | | 9.1 | |
| |
A | | | 5.6 | |
| |
BBB | | | 12.2 | |
| |
BB | | | 10.8 | |
| |
B | | | 5.4 | |
| |
CCC | | | 1.4 | |
| |
CC | | | 0.1 | |
| |
Not Rated | | | 2.4 | |
| |
Cash/Cash Equivalents | | | 8.9 | |
| | |
| Total | | | 100.0 | |
Credit ratings reflect the highest rating assigned by a nationally recognized statistical rating organization (NRSRO) such as Moody’s Investors Service, Inc. (Moody’s), S&P Global Ratings (S&P), or Fitch Ratings Inc. (Fitch). Credit ratings reflect the common nomenclature used by both S&P and Fitch. Where applicable, ratings are converted to the comparable S&P/Fitch rating tier nomenclature. These rating agencies are independent and are widely used. The Not Rated category consists of securities that have not been rated by an NRSRO. Credit ratings are subject to change.
| | | | | | |
| | | |
| Distributions and Yields as of 10/31/23 | | | | | | |
| | | |
| | Total Distributions
Paid for One Year ($) | | SEC 30-Day
Subsidized Yield* (%) | | SEC 30-Day
Unsubsidized Yield** (%) |
| | | |
Class A | | 0.47 | | 5.82 | | 5.82 |
| | | |
Class C | | 0.40 | | 5.27 | | 5.27 |
| | | |
Class Z | | 0.50 | | 6.24 | | 6.36 |
| | | |
Class R6 | | 0.50 | | 6.35 | | 6.35 |
*SEC 30-Day Subsidized Yield (%)—A standardized yield calculation created by the Securities and Exchange Commission, it reflects the income earned during a 30-day period, after the deduction of the Fund’s net expenses (net of any expense waivers or reimbursements). The investor experience is represented by the SEC 30-Day Subsidized Yield.
**SEC 30-Day Unsubsidized Yield (%)—A standardized yield calculation created by the Securities and Exchange Commission, it reflects the income earned during a 30-day period, after the deduction of the Fund’s gross expenses. The investor experience is represented by the SEC 30-Day Subsidized Yield.
PGIM Absolute Return Bond Fund 7
Strategy and Performance Overview* (unaudited)
How did the Fund perform?
The PGIM Absolute Return Bond Fund’s Class Z shares returned 6.71% in the 12-month reporting period that ended October 31, 2023, outperforming the 4.77% return of the ICE BofA US 3-Month Treasury Bill Index (the Index).
What were the market conditions?
| · | | In the US, despite the debt ceiling debate and threats of a government shutdown, inflation that remained above the Federal Reserve’s (the Fed’s) 2% target, and geopolitical risks abroad, the economy proved resilient, posting strong growth for the third quarter of 2023 (i.e., annualized gross domestic product (GDP) of 4.9%) that was driven by consumer spending. With that stated, the durability of the third quarter’s economic momentum doesn’t appear to be repeatable. While September’s payrolls report of 336,000 jobs added came in much stronger than economists expected, October’s payrolls report of 150,000 jobs added was less than expected and provided further evidence of labor market rebalancing. |
| · | | Over the reporting period, the Fed tightened monetary policy by an additional 225 basis points (bps). (One basis point equals 0.01%.) The 10-year/2-year US Treasury spread narrowed from –0.41% as of October 31, 2022, to –0.19% as of October 31, 2023, while the 10-year US Treasury yield rose by 79 bps to end the reporting period at 4.88%. |
| · | | Interest rate volatility increased as markets sought to price in both the aggressive Federal Open Market Committee (FOMC) policy tightening and the potential for a hard landing. Toward the end of the reporting period, macroeconomic and market conditions raised hopes of a soft landing as the FOMC held interest rates steady, and Fed Chairman Jerome Powell acknowledged that higher yields on US Treasuries have aided in the tightening of financial conditions. (When central banks raise interest rates enough to cause a significant economic slowdown or a recession, it is known as a hard landing. When they raise rates just enough to slow the economy and lower inflation without causing a recession, it is known as a soft landing.) |
| · | | In the elevated volatility environment, US investment-grade corporate spreads tightened as expectations for a hard landing dissipated, and fundamentals remained solid. US high yield bonds posted gains over the reporting period amid limited new issuance, resilient economic data, and an ongoing supply deficit. Securitized credit spreads were mixed, with high-quality collateralized loan obligation (CLO) spreads tightening over the reporting period and commercial mortgage-backed securities (CMBS) spreads widening slightly as the commercial real estate sector remained challenged. The emerging markets sector posted positive total returns, and spreads tightened through October 2023. Meanwhile, agency mortgage-backed securities (MBS) posted negative returns over the reporting period, as elevated interest rate volatility weighed on the sector over the first half of the reporting period. |
What worked?
| · | | The Fund’s duration and yield curve positioning contributed to performance during the reporting period. (Duration measures the sensitivity of the price—the value of |
8 Visit our website at pgim.com/investments
| | principal—of a bond to a change in interest rates.) (A yield curve is a line graph that illustrates the relationship between the yields and maturities of fixed income securities. It is created by plotting the yields of different maturities for the same type of bonds.) |
| · | | Overall security selection contributed to performance, with selection in investment-grade corporates, CLOs, and emerging markets contributing most. |
| · | | Overall sector allocation also contributed to returns, with allocations to CLOs, high yield corporates, and emerging markets contributing most. |
| · | | Within credit, positioning in foreign non-corporates, banking, and electric utilities contributed to returns. |
| · | | In individual security selection, the Fund benefited from positioning in JP Morgan Chase &Co. (banking), The Republic of Greece, and EG Global Finance plc (retail). |
What didn’t work?
| · | | Security selection in CMBS and bank loans detracted from performance during the reporting period. |
| · | | Within sector allocation, short positioning in investment-grade corporates, as well as allocations to MBS and CMBS, detracted from performance. |
| · | | Within credit, positioning in telecom, gaming/lodging/leisure, and upstream energy detracted from performance. |
| · | | In individual security selection, positioning in Digicel Group Ltd. (telecommunications), Codere Finance 2 (Luxembourg) SA (entertainment), and JSM Global S.a.r.l. (retailers & restaurants) detracted from performance. |
Did the Fund use derivatives?
The Fund uses derivatives when they facilitate implementation of the overall investment approach. During the reporting period, the Fund used interest rate futures and swaps to help manage duration positioning and yield curve exposure, which contributed to performance. Credit default swaps and credit default swap index (CDX) positions were used to either add risk exposure to certain issuers or to hedge credit risk imposed by certain issuers. Overall, credit derivative exposure detracted from performance during the reporting period. The Fund occasionally features a modest notional exposure to non-USD currencies across a diversified basket of currencies in faster-growing emerging market and developed market countries. The Fund’s foreign-exchange currency market positioning did not impact performance for the reporting period.
Current outlook
| · | | The main forces pushing the yield curve higher are the central banks and a heavy supply of government bond issuance. In PGIM Fixed Income’s view, upward momentum in long-dated yields could easily continue through year-end—pushing US Treasuries toward 5% and German Bunds to 3%—and yields could go beyond those levels if fundamentals heat up again. |
| · | | PGIM Fixed Income believes that the Fed is at or nearing the end of its aggressive tightening cycle. With inflation in the US receding, the real question is where it |
PGIM Absolute Return Bond Fund 9
Strategy and Performance Overview* (continued)
| | troughs and whether it is within an acceptable tolerance band for the Fed. After a series of hikes, the Fed once again held rates steady at the November 2023 FOMC meeting. While there were no surprises in the “higher-for-longer” interest rate messaging, it was reiterated that monetary policy works with an uncertain lag. Fed officials are increasingly expressing a desire to “wait and watch” the incoming data for signs that the effects of prior hikes transmit to the real economy and whether the October surge in market-determined rates provided the last dose of tightening in financial conditions. |
| · | | As the economic backdrop slows and revenue growth begins to run slower than wage growth, PGIM Fixed Income expects companies will first cut hours, then wages, and then head count. If revenue growth continues to run slower than wage growth, the risk of further cuts to head count would grow—a scenario consistent with PGIM Fixed Income’s baseline US economic view whereby tight monetary, fiscal, and credit conditions slow momentum to a below-trend pace of real GDP. Under this “weakflation” scenario, PGIM Fixed Income still expects real GDP growth of between 1.0%-1.5%, inflation descending to 2.5%-3.0%, and the Fed “fine-tuning” its policy rates, with 50 bps of easing next year. |
| · | | With the final quarter of 2023 underway, the gradual loosening of several structural anchors continues to shape PGIM Fixed Income’s economic outlook. As the anchors give way, they are affecting global regions differently, and the growing dispersion across the global economy is evident in the latest adjustments to PGIM Fixed Income’s economic scenarios. PGIM Fixed Income’s base case envisions bullish market fundamentals continuing to develop as they have in recent months, coming to the fore as a market driver moving toward and into 2024. |
| · | | PGIM Fixed Income maintains its positive view of the spread sectors over the medium to long term and holds allocations to structured products (CLOs and CMBS), investment-grade corporates, high yield, and emerging markets. The Fund is underweight MBS relative to the Index in favor of more attractive opportunities across spread sectors. Given the US rates repricing, PGIM Fixed Income believes there is a high bar for a more dovish repricing of the Fed versus other central banks and does not expect the US dollar weakness to continue. For now, PGIM Fixed Income is staying with its long US dollar and short Latin America and Europe biases. |
*This strategy and performance overview, which discusses what strategies or holdings (including derivatives, if applicable) affected the Fund’s performance, is compiled based on how the Fund performed relative to the Index and is viewed for performance attribution purposes at the aggregate Fund level, which in most instances will not directly correlate to the amounts disclosed in the Statement of Operations which conform to US generally accepted accounting principles.
10 Visit our website at pgim.com/investments
Fees and Expenses (unaudited)
As a shareholder of the Fund, you incur two types of costs: (1) transaction costs, including sales charges (loads) on purchase payments and redemptions, as applicable, and (2) ongoing costs, including management fees, distribution and/or service (12b-1) fees, and other Fund expenses, as applicable. This example is intended to help you understand your ongoing costs (in dollars) of investing in the Fund and to compare these costs with the ongoing costs of investing in other mutual funds.
The example is based on an investment of $1,000 held through the six-month period ended October 31, 2023. The example is for illustrative purposes only; you should consult the Prospectus for information on initial and subsequent minimum investment requirements.
Actual Expenses
The first line for each share class in the table on the following page provides information about actual account values and actual expenses. You may use the information on this line, together with the amount you invested, to estimate the expenses that you paid over the period. Simply divide your account value by $1,000 (for example, an $8,600 account value ÷ $1,000 = 8.6), then multiply the result by the number on the first line under the heading “Expenses Paid During the Six-Month Period” to estimate the expenses you paid on your account during this period.
Hypothetical Example for Comparison Purposes
The second line for each share class in the table on the following page provides information about hypothetical account values and hypothetical expenses based on the Fund’s actual expense ratio and an assumed rate of return of 5% per year before expenses, which is not the Fund’s actual return. The hypothetical account values and expenses may not be used to estimate the actual ending account balance or expenses you paid for the period. You may use this information to compare the ongoing costs of investing in the Fund and other funds. To do so, compare this 5% hypothetical example with the 5% hypothetical examples that appear in the shareholder reports of the other funds.
The Fund’s transfer agent may charge additional fees to holders of certain accounts that are not included in the expenses shown in the table on the following page. These fees apply to individual retirement accounts (IRAs) and Section 403(b) accounts. As of the close of the six-month period covered by the table, IRA fees included an annual maintenance fee of $15 per account (subject to a maximum annual maintenance fee of $25 for all accounts held by the same shareholder). Section 403(b) accounts are charged an annual $25 fiduciary maintenance fee. Some of the fees may vary in amount, or may be waived, based on your total account balance or the number of PGIM funds, including the Fund, that you own. You should consider the additional fees that were charged to your Fund account over the six-month period when you estimate the total ongoing expenses paid over the period and the impact of these fees on your ending account value, as these additional expenses are not reflected in the information
PGIM Absolute Return Bond Fund 11
Fees and Expenses (continued)
provided in the expense table. Additional fees have the effect of reducing investment returns.
Please note that the expenses shown in the table are meant to highlight your ongoing costs only and do not reflect any transactional costs such as sales charges (loads). Therefore, the second line for each share class in the table is useful in comparing ongoing costs only and will not help you determine the relative total costs of owning different funds. In addition, if these transactional costs were included, your costs would have been higher.
| | | | | | | | | | |
| | | | |
PGIM Absolute Return Bond Fund | | Beginning Account Value May 1, 2023 | | Ending Account Value October 31, 2023 | | Annualized Expense Ratio Based on the Six-Month Period | | Expenses Paid During the Six-Month Period* |
| | | | | |
Class A | | Actual | | $1,000.00 | | $1,040.60 | | 0.99% | | $5.09 |
| | | | | |
| | Hypothetical | | $1,000.00 | | $1,020.21 | | 0.99% | | $5.04 |
| | | | | |
Class C | | Actual | | $1,000.00 | | $1,036.50 | | 1.78% | | $9.14 |
| | | | | |
| | Hypothetical | | $1,000.00 | | $1,016.23 | | 1.78% | | $9.05 |
| | | | | |
Class Z | | Actual | | $1,000.00 | | $1,043.10 | | 0.74% | | $3.81 |
| | | | | |
| | Hypothetical | | $1,000.00 | | $1,021.48 | | 0.74% | | $3.77 |
| | | | | |
Class R6 | | Actual | | $1,000.00 | | $1,042.40 | | 0.66% | | $3.40 |
| | | | | |
| | | Hypothetical | | $1,000.00 | | $1,021.88 | | 0.66% | | $3.36 |
*Fund expenses (net of fee waivers or subsidies, if any) for each share class are equal to the annualized expense ratio for each share class (provided in the table), multiplied by the average account value over the period, multiplied by the 184 days in the six-month period ended October 31, 2023, and divided by the 365 days in the Fund’s fiscal year ended October 31, 2023 (to reflect the six-month period). Expenses presented in the table include the expenses of any underlying portfolios in which the Fund may invest.
12 Visit our website at pgim.com/investments
Schedule of Investments
as of October 31, 2023
| | | | | | | | | | | | | | | | |
| | | | |
| Description | | Interest Rate | | | Maturity Date | | | Principal Amount (000)# | | | Value | |
| | | | |
LONG-TERM INVESTMENTS 87.8% | | | | | | | | | | | | | | | | |
| | | | |
ASSET-BACKED SECURITIES 26.5% | | | | | | | | | | | | | | | | |
| | | | |
Automobiles 1.6% | | | | | | | | | | | | | | | | |
| | | | |
Avis Budget Rental Car Funding AESOP LLC, | | | | | | | | | | | | | | | | |
Series 2023-05A, Class C, 144A | | | 6.850% | | | | 04/20/28 | | | | 500 | | | $ | 488,473 | |
Series 2023-08A, Class C, 144A | | | 7.340 | | | | 02/20/30 | | | | 2,700 | | | | 2,651,350 | |
Enterprise Fleet Financing LLC, | | | | | | | | | | | | | | | | |
Series 2023-02, Class A2, 144A | | | 5.560 | | | | 04/22/30 | | | | 2,600 | | | | 2,577,303 | |
Ford Credit Auto Owner Trust, | | | | | | | | | | | | | | | | |
Series 2023-02, Class D, 144A | | | 6.600 | | | | 02/15/36 | | | | 1,200 | | | | 1,160,268 | |
Ford Credit Floorplan Master Owner Trust A, | | | | | | | | | | | | | | | | |
Series 2023-01, Class A1, 144A | | | 4.920 | | | | 05/15/28 | | | | 2,600 | | | | 2,544,560 | |
Hertz Vehicle Financing III LP, | | | | | | | | | | | | | | | | |
Series 2021-02A, Class B, 144A | | | 2.120 | | | | 12/27/27 | | | | 200 | | | | 175,168 | |
OneMain Direct Auto Receivables Trust, | | | | | | | | | | | | | | | | |
Series 2019-01A, Class B, 144A | | | 3.950 | | | | 11/14/28 | | | | 1,700 | | | | 1,606,869 | |
Series 2021-01A, Class D, 144A | | | 1.620 | | | | 11/14/30 | | | | 200 | | | | 176,484 | |
Series 2022-01A, Class D, 144A | | | 5.900 | | | | 12/16/30 | | | | 2,900 | | | | 2,769,707 | |
Series 2023-01A, Class D, 144A | | | 7.070 | | | | 02/14/33 | | | | 3,700 | | | | 3,603,242 | |
Santander Bank Auto Credit-Linked Notes, | | | | | | | | | | | | | | | | |
Series 2022-A, Class C, 144A | | | 7.375 | | | | 05/15/32 | | | | 314 | | | | 311,689 | |
Series 2022-C, Class E, 144A | | | 11.366 | | | | 12/15/32 | | | | 181 | | | | 181,883 | |
Series 2023-A, Class E, 144A | | | 10.068 | | | | 06/15/33 | | | | 554 | | | | 552,219 | |
Santander Drive Auto Receivables Trust, | | | | | | | | | | | | | | | | |
Series 2022-07, Class A2 | | | 5.810 | | | | 01/15/26 | | | | 816 | | | | 815,230 | |
Series 2023-02, Class C | | | 5.470 | | | | 12/16/30 | | | | 1,250 | | | | 1,213,311 | |
| | | | | | | | | | | | | | | | |
| | | | |
| | | | | | | | | | | | | | | 20,827,756 | |
| | | | |
Collateralized Loan Obligations 22.3% | | | | | | | | | | | | | | | | |
| | | | |
AlbaCore EURO CLO DAC (Ireland), | | | | | | | | | | | | | | | | |
Series 02A, Class B, 144A, 3 Month EURIBOR + 1.650% (Cap N/A, Floor 1.650%) | | | 5.495(c) | | | | 06/15/34 | | | EUR | 1,000 | | | | 1,018,965 | |
Series 02X, Class B, 3 Month EURIBOR + 1.650% (Cap N/A, Floor 1.650%) | | | 5.495(c) | | | | 06/15/34 | | | EUR | 4,000 | | | | 4,075,860 | |
Anchorage Capital Europe CLO DAC (Ireland), | | | | | | | | | | | | | | | | |
Series 06A, Class B2, 144A | | | 6.000 | | | | 08/25/34 | | | EUR | 4,000 | | | | 4,230,842 | |
Apex Credit CLO LLC (Cayman Islands), | | | | | | | | | | | | | | | | |
Series 2021-02A, Class A1A, 144A, 3 Month SOFR + 1.492% (Cap N/A, Floor 1.230%) | | | 6.907(c) | | | | 10/20/34 | | | | 5,000 | | | | 4,951,974 | |
Ares European CLO DAC (Ireland), | | | | | | | | | | | | | | | | |
Series 2013-06A, Class B1RR, 144A, 3 Month EURIBOR + 1.250% (Cap N/A, Floor 1.250%) | | | 5.215(c) | | | | 04/15/30 | | | EUR | 2,500 | | | | 2,562,119 | |
See Notes to Financial Statements.
PGIM Absolute Return Bond Fund 13
Schedule of Investments (continued)
as of October 31, 2023
| | | | | | | | | | | | | | | | |
| | | | |
| Description | | Interest Rate | | | Maturity Date | | | Principal Amount (000)# | | | Value | |
| | | | |
ASSET-BACKED SECURITIES (Continued) | | | | | | | | | | | | | | | | |
| | | | |
Collateralized Loan Obligations (cont’d.) | | | | | | | | | | | | | | | | |
| | | | |
Atlas Static Senior Loan Fund Ltd. (Cayman Islands), | | | | | | | | | | | | | | | | |
Series 2022-01A, Class A, 144A, 3 Month SOFR + 2.600% (Cap N/A, Floor 2.600%) | | | 7.994%(c) | | | | 07/15/30 | | | | 8,204 | | | $ | 8,247,564 | |
Bain Capital Credit CLO Ltd. (Cayman Islands), | | | | | | | | | | | | | | | | |
Series 2019-02A, Class AR, 144A, 3 Month SOFR + 1.362% (Cap N/A, Floor 1.100%) | | | 6.764(c) | | | | 10/17/32 | | | | 8,500 | | | | 8,446,404 | |
Series 2022-01A, Class A1, 144A, 3 Month SOFR + 1.320% (Cap N/A, Floor 1.320%) | | | 6.715(c) | | | | 04/18/35 | | | | 9,750 | | | | 9,644,693 | |
Barings Euro CLO DAC (Ireland), | | | | | | | | | | | | | | | | |
Series 2020-01A, Class AR, 144A, 3 Month EURIBOR + 0.980% (Cap N/A, Floor 0.980%) | | | 4.982(c) | | | | 10/21/34 | | | EUR | 3,000 | | | | 3,077,003 | |
Battalion CLO Ltd. (Cayman Islands), | | | | | | | | | | | | | | | | |
Series 2016-10A, Class A1R2, 144A, 3 Month SOFR + 1.432% (Cap N/A, Floor 1.170%) | | | 6.830(c) | | | | 01/25/35 | | | | 4,740 | | | | 4,690,035 | |
Series 2021-17A, Class A1, 144A, 3 Month SOFR + 1.522% (Cap N/A, Floor 1.260%) | | | 6.937(c) | | | | 03/09/34 | | | | 2,450 | | | | 2,423,738 | |
Carlyle Euro CLO DAC (Ireland), | | | | | | | | | | | | | | | | |
Series 2019-01A, Class A1R, 144A, 3 Month EURIBOR + 0.750% (Cap N/A, Floor 0.750%) | | | 4.595(c) | | | | 03/15/32 | | | EUR | 1,750 | | | | 1,818,925 | |
Series 2019-01A, Class A2RB, 144A | | | 2.100 | | | | 03/15/32 | | | EUR | 6,500 | | | | 5,996,767 | |
Carlyle Global Market Strategies CLO Ltd. (Cayman Islands), | | | | | | | | | | | | | | | | |
Series 2015-05A, Class A1RR, 144A, 3 Month SOFR + 1.342% (Cap N/A, Floor 1.080%) | | | 6.757(c) | | | | 01/20/32 | | | | 6,228 | | | | 6,190,224 | |
CIFC Funding Ltd. (Cayman Islands), | | | | | | | | | | | | | | | | |
Series 2015-01A, Class ARR, 144A, 3 Month SOFR + 1.372% (Cap N/A, Floor 1.110%) | | | 6.784(c) | | | | 01/22/31 | | | | 6,504 | | | | 6,478,730 | |
Columbia Cent CLO Ltd. (Cayman Islands), | | | | | | | | | | | | | | | | |
Series 2020-29A, Class BR, 144A, 3 Month SOFR + 1.962% (Cap N/A, Floor 0.000%) | | | 7.377(c) | | | | 10/20/34 | | | | 11,335 | | | | 10,932,092 | |
Crown City CLO (Cayman Islands), | | | | | | | | | | | | | | | | |
Series 2020-02A, Class A1AR, 144A, 3 Month SOFR + 1.340% (Cap N/A, Floor 1.340%) | | | 6.756(c) | | | | 04/20/35 | | | | 2,750 | | | | 2,723,643 | |
Elevation CLO Ltd. (Cayman Islands), | | | | | | | | | | | | | | | | |
Series 2017-06A, Class A1, 144A, 3 Month SOFR + 1.542% (Cap N/A, Floor 1.542%) | | | 6.935(c) | | | | 07/15/29 | | | | 848 | | | | 843,328 | |
Series 2023-17A, Class A1, 144A, 3 Month SOFR + 1.870% (Cap N/A, Floor 1.870%)^ | | | 7.234(c) | | | | 10/20/36 | | | | 10,000 | | | | 10,000,000 | |
Ellington CLO Ltd. (Cayman Islands), | | | | | | | | | | | | | | | | |
Series 2017-02A, Class A, 144A, 3 Month SOFR + 1.962% (Cap N/A, Floor 1.700%) | | | 7.326(c) | | | | 02/15/29 | | | | 2,726 | | | | 2,719,758 | |
See Notes to Financial Statements.
14
| | | | | | | | | | | | | | | | |
| | | | |
| Description | | Interest Rate | | | Maturity Date | | | Principal Amount (000)# | | | Value | |
| | | | |
ASSET-BACKED SECURITIES (Continued) | | | | | | | | | | | | | | | | |
| | | | |
Collateralized Loan Obligations (cont’d.) | | | | | | | | | | | | | | | | |
| | | | |
Elmwood CLO Ltd. (Cayman Islands), | | | | | | | | | | | | | | | | |
Series 2021-03A, Class A, 144A, 3 Month SOFR + 1.302% (Cap N/A, Floor 1.040%) | | | 6.717%(c) | | | | 10/20/34 | | | | 4,250 | | | $ | 4,230,433 | |
Generate CLO Ltd. (Cayman Islands), | | | | | | | | | | | | | | | | |
Series 02A, Class AR, 144A, 3 Month SOFR + 1.412% (Cap N/A, Floor 1.150%) | | | 6.824(c) | | | | 01/22/31 | | | | 2,788 | | | | 2,781,306 | |
KKR CLO Ltd. (Cayman Islands), | | | | | | | | | | | | | | | | |
Series 11, Class AR, 144A, 3 Month SOFR + 1.442% (Cap N/A, Floor 1.442%) | | | 6.835(c) | | | | 01/15/31 | | | | 6,954 | | | | 6,931,664 | |
Series 32A, Class A1, 144A, 3 Month SOFR + 1.582% (Cap N/A, Floor 1.320%) | | | 6.975(c) | | | | 01/15/32 | | | | 5,000 | | | | 4,983,939 | |
Madison Park Funding Ltd. (Cayman Islands), | | | | | | | | | | | | | | | | |
Series 2019-33A, Class AR, 144A, 3 Month SOFR + 1.290% (Cap N/A, Floor 1.290%) | | | 6.684(c) | | | | 10/15/32 | | | | 5,500 | | | | 5,459,604 | |
Series 2021-59A, Class A, 144A, 3 Month SOFR + 1.402% (Cap N/A, Floor 1.140%) | | | 6.797(c) | | | | 01/18/34 | | | | 9,500 | | | | 9,457,725 | |
MidOcean Credit CLO (Cayman Islands), | | | | | | | | | | | | | | | | |
Series 2014-03A, Class A1R, 144A, 3 Month SOFR + 1.382% (Cap N/A, Floor 1.120%) | | | 6.794(c) | | | | 04/21/31 | | | | 5,907 | | | | 5,857,289 | |
Series 2014-03A, Class BR, 144A, 3 Month SOFR + 2.062% (Cap N/A, Floor 1.800%) | | | 7.474(c) | | | | 04/21/31 | | | | 18,000 | | | | 17,624,536 | |
Oaktree CLO Ltd. (Cayman Islands), | | | | | | | | | | | | | | | | |
Series 2022-02A, Class A1, 144A, 3 Month SOFR + 2.000% (Cap N/A, Floor 2.000%) | | | 7.394(c) | | | | 07/15/33 | | | | 6,500 | | | | 6,522,677 | |
OFSI BSL Ltd. (Cayman Islands), | | | | | | | | | | | | | | | | |
Series 2022-11A, Class A1R, 144A, 3 Month SOFR + 2.050% (Cap N/A, Floor 2.050%) | | | 7.436(c) | | | | 10/18/35 | | | | 10,000 | | | | 9,994,823 | |
OZLM Ltd. (Cayman Islands), | | | | | | | | | | | | | | | | |
Series 2014-06A, Class A2AS, 144A, 3 Month SOFR + 2.012% (Cap N/A, Floor 0.000%) | | | 7.414(c) | | | | 04/17/31 | | | | 4,000 | | | | 3,948,173 | |
Palmer Square CLO Ltd. (Cayman Islands), | | | | | | | | | | | | | | | | |
Series 2014-01A, Class A1R2, 144A, 3 Month SOFR + 1.392% (Cap N/A, Floor 1.130%) | | | 6.794(c) | | | | 01/17/31 | | | | 3,245 | | | | 3,238,252 | |
Series 2018-02A, Class A1A, 144A, 3 Month SOFR + 1.362% (Cap N/A, Floor 0.000%) | | | 6.755(c) | | | | 07/16/31 | | | | 6,250 | | | | 6,240,277 | |
Palmer Square Loan Funding Ltd. (Cayman Islands), | | | | | | | | | | | | | | | | |
Series 2022-03A, Class A2, 144A, 3 Month SOFR + 3.000% (Cap N/A, Floor 3.000%) | | | 8.394(c) | | | | 04/15/31 | | | | 13,000 | | | | 12,986,666 | |
Penta CLO DAC (Ireland), | | | | | | | | | | | | | | | | |
Series 2018-05A, Class B1R, 144A, 3 Month EURIBOR + 1.550% (Cap N/A, Floor 1.550%) | | | 5.543(c) | | | | 04/20/35 | | | EUR | 10,000 | | | | 10,134,678 | |
See Notes to Financial Statements.
PGIM Absolute Return Bond Fund 15
Schedule of Investments (continued)
as of October 31, 2023
| | | | | | | | | | | | | | | | |
| | | | |
| Description | | Interest Rate | | | Maturity Date | | | Principal Amount (000)# | | | Value | |
| | | | |
ASSET-BACKED SECURITIES (Continued) | | | | | | | | | | | | | | | | |
| | | | |
Collateralized Loan Obligations (cont’d.) | | | | | | | | | | | | | | | | |
| | | | |
Rad CLO Ltd. (Cayman Islands), | | | | | | | | | | | | | | | | |
Series 2023-19A, Class A1, 144A, 3 Month SOFR + 2.000% (Cap N/A, Floor 2.000%) | | | 7.416%(c) | | | | 04/20/35 | | | | 7,000 | | | $ | 7,050,112 | |
Rockford Tower CLO Ltd., | | | | | | | | | | | | | | | | |
Series 2022-02A, Class A1R, 144A, 3 Month SOFR + 1.850% (Cap N/A, Floor 1.850%) | | | 7.266(c) | | | | 10/20/35 | | | | 11,500 | | | | 11,500,000 | |
Romark CLO Ltd. (Cayman Islands), | | | | | | | | | | | | | | | | |
Series 2018-02A, Class A1, 144A, 3 Month SOFR + 1.437% (Cap N/A, Floor 1.175%) | | | 6.815(c) | | | | 07/25/31 | | | | 4,814 | | | | 4,789,578 | |
Romark WM-R Ltd. (Cayman Islands), | | | | | | | | | | | | | | | | |
Series 2018-01A, Class A1, 144A, 3 Month SOFR + 1.292% (Cap N/A, Floor 0.000%) | | | 6.707(c) | | | | 04/20/31 | | | | 1,406 | | | | 1,396,911 | |
Silver Rock CLO Ltd. (Cayman Islands), | | | | | | | | | | | | | | | | |
Series 2021-02A, Class A, 144A, 3 Month SOFR + 1.452% (Cap N/A, Floor 1.190%) | | | 6.867(c) | | | | 01/20/35 | | | | 10,000 | | | | 9,881,230 | |
St. Pauls CLO DAC (Ireland), | | | | | | | | | | | | | | | | |
Series 02A, Class AR4, 144A, 3 Month EURIBOR + 0.980% (Cap N/A, Floor 0.980%) | | | 4.936(c) | | | | 10/25/35 | | | EUR | 8,000 | | | | 8,191,651 | |
Strata CLO Ltd. (Cayman Islands), | | | | | | | | | | | | | | | | |
Series 2018-01A, Class A, 144A, 3 Month SOFR + 1.852% (Cap N/A, Floor 1.590%) | | | 7.245(c) | | | | 01/15/31 | | | | 1,759 | | | | 1,756,269 | |
Venture CLO Ltd. (Cayman Islands), | | | | | | | | | | | | | | | | |
Series 2021-43A, Class A1, 144A, 3 Month SOFR + 1.502% (Cap N/A, Floor 1.240%) | | | 6.895(c) | | | | 04/15/34 | | | | 3,500 | | | | 3,462,282 | |
Warwick Capital CLO Ltd. (United Kingdom), | | | | | | | | | | | | | | | | |
Series 2023-02A, Class A1, 144A, 3 Month SOFR + 1.950% (Cap N/A, Floor 1.950%) | | | 7.327(c) | | | | 01/15/37 | | | | 12,500 | | | | 12,500,000 | |
Wellfleet CLO Ltd., | | | | | | | | | | | | | | | | |
Series 2017-03A, Class A1, 144A, 3 Month SOFR + 1.412% (Cap N/A, Floor 1.150%) | | | 6.814(c) | | | | 01/17/31 | | | | 9,260 | | | | 9,209,420 | |
Zais CLO Ltd. (Cayman Islands), | | | | | | | | | | | | | | | | |
Series 2015-03A, Class A2R, 144A, 3 Month SOFR + 2.452% (Cap N/A, Floor 0.000%) | | | 7.845(c) | | | | 07/15/31 | | | | 11,300 | | | | 11,051,159 | |
| | | | | | | | | | | | | | | | |
| | | | |
| | | | | | | | | | | | | | | 292,253,318 | |
| | | | |
Consumer Loans 0.8% | | | | | | | | | | | | | | | | |
| | | | |
OneMain Financial Issuance Trust, | | | | | | | | | | | | | | | | |
Series 2023-01A, Class A, 144A | | | 5.500 | | | | 06/14/38 | | | | 4,800 | | | | 4,595,657 | |
Series 2023-01A, Class D, 144A | | | 7.490 | | | | 06/14/38 | | | | 200 | | | | 192,802 | |
Series 2023-02A, Class D, 144A | | | 7.520 | | | | 09/15/36 | | | | 2,500 | | | | 2,437,310 | |
See Notes to Financial Statements.
16
| | | | | | | | | | | | | | | | |
| | | | |
| Description | | Interest Rate | | | Maturity Date | | | Principal Amount (000)# | | | Value | |
| | | | |
ASSET-BACKED SECURITIES (Continued) | | | | | | | | | | | | | | | | |
| | | | |
Consumer Loans (cont’d.) | | | | | | | | | | | | | | | | |
| | | | |
Oportun Issuance Trust, | | | | | | | | | | | | | | | | |
Series 2022-02, Class A, 144A | | | 5.940% | | | | 10/09/29 | | | | 630 | | | $ | 628,250 | |
SoFi Consumer Loan Program Trust, | | | | | | | | | | | | | | | | |
Series 2022-01S, Class A, 144A | | | 6.210 | | | | 04/15/31 | | | | 1,987 | | | | 1,986,558 | |
| | | | | | | | | | | | | | | | |
| | | | |
| | | | | | | | | | | | | | | 9,840,577 | |
| | | | |
Home Equity Loans 0.6% | | | | | | | | | | | | | | | | |
| | | | |
Accredited Mortgage Loan Trust, | | | | | | | | | | | | | | | | |
Series 2004-03, Class 2A2, 1 Month SOFR + 1.314% (Cap 13.000%, Floor 1.200%) | | | 6.639(c) | | | | 10/25/34 | | | | 679 | | | | 657,982 | |
Asset-Backed Securities Corp. Home Equity Loan Trust, | | | | | | | | | | | | | | | | |
Series 2003-HE06, Class A2, 1 Month SOFR + 0.794% (Cap N/A, Floor 0.680%) | | | 6.119(c) | | | | 11/25/33 | | | | 818 | | | | 811,296 | |
Series 2003-HE06, Class A3B, 1 Month SOFR + 1.074% (Cap N/A, Floor 0.960%) | | | 6.399(c) | | | | 11/25/33 | | | | 3,327 | | | | 3,090,760 | |
Bear Stearns Asset-Backed Securities Trust, | | | | | | | | | | | | | | | | |
Series 2002-02, Class A1, 1 Month SOFR + 0.774% (Cap 11.000%, Floor 0.660%) | | | 6.099(c) | | | | 10/25/32 | | | | 58 | | | | 57,765 | |
Series 2003-03, Class A2, 1 Month SOFR + 1.294% (Cap 11.000%, Floor 1.180%) | | | 6.619(c) | | | | 06/25/43 | | | | 64 | | | | 63,553 | |
Series 2003-HE01, Class M1, 1 Month SOFR + 1.209% (Cap N/A, Floor 1.095%) | | | 5.746(c) | | | | 01/25/34 | | | | 1,526 | | | | 1,440,381 | |
Home Equity Asset Trust, | | | | | | | | | | | | | | | | |
Series 2004-07, Class A2, 1 Month SOFR + 0.954% (Cap N/A, Floor 0.840%) | | | 6.279(c) | | | | 01/25/35 | | | | 927 | | | | 885,238 | |
MASTR Asset-Backed Securities Trust, | | | | | | | | | | | | | | | | |
Series 2003-WMC02, Class M2, 1 Month SOFR + 2.589% (Cap N/A, Floor 2.475%) | | | 4.297(c) | | | | 08/25/33 | | | | 502 | | | | 506,033 | |
Morgan Stanley ABS Capital I, Inc. Trust, | | | | | | | | | | | | | | | | |
Series 2003-HE03, Class M1, 1 Month SOFR + 1.134% (Cap N/A, Floor 1.020%) | | | 6.459(c) | | | | 10/25/33 | | | | 316 | | | | 311,000 | |
Series 2003-NC08, Class M1, 1 Month SOFR + 1.164% (Cap N/A, Floor 1.050%) | | | 6.489(c) | | | | 09/25/33 | | | | 219 | | | | 214,157 | |
Series 2003-NC10, Class M1, 1 Month SOFR + 1.134% (Cap N/A, Floor 1.020%) | | | 6.459(c) | | | | 10/25/33 | | | | 197 | | | | 193,463 | |
| | | | | | | | | | | | | | | | |
| | | | |
| | | | | | | | | | | | | | | 8,231,628 | |
See Notes to Financial Statements.
PGIM Absolute Return Bond Fund 17
Schedule of Investments (continued)
as of October 31, 2023
| | | | | | | | | | | | | | | | |
| | | | |
| Description | | Interest Rate | | | Maturity Date | | | Principal Amount (000)# | | | Value | |
| | | | |
ASSET-BACKED SECURITIES (Continued) | | | | | | | | | | | | | | | | |
| | | | |
Other 0.1% | | | | | | | | | | | | | | | | |
| | | | |
Goodleap Sustainable Home Solutions Trust, | | | | | | | | | | | | | | | | |
Series 2023-03C, Class A, 144A | | | 6.500% | | | | 07/20/55 | | | | 487 | | | $ | 472,863 | |
Sierra Timeshare Receivables Funding LLC, | | | | | | | | | | | | | | | | |
Series 2023-02A, Class D, 144A | | | 9.720 | | | | 04/20/40 | | | | 1,474 | | | | 1,478,770 | |
| | | | | | | | | | | | | | | | |
| | | | |
| | | | | | | | | | | | | | | 1,951,633 | |
| | | | |
Residential Mortgage-Backed Securities 0.9% | | | | | | | | | | | | | | | | |
| | | | |
Chase Funding Trust, | | | | | | | | | | | | | | | | |
Series 2002-03, Class 2A1, 1 Month SOFR + 0.754% (Cap N/A, Floor 0.640%) | | | 6.079(c) | | | | 08/25/32 | | | | 234 | | | | 217,704 | |
Series 2003-04, Class 1A5 | | | 4.894 | | | | 05/25/33 | | | | 314 | | | | 291,771 | |
Citigroup Mortgage Loan Trust, Inc., | | | | | | | | | | | | | | | | |
Series 2005-OPT01, Class M1, 1 Month SOFR + 0.744% (Cap N/A, Floor 0.630%) | | | 6.069(c) | | | | 02/25/35 | | | | 167 | | | | 147,941 | |
Series 2005-WF01, Class A5 | | | 5.010(cc) | | | | 11/25/34 | | | | —(r | ) | | | 1 | |
Countrywide Asset-Backed Certificates, | | | | | | | | | | | | | | | | |
Series 2003-BC04, Class M1, 1 Month SOFR + 1.164% (Cap N/A, Floor 1.050%) | | | 6.489(c) | | | | 07/25/33 | | | | 250 | | | | 244,561 | |
Series 2004-01, Class M1, 1 Month SOFR + 0.864% (Cap N/A, Floor 0.750%) | | | 6.189(c) | | | | 03/25/34 | | | | 16 | | | | 15,427 | |
Countrywide Asset-Backed Certificates Trust, | | | | | | | | | | | | | | | | |
Series 2004-BC04, Class M1, 1 Month SOFR + 1.164% (Cap N/A, Floor 1.050%) | | | 6.489(c) | | | | 11/25/34 | | | | 81 | | | | 79,932 | |
Credit-Based Asset Servicing & Securitization LLC, | | | | | | | | | | | | | | | | |
Series 2003-CB03, Class AF1 | | | 3.379 | | | | 12/25/32 | | | | 68 | | | | 61,918 | |
Finance America Mortgage Loan Trust, | | | | | | | | | | | | | | | | |
Series 2003-01, Class M1, 1 Month SOFR + 1.164% (Cap N/A, Floor 1.050%) | | | 6.489(c) | | | | 09/25/33 | | | | 1,008 | | | | 964,395 | |
First Franklin Mortgage Loan Trust, | | | | | | | | | | | | | | | | |
Series 2004-FF05, Class A2, 1 Month SOFR + 0.874% (Cap N/A, Floor 0.760%) | | | 6.199(c) | | | | 08/25/34 | | | | 368 | | | | 335,660 | |
Fremont Home Loan Trust, | | | | | | | | | | | | | | | | |
Series 2004-04, Class M1, 1 Month SOFR + 0.909% (Cap N/A, Floor 0.795%) | | | 6.234(c) | | | | 03/25/35 | | | | 1,482 | | | | 1,374,044 | |
Long Beach Mortgage Loan Trust, | | | | | | | | | | | | | | | | |
Series 2004-02, Class A1, 1 Month SOFR + 0.554% (Cap N/A, Floor 0.440%) | | | 5.879(c) | | | | 06/25/34 | | | | 522 | | | | 492,220 | |
Morgan Stanley ABS Capital I, Inc. Trust, | | | | | | | | | | | | | | | | |
Series 2004-NC05, Class M1, 1 Month SOFR + 1.014% (Cap N/A, Floor 0.900%) | | | 6.339(c) | | | | 05/25/34 | | | | 153 | | | | 142,261 | |
See Notes to Financial Statements.
18
| | | | | | | | | | | | | | | | |
| | | | |
| Description | | Interest Rate | | | Maturity Date | | | Principal Amount (000)# | | | Value | |
| | | | |
ASSET-BACKED SECURITIES (Continued) | | | | | | | | | | | | | | | | |
| | | | |
Residential Mortgage-Backed Securities (cont’d.) | | | | | | | | | | | | | | | | |
| | | | |
Rathlin Residential DAC (Ireland), | | | | | | | | | | | | | | | | |
Series 2021-01A, Class A, 144A, 1 Month EURIBOR + 2.000% (Cap N/A, Floor 0.000%) | | | 5.845%(c) | | | | 09/27/75 | | | EUR | 1,016 | | | $ | 1,047,886 | |
Structured Asset Investment Loan Trust, | | | | | | | | | | | | | | | | |
Series 2004-BNC01, Class A2, 1 Month SOFR + 1.114% (Cap N/A, Floor 1.000%) | | | 6.434(c) | | | | 09/25/34 | | | | 1,881 | | | | 1,790,676 | |
TFS (Spain), | | | | | | | | | | | | | | | | |
Series 2018-03^ | | | 0.000(s) | | | | 04/16/40 | | | EUR | —(r | ) | | | 1 | |
Series 2018-03, Class A1, 1 Month EURIBOR + 3.000%^ | | | 7.122(c) | | | | 03/15/26 | | | EUR | 4,692 | | | | 4,219,917 | |
| | | | | | | | | | | | | | | | |
| | | | |
| | | | | | | | | | | | | | | 11,426,315 | |
| | | | |
Student Loans 0.2% | | | | | | | | | | | | | | | | |
| | | | |
Laurel Road Prime Student Loan Trust, | | | | | | | | | | | | | | | | |
Series 2018-D, Class A, 144A | | | 0.000(cc) | | | | 11/25/43 | | | | 2,224 | | | | 2,050,285 | |
Series 2019-A, Class R, 144A | | | 0.000 | | | | 10/25/48 | | | | 1,772 | | | | 340,722 | |
| | | | | | | | | | | | | | | | |
| | | | |
| | | | | | | | | | | | | | | 2,391,007 | |
| | | | | | | | | | | | | | | | |
| | | | |
TOTAL ASSET-BACKED SECURITIES
(cost $354,395,869) | | | | | | | | | | | | | | | 346,922,234 | |
| | | | | | | | | | | | | | | | |
| | | | |
COMMERCIAL MORTGAGE-BACKED SECURITIES 6.0% | | | | | | | | | | | | | | | | |
| | | | |
20 Times Square Trust, | | | | | | | | | | | | | | | | |
Series 2018-20TS, Class G, 144A (original cost $2,454,600; purchased
05/09/18)(f) | | | 3.100(cc) | | | | 05/15/35 | | | | 2,700 | | | | 1,836,000 | |
Series 2018-20TS, Class H, 144A (original cost $2,389,640; purchased
05/09/18)(f) | | | 3.100(cc) | | | | 05/15/35 | | | | 2,700 | | | | 1,782,000 | |
Barclays Commercial Mortgage Securities Trust, | | | | | | | | | | | | | | | | |
Series 2018-CHRS, Class B, 144A | | | 4.267(cc) | | | | 08/05/38 | | | | 2,650 | | | | 2,103,932 | |
Series 2018-CHRS, Class C, 144A | | | 4.267(cc) | | | | 08/05/38 | | | | 900 | | | | 672,728 | |
Series 2018-CHRS, Class D, 144A | | | 4.267(cc) | | | | 08/05/38 | | | | 1,490 | | | | 1,002,957 | |
Benchmark Mortgage Trust, | | | | | | | | | | | | | | | | |
Series 2023-V03, Class XA, IO | | | 0.814(cc) | | | | 07/15/56 | | | | 50,611 | | | | 1,666,292 | |
BPR Trust, | | | | | | | | | | | | | | | | |
Series 2021-TY, Class C, 144A, 1 Month SOFR + 1.814% (Cap N/A, Floor 1.700%) | | | 7.149(c) | | | | 09/15/38 | | | | 2,024 | | | | 1,880,349 | |
Series 2023-BRK02, Class C, 144A | | | 8.630(cc) | | | | 11/05/28 | | | | 4,300 | | | | 4,259,536 | |
BX Commercial Mortgage Trust, | | | | | | | | | | | | | | | | |
Series 2019-XL, Class J, 144A, 1 Month SOFR + 2.764% (Cap N/A, Floor 2.650%) | | | 8.099(c) | | | | 10/15/36 | | | | 5,653 | | | | 5,515,154 | |
See Notes to Financial Statements.
PGIM Absolute Return Bond Fund 19
Schedule of Investments (continued)
as of October 31, 2023
| | | | | | | | | | | | |
| | | | |
| Description | | Interest Rate | | Maturity Date | | Principal Amount (000)# | | | Value | |
| | |
COMMERCIAL MORTGAGE-BACKED SECURITIES (Continued) | | | | | | | | |
| | | | |
Commercial Mortgage Trust, | | | | | | | | | | | | |
Series 2015-LC19, Class XB, IO, 144A | | 0.238%(cc) | | 02/10/48 | | | 123,049 | | | $ | 293,090 | |
Credit Suisse Mortgage Capital Certificates, | | | | | | | | | | | | |
Series 2019-ICE04, Class F, 144A, 1 Month SOFR + 2.697% (Cap N/A, Floor 2.650%) | | 8.032(c) | | 05/15/36 | | | 5,666 | | | | 5,581,773 | |
DBWF Mortgage Trust, | | | | | | | | | | | | |
Series 2016-85T, Class E, 144A | | 3.808(cc) | | 12/10/36 | | | 15,500 | | | | 9,325,189 | |
FHLMC Multifamily Structured Pass-Through Certificates, | | | | | | | | | | | | |
Series K055, Class X1, IO | | 1.338(cc) | | 03/25/26 | | | 21,052 | | | | 572,037 | |
Series KC02, Class X1, IO | | 0.381(cc) | | 03/25/24 | | | 115,844 | | | | 317,840 | |
GS Mortgage Securities Corp. Trust, | | | | | | | | | | | | |
Series 2021-IP, Class A, 144A, 1 Month SOFR + 1.064% (Cap N/A, Floor 0.950%) | | 6.399(c) | | 10/15/36 | | | 2,130 | | | | 2,031,332 | |
GS Mortgage Securities Trust, | | | | | | | | | | | | |
Series 2013-GC10, Class XB, IO, 144A | | 0.252(cc) | | 02/10/46 | | | 26,729 | | | | 267 | |
Series 2014-GC20, Class XB, IO | | 0.472(cc) | | 04/10/47 | | | 28,307 | | | | 10,004 | |
Independence Plaza Trust, | | | | | | | | | | | | |
Series 2018-INDP, Class E, 144A | | 4.996 | | 07/10/35 | | | 3,000 | | | | 2,700,406 | |
JPMBB Commercial Mortgage Securities Trust, | | | | | | | | | | | | |
Series 2014-C21, Class XB, IO | | 0.302(cc) | | 08/15/47 | | | 45,056 | | | | 93,951 | |
Series 2015-C27, Class XB, IO | | 0.405(cc) | | 02/15/48 | | | 52,766 | | | | 214,583 | |
JPMCC Commercial Mortgage Securities Trust, | | | | | | | | | | | | |
Series 2017-JP06, Class A5 | | 3.490 | | 07/15/50 | | | 5,000 | | | | 4,452,686 | |
JPMorgan Chase Commercial Mortgage Securities Trust, | | | | | | | | | | | | |
Series 2013-LC11, Class XB, IO | | 0.512(cc) | | 04/15/46 | | | 34,956 | | | | 350 | |
Series 2016-JP03, Class A5 | | 2.870 | | 08/15/49 | | | 10,495 | | | | 9,445,669 | |
Series 2018-AON, Class E, 144A | | 4.613(cc) | | 07/05/31 | | | 7,950 | | | | 2,703,985 | |
Morgan Stanley Capital I Trust, | | | | | | | | | | | | |
Series 2019-MEAD, Class C, 144A | | 3.177(cc) | | 11/10/36 | | | 2,020 | | | | 1,753,202 | |
Series 2019-MEAD, Class D, 144A | | 3.177(cc) | | 11/10/36 | | | 3,000 | | | | 2,489,996 | |
Series 2019-MEAD, Class E, 144A | | 3.177(cc) | | 11/10/36 | | | 2,505 | | | | 1,969,167 | |
ONE Mortgage Trust, | | | | | | | | | | | | |
Series 2021-PARK, Class E, 144A, 1 Month SOFR + 1.864% (Cap N/A, Floor 1.750%) | | 7.198(c) | | 03/15/36 | | | 3,750 | | | | 3,386,370 | |
Salus European Loan Conduit DAC (United Kingdom), | | | | | | | | | | | | |
Series 33A, Class A, 144A, SONIA + 1.619% (Cap 6.500%, Floor 1.500%) | | 6.500(c) | | 01/23/29 | | GBP | 9,500 | | | | 11,113,771 | |
| | | | | | | | | | | | |
| | | | |
TOTAL COMMERCIAL MORTGAGE-BACKED SECURITIES
(cost $93,361,746) | | | | | | | | | | | 79,174,616 | |
| | | | | | | | | | | | |
See Notes to Financial Statements.
20
| | | | | | | | | | | | | | | | |
| | | | |
| Description | | Interest Rate | | | Maturity Date | | | Principal Amount (000)# | | | Value | |
| | | | |
CONVERTIBLE BOND 0.0% | | | | | | | | | | | | | | | | |
| | | | |
Telecommunications | | | | | | | | | | | | | | | | |
| | | | |
Digicel Group Holdings Ltd. (Jamaica), | | | | | | | | | | | | | | | | |
Sub. Notes, 144A, Cash coupon 7.000% (original cost $8,885; purchased 06/23/20 - 04/03/23)(f) (cost $8,885) | | | 7.000% | | | | 11/16/23(d)(oo) | | | | 47 | | | $ | 2,335 | |
| | | | | | | | | | | | | | | | |
| | | | |
CORPORATE BONDS 24.2% | | | | | | | | | | | | | | | | |
| | | | |
Aerospace & Defense 0.6% | | | | | | | | | | | | | | | | |
| | | | |
Bombardier, Inc. (Canada), | | | | | | | | | | | | | | | | |
Sr. Unsec’d. Notes, 144A(a) | | | 7.500 | | | | 02/01/29 | | | | 1,125 | | | | 1,042,031 | |
Sr. Unsec’d. Notes, 144A | | | 7.875 | | | | 04/15/27 | | | | 5,675 | | | | 5,462,187 | |
Embraer Netherlands Finance BV (Brazil), | | | | | | | | | | | | | | | | |
Sr. Unsec’d. Notes, 144A | | | 7.000 | | | | 07/28/30 | | | | 1,770 | | | | 1,721,768 | |
| | | | | | | | | | | | | | | | |
| | | | |
| | | | | | | | | | | | | | | 8,225,986 | |
| | | | |
Agriculture 0.0% | | | | | | | | | | | | | | | | |
| | | | |
Vector Group Ltd., | | | | | | | | | | | | | | | | |
Sr. Sec’d. Notes, 144A | | | 5.750 | | | | 02/01/29 | | | | 475 | | | | 402,716 | |
| | | | |
Airlines 0.3% | | | | | | | | | | | | | | | | |
| | | | |
American Airlines 2013-1 Class A Pass-Through Trust, | | | | | | | | | | | | | | | | |
Pass-Through Certificates | | | 4.000 | | | | 01/15/27 | | | | 1,402 | | | | 1,313,996 | |
Continental Airlines 2012-2 Class A Pass-Through Trust, | | | | | | | | | | | | | | | | |
Pass-Through Certificates | | | 4.000 | | | | 04/29/26 | | | | 63 | | | | 60,736 | |
United Airlines 2013-1 Class A Pass-Through Trust, | | | | | | | | | | | | | | | | |
Pass-Through Certificates | | | 4.300 | | | | 02/15/27 | | | | 1,355 | | | | 1,298,257 | |
United Airlines, Inc., | | | | | | | | | | | | | | | | |
Sr. Sec’d. Notes, 144A | | | 4.375 | | | | 04/15/26 | | | | 645 | | | | 599,910 | |
Sr. Sec’d. Notes, 144A | | | 4.625 | | | | 04/15/29 | | | | 170 | | | | 143,726 | |
| | | | | | | | | | | | | | | | |
| | | | |
| | | | | | | | | | | | | | | 3,416,625 | |
| | | | |
Apparel 0.0% | | | | | | | | | | | | | | | | |
| | | | |
Wolverine World Wide, Inc., | | | | | | | | | | | | | | | | |
Gtd. Notes, 144A(a) | | | 4.000 | | | | 08/15/29 | | | | 825 | | | | 614,336 | |
| | | | |
Auto Manufacturers 0.4% | | | | | | | | | | | | | | | | |
| | | | |
Ford Motor Credit Co. LLC, | | | | | | | | | | | | | | | | |
Sr. Unsec’d. Notes | | | 3.375 | | | | 11/13/25 | | | | 2,650 | | | | 2,472,643 | |
See Notes to Financial Statements.
PGIM Absolute Return Bond Fund 21
Schedule of Investments (continued)
as of October 31, 2023
| | | | | | | | | | | | | | | | |
| | | | |
| Description | | Interest Rate | | | Maturity Date | | | Principal Amount (000)# | | | Value | |
| | | | |
CORPORATE BONDS (Continued) | | | | | | | | | | | | | | | | |
| | | | |
Auto Manufacturers (cont’d.) | | | | | | | | | | | | | | | | |
| | | | |
Ford Motor Credit Co. LLC, (cont’d.) | | | | | | | | | | | | | | | | |
Sr. Unsec’d. Notes(a) | | | 6.800% | | | | 05/12/28 | | | | 625 | | | $ | 623,433 | |
Sr. Unsec’d. Notes | | | 6.950 | | | | 03/06/26 | | | | 450 | | | | 451,318 | |
General Motors Co., | | | | | | | | | | | | | | | | |
Sr. Unsec’d. Notes | | | 6.250 | | | | 10/02/43 | | | | 1,555 | | | | 1,333,728 | |
| | | | | | | | | | | | | | | | |
| | | | |
| | | | | | | | | | | | | | | 4,881,122 | |
| | | | |
Auto Parts & Equipment 0.2% | | | | | | | | | | | | | | | | |
| | | | |
Adient Global Holdings Ltd., | | | | | | | | | | | | | | | | |
Gtd. Notes, 144A | | | 4.875 | | | | 08/15/26 | | | | 1,900 | | | | 1,764,625 | |
American Axle & Manufacturing, Inc., | | | | | | | | | | | | | | | | |
Gtd. Notes | | | 6.250 | | | | 03/15/26 | | | | 515 | | | | 497,634 | |
Dana, Inc., | | | | | | | | | | | | | | | | |
Sr. Unsec’d. Notes | | | 4.500 | | | | 02/15/32 | | | | 800 | | | | 626,197 | |
Nemak SAB de CV (Mexico), | | | | | | | | | | | | | | | | |
Sr. Unsec’d. Notes, 144A | | | 3.625 | | | | 06/28/31 | | | | 350 | | | | 256,812 | |
| | | | | | | | | | | | | | | | |
| | | | |
| | | | | | | | | | | | | | | 3,145,268 | |
| | | | |
Banks 5.9% | | | | | | | | | | | | | | | | |
| | | | |
ABN AMRO Bank NV (Netherlands), | | | | | | | | | | | | | | | | |
Sr. Unsec’d. Notes, 144A, MTN | | | 6.575(ff) | | | | 10/13/26 | | | | 3,700 | | | | 3,692,985 | |
Banco de Credito del Peru S.A. (Peru), | | | | | | | | | | | | | | | | |
Sub. Notes, 144A, MTN | | | 3.250(ff) | | | | 09/30/31 | | | | 1,055 | | | | 920,044 | |
Banco Mercantil del Norte SA (Mexico), | | | | | | | | | | | | | | | | |
Jr. Sub. Notes, 144A | | | 6.625(ff) | | | | 01/24/32(oo) | | | | 1,110 | | | | 838,050 | |
Bangkok Bank PCL (Thailand), | | | | | | | | | | | | | | | | |
Sub. Notes, 144A | | | 3.466(ff) | | | | 09/23/36 | | | | 945 | | | | 704,261 | |
Bank Gospodarstwa Krajowego (Poland), | | | | | | | | | | | | | | | | |
Gov’t. Gtd. Notes, 144A, MTN(h) | | | 5.375 | | | | 05/22/33 | | | | 969 | | | | 901,170 | |
Bank of America Corp., | | | | | | | | | | | | | | | | |
Jr. Sub. Notes, Series JJ | | | 5.125(ff) | | | | 06/20/24(oo) | | | | 6,850 | | | | 6,673,290 | |
Sr. Unsec’d. Notes, MTN | | | 4.271(ff) | | | | 07/23/29 | | | | 1,450 | | | | 1,318,414 | |
Barclays PLC (United Kingdom), | | | | | | | | | | | | | | | | |
Sr. Unsec’d. Notes | | | 7.437(ff) | | | | 11/02/33 | | | | 3,810 | | | | 3,785,618 | |
Cassa Depositi e Prestiti SpA (Italy), | | | | | | | | | | | | | | | | |
Sr. Unsec’d. Notes, 144A | | | 5.750 | | | | 05/05/26 | | | | 400 | | | | 391,625 | |
Citigroup, Inc., | | | | | | | | | | | | | | | | |
Sr. Unsec’d. Notes | | | 2.976(ff) | | | | 11/05/30 | | | | 870 | | | | 713,776 | |
Sr. Unsec’d. Notes | | | 3.200 | | | | 10/21/26 | | | | 1,145 | | | | 1,056,556 | |
Sr. Unsec’d. Notes | | | 3.785(ff) | | | | 03/17/33 | | | | 1,240 | | | | 1,007,427 | |
Sr. Unsec’d. Notes | | | 3.887(ff) | | | | 01/10/28 | | | | 980 | | | | 908,647 | |
See Notes to Financial Statements.
22
| | | | | | | | | | | | | | | | |
| | | | |
| Description | | Interest Rate | | | Maturity Date | | | Principal Amount (000)# | | | Value | |
| | | | |
CORPORATE BONDS (Continued) | | | | | | | | | | | | | | | | |
| | | | |
Banks (cont’d.) | | | | | | | | | | | | | | | | |
| | | | |
Citigroup, Inc., (cont’d.) | | | | | | | | | | | | | | | | |
Sub. Notes | | | 4.400% | | | | 06/10/25 | | | | 405 | | | $ | 391,950 | |
Freedom Mortgage Corp., | | | | | | | | | | | | | | | | |
Sr. Unsec’d. Notes, 144A | | | 12.000 | | | | 10/01/28 | | | | 175 | | | | 175,604 | |
Goldman Sachs Group, Inc. (The), | | | | | | | | | | | | | | | | |
Sr. Unsec’d. Notes | | | 3.814(ff) | | | | 04/23/29 | | | | 35 | | | | 31,437 | |
Sr. Unsec’d. Notes | | | 3.850 | | | | 01/26/27 | | | | 3,940 | | | | 3,669,630 | |
Sr. Unsec’d. Notes | | | 4.223(ff) | | | | 05/01/29 | | | | 135 | | | | 123,131 | |
Sr. Unsec’d. Notes | | | 6.484(ff) | | | | 10/24/29 | | | | 3,110 | | | | 3,108,210 | |
JPMorgan Chase & Co., | | | | | | | | | | | | | | | | |
Jr. Sub. Notes, Series FF | | | 5.000(ff) | | | | 08/01/24(oo) | | | | 1,500 | | | | 1,451,636 | |
Jr. Sub. Notes, Series HH | | | 4.600(ff) | | | | 02/01/25(oo) | | | | 15,325 | | | | 14,323,947 | |
KeyCorp, | | | | | | | | | | | | | | | | |
Sr. Unsec’d. Notes, MTN | | | 2.550 | | | | 10/01/29 | | | | 2,370 | | | | 1,772,409 | |
M&T Bank Corp., | | | | | | | | | | | | | | | | |
Sub. Notes | | | 4.000 | | | | 07/15/24 | | | | 325 | | | | 317,257 | |
Mizrahi Tefahot Bank Ltd. (Israel), | | | | | | | | | | | | | | | | |
Sub. Notes, 144A | | | 3.077(ff) | | | | 04/07/31 | | | | 1,555 | | | | 1,296,481 | |
Morgan Stanley, | | | | | | | | | | | | | | | | |
Sr. Unsec’d. Notes | | | 6.342(ff) | | | | 10/18/33 | | | | 1,625 | | | | 1,592,985 | |
Sr. Unsec’d. Notes | | | 6.407(ff) | | | | 11/01/29 | | | | 2,570 | | | | 2,568,060 | |
Sr. Unsec’d. Notes, GMTN | | | 2.239(ff) | | | | 07/21/32 | | | | 2,865 | | | | 2,113,917 | |
Sr. Unsec’d. Notes, GMTN | | | 3.772(ff) | | | | 01/24/29 | | | | 1,750 | | | | 1,577,152 | |
| | | | | | | | | | | | | | | | |
Sr. Unsec’d. Notes, GMTN | | | 3.875 | | | | 01/27/26 | | | | 605 | | | | 576,880 | |
Societe Generale SA (France), | | | | | | | | | | | | | | | | |
Sub. Notes, 144A, MTN | | | 6.221(ff) | | | | 06/15/33 | | | | 7,380 | | | | 6,483,462 | |
Truist Financial Corp., | | | | | | | | | | | | | | | | |
Sr. Unsec’d. Notes, MTN | | | 7.161(ff) | | | | 10/30/29 | | | | 1,005 | | | | 1,010,809 | |
UBS Group AG (Switzerland), | | | | | | | | | | | | | | | | |
Sr. Unsec’d. Notes | | | 3.750 | | | | 03/26/25 | | | | 1,200 | | | | 1,154,879 | |
Sr. Unsec’d. Notes, 144A | | | 4.488(ff) | | | | 05/12/26 | | | | 615 | | | | 596,229 | |
Sr. Unsec’d. Notes, 144A | | | 6.537(ff) | | | | 08/12/33 | | | | 1,500 | | | | 1,437,676 | |
Sr. Unsec’d. Notes, 144A, SOFR + 1.580% | | | 6.921(c) | | | | 05/12/26 | | | | 1,925 | | | | 1,936,588 | |
Wells Fargo & Co., | | | | | | | | | | | | | | | | |
Sr. Unsec’d. Notes, MTN | | | 4.808(ff) | | | | 07/25/28 | | | | 6,475 | | | | 6,124,766 | |
| | | | | | | | | | | | | | | | |
| | | | |
| | | | | | | | | | | | | | | 76,746,958 | |
| | | | |
Beverages 0.0% | | | | | | | | | | | | | | | | |
| | | | |
Anheuser-Busch InBev Worldwide, Inc. (Belgium), | | | | | | | | | | | | | | | | |
Gtd. Notes | | | 8.200 | | | | 01/15/39 | | | | 250 | | | | 292,201 | |
See Notes to Financial Statements.
PGIM Absolute Return Bond Fund 23
Schedule of Investments (continued)
as of October 31, 2023
| | | | | | | | | | | | | | | | |
| | | | |
| Description | | Interest Rate | | | Maturity Date | | | Principal Amount (000)# | | | Value | |
| | | | |
CORPORATE BONDS (Continued) | | | | | | | | | | | | | | | | |
| | | | |
Biotechnology 0.1% | | | | | | | | | | | | | | | | |
| | | | |
Amgen, Inc., | | | | | | | | | | | | | | | | |
Sr. Unsec’d. Notes(h) | | | 5.600% | | | | 03/02/43 | | | | 1,675 | | | $ | 1,493,163 | |
| | | | |
Building Materials 0.1% | | | | | | | | | | | | | | | | |
| | | | |
Cemex SAB de CV (Mexico), | | | | | | | | | | | | | | | | |
Gtd. Notes, 144A | | | 5.450 | | | | 11/19/29 | | | | 1,180 | | | | 1,092,237 | |
JELD-WEN, Inc., | | | | | | | | | | | | | | | | |
Gtd. Notes, 144A | | | 4.625 | | | | 12/15/25 | | | | 149 | | | | 141,321 | |
| | | | | | | | | | | | | | | | |
| | | | |
| | | | | | | | | | | | | | | 1,233,558 | |
| | | | |
Chemicals 1.0% | | | | | | | | | | | | | | | | |
| | | | |
Ashland Services BV, | | | | | | | | | | | | | | | | |
Gtd. Notes | | | 2.000 | | | | 01/30/28 | | | EUR | 1,200 | | | | 1,079,011 | |
Ashland, Inc., | | | | | | | | | | | | | | | | |
Sr. Unsec’d. Notes | | | 6.875 | | | | 05/15/43 | | | | 4,100 | | | | 3,860,569 | |
Braskem Netherlands Finance BV (Brazil), | | | | | | | | | | | | | | | | |
Gtd. Notes, 144A | | | 4.500 | | | | 01/10/28 | | | | 1,630 | | | | 1,376,861 | |
Gtd. Notes, 144A | | | 8.500 | | | | 01/12/31 | | | | 1,585 | | | | 1,483,877 | |
FMC Corp., | | | | | | | | | | | | | | | | |
Sr. Unsec’d. Notes | | | 3.450 | | | | 10/01/29 | | | | 3,223 | | | | 2,668,708 | |
LYB International Finance BV, | | | | | | | | | | | | | | | | |
Gtd. Notes | | | 5.250 | | | | 07/15/43 | | | | 175 | | | | 140,097 | |
Nutrien Ltd. (Canada), | | | | | | | | | | | | | | | | |
Sr. Unsec’d. Notes | | | 4.900 | | | | 06/01/43 | | | | 1,350 | | | | 1,064,485 | |
Rain Carbon, Inc., | | | | | | | | | | | | | | | | |
Sr. Sec’d. Notes, 144A | | | 12.250 | | | | 09/01/29 | | | | 225 | | | | 228,943 | |
Sasol Financing USA LLC (South Africa), | | | | | | | | | | | | | | | | |
Gtd. Notes | | | 4.375 | | | | 09/18/26 | | | | 350 | | | | 308,000 | |
TPC Group, Inc., | | | | | | | | | | | | | | | | |
Sr. Sec’d. Notes, 144A (original cost $1,054,922; purchased 12/15/22 - 05/16/23)(f) | | | 13.000 | | | | 12/16/27 | | | | 1,058 | | | | 1,060,169 | |
| | | | | | | | | | | | | | | | |
| | | | |
| | | | | | | | | | | | | | | 13,270,720 | |
| | | | |
Commercial Services 0.7% | | | | | | | | | | | | | | | | |
| | | | |
Allied Universal Holdco LLC/Allied Universal Finance Corp., | | | | | | | | | | | | | | | | |
Sr. Sec’d. Notes, 144A | | | 6.625 | | | | 07/15/26 | | | | 1,000 | | | | 936,176 | |
AMN Healthcare, Inc., | | | | | | | | | | | | | | | | |
Gtd. Notes, 144A | | | 4.000 | | | | 04/15/29 | | | | 1,200 | | | | 999,550 | |
DP World Ltd. (United Arab Emirates), | | | | | | | | | | | | | | | | |
Sr. Unsec’d. Notes, 144A | | | 2.375 | | | | 09/25/26 | | | EUR | 601 | | | | 593,750 | |
See Notes to Financial Statements.
24
| | | | | | | | | | | | | | | | |
| | | | |
| Description | | Interest Rate | | | Maturity Date | | | Principal Amount (000)# | | | Value | |
| | | | |
CORPORATE BONDS (Continued) | | | | | | | | | | | | | | | | |
| | | | |
Commercial Services (cont’d.) | | | | | | | | | | | | | | | | |
| | | | |
ERAC USA Finance LLC, | | | | | | | | | | | | | | | | |
Gtd. Notes, 144A | | | 6.700% | | | | 06/01/34 | | | | 110 | | | $ | 112,512 | |
Gtd. Notes, 144A | | | 7.000 | | | | 10/15/37 | | | | 1,725 | | | | 1,793,077 | |
GTCR W-2 Merger Sub LLC, | | | | | | | | | | | | | | | | |
Sr. Sec’d. Notes, 144A | | | 7.500 | | | | 01/15/31 | | | | 200 | | | | 197,221 | |
Nexi SpA (Italy), | | | | | | | | | | | | | | | | |
Sr. Unsec’d. Notes(a) | | | 2.125 | | | | 04/30/29 | | | EUR | 3,560 | | | | 3,085,980 | |
United Rentals North America, Inc., | | | | | | | | | | | | | | | | |
Gtd. Notes | | | 3.750 | | | | 01/15/32 | | | | 325 | | | | 258,578 | |
Gtd. Notes | | | 5.250 | | | | 01/15/30 | | | | 1,200 | | | | 1,097,427 | |
| | | | | | | | | | | | | | | | |
| | | | |
| | | | | | | | | | | | | | | 9,074,271 | |
| | | | |
Computers 0.2% | | | | | | | | | | | | | | | | |
| | | | |
CA Magnum Holdings (India), | | | | | | | | | | | | | | | | |
Sr. Sec’d. Notes, 144A | | | 5.375 | | | | 10/31/26 | | | | 1,625 | | | | 1,415,148 | |
NCR Atleos Escrow Corp., | | | | | | | | | | | | | | | | |
Sr. Sec’d. Notes, 144A | | | 9.500 | | | | 04/01/29 | | | | 761 | | | | 745,802 | |
| | | | | | | | | | | | | | | | |
| | | | |
| | | | | | | | | | | | | | | 2,160,950 | |
| | | | |
Distribution/Wholesale 0.1% | | | | | | | | | | | | | | | | |
| | | | |
H&E Equipment Services, Inc., | | | | | | | | | | | | | | | | |
Gtd. Notes, 144A | | | 3.875 | | | | 12/15/28 | | | | 1,150 | | | | 974,364 | |
Ritchie Bros Holdings, Inc. (Canada), | | | | | | | | | | | | | | | | |
Sr. Sec’d. Notes, 144A | | | 6.750 | | | | 03/15/28 | | | | 100 | | | | 98,000 | |
| | | | | | | | | | | | | | | | |
| | | | |
| | | | | | | | | | | | | | | 1,072,364 | |
| | | | |
Diversified Financial Services 0.4% | | | | | | | | | | | | | | | | |
| | | | |
Blackstone Private Credit Fund, | | | | | | | | | | | | | | | | |
Sr. Sec’d. Notes^ | | | 5.610 | | | | 05/03/27 | | | | 950 | | | | 866,894 | |
Capital One Financial Corp., | | | | | | | | | | | | | | | | |
Sr. Unsec’d. Notes | | | 7.624(ff) | | | | 10/30/31 | | | | 935 | | | | 934,808 | |
Jefferies Finance LLC/JFIN Co-Issuer Corp., | | | | | | | | | | | | | | | | |
Sr. Unsec’d. Notes, 144A | | | 5.000 | | | | 08/15/28 | | | | 1,025 | | | | 820,692 | |
Jefferies Financial Group, Inc., | | | | | | | | | | | | | | | | |
Sr. Unsec’d. Notes | | | 6.500 | | | | 01/20/43 | | | | 175 | | | | 161,624 | |
Navient Corp., | | | | | | | | | | | | | | | | |
Sr. Unsec’d. Notes | | | 6.750 | | | | 06/25/25 | | | | 575 | | | | 561,572 | |
See Notes to Financial Statements.
PGIM Absolute Return Bond Fund 25
Schedule of Investments (continued)
as of October 31, 2023
| | | | | | | | | | | | | | | | |
| | | | |
| Description | | Interest Rate | | | Maturity Date | | | Principal Amount (000)# | | | Value | |
| | | | |
CORPORATE BONDS (Continued) | | | | | | | | | | | | | | | | |
| | | | |
Diversified Financial Services (cont’d.) | | | | | | | | | | | | | | | | |
| | | | |
OneMain Finance Corp., | | | | | | | | | | | | | | | | |
Gtd. Notes | | | 3.875% | | | | 09/15/28 | | | | 1,200 | | | $ | 953,467 | |
Power Finance Corp. Ltd. (India), | | | | | | | | | | | | | | | | |
Sr. Unsec’d. Notes, EMTN | | | 5.250 | | | | 08/10/28 | | | | 1,100 | | | | 1,051,666 | |
| | | | | | | | | | | | | | | | |
| | | | |
| | | | | | | | | | | | | | | 5,350,723 | |
| | | | |
Electric 1.3% | | | | | | | | | | | | | | | | |
| | | | |
AES Panama Generation Holdings SRL (Panama), | | | | | | | | | | | | | | | | |
Sr. Sec’d. Notes, 144A | | | 4.375 | | | | 05/31/30 | | | | 1,055 | | | | 855,771 | |
American Electric Power Co., Inc., | | | | | | | | | | | | | | | | |
Jr. Sub. Notes | | | 5.699 | | | | 08/15/25 | | | | 2,075 | | | | 2,058,137 | |
Calpine Corp., | | | | | | | | | | | | | | | | |
Sr. Unsec’d. Notes, 144A | | | 4.625 | | | | 02/01/29 | | | | 1,500 | | | | 1,264,862 | |
Sr. Unsec’d. Notes, 144A | | | 5.000 | | | | 02/01/31 | | | | 2,695 | | | | 2,175,633 | |
Clean Renewable Power Mauritius Pte Ltd. (India), | | | | | | | | | | | | | | | | |
Sr. Sec’d. Notes, 144A | | | 4.250 | | | | 03/25/27 | | | | 428 | | | | 364,542 | |
Duke Energy Carolinas LLC, | | | | | | | | | | | | | | | | |
First Ref. Mortgage | | | 4.000 | | | | 09/30/42 | | | | 50 | | | | 36,557 | |
Eskom Holdings SOC Ltd. (South Africa), | | | | | | | | | | | | | | | | |
Sr. Unsec’d. Notes, 144A | | | 7.125 | | | | 02/11/25 | | | | 2,145 | | | | 2,102,100 | |
Mercury Chile Holdco LLC (Chile), | | | | | | | | | | | | | | | | |
Sr. Sec’d. Notes | | | 6.500 | | | | 01/24/27 | | | | 1,400 | | | | 1,256,500 | |
Mong Duong Finance Holdings BV (Vietnam), | | | | | | | | | | | | | | | | |
Sr. Sec’d. Notes | | | 5.125 | | | | 05/07/29 | | | | 1,295 | | | | 1,166,173 | |
NRG Energy, Inc., | | | | | | | | | | | | | | | | |
Gtd. Notes, 144A | | | 3.625 | | | | 02/15/31 | | | | 1,475 | | | | 1,112,933 | |
Gtd. Notes, 144A | | | 3.875 | | | | 02/15/32 | | | | 1,050 | | | | 784,263 | |
Jr. Sub. Notes, 144A | | | 10.250(ff) | | | | 03/15/28(oo) | | | | 275 | | | | 265,375 | |
Tierra Mojada Luxembourg II Sarl (Mexico), | | | | | | | | | | | | | | | | |
Sr. Sec’d. Notes, 144A | | | 5.750 | | | | 12/01/40 | | | | 1,714 | | | | 1,357,412 | |
Vistra Corp., | | | | | | | | | | | | | | | | |
Jr. Sub. Notes, 144A | | | 7.000(ff) | | | | 12/15/26(oo) | | | | 450 | | | | 411,359 | |
Jr. Sub. Notes, 144A | | | 8.000(ff) | | | | 10/15/26(oo) | | | | 1,575 | | | | 1,496,384 | |
| | | | | | | | | | | | | | | | |
| | | | |
| | | | | | | | | | | | | | | 16,708,001 | |
| | | | |
Energy-Alternate Sources 0.0% | | | | | | | | | | | | | | | | |
| | | | |
Aydem Yenilenebilir Enerji A/S (Turkey), | | | | | | | | | | | | | | | | |
Sr. Sec’d. Notes, 144A | | | 7.750 | | | | 02/02/27 | | | | 630 | | | | 550,456 | |
See Notes to Financial Statements.
26
| | | | | | | | | | | | | | | | |
| | | | |
| Description | | Interest Rate | | | Maturity Date | | | Principal Amount (000)# | | | Value | |
| | | | |
CORPORATE BONDS (Continued) | | | | | | | | | | | | | | | | |
| | | | |
Engineering & Construction 0.5% | | | | | | | | | | | | | | | | |
| | | | |
Cellnex Finance Co. SA (Spain), | | | | | | | | | | | | | | | | |
Gtd. Notes, EMTN | | | 2.000% | | | | 02/15/33 | | | EUR | 1,100 | | | $ | 880,847 | |
Cellnex Telecom SA (Spain), | | | | | | | | | | | | | | | | |
Sr. Unsec’d. Notes, EMTN | | | 1.750 | | | | 10/23/30 | | | EUR | 700 | | | | 593,731 | |
IHS Holding Ltd. (Nigeria), | | | | | | | | | | | | | | | | |
Gtd. Notes, 144A | | | 6.250 | | | | 11/29/28 | | | | 850 | | | | 622,583 | |
Mexico City Airport Trust (Mexico), | | | | | | | | | | | | | | | | |
Sr. Sec’d. Notes, 144A | | | 3.875 | | | | 04/30/28 | | | | 2,000 | | | | 1,765,360 | |
Sr. Sec’d. Notes, 144A | | | 4.250 | | | | 10/31/26 | | | | 218 | | | | 201,947 | |
Sr. Sec’d. Notes, 144A | | | 5.500 | | | | 10/31/46 | | | | 415 | | | | 293,297 | |
Sr. Sec’d. Notes, 144A | | | 5.500 | | | | 07/31/47 | | | | 3,395 | | | | 2,415,576 | |
| | | | | | | | | | | | | | | | |
| | | | |
| | | | | | | | | | | | | | | 6,773,341 | |
| | | | |
Entertainment 0.4% | | | | | | | | | | | | | | | | |
| | | | |
Caesars Entertainment, Inc., | | | | | | | | | | | | | | | | |
Sr. Sec’d. Notes, 144A | | | 6.250 | | | | 07/01/25 | | | | 350 | | | | 344,453 | |
Sr. Sec’d. Notes, 144A | | | 7.000 | | | | 02/15/30 | | | | 1,450 | | | | 1,395,652 | |
CCM Merger, Inc., | | | | | | | | | | | | | | | | |
Sr. Unsec’d. Notes, 144A | | | 6.375 | | | | 05/01/26 | | | | 625 | | | | 592,807 | |
Codere Finance 2 Luxembourg SA (Spain), | | | | | | | | | | | | | | | | |
Sr. Sec’d. Notes, Cash coupon 2.000% and PIK 10.750% | | | 12.750 | | | | 11/30/27(d) | | | EUR | 689 | | | | 56,276 | |
Sr. Sec’d. Notes, 144A, Cash coupon 8.000% and PIK 3.000% | | | 11.000 | | | | 09/30/26(d) | | | EUR | 2,008 | | | | 1,445,010 | |
Sr. Sec’d. Notes, 144A | | | 13.000 | | | | 09/30/24 | | | EUR | 330 | | | | 348,301 | |
Penn Entertainment, Inc., | | | | | | | | | | | | | | | | |
Sr. Unsec’d. Notes, 144A(a) | | | 4.125 | | | | 07/01/29 | | | | 391 | | | | 303,823 | |
Premier Entertainment Sub LLC/Premier Entertainment Finance Corp., | | | | | | | | | | | | | | | | |
Gtd. Notes, 144A | | | 5.875 | | | | 09/01/31 | | | | 625 | | | | 424,298 | |
| | | | | | | | | | | | | | | | |
| | | | |
| | | | | | | | | | | | | | | 4,910,620 | |
| | | | |
Foods 0.3% | | | | | | | | | | | | | | | | |
| | | | |
Albertson’s Cos., Inc./Safeway, Inc./New Albertson’s LP/Albertson’s LLC, | | | | | | | | | | | | | | | | |
Gtd. Notes, 144A | | | 6.500 | | | | 02/15/28 | | | | 450 | | | | 441,777 | |
B&G Foods, Inc., | | | | | | | | | | | | | | | | |
Gtd. Notes | | | 5.250 | | | | 09/15/27 | | | | 1,275 | | | | 1,049,353 | |
Bellis Finco PLC (United Kingdom), | | | | | | | | | | | | | | | | |
Gtd. Notes | | | 4.000 | | | | 02/16/27 | | | GBP | 2,700 | | | | 2,426,041 | |
See Notes to Financial Statements.
PGIM Absolute Return Bond Fund 27
Schedule of Investments (continued)
as of October 31, 2023
| | | | | | | | | | | | | | | | |
| | | | |
| Description | | Interest Rate | | | Maturity Date | | | Principal Amount (000)# | | | Value | |
| | | | |
CORPORATE BONDS (Continued) | | | | | | | | | | | | | | | | |
| | | | |
Foods (cont’d.) | | | | | | | | | | | | | | | | |
| | | | |
Lamb Weston Holdings, Inc., | | | | | | | | | | | | | | | | |
Gtd. Notes, 144A | | | 4.125% | | | | 01/31/30 | | | | 175 | | | $ | 148,726 | |
Gtd. Notes, 144A | | | 4.375 | | | | 01/31/32 | | | | 325 | | | | 268,656 | |
| | | | | | | | | | | | | | | | |
| | | | |
| | | | | | | | | | | | | | | 4,334,553 | |
| | | | |
Forest Products & Paper 0.1% | | | | | | | | | | | | | | | | |
| | | | |
Georgia-Pacific LLC, | | | | | | | | | | | | | | | | |
Sr. Unsec’d. Notes | | | 7.375 | | | | 12/01/25 | | | | 400 | | | | 410,921 | |
Suzano Austria GmbH (Brazil), | | | | | | | | | | | | | | | | |
Gtd. Notes | | | 6.000 | | | | 01/15/29 | | | | 1,000 | | | | 960,050 | |
| | | | | | | | | | | | | | | | |
| | | | |
| | | | | | | | | | | | | | | 1,370,971 | |
| | | | |
Gas 0.3% | | | | | | | | | | | | | | | | |
| | | | |
AmeriGas Partners LP/AmeriGas Finance Corp., | | | | | | | | | | | | | | | | |
Sr. Unsec’d. Notes | | | 5.500 | | | | 05/20/25 | | | | 1,500 | | | | 1,439,897 | |
CenterPoint Energy Resources Corp., | | | | | | | | | | | | | | | | |
Sr. Unsec’d. Notes | | | 5.850 | | | | 01/15/41 | | | | 700 | | | | 639,784 | |
ENN Clean Energy International Investment Ltd. (China), | | | | | | | | | | | | | | | | |
Gtd. Notes, 144A | | | 3.375 | | | | 05/12/26 | | | | 1,350 | | | | 1,235,250 | |
Southern Co. Gas Capital Corp., | | | | | | | | | | | | | | | | |
Gtd. Notes | | | 4.400 | | | | 06/01/43 | | | | 1,375 | | | | 992,611 | |
| | | | | | | | | | | | | | | | |
| | | | |
| | | | | | | | | | | | | | | 4,307,542 | |
| | | | |
Healthcare-Products 0.1% | | | | | | | | | | | | | | | | |
| | | | |
Medline Borrower LP, | | | | | | | | | | | | | | | | |
Sr. Sec’d. Notes, 144A | | | 3.875 | | | | 04/01/29 | | | | 250 | | | | 210,982 | |
Sr. Unsec’d. Notes, 144A | | | 5.250 | | | | 10/01/29 | | | | 150 | | | | 127,720 | |
Thermo Fisher Scientific, Inc., | | | | | | | | | | | | | | | | |
Sr. Unsec’d. Notes, EMTN | | | 1.500 | | | | 10/01/39 | | | EUR | 1,250 | | | | 882,418 | |
Sr. Unsec’d. Notes, EMTN | | | 1.875 | | | | 10/01/49 | | | EUR | 825 | | | | 506,236 | |
| | | | | | | | | | | | | | | | |
| | | | |
| | | | | | | | | | | | | | | 1,727,356 | |
| | | | |
Healthcare-Services 0.4% | | | | | | | | | | | | | | | | |
| | | | |
Aetna, Inc., | | | | | | | | | | | | | | | | |
Sr. Unsec’d. Notes | | | 4.500 | | | | 05/15/42 | | | | 530 | | | | 401,059 | |
DaVita, Inc., | | | | | | | | | | | | | | | | |
Gtd. Notes, 144A | | | 4.625 | | | | 06/01/30 | | | | 1,300 | | | | 1,019,228 | |
See Notes to Financial Statements.
28
| | | | | | | | | | | | | | | | |
| | | | |
| Description | | Interest Rate | | | Maturity Date | | | Principal Amount (000)# | | | Value | |
| | | | |
CORPORATE BONDS (Continued) | | | | | | | | | | | | | | | | |
| | | | |
Healthcare-Services (cont’d.) | | | | | | | | | | | | | | | | |
| | | | |
Elevance Health, Inc., | | | | | | | | | | | | | | | | |
Sr. Unsec’d. Notes | | | 4.101% | | | | 03/01/28 | | | | 700 | | | $ | 653,927 | |
Sr. Unsec’d. Notes | | | 4.650 | | | | 01/15/43 | | | | 120 | | | | 95,834 | |
Sr. Unsec’d. Notes | | | 5.100 | | | | 01/15/44 | | | | 515 | | | | 430,139 | |
Tenet Healthcare Corp., | | | | | | | | | | | | | | | | |
Sr. Sec’d. Notes, 144A | | | 6.750 | | | | 05/15/31 | | | | 1,425 | | | | 1,353,574 | |
Sr. Unsec’d. Notes(a) | | | 6.875 | | | | 11/15/31 | | | | 1,200 | | | | 1,107,339 | |
| | | | | | | | | | | | | | | | |
| | | | |
| | | | | | | | | | | | | | | 5,061,100 | |
| | | | |
Home Builders 0.4% | | | | | | | | | | | | | | | | |
| | | | |
Beazer Homes USA, Inc., | | | | | | | | | | | | | | | | |
Gtd. Notes | | | 5.875 | | | | 10/15/27 | | | | 150 | | | | 133,962 | |
Gtd. Notes | | | 7.250 | | | | 10/15/29 | | | | 3,475 | | | | 3,171,164 | |
Taylor Morrison Communities, Inc., | | | | | | | | | | | | | | | | |
Gtd. Notes, 144A | | | 5.875 | | | | 06/15/27 | | | | 2,560 | | | | 2,399,960 | |
| | | | | | | | | | | | | | | | |
| | | | |
| | | | | | | | | | | | | | | 5,705,086 | |
| | | | |
Housewares 0.0% | | | | | | | | | | | | | | | | |
| | | | |
SWF Escrow Issuer Corp., | | | | | | | | | | | | | | | | |
Sr. Unsec’d. Notes, 144A | | | 6.500 | | | | 10/01/29 | | | | 325 | | | | 183,696 | |
| | | | |
Insurance 0.5% | | | | | | | | | | | | | | | | |
| | | | |
Hartford Financial Services Group, Inc. (The), | | | | | | | | | | | | | | | | |
Sr. Unsec’d. Notes | | | 5.950 | | | | 10/15/36 | | | | 215 | | | | 204,520 | |
Sr. Unsec’d. Notes | | | 6.100 | | | | 10/01/41 | | | | 280 | | | | 261,604 | |
Liberty Mutual Group, Inc., | | | | | | | | | | | | | | | | |
Gtd. Notes, 144A | | | 4.569 | | | | 02/01/29 | | | | 1,614 | | | | 1,495,358 | |
Lincoln National Corp., | | | | | | | | | | | | | | | | |
Sr. Unsec’d. Notes | | | 7.000 | | | | 06/15/40 | | | | 695 | | | | 657,680 | |
Markel Group, Inc., | | | | | | | | | | | | | | | | |
Sr. Unsec’d. Notes | | | 5.000 | | | | 03/30/43 | | | | 3,125 | | | | 2,415,301 | |
Principal Financial Group, Inc., | | | | | | | | | | | | | | | | |
Gtd. Notes | | | 4.350 | | | | 05/15/43 | | | | 245 | | | | 182,172 | |
Teachers Insurance & Annuity Association of America, | | | | | | | | | | | | | | | | |
Sub. Notes, 144A(h) | | | 4.900 | | | | 09/15/44 | | | | 1,950 | | | | 1,583,262 | |
Sub. Notes, 144A | | | 6.850 | | | | 12/16/39 | | | | 54 | | | | 54,781 | |
| | | | | | | | | | | | | | | | |
| | | | |
| | | | | | | | | | | | | | | 6,854,678 | |
See Notes to Financial Statements.
PGIM Absolute Return Bond Fund 29
Schedule of Investments (continued)
as of October 31, 2023
| | | | | | | | | | | | | | | | |
| | | | |
| Description | | Interest Rate | | | Maturity Date | | | Principal Amount (000)# | | | Value | |
| | | | |
CORPORATE BONDS (Continued) | | | | | | | | | | | | | | | | |
| | | | |
Internet 0.1% | | | | | | | | | | | | | | | | |
| | | | |
Prosus NV (China), | | | | | | | | | | | | | | | | |
Sr. Unsec’d. Notes, 144A | | | 4.193% | | | | 01/19/32 | | | | 1,250 | | | $ | 961,563 | |
| | | | |
Leisure Time 0.4% | | | | | | | | | | | | | | | | |
| | | | |
Carnival Corp., | | | | | | | | | | | | | | | | |
Gtd. Notes, 144A | | | 5.750 | | | | 03/01/27 | | | | 350 | | | | 311,500 | |
Gtd. Notes, 144A | | | 6.000 | | | | 05/01/29 | | | | 875 | | | | 739,375 | |
NCL Corp. Ltd., | | | | | | | | | | | | | | | | |
Sr. Sec’d. Notes, 144A | | | 8.125 | | | | 01/15/29 | | | | 550 | | | | 535,563 | |
Sr. Sec’d. Notes, 144A | | | 8.375 | | | | 02/01/28 | | | | 925 | | | | 916,906 | |
Royal Caribbean Cruises Ltd., | | | | | | | | | | | | | | | | |
Gtd. Notes, 144A | | | 7.250 | | | | 01/15/30 | | | | 150 | | | | 147,750 | |
Gtd. Notes, 144A | | | 9.250 | | | | 01/15/29 | | | | 600 | | | | 625,500 | |
Sr. Unsec’d. Notes, 144A | | | 5.500 | | | | 08/31/26 | | | | 950 | | | | 895,090 | |
Viking Cruises Ltd., | | | | | | | | | | | | | | | | |
Gtd. Notes, 144A | | | 5.875 | | | | 09/15/27 | | | | 650 | | | | 585,585 | |
Viking Ocean Cruises Ship VII Ltd., | | | | | | | | | | | | | | | | |
Sr. Sec’d. Notes, 144A | | | 5.625 | | | | 02/15/29 | | | | 1,100 | | | | 973,500 | |
| | | | | | | | | | | | | | | | |
| | | | |
| | | | | | | | | | | | | | | 5,730,769 | |
| | | | |
Lodging 0.5% | | | | | | | | | | | | | | | | |
| | | | |
Gohl Capital Ltd. (Malaysia), | | | | | | | | | | | | | | | | |
Gtd. Notes | | | 4.250 | | | | 01/24/27 | | | | 1,510 | | | | 1,380,215 | |
MGM China Holdings Ltd. (Macau), | | | | | | | | | | | | | | | | |
Sr. Unsec’d. Notes, 144A | | | 4.750 | | | | 02/01/27 | | | | 700 | | | | 612,448 | |
MGM Resorts International, | | | | | | | | | | | | | | | | |
Gtd. Notes(a) | | | 4.750 | | | | 10/15/28 | | | | 2,400 | | | | 2,095,107 | |
Sands China Ltd. (Macau), | | | | | | | | | | | | | | | | |
Sr. Unsec’d. Notes | | | 5.375 | | | | 08/08/25 | | | | 203 | | | | 195,588 | |
Sr. Unsec’d. Notes | | | 5.650 | | | | 08/08/28 | | | | 756 | | | | 697,221 | |
Sugarhouse HSP Gaming Prop Mezz LP/Sugarhouse HSP Gaming Finance Corp., | | | | | | | | | | | | | | | | |
Sr. Sec’d. Notes, 144A | | | 5.875 | | | | 05/15/25 | | | | 1,198 | | | | 1,151,523 | |
Wynn Macau Ltd. (Macau), | | | | | | | | | | | | | | | | |
Sr. Unsec’d. Notes, 144A | | | 5.500 | | | | 01/15/26 | | | | 475 | | | | 437,722 | |
| | | | | | | | | | | | | | | | |
| | | | |
| | | | | | | | | | | | | | | 6,569,824 | |
See Notes to Financial Statements.
30
| | | | | | | | | | | | | | | | |
| | | | |
| Description | | Interest Rate | | | Maturity Date | | | Principal Amount (000)# | | | Value | |
| | | | |
CORPORATE BONDS (Continued) | | | | | | | | | | | | | | | | |
| | | | |
Machinery-Diversified 0.1% | | | | | | | | | | | | | | | | |
| | | | |
Chart Industries, Inc., | | | | | | | | | | | | | | | | |
Sr. Sec’d. Notes, 144A | | | 7.500% | | | | 01/01/30 | | | | 1,100 | | | $ | 1,080,774 | |
Maxim Crane Works Holdings Capital LLC, | | | | | | | | | | | | | | | | |
Sec’d. Notes, 144A | | | 11.500 | | | | 09/01/28 | | | | 400 | | | | 390,434 | |
| | | | | | | | | | | | | | | | |
| | | | |
| | | | | | | | | | | | | | | 1,471,208 | |
| | | | |
Media 1.3% | | | | | | | | | | | | | | | | |
| | | | |
Altice Finco SA (Luxembourg), | | | | | | | | | | | | | | | | |
Sec’d. Notes | | | 4.750 | | | | 01/15/28 | | | EUR | 3,350 | | | | 2,621,647 | |
AMC Networks, Inc., | | | | | | | | | | | | | | | | |
Gtd. Notes | | | 5.000 | | | | 04/01/24 | | | | 1,075 | | | | 1,068,264 | |
CCO Holdings LLC/CCO Holdings Capital Corp., | | | | | | | | | | | | | | | | |
Sr. Unsec’d. Notes, 144A | | | 4.750 | | | | 03/01/30 | | | | 1,300 | | | | 1,072,657 | |
Charter Communications Operating LLC/Charter | | | | | | | | | | | | | | | | |
Communications Operating Capital, | | | | | | | | | | | | | | | | |
Sr. Sec’d. Notes | | | 6.384 | | | | 10/23/35 | | | | 2,640 | | | | 2,387,377 | |
Sr. Sec’d. Notes | | | 6.484 | | | | 10/23/45 | | | | 585 | | | | 493,432 | |
CSC Holdings LLC, | | | | | | | | | | | | | | | | |
Gtd. Notes, 144A | | | 5.375 | | | | 02/01/28 | | | | 1,600 | | | | 1,274,437 | |
Gtd. Notes, 144A(a) | | | 5.500 | | | | 04/15/27 | | | | 1,500 | | | | 1,252,471 | |
Sr. Unsec’d. Notes(a) | | | 5.250 | | | | 06/01/24 | | | | 2,000 | | | | 1,870,035 | |
Diamond Sports Group LLC/Diamond Sports Finance Co., | | | | | | | | | | | | | | | | |
Gtd. Notes, 144A (original cost $2,576,156;purchased 07/18/19 - 02/27/20)(f) | | | 6.625 | | | | 08/15/27(d) | | | | 2,785 | | | | 28,121 | |
DISH Network Corp., | | | | | | | | | | | | | | | | |
Sr. Sec’d. Notes, 144A | | | 11.750 | | | | 11/15/27 | | | | 2,350 | | | | 2,327,543 | |
Sinclair Television Group, Inc., | | | | | | | | | | | | | | | | |
Gtd. Notes, 144A | | | 5.125 | | | | 02/15/27 | | | | 425 | | | | 336,371 | |
Univision Communications, Inc., | | | | | | | | | | | | | | | | |
Sr. Sec’d. Notes, 144A | | | 5.125 | | | | 02/15/25 | | | | 564 | | | | 551,028 | |
Virgin Media Secured Finance PLC (United Kingdom), | | | | | | | | | | | | | | | | |
Sr. Sec’d. Notes | | | 4.125 | | | | 08/15/30 | | | GBP | 700 | | | | 675,038 | |
Sr. Sec’d. Notes | | | 4.250 | | | | 01/15/30 | | | GBP | 600 | | | | 587,143 | |
Ziggo BV (Netherlands), | | | | | | | | | | | | | | | | |
Sr. Sec’d. Notes | | | 2.875 | | | | 01/15/30 | | | EUR | 370 | | | | 310,026 | |
| | | | | | | | | | | | | | | | |
| | | | |
| | | | | | | | | | | | | | | 16,855,590 | |
See Notes to Financial Statements.
PGIM Absolute Return Bond Fund 31
Schedule of Investments (continued)
as of October 31, 2023
| | | | | | | | | | | | | | | | |
| | | | |
| Description | | Interest Rate | | | Maturity Date | | | Principal Amount (000)# | | | Value | |
| | | | |
CORPORATE BONDS (Continued) | | | | | | | | | | | | | | | | |
| | | | |
Mining 0.3% | | | | | | | | | | | | | | | | |
| | | | |
AngloGold Ashanti Holdings PLC (Australia), | | | | | | | | | | | | | | | | |
Gtd. Notes | | | 3.375% | | | | 11/01/28 | | | | 730 | | | $ | 600,516 | |
First Quantum Minerals Ltd. (Zambia), | | | | | | | | | | | | | | | | |
Gtd. Notes, 144A | | | 6.875 | | | | 10/15/27 | | | | 600 | | | | 505,500 | |
Freeport Indonesia PT (Indonesia), | | | | | | | | | | | | | | | | |
Sr. Unsec’d. Notes, 144A, MTN | | | 5.315 | | | | 04/14/32 | | | | 600 | | | | 532,956 | |
Indonesia Asahan Aluminium PT/Mineral Industri | | | | | | | | | | | | | | | | |
Indonesia Persero PT (Indonesia), | | | | | | | | | | | | | | | | |
Sr. Unsec’d. Notes | | | 6.530 | | | | 11/15/28 | | | | 1,650 | | | | 1,641,552 | |
| | | | | | | | | | | | | | | | |
| | | | |
| | | | | | | | | | | | | | | 3,280,524 | |
| | | | |
Oil & Gas 2.5% | | | | | | | | | | | | | | | | |
| | | | |
Aker BP ASA (Norway), | | | | | | | | | | | | | | | | |
Sr. Unsec’d. Notes, 144A | | | 2.000 | | | | 07/15/26 | | | | 2,445 | | | | 2,185,091 | |
Ascent Resources Utica Holdings LLC/ARU Finance Corp., | | | | | | | | | | | | | | | | |
Gtd. Notes, 144A | | | 7.000 | | | | 11/01/26 | | | | 1,225 | | | | 1,183,833 | |
Gtd. Notes, 144A | | | 9.000 | | | | 11/01/27 | | | | 899 | | | | 1,136,349 | |
Cenovus Energy, Inc. (Canada), | | | | | | | | | | | | | | | | |
Sr. Unsec’d. Notes | | | 5.400 | | | | 06/15/47 | | | | 1,092 | | | | 890,482 | |
CITGO Petroleum Corp., | | | | | | | | | | | | | | | | |
Sr. Sec’d. Notes, 144A | | | 7.000 | | | | 06/15/25 | | | | 1,325 | | | | 1,303,117 | |
Civitas Resources, Inc., | | | | | | | | | | | | | | | | |
Gtd. Notes, 144A | | | 8.375 | | | | 07/01/28 | | | | 200 | | | | 201,436 | |
Gtd. Notes, 144A | | | 8.625 | | | | 11/01/30 | | | | 225 | | | | 229,010 | |
CNX Resources Corp., | | | | | | | | | | | | | | | | |
Gtd. Notes, 144A | | | 7.250 | | | | 03/14/27 | | | | 525 | | | | 517,003 | |
CrownRock LP/CrownRock Finance, Inc., | | | | | | | | | | | | | | | | |
Sr. Unsec’d. Notes, 144A | | | 5.625 | | | | 10/15/25 | | | | 1,000 | | | | 990,554 | |
Ecopetrol SA (Colombia), | | | | | | | | | | | | | | | | |
Sr. Unsec’d. Notes | | | 6.875 | | | | 04/29/30 | | | | 2,170 | | | | 1,945,297 | |
Sr. Unsec’d. Notes | | | 8.625 | | | | 01/19/29 | | | | 2,105 | | | | 2,095,528 | |
Sr. Unsec’d. Notes | | | 8.875 | | | | 01/13/33 | | | | 2,660 | | | | 2,542,960 | |
Energian Israel Finance Ltd. (Israel), | | | | | | | | | | | | | | | | |
Sr. Sec’d. Notes, 144A | | | 4.875 | | | | 03/30/26 | | | | 1,135 | | | | 995,293 | |
Sr. Sec’d. Notes, 144A | | | 5.375 | | | | 03/30/28 | | | | 857 | | | | 699,526 | |
Hilcorp Energy I LP/Hilcorp Finance Co., | | | | | | | | | | | | | | | | |
Sr. Unsec’d. Notes, 144A | | | 6.250 | | | | 11/01/28 | | | | 700 | | | | 654,498 | |
Sr. Unsec’d. Notes, 144A | | | 6.250 | | | | 04/15/32 | | | | 500 | | | | 436,447 | |
Leviathan Bond Ltd. (Israel), | | | | | | | | | | | | | | | | |
Sr. Sec’d. Notes, 144A | | | 6.750 | | | | 06/30/30 | | | | 600 | | | | 492,600 | |
See Notes to Financial Statements.
32
| | | | | | | | | | | | | | | | |
| | | | |
| Description | | Interest Rate | | | Maturity Date | | | Principal Amount (000)# | | | Value | |
| | | | |
CORPORATE BONDS (Continued) | | | | | | | | | | | | | | | | |
| | | | |
Oil & Gas (cont’d.) | | | | | | | | | | | | | | | | |
| | | | |
Ovintiv, Inc., | | | | | | | | | | | | | | | | |
Gtd. Notes | | | 5.650% | | | | 05/15/28 | | | | 2,145 | | | $ | 2,083,438 | |
Petrobras Global Finance BV (Brazil), | | | | | | | | | | | | | | | | |
Gtd. Notes | | | 5.375 | | | | 10/01/29 | | | GBP | 800 | | | | 848,501 | |
Petroleos Mexicanos (Mexico), | | | | | | | | | | | | | | | | |
Gtd. Notes | | | 4.750 | | | | 02/26/29 | | | EUR | 2,055 | | | | 1,640,777 | |
Gtd. Notes | | | 6.500 | | | | 03/13/27 | | | | 260 | | | | 228,362 | |
Gtd. Notes | | | 6.700 | | | | 02/16/32 | | | | 2,660 | | | | 1,941,800 | |
Gtd. Notes | | | 6.840 | | | | 01/23/30 | | | | 500 | | | | 388,250 | |
Gtd. Notes, EMTN | | | 4.875 | | | | 02/21/28 | | | EUR | 150 | | | | 127,099 | |
Precision Drilling Corp. (Canada), | | | | | | | | | | | | | | | | |
Gtd. Notes, 144A | | | 7.125 | | | | 01/15/26 | | | | 675 | | | | 660,656 | |
Preem Holdings AB (Sweden), | | | | | | | | | | | | | | | | |
Sr. Unsec’d. Notes, 144A | | | 12.000 | | | | 06/30/27 | | | EUR | 1,980 | | | | 2,242,633 | |
Southwestern Energy Co., | | | | | | | | | | | | | | | | |
Gtd. Notes | | | 4.750 | | | | 02/01/32 | | | | 650 | | | | 558,976 | |
Transocean, Inc., | | | | | | | | | | | | | | | | |
Gtd. Notes, 144A | | | 7.250 | | | | 11/01/25 | | | | 3,025 | | | | 2,941,813 | |
| | | | | | | | | | | | | | | | |
| | | | |
| | | | | | | | | | | | | | | 32,161,329 | |
| | | | |
Oil & Gas Services 0.0% | | | | | | | | | | | | | | | | |
| | | | |
Cameron International Corp., | | | | | | | | | | | | | | | | |
Gtd. Notes | | | 5.950 | | | | 06/01/41 | | | | 100 | | | | 84,533 | |
| | | | |
Packaging & Containers 0.2% | | | | | | | | | | | | | | | | |
| | | | |
Ball Corp., | | | | | | | | | | | | | | | | |
Gtd. Notes | | | 6.000 | | | | 06/15/29 | | | | 1,125 | | | | 1,077,489 | |
Pactiv Evergreen Group Issuer LLC/Pactiv Evergreen Group Issuer, Inc., | | | | | | | | | | | | | | | | |
Sr. Sec’d. Notes, 144A(a) | | | 4.375 | | | | 10/15/28 | | | | 1,300 | | | | 1,111,106 | |
Sealed Air Corp./Sealed Air Corp. US, | | | | | | | | | | | | | | | | |
Gtd. Notes, 144A | | | 6.125 | | | | 02/01/28 | | | | 125 | | | | 118,892 | |
| | | | | | | | | | | | | | | | |
| | | | |
| | | | | | | | | | | | | | | 2,307,487 | |
| | | | |
Pharmaceuticals 1.0% | | | | | | | | | | | | | | | | |
| | | | |
AbbVie, Inc., | | | | | | | | | | | | | | | | |
Sr. Unsec’d. Notes | | | 4.050 | | | | 11/21/39 | | | | 905 | | | | 706,156 | |
Sr. Unsec’d. Notes | | | 4.550 | | | | 03/15/35 | | | | 4,155 | | | | 3,650,081 | |
AdaptHealth LLC, | | | | | | | | | | | | | | | | |
Gtd. Notes, 144A | | | 4.625 | | | | 08/01/29 | | | | 750 | | | | 560,762 | |
See Notes to Financial Statements.
PGIM Absolute Return Bond Fund 33
Schedule of Investments (continued)
as of October 31, 2023
| | | | | | | | | | | | | | | | |
| | | | |
| Description | | Interest Rate | | | Maturity Date | | | Principal Amount (000)# | | | Value | |
| | | | |
CORPORATE BONDS (Continued) | | | | | | | | | | | | | | | | |
| | | | |
Pharmaceuticals (cont’d.) | | | | | | | | | | | | | | | | |
| | | | |
AdaptHealth LLC, (cont’d.) | | | | | | | | | | | | | | | | |
Gtd. Notes, 144A | | | 6.125% | | | | 08/01/28 | | | | 800 | | | $ | 661,262 | |
Bausch Health Cos., Inc., | | | | | | | | | | | | | | | | |
Gtd. Notes, 144A | | | 5.000 | | | | 01/30/28 | | | | 400 | | | | 148,000 | |
Gtd. Notes, 144A | | | 6.250 | | | | 02/15/29 | | | | 1,200 | | | | 435,000 | |
Cigna Group (The), | | | | | | | | | | | | | | | | |
Gtd. Notes(h) | | | 4.375 | | | | 10/15/28 | | | | 3,990 | | | | 3,729,295 | |
CVS Health Corp., | | | | | | | | | | | | | | | | |
Sr. Unsec’d. Notes | | | 5.875 | | | | 06/01/53 | | | | 390 | | | | 341,245 | |
Organon & Co./Organon Foreign Debt Co-Issuer BV, | | | | | | | | | | | | | | | | |
Sr. Sec’d. Notes, 144A | | | 4.125 | | | | 04/30/28 | | | | 650 | | | | 561,533 | |
Sr. Unsec’d. Notes, 144A | | | 5.125 | | | | 04/30/31 | | | | 650 | | | | 507,906 | |
Utah Acquisition Sub, Inc., | | | | | | | | | | | | | | | | |
Gtd. Notes | | | 5.250 | | | | 06/15/46 | | | | 520 | | | | 363,776 | |
Viatris, Inc., | | | | | | | | | | | | | | | | |
Gtd. Notes | | | 4.000 | | | | 06/22/50 | | | | 2,190 | | | | 1,256,738 | |
| | | | | | | | | | | | | | | | |
| | | | |
| | | | | | | | | | | | | | | 12,921,754 | |
| | | | |
Pipelines 1.2% | | | | | | | | | | | | | | | | |
| | | | |
AI Candelaria Spain SA (Colombia), | | | | | | | | | | | | | | | | |
Sr. Sec’d. Notes, 144A | | | 5.750 | | | | 06/15/33 | | | | 920 | | | | 623,990 | |
Antero Midstream Partners LP/Antero Midstream Finance Corp., | | | | | | | | | | | | | | | | |
Gtd. Notes, 144A | | | 7.875 | | | | 05/15/26 | | | | 900 | | | | 908,367 | |
Eastern Gas Transmission & Storage, Inc., | | | | | | | | | | | | | | | | |
Sr. Unsec’d. Notes | | | 4.600 | | | | 12/15/44 | | | | 125 | | | | 92,675 | |
Energy Transfer LP, | | | | | | | | | | | | | | | | |
Jr. Sub. Notes, Series G | | | 7.125(ff) | | | | 05/15/30(oo) | | | | 3,360 | | | | 2,825,358 | |
Sr. Unsec’d. Notes | | | 5.150 | | | | 03/15/45 | | | | 55 | | | | 42,621 | |
Sr. Unsec’d. Notes | | | 5.300 | | | | 04/15/47 | | | | 125 | | | | 96,846 | |
Sr. Unsec’d. Notes | | | 5.400 | | | | 10/01/47 | | | | 60 | | | | 47,255 | |
Sr. Unsec’d. Notes | | | 6.250 | | | | 04/15/49 | | | | 75 | | | | 66,143 | |
Magellan Midstream Partners LP, | | | | | | | | | | | | | | | | |
Gtd. Notes | | | 4.200 | | | | 12/01/42 | | | | 125 | | | | 83,958 | |
Gtd. Notes | | | 5.150 | | | | 10/15/43 | | | | 1,350 | | | | 1,073,708 | |
MPLX LP, | | | | | | | | | | | | | | | | |
Sr. Unsec’d. Notes | | | 5.200 | | | | 03/01/47 | | | | 145 | | | | 112,412 | |
NGPL PipeCo LLC, | | | | | | | | | | | | | | | | |
Sr. Unsec’d. Notes, 144A | | | 4.875 | | | | 08/15/27 | | | | 500 | | | | 469,099 | |
ONEOK, Inc., | | | | | | | | | | | | | | | | |
Gtd. Notes | | | 4.950 | | | | 07/13/47 | | | | 1,060 | | | | 792,924 | |
See Notes to Financial Statements.
34
| | | | | | | | | | | | | | | | |
| | | | |
| Description | | Interest Rate | | | Maturity Date | | | Principal Amount (000)# | | | Value | |
| | | | |
CORPORATE BONDS (Continued) | | | | | | | | | | | | | | | | |
| | | | |
Pipelines (cont’d.) | | | | | | | | | | | | | | | | |
| | | | |
ONEOK, Inc., (cont’d.) | | | | | | | | | | | | | | | | |
Gtd. Notes | | | 5.650% | | | | 11/01/28 | | | | 3,435 | | | $ | 3,352,470 | |
Rockies Express Pipeline LLC, | | | | | | | | | | | | | | | | |
Sr. Unsec’d. Notes, 144A | | | 3.600 | | | | 05/15/25 | | | | 775 | | | | 733,395 | |
Sr. Unsec’d. Notes, 144A | | | 6.875 | | | | 04/15/40 | | | | 1,850 | | | | 1,540,912 | |
Tallgrass Energy Partners LP/Tallgrass Energy Finance Corp., | | | | | | | | | | | | | | | | |
Gtd. Notes, 144A | | | 5.500 | | | | 01/15/28 | | | | 1,000 | | | | 880,085 | |
Gtd. Notes, 144A | | | 7.500 | | | | 10/01/25 | | | | 125 | | | | 123,458 | |
Venture Global Calcasieu Pass LLC, | | | | | | | | | | | | | | | | |
Sr. Sec’d. Notes, 144A | | | 3.875 | | | | 08/15/29 | | | | 75 | | | | 62,570 | |
Sr. Sec’d. Notes, 144A | | | 4.125 | | | | 08/15/31 | | | | 75 | | | | 60,418 | |
Western Midstream Operating LP, | | | | | | | | | | | | | | | | |
Sr. Unsec’d. Notes | | | 5.300 | | | | 03/01/48 | | | | 910 | | | | 679,531 | |
Williams Cos., Inc. (The), | | | | | | | | | | | | | | | | |
Sr. Unsec’d. Notes | | | 5.300 | | | | 08/15/52 | | | | 765 | | | | 622,002 | |
| | | | | | | | | | | | | | | | |
| | | | |
| | | | | | | | | | | | | | | 15,290,197 | |
| | | | |
Real Estate 0.1% | | | | | | | | | | | | | | | | |
| | | | |
Arabian Centres Sukuk Ltd. (Saudi Arabia), | | | | | | | | | | | | | | | | |
Gtd. Notes, 144A | | | 5.375 | | | | 11/26/24 | | | | 995 | | | | 949,292 | |
| | | | |
Real Estate Investment Trusts (REITs) 0.2% | | | | | | | | | | | | | | | | |
| | | | |
Diversified Healthcare Trust, | | | | | | | | | | | | | | | | |
Gtd. Notes | | | 4.375 | | | | 03/01/31 | | | | 1,000 | | | | 688,370 | |
MPT Operating Partnership LP/MPT Finance Corp., | | | | | | | | | | | | | | | | |
Gtd. Notes | | | 0.993 | | | | 10/15/26 | | | EUR | 837 | | | | 652,271 | |
Gtd. Notes | | | 5.000 | | | | 10/15/27 | | | | 450 | | | | 348,609 | |
Park Intermediate Holdings LLC/PK Domestic Property LLC/PK Finance Co-Issuer, | | | | | | | | | | | | | | | | |
Sr. Sec’d. Notes, 144A | | | 7.500 | | | | 06/01/25 | | | | 900 | | | | 892,603 | |
| | | | | | | | | | | | | | | | |
| | | | |
| | | | | | | | | | | | | | | 2,581,853 | |
| | | | |
Retail 0.7% | | | | | | | | | | | | | | | | |
| | | | |
Brinker International, Inc., | | | | | | | | | | | | | | | | |
Gtd. Notes, 144A | | | 5.000 | | | | 10/01/24 | | | | 500 | | | | 487,752 | |
eG Global Finance PLC (United Kingdom), | | | | | | | | | | | | | | | | |
Sr. Sec’d. Notes | | | 6.250 | | | | 10/30/25 | | | EUR | 231 | | | | 239,791 | |
Sr. Sec’d. Notes, 144A | | | 4.375 | | | | 02/07/25 | | | EUR | 4,346 | | | | 4,482,070 | |
See Notes to Financial Statements.
PGIM Absolute Return Bond Fund 35
Schedule of Investments (continued)
as of October 31, 2023
| | | | | | | | | | | | |
| | | | |
| Description | | Interest Rate | | Maturity Date | | Principal Amount (000)# | | | Value | |
| | | | |
CORPORATE BONDS (Continued) | | | | | | | | | | | | |
| | | | |
Retail (cont’d.) | | | | | | | | | | | | |
| | | | |
Falabella SA (Chile), | | | | | | | | | | | | |
Sr. Unsec’d. Notes, 144A | | 3.375% | | 01/15/32 | | | 1,200 | | | $ | 835,128 | |
Fertitta Entertainment LLC/Fertitta Entertainment Finance Co., Inc., | | | | | | | | | | | | |
Gtd. Notes, 144A | | 6.750 | | 01/15/30 | | | 750 | | | | 596,010 | |
Macy’s Retail Holdings LLC, | | | | | | | | | | | | |
Gtd. Notes | | 4.300 | | 02/15/43 | | | 705 | | | | 386,149 | |
Sally Holdings LLC/Sally Capital, Inc., | | | | | | | | | | | | |
Gtd. Notes | | 5.625 | | 12/01/25 | | | 1,825 | | | | 1,763,830 | |
| | | | | | | | | | | | |
| | | | |
| | | | | | | | | | | 8,790,730 | |
| | | | |
Telecommunications 1.2% | | | | | | | | | | | | |
| | | | |
AT&T, Inc., | | | | | | | | | | | | |
Sr. Unsec’d. Notes | | 2.550 | | 12/01/33 | | | 727 | | | | 521,705 | |
Sr. Unsec’d. Notes | | 3.500 | | 09/15/53 | | | 929 | | | | 547,067 | |
Sr. Unsec’d. Notes | | 3.650 | | 09/15/59 | | | 318 | | | | 183,867 | |
Sr. Unsec’d. Notes | | 4.500 | | 05/15/35 | | | 695 | | | | 578,877 | |
CT Trust (Guatemala), | | | | | | | | | | | | |
Sr. Sec’d. Notes, 144A | | 5.125 | | 02/03/32 | | | 760 | | | | 581,400 | |
Digicel Group Holdings Ltd. (Jamaica), | | | | | | | | | | | | |
Sr. Unsec’d. Notes, 144A, Cash coupon 5.000% and PIK 3.000% (original cost $39,683; purchased 06/23/20)(f) | | 8.000 | | 04/01/25(d) | | | 192 | | | | 38,358 | |
Digicel International Finance Ltd./Digicel International Holdings Ltd. (Jamaica), | | | | | | | | | | | | |
Gtd. Notes, 144A (original cost $736,209; purchased 05/22/20 - 03/15/23)(f) | | 8.000 | | 12/31/26(d) | | | 2,424 | | | | 48,479 | |
Gtd. Notes, 144A, Cash coupon 13.000% (original cost $485,030; purchased 10/19/23)(f) | | 13.000 | | 12/31/25(d) | | | 692 | | | | 478,116 | |
Sr. Sec’d. Notes, 144A (original cost $1,075,788; purchased 10/19/23)(f) | | 8.750 | | 05/25/24 | | | 1,138 | | | | 1,042,501 | |
Digicel Ltd. (Jamaica), | | | | | | | | | | | | |
Gtd. Notes, 144A | | 6.750 | | 03/01/23(d) | | | 2,050 | | | | 51,250 | |
Intelsat Jackson Holdings SA (Luxembourg), | | | | | | | | | | | | |
Sr. Sec’d. Notes, 144A | | 6.500 | | 03/15/30 | | | 1,400 | | | | 1,228,500 | |
Kaixo Bondco Telecom SA (Spain), | | | | | | | | | | | | |
Sr. Sec’d. Notes, 144A | | 5.125 | | 09/30/29 | | EUR | 1,950 | | | | 1,829,010 | |
Level 3 Financing, Inc., | | | | | | | | | | | | |
Sr. Sec’d. Notes, 144A | | 3.400 | | 03/01/27 | | | 465 | | | | 432,455 | |
Sr. Sec’d. Notes, 144A | | 10.500 | | 05/15/30 | | | 275 | | | | 275,236 | |
See Notes to Financial Statements.
36
| | | | | | | | | | | | | | | | |
| | | | |
| Description | | Interest Rate | | | Maturity Date | | | Principal Amount (000)# | | | Value | |
| | | | |
CORPORATE BONDS (Continued) | | | | | | | | | | | | | | | | |
| | | | |
Telecommunications (cont’d.) | | | | | | | | | | | | | | | | |
| | | | |
Millicom International Cellular SA (Guatemala), | | | | | | | | | | | | | | | | |
Sr. Unsec’d. Notes, 144A | | | 4.500% | | | | 04/27/31 | | | | 515 | | | $ | 383,829 | |
Sprint LLC, | | | | | | | | | | | | | | | | |
Gtd. Notes | | | 7.125 | | | | 06/15/24 | | | | 2,000 | | | | 2,010,759 | |
Gtd. Notes | | | 7.625 | | | | 02/15/25 | | | | 1,150 | | | | 1,165,804 | |
TalkTalk Telecom Group Ltd. (United Kingdom), | | | | | | | | | | | | | | | | |
Gtd. Notes | | | 3.875 | | | | 02/20/25 | | | GBP | 1,300 | | | | 1,193,952 | |
Total Play Telecomunicaciones SA de CV (Mexico), | | | | | | | | | | | | | | | | |
Gtd. Notes, 144A | | | 6.375 | | | | 09/20/28 | | | | 480 | | | | 227,174 | |
Verizon Communications, Inc., | | | | | | | | | | | | | | | | |
Sr. Unsec’d. Notes | | | 3.400 | | | | 03/22/41 | | | | 1,575 | | | | 1,061,373 | |
Viasat, Inc., | | | | | | | | | | | | | | | | |
Sr. Unsec’d. Notes, 144A | | | 5.625 | | | | 09/15/25 | | | | 1,650 | | | | 1,531,775 | |
Sr. Unsec’d. Notes, 144A | | | 7.500 | | | | 05/30/31 | | | | 400 | | | | 261,550 | |
| | | | | | | | | | | | | | | | |
| | | | |
| | | | | | | | | | | | | | | 15,673,037 | |
| | | | |
Transportation 0.1% | | | | | | | | | | | | | | | | |
| | | | |
Burlington Northern Santa Fe LLC, | | | | | | | | | | | | | | | | |
Sr. Unsec’d. Notes | | | 5.050 | | | | 03/01/41 | | | | 295 | | | | 256,885 | |
Forward Air Corp., | | | | | | | | | | | | | | | | |
Sr. Sec’d. Notes, 144A | | | 9.500 | | | | 10/15/31 | | | | 650 | | | | 633,644 | |
Indian Railway Finance Corp. Ltd. (India), | | | | | | | | | | | | | | | | |
Sr. Unsec’d. Notes, 144A, MTN | | | 3.570 | | | | 01/21/32 | | | | 360 | | | | 293,306 | |
XPO, Inc., | | | | | | | | | | | | | | | | |
Gtd. Notes, 144A | | | 7.125 | | | | 06/01/31 | | | | 225 | | | | 219,197 | |
| | | | | | | | | | | | | | | | |
| | | | |
| | | | | | | | | | | | | | | 1,403,032 | |
| | | | | | | | | | | | | | | | |
| | | | |
TOTAL CORPORATE BONDS
(cost $359,873,844) | | | | | | | | | | | | | | | 316,901,083 | |
| | | | | | | | | | | | | | | | |
| | | | |
FLOATING RATE AND OTHER LOANS 0.7% | | | | | | | | | | | | | | | | |
| | | | |
Airlines 0.0% | | | | | | | | | | | | | | | | |
| | | | |
United Airlines, Inc., | | | | | | | | | | | | | | | | |
Class B Term Loan, 1 Month SOFR + 3.864% | | | 9.189(c) | | | | 04/21/28 | | | | 389 | | | | 390,166 | |
| | | | |
Computers 0.1% | | | | | | | | | | | | | | | | |
McAfee Corp., | | | | | | | | | | | | | | | | |
Tranche B-1 Term Loan, 1 Month SOFR + 3.850% | | | 9.165(c) | | | | 03/01/29 | | | | 1,012 | | | | 963,265 | |
See Notes to Financial Statements.
PGIM Absolute Return Bond Fund 37
Schedule of Investments (continued)
as of October 31, 2023
| | | | | | | | | | | | |
| | | | |
| Description | | Interest Rate | | Maturity Date | | Principal Amount (000)# | | | Value | |
| | | | |
FLOATING RATE AND OTHER LOANS (Continued) | | | | | | | | | | | | |
| | | | |
Diversified Financial Services 0.1% | | | | | | | | | | | | |
| | | | |
Hudson River Trading LLC, | | | | | | | | | | | | |
Term Loan, 1 Month SOFR + 3.114% | | 8.439%(c) | | 03/20/28 | | | 1,174 | | | $ | 1,156,004 | |
| | | | |
Investment Companies 0.2% | | | | | | | | | | | | |
| | | | |
Rainbow Midco Ltd. (United Kingdom), | | | | | | | | | | | | |
Term Loan, 3 Month EURIBOR + 7.750%^ | | 7.201(c) | | 02/23/29 | | EUR | 2,754 | | | | 2,881,244 | |
| | | | |
Media 0.0% | | | | | | | | | | | | |
| | | | |
Diamond Sports Group LLC, | | | | | | | | | | | | |
First Lien Term Loan, 1 Month SOFR + 10.100% | | 12.775(c) | | 05/25/26 | | | 41 | | | | 15,190 | |
Second Lien Term Loan, 6 Month SOFR + 3.500% | | 10.685(c) | | 08/24/26 | | | 2,065 | | | | 23,229 | |
| | | | | | | | | | | | |
| | | | |
| | | | | | | | | | | 38,419 | |
| | | | |
Metal Fabricate/Hardware 0.1% | | | | | | | | | | | | |
| | | | |
Tank Holding Corp., | | | | | | | | | | | | |
2023 Incremental Term Loan, 1 Month SOFR + 6.100%^ | | 11.424(c) | | 03/31/28 | | | 153 | | | | 145,951 | |
Delayed Draw Term Commitment^ | | — (p) | | 03/31/28 | | | 22 | | | | 21,165 | |
Term Loan, 1 Month SOFR + 5.850% | | 11.174(c) | | 03/31/28 | | | 1,136 | | | | 1,078,844 | |
| | | | | | | | | | | | |
| | | | |
| | | | | | | | | | | 1,245,960 | |
| | | | |
Retail 0.2% | | | | | | | | | | | | |
| | | | |
Constellation Automotive Group Ltd. (United Kingdom), | | | | | | | | | | | | |
Facility 1 Loan, SONIA + 7.500% | | 12.709(c) | | 07/27/29 | | GBP | 1,025 | | | | 839,071 | |
Great Outdoors Group LLC, | | | | | | | | | | | | |
Term B-2 Loan, 3 Month SOFR + 4.012% | | 9.402(c) | | 03/06/28 | | | 1,244 | | | | 1,231,995 | |
| | | | | | | | | | | | |
| | | | |
| | | | | | | | | | | 2,071,066 | |
| | | | |
Telecommunications 0.0% | | | | | | | | | | | | |
| | | | |
Digicel International Finance Ltd. (Jamaica), | | | | | | | | | | | | |
First Lien Initial Term B Loan, 6 Month LIBOR + 3.250% | | 8.981(c) | | 05/27/24 | | | 188 | | | | 172,284 | |
| | | | | | | | | | | | |
| | | | |
TOTAL FLOATING RATE AND OTHER LOANS
(cost $10,287,707) | | | | | | | | | | | 8,918,408 | |
| | | | | | | | | | | | |
See Notes to Financial Statements.
38
| | | | | | | | | | | | | | | | |
| | | | |
| Description | | Interest Rate | | | Maturity Date | | | Principal Amount (000)# | | | Value | |
| | | | |
MUNICIPAL BONDS 1.3% | | | | | | | | | | | | | | | | |
| | | | |
California 0.2% | | | | | | | | | | | | | | | | |
| | | | |
Bay Area Toll Authority, | | | | | | | | | | | | | | | | |
Revenue Bonds, BABs, Series F2 | | | 6.263% | | | | 04/01/49 | | | | 550 | | | $ | 567,258 | |
Los Angeles Department of Water & Power, Water System Revenue, | | | | | | | | | | | | | | | | |
Taxable, Revenue Bonds, BABs, Series C | | | 6.008 | | | | 07/01/39 | | | | 1,730 | | | | 1,719,032 | |
University of California, | | | | | | | | | | | | | | | | |
Taxable, Revenue Bonds, Series AP | | | 3.931 | | | | 05/15/45 | | | | 625 | | | | 519,551 | |
Taxable, Revenue Bonds, Series J | | | 4.131 | | | | 05/15/45 | | | | 675 | | | | 541,187 | |
| | | | | | | | | | | | | | | | |
| | | | |
| | | | | | | | | | | | | | | 3,347,028 | |
| | | | |
Colorado 0.1% | | | | | | | | | | | | | | | | |
| | | | |
Regional Transportation District Sales Tax Revenue, | | | | | | | | | | | | | | | | |
Revenue Bonds, BABs, Series B | | | 5.844 | | | | 11/01/50 | | | | 1,190 | | | | 1,167,792 | |
| | | | |
Illinois 0.1% | | | | | | | | | | | | | | | | |
| | | | |
State of Illinois, | | | | | | | | | | | | | | | | |
General Obligation Unlimited, Taxable | | | 5.100 | | | | 06/01/33 | | | | 865 | | | | 803,019 | |
| | | | |
New Jersey 0.2% | | | | | | | | | | | | | | | | |
| | | | |
New Jersey Turnpike Authority, | | | | | | | | | | | | | | | | |
Taxable, Revenue Bonds, BABs, Series F | | | 7.414 | | | | 01/01/40 | | | | 2,000 | | | | 2,245,834 | |
Rutgers The State University of New Jersey, | | | | | | | | | | | | | | | | |
Taxable, Revenue Bonds, BABs, Series H | | | 5.665 | | | | 05/01/40 | | | | 200 | | | | 195,076 | |
| | | | | | | | | | | | | | | | |
| | | | |
| | | | | | | | | | | | | | | 2,440,910 | |
| | | | |
Ohio 0.0% | | | | | | | | | | | | | | | | |
| | | | |
Ohio State University (The), | | | | | | | | | | | | | | | | |
Taxable, Revenue Bonds, Series A | | | 4.800 | | | | 06/01/2111 | | | | 180 | | | | 140,046 | |
| | | | |
Puerto Rico 0.7% | | | | | | | | | | | | | | | | |
| | | | |
Commonwealth of Puerto Rico, | | | | | | | | | | | | | | | | |
General Obligation, Sub-Series C | | | 0.000(cc) | | | | 11/01/43 | | | | 8,692 | | | | 4,466,020 | |
Puerto Rico Sales Tax Financing Corp. Sales Tax Revenue, | | | | | | | | | | | | | | | | |
Revenue Bonds, Restructured, Series A-1(h) | | | 4.750 | | | | 07/01/53 | | | | 5,846 | | | | 4,931,437 | |
| | | | | | | | | | | | | | | | |
| | | | |
| | | | | | | | | | | | | | | 9,397,457 | |
See Notes to Financial Statements.
PGIM Absolute Return Bond Fund 39
Schedule of Investments (continued)
as of October 31, 2023
| | | | | | | | | | | | | | | | |
| | | | |
| Description | | Interest Rate | | | Maturity Date | | | Principal Amount (000)# | | | Value | |
| | | | |
MUNICIPAL BONDS (Continued) | | | | | | | | | | | | | | | | |
| | | | |
Texas 0.0% | | | | | | | | | | | | | | | | |
| | | | |
City of San Antonio Electric & Gas Systems Revenue, | | | | | | | | | | | | | | | | |
Taxable, Revenue Bonds | | | 4.427% | | | | 02/01/42 | | | | 120 | | | $ | 101,542 | |
| | | | | | | | | | | | | | | | |
| | | | |
TOTAL MUNICIPAL BONDS
(cost $20,192,993) | | | | | | | | | | | | | | | 17,397,794 | |
| | | | | | | | | | | | | | | | |
| | | | |
RESIDENTIAL MORTGAGE-BACKED SECURITIES 2.7% | | | | | | | | | | | | | | | | |
| | | | |
Bellemeade Re Ltd., | | | | | | | | | | | | | | | | |
Series 2021-01A, Class M1C, 144A, 30 Day Average SOFR + 2.950% (Cap N/A, Floor 2.950%) | | | 8.271(c) | | | | 03/25/31 | | | | 960 | | | | 975,875 | |
Chase Mortgage Finance Trust, | | | | | | | | | | | | | | | | |
Series 2007-A01, Class 1A3 | | | 4.979(cc) | | | | 02/25/37 | | | | 34 | | | | 32,623 | |
Connecticut Avenue Securities Trust, | | | | | | | | | | | | | | | | |
Series 2020-R01, Class 1M2, 144A, 30 Day Average SOFR + 2.164% (Cap N/A, Floor 0.000%) | | | 7.485(c) | | | | 01/25/40 | | | | 47 | | | | 47,108 | |
Series 2021-R01, Class 1B1, 144A, 30 Day Average SOFR + 3.100% (Cap N/A, Floor 0.000%) | | | 8.421(c) | | | | 10/25/41 | | | | 1,190 | | | | 1,186,295 | |
Series 2022-R01, Class 1B1, 144A, 30 Day Average SOFR + 3.150% (Cap N/A, Floor 0.000%) | | | 8.471(c) | | | | 12/25/41 | | | | 1,218 | | | | 1,214,201 | |
Series 2022-R02, Class 2M2, 144A, 30 Day Average SOFR + 3.000% (Cap N/A, Floor 0.000%) | | | 8.321(c) | | | | 01/25/42 | | | | 1,900 | | | | 1,899,263 | |
Series 2022-R03, Class 1B1, 144A, 30 Day Average SOFR + 6.250% (Cap N/A, Floor 0.000%) | | | 11.571(c) | | | | 03/25/42 | | | | 1,000 | | | | 1,088,629 | |
Series 2022-R04, Class 1B1, 144A, 30 Day Average SOFR + 5.250% (Cap N/A, Floor 0.000%) | | | 10.571(c) | | | | 03/25/42 | | | | 290 | | | | 307,164 | |
Series 2022-R04, Class 1M2, 144A, 30 Day Average SOFR + 3.100% (Cap N/A, Floor 0.000%) | | | 8.421(c) | | | | 03/25/42 | | | | 1,000 | | | | 1,018,053 | |
Series 2023-R05, Class 1M2, 144A, 30 Day Average SOFR + 3.100% (Cap N/A, Floor 3.100%) | | | 8.421(c) | | | | 06/25/43 | | | | 1,400 | | | | 1,427,757 | |
Eagle Re Ltd., | | | | | | | | | | | | | | | | |
Series 2018-01, Class M1, 144A, 1 Month LIBOR + 1.700% (Cap N/A, Floor 1.700%) | | | 7.139(c) | | | | 11/25/28 | | | | 1,893 | | | | 1,893,276 | |
See Notes to Financial Statements.
40
| | | | | | | | | | | | |
| | | | |
| Description | | Interest Rate | | Maturity Date | | Principal Amount (000)# | | | Value | |
| | |
RESIDENTIAL MORTGAGE-BACKED SECURITIES (Continued) | | | | | | | | |
Eagle Re Ltd., (cont’d.) | | | | | | | | | | | | |
Series 2021-02, Class M1C, 144A, 30 Day Average SOFR + 3.450% (Cap N/A, Floor 3.450%) | | 8.771%(c) | | 04/25/34 | | | 910 | | | $ | 917,700 | |
Series 2023-01, Class M1A, 144A, 30 Day Average SOFR + 2.000% (Cap N/A, Floor 2.000%) | | 7.321(c) | | 09/26/33 | | | 400 | | | | 400,233 | |
FHLMC Structured Agency Credit Risk Debt Notes, | | | | | | | | | | | | |
Series 2021-DNA02, Class B1, 144A, 30 Day Average SOFR + 3.400% (Cap N/A, Floor 0.000%) | | 8.721(c) | | 08/25/33 | | | 3,460 | | | | 3,525,761 | |
Series 2021-DNA02, Class M2, 144A, 30 Day Average SOFR + 2.300% (Cap N/A, Floor 0.000%) | | 7.621(c) | | 08/25/33 | | | 1,812 | | | | 1,818,374 | |
FHLMC Structured Agency Credit Risk REMIC Trust, | | | | | | | | | | | | |
Series 2020-DNA02, Class B1, 144A, 30 Day Average SOFR + 2.614% (Cap N/A, Floor 0.000%) | | 7.935(c) | | 02/25/50 | | | 500 | | | | 502,493 | |
Series 2021-DNA01, Class B1, 144A, 30 Day Average SOFR + 2.650% (Cap N/A, Floor 0.000%) | | 7.971(c) | | 01/25/51 | | | 835 | | | | 815,178 | |
Series 2021-DNA03, Class B1, 144A, 30 Day Average SOFR + 3.500% (Cap N/A, Floor 0.000%) | | 8.821(c) | | 10/25/33 | | | 200 | | | | 204,124 | |
Series 2021-DNA06, Class M2, 144A, 30 Day Average SOFR + 1.500% (Cap N/A, Floor 0.000%) | | 6.821(c) | | 10/25/41 | | | 1,520 | | | | 1,496,918 | |
Series 2021-DNA07, Class M2, 144A, 30 Day Average SOFR + 1.800% (Cap N/A, Floor 0.000%) | | 7.121(c) | | 11/25/41 | | | 100 | | | | 98,221 | |
Series 2021-HQA01, Class B1, 144A, 30 Day Average SOFR + 3.000% (Cap N/A, Floor 0.000%) | | 8.321(c) | | 08/25/33 | | | 200 | | | | 197,126 | |
Series 2021-HQA03, Class B1, 144A, 30 Day Average SOFR + 3.350% (Cap N/A, Floor 0.000%) | | 8.671(c) | | 09/25/41 | | | 170 | | | | 168,725 | |
Series 2021-HQA03, Class M2, 144A, 30 Day Average SOFR + 2.100% (Cap N/A, Floor 0.000%) | | 7.421(c) | | 09/25/41 | | | 100 | | | | 97,125 | |
Series 2022-DNA01, Class M1B, 144A, 30 Day Average SOFR + 1.850% (Cap N/A, Floor 0.000%) | | 7.171(c) | | 01/25/42 | | | 500 | | | | 492,505 | |
Series 2022-DNA02, Class M1B, 144A, 30 Day Average SOFR + 2.400% (Cap N/A, Floor 0.000%) | | 7.721(c) | | 02/25/42 | | | 1,400 | | | | 1,402,620 | |
See Notes to Financial Statements.
PGIM Absolute Return Bond Fund 41
Schedule of Investments (continued)
as of October 31, 2023
| | | | | | | | | | | | |
| | | | |
| Description | | Interest Rate | | Maturity Date | | Principal Amount (000)# | | | Value | |
| | |
RESIDENTIAL MORTGAGE-BACKED SECURITIES (Continued) | | | | | | | | |
FHLMC Structured Agency Credit Risk REMIC Trust, (cont’d.) | | | | | | | | | | | | |
Series 2022-DNA03, Class M1B, 144A, 30 Day Average SOFR + 2.900% (Cap N/A, Floor 0.000%) | | 8.221%(c) | | 04/25/42 | | | 2,020 | | | $ | 2,057,873 | |
Series 2022-DNA04, Class M1B, 144A, 30 Day Average SOFR + 3.350% (Cap N/A, Floor 0.000%) | | 8.671(c) | | 05/25/42 | | | 200 | | | | 206,474 | |
Series 2022-HQA03, Class M2, 144A, 30 Day Average SOFR + 5.350% (Cap N/A, Floor 0.000%) | | 10.671(c) | | 08/25/42 | | | 600 | | | | 633,729 | |
GSMSC Resecuritization Trust, | | | | | | | | | | | | |
Series 2015-03R, Class 2A2, 144A, 1 Month SOFR + 0.254% (Cap N/A, Floor 0.140%) | | 5.579(c) | | 10/26/36 | | | 321 | | | | 319,145 | |
JPMorgan Mortgage Trust, | | | | | | | | | | | | |
Series 2007-A01, Class 4A1 | | 5.676(cc) | | 07/25/35 | | | 8 | | | | 8,275 | |
Legacy Mortgage Asset Trust, | | | | | | | | | | | | |
Series 2021-SL02, Class A, 144A | | 1.875 | | 10/25/68 | | | 166 | | | | 153,119 | |
New Residential Mortgage Loan Trust, | | | | | | | | | | | | |
Series 2018-04A, Class A1S, 144A, 1 Month SOFR + 0.864% (Cap N/A, Floor 0.750%) | | 6.189(c) | | 01/25/48 | | | 1,128 | | | | 1,090,841 | |
Oaktown Re VII Ltd., | | | | | | | | | | | | |
Series 2021-02, Class M1B, 144A, 30 Day Average SOFR + 2.900% (Cap N/A, Floor 2.900%) | | 8.221(c) | | 04/25/34 | | | 1,000 | | | | 1,009,496 | |
PNMAC GMSR Issuer Trust, | | | | | | | | | | | | |
Series 2018-GT01, Class A, 144A, 1 Month LIBOR + 3.850% (Cap N/A, Floor 2.850%) | | 9.289(c) | | 02/25/25 | | | 1,650 | | | | 1,649,989 | |
Series 2018-GT02, Class A, 144A, 1 Month LIBOR + 2.650% (Cap N/A, Floor 0.000%) | | 8.089(c) | | 08/25/25 | | | 3,400 | | | | 3,397,982 | |
Radnor Re Ltd., | | | | | | | | | | | | |
Series 2021-02, Class M1B, 144A, 30 Day Average SOFR + 3.700% (Cap N/A, Floor 3.700%) | | 9.021(c) | | 11/25/31 | | | 1,000 | | | | 1,023,368 | |
Series 2023-01, Class M1A, 144A, 30 Day Average SOFR + 2.700% (Cap N/A, Floor 2.700%) | | 8.021(c) | | 07/25/33 | | | 750 | | | | 754,433 | |
Retiro Mortgage Securities DAC (Spain), | | | | | | | | | | | | |
Series 01A, Class A1, 144A, 3 Month EURIBOR + 2.000% (Cap 5.000%, Floor 0.000%) | | 5.000(c) | | 07/30/75 | | EUR | 314 | | | | 326,304 | |
Structured Asset Securities Corp. Mortgage Pass-Through Certificates, | | | | | | | | | | | | |
Series 2003-37A, Class 3A7 | | 6.684(cc) | | 12/25/33 | | | 216 | | | | 202,453 | |
| | | | | | | | | | | | |
| | | | |
TOTAL RESIDENTIAL MORTGAGE-BACKED SECURITIES
(cost $35,560,865) | | | | | | | | | | | 36,060,828 | |
| | | | | | | | | | | | |
See Notes to Financial Statements.
42
| | | | | | | | | | | | |
| | | | |
| Description | | Interest Rate | | Maturity Date | | Principal Amount (000)# | | | Value | |
| | | | |
SOVEREIGN BONDS 2.6% | | | | | | | | | | | | |
Bermuda Government International Bond (Bermuda), | | | | | | | | | | | | |
Sr. Unsec’d. Notes, 144A | | 2.375% | | 08/20/30 | | | 685 | | | $ | 542,177 | |
Brazil Minas SPE via State of Minas Gerais (Brazil),
Gov’t. Gtd. Notes | | 5.333 | | 02/15/28 | | | 1,645 | | | | 1,595,124 | |
Colombia Government International Bond (Colombia), | | | | | | | | | | | | |
Sr. Unsec’d. Notes | | 7.500 | | 02/02/34 | | | 1,375 | | | | 1,282,187 | |
Dominican Republic International Bond (Dominican Republic), | | | | | | | | | | | | |
Sr. Unsec’d. Notes | | 5.500 | | 02/22/29 | | | 261 | | | | 237,380 | |
Sr. Unsec’d. Notes, 144A | | 5.500 | | 02/22/29 | | | 1,915 | | | | 1,741,692 | |
Sr. Unsec’d. Notes, 144A | | 5.950 | | 01/25/27 | | | 1,570 | | | | 1,508,629 | |
Hellenic Republic Government International Bond (Greece), | | | | | | | | | | | | |
Sr. Unsec’d. Notes | | 5.200 | | 07/17/34 | | EUR | 5,485 | | | | 5,933,702 | |
Sr. Unsec’d. Notes | | 6.140 | | 04/14/28 | | EUR | 2,000 | | | | 2,289,437 | |
Indonesia Government International Bond (Indonesia), | | | | | | | | | | | | |
Sr. Unsec’d. Notes | | 1.100 | | 03/12/33 | | EUR | 410 | | | | 310,551 | |
Sr. Unsec’d. Notes | | 1.450 | | 09/18/26 | | EUR | 805 | | | | 778,493 | |
Sr. Unsec’d. Notes | | 3.375 | | 07/30/25 | | EUR | 2,655 | | | | 2,754,503 | |
Ivory Coast Government International Bond (Ivory Coast), | | | | | | | | | | | | |
Sr. Unsec’d. Notes | | 5.125 | | 06/15/25 | | EUR | 500 | | | | 518,718 | |
Sr. Unsec’d. Notes, 144A | | 5.125 | | 06/15/25 | | EUR | 1,650 | | | | 1,711,768 | |
Pakistan Government International Bond (Pakistan), | | | | | | | | | | | | |
Sr. Unsec’d. Notes | | 8.250 | | 04/15/24 | | | 2,189 | | | | 1,953,858 | |
Romanian Government International Bond (Romania), | | | | | | | | | | | | |
Sr. Unsec’d. Notes, 144A, MTN | | 5.000 | | 09/27/26 | | EUR | 4,200 | | | | 4,460,685 | |
Serbia International Bond (Serbia), | | | | | | | | | | | | |
Sr. Unsec’d. Notes | | 1.500 | | 06/26/29 | | EUR | 366 | | | | 298,678 | |
Sr. Unsec’d. Notes | | 3.125 | | 05/15/27 | | EUR | 1,844 | | | | 1,764,510 | |
Sr. Unsec’d. Notes, 144A | | 1.500 | | 06/26/29 | | EUR | 1,660 | | | | 1,354,659 | |
Sr. Unsec’d. Notes, 144A | | 6.250 | | 05/26/28 | | | 520 | | | | 504,369 | |
Sr. Unsec’d. Notes, 144A | | 6.500 | | 09/26/33 | | | 915 | | | | 858,142 | |
Ukraine Government International Bond (Ukraine), | | | | | | | | | | | | |
Sr. Unsec’d. Notes | | 4.375 | | 01/27/32(d) | | EUR | 1,866 | | | | 439,924 | |
Sr. Unsec’d. Notes | | 8.994 | | 02/01/26(d) | | | 350 | | | | 106,203 | |
Sr. Unsec’d. Notes, 144A | | 4.375 | | 01/27/32(d) | | EUR | 1,265 | | | | 298,234 | |
Sr. Unsec’d. Notes, 144A | | 7.750 | | 09/01/24(d) | | | 1,560 | | | | 491,400 | |
See Notes to Financial Statements.
PGIM Absolute Return Bond Fund 43
Schedule of Investments (continued)
as of October 31, 2023
| | | | | | | | | | | | | | | | |
| | | | |
| Description | | Interest Rate | | | Maturity Date | | | Principal Amount (000)# | | | Value | |
| | | | |
SOVEREIGN BONDS (Continued) | | | | | | | | | | | | | | | | |
Ukraine Government International Bond (Ukraine), (cont’d.) | | | | | | | | | | | | | | | | |
Sr. Unsec’d. Notes, 144A | | | 8.994% | | | | 02/01/26(d) | | | | 800 | | | $ | 242,750 | |
| | | | | | | | | | | | | | | | |
| | | | |
TOTAL SOVEREIGN BONDS
(cost $39,226,385) | | | | | | | | | | | | | | | 33,977,773 | |
| | | | | | | | | | | | | | | | |
| | | |
U.S. GOVERNMENT AGENCY OBLIGATIONS 6.1% | | | | | | | | | | | | | |
Federal Home Loan Mortgage Corp. | | | 2.500 | | | | 09/01/46 | | | | 1,470 | | | | 1,144,098 | |
Federal Home Loan Mortgage Corp. | | | 2.500 | | | | 03/01/51 | | | | 2,943 | | | | 2,276,477 | |
Federal Home Loan Mortgage Corp. | | | 2.500 | | | | 07/01/51 | | | | 517 | | | | 398,470 | |
Federal Home Loan Mortgage Corp. | | | 2.500 | | | | 08/01/51 | | | | 1,910 | | | | 1,469,254 | |
Federal Home Loan Mortgage Corp. | | | 3.000 | | | | 02/01/52 | | | | 2,942 | | | | 2,358,190 | |
Federal Home Loan Mortgage Corp. | | | 4.000 | | | | 10/01/52 | | | | 2,933 | | | | 2,535,090 | |
Federal Home Loan Mortgage Corp. | | | 4.500 | | | | 07/01/52 | | | | 1,447 | | | | 1,293,534 | |
Federal Home Loan Mortgage Corp. | | | 4.500 | | | | 08/01/52 | | | | 1,038 | | | | 927,693 | |
Federal Home Loan Mortgage Corp. | | | 5.000 | | | | 07/01/52 | | | | 4,976 | | | | 4,592,598 | |
Federal Home Loan Mortgage Corp. | | | 5.000 | | | | 09/01/52 | | | | 11,143 | | | | 10,282,721 | |
Federal Home Loan Mortgage Corp. | | | 5.500 | | | | 02/01/53 | | | | 500 | | | | 474,276 | |
Federal National Mortgage Assoc. | | | 2.000 | | | | 11/01/50 | | | | 3,846 | | | | 2,852,314 | |
Federal National Mortgage Assoc. | | | 2.500 | | | | 02/01/51 | | | | 1,580 | | | | 1,222,097 | |
Federal National Mortgage Assoc. | | | 2.500 | | | | 03/01/51 | | | | 1,751 | | | | 1,353,223 | |
Federal National Mortgage Assoc. | | | 3.000 | | | | TBA | | | | 1,500 | | | | 1,201,480 | |
Federal National Mortgage Assoc. | | | 3.000 | | | | 04/01/48 | | | | 5,789 | | | | 4,855,704 | |
Federal National Mortgage Assoc. | | | 3.000 | | | | 07/01/51 | | | | 552 | | | | 442,755 | |
Federal National Mortgage Assoc. | | | 3.000 | | | | 02/01/52 | | | | 526 | | | | 421,746 | |
Federal National Mortgage Assoc. | | | 3.000 | | | | 04/01/52 | | | | 5,643 | | | | 4,522,134 | |
Federal National Mortgage Assoc. | | | 4.500 | | | | 06/01/52 | | | | 1,906 | | | | 1,703,818 | |
Federal National Mortgage Assoc. | | | 4.500 | | | | 07/01/52 | | | | 2,882 | | | | 2,576,438 | |
Federal National Mortgage Assoc. | | | 4.500 | | | | 08/01/52 | | | | 4,424 | | | | 3,954,145 | |
Federal National Mortgage Assoc. | | | 4.500 | | | | 10/01/52 | | | | 5,319 | | | | 4,754,297 | |
Federal National Mortgage Assoc. | | | 5.000 | | | | 07/01/52 | | | | 2,378 | | | | 2,194,302 | |
Federal National Mortgage Assoc. | | | 5.000 | | | | 09/01/52 | | | | 4,843 | | | | 4,469,079 | |
Federal National Mortgage Assoc. | | | 5.500 | | | | 10/01/52 | | | | 916 | | | | 869,264 | |
Federal National Mortgage Assoc.(k) | | | 5.500 | | | | 11/01/52 | | | | 11,766 | | | | 11,173,622 | |
Federal National Mortgage Assoc. | | | 5.500 | | | | 12/01/52 | | | | 1,508 | | | | 1,431,556 | |
Federal National Mortgage Assoc. | | | 6.000 | | | | 11/01/52 | | | | 1,077 | | | | 1,054,826 | |
Federal National Mortgage Assoc. | | | 6.000 | | | | 12/01/52 | | | | 1,428 | | | | 1,395,550 | |
| | | | | | | | | | | | | | | | |
| | | | |
TOTAL U.S. GOVERNMENT AGENCY OBLIGATIONS
(cost $85,739,011) | | | | | | | | | | | | | | | 80,200,751 | |
| | | | | | | | | | | | | | | | |
| | | | |
U.S. TREASURY OBLIGATIONS 17.4% | | | | | | | | | | | | | | | | |
U.S. Treasury Bonds(h)(k) | | | 2.250 | | | | 05/15/41 | | | | 26,700 | | | | 17,501,016 | |
U.S. Treasury Bonds(h) | | | 3.375 | | | | 11/15/48 | | | | 35,125 | | | | 25,981,523 | |
U.S. Treasury Bonds | | | 3.625 | | | | 02/15/53 | | | | 22,665 | | | | 17,660,993 | |
See Notes to Financial Statements.
44
| | | | | | | | | | | | |
| | | | |
| Description | | Interest Rate | | Maturity Date | | Principal Amount (000)# | | | Value | |
| | | | |
U.S. TREASURY OBLIGATIONS (Continued) | | | | | | | | | | | | |
U.S. Treasury Notes(h) | | 0.375% | | 04/30/25 | | | 52,500 | | | $ | 48,855,762 | |
U.S. Treasury Notes | | 2.625 | | 04/15/25 | | | 30,000 | | | | 28,903,125 | |
U.S. Treasury Notes | | 3.875 | | 09/30/29 | | | 4,110 | | | | 3,890,372 | |
U.S. Treasury Notes | | 3.875 | | 12/31/29 | | | 16,900 | | | | 15,961,258 | |
U.S. Treasury Notes | | 4.250 | | 05/31/25 | | | 60,500 | | | | 59,627,949 | |
U.S. Treasury Strips Coupon | | 2.415(s) | | 11/15/40 | | | 1,035 | | | | 409,189 | |
U.S. Treasury Strips Coupon | | 3.019(s) | | 11/15/35 | | | 870 | | | | 467,217 | |
U.S. Treasury Strips Coupon | | 3.507(s) | | 11/15/41 | | | 24,000 | | | | 8,991,563 | |
U.S. Treasury Strips Coupon | | 3.575(s) | | 08/15/41 | | | 165 | | | | 62,706 | |
| | | | | | | | | | | | |
| | | | |
TOTAL U.S. TREASURY OBLIGATIONS
(cost $240,981,963) | | | | | | | | | | | 228,312,673 | |
| | | | | | | | | | | | |
| | | | |
| | | | | | | Shares | | | | |
| | | | |
COMMON STOCKS 0.3% | | | | | | | | | | | | |
| | | | |
Chemicals 0.1% | | | | | | | | | | | | |
| | | | |
TPC Group, Inc. (original cost $609,113; purchased 12/15/22)*^(f) | | | | | | | 56,219 | | | | 1,236,818 | |
| | | | |
Gas Utilities 0.1% | | | | | | | | | | | | |
| | | | |
Ferrellgas Partners LP (Class B Stock) (original cost $1,794,337; purchased 10/25/19)(f) | | | | | | | 6,534 | | | | 1,116,821 | |
| | | | |
Oil, Gas & Consumable Fuels 0.1% | �� | | | | | | | | | | | |
| | | | |
Chesapeake Energy Corp.(a) | | | | | | | 12,570 | | | | 1,082,026 | |
| | | | |
Wireless Telecommunication Services 0.0% | | | | | | | | | | | | |
| | | | |
Intelsat Emergence SA (Luxembourg)* | | | | | | | 19,703 | | | | 484,694 | |
| | | | | | | | | | | | |
| | | | |
TOTAL COMMON STOCKS
(cost $2,309,071) | | | | | | | | | | | 3,920,359 | |
| | | | | | | | | | | | |
| | | | |
| | | | | | | Units | | | | |
| | | | |
RIGHTS* 0.0% | | | | | | | | | | | | |
| | | | |
Wireless Telecommunication Services | | | | | | | | | | | | |
| | | | |
Intelsat Jackson Holdings SA, Series A (Luxembourg), CVR, expiring 12/05/25^ | | | | | | | 2,061 | | | | 12,881 | |
See Notes to Financial Statements.
PGIM Absolute Return Bond Fund 45
Schedule of Investments (continued)
as of October 31, 2023
| | | | | | | | |
| | |
| Description | | Units | | | Value | |
| | |
RIGHTS* (Continued) | | | | | | | | |
| | |
Wireless Telecommunication Services (cont’d.) | | | | | | | | |
| | |
Intelsat Jackson Holdings SA, Series B (Luxembourg), CVR, expiring 12/05/25^ | | | 2,061 | | | $ | 8,244 | |
| | | | | | | | |
| | |
TOTAL RIGHTS
(cost $46) | | | | | | | 21,125 | |
| | | | | | | | |
| | |
TOTAL LONG-TERM INVESTMENTS
(cost $1,241,938,385) | | | | | | | 1,151,809,979 | |
| | | | | | | | |
| | |
| | | Shares | | | | |
| | |
SHORT-TERM INVESTMENTS 11.0% | | | | | | | | |
| | |
AFFILIATED MUTUAL FUNDS | | | | | | | | |
PGIM Core Government Money Market Fund(wb) | | | 14,738,696 | | | | 14,738,696 | |
PGIM Core Short-Term Bond Fund(wb) | | | 12,678,157 | | | | 115,751,574 | |
PGIM Institutional Money Market Fund | | | | | | | | |
(cost $13,217,577; includes $13,150,116 of cash collateral for securities on loan)(b)(wb) | | | 13,237,217 | | | | 13,230,599 | |
| | | | | | | | |
| | |
TOTAL SHORT-TERM INVESTMENTS
(cost $143,445,521) | | | | | | | 143,720,869 | |
| | | | | | | | |
| | |
TOTAL INVESTMENTS, BEFORE OPTION WRITTEN 98.8%
(cost $1,385,383,906) | | | | | | | 1,295,530,848 | |
| | | | | | | | |
| | |
OPTION WRITTEN*~ (0.0)%
(premiums received $0) | | | | | | | (60 | ) |
| | | | | | | | |
| | |
TOTAL INVESTMENTS, NET OF OPTION WRITTEN 98.8%
(cost $1,385,383,906) | | | | | | | 1,295,530,788 | |
Other assets in excess of liabilities(z) 1.2% | | | | | | | 16,040,693 | |
| | | | | | | | |
| | |
NET ASSETS 100.0% | | | | | | $ | 1,311,571,481 | |
| | | | | | | | |
Below is a list of the abbreviation(s) used in the annual report:
AUD—Australian Dollar
BRL—Brazilian Real
CAD—Canadian Dollar
CLP—Chilean Peso
CNH—Chinese Renminbi
COP—Colombian Peso
CZK—Czech Koruna
EUR—Euro
GBP—British Pound
HUF—Hungarian Forint
See Notes to Financial Statements.
46
IDR—Indonesian Rupiah
ILS—Israeli Shekel
INR—Indian Rupee
JPY—Japanese Yen
KRW—South Korean Won
MXN—Mexican Peso
NZD—New Zealand Dollar
PEN—Peruvian Nuevo Sol
PHP—Philippine Peso
PLN—Polish Zloty
SGD—Singapore Dollar
THB—Thai Baht
TWD—New Taiwanese Dollar
USD—US Dollar
ZAR—South African Rand
144A—Security was purchased pursuant to Rule 144A under the Securities Act of 1933 and, pursuant to the requirements of Rule 144A, may not be resold except to qualified institutional buyers.
A—Annual payment frequency for swaps
ABS—Asset-Backed Security
BABs—Build America Bonds
BARC—Barclays Bank PLC
BNP—BNP Paribas S.A.
BOA—Bank of America, N.A.
CDX—Credit Derivative Index
CGM—Citigroup Global Markets, Inc.
CITI—Citibank, N.A.
CLO—Collateralized Loan Obligation
CME—Chicago Mercantile Exchange
CVR—Contingent Value Rights
DAC—Designated Activity Company
DB—Deutsche Bank AG
EMTN—Euro Medium Term Note
EURIBOR—Euro Interbank Offered Rate
FHLMC—Federal Home Loan Mortgage Corporation
GMTN—Global Medium Term Note
GSI—Goldman Sachs International
HSBC—HSBC Bank PLC
IO—Interest Only (Principal amount represents notional)
JPM—JPMorgan Chase Bank N.A.
LIBOR—London Interbank Offered Rate
LP—Limited Partnership
M—Monthly payment frequency for swaps
MASTR—Morgan Stanley Structured Asset Security
MSI—Morgan Stanley & Co International PLC
MTN—Medium Term Note
OTC—Over-the-counter
PIK—Payment-in-Kind
Q—Quarterly payment frequency for swaps
REITs—Real Estate Investment Trust
REMIC—Real Estate Mortgage Investment Conduit
SCB—Standard Chartered Bank
SOFR—Secured Overnight Financing Rate
See Notes to Financial Statements.
PGIM Absolute Return Bond Fund 47
Schedule of Investments (continued)
as of October 31, 2023
SONIA—Sterling Overnight Index Average
SSB—State Street Bank & Trust Company
STRIPs—Separate Trading of Registered Interest and Principal of Securities
T—Swap payment upon termination
TBA—To Be Announced
TD—The Toronto-Dominion Bank
UAG—UBS AG
USOIS—United States Overnight Index Swap
| * | Non-income producing security. |
| # | Principal or notional amount is shown in U.S. dollars unless otherwise stated. |
| ~ | See tables subsequent to the Schedule of Investments for options detail. Options with maturity dates greater than one year from date of acquisition would be considered long-term investments. |
| ^ | Indicates a Level 3 instrument. The aggregate value of Level 3 instruments is $19,398,233 and 1.5% of net assets. |
| (a) | All or a portion of security is on loan. The aggregate market value of such securities, including those sold and pending settlement, is $12,590,393; cash collateral of $13,150,116 (included in liabilities) was received with which the Fund purchased highly liquid short-term investments. In the event of significant appreciation in value of securities on loan on the last business day of the reporting period, the Fund may reflect a collateral value that is less than the market value of the loaned securities and such shortfall is remedied the following business day. |
| (b) | Represents security, or portion thereof, purchased with cash collateral received for securities on loan and includes dividend reinvestment. |
| (c) | Variable rate instrument. The interest rate shown reflects the rate in effect at October 31, 2023. |
| (cc) | Variable rate instrument. The rate shown is based on the latest available information as of October 31, 2023. Certain variable rate securities are not based on a published reference rate and spread but are determined by the issuer or agent and are based on current market conditions. These securities do not indicate a reference rate and spread in their description. |
| (d) | Represents issuer in default on interest payments and/or principal repayment. Non-income producing security. Such securities may be post-maturity. |
| (f) | Indicates a restricted security that is acquired in unregistered, private sales from the issuing company or from an affiliate of the issuer and is considered restricted as to disposition under federal securities law; the aggregate original cost of such securities is $13,224,363. The aggregate value of $8,669,718 is 0.7% of net assets. |
| (ff) | Variable rate security. Security may be issued at a fixed coupon rate, which converts to a variable rate at a specified date. Rate shown is the rate in effect as of period end. |
| (h) | Represents security, or a portion thereof, segregated as collateral for OTC derivatives. |
| (k) | Represents security, or a portion thereof, segregated as collateral for centrally cleared/exchange-traded derivatives. |
| (oo) | Perpetual security. Maturity date represents next call date. |
| (p) | Represents a security with a delayed settlement and therefore the interest rate is not available until settlement which is after the period end. |
| (r) | Principal or notional amount is less than $500 par. |
| (s) | Represents zero coupon bond or principal only security. Rate represents yield to maturity at purchase date. |
| (tt) | All or partial principal amount represents “TBA” mortgage dollar rolls. The aggregate mortgage dollar roll principal amount of $(1,500,000) is (0.1)% of net assets. |
| (wb) | Represents an investment in a Fund affiliated with the Manager. |
| (z) | Includes net unrealized appreciation/(depreciation) and/or market value of the below holdings which are excluded from the Schedule of Investments: |
Unfunded loan commitment outstanding at October 31, 2023:
| | | | | | | | | | | | | | | | | | | | |
Borrower | | Principal
Amount
(000)# | | Current
Value | | Unrealized
Appreciation | | Unrealized
Depreciation |
| | | | |
Tank Holdings Corp. , Delayed Draw Term Commitment, —%(p), Maturity Date 03/31/28 (cost $43,173)^ | | | | 44 | | | | $ | 41,700 | | | | $ | — | | | | $ | (1,473 | ) |
| | | | | | | | | | | | | | | | | | | | |
See Notes to Financial Statements.
48
Forward Commitment Contracts:
| | | | | | | | | | | | | | | | | | | | |
U.S. Government Agency Obligations | | Interest
Rate | | | Maturity
Date | | | Settlement
Date | | | Principal
Amount
(000)# | | | Value | |
| | | | | |
Federal National Mortgage Assoc. | | | 3.000% | | | | TBA(tt) | | | | 11/13/23 | | | | $(1,500 | ) | | $ | (1,200,015 | ) |
Federal National Mortgage Assoc. | | | 5.500% | | | | TBA | | | | 12/13/23 | | | | (7,500 | ) | | | (7,112,109 | ) |
| | | | | | | | | | | | | | | | | | | | |
| | | | | |
TOTAL FORWARD COMMITMENT CONTRACTS
(proceeds receivable $8,287,852) | | | | | | | | | | | | | | | | | | $ | (8,312,124 | ) |
| | | | | | | | | | | | | | | | | | | | |
Option Written:
OTC Swaptions
| | | | | | | | | | | | | | | | | | | | | | | | | | | | | | | | |
Description | | Call/
Put | | | Counterparty | | | Expiration
Date | | | Strike | | | Receive | | | Pay | | | Notional
Amount
(000)# | | | Value | |
| | | | | | | | |
GS_21-PJA†† ^ | | | Put | | | | GSI | | | | 06/17/24 | | | | 0.25% | | | | 0.25%(M) | | | | GS_21-PJA(M) | | | | 16,440 | | | $ | (60 | ) |
| | | | | | | | | | | | | | | | | | | | | | | | | | | | | | | | |
| | | | | | | | |
(premiums received $0) | | | | | | | | | | | | | | | | | | | | | | | | | | | | | | | | |
| †† | The value of the contract, GS_21-PJA is derived from the aggregate credit performance of a pool of senior prime jumbo mortgages. The pool of prime jumbo mortgages is reset monthly. |
Futures contracts outstanding at October 31, 2023:
| | | | | | | | | | | | | | | | |
Number of Contracts | | Type | | Expiration Date | | Current
Notional
Amount | | | Value / Unrealized Appreciation (Depreciation) |
| | | | | |
Long Positions: | | | | | | | | | | | | | | |
417 | | 3 Month CME SOFR | | Dec. 2023 | | $ | 98,672,625 | | | | | $ | 32,181 | | | |
403 | | 3 Month CME SOFR | | Mar. 2024 | | | 95,269,200 | | | | | | (6,592 | ) | | |
267 | | 3 Month CME SOFR | | Jun. 2024 | | | 63,162,188 | | | | | | (20,547 | ) | | |
151 | | 3 Month CME SOFR | | Sep. 2024 | | | 35,796,438 | | | | | | 6,194 | | | |
15 | | 30 Year U.S. Ultra Treasury Bonds | | Dec. 2023 | | | 1,688,438 | | | | | | (960 | ) | | |
| | | | | | | | | | | | | | | | |
| | | | | | | | | | | | | 10,276 | | | |
| | | | | | | | | | | | | | | | |
| | | | | |
Short Positions: | | | | | | | | | | | | | | |
702 | | 2 Year U.S. Treasury Notes | | Dec. 2023 | | | 142,100,157 | | | | | | (27,848 | ) | | |
171 | | 5 Year Euro-Bobl | | Dec. 2023 | | | 21,040,943 | | | | | | 186,708 | | | |
2,952 | | 5 Year U.S. Treasury Notes | | Dec. 2023 | | | 308,414,805 | | | | | | 4,744,605 | | | |
120 | | 10 Year Euro-Bund | | Dec. 2023 | | | 16,378,118 | | | | | | 328,927 | | | |
722 | | 10 Year U.S. Treasury Notes | | Dec. 2023 | | | 76,656,097 | | | | | | 2,301,868 | | | |
265 | | 10 Year U.S. Ultra Treasury Notes | | Dec. 2023 | | | 28,839,454 | | | | | | 1,577,484 | | | |
629 | | 20 Year U.S. Treasury Bonds | | Dec. 2023 | | | 68,836,187 | | | | | | 6,111,858 | | | |
35 | | Euro Schatz Index | | Dec. 2023 | | | 3,894,998 | | | | | | 10,454 | | | |
| | | | | | | | | | | | | | | | |
| | | | | | | | | | | | | 15,234,056 | | | |
| | | | | | | | | | | | | | | | |
| | | | | | | | | | | | $ | 15,244,332 | | | |
| | | | | | | | | | | | | | | | |
See Notes to Financial Statements.
PGIM Absolute Return Bond Fund 49
Schedule of Investments (continued)
as of October 31, 2023
Forward foreign currency exchange contracts outstanding at October 31, 2023:
| | | | | | | | | | | | | | | | | | | | | | | | | | | | | | | | | | | | | | | | | | | | | | |
Purchase Contracts | | Counterparty | | | | | Notional
Amount
(000) | | | Value at
Settlement
Date | | | Current
Value | | | Unrealized
Appreciation | | | Unrealized
Depreciation | |
| | | | | | | |
OTC Forward Foreign Currency Exchange Contracts: | | | | | | | | | | | | | | | | | | | | | | | | | | | | | |
Australian Dollar, | | | | | | | | | | | | | | | | | | | | | | | | | | | | | | | | | | | | | | | | | | | | | | |
Expiring 01/19/24 | | | JPM | | | | | | AUD | | | | 1,182 | | | $ | 750,000 | | | $ | 751,890 | | | | | | | $ | 1,890 | | | | | | | | | | | $ | — | | | | | |
Brazilian Real, | | | | | | | | | | | | | | | | | | | | | | | | | | | | | | | | | | | | | | | | | | | | | | |
Expiring 11/03/23 | | | CITI | | | | | | BRL | | | | 5,374 | | | | 1,071,125 | | | | 1,065,351 | | | | | | | | — | | | | | | | | | | | | (5,774 | ) | | | | |
Expiring 11/03/23 | | | DB | | | | | | BRL | | | | 2,570 | | | | 520,180 | | | | 509,456 | | | | | | | | — | | | | | | | | | | | | (10,724 | ) | | | | |
Canadian Dollar, | | | | | | | | | | | | | | | | | | | | | | | | | | | | | | | | | | | | | | | | | | | | | | |
Expiring 01/19/24 | | | JPM | | �� | | | | CAD | | | | 3,357 | | | | 2,475,347 | | | | 2,424,241 | | | | | | | | — | | | | | | | | | | | | (51,106 | ) | | | | |
Chilean Peso, | | | | | | | | | | | | | | | | | | | | | | | | | | | | | | | | | | | | | | | | | | | | | | |
Expiring 12/20/23 | | | TD | | | | | | CLP | | | | 283,176 | | | | 304,000 | | | | 315,430 | | | | | | | | 11,430 | | | | | | | | | | | | — | | | | | |
Expiring 12/20/23 | | | UAG | | | | | | CLP | | | | 1,445,410 | | | | 1,579,079 | | | | 1,610,045 | | | | | | | | 30,966 | | | | | | | | | | | | — | | | | | |
Chinese Renminbi, | | | | | | | | | | | | | | | | | | | | | | | | | | | | | | | | | | | | | | | | | | | | | | |
Expiring 11/16/23 | | | BOA | | | | | | CNH | | | | 27,825 | | | | 3,826,000 | | | | 3,794,619 | | | | | | | | — | | | | | | | | | | | | (31,381 | ) | | | | |
Expiring 11/16/23 | | | GSI | | | | | | CNH | | | | 21,653 | | | | 2,963,000 | | | | 2,952,894 | | | | | | | | — | | | | | | | | | | | | (10,106 | ) | | | | |
Expiring 11/16/23 | | | GSI | | | | | | CNH | | | | 21,003 | | | | 2,888,000 | | | | 2,864,214 | | | | | | | | — | | | | | | | | | | | | (23,786 | ) | | | | |
Expiring 11/16/23 | | | HSBC | | | | | | CNH | | | | 34,267 | | | | 4,704,000 | | | | 4,673,180 | | | | | | | | — | | | | | | | | | | | | (30,820 | ) | | | | |
Expiring 11/16/23 | | | HSBC | | | | | | CNH | | | | 15,750 | | | | 2,173,000 | | | | 2,147,946 | | | | | | | | — | | | | | | | | | | | | (25,054 | ) | | | | |
Expiring 11/16/23 | | | HSBC | | | | | | CNH | | | | 9,200 | | | | 1,267,000 | | | | 1,254,673 | | | | | | | | — | | | | | | | | | | | | (12,327 | ) | | | | |
Colombian Peso, | | | | | | | | | | | | | | | | | | | | | | | | | | | | | | | | | | | | | | | | | | | | | | |
Expiring 12/20/23 | | | BARC | | | | | | COP | | | | 15,212,013 | | | | 3,570,518 | | | | 3,654,371 | | | | | | | | 83,853 | | | | | | | | | | | | — | | | | | |
Expiring 12/20/23 | | | CITI | | | | | | COP | | | | 7,503,414 | | | | 1,696,194 | | | | 1,802,540 | | | | | | | | 106,346 | | | | | | | | | | | | — | | | | | |
Expiring 12/20/23 | | | HSBC | | | | | | COP | | | | 5,678,783 | | | | 1,409,390 | | | | 1,364,210 | | | | | | | | — | | | | | | | | | | | | (45,180 | ) | | | | |
Expiring 12/20/23 | | | TD | | | | | | COP | | | | 6,083,403 | | | | 1,491,396 | | | | 1,461,412 | | | | | | | | — | | | | | | | | | | | | (29,984 | ) | | | | |
Czech Koruna, | | | | | | | | | | | | | | | | | | | | | | | | | | | | | | | | | | | | | | | | | | | | | | |
Expiring 01/19/24 | | | DB | | | | | | CZK | | | | 47,223 | | | | 2,016,000 | | | | 2,030,797 | | | | | | | | 14,797 | | | | | | | | | | | | — | | | | | |
Hungarian Forint, | | | | | | | | | | | | | | | | | | | | | | | | | | | | | | | | | | | | | | | | | | | | | | |
Expiring 01/19/24 | | | DB | | | | | | HUF | | | | 595,939 | | | | 1,636,000 | | | | 1,630,067 | | | | | | | | — | | | | | | | | | | | | (5,933 | ) | | | | |
Expiring 01/19/24 | | | SSB | | | | | | HUF | | | | 607,050 | | | | 1,678,000 | | | | 1,660,459 | | | | | | | | — | | | | | | | | | | | | (17,541 | ) | | | | |
Indian Rupee, | | | | | | | | | | | | | | | | | | | | | | | | | | | | | | | | | | | | | | | | | | | | | | |
Expiring 12/20/23 | | | BOA | | | | | | INR | | | | 393,402 | | | | 4,714,000 | | | | 4,716,879 | | | | | | | | 2,879 | | | | | | | | | | | | — | | | | | |
Expiring 12/20/23 | | | BOA | | | | | | INR | | | | 197,721 | | | | 2,366,000 | | | | 2,370,665 | | | | | | | | 4,665 | | | | | | | | | | | | — | | | | | |
Expiring 12/20/23 | | | JPM | | | | | | INR | | | | 333,755 | | | | 4,008,000 | | | | 4,001,706 | | | | | | | | — | | | | | | | | | | | | (6,294 | ) | | | | |
Expiring 12/20/23 | | | JPM | | | | | | INR | | | | 324,594 | | | | 3,895,565 | | | | 3,891,872 | | | | | | | | — | | | | | | | | | | | | (3,693 | ) | | | | |
Expiring 12/20/23 | | | JPM | | | | | | INR | | | | 202,556 | | | | 2,427,000 | | | | 2,428,642 | | | | | | | | 1,642 | | | | | | | | | | | | — | | | | | |
Expiring 12/20/23 | | | MSI | | | | | | INR | | | | 364,170 | | | | 4,362,000 | | | | 4,366,390 | | | | | | | | 4,390 | | | | | | | | | | | | — | | | | | |
Indonesian Rupiah, | | | | | | | | | | | | | | | | | | | | | | | | | | | | | | | | | | | | | | | | | | | | | | |
Expiring 12/20/23 | | | MSI | | | | | | IDR | | | | 110,295,000 | | | | 7,169,695 | | | | 6,918,358 | | | | | | | | — | | | | | | | | | | | | (251,337 | ) | | | | |
Japanese Yen, | | | | | | | | | | | | | | | | | | | | | | | | | | | | | | | | | | | | | | | | | | | | | | |
Expiring 01/19/24 | | | HSBC | | | | | | JPY | | | | 292,453 | | | | 1,995,693 | | | | 1,955,605 | | | | | | | | — | | | | | | | | | | | | (40,088 | ) | | | | |
Mexican Peso, | | | | | | | | | | | | | | | | | | | | | | | | | | | | | | | | | | | | | | | | | | | | | | |
Expiring 12/20/23 | | | CITI | | | | | | MXN | | | | 11,580 | | | | 625,416 | | | | 636,987 | | | | | | | | 11,571 | | | | | | | | | | | | — | | | | | |
Expiring 12/20/23 | | | HSBC | | | | | | MXN | | | | 13,646 | | | | 734,000 | | | | 750,604 | | | | | | | | 16,604 | | | | | | | | | | | | — | | | | | |
Expiring 12/20/23 | | | SSB | | | | | | MXN | | | | 13,596 | | | | 734,000 | | | | 747,878 | | | | | | | | 13,878 | | | | | | | | | | | | — | | | | | |
Expiring 12/20/23 | | | TD | | | | | | MXN | | | | 26,834 | | | | 1,463,000 | | | | 1,476,047 | | | | | | | | 13,047 | | | | | | | | | | | | — | | | | | |
See Notes to Financial Statements.
50
Forward foreign currency exchange contracts outstanding at October 31, 2023 (continued):
| | | | | | | | | | | | | | | | | | | | | | | | | | | | | | | | | | | | | | | | | | | | | | | | |
Purchase Contracts | | Counterparty | | | | | | Notional
Amount
(000) | | | Value at
Settlement
Date | | | Current
Value | | | Unrealized
Appreciation | | | Unrealized
Depreciation | |
| | | | | | | |
OTC Forward Foreign Currency Exchange Contracts (cont’d.): | | | | | | | | | | | | | | | | | | | | | | | | | | | | | |
Mexican Peso (cont’d.), | | | | | | | | | | | | | | | | | | | | | | | | | | | | | | | | | | | | | | | | | | | | | | | | |
Expiring 12/20/23 | | | TD | | | | | | | | MXN | | | | 25,526 | | | $ | 1,399,000 | | | $ | 1,404,117 | | | | | | | $ | 5,117 | | | | | | | | | | | $ | — | | | | | |
New Zealand Dollar, | | | | | | | | | | | | | | | | | | | | | | | | | | | | | | | | | | | | | | | | | | | | | | | | |
Expiring 01/19/24 | | | CITI | | | | | | | | NZD | | | | 1,886 | | | | 1,135,606 | | | | 1,099,295 | | | | | | | | — | | | | | | | | | | | | (36,311 | ) | | | | |
Peruvian Nuevo Sol, | | | | | | | | | | | | | | | | | | | | | | | | | | | | | | | | | | | | | | | | | | | | | | | | |
Expiring 12/20/23 | | | CITI | | | | | | | | PEN | | | | 16,591 | | | | 4,449,870 | | | | 4,310,140 | | | | | | | | — | | | | | | | | | | | | (139,730 | ) | | | | |
Philippine Peso, | | | | | | | | | | | | | | | | | | | | | | | | | | | | | | | | | | | | | | | | | | | | | | | | |
Expiring 12/20/23 | | | MSI | | | | | | | | PHP | | | | 42,602 | | | | 752,000 | | | | 750,221 | | | | | | | | — | | | | | | | | | | | | (1,779 | ) | | | | |
Singapore Dollar, | | | | | | | | | | | | | | | | | | | | | | | | | | | | | | | | | | | | | | | | | | | | | | | | |
Expiring 12/20/23 | | | BOA | | | | | | | | SGD | | | | 3,372 | | | | 2,476,000 | | | | 2,468,584 | | | | | | | | — | | | | | | | | | | | | (7,416 | ) | | | | |
Expiring 12/20/23 | | | CITI | | | | | | | | SGD | | | | 410 | | | | 300,000 | | | | 300,051 | | | | | | | | 51 | | | | | | | | | | | | — | | | | | |
Expiring 12/20/23 | | | HSBC | | | | | | | | SGD | | | | 629 | | | | 460,000 | | | | 460,583 | | | | | | | | 583 | | | | | | | | | | | | — | | | | | |
Expiring 12/20/23 | | | SCB | | | | | | | | SGD | | | | 3,885 | | | | 2,863,000 | | | | 2,844,212 | | | | | | | | — | | | | | | | | | | | | (18,788 | ) | | | | |
South African Rand, | | | | | | | | | | | | | | | | | | | | | | | | | | | | | | | | | | | | | | | | | | | | | | | | |
Expiring 12/20/23 | | | DB | | | | | | | | ZAR | | | | 56,941 | | | | 2,972,230 | | | | 3,041,748 | | | | | | | | 69,518 | | | | | | | | | | | | — | | | | | |
Expiring 12/20/23 | | | MSI | | | | | | | | ZAR | | | | 32,068 | | | | 1,705,999 | | | | 1,713,055 | | | | | | | | 7,056 | | | | | | | | | | | | — | | | | | |
South Korean Won, | | | | | | | | | | | | | | | | | | | | | | | | | | | | | | | | | | | | | | | | | | | | | | | | |
Expiring 12/20/23 | | | CITI | | | | | | | | KRW | | | | 1,025,609 | | | | 764,000 | | | | 760,201 | | | | | | | | — | | | | | | | | | | | | (3,799 | ) | | | | |
Expiring 12/20/23 | | | JPM | | | | | | | | KRW | | | | 4,341,161 | | | | 3,254,000 | | | | 3,217,753 | | | | | | | | — | | | | | | | | | | | | (36,247 | ) | | | | |
Expiring 12/20/23 | | | SCB | | | | | | | | KRW | | | | 2,076,739 | | | | 1,543,000 | | | | 1,539,318 | | | | | | | | — | | | | | | | | | | | | (3,682 | ) | | | | |
Thai Baht, | | | | | | | | | | | | | | | | | | | | | | | | | | | | | | | | | | | | | | | | | | | | | | | | |
Expiring 12/20/23 | | | BOA | | | | | | | | THB | | | | 86,214 | | | | 2,407,000 | | | | 2,409,629 | | | | | | | | 2,629 | | | | | | | | | | | | — | | | | | |
Expiring 12/20/23 | | | CITI | | | | | | | | THB | | | | 25,795 | | | | 700,000 | | | | 720,955 | | | | | | | | 20,955 | | | | | | | | | | | | — | | | | | |
| | | | | | | | | | | | | | | | | | | | | | | | | | | | | | | | | | | | | | | | | | | | | | | | |
| | | | | | | | | | | | | | | | | | $ | 99,694,303 | | | $ | 99,269,290 | | | | | | | | 423,867 | | | | | | | | | | | | (848,880 | ) | | | | |
| | | | | | | | | | | | | | | | | | | | | | | | | | | | | | | | | | | | | | | | | | | | | | | | |
| | | | | | | | | | | | | | | | | | | | | | | | | | | | | | | | | | | | | | | | | | | | | | |
Sale Contracts | | Counterparty | | | | | | Notional
Amount
(000) | | | Value at
Settlement
Date | | | Current
Value | | | Unrealized
Appreciation | | | Unrealized
Depreciation | |
| | | | | | | |
OTC Forward Foreign Currency Exchange Contracts: | | | | | | | | | | | | | | | | | | | | | | | | | | | |
Australian Dollar, | | | | | | | | | | | | | | | | | | | | | | | | | | | | | | | | | | | | | | | | | | | | | | |
Expiring 01/19/24 | | | JPM | | | | | | | | AUD | | | | 2,892 | | | $ | 1,862,222 | | | $ | 1,839,489 | | | | | $ | 22,733 | | | | | | | | | | | $ | — | | | | | |
Brazilian Real, | | | | | | | | | | | | | | | | | | | | | | | | | | | | | | | | | | | | | | | | | | | | | | |
Expiring 11/03/23 | | | CITI | | | | | | | | BRL | | | | 7,944 | | | | 1,531,000 | | | | 1,574,806 | | | | | | — | | | | | | | | | | | | (43,806 | ) | | | | |
Expiring 12/04/23 | | | CITI | | | | | | | | BRL | | | | 5,374 | | | | 1,067,158 | | | | 1,061,413 | | | | | | 5,745 | | | | | | | | | | | | — | | | | | |
British Pound, | | | | | | | | | | | | | | | | | | | | | | | | | | | | | | | | | | | | | | | | | | | | | | |
Expiring 01/19/24 | | | HSBC | | | | | | | | GBP | | | | 15,884 | | | | 19,547,924 | | | | 19,319,403 | | | | | | 228,521 | | | | | | | | | | | | — | | | | | |
Expiring 01/19/24 | | | SCB | | | | | | | | GBP | | | | 294 | | | | 357,214 | | | | 357,681 | | | | | | — | | | | | | | | | | | | (467 | ) | | | | |
Chilean Peso, | | | | | | | | | | | | | | | | | | | | | | | | | | | | | | | | | | | | | | | | | | | | | | |
Expiring 12/20/23 | | | GSI | | | | | | | | CLP | | | | 1,497,800 | | | | 1,639,000 | | | | 1,668,402 | | | | | | — | | | | | | | | | | | | (29,402 | ) | | | | |
Expiring 12/20/23 | | | TD | | | | | | | | CLP | | | | 3,647,293 | | | | 4,053,719 | | | | 4,062,727 | | | | | | — | | | | | | | | | | | | (9,008 | ) | | | | |
Expiring 12/20/23 | | | UAG | | | | | | | | CLP | | | | 1,546,981 | | | | 1,713,001 | | | | 1,723,185 | | | | | | — | | | | | | | | | | | | (10,184 | ) | | | | |
See Notes to Financial Statements.
PGIM Absolute Return Bond Fund 51
Schedule of Investments (continued)
as of October 31, 2023
Forward foreign currency exchange contracts outstanding at October 31, 2023 (continued):
| | | | | | | | | | | | | | | | | | | | | | | | | | | | | | | | | | | | | | | | | | | | | | |
Sale Contracts | | Counterparty | | | | | | Notional
Amount
(000) | | | Value at
Settlement
Date | | | Current
Value | | | Unrealized
Appreciation | | | Unrealized
Depreciation | |
| | | | | | | |
OTC Forward Foreign Currency Exchange Contracts (cont’d.): | | | | | | | | | | | | | | | | | | | | | | | | | | | |
Chilean Peso (cont’d.), | | | | | | | | | | | | | | | | | | | | | | | | | | | | | | | | | | | | | | | | | | | | | | |
Expiring 12/20/23 | | | UAG | | | | | | | | CLP | | | | 1,298,880 | | | $ | 1,434,000 | | | $ | 1,446,825 | | | | | $ | — | | | | | | | | | | | $ | (12,825 | ) | | | | |
Chinese Renminbi, | | | | | | | | | | | | | | | | | | | | | | | | | | | | | | | | | | | | | | | | | | | | | | |
Expiring 11/16/23 | | | MSI | | | | | | | | CNH | | | | 98,186 | | | | 13,468,191 | | | | 13,390,051 | | | | | | 78,140 | | | | | | | | | | | | — | | | | | |
Colombian Peso, | | | | | | | | | | | | | | | | | | | | | | | | | | | | | | | | | | | | | | | | | | | | | | |
Expiring 12/20/23 | | | BNP | | | | | | | | COP | | | | 4,803,007 | | | | 1,113,476 | | | | 1,153,823 | | | | | | — | | | | | | | | | | | | (40,347 | ) | | | | |
Expiring 12/20/23 | | | BOA | | | | | | | | COP | | | | 2,996,203 | | | | 700,000 | | | | 719,776 | | | | | | — | | | | | | | | | | | | (19,776 | ) | | | | |
Expiring 12/20/23 | | | BOA | | | | | | | | COP | | | | 1,495,931 | | | | 345,800 | | | | 359,366 | | | | | | — | | | | | | | | | | | | (13,566 | ) | | | | |
Expiring 12/20/23 | | | MSI | | | | | | | | COP | | | | 6,634,399 | | | | 1,641,000 | | | | 1,593,777 | | | | | | 47,223 | | | | | | | | | | | | — | | | | | |
Czech Koruna, | | | | | | | | | | | | | | | | | | | | | | | | | | | | | | | | | | | | | | | | | | | | | | |
Expiring 01/19/24 | | | BARC | | | | | | | | CZK | | | | 99,764 | | | | 4,306,781 | | | | 4,290,275 | | | | | | 16,506 | | | | | | | | | | | | — | | | | | |
Expiring 01/19/24 | | | GSI | | | | | | | | CZK | | | | 35,767 | | | | 1,522,991 | | | | 1,538,112 | | | | | | — | | | | | | | | | | | | (15,121 | ) | | | | |
Expiring 01/19/24 | | | MSI | | | | | | | | CZK | | | | 39,646 | | | | 1,686,009 | | | | 1,704,946 | | | | | | — | | | | | | | | | | | | (18,937 | ) | | | | |
Euro, | | | | | | | | | | | | | | | | | | | | | | | | | | | | | | | | | | | | | | | | | | | | | | |
Expiring 01/19/24 | | | BNP | | | | | | | | EUR | | | | 30,810 | | | | 32,833,681 | | | | 32,724,774 | | | | | | 108,907 | | | | | | | | | | | | — | | | | | |
Expiring 01/19/24 | | | DB | | | | | | | | EUR | | | | 3,646 | | | | 3,874,112 | | | | 3,872,636 | | | | | | 1,476 | | | | | | | | | | | | — | | | | | |
Expiring 01/19/24 | | | MSI | | | | | | | | EUR | | | | 19,636 | | | | 20,945,036 | | | | 20,856,188 | | | | | | 88,848 | | | | | | | | | | | | — | | | | | |
Expiring 01/19/24 | | | SCB | | | | | | | | EUR | | | | 1,339 | | | | 1,420,492 | | | | 1,421,711 | | | | | | — | | | | | | | | | | | | (1,219 | ) | | | | |
Expiring 01/19/24 | | | SSB | | | | | | | | EUR | | | | 34,313 | | | | 36,275,490 | | | | 36,445,929 | | | | | | — | | | | | | | | | | | | (170,439 | ) | | | | |
Hungarian Forint, | | | | | | | | | | | | | | | | | | | | | | | | | | | | | | | | | | | | | | | | | | | | | | |
Expiring 01/19/24 | | | GSI | | | | | | | | HUF | | | | 3,234,737 | | | | 8,744,424 | | | | 8,847,950 | | | | | | — | | | | | | | | | | | | (103,526 | ) | | | | |
Expiring 01/19/24 | | | GSI | | | | | | | | HUF | | | | 621,447 | | | | 1,661,000 | | | | 1,699,838 | | | | | | — | | | | | | | | | | | | (38,838 | ) | | | | |
Indian Rupee, | | | | | | | | | | | | | | | | | | | | | | | | | | | | | | | | | | | | | | | | | | | | | | |
Expiring 12/20/23 | | | JPM | | | | | | | | INR | | | | 410,595 | | | | 4,929,000 | | | | 4,923,021 | | | | | | 5,979 | | | | | | | | | | | | — | | | | | |
Indonesian Rupiah, | | | | | | | | | | | | | | | | | | | | | | | | | | | | | | | | | | | | | | | | | | | | | | |
Expiring 12/20/23 | | | HSBC | | | | | | | | IDR | | | | 36,931,361 | | | | 2,344,000 | | | | 2,316,555 | | | | | | 27,445 | | | | | | | | | | | | — | | | | | |
Israeli Shekel, | | | | | | | | | | | | | | | | | | | | | | | | | | | | | | | | | | | | | | | | | | | | | | |
Expiring 12/20/23 | | | BARC | | | | | | | | ILS | | | | 6,552 | | | | 1,719,000 | | | | 1,625,830 | | | | | | 93,170 | | | | | | | | | | | | — | | | | | |
Expiring 12/20/23 | | | BARC | | | | | | | | ILS | | | | 3,165 | | | | 832,730 | | | | 785,193 | | | | | | 47,537 | | | | | | | | | | | | — | | | | | |
Expiring 12/20/23 | | | CITI | | | | | | | | ILS | | | | 6,457 | | | | 1,685,000 | | | | 1,602,252 | | | | | | 82,748 | | | | | | | | | | | | — | | | | | |
Mexican Peso, | | | | | | | | | | | | | | | | | | | | | | | | | | | | | | | | | | | | | | | | | | | | | | |
Expiring 12/20/23 | | | BARC | | | | | | | | MXN | | | | 55,158 | | | | 3,091,962 | | | | 3,034,125 | | | | | | 57,837 | | | | | | | | | | | | — | | | | | |
Expiring 12/20/23 | | | BOA | | | | | | | | MXN | | | | 25,777 | | | | 1,446,000 | | | | 1,417,931 | | | | | | 28,069 | | | | | | | | | | | | — | | | | | |
Expiring 12/20/23 | | | SSB | | | | | | | | MXN | | | | 26,009 | | | | 1,493,000 | | | | 1,430,707 | | | | | | 62,293 | | | | | | | | | | | | — | | | | | |
New Taiwanese Dollar, | | | | | | | | | | | | | | | | | | | | | | | | | | | | | | | | | | | | | | | | | | | | | | |
Expiring 12/20/23 | | | CITI | | | | | | | | TWD | | | | 143,150 | | | | 4,433,000 | | | | 4,423,032 | | | | | | 9,968 | | | | | | | | | | | | — | | | | | |
Expiring 12/20/23 | | | GSI | | | | | | | | TWD | | | | 86,934 | | | | 2,686,000 | | | | 2,686,060 | | | | | | — | | | | | | | | | | | | (60 | ) | | | | |
Expiring 12/20/23 | | | MSI | | | | | | | | TWD | | | | 143,664 | | | | 4,493,000 | | | | 4,438,890 | | | | | | 54,110 | | | | | | | | | | | | — | | | | | |
Peruvian Nuevo Sol, | | | | | | | | | | | | | | | | | | | | | | | | | | | | | | | | | | | | | | | | | | | | | | |
Expiring 12/20/23 | | | BARC | | | | | | | | PEN | | | | 8,234 | | | | 2,183,530 | | | | 2,138,920 | | | | | | 44,610 | | | | | | | | | | | | — | | | | | |
Expiring 12/20/23 | | | BOA | | | | | | | | PEN | | | | 8,270 | | | | 2,155,468 | | | | 2,148,409 | | | | | | 7,059 | | | | | | | | | | | | — | | | | | |
Expiring 12/20/23 | | | BOA | | | | | | | | PEN | | | | 6,363 | | | | 1,668,100 | | | | 1,653,053 | | | | | | 15,047 | | | | | | | | | | | | — | | | | | |
Expiring 12/20/23 | | | BOA | | | | | | | | PEN | | | | 4,593 | | | | 1,191,532 | | | | 1,193,081 | | | | | | — | | | | | | | | | | | | (1,549 | ) | | | | |
See Notes to Financial Statements.
52
Forward foreign currency exchange contracts outstanding at October 31, 2023 (continued):
| | | | | | | | | | | | | | | | | | | | | | | | | | | | | | | | | | | | | | | | | | | | | | | | |
Sale Contracts | | Counterparty | | | | | | Notional
Amount
(000) | | | Value at
Settlement
Date | | | Current
Value | | | Unrealized
Appreciation | | | Unrealized
Depreciation | |
| | | | | | | |
OTC Forward Foreign Currency Exchange Contracts (cont’d.): | | | | | | | | | | | | | | | | | | | | | | | | | | | | | |
Peruvian Nuevo Sol (cont’d.), | | | | | | | | | | | | | | | | | | | | | | | | | | | | | | | | | | | | | | | | | | | | | | | | |
Expiring 12/20/23 | | | CITI | | | | | | | | PEN | | | | 9,316 | | | $ | 2,405,696 | | | $ | 2,420,086 | | | | | | | $ | — | | | | | | | | | | | $ | (14,390 | ) | | | | |
Expiring 12/20/23 | | | SCB | | | | | | | | PEN | | | | 4,183 | | | | 1,079,304 | | | | 1,086,741 | | | | | | | | — | | | | | | | | | | | | (7,437 | ) | | | | |
Philippine Peso, | | | | | | | | | | | | | | | | | | | | | | | | | | | | | | | | | | | | | | | | | | | | | | | | |
Expiring 12/20/23 | | | CITI | | | | | | | | PHP | | | | 148,602 | | | | 2,617,146 | | | | 2,616,871 | | | | | | | | 275 | | | | | | | | | | | | — | | | | | |
Expiring 12/20/23 | | | JPM | | | | | | | | PHP | | | | 39,830 | | | | 700,000 | | | | 701,406 | | | | | | | | — | | | | | | | | | | | | (1,406 | ) | | | | |
Expiring 12/20/23 | | | SCB | | | | | | | | PHP | | | | 261,706 | | | | 4,590,000 | | | | 4,608,634 | | | | | | | | — | | | | | | | | | | | | (18,634 | ) | | | | |
Polish Zloty, | | | | | | | | | | | | | | | | | | | | | | | | | | | | | | | | | | | | | | | | | | | | | | | | |
Expiring 01/19/24 | | | BARC | | | | | | | | PLN | | | | 6,726 | | | | 1,537,000 | | | | 1,592,559 | | | | | | | | — | | | | | | | | | | | | (55,559 | ) | | | | |
Expiring 01/19/24 | | | UAG | | | | | | | | PLN | | | | 15,994 | | | | 3,743,522 | | | | 3,787,220 | | | | | | | | — | | | | | | | | | | | | (43,698 | ) | | | | |
Singapore Dollar, | | | | | | | | | | | | | | | | | | | | | | | | | | | | | | | | | | | | | | | | | | | | | | | | |
Expiring 12/20/23 | | | JPM | | | | | | | | SGD | | | | 23,881 | | | | 17,621,580 | | | | 17,481,500 | | | | | | | | 140,080 | | | | | | | | | | | | — | | | | | |
Expiring 12/20/23 | | | SCB | | | | | | | | SGD | | | | 2,105 | | | | 1,543,000 | | | | 1,541,092 | | | | | | | | 1,908 | | | | | | | | | | | | — | | | | | |
South Korean Won, | | | | | | | | | | | | | | | | | | | | | | | | | | | | | | | | | | | | | | | | | | | | | | | | |
Expiring 12/20/23 | | | CITI | | | | | | | | KRW | | | | 1,775,674 | | | | 1,343,000 | | | | 1,316,164 | | | | | | | | 26,836 | | | | | | | | | | | | — | | | | | |
Expiring 12/20/23 | | | DB | | | | | | | | KRW | | | | 943,128 | | | | 697,000 | | | | 699,065 | | | | | | | | — | | | | | | | | | | | | (2,065 | ) | | | | |
Expiring 12/20/23 | | | SCB | | | | | | | | KRW | | | | 15,477,564 | | | | 11,732,093 | | | | 11,472,269 | | | | | | | | 259,824 | | | | | | | | | | | | — | | | | | |
Thai Baht, | | | | | | | | | | | | | | | | | | | | | | | | | | | | | | | | | | | | | | | | | | | | | | | | |
Expiring 12/20/23 | | | GSI | | | | | | | | THB | | | | 35,718 | | | | 1,006,947 | | | | 998,309 | | | | | | | | 8,638 | | | | | | | | | | | | — | | | | | |
Expiring 12/20/23 | | | JPM | | | | | | | | THB | | | | 81,744 | | | | 2,265,000 | | | | 2,284,706 | | | | | | | | — | | | | | | | | | | | | (19,706 | ) | | | | |
Expiring 12/20/23 | | | MSI | | | | | | | | THB | | | | 40,757 | | | | 1,122,000 | | | | 1,139,125 | | | | | | | | — | | | | | | | | | | | | (17,125 | ) | | | | |
Expiring 12/20/23 | | | MSI | | | | | | | | THB | | | | 31,351 | | | | 863,000 | | | | 876,232 | | | | | | | | — | | | | | | | | | | | | (13,232 | ) | | | | |
| | | | | | | | | | | | | | | | | | | | | | | | | | | | | | | | | | | | | | | | | | | | | | | | |
| | | | | | | | | | | | |
| | | | | | | | | | | | | | | | | | $ | 254,961,331 | | | $ | 254,112,121 | | | | | | | | 1,571,532 | | | | | | | | | | | | (722,322 | ) | | | | |
| | | | | | | | | | | | | | | | | | | | | | | | | | | | | | | | | | | | | | | | | | | | | | | | |
| | | | | | | | | | | | |
| | | | | | | | | | | | | | | | | | | | | | | | | | | | | | $ | 1,995,399 | | | | | | | | | | | $ | (1,571,202 | ) | | | | |
| | | | | | | | | | | | | | | | | | | | | | | | | | | | | | | | | | | | | | | | | | | | | | | | |
Cross currency exchange contracts outstanding at October 31, 2023:
| | | | | | | | | | | | | | | | | | | | | | | | | | | | | | |
Settlement | | Type | | Notional
Amount
(000) | | | In Exchange
For (000) | | | Unrealized Appreciation | | Unrealized Depreciation | | Counterparty | |
| | | | | | | | | | | | | | | | | | | | | | | | | | |
OTC Cross Currency Exchange Contracts: | | | | | | | | | | | | | | | | | | | | | | | | | |
01/19/24 | | Buy | | EUR | 1,496 | | | | PLN 6,818 | | | | | | $— | | | | | | | | $(25,784 | ) | | | | | BOA | |
| | | | | | | | | | | | | | | | | | | | | | | | | | | | | | |
See Notes to Financial Statements.
PGIM Absolute Return Bond Fund 53
Schedule of Investments (continued)
as of October 31, 2023
Credit default swap agreements outstanding at October 31, 2023:
| | | | | | | | | | | | | | | | | | | | | | | | | | | | | | | | | | | | | | | | | | | | |
Reference Entity/ Obligation | | Termination
Date | | | Fixed
Rate | | | Notional
Amount
(000)#(3) | | | Fair
Value | | | Upfront
Premiums
Paid
(Received) | | | Unrealized
Appreciation
(Depreciation) | | | Counterparty | |
| | | | | | | | | | | | | | | | | | | | | | | | | | | | | | | | | | |
OTC Packaged Credit Default Swap Agreements on corporate and/or sovereign issues - Buy Protection(1)**: | |
Arab Republic of Egypt | | | 12/20/28 | | | | 1.000%(Q) | | | | 2,000 | | | $ | 880,466 | | | | | | | $ | 1,712 | | | | | | | | | | | $ | 878,754 | | | | | | | | CITI | |
Dominican Republic | | | 12/20/28 | | | | 1.000%(Q) | | | | 2,000 | | | | 144,260 | | | | | | | | 1,712 | | | | | | | | | | | | 142,548 | | | | | | | | CITI | |
Emirate of Abu Dhabi | | | 12/20/28 | | | | 1.000%(Q) | | | | 2,000 | | | | (47,454 | ) | | | | | | | 1,712 | | | | | | | | | | | | (49,166 | ) | | | | | | | CITI | |
Federal Republic of Nigeria | | | 12/20/28 | | | | 1.000%(Q) | | | | 2,000 | | | | 462,282 | | | | | | | | 1,712 | | | | | | | | | | | | 460,570 | | | | | | | | CITI | |
Federation of Malaysia | | | 12/20/28 | | | | 1.000%(Q) | | | | 3,000 | | | | (51,493 | ) | | | | | | | 2,568 | | | | | | | | | | | | (54,061 | ) | | | | | | | CITI | |
Federative Republic of Brazil | | | 12/20/28 | | | | 1.000%(Q) | | | | 9,000 | | | | 313,954 | | | | | | | | 7,705 | | | | | | | | | | | | 306,249 | | | | | | | | CITI | |
Kingdom of Bahrain | | | 12/20/28 | | | | 1.000%(Q) | | | | 2,000 | | | | 128,959 | | | | | | | | 1,712 | | | | | | | | | | | | 127,247 | | | | | | | | CITI | |
Kingdom of Morocco | | | 12/20/28 | | | | 1.000%(Q) | | | | 2,000 | | | | 41,250 | | | | | | | | 1,712 | | | | | | | | | | | | 39,538 | | | | | | | | CITI | |
Kingdom of Saudi Arabia | | | 12/20/28 | | | | 1.000%(Q) | | | | 4,000 | | | | (63,035 | ) | | | | | | | 3,424 | | | | | | | | | | | | (66,459 | ) | | | | | | | CITI | |
People’s Republic of China | | | 12/20/28 | | | | 1.000%(Q) | | | | 9,000 | | | | (86,876 | ) | | | | | | | 7,705 | | | | | | | | | | | | (94,581 | ) | | | | | | | CITI | |
Republic of Argentina | | | 12/20/28 | | | | 1.000%(Q) | | | | 2,000 | | | | 1,546,614 | | | | | | | | 1,712 | | | | | | | | | | | | 1,544,902 | | | | | | | | CITI | |
Republic of Chile | | | 12/20/28 | | | | 1.000%(Q) | | | | 7,000 | | | | (75,743 | ) | | | | | | | 5,993 | | | | | | | | | | | | (81,736 | ) | | | | | | | CITI | |
Republic of Colombia | | | 12/20/28 | | | | 1.000%(Q) | | | | 6,000 | | | | 306,930 | | | | | | | | 5,137 | | | | | | | | | | | | 301,793 | | | | | | | | CITI | |
Republic of Indonesia | | | 12/20/28 | | | | 1.000%(Q) | | | | 9,000 | | | | (17,972 | ) | | | | | | | 7,705 | | | | | | | | | | | | (25,677 | ) | | | | | | | CITI | |
Republic of Panama | | | 12/20/28 | | | | 1.000%(Q) | | | | 2,000 | | | | 63,031 | | | | | | | | 1,712 | | | | | | | | | | | | 61,319 | | | | | | | | CITI | |
Republic of Peru | | | 12/20/28 | | | | 1.000%(Q) | | | | 3,000 | | | | (3,128 | ) | | | | | | | 2,568 | | | | | | | | | | | | (5,696 | ) | | | | | | | CITI | |
Republic of Philippines | | | 12/20/28 | | | | 1.000%(Q) | | | | 3,000 | | | | (18,243 | ) | | | | | | | 2,568 | | | | | | | | | | | | (20,811 | ) | | | | | | | CITI | |
Republic of South Africa | | | 12/20/28 | | | | 1.000%(Q) | | | | 9,000 | | | | 666,742 | | | | | | | | 7,705 | | | | | | | | | | | | 659,037 | | | | | | | | CITI | |
Republic of Turkey | | | 12/20/28 | | | | 1.000%(Q) | | | | 9,000 | | | | 1,090,991 | | | | | | | | 7,705 | | | | | | | | | | | | 1,083,286 | | | | | | | | CITI | |
State of Qatar | | | 12/20/28 | | | | 1.000%(Q) | | | | 2,000 | | | | (41,040 | ) | | | | | | | 1,712 | | | | | | | | | | | | (42,752 | ) | | | | | | | CITI | |
Sultanate of Oman | | | 12/20/28 | | | | 1.000%(Q) | | | | 2,000 | | | | 43,789 | | | | | | | | 1,712 | | | | | | | | | | | | 42,077 | | | | | | | | CITI | |
United Mexican States | | | 12/20/28 | | | | 1.000%(Q) | | | | 9,000 | | | | 75,833 | | | | | | | | 7,705 | | | | | | | | | | | | 68,128 | | | | | | | | CITI | |
| | | | | | | | | | | | | | | | | | | | | | | | | | | | | | | | | | | | | | | | | | | | |
| | | | | | | | | | | | | | $ | 5,360,117 | | | | | | | $ | 85,608 | | | | | | | | | | | $ | 5,274,509 | | | | | | | | | |
| | | | | | | | | | | | | | | | | | | | | | | | | | | | | | | | | | | | | | | | | | | | |
| | | | | | | | | | | | | | | | | | | | | | | | | | |
Reference
Entity/
Obligation | | Termination
Date | | Fixed
Rate | | Notional
Amount
(000)#(3) | | | Implied
Credit
Spread at
October 31,
2023(4) | | | Fair
Value | | | Upfront
Premiums
Paid
(Received) | | | Unrealized
Appreciation
(Depreciation) | | | Counterparty |
| | | | | | | | | | | | | | | | | | | | | | |
OTC Packaged Credit Default Swap Agreement on credit indices— Sell Protection(2)**: |
CDX.EM.40.V1 | | 12/20/28 | | 1.000%(Q) | | | 100,000 | | | | 2.279 | % | | $ | (5,351,560 | ) | | $ | (185,026 | ) | | $ | (5,166,534 | ) | | CITI |
| | | | | | | | | | | | | | | | | | | | | | | | | | |
| ** | The Fund entered into multiple credit default swap agreements in a packaged trade consisting of two parts. The Fund bought/sold protection on an Emerging Market CDX Index and bought/sold protection on the countries which comprise the index. The upfront premium is attached to the index of the trade for the Emerging Markets CDX package(s). Each swap is priced individually. If any of the component swaps are closed out early, the Index exposure will be reduced by an amount proportionate to the terminated swap(s). |
See Notes to Financial Statements.
54
Credit default swap agreements outstanding at October 31, 2023 (continued):
| | | | | | | | | | | | | | | | | | | | | | | | | | | | | | | | | | |
Reference
Entity/
Obligation | | Termination
Date | | Fixed
Rate | | Notional
Amount
(000)#(3) | | | Implied
Credit
Spread at
October 31,
2023(4) | | Fair
Value | | | Upfront Premiums Paid (Received) | | Unrealized Appreciation (Depreciation) | | | Counterparty |
| | | | | | | | | | | | | | | | | | | | | | | | | | | | | | |
OTC Credit Default Swap Agreement on asset-backed and/or mortgage-backed securities - Sell Protection(2)^: |
GS_21-PJA | | 11/14/23 | | 0.500%(M) | | | 10,204 | | | * | | $ | 6,651 | | | | | $ | (66 | ) | | | | | | $ | 6,717 | | | | | | | GSI |
| | | | | | | | | | | | | | | | | | | | | | | | | | | | | | | | | | |
| | | | | | | | | | | | | | | | | | | | | | | | | | | | | | | | | | | | | | | | | | | | |
Reference
Entity/
Obligation | | Termination
Date | | | Fixed
Rate | | | Notional
Amount
(000)#(3) | | | Fair
Value | | | Upfront
Premiums
Paid
(Received) | | | Unrealized
Appreciation
(Depreciation) | | | Counterparty | |
| | | | | | | | | | | | | | | | | | | | | | | | | | | | | | | | | | |
OTC Credit Default Swap Agreements on corporate and/or sovereign issues - Buy Protection(1): | |
United Mexican States | | | 12/20/24 | | | | 1.000%(Q) | | | | 1,000 | | | $ | (8,338 | ) | | | | | | $ | (2,706 | ) | | | | | | | | | | $ | (5,632 | ) | | | | | | | BARC | |
United Mexican States | | | 12/20/24 | | | | 1.000%(Q) | | | | 440 | | | | (3,668 | ) | | | | | | | 705 | | | | | | | | | | | | (4,373 | ) | | | | | | | CITI | |
| | | | | | | | | | | | | | | | | | | | | | | | | | | | | | | | | | | | | | | | | | | | |
| | | | | | | | | | | | | | $ | (12,006 | ) | | | | | | $ | (2,001 | ) | | | | | | | | | | $ | (10,005 | ) | | | | | | | | |
| | | | | | | | | | | | | | | | | | | | | | | | | | | | | | | | | | | | | | | | | | | | |
| | | | | | | | | | | | | | | | | | | | | | | | | | | | | | | | | | | | | | | | | | |
Reference
Entity/
Obligation | | Termination
Date | | Fixed
Rate | | Notional
Amount
(000)#(3) | | | Implied
Credit
Spread at
October 31,
2023(4) | | | Fair
Value | | | Upfront
Premiums
Paid
(Received) | | | Unrealized
Appreciation
(Depreciation) | | | Counterparty |
| | | | | | | | | | | | | | | | | | | | | | | | | | | | | | | | | | |
OTC Credit Default Swap Agreements on corporate and/or sovereign issues - Sell Protection(2): |
Bank of America Corp. | | 06/20/24 | | 1.000%(Q) | | | 7,650 | | | | 0.486 | % | | $ | 33,680 | | | | | | | $ | 2,367 | | | | | | | | | | | $ | 31,313 | | | | | | | GSI |
Boeing Co. | | 06/20/24 | | 1.000%(Q) | | | 1,460 | | | | 0.402 | % | | | 7,201 | | | | | | | | 1,284 | | | | | | | | | | | | 5,917 | | | | | | | GSI |
Federative | | | | | | | | | | | | | | | | | | | | | | | | | | | | | | | | | | | | | | | | | | |
Republic of Brazil | | 12/20/23 | | 1.000%(Q) | | | 6,400 | | | | 0.209 | % | | | 14,401 | | | | | | | | 6,578 | | | | | | | | | | | | 7,823 | | | | | | | CITI |
General Motors Co. | | 06/20/26 | | 5.000%(Q) | | | 2,230 | | | | 1.173 | % | | | 221,337 | | | | | | | | 229,252 | | | | | | | | | | | | (7,915 | ) | | | | | | GSI |
Halliburton Co. | | 12/20/26 | | 1.000%(Q) | | | 910 | | | | 0.360 | % | | | 18,014 | | | | | | | | 5,473 | | | | | | | | | | | | 12,541 | | | | | | | GSI |
Host Hotels & Resorts LP | | 06/20/24 | | 1.000%(Q) | | | 500 | | | | 0.358 | % | | | 2,604 | | | | | | | | 1,232 | | | | | | | | | | | | 1,372 | | | | | | | GSI |
Petroleos Mexicanos | | 12/20/24 | | 1.000%(Q) | | | 1,000 | | | | 3.173 | % | | | (22,552 | ) | | | | | | | (11,872 | ) | | | | | | | | | | | (10,680 | ) | | | | | | BARC |
Petroleos Mexicanos | | 12/20/24 | | 1.000%(Q) | | | 440 | | | | 3.173 | % | | | (9,923 | ) | | | | | | | (9,439 | ) | | | | | | | | | | | (484 | ) | | | | | | CITI |
Simon Property Group LP | | 06/20/26 | | 1.000%(Q) | | | 1,980 | | | | 0.605 | % | | | 21,588 | | | | | | | | 12,124 | | | | | | | | | | | | 9,464 | | | | | | | GSI |
See Notes to Financial Statements.
PGIM Absolute Return Bond Fund 55
Schedule of Investments (continued)
as of October 31, 2023
Credit default swap agreements outstanding at October 31, 2023 (continued):
| | | | | | | | | | | | | | | | | | | | | | | | | | | | | | | | | | | | |
Reference Entity/ Obligation | | Termination
Date | | | Fixed
Rate | | | Notional
Amount
(000)#(3) | | | Implied
Credit
Spread at
October 31,
2023(4) | | | Fair
Value | | | Upfront
Premiums
Paid
(Received) | | Unrealized Appreciation (Depreciation) | | Counterparty |
|
OTC Credit Default Swap Agreements on corporate and/or sovereign issues - Sell Protection(2)(cont’d.): |
Verizon Communications, Inc. | | | 06/20/26 | | | | 1.000%(Q | ) | | | 680 | | | | 0.811% | | | $ | 3,950 | | | $ | 7,520 | | | | | | | $ | (3,570 | ) | | | | GSI |
Wells Fargo & Co. | | | 12/20/23 | | | | 1.000%(Q | ) | | | 7,500 | | | | 0.355% | | | | 15,372 | | | | 2,955 | | | | | | | | 12,417 | | | | | MSI |
| | | | | | | | | | | | | | | | | | | | | | | | | | | | | | | | | | | | |
| | | | | | | | | | | |
| | | | | | | | | | | | | | | | | | $ | 305,672 | | | $ | 247,474 | | | | | | | $ | 58,198 | | | | | |
| | | | | | | | | | | | | | | | | | | | | | | | | | | | | | | | | | | | |
| | | | | | | | | | | | | | | | | | | | | | | | | | | | | | | | | | |
Reference Entity/ Obligation | | Termination
Date | | Fixed
Rate | | | Notional
Amount
(000)#(3) | | Implied Credit
Spread at
October 31,
2023(4) | | Value at Trade Date | | Value at October 31, 2023 | | Unrealized Appreciation (Depreciation) |
| | | |
Centrally Cleared Credit Default Swap Agreement on credit indices - Sell Protection(2): | | | | | | | | |
CDX.NA.HY.41.V1 | | 12/20/28 | | | 5.000%(Q | ) | | 88,180 | | 5.161% | | | | $ | 499,101 | | | | | | | $ | (31,990 | ) | | | | | | $ | (531,091 | ) | | |
| | | | | | | | | | | | | | | | | | | | | | | | | | | | | | | | | | |
The Fund entered into credit default swaps (“CDS”) to provide a measure of protection against defaults or to take an active long or short position with respect to the likelihood of a particular issuer’s default or the reference entity’s credit soundness. CDS contracts generally trade based on a spread which represents the cost a protection buyer has to pay the protection seller. The protection buyer is said to be short the credit as the value of the contract rises the more the credit deteriorates. The value of the CDS contract increases for the protection buyer if the spread increases.
| (1) | If the Fund is a buyer of protection, it pays the fixed rate. When a credit event occurs, as defined under the terms of that particular swap agreement, the Fund will either (i) receive from the seller of protection an amount equal to the notional amount of the swap and make delivery of the referenced obligation or underlying securities comprising the referenced index or (ii) receive a net settlement amount in the form of cash or securities equal to the notional amount of the swap less the recovery value of the referenced obligation or underlying securities comprising the referenced index. |
| (2) | If the Fund is a seller of protection, it receives the fixed rate. When a credit event occurs, as defined under the terms of that particular swap agreement, the Fund will either (i) pay to the buyer of protection an amount equal to the notional amount of the swap and take delivery of the referenced obligation or underlying securities comprising the referenced index or (ii) pay a net settlement amount in the form of cash or securities equal to the notional amount of the swap less the recovery value of the referenced obligation or underlying securities comprising the referenced index. |
| (3) | Notional amount represents the maximum potential amount the Fund could be required to pay as a seller of credit protection or receive as a buyer of credit protection if a credit event occurs as defined under the terms of that particular swap agreement. |
| (4) | Implied credit spreads, represented in absolute terms, utilized in determining the fair value of credit default swap |
See Notes to Financial Statements.
56
| | agreements where the Fund is the seller of protection as of the reporting date serve as an indicator of the current status of the payment/ performance risk and represent the likelihood of risk of default for the credit derivative. The implied credit spread of a particular referenced entity reflects the cost of buying/selling protection and may include up-front payments required to be made to enter into the agreement. Wider credit spreads represent a deterioration of the referenced entity’s credit soundness and a greater likelihood of risk of default or other credit event occurring as defined under the terms of the agreement. |
| * | When an implied credit spread is not available, reference the fair value of credit default swap agreements on credit indices and asset-backed securities. Where the Fund is the seller of protection, it serves as an indicator of the current status of the payment/performance risk and represents the likelihood of an expected liability (or profit) for the credit derivative should the notional amount of the swap agreement be closed/sold as of the reporting date. Increasing fair value in absolute terms, when compared to the notional amount of the swap, represents a deterioration of the referenced entity’s credit soundness and a greater likelihood of risk of default or other credit event occurring as defined under the terms of the agreement. |
Interest rate swap agreements outstanding at October 31, 2023:
| | | | | | | | | | | | | | | | | | | | | | | | | | | | | | | | | | | | | | | | |
Notional Amount (000)# | | Termination Date | | | Fixed Rate | | | Floating Rate | | | | Value at Trade Date | | | | Value at October 31, 2023 | | | | Unrealized Appreciation (Depreciation) |
| | | | | | | | | | | | | | | | | | | | |
| | | | |
Centrally Cleared Interest Rate Swap Agreements: | | | | | | | | | | |
GBP 2,090 | | | 05/08/26 | | | | 1.000%(A) | | | 1 Day SONIA(1)(A)/5.186% | | | | | | $ | (28,953 | ) | | | | | | | | $ | 273,983 | | | | | | | | | $ | 302,936 | | | |
GBP 3,280 | | | 05/08/27 | | | | 1.050%(A) | | | 1 Day SONIA(1)(A)/5.186% | | | | | | | 169,315 | | | | | | | | | | 531,637 | | | | | | | | | | 362,322 | | | |
GBP 1,340 | | | 05/08/31 | | | | 1.150%(A) | | | 1 Day SONIA(1)(A)/5.186% | | | | | | | (30,882 | ) | | | | | | | | | 358,998 | | | | | | | | | | 389,880 | | | |
95,120 | | | 08/31/24 | | | | 5.384%(T) | | | 1 Day SOFR(2)(T)/5.350% | | | | | | | — | | | | | | | | | | (65,022 | ) | | | | | | | | | (65,022 | ) | | |
6,572 | | | 03/08/25 | | | | 4.946%(A) | | | 1 Day SOFR(2)(A)/5.350% | | | | | | | — | | | | | | | | | | (33,384 | ) | | | | | | | | | (33,384 | ) | | |
8,268 | | | 03/09/25 | | | | 5.110%(A) | | | 1 Day SOFR(2)(A)/5.350% | | | | | | | — | | | | | | | | | | (15,720 | ) | | | | | | | | | (15,720 | ) | | |
49,045 | | | 08/31/25 | | | | 4.805%(A) | | | 1 Day SOFR(1)(A)/5.350% | | | | | | | — | | | | | | | | | | 242,689 | | | | | | | | | | 242,689 | | | |
12,090 | | | 09/25/26 | | | | 4.699%(A) | | | 1 Day SOFR(1)(A)/5.350% | | | | | | | 2,236 | | | | | | | | | | 15,651 | | | | | | | | | | 13,415 | | | |
| | | | | | | | | | | | | | | | | | | | | | | | | | | | | | | | | | | | | | | | |
| | | | | | | | | | | | | | | | $ | 111,716 | | | | | | | | | $ | 1,308,832 | | | | | | | | | $ | 1,197,116 | | | |
| | | | | | | | | | | | | | | | | | | | | | | | | | | | | | | | | | | | | | | | |
| (1) | The Fund pays the fixed rate and receives the floating rate. |
| (2) | The Fund pays the floating rate and receives the fixed rate. |
See Notes to Financial Statements.
PGIM Absolute Return Bond Fund 57
Schedule of Investments (continued)
as of October 31, 2023
Total return swap agreements outstanding at October 31, 2023:
| | | | | | | | | | | | | | | | | | | | | | | | | | | | | | | | | | |
| Reference Entity | | Financing Rate | | Counterparty | | | Termination Date | | | Long (Short) Notional Amount (000)#(1) | | | Fair Value | | | Upfront Premiums Paid (Received) | | Unrealized Appreciation (Depreciation)(2) |
| | | | | | | | | | | | | | | | | | |
| |
OTC Total Return Swap Agreements: | | | |
Total Return Benchmark Bond Index(T) | | 1 Day USOIS -45bps(T)/4.880% | | | GSI | | | | 03/20/24 | | | | (2,944) | | | $ | 260,585 | | | | | $ | — | | | | | | | $ | 260,585 | | | |
Total Return Benchmark Bond Index(T)†† | | 1 Day USOIS -54bps(T)/4.790% | | | JPM | | | | 03/20/24 | | | | (53,964) | | | | 4,530,191 | | | | | | — | | | | | | | | 4,530,191 | | | |
| | | | | | | | | | | | | | | | | | | | | | | | | | | | | | | | | | |
| | | | | | | | | | | | | | | | $ | 4,790,776 | | | | | $ | — | | | | | | | $ | 4,790,776 | | | |
| | | | | | | | | | | | | | | | | | | | | | | | | | | | | | | | | | |
| (1) | On a long total return swap, the Fund receives payments for any positive return on the reference entity (makes payments for any negative return) and pays the financing rate. On a short total return swap, the Fund makes payments for any positive return on the reference entity (receives payments for any negative return) and receives the financing rate. |
| (2) | Upfront/recurring fees or commissions, as applicable, are included in the net unrealized appreciation (depreciation). |
| †† | See the table below for the swap constituents. To the extent that any swap is composed of greater than 50 constituents, the Fund is only required to disclose the top 50. |
The following table represents the top 50 individual positions and related values of underlying securities of Total Return Benchmark Bond Index total return swap with JPM, as of October 31, 2023, termination date 03/20/2024:
Corporate Bond:
| | | | | | | | | | |
Reference Entity | | Shares | | | Market
Value | | | % of Total
Index Value |
| | | |
Sysco Corp. | | | 4,000,000 | | | $ | 3,976,217 | | | 1.56% |
Morgan Stanley | | | 4,000,000 | | | | 3,598,463 | | | 1.41% |
United Parcel Service, Inc. | | | 4,000,000 | | | | 3,595,255 | | | 1.41% |
Northrop Grumman Corp. | | | 4,000,000 | | | | 3,476,245 | | | 1.36% |
FedEx Corp. | | | 4,000,000 | | | | 3,418,592 | | | 1.34% |
Keurig Dr Pepper, Inc. | | | 4,000,000 | | | | 3,368,580 | | | 1.32% |
Cigna Corp. | | | 4,000,000 | | | | 3,269,974 | | | 1.28% |
The Walt Disney Co. | | | 4,000,000 | | | | 3,257,258 | | | 1.28% |
Fox Corp. | | | 4,000,000 | | | | 3,212,272 | | | 1.26% |
Telefonica Emisiones, S.A.U. | | | 4,000,000 | | | | 3,210,261 | | | 1.26% |
Conagra Brands, Inc. | | | 4,000,000 | | | | 3,204,304 | | | 1.25% |
Wells Fargo & Co. | | | 4,000,000 | | | | 3,188,260 | | | 1.25% |
Intel Corp. | | | 4,000,000 | | | | 3,158,638 | | | 1.24% |
TransCanada PipeLines Ltd. | | | 4,000,000 | | | | 3,158,414 | | | 1.24% |
HCA, Inc. | | | 4,000,000 | | | | 3,155,544 | | | 1.24% |
Bristol-Myers Squibb Co. | | | 4,000,000 | | | | 3,124,311 | | | 1.22% |
ExxonMobil Corp. | | | 4,000,000 | | | | 3,124,027 | | | 1.22% |
Eli Lilly and Co. | | | 4,000,000 | | | | 3,032,760 | | | 1.19% |
Thermo Fisher Scientific, Inc. | | | 4,000,000 | | | | 3,015,441 | | | 1.18% |
See Notes to Financial Statements.
58
Corporate Bond (continued):
| | | | | | | | | | |
Reference Entity | | Shares | | | Market
Value | | | % of Total
Index Value |
| | | |
Johnson & Johnson | | | 4,000,000 | | | $ | 2,984,465 | | | 1.17% |
Enterprise Products Operating LLC | | | 4,000,000 | | | | 2,975,304 | | | 1.17% |
Deere & Co. | | | 4,000,000 | | | | 2,968,696 | | | 1.16% |
Fiserv, Inc. | | | 4,000,000 | | | | 2,958,447 | | | 1.16% |
Mastercard, Inc. | | | 4,000,000 | | | | 2,936,347 | | | 1.15% |
McDonald’s Corp. | | | 4,000,000 | | | | 2,927,997 | | | 1.15% |
T-Mobile USA, Inc. | | | 4,000,000 | | | | 2,925,608 | | | 1.15% |
Progressive Corp. | | | 4,000,000 | | | | 2,860,546 | | | 1.12% |
Bank of America Corp. | | | 4,000,000 | | | | 2,824,991 | | | 1.11% |
Equinor ASA | | | 4,000,000 | | | | 2,784,437 | | | 1.09% |
Humana, Inc. | | | 4,000,000 | | | | 2,780,007 | | | 1.09% |
Union Electric Co. | | | 4,000,000 | | | | 2,770,888 | | | 1.09% |
Becton, Dickinson & Co. | | | 4,000,000 | | | | 2,759,709 | | | 1.08% |
NVIDIA Corp. | | | 4,000,000 | | | | 2,747,439 | | | 1.08% |
Vodafone Group PLC | | | 4,000,000 | | | | 2,747,302 | | | 1.08% |
Nike, Inc. | | | 4,000,000 | | | | 2,702,931 | | | 1.06% |
Starbucks Corp. | | | 4,000,000 | | | | 2,625,658 | | | 1.03% |
Global Payments, Inc. | | | 4,000,000 | | | | 2,624,964 | | | 1.03% |
Caterpillar, Inc. | | | 4,000,000 | | | | 2,622,426 | | | 1.03% |
Paramount Global | | | 4,000,000 | | | | 2,620,945 | | | 1.03% |
Dollar General Corp. | | | 4,000,000 | | | | 2,615,544 | | | 1.02% |
Oracle Corp. | | | 4,000,000 | | | | 2,612,537 | | | 1.02% |
Dow Chemical Co. | | | 4,000,000 | | | | 2,592,752 | | | 1.02% |
Southern California Edison Co. | | | 4,000,000 | | | | 2,577,723 | | | 1.01% |
Entergy Corp. | | | 4,000,000 | | | | 2,573,560 | | | 1.01% |
eBay, Inc. | | | 4,000,000 | | | | 2,569,252 | | | 1.01% |
Suncor Energy, Inc | | | 4,000,000 | | | | 2,563,463 | | | 1.00% |
Union Pacific Corp. | | | 4,000,000 | | | | 2,546,880 | | | 1.00% |
Amazon.com, Inc. | | | 4,000,000 | | | | 2,541,949 | | | 1.00% |
Verizon Communications, Inc. | | | 4,000,000 | | | | 2,528,677 | | | 0.99% |
Carrier Global Corp. | | | 4,000,000 | | | | 2,523,170 | | | 0.99% |
| | | | | | | | | | |
| | | |
| | | | | | $ | 146,939,430 | | | |
| | | | | | | | | | |
Balances Reported in the Statement of Assets and Liabilities for OTC Swap Agreements:
| | | | | | | | |
| | | Premiums Paid | | Premiums Received | | Unrealized Appreciation | | Unrealized Depreciation |
| | | | | |
OTC Swap Agreements | | $355,098 | | $(209,109) | | $10,593,788 | | $(5,640,127) |
See Notes to Financial Statements.
PGIM Absolute Return Bond Fund 59
Schedule of Investments (continued)
as of October 31, 2023
Summary of Collateral for Centrally Cleared/Exchange-traded Derivatives:
Cash and securities segregated as collateral, including pending settlement for closed positions, to cover requirements for centrally cleared/exchange-traded derivatives are listed by broker as follows:
| | | | | | | | | | | | | | | | | | | | | | | | |
Broker | | Cash and/or Foreign Currency | | | Securities Market Value | |
| | | | | | |
CGM | | | | | | $ | — | | | | | | | | | | | $ | 19,135,627 | | | | | |
| | | | | | | | | | | | | | | | | | | | | | | | |
Fair Value Measurements:
Various inputs are used in determining the value of the Fund’s investments. These inputs are summarized in the three broad levels listed below.
Level 1—unadjusted quoted prices generally in active markets for identical securities.
Level 2—quoted prices for similar securities, interest rates and yield curves, prepayment speeds, foreign currency exchange rates and other observable inputs.
Level 3—unobservable inputs for securities valued in accordance with Board approved fair valuation procedures.
The following is a summary of the inputs used as of October 31, 2023 in valuing such portfolio securities:
| | | | | | | | | | | | |
| | | Level 1 | | | Level 2 | | | Level 3 | |
Investments in Securities | | | | | | | | | | | | |
Assets | | | | | | | | | | | | |
Long-Term Investments | | | | | | | | | | | | |
Asset-Backed Securities | | | | | | | | | | | | |
Automobiles | | $ | — | | | $ | 20,827,756 | | | $ | — | |
Collateralized Loan Obligations | | | — | | | | 282,253,318 | | | | 10,000,000 | |
Consumer Loans | | | — | | | | 9,840,577 | | | | — | |
Home Equity Loans | | | — | | | | 8,231,628 | | | | — | |
Other | | | — | | | | 1,951,633 | | | | — | |
Residential Mortgage-Backed Securities | | | — | | | | 7,206,397 | | | | 4,219,918 | |
Student Loans | | | — | | | | 2,391,007 | | | | — | |
Commercial Mortgage-Backed Securities | | | — | | | | 79,174,616 | | | | — | |
Convertible Bond | | | — | | | | 2,335 | | | | — | |
Corporate Bonds | | | — | | | | 316,034,189 | | | | 866,894 | |
Floating Rate and Other Loans | | | — | | | | 5,870,048 | | | | 3,048,360 | |
Municipal Bonds | | | — | | | | 17,397,794 | | | | — | |
Residential Mortgage-Backed Securities | | | — | | | | 36,060,828 | | | | — | |
Sovereign Bonds | | | — | | | | 33,977,773 | | | | — | |
U.S. Government Agency Obligations | | | — | | | | 80,200,751 | | | | — | |
U.S. Treasury Obligations | | | — | | | | 228,312,673 | | | | — | |
Common Stocks | | | 1,082,026 | | | | 1,601,515 | | | | 1,236,818 | |
Rights | | | — | | | | — | | | | 21,125 | |
Short-Term Investments | | | | | | | | | | | | |
Affiliated Mutual Funds | | | 143,720,869 | | | | — | | | | — | |
| | | | | | | | | | | | |
Total | | $ | 144,802,895 | | | $ | 1,131,334,838 | | | $ | 19,393,115 | |
| | | | | | | | | | | | |
See Notes to Financial Statements.
60
| | | | | | | | | | | | |
| | | Level 1 | | | Level 2 | | | Level 3 | |
Investment in Securities (continued) | | | | | | | | | | | | |
Liabilities | | | | | | | | | | | | |
Option Written | | $ | — | | | $ | — | | | $ | (60 | ) |
| | | | | | | | | | | | |
| | | |
Other Financial Instruments* | | | | | | | | | | | | |
Assets | | | | | | | | | | | | |
Futures Contracts | | $ | 15,300,279 | | | $ | — | | | $ | — | |
OTC Forward Foreign Currency Exchange Contracts | | | — | | | | 1,995,399 | | | | — | |
OTC Packaged Credit Default Swap Agreements | | | — | | | | 5,765,101 | | | | — | |
OTC Credit Default Swap Agreements | | | — | | | | 338,147 | | | | 6,651 | |
Centrally Cleared Interest Rate Swap Agreements | | | — | | | | 1,311,242 | | | | — | |
OTC Total Return Swap Agreements | | | — | | | | 4,790,776 | | | | — | |
| | | | | | | | | | | | |
| | | |
Total | | $ | 15,300,279 | | | $ | 14,200,665 | | | $ | 6,651 | |
| | | | | | | | | | | | |
| | | |
Liabilities | | | | | | | | | | | | |
Unfunded Loan Commitment | | $ | — | | | $ | — | | | $ | (1,473 | ) |
Forward Commitment Contracts | | | — | | | | (8,312,124 | ) | | | — | |
Futures Contracts | | | (55,947 | ) | | | — | | | | — | |
OTC Forward Foreign Currency Exchange Contracts | | | — | | | | (1,571,202 | ) | | | — | |
OTC Cross Currency Exchange Contracts | | | — | | | | (25,784 | ) | | | — | |
OTC Packaged Credit Default Swap Agreements | | | — | | | | (5,756,544 | ) | | | — | |
Centrally Cleared Credit Default Swap Agreement | | | — | | | | (531,091 | ) | | | — | |
OTC Credit Default Swap Agreements | | | — | | | | (44,481 | ) | | | — | |
Centrally Cleared Interest Rate Swap Agreements | | | — | | | | (114,126 | ) | | | — | |
| | | | | | | | | | | | |
| | | |
Total | | $ | (55,947 | ) | | $ | (16,355,352 | ) | | $ | (1,473 | ) |
| | | | | | | | | | | | |
| * | Other financial instruments are derivative instruments, with the exception of unfunded loan commitments and forward commitment contracts, and are not reflected in the Schedule of Investments. Futures, forwards, centrally cleared swap contracts and unfunded loan commitments are recorded at unrealized appreciation (depreciation) and OTC swap contracts are recorded at fair value. Forward commitment contracts are recorded at market value. |
The following is a reconciliation of assets in which unobservable inputs (Level 3) were used in determining fair value:
| | | | | | | | | | | | | | | | | | | | | | | | | | | | | | | | | | | | | | |
| | | Asset-Backed Securities- Collateralized Loan Obligations | | | | Asset-Backed Securities- Residential Mortgage-Backed Securities | | | | Corporate Bonds | | | | Floating Rate and Other Loans |
Balance as of 10/31/22 | | | | $ | — | | | | | | | | | $ | 5,303,948 | | | | | | | | | $ | 853,677 | | | | | | | | | $ | 2,487,598 | | | |
Realized gain (loss) | | | | | — | | | | | | | | | | (56,733 | ) | | | | | | | | | — | | | | | | | | | | — | | | |
Change in unrealized appreciation (depreciation) | | | | | — | | | | | | | | | | (7,452 | ) | | | | | | | | | 13,217 | | | | | | | | | | 282,368 | | | |
Purchases/Exchanges/Issuances | | | | | 10,000,000 | | | | | | | | | | — | | | | | | | | | | — | | | | | | | | | | 443,982 | | | |
Sales/Paydowns | | | | | — | | | | | | | | | | (1,019,845 | ) | | | | | | | | | — | | | | | | | | | | (165,960 | ) | | |
Accrued discount/premium | | | | | — | | | | | | | | | | — | | | | | | | | | | — | | | | | | | | | | 372 | | | |
See Notes to Financial Statements.
PGIM Absolute Return Bond Fund 61
Schedule of Investments (continued)
as of October 31, 2023
| | | | | | | | | | | | | | | | | | | | | | | | | | | | | | | | | | | | | | |
| | | Asset-Backed Securities- Collateralized Loan Obligations | | | | Asset-Backed Securities- Residential Mortgage-Backed Securities | | | | Corporate Bonds | | | | Floating Rate and Other Loans |
Transfers into Level 3* | | | | $ | — | | | | | | | | | $ | — | | | | | | | | | $ | — | | | | | | | | | $ | — | | | |
Transfers out of Level 3* | | | | | — | | | | | | | | | | — | | | | | | | | | | — | | | | | | | | | | — | | | |
| | | | | | | | | | | | | | | | | | | | | | | | | | | | | | | | | | | | | | |
Balance as of 10/31/23 | | | | $ | 10,000,000 | | | | | | | | | $ | 4,219,918 | | | | | | | | | $ | 866,894 | | | | | | | | | $ | 3,048,360 | | | |
| | | | | | | | | | | | | | | | | | | | | | | | | | | | | | | | | | | | | | |
| | | | | | | | | | | | | | | |
Change in unrealized appreciation (depreciation) relating to securities still held at reporting period end | | | | $ | — | | | | | | | | | $ | (7,452 | ) | | | | | | | | $ | 13,219 | | | | | | | | | $ | 282,368 | | | |
| | | | | | | | | | | | | | | | | | | | | | | | | | | | | | | | | | | | | | |
| | | | | | | | | | | | | | | | | | | | | | | | | | | | | | | | | | | | | | | | | | | | |
| | | Common
Stocks | | | Rights | | Warrants | | Options Written | | Unfunded Loan Commitments | | OTC Credit Default Swap Agreements |
Balance as of 10/31/22 | | $ | 1,362,600 | | | | | $ | 23,677 | | | | | | | $ | 119 | | | | | | | $ | (479 | ) | | | | | | $ | — | | | | | | | $ | 4,563 | | | |
Realized gain (loss) | | | — | | | | | | — | | | | | | | | — | | | | | | | | — | | | | | | | | — | | | | | | | | 1,212 | | | |
Change in unrealized appreciation (depreciation) | | | 627,705 | | | | | | (2,598 | ) | | | | | | | (119 | ) | | | | | | | 419 | | | | | | | | (1,473 | ) | | | | | | | 6,651 | | | |
Purchases/Exchanges/Issuances | | | 609,113 | | | | | | 46 | | | | | | | | — | | | | | | | | — | | | | | | | | — | | | | | | | | — | | | |
Sales/Paydowns | | | — | | | | | | — | | | | | | | | — | | | | | | | | — | | | | | | | | — | | | | | | | | (5,775 | ) | | |
Accrued discount/premium | | | — | | | | | | — | | | | | | | | — | | | | | | | | — | | | | | | | | — | | | | | | | | — | | | |
Transfers into Level 3* | | | — | | | | | | — | | | | | | | | — | | | | | | | | — | | | | | | | | — | | | | | | | | — | | | |
Transfers out of Level 3* | | | (1,362,600 | ) | | | | | — | | | | | | | | — | | | | | | | | — | | | | | | | | — | | | | | | | | — | | | |
| | | | | | | | | | | | | | | | | | | | | | | | | | | | | | | | | | | | | | | | | | | | |
| | | | | | | | | | | | | | | | |
Balance as of 10/31/23 | | $ | 1,236,818 | | | | | $ | 21,125 | | | | | | | $ | — | | | | | | | $ | (60 | ) | | | | | | $ | (1,473 | ) | | | | | | $ | 6,651 | | | |
| | | | | | | | | | | | | | | | | | | | | | | | | | | | | | | | | | | | | | | | | | | | |
Change in unrealized appreciation (depreciation) relating to securities still held at reporting period end | | $ | 627,705 | | | | | $ | (2,598 | ) | | | | | | $ | — | | | | | | | $ | 254 | | | | | | | $ | (1,473 | ) | | | | | | $ | 6,651 | | | |
| | | | | | | | | | | | | | | | | | | | | | | | | | | | | | | | | | | | | | | | | | | | |
| * | It is the Fund’s policy to recognize transfers in and transfers out at the securities’ fair values as of the beginning of period. Securities transferred between Level 2 and Level 3 are due to changes in the method utilized in valuing the investments. Transfers from Level 2 to Level 3 are typically a result of a change from the use of methods used by independent pricing services (Level 2) to the use of a single broker quote or valuation technique which utilizes significant unobservable inputs due to an absence of current or reliable market quotations (Level 3). Transfers from Level 3 to Level 2 are a result of the availability of current and reliable market data provided by independent pricing services or other valuation techniques which utilize observable inputs. In accordance with the requirements of ASC 820, the amounts of transfers into and out of Level 3, if material, are disclosed in the Notes to the Schedule of Investments of the Fund. |
See Notes to Financial Statements.
62
Level 3 securities as presented in the table above are being fair valued using pricing methodologies approved by the Board, which contain unobservable inputs as follows:
| | | | | | | | | | | | | | | | |
Level 3 Securities** | | Fair Value as of October 31, 2023 | | Valuation
Approach | | Valuation
Methodology | | | Unobservable
Inputs |
| | | | | | |
Asset-Backed Securities-Collateralized Loan Obligations | | | | $ | 10,000,000 | | | | | Market | | | Transaction Based | | | Unadjusted Purchase
Price |
Asset-Backed Securities-Residential Mortgage-Backed Securities | | | | | 1 | | | | | Market | | | Contingent Value | | | Property Price
Appreciation Forecast |
Asset-Backed Securities-Residential Mortgage-Backed Securities | | | | | 4,219,917 | | | | | Market | | | Transaction Based | | | Unadjusted Trade Price |
Floating Rate and Other Loans | | | | | 2,881,244 | | | | | Market | | | Comparable Bond | | | Discounted Yield Curve
Spread |
Rights | | | | | 21,125 | | | | | Market | | | Transaction Based | | | Unadjusted Trade Price |
| | | | | | | | | | | | | | | | |
| | | | | | |
| | | | $ | 17,122,287 | | | | | | | | | | | |
| | | | | | | | | | | | | | | | |
| ** | The table does not include Level 3 securities and/or derivatives that are valued by independent pricing vendors or brokers. As of October 31, 2023, the aggregate value of these securities and/or derivatives was $2,275,946. The unobservable inputs for these investments were not developed by the Fund and are not readily available (e.g. single broker quotes). |
Industry Classification:
The industry classification of investments and other assets in excess of liabilities shown as a percentage of net assets as of October 31, 2023 were as follows:
| | | | |
Collateralized Loan Obligations | | | 22.3 | % |
U.S. Treasury Obligations | | | 17.4 | |
Affiliated Mutual Funds (1.0% represents investments purchased with collateral from securities on loan) | | | 11.0 | |
U.S. Government Agency Obligations | | | 6.1 | |
Commercial Mortgage-Backed Securities | | | 6.0 | |
Banks | | | 5.9 | |
Residential Mortgage-Backed Securities | | | 3.6 | |
Sovereign Bonds | | | 2.6 | |
Oil & Gas | | | 2.5 | |
Automobiles | | | 1.6 | |
Municipal Bonds | | | 1.3 | |
Media | | | 1.3 | |
Electric | | | 1.3 | |
Telecommunications | | | 1.2 | |
| | | | |
Pipelines | | | 1.2 | % |
Chemicals | | | 1.1 | |
Pharmaceuticals | | | 1.0 | |
Retail | | | 0.9 | |
Consumer Loans | | | 0.8 | |
Commercial Services | | | 0.7 | |
Home Equity Loans | | | 0.6 | |
Aerospace & Defense | | | 0.6 | |
Insurance | | | 0.5 | |
Engineering & Construction | | | 0.5 | |
Lodging | | | 0.5 | |
Diversified Financial Services | | | 0.5 | |
Leisure Time | | | 0.4 | |
Home Builders | | | 0.4 | |
Healthcare-Services | | | 0.4 | |
Entertainment | | | 0.4 | |
See Notes to Financial Statements.
PGIM Absolute Return Bond Fund 63
Schedule of Investments (continued)
as of October 31, 2023
Industry Classification (continued):
| | | | |
Auto Manufacturers | | | 0.4 | % |
Foods | | | 0.3 | |
Gas | | | 0.3 | |
Airlines | | | 0.3 | |
Mining | | | 0.3 | |
Computers | | | 0.3 | |
Auto Parts & Equipment | | | 0.2 | |
Investment Companies | | | 0.2 | |
Real Estate Investment Trusts (REITs) | | | 0.2 | |
Student Loans | | | 0.2 | |
Packaging & Containers | | | 0.2 | |
Other | | | 0.1 | |
Healthcare-Products | | | 0.1 | |
Biotechnology | | | 0.1 | |
Machinery-Diversified | | | 0.1 | |
Transportation | | | 0.1 | |
Forest Products & Paper | | | 0.1 | |
Metal Fabricate/Hardware | | | 0.1 | |
Building Materials | | | 0.1 | |
Gas Utilities | | | 0.1 | |
| | | | |
Oil, Gas & Consumable Fuels | | | 0.1 | % |
Distribution/Wholesale | | | 0.1 | |
Internet | | | 0.1 | |
Real Estate | | | 0.1 | |
Apparel | | | 0.0 | * |
Energy-Alternate Sources | | | 0.0 | * |
Wireless Telecommunication Services | | | 0.0 | * |
Agriculture | | | 0.0 | * |
Beverages | | | 0.0 | * |
Housewares | | | 0.0 | * |
Oil & Gas Services | | | 0.0 | * |
| | | | |
| |
| | | 98.8 | |
Option Written | | | (0.0 | )* |
Other assets in excess of liabilities | | | 1.2 | |
| | | | |
| |
| | | 100.0 | % |
| | | | |
Effects of Derivative Instruments on the Financial Statements and Primary Underlying Risk Exposure:
The Fund invested in derivative instruments during the reporting period. The primary types of risk associated with these derivative instruments are credit risk, foreign exchange risk and interest rate risk. See the Notes to Financial Statements for additional detail regarding these derivative instruments and their risks. The effect of such derivative instruments on the Fund’s financial position and financial performance as reflected in the Statement of Assets and Liabilities and Statement of Operations is presented in the summary below.
Fair values of derivative instruments as of October 31, 2023 as presented in the Statement of Assets and Liabilities:
| | | | | | | | | | | | |
| | | Asset Derivatives | | | Liability Derivatives | |
| | | | |
Derivatives not accounted for as hedging instruments, carried at fair value | | Statement of Assets and Liabilities Location | | Fair
Value | | | Statement of Assets and Liabilities Location | | Fair
Value | |
Credit contracts | | — | | $ | — | | | Due from/to broker-variation margin swaps | | $ | 531,091* | |
Credit contracts | | Premiums paid for OTC swap agreements | | | 355,098 | | | Premiums received for OTC swap agreements | | | 209,109 | |
Credit contracts | | — | | | — | | | Options written outstanding, at value | | | 60 | |
Credit contracts | | Unrealized appreciation on OTC swap agreements | | | 5,803,012 | | | Unrealized depreciation on OTC swap agreements | | | 5,640,127 | |
See Notes to Financial Statements.
64
| | | | | | | | | | | | |
| | | Asset Derivatives | | | Liability Derivatives | |
| | | | |
Derivatives not accounted for as hedging instruments, carried at fair value | | Statement of Assets and Liabilities Location | | Fair
Value | | | Statement of Assets and Liabilities Location | | Fair
Value | |
Foreign exchange contracts | | — | | $ | — | | | Unrealized depreciation on OTC cross currency exchange contracts | | $ | 25,784 | |
Foreign exchange contracts | | Unrealized appreciation on OTC forward foreign currency exchange contracts | | | 1,995,399 | | | Unrealized depreciation on OTC forward foreign currency exchange contracts | | | 1,571,202 | |
Interest rate contracts | | Due from/to broker-variation margin futures | | | 15,300,279 | * | | Due from/to broker-variation margin futures | | | 55,947 | * |
Interest rate contracts | | Due from/to broker-variation margin swaps | | | 1,311,242 | * | | Due from/to broker-variation margin swaps | | | 114,126 | * |
Interest rate contracts | | Unrealized appreciation on OTC swap agreements | | | 4,790,776 | | | — | | | — | |
| | | | | | | | | | | | |
| | | | $ | 29,555,806 | | | | | $ | 8,147,446 | |
| | | | | | | | | | | | |
| * | Includes cumulative appreciation (depreciation) as reported in the schedule of open futures and centrally cleared swap contracts. Only unsettled variation margin receivable (payable) is reported within the Statement of Assets and Liabilities. |
The effects of derivative instruments on the Statement of Operations for the year ended October 31, 2023 are as follows:
| | | | | | | | | | | | | | | | | | | | | | | | |
Amount of Realized Gain (Loss) on Derivatives Recognized in Income | |
| | | | | |
Derivatives not accounted for as hedging instruments, carried at fair value | | Options Purchased(1) | | Options
Written | | | Futures | | | Forward
& Cross
Currency
Exchange
Contracts | | | Swaps | |
| | | | | | | |
Credit contracts | | | | $ | (5,073,205 | ) | | | | $ | 5,550,379 | | | $ | — | | | $ | — | | | $ | (9,537,580 | ) |
Foreign exchange contracts | | | | | (493,823 | ) | | | | | 539,994 | | | | — | | | | (1,173,502 | ) | | | — | |
Interest rate contracts | | | | | (3,828 | ) | | | | | 155,312 | | | | 31,899,233 | | | | — | | | | 1,767,193 | |
| | | | | | | | | | | | | | | | | | | | | | | | |
| | | | | | | |
Total | | | | $ | (5,570,856 | ) | | | | $ | 6,245,685 | | | $ | 31,899,233 | | | $ | (1,173,502 | ) | | $ | (7,770,387 | ) |
| | | | | | | | | | | | | | | | | | | | | | | | |
| (1) | Included in net realized gain (loss) on investment transactions in the Statement of Operations. |
| | | | | | | | | | | | | | | | | | | | | | | | |
Change in Unrealized Appreciation (Depreciation) on Derivatives Recognized in Income | |
| | | | | |
Derivatives not accounted for as hedging instruments, carried at fair value | | Options Purchased(2) | | Options
Written | | | Futures | | | Forward
& Cross
Currency
Exchange
Contracts | | | Swaps | |
| | | | | | | |
Credit contracts | | | | $ | 1,859,219 | | | | | $ | (1,478,418 | ) | | $ | — | | | $ | — | | | $ | 1,345,472 | |
See Notes to Financial Statements.
PGIM Absolute Return Bond Fund 65
Schedule of Investments (continued)
as of October 31, 2023
| | | | | | | | | | | | | | | | | | | | | | | | | |
Change in Unrealized Appreciation (Depreciation) on Derivatives Recognized in Income |
| | | | | |
Derivatives not accounted for as hedging instruments, carried at fair value | | Options Purchased(2) | | Options
Written | | Futures | | Forward
& Cross
Currency
Exchange
Contracts | | Swaps |
| | | | | |
Foreign exchange contracts | | | $ | (6,521,766 | ) | | | $ | 6,475,596 | | | | $ | — | | | | $ | (685,692 | ) | | | $ | — | |
Interest rate contracts | | | | — | | | | | — | | | | | (20,618,991 | ) | | | | — | | | | | 3,720,479 | |
| | | | | | | | | | | | | | | | | | | | | | | | | |
| | | | | |
Total | | | $ | (4,662,547 | ) | | | $ | 4,997,178 | | | | $ | (20,618,991 | ) | | | $ | (685,692 | ) | | | $ | 5,065,951 | |
| | | | | | | | | | | | | | | | | | | | | | | | | |
| (2) | Included in net change in unrealized appreciation (depreciation) on investments in the Statement of Operations. |
For the year ended October 31, 2023, the Fund’s average volume of derivative activities is as follows:
| | | | | |
| Derivative Contract Type | | Average Volume of Derivative Activities* |
Options Purchased (1) | | | $ | 1,422,705 | |
Options Written (2) | | | | 570,617,600 | |
Futures Contracts - Long Positions (2) | | | | 93,683,597 | |
Futures Contracts - Short Positions (2) | | | | 603,745,209 | |
Forward Foreign Currency Exchange Contracts - Purchased (3) | | | | 184,446,495 | |
Forward Foreign Currency Exchange Contracts - Sold (3) | | | | 335,775,302 | |
Cross Currency Exchange Contracts (4) | | | | 13,976,333 | |
Interest Rate Swap Agreements (2) | | | | 49,305,878 | |
Credit Default Swap Agreements - Buy Protection (2) | | | | 238,589,510 | |
Credit Default Swap Agreements - Sell Protection (2) | | | | 118,072,695 | |
Total Return Swap Agreements (2) | | | | 103,041,718 | |
| * | Average volume is based on average quarter end balances as noted for the year ended October 31, 2023. |
| (2) | Notional Amount in USD. |
| (3) | Value at Settlement Date. |
Financial Instruments/Transactions—Summary of Offsetting and Netting Arrangements:
The Fund invested in OTC derivatives and entered into financial instruments/transactions during the reporting period that are either offset in accordance with current requirements or are subject to enforceable master netting arrangements or similar agreements that permit offsetting. The information about offsetting and related netting arrangements for OTC derivatives and financial instruments/transactions where the legal right to set-off exists is presented in the summary below.
Offsetting of financial instrument/transaction assets and liabilities:
See Notes to Financial Statements.
66
| | | | | | | | | | | | | | | |
| | | | |
| Description | | Gross Market Value of Recognized Assets/(Liabilities) | | Collateral Pledged/(Received)(2) | | Net Amount |
Securities on Loan | | $12,590,393 | | $(12,590,393) | | $— |
Offsetting of OTC derivative assets and liabilities:
| | | | | | | | | | | | | | | | | | | | | | | | | |
Counterparty | | Gross Amounts of Recognized Assets(1) | | Gross Amounts of Recognized Liabilities(1) | | Net Amounts of Recognized Assets/(Liabilities) | | Collateral Pledged/(Received)(2) | | Net Amount |
| | | | | | | | | | | |
BARC | | | $ | 343,513 | | | | $ | (86,449 | ) | | | $ | 257,064 | | | | $ | (257,064 | ) | | | $ | — | |
BNP | | | | 108,907 | | | | | (40,347 | ) | | | | 68,560 | | | | | — | | | | | 68,560 | |
BOA | | | | 60,348 | | | | | (99,472 | ) | | | | (39,124 | ) | | | | 39,124 | | | | | — | |
CITI | | | | 6,080,657 | | | | | (6,050,605 | ) | | | | 30,052 | | | | | (30,052 | ) | | | | — | |
DB | | | | 85,791 | | | | | (18,722 | ) | | | | 67,069 | | | | | — | | | | | 67,069 | |
GSI | | | | 595,799 | | | | | (232,450 | ) | | | | 363,349 | | | | | — | | | | | 363,349 | |
HSBC | | | | 273,153 | | | | | (153,469 | ) | | | | 119,684 | | | | | — | | | | | 119,684 | |
JPM | | | | 4,702,515 | | | | | (118,452 | ) | | | | 4,584,063 | | | | | (4,584,063 | ) | | | | — | |
MSI | | | | 295,139 | | | | | (302,410 | ) | | | | (7,271 | ) | | | | 7,271 | | | | | — | |
SCB | | | | 261,732 | | | | | (50,227 | ) | | | | 211,505 | | | | | (211,505 | ) | | | | — | |
SSB | | | | 76,171 | | | | | (187,980 | ) | | | | (111,809 | ) | | | | 111,809 | | | | | — | |
TD | | | | 29,594 | | | | | (38,992 | ) | | | | (9,398 | ) | | | | — | | | | | (9,398 | ) |
UAG | | | | 30,966 | | | | | (66,707 | ) | | | | (35,741 | ) | | | | — | | | | | (35,741 | ) |
| | | | | | | | | | | | | | | | | | | | | | | | | |
| | | | | |
| | | $ | 12,944,285 | | | | $ | (7,446,282 | ) | | | $ | 5,498,003 | | | | $ | (4,924,480 | ) | | | $ | 573,523 | |
| | | | | | | | | | | | | | | | | | | | | | | | | |
| (1) | Includes unrealized appreciation/(depreciation) on swaps and forwards, premiums paid/(received) on swap agreements and market value of purchased and written options, as represented on the Statement of Assets and Liabilities. |
| (2) | Collateral amount disclosed by the Fund is limited to the market value of financial instruments/transactions and the Fund’s OTC derivative exposure by counterparty. |
See Notes to Financial Statements.
PGIM Absolute Return Bond Fund 67
Statement of Assets and Liabilities
as of October 31, 2023
| | | | |
Assets | | | | |
| |
Investments at value, including securities on loan of $12,590,393: | | | | |
Unaffiliated investments (cost $1,241,938,385) | | $ | 1,151,809,979 | |
Affiliated investments (cost $143,445,521) | | | 143,720,869 | |
Cash | | | 39,001,499 | |
Foreign currency, at value (cost $1,662,682) | | | 1,661,294 | |
Receivable for investments sold | | | 21,188,770 | |
Receivable for Fund shares sold | | | 15,501,512 | |
Unrealized appreciation on OTC swap agreements | | | 10,593,788 | |
Dividends and interest receivable | | | 9,845,941 | |
Unrealized appreciation on OTC forward foreign currency exchange contracts | | | 1,995,399 | |
Premiums paid for OTC swap agreements | | | 355,098 | |
Due from broker—variation margin swaps | | | 330,866 | |
Due from broker—variation margin futures | | | 126,693 | |
Prepaid expenses | | | 6,021 | |
| | | | |
| |
Total Assets | | | 1,396,137,729 | |
| | | | |
| |
Liabilities | | | | |
| |
Payable for investments purchased | | | 45,719,006 | |
Payable to broker for collateral for securities on loan | | | 13,150,116 | |
Forward commitment contracts, at value (proceeds receivable $8,287,852) | | | 8,312,124 | |
Payable for Fund shares purchased | | | 8,052,011 | |
Unrealized depreciation on OTC swap agreements | | | 5,640,127 | |
Unrealized depreciation on OTC forward foreign currency exchange contracts | | | 1,571,202 | |
Management fee payable | | | 730,099 | |
Accrued expenses and other liabilities | | | 619,072 | |
Dividends payable | | | 486,282 | |
Premiums received for OTC swap agreements | | | 209,109 | |
Distribution fee payable | | | 43,931 | |
Unrealized depreciation on OTC cross currency exchange contracts | | | 25,784 | |
Affiliated transfer agent fee payable | | | 3,528 | |
Trustees’ fees payable | | | 2,324 | |
Unrealized depreciation on unfunded loan commitment | | | 1,473 | |
Options written outstanding, at value (premiums received $0) | | | 60 | |
| | | | |
| |
Total Liabilities | | | 84,566,248 | |
| | | | |
| |
Net Assets | | $ | 1,311,571,481 | |
| | | | |
| |
| | | | | |
| |
Net assets were comprised of: | | | | |
Shares of beneficial interest, at par | | $ | 147,373 | |
Paid-in capital in excess of par | | | 1,599,732,412 | |
Total distributable earnings (loss) | | | (288,308,304 | ) |
| | | | |
| |
Net assets, October 31, 2023 | | $ | 1,311,571,481 | |
| | | | |
See Notes to Financial Statements.
68
| | | | |
Class A | | | | |
| |
Net asset value and redemption price per share, ($106,045,420 ÷ 11,961,649 shares of beneficial interest issued and outstanding) | | $ | 8.87 | |
Maximum sales charge (3.25% of offering price) | | | 0.30 | |
| | | | |
| |
Maximum offering price to public | | $ | 9.17 | |
| | | | |
| |
Class C | | | | |
| |
Net asset value, offering price and redemption price per share, ($25,850,973 ÷ 2,907,038 shares of beneficial interest issued and outstanding) | | $ | 8.89 | |
| | | | |
| |
Class Z | | | | |
| |
Net asset value, offering price and redemption price per share, ($1,116,816,254 ÷ 125,409,909 shares of beneficial interest issued and outstanding) | | $ | 8.91 | |
| | | | |
| |
Class R6 | | | | |
| |
Net asset value, offering price and redemption price per share, ($62,858,834 ÷ 7,094,412 shares of beneficial interest issued and outstanding) | | $ | 8.86 | |
| | | | |
See Notes to Financial Statements.
PGIM Absolute Return Bond Fund 69
Statement of Operations
Year Ended October 31, 2023
| | | | |
Net Investment Income (Loss) | | | | |
| |
Income | | | | |
Interest income | | $ | 59,958,246 | |
Affiliated dividend income | | | 6,561,310 | |
Unaffiliated dividend income | | | 838,554 | |
Income from securities lending, net (including affiliated income of $107,075) | | | 107,378 | |
| | | | |
| |
Total income | | | 67,465,488 | |
| | | | |
| |
Expenses | | | | |
Management fee | | | 7,143,526 | |
Distribution fee(a) | | | 534,316 | |
Transfer agent’s fees and expenses (including affiliated expense of $23,635)(a) | | | 1,218,414 | |
Registration fees(a) | | | 110,685 | |
Custodian and accounting fees | | | 90,368 | |
Shareholders’ reports | | | 84,265 | |
Audit fee | | | 68,900 | |
Professional fees | | | 50,899 | |
Trustees’ fees | | | 27,314 | |
Miscellaneous | | | 85,775 | |
| | | | |
| |
Total expenses | | | 9,414,462 | |
Less: Fee waiver and/or expense reimbursement(a) | | | (57,782 | ) |
| | | | |
| |
Net expenses | | | 9,356,680 | |
| | | | |
| |
Net investment income (loss) | | | 58,108,808 | |
| | | | |
| |
Realized And Unrealized Gain (Loss) On Investment And Foreign Currency Transactions | | | | |
| |
Net realized gain (loss) on: | | | | |
Investment transactions (including affiliated of $5,749) | | | (44,668,861 | ) |
Futures transactions | | | 31,899,233 | |
Forward and cross currency contract transactions | | | (1,173,502 | ) |
Options written transactions | | | 6,245,685 | |
Swap agreement transactions | | | (7,770,387 | ) |
Foreign currency transactions | | | (2,393,556 | ) |
| | | | |
| |
| | | (17,861,388 | ) |
| | | | |
Net change in unrealized appreciation (depreciation) on: | | | | |
Investments (including affiliated of $364,305) | | | 45,670,038 | |
Futures | | | (20,618,991 | ) |
Forward and cross currency contracts | | | (685,692 | ) |
Options written | | | 4,997,178 | |
Swap agreements | | | 5,065,951 | |
Foreign currencies | | | 196,470 | |
Unfunded loan commitment | | | (1,473 | ) |
| | | | |
| |
| | | 34,623,481 | |
| | | | |
| |
Net gain (loss) on investment and foreign currency transactions | | | 16,762,093 | |
| | | | |
| |
Net Increase (Decrease) In Net Assets Resulting From Operations | | $ | 74,870,901 | |
| | | | |
See Notes to Financial Statements.
70
| (a) | Class specific expenses and waivers were as follows: |
| | | | | | | | | | | | | | | | | | | | | | | | |
| | | Class A | | | Class C | | | Class Z | | | Class R6 | |
Distribution fee | | | 252,047 | | | | 282,269 | | | | — | | | | | | | | — | | | | | |
Transfer agent’s fees and expenses | | | 92,324 | | | | 28,597 | | | | 1,094,338 | | | | | | | | 3,155 | | | | | |
Registration fees | | | 16,687 | | | | 14,586 | | | | 66,571 | | | | | | | | 12,841 | | | | | |
Fee waiver and/or expense reimbursement | | | — | | | | — | | | | (57,782 | ) | | | | | | | — | | | | | |
See Notes to Financial Statements.
PGIM Absolute Return Bond Fund 71
Statements of Changes in Net Assets
| | | | | | | | |
| |
| | | Year Ended October 31, | |
| | |
| | | 2023 | | | 2022 | |
| | |
Increase (Decrease) in Net Assets | | | | | | | | |
| | |
Operations | | | | | | | | |
Net investment income (loss) | | $ | 58,108,808 | | | $ | 30,390,108 | |
Net realized gain (loss) on investment and foreign currency transactions | | | (17,861,388 | ) | | | 74,094,583 | |
Net change in unrealized appreciation (depreciation) on investments and foreign currencies | | | 34,623,481 | | | | (126,537,945 | ) |
| | | | | | | | |
| | |
Net increase (decrease) in net assets resulting from operations | | | 74,870,901 | | | | (22,053,254 | ) |
| | | | | | | | |
| | |
Dividends and Distributions | | | | | | | | |
Distributions from distributable earnings | | | | | | | | |
Class A | | | (5,217,195 | ) | | | (2,370,039 | ) |
Class C | | | (1,238,587 | ) | | | (598,981 | ) |
Class Z | | | (55,015,744 | ) | | | (25,120,070 | ) |
Class R6 | | | (3,332,132 | ) | | | (1,673,096 | ) |
| | | | | | | | |
| | |
| | | (64,803,658 | ) | | | (29,762,186 | ) |
| | | | | | | | |
| | |
Tax return of capital distributions | | | | | | | | |
Class A | | | (191,271 | ) | | | — | |
Class C | | | (45,409 | ) | | | — | |
Class Z | | | (2,016,965 | ) | | | — | |
Class R6 | | | (122,161 | ) | | | — | |
| | | | | | | | |
| | |
| | | (2,375,806 | ) | | | — | |
| | | | | | | | |
Fund share transactions (Net of share conversions) | | | | | | | | |
Net proceeds from shares sold | | | 963,435,107 | | | | 966,077,747 | |
Net asset value of shares issued in reinvestment of dividends and distributions | | | 60,324,388 | | | | 26,305,286 | |
Cost of shares purchased | | | (1,016,865,561 | ) | | | (623,037,493 | ) |
| | | | | | | | |
| | |
Net increase (decrease) in net assets from Fund share transactions | | | 6,893,934 | | | | 369,345,540 | |
| | | | | | | | |
| | |
Total increase (decrease) | | | 14,585,371 | | | | 317,530,100 | |
| | |
Net Assets: | | | | | | | | |
| | |
Beginning of year | | | 1,296,986,110 | | | | 979,456,010 | |
| | | | | | | | |
| | |
End of year | | $ | 1,311,571,481 | | | $ | 1,296,986,110 | |
| | | | | | | | |
See Notes to Financial Statements.
72
Financial Highlights
| | | | | | | | | | | | | | | | | | | | |
| | | | | | |
Class A Shares | | | | | | | | | | | | | | | | | | | | |
| | | Year Ended October 31, | |
| | | 2023 | | | 2022 | | | 2021 | | | 2020 | | | 2019 | |
| | | | | | |
Per Share Operating Performance(a): | | | | | | | | | | | | | | | | | | | | |
Net Asset Value, Beginning of Year | | | $8.79 | | | | $9.22 | | | | $8.94 | | | | $9.73 | | | | $9.82 | |
Income (loss) from investment operations: | | | | | | | | | | | | | | | | | | | | |
Net investment income (loss) | | | 0.41 | | | | 0.22 | | | | 0.21 | | | | 0.30 | | | | 0.31 | |
| Net realized and unrealized gain (loss) on investment and foreign currency transactions | | | 0.14 | | | | (0.43 | ) | | | 0.30 | | | | (0.49 | ) | | | 0.13 | |
Total from investment operations | | | 0.55 | | | | (0.21 | ) | | | 0.51 | | | | (0.19 | ) | | | 0.44 | |
Less Dividends and Distributions: | | | | | | | | | | | | | | | | | | | | |
Dividends from net investment income | | | (0.45 | ) | | | (0.22 | ) | | | (0.22 | ) | | | (0.26 | ) | | | (0.53 | ) |
Tax return of capital distributions | | | (0.02 | ) | | | - | | | | (0.01 | ) | | | (0.04 | ) | | | - | |
Distributions from net realized gains | | | - | | | | - | | | | - | | | | (0.30 | ) | | | - | |
Total dividends and distributions | | | (0.47 | ) | | | (0.22 | ) | | | (0.23 | ) | | | (0.60 | ) | | | (0.53 | ) |
Net asset value, end of year | | | $8.87 | | | | $8.79 | | | | $9.22 | | | | $8.94 | | | | $9.73 | |
Total Return(b): | | | 6.45 | % | | | (2.30 | )% | | | 5.71 | % | | | (1.96 | )% | | | 4.71 | % |
| | | | | | | | | | | | | | | | | | | | | |
| | | | | | |
Ratios/Supplemental Data: | | | | | | | | | | | | | | | | | | | | |
Net assets, end of year (000) | | | $106,045 | | | | $94,351 | | | | $109,630 | | | | $93,597 | | | | $142,879 | |
Average net assets (000) | | | $100,819 | | | | $97,005 | | | | $98,531 | | | | $114,656 | | | | $147,612 | |
Ratios to average net assets(c): | | | | | | | | | | | | | | | | | | | | |
Expenses after waivers and/or expense reimbursement | | | 0.98 | % | | | 0.98 | % | | | 0.97 | % | | | 0.97 | % | | | 1.02 | % |
Expenses before waivers and/or expense reimbursement | | | 0.98 | % | | | 0.98 | % | | | 0.97 | % | | | 0.97 | % | | | 1.02 | % |
Net investment income (loss) | | | 4.64 | % | | | 2.46 | % | | | 2.32 | % | | | 3.27 | % | | | 3.24 | % |
Portfolio turnover rate(d) | | | 156 | % | | | 30 | % | | | 48 | % | | | 20 | % | | | 50 | % |
| (a) | Calculated based on average shares outstanding during the year. |
| (b) | Total return does not consider the effects of sales loads. Total return is calculated assuming a purchase of a share on the first day and a sale on the last day of each year reported and includes reinvestment of dividends and distributions, if any. Total returns may reflect adjustments to conform to GAAP. |
| (c) | Does not include expenses of the underlying funds in which the Fund invests. |
| (d) | The Fund’s portfolio turnover rate is calculated in accordance with regulatory requirements, without regard to transactions involving short-term investments, certain derivatives and in-kind transactions (if any). If such transactions were included, the Fund’s portfolio turnover rate may be higher. |
See Notes to Financial Statements.
PGIM Absolute Return Bond Fund 73
Financial Highlights (continued)
| | | | | | | | | | | | | | | | | | | | |
| | | | | | |
Class C Shares | | | | | | | | | | | | | | | | | | | | |
| | | Year Ended October 31, | |
| | | 2023 | | | 2022 | | | 2021 | | | 2020 | | | 2019 | |
| | | | | | |
Per Share Operating Performance(a): | | | | | | | | | | | | | | | | | | | | |
Net Asset Value, Beginning of Year | | | $8.82 | | | | $9.25 | | | | $8.97 | | | | $9.76 | | | | $9.85 | |
Income (loss) from investment operations: | | | | | | | | | | | | | | | | | | | | |
Net investment income (loss) | | | 0.34 | | | | 0.15 | | | | 0.15 | | | | 0.23 | | | | 0.24 | |
| Net realized and unrealized gain (loss) on investment and foreign currency transactions | | | 0.13 | | | | (0.43 | ) | | | 0.29 | | | | (0.48 | ) | | | 0.13 | |
Total from investment operations | | | 0.47 | | | | (0.28 | ) | | | 0.44 | | | | (0.25 | ) | | | 0.37 | |
Less Dividends and Distributions: | | | | | | | | | | | | | | | | | | | | |
Dividends from net investment income | | | (0.38 | ) | | | (0.15 | ) | | | (0.15 | ) | | | (0.20 | ) | | | (0.46 | ) |
Tax return of capital distributions | | | (0.02 | ) | | | - | | | | (0.01 | ) | | | (0.04 | ) | | | - | |
Distributions from net realized gains | | | - | | | | - | | | | - | | | | (0.30 | ) | | | - | |
Total dividends and distributions | | | (0.40 | ) | | | (0.15 | ) | | | (0.16 | ) | | | (0.54 | ) | | | (0.46 | ) |
Net asset value, end of year | | | $8.89 | | | | $8.82 | | | | $9.25 | | | | $8.97 | | | | $9.76 | |
Total Return(b): | | | 5.49 | % | | | (3.04 | )% | | | 5.03 | % | | | (2.70 | )% | | | 3.80 | % |
| | | | | | | | | | | | | | | | | | | | | |
| | | | | | |
Ratios/Supplemental Data: | | | | | | | | | | | | | | | | | | | | |
Net assets, end of year (000) | | | $25,851 | | | | $31,871 | | | | $42,635 | | | | $66,396 | | | | $103,133 | |
Average net assets (000) | | | $28,227 | | | | $36,300 | | | | $52,974 | | | | $86,229 | | | | $107,605 | |
Ratios to average net assets(c): | | | | | | | | | | | | | | | | | | | | |
Expenses after waivers and/or expense reimbursement | | | 1.78 | % | | | 1.75 | % | | | 1.73 | % | | | 1.73 | % | | | 1.78 | % |
Expenses before waivers and/or expense reimbursement | | | 1.78 | % | | | 1.75 | % | | | 1.73 | % | | | 1.73 | % | | | 1.78 | % |
Net investment income (loss) | | | 3.81 | % | | | 1.67 | % | | | 1.64 | % | | | 2.51 | % | | | 2.46 | % |
Portfolio turnover rate(d) | | | 156 | % | | | 30 | % | | | 48 | % | | | 20 | % | | | 50 | % |
| (a) | Calculated based on average shares outstanding during the year. |
| (b) | Total return does not consider the effects of sales loads. Total return is calculated assuming a purchase of a share on the first day and a sale on the last day of each year reported and includes reinvestment of dividends and distributions, if any. Total returns may reflect adjustments to conform to GAAP. |
| (c) | Does not include expenses of the underlying funds in which the Fund invests. |
| (d) | The Fund’s portfolio turnover rate is calculated in accordance with regulatory requirements, without regard to transactions involving short-term investments, certain derivatives and in-kind transactions (if any). If such transactions were included, the Fund’s portfolio turnover rate may be higher. |
See Notes to Financial Statements.
74
| | | | | | | | | | | | | | | | | | | | |
| | | | | | |
Class Z Shares | | | | | | | | | | | | | | | | | | | | |
| | | Year Ended October 31, | |
| | | 2023 | | | 2022 | | | 2021 | | | 2020 | | | 2019 | |
| | | | | | |
Per Share Operating Performance(a): | | | | | | | | | | | | | | | | | | | | |
Net Asset Value, Beginning of Year | | | $8.83 | | | | $9.26 | | | | $8.98 | | | | $9.77 | | | | $9.86 | |
Income (loss) from investment operations: | | | | | | | | | | | | | | | | | | | | |
Net investment income (loss) | | | 0.43 | | | | 0.25 | | | | 0.24 | | | | 0.32 | | | | 0.34 | |
| Net realized and unrealized gain (loss) on investment and foreign currency transactions | | | 0.15 | | | | (0.44 | ) | | | 0.29 | | | | (0.48 | ) | | | 0.13 | |
Total from investment operations | | | 0.58 | | | | (0.19 | ) | | | 0.53 | | | | (0.16 | ) | | | 0.47 | |
Less Dividends and Distributions: | | | | | | | | | | | | | | | | | | | | |
Dividends from net investment income | | | (0.48 | ) | | | (0.24 | ) | | | (0.24 | ) | | | (0.29 | ) | | | (0.56 | ) |
Tax return of capital distributions | | | (0.02 | ) | | | - | | | | (0.01 | ) | | | (0.04 | ) | | | - | |
Distributions from net realized gains | | | - | | | | - | | | | - | | | | (0.30 | ) | | | - | |
Total dividends and distributions | | | (0.50 | ) | | | (0.24 | ) | | | (0.25 | ) | | | (0.63 | ) | | | (0.56 | ) |
Net asset value, end of year | | | $8.91 | | | | $8.83 | | | | $9.26 | | | | $8.98 | | | | $9.77 | |
Total Return(b): | | | 6.71 | % | | | (2.03 | )% | | | 5.96 | % | | | (1.70 | )% | | | 5.00 | % |
| | | | | | | | | | | | | | | | | | | | | |
| | | | | | |
Ratios/Supplemental Data: | | | | | | | | | | | | | | | | | | | | |
Net assets, end of year (000) | | | $1,116,816 | | | | $1,108,186 | | | | $767,056 | | | | $1,071,124 | | | | $2,040,949 | |
Average net assets (000) | | | $1,020,990 | | | | $914,879 | | | | $833,908 | | | | $1,499,872 | | | | $2,155,699 | |
Ratios to average net assets(c): | | | | | | | | | | | | | | | | | | | | |
Expenses after waivers and/or expense reimbursement | | | 0.73 | % | | | 0.72 | % | | | 0.73 | % | | | 0.73 | % | | | 0.73 | % |
Expenses before waivers and/or expense reimbursement | | | 0.74 | % | | | 0.72 | % | | | 0.73 | % | | | 0.74 | % | | | 0.79 | % |
Net investment income (loss) | | | 4.83 | % | | | 2.81 | % | | | 2.64 | % | | | 3.53 | % | | | 3.51 | % |
Portfolio turnover rate(d) | | | 156 | % | | | 30 | % | | | 48 | % | | | 20 | % | | | 50 | % |
| (a) | Calculated based on average shares outstanding during the year. |
| (b) | Total return is calculated assuming a purchase of a share on the first day and a sale on the last day of each year reported and includes reinvestment of dividends and distributions, if any. Total returns may reflect adjustments to conform to GAAP. |
| (c) | Does not include expenses of the underlying funds in which the Fund invests. |
| (d) | The Fund’s portfolio turnover rate is calculated in accordance with regulatory requirements, without regard to transactions involving short-term investments, certain derivatives and in-kind transactions (if any). If such transactions were included, the Fund’s portfolio turnover rate may be higher. |
See Notes to Financial Statements.
PGIM Absolute Return Bond Fund 75
Financial Highlights (continued)
| | | | | | | | | | | | | | | | | | | | |
| | | | | | |
Class R6 Shares | | | | | | | | | | | | | | | | | | | | |
| | | Year Ended October 31, | |
| | | 2023 | | | 2022 | | | 2021 | | | 2020 | | | 2019 | |
| | | | | | |
Per Share Operating Performance(a): | | | | | | | | | | | | | | | | | | | | |
Net Asset Value, Beginning of Year | | | $8.79 | | | | $9.21 | | | | $8.93 | | | | $9.72 | | | | $9.82 | |
Income (loss) from investment operations: | | | | | | | | | | | | | | | | | | | | |
Net investment income (loss) | | | 0.44 | | | | 0.25 | | | | 0.26 | | | | 0.32 | | | | 0.35 | |
| Net realized and unrealized gain (loss) on investment and foreign currency transactions | | | 0.13 | | | | (0.42 | ) | | | 0.28 | | | | (0.48 | ) | | | 0.12 | |
Total from investment operations | | | 0.57 | | | | (0.17 | ) | | | 0.54 | | | | (0.16 | ) | | | 0.47 | |
Less Dividends and Distributions: | | | | | | | | | | | | | | | | | | | | |
Dividends from net investment income | | | (0.48 | ) | | | (0.25 | ) | | | (0.25 | ) | | | (0.29 | ) | | | (0.57 | ) |
Tax return of capital distributions | | | (0.02 | ) | | | - | | | | (0.01 | ) | | | (0.04 | ) | | | - | |
Distributions from net realized gains | | | - | | | | - | | | | - | | | | (0.30 | ) | | | - | |
Total dividends and distributions | | | (0.50 | ) | | | (0.25 | ) | | | (0.26 | ) | | | (0.63 | ) | | | (0.57 | ) |
Net asset value, end of year | | | $8.86 | | | | $8.79 | | | | $9.21 | | | | $8.93 | | | | $9.72 | |
Total Return(b): | | | 6.69 | % | | | (1.87 | )% | | | 6.07 | % | | | (1.66 | )% | | | 4.94 | % |
| | | | | | | | | | | | | | | | | | | | | |
| | | | | | |
Ratios/Supplemental Data: | | | | | | | | | | | | | | | | | | | | |
Net assets, end of year (000) | | | $62,859 | | | | $62,579 | | | | $60,135 | | | | $127,864 | | | | $82,538 | |
Average net assets (000) | | | $60,732 | | | | $60,251 | | | | $97,518 | | | | $109,540 | | | | $88,570 | |
Ratios to average net assets(c): | | | | | | | | | | | | | | | | | | | | |
Expenses after waivers and/or expense reimbursement | | | 0.65 | % | | | 0.65 | % | | | 0.64 | % | | | 0.65 | % | | | 0.70 | % |
Expenses before waivers and/or expense reimbursement | | | 0.65 | % | | | 0.65 | % | | | 0.64 | % | | | 0.65 | % | | | 0.71 | % |
Net investment income (loss) | | | 4.95 | % | | | 2.82 | % | | | 2.79 | % | | | 3.54 | % | | | 3.59 | % |
Portfolio turnover rate(d) | | | 156 | % | | | 30 | % | | | 48 | % | | | 20 | % | | | 50 | % |
| (a) | Calculated based on average shares outstanding during the year. |
| (b) | Total return is calculated assuming a purchase of a share on the first day and a sale on the last day of each year reported and includes reinvestment of dividends and distributions, if any. Total returns may reflect adjustments to conform to GAAP. |
| (c) | Does not include expenses of the underlying funds in which the Fund invests. |
| (d) | The Fund’s portfolio turnover rate is calculated in accordance with regulatory requirements, without regard to transactions involving short-term investments, certain derivatives and in-kind transactions (if any). If such transactions were included, the Fund’s portfolio turnover rate may be higher. |
See Notes to Financial Statements.
76
Notes to Financial Statements
Prudential Investment Portfolios 9 (the “Registered Investment Company” or “RIC”) is registered under the Investment Company Act of 1940, as amended (“1940 Act”), as an open-end management investment company. The RIC is organized as a Delaware Statutory Trust. These financial statements relate only to the PGIM Absolute Return Bond Fund (the “Fund”), a series of the RIC. The Fund is classified as a diversified fund for purposes of the 1940 Act.
The investment objective of the Fund is to seek positive returns over the long term, regardless of market conditions.
The Fund follows the investment company accounting and reporting guidance of the Financial Accounting Standards Board (“FASB”) Accounting Standard Codification (“ASC”) Topic 946 Financial Services — Investment Companies. The following is a summary of significant accounting policies followed by the Fund in the preparation of its financial statements. The policies conform to U.S. generally accepted accounting principles (“GAAP”). The Fund consistently follows such policies in the preparation of its financial statements.
Securities Valuation: The Fund holds securities and other assets and liabilities that are fair valued as of the close of each day (generally, 4:00 PM Eastern time) the New York Stock Exchange (“NYSE”) is open for trading. As described in further detail below, the Fund’s investments are valued daily based on a number of factors, including the type of investment and whether market quotations are readily available. The RIC’s Board of Trustees (the “Board”) has approved the Fund’s valuation policies and procedures for security valuation and designated PGIM Investments LLC (“PGIM Investments” or the “Manager”) as the “Valuation Designee,” as defined by Rule 2a-5(b) under the 1940 Act, to perform the fair value determination relating to all Fund investments. Pursuant to the Board’s oversight, the Valuation Designee has established a Valuation Committee to perform the duties and responsibilities as Valuation Designee under Rule 2a-5. The valuation procedures permit the Fund to utilize independent pricing vendor services, quotations from market makers, and alternative valuation methods when market quotations are either not readily available or not deemed representative of fair value. Fair value is the estimated price that would be received to sell an asset or paid to transfer a liability in an orderly transaction between market participants on the measurement date.
For the fiscal reporting year-end, securities and other assets and liabilities were fair valued at the close of the last U.S. business day. Trading in certain foreign securities may occur when the NYSE is closed (including weekends and holidays). Because such foreign securities
PGIM Absolute Return Bond Fund 77
Notes to Financial Statements (continued)
trade in markets that are open on weekends and U.S. holidays, the values of some of the Fund’s foreign investments may change on days when investors cannot purchase or redeem Fund shares.
Various inputs determine how the Fund’s investments are valued, all of which are categorized according to the three broad levels (Level 1, 2, or 3) detailed in the Schedule of Investments and referred to herein as the “fair value hierarchy” in accordance with FASB ASC Topic 820 — Fair Value Measurement.
Common or preferred stocks, exchange-traded funds (ETFs) and derivative instruments, if applicable, that are traded on a national securities exchange are valued at the last sale price as of the close of trading on the applicable exchange where the security principally trades. Securities traded via NASDAQ are valued at the NASDAQ official closing price. To the extent these securities are valued at the last sale price or NASDAQ official closing price, they are classified as Level 1 in the fair value hierarchy. In the event that no sale or official closing price on a valuation date exists, these securities are generally valued at the mean between the last reported bid and ask prices, or at the last bid price in the absence of an ask price. These securities are classified as Level 2 in the fair value hierarchy.
Investments in open-end funds (other than ETFs) are valued at their net asset values as of the close of the NYSE on the date of valuation. These securities are classified as Level 1 in the fair value hierarchy since they may be purchased or sold at their net asset values on the date of valuation.
Fixed income securities traded in the OTC market are generally classified as Level 2 in the fair value hierarchy. Such fixed income securities are typically valued using the market approach which generally involves obtaining data from an approved independent third-party vendor source. The Fund utilizes the market approach as the primary method to value securities when market prices of identical or comparable instruments are available. The third-party vendors’ valuation techniques used to derive the evaluated bid price are based on evaluating observable inputs, including but not limited to, yield curves, yield spreads, credit ratings, deal terms, tranche level attributes, default rates, cash flows, prepayment speeds, broker/dealer quotations and reported trades. Certain Level 3 securities are also valued using the market approach when obtaining a single broker quote or when utilizing transaction prices for identical securities that have been used in excess of five business days. During the reporting period, there were no changes to report with respect to the valuation approach and/or valuation techniques discussed above.
Floating rate and other loans are generally valued at prices provided by approved independent pricing vendors. The pricing vendors utilize broker/dealer quotations and provide prices based on the average of such quotations. Floating rate and other loans valued
78
using such vendor prices are generally classified as Level 2 in the fair value hierarchy. Floating rate and other loans valued based on a single broker quote or at the original transaction price in excess of five business days are classified as Level 3 in the fair value hierarchy.
OTC and centrally cleared derivative instruments are generally classified as Level 2 in the fair value hierarchy. Such derivative instruments are typically valued using the market approach and/or income approach which generally involves obtaining data from an approved independent third-party vendor source. The Fund utilizes the market approach when quoted prices in broker-dealer markets are available but also includes consideration of alternative valuation approaches, including the income approach. In the absence of reliable market quotations, the income approach is typically utilized for purposes of valuing derivatives such as interest rate swaps based on a discounted cash flow analysis whereby the value of the instrument is equal to the present value of its future cash inflows or outflows. Such analysis includes projecting future cash flows and determining the discount rate (including the present value factors that affect the discount rate) used to discount the future cash flows. In addition, the third-party vendors’ valuation techniques used to derive the evaluated derivative price is based on evaluating observable inputs, including but not limited to, underlying asset prices, indices, spreads, interest rates and exchange rates. Certain derivatives may be classified as Level 3 when valued using the market approach by obtaining a single broker quote or when utilizing unobservable inputs in the income approach. During the reporting period, there were no changes to report with respect to the valuation approach and/or valuation techniques discussed above.
Securities and other assets that cannot be priced according to the methods described above are valued based on policies and procedures approved by the Board. In the event that unobservable inputs are used when determining such valuations, the securities will be classified as Level 3 in the fair value hierarchy. Altering one or more unobservable inputs may result in a significant change to a Level 3 security’s fair value measurement.
When determining the fair value of securities, some of the factors influencing the valuation include: the nature of any restrictions on disposition of the securities; assessment of the general liquidity of the securities; the issuer’s financial condition and the markets in which it does business; the cost of the investment; the size of the holding and the capitalization of the issuer; the prices of any recent transactions or bids/offers for such securities or any comparable securities; and any available analyst media or other reports or information deemed reliable by the Valuation Designee regarding the issuer or the markets or industry in which it operates. Using fair value to price securities may result in a value that is different from a security’s most recent closing price and from the price used by other unaffiliated mutual funds to calculate their net asset values.
Foreign Currency Translation: The books and records of the Fund are maintained in U.S. dollars. Foreign currency amounts are translated into U.S. dollars on the following basis:
PGIM Absolute Return Bond Fund 79
Notes to Financial Statements (continued)
(i) market value of investment securities, other assets and liabilities — at the exchange rate as of the valuation date;
(ii) purchases and sales of investment securities, income and expenses — at the rates of exchange prevailing on the respective dates of such transactions.
Although the net assets of the Fund are presented at the foreign exchange rates and market values at the close of the period, the Fund does not generally isolate that portion of the results of operations arising as a result of changes in the foreign exchange rates from the fluctuations arising from changes in the market prices of long-term portfolio securities held at the end of the period. Similarly, the Fund does not isolate the effect of changes in foreign exchange rates from the fluctuations arising from changes in the market prices of long-term portfolio securities sold during the period. Accordingly, holding period unrealized and realized foreign currency gains (losses) are included in the reported net change in unrealized appreciation (depreciation) on investments and net realized gains (losses) on investment transactions on the Statements of Operations. Notwithstanding the above, the Fund does isolate the effect of fluctuations in foreign currency exchange rates when determining the gain (loss) upon the sale or maturity of foreign currency denominated debt obligations; such amounts are included in net realized gains (losses) on foreign currency transactions.
Additionally, net realized gains (losses) on foreign currency transactions represent net foreign exchange gains (losses) from the disposition of holdings of foreign currencies, currency gains (losses) realized between the trade and settlement dates on investment transactions, and the difference between the amounts of interest, dividends and foreign withholding taxes recorded on the Fund’s books and the U.S. dollar equivalent amounts actually received or paid. Net unrealized currency gains (losses) arise from valuing foreign currency denominated assets and liabilities (other than investments) at period end exchange rates.
Forward and Cross Currency Contracts: A forward currency contract is a commitment to purchase or sell a foreign currency at a future date at a negotiated forward rate. The Fund enters into forward currency contracts, as defined in the prospectus, in order to hedge its exposure to changes in foreign currency exchange rates on its foreign portfolio holdings or on specific receivables and payables denominated in a foreign currency and to gain exposure to certain currencies. The contracts are valued daily at current forward exchange rates and any unrealized gain (loss) is included in net unrealized appreciation or depreciation on forward and cross currency contracts. Gain (loss) is realized on the settlement date of the contract equal to the difference between the settlement value of the original and negotiated forward contracts. This gain (loss), if any, is included in net realized gain (loss) on forward and cross currency contract transactions. Risks may arise upon
80
entering into these contracts from the potential inability of the counterparties to meet the terms of their contracts. Forward currency contracts involve risks from currency exchange rate and credit risk in excess of the amounts reflected on the Statement of Assets and Liabilities. The Fund’s maximum risk of loss from counterparty credit risk is the net value of the cash flows to be received from the counterparty at the end of the contract’s life. A cross currency contract is a forward contract where a specified amount of one foreign currency will be exchanged for a specified amount of another foreign currency.
Options: The Fund purchased and/or wrote options in order to hedge against adverse market movements or fluctuations in value caused by changes in prevailing interest rates, value of equities or foreign currency exchange rates with respect to securities or financial instruments which the Fund currently owns or intends to purchase. The Fund may also use options to gain additional market exposure. The Fund’s principal reason for writing options is to realize, through receipt of premiums, a greater current return than would be realized on the underlying security alone. When the Fund purchases an option, it pays a premium and an amount equal to that premium is recorded as an asset. When the Fund writes an option, it receives a premium and an amount equal to that premium is recorded as a liability. The asset or liability is adjusted daily to reflect the current market value of the option. If an option expires unexercised, the Fund realizes a gain (loss) to the extent of the premium received or paid. If an option is exercised, the premium received or paid is recorded as an adjustment to the proceeds from the sale or the cost of the purchase in determining whether the Fund has realized a gain (loss). The difference between the premium and the amount received or paid at the closing of a purchase or sale transaction is also treated as a realized gain (loss). Gain (loss) on purchased options is included in net realized gain (loss) on investment transactions. Gain (loss) on written options is presented separately as net realized gain (loss) on options written transactions.
The Fund, as writer of an option, may have no control over whether the underlying securities or financial instruments may be sold (called) or purchased (put). As a result, the Fund bears the market risk of an unfavorable change in the price of the security or financial instrument underlying the written option. The Fund, as purchaser of an OTC option, bears the risk of the potential inability of the counterparties to meet the terms of their contracts. With exchange-traded options contracts, there is minimal counterparty credit risk to the Fund since the exchanges’ clearinghouse acts as counterparty to all exchange-traded options and guarantees the options contracts against default.
When the Fund writes an option on a swap, an amount equal to any premium received by the Fund is recorded as a liability and is subsequently adjusted to the current market value of the written option on the swap. If a call option on a swap is exercised, the Fund becomes obligated to pay a fixed interest rate (noted as the strike price) and receive a variable interest rate on a notional amount. If a put option on a swap is exercised, the Fund becomes obligated to pay a variable interest rate and receive a fixed interest rate (noted as the strike price) on a notional amount. Premiums received from writing options on swaps that expire or are exercised are treated as realized gains upon the expiration or exercise of such options on swaps. The risk associated with writing put and call options on swaps is that the Fund will be
PGIM Absolute Return Bond Fund 81
Notes to Financial Statements (continued)
obligated to be party to a swap agreement if an option on a swap is exercised. The Fund entered into options on swaps that are executed through a central clearing facility, such as a registered exchange. Such options pay or receive an amount known as “variation margin”, based on daily changes in the valuation of the contract. The daily variation margin, rather than the contract market value, is recorded for financial statement purposes on the Statement of Assets and Liabilities.
Financial Futures Contracts: A financial futures contract is an agreement to purchase (long) or sell (short) an agreed amount of securities at a set price for delivery on a future date. Upon entering into a financial futures contract, the Fund is required to pledge to the broker an amount of cash and/or other assets equal to a certain percentage of the contract amount. This amount is known as the “initial margin.” Subsequent payments, known as “variation margin,” are made or received by the Fund each day, depending on the daily fluctuations in the value of the underlying security. Such variation margin is recorded for financial statement purposes on a daily basis as unrealized gain (loss). When the contract expires or is closed, the gain (loss) is realized and is presented in the Statement of Operations as net realized gain (loss) on futures transactions.
The Fund invested in financial futures contracts in order to hedge its existing portfolio securities, or securities the Fund intends to purchase, against fluctuations in value caused by changes in prevailing interest rates. Should interest rates move unexpectedly, the Fund may not achieve the anticipated benefits of the financial futures contracts and may realize a loss. The use of futures transactions involves the risk of imperfect correlation in movements in the price of futures contracts, interest rates and the underlying hedged assets. Since futures contracts are exchange-traded, there is minimal counterparty credit risk to the Fund since the exchanges’ clearinghouse acts as counterparty to all exchange-traded futures and guarantees the futures contracts against default.
Swap Agreements: The Fund entered into certain types of swap agreements detailed in the disclosures below. A swap agreement is an agreement to exchange the return generated by one instrument for the return generated by another instrument. Swap agreements are negotiated in the OTC market and may be executed either directly with a counterparty (“OTC-traded”) or through a central clearing facility, such as a registered exchange. Swap agreements are valued daily at current market value and any change in value is included in the net unrealized appreciation or depreciation on swap agreements. Centrally cleared swaps pay or receive an amount known as “variation margin”, based on daily changes in the valuation of the swap contract. For OTC-traded, upfront premiums paid and received are shown as swap premiums paid and swap premiums received in the Statement of Assets and Liabilities. Risk of loss may exceed amounts recognized on the Statement of Assets and Liabilities. Swap agreements outstanding at period end, if any, are listed on the Schedule of Investments.
82
Interest Rate Swaps: Interest rate swaps represent an agreement between counterparties to exchange cash flows based on the difference between two interest rates, applied to a notional principal amount for a specified period. The Fund is subject to interest rate risk exposure in the normal course of pursuing its investment objective. The Fund used interest rate swaps to maintain its ability to generate steady cash flow by receiving a stream of fixed rate payments or to increase exposure to prevailing market rates by receiving floating rate payments. The Fund’s maximum risk of loss from counterparty credit risk is the discounted net present value of the cash flows to be received from the counterparty over the contract’s remaining life.
Credit Default Swaps (“CDS”): CDS involve one party (the protection buyer) making a stream of payments to another party (the protection seller) in exchange for the right to receive a specified payment in the event of a default or as a result of a default (collectively a “credit event”) for the referenced entity (typically corporate issues or sovereign issues of an emerging country) on its obligation; or in the event of a write-down, principal shortfall, interest shortfall or default of all or part of the referenced entities comprising a credit index.
The Fund is subject to credit risk in the normal course of pursuing its investment objectives, and as such, has entered into CDS contracts to provide a measure of protection against defaults or to take an active long or short position with respect to the likelihood of a particular issuer’s default or the reference entity’s credit soundness. CDS contracts generally trade based on a spread which represents the cost a protection buyer has to pay the protection seller. The protection buyer is said to be “short the credit” because the higher the contract value rises, the more the credit deteriorates. The value of the CDS contract increases for the protection buyer if the spread increases. The Fund’s maximum risk of loss from counterparty credit risk for purchased CDS is the inability of the counterparty to honor the contract up to the notional value due to a credit event.
As a seller of protection on credit default swap agreements, the Fund generally receives an agreed upon payment from the buyer of protection throughout the term of the swap, provided no credit event occurs. As the seller, the Fund effectively increases its investment risk because, in addition to its total net assets, the Fund may be subject to investment exposure on the notional amount of the swap.
The maximum amount of the payment that the Fund, as a seller of protection, could be required to make under a credit default swap agreement would be equal to the notional amount of the underlying security or index contract as a result of a credit event. This potential amount will be partially offset by any recovery values of the respective referenced obligations or net amounts received from the settlement of buy protection credit default swap agreements which the Fund entered into for the same referenced entity or index. As a buyer of protection, the Fund generally receives an amount up to the notional value of the swap if a credit event occurs.
Implied credit spreads, represented in absolute terms, utilized in determining the market value of credit default swap agreements where the Fund is the seller of protection as of
PGIM Absolute Return Bond Fund 83
Notes to Financial Statements (continued)
period end are disclosed in the footnotes to the Schedule of Investments, if applicable. These spreads serve as indicators of the current status of the payment/performance risk and represent the likelihood of default risk for the credit derivative. The implied credit spread of a particular referenced entity reflects the cost of buying/selling protection and may include upfront payments required to enter into the agreement. Wider credit spreads and increased market value in absolute terms, when compared to the notional amount of the swap, represent a deterioration of the referenced entity’s credit soundness and a greater likelihood of risk of default or other credit event occurring as defined under the terms of the agreement.
Total Return Swaps: In a total return swap, one party receives payments based on the market value of the security or the commodity involved, or total return of a specific referenced asset, such as an equity, index or bond, and in return pays a defined amount. The Fund is subject to risk exposures associated with the referenced asset in the normal course of pursuing its investment objectives. The Fund entered into total return swaps to manage its exposure to a security or an index. The Fund’s maximum risk of loss from counterparty credit risk is the change in the value of the security, in the Fund’s favor, from the point of entering into the contract.
Floating Rate and Other Loans: The Fund invested in floating rate and other loans. Floating rate and other loans include loans that are privately negotiated between a corporate borrower and one or more financial institutions, including, but not limited to, term loans, revolvers, and other instruments issued in the floating rate and other loans market. The Fund acquires interests in loans directly (by way of assignment from the selling institution) and/or indirectly (by way of the purchase of a participation interest from the selling institution). Under a floating rate and other loans assignment, the Fund generally will succeed to all the rights and obligations of an assigning lending institution and becomes a lender under the loan agreement with the relevant borrower in connection with that loan. Under a floating rate and other loans participation, the Fund generally will have a contractual relationship only with the lender, not with the relevant borrower. As a result, the Fund generally will have the right to receive payments of principal, interest, and any fees to which it is entitled only from the lender selling the participation and only upon receipt by the lender of the payments from the relevant borrower. The Fund may not directly benefit from the collateral supporting the debt obligation in which it has purchased the participation. As a result, the Fund will assume the credit risk of both the borrower and the institution selling the participation to the Fund.
Mortgage-Backed and Asset-Backed Securities: Mortgage-backed securities are pass-through securities, meaning that principal and interest payments made by the borrower on the underlying mortgages are passed through to the Fund. Asset-backed securities directly or indirectly represent a participation interest in, or are secured by and
84
payable from, a stream of payments generated by particular assets such as motor vehicle or credit card receivables. Asset-backed securities may be classified as pass-through certificates or collateralized obligations, such as collateralized bond obligations, collateralized loan obligations and other similarly structured securities. The value of mortgage-backed and asset-backed securities varies with changes in interest rates and may be affected by changes in credit quality or value of the mortgage loans or other assets that support the securities.
Stripped mortgage-backed securities are usually structured with two classes that receive different proportions of the interest (“IO”) and principal (“PO”) distributions on a pool of mortgage assets. Payments received for IOs are included in interest income on the Statements of Operations. Because no principal will be received at the maturity of an IO, adjustments are made to the cost of the security on a monthly basis until maturity. These adjustments are included in interest income on the Statements of Operations. Payments received for POs are treated as reductions to the cost and par value of the securities.
Master Netting Arrangements: The RIC, on behalf of the Fund, is subject to various Master Agreements, or netting arrangements, with select counterparties. These are agreements which a subadviser may have negotiated and entered into on behalf of all or a portion of the Fund. A master netting arrangement between the Fund and the counterparty permits the Fund to offset amounts payable by the Fund to the same counterparty against amounts to be received and by the receipt of collateral from the counterparty by the Fund to cover the Fund’s exposure to the counterparty. However, there is no assurance that such mitigating factors are easily enforceable. In addition to master netting arrangements, the right to set-off exists when all the conditions are met such that each of the parties owes the other determinable amounts, the reporting party has the right to set-off the amount owed with the amount owed by the other party, the reporting party intends to set-off and the right of set-off is enforceable by law.
The RIC, on behalf of the Fund, is a party to International Swaps and Derivatives Association, Inc. (“ISDA”) Master Agreements with certain counterparties that govern OTC derivative and foreign exchange contracts entered into from time to time. The Master Agreements may contain provisions regarding, among other things, the parties’ general obligations, representations, agreements, collateral requirements, events of default and early termination. With respect to certain counterparties, in accordance with the terms of the Master Agreements, collateral posted to the Fund is held in a segregated account by the Fund’s custodian and with respect to those amounts which can be sold or re-pledged, is presented in the Schedule of Investments. Collateral pledged by the Fund is segregated by the Fund’s custodian and identified in the Schedule of Investments. Collateral can be in the form of cash or debt securities issued by the U.S. Government or related agencies or other securities as agreed to by the Fund and the applicable counterparty. Collateral requirements are determined based on the Fund’s net position with each counterparty. Termination events applicable to the Fund may occur upon a decline in the Fund’s net assets below a specified threshold over a certain period of time. Termination events applicable to counterparties may occur upon a decline in the counterparty’s long-term and short-term credit ratings below a
PGIM Absolute Return Bond Fund 85
Notes to Financial Statements (continued)
specified level. In each case, upon occurrence, the other party may elect to terminate early and cause settlement of all derivative and foreign exchange contracts outstanding, including the payment of any losses and costs resulting from such early termination, as reasonably determined by the terminating party. Any decision by one or more of the Fund’s counterparties to elect early termination could impact the Fund’s future derivative activity.
In addition to each instrument’s primary underlying risk exposure (e.g. interest rate, credit, equity or foreign exchange, etc.), swap agreements involve, to varying degrees, elements of credit, market and documentation risk. Such risks involve the possibility that no liquid market for these agreements will exist, the counterparty to the agreement may default on its obligation to perform or disagree on the contractual terms of the agreement, and changes in net interest rates will be unfavorable. In connection with these agreements, securities in the portfolio may be identified or received as collateral from the counterparty in accordance with the terms of the respective swap agreements to provide or receive assets of value and to serve as recourse in the event of default or bankruptcy/insolvency of either party. Such OTC derivative agreements include conditions which, when materialized, give the counterparty the right to cause an early termination of the transactions under those agreements. Any election by the counterparty for early termination of the contract(s) may impact the amounts reported on financial statements.
Short sales and OTC contracts, including forward foreign currency exchange contracts, swaps, forward rate agreements and written options involve elements of both market and credit risk in excess of the amounts reflected on the Statement of Assets and Liabilities, if applicable. Such risks may be mitigated by engaging in master netting arrangements.
Rights: The Fund held rights acquired either through a direct purchase or pursuant to corporate actions. Rights entitle the holder to buy a proportionate amount of common stock, or such other security that the issuer may specify, at a specific price and time through the expiration dates. Such rights are held as long positions by the Fund until exercised, sold or expired. Rights are valued at fair value in accordance with the Board approved fair valuation procedures.
Payment-In-Kind: The Fund invested in the open market or received pursuant to debt restructuring securities that pay-in-kind (PIK) the interest due on such debt instruments. The PIK interest, computed at the contractual rate specified, is added to the existing principal balance of the debt when issued bonds have the same terms as the bond or recorded as a separate bond when terms are different from the existing debt, and is recorded as interest income.
Securities Lending: The Fund lends its portfolio securities to banks and broker-dealers. The loans are secured by collateral at least equal to the market value of the securities loaned.
86
Collateral pledged by each borrower is invested in an affiliated money market fund and is marked to market daily, based on the previous day’s market value, such that the value of the collateral exceeds the value of the loaned securities. In the event of significant appreciation in value of the securities on loan on the last business day of the reporting period, the financial statements may reflect a collateral value that is less than the market value of the loaned securities. Such shortfall is remedied as described above. Loans are subject to termination at the option of the borrower or the Fund. Upon termination of the loan, the borrower will return to the Fund securities identical to the loaned securities. The remaining open loans of the securities lending transactions are considered overnight and continuous. Should the borrower of the securities fail financially, the Fund has the right to repurchase the securities in the open market using the collateral.
The Fund recognizes income, net of any rebate and securities lending agent fees, for lending its securities in the form of fees or interest on the investment of any cash received as collateral. The borrower receives all interest and dividends from the securities loaned and such payments are passed back to the lender in amounts equivalent thereto, which are reflected in interest income or unaffiliated dividend income based on the nature of the payment on the Statement of Operations. The Fund also continues to recognize any unrealized gain (loss) in the market price of the securities loaned and on the change in the value of the collateral invested that may occur during the term of the loan. In addition, realized gain (loss) is recognized on changes in the value of the collateral invested upon liquidation of the collateral. Net earnings from securities lending are disclosed in the Statement of Operations.
Mortgage Dollar Rolls: The Fund entered into mortgage dollar rolls in which the Fund sell mortgage securities for delivery in the current month, realizing a gain (loss), and simultaneously enter into contracts to repurchase somewhat similar (same type, coupon and maturity) securities on a specified future date. During the roll period, the Fund forgoes principal and interest paid on the securities. The Fund is compensated by the interest earned on the cash proceeds of the initial sale and by the lower repurchase price at the future date. The difference between the sale proceeds and the lower repurchase price is recorded as a realized gain on investment transactions. The Fund maintains a segregated account, the dollar value of which is at least equal to its obligations, with respect to dollar rolls. The Fund is subject to the risk that the market value of the securities the Fund is obligated to repurchase under the agreement may decline below the repurchase price.
Securities Transactions and Net Investment Income: Securities transactions are recorded on the trade date. Realized gains (losses) from investment and currency transactions are calculated on the specific identification method. Dividend income is recorded on the ex-date, or for certain foreign securities, when the Fund becomes aware of such dividends. Interest income, including amortization of premium and accretion of discount on debt securities, as required, is recorded on the accrual basis. Expenses are recorded on an accrual basis, which may require the use of certain estimates by management that may differ from actual expense amounts. Net investment income or loss (other than class specific expenses and waivers, which are allocated as noted below) and unrealized and
PGIM Absolute Return Bond Fund 87
Notes to Financial Statements (continued)
realized gains (losses) are allocated daily to each class of shares based upon the relative proportion of adjusted net assets of each class at the beginning of the day. Class specific expenses and waivers, where applicable, are charged to the respective share classes. Such class specific expenses and waivers include distribution fees and distribution fee waivers, shareholder servicing fees, transfer agent’s fees and expenses, registration fees and fee waivers and/or expense reimbursements, as applicable.
Taxes: It is the Fund’s policy to continue to meet the requirements of the Internal Revenue Code applicable to regulated investment companies and to distribute all of its taxable net investment income and capital gains, if any, to its shareholders. Therefore, no federal income tax provision is required. Withholding taxes on foreign dividends, interest and capital gains, if any, are recorded, net of reclaimable amounts, at the time the related income is earned.
Dividends and Distributions: Dividends and distributions to shareholders, which are determined in accordance with federal income tax regulations and which may differ from GAAP, are recorded on the ex-date. Permanent book/tax differences relating to income and gain (loss) are reclassified between total distributable earnings (loss) and paid-in capital in excess of par, as appropriate. The chart below sets forth the expected frequency of dividend and capital gains distributions to shareholders. Various factors may impact the frequency of dividend distributions to shareholders, including but not limited to adverse market conditions or portfolio holding-specific events.
| | | | |
| Expected Distribution Schedule to Shareholders* | | Frequency | |
Net Investment Income | | | Monthly | |
Short-Term Capital Gains | | | Annually | |
Long-Term Capital Gains | | | Annually | |
| * | Under certain circumstances, the Fund may make more than one distribution of short-term and/or long-term capital gains during a fiscal year. |
Estimates: The preparation of financial statements requires management to make estimates and assumptions that affect the reported amounts and disclosures in the financial statements. Actual results could differ from those estimates.
The RIC, on behalf of the Fund, has a management agreement with the Manager pursuant to which it has responsibility for all investment advisory services, including supervision of the subadviser’s performance of such services, and for rendering administrative services.
88
The Manager has entered into a subadvisory agreement with PGIM, Inc., which provides subadvisory services to the Fund through its business unit PGIM Fixed Income, and PGIM Limited (collectively the “subadviser”). The Manager pays for the services of the subadviser.
Fees payable under the management agreement are computed daily and paid monthly. For the reporting period ended October 31, 2023, the contractual and effective management fee rates were as follows:
| | | | |
| Contractual Management Rate | | Effective Management Fee, before any waivers and/or expense reimbursements | |
0.590% of average daily net assets up to $2.5 billion; | | | 0.59% | |
0.565% of average daily net assets from $2.5 billion to $5 billion; | | | | |
0.540% of average daily net assets over $5 billion. | | | | |
The Manager has contractually agreed, through February 28, 2025, to limit total annual operating expenses after fee waivers and/or expense reimbursements. This contractual waiver excludes interest, brokerage, taxes (such as income and foreign withholdings taxes, stamp duty and deferred tax expenses), acquired fund fees and expenses, extraordinary expenses, and certain other Fund expenses such as dividend and interest expense and broker charges on short sales.
Where applicable, the Manager agrees to waive management fees or shared operating expenses on any share class to the same extent that it waives such expenses on any other share class. In addition, total annual operating expenses for Class R6 shares will not exceed total annual operating expenses for Class Z shares. Fees and/or expenses waived and/or reimbursed by the Manager for the purpose of preventing the expenses from exceeding a certain expense ratio limit may be recouped by the Manager within the same fiscal year during which such waiver and/or reimbursement is made if such recoupment can be realized without exceeding the expense limit in effect at the time of the recoupment for that fiscal year. The expense limitations attributable to each class are as follows:
| | | | |
| Class | | Expense
Limitations |
A | | | — | % |
C | | | — | |
Z | | | 0.73 | |
R6 | | | 0.70 | |
The RIC, on behalf of the Fund, has a distribution agreement with Prudential Investment Management Services LLC (“PIMS”), which acts as the distributor of the Class A, Class C, Class Z and Class R6 shares of the Fund. The Fund compensates PIMS for distributing and servicing the Fund’s Class A and Class C shares, pursuant to the plans of distribution (the “Distribution Plans”), regardless of expenses actually incurred by PIMS.
PGIM Absolute Return Bond Fund 89
Notes to Financial Statements (continued)
Pursuant to the Distribution Plans, the Fund compensates PIMS for distribution related activities at an annual rate based on average daily net assets per class. The distribution fees are accrued daily and payable monthly.
The Fund’s annual gross and net distribution rates, where applicable, are as follows:
| | | | |
| Class | | Gross Distribution Fee | | Net Distribution Fee |
A | | 0.25% | | 0.25% |
C | | 1.00 | | 1.00 |
Z | | N/A | | N/A |
R6 | | N/A | | N/A |
For the year ended October 31, 2023, PIMS received front-end sales charges (“FESL”) resulting from sales of certain class shares and contingent deferred sales charges (“CDSC”) imposed upon redemptions by certain shareholders. From these fees, PIMS paid such sales charges to broker-dealers, who in turn paid commissions to salespersons and incurred other distribution costs. The sales charges are as follows where applicable:
| | | | | | | | | | |
| Class | | FESL | | | | | | CDSC |
A | | $ | 55,330 | | | | | | | $ 52 |
C | | | — | | | | | | | 3,663 |
PGIM Investments, PGIM, Inc., PGIM Limited and PIMS are indirect, wholly-owned subsidiaries of Prudential Financial, Inc. (“Prudential”).
| 4. | Other Transactions with Affiliates |
Prudential Mutual Fund Services LLC (“PMFS”), an affiliate of PGIM Investments and an indirect, wholly-owned subsidiary of Prudential, serves as the Fund’s transfer agent and shareholder servicing agent. Transfer agent’s and shareholder servicing agent’s fees and expenses in the Statement of Operations include certain out-of-pocket expenses paid to non-affiliates, where applicable.
The Fund may invest its overnight sweep cash in the PGIM Core Government Money Market Fund (the “Core Government Fund”), a series of the Prudential Government Money Market Fund, Inc., and its securities lending cash collateral in the PGIM Institutional Money Market Fund (the “Money Market Fund”), a series of Prudential Investment Portfolios 2, each registered under the 1940 Act and managed by PGIM Investments. The Fund may also invest in the PGIM Core Short-Term Bond Fund (together with the Core Government Fund, the “Core Funds”), a series of Prudential Investment Portfolios 2, registered under the 1940 Act and managed by PGIM Investments, pursuant to an exemptive order received from the Securities and Exchange Commission (“SEC”). PGIM Investments and/or its affiliates are paid fees or reimbursed for providing their services to the Core Funds and the Money
90
Market Fund. In addition to the realized and unrealized gains on investments in the Core Funds and the Money Market Fund, earnings from such investments are disclosed on the Statement of Operations as “Affiliated dividend income” and “Income from securities lending, net”, respectively.
The Fund may enter into certain securities purchase or sale transactions under Board approved Rule 17a-7 procedures. Rule 17a-7 is an exemptive rule under the 1940 Act that, subject to certain conditions, permits purchase and sale transactions among affiliated investment companies, or between an investment company and a person that is affiliated solely by reason of having a common (or affiliated) investment adviser, common directors/trustees, and/or common officers. For the year ended October 31, 2023, no Rule 17a-7 transactions were entered into by the Fund.
The aggregate cost of purchases and proceeds from sales of portfolio securities (excluding short-term investments and U.S. Government securities) for the reporting period ended October 31, 2023, were as follows:
| | | | |
| | | |
| Cost of Purchases | | | | Proceeds from Sales |
$1,399,533,250 | | | | $1,288,812,232 |
A summary of the cost of purchases and proceeds from sales of shares of affiliated mutual funds for the year ended October 31, 2023, is presented as follows:
| | | | | | | | | | | | | | | | | | | | | | | | | | | | |
Value,
Beginning
of Year | | Cost of Purchases | | | Proceeds from Sales | | | Change in Unrealized Gain (Loss) | | Realized Gain (Loss) | | | Value, End of Year | | | Shares, End of Year | | | Income | |
|
Short-Term Investments - Affiliated Mutual Funds: | |
|
PGIM Core Government Money Market Fund(1)(wb) | |
$ — | | | $428,783,417 | | | | $414,044,721 | | | | $ — | | | | $ — | | | | $ 14,738,696 | | | | 14,738,696 | | | | $ 741,304 | |
|
PGIM Core Short-Term Bond Fund(1)(wb) | |
109,571,168 | | | 5,820,006 | | | | — | | | | 360,400 | | | | — | | | | 115,751,574 | | | | 12,678,157 | | | | 5,820,006 | |
|
PGIM Institutional Money Market Fund(1)(b)(wb) | |
24,336,247 | | | 183,515,189 | | | | 194,630,491 | | | | 3,905 | | | | 5,749 | | | | 13,230,599 | | | | 13,237,217 | | | | 107,075 | (2) |
$133,907,415 | | | $618,118,612 | | | | $608,675,212 | | | | $364,305 | | | | $5,749 | | | | $143,720,869 | | | | | | | | $6,668,385 | |
| (1) | The Fund did not have any capital gain distributions during the reporting period. |
| (2) | The amount, or a portion thereof, represents the affiliated securities lending income shown on the Statement of Operations. |
| (b) | Represents security, or portion thereof, purchased with cash collateral received for securities on loan and includes dividend reinvestment. |
| (wb) | Represents an investment in a Fund affiliated with the Manager. |
PGIM Absolute Return Bond Fund 91
Notes to Financial Statements (continued)
| 6. | Distributions and Tax Information |
Distributions to shareholders, which are determined in accordance with federal income tax regulations and which may differ from GAAP, are recorded on the ex-date.
For the year ended October 31, 2023, the tax character of dividends paid as reflected in the Statement of Changes in Net Assets were as follows:
| | | | | | |
Ordinary
Income | | Long-Term Capital Gains | | Tax Return of Capital | | Total Dividends and Distributions |
| $64,803,658 | | $— | | $2,375,806 | | $67,179,464 |
For the year ended October 31, 2022, the tax character of dividends paid as reflected in the Statement of Changes in Net Assets were as follows:
| | | | | | |
Ordinary
Income | | Long-Term Capital Gains | | Tax Return of Capital | | Total Dividends
and Distributions |
| $29,762,186 | | $— | | $— | | $29,762,186 |
For the year ended October 31, 2023, the Fund had the following amounts of accumulated undistributed earnings on a tax basis:
| | |
| | |
Undistributed
Ordinary
Income | | Undistributed Long-Term Capital Gains |
$— | | $— |
The United States federal income tax basis of the Fund’s investments and the net unrealized depreciation as of October 31, 2023 were as follows:
| | | | | | |
| Tax Basis | | Gross Unrealized Appreciation | | Gross Unrealized Depreciation | | Net Unrealized Depreciation |
| $1,367,166,089 | | $49,922,045 | | $(108,462,523) | | $(58,540,478) |
The differences between GAAP and tax basis were primarily attributable to deferred losses on wash sales, swaps, mark-to-market of futures and forwards contracts, difference in the treatment of premium amortization and investment in partnerships.
For federal income tax purposes, the Fund had an approximated capital loss carryforward as of October 31, 2023 which can be carried forward for an unlimited period. No capital gains
92
distributions are expected to be paid to shareholders until net gains have been realized in excess of such losses.
| | |
Capital Loss
Carryforward | | Capital Loss Carryforward Utilized |
$199,874,000 | | $— |
The Manager has analyzed the Fund’s tax positions taken on federal, state and local income tax returns for all open tax years and has concluded that no provision for income tax is required in the Fund’s financial statements for the current reporting period. Since tax authorities can examine previously filed tax returns, the Fund’s U.S. federal and state tax returns for each of the four fiscal years up to the most recent fiscal year ended October 31, 2023 are subject to such review.
7. Capital and Ownership
The Fund offers Class A, Class C, Class Z and Class R6 shares. Class A shares are sold with a maximum front-end sales charge of 3.25%. Investors who purchase $500,000 or more of Class A shares and sell those shares within 12 months of purchase are subject to a CDSC of 1% on sales although these purchases are not subject to a front-end sales charge. The Class A CDSC is waived for certain retirement and/or benefit plans. A special exchange privilege is also available for shareholders who qualified to purchase Class A shares at net asset value. Class C shares are sold with a CDSC of 1% on sales made within 12 months of purchase. Class C shares will automatically convert to Class A shares on a monthly basis approximately eight years (ten years prior to January 22, 2021) after purchase. Class Z and Class R6 shares are not subject to any sales or redemption charges and are available exclusively for sale to a limited group of investors.
Under certain circumstances, an exchange may be made from specified share classes of the Fund to one or more other share classes of the Fund as presented in the table of transactions in shares of beneficial interest, below.
The RIC has authorized an unlimited number of shares of beneficial interest of the Fund at $0.001 par value per share, currently divided into four classes, designated Class A, Class C, Class Z and Class R6.
As of October 31, 2023, Prudential, through its affiliated entities, including affiliated funds (if applicable), owned shares of the Fund as follows:
| | | | |
| Class | | Number of Shares | | Percentage of Outstanding Shares |
Z | | 25,174 | | 0.1% |
PGIM Absolute Return Bond Fund 93
Notes to Financial Statements (continued)
At the reporting period end, the number of shareholders holding greater than 5% of the Fund are as follows:
| | | | |
| | | |
| | | Number of Shareholders | | Percentage of Outstanding Shares |
Affiliated | | — | | —% |
Unaffiliated | | 9 | | 88.8 |
Transactions in shares of beneficial interest were as follows:
| | | | | | | | | | |
| | | | |
| Share Class | | Shares | | | | | Amount | |
| | | |
Class A | | | | | | | | | | |
Year ended October 31, 2023: | | | | | | | | | | |
Shares sold | | | 3,273,563 | | | | | $ | 28,918,593 | |
Shares issued in reinvestment of dividends and distributions | | | 525,133 | | | | | | 4,640,379 | |
Shares purchased | | | (3,063,639 | ) | | | | | (27,039,908 | ) |
Net increase (decrease) in shares outstanding before conversion | | | 735,057 | | | | | | 6,519,064 | |
Shares issued upon conversion from other share class(es) | | | 917,128 | | | | | | 8,094,155 | |
Shares purchased upon conversion into other share class(es) | | | (422,422 | ) | | | | | (3,726,460 | ) |
Net increase (decrease) in shares outstanding | | | 1,229,763 | | | | | $ | 10,886,759 | |
| | | |
Year ended October 31, 2022: | | | | | | | | | | |
Shares sold | | | 2,646,418 | | | | | $ | 23,662,293 | |
Shares issued in reinvestment of dividends and distributions | | | 225,474 | | | | | | 2,019,539 | |
Shares purchased | | | (4,801,741 | ) | | | | | (43,240,216 | ) |
Net increase (decrease) in shares outstanding before conversion | | | (1,929,849 | ) | | | | | (17,558,384 | ) |
Shares issued upon conversion from other share class(es) | | | 1,271,170 | | | | | | 11,431,721 | |
Shares purchased upon conversion into other share class(es) | | | (503,327 | ) | | | | | (4,526,308 | ) |
Net increase (decrease) in shares outstanding | | | (1,162,006 | ) | | | | $ | (10,652,971 | ) |
| | | |
Class C | | | | | | | | | | |
Year ended October 31, 2023: | | | | | | | | | | |
Shares sold | | | 585,316 | | | | | $ | 5,189,425 | |
Shares issued in reinvestment of dividends and distributions | | | 135,373 | | | | | | 1,199,267 | |
Shares purchased | | | (942,665 | ) | | | | | (8,339,381 | ) |
Net increase (decrease) in shares outstanding before conversion | | | (221,976 | ) | | | | | (1,950,689 | ) |
Shares purchased upon conversion into other share class(es) | | | (484,926 | ) | | | | | (4,289,276 | ) |
Net increase (decrease) in shares outstanding | | | (706,902 | ) | | | | $ | (6,239,965 | ) |
94
| | | | | | | | | | |
| | | | |
| Share Class | | Shares | | | | | Amount | |
| | | |
Year ended October 31, 2022: | | | | | | | | | | |
Shares sold | | | 877,518 | | | | | $ | 7,896,265 | |
Shares issued in reinvestment of dividends and distributions | | | 61,798 | | | | | | 555,299 | |
Shares purchased | | | (1,004,200 | ) | | | | | (9,079,074 | ) |
Net increase (decrease) in shares outstanding before conversion | | | (64,884 | ) | | | | | (627,510 | ) |
Shares issued upon conversion from other share class(es) | | | 562 | | | | | | 4,961 | |
Shares purchased upon conversion into other share class(es) | | | (932,971 | ) | | | | | (8,415,272 | ) |
Net increase (decrease) in shares outstanding | | | (997,293 | ) | | | | $ | (9,037,821 | ) |
| | | |
Class Z | | | | | | | | | | |
Year ended October 31, 2023: | | | | | | | | | | |
Shares sold | | | 103,099,124 | | | | | $ | 915,661,477 | |
Shares issued in reinvestment of dividends and distributions | | | 5,754,672 | | | | | | 51,052,303 | |
Shares purchased | | | (108,685,294 | ) | | | | | (962,092,248 | ) |
Net increase (decrease) in shares outstanding before conversion | | | 168,502 | | | | | | 4,621,532 | |
Shares issued upon conversion from other share class(es) | | | 484,576 | | | | | | 4,293,372 | |
Shares purchased upon conversion into other share class(es) | | | (729,561 | ) | | | | | (6,491,946 | ) |
Net increase (decrease) in shares outstanding | | | (76,483 | ) | | | | $ | 2,422,958 | |
| | | |
Year ended October 31, 2022: | | | | | | | | | | |
Shares sold | | | 102,369,219 | | | | | $ | 919,665,721 | |
Shares issued in reinvestment of dividends and distributions | | | 2,460,724 | | | | | | 22,062,630 | |
Shares purchased | | | (62,343,869 | ) | | | | | (559,336,562 | ) |
Net increase (decrease) in shares outstanding before conversion | | | 42,486,074 | | | | | | 382,391,789 | |
Shares issued upon conversion from other share class(es) | | | 639,113 | | | | | | 5,782,742 | |
Shares purchased upon conversion into other share class(es) | | | (486,684 | ) | | | | | (4,407,950 | ) |
Net increase (decrease) in shares outstanding | | | 42,638,503 | | | | | $ | 383,766,581 | |
| | | |
Class R6 | | | | | | | | | | |
Year ended October 31, 2023: | | | | | | | | | | |
Shares sold | | | 1,546,836 | | | | | $ | 13,665,612 | |
Shares issued in reinvestment of dividends and distributions | | | 388,862 | | | | | | 3,432,439 | |
Shares purchased | | | (2,200,992 | ) | | | | | (19,394,024 | ) |
Net increase (decrease) in shares outstanding before conversion | | | (265,294 | ) | | | | | (2,295,973 | ) |
Shares issued upon conversion from other share class(es) | | | 237,980 | | | | | | 2,120,155 | |
Net increase (decrease) in shares outstanding | | | (27,314 | ) | | | | $ | (175,818 | ) |
PGIM Absolute Return Bond Fund 95
Notes to Financial Statements (continued)
| | | | | | | | | | |
| | | | |
| Share Class | | Shares | | | | | Amount | |
| | | |
Year ended October 31, 2022: | | | | | | | | | | |
Shares sold | | | 1,666,379 | | | | | $ | 14,853,468 | |
Shares issued in reinvestment of dividends and distributions | | | 186,465 | | | | | | 1,667,818 | |
Shares purchased | | | (1,273,173 | ) | | | | | (11,381,641 | ) |
Net increase (decrease) in shares outstanding before conversion | | | 579,671 | | | | | | 5,139,645 | |
Shares issued upon conversion from other share class(es) | | | 14,475 | | | | | | 130,106 | |
Net increase (decrease) in shares outstanding | | | 594,146 | | | | | $ | 5,269,751 | |
The RIC, on behalf of the Fund, along with other affiliated registered investment companies (the “Participating Funds”), is a party to a Syndicated Credit Agreement (“SCA”) with a group of banks. The purpose of the SCA is to provide an alternative source of temporary funding for capital share redemptions. The table below provides details of the current SCA in effect at the reporting period-end as well as the prior SCA.
| | | | | | |
| | | Current SCA | | Prior SCA | | |
Term of Commitment | | 9/29/2023 - 9/26/2024 | | 9/30/2022 – 9/28/2023 | | |
Total Commitment | | $ 1,200,000,000 | | $ 1,200,000,000 | | |
Annualized Commitment Fee on the Unused Portion of the SCA | | 0.15% | | 0.15% | | |
Annualized Interest Rate on Borrowings | | 1.00% plus the higher of (1)
the effective federal funds
rate, (2) the daily SOFR rate
plus 0.10% or (3) zero
percent | | 1.00% plus the higher of (1)
the effective federal funds
rate, (2) the daily SOFR
rate plus 0.10% or (3) zero
percent | | |
Certain affiliated registered investment companies that are parties to the SCA include portfolios that are subject to a predetermined mathematical formula used to manage certain benefit guarantees offered under variable annuity contracts. The formula may result in large scale asset flows into and out of these portfolios. Consequently, these portfolios may be more likely to utilize the SCA for purposes of funding redemptions. It may be possible for those portfolios to fully exhaust the committed amount of the SCA, thereby requiring the Manager to allocate available funding per a Board-approved methodology designed to treat the Participating Funds in the SCA equitably.
The Fund utilized the SCA during the year ended October 31, 2023. The average daily balance for the 34 days that the Fund had loans outstanding during the period was approximately $2,696,853, borrowed at a weighted average interest rate of 5.88%. The maximum loan outstanding amount during the period was $8,948,000. At October 31, 2023, the Fund did not have an outstanding loan amount.
96
| 9. | Risks of Investing in the Fund |
The Fund’s risks include, but are not limited to, some or all of the risks discussed below. For further information on the Fund’s risks, please refer to the Fund’s Prospectus and Statement of Additional Information.
Collateralized Loan Obligations (“CLOs”) Risk: CLOs are subject to credit, interest rate, valuation, and prepayment and extension risks. These securities also are subject to risk of default on the underlying asset, particularly during periods of economic downturn. The market value of CLOs may be affected by, among other things, changes in the market value of the underlying assets held by the CLO, changes in the distributions on the underlying assets, defaults and recoveries on the underlying assets, capital gains and losses on the underlying assets, prepayments on underlying assets and the availability, prices and interest rate of underlying assets.
“Covenant-Lite” Risk: Some of the loans or debt obligations in which the Fund may invest or get exposure to may be “covenant-lite”, which means the loans or obligations contain fewer financial maintenance covenants than other loans or obligations (in some cases, none) and do not include terms which allow the lender to monitor the borrower’s performance and declare a default if certain criteria are breached. An investment by the Fund in a covenant-lite loan may potentially hinder the ability to reprice credit risk associated with the issuer and reduce the ability to restructure a problematic loan and mitigate potential loss. The Fund may also experience difficulty, expenses or delays in enforcing its rights on its holdings of covenant-lite loans or obligations. As a result of these risks, the Fund’s exposure to losses may be increased, which could result in an adverse impact on the Fund’s net income and NAV.
Credit Risk: This is the risk that the issuer, the guarantor or the insurer of a fixed income security, or the counterparty to a contract, may be unable or unwilling to make timely principal and interest payments, or to otherwise honor its obligations. Additionally, fixed income securities could lose value due to a loss of confidence in the ability of the issuer, guarantor, insurer or counterparty to pay back debt. The lower the credit quality of a bond, the more sensitive it is to credit risk.
Currency Risk: The Fund’s net asset value could decline as a result of changes in exchange rates, which could adversely affect the Fund’s investments in currencies, or in securities that trade in, and receive revenues related to, currencies, or in derivatives that provide exposure to currencies. Certain foreign countries may impose restrictions on the ability of issuers of foreign securities to make payment of principal and interest or dividends to investors located outside the country, due to blockage of foreign currency exchanges or otherwise.
Debt Obligations Risk: Debt obligations are subject to credit risk, market risk and interest rate risk. The Fund’s holdings, share price, yield and total return may also fluctuate in response to bond market movements. The value of bonds may decline for issuer-related reasons, including management performance, financial leverage and reduced demand for the issuer’s goods and services. Certain types of fixed income obligations also may be
PGIM Absolute Return Bond Fund 97
Notes to Financial Statements (continued)
subject to “call and redemption risk,” which is the risk that the issuer may call a bond held by the Fund for redemption before it matures and the Fund may not be able to reinvest at the same rate of interest and therefore would earn less income.
Derivatives Risk: Derivatives involve special risks and costs and may result in losses to the Fund. The successful use of derivatives requires sophisticated management, and, to the extent that derivatives are used, the Fund will depend on the subadviser’s ability to analyze and manage derivatives transactions. The prices of derivatives may move in unexpected ways, especially in abnormal market conditions. Some derivatives are “leveraged” or may create economic leverage for the Fund and therefore may magnify or otherwise increase investment losses to the Fund. The Fund’s use of derivatives may also increase the amount of taxes payable by shareholders.
Other risks arise from the potential inability to terminate or sell derivatives positions. A liquid secondary market may not always exist for the Fund’s derivatives positions. In fact, many over-the-counter derivative instruments will not have liquidity beyond the counterparty to the instrument. Over-the-counter derivative instruments also involve the risk that the other party will not meet its obligations to the Fund. The use of derivatives also exposes the Fund to operational issues, such as documentation and settlement issues, systems failures, inadequate control and human error.
Derivatives may also involve legal risks, such as insufficient documentation, the lack of capacity or authority of a counterparty to execute or settle a transaction, and the legality and enforceability of derivatives contracts. The U.S. Government and foreign governments have adopted (and may adopt further) regulations governing derivatives markets, including mandatory clearing of certain derivatives, margin and reporting requirements and risk exposure limitations. Regulation of derivatives may make derivatives more costly, limit their availability or utility to the Fund, or otherwise adversely affect their performance or disrupt markets.
Economic and Market Events Risk: Events in the U.S. and global financial markets, including actions taken by the U.S. Federal Reserve or foreign central banks to stimulate or stabilize economic growth or the functioning of the securities markets, or otherwise reduce inflation, may at times result in unusually high market volatility, which could negatively impact performance. Governmental efforts to curb inflation often have negative effects on the level of economic activity. Relatively reduced liquidity in credit and fixed income markets could adversely affect issuers worldwide.
Floating Rate and Other Loans Risk: The Fund’s ability to receive payments of principal and interest and other amounts in connection with loans (whether through participations, assignments or otherwise) will depend primarily on the financial condition of the borrower.
98
The failure by the Fund to receive scheduled interest or principal payments on a loan because of a default, bankruptcy or any other reason would adversely affect the income of the Fund and would likely reduce the value of its assets. Even with loans secured by collateral, there is the risk that the value of the collateral may decline, may be insufficient to meet the obligations of the borrower, or be difficult to liquidate. In the event of a default, the Fund may have difficulty collecting on any collateral and would not have the ability to collect on any collateral for an uncollateralized loan. Further, the Fund’s access to collateral, if any, may be limited by bankruptcy laws. Due to the nature of the private syndication of senior loans, including, for example, lack of publicly-available information, some senior loans are not as easily purchased or sold as publicly-traded securities. In addition, loan participations generally are subject to restrictions on transfer, and only limited opportunities may exist to sell loan participations in secondary markets. As a result, it may be difficult for the Fund to value loans or sell loans at an acceptable price when it wants to sell them. Loans trade in an over-the-counter market, and confirmation and settlement, which are effected through standardized procedures and documentation, may take significantly longer than seven days to complete. Extended trade settlement periods may, in unusual market conditions with a high volume of shareholder redemptions, present a risk to shareholders regarding the Fund’s ability to pay redemption proceeds in a timely manner. In some instances, loans and loan participations are not rated by independent credit rating agencies; in such instances, a decision by the Fund to invest in a particular loan or loan participation could depend exclusively on the subadviser’s credit analysis of the borrower, or in the case of a loan participation, of the intermediary holding the portion of the loan that the Fund has purchased. To the extent the Fund invests in loans of non-U.S. issuers, the risks of investing in non-U.S. issuers are applicable. Loans may not be considered to be “securities” and as a result may not benefit from the protections of the federal securities laws, including anti-fraud protections and those with respect to the use of material non-public information, so that purchasers, such as the Fund, may not have the benefit of these protections. If the Fund is in possession of material non-public information about a borrower as a result of its investment in such borrower’s loan, the Fund may not be able to enter into a transaction with respect to a publicly-traded security of the borrower when it would otherwise be advantageous to do so.
Foreign Securities Risk: Investments in securities of non-U.S. issuers (including those denominated in U.S. dollars) may involve more risk than investing in securities of U.S. issuers. Foreign political, economic and legal systems, especially those in developing and emerging market countries, may be less stable and more volatile than in the United States. Foreign legal systems generally have fewer regulatory requirements than the U.S. legal system, particularly those of emerging markets. In general, less information is publicly available with respect to non-U.S. companies than U.S. companies. Non-U.S. companies generally are not subject to the same accounting, auditing, and financial reporting standards as are U.S. companies. Additionally, the changing value of foreign currencies and changes in exchange rates could also affect the value of the assets the Fund holds and the Fund’s performance. Certain foreign countries may impose restrictions on the ability of issuers of foreign securities to make payment of principal and interest or dividends to investors located
PGIM Absolute Return Bond Fund 99
Notes to Financial Statements (continued)
outside the country, due to blockage of foreign currency exchanges or otherwise. Investments in emerging markets are subject to greater volatility and price declines.
In addition, the Fund’s investments in non-U.S. securities may be subject to the risks of nationalization or expropriation of assets, imposition of currency exchange controls or restrictions on the repatriation of non-U.S. currency, confiscatory taxation and adverse diplomatic developments. Special U.S. tax considerations may apply.
Increase in Expenses Risk: Your actual cost of investing in the Fund may be higher than the expenses shown in the expense table in the Fund’s prospectus for a variety of reasons. For example, expense ratios may be higher than those shown if average net assets decrease. Net assets are more likely to decrease and Fund expense ratios are more likely to increase when markets are volatile. Active and frequent trading of Fund securities can increase expenses.
Interest Rate Risk: The value of your investment may go down when interest rates rise. A rise in rates tends to have a greater impact on the prices of longer term or duration debt securities. Similarly, a rise in interest rates may also have a greater negative impact on the value of equity securities whose issuers expect earnings further out in the future. For example, a fixed income security with a duration of three years is expected to decrease in value by approximately 3% if interest rates increase by 1%. This is referred to as “duration risk.” When interest rates fall, the issuers of debt obligations may prepay principal more quickly than expected, and the Fund may be required to reinvest the proceeds at a lower interest rate. This is referred to as “prepayment risk.” When interest rates rise, debt obligations may be repaid more slowly than expected, and the value of the Fund’s holdings may fall sharply. This is referred to as “extension risk.” The Fund may lose money if short-term or long-term interest rates rise sharply or in a manner not anticipated by the subadviser.
Junk Bonds Risk: High-yield, high-risk bonds have predominantly speculative characteristics, including particularly high credit risk. Junk bonds tend to have lower market liquidity than higher-rated securities. The liquidity of particular issuers or industries within a particular investment category may shrink or disappear suddenly and without warning. The non-investment grade bond market can experience sudden and sharp price swings and become illiquid due to a variety of factors, including changes in economic forecasts, stock market activity, large sustained sales by major investors, a high profile default or a change in the market’s psychology.
Large Shareholder and Large Scale Redemption Risk: Certain individuals, accounts, funds (including funds affiliated with the Manager) or institutions, including the Manager and its affiliates, may from time to time own or control a substantial amount of the Fund’s shares.
100
There is no requirement that these entities maintain their investment in the Fund. There is a risk that such large shareholders or that the Fund’s shareholders generally may redeem all or a substantial portion of their investments in the Fund in a short period of time, which could have a significant negative impact on the Fund’s NAV, liquidity, and brokerage costs. Large redemptions could also result in tax consequences to shareholders and impact the Fund’s ability to implement its investment strategy. The Fund’s ability to pursue its investment objective after one or more large scale redemptions may be impaired and, as a result, the Fund may invest a larger portion of its assets in cash or cash equivalents.
Liquidity Risk: Liquidity risk is the risk that the Fund could not meet requests to redeem shares issued by the Fund without significant dilution of remaining investors’ interests in the Fund. The Fund may invest in instruments that trade in lower volumes and are more illiquid than other investments. If the Fund is forced to sell these investments to pay redemption proceeds or for other reasons, the Fund may lose money. In addition, when there is no willing buyer and investments cannot be readily sold at the desired time or price, the Fund may have to accept a lower price or may not be able to sell the instrument at all. An inability to sell a portfolio position can adversely affect the Fund’s value or prevent the Fund from being able to take advantage of other investment opportunities.
Management Risk: Actively managed funds are subject to management risk. The subadviser will apply investment techniques and risk analyses in making investment decisions for the Fund, but the subadviser’s judgments about the attractiveness, value or market trends affecting a particular security, industry or sector or about market movements may be incorrect. Additionally, the investments selected for the Fund may underperform the markets in general, the Fund’s benchmark and other funds with similar investment objectives.
Market Disruption and Geopolitical Risks: Market disruption can be caused by economic, financial or political events and factors, including but not limited to, international wars or conflicts (including Russia’s military invasion of Ukraine), geopolitical developments (including trading and tariff arrangements, sanctions and cybersecurity attacks), instability in regions such as Asia, Eastern Europe and the Middle East, terrorism, natural disasters and public health epidemics (including the outbreak of COVID-19 globally).
The extent and duration of such events and resulting market disruptions cannot be predicted, but could be substantial and could magnify the impact of other risks to the Fund. These and other similar events could adversely affect the U.S. and foreign financial markets and lead to increased market volatility, reduced liquidity in the securities markets, significant negative impacts on issuers and the markets for certain securities and commodities and/or government intervention. They may also cause short-or long-term economic uncertainties in the United States and worldwide. As a result, whether or not the Fund invests in securities of issuers located in or with significant exposure to the countries directly affected, the value and liquidity of the Fund’s investments may be negatively impacted. Further, due to closures of certain markets and restrictions on trading certain securities, the value of certain
PGIM Absolute Return Bond Fund 101
Notes to Financial Statements (continued)
securities held by the Fund could be significantly impacted, which could lead to such securities being valued at zero.
Market Risk: Securities markets may be volatile and the market prices of the Fund’s securities may decline. Securities fluctuate in price based on changes in an issuer’s financial condition and overall market and economic conditions. If the market prices of the securities owned by the Fund fall, the value of your investment in the Fund will decline.
Mortgage-Backed and Asset-Backed Securities Risk: Mortgage-backed and asset-backed securities tend to increase in value less than other debt securities when interest rates decline, but are subject to similar risk of decline in market value during periods of rising interest rates. The values of mortgage-backed and asset-backed securities become more volatile as interest rates rise. In a period of declining interest rates, the Fund may be required to reinvest more frequent prepayments on mortgage-backed and asset-backed securities in lower-yielding investments.
Structured Products Risk: Holders of structured product securities bear risks of the underlying investments, index or reference obligation. Certain structured products may be thinly traded or have a limited trading market, and as a result may be characterized as illiquid. The possible lack of a liquid secondary market for structured securities and the resulting inability of the Fund to sell a structured security could expose the Fund to losses and could make structured securities more difficult for the Fund to value accurately, which may also result in additional costs. Structured products are also subject to credit risk; the assets backing the structured product may be insufficient to pay interest or principal. In addition to the general risks associated with investments in fixed income, structured products carry additional risks, including, but not limited to: the possibility that distributions from collateral securities will not be adequate to make interest or other payments; the quality of the collateral may decline in value or default; and the possibility that the structured products are subordinate to other classes. Structured securities are generally privately negotiated debt obligations where the principal and/or interest or value of the structured security is determined by reference to the performance of a specific asset, benchmark asset, market or interest rate (“reference instrument”), and changes in the reference instrument or security may cause significant price fluctuations, or could cause the interest rate on the structured security to be reduced to zero. Holders of structured products indirectly bear risks associated with the reference instrument, are subject to counterparty risk and typically do not have direct rights against the reference instrument. Structured products may also entail structural complexity and documentation risk and there is no guarantee that the courts or administrators will interpret the priority of principal and interest payments as expected.
102
U.S. Government and Agency Securities Risk: U.S. Treasury obligations are backed by the “full faith and credit” of the U.S. Government. Securities issued or guaranteed by federal agencies or authorities and U.S. Government-sponsored instrumentalities or enterprises may or may not be backed by the full faith and credit of the U.S. Government. For example, securities issued by the Federal Home Loan Mortgage Corporation, the Federal National Mortgage Association and the Federal Home Loan Banks are neither insured nor guaranteed by the U.S. Government. These securities may be supported by the ability to borrow from the U.S. Treasury or only by the credit of the issuing agency, authority, instrumentality or enterprise and, as a result, are subject to greater credit risk than securities issued or guaranteed by the U.S. Treasury. Further, the U.S. Government and its agencies, authorities, instrumentalities and enterprises do not guarantee the market value of their securities; consequently, the value of such securities will fluctuate. This may be the case especially when there is any controversy or ongoing uncertainty regarding the status of negotiations in the U.S. Congress to increase the statutory debt ceiling. Such controversy or uncertainty could, among other things, result in the credit quality rating of the U.S. Government being downgraded and reduced prices of U.S. Treasury securities. If the U.S. Congress is unable to negotiate an adjustment to the statutory debt ceiling, there is also the risk that the U.S. Government may default on payments on certain U.S. Government securities, including those held by the Fund, which could have a negative impact on the Fund. An increase in demand for U.S. Government securities resulting from an increase in demand for government money market funds may lead to lower yields on such securities.
| 10. | Recent Regulatory Developments |
Effective January 24, 2023, the SEC adopted rule and form amendments to require mutual funds and ETFs to transmit concise and visually engaging streamlined annual and semiannual reports to shareholders that highlight key information deemed important for retail investors to assess and monitor their fund investments (the “Rule”). Other information, including financial statements, will no longer appear in the funds’ streamlined shareholder reports but must be available online, delivered free of charge upon request, and filed on a semiannual basis on Form N-CSR. The Rule and form amendments have a compliance date of July 24, 2024. At this time, management is evaluating the Rule and its impact to the Fund.
PGIM Absolute Return Bond Fund 103
Report of Independent Registered Public Accounting Firm
To the Board of Trustees of Prudential Investment Portfolios 9 and Shareholders of PGIM Absolute Return Bond Fund
Opinion on the Financial Statements
We have audited the accompanying statement of assets and liabilities, including the schedule of investments, of PGIM Absolute Return Bond Fund (one of the funds constituting Prudential Investment Portfolios 9, referred to hereafter as the “Fund”) as of October 31, 2023, the related statement of operations for the year ended October 31, 2023, the statements of changes in net assets for each of the two years in the period ended October 31, 2023, including the related notes, and the financial highlights for each of the four years in the period ended October 31, 2023 (collectively referred to as the “financial statements”). In our opinion, the financial statements present fairly, in all material respects, the financial position of the Fund as of October 31, 2023, the results of its operations for the year then ended, the changes in its net assets for each of the two years in the period ended October 31, 2023 and the financial highlights for each of the four years in the period ended October 31, 2023 in conformity with accounting principles generally accepted in the United States of America.
The financial statements of the Fund as of and for the year ended October 31, 2019 and the financial highlights for the period ended October 31, 2019 (not presented herein, other than the financial highlights) were audited by other auditors whose report dated December 19, 2019 expressed an unqualified opinion on those financial statements and financial highlights.
Basis for Opinion
These financial statements are the responsibility of the Fund’s management. Our responsibility is to express an opinion on the Fund’s financial statements based on our audits. We are a public accounting firm registered with the Public Company Accounting Oversight Board (United States) (PCAOB) and are required to be independent with respect to the Fund in accordance with the U.S. federal securities laws and the applicable rules and regulations of the Securities and Exchange Commission and the PCAOB.
We conducted our audits of these financial statements in accordance with the standards of the PCAOB. Those standards require that we plan and perform the audit to obtain reasonable assurance about whether the financial statements are free of material misstatement, whether due to error or fraud.
Our audits included performing procedures to assess the risks of material misstatement of the financial statements, whether due to error or fraud, and performing procedures that respond to those risks. Such procedures included examining, on a test basis, evidence regarding the amounts and disclosures in the financial statements. Our audits also included evaluating the accounting principles used and significant estimates made by management, as well as evaluating the overall presentation of the financial statements. Our procedures included confirmation of securities owned as of October 31, 2023 by correspondence with the custodian, transfer agent, brokers and agent banks; when replies were not received from brokers, we performed other auditing procedures. We believe that our audits provide a reasonable basis for our opinion.
/s/PricewaterhouseCoopers LLP
New York, New York
December 19, 2023
We have served as the auditor of one or more investment companies in the PGIM Retail Funds complex since 2020.
104
Tax Information (unaudited)
For the year ended October 31, 2023, the Fund reports the maximum amount allowable but not less than 38.52% as interest related dividends in accordance with Section 871(k)(1) and 881(e)(1) of the Internal Revenue Code.
For the year ended October 31, 2023 the Fund reports the maximum amount allowable but not less than 88.42% as interest dividends that are eligible to be treated as interest income in accordance with Section 163(j) of the Internal Revenue Code.
In January 2024, you will be advised on IRS Form 1099-DIV or substitute Form 1099-DIV as to the federal tax status of the distributions received by you in calendar year 2023.
We are required by Massachusetts, Missouri and Oregon to inform you that dividends which have been derived from interest on federal obligations are not taxable to shareholders provided the Fund meets certain requirements mandated by the respective state’s taxing authorities. We are pleased to report that 11.39% of the dividends paid by the Fund qualifies for such deduction.
Please consult your tax adviser or state/local authorities to properly report this information on your tax return. If you have any questions concerning the amounts listed above, please call your financial adviser.
PGIM Absolute Return Bond Fund 105
| INFORMATION | ABOUT BOARD MEMBERS AND OFFICERS (unaudited) |
Information about Board Members and Officers of the Fund is set forth below. Board Members who are not deemed to be “interested persons” of the Fund, as defined in the 1940 Act, are referred to as “Independent Board Members.” Board Members who are deemed to be “interested persons” of the Fund are referred to as “Interested Board Members.” The Board Members are responsible for the overall supervision of the operations of the Fund and perform the various duties imposed on the directors of investment companies by the 1940 Act. The Board in turn elects the Officers, who are responsible for administering the day-to-day operations of the Fund.
| | | | | | |
| |
Independent Board Members |
| | | | |
Name Year of Birth Position(s) Portfolios Overseen | | Principal Occupation(s) During Past Five Years | | Other Directorships Held During Past Five Years | | Length of Board Service |
| | | | |
Ellen S. Alberding 1958 Board Member Portfolios Overseen: 100 | | Chief Executive Officer and President, The Joyce Foundation (charitable foundation) (since 2002); formerly Vice Chair, City Colleges of Chicago (community college system) (2011-2015); formerly Trustee, National Park Foundation (charitable foundation for national park system) (2009-2018); formerly Trustee, Economic Club of Chicago (2009-2016); Trustee, Loyola University (since 2018). | | None. | | Since September 2013 |
| | | | |
Kevin J. Bannon 1952 Board Member Portfolios Overseen: 101 | | Retired; formerly Managing Director (April 2008-May 2015) and Chief Investment Officer (October 2008-November 2013) of Highmount Capital LLC (registered investment adviser); formerly Executive Vice President and Chief Investment Officer (April 1993-August 2007) of Bank of New York Company; formerly President (May 2003-May 2007) of BNY Hamilton Family of Mutual Funds. | | Director of Urstadt Biddle Properties (equity real estate investment trust) (September 2008-August 2023). | | Since July 2008 |
PGIM Absolute Return Bond Fund
| | | | | | |
| |
Independent Board Members |
| | | | |
Name Year of Birth Position(s) Portfolios Overseen | | Principal Occupation(s) During Past Five Years | | Other Directorships Held During Past Five Years | | Length of Board Service |
| | | | |
Linda W. Bynoe 1952 Board Member Portfolios Overseen: 98 | | President and Chief Executive Officer (since March 1995) and formerly Chief Operating Officer (December 1989-February 1995) of Telemat Limited LLC (formerly Telemat Ltd) (management consulting); formerly Vice President (January 1985-June 1989) at Morgan Stanley & Co. (broker-dealer). | | Trustee of Equity Residential (residential real estate) (since December 2009); Director of Northern Trust Corporation (financial services) (since April 2006); formerly Director of Anixter International, Inc. (communication products distributor) (January 2006-June 2020). | | Since March 2005 |
| | | | |
Barry H. Evans 1960 Board Member Portfolios Overseen: 101 | | Retired; formerly President (2005-2016), Global Chief Operating Officer (2014-2016), Chief Investment Officer - Global Head of Fixed Income (1998-2014), and various portfolio manager roles (1986-2006), Manulife Asset Management (asset management). | | Formerly Director, Manulife Trust Company (2011-2018); formerly Director, Manulife Asset Management Limited (2015-2017); formerly Chairman of the Board of Directors of Manulife Asset Management U.S. (2005-2016); formerly Chairman of the Board, Declaration Investment Management and Research (2008-2016). | | Since September 2017 |
| | | | |
Keith F. Hartstein 1956 Board Member & Independent Chair Portfolios Overseen: 101 | | Retired; formerly Member (November 2014-September 2022) of the Governing Council of the Independent Directors Council (IDC) (organization of independent mutual fund directors); formerly Executive Committee of the IDC Board of Governors (October 2019-December 2021); formerly President and Chief Executive Officer (2005-2012), Senior Vice President (2004-2005), Senior Vice President of Sales and Marketing (1997-2004), and various executive management positions (1990-1997), John Hancock Funds, LLC (asset management); formerly Chairman, Investment Company Institute’s Sales Force Marketing Committee (2003-2008). | | None. | | Since September 2013 |
Visit our website at pgim.com/investments
| | | | | | |
| |
Independent Board Members |
| | | | |
Name Year of Birth Position(s) Portfolios Overseen | | Principal Occupation(s) During Past Five Years | | Other Directorships Held During Past Five Years | | Length of Board Service |
| | | | |
Laurie Simon Hodrick 1962 Board Member Portfolios Overseen: 98 | | A. Barton Hepburn Professor Emerita of Economics in the Faculty of Business, Columbia Business School (since 2018); Visiting Fellow at the Hoover Institution, Stanford University (since 2015); Sole Member, ReidCourt LLC (since 2008) (a consulting firm); formerly Visiting Professor of Law, Stanford Law School (2015-2021); formerly A. Barton Hepburn Professor of Economics in the Faculty of Business, Columbia Business School (1996-2017); formerly Managing Director, Global Head of Alternative Investment Strategies, Deutsche Bank (2006-2008). | | Independent Director, Andela (since January 2022) (global talent network); Independent Director, Roku (since December 2020) (communication services); formerly Independent Director, Synnex Corporation (2019-2021) (information technology); formerly Independent Director, Kabbage, Inc. (2018-2020) (financial services); formerly Independent Director, Corporate Capital Trust (2017-2018) (a business development company). | | Since September 2017 |
| | | | |
Brian K. Reid 1961 Board Member Portfolios Overseen: 101 | | Retired; formerly Chief Economist for the Investment Company Institute (ICI) (2005-2017); formerly Senior Economist and Director of Industry and Financial Analysis at the ICI (1998-2004); formerly Senior Economist, Industry and Financial Analysis at the ICI (1996-1998); formerly Staff Economist at the Federal Reserve Board (1989-1996); formerly Director, ICI Mutual Insurance Company (2012-2017). | | None. | | Since March 2018 |
PGIM Absolute Return Bond Fund
| | | | | | |
| |
Independent Board Members |
| | | | |
Name Year of Birth Position(s) Portfolios Overseen | | Principal Occupation(s) During Past Five Years | | Other Directorships Held During Past Five Years | | Length of Board Service |
| | | | |
Grace C. Torres 1959 Board Member Portfolios Overseen: 101 | | Retired; formerly Treasurer and Principal Financial and Accounting Officer of the PGIM Funds, Target Funds, Advanced Series Trust, Prudential Variable Contract Accounts and The Prudential Series Fund (1998-June 2014); Assistant Treasurer (March 1999-June 2014) and Senior Vice President (September 1999-June 2014) of PGIM Investments LLC; Assistant Treasurer (May 2003-June 2014) and Vice President (June 2005-June 2014) of AST Investment Services, Inc.; Senior Vice President and Assistant Treasurer (May 2003-June 2014) of Prudential Annuities Advisory Services, Inc. | | Director (since January 2018) of OceanFirst Financial Corp. and OceanFirst Bank; formerly Director (July 2015-January 2018) of Sun Bancorp, Inc. N.A. and Sun National Bank. | | Since November 2014 |
Visit our website at pgim.com/investments
| | | | | | |
| |
Interested Board Members |
| | | | |
Name Year of Birth Position(s) Portfolios Overseen | | Principal Occupation(s) During Past Five Years | | Other Directorships Held During Past Five Years | | Length of Board Service |
| | | | |
Stuart S. Parker 1962 Board Member & President Portfolios Overseen: 101 | | President, Chief Executive Officer, Chief Operating Officer and Officer in Charge of PGIM Investments LLC (formerly known as Prudential Investments LLC) (since January 2012); President and Principal Executive Officer (“PEO”) (since December 2023) of the PGIM Credit Income Fund; President and PEO (since September 2022) of the PGIM Private Credit Fund; President and PEO (since March 2022) of the PGIM Private Real Estate Fund, Inc.; formerly Executive Vice President of Jennison Associates LLC and Head of Retail Distribution of PGIM Investments LLC (June 2005-December 2011); Investment Company Institute - Board of Governors (since May 2012). | | None. | | Since January 2012 |
| | | | |
Scott E. Benjamin 1973 Board Member & Vice President Portfolios Overseen: 101 | | Executive Vice President (since May 2009) of PGIM Investments LLC; Vice President (since June 2012) of Prudential Investment Management Services LLC; Executive Vice President (since September 2009) of AST Investment Services, Inc.; Senior Vice President of Product Development and Marketing, PGIM Investments (since February 2006); Vice President (since December 2023) of the PGIM Credit Income Fund; Vice President (since September 2022) of the PGIM Private Credit Fund; Vice President (since March 2022) of the PGIM Private Real Estate Fund, Inc.; formerly Vice President of Product Development and Product Management, PGIM Investments LLC (2003-2006). | | None. | | Since March 2010 |
PGIM Absolute Return Bond Fund
| | | | |
| | | |
| Fund Officers(a) | | | | |
| | | |
Name Year of Birth Fund Position | | Principal Occupation(s) During Past Five Years | | Length of Service as Fund Officer |
| | | |
Claudia DiGiacomo 1974 Chief Legal Officer | | Chief Legal Officer (since December 2023) of the PGIM Credit Income Fund; Chief Legal Officer (since September 2022) of the PGIM Private Credit Fund; Chief Legal Officer (since July 2022) of the PGIM Private Real Estate Fund, Inc.; Chief Legal Officer, Executive Vice President and Secretary of PGIM Investments LLC (since August 2020); Chief Legal Officer of Prudential Mutual Fund Services LLC (since August 2020); Chief Legal Officer of PIFM Holdco, LLC (since August 2020); Vice President and Corporate Counsel (since January 2005) of Prudential; and Corporate Counsel of AST Investment Services, Inc. (since August 2020); formerly Vice President and Assistant Secretary of PGIM Investments LLC (2005-2020); formerly Associate at Sidley Austin Brown & Wood LLP (1999-2004). | | Since December 2005 |
| | | |
Andrew Donohue 1972 Chief Compliance Officer | | Chief Compliance Officer (since May 2023) of the PGIM Funds, Target Funds, PGIM ETF Trust, PGIM Global High Yield Fund, Inc., PGIM High Yield Bond Fund, Inc., PGIM Short Duration High Yield Opportunities Fund, Advanced Series Trust, The Prudential Series Fund, Prudential’s Gibraltar Fund, Inc., PGIM Private Credit Fund, PGIM Private Real Estate Fund, Inc.; Chief Compliance Officer of AST Investment Services, Inc. (since October 2022); Vice President, Chief Compliance Officer of PGIM Investments LLC (since September 2022); Chief Compliance Officer (since December 2023) of the PGIM Credit Income Fund; formerly various senior compliance roles within Principal Global Investors, LLC., global asset management for Principal Financial (2011-2022), most recently as Global Chief Compliance Officer (2016-2022). | | Since May 2023 |
| | | |
Andrew R. French 1962 Secretary | | Vice President (since December 2018) of PGIM Investments LLC; Secretary (since December 2023) of the PGIM Credit Income Fund; Secretary (since September 2022) of the PGIM Private Credit Fund; Secretary (since March 2022) of the PGIM Private Real Estate Fund, Inc.; formerly Vice President and Corporate Counsel (2010-2018) of Prudential; formerly Director and Corporate Counsel (2006-2010) of Prudential; Vice President and Assistant Secretary (since January 2007) of PGIM Investments LLC; Vice President and Assistant Secretary (since January 2007) of Prudential Mutual Fund Services LLC. | | Since October 2006 |
Visit our website at pgim.com/investments
| | | | |
| | | |
| Fund Officers(a) | | | | |
| | | |
Name Year of Birth Fund Position | | Principal Occupation(s) During Past Five Years | | Length of Service as Fund
Officer |
| | | |
Melissa Gonzalez 1980 Assistant Secretary | | Vice President and Corporate Counsel (since September 2018) of Prudential; Vice President and Assistant Secretary (since August 2020) of PGIM Investments LLC; Assistant Secretary (since December 2023) of the PGIM Credit Income Fund; Assistant Secretary (since September 2022) of the PGIM Private Credit Fund; Assistant Secretary (since March 2022) of the PGIM Private Real Estate Fund, Inc.; formerly Director and Corporate Counsel (March 2014-September 2018) of Prudential. | | Since March 2020 |
| | | |
Patrick E. McGuinness 1986 Assistant Secretary | | Vice President and Assistant Secretary (since August 2020) of PGIM Investments LLC; Director and Corporate Counsel (since February 2017) of Prudential; Assistant Secretary (since December 2023) of the PGIM Credit Income Fund; Assistant Secretary (since September 2022) of the PGIM Private Credit Fund; Assistant Secretary (since March 2022) of the PGIM Private Real Estate Fund, Inc. | | Since June 2020 |
| | | |
Debra Rubano 1975 Assistant Secretary | | Vice President and Corporate Counsel (since November 2020) of Prudential; Assistant Secretary (since December 2023) of the PGIM Credit Income Fund; Assistant Secretary (since September 2022) of the PGIM Private Credit Fund; Assistant Secretary (since March 2022) of the PGIM Private Real Estate Fund, Inc; formerly Director and Senior Counsel of Allianz Global Investors U.S. Holdings LLC (2010-2020) and Assistant Secretary of numerous funds in the Allianz fund complex (2015-2020). | | Since December 2020 |
| | | |
George Hoyt 1965 Assistant Secretary | | Vice President and Corporate Counsel of Prudential (since September 2023); formerly Associate General Counsel of Franklin Templeton and Secretary and Chief Legal Officer of certain funds in the Franklin Templeton complex (2020- 2023) and Managing Director (2016-2020) and Associate General Counsel for Legg Mason, Inc. and its predecessors (2004-2020). | | Since December 2023 |
| | | |
Devan Goolsby 1991 Assistant Secretary | | Vice President and Corporate Counsel of Prudential (since May 2023); formerly Associate at Eversheds Sutherland (US) LLP (2021-2023); Compliance Officer at Bloomberg LP (2019-2021); and an Examiner at the Financial Industry Regulatory Authority (2015-2019). | | Since December 2023 |
| | | |
Kelly A. Coyne 1968 Assistant Secretary | | Director, Investment Operations of Prudential Mutual Fund Services LLC (since 2010); Assistant Secretary (since December 2023) of the PGIM Credit Income Fund; Assistant Secretary (since September 2022) of the PGIM Private Credit Fund; Assistant Secretary (since March 2022) of the PGIM Private Real Estate Fund, Inc. | | Since March 2015 |
PGIM Absolute Return Bond Fund
| | | | |
| | | |
| Fund Officers(a) | | | | |
| | | |
Name Year of Birth Fund Position | | Principal Occupation(s) During Past Five Years | | Length of Service as Fund
Officer |
| | | |
Christian J. Kelly 1975 Chief Financial Officer | | Vice President, Global Head of Fund Administration of PGIM Investments LLC (since November 2018); Chief Financial Officer (since March 2023) of PGIM Investments mutual funds, closed end funds and ETFs, Advanced Series Trust Portfolios, Prudential Series Funds and Prudential Gibraltar Fund; Chief Financial Officer (since December 2023) of the PGIM Credit Income Fund; Chief Financial Officer of PGIM Private Credit Fund (since September 2022); Chief Financial Officer of PGIM Private Real Estate Fund, Inc. (since July 2022); formerly Treasurer and Principal Financial Officer (January 2019- March 2023) of PGIM Investments mutual funds, closed end funds and ETFs, Advanced Series Trust Portfolios, Prudential Series Funds and Prudential Gibraltar Fund; formerly Treasurer and Principal Financial Officer (March 2022 – July 2022) of the PGIM Private Real Estate Fund, Inc.; formerly Director of Fund Administration of Lord Abbett & Co. LLC (2009-2018), Treasurer and Principal Accounting Officer of the Lord Abbett Family of Funds (2017-2018); Director of Accounting, Avenue Capital Group (2008-2009); Senior Manager, Investment Management Practice of Deloitte & Touche LLP (1998-2007). | | Since January 2019 |
| | | |
Russ Shupak 1973 Treasurer and Principal Accounting Officer | | Vice President (since 2017) within PGIM Investments Fund Administration; Treasurer and Principal Accounting Officer of PGIM Investments mutual funds, closed end funds and ETFs (since March 2023); Treasurer and Principal Accounting Officer (since December 2023) of the PGIM Credit Income Fund; Treasurer and Principal Accounting Officer (since July 2022) of the PGIM Private Real Estate Fund, Inc.; Assistant Treasurer (since September 2022) of the PGIM Private Credit Fund; formerly Assistant Treasurer (March 2022 – July 2022) of the PGIM Private Real Estate Fund, Inc.; Assistant Treasurer of Advanced Series Trust Portfolios, Prudential Series Funds and Prudential Gibraltar Fund (since October 2019); formerly Director (2013-2017) within PGIM Investments Fund Administration. | | Since October 2019 |
| | | |
Lana Lomuti 1967 Assistant Treasurer | | Vice President (since 2007) within PGIM Investments Fund Administration; formerly Assistant Treasurer (December 2007-February 2014) of The Greater China Fund, Inc.; formerly Director (2005-2007) within PGIM Investments Fund Administration. | | Since April 2014 |
| | | |
Deborah Conway 1969 Assistant Treasurer | | Vice President (since 2017) within PGIM Investments Fund Administration; formerly Director (2007-2017) within PGIM Investments Fund Administration. | | Since October 2019 |
Visit our website at pgim.com/investments
| | | | |
| | | |
Fund Officers(a) | | | | |
| | | |
Name Year of Birth Fund Position | | Principal Occupation(s) During Past Five Years | | Length of Service as Fund
Officer |
| | | |
Elyse M. McLaughlin 1974 Assistant Treasurer | | Vice President (since 2017) within PGIM Investments Fund Administration; Treasurer and Principal Accounting Officer of the Advanced Series Trust, the Prudential Series Fund and the Prudential Gibraltar Fund (since March 2023); Assistant Treasurer (since December 2023) of the PGIM Credit Income Fund; Treasurer and Principal Accounting Officer (since September 2022) of the PGIM Private Credit Fund; Assistant Treasurer (since March 2022) of the PGIM Private Real Estate Fund, Inc.; Assistant Treasurer of PGIM Investments mutual funds, closed end funds and ETFs (since October 2019); formerly Director (2011-2017) within PGIM Investments Fund Administration. | | Since October 2019 |
| | | |
Robert W. McCormack 1973 Assistant Treasurer | | Vice President (since 2019) within PGIM Investments Fund Administration; Assistant Treasurer (since March 2023) of PGIM Investments mutual funds, closed end funds, ETFs, Advanced Series Trust Portfolios, Prudential Series Funds and Prudential Gibraltar Fund; Assistant Treasurer (since December 2023) of the PGIM Credit Income Fund; Assistant Treasurer (since September 2022) of the PGIM Private Credit Fund; Assistant Treasurer (since March 2022) of the PGIM Private Real Estate Fund, Inc.; formerly Director (2016-2019) within PGIM Investments Fund Administration; formerly Vice President within Goldman, Sachs & Co. Investment Management Controllers (2008-2016), Assistant Treasurer of Goldman Sachs Family of Funds (2015-2016). | | Since March 2023 |
| | | |
Kelly Florio 1978 Anti-Money Laundering Compliance Officer | | Vice President, Corporate Compliance, Global Compliance Programs and Compliance Risk Management (since December 2021) of Prudential; formerly Head of Fraud Risk Management (October 2019-December 2021) at New York Life Insurance Company; formerly Head of Key Risk Area Operations (November 2018-October 2019), Director of the US Anti-Money Laundering Compliance Unit (2009-2018) and Bank Loss Prevention Associate (2006-2009) at MetLife. | | Since June 2022 |
(a) Excludes Mr. Parker and Mr. Benjamin, interested Board Members who also serve as President and Vice President, respectively.
Explanatory Notes to Tables:
| ∎ | | Board Members are deemed to be “Interested,” as defined in the 1940 Act, by reason of their affiliation with PGIM Investments LLC and/or an affiliate of PGIM Investments LLC. |
| ∎ | | Unless otherwise noted, the address of all Board Members and Officers is c/o PGIM Investments LLC, 655 Broad Street, Newark, New Jersey 07102-4410. |
| ∎ | | There is no set term of office for Board Members or Officers. The Board Members have adopted a retirement policy, which calls for the retirement of Board Members on December 31 of the year in which they reach the age of 75. |
| ∎ | | “Other Directorships Held” includes all directorships of companies required to register or file reports with the SEC under the 1934 Act (that is, “public companies”) or other investment companies registered under the 1940 Act. |
PGIM Absolute Return Bond Fund
| ∎ | | “Portfolios Overseen” includes such applicable investment companies managed by PGIM Investments LLC and overseen by the Board Member. The investment companies for which PGIM Investments LLC serves as manager include the PGIM Mutual Funds, Target Funds, PGIM ETF Trust, PGIM Private Real Estate Fund, Inc., PGIM Private Credit Fund, PGIM Credit Income Fund, PGIM High Yield Bond Fund, Inc., PGIM Global High Yield Fund, Inc., PGIM Short Duration High Yield Opportunities Fund, The Prudential Series Fund, Prudential’s Gibraltar Fund, Inc. and the Advanced Series Trust. |
| ∎ | | As used in the Fund Officers table “Prudential” means The Prudential Insurance Company of America. |
Visit our website at pgim.com/investments
Approval of Advisory Agreements (unaudited)
The Fund’s Board of Trustees
The Board of Trustees (the “Board”) of PGIM Absolute Return Bond Fund (the “Fund”)1 consists of ten individuals, eight of whom are not “interested persons” of the Fund, as defined in the Investment Company Act of 1940, as amended (the “1940 Act”) (the “Independent Trustees”). The Board is responsible for the oversight of the Fund and its operations, and performs the various duties imposed on the directors of investment companies by the 1940 Act. The Independent Trustees have retained independent legal counsel to assist them in connection with their duties. The Chair of the Board is an Independent Trustee. The Board has established five standing committees: the Audit Committee, the Nominating and Governance Committee, the Compliance Committee and two Investment Committees. Each committee is chaired by, and composed of, Independent Trustees.
Annual Approval of the Fund’s Advisory Agreements
As required under the 1940 Act, the Board determines annually whether to renew the Fund’s management agreement with PGIM Investments LLC (“PGIM Investments”), the Fund’s subadvisory agreement with PGIM, Inc. (“PGIM”) on behalf of its PGIM Fixed Income unit (“PGIM Fixed Income”), and the Fund’s sub-subadvisory agreement with PGIM Limited (“PGIML”). In considering the renewal of the agreements, the Board, including all of the Independent Trustees, met on May 25 and June 6-8, 2023 (the “Board Meeting”) and approved the renewal of the agreements through July 31, 2024, after concluding that the renewal of the agreements was in the best interests of the Fund and its shareholders.
In advance of the meetings, the Board requested and received materials relating to the agreements, and had the opportunity to ask questions and request further information in connection with its consideration. Among other things, the Board considered comparative fee information from PGIM Investments, PGIM, and where appropriate, affiliates of PGIM. Also, the Board considered comparisons with other mutual funds in relevant Peer Universes and Peer Groups, as is further discussed below.
In approving the agreements, the Board, including the Independent Trustees advised by independent legal counsel, considered the factors it deemed relevant, including the nature, quality and extent of services provided by PGIM Investments, the subadviser, and, as relevant, its affiliates, the performance of the Fund, the profitability of PGIM Investments and its affiliates, expenses and fees, and the potential for economies of scale that may be shared with the Fund and its shareholders as the Fund’s assets grow. In their deliberations, the Trustees did not identify any single factor which alone was responsible for the Board’s decision to approve the agreements with respect to the Fund. In connection with its deliberations, the Board considered information provided by PGIM Investments throughout the year at regular Board meetings, presentations from portfolio managers and other information, as well as information furnished at or in advance of the Board Meeting.
1PGIM Absolute Return Bond Fund is a series of Prudential Investment Portfolios 9.
PGIM Absolute Return Bond Fund
Approval of Advisory Agreements (continued)
The Trustees determined that the overall arrangements between the Fund and PGIM Investments, which serves as the Fund’s investment manager pursuant to a management agreement, between PGIM Investments and PGIM, which, through its PGIM Fixed Income unit, serves as the Fund’s subadviser pursuant to the terms of a subadvisory agreement with PGIM Investments, and between PGIM and PGIML, which serves as the Fund’s sub-subadviser pursuant to the terms of a sub-subadvisory agreement with PGIM, are in the best interests of the Fund and its shareholders in light of the services performed, fees charged and such other matters as the Trustees considered relevant in the exercise of their business judgment.
The material factors and conclusions that formed the basis for the Trustees’ reaching their determinations to approve the continuance of the agreements are separately discussed below.
Nature, Quality and Extent of Services
The Board received and considered information regarding the nature, quality and extent of services provided to the Fund by PGIM Investments, PGIM Fixed Income, and PGIML. The Board noted that PGIM Fixed Income and PGIML are affiliated with PGIM Investments. The Board considered the services provided by PGIM Investments, including but not limited to the oversight of the subadviser and sub-subadviser for the Fund, as well as the provision of fund recordkeeping, compliance and other services to the Fund, and PGIM Investments’ role as administrator for the Fund’s liquidity risk management program. With respect to PGIM Investments’ oversight of the subadviser and sub-subadviser, the Board noted that PGIM Investments’ Strategic Investment Research Group (“SIRG”), which is a business unit of PGIM Investments, is responsible for monitoring and reporting to PGIM Investments senior management on the performance and operations of the subadviser and sub-subadviser. The Board also considered that PGIM Investments pays the salaries of all of the officers and interested Trustees of the Fund who are part of Fund management. The Board also considered the investment subadvisory services provided by PGIM Fixed Income and PGIML, including investment research and security selection, as well as adherence to the Fund’s investment restrictions and compliance with applicable Fund policies and procedures. The Board considered PGIM Investments’ evaluation of the subadviser and sub-subadviser, as well as PGIM Investments’ recommendation, based on its review of the subadviser and sub-subadviser, to renew the subadvisory and sub-subadvisory agreements.
The Board considered the qualifications, backgrounds and responsibilities of PGIM Investments’ senior management responsible for the oversight of the Fund, PGIM Fixed Income, and PGIML, and also considered the qualifications, backgrounds and responsibilities of PGIM Fixed Income’s portfolio managers who are responsible for the day-to-day management of the Fund’s portfolio. The Board was provided with information pertaining to PGIM Investments’, PGIM Fixed Income’s, and PGIML’s organizational structure, senior management, investment operations, and other relevant
Visit our website at pgim.com/investments
information pertaining to PGIM Investments, PGIM Fixed Income, and PGIML. The Board also noted that it received favorable compliance reports from the Fund’s Chief Compliance Officer (“CCO”) as to PGIM Investments, PGIM Fixed Income, and PGIML.
The Board concluded that it was satisfied with the nature, extent and quality of the investment management services provided by PGIM Investments, the subadvisory services provided to the Fund by PGIM Fixed Income, and the sub-subadvisory services provided by PGIML, and that there was a reasonable basis on which to conclude that the Fund benefits from the services provided by PGIM Investments, PGIM Fixed Income, and PGIML under the management, subadvisory and sub-subadvisory agreements.
Costs of Services and Profits Realized by PGIM Investments
The Board was provided with information on the profitability of PGIM Investments and its affiliates in serving as the Fund’s investment manager. The Board discussed with PGIM Investments the methodology utilized in assembling the information regarding profitability and considered its reasonableness. The Board recognized that it is difficult to make comparisons of profitability from fund management contracts because comparative information is not generally publicly available and is affected by numerous factors, including the structure of the particular adviser, the types of funds it manages, its business mix, numerous assumptions regarding allocations and the adviser’s capital structure and cost of capital. Taking these factors into account, the Board concluded that the profitability of PGIM Investments and its affiliates in relation to the services rendered was not unreasonable.
Economies of Scale
The Board received and discussed information concerning economies of scale that PGIM Investments may realize as the Fund’s assets grow beyond current levels. The Board noted that the management fee schedule for the Fund includes breakpoints, which have the effect of decreasing the fee rate as assets increase. During the course of time, the Board has considered information regarding the launch date of the Fund, the management fees of the Fund compared to those of similarly managed funds and PGIM Investments’ investment in the Fund over time. The Board noted that economies of scale can be shared with the Fund in other ways, including low management fees from inception, additional technological and personnel investments to enhance shareholder services, and maintaining existing expense structures in the face of a rising cost environment. The Board also considered PGIM Investments’ assertion that it continually evaluates the management fee schedule of the Fund and the potential to share economies of scale through breakpoints or fee waivers as asset levels increase.
The Board recognized the inherent limitations of any analysis of economies of scale, stemming largely from the Board’s understanding that most of PGIM Investments’ costs are not specific to individual funds, but rather are incurred across a variety of products and services.
PGIM Absolute Return Bond Fund
Approval of Advisory Agreements (continued)
Other Benefits to PGIM Investments, PGIM Fixed Income, and PGIML
The Board considered potential ancillary benefits that might be received by PGIM Investments, PGIM Fixed Income, PGIML and their affiliates as a result of their relationship with the Fund. The Board concluded that potential benefits to be derived by PGIM Investments included transfer agency fees received by the Fund’s transfer agent (which is affiliated with PGIM Investments), as well as benefits to its reputation or other intangible benefits resulting from PGIM Investments’ association with the Fund. The Board concluded that the potential benefits to be derived by PGIM Fixed Income and PGIML included the ability to use soft dollar credits, as well as the potential benefits consistent with those generally resulting from an increase in assets under management, specifically, potential access to additional research resources and benefits to their reputations. The Board concluded that the benefits derived by PGIM Investments, PGIM Fixed Income, and PGIML were consistent with the types of benefits generally derived by investment managers and subadvisers to mutual funds.
Performance of the Fund / Fees and Expenses
The Board considered certain additional factors and made related conclusions relating to the historical performance of the Fund for the one, three-, and five-year periods ended December 31, 2022.
The Board also considered the Fund’s actual management fee, as well as the Fund’s net total expense ratio, for the fiscal year ended October 31, 2022. The Board considered the management fee for the Fund as compared to the management fee charged by PGIM Investments to other funds and the fee charged by other advisers to comparable mutual funds in a Peer Group. The actual management fee represents the fee rate actually paid by Fund shareholders and includes any fee waivers or reimbursements. The net total expense ratio for the Fund represents the actual expense ratio incurred by Fund shareholders.
The mutual funds included in the Peer Universe, which was used to consider performance, and the Peer Group, which was used to consider expenses and fees, were objectively determined by Broadridge, an independent provider of mutual fund data. In certain circumstances, PGIM Investments also provided supplemental Peer Universe or Peer Group information, for reasons addressed with the Board. The comparisons placed the Fund in various quartiles over various periods, with the first quartile being the best 25% of the mutual funds (for performance, the best performing mutual funds and, for expenses, the lowest cost mutual funds).
The section below summarizes key factors considered by the Board and the Board’s conclusions regarding the Fund’s performance, fees and overall expenses. The table sets forth net performance comparisons (which reflect the impact on performance of fund expenses, or any subsidies, expense caps or waivers that may be applicable) with the Peer Universe, actual management fees with the Peer Group (which reflect the impact of any subsidies or fee waivers), and net total expenses with the Peer Group, each of which were key factors considered by the Board.
Visit our website at pgim.com/investments
| | | | | | | | |
| | | | | |
Net Performance | | 1 Year | | 3 Years | | 5 Years | | 10 Years |
| | 1st Quartile | | 2nd Quartile | | 1st Quartile | | 1st Quartile |
| | |
| Actual Management Fees: 2nd Quartile | | |
| |
| Net Total Expenses: 2nd Quartile |
| · | | The Board noted that the Fund outperformed its benchmark index over the five- and ten-year periods, and underperformed over the one- and three-year periods. |
| · | | The Board and PGIM Investments agreed to retain the existing contractual expense cap, which (exclusive of certain fees and expenses) caps total annual operating expenses at 0.70% for Class R6 shares, and 0.73% for Class Z shares through February 29, 2024. |
| · | | In addition, PGIM Investments will waive management fees or shared operating expenses on any share class to the same extent that it waives such expenses on any other share class, and has agreed that total annual fund operating expenses for Class R6 shares will not exceed total annual fund operating expenses for Class Z shares. |
| · | | The Board concluded that, in light of the above, it would be in the best interests of the Fund and its shareholders to renew the agreements. |
| · | | The Board concluded that the management fees (including subadvisory fees) and total expenses were reasonable in light of the services provided. |
* * *
After full consideration of these factors, the Board concluded that the approval of the agreements was in the best interests of the Fund and its shareholders.
PGIM Absolute Return Bond Fund
| | | | |
| ∎ MAIL | | ∎ TELEPHONE | | ∎ WEBSITE |
655 Broad Street Newark, NJ 07102 | | (800)225-1852 | | pgim.com/investments |
|
| |
| PROXY VOTING |
The Board of Trustees of the Fund has delegated to the Fund’s subadviser the responsibility for voting any proxies and maintaining proxy recordkeeping with respect to the Fund. A description of these proxy voting policies and procedures is available without charge, upon request, by calling (800) 225-1852 or by visiting the Securities and Exchange Commission’s website at sec.gov. Information regarding how the Fund voted proxies relating to portfolio securities during the most recent 12-month period ended June 30 is available on the Fund’s website and on the Securities and Exchange Commission’s website. |
|
| |
| TRUSTEES |
Ellen S. Alberding · Kevin J. Bannon · Scott E. Benjamin · Linda W. Bynoe · Barry H. Evans · Keith F. Hartstein · Laurie Simon Hodrick · Stuart S. Parker · Brian K. Reid · Grace C. Torres |
|
| |
| OFFICERS |
Stuart S. Parker, President · Scott E. Benjamin, Vice President · Christian J. Kelly, Chief Financial Officer · Claudia DiGiacomo, Chief Legal Officer · Andrew Donohue, Chief Compliance Officer · Russ Shupak, Treasurer and Principal Accounting Officer · Kelly Florio, Anti-Money Laundering Compliance Officer · Andrew R. French, Secretary · Melissa Gonzalez, Assistant Secretary · Kelly A. Coyne, Assistant Secretary · Patrick E. McGuinness, Assistant Secretary · Debra Rubano, Assistant Secretary · George Hoyt, Assistant Secretary · Devan Goolsby, Assistant Secretary · Lana Lomuti, Assistant Treasurer · Elyse M. McLaughlin, Assistant Treasurer · Deborah Conway, Assistant Treasurer · Robert W. McCormack, Assistant Treasurer |
| | | | |
| MANAGER | | PGIM Investments LLC | | 655 Broad Street Newark, NJ 07102 |
| | |
| SUBADVISER | | PGIM Fixed Income | | 655 Broad Street Newark, NJ 07102 |
| | |
| SUB-SUBADVISER | | PGIM Limited | | Grand Buildings, 1-3 Strand Trafalgar Square London, WC2N 5HR United Kingdom |
| | |
| DISTRIBUTOR | | Prudential Investment Management Services LLC | | 655 Broad Street Newark, NJ 07102 |
| | |
| CUSTODIAN | | The Bank of New York Mellon | | 240 Greenwich Street New York, NY 10286 |
| | |
| TRANSFER AGENT | | Prudential Mutual Fund Services LLC | | PO Box 534432 Pittsburgh, PA 15253 |
| | |
INDEPENDENT REGISTERED PUBLIC ACCOUNTING FIRM | | PricewaterhouseCoopers LLP | | 300 Madison Avenue New York, NY 10017 |
| | |
| FUND COUNSEL | | Willkie Farr & Gallagher LLP | | 787 Seventh Avenue New York, NY 10019 |
An investor should consider the investment objectives, risks, charges, and expenses of the Fund carefully before investing. The prospectus and summary prospectus contain this and other information about the Fund. An investor may obtain the prospectus and summary prospectus by visiting our website at pgim.com/investments or by calling (800) 225-1852. The prospectus and summary prospectus should be read carefully before investing.
E-DELIVERY
To receive your mutual fund documents online, go to pgim.com/investments/resource/edelivery and enroll. Instead of receiving printed documents by mail, you will receive notification via email when new materials are available. You can cancel your enrollment or change your email address at any time by visiting the website address above.
SHAREHOLDER COMMUNICATIONS WITH TRUSTEES
Shareholders can communicate directly with the Board of Trustees by writing to the Chair of the Board, PGIM Absolute Return Bond Fund, PGIM Investments, Attn: Board of Trustees, 655 Broad Street, Newark, NJ 07102. Shareholders can communicate directly with an individual Trustee by writing to that Trustee at the same address. Communications are not screened before being delivered to the addressee.
AVAILABILITY OF PORTFOLIO HOLDINGS
The Fund files its complete schedule of portfolio holdings with the Securities and Exchange Commission for the first and third quarters of each fiscal year as an exhibit to its reports on Form N-PORT. The Fund’s Form N-PORT filings are available on the Commission’s website at sec.gov.
The Fund’s Statement of Additional Information contains additional information about the Fund’s Trustees and is available without charge, upon request, by calling (800) 225-1852.
Mutual Funds:
| | | | |
| | | |
ARE NOT INSURED BY THE FDIC OR ANY FEDERAL GOVERNMENT AGENCY | | MAY LOSE VALUE | | ARE NOT A DEPOSIT OF OR GUARANTEED BY ANY BANK OR ANY BANK AFFILIATE |

PGIM ABSOLUTE RETURN BOND FUND
| | | | | | | | |
| | | | |
SHARE CLASS | | A | | C | | Z | | R6 |
| | | | |
NASDAQ | | PADAX | | PADCX | | PADZX | | PADQX |
| | | | |
CUSIP | | 74441J852 | | 74441J845 | | 74441J829 | | 74441J837 |
MF213E

PGIM QUANT SOLUTIONS LARGE-CAP CORE FUND
ANNUAL REPORT
OCTOBER 31, 2023

To enroll in e-delivery, go to pgim.com/investments/resource/edelivery
Table of Contents
This report is not authorized for distribution to prospective investors unless preceded or accompanied by a current prospectus.
The views expressed in this report and information about the Fund’s portfolio holdings are for the period covered by this report and are subject to change thereafter.
Mutual funds are distributed by Prudential Investment Management Services LLC, a Prudential Financial company and member SIPC. PGIM Quantitative Solutions LLC, a wholly owned subsidiary of PGIM, Inc. (PGIM), is a registered investment adviser. © 2023 Prudential Financial, Inc. and its related entities. PGIM and the PGIM logo are service marks of Prudential Financial, Inc. and its related entities, registered in many jurisdictions worldwide.
2 Visit our website at pgim.com/investments
Letter from the President
| | |
 | | Dear Shareholder: |
| | We hope you find the annual report for the PGIM Quant Solutions Large-Cap Core Fund informative and useful. The report covers performance for the 12-month period that ended October 31, 2023. Although central banks raised interest rates aggressively to tame surging inflation during the period, the global economy and financial markets demonstrated resilience. Employers continued hiring, consumers continued spending, home prices rose, and recession fears receded. |
Early in the period, stocks began a rally that eventually ended a bear market and continued to rise globally for much of 2023 as inflation cooled and the Federal Reserve (the Fed) slowed the pace of its rate hikes. However, stocks declined late in the period when the Fed signaled that rates may remain elevated longer than investors had expected. For the entire period, large-cap US stocks and equities in international markets posted gains, while small-cap US stocks declined.
Bond markets benefited during the period as the Fed moderated its rate-hiking cycle, and the higher level of interest rates offered investors an additional cushion from fixed income volatility. US and global investment-grade bonds, along with US high yield corporate bonds and emerging market debt, all posted gains.
Regarding your investments with PGIM, we believe it is important to maintain a diversified portfolio of funds consistent with your tolerance for risk, time horizon, and financial goals. Your financial advisor can help you create a diversified investment plan that may include funds covering all the basic asset classes and that reflects your personal investor profile and risk tolerance. However, diversification and asset allocation strategies do not assure a profit or protect against loss in declining markets.
At PGIM Investments, we provide access to active investment strategies across the global markets in the pursuit of consistent outperformance for investors. PGIM is the world’s 14th-largest investment manager with more than $1.3 trillion in assets under management. Our scale and investment expertise allow us to deliver a diversified suite of actively managed solutions across a broad spectrum of asset classes and investment styles.
Thank you for choosing our family of funds.
Sincerely,

Stuart S. Parker, President
PGIM Quant Solutions Large-Cap Core Fund
December 15, 2023
PGIM Quant Solutions Large-Cap Core Fund 3
Your Fund’s Performance (unaudited)
Performance data quoted represent past performance. Past performance does not guarantee future results. The investment return and principal value of an investment will fluctuate so that an investor’s shares, when redeemed, may be worth more or less than their original cost. Current performance may be lower or higher than the past performance data quoted. An investor may obtain performance data as of the most recent month-end by visiting our website at pgim.com/investments or by calling (800) 225-1852.
| | | | | | | | | | | | | | |
| |
| | | Average Annual Total Returns as of 10/31/23 |
| | | One Year (%) | | | Five Years (%) | | | Ten Years (%) | | | Since Inception (%) |
| | | | |
Class A | | | | | | | | | | | | | | |
| | | | |
(with sales charges) | | | 3.16 | | | | 8.03 | | | | 9.41 | | | — |
| | | | |
(without sales charges) | | | 9.16 | | | | 9.26 | | | | 10.03 | | | — |
| | | | |
Class C | | | | | | | | | | | | | | |
| | | | |
(with sales charges) | | | 7.37 | | | | 8.47 | | | | 9.23 | | | — |
| | | | |
(without sales charges) | | | 8.37 | | | | 8.47 | | | | 9.23 | | | — |
| | | | |
Class Z | | | | | | | | | | | | | | |
| | | | |
(without sales charges) | | | 9.43 | | | | 9.53 | | | | 10.31 | | | — |
| | | | |
Class R6 | | | | | | | | | | | | | | |
| | | | |
(without sales charges) | | | 9.56 | | | | 9.67 | | | | N/A | | | 10.43 (12/28/2016) |
| | | | |
S&P 500 Index | | | | | | | | | | | | | | |
| | | | |
| | | | 10.14 | | | | 11.01 | | | | 11.18 | | | — |
| | | | | | | | |
Average Annual Total Returns as of 10/31/23 Since Inception (%) | | | | | | |
| | | | | | | | | Class R6 |
| | | | | | | | | (12/28/2016) |
| | | | |
S&P 500 Index | | | | | | | | 11.59 |
Since Inception returns are provided for any share class with less than 10 fiscal years of returns. Since Inception returns for the Index are measured from the closest month-end to the class’s inception date.
4 Visit our website at pgim.com/investments
Growth of a $10,000 Investment (unaudited)
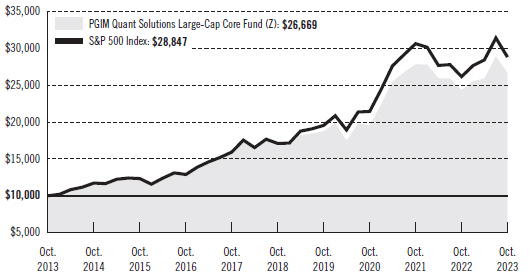
The graph compares a $10,000 investment in the Fund’s Class Z shares with a similar investment in the S&P 500 Index by portraying the initial account values at the beginning of the 10-year period for Class Z shares (October 31, 2013) and the account values at the end of the current fiscal year (October 31, 2023) as measured on a quarterly basis. For purposes of the graph, and unless otherwise indicated, it has been assumed that (a) all recurring fees (including management fees) were deducted and (b) all dividends and distributions were reinvested. The line graph provides information for Class Z shares only. As indicated in the tables provided earlier, performance for other share classes will vary due to the differing fees and expenses applicable to each share class (as indicated in the following paragraphs). Without waiver of fees and/or expense reimbursements, if any, the returns would have been lower.
Past performance does not predict future performance. Total returns and the ending account values in the graphs include changes in share price and reinvestment of dividends and capital gains distributions in a hypothetical investment for the periods shown. The Fund’s total returns do not reflect the deduction of income taxes on an individual’s investment. Taxes may reduce your actual investment returns on income or gains paid by the Fund or any gains you may realize if you sell your shares.
PGIM Quant Solutions Large-Cap Core Fund 5
Your Fund’s Performance (continued)
The returns in the tables do not reflect the deduction of taxes that a shareholder would pay on Fund distributions or following the redemption of Fund shares. The average annual total returns take into account applicable sales charges, which are described for each share class in the table below.
| | | | | | | | |
| | | | | |
| | | Class A | | Class C | | Class Z | | Class R6 |
| | | | | |
| Maximum initial sales charge | | 5.50% of the public offering price | | None | | None | | None |
| Contingent deferred sales charge (CDSC) (as a percentage of the lower of the original purchase price or the net asset value at redemption) | | 1.00% on sales of $1 million or more made within 12 months of purchase | | 1.00% on sales made within 12 months of purchase | | None | | None |
| Annual distribution and service (12b-1) fees (shown as a percentage of average daily net assets) | | 0.30% (0.25% currently) | | 1.00% | | None | | None |
Benchmark Definition
S&P 500 Index*—The S&P 500 Index is an unmanaged index of over 500 stocks of large US public companies. It gives a broad look at how large company stocks in the United States have performed.
*The S&P 500 Index is a product of S&P Dow Jones Indices LLC and/or its affiliates and has been licensed for use by PGIM, Inc. and/or its affiliates. Copyright © 2023 S&P Dow Jones Indices LLC, a division of S&P Global, Inc., and/or its affiliates. All rights reserved. Redistribution or reproduction in whole or in part are prohibited without written permission of S&P Dow Jones Indices LLC. For more information on any of S&P Dow Jones Indices LLC’s indices please visit www.spdji.com. S&P® is a registered trademark of S&P Global and Dow Jones® is a registered trademark of Dow Jones Trademark Holdings LLC.
Investors cannot invest directly in an index. The returns for the Index would be lower if they included the effects of sales charges, operating expenses of a mutual fund, or taxes that may be paid by an investor.
6 Visit our website at pgim.com/investments
Presentation of Fund Holdings as of 10/31/23
| | | | |
| | |
Ten Largest Holdings | | Line of Business | | % of Net Assets |
| | |
Microsoft Corp. | | Software | | 7.6% |
| | |
Apple, Inc. | | Technology Hardware, Storage & Peripherals | | 6.7% |
| | |
Amazon.com, Inc. | | Broadline Retail | | 3.8% |
| | |
NVIDIA Corp. | | Semiconductors & Semiconductor Equipment | | 3.5% |
| | |
Alphabet, Inc. (Class A Stock) | | Interactive Media & Services | | 2.3% |
| | |
Alphabet, Inc. (Class C Stock) | | Interactive Media & Services | | 2.1% |
| | |
Eli Lilly & Co. | | Pharmaceuticals | | 1.7% |
| | |
Meta Platforms, Inc. (Class A Stock) | | Interactive Media & Services | | 1.6% |
| | |
Johnson & Johnson | | Pharmaceuticals | | 1.6% |
| | |
Mastercard, Inc. (Class A Stock) | | Financial Services | | 1.4% |
Holdings reflect only long-term investments and are subject to change.
PGIM Quant Solutions Large-Cap Core Fund 7
Strategy and Performance Overview* (unaudited)
How did the Fund perform?
The PGIM Quant Solutions Large-Cap Core Fund’s Class Z shares returned 9.43% in the 12-month reporting period that ended October 31, 2023, underperforming the 10.14% return of the S&P 500 Index (the Index).
What were the market conditions?
| · | | Inflation continued to occupy headlines during the reporting period. The US Federal Reserve (Fed) signaled that it would not loosen monetary conditions until confident that inflationary pressures were easing, and the annual inflation rate was on a trajectory to return to the Fed’s 2% target. |
| · | | US large-cap stocks continued to outperform small-cap stocks. Artificial intelligence (AI) hype associated with mega-cap tech stocks, which was prevalent during the first half of 2023, faded a bit during the third quarter as investors focused on inflation and interest rates. |
What worked?
Favoring stocks with positive, stable earnings streams contributed positively to the Fund’s performance, particularly in the utilities and information technology sectors.
What didn’t work?
While inexpensive stocks performed well during the final months of 2022, they underperformed their more expensive counterparts during the first half of 2023. Much of the latter trend resulted from the regional banking crisis that occurred during the first quarter of 2023.
Did the Fund use derivatives?
The Fund held futures contracts on the Index during the reporting period. PGIM Quantitative Solutions used these instruments during the reporting period primarily to manage daily cash flows, provide liquidity, and equitize cash—not as a means of adding to performance. Consequently, the effect on Fund performance was minimal.
Current outlook
While a recession looks less likely than it did at the start of the year, macroeconomic risks remain, many of which are outside of the Fed’s control. While inflationary pressures are easing, the Fed’s rate hike cycle may not be over. Mortgage rates have stayed stubbornly above 7%, contributing to a slowdown in housing starts. There are also increasing consumer headwinds, such as the restart of student loan repayments after the pandemic-driven pause. PGIM Quantitative Solutions believes that its core portfolios are well positioned for this market environment.
*This strategy and performance overview, which discusses what strategies or holdings (including derivatives, if applicable) affected the Fund’s performance, is compiled based on how the Fund performed relative to the Index and is viewed for performance attribution purposes at the aggregate Fund level, which in most instances will not directly correlate to the amounts disclosed in the Statement of Operations which conform to US generally accepted accounting principles.
8 Visit our website at pgim.com/investments
Fees and Expenses (unaudited)
As a shareholder of the Fund, you incur two types of costs: (1) transaction costs, including sales charges (loads) on purchase payments and redemptions, as applicable, and (2) ongoing costs, including management fees, distribution and/or service (12b-1) fees, and other Fund expenses, as applicable. This example is intended to help you understand your ongoing costs (in dollars) of investing in the Fund and to compare these costs with the ongoing costs of investing in other mutual funds.
The example is based on an investment of $1,000 held through the six-month period ended October 31, 2023. The example is for illustrative purposes only; you should consult the Prospectus for information on initial and subsequent minimum investment requirements.
Actual Expenses
The first line for each share class in the table on the following page provides information about actual account values and actual expenses. You may use the information on this line, together with the amount you invested, to estimate the expenses that you paid over the period. Simply divide your account value by $1,000 (for example, an $8,600 account value ÷ $1,000 = 8.6), then multiply the result by the number on the first line under the heading “Expenses Paid During the Six-Month Period” to estimate the expenses you paid on your account during this period.
Hypothetical Example for Comparison Purposes
The second line for each share class in the table on the following page provides information about hypothetical account values and hypothetical expenses based on the Fund’s actual expense ratio and an assumed rate of return of 5% per year before expenses, which is not the Fund’s actual return. The hypothetical account values and expenses may not be used to estimate the actual ending account balance or expenses you paid for the period. You may use this information to compare the ongoing costs of investing in the Fund and other funds. To do so, compare this 5% hypothetical example with the 5% hypothetical examples that appear in the shareholder reports of the other funds.
The Fund’s transfer agent may charge additional fees to holders of certain accounts that are not included in the expenses shown in the table on the following page. These fees apply to individual retirement accounts (IRAs) and Section 403(b) accounts. As of the close of the six-month period covered by the table, IRA fees included an annual maintenance fee of $15 per account (subject to a maximum annual maintenance fee of $25 for all accounts held by the same shareholder). Section 403(b) accounts are charged an annual $25 fiduciary maintenance fee. Some of the fees may vary in amount, or may be waived, based on your total account balance or the number of PGIM funds, including the Fund, that you own. You should consider the additional fees that were charged to your Fund account over the six-month period when you estimate the total ongoing expenses paid over the period and the impact of these fees on your ending account value, as these additional expenses are not reflected in the information
PGIM Quant Solutions Large-Cap Core Fund 9
Fees and Expenses (continued)
provided in the expense table. Additional fees have the effect of reducing investment returns.
Please note that the expenses shown in the table are meant to highlight your ongoing costs only and do not reflect any transactional costs such as sales charges (loads). Therefore, the second line for each share class in the table is useful in comparing ongoing costs only and will not help you determine the relative total costs of owning different funds. In addition, if these transactional costs were included, your costs would have been higher.
| | | | | | | | | | |
| | | | |
PGIM Quant Solutions Large-Cap Core Fund | | Beginning
Account Value
May 1, 2023 | | Ending Account Value
October 31, 2023 | | Annualized Expense
Ratio Based on the Six-Month Period | | Expenses Paid During the
Six-Month Period* |
| | | | | |
| Class A | | Actual | | $1,000.00 | | $1,027.50 | | 0.72% | | $3.68 |
| | | | | |
| | | Hypothetical | | $1,000.00 | | $1,021.58 | | 0.72% | | $3.67 |
| | | | | |
| Class C | | Actual | | $1,000.00 | | $1,024.30 | | 1.44% | | $7.35 |
| | | | | |
| | | Hypothetical | | $1,000.00 | | $1,017.95 | | 1.44% | | $7.32 |
| | | | | |
| Class Z | | Actual | | $1,000.00 | | $1,028.90 | | 0.46% | | $2.35 |
| | | | | |
| | | Hypothetical | | $1,000.00 | | $1,022.89 | | 0.46% | | $2.35 |
| | | | | |
| Class R6 | | Actual | | $1,000.00 | | $1,029.40 | | 0.35% | | $1.79 |
| | | | | |
| | | Hypothetical | | $1,000.00 | | $1,023.44 | | 0.35% | | $1.79 |
*Fund expenses (net of fee waivers or subsidies, if any) for each share class are equal to the annualized expense ratio for each share class (provided in the table), multiplied by the average account value over the period, multiplied by the 184 days in the six-month period ended October 31, 2023, and divided by the 365 days in the Fund’s fiscal year ended October 31, 2023 (to reflect the six-month period). Expenses presented in the table include the expenses of any underlying portfolios in which the Fund may invest.
10 Visit our website at pgim.com/investments
Schedule of Investments
as of October 31, 2023
| | | | | | | | |
| | |
| Description | | Shares | | | Value | |
| | |
LONG-TERM INVESTMENTS 98.4% | | | | | | | | |
| | |
COMMON STOCKS | | | | | | | | |
| | |
Aerospace & Defense 2.4% | | | | | | | | |
| | |
Boeing Co. (The)* | | | 19,900 | | | $ | 3,717,718 | |
Howmet Aerospace, Inc. | | | 20,000 | | | | 882,000 | |
L3Harris Technologies, Inc. | | | 7,500 | | | | 1,345,575 | |
Lockheed Martin Corp. | | | 3,733 | | | | 1,697,171 | |
Northrop Grumman Corp. | | | 7,800 | | | | 3,677,154 | |
RTX Corp. | | | 20,300 | | | | 1,652,217 | |
Textron, Inc. | | | 50,100 | | | | 3,807,600 | |
| | | | | | | | |
| | |
| | | | | | | 16,779,435 | |
| | |
Air Freight & Logistics 0.7% | | | | | | | | |
| | |
FedEx Corp. | | | 19,100 | | | | 4,585,910 | |
| | |
Automobiles 2.2% | | | | | | | | |
| | |
Ford Motor Co. | | | 378,900 | | | | 3,694,275 | |
General Motors Co. | | | 150,900 | | | | 4,255,380 | |
Tesla, Inc.* | | | 38,400 | | | | 7,712,256 | |
| | | | | | | | |
| | |
| | | | | | | 15,661,911 | |
| | |
Banks 3.2% | | | | | | | | |
| | |
Bank of America Corp. | | | 262,900 | | | | 6,924,786 | |
Citigroup, Inc. | | | 87,278 | | | | 3,446,608 | |
JPMorgan Chase & Co. | | | 31,581 | | | | 4,391,654 | |
Truist Financial Corp. | | | 89,800 | | | | 2,546,728 | |
Wells Fargo & Co. | | | 127,500 | | | | 5,070,675 | |
| | | | | | | | |
| | |
| | | | | | | 22,380,451 | |
| | |
Beverages 2.2% | | | | | | | | |
| | |
Coca-Cola Co. (The) | | | 143,800 | | | | 8,123,262 | |
PepsiCo, Inc. | | | 47,000 | | | | 7,674,160 | |
| | | | | | | | |
| | |
| | | | | | | 15,797,422 | |
| | |
Biotechnology 1.5% | | | | | | | | |
| | |
AbbVie, Inc. | | | 45,951 | | | | 6,487,362 | |
Amgen, Inc. | | | 16,800 | | | | 4,295,760 | |
| | | | | | | | |
| | |
| | | | | | | 10,783,122 | |
See Notes to Financial Statements.
PGIM Quant Solutions Large-Cap Core Fund 11
Schedule of Investments (continued)
as of October 31, 2023
| | | | | | | | |
| | |
| Description | | Shares | | | Value | |
| | |
COMMON STOCKS (Continued) | | | | | | | | |
| | |
Broadline Retail 4.2% | | | | | | | | |
| | |
Amazon.com, Inc.* | | | 199,440 | | | $ | 26,543,470 | |
Coupang, Inc. (South Korea)* | | | 182,600 | | | | 3,104,200 | |
| | | | | | | | |
| | |
| | | | | | | 29,647,670 | |
| | |
Building Products 0.1% | | | | | | | | |
| | |
Armstrong World Industries, Inc. | | | 3,300 | | | | 250,437 | |
AZEK Co., Inc. (The)* | | | 12,600 | | | | 330,120 | |
Masonite International Corp.* | | | 5,800 | | | | 459,012 | |
| | | | | | | | |
| | |
| | | | | | | 1,039,569 | |
| | |
Capital Markets 2.2% | | | | | | | | |
| | |
Bank of New York Mellon Corp. (The) | | | 101,600 | | | | 4,318,000 | |
BGC Group, Inc. (Class A Stock) | | | 143,000 | | | | 839,410 | |
Intercontinental Exchange, Inc. | | | 35,600 | | | | 3,824,864 | |
Moody’s Corp. | | | 2,500 | | | | 770,000 | |
MSCI, Inc. | | | 3,000 | | | | 1,414,650 | |
State Street Corp. | | | 31,200 | | | | 2,016,456 | |
Victory Capital Holdings, Inc. (Class A Stock) | | | 16,400 | | | | 483,144 | |
Virtu Financial, Inc. (Class A Stock) | | | 84,200 | | | | 1,556,858 | |
| | | | | | | | |
| | |
| | | | | | | 15,223,382 | |
| | |
Chemicals 1.2% | | | | | | | | |
| | |
Ecolab, Inc. | | | 11,100 | | | | 1,861,914 | |
PPG Industries, Inc. | | | 20,900 | | | | 2,565,893 | |
Sherwin-Williams Co. (The) | | | 17,200 | | | | 4,097,212 | |
| | | | | | | | |
| | |
| | | | | | | 8,525,019 | |
| | |
Communications Equipment 1.1% | | | | | | | | |
| | |
Arista Networks, Inc.* | | | 1,100 | | | | 220,407 | |
Cisco Systems, Inc. | | | 145,982 | | | | 7,610,042 | |
| | | | | | | | |
| | |
| | | | | | | 7,830,449 | |
| | |
Construction & Engineering 0.6% | | | | | | | | |
| | |
Fluor Corp.* | | | 68,400 | | | | 2,277,036 | |
Sterling Infrastructure, Inc.* | | | 23,100 | | | | 1,682,835 | |
| | | | | | | | |
| | |
| | | | | | | 3,959,871 | |
See Notes to Financial Statements.
12
| | | | | | | | |
| | |
| Description | | Shares | | | Value | |
| | |
COMMON STOCKS (Continued) | | | | | | | | |
| | |
Construction Materials 0.9% | | | | | | | | |
| | |
Martin Marietta Materials, Inc. | | | 4,900 | | | $ | 2,003,806 | |
Vulcan Materials Co. | | | 20,300 | | | | 3,988,747 | |
| | | | | | | | |
| | |
| | | | | | | 5,992,553 | |
| | |
Consumer Staples Distribution & Retail 1.3% | | | | | | | | |
| | |
Costco Wholesale Corp. | | | 5,300 | | | | 2,927,932 | |
Target Corp. | | | 15,800 | | | | 1,750,482 | |
United Natural Foods, Inc.* | | | 73,500 | | | | 1,071,630 | |
Walmart, Inc. | | | 20,900 | | | | 3,415,269 | |
| | | | | | | | |
| | |
| | | | | | | 9,165,313 | |
| | |
Distributors 0.2% | | | | | | | | |
| | |
Genuine Parts Co. | | | 7,600 | | | | 979,336 | |
LKQ Corp. | | | 12,000 | | | | 527,040 | |
| | | | | | | | |
| | |
| | | | | | | 1,506,376 | |
| | |
Diversified Consumer Services 0.3% | | | | | | | | |
| | |
Frontdoor, Inc.* | | | 70,400 | | | | 2,036,672 | |
| | |
Diversified Telecommunication Services 1.4% | | | | | | | | |
| | |
AT&T, Inc. | | | 363,435 | | | | 5,596,899 | |
Verizon Communications, Inc. | | | 114,400 | | | | 4,018,872 | |
| | | | | | | | |
| | |
| | | | | | | 9,615,771 | |
| | |
Electric Utilities 0.9% | | | | | | | | |
| | |
ALLETE, Inc. | | | 13,600 | | | | 728,144 | |
NextEra Energy, Inc. | | | 15,800 | | | | 921,140 | |
NRG Energy, Inc. | | | 29,300 | | | | 1,241,734 | |
PG&E Corp.*(a) | | | 132,400 | | | | 2,158,120 | |
Portland General Electric Co. | | | 28,200 | | | | 1,128,564 | |
| | | | | | | | |
| | |
| | | | | | | 6,177,702 | |
| | |
Electrical Equipment 1.3% | | | | | | | | |
| | |
Eaton Corp. PLC | | | 1,000 | | | | 207,910 | |
Emerson Electric Co. | | | 49,900 | | | | 4,439,603 | |
EnerSys | | | 2,500 | | | | 213,950 | |
Vertiv Holdings Co. | | | 116,900 | | | | 4,590,663 | |
| | | | | | | | |
| | |
| | | | | | | 9,452,126 | |
See Notes to Financial Statements.
PGIM Quant Solutions Large-Cap Core Fund 13
Schedule of Investments (continued)
as of October 31, 2023
| | | | | | | | |
| | |
| Description | | Shares | | | Value | |
| | |
COMMON STOCKS (Continued) | | | | | | | | |
| | |
Energy Equipment & Services 0.1% | | | | | | | | |
| | |
Baker Hughes Co. | | | 6,000 | | | $ | 206,520 | |
TETRA Technologies, Inc.* | | | 94,100 | | | | 446,034 | |
| | | | | | | | |
| | |
| | | | | | | 652,554 | |
| | |
Entertainment 1.5% | | | | | | | | |
| | |
Electronic Arts, Inc. | | | 19,700 | | | | 2,438,663 | |
Netflix, Inc.* | | | 16,900 | | | | 6,957,561 | |
Warner Bros Discovery, Inc.* | | | 114,900 | | | | 1,142,106 | |
| | | | | | | | |
| | |
| | | | | | | 10,538,330 | |
| | |
Financial Services 5.0% | | | | | | | | |
| | |
Berkshire Hathaway, Inc. (Class B Stock)* | | | 24,274 | | | | 8,285,444 | |
Fidelity National Information Services, Inc. | | | 73,100 | | | | 3,589,941 | |
Mastercard, Inc. (Class A Stock) | | | 26,100 | | | | 9,822,735 | |
NCR Atleos Corp.* | | | 33,750 | | | | 744,525 | |
PayPal Holdings, Inc.* | | | 62,800 | | | | 3,253,040 | |
Visa, Inc. (Class A Stock)(a) | | | 39,825 | | | | 9,362,858 | |
| | | | | | | | |
| | |
| | | | | | | 35,058,543 | |
| | |
Food Products 1.3% | | | | | | | | |
| | |
Archer-Daniels-Midland Co. | | | 60,000 | | | | 4,294,200 | |
Hain Celestial Group, Inc. (The)* | | | 37,700 | | | | 416,585 | |
Mondelez International, Inc. (Class A Stock) | | | 71,500 | | | | 4,734,015 | |
| | | | | | | | |
| | |
| | | | | | | 9,444,800 | |
| | |
Gas Utilities 0.1% | | | | | | | | |
| | |
UGI Corp. | | | 17,300 | | | | 359,840 | |
| | |
Ground Transportation 0.2% | | | | | | | | |
| | |
Uber Technologies, Inc.* | | | 32,500 | | | | 1,406,600 | |
| | |
Health Care Equipment & Supplies 2.5% | | | | | | | | |
| | |
Abbott Laboratories | | | 38,200 | | | | 3,611,810 | |
Baxter International, Inc. | | | 73,000 | | | | 2,367,390 | |
Boston Scientific Corp.* | | | 64,200 | | | | 3,286,398 | |
DENTSPLY SIRONA, Inc. | | | 10,000 | | | | 304,100 | |
GE HealthCare Technologies, Inc. | | | 9,900 | | | | 659,043 | |
Medtronic PLC | | | 76,000 | | | | 5,362,560 | |
Zimmer Biomet Holdings, Inc. | | | 19,900 | | | | 2,077,759 | |
| | | | | | | | |
| | |
| | | | | | | 17,669,060 | |
See Notes to Financial Statements.
14
| | | | | | | | |
| | |
| Description | | Shares | | | Value | |
| | |
COMMON STOCKS (Continued) | | | | | | | | |
| | |
Health Care Providers & Services 3.7% | | | | | | | | |
| | |
Cardinal Health, Inc. | | | 46,700 | | | $ | 4,249,700 | |
Elevance Health, Inc. | | | 8,100 | | | | 3,645,729 | |
HealthEquity, Inc.* | | | 45,300 | | | | 3,247,104 | |
Humana, Inc. | | | 10,400 | | | | 5,446,376 | |
McKesson Corp. | | | 7,600 | | | | 3,460,736 | |
UnitedHealth Group, Inc. | | | 10,600 | | | | 5,676,936 | |
| | | | | | | | |
| | |
| | | | | | | 25,726,581 | |
| | |
Health Care REITs 0.1% | | | | | | | | |
| | |
CareTrust REIT, Inc. | | | 24,600 | | | | 529,392 | |
| | |
Hotels, Restaurants & Leisure 1.8% | | | | | | | | |
| | |
Booking Holdings, Inc.* | | | 800 | | | | 2,231,648 | |
Hilton Worldwide Holdings, Inc. | | | 22,600 | | | | 3,424,578 | |
Marriott International, Inc. (Class A Stock) | | | 5,300 | | | | 999,368 | |
McDonald’s Corp. | | | 14,600 | | | | 3,827,682 | |
Starbucks Corp. | | | 20,700 | | | | 1,909,368 | |
| | | | | | | | |
| | |
| | | | | | | 12,392,644 | |
| | |
Household Durables 0.2% | | | | | | | | |
| | |
Beazer Homes USA, Inc.* | | | 42,200 | | | | 1,020,818 | |
Lennar Corp. (Class A Stock) | | | 4,500 | | | | 480,060 | |
| | | | | | | | |
| | |
| | | | | | | 1,500,878 | |
| | |
Household Products 2.1% | | | | | | | | |
| | |
Colgate-Palmolive Co. | | | 65,400 | | | | 4,912,848 | |
Kimberly-Clark Corp. | | | 24,400 | | | | 2,919,216 | |
Procter & Gamble Co. (The) | | | 48,086 | | | | 7,214,342 | |
| | | | | | | | |
| | |
| | | | | | | 15,046,406 | |
| | |
Independent Power & Renewable Electricity Producers 0.3% | | | | | | | | |
| | |
AES Corp. (The) | | | 35,200 | | | | 524,480 | |
Vistra Corp. | | | 54,000 | | | | 1,766,880 | |
| | | | | | | | |
| | |
| | | | | | | 2,291,360 | |
| | |
Industrial Conglomerates 1.5% | | | | | | | | |
| | |
3M Co. | | | 51,000 | | | | 4,638,450 | |
See Notes to Financial Statements.
PGIM Quant Solutions Large-Cap Core Fund 15
Schedule of Investments (continued)
as of October 31, 2023
| | | | | | | | |
| | |
| Description | | Shares | | | Value | |
| | |
COMMON STOCKS (Continued) | | | | | | | | |
| | |
Industrial Conglomerates (cont’d.) | | | | | | | | |
| | |
General Electric Co. | | | 54,000 | | | $ | 5,866,020 | |
Honeywell International, Inc. | | | 1,700 | | | | 311,542 | |
| | | | | | | | |
| | |
| | | | | | | 10,816,012 | |
| | |
Industrial REITs 0.6% | | | | | | | | |
| | |
Americold Realty Trust, Inc. | | | 66,400 | | | | 1,741,008 | |
LXP Industrial Trust | | | 254,200 | | | | 2,010,722 | |
Prologis, Inc. | | | 4,700 | | | | 473,525 | |
| | | | | | | | |
| | |
| | | | | | | 4,225,255 | |
| | |
Insurance 1.5% | | | | | | | | |
| | |
American International Group, Inc. | | | 16,000 | | | | 980,960 | |
Assurant, Inc. | | | 3,900 | | | | 580,710 | |
Genworth Financial, Inc. (Class A Stock)* | | | 118,400 | | | | 709,216 | |
Marsh & McLennan Cos., Inc. | | | 16,000 | | | | 3,034,400 | |
MetLife, Inc. | | | 80,000 | | | | 4,800,800 | |
Unum Group | | | 9,400 | | | | 459,660 | |
| | | | | | | | |
| | |
| | | | | | | 10,565,746 | |
| | |
Interactive Media & Services 6.0% | | | | | | | | |
| | |
Alphabet, Inc. (Class A Stock)* | | | 130,680 | | | | 16,214,774 | |
Alphabet, Inc. (Class C Stock)* | | | 115,160 | | | | 14,429,548 | |
Meta Platforms, Inc. (Class A Stock)* | | | 37,080 | | | | 11,171,092 | |
| | | | | | | | |
| | |
| | | | | | | 41,815,414 | |
| | |
IT Services 1.0% | | | | | | | | |
| | |
Akamai Technologies, Inc.* | | | 25,500 | | | | 2,634,915 | |
Cognizant Technology Solutions Corp. (Class A Stock) | | | 49,800 | | | | 3,210,606 | |
International Business Machines Corp. | | | 8,730 | | | | 1,262,707 | |
| | | | | | | | |
| | |
| | | | | | | 7,108,228 | |
| | |
Life Sciences Tools & Services 0.5% | | | | | | | | |
| | |
Thermo Fisher Scientific, Inc. | | | 4,514 | | | | 2,007,692 | |
West Pharmaceutical Services, Inc. | | | 5,500 | | | | 1,750,595 | |
| | | | | | | | |
| | |
| | | | | | | 3,758,287 | |
| | |
Machinery 0.9% | | | | | | | | |
| | |
Allison Transmission Holdings, Inc. | | | 9,000 | | | | 453,780 | |
See Notes to Financial Statements.
16
| | | | | | | | |
| | |
| Description | | Shares | | | Value | |
| | |
COMMON STOCKS (Continued) | | | | | | | | |
| | |
Machinery (cont’d.) | | | | | | | | |
| | |
Caterpillar, Inc. | | | 11,800 | | | $ | 2,667,390 | |
Terex Corp. | | | 74,100 | | | | 3,393,780 | |
| | | | | | | | |
| | |
| | | | | | | 6,514,950 | |
| | |
Marine Transportation 0.1% | | | | | | | | |
| | |
Kirby Corp.* | | | 6,200 | | | | 463,140 | |
| | |
Media 0.3% | | | | | | | | |
| | |
Comcast Corp. (Class A Stock) | | | 57,200 | | | | 2,361,788 | |
| | |
Mortgage Real Estate Investment Trusts (REITs) 0.1% | | | | | | | | |
| | |
MFA Financial, Inc. | | | 61,100 | | | | 543,179 | |
| | |
Multi-Utilities 0.5% | | | | | | | | |
| | |
Avista Corp. | | | 63,200 | | | | 2,002,808 | |
Black Hills Corp. | | | 25,000 | | | | 1,208,750 | |
| | | | | | | | |
| | |
| | | | | | | 3,211,558 | |
| | |
Oil, Gas & Consumable Fuels 3.7% | | | | | | | | |
| | |
Cheniere Energy, Inc. | | | 1,500 | | | | 249,630 | |
Chevron Corp. | | | 25,600 | | | | 3,730,688 | |
Exxon Mobil Corp. | | | 82,500 | | | | 8,732,625 | |
Marathon Petroleum Corp. | | | 34,500 | | | | 5,218,125 | |
ONEOK, Inc. | | | 16,400 | | | | 1,069,280 | |
Phillips 66 | | | 42,000 | | | | 4,790,940 | |
Valero Energy Corp. | | | 16,200 | | | | 2,057,400 | |
| | | | | | | | |
| | |
| | | | | | | 25,848,688 | |
| | |
Pharmaceuticals 4.7% | | | | | | | | |
| | |
Bristol-Myers Squibb Co. | | | 78,600 | | | | 4,050,258 | |
Elanco Animal Health, Inc.* | | | 252,500 | | | | 2,224,525 | |
Eli Lilly & Co. | | | 22,200 | | | | 12,297,246 | |
Johnson & Johnson | | | 74,658 | | | | 11,074,768 | |
Merck & Co., Inc. | | | 24,500 | | | | 2,516,150 | |
Pfizer, Inc. | | | 26,000 | | | | 794,560 | |
| | | | | | | | |
| | |
| | | | | | | 32,957,507 | |
See Notes to Financial Statements.
PGIM Quant Solutions Large-Cap Core Fund 17
Schedule of Investments (continued)
as of October 31, 2023
| | | | | | | | |
| | |
| Description | | Shares | | | Value | |
| | |
COMMON STOCKS (Continued) | | | | | | | | |
| | |
Professional Services 0.9% | | | | | | | | |
| | |
Automatic Data Processing, Inc. | | | 23,700 | | | $ | 5,171,814 | |
Verisk Analytics, Inc. | | | 4,500 | | | | 1,023,120 | |
| | | | | | | | |
| | |
| | | | | | | 6,194,934 | |
| | |
Residential REITs 0.5% | | | | | | | | |
| | |
Equity Residential | | | 68,000 | | | | 3,762,440 | |
| | |
Semiconductors & Semiconductor Equipment 7.9% | | | | | | | | |
| | |
Applied Materials, Inc. | | | 30,600 | | | | 4,049,910 | |
Broadcom, Inc. | | | 3,800 | | | | 3,197,206 | |
Intel Corp. | | | 186,800 | | | | 6,818,200 | |
Lam Research Corp. | | | 8,400 | | | | 4,941,048 | |
NVIDIA Corp. | | | 60,000 | | | | 24,468,000 | |
NXP Semiconductors NV (China) | | | 21,400 | | | | 3,690,002 | |
Photronics, Inc.* | | | 94,000 | | | | 1,725,840 | |
QUALCOMM, Inc. | | | 55,000 | | | | 5,994,450 | |
Skyworks Solutions, Inc. | | | 3,200 | | | | 277,568 | |
| | | | | | | | |
| | |
| | | | | | | 55,162,224 | |
| | |
Software 11.4% | | | | | | | | |
| | |
Adobe, Inc.* | | | 6,483 | | | | 3,449,345 | |
Appfolio, Inc. (Class A Stock)* | | | 7,000 | | | | 1,312,990 | |
Intuit, Inc. | | | 12,600 | | | | 6,236,370 | |
Microsoft Corp. | | | 158,584 | | | | 53,618,836 | |
NCR Voyix Corp.* | | | 157,300 | | | | 2,405,117 | |
Salesforce, Inc.* | | | 36,600 | | | | 7,350,378 | |
ServiceNow, Inc.* | | | 9,800 | | | | 5,702,130 | |
Teradata Corp.* | | | 5,600 | | | | 239,232 | |
| | | | | | | | |
| | |
| | | | | | | 80,314,398 | |
| | |
Specialized REITs 0.3% | | | | | | | | |
| | |
Public Storage | | | 7,100 | | | | 1,694,841 | |
VICI Properties, Inc. | | | 7,600 | | | | 212,040 | |
Weyerhaeuser Co. | | | 7,200 | | | | 206,568 | |
| | | | | | | | |
| | |
| | | | | | | 2,113,449 | |
| | |
Specialty Retail 1.3% | | | | | | | | |
| | |
Home Depot, Inc. (The) | | | 8,100 | | | | 2,305,989 | |
Lowe’s Cos., Inc. | | | 10,100 | | | | 1,924,757 | |
Petco Health & Wellness Co., Inc.*(a) | | | 330,600 | | | | 1,143,876 | |
See Notes to Financial Statements.
18
| | | | | | | | |
| | |
| Description | | Shares | | | Value | |
| | |
COMMON STOCKS (Continued) | | | | | | | | |
| | |
Specialty Retail (cont’d.) | | | | | | | | |
| | |
TJX Cos., Inc. (The) | | | 16,500 | | | $ | 1,453,155 | |
Urban Outfitters, Inc.* | | | 58,800 | | | | 2,035,656 | |
| | | | | | | | |
| | |
| | | | | | | 8,863,433 | |
| | |
Technology Hardware, Storage & Peripherals 7.0% | | | | | | | | |
| | |
Apple, Inc. | | | 275,780 | | | | 47,094,951 | |
Hewlett Packard Enterprise Co. | | | 149,500 | | | | 2,299,310 | |
| | | | | | | | |
| | |
| | | | | | | 49,394,261 | |
| | |
Textiles, Apparel & Luxury Goods 0.5% | | | | | | | | |
| | |
G-III Apparel Group Ltd.* | | | 23,500 | | | | 600,425 | |
Lululemon Athletica, Inc.* | | | 8,000 | | | | 3,147,840 | |
| | | | | | | | |
| | |
| | | | | | | 3,748,265 | |
| | |
Trading Companies & Distributors 0.2% | | | | | | | | |
| | |
Boise Cascade Co. | | | 8,200 | | | | 768,750 | |
GMS, Inc.* | | | 8,400 | | | | 491,232 | |
| | | | | | | | |
| | |
| | | | | | | 1,259,982 | |
| | |
Wireless Telecommunication Services 0.2% | | | | | | | | |
| | |
T-Mobile US, Inc.* | | | 8,300 | | | | 1,194,038 | |
| | | | | | | | |
| | |
TOTAL LONG-TERM INVESTMENTS
(cost $535,977,969) | | | | | | | 690,974,888 | |
| | | | | | | | |
| | |
SHORT-TERM INVESTMENTS 3.1% | | | | | | | | |
| | |
AFFILIATED MUTUAL FUNDS 3.0% | | | | | | | | |
| | |
PGIM Core Government Money Market Fund(wb) | | | 10,525,531 | | | | 10,525,531 | |
PGIM Institutional Money Market Fund (cost $10,584,479; includes $10,540,475 of cash collateral for securities on loan)(b)(wb) | | | 10,590,037 | | | | 10,584,741 | |
| | | | | | | | |
| | |
TOTAL AFFILIATED MUTUAL FUNDS
(cost $21,110,010) | | | | | | | 21,110,272 | |
| | | | | | | | |
See Notes to Financial Statements.
PGIM Quant Solutions Large-Cap Core Fund 19
Schedule of Investments (continued)
as of October 31, 2023
| | | | | | | | | | | | | | | | |
| Description | | Interest
Rate | | | Maturity
Date | | | Principal
Amount
(000)# | | | Value | |
| | | | |
U.S. TREASURY OBLIGATION(k)(n) 0.1% | | | | | | | | | | | | | | | | |
| | | | |
U.S. Treasury Bills
(cost $794,978) | | | 5.330 | % | | | 12/14/23 | | | | 800 | | | $ | 794,941 | |
| | | | | | | | | | | | | | | | |
| | | | |
TOTAL SHORT-TERM INVESTMENTS
(cost $21,904,988) | | | | | | | | | | | | | | | 21,905,213 | |
| | | | | | | | | | | | | | | | |
| | | | |
TOTAL INVESTMENTS 101.5%
(cost $557,882,957) | | | | | | | | | | | | | | | 712,880,101 | |
| | | | |
Liabilities in excess of other assets(z) (1.5)% | | | | | | | | | | | | | | | (10,684,659 | ) |
| | | | | | | | | | | | | | | | |
| | | | |
NET ASSETS 100.0% | | | | | | | | | | | | | | $ | 702,195,442 | |
| | | | | | | | | | | | | | | | |
Below is a list of the abbreviation(s) used in the annual report:
USD—US Dollar
GS—Goldman Sachs & Co. LLC
REITs—Real Estate Investment Trust
S&P—Standard & Poor’s
SOFR—Secured Overnight Financing Rate
| * | Non-income producing security. |
| # | Principal amount is shown in U.S. dollars unless otherwise stated. |
| (a) | All or a portion of security is on loan. The aggregate market value of such securities, including those sold and pending settlement, is $10,400,040; cash collateral of $10,540,475 (included in liabilities) was received with which the Fund purchased highly liquid short-term investments. In the event of significant appreciation in value of securities on loan on the last business day of the reporting period, the Fund may reflect a collateral value that is less than the market value of the loaned securities and such shortfall is remedied the following business day. |
| (b) | Represents security, or portion thereof, purchased with cash collateral received for securities on loan and includes dividend reinvestment. |
| (k) | Represents security, or a portion thereof, segregated as collateral for centrally cleared/exchange-traded derivatives. |
| (n) | Rate shown reflects yield to maturity at purchased date. |
| (wb) | Represents an investment in a Fund affiliated with the Manager. |
| (z) | Includes net unrealized appreciation/(depreciation) and/or market value of the below holdings which are excluded from the Schedule of Investments: |
Futures contracts outstanding at October 31, 2023:
| | | | | | | | | | | | | | | | | |
Number
of
Contracts | | Type | | Expiration
Date | | Current
Notional
Amount | | Value / Unrealized Appreciation (Depreciation) |
| | | |
Long Position: | | | | | | | | | | | | | | | |
49 | | S&P 500 E-Mini Index | | | | Dec. 2023 | | | | | $10,320,013 | | | | | $(732,321) | |
| | | | | | | | | | | | | | | | | |
See Notes to Financial Statements.
20
Summary of Collateral for Centrally Cleared/Exchange-traded Derivatives:
Cash and securities segregated as collateral, including pending settlement for closed positions, to cover requirements for centrally cleared/exchange-traded derivatives are listed by broker as follows:
| | | | | | | | | | | | | | |
Broker | | Cash and/or Foreign Currency | | | | Securities Market Value |
| | | | | | | |
GS | | | | $— | | | | | | | | $794,941 | | |
| | | | | | | | | | | | | | |
Fair Value Measurements:
Various inputs are used in determining the value of the Fund’s investments. These inputs are summarized in the three broad levels listed below.
Level 1—unadjusted quoted prices generally in active markets for identical securities.
Level 2—quoted prices for similar securities, interest rates and yield curves, prepayment speeds, foreign currency exchange rates and other observable inputs.
Level 3—unobservable inputs for securities valued in accordance with Board approved fair valuation procedures.
The following is a summary of the inputs used as of October 31, 2023 in valuing such portfolio securities:
| | | | | | | | | | | | |
| | | Level 1 | | | Level 2 | | | Level 3 | |
Investments in Securities | | | | | | | | | | | | |
Assets | | | | | | | | | | | | |
Long-Term Investments | | | | | | | | | | | | |
Common Stocks | | | | | | | | | | | | |
Aerospace & Defense | | $ | 16,779,435 | | | $ | — | | | | $ — | |
Air Freight & Logistics | | | 4,585,910 | | | | — | | | | — | |
Automobiles | | | 15,661,911 | | | | — | | | | — | |
Banks | | | 22,380,451 | | | | — | | | | — | |
Beverages | | | 15,797,422 | | | | — | | | | — | |
Biotechnology | | | 10,783,122 | | | | — | | | | — | |
Broadline Retail | | | 29,647,670 | | | | — | | | | — | |
Building Products | | | 1,039,569 | | | | — | | | | — | |
Capital Markets | | | 15,223,382 | | | | — | | | | — | |
Chemicals | | | 8,525,019 | | | | — | | | | — | |
Communications Equipment | | | 7,830,449 | | | | — | | | | — | |
Construction & Engineering | | | 3,959,871 | | | | — | | | | — | |
Construction Materials | | | 5,992,553 | | | | — | | | | — | |
Consumer Staples Distribution & Retail | | | 9,165,313 | | | | — | | | | — | |
Distributors | | | 1,506,376 | | | | — | | | | — | |
Diversified Consumer Services | | | 2,036,672 | | | | — | | | | — | |
Diversified Telecommunication Services | | | 9,615,771 | | | | — | | | | — | |
Electric Utilities | | | 6,177,702 | | | | — | | | | — | |
Electrical Equipment | | | 9,452,126 | | | | — | | | | — | |
Energy Equipment & Services | | | 652,554 | | | | — | | | | — | |
Entertainment | | | 10,538,330 | | | | — | | | | — | |
Financial Services | | | 35,058,543 | | | | — | | | | — | |
Food Products | | | 9,444,800 | | | | — | | | | — | |
See Notes to Financial Statements.
PGIM Quant Solutions Large-Cap Core Fund 21
Schedule of Investments (continued)
as of October 31, 2023
| | | | | | | | | | |
| | | Level 1 | | | Level 2 | | | Level 3 |
Investments in Securities (continued) | | | | | | | | | | |
Assets (continued) | | | | | | | | | | |
Long-Term Investments (continued) | | | | | | | | | | |
Common Stocks (continued) | | | | | | | | | | |
Gas Utilities | | $ | 359,840 | | | $ | — | | | $— |
Ground Transportation | | | 1,406,600 | | | | — | | | — |
Health Care Equipment & Supplies | | | 17,669,060 | | | | — | | | — |
Health Care Providers & Services | | | 25,726,581 | | | | — | | | — |
Health Care REITs | | | 529,392 | | | | — | | | — |
Hotels, Restaurants & Leisure | | | 12,392,644 | | | | — | | | — |
Household Durables | | | 1,500,878 | | | | — | | | — |
Household Products | | | 15,046,406 | | | | — | | | — |
Independent Power & Renewable Electricity Producers | | | 2,291,360 | | | | — | | | — |
Industrial Conglomerates | | | 10,816,012 | | | | — | | | — |
Industrial REITs | | | 4,225,255 | | | | — | | | — |
Insurance | | | 10,565,746 | | | | — | | | — |
Interactive Media & Services | | | 41,815,414 | | | | — | | | — |
IT Services | | | 7,108,228 | | | | — | | | — |
Life Sciences Tools & Services | | | 3,758,287 | | | | — | | | — |
Machinery | | | 6,514,950 | | | | — | | | — |
Marine Transportation | | | 463,140 | | | | — | | | — |
Media | | | 2,361,788 | | | | — | | | — |
Mortgage Real Estate Investment Trusts (REITs) | | | 543,179 | | | | — | | | — |
Multi-Utilities | | | 3,211,558 | | | | — | | | — |
Oil, Gas & Consumable Fuels | | | 25,848,688 | | | | — | | | — |
Pharmaceuticals | | | 32,957,507 | | | | — | | | — |
Professional Services | | | 6,194,934 | | | | — | | | — |
Residential REITs | | | 3,762,440 | | | | — | | | — |
Semiconductors & Semiconductor Equipment | | | 55,162,224 | | | | — | | | — |
Software | | | 80,314,398 | | | | — | | | — |
Specialized REITs | | | 2,113,449 | | | | — | | | — |
Specialty Retail | | | 8,863,433 | | | | — | | | — |
Technology Hardware, Storage & Peripherals | | | 49,394,261 | | | | — | | | — |
Textiles, Apparel & Luxury Goods | | | 3,748,265 | | | | — | | | — |
Trading Companies & Distributors | | | 1,259,982 | | | | — | | | — |
Wireless Telecommunication Services | | | 1,194,038 | | | | — | | | — |
Short-Term Investments | | | | | | | | | | |
Affiliated Mutual Funds | | | 21,110,272 | | | | — | | | — |
U.S. Treasury Obligation | | | — | | | | 794,941 | | | — |
| | | | | | | | | | |
Total | | $ | 712,085,160 | | | $ | 794,941 | | | $— |
| | | | | | | | | | |
| | | |
Other Financial Instruments* | | | | | | | | | | |
Liabilities | | | | | | | | | | |
Futures Contracts | | $ | (732,321 | ) | | $ | — | | | $— |
| | | | | | | | | | |
See Notes to Financial Statements.
22
| * | Other financial instruments are derivative instruments not reflected in the Schedule of Investments, such as futures, forwards and centrally cleared swap contracts, which are recorded at the unrealized appreciation (depreciation) on the instrument, and OTC swap contracts which are recorded at fair value. |
Industry Classification:
The industry classification of investments and liabilities in excess of other assets shown as a percentage of net assets as of October 31, 2023 were as follows:
| | | | |
Software | | | 11.4 | % |
Semiconductors & Semiconductor Equipment | | | 7.9 | |
Technology Hardware, Storage & Peripherals | | | 7.0 | |
Interactive Media & Services | | | 6.0 | |
Financial Services | | | 5.0 | |
Pharmaceuticals | | | 4.7 | |
Broadline Retail | | | 4.2 | |
Oil, Gas & Consumable Fuels | | | 3.7 | |
Health Care Providers & Services | | | 3.7 | |
Banks | | | 3.2 | |
Affiliated Mutual Funds (1.5% represents investments purchased with collateral from securities on loan) | | | 3.0 | |
Health Care Equipment & Supplies | | | 2.5 | |
Aerospace & Defense | | | 2.4 | |
Beverages | | | 2.2 | |
Automobiles | | | 2.2 | |
Capital Markets | | | 2.2 | |
Household Products | | | 2.1 | |
Hotels, Restaurants & Leisure | | | 1.8 | |
Industrial Conglomerates | | | 1.5 | |
Biotechnology | | | 1.5 | |
Insurance | | | 1.5 | |
Entertainment | | | 1.5 | |
Diversified Telecommunication Services | | | 1.4 | |
Electrical Equipment | | | 1.3 | |
Food Products | | | 1.3 | |
Consumer Staples Distribution & Retail | | | 1.3 | |
Specialty Retail | | | 1.3 | |
Chemicals | | | 1.2 | |
Communications Equipment | | | 1.1 | |
IT Services | | | 1.0 | |
Machinery | | | 0.9 | |
| | | | |
Professional Services | | | 0.9 | % |
Electric Utilities | | | 0.9 | |
Construction Materials | | | 0.9 | |
Air Freight & Logistics | | | 0.7 | |
Industrial REITs | | | 0.6 | |
Construction & Engineering | | | 0.6 | |
Residential REITs | | | 0.5 | |
Life Sciences Tools & Services | | | 0.5 | |
Textiles, Apparel & Luxury Goods | | | 0.5 | |
Multi-Utilities | | | 0.5 | |
Media | | | 0.3 | |
Independent Power & Renewable Electricity Producers | | | 0.3 | |
Specialized REITs | | | 0.3 | |
Diversified Consumer Services | | | 0.3 | |
Distributors | | | 0.2 | |
Household Durables | | | 0.2 | |
Ground Transportation | | | 0.2 | |
Trading Companies & Distributors | | | 0.2 | |
Wireless Telecommunication Services | | | 0.2 | |
Building Products | | | 0.1 | |
U.S. Treasury Obligation | | | 0.1 | |
Energy Equipment & Services | | | 0.1 | |
Mortgage Real Estate Investment Trusts (REITs) | | | 0.1 | |
Health Care REITs | | | 0.1 | |
Marine Transportation | | | 0.1 | |
Gas Utilities | | | 0.1 | |
| | | | |
| | | 101.5 | |
Liabilities in excess of other assets | | | (1.5 | ) |
| | | | |
| |
| | | 100.0 | % |
| | | | |
See Notes to Financial Statements.
PGIM Quant Solutions Large-Cap Core Fund 23
Schedule of Investments (continued)
as of October 31, 2023
Effects of Derivative Instruments on the Financial Statements and Primary Underlying Risk Exposure:
The Fund invested in derivative instruments during the reporting period. The primary type of risk associated with these derivative instruments is equity risk. See the Notes to Financial Statements for additional detail regarding these derivative instruments and their risks. The effect of such derivative instruments on the Fund’s financial position and financial performance as reflected in the Statement of Assets and Liabilities and Statement of Operations is presented in the summary below.
Fair values of derivative instruments as of October 31, 2023 as presented in the Statement of Assets and Liabilities:
| | | | | | | | | | |
| | | Asset Derivatives | | Liability Derivatives | |
| | | | |
Derivatives not accounted for as hedging instruments, carried at fair value | | Statement of
Assets and
Liabilities Location | | Fair
Value | | Statement of Assets and Liabilities Location | | Fair
Value | |
| Equity contracts | | — | | $— | | Due from/to broker-variation margin futures | | | $732,321* | |
| | | | | | | | | | |
| * | Includes cumulative appreciation (depreciation) as reported in the schedule of open futures and centrally cleared swap contracts. Only unsettled variation margin receivable (payable) is reported within the Statement of Assets and Liabilities. |
The effects of derivative instruments on the Statement of Operations for the year ended October 31, 2023 are as follows:
| | | | |
Amount of Realized Gain (Loss) on Derivatives Recognized in Income | |
| |
Derivatives not accounted for as hedging instruments, carried at fair value | | Futures | |
| |
Equity contracts | | $ | 732,659 | |
| | | | |
|
Change in Unrealized Appreciation (Depreciation) on Derivatives Recognized in Income | |
| |
Derivatives not accounted for as hedging instruments, carried at fair value | | Futures | |
| |
Equity contracts | | $ | (354,764 | ) |
| | | | |
For the year ended October 31, 2023, the Fund’s average volume of derivative activities is as follows:
| | |
| |
| Derivative Contract Type | | Average Volume of Derivative Activities* |
| |
Futures Contracts - Long Positions (1) | | $11,023,983 |
| * | Average volume is based on average quarter end balances as noted for the year ended October 31, 2023. |
| (1) | Notional Amount in USD. |
See Notes to Financial Statements.
24
Financial Instruments/Transactions—Summary of Offsetting and Netting Arrangements:
The Fund entered into financial instruments/transactions during the reporting period that are either offset in accordance with current requirements or are subject to enforceable master netting arrangements or similar agreements that permit offsetting. The information about offsetting and related netting arrangements for financial instruments/transactions where the legal right to set-off exists is presented in the summary below.
Offsetting of financial instrument/transaction assets and liabilities:
| | | | | | |
| Description | | Gross Market
Value of
Recognized
Assets/(Liabilities) | | Collateral
Pledged/(Received)(1) | | Net
Amount |
Securities on Loan | | $10,400,040 | | $(10,400,040) | | $— |
| (1) | Collateral amount disclosed by the Fund is limited to the market value of financial instruments/transactions. |
See Notes to Financial Statements.
PGIM Quant Solutions Large-Cap Core Fund 25
Statement of Assets and Liabilities
as of October 31, 2023
| | | | |
| |
Assets | | | | |
| |
Investments at value, including securities on loan of $10,400,040: | | | | |
Unaffiliated investments (cost $536,772,947) | | $ | 691,769,829 | |
Affiliated investments (cost $21,110,010) | | | 21,110,272 | |
Receivable for Fund shares sold | | | 700,865 | |
Dividends and interest receivable | | | 566,825 | |
Due from broker—variation margin futures | | | 64,925 | |
Prepaid expenses | | | 4,198 | |
| | | | |
| |
Total Assets | | | 714,216,914 | |
| | | | |
| |
Liabilities | | | | |
| |
Payable to broker for collateral for securities on loan | | | 10,540,475 | |
Payable for Fund shares purchased | | | 935,508 | |
Management fee payable | | | 219,124 | |
Accrued expenses and other liabilities | | | 157,391 | |
Distribution fee payable | | | 101,592 | |
Affiliated transfer agent fee payable | | | 65,925 | |
Trustees’ fees payable | | | 1,457 | |
| | | | |
| |
Total Liabilities | | | 12,021,472 | |
| | | | |
| |
Net Assets | | $ | 702,195,442 | |
| | | | |
| |
| | | | | |
| |
Net assets were comprised of: | | | | |
Shares of beneficial interest, at par | | $ | 41,253 | |
Paid-in capital in excess of par | | | 526,345,488 | |
Total distributable earnings (loss) | | | 175,808,701 | |
| | | | |
| |
Net assets, October 31, 2023 | | $ | 702,195,442 | |
| | | | |
See Notes to Financial Statements.
26
| | | | | | | | |
Class A | | | | | | | | |
| | |
Net asset value and redemption price per share, ($412,198,421 ÷ 24,534,659 shares of beneficial interest issued and outstanding) | | $ | 16.80 | | | | | |
Maximum sales charge (5.50% of offering price) | | | 0.98 | | | | | |
| | | | | | | | |
| | |
Maximum offering price to public | | $ | 17.78 | | | | | |
| | | | | | | | |
| | |
Class C | | | | | | | | |
| | |
Net asset value, offering price and redemption price per share, ($13,875,846 ÷ 966,967 shares of beneficial interest issued and outstanding) | | $ | 14.35 | | | | | |
| | | | | | | | |
| | |
Class Z | | | | | | | | |
| | |
Net asset value, offering price and redemption price per share, ($21,378,715 ÷ 1,223,643 shares of beneficial interest issued and outstanding) | | $ | 17.47 | | | | | |
| | | | | | | | |
| | |
Class R6 | | | | | | | | |
| | |
Net asset value, offering price and redemption price per share, ($254,742,460 ÷ 14,527,892 shares of beneficial interest issued and outstanding) | | $ | 17.53 | | | | | |
| | | | | | | | |
See Notes to Financial Statements.
PGIM Quant Solutions Large-Cap Core Fund 27
Statement of Operations
Year Ended October 31, 2023
| | | | |
Net Investment Income (Loss) | | | | |
| |
Income | | | | |
Unaffiliated dividend income (net of $11,418 foreign withholding tax) | | $ | 11,553,075 | |
Affiliated dividend income | | | 338,011 | |
Affiliated income from securities lending, net | | | 45,891 | |
Interest income | | | 33,345 | |
| | | | |
| |
Total income | | | 11,970,322 | |
| | | | |
| |
Expenses | | | | |
Management fee | | | 2,479,426 | |
Distribution fee(a) | | | 1,424,698 | |
Transfer agent’s fees and expenses (including affiliated expense of $369,065)(a) | | | 655,352 | |
Custodian and accounting fees | | | 72,196 | |
Shareholders’ reports | | | 60,376 | |
Registration fees(a) | | | 44,724 | |
Professional fees | | | 42,107 | |
Audit fee | | | 24,910 | |
Trustees’ fees | | | 19,120 | |
Miscellaneous | | | 31,603 | |
| | | | |
| |
Total expenses | | | 4,854,512 | |
Less: Fee waiver and/or expense reimbursement(a) | | | (395,848 | ) |
Distribution fee waiver(a) | | | (211,670 | ) |
| | | | |
| |
Net expenses | | | 4,246,994 | |
| | | | |
| |
Net investment income (loss) | | | 7,723,328 | |
| | | | |
| |
Realized And Unrealized Gain (Loss) On Investments | | | | |
| |
Net realized gain (loss) on: | | | | |
Investment transactions (including affiliated of $(8,768)) | | | 17,605,343 | |
Futures transactions | | | 732,659 | |
| | | | |
| |
| | | 18,338,002 | |
| | | | |
Net change in unrealized appreciation (depreciation) on: | | | | |
Investments (including affiliated of $(269)) | | | 36,683,254 | |
Futures | | | (354,764 | ) |
| | | | |
| |
| | | 36,328,490 | |
| | | | |
| |
Net gain (loss) on investment transactions | | | 54,666,492 | |
| | | | |
| |
Net Increase (Decrease) In Net Assets Resulting From Operations | | $ | 62,389,820 | |
| | | | |
| (a) | Class specific expenses and waivers were as follows: |
| | | | | | | | | | | | | | | | |
| | | Class A | | | Class C | | | Class Z | | | Class R6 | |
| | | | |
Distribution fee | | | 1,270,021 | | | | 154,677 | | | | — | | | | — | |
Transfer agent’s fees and expenses | | | 595,811 | | | | 31,719 | | | | 24,520 | | | | 3,302 | |
Registration fees | | | 15,406 | | | | 9,453 | | | | 9,802 | | | | 10,063 | |
Fee waiver and/or expense reimbursement | | | (250,011 | ) | | | (32,628 | ) | | | (17,237 | ) | | | (95,972 | ) |
Distribution fee waiver | | | (211,670 | ) | | | — | | | | — | | | | — | |
See Notes to Financial Statements.
28
Statements of Changes in Net Assets
| | | | | | | | | | |
| | |
| | | Year Ended
October 31, | | | |
| | | |
| | | 2023 | | | 2022 | | | |
| | | |
Increase (Decrease) in Net Assets | | | | | | | | | | |
| | | |
Operations | | | | | | | | | | |
Net investment income (loss) | | $ | 7,723,328 | | | $ | 8,761,205 | | | |
Net realized gain (loss) on investment transactions | | | 18,338,002 | | | | 6,640,202 | | | |
Net change in unrealized appreciation (depreciation) on investments | | | 36,328,490 | | | | (120,387,232 | ) | | |
| | | | | | | | | | |
| | | |
Net increase (decrease) in net assets resulting from operations | | | 62,389,820 | | | | (104,985,825 | ) | | |
| | | | | | | | | | |
| | | |
Dividends and Distributions | | | | | | | | | | |
Distributions from distributable earnings | | | | | | | | | | |
Class A | | | (9,633,764 | ) | | | (75,324,555 | ) | | |
Class C | | | (322,443 | ) | | | (3,481,355 | ) | | |
Class Z | | | (535,641 | ) | | | (3,670,638 | ) | | |
Class R6 | | | (6,152,130 | ) | | | (37,719,399 | ) | | |
| | | | | | | | | | |
| | | |
| | | (16,643,978 | ) | | | (120,195,947 | ) | | |
| | | | | | | | | | |
Fund share transactions (Net of share conversions) | | | | | | | | | | |
Net proceeds from shares sold | | | 77,334,909 | | | | 181,955,294 | | | |
Net asset value of shares issued in reinvestment of dividends and distributions | | | 16,494,157 | | | | 119,012,363 | | | |
Cost of shares purchased | | | (113,888,922 | ) | | | (265,425,580 | ) | | |
| | | | | | | | | | |
| | | |
Net increase (decrease) in net assets from Fund share transactions | | | (20,059,856 | ) | | | 35,542,077 | | | |
| | | | | | | | | | |
| | | |
Total increase (decrease) | | | 25,685,986 | | | | (189,639,695 | ) | | |
| | | |
Net Assets: | | | | | | | | | | |
| | | |
Beginning of year | | | 676,509,456 | | | | 866,149,151 | | | |
| | | | | | | | | | |
| | | |
End of year | | $ | 702,195,442 | | | $ | 676,509,456 | | | |
| | | | | | | | | | |
See Notes to Financial Statements.
PGIM Quant Solutions Large-Cap Core Fund 29
Financial Highlights
| | | | | | | | | | | | | | | | | | | | |
| | | | | | |
Class A Shares | | | | | | | | | | | | | | | | | | | | |
| | | Year Ended October 31, | |
| | | | | | |
| | | 2023 | | | 2022 | | | 2021 | | | 2020 | | | 2019 | |
| | | | | | |
Per Share Operating Performance(a) : | | | | | | | | | | | | | | | | | | | | |
Net Asset Value, Beginning of Year | | | $15.75 | | | | $21.09 | | | | $15.17 | | | | $15.17 | | | | $16.76 | |
Income (loss) from investment operations: | | | | | | | | | | | | | | | | | | | | |
Net investment income (loss) | | | 0.16 | | | | 0.18 | | | | 0.16 | | | | 0.19 | | | | 0.18 | |
| Net realized and unrealized gain (loss) on investment transactions | | | 1.26 | | | | (2.46 | ) | | | 6.14 | | | | 0.43 | | | | 1.19 | |
Total from investment operations | | | 1.42 | | | | (2.28 | ) | | | 6.30 | | | | 0.62 | | | | 1.37 | |
Less Dividends and Distributions: | | | | | | | | | | | | | | | | | | | | |
Dividends from net investment income | | | (0.19 | ) | | | (0.17 | ) | | | (0.19 | ) | | | (0.19 | ) | | | (0.22 | ) |
Distributions from net realized gains | | | (0.18 | ) | | | (2.89 | ) | | | (0.19 | ) | | | (0.43 | ) | | | (2.74 | ) |
Total dividends and distributions | | | (0.37 | ) | | | (3.06 | ) | | | (0.38 | ) | | | (0.62 | ) | | | (2.96 | ) |
Net asset value, end of year | | | $16.80 | | | | $15.75 | | | | $21.09 | | | | $15.17 | | | | $15.17 | |
Total Return(b) : | | | 9.16 | % | | | (12.84 | )% | | | 42.24 | % | | | 4.02 | % | | | 10.61 | % |
| | | | | | | | | | | | | | | | | | | | | |
Ratios/Supplemental Data: | | | | | | | | | | | | | | | | | | | | |
Net assets, end of year (000) | | | $412,198 | | | | $411,798 | | | | $522,601 | | | | $382,165 | | | | $400,634 | |
Average net assets (000) | | | $423,340 | | | | $468,874 | | | | $475,322 | | | | $389,009 | | | | $302,864 | |
Ratios to average net assets(c) : | | | | | | | | | | | | | | | | | | | | |
| Expenses after waivers and/or expense reimbursement | | | 0.72 | % | | | 0.72 | % | | | 0.72 | % | | | 0.72 | % | | | 0.74 | % |
| Expenses before waivers and/or expense reimbursement | | | 0.83 | % | | | 0.83 | % | | | 0.81 | % | | | 0.83 | % | | | 0.87 | % |
Net investment income (loss) | | | 0.97 | % | | | 1.03 | % | | | 0.84 | % | | | 1.26 | % | | | 1.27 | % |
Portfolio turnover rate(d) | | | 96 | % | | | 98 | % | | | 101 | % | | | 92 | % | | | 88 | % |
| (a) | Calculated based on average shares outstanding during the year. |
| (b) | Total return does not consider the effects of sales loads. Total return is calculated assuming a purchase of a share on the first day and a sale on the last day of each year reported and includes reinvestment of dividends and distributions, if any. Total returns may reflect adjustments to conform to GAAP. |
| (c) | Does not include expenses of the underlying funds in which the Fund invests. |
| (d) | The Fund’s portfolio turnover rate is calculated in accordance with regulatory requirements, without regard to transactions involving short-term investments, certain derivatives and in-kind transactions (if any). If such transactions were included, the Fund’s portfolio turnover rate may be higher. |
See Notes to Financial Statements.
30
| | | | | | | | | | | | | | | | | | | | |
| | | | | | |
Class C Shares | | | | | | | | | | | | | | | | | | | | |
| | | Year Ended October 31, | |
| | | | | | |
| | | 2023 | | | 2022 | | | 2021 | | | 2020 | | | 2019 | |
| | | | | | |
Per Share Operating Performance(a) : | | | | | | | | | | | | | | | | | | | | |
Net Asset Value, Beginning of Year | | | $13.51 | | | | $18.52 | | | | $13.38 | | | | $13.46 | | | | $15.20 | |
Income (loss) from investment operations: | | | | | | | | | | | | | | | | | | | | |
Net investment income (loss) | | | 0.04 | | | | 0.05 | | | | 0.02 | | | | 0.07 | | | | 0.08 | |
| Net realized and unrealized gain (loss) on investment transactions | | | 1.08 | | | | (2.11 | ) | | | 5.42 | | | | 0.38 | | | | 1.03 | |
Total from investment operations | | | 1.12 | | | | (2.06 | ) | | | 5.44 | | | | 0.45 | | | | 1.11 | |
Less Dividends and Distributions: | | | | | | | | | | | | | | | | | | | | |
Dividends from net investment income | | | (0.10 | ) | | | (0.06 | ) | | | (0.11 | ) | | | (0.10 | ) | | | (0.11 | ) |
Distributions from net realized gains | | | (0.18 | ) | | | (2.89 | ) | | | (0.19 | ) | | | (0.43 | ) | | | (2.74 | ) |
Total dividends and distributions | | | (0.28 | ) | | | (2.95 | ) | | | (0.30 | ) | | | (0.53 | ) | | | (2.85 | ) |
Net asset value, end of year | | | $14.35 | | | | $13.51 | | | | $18.52 | | | | $13.38 | | | | $13.46 | |
Total Return(b) : | | | 8.37 | % | | | (13.46 | )% | | | 41.25 | % | | | 3.27 | % | | | 9.77 | % |
| | | | | | | | | | | | | | | | | | | | | |
Ratios/Supplemental Data: | | | | | | | | | | | | | | | | | | | | |
Net assets, end of year (000) | | | $13,876 | | | | $15,992 | | | | $22,453 | | | | $21,047 | | | | $27,333 | |
Average net assets (000) | | | $15,468 | | | | $19,087 | | | | $22,342 | | | | $24,287 | | | | $36,812 | |
Ratios to average net assets(c) : | | | | | | | | | | | | | | | | | | | | |
| Expenses after waivers and/or expense reimbursement | | | 1.44 | % | | | 1.44 | % | | | 1.44 | % | | | 1.44 | % | | | 1.47 | % |
| Expenses before waivers and/or expense reimbursement | | | 1.65 | % | | | 1.65 | % | | | 1.59 | % | | | 1.59 | % | | | 1.54 | % |
Net investment income (loss) | | | 0.27 | % | | | 0.30 | % | | | 0.14 | % | | | 0.56 | % | | | 0.59 | % |
Portfolio turnover rate(d) | | | 96 | % | | | 98 | % | | | 101 | % | | | 92 | % | | | 88 | % |
| (a) | Calculated based on average shares outstanding during the year. |
| (b) | Total return does not consider the effects of sales loads. Total return is calculated assuming a purchase of a share on the first day and a sale on the last day of each year reported and includes reinvestment of dividends and distributions, if any. Total returns may reflect adjustments to conform to GAAP. |
| (c) | Does not include expenses of the underlying funds in which the Fund invests. |
| (d) | The Fund’s portfolio turnover rate is calculated in accordance with regulatory requirements, without regard to transactions involving short-term investments, certain derivatives and in-kind transactions (if any). If such transactions were included, the Fund’s portfolio turnover rate may be higher. |
See Notes to Financial Statements.
PGIM Quant Solutions Large-Cap Core Fund 31
Financial Highlights (continued)
| | | | | | | | | | | | | | | | | | | | |
| | | | | | |
Class Z Shares | | | | | | | | | | | | | | | | | | | | |
| | | Year Ended October 31, | |
| | | | | | |
| | | 2023 | | | 2022 | | | 2021 | | | 2020 | | | 2019 | |
| | | | | | |
Per Share Operating Performance(a) : | | | | | | | | | | | | | | | | | | | | |
Net Asset Value, Beginning of Year | | | $16.38 | | | | $21.79 | | | | $15.67 | | | | $15.65 | | | | $17.20 | |
Income (loss) from investment operations: | | | | | | | | | | | | | | | | | | | | |
Net investment income (loss) | | | 0.21 | | | | 0.24 | | | | 0.21 | | | | 0.23 | | | | 0.24 | |
| Net realized and unrealized gain (loss) on investment transactions | | | 1.31 | | | | (2.55 | ) | | | 6.32 | | | | 0.44 | | | | 1.21 | |
Total from investment operations | | | 1.52 | | | | (2.31 | ) | | | 6.53 | | | | 0.67 | | | | 1.45 | |
Less Dividends and Distributions: | | | | | | | | | | | | | | | | | | | | |
Dividends from net investment income | | | (0.25 | ) | | | (0.21 | ) | | | (0.22 | ) | | | (0.22 | ) | | | (0.26 | ) |
Distributions from net realized gains | | | (0.18 | ) | | | (2.89 | ) | | | (0.19 | ) | | | (0.43 | ) | | | (2.74 | ) |
Total dividends and distributions | | | (0.43 | ) | | | (3.10 | ) | | | (0.41 | ) | | | (0.65 | ) | | | (3.00 | ) |
Net asset value, end of year | | | $17.47 | | | | $16.38 | | | | $21.79 | | | | $15.67 | | | | $15.65 | |
Total Return(b) : | | | 9.43 | % | | | (12.54 | )% | | | 42.44 | % | | | 4.27 | % | | | 10.91 | % |
| | | | | | | | | | | | | | | | | | | | | |
Ratios/Supplemental Data: | | | | | | | | | | | | | | | | | | | | |
Net assets, end of year (000) | | | $21,379 | | | | $20,647 | | | | $25,663 | | | | $47,730 | | | | $67,192 | |
Average net assets (000) | | | $21,455 | | | | $23,609 | | | | $60,616 | | | | $64,099 | | | | $65,923 | |
Ratios to average net assets(c) : | | | | | | | | | | | | | | | | | | | | |
| Expenses after waivers and/or expense reimbursement | | | 0.46 | % | | | 0.42 | % | | | 0.49 | % | | | 0.48 | % | | | 0.48 | % |
| Expenses before waivers and/or expense reimbursement | | | 0.54 | % | | | 0.54 | % | | | 0.55 | % | | | 0.55 | % | | | 0.54 | % |
Net investment income (loss) | | | 1.22 | % | | | 1.34 | % | | | 1.10 | % | | | 1.54 | % | | | 1.59 | % |
Portfolio turnover rate(d) | | | 96 | % | | | 98 | % | | | 101 | % | | | 92 | % | | | 88 | % |
| (a) | Calculated based on average shares outstanding during the year. |
| (b) | Total return is calculated assuming a purchase of a share on the first day and a sale on the last day of each year reported and includes reinvestment of dividends and distributions, if any. Total returns may reflect adjustments to conform to GAAP. |
| (c) | Does not include expenses of the underlying funds in which the Fund invests. |
| (d) | The Fund’s portfolio turnover rate is calculated in accordance with regulatory requirements, without regard to transactions involving short-term investments, certain derivatives and in-kind transactions (if any). If such transactions were included, the Fund’s portfolio turnover rate may be higher. |
See Notes to Financial Statements.
32
| | | | | | | | | | | | | | | | | | | | |
| | | | | | |
Class R6 Shares | | | | | | | | | | | | | | | | | | | | |
| | | Year Ended October 31, | |
| | | | | | |
| | | 2023 | | | 2022 | | | 2021 | | | 2020 | | | 2019 | |
| | | | | | |
Per Share Operating Performance(a) : | | | | | | | | | | | | | | | | | | | | |
Net Asset Value, Beginning of Year | | $ | 16.42 | | | $ | 21.86 | | | $ | 15.70 | | | $ | 15.68 | | | $ | 17.23 | |
Income (loss) from investment operations: | | | | | | | | | | | | | | | | | | | | |
Net investment income (loss) | | | 0.23 | | | | 0.25 | | | | 0.23 | | | | 0.25 | | | | 0.26 | |
| Net realized and unrealized gain (loss) on investment transactions | | | 1.31 | | | | (2.56 | ) | | | 6.36 | | | | 0.44 | | | | 1.21 | |
Total from investment operations | | | 1.54 | | | | (2.31 | ) | | | 6.59 | | | | 0.69 | | | | 1.47 | |
Less Dividends and Distributions: | | | | | | | | | | | | | | | | | | | | |
Dividends from net investment income | | | (0.25 | ) | | | (0.24 | ) | | | (0.24 | ) | | | (0.24 | ) | | | (0.28 | ) |
Distributions from net realized gains | | | (0.18 | ) | | | (2.89 | ) | | | (0.19 | ) | | | (0.43 | ) | | | (2.74 | ) |
Total dividends and distributions | | | (0.43 | ) | | | (3.13 | ) | | | (0.43 | ) | | | (0.67 | ) | | | (3.02 | ) |
Net asset value, end of year | | $ | 17.53 | | | $ | 16.42 | | | $ | 21.86 | | | $ | 15.70 | | | $ | 15.68 | |
Total Return(b) : | | | 9.56 | % | | | (12.52 | )% | | | 42.79 | % | | | 4.39 | % | | | 11.05 | % |
| | | | | | | | | | | | | | | | | | | | | |
Ratios/Supplemental Data: | | | | | | | | | | | | | | | | | | | | |
Net assets, end of year (000) | | $ | 254,742 | | | $ | 228,073 | | | $ | 295,432 | | | $ | 132,446 | | | $ | 90,722 | |
Average net assets (000) | | $ | 248,145 | | | $ | 258,329 | | | $ | 204,016 | | | $ | 105,498 | | | $ | 86,249 | |
Ratios to average net assets(c) : | | | | | | | | | | | | | | | | | | | | |
| Expenses after waivers and/or expense reimbursement | | | 0.35 | % | | | 0.35 | % | | | 0.35 | % | | | 0.35 | % | | | 0.35 | % |
| Expenses before waivers and/or expense reimbursement | | | 0.39 | % | | | 0.39 | % | | | 0.38 | % | | | 0.40 | % | | | 0.41 | % |
Net investment income (loss) | | | 1.33 | % | | | 1.38 | % | | | 1.17 | % | | | 1.60 | % | | | 1.72 | % |
Portfolio turnover rate(d) | | | 96 | % | | | 98 | % | | | 101 | % | | | 92 | % | | | 88 | % |
| (a) | Calculated based on average shares outstanding during the year. |
| (b) | Total return is calculated assuming a purchase of a share on the first day and a sale on the last day of each year reported and includes reinvestment of dividends and distributions, if any. Total returns may reflect adjustments to conform to GAAP. |
| (c) | Does not include expenses of the underlying funds in which the Fund invests. |
| (d) | The Fund’s portfolio turnover rate is calculated in accordance with regulatory requirements, without regard to transactions involving short-term investments, certain derivatives and in-kind transactions (if any). If such transactions were included, the Fund’s portfolio turnover rate may be higher. |
See Notes to Financial Statements.
PGIM Quant Solutions Large-Cap Core Fund 33
Notes to Financial Statements
Prudential Investment Portfolios 9 (the “Registered Investment Company” or “RIC”) is registered under the Investment Company Act of 1940, as amended (“1940 Act”), as an open-end management investment company. The RIC is organized as a Delaware Statutory Trust. These financial statements relate only to the PGIM Quant Solutions Large-Cap Core Fund (the “Fund”), a series of the RIC. The Fund is classified as a diversified fund for purposes of the 1940 Act.
The investment objective of the Fund is to seek long-term growth of capital.
The Fund follows the investment company accounting and reporting guidance of the Financial Accounting Standards Board (“FASB”) Accounting Standard Codification (“ASC”) Topic 946 Financial Services — Investment Companies. The following is a summary of significant accounting policies followed by the Fund in the preparation of its financial statements. The policies conform to U.S. generally accepted accounting principles (“GAAP”). The Fund consistently follows such policies in the preparation of its financial statements.
Securities Valuation: The Fund holds securities and other assets and liabilities that are fair valued as of the close of each day (generally, 4:00 PM Eastern time) the New York Stock Exchange (“NYSE”) is open for trading. As described in further detail below, the Fund’s investments are valued daily based on a number of factors, including the type of investment and whether market quotations are readily available. The RIC’s Board of Trustees (the “Board”) has approved the Fund’s valuation policies and procedures for security valuation and designated PGIM Investments LLC (“PGIM Investments” or the “Manager”) as the “Valuation Designee,” as defined by Rule 2a-5(b) under the 1940 Act, to perform the fair value determination relating to all Fund investments. Pursuant to the Board’s oversight, the Valuation Designee has established a Valuation Committee to perform the duties and responsibilities as Valuation Designee under Rule 2a-5. The valuation procedures permit the Fund to utilize independent pricing vendor services, quotations from market makers, and alternative valuation methods when market quotations are either not readily available or not deemed representative of fair value. Fair value is the estimated price that would be received to sell an asset or paid to transfer a liability in an orderly transaction between market participants on the measurement date.
For the fiscal reporting year-end, securities and other assets and liabilities were fair valued at the close of the last U.S. business day. Trading in certain foreign securities may occur when the NYSE is closed (including weekends and holidays). Because such foreign securities trade in markets that are open on weekends and U.S. holidays, the values of some of the
34
Fund’s foreign investments may change on days when investors cannot purchase or redeem Fund shares.
Various inputs determine how the Fund’s investments are valued, all of which are categorized according to the three broad levels (Level 1, 2, or 3) detailed in the Schedule of Investments and referred to herein as the “fair value hierarchy” in accordance with FASB ASC Topic 820 — Fair Value Measurement.
Common or preferred stocks, exchange-traded funds (ETFs) and derivative instruments, if applicable, that are traded on a national securities exchange are valued at the last sale price as of the close of trading on the applicable exchange where the security principally trades. Securities traded via NASDAQ are valued at the NASDAQ official closing price. To the extent these securities are valued at the last sale price or NASDAQ official closing price, they are classified as Level 1 in the fair value hierarchy. In the event that no sale or official closing price on a valuation date exists, these securities are generally valued at the mean between the last reported bid and ask prices, or at the last bid price in the absence of an ask price. These securities are classified as Level 2 in the fair value hierarchy.
Foreign equities traded on foreign securities exchanges are generally valued using pricing vendor services that provide model prices derived using adjustment factors based on information such as local closing price, relevant general and sector indices, currency fluctuations, depositary receipts, and futures, as applicable. Securities valued using such model prices are classified as Level 2 in the fair value hierarchy. The models generate an evaluated adjustment factor for each security, which is applied to the local closing price to adjust it for post closing market movements up to the time the Fund is valued. Utilizing that evaluated adjustment factor, the vendor provides an evaluated price for each security. If the vendor does not provide an evaluated price, securities are valued in accordance with exchange-traded common and preferred stock valuation policies discussed above.
Investments in open-end funds (other than ETFs) are valued at their net asset values as of the close of the NYSE on the date of valuation. These securities are classified as Level 1 in the fair value hierarchy since they may be purchased or sold at their net asset values on the date of valuation.
Securities and other assets that cannot be priced according to the methods described above are valued based on policies and procedures approved by the Board. In the event that unobservable inputs are used when determining such valuations, the securities will be classified as Level 3 in the fair value hierarchy. Altering one or more unobservable inputs may result in a significant change to a Level 3 security’s fair value measurement.
When determining the fair value of securities, some of the factors influencing the valuation include: the nature of any restrictions on disposition of the securities; assessment of the general liquidity of the securities; the issuer’s financial condition and the markets in which it does business; the cost of the investment; the size of the holding and the capitalization of the issuer; the prices of any recent transactions or bids/offers for such securities or any
PGIM Quant Solutions Large-Cap Core Fund 35
Notes to Financial Statements (continued)
comparable securities; and any available analyst media or other reports or information deemed reliable by the Valuation Designee regarding the issuer or the markets or industry in which it operates. Using fair value to price securities may result in a value that is different from a security’s most recent closing price and from the price used by other unaffiliated mutual funds to calculate their net asset values.
Financial Futures Contracts: A financial futures contract is an agreement to purchase (long) or sell (short) an agreed amount of securities at a set price for delivery on a future date. Upon entering into a financial futures contract, the Fund is required to pledge to the broker an amount of cash and/or other assets equal to a certain percentage of the contract amount. This amount is known as the “initial margin.” Subsequent payments, known as “variation margin,” are made or received by the Fund each day, depending on the daily fluctuations in the value of the underlying security. Such variation margin is recorded for financial statement purposes on a daily basis as unrealized gain (loss). When the contract expires or is closed, the gain (loss) is realized and is presented in the Statement of Operations as net realized gain (loss) on futures transactions.
The Fund invested in financial futures contracts in order to hedge its existing portfolio securities, or securities the Fund intends to purchase, against fluctuations in value caused by changes in prevailing interest rates. Should interest rates move unexpectedly, the Fund may not achieve the anticipated benefits of the financial futures contracts and may realize a loss. The use of futures transactions involves the risk of imperfect correlation in movements in the price of futures contracts and the underlying hedged assets. Since futures contracts are exchange-traded, there is minimal counterparty credit risk to the Fund since the exchanges’ clearinghouse acts as counterparty to all exchange-traded futures and guarantees the futures contracts against default.
Master Netting Arrangements: The RIC, on behalf of the Fund, is subject to various Master Agreements, or netting arrangements, with select counterparties. These are agreements which a subadviser may have negotiated and entered into on behalf of all or a portion of the Fund. A master netting arrangement between the Fund and the counterparty permits the Fund to offset amounts payable by the Fund to the same counterparty against amounts to be received and by the receipt of collateral from the counterparty by the Fund to cover the Fund’s exposure to the counterparty. However, there is no assurance that such mitigating factors are easily enforceable. In addition to master netting arrangements, the right to set-off exists when all the conditions are met such that each of the parties owes the other determinable amounts, the reporting party has the right to set-off the amount owed with the amount owed by the other party, the reporting party intends to set-off and the right of set-off is enforceable by law.
36
Securities Lending: The Fund lends its portfolio securities to banks and broker-dealers. The loans are secured by collateral at least equal to the market value of the securities loaned. Collateral pledged by each borrower is invested in an affiliated money market fund and is marked to market daily, based on the previous day’s market value, such that the value of the collateral exceeds the value of the loaned securities. In the event of significant appreciation in value of the securities on loan on the last business day of the reporting period, the financial statements may reflect a collateral value that is less than the market value of the loaned securities. Such shortfall is remedied as described above. Loans are subject to termination at the option of the borrower or the Fund. Upon termination of the loan, the borrower will return to the Fund securities identical to the loaned securities. The remaining open loans of the securities lending transactions are considered overnight and continuous. Should the borrower of the securities fail financially, the Fund has the right to repurchase the securities in the open market using the collateral.
The Fund recognizes income, net of any rebate and securities lending agent fees, for lending its securities in the form of fees or interest on the investment of any cash received as collateral. The borrower receives all interest and dividends from the securities loaned and such payments are passed back to the lender in amounts equivalent thereto, which are reflected in interest income or unaffiliated dividend income based on the nature of the payment on the Statement of Operations. The Fund also continues to recognize any unrealized gain (loss) in the market price of the securities loaned and on the change in the value of the collateral invested that may occur during the term of the loan. In addition, realized gain (loss) is recognized on changes in the value of the collateral invested upon liquidation of the collateral. Net earnings from securities lending are disclosed in the Statement of Operations.
Equity and Mortgage Real Estate Investment Trusts (collectively REITs): The Fund invested in REITs, which report information on the source of their distributions annually. Based on current and historical information, a portion of distributions received from REITs during the period is estimated to be dividend income, capital gain or return of capital and recorded accordingly. When material, these estimates are adjusted periodically when the actual source of distributions is disclosed by the REITs.
Securities Transactions and Net Investment Income: Securities transactions are recorded on the trade date. Realized gains (losses) from investment and currency transactions are calculated on the specific identification method. Dividend income is recorded on the ex-date, or for certain foreign securities, when the Fund becomes aware of such dividends. Expenses are recorded on an accrual basis, which may require the use of certain estimates by management that may differ from actual expense amounts. Net investment income or loss (other than class specific expenses and waivers, which are allocated as noted below) and unrealized and realized gains (losses) are allocated daily to each class of shares based upon the relative proportion of adjusted net assets of each class at the beginning of the day. Class specific expenses and waivers, where applicable, are charged to the respective share classes. Such class specific expenses and waivers include distribution fees and distribution
PGIM Quant Solutions Large-Cap Core Fund 37
Notes to Financial Statements (continued)
fee waivers, shareholder servicing fees, transfer agent’s fees and expenses, registration fees and fee waivers and/or expense reimbursements, as applicable.
Taxes: It is the Fund’s policy to continue to meet the requirements of the Internal Revenue Code applicable to regulated investment companies and to distribute all of its taxable net investment income and capital gains, if any, to its shareholders. Therefore, no federal income tax provision is required. Withholding taxes on foreign dividends, interest and capital gains, if any, are recorded, net of reclaimable amounts, at the time the related income is earned.
Dividends and Distributions: Dividends and distributions to shareholders, which are determined in accordance with federal income tax regulations and which may differ from GAAP, are recorded on the ex-date. Permanent book/tax differences relating to income and gain (loss) are reclassified between total distributable earnings (loss) and paid-in capital in excess of par, as appropriate. The chart below sets forth the expected frequency of dividend and capital gains distributions to shareholders. Various factors may impact the frequency of dividend distributions to shareholders, including but not limited to adverse market conditions or portfolio holding-specific events.
| | |
| | |
Expected Distribution Schedule to Shareholders* | | Frequency |
Net Investment Income | | Annually |
Short-Term Capital Gains | | Annually |
Long-Term Capital Gains | | Annually |
| * | Under certain circumstances, the Fund may make more than one distribution of short-term and/or long-term capital gains during a fiscal year. |
Estimates: The preparation of financial statements requires management to make estimates and assumptions that affect the reported amounts and disclosures in the financial statements. Actual results could differ from those estimates.
The RIC, on behalf of the Fund, has a management agreement with the Manager pursuant to which it has responsibility for all investment advisory services, including supervision of the subadviser’s performance of such services, and for rendering administrative services.
The Manager has entered into a subadvisory agreement with PGIM Quantitative Solutions LLC (“PGIM Quantitative Solutions” or the “subadviser”). The Manager pays for the services of PGIM Quantitative Solutions.
38
Fees payable under the management agreement are computed daily and paid monthly. For the reporting period ended October 31, 2023, the contractual and effective management fee rates were as follows:
| | | | |
Contractual Management Rate | |
| Effective Management Fee, before any waivers
and/or expense reimbursements |
|
0.35% of average daily net assets up to $5 billion; | | | 0.35% | |
0.34% of average daily net assets over $5 billion. | | | | |
The Manager has contractually agreed, through February 28, 2025, to limit certain operating expenses and/or to limit total annual operating expenses after fee waivers and/or expense reimbursements. This contractual waiver exclude interest, brokerage, taxes (such as income and foreign withholding taxes, stamp duty and deferred tax expenses), acquired fund fees and expenses, extraordinary expenses, and certain other Fund expenses such as dividend and interest expense and broker charges on short sales.
Where applicable, the Manager agrees to waive management fees or shared operating expenses on any share class to the same extent that it waives such expenses on any other share class. In addition, total annual operating expenses for Class R6 shares will not exceed total annual operating expenses for Class Z shares. Fees and/or expenses waived and/or reimbursed by the Manager for the purpose of preventing the expenses from exceeding a certain expense ratio limit may be recouped by the Manager within the same fiscal year during which such waiver and/or reimbursement is made if such recoupment can be realized without exceeding the expense limit in effect at the time of the recoupment for that fiscal year. The expense limitations attributable to each class are as follows:
| | | | |
Class | | Fund Expense
Limitation* | | Class Expense
Limitation |
A | | 0.35% | | 0.72% |
C | | 0.35 | | 1.44 |
Z | | 0.35 | | — |
R6 | | 0.35 | | — |
*Expense limitation excludes distribution and service (12b-1) fees, shareholder service fee, and transfer agency expenses (including sub-transfer agency and networking fees).
The RIC, on behalf of the Fund, has a distribution agreement with Prudential Investment Management Services LLC (“PIMS”), which acts as the distributor of the Class A, Class C, Class Z and Class R6 shares of the Fund. The Fund compensates PIMS for distributing and servicing the Fund’s Class A and Class C shares, pursuant to the plans of distribution (the “Distribution Plans”), regardless of expenses actually incurred by PIMS.
Pursuant to the Distribution Plans, the Fund compensates PIMS for distribution related activities at an annual rate based on average daily net assets per class. PIMS has contractually agreed through February 28, 2025 to limit such fees on certain classes based on the daily net assets. The distribution fees are accrued daily and payable monthly.
PGIM Quant Solutions Large-Cap Core Fund 39
Notes to Financial Statements (continued)
The Fund’s annual gross and net distribution rates, where applicable, are as follows:
| | | | |
| | | |
Class | | Gross Distribution Fee | | Net Distribution Fee |
A | | 0.30% | | 0.25% |
C | | 1.00 | | 1.00 |
Z | | N/A | | N/A |
R6 | | N/A | | N/A |
For the year ended October 31, 2023, PIMS received front-end sales charges (“FESL”) resulting from sales of certain class shares and contingent deferred sales charges (“CDSC”) imposed upon redemptions by certain shareholders. From these fees, PIMS paid such sales charges to broker-dealers, who in turn paid commissions to salespersons and incurred other distribution costs. The sales charges are as follows where applicable:
| | | | | | | | |
Class | | | FESL | | | | CDSC | |
A | | $ | 157,088 | | | $ | 43 | |
C | | | — | | | | 987 | |
PGIM Investments, PIMS and PGIM Quantitative Solutions are indirect, wholly-owned subsidiaries of Prudential Financial, Inc. (“Prudential”).
| 4. | Other Transactions with Affiliates |
Prudential Mutual Fund Services LLC (“PMFS”), an affiliate of PGIM Investments and an indirect, wholly-owned subsidiary of Prudential, serves as the Fund’s transfer agent and shareholder servicing agent. Transfer agent’s fees and expenses in the Statement of Operations include certain out-of-pocket expenses paid to non-affiliates, where applicable.
The Fund may invest its overnight sweep cash in the PGIM Core Government Money Market Fund (the “Core Government Fund”), a series of the Prudential Government Money Market Fund, Inc., and its securities lending cash collateral in the PGIM Institutional Money Market Fund (the “Money Market Fund”), a series of Prudential Investment Portfolios 2, each registered under the 1940 Act and managed by PGIM Investments. PGIM Investments and/or its affiliates are paid fees or reimbursed for providing their services to the Core Government Fund and the Money Market Fund. In addition to the realized and unrealized gains on investments in the Core Government Fund and the Money Market Fund, earnings from such investments are disclosed on the Statement of Operations as “Affiliated dividend income” and “Affiliated income from securities lending, net”, respectively.
The Fund may enter into certain securities purchase or sale transactions under Board approved Rule 17a-7 procedures. Rule 17a-7 is an exemptive rule under the 1940 Act that, subject to certain conditions, permits purchase and sale transactions among affiliated
40
investment companies, or between an investment company and a person that is affiliated solely by reason of having a common (or affiliated) investment adviser, common directors/trustees, and/or common officers. For the year ended October 31, 2023, no Rule 17a-7 transactions were entered into by the Fund.
The aggregate cost of purchases and proceeds from sales of portfolio securities (excluding short-term investments and U.S. Government securities) for the reporting period ended October 31, 2023, were as follows:
| | |
Cost of Purchases | | Proceeds from Sales |
$669,615,601 | | $698,027,421 |
A summary of the cost of purchases and proceeds from sales of shares of affiliated mutual funds for the year ended October 31, 2023, is presented as follows:
| | | | | | | | | | | | | | | | | | | | | | | | | | | | | | | | | | | | | | | | | | | | | | | | | | | | |
Value,
Beginning of
Year | | Cost of
Purchases | | | | | | Proceeds
from Sales | | | | | | Change in
Unrealized
Gain
(Loss) | | | | | | Realized
Gain
(Loss) | | | | | | Value,
End of Year | | | | | | Shares,
End
of Year | | | | | | Income | |
|
Short-Term Investments - Affiliated Mutual Funds: | |
| |
|
PGIM Core Government Money Market Fund(1)(wb) | |
| |
$ — | | $ | 44,720,997 | | | | | | | $ | 34,195,466 | | | | | | | $ | — | | | | | | | $ | — | | | | | | | $ | 10,525,531 | | | | | | | | 10,525,531 | | | | | | | $ | 338,011 | |
| |
|
PGIM Institutional Money Market Fund(1)(b)(wb) | |
| |
11,321,124 | | | 356,591,405 | | | | | | | | 357,318,751 | | | | | | | | (269 | ) | | | | | | | (8,768 | ) | | | | | | | 10,584,741 | | | | | | | | 10,590,037 | | | | | | | | 45,891 | (2) |
$11,321,124 | | $ | 401,312,402 | | | | | | | $ | 391,514,217 | | | | | | | $ | (269 | ) | | | | | | $ | (8,768 | ) | | | | | | $ | 21,110,272 | | | | | | | | | | | | | | | $ | 383,902 | |
| (1) | The Fund did not have any capital gain distributions during the reporting period. |
| (2) | The amount, or a portion thereof, represents the affiliated securities lending income shown on the Statement of Operations. |
| (b) | Represents security, or portion thereof, purchased with cash collateral received for securities on loan and includes dividend reinvestment. |
| (wb) | Represents an investment in a Fund affiliated with the Manager. |
| 6. | Distributions and Tax Information |
Distributions to shareholders, which are determined in accordance with federal income tax regulations and which may differ from GAAP, are recorded on the ex-date.
For the year ended October 31, 2023, the tax character of dividends paid as reflected in the Statement of Changes in Net Assets were as follows:
| | | | | | |
Ordinary Income | | Long-Term Capital Gains | | Tax Return of Capital | | Total Dividends and Distributions |
$8,973,357 | | $7,670,621 | | $— | | $16,643,978 |
PGIM Quant Solutions Large-Cap Core Fund 41
Notes to Financial Statements (continued)
For the year ended October 31, 2022, the tax character of dividends paid as reflected in the Statement of Changes in Net Assets were as follows:
| | | | | | |
Ordinary Income | | Long-Term Capital Gains | | Tax Return of Capital | | Total Dividends and Distributions |
$72,705,214 | | $47,490,733 | | $— | | $120,195,947 |
For the year ended October 31, 2023, the Fund had the following amounts of accumulated undistributed earnings on a tax basis:
| | |
Undistributed Ordinary Income | | Undistributed Long-Term Capital Gains |
$6,479,278 | | $17,486,112 |
The United States federal income tax basis of the Fund’s investments and the net unrealized appreciation as of October 31, 2023 were as follows:
| | | | | | | | | | | | |
Tax Basis | | | | Gross Unrealized Appreciation | | | | Gross Unrealized Depreciation | | | | Net Unrealized Appreciation |
$560,304,470 | | | | $180,741,406 | | | | $(28,898,096) | | | | $151,843,310 |
The difference between GAAP and tax basis were primarily attributable to deferred losses on wash sales and mark-to-market of futures contracts.
The Manager has analyzed the Fund’s tax positions taken on federal, state and local income tax returns for all open tax years and has concluded that no provision for income tax is required in the Fund’s financial statements for the current reporting period. Since tax authorities can examine previously filed tax returns, the Fund’s U.S. federal and state tax returns for each of the four fiscal years up to the most recent fiscal year ended October 31, 2023 are subject to such review.
The Fund offers Class A, Class C, Class Z and Class R6 shares. Class A shares are sold with a maximum front-end sales charge of 5.50%. Investors who purchase $1 million or more of Class A shares and sell these shares within 12 months of purchase are subject to a CDSC of 1%, although they are not subject to an initial sales charge. The Class A CDSC is waived for certain retirement and/or benefit plans. A special exchange privilege is also available for shareholders who qualified to purchase Class A shares at net asset value. Class C shares are sold with a CDSC of 1% on sales made within 12 months of purchase. Class C shares will automatically convert to Class A shares on a monthly basis approximately eight years (ten
42
years prior to January 22, 2021) after purchase. Class Z and Class R6 shares are not subject to any sales or redemption charges and are available exclusively for sale to a limited group of investors.
Under certain circumstances, an exchange may be made from specified share classes of the Fund to one or more other share classes of the Fund as presented in the table of transactions in shares of beneficial interest, below.
The RIC has authorized an unlimited number of shares of beneficial interest of the Fund at $0.001 par value per share, currently divided into four classes, designated Class A, Class C, Class Z and Class R6.
As of October 31, 2023, Prudential, through its affiliated entities, including affiliated funds (if applicable), owned shares of the Fund as follows:
| | | | | | | | | | |
| | | |
| Class | | Number of Shares | | Percentage of Outstanding Shares |
Z | | | | 26,215 | | | | | 2.1 | % |
R6 | | | | 6,656,776 | | | | | 45.8 | |
At the reporting period end, the number of shareholders holding greater than 5% of the Fund are as follows:
| | | | |
| | | |
| | | Number of Shareholders | | Percentage of Outstanding Shares |
Affiliated | | 1 | | 7.5% |
Unaffiliated | | 2 | | 36.3 |
Transactions in shares of beneficial interest were as follows:
| | | | | | | | | | | | |
| | | | |
Share Class | | | Shares | | | | | | | | Amount | |
| | | |
Class A | | | | | | | | | | | | |
Year ended October 31, 2023: | | | | | | | | | | | | |
Shares sold | | | 535,744 | | | | | | | $ | 8,875,073 | |
Shares issued in reinvestment of dividends and distributions | | | 597,462 | | | | | | | | 9,499,642 | |
Shares purchased | | | (2,779,584 | ) | | | | | | | (46,070,888 | ) |
Net increase (decrease) in shares outstanding before conversion | | | (1,646,378 | ) | | | | | | | (27,696,173 | ) |
Shares issued upon conversion from other share class(es) | | | 152,757 | | | | | | | | 2,546,276 | |
Shares purchased upon conversion into other share class(es) | | | (120,015 | ) | | | | | | | (1,974,533 | ) |
Net increase (decrease) in shares outstanding | | | (1,613,636 | ) | | | | | | $ | (27,124,430) | |
PGIM Quant Solutions Large-Cap Core Fund 43
Notes to Financial Statements (continued)
| | | | | | | | | | | | |
| | | | |
Share Class | | | Shares | | | | | | | | Amount | |
| | | |
Year ended October 31, 2022: | | | | | | | | | | | | |
Shares sold | | | 728,579 | | | | | | | $ | 12,708,622 | |
Shares issued in reinvestment of dividends and distributions | | | 4,053,312 | | | | | | | | 74,256,672 | |
Shares purchased | | | (3,441,735 | ) | | | | | | | (59,313,796 | ) |
Net increase (decrease) in shares outstanding before conversion | | | 1,340,156 | | | | | | | | 27,651,498 | |
Shares issued upon conversion from other share class(es) | | | 133,317 | | | | | | | | 2,309,798 | |
Shares purchased upon conversion into other share class(es) | | | (106,980 | ) | | | | | | | (1,845,512 | ) |
Net increase (decrease) in shares outstanding | | | 1,366,493 | | | | | | | $ | 28,115,784 | |
| | | |
Class C | | | | | | | | | | | | |
Year ended October 31, 2023: | | | | | | | | | | | | |
Shares sold | | | 89,439 | | | | | | | $ | 1,253,172 | |
Shares issued in reinvestment of dividends and distributions | | | 23,548 | | | | | | | | 321,896 | |
Shares purchased | | | (153,755 | ) | | | | | | | (2,160,660 | ) |
Net increase (decrease) in shares outstanding before conversion | | | (40,768 | ) | | | | | | | (585,592 | ) |
Shares purchased upon conversion into other share class(es) | | | (176,273 | ) | | | | | | | (2,518,164 | ) |
Net increase (decrease) in shares outstanding | | | (217,041 | ) | | | | | | $ | (3,103,756 | ) |
| | | |
Year ended October 31, 2022: | | | | | | | | | | | | |
Shares sold | | | 99,883 | | | | | | | $ | 1,472,695 | |
Shares issued in reinvestment of dividends and distributions | | | 218,899 | | | | | | | | 3,460,797 | |
Shares purchased | | | (180,782 | ) | | | | | | | (2,754,149 | ) |
Net increase (decrease) in shares outstanding before conversion | | | 138,000 | | | | | | | | 2,179,343 | |
Shares purchased upon conversion into other share class(es) | | | (166,582 | ) | | | | | | | (2,478,670 | ) |
Net increase (decrease) in shares outstanding | | | (28,582 | ) | | | | | | $ | (299,327 | ) |
| | | |
Class Z | | | | | | | | | | | | |
Year ended October 31, 2023: | | | | | | | | | | | | |
Shares sold | | | 69,891 | | | | | | | $ | 1,220,580 | |
Shares issued in reinvestment of dividends and distributions | | | 31,553 | | | | | | | | 520,632 | |
Shares purchased | | | (224,709 | ) | | | | | | | (3,859,034) | |
Net increase (decrease) in shares outstanding before conversion | | | (123,265 | ) | | | | | | | (2,117,822 | ) |
Shares issued upon conversion from other share class(es) | | | 96,062 | | | | | | | | 1,644,906 | |
Shares purchased upon conversion into other share class(es) | | | (9,831 | ) | | | | | | | (174,755 | ) |
Net increase (decrease) in shares outstanding | | | (37,034 | ) | | | | | | $ | (647,671 | ) |
44
| | | | | | | | | | | | |
| | | | |
Share Class | | | Shares | | | | | | | | Amount | |
| | | |
Year ended October 31, 2022: | | | | | | | | | | | | |
Shares sold | | | 132,004 | | | | | | | $ | 2,380,417 | |
Shares issued in reinvestment of dividends and distributions | | | 188,283 | | | | | | | | 3,575,495 | |
Shares purchased | | | (345,859 | ) | | | | | | | (6,006,503 | ) |
Net increase (decrease) in shares outstanding before conversion | | | (25,572 | ) | | | | | | | (50,591 | ) |
Shares issued upon conversion from other share class(es) | | | 108,667 | | | | | | | | 1,922,987 | |
Net increase (decrease) in shares outstanding | | | 83,095 | | | | | | | $ | 1,872,396 | |
| | | |
Class R6 | | | | | | | | | | | | |
Year ended October 31, 2023: | | | | | | | | | | | | |
Shares sold | | | 3,818,309 | | | | | | | $ | 65,986,084 | |
Shares issued in reinvestment of dividends and distributions | | | 371,721 | | | | | | | | 6,151,987 | |
Shares purchased | | | (3,578,240 | ) | | | | | | | (61,798,340) | |
Net increase (decrease) in shares outstanding before conversion | | | 611,790 | | | | | | | | 10,339,731 | |
Shares issued upon conversion from other share class(es) | | | 27,597 | | | | | | | | 477,110 | |
Shares purchased upon conversion into other share class(es) | | | (51 | ) | | | | | | | (840 | ) |
Net increase (decrease) in shares outstanding | | | 639,336 | | | | | | | $ | 10,816,001 | |
| | | |
Year ended October 31, 2022: | | | | | | | | | | | | |
Shares sold | | | 9,138,234 | | | | | | | $ | 165,393,560 | |
Shares issued in reinvestment of dividends and distributions | | | 1,981,061 | | | | | | | | 37,719,399 | |
Shares purchased | | | (10,749,193 | ) | | | | | | | (197,351,132 | ) |
Net increase (decrease) in shares outstanding before conversion | | | 370,102 | | | | | | | | 5,761,827 | |
Shares issued upon conversion from other share class(es) | | | 4,909 | | | | | | | | 102,158 | |
Shares purchased upon conversion into other share class(es) | | | (577 | ) | | | | | | | (10,761 | ) |
Net increase (decrease) in shares outstanding | | | 374,434 | | | | | | | $ | 5,853,224 | |
The RIC, on behalf of the Fund, along with other affiliated registered investment companies (the “Participating Funds”), is a party to a Syndicated Credit Agreement (“SCA”) with a group of banks. The purpose of the SCA is to provide an alternative source of temporary funding for capital share redemptions. The table below provides details of the current SCA in effect at the reporting period-end as well as the prior SCA.
| | | | | | |
| | | | |
| | | Current SCA | | | | Prior SCA |
Term of Commitment | | 9/29/2023 - 9/26/2024 | | | | 9/30/2022 – 9/28/2023 |
Total Commitment | | $ 1,200,000,000 | | | | $ 1,200,000,000 |
Annualized Commitment Fee on the Unused Portion of the SCA | | 0.15% | | | | 0.15% |
Annualized Interest Rate on Borrowings | | 1.00% plus the higher of (1) the effective federal funds rate, (2) the daily SOFR rate plus 0.10% or (3) zero percent | | | | 1.00% plus the higher of (1) the effective federal funds rate, (2) the daily SOFR rate plus 0.10% or (3) zero percent |
PGIM Quant Solutions Large-Cap Core Fund 45
Notes to Financial Statements (continued)
Certain affiliated registered investment companies that are parties to the SCA include portfolios that are subject to a predetermined mathematical formula used to manage certain benefit guarantees offered under variable annuity contracts. The formula may result in large scale asset flows into and out of these portfolios. Consequently, these portfolios may be more likely to utilize the SCA for purposes of funding redemptions. It may be possible for those portfolios to fully exhaust the committed amount of the SCA, thereby requiring the Manager to allocate available funding per a Board-approved methodology designed to treat the Participating Funds in the SCA equitably.
The Fund did not utilize the SCA during the year ended October 31, 2023.
| 9. | Risks of Investing in the Fund |
The Fund’s risks include, but are not limited to, some or all of the risks discussed below. For further information on the Fund’s risks, please refer to the Fund’s Prospectus and Statement of Additional Information.
Active Trading Risk: The Fund actively and frequently trades its portfolio securities. High portfolio turnover results in higher transaction costs, which can affect the Fund’s performance and have adverse tax consequences. In addition, high portfolio turnover may also mean that a proportionately greater amount of distributions to shareholders will be taxed as ordinary income rather than long-term capital gains compared to investment companies with lower portfolio turnover.
Blend Style Risk: The Fund’s blend investment style may subject the Fund to risks of both value and growth investing. The portion of the Fund’s portfolio that makes investments pursuant to a growth strategy may be subject to above-average fluctuations as a result of seeking higher than average capital growth. The portion of the Fund’s portfolio that makes investments pursuant to a value strategy may be subject to the risk that the market may not recognize a security’s intrinsic value for long periods of time or at all, or that a stock judged to be undervalued may actually be appropriately priced or overvalued. Issuers of value stocks may have experienced adverse business developments or may be subject to special risks that have caused the stock to be out of favor. If the Fund’s assessment of market conditions or a company’s value is inaccurate, the Fund could suffer losses or produce poor performance relative to other funds. Historically, growth stocks have performed best during later stages of economic expansion and value stocks have performed best during periods of economic recovery. Therefore, both styles may over time go in and out of favor with the markets. At times when a style is out of favor, that portion of the portfolio may lag the other portion of the portfolio, which may cause the Fund to underperform the market in general, its benchmark and other mutual funds. Growth and value stocks have historically produced similar long-term results, though each category has periods when it outperforms the other.
46
Economic and Market Events Risk: Events in the U.S. and global financial markets, including actions taken by the U.S. Federal Reserve or foreign central banks to stimulate or stabilize economic growth or the functioning of the securities markets, or otherwise reduce inflation may at times result in unusually high market volatility, which could negatively impact performance. Governmental efforts to curb inflation often have negative effects on the level of economic activity. Relatively reduced liquidity in credit and fixed income markets could adversely affect issuers worldwide.
Equity and Equity-Related Securities Risk: Equity and equity-related securities may be subject to changes in value, and their values may be more volatile than those of other asset classes. In addition to an individual security losing value, the value of the equity markets or a sector in which the Fund invests could go down. Different parts of a market can react differently to adverse issuer, market, regulatory, political and economic developments.
Increase in Expenses Risk: Your actual cost of investing in the Fund may be higher than the expenses shown in the expense table in the Fund’s prospectus for a variety of reasons. For example, expense ratios may be higher than those shown if average net assets decrease. Net assets are more likely to decrease and Fund expense ratios are more likely to increase when markets are volatile. Active and frequent trading of Fund securities can increase expenses.
Large Capitalization Company Risk: Companies with large market capitalizations go in and out of favor based on market and economic conditions. Larger companies tend to be less volatile than companies with smaller market capitalizations. In exchange for this potentially lower risk, the Fund’s value may not rise or fall as much as the value of funds that emphasize companies with smaller market capitalizations.
Large Shareholder and Large Scale Redemption Risk: Certain individuals, accounts, funds (including funds affiliated with the Manager) or institutions, including the Manager and its affiliates, may from time to time own or control a substantial amount of the Fund’s shares. There is no requirement that these entities maintain their investment in the Fund. There is a risk that such large shareholders or that the Fund’s shareholders generally may redeem all or a substantial portion of their investments in the Fund in a short period of time, which could have a significant negative impact on the Fund’s NAV, liquidity, and brokerage costs. Large redemptions could also result in tax consequences to shareholders and impact the Fund’s ability to implement its investment strategy. The Fund’s ability to pursue its investment objective after one or more large scale redemptions may be impaired and, as a result, the Fund may invest a larger portion of its assets in cash or cash equivalents.
Management Risk: Actively managed funds are subject to management risk. The subadviser will apply investment techniques and risk analyses in making investment decisions for the Fund, but the subadviser’s judgments about the attractiveness, value or market trends affecting a particular security, industry or sector or about market movements may be
PGIM Quant Solutions Large-Cap Core Fund 47
Notes to Financial Statements (continued)
incorrect. Additionally, the investments selected for the Fund may underperform the markets in general, the Fund’s benchmark and other funds with similar investment objectives.
Market Disruption and Geopolitical Risks: Market disruption can be caused by economic, financial or political events and factors, including but not limited to, international wars or conflicts (including Russia’s military invasion of Ukraine), geopolitical developments (including trading and tariff arrangements, sanctions and cybersecurity attacks), instability in regions such as Asia, Eastern Europe and the Middle East, terrorism, natural disasters and public health epidemics (including the outbreak of COVID-19 globally).
The extent and duration of such events and resulting market disruptions cannot be predicted, but could be substantial and could magnify the impact of other risks to the Fund. These and other similar events could adversely affect the U.S. and foreign financial markets and lead to increased market volatility, reduced liquidity in the securities markets, significant negative impacts on issuers and the markets for certain securities and commodities and/or government intervention. They may also cause short- or long-term economic uncertainties in the United States and worldwide. As a result, whether or not the Fund invests in securities of issuers located in or with significant exposure to the countries directly affected, the value and liquidity of the Fund’s investments may be negatively impacted. Further, due to closures of certain markets and restrictions on trading certain securities, the value of certain securities held by the Fund could be significantly impacted, which could lead to such securities being valued at zero.
Market Risk: Securities markets may be volatile and the market prices of the Fund’s securities may decline. Securities fluctuate in price based on changes in an issuer’s financial condition and overall market and economic conditions. If the market prices of the securities owned by the Fund fall, the value of your investment in the Fund will decline.
Model Design Risk: The subadviser uses certain quantitative models to help guide its investment decisions. The design of the underlying models may be flawed or incomplete. The investment models the subadviser uses are based on historical and theoretical underpinnings that it believes are sound. There can be no guarantee, however, that these underpinnings will correlate with security price behavior in the manner assumed by the subadviser’s models. Additionally, the quantitative techniques that underlie the subadviser’s portfolio construction processes may fail to fully anticipate important risks.
Model Implementation Risk: While the subadviser strives to mitigate the likelihood of material implementation errors, it is impossible to completely eliminate the risk of error in the implementation of the computer models that guide the subadviser’s quantitative investment processes. Additionally, it may be difficult to implement model recommendations
48
in volatile and rapidly changing market conditions.
| 10. | Recent Regulatory Developments |
Effective January 24, 2023, the SEC adopted rule and form amendments to require mutual funds and ETFs to transmit concise and visually engaging streamlined annual and semiannual reports to shareholders that highlight key information deemed important for retail investors to assess and monitor their fund investments (the “Rule”). Other information, including financial statements, will no longer appear in the funds’ streamlined shareholder reports but must be available online, delivered free of charge upon request, and filed on a semiannual basis on Form N-CSR. The Rule and form amendments have a compliance date of July 24, 2024. At this time, management is evaluating the Rule and its impact to the Fund.
PGIM Quant Solutions Large-Cap Core Fund 49
Report of Independent Registered Public Accounting Firm
To the Board of Trustees of Prudential Investment Portfolios 9 and Shareholders of PGIM Quant Solutions Large-Cap Core Fund
Opinion on the Financial Statements
We have audited the accompanying statement of assets and liabilities, including the schedule of investments, of PGIM Quant Solutions Large-Cap Core Fund (one of the funds constituting Prudential Investment Portfolios 9, referred to hereafter as the “Fund”) as of October 31, 2023, the related statement of operations for the year ended October 31, 2023, the statements of changes in net assets for each of the two years in the period ended October 31, 2023, including the related notes, and the financial highlights for each of the four years in the period ended October 31, 2023 (collectively referred to as the “financial statements”). In our opinion, the financial statements present fairly, in all material respects, the financial position of the Fund as of October 31, 2023, the results of its operations for the year then ended, the changes in its net assets for each of the two years in the period ended October 31, 2023 and the financial highlights for each of the four years in the period ended October 31, 2023 in conformity with accounting principles generally accepted in the United States of America.
The financial statements of the Fund as of and for the year ended October 31, 2019 and the financial highlights for the period ended October 31, 2019 (not presented herein, other than the financial highlights) were audited by other auditors whose report dated December 19, 2019 expressed an unqualified opinion on those financial statements and financial highlights.
Basis for Opinion
These financial statements are the responsibility of the Fund’s management. Our responsibility is to express an opinion on the Fund’s financial statements based on our audits. We are a public accounting firm registered with the Public Company Accounting Oversight Board (United States) (PCAOB) and are required to be independent with respect to the Fund in accordance with the U.S. federal securities laws and the applicable rules and regulations of the Securities and Exchange Commission and the PCAOB.
We conducted our audits of these financial statements in accordance with the standards of the PCAOB. Those standards require that we plan and perform the audit to obtain reasonable assurance about whether the financial statements are free of material misstatement, whether due to error or fraud.
Our audits included performing procedures to assess the risks of material misstatement of the financial statements, whether due to error or fraud, and performing procedures that respond to those risks. Such procedures included examining, on a test basis, evidence regarding the amounts and disclosures in the financial statements. Our audits also included evaluating the accounting principles used and significant estimates made by management, as well as evaluating the overall presentation of the financial statements. Our procedures included confirmation of securities owned as of October 31, 2023 by correspondence with the custodian, transfer agent and brokers. We believe that our audits provide a reasonable basis for our opinion.
/s/PricewaterhouseCoopers LLP
New York, New York
December 18, 2023
We have served as the auditor of one or more investment companies in the PGIM Retail Funds complex since 2020.
50
Tax Information (unaudited)
We are advising you that during the fiscal year ended October 31, 2023, the Fund reports the maximum amount allowed per share but not less than $0.18 for Class A, C, Z and R6 shares as a capital gain distribution in accordance with Section 852(b)(3)(C) of the Internal Revenue Code.
For the year ended October 31, 2023, the Fund reports the maximum amount allowable under Section 854 of the Internal Revenue Code, but not less than, the following percentages of the ordinary income dividends paid as 1) qualified dividend income (QDI); and 2) eligible for corporate dividends received deduction (DRD):
| | | | | | |
| | | | |
Fund | | QDI | | | | DRD |
| | | |
PGIM Quant Solutions Large-Cap Core Fund | | 100.00% | | | | 100.00% |
In January 2024, you will be advised on IRS Form 1099-DIV or substitute 1099-DIV, as to the federal tax status of dividends and distributions received by you in calendar year 2023.
PGIM Quant Solutions Large-Cap Core Fund 51
INFORMATION ABOUT BOARD MEMBERS AND OFFICERS (unaudited)
Information about Board Members and Officers of the Fund is set forth below. Board Members who are not deemed to be “interested persons” of the Fund, as defined in the 1940 Act, are referred to as “Independent Board Members.” Board Members who are deemed to be “interested persons” of the Fund are referred to as “Interested Board Members.” The Board Members are responsible for the overall supervision of the operations of the Fund and perform the various duties imposed on the directors of investment companies by the 1940 Act. The Board in turn elects the Officers, who are responsible for administering the day-to-day operations of the Fund.
| | | | | | |
| |
Independent Board Members |
| | | | |
Name Year of Birth Position(s) Portfolios Overseen | | Principal Occupation(s) During Past Five Years | | Other Directorships Held During Past Five Years | | Length of
Board Service |
| | | | |
Ellen S. Alberding 1958 Board Member Portfolios Overseen: 100 | | Chief Executive Officer and President, The Joyce Foundation (charitable foundation) (since 2002); formerly Vice Chair, City Colleges of Chicago (community college system) (2011-2015); formerly Trustee, National Park Foundation (charitable foundation for national park system) (2009-2018); formerly Trustee, Economic Club of Chicago (2009-2016); Trustee, Loyola University (since 2018). | | None. | | Since September 2013 |
| | | | |
Kevin J. Bannon 1952 Board Member Portfolios Overseen: 101 | | Retired; formerly Managing Director (April 2008-May 2015) and Chief Investment Officer (October 2008-November 2013) of Highmount Capital LLC (registered investment adviser); formerly Executive Vice President and Chief Investment Officer (April 1993-August 2007) of Bank of New York Company; formerly President (May 2003-May 2007) of BNY Hamilton Family of Mutual Funds. | | Director of Urstadt Biddle Properties (equity real estate investment trust) (September 2008-August 2023). | | Since July 2008 |
PGIM Quant Solutions Large-Cap Core Fund
| | | | | | |
| |
Independent Board Members |
| | | | |
Name Year of Birth Position(s) Portfolios Overseen | | Principal Occupation(s) During Past Five Years | | Other Directorships Held During Past Five Years | | Length of
Board Service |
| | | | |
Linda W. Bynoe 1952 Board Member Portfolios Overseen: 98 | | President and Chief Executive Officer (since March 1995) and formerly Chief Operating Officer (December 1989-February 1995) of Telemat Limited LLC (formerly Telemat Ltd) (management consulting); formerly Vice President (January 1985-June 1989) at Morgan Stanley & Co. (broker-dealer). | | Trustee of Equity Residential (residential real estate) (since December 2009); Director of Northern Trust Corporation (financial services) (since April 2006); formerly Director of Anixter International, Inc. (communication products distributor) (January 2006-June 2020). | | Since March 2005 |
| | | | |
Barry H. Evans 1960 Board Member Portfolios Overseen: 101 | | Retired; formerly President (2005-2016), Global Chief Operating Officer (2014-2016), Chief Investment Officer - Global Head of Fixed Income (1998-2014), and various portfolio manager roles (1986-2006), Manulife Asset Management (asset management). | | Formerly Director, Manulife Trust Company (2011-2018); formerly Director, Manulife Asset Management Limited (2015-2017); formerly Chairman of the Board of Directors of Manulife Asset Management U.S. (2005-2016); formerly Chairman of the Board, Declaration Investment Management and Research (2008-2016). | | Since September 2017 |
| | | | |
Keith F. Hartstein 1956 Board Member & Independent Chair Portfolios Overseen: 101 | | Retired; formerly Member (November 2014-September 2022) of the Governing Council of the Independent Directors Council (IDC) (organization of independent mutual fund directors); formerly Executive Committee of the IDC Board of Governors (October 2019-December 2021); formerly President and Chief Executive Officer (2005-2012), Senior Vice President (2004-2005), Senior Vice President of Sales and Marketing (1997-2004), and various executive management positions (1990-1997), John Hancock Funds, LLC (asset management); formerly Chairman, Investment Company Institute’s Sales Force Marketing Committee (2003-2008). | | None. | | Since September 2013 |
Visit our website at pgim.com/investments
| | | | | | |
| |
Independent Board Members |
| | | | |
Name Year of Birth Position(s) Portfolios Overseen | | Principal Occupation(s) During Past Five Years | | Other Directorships Held During Past Five Years | | Length of
Board Service |
| | | | |
Laurie Simon Hodrick 1962 Board Member Portfolios Overseen: 98 | | A. Barton Hepburn Professor Emerita of Economics in the Faculty of Business, Columbia Business School (since 2018); Visiting Fellow at the Hoover Institution, Stanford University (since 2015); Sole Member, ReidCourt LLC (since 2008) (a consulting firm); formerly Visiting Professor of Law, Stanford Law School (2015-2021); formerly A. Barton Hepburn Professor of Economics in the Faculty of Business, Columbia Business School (1996-2017); formerly Managing Director, Global Head of Alternative Investment Strategies, Deutsche Bank (2006-2008). | | Independent Director, Andela (since January 2022) (global talent network); Independent Director, Roku (since December 2020) (communication services); formerly Independent Director, Synnex Corporation (2019-2021) (information technology); formerly Independent Director, Kabbage, Inc. (2018-2020) (financial services); formerly Independent Director, Corporate Capital Trust (2017-2018) (a business development company). | | Since September 2017 |
| | | | |
Brian K. Reid 1961 Board Member Portfolios Overseen: 101 | | Retired; formerly Chief Economist for the Investment Company Institute (ICI) (2005-2017); formerly Senior Economist and Director of Industry and Financial Analysis at the ICI (1998-2004); formerly Senior Economist, Industry and Financial Analysis at the ICI (1996-1998); formerly Staff Economist at the Federal Reserve Board (1989-1996); formerly Director, ICI Mutual Insurance Company (2012-2017). | | None. | | Since March 2018 |
PGIM Quant Solutions Large-Cap Core Fund
| | | | | | |
| |
Independent Board Members |
| | | | |
Name Year of Birth Position(s) Portfolios Overseen | | Principal Occupation(s) During Past Five Years | | Other Directorships Held During Past Five Years | | Length of
Board Service |
| | | | |
Grace C. Torres 1959 Board Member Portfolios Overseen: 101 | | Retired; formerly Treasurer and Principal Financial and Accounting Officer of the PGIM Funds, Target Funds, Advanced Series Trust, Prudential Variable Contract Accounts and The Prudential Series Fund (1998-June 2014); Assistant Treasurer (March 1999-June 2014) and Senior Vice President (September 1999-June 2014) of PGIM Investments LLC; Assistant Treasurer (May 2003-June 2014) and Vice President (June 2005-June 2014) of AST Investment Services, Inc.; Senior Vice President and Assistant Treasurer (May 2003-June 2014) of Prudential Annuities Advisory Services, Inc. | | Director (since January 2018) of OceanFirst Financial Corp. and OceanFirst Bank; formerly Director (July 2015-January 2018) of Sun Bancorp, Inc. N.A. and Sun National Bank. | | Since November 2014 |
Visit our website at pgim.com/investments
| | | | | | |
| |
Interested Board Members |
| | | | |
Name Year of Birth Position(s) Portfolios Overseen | | Principal Occupation(s) During Past Five Years | | Other Directorships Held During Past Five Years | | Length of
Board Service |
| | | | |
Stuart S. Parker 1962 Board Member & President Portfolios Overseen: 101 | | President, Chief Executive Officer, Chief Operating Officer and Officer in Charge of PGIM Investments LLC (formerly known as Prudential Investments LLC) (since January 2012); President and Principal Executive Officer (“PEO”) (since December 2023) of the PGIM Credit Income Fund; President and PEO (since September 2022) of the PGIM Private Credit Fund; President and PEO (since March 2022) of the PGIM Private Real Estate Fund, Inc.; formerly Executive Vice President of Jennison Associates LLC and Head of Retail Distribution of PGIM Investments LLC (June 2005-December 2011); Investment Company Institute - Board of Governors (since May 2012). | | None. | | Since January 2012 |
| | | | |
Scott E. Benjamin 1973 Board Member & Vice President Portfolios Overseen: 101 | | Executive Vice President (since May 2009) of PGIM Investments LLC; Vice President (since June 2012) of Prudential Investment Management Services LLC; Executive Vice President (since September 2009) of AST Investment Services, Inc.; Senior Vice President of Product Development and Marketing, PGIM Investments (since February 2006); Vice President (since December 2023) of the PGIM Credit Income Fund; Vice President (since September 2022) of the PGIM Private Credit Fund; Vice President (since March 2022) of the PGIM Private Real Estate Fund, Inc.; formerly Vice President of Product Development and Product Management, PGIM Investments LLC (2003-2006). | | None. | | Since March 2010 |
PGIM Quant Solutions Large-Cap Core Fund
| | | | |
| |
Fund Officers(a) |
| | | |
Name Year of Birth Fund Position | | Principal Occupation(s) During Past Five Years | | Length of Service as Fund Officer |
| | | |
Claudia DiGiacomo 1974 Chief Legal Officer | | Chief Legal Officer (since December 2023) of the PGIM Credit Income Fund; Chief Legal Officer (since September 2022) of the PGIM Private Credit Fund; Chief Legal Officer (since July 2022) of the PGIM Private Real Estate Fund, Inc.; Chief Legal Officer, Executive Vice President and Secretary of PGIM Investments LLC (since August 2020); Chief Legal Officer of Prudential Mutual Fund Services LLC (since August 2020); Chief Legal Officer of PIFM Holdco, LLC (since August 2020); Vice President and Corporate Counsel (since January 2005) of Prudential; and Corporate Counsel of AST Investment Services, Inc. (since August 2020); formerly Vice President and Assistant Secretary of PGIM Investments LLC (2005-2020); formerly Associate at Sidley Austin Brown & Wood LLP (1999-2004). | | Since December 2005 |
| | | |
Andrew Donohue 1972 Chief Compliance Officer | | Chief Compliance Officer (since May 2023) of the PGIM Funds, Target Funds, PGIM ETF Trust, PGIM Global High Yield Fund, Inc., PGIM High Yield Bond Fund, Inc., PGIM Short Duration High Yield Opportunities Fund, Advanced Series Trust, The Prudential Series Fund, Prudential’s Gibraltar Fund, Inc., PGIM Private Credit Fund, PGIM Private Real Estate Fund, Inc.; Chief Compliance Officer of AST Investment Services, Inc. (since October 2022); Vice President, Chief Compliance Officer of PGIM Investments LLC (since September 2022); Chief Compliance Officer (since December 2023) of the PGIM Credit Income Fund; formerly various senior compliance roles within Principal Global Investors, LLC., global asset management for Principal Financial (2011-2022), most recently as Global Chief Compliance Officer (2016-2022). | | Since May 2023 |
| | | |
Andrew R. French 1962 Secretary | | Vice President (since December 2018) of PGIM Investments LLC; Secretary (since December 2023) of the PGIM Credit Income Fund; Secretary (since September 2022) of the PGIM Private Credit Fund; Secretary (since March 2022) of the PGIM Private Real Estate Fund, Inc.; formerly Vice President and Corporate Counsel (2010-2018) of Prudential; formerly Director and Corporate Counsel (2006-2010) of Prudential; Vice President and Assistant Secretary (since January 2007) of PGIM Investments LLC; Vice President and Assistant Secretary (since January 2007) of Prudential Mutual Fund Services LLC. | | Since October 2006 |
Visit our website at pgim.com/investments
| | | | |
| |
Fund Officers(a) |
| | | |
Name Year of Birth Fund Position | | Principal Occupation(s) During Past Five Years | | Length of Service as Fund Officer |
| | | |
Melissa Gonzalez 1980 Assistant Secretary | | Vice President and Corporate Counsel (since September 2018) of Prudential; Vice President and Assistant Secretary (since August 2020) of PGIM Investments LLC; Assistant Secretary (since December 2023) of the PGIM Credit Income Fund; Assistant Secretary (since September 2022) of the PGIM Private Credit Fund; Assistant Secretary (since March 2022) of the PGIM Private Real Estate Fund, Inc.; formerly Director and Corporate Counsel (March 2014-September 2018) of Prudential. | | Since March 2020 |
| | | |
Patrick E. McGuinness 1986 Assistant Secretary | | Vice President and Assistant Secretary (since August 2020) of PGIM Investments LLC; Director and Corporate Counsel (since February 2017) of Prudential; Assistant Secretary (since December 2023) of the PGIM Credit Income Fund; Assistant Secretary (since September 2022) of the PGIM Private Credit Fund; Assistant Secretary (since March 2022) of the PGIM Private Real Estate Fund, Inc. | | Since June 2020 |
| | | |
Debra Rubano 1975 Assistant Secretary | | Vice President and Corporate Counsel (since November 2020) of Prudential; Assistant Secretary (since December 2023) of the PGIM Credit Income Fund; Assistant Secretary (since September 2022) of the PGIM Private Credit Fund; Assistant Secretary (since March 2022) of the PGIM Private Real Estate Fund, Inc; formerly Director and Senior Counsel of Allianz Global Investors U.S. Holdings LLC (2010-2020) and Assistant Secretary of numerous funds in the Allianz fund complex (2015-2020). | | Since December 2020 |
| | | |
George Hoyt 1965 Assistant Secretary | | Vice President and Corporate Counsel of Prudential (since September 2023); formerly Associate General Counsel of Franklin Templeton and Secretary and Chief Legal Officer of certain funds in the Franklin Templeton complex (2020- 2023) and Managing Director (2016-2020) and Associate General Counsel for Legg Mason, Inc. and its predecessors (2004-2020). | | Since December 2023 |
| | | |
Devan Goolsby 1991 Assistant Secretary | | Vice President and Corporate Counsel of Prudential (since May 2023); formerly Associate at Eversheds Sutherland (US) LLP (2021-2023); Compliance Officer at Bloomberg LP (2019-2021); and an Examiner at the Financial Industry Regulatory Authority (2015-2019). | | Since December 2023 |
| | | |
Kelly A. Coyne 1968 Assistant Secretary | | Director, Investment Operations of Prudential Mutual Fund Services LLC (since 2010); Assistant Secretary (since December 2023) of the PGIM Credit Income Fund; Assistant Secretary (since September 2022) of the PGIM Private Credit Fund; Assistant Secretary (since March 2022) of the PGIM Private Real Estate Fund, Inc. | | Since March 2015 |
PGIM Quant Solutions Large-Cap Core Fund
| | | | |
| |
Fund Officers(a) |
| | | |
Name Year of Birth Fund Position | | Principal Occupation(s) During Past Five Years | | Length of Service as Fund Officer |
| | | |
Christian J. Kelly 1975 Chief Financial Officer | | Vice President, Global Head of Fund Administration of PGIM Investments LLC (since November 2018); Chief Financial Officer (since March 2023) of PGIM Investments mutual funds, closed end funds and ETFs, Advanced Series Trust Portfolios, Prudential Series Funds and Prudential Gibraltar Fund; Chief Financial Officer (since December 2023) of the PGIM Credit Income Fund; Chief Financial Officer of PGIM Private Credit Fund (since September 2022); Chief Financial Officer of PGIM Private Real Estate Fund, Inc. (since July 2022); formerly Treasurer and Principal Financial Officer (January 2019- March 2023) of PGIM Investments mutual funds, closed end funds and ETFs, Advanced Series Trust Portfolios, Prudential Series Funds and Prudential Gibraltar Fund; formerly Treasurer and Principal Financial Officer (March 2022 – July 2022) of the PGIM Private Real Estate Fund, Inc.; formerly Director of Fund Administration of Lord Abbett & Co. LLC (2009-2018), Treasurer and Principal Accounting Officer of the Lord Abbett Family of Funds (2017-2018); Director of Accounting, Avenue Capital Group (2008-2009); Senior Manager, Investment Management Practice of Deloitte & Touche LLP (1998-2007). | | Since January 2019 |
| | | |
Russ Shupak 1973 Treasurer and Principal Accounting Officer | | Vice President (since 2017) within PGIM Investments Fund Administration; Treasurer and Principal Accounting Officer of PGIM Investments mutual funds, closed end funds and ETFs (since March 2023); Treasurer and Principal Accounting Officer (since December 2023) of the PGIM Credit Income Fund; Treasurer and Principal Accounting Officer (since July 2022) of the PGIM Private Real Estate Fund, Inc.; Assistant Treasurer (since September 2022) of the PGIM Private Credit Fund; formerly Assistant Treasurer (March 2022 – July 2022) of the PGIM Private Real Estate Fund, Inc.; Assistant Treasurer of Advanced Series Trust Portfolios, Prudential Series Funds and Prudential Gibraltar Fund (since October 2019); formerly Director (2013-2017) within PGIM Investments Fund Administration. | | Since October 2019 |
| | | |
Lana Lomuti 1967 Assistant Treasurer | | Vice President (since 2007) within PGIM Investments Fund Administration; formerly Assistant Treasurer (December 2007-February 2014) of The Greater China Fund, Inc.; formerly Director (2005-2007) within PGIM Investments Fund Administration. | | Since April 2014 |
| | | |
Deborah Conway 1969 Assistant Treasurer | | Vice President (since 2017) within PGIM Investments Fund Administration; formerly Director (2007-2017) within PGIM Investments Fund Administration. | | Since October 2019 |
Visit our website at pgim.com/investments
| | | | |
| |
Fund Officers(a) |
| | | |
Name Year of Birth Fund Position | | Principal Occupation(s) During Past Five Years | | Length of Service as Fund Officer |
| | | |
Elyse M. McLaughlin 1974 Assistant Treasurer | | Vice President (since 2017) within PGIM Investments Fund Administration; Treasurer and Principal Accounting Officer of the Advanced Series Trust, the Prudential Series Fund and the Prudential Gibraltar Fund (since March 2023); Assistant Treasurer (since December 2023) of the PGIM Credit Income Fund; Treasurer and Principal Accounting Officer (since September 2022) of the PGIM Private Credit Fund; Assistant Treasurer (since March 2022) of the PGIM Private Real Estate Fund, Inc.; Assistant Treasurer of PGIM Investments mutual funds, closed end funds and ETFs (since October 2019); formerly Director (2011-2017) within PGIM Investments Fund Administration. | | Since October 2019 |
| | | |
Robert W. McCormack 1973 Assistant Treasurer | | Vice President (since 2019) within PGIM Investments Fund Administration; Assistant Treasurer (since March 2023) of PGIM Investments mutual funds, closed end funds, ETFs, Advanced Series Trust Portfolios, Prudential Series Funds and Prudential Gibraltar Fund; Assistant Treasurer (since December 2023) of the PGIM Credit Income Fund; Assistant Treasurer (since September 2022) of the PGIM Private Credit Fund; Assistant Treasurer (since March 2022) of the PGIM Private Real Estate Fund, Inc.; formerly Director (2016-2019) within PGIM Investments Fund Administration; formerly Vice President within Goldman, Sachs & Co. Investment Management Controllers (2008-2016), Assistant Treasurer of Goldman Sachs Family of Funds (2015-2016). | | Since March 2023 |
| | | |
Kelly Florio 1978 Anti-Money Laundering Compliance Officer | | Vice President, Corporate Compliance, Global Compliance Programs and Compliance Risk Management (since December 2021) of Prudential; formerly Head of Fraud Risk Management (October 2019-December 2021) at New York Life Insurance Company; formerly Head of Key Risk Area Operations (November 2018-October 2019), Director of the US Anti-Money Laundering Compliance Unit (2009-2018) and Bank Loss Prevention Associate (2006-2009) at MetLife. | | Since June 2022 |
| (a) | Excludes Mr. Parker and Mr. Benjamin, interested Board Members who also serve as President and Vice President, respectively. |
Explanatory Notes to Tables:
| ∎ | | Board Members are deemed to be “Interested,” as defined in the 1940 Act, by reason of their affiliation with PGIM Investments LLC and/or an affiliate of PGIM Investments LLC. |
| ∎ | | Unless otherwise noted, the address of all Board Members and Officers is c/o PGIM Investments LLC, 655 Broad Street, Newark, New Jersey 07102-4410. |
| ∎ | | There is no set term of office for Board Members or Officers. The Board Members have adopted a retirement policy, which calls for the retirement of Board Members on December 31 of the year in which they reach the age of 75. |
| ∎ | | “Other Directorships Held” includes all directorships of companies required to register or file reports with the SEC under the 1934 Act (that is, “public companies”) or other investment companies registered under the 1940 Act. |
PGIM Quant Solutions Large-Cap Core Fund
| ∎ | | “Portfolios Overseen” includes such applicable investment companies managed by PGIM Investments LLC and overseen by the Board Member. The investment companies for which PGIM Investments LLC serves as manager include the PGIM Mutual Funds, Target Funds, PGIM ETF Trust, PGIM Private Real Estate Fund, Inc., PGIM Private Credit Fund, PGIM Credit Income Fund, PGIM High Yield Bond Fund, Inc., PGIM Global High Yield Fund, Inc., PGIM Short Duration High Yield Opportunities Fund, The Prudential Series Fund, Prudential’s Gibraltar Fund, Inc. and the Advanced Series Trust. |
| ∎ | | As used in the Fund Officers table “Prudential” means The Prudential Insurance Company of America. |
Visit our website at pgim.com/investments
Approval of Advisory Agreements (unaudited)
The Fund’s Board of Trustees
The Board of Trustees (the “Board”) of PGIM Quant Solutions Large-Cap Core Fund (the “Fund”)1 consists of ten individuals, eight of whom are not “interested persons” of the Fund, as defined in the Investment Company Act of 1940, as amended (the “1940 Act”) (the “Independent Trustees”). The Board is responsible for the oversight of the Fund and its operations, and performs the various duties imposed on the directors of investment companies by the 1940 Act. The Independent Trustees have retained independent legal counsel to assist them in connection with their duties. The Chair of the Board is an Independent Trustee. The Board has established five standing committees: the Audit Committee, the Nominating and Governance Committee, the Compliance Committee and two Investment Committees. Each committee is chaired by, and composed of, Independent Trustees.
Annual Approval of the Fund’s Advisory Agreements
As required under the 1940 Act, the Board determines annually whether to renew the Fund’s management agreement with PGIM Investments LLC (“PGIM Investments”) and the Fund’s subadvisory agreement with PGIM Quantitative Solutions LLC (“PGIM Quantitative Solutions”). In considering the renewal of the agreements, the Board, including all of the Independent Trustees, met on May 25 and June 6-8, 2023 (the “Board Meeting”) and approved the renewal of the agreements through July 31, 2024, after concluding that the renewal of the agreements was in the best interests of the Fund and its shareholders.
In advance of the meetings, the Board requested and received materials relating to the agreements, and had the opportunity to ask questions and request further information in connection with its consideration. Among other things, the Board considered comparative fee information from PGIM Investments and PGIM Quantitative Solutions. Also, the Board considered comparisons with other mutual funds in relevant Peer Universes and Peer Groups, as is further discussed below.
In approving the agreements, the Board, including the Independent Trustees advised by independent legal counsel, considered the factors it deemed relevant, including the nature, quality and extent of services provided by PGIM Investments and the subadviser, the performance of the Fund, the profitability of PGIM Investments and its affiliates, expenses and fees, and the potential for economies of scale that may be shared with the Fund and its shareholders as the Fund’s assets grow. In their deliberations, the Trustees did not identify any single factor which alone was responsible for the Board’s decision to approve the agreements with respect to the Fund. In connection with its deliberations, the Board considered information provided by PGIM Investments throughout the year at regular Board meetings, presentations from portfolio managers and other information, as well as information furnished at or in advance of the Board Meeting.
| 1 | PGIM Quant Solutions Large-Cap Core Fund is a series of Prudential Investment Portfolios 9. |
PGIM Quant Solutions Large-Cap Core Fund
Approval of Advisory Agreements (continued)
The Trustees determined that the overall arrangements between the Fund and PGIM Investments, which serves as the Fund’s investment manager pursuant to a management agreement, and between PGIM Investments and PGIM Quantitative Solutions, which serves as the Fund’s subadviser pursuant to the terms of a subadvisory agreement with PGIM Investments, are in the best interests of the Fund and its shareholders in light of the services performed, fees charged and such other matters as the Trustees considered relevant in the exercise of their business judgment.
The material factors and conclusions that formed the basis for the Trustees’ reaching their determinations to approve the continuance of the agreements are separately discussed below.
Nature, Quality and Extent of Services
The Board received and considered information regarding the nature, quality and extent of services provided to the Fund by PGIM Investments and PGIM Quantitative Solutions. The Board noted that PGIM Quantitative Solutions is affiliated with PGIM Investments. The Board considered the services provided by PGIM Investments, including but not limited to the oversight of the subadviser for the Fund, as well as the provision of fund recordkeeping, compliance and other services to the Fund, and PGIM Investments’ role as administrator for the Fund’s liquidity risk management program. With respect to PGIM Investments’ oversight of the subadviser, the Board noted that PGIM Investments’ Strategic Investment Research Group (“SIRG”), which is a business unit of PGIM Investments, is responsible for monitoring and reporting to PGIM Investments’ senior management on the performance and operations of the subadviser. The Board also considered that PGIM Investments pays the salaries of all of the officers and interested Trustees of the Fund who are part of Fund management. The Board also considered the investment subadvisory services provided by PGIM Quantitative Solutions, including investment research and security selection, as well as adherence to the Fund’s investment restrictions and compliance with applicable Fund policies and procedures. The Board considered PGIM Investments’ evaluation of the subadviser, as well as PGIM Investments’ recommendation, based on its review of the subadviser, to renew the subadvisory agreement.
The Board considered the qualifications, backgrounds and responsibilities of PGIM Investments’ senior management responsible for the oversight of the Fund and PGIM Quantitative Solutions, and also considered the qualifications, backgrounds and responsibilities of the PGIM Quantitative Solutions portfolio managers who are responsible for the day-to-day management of the Fund’s portfolio. The Board was provided with information pertaining to PGIM Investments’ and PGIM Quantitative Solutions’ organizational structure, senior management, investment operations, and other relevant information pertaining to PGIM Investments and PGIM Quantitative Solutions. The Board also noted that it received favorable compliance reports from the Fund’s Chief Compliance Officer (“CCO”) as to PGIM Investments and PGIM Quantitative Solutions.
Visit our website at pgim.com/investments
The Board concluded that it was satisfied with the nature, extent and quality of the investment management services provided by PGIM Investments and the subadvisory services provided to the Fund by PGIM Quantitative Solutions, and that there was a reasonable basis on which to conclude that the Fund benefits from the services provided by PGIM Investments and PGIM Quantitative Solutions under the management and subadvisory agreements.
Costs of Services and Profits Realized by PGIM Investments
The Board was provided with information on the profitability of PGIM Investments and its affiliates in serving as the Fund’s investment manager. The Board discussed with PGIM Investments the methodology utilized in assembling the information regarding profitability and considered its reasonableness. The Board recognized that it is difficult to make comparisons of profitability from fund management contracts because comparative information is not generally publicly available and is affected by numerous factors, including the structure of the particular adviser, the types of funds it manages, its business mix, numerous assumptions regarding allocations and the adviser’s capital structure and cost of capital. Taking these factors into account, the Board concluded that the profitability of PGIM Investments and its affiliates in relation to the services rendered was not unreasonable.
Economies of Scale
The Board received and discussed information concerning economies of scale that PGIM Investments may realize as the Fund’s assets grow beyond current levels. The Board noted that the management fee schedule for the Fund includes breakpoints, which have the effect of decreasing the fee rate as assets increase. During the course of time, the Board has considered information regarding the launch date of the Fund, the management fees of the Fund compared to those of similarly managed funds and PGIM Investments’ investment in the Fund over time. The Board noted that economies of scale can be shared with the Fund in other ways, including low management fees from inception, additional technological and personnel investments to enhance shareholder services, and maintaining existing expense structures in the face of a rising cost environment. The Board also considered PGIM Investments’ assertion that it continually evaluates the management fee schedule of the Fund and the potential to share economies of scale through breakpoints or fee waivers as asset levels increase.
The Board recognized the inherent limitations of any analysis of economies of scale, stemming largely from the Board’s understanding that most of PGIM Investments’ costs are not specific to individual funds, but rather are incurred across a variety of products and services.
Other Benefits to PGIM Investments and PGIM Quantitative Solutions
The Board considered potential ancillary benefits that might be received by PGIM Investments, PGIM Quantitative Solutions and their affiliates as a result of their relationship with the Fund. The Board concluded that potential benefits to be derived by PGIM Investments included transfer agency fees received by the Fund’s transfer agent
PGIM Quant Solutions Large-Cap Core Fund
Approval of Advisory Agreementst (continued)
(which is affiliated with PGIM Investments), and benefits to its reputation as well as other intangible benefits resulting from PGIM Investments’ association with the Fund. The Board concluded that the potential benefits to be derived by PGIM Quantitative Solutions included its ability to use soft dollar credits, as well as the potential benefits consistent with those generally resulting from an increase in assets under management, specifically, potential access to additional research resources and benefits to its reputation. The Board concluded that the benefits derived by PGIM Investments and PGIM Quantitative Solutions were consistent with the types of benefits generally derived by investment managers and subadvisers to mutual funds.
Performance of the Fund / Fees and Expenses
The Board considered certain additional factors and made related conclusions relating to the historical performance of the Fund for the one-, three-, five- and ten-year periods ended December 31, 2022.
The Board also considered the Fund’s actual management fee, as well as the Fund’s net total expense ratio, for the fiscal year ended October 31, 2022. The Board considered the management fee for the Fund as compared to the management fee charged by PGIM Investments to other funds and the fee charged by other advisers to comparable mutual funds in a Peer Group. The actual management fee represents the fee rate actually paid by Fund shareholders and includes any fee waivers or reimbursements. The net total expense ratio for the Fund represents the actual expense ratio incurred by Fund shareholders.
The mutual funds included in the Peer Universe, which was used to consider performance, and the Peer Group, which was used to consider expenses and fees, were objectively determined by Broadridge, an independent provider of mutual fund data. In certain circumstances, PGIM Investments also provided supplemental Peer Universe or Peer Group information for reasons addressed with the Board. The comparisons placed the Fund in various quartiles over various periods, with the first quartile being the best 25% of the mutual funds (for performance, the best performing mutual funds and, for expenses, the lowest cost mutual funds).
The section below summarizes key factors considered by the Board and the Board’s conclusions regarding the Fund’s performance, fees and overall expenses. The table sets forth net performance comparisons (which reflect the impact on performance of fund expenses, or any subsidies, expense caps or waivers that may be applicable) with the Peer Universe, actual management fees with the Peer Group (which reflect the impact of any subsidies or fee waivers), and net total expenses with the Peer Group, each of which were key factors considered by the Board.
Visit our website at pgim.com/investments
| | | | | | | | |
Net Performance | | 1 Year | | 3 Years | | 5 Years | | 10 Years |
| | 2nd Quartile | | 3rd Quartile | | 4th Quartile | | 3rd Quartile |
Actual Management Fees: 1st Quartile |
Net Total Expenses: 1st Quartile |
| | · | | The Board noted that the Fund outperformed its benchmark index over the one-year period and underperformed over the three-, five-, and ten-year periods. |
| | · | | The Board and PGIM Investments agreed to retain the existing contractual expense cap, which (exclusive of certain fees and expenses) caps the Fund’s net annual operating expenses at 0.35% for each class of the Fund’s shares through February 29, 2024. |
| | · | | The Board and PGIM Investments also agreed to retain the existing contractual expense cap that (exclusive of certain fees and expenses) limits the Fund’s total annual operating expenses to 0.72% of the average daily net assets for Class A shares, and 1.44% of the average daily net assets for Class C shares through February 29, 2024. |
| | · | | In addition, PGIM Investments will waive management fees or shared operating expenses on any share class to the same extent that it waives such expenses on any other share class and has agreed that total annual fund operating expenses for Class R6 shares will not exceed total annual fund operating expenses for Class Z shares. |
| | · | | The Board concluded that, in light of the above, it would be in the best interests of the Fund and its shareholders to renew the agreements. |
| | · | | The Board concluded that the management fees (including subadvisory fees) and total expenses were reasonable in light of the services provided. |
* * *
After full consideration of these factors, the Board concluded that the approval of the agreements was in the best interests of the Fund and its shareholders.
PGIM Quant Solutions Large-Cap Core Fund
| | | | |
| | | |
⬛ MAIL 655 Broad Street Newark, NJ 07102 | | ⬛ TELEPHONE (800) 225-1852 | | ⬛ WEBSITE pgim.com/investments |
PROXY VOTING
The Board of Trustees of the Fund has delegated to the Fund’s subadviser the responsibility for voting any proxies and maintaining proxy recordkeeping with respect to the Fund. A description of these proxy voting policies and procedures is available without charge, upon request, by calling (800) 225-1852 or by visiting the Securities and Exchange Commission’s website at sec.gov. Information regarding how the Fund voted proxies relating to portfolio securities during the most recent 12-month period ended June 30 is available on the Fund’s website and on the Securities and Exchange Commission’s website.
TRUSTEES
Ellen S. Alberding ● Kevin J. Bannon ● Scott E. Benjamin ● Linda W. Bynoe ● Barry H. Evans ● Keith F. Hartstein ● Laurie Simon Hodrick ● Stuart S. Parker ● Brian K. Reid ● Grace C. Torres
OFFICERS
Stuart S. Parker, President ● Scott E. Benjamin, Vice President ● Christian J. Kelly, Chief Financial Officer ● Claudia DiGiacomo, Chief Legal Officer ● Andrew Donohue, Chief Compliance Officer ● Russ Shupak, Treasurer and Principal Accounting Officer ● Kelly Florio, Anti-Money Laundering Compliance Officer ● Andrew R. French, Secretary ● Melissa Gonzalez, Assistant Secretary ● Kelly A. Coyne, Assistant Secretary ● Patrick E. McGuinness, Assistant Secretary ● Debra Rubano, Assistant Secretary ● George Hoyt, Assistant Secretary ● Devan Goolsby, Assistant Secretary ● Lana Lomuti, Assistant Treasurer ● Elyse M. McLaughlin, Assistant Treasurer ● Deborah Conway, Assistant Treasurer ● Robert W. McCormack, Assistant Treasurer
| | | | |
MANAGER | | PGIM Investments LLC | | 655 Broad Street Newark, NJ 07102 |
| | |
SUBADVISER | | PGIM Quantitative Solutions LLC | | 655 Broad Street 16th Floor Newark, NJ 07102 |
| | |
DISTRIBUTOR | | Prudential Investment Management Services LLC | | 655 Broad Street Newark, NJ 07102 |
| | |
CUSTODIAN | | The Bank of New York Mellon | | 240 Greenwich Street New York, NY 10286 |
| | |
TRANSFER AGENT | | Prudential Mutual Fund Services LLC | | PO Box 534432 Pittsburgh, PA 15253 |
| | |
| INDEPENDENT REGISTERED PUBLIC ACCOUNTING FIRM | | PricewaterhouseCoopers LLP | | 300 Madison Avenue New York, NY 10017 |
| | |
FUND COUNSEL | | Willkie Farr & Gallagher LLP | | 787 Seventh Avenue New York, NY 10019 |
An investor should consider the investment objectives, risks, charges, and expenses of the Fund carefully before investing. The prospectus and summary prospectus contain this and other information about the Fund. An investor may obtain the prospectus and summary prospectus by visiting our website at pgim.com/investments or by calling (800) 225-1852. The prospectus and summary prospectus should be read carefully before investing.
E-DELIVERY
To receive your mutual fund documents online, go to pgim.com/investments/resource/edelivery and enroll. Instead of receiving printed documents by mail, you will receive notification via email when new materials are available. You can cancel your enrollment or change your email address at any time by visiting the website address above.
SHAREHOLDER COMMUNICATIONS WITH TRUSTEES
Shareholders can communicate directly with the Board of Trustees by writing to the Chair of the Board, PGIM Quant Solutions Large-Cap Core Fund, PGIM Investments, Attn: Board of Trustees, 655 Broad Street, Newark, NJ 07102. Shareholders can communicate directly with an individual Trustee by writing to that Trustee at the same address. Communications are not screened before being delivered to the addressee.
AVAILABILITY OF PORTFOLIO HOLDINGS
The Fund files its complete schedule of portfolio holdings with the Securities and Exchange Commission for the first and third quarters of each fiscal year as an exhibit to its reports on Form N-PORT. The Fund’s Form N-PORT filings are available on the Commission’s website at sec.gov.
The Fund’s Statement of Additional Information contains additional information about the Fund’s Trustees and is available without charge, upon request, by calling (800) 225-1852.
Mutual Funds:
| | | | |
| | | |
| ARE NOT INSURED BY THE FDIC OR ANY FEDERAL GOVERNMENT AGENCY | | MAY LOSE VALUE | | ARE NOT A DEPOSIT OF OR GUARANTEED BY ANY BANK OR ANY BANK AFFILIATE |

PGIM QUANT SOLUTIONS LARGE-CAP CORE FUND
| | | | | | | | | | | | |
| | | | | |
| SHARE CLASS | | | | | A | | C | | Z | | R6 |
| | | | | |
NASDAQ | | | | | | PTMAX | | PTMCX | | PTEZX | | PTMQX |
| | | | | |
CUSIP | | | | | | 74441J100 | | 74441J308 | | 74441J407 | | 74441J688 |
MF187E

PGIM REAL ESTATE INCOME FUND
ANNUAL REPORT
OCTOBER 31, 2023

To enroll in e-delivery, go to pgim.com/investments/resource/edelivery
Table of Contents
This report is not authorized for distribution to prospective investors unless preceded or accompanied by a current prospectus.
The views expressed in this report and information about the Fund’s portfolio holdings are for the period covered by this report and are subject to change thereafter.
Mutual funds are distributed by Prudential Investment Management Services LLC (PIMS), member SIPC. PGIM Real Estate is a unit of PGIM, Inc. (PGIM), a registered investment adviser. PIMS and PGIM are Prudential Financial companies. © 2023 Prudential Financial, Inc. and its related entities. PGIM Real Estate, PGIM, and the PGIM logo are service marks of Prudential Financial, Inc. and its related entities, registered in many jurisdictions worldwide.
2 Visit our website at pgim.com/investments
Letter from the President
| | | | |
 | | | | Dear Shareholder: We hope you find the annual report for the PGIM Real Estate Income Fund informative and useful. The report covers performance for the 12-month period that ended October 31, 2023. Although central banks raised interest rates aggressively to tame surging inflation during the period, the global economy and financial markets demonstrated resilience. Employers continued hiring, consumers continued spending, home prices rose, and recession fears receded. |
Early in the period, stocks began a rally that eventually ended a bear market and continued to rise globally for much of 2023 as inflation cooled and the Federal Reserve (the Fed) slowed the pace of its rate hikes. However, stocks declined late in the period when the Fed signaled that rates may remain elevated longer than investors had expected. For the entire period, large-cap US stocks and equities in international markets posted gains, while small-cap US stocks declined.
Bond markets benefited during the period as the Fed moderated its rate-hiking cycle, and the higher level of interest rates offered investors an additional cushion from fixed income volatility. US and global investment-grade bonds, along with US high yield corporate bonds and emerging market debt, all posted gains.
Regarding your investments with PGIM, we believe it is important to maintain a diversified portfolio of funds consistent with your tolerance for risk, time horizon, and financial goals. Your financial advisor can help you create a diversified investment plan that may include funds covering all the basic asset classes and that reflects your personal investor profile and risk tolerance. However, diversification and asset allocation strategies do not assure a profit or protect against loss in declining markets.
At PGIM Investments, we provide access to active investment strategies across the global markets in the pursuit of consistent outperformance for investors. PGIM is the world’s 14th-largest investment manager with more than $1.3 trillion in assets under management. Our scale and investment expertise allow us to deliver a diversified suite of actively managed solutions across a broad spectrum of asset classes and investment styles.
Thank you for choosing our family of funds.
Sincerely,

Stuart S. Parker, President
PGIM Real Estate Income Fund
December 15, 2023
PGIM Real Estate Income Fund 3
Your Fund’s Performance (unaudited)
Performance data quoted represent past performance. Past performance does not guarantee future results. The investment return and principal value of an investment will fluctuate so that an investor’s shares, when redeemed, may be worth more or less than their original cost. Current performance may be lower or higher than the past performance data quoted. An investor may obtain performance data as of the most recent month-end by visiting our website at pgim.com/investments or by calling (800) 225-1852.
| | | | | | | | |
| |
| | | Average Annual Total Returns as of 10/31/23 |
| | | One Year (%) | | | Five Years (%) | | Since Inception (%) |
| | | |
Class A | | | | | | | | |
| | | |
(with sales charges) | | | -6.68 | | | 0.56 | | 0.98 (6/3/2015) |
| | | |
(without sales charges) | | | -1.24 | | | 1.70 | | 1.66 (6/3/2015) |
| | | |
Class C | | | | | | | | |
| | | |
(with sales charges) | | | -2.96 | | | 0.93 | | 0.90 (6/3/2015) |
| | | |
(without sales charges) | | | -2.01 | | | 0.93 | | 0.90 (6/3/2015) |
| | | |
Class Z | | | | | | | | |
| | | |
(without sales charges) | | | -0.99 | | | 1.95 | | 1.93 (6/3/2015) |
| | | |
Class R6 | | | | | | | | |
| | | |
(without sales charges) | | | -0.98 | | | 1.96 | | 2.07 (12/28/2016) |
| |
Custom Blend Index | | |
| | | |
| | | | -3.53 | | | -1.13 | | — |
| | | | | | |
| | |
| Average Annual Total Returns as of 10/31/23 Since Inception (%) | | | | |
| | | | |
| | | Class A, Class C, Class Z
(6/3/2015) | | Class R6
(12/28/2016) |
| | |
Custom Blend Index | | 0.51 | | 0.15 |
Since Inception returns are provided since the Fund has less than 10 fiscal years of returns. Since Inception returns for the Index are measured from the closest month-end to the class’s inception date.
4 Visit our website at pgim.com/investments
Growth of a $10,000 Investment (unaudited)
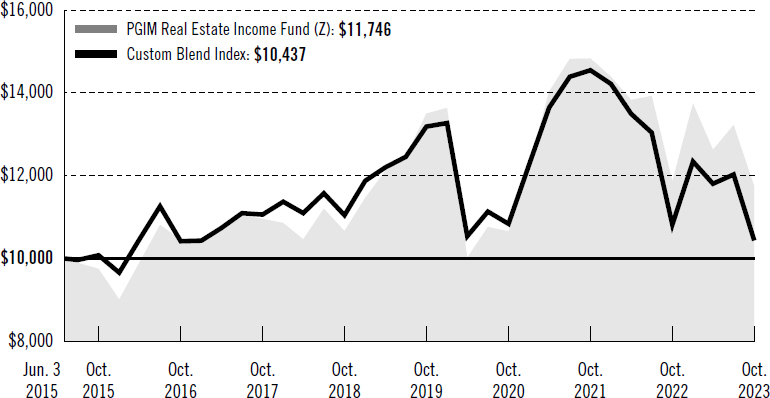
The graph compares a $10,000 investment in the Fund’s Class Z shares with a similar investment in the Custom Blend Index by portraying the initial account values at the commencement of operations for Class Z shares (June 3, 2015) and the account values at the end of the current fiscal year (October 31, 2023) as measured on a quarterly basis. For purposes of the graph, and unless otherwise indicated, it has been assumed that (a) all recurring fees (including management fees) were deducted and (b) all dividends and distributions were reinvested. The line graph provides information for Class Z shares only. As indicated in the tables provided earlier, performance for other share classes will vary due to the differing fees and expenses applicable to each share class (as indicated in the following paragraphs). Without waiver of fees and/or expense reimbursements, if any, the returns would have been lower.
Past performance does not predict future performance. Total returns and the ending account values in the graphs include changes in share price and reinvestment of dividends and capital gains distributions in a hypothetical investment for the periods shown. The Fund’s total returns do not reflect the deduction of income taxes on an individual’s investment. Taxes may reduce your actual investment returns on income or gains paid by the Fund or any gains you may realize if you sell your shares.
PGIM Real Estate Income Fund 5
Your Fund’s Performance (continued)
The returns in the tables do not reflect the deduction of taxes that a shareholder would pay on Fund distributions or following the redemption of Fund shares. The average annual total returns take into account applicable sales charges, which are described for each share class in the table below.
| | | | | | | | |
| | | | | |
| | | Class A | | Class C | | Class Z | | Class R6 |
| | | | | |
Maximum initial sales charge | | 5.50% of the public offering price | | None | | None | | None |
| | | | | |
Contingent deferred sales charge (CDSC) (as a percentage of the lower of the original purchase price or the net asset value at redemption) | | 1.00% on sales of $1 million or more made within 12 months of purchase | | 1.00% on sales made within 12 months of purchase | | None | | None |
| | | | | |
Annual distribution and service (12b-1) fees (shown as a percentage of average daily net assets) | | 0.30% (0.25% currently) | | 1.00% | | None | | None |
Benchmark Definition
Custom Blend Index—The Custom Blend Index is a model portfolio consisting of the FTSE EPRA/NAREIT Developed Index (80%), which is an unmanaged index and reflects the stock performance of companies engaged in specific aspects of the major real estate markets/regions of the world, and the BofA Merrill Lynch 7% Constrained REIT Preferred Securities Index (20%), which is an unmanaged index that is a subset of the BofA Merrill Lynch Fixed Rate Preferred Securities Index including all REIT-issued preferred securities.
Investors cannot invest directly in an index. The returns for the Index would be lower if they included the effects of sales charges, operating expenses of a mutual fund, or taxes that may be paid by an investor.
6 Visit our website at pgim.com/investments
Presentation of Fund Holdings as of 10/31/23
| | | | |
| | |
Ten Largest Holdings | | Real Estate Sectors | | % of Net Assets |
| | |
| Digital Realty Trust, Inc. | | Specialized REITs | | 6.0% |
| | |
| Brixmor Property Group, Inc. | | Retail REITs | | 5.8% |
| | |
| Simon Property Group, Inc. | | Retail REITs | | 5.6% |
| | |
| Omega Healthcare Investors, Inc. | | Health Care REITs | | 5.1% |
| | |
| Agree Realty Corp., Series A | | Retail REITs | | 4.8% |
| | |
| Broadstone Net Lease, Inc. | | Diversified REITs | | 4.6% |
| | |
| LXP Industrial Trust | | Industrial REITs | | 4.5% |
| | |
| VICI Properties, Inc. | | Specialized REITs | | 4.5% |
| | |
| EPR Properties | | Specialized REITs | | 4.1% |
| | |
| Apartment Income REIT Corp. | | Residential REITs | | 4.0% |
Holdings reflect only long-term investments and are subject to change.
PGIM Real Estate Income Fund 7
Strategy and Performance Overview*
(unaudited)
How did the Fund perform?
The PGIM Real Estate Income Fund’s Class Z shares returned –0.99% in the 12-month reporting period that ended October 31, 2023, outperforming the –3.53% return of the Custom Blend Index (the Index). The Index is a model portfolio consisting of the FTSE EPRA/NAREIT Developed Index (80%) and the BofA Merrill Lynch 7% Constrained REIT Preferred Securities Index (20%).
What were conditions like in the global real estate securities market?
| ● | During the reporting period, the real estate investment trust (REIT) market faced a perfect storm of rising inflation and sustained rate hikes, ushered in by pandemic-related global monetary easing and stimulus. Equity and bond market volatility became the norm, as markets alternated between greater or lesser rate-hike expectations in response to strong or weak inflation data. |
| ● | In the US, the Federal Reserve (Fed) raised rates sharply enough to reduce the risk of a severe inflation spike. Inflation declined from over 7% to just over 3%, despite a persistently strong consumer, an unemployment rate staying below 4% (3.9% currently), and roughly 200,000 new jobs being added each month. A dramatic rise in rates undermined REIT sentiment, with the federal funds rate reaching 5.25%–5.50% and the yield on the 10-year US Treasury note jumping 80 basis points (bps) during the third quarter of 2023, from 4.05% to 4.88%. (One basis point equals 0.01%.) |
| ● | Inflation figures declined in Europe throughout the period. However, as of the end of the period, the level of inflation still remained high relative to other global regions. This was especially true in the UK and Sweden, despite gradually declining figures for both headline and core inflation. Inflation levels in the UK remained materially higher than in continental Europe and much higher than in the US. Government bond yields at both the short and long end of the curve climbed throughout the region and remained elevated. In spite of this, the Bank of England held rates unchanged in its September 2023 decision, while the European Central Bank tightened but indicated an intention to pause. Companies with weak balance sheets remained near record discounts to net and gross asset values, as they were still exposed to refinancing risk and declining cash flows. Capitalization (cap) rates moved up quickly in the second half of 2022, in response to major upward moves in bond yields, and moved out further in the first nine months of 2023, but share prices implied further moves in private market-cap rates. The region experienced a rebound in the third quarter of 2023, despite the generally increasing global bond yield environment, led by sectors and countries that had largely underperformed in the previous 12 months. However, the rebound was fairly limited, with only Germany, Switzerland, and Sweden showing positive returns. The German real estate market produced a total return of 19.3% in the third quarter, thanks to its large, multifamily residential sector. Despite ongoing concerns regarding overextended balance sheets and bond refinancings in the multifamily sector, investors covered shorts and returned to stocks, which they considered oversold following their extended period of major underperformance. |
8 Visit our website at pgim.com/investments
| ● | In the Asia-Pacific region, attention centered on how the Fed, the Bank of Japan (BOJ), and the Chinese government appeared likely to move. In China, the central government announced relaxation measures in the property sector in an effort to spur a market rebound. The BOJ adjusted monetary policy in its last meeting during the period, as a result of stronger wage and inflation data, and indicated an expectation that new core Consumer Price Index numbers (excluding fresh food and energy) would come in below 2% in 2024. |
What worked and didn’t work?
| ● | During the reporting period, the Fund outperformed the Index in North America and Asia, while relative performance lagged in Europe. |
| ● | Within North America, the office sector largely drove outperformance, due to strong stock selection and asset allocation; on average, the Fund was underweight the sector relative to the Index. The hotel, mall, and triple-net sectors also contributed meaningfully to relative performance. Weak stock selection in the healthcare sector detracted. |
| ● | The Fund’s underperformance in Europe can be attributed to asset allocation. Lack of exposure to Switzerland, Germany, and France had a negative effect on relative returns. |
| ● | The Asia Pacific region performed well on a relative basis, due to favorable security selection in Hong Kong. Japan detracted due to an underweight position. |
Current outlook
| ● | The prevailing environment of heightened market volatility, driven by shifting rate-hike trends, presents an interesting dilemma wherein bad macroeconomic news could benefit real estate equities, as long as interest rate hikes slow, while net operating income is maintained. With increasing evidence of inflation slowing at the margin (but without a recession looming), the Fed has sounded less hawkish recently. The market expects, at most, a further rate uptick in 2023, followed by a pause in 2024. With 2024 being an election year, the Fed would likely act pragmatically on rates, especially if inflation moderates further. Accordingly, PGIM Real Estate believes the US is nearing the end of its current rate cycle, with headwinds likely to shift into tailwinds for the REIT market into the end of 2023 and throughout 2024. From a historical perspective, REITs have outperformed the S&P 500 Index following the conclusion of the last three Fed-tightening cycles for the following one-year periods. |
| ● | While a “soft landing” narrative seems to be taking root, this would be an unprecedented outcome, given the pace and extent of the Fed’s rate hikes this time around. A more hawkish Fed that implements additional hikes to cool core inflationary pressures remains a risk for 2024. Deglobalization and geopolitics—such as the continuation of the conflict in Ukraine and tensions between the US and China—also warrant concern. However, given the REIT market’s dramatic underperformance since the beginning of 2022 and its discounted valuation, PGIM Real Estate believes these incremental risks are already priced in. |
PGIM Real Estate Income Fund 9
Strategy and Performance Overview* (continued)
| ● | Outside of the office sector, US REIT fundamentals remain steady, with roughly 5.5% funds-from-operations (FFO) per-share growth expected in 2024, followed by 6% in 2025. Barring a major economic contraction, PGIM Real Estate expects REIT fundamentals to remain steady for most property types, given long lease durations, low supply risk, and defensive/secular-based demand. The current spread between REIT-implied valuations and private real estate values is at a historically wide spread, roughly 25% on an equally weighted basis. As rates stabilize, this valuation discrepancy is likely to lead to increased merger-and-acquisition opportunities for private equity players looking to deploy capital toward the discounted REIT sector. PGIM Real Estate continues to favor a barbell approach to the Fund’s sector allocation, minimizing unintended factor exposure. |
| ● | Regarding individual sectors of the US REIT market: |
| | ● | PGIM Real Estate has added to the Fund’s data center overweight, given attractive valuation and defensive net operating income (NOI) growth. Despite the outperformance of data centers year-to-date, the sector remains discounted and represents the only REIT sector to directly benefit from increasing artificial intelligence (AI)-related demand. |
| | ● | PGIM Real Estate also remains positive on sectors with embedded occupancy upside and limited economic sensitivity, such as healthcare. Senior housing occupancy, overall, remains roughly 4–6% below pre-pandemic levels, which should allow for significant top-line growth as trends continue to normalize. |
| | ● | The recent decline in retail (both shopping centers and malls) has increased the attractiveness of the sector, given decent growth prospects in 2024 and beyond. Within retail, PGIM Real Estate has become slightly more constructive on the mall sector relative to shopping centers, given relative valuations. |
| | ● | Despite discounted valuations, PGIM Real Estate remains cautious on the office sector, which appears to be in the early stages of a multi-year secular headwind. PGIM Real Estate has reduced the Fund’s weighting to the sector given its recent outperformance and numerous secular challenges expected in coming years. |
| | ● | PGIM Real Estate has also reduced the Fund’s industrial and storage weights, reflecting increasing caution regarding the ability of these sectors to sustain above-average growth in 2024. |
| ● | Inflation figures have been on the decline in Europe since November 2022. Although the region’s central banks chose to hold interest rates steady, rather than implement additional increases in their most recent decisions in October 2023, the level of inflation still remains high relative to other global regions. Despite the strong rebound in equity markets, companies with weak balance sheets remain at near-record discounts to net and gross asset values, as they are still exposed to refinancing risk and falling cash flows. PGIM Real Estate’s focus in Europe remains on those companies we believe are better equipped to withstand sustained high interest rates, |
10 Visit our website at pgim.com/investments
| | as well as potential macroeconomic headwinds. However, PGIM Real Estate has added to selected holdings, gradually moderating the Fund’s defensive regional positioning, as most of Europe may have reached the peak of the current interest rate cycle. |
| ● | In Asia, managing the rising cost of living, while ensuring economic growth, remains the predominant challenge. The path by which China manages its fiscal and monetary policies to boost economic growth, as well as its housing market policies, present an uncertain economic outlook. For the rest of Asia, economic growth and the monetary policy outlook remain largely dependent on Fed policy and global growth. A sharper rise in long-term real interest rates could negatively impact regional REIT valuations. In the event of setbacks on the geopolitical front, and given the severity of a potential US recession, risk appetite could remain in check heading into year-end. |
| ● | Regarding individual Asian markets: |
| | ● | In China, without a necessary increase in consumer confidence, PGIM Real Estate expects any economic recovery could be short-lived. |
| | ● | In Japan, PGIM Real Estate believes there could be additional tightening if inflation expectations surprise significantly to the upside. PGIM Real Estate is positive on Japanese developers, preferring names that exhibit strong shareholder returns with greater reopening exposure. Despite caution regarding Japanese REITs (J-REITs), the Fund maintains a sizeable overweight in hospitality names that benefit from tourism reopening relative to the Index. The Fund also holds an overweight relative to the Index to logistic-JREITs, given their strong fundamentals leading to earnings growth. |
| | ● | PGIM Real Estate is positive on Australian data centers and self-storage. AI, cloud-computing-driven demand, and increasing self-storage penetration trends, respectively, provide structural tailwinds to both sectors. |
| | ● | In Hong Kong, which is saddled by a weak economic outlook, the Fund holds exposure to the retail sector, as the recovery in tourist travel is the most visible upward trend in the market. |
| | ● | In Singapore, PGIM Real Estate favors manager/landlord plays, as well as hospitality and industrial names with solid dividend growth underpinned by strong fundamentals. |
*This strategy and performance overview, which discusses what strategies or holdings (including derivatives, if applicable) affected the Fund’s performance, is compiled based on how the Fund performed relative to the Index and is viewed for performance attribution purposes at the aggregate Fund level, which in most instances will not directly correlate to the amounts disclosed in the Statement of Operations which conform to US generally accepted accounting principles.
PGIM Real Estate Income Fund 11
Comments on Largest Holdings (unaudited)
6.0% Digital Realty Trust, Inc., Specialized REITs
Digital Realty owns, acquires, repositions, and manages technology-related real estate. The company’s properties, located throughout the United States and in England, support the day-to-day operations of technology industry tenants and corporate enterprise data center tenants.
5.8% Brixmor Property Group, Inc., Retail REITs
Brixmor Property owns and operates grocery-anchored community and neighborhood shopping centers in the United States.
5.6% Simon Property Group, Inc., Retail REITs
Simon Property owns, develops, and manages retail real estate properties, including regional malls, outlet centers, community/lifestyle centers, and international properties in the State of Indiana.
5.1% Omega Healthcare Investors, Inc., Health Care REITs
Omega Healthcare Investors invests in and provides financing to the long-term-care industry. Omega owns healthcare facilities in the United States, which are operated by independent healthcare companies.
4.8% Agree Realty Corp., Retail REITs
Agree Realty owns, manages, and develops primarily neighborhood community shopping centers and single-tenant properties located in 12 states and leased under net leases to major retail tenants.
12 Visit our website at pgim.com/investments
Fees and Expenses (unaudited)
As a shareholder of the Fund, you incur two types of costs: (1) transaction costs, including sales charges (loads) on purchase payments and redemptions, as applicable, and (2) ongoing costs, including management fees, distribution and/or service (12b-1) fees, and other Fund expenses, as applicable. This example is intended to help you understand your ongoing costs (in dollars) of investing in the Fund and to compare these costs with the ongoing costs of investing in other mutual funds.
The example is based on an investment of $1,000 held through the six-month period ended October 31, 2023. The example is for illustrative purposes only; you should consult the Prospectus for information on initial and subsequent minimum investment requirements.
Actual Expenses
The first line for each share class in the table on the following page provides information about actual account values and actual expenses. You may use the information on this line, together with the amount you invested, to estimate the expenses that you paid over the period. Simply divide your account value by $1,000 (for example, an $8,600 account value ÷ $1,000 = 8.6), then multiply the result by the number on the first line under the heading “Expenses Paid During the Six-Month Period” to estimate the expenses you paid on your account during this period.
Hypothetical Example for Comparison Purposes
The second line for each share class in the table on the following page provides information about hypothetical account values and hypothetical expenses based on the Fund’s actual expense ratio and an assumed rate of return of 5% per year before expenses, which is not the Fund’s actual return. The hypothetical account values and expenses may not be used to estimate the actual ending account balance or expenses you paid for the period. You may use this information to compare the ongoing costs of investing in the Fund and other funds. To do so, compare this 5% hypothetical example with the 5% hypothetical examples that appear in the shareholder reports of the other funds.
The Fund’s transfer agent may charge additional fees to holders of certain accounts that are not included in the expenses shown in the table on the following page. These fees apply to individual retirement accounts (IRAs) and Section 403(b) accounts. As of the close of the six-month period covered by the table, IRA fees included an annual maintenance fee of $15 per account (subject to a maximum annual maintenance fee of $25 for all accounts held by the same shareholder). Section 403(b) accounts are charged an annual $25 fiduciary maintenance fee. Some of the fees may vary in amount, or may be waived, based on your total account balance or the number of PGIM funds, including the Fund, that you own. You should consider the additional fees that were charged to your Fund account over the six-month period when you estimate the total ongoing expenses paid over the period and the impact of these fees on your ending account value, as these additional expenses are not reflected in the information
PGIM Real Estate Income Fund 13
Fees and Expenses (continued)
provided in the expense table. Additional fees have the effect of reducing investment returns.
Please note that the expenses shown in the table are meant to highlight your ongoing costs only and do not reflect any transactional costs such as sales charges (loads). Therefore, the second line for each share class in the table is useful in comparing ongoing costs only and will not help you determine the relative total costs of owning different funds. In addition, if these transactional costs were included, your costs would have been higher.
| | | | | | | | | | |
| | | | |
| PGIM Real Estate Income Fund | | Beginning
Account Value May 1, 2023 | | Ending
Account Value
October 31, 2023 | | Annualized Expense Ratio Based on the Six-Month Period | | Expenses Paid During the Six-Month Period* |
| | | | | |
Class A | | Actual | | $1,000.00 | | $ 930.10 | | 1.38% | | $ 6.71 |
| | | | | |
| | Hypothetical | | $1,000.00 | | $1,018.25 | | 1.38% | | $ 7.02 |
| | | | | |
Class C | | Actual | | $1,000.00 | | $ 926.30 | | 2.13% | | $10.34 |
| | | | | |
| | Hypothetical | | $1,000.00 | | $1,014.47 | | 2.13% | | $10.82 |
| | | | | |
Class Z | | Actual | | $1,000.00 | | $ 930.10 | | 1.13% | | $ 5.50 |
| | | | | |
| | Hypothetical | | $1,000.00 | | $1,019.51 | | 1.13% | | $ 5.75 |
| | | | | |
Class R6 | | Actual | | $1,000.00 | | $ 931.50 | | 1.14% | | $ 5.55 |
| | | | | |
| | | Hypothetical | | $1,000.00 | | $1,019.46 | | 1.14% | | $ 5.80 |
*Fund expenses (net of fee waivers or subsidies, if any) for each share class are equal to the annualized expense ratio for each share class (provided in the table), multiplied by the average account value over the period, multiplied by the 184 days in the six-month period ended October 31, 2023, and divided by the 365 days in the Fund’s fiscal year ended October 31, 2023 (to reflect the six-month period). Expenses presented in the table include the expenses of any underlying portfolios in which the Fund may invest.
14 Visit our website at pgim.com/investments
Schedule of Investments
as of October 31, 2023
| | | | | | | | |
| | |
| Description | | Shares | | | Value | |
| | |
| LONG-TERM INVESTMENTS 99.5% | | | | | | |
| | |
| COMMON STOCKS 79.1% | | | | | | |
| | |
| Diversified Real Estate Activities 2.0% | | | | | | |
| |
| | |
Sun Hung Kai Properties Ltd. (Hong Kong) | | | 58,330 | | | $ | 598,973 | |
| | |
| Diversified REITs 6.0% | | | | | | |
| |
| | |
Broadstone Net Lease, Inc. | | | 95,495 | | | | 1,351,254 | |
Land Securities Group PLC (United Kingdom) | | | 60,053 | | | | 416,270 | |
| | | | | | | | |
| | |
| | | | | | 1,767,524 | |
| | |
| Health Care REITs 7.9% | | | | | | |
| |
| | |
Community Healthcare Trust, Inc. | | | 29,438 | | | | 843,987 | |
Omega Healthcare Investors, Inc. | | | 45,097 | | | | 1,492,711 | |
| | | | | | | | |
| | |
| | | | | | 2,336,698 | |
| | |
| Hotel & Resort REITs 3.9% | | | | | | |
| |
| | |
Apple Hospitality REIT, Inc. | | | 73,150 | | | | 1,146,992 | |
| | |
| Industrial REITs 13.2% | | | | | | |
| |
| | |
CapitaLand Ascendas REIT (Singapore) | | | 352,541 | | | | 669,844 | |
Frasers Logistics & Commercial Trust (Singapore) | | | 1,302,064 | | | | 989,058 | |
LXP Industrial Trust | | | 167,906 | | | | 1,328,136 | |
Nexus Industrial REIT (Canada) | | | 191,307 | | | | 896,698 | |
| | | | | | | | |
| | |
| | | | | | 3,883,736 | |
| | |
| Office REITs 3.7% | | | | | | |
| |
| | |
Kilroy Realty Corp. | | | 38,678 | | | | 1,105,417 | |
| | |
| Residential REITs 4.0% | | | | | | |
| |
| | |
Apartment Income REIT Corp. | | | 40,322 | | | | 1,177,806 | |
| | |
| Retail REITs 21.2% | | | | | | |
| |
Brixmor Property Group, Inc. | | | 82,974 | | | | 1,725,029 | |
Link REIT (Hong Kong) | | | 109,017 | | | | 500,295 | |
Realty Income Corp. | | | 19,868 | | | | 941,346 | |
Region Re Ltd. (Australia) | | | 318,017 | | | | 397,646 | |
Scentre Group (Australia) | | | 456,872 | | | | 707,783 | |
Simon Property Group, Inc. | | | 14,990 | | | | 1,647,251 | |
Supermarket Income REIT PLC (United Kingdom) | | | 380,807 | | | | 336,220 | |
| | | | | | | | |
| | |
| | | | | | 6,255,570 | |
See Notes to Financial Statements.
PGIM Real Estate Income Fund 15
Schedule of Investments (continued)
as of October 31, 2023
| | | | | | | | |
| | |
| Description | | Shares | | | Value | |
| | |
| COMMON STOCKS (Continued) | | | | | | |
| | |
| Specialized REITs 17.2% | | | | | | |
| |
| | |
Digital Realty Trust, Inc. | | | 14,163 | | | $ | 1,761,311 | |
EPR Properties | | | 28,367 | | | | 1,211,271 | |
National Storage Affiliates Trust | | | 27,637 | | | | 788,207 | |
VICI Properties, Inc. | | | 47,349 | | | | 1,321,037 | |
| | | | | | | | |
| | |
| | | | | | 5,081,826 | |
| | | | | | | | |
| | |
| TOTAL COMMON STOCKS | | | | | | |
(cost $26,225,462) | | | | | | | 23,354,542 | |
| | | | | | | | |
| | |
| PREFERRED STOCKS 20.4% | | | | | | |
| | |
| Diversified REITs 2.7% | | | | | | |
| |
| | |
Gladstone Commercial Corp., Series G, 6.000%, Maturing 06/28/26(oo) | | | 48,154 | | | | 810,432 | |
| | |
| Hotel & Resort REITs 3.1% | | | | | | |
| |
| | |
Pebblebrook Hotel Trust, Series H, 5.700%, Maturing 07/27/26(oo) | | | 56,187 | | | | 904,049 | |
| | |
| Office REITs 3.4% | | | | | | |
| |
| | |
Vornado Realty Trust, Series M, 5.250%, Maturing 11/30/23(oo) | | | 72,012 | | | | 1,008,168 | |
| | |
| Residential REITs 2.1% | | | | | | |
| |
| | |
Centerspace, Series C, 6.625%, Maturing 11/30/23(oo) | | | 27,484 | | | | 615,642 | |
| | |
| Retail REITs 4.8% | | | | | | |
| |
| | |
Agree Realty Corp., Series A, 4.250%, Maturing 09/17/26(oo) | | | 88,181 | | | | 1,417,950 | |
| | |
| Specialized REITs 4.3% | | | | | | |
| |
| | |
EPR Properties, Series G, 5.750%, Maturing 11/30/23(oo) | | | 52,652 | | | | 949,315 | |
Public Storage, Series H, 5.600%, Maturing 03/11/24(oo) | | | 14,456 | | | | 320,779 | |
| | | | | | | | |
| | |
| | | | | | 1,270,094 | |
| | | | | | | | |
| | |
| TOTAL PREFERRED STOCKS | | | | | | |
(cost $7,041,211) | | | | | | | 6,026,335 | |
| | | | | | | | |
| | |
| TOTAL LONG-TERM INVESTMENTS | | | | | | |
(cost $33,266,673) | | | | | | | 29,380,877 | |
| | | | | | | | |
See Notes to Financial Statements.
16
| | | | | | | | |
| | |
| Description | | Shares | | | Value | |
| | |
| SHORT-TERM INVESTMENT 0.4% | | | | | | |
| | |
| AFFILIATED MUTUAL FUND | | | | | | |
PGIM Core Government Money Market Fund | | | | | | | | |
(cost $114,668)(wb) | | | 114,668 | | | $ | 114,668 | |
| | | | | | | | |
| | |
| TOTAL INVESTMENTS 99.9% | | | | | | |
(cost $33,381,341) | | | | | | | 29,495,545 | |
| Other assets in excess of liabilities 0.1% | | | | | 26,663 | |
| | | | | | | | |
| | |
| NET ASSETS 100.0% | | | | | $ 29,522,208 | |
| | | | | | | | |
Below is a list of the abbreviation(s) used in the annual report:
REITs—Real Estate Investment Trust
SOFR—Secured Overnight Financing Rate
UTS—Unit Trust Security
| (oo) | Perpetual security. Maturity date represents next call date. |
| (wb) | Represents an investment in a Fund affiliated with the Manager. |
Fair Value Measurements:
Various inputs are used in determining the value of the Fund’s investments. These inputs are summarized in the three broad levels listed below.
Level 1—unadjusted quoted prices generally in active markets for identical securities.
Level 2—quoted prices for similar securities, interest rates and yield curves, prepayment speeds, foreign currency exchange rates and other observable inputs.
Level 3—unobservable inputs for securities valued in accordance with Board approved fair valuation procedures.
The following is a summary of the inputs used as of October 31, 2023 in valuing such portfolio securities:
| | | | | | | | | | | | |
| | | Level 1 | | | Level 2 | | | Level 3 | |
Investments in Securities | | | | | | | | | | | | |
Assets | | | | | | | | | | | | |
Long-Term Investments | | | | | | | | | | | | |
Common Stocks | | | | | | | | | | | | |
Diversified Real Estate Activities | | $ | — | | | $ | 598,973 | | | | $— | |
Diversified REITs | | | 1,351,254 | | | | 416,270 | | | | — | |
Health Care REITs | | | 2,336,698 | | | | — | | | | — | |
Hotel & Resort REITs | | | 1,146,992 | | | | — | | | | — | |
Industrial REITs | | | 2,224,834 | | | | 1,658,902 | | | | — | |
Office REITs | | | 1,105,417 | | | | — | | | | — | |
Residential REITs | | | 1,177,806 | | | | — | | | | — | |
Retail REITs | | | 4,313,626 | | | | 1,941,944 | | | | — | |
Specialized REITs | | | 5,081,826 | | | | — | | | | — | |
Preferred Stocks | | | | | | | | | | | | |
Diversified REITs | | | 810,432 | | | | — | | | | — | |
Hotel & Resort REITs | | | 904,049 | | | | — | | | | — | |
See Notes to Financial Statements.
PGIM Real Estate Income Fund 17
Schedule of Investments (continued)
as of October 31, 2023
| | | | | | | | | | | | |
| | | Level 1 | | | Level 2 | | | Level 3 | |
Investments in Securities (continued) | | | | | | | | | | | | |
Assets (continued) | | | | | | | | | | | | |
Long-Term Investments (continued) | | | | | | | | | | | | |
Preferred Stocks (continued) | | | | | | | | | | | | |
Office REITs | | $ | 1,008,168 | | | $ | — | | | | $— | |
Residential REITs | | | 615,642 | | | | — | | | | — | |
Retail REITs | | | 1,417,950 | | | | — | | | | — | |
Specialized REITs | | | 1,270,094 | | | | — | | | | — | |
Short-Term Investment | | | | | | | | | | | | |
Affiliated Mutual Fund | | | 114,668 | | | | — | | | | — | |
| | | | | | | | | | | | |
| | | |
Total | | $ | 24,879,456 | | | $ | 4,616,089 | | | | $— | |
| | | | | | | | | | | | |
Sector Classification:
The sector classification of investments and other assets in excess of liabilities shown as a percentage of net assets as of October 31, 2023 were as follows:
| | | | |
Retail REITs | | | 26.0 | % |
Specialized REITs | | | 21.5 | |
Industrial REITs | | | 13.2 | |
Diversified REITs | | | 8.7 | |
Health Care REITs | | | 7.9 | |
Office REITs | | | 7.1 | |
Hotel & Resort REITs | | | 7.0 | |
Residential REITs | | | 6.1 | |
| | | | |
Diversified Real Estate Activities | | | 2.0 | % |
Affiliated Mutual Fund | | | 0.4 | |
| | | | |
| | | 99.9 | |
Other assets in excess of liabilities | | | 0.1 | |
| | | | |
| | | 100.0 | % |
| | | | |
See Notes to Financial Statements.
18
Statement of Assets and Liabilities
as of October 31, 2023
| | | | |
| |
Assets | | | | |
| |
Investments at value: | | | | |
Unaffiliated investments (cost $33,266,673) | | $ | 29,380,877 | |
Affiliated investments (cost $114,668) | | | 114,668 | |
Foreign currency, at value (cost $475) | | | 473 | |
Receivable for investments sold | | | 3,872,994 | |
Dividends receivable | | | 64,515 | |
Receivable for Fund shares sold | | | 19,336 | |
Tax reclaim receivable | | | 17,694 | |
Prepaid expenses | | | 939 | |
| | | | |
| |
Total Assets | | | 33,471,496 | |
| | | | |
| |
Liabilities | | | | |
| |
Payable for investments purchased | | | 3,866,322 | |
Accrued expenses and other liabilities | | | 53,485 | |
Payable for Fund shares purchased | | | 18,205 | |
Management fee payable | | | 9,748 | |
Trustees’ fees payable | | | 841 | |
Affiliated transfer agent fee payable | | | 429 | |
Distribution fee payable | | | 258 | |
| | | | |
| |
Total Liabilities | | | 3,949,288 | |
| | | | |
| |
Net Assets | | $ | 29,522,208 | |
| | | | |
| |
| | | | | |
| |
Net assets were comprised of: | | | | |
Shares of beneficial interest, at par | | $ | 5,041 | |
Paid-in capital in excess of par | | | 35,531,344 | |
Total distributable earnings (loss) | | | (6,014,177 | ) |
| | | | |
| |
Net assets, October 31, 2023 | | $ | 29,522,208 | |
| | | | |
See Notes to Financial Statements.
PGIM Real Estate Income Fund 19
Statement of Assets and Liabilities
as of October 31, 2023
| | | | | | | | |
Class A | | | | | | | | |
| | |
Net asset value and redemption price per share, ($524,366 ÷ 89,651 shares of beneficial interest issued and outstanding) | | $ | 5.85 | | | | | |
Maximum sales charge (5.50% of offering price) | | | 0.34 | | | | | |
| | | | | | | | |
| | |
Maximum offering price to public | | $ | 6.19 | | | | | |
| | | | | | | | |
| | |
Class C | | | | | | | | |
| | |
Net asset value, offering price and redemption price per share, ($166,788 ÷ 28,504 shares of beneficial interest issued and outstanding) | | $ | 5.85 | | | | | |
| | | | | | | | |
| | |
Class Z | | | | | | | | |
| | |
Net asset value, offering price and redemption price per share, ($450,517 ÷ 76,709 shares of beneficial interest issued and outstanding) | | $ | 5.87 | | | | | |
| | | | | | | | |
| | |
Class R6 | | | | | | | | |
| | |
Net asset value, offering price and redemption price per share, ($28,380,537 ÷ 4,846,319 shares of beneficial interest issued and outstanding) | | $ | 5.86 | | | | | |
| | | | | | | | |
See Notes to Financial Statements.
20
Statement of Operations
Year Ended October 31, 2023
| | | | |
| |
Net Investment Income (Loss) | | | | |
| |
Income | | | | |
Unaffiliated dividend income (net of $32,060 foreign withholding tax) | | $ | 1,200,454 | |
Affiliated dividend income | | | 10,722 | |
Income from securities lending, net (including affiliated income of $840) | | | 2,059 | |
| | | | |
Total income | | | 1,213,235 | |
| | | | |
| |
Expenses | | | | |
Management fee | | | 201,330 | |
Distribution fee(a) | | | 4,325 | |
Professional fees | | | 44,748 | |
Custodian and accounting fees | | | 38,056 | |
Audit fee | | | 33,814 | |
Registration fees(a) | | | 21,867 | |
Shareholders’ reports | | | 18,276 | |
Trustees’ fees | | | 9,881 | |
Transfer agent’s fees and expenses (including affiliated expense of $2,552)(a) | | | 5,126 | |
Commitment fees | | | 4,580 | |
Miscellaneous | | | 18,180 | |
| | | | |
| |
Total expenses | | | 400,183 | |
Less: Fee waiver and/or expense reimbursement(a) | | | (114,063 | ) |
Distribution fee waiver(a) | | | (352 | ) |
| | | | |
| |
Net expenses | | | 285,768 | |
| | | | |
| |
Net investment income (loss) | | | 927,467 | |
| | | | |
| |
Realized And Unrealized Gain (Loss) On Investment And Foreign Currency Transactions | | | | |
| |
Net realized gain (loss) on: | | | | |
Investment transactions (including affiliated of $47) | | | (1,830,036 | ) |
In-kind redemptions(1) | | | (971,423 | ) |
Foreign currency transactions | | | (3,050 | ) |
| | | | |
| |
| | | (2,804,509 | ) |
| | | | |
Net change in unrealized appreciation (depreciation) on: | | | | |
Investments | | | 1,511,385 | |
Foreign currencies | | | 459 | |
| | | | |
| |
| | | 1,511,844 | |
| | | | |
| |
Net gain (loss) on investment and foreign currency transactions | | | (1,292,665 | ) |
| | | | |
| |
Net Increase (Decrease) In Net Assets Resulting From Operations | | $ | (365,198 | ) |
| | | | |
| (1) | See Note 9, Redemption In-kind, in Notes to Financial Statements |
| (a) | Class specific expenses and waivers were as follows: |
| | | | | | | | | | | | | | | | |
| | | Class A | | | Class C | | | Class Z | | | Class R6 | |
| | | | |
Distribution fee | | | 2,113 | | | | 2,212 | | | | — | | | | — | |
Registration fees | | | 5,532 | | | | 5,782 | | | | 6,322 | | | | 4,231 | |
Transfer agent’s fees and expenses | | | 1,880 | | | | 541 | | | | 2,333 | | | | 372 | |
Fee waiver and/or expense reimbursement | | | (9,727 | ) | | | (7,059 | ) | | | (11,474 | ) | | | (85,803 | ) |
Distribution fee waiver | | | (352 | ) | | | — | | | | — | | | | — | |
See Notes to Financial Statements.
PGIM Real Estate Income Fund 21
Statements of Changes in Net Assets
| | | | | | | | | | |
| | |
| | | Year Ended October 31, | | | |
| | | |
| | | 2023 | | | 2022 | | | |
| | | |
Increase (Decrease) in Net Assets | | | | | | | | | | |
Operations | | | | | | | | | | |
Net investment income (loss) | | | $ 927,467 | | | | $ 1,267,169 | | | |
Net realized gain (loss) on investment and foreign currency transactions | | | (2,804,509 | ) | | | (280,806 | ) | | |
Net change in unrealized appreciation (depreciation) on investments and foreign currencies | | | 1,511,844 | | | | (8,315,357 | ) | | |
| | | | | | | | | | |
| | | |
Net increase (decrease) in net assets resulting from operations | | | (365,198 | ) | | | (7,328,994 | ) | | |
| | | | | | | | | | |
| | | |
Dividends and Distributions | | | | | | | | | | |
Distributions from distributable earnings | | | | | | | | | | |
Class A | | | (23,535 | ) | | | (342,173 | ) | | |
Class C | | | (6,131 | ) | | | (63,156 | ) | | |
Class Z | | | (24,610 | ) | | | (1,890,345 | ) | | |
Class R6 | | | (869,841 | ) | | | (6,496,377 | ) | | |
| | | | | | | | | | |
| | | |
| | | (924,117 | ) | | | (8,792,051 | ) | | |
| | | | | | | | | | |
Tax return of capital distributions | | | | | | | | | | |
Class A | | | (4,438 | ) | | | (18,151 | ) | | |
Class C | | | (1,156 | ) | | | (3,350 | ) | | |
Class Z | | | (4,641 | ) | | | (100,276 | ) | | |
Class R6 | | | (164,033 | ) | | | (344,611 | ) | | |
| | | | | | | | | | |
| | | |
| | | (174,268 | ) | | | (466,388 | ) | | |
| | | | | | | | | | |
Fund share transactions (Net of share conversions) | | | | | | | | | | |
Net proceeds from shares sold | | | 12,658,309 | | | | 7,132,240 | | | |
Net asset value of shares issued in reinvestment of dividends and distributions | | | 1,096,923 | | | | 9,242,174 | | | |
Cost of shares purchased | | | (10,859,789 | ) | | | (14,139,352 | ) | | |
| | | | | | | | | | |
| | | |
Net increase (decrease) in net assets from Fund share transactions | | | 2,895,443 | | | | 2,235,062 | | | |
| | | | | | | | | | |
| | | |
Total increase (decrease) | | | 1,431,860 | | | | (14,352,371 | ) | | |
| | | |
Net Assets: | | | | | | | | | | |
| | | |
Beginning of year | | | 28,090,348 | | | | 42,442,719 | | | |
| | | | | | | | | | |
| | | |
End of year | | | $29,522,208 | | | | $28,090,348 | | | |
| | | | | | | | | | |
See Notes to Financial Statements.
22
Financial Highlights
| | | | | | | | | | | | | | | | | | | | |
| |
| Class A Shares | |
| | | Year Ended October 31, | |
| | 2023 | | | 2022 | | | 2021 | | | 2020 | | | 2019 | |
| | | | | | |
| Per Share Operating Performance(a): | | | | | | | | | | | | | | | | | | | | |
| Net Asset Value, Beginning of Year | | | $6.18 | | | | $10.26 | | | | $7.67 | | | | $10.66 | | | | $8.76 | |
| Income (loss) from investment operations: | | | | | | | | | | | | | | | | | | | | |
| Net investment income (loss) | | | 0.22 | | | | 0.32 | | | | 0.25 | | | | 0.27 | | | | 0.28 | |
| Net realized and unrealized gain (loss) on investment and foreign currency transactions | | | (0.29 | ) | | | (1.99 | ) | | | 2.70 | | | | (2.43 | ) | | | 1.97 | |
| Total from investment operations | | | (0.07 | ) | | | (1.67 | ) | | | 2.95 | | | | (2.16 | ) | | | 2.25 | |
| Less Dividends and Distributions: | | | | | | | | | | | | | | | | | | | | |
| Dividends from net investment income | | | (0.22 | ) | | | (0.29 | ) | | | (0.36 | ) | | | (0.63 | ) | | | (0.35 | ) |
| Tax return of capital distributions | | | (0.04 | ) | | | (0.10 | ) | | | - | | | | (0.14 | ) | | | - | |
| Distributions from net realized gains | | | - | | | | (2.02 | ) | | | - | | | | (0.06 | ) | | | - | |
| Total dividends and distributions | | | (0.26 | ) | | | (2.41 | ) | | | (0.36 | ) | | | (0.83 | ) | | | (0.35 | ) |
| Net asset value, end of year | | | $5.85 | | | | $6.18 | | | | $10.26 | | | | $7.67 | | | | $10.66 | |
| Total Return(b): | | | (1.24 | )% | | | (20.18 | )% | | | 38.84 | % | | | (21.25 | )% | | | 26.26 | % |
| | | | | | | | | | | | | | | | | | | | | |
| | | | | | |
| Ratios/Supplemental Data: | | | | | | | | | | | | | | | |
| Net assets, end of year (000) | | | $524 | | | | $738 | | | | $1,582 | | | | $866 | | | | $915 | |
| Average net assets (000) | | | $705 | | | | $1,190 | | | | $1,428 | | | | $796 | | | | $677 | |
| Ratios to average net assets(c): | | | | | | | | | | | | | | | | | | | | |
| Expenses after waivers and/or expense reimbursement | | | 1.36 | %(d) | | | 1.35 | % | | | 1.35 | % | | | 1.36 | % | | | 1.35 | % |
| Expenses before waivers and/or expense reimbursement | | | 2.79 | % | | | 2.39 | % | | | 2.16 | % | | | 4.78 | % | | | 4.65 | % |
| Net investment income (loss) | | | 3.40 | % | | | 4.16 | % | | | 2.56 | % | | | 3.18 | % | | | 2.91 | % |
| Portfolio turnover rate(e) | | | 92 | % | | | 90 | % | | | 201 | % | | | 235 | % | | | 257 | % |
| (a) | Calculated based on average shares outstanding during the year. |
| (b) | Total return does not consider the effects of sales loads. Total return is calculated assuming a purchase of a share on the first day and a sale on the last day of each year reported and includes reinvestment of dividends and distributions, if any. Total returns may reflect adjustments to conform to GAAP. |
| (c) | Does not include expenses of the underlying funds in which the Fund invests. |
| (d) | Includes certain non-recurring expenses of 0.01% which are being excluded from the Fund’s contractual waiver for the year ended October 31, 2023. |
| (e) | The Fund’s portfolio turnover rate is calculated in accordance with regulatory requirements, without regard to transactions involving short-term investments, certain derivatives and in-kind transactions (if any). If such transactions were included, the Fund’s portfolio turnover rate may be higher. |
See Notes to Financial Statements.
PGIM Real Estate Income Fund 23
Financial Highlights (continued)
| | | | | | | | | | | | | | | | | | | | |
| |
| Class C Shares | |
| | | Year Ended October 31, | |
| | 2023 | | | 2022 | | | 2021 | | | 2020 | | | 2019 | |
| | | | | | |
| Per Share Operating Performance(a): | | | | | | | | | | | | | | | | | | | | |
| Net Asset Value, Beginning of Year | | | $6.18 | | | | $10.26 | | | | $7.67 | | | | $10.66 | | | | $8.76 | |
| Income (loss) from investment operations: | | | | | | | | | | | | | | | | | | | | |
| Net investment income (loss) | | | 0.17 | | | | 0.20 | | | | 0.18 | | | | 0.23 | | | | 0.21 | |
| Net realized and unrealized gain (loss) on investment and foreign currency transactions | | | (0.29 | ) | | | (1.93 | ) | | | 2.70 | | | | (2.45 | ) | | | 1.97 | |
| Total from investment operations | | | (0.12 | ) | | | (1.73 | ) | | | 2.88 | | | | (2.22 | ) | | | 2.18 | |
| Less Dividends and Distributions: | | | | | | | | | | | | | | | | | | | | |
| Dividends from net investment income | | | (0.17 | ) | | | (0.23 | ) | | | (0.29 | ) | | | (0.57 | ) | | | (0.28 | ) |
| Tax return of capital distributions | | | (0.04 | ) | | | (0.10 | ) | | | - | | | | (0.14 | ) | | | - | |
| Distributions from net realized gains | | | - | | | | (2.02 | ) | | | - | | | | (0.06 | ) | | | - | |
| Total dividends and distributions | | | (0.21 | ) | | | (2.35 | ) | | | (0.29 | ) | | | (0.77 | ) | | | (0.28 | ) |
| Net asset value, end of year | | | $5.85 | | | | $6.18 | | | | $10.26 | | | | $7.67 | | | | $10.66 | |
| Total Return(b): | | | (2.01 | )% | | | (20.81 | )% | | | 37.84 | % | | | (21.86 | )% | | | 25.34 | % |
| | | | | | | | | | | | | | | | | | | | | |
| | | | | | |
| Ratios/Supplemental Data: | | | | | | | | | | | | | | | |
| Net assets, end of year (000) | | | $167 | | | | $178 | | | | $277 | | | | $268 | | | | $639 | |
| Average net assets (000) | | | $221 | | | | $240 | | | | $302 | | | | $500 | | | | $510 | |
| Ratios to average net assets(c): | | | | | | | | | | | | | | | | | | | | |
| Expenses after waivers and/or expense reimbursement | | | 2.11 | %(d) | | | 2.10 | % | | | 2.10 | % | | | 2.11 | % | | | 2.10 | % |
| Expenses before waivers and/or expense reimbursement | | | 5.30 | % | | | 5.03 | % | | | 4.27 | % | | | 6.45 | % | | | 5.86 | % |
| Net investment income (loss) | | | 2.63 | % | | | 2.65 | % | | | 1.92 | % | | | 2.62 | % | | | 2.21 | % |
| Portfolio turnover rate(e) | | | 92 | % | | | 90 | % | | | 201 | % | | | 235 | % | | | 257 | % |
| (a) | Calculated based on average shares outstanding during the year. |
| (b) | Total return does not consider the effects of sales loads. Total return is calculated assuming a purchase of a share on the first day and a sale on the last day of each year reported and includes reinvestment of dividends and distributions, if any. Total returns may reflect adjustments to conform to GAAP. |
| (c) | Does not include expenses of the underlying funds in which the Fund invests. |
| (d) | Includes certain non-recurring expenses of 0.01% which are being excluded from the Fund’s contractual waiver for the year ended October 31, 2023. |
| (e) | The Fund’s portfolio turnover rate is calculated in accordance with regulatory requirements, without regard to transactions involving short-term investments, certain derivatives and in-kind transactions (if any). If such transactions were included, the Fund’s portfolio turnover rate may be higher. |
See Notes to Financial Statements.
24
| | | | | | | | | | | | | | | | | | | | |
| |
| Class Z Shares | |
| | | Year Ended October 31, | |
| | 2023 | | | 2022 | | | 2021 | | | 2020 | | | 2019 | |
| | | | | | |
| Per Share Operating Performance(a): | | | | | | | | | | | | | | | | | | | | |
| Net Asset Value, Beginning of Year | | | $6.20 | | | | $10.29 | | | | $7.69 | | | | $10.69 | | | | $8.78 | |
| Income (loss) from investment operations: | | | | | | | | | | | | | | | | | | | | |
| Net investment income (loss) | | | 0.26 | | | | 0.28 | | | | 0.28 | | | | 0.34 | | | | 0.31 | |
| Net realized and unrealized gain (loss) on investment and foreign currency transactions | | | (0.31 | ) | | | (1.94 | ) | | | 2.71 | | | | (2.49 | ) | | | 1.98 | |
| Total from investment operations | | | (0.05 | ) | | | (1.66 | ) | | | 2.99 | | | | (2.15 | ) | | | 2.29 | |
| Less Dividends and Distributions: | | | | | | | | | | | | | | | | | | | | |
| Dividends from net investment income | | | (0.24 | ) | | | (0.31 | ) | | | (0.39 | ) | | | (0.65 | ) | | | (0.38 | ) |
| Tax return of capital distributions | | | (0.04 | ) | | | (0.10 | ) | | | - | | | | (0.14 | ) | | | - | |
| Distributions from net realized gains | | | - | | | | (2.02 | ) | | | - | | | | (0.06 | ) | | | - | |
| Total dividends and distributions | | | (0.28 | ) | | | (2.43 | ) | | | (0.39 | ) | | | (0.85 | ) | | | (0.38 | ) |
| Net asset value, end of year | | | $5.87 | | | | $6.20 | | | | $10.29 | | | | $7.69 | | | | $10.69 | |
| Total Return(b): | | | (0.99 | )% | | | (20.03 | )% | | | 39.19 | % | | | (21.08 | )% | | | 26.62 | % |
| | | | | | | | | | | | | | | | | | | | | |
| | | | | | |
| Ratios/Supplemental Data: | | | | | | | | | | | | | | | |
| Net assets, end of year (000) | | | $451 | | | | $7,024 | | | | $10,941 | | | | $7,797 | | | | $16,451 | |
| Average net assets (000) | | | $1,033 | | | | $7,858 | | | | $11,287 | | | | $9,743 | | | | $12,060 | |
| Ratios to average net assets(c): | | | | | | | | | | | | | | | | | | | | |
| Expenses after waivers and/or expense reimbursement | | | 1.11 | %(d) | | | 1.10 | % | | | 1.10 | % | | | 1.11 | % | | | 1.10 | % |
| Expenses before waivers and/or expense reimbursement | | | 2.22 | % | | | 1.34 | % | | | 1.38 | % | | | 2.54 | % | | | 2.31 | % |
| Net investment income (loss) | | | 4.08 | % | | | 3.67 | % | | | 2.92 | % | | | 3.81 | % | | | 3.17 | % |
| Portfolio turnover rate(e) | | | 92 | % | | | 90 | % | | | 201 | % | | | 235 | % | | | 257 | % |
| (a) | Calculated based on average shares outstanding during the year. |
| (b) | Total return is calculated assuming a purchase of a share on the first day and a sale on the last day of each year reported and includes reinvestment of dividends and distributions, if any. Total returns may reflect adjustments to conform to GAAP. |
| (c) | Does not include expenses of the underlying funds in which the Fund invests. |
| (d) | Includes certain non-recurring expenses of 0.01% which are being excluded from the Fund’s contractual waiver for the year ended October 31, 2023. |
| (e) | The Fund’s portfolio turnover rate is calculated in accordance with regulatory requirements, without regard to transactions involving short-term investments, certain derivatives and in-kind transactions (if any). If such transactions were included, the Fund’s portfolio turnover rate may be higher. |
See Notes to Financial Statements.
PGIM Real Estate Income Fund 25
Financial Highlights (continued)
| | | | | | | | | | | | | | | | | | | | |
| |
| Class R6 Shares | |
| | | Year Ended October 31, | |
| | 2023 | | | 2022 | | | 2021 | | | 2020 | | | 2019 | |
| | | | | | |
| Per Share Operating Performance(a): | | | | | | | | | | | | | | | | | | | | |
| Net Asset Value, Beginning of Year | | | $6.19 | | | | $10.27 | | | | $7.68 | | | | $10.67 | | | | $8.76 | |
| Income (loss) from investment operations: | | | | | | | | | | | | | | | | | | | | |
| Net investment income (loss) | | | 0.24 | | | | 0.28 | | | | 0.27 | | | | 0.12 | | | | 0.31 | |
| Net realized and unrealized gain (loss) on investment and foreign currency transactions | | | (0.29 | ) | | | (1.93 | ) | | | 2.71 | | | | (2.26 | ) | | | 1.98 | |
| Total from investment operations | | | (0.05 | ) | | | (1.65 | ) | | | 2.98 | | | | (2.14 | ) | | | 2.29 | |
| Less Dividends and Distributions: | | | | | | | | | | | | | | | | | | | | |
| Dividends from net investment income | | | (0.24 | ) | | | (0.31 | ) | | | (0.39 | ) | | | (0.65 | ) | | | (0.38 | ) |
| Tax return of capital distributions | | | (0.04 | ) | | | (0.10 | ) | | | - | | | | (0.14 | ) | | | - | |
| Distributions from net realized gains | | | - | | | | (2.02 | ) | | | - | | | | (0.06 | ) | | | - | |
| Total dividends and distributions | | | (0.28 | ) | | | (2.43 | ) | | | (0.39 | ) | | | (0.85 | ) | | | (0.38 | ) |
| Net asset value, end of year | | | $5.86 | | | | $6.19 | | | | $10.27 | | | | $7.68 | | | | $10.67 | |
| Total Return(b): | | | (0.98 | )% | | | (19.95 | )% | | | 39.11 | % | | | (21.03 | )% | | | 26.54 | % |
| | | | | | | | | | | | | | | | | | | | | |
| | | | | | |
| Ratios/Supplemental Data: | | | | | | | | | | | | | | | |
| Net assets, end of year (000) | | | $28,381 | | | | $20,150 | | | | $29,642 | | | | $23,216 | | | | $158 | |
| Average net assets (000) | | | $23,207 | | | | $24,849 | | | | $33,597 | | | | $675 | | | | $115 | |
| Ratios to average net assets(c): | | | | | | | | | | | | | | | | | | | | |
| Expenses after waivers and/or expense reimbursement | | | 1.12 | %(d) | | | 1.10 | % | | | 1.10 | % | | | 1.10 | % | | | 1.10 | % |
| Expenses before waivers and/or expense reimbursement | | | 1.49 | % | | | 1.24 | % | | | 1.15 | % | | | 3.80 | % | | | 8.55 | % |
| Net investment income (loss) | | | 3.69 | % | | | 3.72 | % | | | 2.82 | % | | | 1.36 | % | | | 3.15 | % |
| Portfolio turnover rate(e) | | | 92 | % | | | 90 | % | | | 201 | % | | | 235 | % | | | 257 | % |
| (a) | Calculated based on average shares outstanding during the year. |
| (b) | Total return is calculated assuming a purchase of a share on the first day and a sale on the last day of each year reported and includes reinvestment of dividends and distributions, if any. Total returns may reflect adjustments to conform to GAAP. |
| (c) | Does not include expenses of the underlying funds in which the Fund invests. |
| (d) | Includes certain non-recurring expenses of 0.02% which are being excluded from the Fund’s contractual waiver for the year ended October 31, 2023. |
| (e) | The Fund’s portfolio turnover rate is calculated in accordance with regulatory requirements, without regard to transactions involving short-term investments, certain derivatives and in-kind transactions (if any). If such transactions were included, the Fund’s portfolio turnover rate may be higher. |
See Notes to Financial Statements.
26
Notes to Financial Statements
Prudential Investment Portfolios 9 (the “Registered Investment Company” or “RIC”) is registered under the Investment Company Act of 1940, as amended (“1940 Act”), as an open-end management investment company. The RIC is organized as a Delaware Statutory Trust. These financial statements relate only to the PGIM Real Estate Income Fund (the “Fund”), a series of the RIC. The Fund is classified as a non-diversified fund for purposes of the 1940 Act.
The investment objective of the Fund is to seek income and capital appreciation.
The Fund follows the investment company accounting and reporting guidance of the Financial Accounting Standards Board (“FASB”) Accounting Standard Codification (“ASC”) Topic 946 Financial Services — Investment Companies. The following is a summary of significant accounting policies followed by the Fund in the preparation of its financial statements. The policies conform to U.S. generally accepted accounting principles (“GAAP”). The Fund consistently follows such policies in the preparation of its financial statements.
Securities Valuation: The Fund holds securities and other assets and liabilities that are fair valued as of the close of each day (generally, 4:00 PM Eastern time) the New York Stock Exchange (“NYSE”) is open for trading. As described in further detail below, the Fund’s investments are valued daily based on a number of factors, including the type of investment and whether market quotations are readily available. The RIC’s Board of Trustees (the “Board”) has approved the Fund’s valuation policies and procedures for security valuation and designated PGIM Investments LLC (“PGIM Investments” or the “Manager”) as the “Valuation Designee,” as defined by Rule 2a-5(b) under the 1940 Act, to perform the fair value determination relating to all Fund investments. Pursuant to the Board’s oversight, the Valuation Designee has established a Valuation Committee to perform the duties and responsibilities as Valuation Designee under Rule 2a-5. The valuation procedures permit the Fund to utilize independent pricing vendor services, quotations from market makers, and alternative valuation methods when market quotations are either not readily available or not deemed representative of fair value. Fair value is the estimated price that would be received to sell an asset or paid to transfer a liability in an orderly transaction between market participants on the measurement date.
For the fiscal reporting year-end, securities and other assets and liabilities were fair valued at the close of the last U.S. business day. Trading in certain foreign securities may occur when the NYSE is closed (including weekends and holidays). Because such foreign securities trade in markets that are open on weekends and U.S. holidays, the values of some of the
PGIM Real Estate Income Fund 27
Notes to Financial Statements (continued)
Fund’s foreign investments may change on days when investors cannot purchase or redeem Fund shares.
Various inputs determine how the Fund’s investments are valued, all of which are categorized according to the three broad levels (Level 1, 2, or 3) detailed in the Schedule of Investments and referred to herein as the “fair value hierarchy” in accordance with FASB ASC Topic 820 — Fair Value Measurement.
Common or preferred stocks, exchange-traded funds (ETFs) and derivative instruments, if applicable, that are traded on a national securities exchange are valued at the last sale price as of the close of trading on the applicable exchange where the security principally trades. Securities traded via NASDAQ are valued at the NASDAQ official closing price. To the extent these securities are valued at the last sale price or NASDAQ official closing price, they are classified as Level 1 in the fair value hierarchy. In the event that no sale or official closing price on a valuation date exists, these securities are generally valued at the mean between the last reported bid and ask prices, or at the last bid price in the absence of an ask price. These securities are classified as Level 2 in the fair value hierarchy.
Foreign equities traded on foreign securities exchanges are generally valued using pricing vendor services that provide model prices derived using adjustment factors based on information such as local closing price, relevant general and sector indices, currency fluctuations, depositary receipts, and futures, as applicable. Securities valued using such model prices are classified as Level 2 in the fair value hierarchy. The models generate an evaluated adjustment factor for each security, which is applied to the local closing price to adjust it for post closing market movements up to the time the Fund is valued. Utilizing that evaluated adjustment factor, the vendor provides an evaluated price for each security. If the vendor does not provide an evaluated price, securities are valued in accordance with exchange-traded common and preferred stock valuation policies discussed above.
Investments in open-end funds (other than ETFs) are valued at their net asset values as of the close of the NYSE on the date of valuation. These securities are classified as Level 1 in the fair value hierarchy since they may be purchased or sold at their net asset values on the date of valuation.
Securities and other assets that cannot be priced according to the methods described above are valued based on policies and procedures approved by the Board. In the event that unobservable inputs are used when determining such valuations, the securities will be classified as Level 3 in the fair value hierarchy. Altering one or more unobservable inputs may result in a significant change to a Level 3 security’s fair value measurement.
28
When determining the fair value of securities, some of the factors influencing the valuation include: the nature of any restrictions on disposition of the securities; assessment of the general liquidity of the securities; the issuer’s financial condition and the markets in which it does business; the cost of the investment; the size of the holding and the capitalization of the issuer; the prices of any recent transactions or bids/offers for such securities or any comparable securities; and any available analyst media or other reports or information deemed reliable by the Valuation Designee regarding the issuer or the markets or industry in which it operates. Using fair value to price securities may result in a value that is different from a security’s most recent closing price and from the price used by other unaffiliated mutual funds to calculate their net asset values.
Foreign Currency Translation: The books and records of the Fund are maintained in U.S. dollars. Foreign currency amounts are translated into U.S. dollars on the following basis:
(i) market value of investment securities, other assets and liabilities — at the exchange rate as of the valuation date;
(ii) purchases and sales of investment securities, income and expenses — at the rates of exchange prevailing on the respective dates of such transactions.
Although the net assets of the Fund are presented at the foreign exchange rates and market values at the close of the period, the Fund does not generally isolate that portion of the results of operations arising as a result of changes in the foreign exchange rates from the fluctuations arising from changes in the market prices of long-term portfolio securities held at the end of the period. Similarly, the Fund does not isolate the effect of changes in foreign exchange rates from the fluctuations arising from changes in the market prices of long-term portfolio securities sold during the period. Accordingly, holding period unrealized and realized foreign currency gains (losses) are included in the reported net change in unrealized appreciation (depreciation) on investments and net realized gains (losses) on investment transactions on the Statements of Operations.
Net realized gains (losses) on foreign currency transactions represent net foreign exchange gains (losses) from the disposition of holdings of foreign currencies, currency gains (losses) realized between the trade and settlement dates on investment transactions, and the difference between the amounts of interest, dividends and foreign withholding taxes recorded on the Fund’s books and the U.S. dollar equivalent amounts actually received or paid. Net unrealized currency gains (losses) arise from valuing foreign currency denominated assets and liabilities (other than investments) at period end exchange rates.
Master Netting Arrangements: The RIC, on behalf of the Fund, is subject to various Master Agreements, or netting arrangements, with select counterparties. These are agreements which a subadviser may have negotiated and entered into on behalf of all or a portion of the Fund. A master netting arrangement between the Fund and the counterparty permits the Fund to offset amounts payable by the Fund to the same counterparty against amounts to be received and by the receipt of collateral from the counterparty by the Fund to cover
PGIM Real Estate Income Fund 29
Notes to Financial Statements (continued)
the Fund’s exposure to the counterparty. However, there is no assurance that such mitigating factors are easily enforceable. In addition to master netting arrangements, the right to set-off exists when all the conditions are met such that each of the parties owes the other determinable amounts, the reporting party has the right to set-off the amount owed with the amount owed by the other party, the reporting party intends to set-off and the right of set-off is enforceable by law.
Securities Lending: The Fund lends its portfolio securities to banks and broker-dealers. The loans are secured by collateral at least equal to the market value of the securities loaned. Collateral pledged by each borrower is invested in an affiliated money market fund and is marked to market daily, based on the previous day’s market value, such that the value of the collateral exceeds the value of the loaned securities. In the event of significant appreciation in value of the securities on loan on the last business day of the reporting period, the financial statements may reflect a collateral value that is less than the market value of the loaned securities. Such shortfall is remedied as described above. Loans are subject to termination at the option of the borrower or the Fund. Upon termination of the loan, the borrower will return to the Fund securities identical to the loaned securities. The remaining open loans of the securities lending transactions are considered overnight and continuous. Should the borrower of the securities fail financially, the Fund has the right to repurchase the securities in the open market using the collateral.
The Fund recognizes income, net of any rebate and securities lending agent fees, for lending its securities in the form of fees or interest on the investment of any cash received as collateral. The borrower receives all interest and dividends from the securities loaned and such payments are passed back to the lender in amounts equivalent thereto, which are reflected in interest income or unaffiliated dividend income based on the nature of the payment on the Statement of Operations. The Fund also continues to recognize any unrealized gain (loss) in the market price of the securities loaned and on the change in the value of the collateral invested that may occur during the term of the loan. In addition, realized gain (loss) is recognized on changes in the value of the collateral invested upon liquidation of the collateral. Net earnings from securities lending are disclosed in the Statement of Operations.
Equity and Mortgage Real Estate Investment Trusts (collectively REITs): The Fund invested in REITs, which report information on the source of their distributions annually. Based on current and historical information, a portion of distributions received from REITs during the period is estimated to be dividend income, capital gain or return of capital and recorded accordingly. When material, these estimates are adjusted periodically when the actual source of distributions is disclosed by the REITs.
30
Securities Transactions and Net Investment Income: Securities transactions are recorded on the trade date. Realized gains (losses) from investment and currency transactions are calculated on the specific identification method. Dividend income is recorded on the ex-date, or for certain foreign securities, when the Fund becomes aware of such dividends. Expenses are recorded on an accrual basis, which may require the use of certain estimates by management that may differ from actual expense amounts. Net investment income or loss (other than class specific expenses and waivers, which are allocated as noted below) and unrealized and realized gains (losses) are allocated daily to each class of shares based upon the relative proportion of adjusted net assets of each class at the beginning of the day. Class specific expenses and waivers, where applicable, are charged to the respective share classes. Such class specific expenses and waivers include distribution fees and distribution fee waivers, shareholder servicing fees, transfer agent’s fees and expenses, registration fees and fee waivers and/or expense reimbursements, as applicable.
Taxes: It is the Fund’s policy to continue to meet the requirements of the Internal Revenue Code applicable to regulated investment companies and to distribute all of its taxable net investment income and capital gains, if any, to its shareholders. Therefore, no federal income tax provision is required. Withholding taxes on foreign dividends, interest and capital gains, if any, are recorded, net of reclaimable amounts, at the time the related income is earned.
Between 2018 and 2025, tax reform legislation commonly referred to as the Tax Cuts and Jobs Act permits a direct REIT shareholder to claim a 20% “qualified business income” deduction for ordinary REIT dividends. The tax legislation did not expressly permit regulated investment companies (“RICs”) paying dividends attributable to such income to pass through this special treatment to its shareholders. On January 18, 2019, the Internal Revenue Service issued final regulations that permit RICs to pass through “qualified REIT dividends” to their shareholders.
Dividends and Distributions: Dividends and distributions to shareholders, which are determined in accordance with federal income tax regulations and which may differ from GAAP, are recorded on the ex-date. Permanent book/tax differences relating to income and gain (loss) are reclassified between total distributable earnings (loss) and paid-in capital in excess of par, as appropriate. The chart below sets forth the expected frequency of dividend and capital gains distributions to shareholders. Various factors may impact the frequency of dividend distributions to shareholders, including but not limited to adverse market conditions or portfolio holding-specific events.
| | |
| | |
| Expected Distribution Schedule to Shareholders* | | Frequency |
| |
Net Investment Income | | Quarterly |
| |
Short-Term Capital Gains | | Annually |
| |
Long-Term Capital Gains | | Annually |
| * | Under certain circumstances, the Fund may make more than one distribution of short-term and/or long-term capital gains during a fiscal year. |
PGIM Real Estate Income Fund 31
Notes to Financial Statements (continued)
Estimates: The preparation of financial statements requires management to make estimates and assumptions that affect the reported amounts and disclosures in the financial statements. Actual results could differ from those estimates.
The RIC, on behalf of the Fund, has a management agreement with the Manager pursuant to which it has responsibility for all investment advisory services, including supervision of the subadviser’s performance of such services, and for rendering administrative services.
The Manager has entered into a subadvisory agreement with PGIM, Inc., which provides subadvisory services to the Fund through its business unit, PGIM Real Estate, and PGIM Real Estate (UK) Limited, an indirect wholly-owned subsidiary of PGIM, Inc. (collectively referred to herein as the “subadviser”). The Manager pays for the services of the subadviser.
Fees payable under the management agreement are computed daily and paid monthly. For the reporting period ended October 31, 2023, the contractual and effective management fee rates were as follows:
| | |
| | |
| Contractual Management Rate | | Effective Management Fee, before any waivers and/or expense reimbursements |
| |
0.80% on average daily net assets up to and including $1 billion; | | 0.80% |
| |
0.78% on the next $2 billion of average daily net assets; | | |
| |
0.76% on the next $2 billion of average daily net assets; | | |
| |
0.75% on the next $5 billion of average daily net assets; | | |
| |
0.74% on average daily net assets exceeding $10 billion. | | |
The Manager has contractually agreed, through February 28, 2025, to limit total annual operating expenses after fee waivers and/or expense reimbursements. This contractual waiver excludes interest, brokerage, taxes (such as income and foreign withholding taxes, stamp duty and deferred tax expenses), acquired fund fees and expenses, extraordinary expenses, and certain other Fund expenses such as dividend and interest expense and broker charges on short sales.
Where applicable, the Manager agrees to waive management fees or shared operating expenses on any share class to the same extent that it waives such expenses on any other share class. In addition, total annual operating expenses for Class R6 shares will not exceed total annual operating expenses for Class Z shares. Fees and/or expenses waived and/or reimbursed by the Manager for the purpose of preventing the expenses from exceeding a certain expense ratio limit may be recouped by the Manager within the same fiscal year during which such waiver and/or reimbursement is made if such recoupment can be
32
realized without exceeding the expense limit in effect at the time of the recoupment for that fiscal year. The expense limitations attributable to each class are as follows:
| | | | | |
| | |
| Class | | Expense Limitations |
| |
A | | | | 1.35 | % |
| |
C | | | | 2.10 | |
| |
Z | | | | 1.10 | |
| |
R6 | | | | 1.10 | |
The RIC, on behalf of the Fund, has a distribution agreement with Prudential Investment Management Services LLC (“PIMS”), which acts as the distributor of the Class A, Class C, Class Z and Class R6 shares of the Fund. The Fund compensates PIMS for distributing and servicing the Fund’s Class A and Class C shares, pursuant to the plans of distribution (the “Distribution Plans”), regardless of expenses actually incurred by PIMS.
Pursuant to the Distribution Plans, the Fund compensates PIMS for distribution related activities at an annual rate based on average daily net assets per class. PIMS has contractually agreed through February 28, 2025 to limit such fees on certain classes based on the average daily net assets. The distribution fees are accrued daily and payable monthly.
The Fund’s annual gross and net distribution rates, where applicable, are as follows:
| | | | | | | | | | |
| | | |
| Class | | Gross Distribution Fee | | Net Distribution Fee |
| | |
A | | | | 0.30 | % | | | | 0.25 | % |
| | |
C | | | | 1.00 | | | | | 1.00 | |
| | |
Z | | | | N/A | | | | | N/A | |
| | |
R6 | | | | N/A | | | | | N/A | |
For the year ended October 31, 2023, PIMS received front-end sales charges (“FESL”) resulting from sales of certain class shares. Additionally, for the year ended October 31, 2023, PIMS did not receive any contingent deferred sales charges (“CDSC”) imposed upon redemptions by certain shareholders.
| | | | |
| | | |
| Class | | FESL | | CDSC |
| | |
A | | $339 | | $— |
| | |
C | | — | | — |
PGIM Investments, PGIM, Inc., PGIM Real Estate (UK) Limited and PIMS are indirect, wholly-owned subsidiaries of Prudential Financial, Inc. (“Prudential”).
| 4. | Other Transactions with Affiliates |
Prudential Mutual Fund Services LLC (“PMFS”), an affiliate of PGIM Investments and an indirect, wholly-owned subsidiary of Prudential, serves as the Fund’s transfer agent and shareholder servicing agent. Transfer agent’s fees and expenses in the Statement of Operations include certain out-of-pocket expenses paid to non-affiliates, where applicable.
PGIM Real Estate Income Fund 33
Notes to Financial Statements (continued)
The Fund may invest its overnight sweep cash in the PGIM Core Government Money Market Fund (the “Core Government Fund”), a series of the Prudential Government Money Market Fund, Inc., and its securities lending cash collateral in the PGIM Institutional Money Market Fund (the “Money Market Fund”), a series of Prudential Investment Portfolios 2, each registered under the 1940 Act and managed by PGIM Investments. PGIM Investments and/or its affiliates are paid fees or reimbursed for providing their services to the Core Government Fund and the Money Market Fund. In addition to the realized and unrealized gains on investments in the Core Government Fund and the Money Market Fund, earnings from such investments are disclosed on the Statement of Operations as “Affiliated dividend income” and “Income from securities lending, net”, respectively.
The Fund may enter into certain securities purchase or sale transactions under Board approved Rule 17a-7 procedures. Rule 17a-7 is an exemptive rule under the 1940 Act that, subject to certain conditions, permits purchase and sale transactions among affiliated investment companies, or between an investment company and a person that is affiliated solely by reason of having a common (or affiliated) investment adviser, common directors/trustees, and/or common officers. For the year ended October 31, 2023, no Rule 17a-7 transactions were entered into by the Fund.
The aggregate cost of purchases and proceeds from sales of portfolio securities (excluding short-term investments and U.S. Government securities) for the reporting period ended October 31, 2023, were as follows:
| | |
| | |
| Cost of Purchases | | Proceeds from Sales |
| |
$33,038,673 | | $23,641,757 |
A summary of the cost of purchases and proceeds from sales of shares of affiliated mutual funds for the year ended October 31, 2023, is presented as follows:
| | | | | | | | | | | | | | |
| | | | | | | | |
Value,
Beginning
of Year | | Cost of
Purchases | | Proceeds
from Sales | | Change in
Unrealized
Gain
(Loss) | | Realized
Gain
(Loss) | | Value, End of Year | | Shares,
End
of Year | | Income |
|
Short-Term Investments - Affiliated Mutual Funds: |
|
PGIM Core Government Money Market Fund(1)(wb) |
| | | | | | | |
| $ — | | $10,015,208 | | $9,900,540 | | $— | | $— | | $114,668 | | 114,668 | | $10,722 |
34
| | | | | | | | | | | | | | | | |
| | | | | | | | |
Value,
Beginning
of Year | | Cost of
Purchases | | Proceeds
from Sales | | Change in
Unrealized
Gain
(Loss) | | Realized
Gain
(Loss) | | Value, End of Year | | Shares,
End
of Year | | Income | |
|
PGIM Institutional Money Market Fund(1)(b)(wb) | |
| | | | | | | |
| $9,696 | | $ 2,034,214 | | $ 2,043,957 | | $— | | $47 | | $ — | | — | | | $ 840 | (2) |
| | | | | | | |
| $9,696 | | $12,049,422 | | $11,944,497 | | $— | | $47 | | $114,668 | | | | | $11,562 | |
| (1) | The Fund did not have any capital gain distributions during the reporting period. |
| (2) | The amount, or a portion thereof, represents the affiliated securities lending income shown on the Statement of Operations. |
| (b) | Represents security, or portion thereof, purchased with cash collateral received for securities on loan and includes dividend reinvestment. |
| (wb) | Represents an investment in a Fund affiliated with the Manager. |
| 6. | Distributions and Tax Information |
Distributions to shareholders, which are determined in accordance with federal income tax regulations and which may differ from GAAP, are recorded on the ex-date. In order to present total distributable earnings (loss) and paid-in capital in excess of par on the Statement of Assets and Liabilities that more closely represent their tax character, certain adjustments have been made to total distributable earnings (loss) and paid-in capital in excess of par for the Fund. The adjustments were due to redemption in-kind transactions and prior year post-financial statement adjustments.
For the year ended October 31, 2023, the adjustments were as follows:
| | | | | | | | |
| | | | | |
| | | Total Distributable
Earnings (Loss) | | | | Paid-in
Capital in
Excess of Par | | |
| | | $1,148,013 | | | | $(1,148,013) | | |
For the year ended October 31, 2023, the tax character of dividends paid as reflected in the Statement of Changes in Net Assets were as follows:
| | | | | | |
| | | | |
Ordinary
Income | | Long-Term
Capital Gains | | Tax Return
of Capital | | Total Dividends
and Distributions |
| | | |
| $924,117 | | $— | | $174,268 | | $1,098,385 |
For the year ended October 31, 2022, the tax character of dividends paid as reflected in the Statement of Changes in Net Assets were as follows:
| | | | | | |
| | | | |
Ordinary
Income | | Long-Term
Capital Gains | | Tax Return
of Capital | | Total Dividends
and Distributions |
| | | |
| $8,792,051 | | $— | | $466,388 | | $9,258,439 |
PGIM Real Estate Income Fund 35
Notes to Financial Statements (continued)
The United States federal income tax basis of the Fund’s investments and the net unrealized depreciation as of October 31, 2023 were as follows:
| | | | | | |
| | | | |
| Tax Basis | | Gross
Unrealized
Appreciation | | Gross
Unrealized
Depreciation | | Net
Unrealized
Depreciation |
| | | |
| $33,603,068 | | $374,037 | | $(4,481,560) | | $(4,107,523) |
The difference between GAAP and tax basis were primarily due to deferred losses on wash sales.
For federal income tax purposes, the Fund had an approximated capital loss carryforward as of October 31, 2023 which can be carried forward for an unlimited period. No capital gains distributions are expected to be paid to shareholders until net gains have been realized in excess of such losses.
| | | | | | | | |
| | | | | |
| | | Capital Loss
Carryforward | | | | Capital Loss
Carryforward Utilized | | |
| | | $1,903,000 | | | | $— | | |
The Manager has analyzed the Fund’s tax positions taken on federal, state and local income tax returns for all open tax years and has concluded that no provision for income tax is required in the Fund’s financial statements for the current reporting period. Since tax authorities can examine previously filed tax returns, the Fund’s U.S. federal and state tax returns for each of the four fiscal years up to the most recent fiscal year ended October 31, 2023 are subject to such review.
The Fund offers Class A, Class C, Class Z and Class R6 shares. Class A shares are sold with a maximum front-end sales charge of 5.50%. Investors who purchase $1 million or more of Class A shares and sell these shares within 12 months of purchase are subject to a CDSC of 1%, although they are not subject to an initial sales charge. The Class A CDSC is waived for certain retirement and/or benefit plans. A special exchange privilege is also available for shareholders who qualified to purchase Class A shares at net asset value. Class C shares are sold with a CDSC of 1% on sales made within 12 months of purchase. Class C shares will automatically convert to Class A shares on a monthly basis approximately eight years (ten years prior to January 22, 2021) after purchase. Class Z and Class R6 shares are not subject to any sales or redemption charges and are available exclusively for sale to a limited group of investors.
36
Under certain circumstances, an exchange may be made from specified share classes of the Fund to one or more other share classes of the Fund as presented in the table of transactions in shares of beneficial interest, below.
The RIC has authorized an unlimited number of shares of beneficial interest of the Fund at $0.001 par value per share, currently divided into four classes, designated Class A, Class C, Class Z and Class R6.
As of October 31, 2023, Prudential, through its affiliated entities, including affiliated funds (if applicable), owned shares of the Fund as follows:
| | | | | | | | | | |
| | | |
| Class | | Number of Shares | | Percentage of Outstanding Shares |
| | |
Z | | 11,418 | | | | 14.9 | % |
| | |
R6 | | 3,765,376 | | | | 77.7 | |
At the reporting period end, the number of shareholders holding greater than 5% of the Fund are as follows:
| | | | | | | | | | |
| | | |
| | | Number of Shareholders | | Percentage of Outstanding Shares |
| | |
Affiliated | | 1 | | | | 74.7 | % |
| | |
Unaffiliated | | 1 | | | | 22.7 | |
Transactions in shares of beneficial interest were as follows:
| | | | | | | | |
| | | |
| Share Class | | Shares | | | Amount | |
| | |
Class A | | | | | | | | |
| | |
Year ended October 31, 2023: | | | | | | | | |
| | |
Shares sold | | | 14,594 | | | $ | 95,679 | |
| | |
Shares issued in reinvestment of dividends and distributions | | | 4,374 | | | | 27,806 | |
| | |
Shares purchased | | | (47,480 | ) | | | (303,028) | |
| | |
Net increase (decrease) in shares outstanding before conversion | | | (28,512 | ) | | | (179,543) | |
| | |
Shares purchased upon conversion into other share class(es) | | | (1,329 | ) | | | (8,359) | |
| | |
Net increase (decrease) in shares outstanding | | | (29,841 | ) | | $ | (187,902) | |
| | |
Year ended October 31, 2022: | | | | | | | | |
| | |
Shares sold | | | 23,992 | | | $ | 207,103 | |
| | |
Shares issued in reinvestment of dividends and distributions | | | 46,023 | | | | 355,748 | |
| | |
Shares purchased | | | (104,941 | ) | | | (795,676) | |
| | |
Net increase (decrease) in shares outstanding before conversion | | | (34,926 | ) | | | (232,825) | |
| | |
Shares issued upon conversion from other share class(es) | | | 258 | | | | 2,020 | |
| | |
Net increase (decrease) in shares outstanding | | | (34,668 | ) | | $ | (230,805) | |
PGIM Real Estate Income Fund 37
Notes to Financial Statements (continued)
| | | | | | | | |
| | | |
| Share Class | | Shares | | | Amount | |
| | |
Class C | | | | | | | | |
| | |
Year ended October 31, 2023: | | | | | | | | |
| | |
Shares sold | | | 11,910 | | | $ | 80,031 | |
| | |
Shares issued in reinvestment of dividends and distributions | | | 1,142 | | | | 7,287 | |
| | |
Shares purchased | | | (13,408 | ) | | | (85,394) | |
| | |
Net increase (decrease) in shares outstanding | | | (356 | ) | | $ | 1,924 | |
| | |
Year ended October 31, 2022: | | | | | | | | |
| | |
Shares sold | | | 2,956 | | | $ | 24,300 | |
| | |
Shares issued in reinvestment of dividends and distributions | | | 8,622 | | | | 66,506 | |
| | |
Shares purchased | | | (9,484 | ) | | | (68,123) | |
| | |
Net increase (decrease) in shares outstanding before conversion | | | 2,094 | | | | 22,683 | |
| | |
Shares purchased upon conversion into other share class(es) | | | (258 | ) | | | (2,020) | |
| | |
Net increase (decrease) in shares outstanding | | | 1,836 | | | $ | 20,663 | |
| | |
Class Z | | | | | | | | |
| | |
Year ended October 31, 2023: | | | | | | | | |
| | |
Shares sold | | | 52,996 | | | $ | 352,376 | |
| | |
Shares issued in reinvestment of dividends and distributions | | | 4,353 | | | | 27,956 | |
| | |
Shares purchased | | | (1,113,926 | ) | | | (7,255,107) | |
| | |
Net increase (decrease) in shares outstanding before conversion | | | (1,056,577 | ) | | | (6,874,775) | |
| | |
Shares issued upon conversion from other share class(es) | | | 1,323 | | | | 8,359 | |
| | |
Net increase (decrease) in shares outstanding | | | (1,055,254 | ) | | $ | (6,866,416) | |
| | |
Year ended October 31, 2022: | | | | | | | | |
| | |
Shares sold | | | 128,475 | | | $ | 975,580 | |
| | |
Shares issued in reinvestment of dividends and distributions | | | 257,914 | | | | 1,978,932 | |
| | |
Shares purchased | | | (317,510 | ) | | | (3,032,469) | |
| | |
Net increase (decrease) in shares outstanding | | | 68,879 | | | $ | (77,957) | |
| | |
Class R6 | | | | | | | | |
| | |
Year ended October 31, 2023: | | | | | | | | |
| | |
Shares sold | | | 1,918,443 | | | $ | 12,130,223 | |
| | |
Shares issued in reinvestment of dividends and distributions | | | 164,171 | | | | 1,033,874 | |
| | |
Shares purchased | | | (492,582 | ) | | | (3,216,260) | |
| | |
Net increase (decrease) in shares outstanding | | | 1,590,032 | | | $ | 9,947,837 | |
38
| | | | | | | | |
| | | |
| Share Class | | Shares | | | Amount | |
| | |
Year ended October 31, 2022: | | | | | | | | |
| | |
Shares sold | | | 813,769 | | | $ | 5,925,257 | |
| | |
Shares issued in reinvestment of dividends and distributions | | | 890,352 | | | | 6,840,988 | |
| | |
Shares purchased | | | (1,334,054 | ) | | | (10,243,084) | |
| | |
Net increase (decrease) in shares outstanding | | | 370,067 | | | $ | 2,523,161 | |
The RIC, on behalf of the Fund, along with other affiliated registered investment companies (the “Participating Funds”), is a party to a Syndicated Credit Agreement (“SCA”) with a group of banks. The purpose of the SCA is to provide an alternative source of temporary funding for capital share redemptions. The table below provides details of the current SCA in effect at the reporting period-end as well as the prior SCA.
| | | | |
| | | |
| | | Current SCA | | Prior SCA |
| | |
Term of Commitment | | 9/29/2023 - 9/26/2024 | | 9/30/2022 – 9/28/2023 |
| | |
Total Commitment | | $1,200,000,000 | | $1,200,000,000 |
| | |
Annualized Commitment Fee on the Unused Portion of the SCA | | 0.15% | | 0.15% |
| | |
Annualized Interest Rate on Borrowings | | 1.00% plus the higher of (1) the effective federal funds rate, (2) the daily SOFR rate plus 0.10% or (3) zero percent | | 1.00% plus the higher of (1) the effective federal funds rate, (2) the daily SOFR rate plus 0.10% or (3) zero percent |
Certain affiliated registered investment companies that are parties to the SCA include portfolios that are subject to a predetermined mathematical formula used to manage certain benefit guarantees offered under variable annuity contracts. The formula may result in large scale asset flows into and out of these portfolios. Consequently, these portfolios may be more likely to utilize the SCA for purposes of funding redemptions. It may be possible for those portfolios to fully exhaust the committed amount of the SCA, thereby requiring the Manager to allocate available funding per a Board-approved methodology designed to treat the Participating Funds in the SCA equitably.
The Fund utilized the SCA during the year ended October 31, 2023. The average daily balance for the 5 days that the Fund had loans outstanding during the period was approximately $288,800, borrowed at a weighted average interest rate of 5.84%. The maximum loan outstanding amount during the period was $554,000. At October 31, 2023, the Fund did not have an outstanding loan amount.
| 9. | Purchases & Redemption In-kind |
As of the close of business on November 15, 2022, the Fund settled the redemption of fund Class Z shares by delivering to an affiliate portfolio securities and other assets. The value of such securities and other assets that were transferred in-kind was $6,247,174.
PGIM Real Estate Income Fund 39
Notes to Financial Statements (continued)
In-kind redemption gains and losses are excluded in the calculation of taxable gain (loss) for federal income tax purposes.
| 10. | Risks of Investing in the Fund |
The Fund’s risks include, but are not limited to, some or all of the risks discussed below. For further information on the Fund’s risks, please refer to the Fund’s Prospectus and Statement of Additional Information.
Active Trading Risk: The Fund actively and frequently trades its portfolio securities. High portfolio turnover results in higher transaction costs, which can affect the Fund’s performance and have adverse tax consequences. In addition, high portfolio turnover may also mean that a proportionately greater amount of distributions to shareholders will be taxed as ordinary income rather than long-term capital gains compared to investment companies with lower portfolio turnover.
Distribution Risk: The Fund’s distributions may consist of net investment income, if any, and net realized gains, if any, from the sale of investments and/or return of capital. The Fund will provide to shareholders early in each calendar year the final tax character of the Fund’s distributions for the previous year. Also, at such time that the Fund distribution is expected to be from sources other than current or accumulated net income, a notice to shareholders may be required.
Economic and Market Events Risk: Events in the U.S. and global financial markets, including actions taken by the U.S. Federal Reserve or foreign central banks to stimulate or stabilize economic growth or the functioning of the securities markets, or otherwise reduce inflation, may at times result in unusually high market volatility, which could negatively impact performance. Governmental efforts to curb inflation often have negative effects on the level of economic activity. Relatively reduced liquidity in credit and fixed income markets could adversely affect issuers worldwide.
Emerging Markets Risk: The risks of foreign investments are greater for investments in or exposed to emerging markets. Emerging market countries typically have economic and political systems that are less fully developed, and can be expected to be less stable, than those of more developed countries. For example, the economies of such countries can be subject to rapid and unpredictable rates of inflation or deflation. Low trading volumes may result in a lack of liquidity and price volatility. Emerging market countries may have policies that restrict investment by non-U.S. investors, or that prevent non-U.S. investors from withdrawing their money at will.
40
The Fund may invest in some emerging markets that subject it to risks such as those associated with illiquidity, custody of assets, different settlement and clearance procedures and asserting legal title under a developing legal and regulatory regime to a greater degree than in developed markets or even in other emerging markets.
Equity and Equity-Related Securities Risk: Equity and equity-related securities may be subject to changes in value, and their values may be more volatile than those of other asset classes. In addition to an individual security losing value, the value of the equity markets or a sector in which the Fund invests could go down. Different parts of a market can react differently to adverse issuer, market, regulatory, political and economic developments.
Foreign Securities Risk: Investments in securities of non-U.S. issuers (including those denominated in U.S. dollars) may involve more risk than investing in securities of U.S. issuers. Foreign political, economic and legal systems, especially those in developing and emerging market countries, may be less stable and more volatile than in the United States. Foreign legal systems generally have fewer regulatory requirements than the U.S. legal system, particularly those of emerging markets. In general, less information is publicly available with respect to non-U.S. companies than U.S. companies. Non-U.S. companies generally are not subject to the same accounting, auditing, and financial reporting standards as are U.S. companies. Additionally, the changing value of foreign currencies and changes in exchange rates could also affect the value of the assets the Fund holds and the Fund’s performance. Certain foreign countries may impose restrictions on the ability of issuers of foreign securities to make payment of principal and interest or dividends to investors located outside the country, due to blockage of foreign currency exchanges or otherwise. Investments in emerging markets are subject to greater volatility and price declines.
In addition, the Fund’s investments in non-U.S. securities may be subject to the risks of nationalization or expropriation of assets, imposition of currency exchange controls or restrictions on the repatriation of non-U.S. currency, confiscatory taxation and adverse diplomatic developments. Special U.S. tax considerations may apply.
Increase in Expenses Risk: Your actual cost of investing in the Fund may be higher than the expenses shown in the expense table in the Fund’s prospectus for a variety of reasons. For example, expense ratios may be higher than those shown if average net assets decrease. Net assets are more likely to decrease and Fund expense ratios are more likely to increase when markets are volatile. Active and frequent trading of Fund securities can increase expenses.
Large Shareholder and Large Scale Redemption Risk: Certain individuals, accounts, funds (including funds affiliated with the Manager) or institutions, including the Manager and its affiliates, may from time to time own or control a substantial amount of the Fund’s shares. There is no requirement that these entities maintain their investment in the Fund. There is a risk that such large shareholders or that the Fund’s shareholders generally may redeem all or a substantial portion of their investments in the Fund in a short period of time, which could have a significant negative impact on the Fund’s NAV, liquidity, and brokerage costs.
PGIM Real Estate Income Fund 41
Notes to Financial Statements (continued)
Large redemptions could also result in tax consequences to shareholders and impact the Fund’s ability to implement its investment strategy. The Fund’s ability to pursue its investment objective after one or more large scale redemptions may be impaired and, as a result, the Fund may invest a larger portion of its assets in cash or cash equivalents.
Market Capitalization Risk: The Fund may invest in companies of any market capitalization. Generally, the stock prices of small- and mid-cap companies are less stable than the prices of large-cap stocks and may present greater risks. Large capitalization companies as a group could fall out of favor with the market, causing the Fund to underperform compared to investments that focus on smaller capitalized companies.
Market Disruption and Geopolitical Risks: Market disruption can be caused by economic, financial or political events and factors, including but not limited to, international wars or conflicts (including Russia’s military invasion of Ukraine), geopolitical developments (including trading and tariff arrangements, sanctions and cybersecurity attacks), instability in regions such as Asia, Eastern Europe and the Middle East, terrorism, natural disasters and public health epidemics (including the outbreak of COVID-19 globally).
The extent and duration of such events and resulting market disruptions cannot be predicted, but could be substantial and could magnify the impact of other risks to the Fund. These and other similar events could adversely affect the U.S. and foreign financial markets and lead to increased market volatility, reduced liquidity in the securities markets, significant negative impacts on issuers and the markets for certain securities and commodities and/or government intervention. They may also cause short- or long-term economic uncertainties in the United States and worldwide. As a result, whether or not the Fund invests in securities of issuers located in or with significant exposure to the countries directly affected, the value and liquidity of the Fund’s investments may be negatively impacted. Further, due to closures of certain markets and restrictions on trading certain securities, the value of certain securities held by the Fund could be significantly impacted, which could lead to such securities being valued at zero.
Market Risk: Securities markets may be volatile and the market prices of the Fund’s securities may decline. Securities fluctuate in price based on changes in an issuer’s financial condition and overall market and economic conditions. If the market prices of the securities owned by the Fund fall, the value of your investment in the Fund will decline.
Non-Diversified Investment Company Risk: The Fund is non-diversified for purposes of the 1940 Act. This means that the Fund may invest a greater percentage of its assets in the securities of a single company or other issuer than a diversified fund. Investing in a non-diversified fund involves greater risk than investing in a diversified fund because a loss
42
resulting from the decline in value of any one security may represent a greater portion of the total assets of a non-diversified fund.
Real Estate Investment Trust (“REIT”) Risk: Investing in REITs involves certain unique risks in addition to those risks associated with investing in the real estate industry in general. REITs may be affected by changes in the value of the underlying property owned by the REITs, while mortgage REITs may be affected by the quality of any credit extended. REITs are dependent upon management skills, may not be diversified geographically or by property/mortgage asset type, and are subject to heavy cash flow dependency, default by borrowers and self-liquidation. REITs may be more volatile and/or more illiquid than other types of equity securities. REITs (especially mortgage REITs) are subject to interest rate risks. REITs may incur significant amounts of leverage. The Fund will indirectly bear a portion of the expenses, including management fees, paid by each REIT in which it invests, in addition to the expenses of the Fund.
REITs must also meet certain requirements under the Internal Revenue Code of 1986, as amended (the Code) to avoid entity level tax and be eligible to pass-through certain tax attributes of their income to shareholders. REITs are consequently subject to the risk of failing to meet these requirements for favorable tax treatment and of failing to maintain their exemptions from registration under the Investment Company Act of 1940. REITs are subject to the risks of changes in the Code affecting their tax status.
Real Estate Related Securities Risk: Because the Fund invests in real estate securities, including REITs, the Fund is subject to the risks of investing in the real estate industry, such as changes in general and local economic conditions, the supply and demand for real estate and changes in zoning and tax laws. Since the Fund concentrates in the real estate industry, its holdings can vary significantly from broad market indices. As a result, the Fund’s performance can deviate from the performance of such indices. Because the Fund invests in stocks, there is the risk that the price of a particular stock owned by the Fund could go down or pay lower-than-expected or no dividends. In addition to an individual stock losing value, the value of the equity markets or of companies comprising the real estate industry could go down.
An investment in the Fund will be closely linked to the performance of the real estate markets. Real estate securities are subject to the same risks as direct investments in real estate and mortgages, and their value will depend on the value of the underlying properties or the underlying loans or interests. The underlying loans may be subject to the risks of default or of prepayments that occur earlier or later than expected, and such loans may also include so-called “subprime” mortgages. The value of these securities will rise and fall in response to many factors, including economic conditions, the demand for rental property and interest rates. In particular, the value of these securities may decline when interest rates rise and will also be affected by the real estate market and by the management of the underlying properties.
PGIM Real Estate Income Fund 43
Notes to Financial Statements (continued)
Selection Risk: Selection risk is the risk that the securities selected by the subadviser will underperform the market, the relevant indices, or other funds with similar investment objectives and investment strategies. Individual REIT prices may drop because of the failure of borrowers to pay their loans, a dividend reduction, a disruption to the real estate investment sales market, changes in federal or state taxation policies affecting REITs, or poor management of a REIT.
Value Style Risk: Since the Fund follows a value investment style, there is the risk that the value style may be out of favor for long periods of time, that the market will not recognize a security’s intrinsic value for a long time or at all, or that a stock judged to be undervalued may actually be appropriately priced or overvalued. Issuers of value stocks may have experienced adverse business developments or may be subject to special risks that have caused the stock to be out of favor. In addition, the Fund’s value investment style may go out of favor with investors, negatively affecting the Fund’s performance. If the Fund’s assessment of market conditions or a company’s value is inaccurate, the Fund could suffer losses or produce poor performance relative to other funds.
| 11. | Recent Regulatory Developments |
Effective January 24, 2023, the SEC adopted rule and form amendments to require mutual funds and ETFs to transmit concise and visually engaging streamlined annual and semiannual reports to shareholders that highlight key information deemed important for retail investors to assess and monitor their fund investments (the “Rule”). Other information, including financial statements, will no longer appear in the funds’ streamlined shareholder reports but must be available online, delivered free of charge upon request, and filed on a semiannual basis on Form N-CSR. The Rule and form amendments have a compliance date of July 24, 2024. At this time, management is evaluating the Rule and its impact to the Fund.
44
Report of Independent Registered Public Accounting Firm
To the Board of Trustees of Prudential Investment Portfolios 9 and Shareholders of PGIM Real Estate Income Fund
Opinion on the Financial Statements
We have audited the accompanying statement of assets and liabilities, including the schedule of investments, of PGIM Real Estate Income Fund (one of the funds constituting Prudential Investment Portfolios 9, referred to hereafter as the “Fund”) as of October 31, 2023, the related statement of operations for the year ended October 31, 2023, the statements of changes in net assets for each of the two years in the period ended October 31, 2023, including the related notes, and the financial highlights for each of the four years in the period ended October 31, 2023 (collectively referred to as the “financial statements”). In our opinion, the financial statements present fairly, in all material respects, the financial position of the Fund as of October 31, 2023, the results of its operations for the year then ended, the changes in its net assets for each of the two years in the period ended October 31, 2023 and the financial highlights for each of the four years in the period ended October 31, 2023 in conformity with accounting principles generally accepted in the United States of America.
The financial statements of the Fund as of and for the year ended October 31, 2019 and the financial highlights for the period ended October 31, 2019 (not presented herein, other than the financial highlights) were audited by other auditors whose report dated December 16, 2019 expressed an unqualified opinion on those financial statements and financial highlights.
Basis for Opinion
These financial statements are the responsibility of the Fund’s management. Our responsibility is to express an opinion on the Fund’s financial statements based on our audits. We are a public accounting firm registered with the Public Company Accounting Oversight Board (United States) (PCAOB) and are required to be independent with respect to the Fund in accordance with the U.S. federal securities laws and the applicable rules and regulations of the Securities and Exchange Commission and the PCAOB.
We conducted our audits of these financial statements in accordance with the standards of the PCAOB. Those standards require that we plan and perform the audit to obtain reasonable assurance about whether the financial statements are free of material misstatement, whether due to error or fraud.
Our audits included performing procedures to assess the risks of material misstatement of the financial statements, whether due to error or fraud, and performing procedures that respond to those risks. Such procedures included examining, on a test basis, evidence regarding the amounts and disclosures in the financial statements. Our audits also included evaluating the accounting principles used and significant estimates made by management, as well as evaluating the overall presentation of the financial statements. Our procedures included confirmation of securities owned as of October 31, 2023 by correspondence with the custodian, transfer agent and brokers; when replies were not received from brokers, we performed other auditing procedures. We believe that our audits provide a reasonable basis for our opinion.
/s/PricewaterhouseCoopers LLP
New York, New York
December 18, 2023
We have served as the auditor of one or more investment companies in the PGIM Retail Funds complex since 2020.
PGIM Real Estate Income Fund 45
Tax Information (unaudited)
For the year ended October 31, 2023, the Fund reports the maximum amount allowable under Section 854 of the Internal Revenue Code, but not less than, the following percentages of the ordinary income dividends paid as: 1) qualified dividend income (QDI); and 2) eligible for corporate dividends received deduction (DRD):
| | | | | | |
| | | | |
| Fund | | QDI | | | | DRD |
| | | |
PGIM Real Estate Income Fund | | 37.65% | | | | 37.07% |
In January 2024, you will be advised on IRS Form 1099-DIV or substitute 1099-DIV as to the federal tax status of the dividends received by you in calendar year 2023.
46
INFORMATION ABOUT BOARD MEMBERS AND OFFICERS (unaudited)
Information about Board Members and Officers of the Fund is set forth below. Board Members who are not deemed to be “interested persons” of the Fund, as defined in the 1940 Act, are referred to as “Independent Board Members.” Board Members who are deemed to be “interested persons” of the Fund are referred to as “Interested Board Members.” The Board Members are responsible for the overall supervision of the operations of the Fund and perform the various duties imposed on the directors of investment companies by the 1940 Act. The Board in turn elects the Officers, who are responsible for administering the day-to-day operations of the Fund.
| | | | | | |
|
Independent Board Members |
| | | | |
Name Year of Birth Position(s) Portfolios Overseen | | Principal Occupation(s) During Past Five Years | | Other Directorships Held During Past Five Years | | Length of Board Service |
| | | | |
Ellen S. Alberding 1958 Board Member Portfolios Overseen: 100 | | Chief Executive Officer and President, The Joyce Foundation (charitable foundation) (since 2002); formerly Vice Chair, City Colleges of Chicago (community college system) (2011-2015); formerly Trustee, National Park Foundation (charitable foundation for national park system) (2009-2018); formerly Trustee, Economic Club of Chicago (2009-2016); Trustee, Loyola University (since 2018). | | None. | | Since September 2013 |
| | | | |
Kevin J. Bannon 1952 Board Member Portfolios Overseen: 101 | | Retired; formerly Managing Director (April 2008-May 2015) and Chief Investment Officer (October 2008-November 2013) of Highmount Capital LLC (registered investment adviser); formerly Executive Vice President and Chief Investment Officer (April 1993-August 2007) of Bank of New York Company; formerly President (May 2003-May 2007) of BNY Hamilton Family of Mutual Funds. | | Director of Urstadt Biddle Properties (equity real estate investment trust) (September 2008-August 2023). | | Since July 2008 |
PGIM Real Estate Income Fund
| | | | | | |
|
Independent Board Members |
| | | | |
Name Year of Birth Position(s) Portfolios Overseen | | Principal Occupation(s) During Past Five Years | | Other Directorships Held During Past Five Years | | Length of Board Service |
| | | | |
Linda W. Bynoe 1952 Board Member Portfolios Overseen: 98 | | President and Chief Executive Officer (since March 1995) and formerly Chief Operating Officer (December 1989-February 1995) of Telemat Limited LLC (formerly Telemat Ltd) (management consulting); formerly Vice President (January 1985-June 1989) at Morgan Stanley & Co. (broker-dealer). | | Trustee of Equity Residential (residential real estate) (since December 2009); Director of Northern Trust Corporation (financial services) (since April 2006); formerly Director of Anixter International, Inc. (communication products distributor) (January 2006-June 2020). | | Since March 2005 |
| | | | |
Barry H. Evans 1960 Board Member Portfolios Overseen: 101 | | Retired; formerly President (2005-2016), Global Chief Operating Officer (2014-2016), Chief Investment Officer - Global Head of Fixed Income (1998-2014), and various portfolio manager roles (1986-2006), Manulife Asset Management (asset management). | | Formerly Director, Manulife Trust Company (2011-2018); formerly Director, Manulife Asset Management Limited (2015-2017); formerly Chairman of the Board of Directors of Manulife Asset Management U.S. (2005-2016); formerly Chairman of the Board, Declaration Investment Management and Research (2008-2016). | | Since September 2017 |
| | | | |
Keith F. Hartstein 1956 Board Member & Independent Chair Portfolios Overseen: 101 | | Retired; formerly Member (November 2014-September 2022) of the Governing Council of the Independent Directors Council (IDC) (organization of independent mutual fund directors); formerly Executive Committee of the IDC Board of Governors (October 2019-December 2021); formerly President and Chief Executive Officer (2005-2012), Senior Vice President (2004-2005), Senior Vice President of Sales and Marketing (1997-2004), and various executive management positions (1990-1997), John Hancock Funds, LLC (asset management); formerly Chairman, Investment Company Institute’s Sales Force Marketing Committee (2003-2008). | | None. | | Since September 2013 |
Visit our website at pgim.com/investments
| | | | | | |
|
Independent Board Members |
| | | | |
Name Year of Birth Position(s) Portfolios Overseen | | Principal Occupation(s) During Past Five Years | | Other Directorships Held During Past Five Years | | Length of Board Service |
| | | | |
Laurie Simon Hodrick 1962 Board Member Portfolios Overseen: 98 | | A. Barton Hepburn Professor Emerita of Economics in the Faculty of Business, Columbia Business School (since 2018); Visiting Fellow at the Hoover Institution, Stanford University (since 2015); Sole Member, ReidCourt LLC (since 2008) (a consulting firm); formerly Visiting Professor of Law, Stanford Law School (2015-2021); formerly A. Barton Hepburn Professor of Economics in the Faculty of Business, Columbia Business School (1996-2017); formerly Managing Director, Global Head of Alternative Investment Strategies, Deutsche Bank (2006-2008). | | Independent Director, Andela (since January 2022) (global talent network); Independent Director, Roku (since December 2020) (communication services); formerly Independent Director, Synnex Corporation (2019-2021) (information technology); formerly Independent Director, Kabbage, Inc. (2018-2020) (financial services); formerly Independent Director, Corporate Capital Trust (2017-2018) (a business development company). | | Since September 2017 |
| | | | |
Brian K. Reid 1961 Board Member Portfolios Overseen: 101 | | Retired; formerly Chief Economist for the Investment Company Institute (ICI) (2005-2017); formerly Senior Economist and Director of Industry and Financial Analysis at the ICI (1998-2004); formerly Senior Economist, Industry and Financial Analysis at the ICI (1996-1998); formerly Staff Economist at the Federal Reserve Board (1989-1996); formerly Director, ICI Mutual Insurance Company (2012-2017). | | None. | | Since March 2018 |
PGIM Real Estate Income Fund
| | | | | | |
|
Independent Board Members |
| | | | |
Name Year of Birth Position(s) Portfolios Overseen | | Principal Occupation(s) During Past Five Years | | Other Directorships Held During Past Five Years | | Length of Board Service |
| | | | |
Grace C. Torres 1959 Board Member Portfolios Overseen: 101 | | Retired; formerly Treasurer and Principal Financial and Accounting Officer of the PGIM Funds, Target Funds, Advanced Series Trust, Prudential Variable Contract Accounts and The Prudential Series Fund (1998-June 2014); Assistant Treasurer (March 1999-June 2014) and Senior Vice President (September 1999-June 2014) of PGIM Investments LLC; Assistant Treasurer (May 2003-June 2014) and Vice President (June 2005-June 2014) of AST Investment Services, Inc.; Senior Vice President and Assistant Treasurer (May 2003-June 2014) of Prudential Annuities Advisory Services, Inc. | | Director (since January 2018) of OceanFirst Financial Corp. and OceanFirst Bank; formerly Director (July 2015-January 2018) of Sun Bancorp, Inc. N.A. and Sun National Bank. | | Since November 2014 |
Visit our website at pgim.com/investments
| | | | | | |
|
Interested Board Members |
| | | | |
Name Year of Birth Position(s) Portfolios Overseen | | Principal Occupation(s) During Past Five Years | | Other Directorships Held During Past Five Years | | Length of Board Service |
| | | | |
Stuart S. Parker 1962 Board Member & President Portfolios Overseen: 101 | | President, Chief Executive Officer, Chief Operating Officer and Officer in Charge of PGIM Investments LLC (formerly known as Prudential Investments LLC) (since January 2012); President and Principal Executive Officer (“PEO”) (since December 2023) of the PGIM Credit Income Fund; President and PEO (since September 2022) of the PGIM Private Credit Fund; President and PEO (since March 2022) of the PGIM Private Real Estate Fund, Inc.; formerly Executive Vice President of Jennison Associates LLC and Head of Retail Distribution of PGIM Investments LLC (June 2005-December 2011); Investment Company Institute - Board of Governors (since May 2012). | | None. | | Since January 2012 |
| | | | |
Scott E. Benjamin 1973 Board Member & Vice President Portfolios Overseen: 101 | | Executive Vice President (since May 2009) of PGIM Investments LLC; Vice President (since June 2012) of Prudential Investment Management Services LLC; Executive Vice President (since September 2009) of AST Investment Services, Inc.; Senior Vice President of Product Development and Marketing, PGIM Investments (since February 2006); Vice President (since December 2023) of the PGIM Credit Income Fund; Vice President (since September 2022) of the PGIM Private Credit Fund; Vice President (since March 2022) of the PGIM Private Real Estate Fund, Inc.; formerly Vice President of Product Development and Product Management, PGIM Investments LLC (2003-2006). | | None. | | Since March 2010 |
PGIM Real Estate Income Fund
| | | | |
|
Fund Officers(a) |
| | | |
Name Year of Birth Fund Position | | Principal Occupation(s) During Past Five Years | | Length of Service as Fund Officer |
| | | |
Claudia DiGiacomo 1974 Chief Legal Officer | | Chief Legal Officer (since December 2023) of the PGIM Credit Income Fund; Chief Legal Officer (since September 2022) of the PGIM Private Credit Fund; Chief Legal Officer (since July 2022) of the PGIM Private Real Estate Fund, Inc.; Chief Legal Officer, Executive Vice President and Secretary of PGIM Investments LLC (since August 2020); Chief Legal Officer of Prudential Mutual Fund Services LLC (since August 2020); Chief Legal Officer of PIFM Holdco, LLC (since August 2020); Vice President and Corporate Counsel (since January 2005) of Prudential; and Corporate Counsel of AST Investment Services, Inc. (since August 2020); formerly Vice President and Assistant Secretary of PGIM Investments LLC (2005-2020); formerly Associate at Sidley Austin Brown & Wood LLP (1999-2004). | | Since December 2005 |
| | | |
Andrew Donohue 1972 Chief Compliance Officer | | Chief Compliance Officer (since May 2023) of the PGIM Funds, Target Funds, PGIM ETF Trust, PGIM Global High Yield Fund, Inc., PGIM High Yield Bond Fund, Inc., PGIM Short Duration High Yield Opportunities Fund, Advanced Series Trust, The Prudential Series Fund, Prudential’s Gibraltar Fund, Inc., PGIM Private Credit Fund, PGIM Private Real Estate Fund, Inc.; Chief Compliance Officer of AST Investment Services, Inc. (since October 2022); Vice President, Chief Compliance Officer of PGIM Investments LLC (since September 2022); Chief Compliance Officer (since December 2023) of the PGIM Credit Income Fund; formerly various senior compliance roles within Principal Global Investors, LLC., global asset management for Principal Financial (2011-2022), most recently as Global Chief Compliance Officer (2016-2022). | | Since May 2023 |
| | | |
Andrew R. French 1962 Secretary | | Vice President (since December 2018) of PGIM Investments LLC; Secretary (since December 2023) of the PGIM Credit Income Fund; Secretary (since September 2022) of the PGIM Private Credit Fund; Secretary (since March 2022) of the PGIM Private Real Estate Fund, Inc.; formerly Vice President and Corporate Counsel (2010-2018) of Prudential; formerly Director and Corporate Counsel (2006-2010) of Prudential; Vice President and Assistant Secretary (since January 2007) of PGIM Investments LLC; Vice President and Assistant Secretary (since January 2007) of Prudential Mutual Fund Services LLC. | | Since October 2006 |
Visit our website at pgim.com/investments
| | | | |
|
Fund Officers(a) |
| | | |
Name Year of Birth Fund Position | | Principal Occupation(s) During Past Five Years | | Length of Service as Fund Officer |
| | | |
Melissa Gonzalez 1980 Assistant Secretary | | Vice President and Corporate Counsel (since September 2018) of Prudential; Vice President and Assistant Secretary (since August 2020) of PGIM Investments LLC; Assistant Secretary (since December 2023) of the PGIM Credit Income Fund; Assistant Secretary (since September 2022) of the PGIM Private Credit Fund; Assistant Secretary (since March 2022) of the PGIM Private Real Estate Fund, Inc.; formerly Director and Corporate Counsel (March 2014-September 2018) of Prudential. | | Since March 2020 |
| | | |
Patrick E. McGuinness 1986 Assistant Secretary | | Vice President and Assistant Secretary (since August 2020) of PGIM Investments LLC; Director and Corporate Counsel (since February 2017) of Prudential; Assistant Secretary (since December 2023) of the PGIM Credit Income Fund; Assistant Secretary (since September 2022) of the PGIM Private Credit Fund; Assistant Secretary (since March 2022) of the PGIM Private Real Estate Fund, Inc. | | Since June 2020 |
| | | |
Debra Rubano 1975 Assistant Secretary | | Vice President and Corporate Counsel (since November 2020) of Prudential; Assistant Secretary (since December 2023) of the PGIM Credit Income Fund; Assistant Secretary (since September 2022) of the PGIM Private Credit Fund; Assistant Secretary (since March 2022) of the PGIM Private Real Estate Fund, Inc; formerly Director and Senior Counsel of Allianz Global Investors U.S. Holdings LLC (2010-2020) and Assistant Secretary of numerous funds in the Allianz fund complex (2015-2020). | | Since December 2020 |
| | | |
George Hoyt 1965 Assistant Secretary | | Vice President and Corporate Counsel of Prudential (since September 2023); formerly Associate General Counsel of Franklin Templeton and Secretary and Chief Legal Officer of certain funds in the Franklin Templeton complex (2020- 2023) and Managing Director (2016-2020) and Associate General Counsel for Legg Mason, Inc. and its predecessors (2004-2020). | | Since December 2023 |
| | | |
Devan Goolsby 1991 Assistant Secretary | | Vice President and Corporate Counsel of Prudential (since May 2023); formerly Associate at Eversheds Sutherland (US) LLP (2021-2023); Compliance Officer at Bloomberg LP (2019-2021); and an Examiner at the Financial Industry Regulatory Authority (2015-2019). | | Since December 2023 |
| | | |
Kelly A. Coyne 1968 Assistant Secretary | | Director, Investment Operations of Prudential Mutual Fund Services LLC (since 2010); Assistant Secretary (since December 2023) of the PGIM Credit Income Fund; Assistant Secretary (since September 2022) of the PGIM Private Credit Fund; Assistant Secretary (since March 2022) of the PGIM Private Real Estate Fund, Inc. | | Since March 2015 |
PGIM Real Estate Income Fund
| | | | |
|
Fund Officers(a) |
| | | |
Name Year of Birth Fund Position | | Principal Occupation(s) During Past Five Years | | Length of Service as Fund Officer |
| | | |
Christian J. Kelly 1975 Chief Financial Officer | | Vice President, Global Head of Fund Administration of PGIM Investments LLC (since November 2018); Chief Financial Officer (since March 2023) of PGIM Investments mutual funds, closed end funds and ETFs, Advanced Series Trust Portfolios, Prudential Series Funds and Prudential Gibraltar Fund; Chief Financial Officer (since December 2023) of the PGIM Credit Income Fund; Chief Financial Officer of PGIM Private Credit Fund (since September 2022); Chief Financial Officer of PGIM Private Real Estate Fund, Inc. (since July 2022); formerly Treasurer and Principal Financial Officer (January 2019-March 2023) of PGIM Investments mutual funds, closed end funds and ETFs, Advanced Series Trust Portfolios, Prudential Series Funds and Prudential Gibraltar Fund; formerly Treasurer and Principal Financial Officer (March 2022 – July 2022) of the PGIM Private Real Estate Fund, Inc.; formerly Director of Fund Administration of Lord Abbett & Co. LLC (2009-2018), Treasurer and Principal Accounting Officer of the Lord Abbett Family of Funds (2017-2018); Director of Accounting, Avenue Capital Group (2008-2009); Senior Manager, Investment Management Practice of Deloitte & Touche LLP (1998-2007). | | Since January 2019 |
| | | |
Russ Shupak 1973 Treasurer and Principal Accounting Officer | | Vice President (since 2017) within PGIM Investments Fund Administration; Treasurer and Principal Accounting Officer of PGIM Investments mutual funds, closed end funds and ETFs (since March 2023); Treasurer and Principal Accounting Officer (since December 2023) of the PGIM Credit Income Fund; Treasurer and Principal Accounting Officer (since July 2022) of the PGIM Private Real Estate Fund, Inc.; Assistant Treasurer (since September 2022) of the PGIM Private Credit Fund; formerly Assistant Treasurer (March 2022 – July 2022) of the PGIM Private Real Estate Fund, Inc.; Assistant Treasurer of Advanced Series Trust Portfolios, Prudential Series Funds and Prudential Gibraltar Fund (since October 2019); formerly Director (2013-2017) within PGIM Investments Fund Administration. | | Since October 2019 |
| | | |
Lana Lomuti 1967 Assistant Treasurer | | Vice President (since 2007) within PGIM Investments Fund Administration; formerly Assistant Treasurer (December 2007-February 2014) of The Greater China Fund, Inc.; formerly Director (2005-2007) within PGIM Investments Fund Administration. | | Since April 2014 |
| | | |
Deborah Conway 1969 Assistant Treasurer | | Vice President (since 2017) within PGIM Investments Fund Administration; formerly Director (2007-2017) within PGIM Investments Fund Administration. | | Since October 2019 |
Visit our website at pgim.com/investments
| | | | |
|
Fund Officers(a) |
| | | |
Name Year of Birth Fund Position | | Principal Occupation(s) During Past Five Years | | Length of Service as Fund Officer |
| | | |
Elyse M. McLaughlin 1974 Assistant Treasurer | | Vice President (since 2017) within PGIM Investments Fund Administration; Treasurer and Principal Accounting Officer of the Advanced Series Trust, the Prudential Series Fund and the Prudential Gibraltar Fund (since March 2023); Assistant Treasurer (since December 2023) of the PGIM Credit Income Fund; Treasurer and Principal Accounting Officer (since September 2022) of the PGIM Private Credit Fund; Assistant Treasurer (since March 2022) of the PGIM Private Real Estate Fund, Inc.; Assistant Treasurer of PGIM Investments mutual funds, closed end funds and ETFs (since October 2019); formerly Director (2011-2017) within PGIM Investments Fund Administration. | | Since October 2019 |
| | | |
Robert W. McCormack 1973 Assistant Treasurer | | Vice President (since 2019) within PGIM Investments Fund Administration; Assistant Treasurer (since March 2023) of PGIM Investments mutual funds, closed end funds, ETFs, Advanced Series Trust Portfolios, Prudential Series Funds and Prudential Gibraltar Fund; Assistant Treasurer (since December 2023) of the PGIM Credit Income Fund; Assistant Treasurer (since September 2022) of the PGIM Private Credit Fund; Assistant Treasurer (since March 2022) of the PGIM Private Real Estate Fund, Inc.; formerly Director (2016-2019) within PGIM Investments Fund Administration; formerly Vice President within Goldman, Sachs & Co. Investment Management Controllers (2008-2016), Assistant Treasurer of Goldman Sachs Family of Funds (2015-2016). | | Since March 2023 |
| | | |
Kelly Florio 1978 Anti-Money Laundering Compliance Officer | | Vice President, Corporate Compliance, Global Compliance Programs and Compliance Risk Management (since December 2021) of Prudential; formerly Head of Fraud Risk Management (October 2019-December 2021) at New York Life Insurance Company; formerly Head of Key Risk Area Operations (November 2018-October 2019), Director of the US Anti-Money Laundering Compliance Unit (2009-2018) and Bank Loss Prevention Associate (2006-2009) at MetLife. | | Since June 2022 |
(a) Excludes Mr. Parker and Mr. Benjamin, interested Board Members who also serve as President and Vice President, respectively.
Explanatory Notes to Tables:
| ∎ | Board Members are deemed to be “Interested,” as defined in the 1940 Act, by reason of their affiliation with PGIM Investments LLC and/or an affiliate of PGIM Investments LLC. |
| ∎ | Unless otherwise noted, the address of all Board Members and Officers is c/o PGIM Investments LLC, 655 Broad Street, Newark, New Jersey 07102-4410. |
| ∎ | There is no set term of office for Board Members or Officers. The Board Members have adopted a retirement policy, which calls for the retirement of Board Members on December 31 of the year in which they reach the age of 75. |
| ∎ | ‘Other Directorships Held” includes all directorships of companies required to register or file reports with the SEC under the 1934 Act (that is, “public companies”) or other investment companies registered under the 1940 Act. |
PGIM Real Estate Income Fund
| ∎ | “Portfolios Overseen” includes such applicable investment companies managed by PGIM Investments LLC and overseen by the Board Member. The investment companies for which PGIM Investments LLC serves as manager include the PGIM Mutual Funds, Target Funds, PGIM ETF Trust, PGIM Private Real Estate Fund, Inc., PGIM Private Credit Fund, PGIM Credit Income Fund, PGIM High Yield Bond Fund, Inc., PGIM Global High Yield Fund, Inc., PGIM Short Duration High Yield Opportunities Fund, The Prudential Series Fund, Prudential’s Gibraltar Fund, Inc. and the Advanced Series Trust. |
| ∎ | As used in the Fund Officers table “Prudential” means The Prudential Insurance Company of America. |
Visit our website at pgim.com/investments
Approval of Advisory Agreements (unaudited)
The Fund’s Board of Trustees
The Board of Trustees (the “Board”) of PGIM Real Estate Income Fund (the “Fund”)1 consists of ten individuals, eight of whom are not “interested persons” of the Fund, as defined in the Investment Company Act of 1940, as amended (the “1940 Act”) (the “Independent Trustees”). The Board is responsible for the oversight of the Fund and its operations, and performs the various duties imposed on the directors of investment companies by the 1940 Act. The Independent Trustees have retained independent legal counsel to assist them in connection with their duties. The Chair of the Board is an Independent Trustee. The Board has established five standing committees: the Audit Committee, the Nominating and Governance Committee, the Compliance Committee and two Investment Committees. Each committee is chaired by, and composed of, Independent Trustees.
Annual Approval of the Fund’s Advisory Agreements
As required under the 1940 Act, the Board determines annually whether to renew the Fund’s management agreement with PGIM Investments LLC (“PGIM Investments”) and the Fund’s subadvisory agreement with PGIM Real Estate (UK) Limited (“PGIM RE (UK)”) and PGIM, Inc. (“PGIM”) on behalf of its PGIM Real Estate unit (“PGIM Real Estate”). In considering the renewal of the agreements, the Board, including all of the Independent Trustees, met on May 25 and June 6-8, 2023 (the “Board Meeting”) and approved the renewal of the agreements through July 31, 2024, after concluding that the renewal of the agreements was in the best interests of the Fund and its shareholders.
In advance of the meetings, the Board requested and received materials relating to the agreements, and had the opportunity to ask questions and request further information in connection with its consideration. Among other things, the Board considered comparative fee information from PGIM Investments, PGIM RE (UK) and PGIM. Also, the Board considered comparisons with other mutual funds in relevant Peer Universes and Peer Groups, as is further discussed below.
In approving the agreements, the Board, including the Independent Trustees advised by independent legal counsel, considered the factors it deemed relevant, including the nature, quality and extent of services provided by PGIM Investments and the subadvisers, the performance of the Fund, the profitability of PGIM Investments and its affiliates, expenses and fees, and the potential for economies of scale that may be shared with the Fund and its shareholders as the Fund’s assets grow. In their deliberations, the Trustees did not identify any single factor which alone was responsible for the Board’s decision to approve the agreements with respect to the Fund. In connection with its deliberations, the Board considered information provided by PGIM Investments throughout the year at regular Board meetings, presentations from portfolio managers and other information, as well as information furnished at or in advance of the Board Meeting.
1PGIM Real Estate Income Fund is a series of Prudential Investment Portfolios 9.
PGIM Real Estate Income Fund
Approval of Advisory Agreements (continued)
The Trustees determined that the overall arrangements between the Fund and PGIM Investments, which serves as the Fund’s investment manager pursuant to a management agreement, and between PGIM Investments and each of PGIM RE (UK) and PGIM, which serve as the Fund’s subadvisers pursuant to the terms of a subadvisory agreement with PGIM Investments, are in the best interests of the Fund and its shareholders in light of the services performed, fees charged and such other matters as the Trustees considered relevant in the exercise of their business judgment.
The material factors and conclusions that formed the basis for the Trustees’ reaching their determinations to approve the continuance of the agreements are separately discussed below.
Nature, Quality and Extent of Services
The Board received and considered information regarding the nature, quality and extent of services provided to the Fund by PGIM Investments, PGIM RE (UK) and PGIM Real Estate. The Board noted that PGIM Real Estate and PGIM RE (UK) are affiliated with PGIM Investments. The Board considered the services provided by PGIM Investments, including but not limited to the oversight of the subadvisers for the Fund, as well as the provision of fund recordkeeping, compliance and other services to the Fund and PGIM Investments’ role as the administrator for the Fund’s liquidity risk management program. With respect to PGIM Investments’ oversight of the subadvisers, the Board noted that PGIM Investments’ Strategic Investment Research Group (“SIRG”), which is a business unit of PGIM Investments, is responsible for monitoring and reporting to PGIM Investments’ senior management on the performance and operations of the subadvisers. The Board also considered that PGIM Investments pays the salaries of all of the officers and interested Trustees of the Fund who are part of Fund management. The Board also considered the investment subadvisory services provided by PGIM Real Estate and PGIM RE (UK), including investment research and security selection, as well as adherence to the Fund’s investment restrictions and compliance with applicable Fund policies and procedures. The Board considered PGIM Investments’ evaluation of the subadvisers, as well as PGIM Investments’ recommendation, based on its review of the subadvisers, to renew the subadvisory agreement.
The Board considered the qualifications, backgrounds and responsibilities of PGIM Investments’ senior management responsible for the oversight of the Fund, PGIM RE (UK) and PGIM Real Estate, and also considered the qualifications, backgrounds and responsibilities of the PGIM RE (UK) and PGIM Real Estate portfolio managers who are responsible for the day-to-day management of the Fund’s portfolio. The Board was provided with information pertaining to PGIM Investments’, PGIM Real Estate’s, PGIM RE (UK)’s and PGIM’s organizational structure, senior management, investment operations, and other relevant information pertaining to PGIM Investments, PGIM Real Estate, PGIM RE (UK) and PGIM. The Board also noted that it received favorable compliance reports from the Fund’s Chief Compliance Officer (“CCO”) as to PGIM Investments, PGIM Real Estate, PGIM RE (UK) and PGIM.
Visit our website at pgim.com/investments
The Board concluded that it was satisfied with the nature, extent and quality of the investment management services provided by PGIM Investments and the subadvisory services provided to the Fund by PGIM Real Estate and PGIM RE (UK), and that there was a reasonable basis on which to conclude that the Fund benefits from the services provided by PGIM Investments, PGIM RE (UK) and PGIM Real Estate under the management and subadvisory agreements.
Costs of Services and Profits Realized by PGIM Investments
The Board was provided with information on the profitability of PGIM Investments and its affiliates in serving as the Fund’s investment manager. The Board discussed with PGIM Investments the methodology utilized in assembling the information regarding profitability and considered its reasonableness. The Board recognized that it is difficult to make comparisons of profitability from fund management contracts because comparative information is not generally publicly available and is affected by numerous factors, including the structure of the particular adviser, the types of funds it manages, its business mix, numerous assumptions regarding allocations and the adviser’s capital structure and cost of capital. However, the Board considered that the cost of services provided by PGIM Investments to the Fund during the year ended December 31, 2022 exceeded the management fees paid by the Fund, resulting in an operating loss to PGIM Investments. Taking these factors into account, the Board concluded that the profitability of PGIM Investments and its affiliates in relation to the services rendered was not unreasonable.
Economies of Scale
The Board received and discussed information concerning economies of scale that PGIM Investments may realize as the Fund’s assets grow beyond current levels. The Board noted that the management fee schedule for the Fund includes breakpoints, which have the effect of decreasing the fee rate as assets increase. During the course of time, the Board has considered information regarding the launch date of the Fund, the management fees of the Fund compared to those of similarly managed funds and PGIM Investments’ investment in the Fund over time. The Board noted that economies of scale can be shared with the Fund in other ways, including low management fees from inception, additional technological and personnel investments to enhance shareholder services, and maintaining existing expense structures in the face of a rising cost environment. The Board also considered PGIM Investments’ assertion that it continually evaluates the management fee schedule of the Fund and the potential to share economies of scale through breakpoints or fee waivers as asset levels increase.
The Board recognized the inherent limitations of any analysis of economies of scale, stemming largely from the Board’s understanding that most of PGIM Investments’ costs are not specific to individual funds, but rather are incurred across a variety of products and services.
PGIM Real Estate Income Fund
Approval of Advisory Agreements (continued)
Other Benefits to PGIM Investments, PGIM RE (UK) and PGIM Real Estate
The Board considered potential ancillary benefits that might be received by PGIM Investments, PGIM Real Estate, PGIM RE (UK) and their affiliates as a result of their relationship with the Fund. The Board concluded that potential benefits to be derived by PGIM Investments included transfer agency fees received by the Fund’s transfer agent (which is affiliated with PGIM Investments), and benefits to its reputation as well as other intangible benefits resulting from PGIM Investments’ association with the Fund. The Board concluded that the potential benefits to be derived by PGIM Real Estate and PGIM RE (UK) included the ability to use soft dollar credits, as well as the potential benefits consistent with those generally resulting from an increase in assets under management, specifically, potential access to additional research resources and benefits to its reputation. The Board concluded that the benefits derived by PGIM Investments, PGIM Real Estate and PGIM RE (UK) were consistent with the types of benefits generally derived by investment managers and subadvisers to mutual funds.
Performance of the Fund / Fees and Expenses
The Board considered certain additional factors and made related conclusions relating to the historical performance of the Fund for the one-, three- and five-year periods ended December 31, 2022. The Board considered that the Fund commenced operations on June 3, 2015 and that longer-term performance was not yet available.
The Board also considered the Fund’s actual management fee, as well as the Fund’s net total expense ratio, for the fiscal year ended October 31, 2022. The Board considered the management fee for the Fund as compared to the management fee charged by PGIM Investments to other funds and the fee charged by other advisers to comparable mutual funds in a Peer Group. The actual management fee represents the fee rate actually paid by Fund shareholders and includes any fee waivers or reimbursements. The net total expense ratio for the Fund represents the actual expense ratio incurred by Fund shareholders.
The mutual funds included in the Peer Universe, which was used to consider performance, and the Peer Group, which was used to consider expenses and fees, were objectively determined by Broadridge, an independent provider of mutual fund data. In certain circumstances, PGIM Investments also provided supplemental Peer Universe or Peer Group information for reasons addressed with the Board. The comparisons placed the Fund in various quartiles over various periods, with the first quartile being the best 25% of the mutual funds (for performance, the best performing mutual funds and, for expenses, the lowest cost mutual funds).
The section below summarizes key factors considered by the Board and the Board’s conclusions regarding the Fund’s performance, fees and overall expenses. The table sets forth net performance comparisons (which reflect the impact on performance of fund expenses, or any subsidies, expense caps or waivers that may be applicable) with the Peer Universe, actual management fees with the Peer Group (which reflect the
Visit our website at pgim.com/investments
impact of any subsidies or fee waivers), and net total expenses with the Peer Group, each of which were key factors considered by the Board.
| | | | | | | | |
| | | | | |
| Net Performance | | 1 Year | | 3 Years | | 5 Years | | 10 Years |
| | | | | |
| | | 1st Quartile | | 2nd Quartile | | 1st Quartile | | N/A |
| |
| Actual Management Fees: 2nd Quartile |
| |
| Net Total Expenses: 4th Quartile |
| ● | The Board noted that the Fund outperformed its benchmark index over all periods. |
| ● | The Board and PGIM Investments agreed to retain the Fund’s existing contractual expense cap, which (exclusive of certain fees and expenses) caps the Fund’s annual operating expenses at 1.35% for Class A shares, 2.10% for Class C shares, 1.10% for Class R6 shares, and 1.10% for Class Z shares through February 29, 2024. |
| ● | In addition, PGIM Investments will waive management fees or shared operating expenses on any share class to the same extent that it waives such expenses on any other share class and has agreed that total annual fund operating expenses for Class R6 shares will not exceed total annual fund operating expenses for Class Z shares. |
| ● | The Board concluded that, in light of the above, it would be in the best interests of the Fund and its shareholders to renew the agreements. |
| ● | The Board concluded that the management fees (including subadvisory fees) and total expenses were reasonable in light of the services provided. |
* * *
After full consideration of these factors, the Board concluded that the approval of the agreements was in the best interests of the Fund and its shareholders.
PGIM Real Estate Income Fund
| | | | |
| ∎ MAIL | | ∎ TELEPHONE | | ∎ WEBSITE |
655 Broad Street Newark, NJ 07102 | | (800) 225-1852 | | pgim.com/investments |
PROXY VOTING
The Board of Trustees of the Fund has delegated to the Fund’s subadvisers the responsibility for voting any proxies and maintaining proxy recordkeeping with respect to the Fund. A description of these proxy voting policies and procedures is available without charge, upon request, by calling (800) 225-1852 or by visiting the Securities and Exchange Commission’s website at sec.gov. Information regarding how the Fund voted proxies relating to portfolio securities during the most recent 12-month period ended June 30 is available on the Fund’s website and on the Securities and Exchange Commission’s website.
TRUSTEES
Ellen S. Alberding · Kevin J. Bannon · Scott E. Benjamin · Linda W. Bynoe · Barry H. Evans · Keith F. Hartstein · Laurie Simon Hodrick · Stuart S. Parker · Brian K. Reid · Grace C. Torres
OFFICERS
Stuart S. Parker, President · Scott E. Benjamin, Vice President · Christian J. Kelly, Chief Financial Officer · Claudia DiGiacomo, Chief Legal Officer · Andrew Donohue, Chief Compliance Officer · Russ Shupak, Treasurer and Principal Accounting Officer · Kelly Florio, Anti-Money Laundering Compliance Officer · Andrew R. French, Secretary · Melissa Gonzalez, Assistant Secretary · Kelly A. Coyne, Assistant Secretary · Patrick E. McGuinness, Assistant Secretary · Debra Rubano, Assistant Secretary · George Hoyt, Assistant Secretary · Devan Goolsby, Assistant Secretary · Lana Lomuti, Assistant Treasurer · Elyse M. McLaughlin, Assistant Treasurer · Deborah Conway, Assistant Treasurer · Robert W. McCormack, Assistant Treasurer
| | | | |
| MANAGER | | PGIM Investments LLC | | 655 Broad Street Newark, NJ 07102 |
| | |
| SUBADVISERS | | PGIM Real Estate | | 655 Broad Street 14th Floor Newark, NJ 07102 |
| | |
| | | PGIM Real Estate (UK) Limited | | Grand Buildings, 1-3 Strand Trafalgar Square London, WC2N 5HR United Kingdom |
| | |
| DISTRIBUTOR | | Prudential Investment Management Services LLC | | 655 Broad Street Newark, NJ 07102 |
| | |
| CUSTODIAN | | The Bank of New York Mellon | | 240 Greenwich Street New York, NY 10286 |
| | |
| TRANSFER AGENT | | Prudential Mutual Fund Services LLC | | PO Box 534432 Pittsburgh, PA 15253 |
| | |
| INDEPENDENT REGISTERED PUBLIC ACCOUNTING FIRM | | PricewaterhouseCoopers LLP | | 300 Madison Avenue New York, NY 10017 |
| | |
| FUND COUNSEL | | Willkie Farr & Gallagher LLP | | 787 Seventh Avenue New York, NY 10019 |
An investor should consider the investment objectives, risks, charges, and expenses of the Fund carefully before investing. The prospectus and summary prospectus contain this and other information about the Fund. An investor may obtain the prospectus and summary prospectus by visiting our website at pgim.com/investments or by calling (800) 225-1852. The prospectus and summary prospectus should be read carefully before investing.
E-DELIVERY
To receive your mutual fund documents online, go to pgim.com/investments/resource/edelivery and enroll. Instead of receiving printed documents by mail, you will receive notification via email when new materials are available. You can cancel your enrollment or change your email address at any time by visiting the website address above.
SHAREHOLDER COMMUNICATIONS WITH TRUSTEES
Shareholders can communicate directly with the Board of Trustees by writing to the Chair of the Board, PGIM Real Estate Income Fund, PGIM Investments, Attn: Board of Trustees, 655 Broad Street, Newark, NJ 07102. Shareholders can communicate directly with an individual Trustee by writing to that Trustee at the same address. Communications are not screened before being delivered to the addressee.
AVAILABILITY OF PORTFOLIO HOLDINGS
The Fund files its complete schedule of portfolio holdings with the Securities and Exchange Commission for the first and third quarters of each fiscal year as an exhibit to its reports on Form N-PORT.The Fund’s Form N-PORT filings are available on the Commission’s website at sec.gov.
The Fund’s Statement of Additional Information contains additional information about the Fund’s Trustees and is available without charge, upon request, by calling (800) 225-1852.
| | | | |
| Mutual Funds: | | | | |
ARE NOT INSURED BY THE FDIC OR ANY | | MAY LOSE VALUE | | ARE NOT A DEPOSIT OF OR GUARANTEED |
FEDERAL GOVERNMENT AGENCY | | BY ANY BANK OR ANY BANK AFFILIATE |
PGIM REAL ESTATE INCOME FUND
| | | | | | | | | | |
| | | | | |
SHARE CLASS | | | | A | | C | | Z | | R6 |
| | | | | |
NASDAQ | | | | PRKAX | | PRKCX | | PRKZX | | PRKQX |
| | | | | |
CUSIP | | | | 74441J761 | | 74441J753 | | 74441J746 | | 74441J670 |
MF228E

PGIM SELECT REAL ESTATE FUND
ANNUAL REPORT
OCTOBER 31, 2023

To enroll in e-delivery, go to pgim.com/investments/resource/edelivery
Table of Contents
This report is not authorized for distribution to prospective investors unless preceded or accompanied by a current prospectus.
The views expressed in this report and information about the Fund’s portfolio holdings are for the period covered by this report and are subject to change thereafter.
Mutual funds are distributed by Prudential Investment Management Services LLC (PIMS), member SIPC. PGIM Real Estate is a unit of PGIM, Inc. (PGIM), a registered investment adviser. PIMS and PGIM are Prudential Financial companies. ©2023 Prudential Financial, Inc. and its related entities. PGIM Real Estate, PGIM, and the PGIM logo are service marks of Prudential Financial, Inc. and its related entities, registered in many jurisdictions worldwide.
2 Visit our website at pgim.com/investments
Letter from the President
| | |
 | | Dear Shareholder: We hope you find the annual report for the PGIM Select Real Estate Fund informative and useful. The report covers performance for the 12-month period that ended October 31, 2023. Although central banks raised interest rates aggressively to tame surging inflation during the period, the global economy and financial markets demonstrated resilience. Employers continued hiring, consumers continued spending, home prices rose, and recession fears receded. |
Early in the period, stocks began a rally that eventually ended a bear market and continued to rise globally for much of 2023 as inflation cooled and the Federal Reserve (the Fed) slowed the pace of its rate hikes. However, stocks declined late in the period when the Fed signaled that rates may remain elevated longer than investors had expected. For the entire period, large-cap US stocks and equities in international markets posted gains, while small-cap US stocks declined.
Bond markets benefited during the period as the Fed moderated its rate-hiking cycle, and the higher level of interest rates offered investors an additional cushion from fixed income volatility. US and global investment-grade bonds, along with US high yield corporate bonds and emerging market debt, all posted gains.
Regarding your investments with PGIM, we believe it is important to maintain a diversified portfolio of funds consistent with your tolerance for risk, time horizon, and financial goals. Your financial advisor can help you create a diversified investment plan that may include funds covering all the basic asset classes and that reflects your personal investor profile and risk tolerance. However, diversification and asset allocation strategies do not assure a profit or protect against loss in declining markets.
At PGIM Investments, we provide access to active investment strategies across the global markets in the pursuit of consistent outperformance for investors. PGIM is the world’s 14th-largest investment manager with more than $1.3 trillion in assets under management. Our scale and investment expertise allow us to deliver a diversified suite of actively managed solutions across a broad spectrum of asset classes and investment styles.
Thank you for choosing our family of funds.
Sincerely,

Stuart S. Parker, President
PGIM Select Real Estate Fund
December 15, 2023
PGIM Select Real Estate Fund 3
Your Fund’s Performance (unaudited)
Performance data quoted represent past performance. Past performance does not guarantee future results. The investment return and principal value of an investment will fluctuate so that an investor’s shares, when redeemed, may be worth more or less than their original cost. Current performance may be lower or higher than the past performance data quoted. An investor may obtain performance data as of the most recent month-end by visiting our website at pgim.com/investments or by calling (800) 225-1852.
| | | | | | |
| |
| | | Average Annual Total Returns as of 10/31/23 |
| | | |
| | | One Year (%) | | Five Years (%) | | Since Inception (%) |
| | | |
Class A | | | | | | |
| | | |
(with sales charges) | | -6.09 | | 2.96 | | 3.45 (8/1/2014) |
| | | |
(without sales charges) | | -0.62 | | 4.13 | | 4.08 (8/1/2014) |
| | | |
Class C | | | | | | |
| | | |
(with sales charges) | | -2.28 | | 3.37 | | 3.30 (8/1/2014) |
| | | |
(without sales charges) | | -1.30 | | 3.37 | | 3.30 (8/1/2014) |
| | | |
Class Z | | | | | | |
| | | |
(without sales charges) | | -0.37 | | 4.42 | | 4.35 (8/1/2014) |
| | | |
Class R6 | | | | | | |
| | | |
(without sales charges) | | -0.27 | | 4.48 | | 4.37 (8/1/2014) |
| | | |
FTSE EPRA/NAREIT Developed Index | | | | | | |
| | | |
| | -6.03 | | -1.46 | | 0.50 |
| | | |
S&P 500 Index | | | | | | |
| | | |
| | | 10.14 | | 11.01 | | 10.81 |
Since Inception returns are provided since the Fund has less than 10 fiscal years of returns. Since Inception returns for the Indexes are measured from the closest month-end to the Fund’s inception date.
4 Visit our website at pgim.com/investments
Growth of a $10,000 Investment (unaudited)
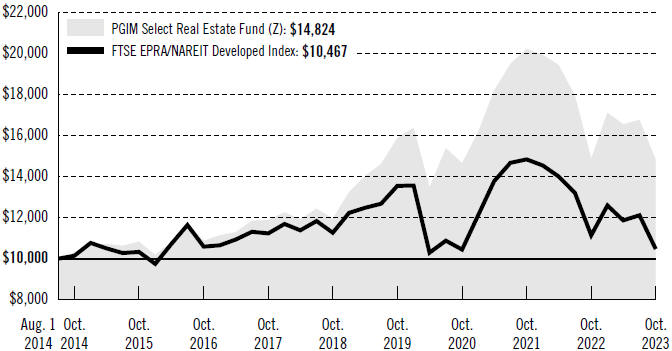
The graph compares a $10,000 investment in the Fund’s Class Z shares with a similar investment in the FTSE EPRA/NAREIT Developed Index, by portraying the initial account values at the commencement of operations for Class Z shares (August 1, 2014) and the account values at the end of the current fiscal year (October 31, 2023) as measured on a quarterly basis. For purposes of the graph, and unless otherwise indicated, it has been assumed that (a) all recurring fees (including management fees) were deducted and (b) all dividends and distributions were reinvested. The line graph provides information for Class Z shares only. As indicated in the tables provided earlier, performance for other share classes will vary due to the differing fees and expenses applicable to each share class (as indicated in the following paragraphs). Without waiver of fees and/or expense reimbursements, if any, the returns would have been lower.
Past performance does not predict future performance. Total returns and the ending account values in the graphs include changes in share price and reinvestment of dividends and capital gains distributions in a hypothetical investment for the periods shown. The Fund’s total returns do not reflect the deduction of income taxes on an individual’s investment. Taxes may reduce your actual investment returns on income or gains paid by the Fund or any gains you may realize if you sell your shares.
PGIM Select Real Estate Fund 5
Your Fund’s Performance (continued)
The returns in the tables do not reflect the deduction of taxes that a shareholder would pay on Fund distributions or following the redemption of Fund shares. The average annual total returns take into account applicable sales charges, which are described for each share class in the table below.
| | | | | | | | |
| | | | | |
| | | Class A | | Class C | | Class Z | | Class R6 |
| | | | | |
| Maximum initial sales charge | | 5.50% of the public offering price | | None | | None | | None |
| | | | | |
Contingent deferred sales charge (CDSC) (as a percentage of the lower of the original purchase price or the net asset value at redemption) | | 1.00% on sales of $1 million or more made within 12 months of purchase | | 1.00% on sales made within 12 months of purchase | | None | | None |
| | | | | |
Annual distribution and service (12b-1) fees (shown as a percentage of average daily net assets) | | 0.30% (0.25% currently) | | 1.00% | | None | | None |
Benchmark Definitions
FTSE EPRA/NAREIT Developed Index—The Financial Times Stock Exchange European Public Real Estate Association/National Association of Real Estate Investment Trusts (FTSE EPRA/NAREIT) Developed Index reflects the stock performance of companies engaged in specific aspects of the major real estate markets/regions of the world.
S&P 500 Index*—The S&P 500 Index is an unmanaged index of over 500 stocks of large US public companies. It gives a broad look at how large company stocks in the United States have performed.
*The S&P 500 Index is a product of S&P Dow Jones Indices LLC and/or its affiliates and has been licensed for use by PGIM, Inc. and/or its affiliates. Copyright © 2023 S&P Dow Jones Indices LLC, a division of S&P Global, Inc., and/or its affiliates. All rights reserved. Redistribution or reproduction in whole or in part are prohibited without written permission of S&P Dow Jones Indices LLC. For more information on any of S&P Dow Jones Indices LLC’s indices please visit www.spdji.com. S&P® is a registered trademark of S&P Global and Dow Jones® is a registered trademark of Dow Jones Trademark Holdings LLC.
Investors cannot invest directly in an index. The returns for the Indexes would be lower if they included the effects of sales charges, operating expenses of a mutual fund, or taxes that may be paid by an investor.
6 Visit our website at pgim.com/investments
Presentation of Fund Holdings as of 10/31/23
| | | | |
| | |
| Ten Largest Holdings | | Real Estate Sectors | | % of Net Assets |
| | |
Welltower, Inc. | | Health Care REITs | | 8.0% |
| | |
Digital Realty Trust, Inc. | | Specialized REITs | | 7.3% |
| | |
Prologis, Inc. | | Industrial REITs | | 6.9% |
| | |
Equinix, Inc. | | Specialized REITs | | 5.0% |
| | |
Simon Property Group, Inc. | | Retail REITs | | 4.1% |
| | |
Ventas, Inc. | | Health Care REITs | | 4.0% |
| | |
Mitsui Fudosan Co. Ltd. (Japan) | | Diversified Real Estate Activities | | 3.4% |
| | |
Americold Realty Trust, Inc. | | Industrial REITs | | 2.8% |
| | |
Veris Residential, Inc. | | Residential REITs | | 2.7% |
| | |
Equity Residential | | Residential REITs | | 2.6% |
Holdings reflect only long-term investments and are subject to change.
PGIM Select Real Estate Fund 7
Strategy and Performance Overview* (unaudited)
How did the Fund perform?
The PGIM Select Real Estate Fund’s Class Z shares returned –0.37% in the 12-month reporting period that ended October 31, 2023, outperforming the –6.03% return of the FTSE EPRA/NAREIT Developed Index (the Index).
What were conditions like in the global real estate securities market?
| · | | During the reporting period, the real estate investment trust (REIT) market faced a perfect storm of rising inflation and sustained rate hikes, ushered in by pandemic-related global monetary easing and stimulus. Equity and bond market volatility became the norm, as markets alternated between greater or lesser rate-hike expectations in response to strong or weak inflation data. |
| · | | In the US, the Federal Reserve (Fed) raised rates sharply enough to reduce the risk of a severe inflation spike. Inflation declined from over 7% to just over 3%, despite a persistently strong consumer, an unemployment rate staying below 4% (3.9% currently), and roughly 200,000 new jobs being added each month. A dramatic rise in rates undermined REIT sentiment, with the federal funds rate reaching 5.25%– 5.50% and the yield on the 10-year US Treasury note jumping 80 basis points (bps) during the third quarter of 2023, from 4.05% to 4.88%. (One basis point equals 0.01%.) |
| · | | Inflation figures declined in Europe throughout the period. However, as of the end of the period, the level of inflation still remained high relative to other global regions. This was especially true in the UK and Sweden, despite gradually declining figures for both headline and core inflation. Inflation levels in the UK remained materially higher than in continental Europe and much higher than in the US. Government bond yields at both the short and long end of the curve climbed throughout the region and remained elevated. In spite of this, the Bank of England held rates unchanged in its September 2023 decision, while the European Central Bank tightened but indicated an intention to pause. Companies with weak balance sheets remained near-record discounts to net and gross asset values, as they were still exposed to refinancing risk and declining cash flows. Capitalization (cap) rates moved up quickly in the second half of 2022, in response to major upward moves in bond yields, and moved out further in the first nine months of 2023, but share prices implied further moves in private market-cap rates. The region experienced a rebound in the third quarter of 2023, despite the generally increasing global bond yield environment, led by sectors and countries that had largely underperformed in the previous 12 months. However, the rebound was fairly limited, with only Germany, Switzerland, and Sweden showing positive returns. The German real estate market produced a total return of 19.3% in the third quarter, thanks to its large, multifamily residential sector. Despite ongoing concerns regarding overextended balance sheets and bond refinancings in the multifamily sector, investors covered shorts and returned to stocks, which they considered oversold following their extended period of major underperformance. |
| · | | In the Asia-Pacific region, attention centered on how the Fed, the Bank of Japan (BOJ), and the Chinese government appeared likely to move. In China, the central |
8 Visit our website at pgim.com/investments
| | government announced relaxation measures in the property sector in an effort to spur a market rebound. The BOJ adjusted monetary policy in its last meeting during the period, as a result of stronger wage and inflation data, and indicated an expectation that new core Consumer Price Index numbers (excluding fresh food and energy) would come in below 2% in 2024. |
What worked and didn’t work?
| · | | During the reporting period, the Fund outperformed the Index in North America, while relative performance lagged in Europe and the Asia Pacific region. |
| · | | Within North America, stock selection in the US healthcare and triple-net sectors drove outperformance, along with underweight allocation, relative to the Index, to the office sector. The data center sector also contributed, due to favorable stock selection and asset allocation. Stock selection in Canada further added to relative returns. |
| · | | Europe marginally underperformed, primarily due to underperformance in Sweden and Switzerland. Belgium also slightly detracted. |
| · | | The Asia Pacific region underperformed, largely due to weak stock selection in and an underweight allocation, relative to the Index, to, Hong Kong. |
Current outlook
| · | | The prevailing environment of heightened market volatility, driven by shifting rate-hike trends, presents an interesting dilemma wherein bad macroeconomic news could benefit real estate equities, as long as interest rate hikes slow, while net operating income is maintained. With increasing evidence of inflation slowing at the margin (but without a recession looming), the Fed has sounded less hawkish recently. The market expects, at most, a further rate uptick in 2023, followed by a pause in 2024. With 2024 being an election year, the Fed would likely act pragmatically on rates, especially if inflation moderates further. Accordingly, PGIM Real Estate believes the US is nearing the end of its current rate cycle, with headwinds likely to shift into tailwinds for the REIT market into the end of 2023 and throughout 2024. From a historical perspective, REITs have outperformed the S&P 500 Index following the conclusion of the last three Fed-tightening cycles for the following one-year periods. |
| · | | While a “soft landing” narrative seems to be taking root, this would be an unprecedented outcome, given the pace and extent of the Fed’s rate hikes this time around. A more hawkish Fed that implements additional hikes to cool core inflationary pressures remains a risk for 2024. Deglobalization and geopolitics—such as the continuation of the conflict in Ukraine and tensions between the US and China—also warrant concern. However, given the REIT market’s dramatic underperformance since the beginning of 2022 and its discounted valuation, PGIM Real Estate believes these incremental risks are already priced in. |
| · | | Outside of the office sector, US REIT fundamentals remain steady, with roughly 5.5% funds-from-operations (FFO) per-share growth expected in 2024, followed by 6% in 2025. Barring a major economic contraction, PGIM Real Estate expects REIT fundamentals to remain steady for most property types, given long lease durations, |
PGIM Select Real Estate Fund 9
Strategy and Performance Overview* (continued)
| | low supply risk, and defensive/secular-based demand. The current spread between REIT-implied valuations and private real estate values is at a historically wide spread, roughly 25% on an equally weighted basis. As rates stabilize, this valuation discrepancy is likely to lead to increased merger-and-acquisition opportunities for private equity players looking to deploy capital toward the discounted REIT sector. PGIM Real Estate continues to favor a barbell approach to the Fund’s sector allocation, minimizing unintended factor exposure. |
| · | | Regarding individual sectors of the US REIT market: |
| | · | | PGIM Real Estate has added to the Fund’s data center overweight, given attractive valuation and defensive net operating income (NOI) growth. Despite the outperformance of data centers year-to-date, the sector remains discounted and represents the only REIT sector to directly benefit from increasing artificial intelligence (AI)-related demand. |
| | · | | PGIM Real Estate also remains positive on sectors with embedded occupancy upside and limited economic sensitivity, such as healthcare. Senior housing occupancy, overall, remains roughly 4%–6% below pre-pandemic levels, which should allow for significant top-line growth as trends continue to normalize. |
| | · | | The recent decline in retail (both shopping centers and malls) has increased the attractiveness of the sector, given decent growth prospects in 2024 and beyond. Within retail, PGIM Real Estate has become slightly more constructive on the mall sector relative to shopping centers, given relative valuations. |
| | · | | Despite discounted valuations, PGIM Real Estate remains cautious on the office sector, which appears to be in the early stages of a multi-year secular headwind. PGIM Real Estate has reduced the Fund’s weighting to the sector, given its recent outperformance and numerous secular challenges expected in coming years. |
| | · | | PGIM Real Estate has also reduced the Fund’s industrial and storage weights, reflecting increasing caution regarding the ability of these sectors to sustain above-average growth in 2024. |
| · | | Inflation figures have been on the decline in Europe since November 2022. Although the region’s central banks chose to hold interest rates steady rather than implement additional increases in their most recent decisions in October 2023, the level of inflation still remains high relative to other global regions. Despite the strong rebound in equity markets, companies with weak balance sheets remain at near-record discounts to net and gross asset values, as they are still exposed to refinancing risk and falling cash flows. PGIM Real Estate’s focus in Europe remains on those companies we believe are better equipped to withstand sustained high interest rates, as well as potential macroeconomic headwinds. However, PGIM Real Estate has added to selected holdings, gradually moderating the Fund’s defensive regional positioning, as it believes most of Europe may have reached the peak of the current interest rate cycle. |
10 Visit our website at pgim.com/investments
| · | | In Asia, managing the rising cost of living, while ensuring economic growth, remains the predominant challenge. The path by which China manages its fiscal and monetary policies to boost economic growth, as well as its housing market policies, present an uncertain economic outlook. For the rest of Asia, economic growth and the monetary policy outlook remain largely dependent on Fed policy and global growth. A sharper rise in long-term real interest rates could negatively impact regional REIT valuations. In the event of setbacks on the geopolitical front, and given the severity of a potential US recession, risk appetite could remain in check heading into year-end. |
| · | | Regarding individual Asian markets: |
| | · | | In China, without a necessary increase in consumer confidence, PGIM Real Estate expects any economic recovery could be short-lived. |
| | · | | In Japan, PGIM Real Estate believes there could be additional tightening, if inflation expectations surprise significantly to the upside. PGIM Real Estate is positive on Japanese developers, preferring names that exhibit strong shareholder returns with greater reopening exposure. Despite caution regarding Japanese REITs (J-REITs), the Fund maintains a sizeable overweight, relative to the Index, in hospitality names that benefit from tourism reopening. The Fund also holds an overweight, relative to the Index, to logistic J-REITs, given their strong fundamentals leading to earnings growth. |
| | · | | PGIM Real Estate is positive on Australian data centers and self-storage. AI, cloud-computing-driven demand, and increasing self-storage penetration trends, respectively, provide structural tailwinds to both sectors. |
| | · | | In Hong Kong, which is saddled by a weak economic outlook, the Fund holds exposure to the retail sector, as the recovery in tourist travel is the most visible upward trend in the market. |
| | · | | In Singapore, PGIM Real Estate favors manager/landlord plays, as well as hospitality and industrial names with solid dividend growth underpinned by strong fundamentals. |
*This strategy and performance overview, which discusses what strategies or holdings (including derivatives, if applicable) affected the Fund’s performance, is compiled based on how the Fund performed relative to the Index and is viewed for performance attribution purposes at the aggregate Fund level, which in most instances will not directly correlate to the amounts disclosed in the Statement of Operations which conform to US generally accepted accounting principles.
PGIM Select Real Estate Fund 11
Comments on Largest Holdings (unaudited)
8.0% Welltower, Inc., Health Care REITs
Welltower invests in senior housing operators, post-acute providers, and health systems, and delivers the healthcare infrastructure necessary to facilitate better treatment. Welltower serves customers in the US, Canada, and the UK.
7.3% Digital Realty Trust, Inc., Specialized REITs
Digital Realty owns, acquires, repositions, and manages technology-related real estate. The company’s properties, located throughout the United States and in England, support the day-to-day operations of technology industry tenants and corporate enterprise data center tenants.
6.9% Prologis, Inc., Industrial REITs
Prologis is an owner, operator, and developer of industrial real estate, focused on global and regional markets across the Americas, Europe, and Asia. The company also leases modern distribution facilities to customers, including manufacturers, retailers, transportation companies, third-party logistics providers, and other enterprises.
5.0% Equinix, Inc., Specialized REITs
Equinix invests in interconnected data centers, focusing on developing network and cloud-neutral, data center platforms for cloud and information technology, enterprises, network, and mobile services providers, as well as for financial companies.
4.1% Simon Property Group, Inc., Retail REITs
Simon Property owns, develops, and manages retail real estate properties, including regional malls, outlet centers, community/lifestyle centers, and international properties in the state of Indiana.
12 Visit our website at pgim.com/investments
Fees and Expenses (unaudited)
As a shareholder of the Fund, you incur two types of costs: (1) transaction costs, including sales charges (loads) on purchase payments and redemptions, as applicable, and (2) ongoing costs, including management fees, distribution and/or service (12b-1) fees, and other Fund expenses, as applicable. This example is intended to help you understand your ongoing costs (in dollars) of investing in the Fund and to compare these costs with the ongoing costs of investing in other mutual funds.
The example is based on an investment of $1,000 held through the six-month period ended October 31, 2023. The example is for illustrative purposes only; you should consult the Prospectus for information on initial and subsequent minimum investment requirements.
Actual Expenses
The first line for each share class in the table on the following page provides information about actual account values and actual expenses. You may use the information on this line, together with the amount you invested, to estimate the expenses that you paid over the period. Simply divide your account value by $1,000 (for example, an $8,600 account value ÷ $1,000 = 8.6), then multiply the result by the number on the first line under the heading “Expenses Paid During the Six-Month Period” to estimate the expenses you paid on your account during this period.
Hypothetical Example for Comparison Purposes
The second line for each share class in the table on the following page provides information about hypothetical account values and hypothetical expenses based on the Fund’s actual expense ratio and an assumed rate of return of 5% per year before expenses, which is not the Fund’s actual return. The hypothetical account values and expenses may not be used to estimate the actual ending account balance or expenses you paid for the period. You may use this information to compare the ongoing costs of investing in the Fund and other funds. To do so, compare this 5% hypothetical example with the 5% hypothetical examples that appear in the shareholder reports of the other funds.
The Fund’s transfer agent may charge additional fees to holders of certain accounts that are not included in the expenses shown in the table on the following page. These fees apply to individual retirement accounts (IRAs) and Section 403(b) accounts. As of the close of the six-month period covered by the table, IRA fees included an annual maintenance fee of $15 per account (subject to a maximum annual maintenance fee of $25 for all accounts held by the same shareholder). Section 403(b) accounts are charged an annual $25 fiduciary maintenance fee. Some of the fees may vary in amount, or may be waived, based on your total account balance or the number of PGIM funds, including the Fund, that you own. You should consider the additional fees that were charged to your Fund account over the six-month period when you estimate the total ongoing expenses paid over the period and the impact of these fees on your ending account value, as these additional expenses are not reflected in the information
PGIM Select Real Estate Fund 13
Fees and Expenses (continued)
provided in the expense table. Additional fees have the effect of reducing investment returns.
Please note that the expenses shown in the table are meant to highlight your ongoing costs only and do not reflect any transactional costs such as sales charges (loads). Therefore, the second line for each share class in the table is useful in comparing ongoing costs only and will not help you determine the relative total costs of owning different funds. In addition, if these transactional costs were included, your costs would have been higher.
| | | | | | | | | | |
| | | | |
| PGIM Select Real Estate Fund | | Beginning Account Value May 1, 2023 | | Ending Account Value
October 31, 2023 | | Annualized Expense Ratio Based on the Six-Month Period | | Expenses Paid During the Six-Month Period* |
| | | | | |
Class A | | Actual | | $ 1,000.00 | | $ 894.00 | | 1.33% | | $ 6.35 |
| | | | | |
| | Hypothetical | | $1,000.00 | | $1,018.50 | | 1.33% | | $ 6.77 |
| | | | | |
Class C | | Actual | | $ 1,000.00 | | $ 890.70 | | 2.08% | | $ 9.91 |
| | | | | |
| | Hypothetical | | $1,000.00 | | $1,014.72 | | 2.08% | | $10.56 |
| | | | | |
Class Z | | Actual | | $1,000.00 | | $ 895.40 | | 1.10% | | $ 5.26 |
| | | | | |
| | Hypothetical | | $1,000.00 | | $1,019.66 | | 1.10% | | $ 5.60 |
| | | | | |
Class R6 | | Actual | | $ 1,000.00 | | $ 895.60 | | 1.01% | | $ 4.83 |
| | | | | |
| | | Hypothetical | | $1,000.00 | | $1,020.11 | | 1.01% | | $ 5.14 |
*Fund expenses (net of fee waivers or subsidies, if any) for each share class are equal to the annualized expense ratio for each share class (provided in the table), multiplied by the average account value over the period, multiplied by the 184 days in the six-month period ended October 31, 2023, and divided by the 365 days in the Fund’s fiscal year ended October 31, 2023 (to reflect the six-month period). Expenses presented in the table include the expenses of any underlying portfolios in which the Fund may invest.
14 Visit our website at pgim.com/investments
Schedule of Investments
as of October 31, 2023
| | | | | | | | |
| | |
| Description | | Shares | | | Value | |
| | |
LONG-TERM INVESTMENTS 99.1% | | | | | | | | |
| | |
COMMON STOCKS | | | | | | | | |
| | |
Diversified Real Estate Activities 6.0% | | | | | | | | |
| | |
Mitsui Fudosan Co. Ltd. (Japan) | | | 272,184 | | | $ | 5,899,551 | |
Sun Hung Kai Properties Ltd. (Hong Kong) | | | 325,963 | | | | 3,347,218 | |
Tokyu Fudosan Holdings Corp. (Japan) | | | 187,437 | | | | 1,092,069 | |
| | | | | | | | |
| | |
| | | | | | | 10,338,838 | |
| | |
Diversified REITs 3.0% | | | | | | | | |
| | |
Broadstone Net Lease, Inc. | | | 140,849 | | | | 1,993,013 | |
Essential Properties Realty Trust, Inc. | | | 145,739 | | | | 3,198,971 | |
| | | | | | | | |
| | |
| | | | | | | 5,191,984 | |
| | |
Health Care Facilities 0.5% | | | | | | | | |
| | |
Chartwell Retirement Residences (Canada), UTS | | | 120,563 | | | | 883,303 | |
| | |
Health Care REITs 13.9% | | | | | | | | |
| | |
Omega Healthcare Investors, Inc. | | | 98,206 | | | | 3,250,619 | |
Ventas, Inc. | | | 163,079 | | | | 6,924,334 | |
Welltower, Inc. | | | 166,432 | | | | 13,915,379 | |
| | | | | | | | |
| | |
| | | | | | | 24,090,332 | |
| | |
Hotel & Resort REITs 6.4% | | | | | | | | |
| | |
CapitaLand Ascott Trust (Singapore), UTS | | | 4,961,987 | | | | 3,262,535 | |
Host Hotels & Resorts, Inc. | | | 237,330 | | | | 3,673,869 | |
Invincible Investment Corp. (Japan) | | | 5,972 | | | | 2,296,833 | |
Japan Hotel REIT Investment Corp. (Japan) | | | 4,281 | | | | 1,946,285 | |
| | | | | | | | |
| | |
| | | | | | | 11,179,522 | |
| | |
Industrial REITs 15.5% | | | | | | | | |
| | |
Americold Realty Trust, Inc. | | | 185,992 | | | | 4,876,710 | |
CapitaLand Ascendas REIT (Singapore) | | | 1,465,210 | | | | 2,783,965 | |
GLP J-REIT (Japan) | | | 3,402 | | | | 3,047,028 | |
Mitsui Fudosan Logistics Park, Inc. (Japan) | | | 506 | | | | 1,529,755 | |
Prologis, Inc. | | | 118,421 | | | | 11,930,916 | |
Tritax Big Box REIT PLC (United Kingdom) | | | 1,550,099 | | | | 2,580,791 | |
Warehouses De Pauw CVA (Belgium) | | | 7,903 | | | | 195,540 | |
| | | | | | | | |
| | |
| | | | | | | 26,944,705 | |
| | |
Internet Services & Infrastructure 0.9% | | | | | | | | |
| | |
NEXTDC Ltd. (Australia)* | | | 201,387 | | | | 1,512,188 | |
See Notes to Financial Statements.
PGIM Select Real Estate Fund 15
Schedule of Investments (continued)
as of October 31, 2023
| | | | | | | | |
| | |
| Description | | Shares | | | Value | |
| | |
COMMON STOCKS (Continued) | | | | | | | | |
| | |
Office REITs 2.2% | | | | | | | | |
| | |
Great Portland Estates PLC (United Kingdom) | | | 331,131 | | | $ | 1,572,070 | |
Kilroy Realty Corp. | | | 78,986 | | | | 2,257,420 | |
| | | | | | | | |
| | |
| | | | | | | 3,829,490 | |
| | |
Real Estate Operating Companies 7.7% | | | | | | | | |
| | |
CapitaLand Investment Ltd. (Singapore) | | | 588,341 | | | | 1,263,276 | |
Castellum AB (Sweden) | | | 193,444 | | | | 1,853,922 | |
Grainger PLC (United Kingdom) | | | 689,905 | | | | 1,909,469 | |
Sagax AB (Sweden) (Class B Stock) | | | 63,958 | | | | 1,157,827 | |
Shurgard Self Storage Ltd. (Belgium) | | | 67,171 | | | | 2,513,854 | |
| | |
TAG Immobilien AG (Germany)* | | | 203,419 | | | | 2,224,183 | |
Wharf Real Estate Investment Co. Ltd. (Hong Kong) | | | 716,218 | | | | 2,505,359 | |
| | | | | | | | |
| | |
| | | | | | | 13,427,890 | |
| | |
Residential REITs 12.4% | | | | | | | | |
| | |
Apartment Income REIT Corp. | | | 122,549 | | | | 3,579,656 | |
Boardwalk Real Estate Investment Trust (Canada) | | | 59,529 | | | | 2,779,952 | |
Equity Residential | | | 82,232 | | | | 4,549,897 | |
InterRent Real Estate Investment Trust (Canada) | | | 234,864 | | | | 1,991,708 | |
Sun Communities, Inc. | | | 15,368 | | | | 1,709,536 | |
UNITE Group PLC (The) (United Kingdom) | | | 213,853 | | | | 2,263,105 | |
Veris Residential, Inc. | | | 351,438 | | | | 4,705,755 | |
| | | | | | | | |
| | |
| | | | | | | 21,579,609 | |
| | |
Retail REITs 11.9% | | | | | | | | |
| | |
Brixmor Property Group, Inc. | | | 198,334 | | | | 4,123,364 | |
Scentre Group (Australia) | | | 2,604,163 | | | | 4,034,351 | |
Simon Property Group, Inc. | | | 64,700 | | | | 7,109,883 | |
SITE Centers Corp. | | | 150,373 | | | | 1,753,349 | |
Unibail-Rodamco-Westfield (France)* | | | 74,336 | | | | 3,683,289 | |
| | | | | | | | |
| | |
| | | | | | | 20,704,236 | |
| | |
Specialized REITs 18.7% | | | | | | | | |
| | |
Digital Realty Trust, Inc. | | | 102,503 | | | | 12,747,273 | |
EPR Properties | | | 66,298 | | | | 2,830,925 | |
Equinix, Inc. | | | 11,833 | | | | 8,633,830 | |
Extra Space Storage, Inc. | | | 25,435 | | | | 2,634,812 | |
See Notes to Financial Statements.
16
| | | | | | | | |
| | |
| Description | | Shares | | | Value | |
| | |
COMMON STOCKS (Continued) | | | | | | | | |
| | |
Specialized REITs (cont’d.) | | | | | | | | |
| | |
Iron Mountain, Inc. | | | 63,865 | | | $ | 3,772,505 | |
National Storage REIT (Australia) | | | 1,446,104 | | | | 1,843,760 | |
| | | | | | | | |
| | |
| | | | | | | 32,463,105 | |
| | | | | | | | |
TOTAL LONG-TERM INVESTMENTS | | | | | | | | |
(cost $177,418,497) | | | | | | | 172,145,202 | |
| | | | | | | | |
| | |
SHORT-TERM INVESTMENT 0.0% | | | | | | | | |
| | |
AFFILIATED MUTUAL FUND | | | | | | | | |
PGIM Core Government Money Market Fund
(cost $420)(wb) | | | 420 | | | | 420 | |
| | | | | | | | |
TOTAL INVESTMENTS 99.1% | | | | | | | | |
(cost $177,418,917) | | | | | | | 172,145,622 | |
| | |
Other assets in excess of liabilities 0.9% | | | | | | | 1,607,056 | |
| | | | | | | | |
| | |
NET ASSETS 100.0% | | | | | | $ | 173,752,678 | |
| | | | | | | | |
Below is a list of the abbreviation(s) used in the annual report:
REITs—Real Estate Investment Trust
SOFR—Secured Overnight Financing Rate
UTS—Unit Trust Security
| * | Non-income producing security. |
| (wb) | Represents an investment in a Fund affiliated with the Manager. |
Fair Value Measurements:
Various inputs are used in determining the value of the Fund’s investments. These inputs are summarized in the three broad levels listed below.
Level 1—unadjusted quoted prices generally in active markets for identical securities.
Level 2—quoted prices for similar securities, interest rates and yield curves, prepayment speeds, foreign currency exchange rates and other observable inputs.
Level 3—unobservable inputs for securities valued in accordance with Board approved fair valuation procedures.
The following is a summary of the inputs used as of October 31, 2023 in valuing such portfolio securities:
| | | | | | | | | | | | | | | | | | | | | | | | |
| | | Level 1 | | | | | Level 2 | | | | | Level 3 | |
Investments in Securities | | | | | | | | | | | | | | | | | | | | | | | | |
Assets | | | | | | | | | | | | | | | | | | | | | | | | |
Long-Term Investments | | | | | | | | | | | | | | | | | | | | | | | | |
Common Stocks | | | | | | | | | | | | | | | | | | | | | | | | |
Australia | | $ | — | | | | | $ | 7,390,299 | | | | | | | | | $ | — | | | | | |
See Notes to Financial Statements.
PGIM Select Real Estate Fund 17
Schedule of Investments (continued)
as of October 31, 2023
| | | | | | | | | | | | | | | | | | | | | | | | |
| | | Level 1 | | | | | Level 2 | | | | | Level 3 | |
| | | | | | | |
Investments in Securities (continued) | | | | | | | | | | | | | | | | | | | | | | | | |
Assets (continued) | | | | | | | | | | | | | | | | | | | | | | | | |
Long-Term Investments (continued) | | | | | | | | | | | | | | | | | | | | | | | | |
Common Stocks (continued) | | | | | | | | | | | | | | | | | | | | | | | | |
Belgium | | $ | — | | | | | $ | 2,709,394 | | | | | | | | | $ | — | | | | | |
Canada | | | 5,654,963 | | | | | | — | | | | | | | | | | — | | | | | |
France | | | — | | | | | | 3,683,289 | | | | | | | | | | — | | | | | |
Germany | | | — | | | | | | 2,224,183 | | | | | | | | | | — | | | | | |
Hong Kong | | | — | | | | | | 5,852,577 | | | | | | | | | | — | | | | | |
Japan | | | — | | | | | | 15,811,521 | | | | | | | | | | — | | | | | |
Singapore | | | — | | | | | | 7,309,776 | | | | | | | | | | — | | | | | |
Sweden | | | — | | | | | | 3,011,749 | | | | | | | | | | — | | | | | |
United Kingdom | | | — | | | | | | 8,325,435 | | | | | | | | | | — | | | | | |
United States | | | 110,172,016 | | | | | | — | | | | | | | | | | — | | | | | |
Short-Term Investment | | | | | | | | | | | | | | | | | | | | | | | | |
Affiliated Mutual Fund | | | 420 | | | | | | — | | | | | | | | | | — | | | | | |
| | | | | | | | | | | | | | | | | | | | | | | | |
Total | | $ | 115,827,399 | | | | | $ | 56,318,223 | | | | | | | | | $ | — | | | | | |
| | | | | | | | | | | | | | | | |
Country Allocation:
The country allocation of portfolio holdings and other assets in excess of liabilities shown as a percentage of net assets as of October 31, 2023 were as follows:
| | | | |
United States | | | 63.5 | % |
Japan | | | 9.1 | |
United Kingdom | | | 4.8 | |
Australia | | | 4.3 | |
Singapore | | | 4.2 | |
Hong Kong | | | 3.3 | |
Canada | | | 3.2 | |
France | | | 2.1 | |
| | | | |
Sweden | | | 1.8 | % |
Belgium | | | 1.5 | |
Germany | | | 1.3 | |
| | | | |
| |
| | | 99.1 | |
Other assets in excess of liabilities | | | 0.9 | |
| | | | |
| |
| | | 100.0 | % |
| | | | |
See Notes to Financial Statements.
18
Statement of Assets and Liabilities
as of October 31, 2023
| | | | |
| |
Assets | | | | |
| |
Investments at value: | | | | |
Unaffiliated investments (cost $177,418,497) | | $ | 172,145,202 | |
Affiliated investments (cost $420) | | | 420 | |
Foreign currency, at value (cost $192) | | | 191 | |
Receivable for investments sold | | | 10,765,429 | |
Receivable for Fund shares sold | | | 503,484 | |
Dividends receivable | | | 275,332 | |
Tax reclaim receivable | | | 256,074 | |
Prepaid expenses | | | 2,247 | |
| | | | |
| |
Total Assets | | | 183,948,379 | |
| | | | |
| |
Liabilities | | | | |
| |
Loan payable | | | 8,596,000 | |
Payable for investments purchased | | | 884,106 | |
Payable for Fund shares purchased | | | 485,702 | |
Management fee payable | | | 128,468 | |
Accrued expenses and other liabilities | | | 96,103 | |
Distribution fee payable | | | 2,602 | |
Affiliated transfer agent fee payable | | | 1,376 | |
Trustees’ fees payable | | | 1,344 | |
| | | | |
| |
Total Liabilities | | | 10,195,701 | |
| | | | |
| |
Net Assets | | $ | 173,752,678 | |
| | | | |
| |
| | | | |
| |
Net assets were comprised of: | | | | |
Shares of beneficial interest, at par | | $ | 16,452 | |
Paid-in capital in excess of par | | | 249,662,953 | |
Total distributable earnings (loss) | | | (75,926,727 | ) |
| | | | |
| |
Net assets, October 31, 2023 | | $ | 173,752,678 | |
| | | | |
See Notes to Financial Statements.
PGIM Select Real Estate Fund 19
Statement of Assets and Liabilities
as of October 31, 2023
| | | | | | | | |
Class A | | | | | | | | |
| | |
Net asset value and redemption price per share, | | | | | | | | |
| | |
($5,278,067 ÷ 499,387 shares of beneficial interest issued and outstanding) | | $ | 10.57 | | | | | |
| | |
Maximum sales charge (5.50% of offering price) | | | 0.62 | | | | | |
| | | | | | | | |
| | |
Maximum offering price to public | | $ | 11.19 | | | | | |
| | | | | | | | |
| | |
Class C | | | | | | | | |
| | |
Net asset value, offering price and redemption price per share, | | | | | | | | |
| | |
($1,616,821 ÷ 155,054 shares of beneficial interest issued and outstanding) | | $ | 10.43 | | | | | |
| | | | | | | | |
| | |
Class Z | | | | | | | | |
| | |
Net asset value, offering price and redemption price per share, | | | | | | | | |
| | |
($147,175,783 ÷ 13,904,901 shares of beneficial interest issued and outstanding) | | $ | 10.58 | | | | | |
| | | | | | | | |
| | |
Class R6 | | | | | | | | |
| | |
Net asset value, offering price and redemption price per share, | | | | | | | | |
| | |
($19,682,007 ÷ 1,892,960 shares of beneficial interest issued and outstanding) | | $ | 10.40 | | | | | |
| | | | | | | | |
See Notes to Financial Statements.
20
Statement of Operations
Year Ended October 31, 2023
| | | | |
Net Investment Income (Loss) | | | | |
| |
Income | | | | |
Unaffiliated dividend income (net of $255,843 foreign withholding tax) | | $ | 7,298,822 | |
Affiliated dividend income | | | 53,229 | |
Affiliated income from securities lending, net | | | 11,485 | |
| | | | |
| |
Total income | | | 7,363,536 | |
| | | | |
| |
Expenses | | | | |
Management fee | | | 1,938,814 | |
Distribution fee(a) | | | 48,194 | |
Transfer agent’s fees and expenses (including affiliated expense of $7,921)(a) | | | 250,805 | |
Custodian and accounting fees | | | 79,516 | |
Professional fees | | | 46,688 | |
Registration fees(a) | | | 46,606 | |
Shareholders’ reports | | | 34,838 | |
Audit fee | | | 33,920 | |
Trustees’ fees | | | 13,104 | |
Miscellaneous | | | 91,669 | |
| | | | |
| |
Total expenses | | | 2,584,154 | |
Less: Fee waiver and/or expense reimbursement(a) | | | (20,310 | ) |
Distribution fee waiver(a) | | | (4,898 | ) |
| | | | |
| |
Net expenses | | | 2,558,946 | |
| | | | |
Net investment income (loss) | | | 4,804,590 | |
| | | | |
| |
Realized And Unrealized Gain (Loss) On Investment And Foreign Currency Transactions | | | | |
| |
Net realized gain (loss) on: | | | | |
Investment transactions (including affiliated of $13,498) | | | (29,345,139 | ) |
Foreign currency transactions | | | 15,861 | |
| | | | |
| |
| | | (29,329,278 | ) |
| | | | |
Net change in unrealized appreciation (depreciation) on: | | | | |
Investments (including affiliated of $(793)) | | | 31,032,178 | |
Foreign currencies | | | 15,748 | |
| | | | |
| |
| | | 31,047,926 | |
| | | | |
Net gain (loss) on investment and foreign currency transactions | | | 1,718,648 | |
| | | | |
Net Increase (Decrease) In Net Assets Resulting From Operations | | $ | 6,523,238 | |
| | | | |
| (a) | Class specific expenses and waivers were as follows: |
| | | | | | | | | | | | | | | | |
| | | Class A | | | Class C | | | Class Z | | | Class R6 | |
Distribution fee | | | 29,389 | | | | 18,805 | | | | — | | | | — | |
Transfer agent’s fees and expenses | | | 13,010 | | | | 3,155 | | | | 231,133 | | | | 3,507 | |
Registration fees | | | 7,504 | | | | 7,234 | | | | 18,562 | | | | 13,306 | |
Fee waiver and/or expense reimbursement | | | (5,988 | ) | | | (7,792 | ) | | | (6,530 | ) | | | — | |
Distribution fee waiver | | | (4,898 | ) | | | — | | | | — | | | | — | |
See Notes to Financial Statements.
PGIM Select Real Estate Fund 21
Statements of Changes in Net Assets
| | | | | | | | |
| |
| | | Year Ended
October 31, | |
| | |
| | | 2023 | | | 2022 | |
| | |
Increase (Decrease) in Net Assets | | | | | | | | |
| | |
Operations | | | | | | | | |
Net investment income (loss) | | $ | 4,804,590 | | | $ | 4,457,662 | |
Net realized gain (loss) on investment and foreign currency transactions | | | (29,329,278 | ) | | | (38,704,294 | ) |
Net change in unrealized appreciation (depreciation) on investments and foreign currencies | | | 31,047,926 | | | | (70,987,377 | ) |
| | | | | | | | |
Net increase (decrease) in net assets resulting from operations | | | 6,523,238 | | | | (105,234,009 | ) |
| | | | | | | | |
Dividends and Distributions | | | | | | | | |
Distributions from distributable earnings | | | | | | | | |
Class A | | | (171,028 | ) | | | (414,882 | ) |
Class C | | | (21,353 | ) | | | (91,196 | ) |
Class Z | | | (3,811,369 | ) | | | (10,983,011 | ) |
Class R6 | | | (1,011,529 | ) | | | (5,037,561 | ) |
| | | | | | | | |
| | | (5,015,279 | ) | | | (16,526,650 | ) |
| | | | | | | | |
Tax return of capital distributions | | | | | | | | |
Class A | | | — | | | | (24,202 | ) |
Class C | | | — | | | | (5,320 | ) |
Class Z | | | — | | | | (640,682 | ) |
Class R6 | | | — | | | | (293,861 | ) |
| | | | | | | | |
| | |
| | | — | | | | (964,065 | ) |
| | | | | | | | |
| | |
Fund share transactions (Net of share conversions) | | | | | | | | |
Net proceeds from shares sold | | | 96,110,698 | | | | 188,423,446 | |
Net asset value of shares issued in reinvestment of dividends and distributions | | | 5,008,295 | | | | 17,480,857 | |
Cost of shares purchased | | | (188,872,508 | ) | | | (151,688,740 | ) |
| | | | | | | | |
| | |
Net increase (decrease) in net assets from Fund share transactions | | | (87,753,515 | ) | | | 54,215,563 | |
| | | | | | | | |
| | |
Total increase (decrease) | | | (86,245,556 | ) | | | (68,509,161 | ) |
| | |
Net Assets: | | | | | | | | |
| | |
Beginning of year | | | 259,998,234 | | | | 328,507,395 | |
| | | | | | | | |
| | |
End of year | | $ | 173,752,678 | | | $ | 259,998,234 | |
| | | | | | | | |
See Notes to Financial Statements.
22
Financial Highlights
| | | | | | | | | | | | | | | | | | | | |
| |
| Class A Shares | |
| | | Year Ended October 31, | |
| | | | | | |
| | | 2023 | | | 2022 | | | 2021 | | | 2020 | | | 2019 | |
| Per Share Operating Performance(a): | | | | | | | | | | | | | | | | | | | | |
| Net Asset Value, Beginning of Year | | | $10.84 | | | | $15.54 | | | | $11.48 | | | | $13.18 | | | | $10.33 | |
| Income (loss) from investment operations: | | | | | | | | | | | | | | | | | | | | |
| Net investment income (loss) | | | 0.20 | (b) | | | 0.14 | | | | 0.10 | | | | 0.15 | | | | 0.16 | |
| Net realized and unrealized gain (loss) on investment and foreign currency transactions | | | (0.25 | )(c) | | | (4.12 | ) | | | 4.18 | | | | (1.16 | ) | | | 3.10 | |
| Total from investment operations | | | (0.05 | ) | | | (3.98 | ) | | | 4.28 | | | | (1.01 | ) | | | 3.26 | |
| Less Dividends and Distributions: | | | | | | | | | | | | | | | | | | | | |
| Dividends from net investment income | | | (0.22 | ) | | | (0.22 | ) | | | (0.22 | ) | | | (0.43 | ) | | | (0.21 | ) |
| Tax return of capital distributions | | | - | | | | (0.04 | ) | | | - | | | | - | | | | - | |
| Distributions from net realized gains | | | - | | | | (0.46 | ) | | | - | | | | (0.26 | ) | | | (0.20 | ) |
| Total dividends and distributions | | | (0.22 | ) | | | (0.72 | ) | | | (0.22 | ) | | | (0.69 | ) | | | (0.41 | ) |
| Net asset value, end of year | | | $10.57 | | | | $10.84 | | | | $15.54 | | | | $11.48 | | | | $13.18 | |
| Total Return(d): | | | (0.62 | )% | | | (26.71 | )% | | | 37.61 | % | | | (7.90 | )% | | | 32.64 | % |
| | | | | | | | | | | | | | | | | | | | | |
| Ratios/Supplemental Data: | | | | | | | | | | | | | | | | | | | | |
| Net assets, end of year (000) | | | $5,278 | | | | $10,982 | | | | $6,733 | | | | $3,878 | | | | $4,447 | |
| Average net assets (000) | | | $9,796 | | | | $11,632 | | | | $4,803 | | | | $4,534 | | | | $3,205 | |
| Ratios to average net assets(e): | | | | | | | | | | | | | | | | | | | | |
| Expenses after waivers and/or expense reimbursement | | | 1.32 | %(f) | | | 1.30 | % | | | 1.30 | % | | | 1.30 | % | | | 1.30 | % |
| Expenses before waivers and/or expense reimbursement | | | 1.43 | % | | | 1.44 | % | | | 1.57 | % | | | 2.11 | % | | | 3.04 | % |
| Net investment income (loss) | | | 1.73 | % | | | 1.05 | % | | | 0.74 | % | | | 1.26 | % | | | 1.36 | % |
| Portfolio turnover rate(g) | | | 121 | % | | | 137 | % | | | 165 | % | | | 313 | % | | | 242 | % |
| (a) | Calculated based on average shares outstanding during the year. |
| (b) | The per share amount of net investment income (loss) does not directly correlate to the amounts reported in the Statement of Operations due to class specific expenses. |
| (c) | The per share amount of realized and unrealized gain (loss) on investments does not directly correlate to the amounts reported in the Statement of Operations due to the timing of portfolio share transactions in relation to fluctuating market values. |
| (d) | Total return does not consider the effects of sales loads. Total return is calculated assuming a purchase of a share on the first day and a sale on the last day of each year reported and includes reinvestment of dividends and distributions, if any. Total returns may reflect adjustments to conform to GAAP. |
| (e) | Does not include expenses of the underlying funds in which the Fund invests. |
| (f) | Includes interest expense on borrowings from the Syndicated Credit Agreement and certain non-recurring expenses of 0.02% which are being excluded from the Fund’s contractual waiver for the year ended October 31, 2023. |
| (g) | The Fund’s portfolio turnover rate is calculated in accordance with regulatory requirements, without regard to transactions involving short-term investments, certain derivatives and in-kind transactions (if any). If such transactions were included, the Fund’s portfolio turnover rate may be higher. |
See Notes to Financial Statements.
PGIM Select Real Estate Fund 23
Financial Highlights (continued)
| | | | | | | | | | | | | | | | | | | | |
| |
| Class C Shares | |
| | | Year Ended October 31, | |
| | | | | | |
| | | 2023 | | | 2022 | | | 2021 | | | 2020 | | | 2019 | |
| Per Share Operating Performance(a): | | | | | | | | | | | | | | | | | | | | |
| Net Asset Value, Beginning of Year | | | $10.69 | | | | $15.33 | | | | $11.35 | | | | $13.03 | | | | $10.23 | |
| Income (loss) from investment operations: | | | | | | | | | | | | | | | | | | | | |
| Net investment income (loss) | | | 0.11 | (b) | | | 0.03 | | | | (0.01 | )(b) | | | 0.06 | | | | 0.06 | |
| Net realized and unrealized gain (loss) on investment and foreign currency transactions | | | (0.24 | )(c) | | | (4.05 | ) | | | 4.12 | | | | (1.13 | ) | | | 3.08 | |
| Total from investment operations | | | (0.13 | ) | | | (4.02 | ) | | | 4.11 | | | | (1.07 | ) | | | 3.14 | |
| Less Dividends and Distributions: | | | | | | | | | | | | | | | | | | | | |
| Dividends from net investment income | | | (0.13 | ) | | | (0.12 | ) | | | (0.13 | ) | | | (0.35 | ) | | | (0.14 | ) |
| Tax return of capital distributions | | | - | | | | (0.04 | ) | | | - | | | | - | | | | - | |
| Distributions from net realized gains | | | - | | | | (0.46 | ) | | | - | | | | (0.26 | ) | | | (0.20 | ) |
| Total dividends and distributions | | | (0.13 | ) | | | (0.62 | ) | | | (0.13 | ) | | | (0.61 | ) | | | (0.34 | ) |
| Net asset value, end of year | | | $10.43 | | | | $10.69 | | | | $15.33 | | | | $11.35 | | | | $13.03 | |
| Total Return(d): | | | (1.30 | )% | | | (27.25 | )% | | | 36.64 | % | | | (8.60 | )% | | | 31.59 | % |
| | | | | | | | | | | | | | | | | | | | | |
| Ratios/Supplemental Data: | | | | | | | | | | | | | | | | | | | | |
| Net assets, end of year (000) | | | $1,617 | | | | $1,754 | | | | $1,636 | | | | $605 | | | | $351 | |
| Average net assets (000) | | | $1,880 | | | | $2,168 | | | | $1,021 | | | | $532 | | | | $148 | |
| Ratios to average net assets(e): | | | | | | | | | | | | | | | | | | | | |
| Expenses after waivers and/or expense reimbursement | | | 2.07 | %(f) | | | 2.05 | % | | | 2.05 | % | | | 2.05 | % | | | 2.05 | % |
| Expenses before waivers and/or expense reimbursement | | | 2.48 | % | | | 2.56 | % | | | 2.95 | % | | | 5.31 | % | | | 11.73 | % |
| Net investment income (loss) | | | 0.96 | % | | | 0.26 | % | | | (0.06 | )% | | | 0.55 | % | | | 0.54 | % |
| Portfolio turnover rate(g) | | | 121 | % | | | 137 | % | | | 165 | % | | | 313 | % | | | 242 | % |
| (a) | Calculated based on average shares outstanding during the year. |
| (b) | The per share amount of net investment income (loss) does not directly correlate to the amounts reported in the Statement of Operations due to class specific expenses. |
| (c) | The per share amount of realized and unrealized gain (loss) on investments does not directly correlate to the amounts reported in the Statement of Operations due to the timing of portfolio share transactions in relation to fluctuating market values. |
| (d) | Total return does not consider the effects of sales loads. Total return is calculated assuming a purchase of a share on the first day and a sale on the last day of each year reported and includes reinvestment of dividends and distributions, if any. Total returns may reflect adjustments to conform to GAAP. |
| (e) | Does not include expenses of the underlying funds in which the Fund invests. |
| (f) | Includes interest expense on borrowings from the Syndicated Credit Agreement and certain non-recurring expenses of 0.02% which are being excluded from the Fund’s contractual waiver for the year ended October 31, 2023. |
| (g) | The Fund’s portfolio turnover rate is calculated in accordance with regulatory requirements, without regard to transactions involving short-term investments, certain derivatives and in-kind transactions (if any). If such transactions were included, the Fund’s portfolio turnover rate may be higher. |
See Notes to Financial Statements.
24
| | | | | | | | | | | | | | | | | | | | |
| |
| Class Z Shares | |
| | | Year Ended October 31, | |
| | | | | | |
| | | 2023 | | | 2022 | | | 2021 | | | 2020 | | | 2019 | |
| Per Share Operating Performance(a): | | | | | | | | | | | | | | | | | | | | |
| Net Asset Value, Beginning of Year | | | $10.86 | | | | $15.56 | | | | $11.49 | | | | $13.20 | | | | $10.34 | |
| Income (loss) from investment operations: | | | | | | | | | | | | | | | | | | | | |
| Net investment income (loss) | | | 0.23 | (b) | | | 0.18 | | | | 0.13 | | | | 0.16 | | | | 0.19 | |
| Net realized and unrealized gain (loss) on investment and foreign currency transactions | | | (0.26 | )(c) | | | (4.12 | ) | | | 4.19 | | | | (1.15 | ) | | | 3.11 | |
| Total from investment operations | | | (0.03 | ) | | | (3.94 | ) | | | 4.32 | | | | (0.99 | ) | | | 3.30 | |
| Less Dividends and Distributions: | | | | | | | | | | | | | | | | | | | | |
| Dividends from net investment income | | | (0.25 | ) | | | (0.26 | ) | | | (0.25 | ) | | | (0.46 | ) | | | (0.24 | ) |
| Tax return of capital distributions | | | - | | | | (0.04 | ) | | | - | | | | - | | | | - | |
| Distributions from net realized gains | | | - | | | | (0.46 | ) | | | - | | | | (0.26 | ) | | | (0.20 | ) |
| Total dividends and distributions | | | (0.25 | ) | | | (0.76 | ) | | | (0.25 | ) | | | (0.72 | ) | | | (0.44 | ) |
| Net asset value, end of year | | | $10.58 | | | | $10.86 | | | | $15.56 | | | | $11.49 | | | | $13.20 | |
| Total Return(d): | | | (0.37 | )% | | | (26.46 | )% | | | 38.04 | % | | | (7.73 | )% | | | 33.02 | % |
| | | | | | | | | | | | | | | | | | | | | |
| Ratios/Supplemental Data: | | | | | | | | | | | | | | | | | | | | |
| Net assets, end of year (000) | | | $147,176 | | | | $171,629 | | | | $226,286 | | | | $29,056 | | | | $6,366 | |
| Average net assets (000) | | | $177,323 | | | | $235,834 | | | | $126,992 | | | | $14,227 | | | | $1,621 | |
| Ratios to average net assets(e): | | | | | | | | | | | | | | | | | | | | |
| Expenses after waivers and/or expense reimbursement | | | 1.07 | %(f) | | | 1.01 | % | | | 1.04 | % | | | 1.05 | % | | | 1.05 | % |
| Expenses before waivers and/or expense reimbursement | | | 1.07 | % | | | 1.01 | % | | | 1.04 | % | | | 1.61 | % | | | 2.85 | % |
| Net investment income (loss) | | | 1.97 | % | | | 1.29 | % | | | 0.92 | % | | | 1.40 | % | | | 1.48 | % |
| Portfolio turnover rate(g) | | | 121 | % | | | 137 | % | | | 165 | % | | | 313 | % | | | 242 | % |
| (a) | Calculated based on average shares outstanding during the year. |
| (b) | The per share amount of net investment income (loss) does not directly correlate to the amounts reported in the Statement of Operations due to class specific expenses. |
| (c) | The per share amount of realized and unrealized gain (loss) on investments does not directly correlate to the amounts reported in the Statement of Operations due to the timing of portfolio share transactions in relation to fluctuating market values. |
| (d) | Total return is calculated assuming a purchase of a share on the first day and a sale on the last day of each year reported and includes reinvestment of dividends and distributions, if any. Total returns may reflect adjustments to conform to GAAP. |
| (e) | Does not include expenses of the underlying funds in which the Fund invests. |
| (f) | Includes interest expense on borrowings from the Syndicated Credit Agreement and certain non-recurring expenses of 0.02% which are being excluded from the Fund’s contractual waiver for the year ended October 31, 2023. |
| (g) | The Fund’s portfolio turnover rate is calculated in accordance with regulatory requirements, without regard to transactions involving short-term investments, certain derivatives and in-kind transactions (if any). If such transactions were included, the Fund’s portfolio turnover rate may be higher. |
See Notes to Financial Statements.
PGIM Select Real Estate Fund 25
Financial Highlights (continued)
| | | | | | | | | | | | | | | | | | | | |
| |
| Class R6 Shares | |
| | | Year Ended October 31, | |
| | | | | | |
| | | 2023 | | | 2022 | | | 2021 | | | 2020 | | | 2019 | |
| Per Share Operating Performance(a): | | | | | | | | | | | | | | | | | | | | |
| Net Asset Value, Beginning of Year | | | $10.67 | | | | $15.31 | | | | $11.31 | | | | $13.00 | | | | $10.19 | |
| Income (loss) from investment operations: | | | | | | | | | | | | | | | | | | | | |
| Net investment income (loss) | | | 0.24 | (b) | | | 0.19 | | | | 0.15 | | | | 0.18 | | | | 0.18 | |
| Net realized and unrealized gain (loss) on investment and foreign currency transactions | | | (0.25 | )(c) | | | (4.06 | ) | | | 4.11 | | | | (1.15 | ) | | | 3.07 | |
| Total from investment operations | | | (0.01 | ) | | | (3.87 | ) | | | 4.26 | | | | (0.97 | ) | | | 3.25 | |
| Less Dividends and Distributions: | | | | | | | | | | | | | | | | | | | | |
| Dividends from net investment income | | | (0.26 | ) | | | (0.27 | ) | | | (0.26 | ) | | | (0.46 | ) | | | (0.24 | ) |
| Tax return of capital distributions | | | - | | | | (0.04 | ) | | | - | | | | - | | | | - | |
| Distributions from net realized gains | | | - | | | | (0.46 | ) | | | - | | | | (0.26 | ) | | | (0.20 | ) |
| Total dividends and distributions | | | (0.26 | ) | | | (0.77 | ) | | | (0.26 | ) | | | (0.72 | ) | | | (0.44 | ) |
| Net asset value, end of year | | | $10.40 | | | | $10.67 | | | | $15.31 | | | | $11.31 | | | | $13.00 | |
| Total Return(d): | | | (0.27 | )% | | | (26.39 | )% | | | 38.10 | % | | | (7.70 | )% | | | 33.02 | % |
| | | | | | | | | | | | | | | | | | | | | |
| Ratios/Supplemental Data: | | | | | | | | | | | | | | | | | | | | |
| Net assets, end of year (000) | | | $19,682 | | | | $75,634 | | | | $93,853 | | | | $15,686 | | | | $17,138 | |
| Average net assets (000) | | | $53,351 | | | | $92,466 | | | | $57,833 | | | | $16,060 | | | | $8,739 | |
| Ratios to average net assets(e): | | | | | | | | | | | | | | | | | | | | |
| Expenses after waivers and/or expense reimbursement | | | 0.93 | % | | | 0.89 | % | | | 0.94 | % | | | 1.05 | % | | | 1.05 | % |
| Expenses before waivers and/or expense reimbursement | | | 0.93 | % | | | 0.89 | % | | | 0.94 | % | | | 1.42 | % | | | 2.25 | % |
| Net investment income (loss) | | | 2.11 | % | | | 1.40 | % | | | 1.06 | % | | | 1.56 | % | | | 1.56 | % |
| Portfolio turnover rate(f) | | | 121 | % | | | 137 | % | | | 165 | % | | | 313 | % | | | 242 | % |
| (a) | Calculated based on average shares outstanding during the year. |
| (b) | The per share amount of net investment income (loss) does not directly correlate to the amounts reported in the Statement of Operations due to class specific expenses. |
| (c) | The per share amount of realized and unrealized gain (loss) on investments does not directly correlate to the amounts reported in the Statement of Operations due to the timing of portfolio share transactions in relation to fluctuating market values. |
| (d) | Total return is calculated assuming a purchase of a share on the first day and a sale on the last day of each year reported and includes reinvestment of dividends and distributions, if any. Total returns may reflect adjustments to conform to GAAP. |
| (e) | Does not include expenses of the underlying funds in which the Fund invests. |
| (f) | The Fund’s portfolio turnover rate is calculated in accordance with regulatory requirements, without regard to transactions involving short-term investments, certain derivatives and in-kind transactions (if any). If such transactions were included, the Fund’s portfolio turnover rate may be higher. |
See Notes to Financial Statements.
26
Notes to Financial Statements
Prudential Investment Portfolios 9 (the “Registered Investment Company” or “RIC”) is registered under the Investment Company Act of 1940, as amended (“1940 Act”), as an open-end management investment company. The RIC is organized as a Delaware Statutory Trust. These financial statements relate only to the PGIM Select Real Estate Fund (the “Fund”), a series of the RIC. The Fund is classified as a diversified fund for purposes of the 1940 Act.
The investment objective of the Fund is to seek income and capital appreciation.
The Fund follows the investment company accounting and reporting guidance of the Financial Accounting Standards Board (“FASB”) Accounting Standard Codification (“ASC”) Topic 946 Financial Services — Investment Companies. The following is a summary of significant accounting policies followed by the Fund in the preparation of its financial statements. The policies conform to U.S. generally accepted accounting principles (“GAAP”). The Fund consistently follows such policies in the preparation of its financial statements.
Securities Valuation: The Fund holds securities and other assets and liabilities that are fair valued as of the close of each day (generally, 4:00 PM Eastern time) the New York Stock Exchange (“NYSE”) is open for trading. As described in further detail below, the Fund’s investments are valued daily based on a number of factors, including the type of investment and whether market quotations are readily available. The RIC’s Board of Trustees (the “Board”) has approved the Fund’s valuation policies and procedures for security valuation and designated PGIM Investments LLC (“PGIM Investments” or the “Manager”) as the “Valuation Designee,” as defined by Rule 2a-5(b) under the 1940 Act, to perform the fair value determination relating to all Fund investments. Pursuant to the Board’s oversight, the Valuation Designee has established a Valuation Committee to perform the duties and responsibilities as Valuation Designee under Rule 2a-5. The valuation procedures permit the Fund to utilize independent pricing vendor services, quotations from market makers, and alternative valuation methods when market quotations are either not readily available or not deemed representative of fair value. Fair value is the estimated price that would be received to sell an asset or paid to transfer a liability in an orderly transaction between market participants on the measurement date.
For the fiscal reporting year-end, securities and other assets and liabilities were fair valued at the close of the last U.S. business day. Trading in certain foreign securities may occur when the NYSE is closed (including weekends and holidays). Because such foreign securities trade in markets that are open on weekends and U.S. holidays, the values of some of the
PGIM Select Real Estate Fund 27
Notes to Financial Statements (continued)
Fund’s foreign investments may change on days when investors cannot purchase or redeem Fund shares.
Various inputs determine how the Fund’s investments are valued, all of which are categorized according to the three broad levels (Level 1, 2, or 3) detailed in the Schedule of Investments and referred to herein as the “fair value hierarchy” in accordance with FASB ASC Topic 820 — Fair Value Measurement.
Common or preferred stocks, exchange-traded funds (ETFs) and derivative instruments, if applicable, that are traded on a national securities exchange are valued at the last sale price as of the close of trading on the applicable exchange where the security principally trades. Securities traded via NASDAQ are valued at the NASDAQ official closing price. To the extent these securities are valued at the last sale price or NASDAQ official closing price, they are classified as Level 1 in the fair value hierarchy. In the event that no sale or official closing price on a valuation date exists, these securities are generally valued at the mean between the last reported bid and ask prices, or at the last bid price in the absence of an ask price. These securities are classified as Level 2 in the fair value hierarchy.
Foreign equities traded on foreign securities exchanges are generally valued using pricing vendor services that provide model prices derived using adjustment factors based on information such as local closing price, relevant general and sector indices, currency fluctuations, depositary receipts, and futures, as applicable. Securities valued using such model prices are classified as Level 2 in the fair value hierarchy. The models generate an evaluated adjustment factor for each security, which is applied to the local closing price to adjust it for post closing market movements up to the time the Fund is valued. Utilizing that evaluated adjustment factor, the vendor provides an evaluated price for each security. If the vendor does not provide an evaluated price, securities are valued in accordance with exchange-traded common and preferred stock valuation policies discussed above.
Investments in open-end funds (other than ETFs) are valued at their net asset values as of the close of the NYSE on the date of valuation. These securities are classified as Level 1 in the fair value hierarchy since they may be purchased or sold at their net asset values on the date of valuation.
Securities and other assets that cannot be priced according to the methods described above are valued based on policies and procedures approved by the Board. In the event that unobservable inputs are used when determining such valuations, the securities will be classified as Level 3 in the fair value hierarchy. Altering one or more unobservable inputs may result in a significant change to a Level 3 security’s fair value measurement.
28
When determining the fair value of securities, some of the factors influencing the valuation include: the nature of any restrictions on disposition of the securities; assessment of the general liquidity of the securities; the issuer’s financial condition and the markets in which it does business; the cost of the investment; the size of the holding and the capitalization of the issuer; the prices of any recent transactions or bids/offers for such securities or any comparable securities; and any available analyst media or other reports or information deemed reliable by the Valuation Designee regarding the issuer or the markets or industry in which it operates. Using fair value to price securities may result in a value that is different from a security’s most recent closing price and from the price used by other unaffiliated mutual funds to calculate their net asset values.
Foreign Currency Translation: The books and records of the Fund are maintained in U.S. dollars. Foreign currency amounts are translated into U.S. dollars on the following basis:
(i) market value of investment securities, other assets and liabilities — at the exchange rate as of the valuation date;
(ii) purchases and sales of investment securities, income and expenses — at the rates of exchange prevailing on the respective dates of such transactions.
Although the net assets of the Fund are presented at the foreign exchange rates and market values at the close of the period, the Fund does not generally isolate that portion of the results of operations arising as a result of changes in the foreign exchange rates from the fluctuations arising from changes in the market prices of long-term portfolio securities held at the end of the period. Similarly, the Fund does not isolate the effect of changes in foreign exchange rates from the fluctuations arising from changes in the market prices of long-term portfolio securities sold during the period. Accordingly, holding period unrealized and realized foreign currency gains (losses) are included in the reported net change in unrealized appreciation (depreciation) on investments and net realized gains (losses) on investment transactions on the Statements of Operations.
Net realized gains (losses) on foreign currency transactions represent net foreign exchange gains (losses) from the disposition of holdings of foreign currencies, currency gains (losses) realized between the trade and settlement dates on investment transactions, and the difference between the amounts of interest, dividends and foreign withholding taxes recorded on the Fund’s books and the U.S. dollar equivalent amounts actually received or paid. Net unrealized currency gains (losses) arise from valuing foreign currency denominated assets and liabilities (other than investments) at period end exchange rates.
Master Netting Arrangements: The RIC, on behalf of the Fund, is subject to various Master Agreements, or netting arrangements, with select counterparties. These are agreements which a subadviser may have negotiated and entered into on behalf of all or a portion of the Fund. A master netting arrangement between the Fund and the counterparty permits the Fund to offset amounts payable by the Fund to the same counterparty against amounts to be received and by the receipt of collateral from the counterparty by the Fund to cover
PGIM Select Real Estate Fund 29
Notes to Financial Statements (continued)
the Fund’s exposure to the counterparty. However, there is no assurance that such mitigating factors are easily enforceable. In addition to master netting arrangements, the right to set-off exists when all the conditions are met such that each of the parties owes the other determinable amounts, the reporting party has the right to set-off the amount owed with the amount owed by the other party, the reporting party intends to set-off and the right of set-off is enforceable by law.
Securities Lending: The Fund lends its portfolio securities to banks and broker-dealers. The loans are secured by collateral at least equal to the market value of the securities loaned. Collateral pledged by each borrower is invested in an affiliated money market fund and is marked to market daily, based on the previous day’s market value, such that the value of the collateral exceeds the value of the loaned securities. In the event of significant appreciation in value of the securities on loan on the last business day of the reporting period, the financial statements may reflect a collateral value that is less than the market value of the loaned securities. Such shortfall is remedied as described above. Loans are subject to termination at the option of the borrower or the Fund. Upon termination of the loan, the borrower will return to the Fund securities identical to the loaned securities. The remaining open loans of the securities lending transactions are considered overnight and continuous. Should the borrower of the securities fail financially, the Fund has the right to repurchase the securities in the open market using the collateral.
The Fund recognizes income, net of any rebate and securities lending agent fees, for lending its securities in the form of fees or interest on the investment of any cash received as collateral. The borrower receives all interest and dividends from the securities loaned and such payments are passed back to the lender in amounts equivalent thereto, which are reflected in interest income or unaffiliated dividend income based on the nature of the payment on the Statement of Operations. The Fund also continues to recognize any unrealized gain (loss) in the market price of the securities loaned and on the change in the value of the collateral invested that may occur during the term of the loan. In addition, realized gain (loss) is recognized on changes in the value of the collateral invested upon liquidation of the collateral. Net earnings from securities lending are disclosed in the Statement of Operations.
Equity and Mortgage Real Estate Investment Trusts (collectively REITs): The Fund invested in REITs, which report information on the source of their distributions annually. Based on current and historical information, a portion of distributions received from REITs during the period is estimated to be dividend income, capital gain or return of capital and recorded accordingly. When material, these estimates are adjusted periodically when the actual source of distributions is disclosed by the REITs.
30
Securities Transactions and Net Investment Income: Securities transactions are recorded on the trade date. Realized gains (losses) from investment and currency transactions are calculated on the specific identification method. Dividend income is recorded on the ex-date, or for certain foreign securities, when the Fund becomes aware of such dividends. Expenses are recorded on an accrual basis, which may require the use of certain estimates by management that may differ from actual expense amounts. Net investment income or loss (other than class specific expenses and waivers, which are allocated as noted below) and unrealized and realized gains (losses) are allocated daily to each class of shares based upon the relative proportion of adjusted net assets of each class at the beginning of the day. Class specific expenses and waivers, where applicable, are charged to the respective share classes. Such class specific expenses and waivers include distribution fees and distribution fee waivers, shareholder servicing fees, transfer agent’s fees and expenses, registration fees and fee waivers and/or expense reimbursements, as applicable.
Taxes: It is the Fund’s policy to continue to meet the requirements of the Internal Revenue Code applicable to regulated investment companies and to distribute all of its taxable net investment income and capital gains, if any, to its shareholders. Therefore, no federal income tax provision is required. Withholding taxes on foreign dividends, interest and capital gains, if any, are recorded, net of reclaimable amounts, at the time the related income is earned.
Between 2018 and 2025, tax reform legislation commonly referred to as the Tax Cuts and Jobs Act permits a direct REIT shareholder to claim a 20% “qualified business income” deduction for ordinary REIT dividends. The tax legislation did not expressly permit regulated investment companies (“RICs”) paying dividends attributable to such income to pass through this special treatment to its shareholders. On January 18, 2019, the Internal Revenue Service issued final regulations that permit RICs to pass through “qualified REIT dividends” to their shareholders.
Dividends and Distributions: Dividends and distributions to shareholders, which are determined in accordance with federal income tax regulations and which may differ from GAAP, are recorded on the ex-date. Permanent book/tax differences relating to income and gain (loss) are reclassified between total distributable earnings (loss) and paid-in capital in excess of par, as appropriate. The chart below sets forth the expected frequency of dividend and capital gains distributions to shareholders. Various factors may impact the frequency of dividend distributions to shareholders, including but not limited to adverse market conditions or portfolio holding-specific events.
| | |
| | |
Expected Distribution Schedule to Shareholders* | | Frequency |
Net Investment Income | | Quarterly |
Short-Term Capital Gains | | Annually |
Long-Term Capital Gains | | Annually |
| * | Under certain circumstances, the Fund may make more than one distribution of short-term and/or long-term capital gains during a fiscal year. |
PGIM Select Real Estate Fund 31
Notes to Financial Statements (continued)
Estimates: The preparation of financial statements requires management to make estimates and assumptions that affect the reported amounts and disclosures in the financial statements. Actual results could differ from those estimates.
The RIC, on behalf of the Fund, has a management agreement with the Manager pursuant to which it has responsibility for all investment advisory services, including supervision of the subadviser’s performance of such services, and for rendering administrative services.
The Manager has entered into a subadvisory agreement with PGIM, Inc., which provides subadvisory services to the Fund through its business unit, PGIM Real Estate, and PGIM Real Estate (UK) Limited, an indirect wholly-owned subsidiary of PGIM, Inc. (collectively referred to herein as the “subadviser”). The Manager pays for the services of subadviser.
Fees payable under the management agreement are computed daily and paid monthly. For the reporting period ended October 31, 2023, the contractual and effective management fee rates were as follows:
| | |
| | |
Contractual Management Rate | | Effective Management Fee, before any waivers and/or expense reimbursements |
0.80% on average daily net assets up to and including $1 billion; | | 0.80% |
0.78% on the next $2 billion of average daily net assets; | | |
0.76% on the next $2 billion of average daily net assets; | | |
0.75% on the next $5 billion of average daily net assets; | | |
0.74% on average daily net assets exceeding $10 billion. | | |
The Manager has contractually agreed, through February 28, 2025, to limit total annual operating expenses after fee waivers and/or expense reimbursements. This contractual waiver excludes interest, brokerage, taxes (such as income and foreign withholding taxes, stamp duty and deferred tax expenses), acquired fund fees and expenses, extraordinary expenses, and certain other Fund expenses such as dividend and interest expense and broker charges on short sales.
Where applicable, the Manager agrees to waive management fees or shared operating expenses on any share class to the same extent that it waives such expenses on any other share class. In addition, total annual operating expenses for Class R6 shares will not exceed total annual operating expenses for Class Z shares. Fees and/or expenses waived and/or reimbursed by the Manager for the purpose of preventing the expenses from exceeding a certain expense ratio limit may be recouped by the Manager within the same fiscal year during which such waiver and/or reimbursement is made if such recoupment can be
32
realized without exceeding the expense limit in effect at the time of the recoupment for that fiscal year. The expense limitations attributable to each class are as follows:
| | |
| | |
Class | | Expense
Limitations |
A | | 1.30% |
C | | 2.05 |
Z | | 1.05 |
R6 | | 1.05 |
The RIC, on behalf of the Fund, has a distribution agreement with Prudential Investment Management Services LLC (“PIMS”), which acts as the distributor of the Class A, Class C, Class Z and Class R6 shares of the Fund. The Fund compensates PIMS for distributing and servicing the Fund’s Class A and Class C shares, pursuant to the plans of distribution (the “Distribution Plans”), regardless of expenses actually incurred by PIMS.
Pursuant to the Distribution Plans, the Fund compensates PIMS for distribution related activities at an annual rate based on average daily net assets per class. PIMS has contractually agreed through February 28, 2025 to limit such fees on certain classes based on the average daily net assets. The distribution fees are accrued daily and payable monthly.
The Fund’s annual gross and net distribution rates, where applicable, are as follows:
| | | | |
| | | |
Class | | Gross Distribution Fee | | Net Distribution Fee |
A | | 0.30% | | 0.25% |
C | | 1.00 | | 1.00 |
Z | | N/A | | N/A |
R6 | | N/A | | N/A |
For the year ended October 31, 2023, PIMS received front-end sales charges (“FESL”) resulting from sales of certain class shares and contingent deferred sales charges (“CDSC”) imposed upon redemptions by certain shareholders. From these fees, PIMS paid such sales charges to broker-dealers, who in turn paid commissions to salespersons and incurred other distribution costs. The sales charges are as follows where applicable:
| | | | | | | | |
| | | |
Class | | | FESL | | | | CDSC | |
A | | $ | 15,892 | | | $ | — | |
C | | | — | | | | 444 | |
PGIM Investments, PGIM, Inc., PGIM Real Estate (UK) Limited and PIMS are indirect, wholly-owned subsidiaries of Prudential Financial, Inc. (“Prudential”).
| 4. | Other Transactions with Affiliates |
Prudential Mutual Fund Services LLC (“PMFS”), an affiliate of PGIM Investments and an indirect, wholly-owned subsidiary of Prudential, serves as the Fund’s transfer agent and shareholder servicing agent. Transfer agent’s fees and expenses in the Statement of Operations include certain out-of-pocket expenses paid to non-affiliates, where applicable.
PGIM Select Real Estate Fund 33
Notes to Financial Statements (continued)
The Fund may invest its overnight sweep cash in the PGIM Core Government Money Market Fund (the “Core Government Fund”), a series of the Prudential Government Money Market Fund, Inc., and its securities lending cash collateral in the PGIM Institutional Money Market Fund (the “Money Market Fund”), a series of Prudential Investment Portfolios 2, each registered under the 1940 Act and managed by PGIM Investments. PGIM Investments and/or its affiliates are paid fees or reimbursed for providing their services to the Core Government Fund and the Money Market Fund. In addition to the realized and unrealized gains on investments in the Core Government Fund and the Money Market Fund, earnings from such investments are disclosed on the Statement of Operations as “Affiliated dividend income” and “Affiliated income from securities lending, net”, respectively.
The Fund may enter into certain securities purchase or sale transactions under Board approved Rule 17a-7 procedures. Rule 17a-7 is an exemptive rule under the 1940 Act that, subject to certain conditions, permits purchase and sale transactions among affiliated investment companies, or between an investment company and a person that is affiliated solely by reason of having a common (or affiliated) investment adviser, common directors/trustees, and/or common officers. For the year ended October 31, 2023, no Rule 17a-7 transactions were entered into by the Fund.
The aggregate cost of purchases and proceeds from sales of portfolio securities (excluding short-term investments and U.S. Government securities) for the reporting period ended October 31, 2023, were as follows:
| | |
| | |
| Cost of Purchases | | Proceeds from Sales |
$290,217,415 | | $375,523,440 |
A summary of the cost of purchases and proceeds from sales of shares of affiliated mutual funds for the year ended October 31, 2023, is presented as follows:
| | | | | | | | | | | | | | | | | | | | | | | | |
| | | | | | | | |
Value,
Beginning
of Year | | Cost of Purchases | | | Proceeds from Sales | | | Change in Unrealized Gain (Loss) | | Realized Gain (Loss) | | Value, End of Year | | | Shares, End of Year | | | Income | |
| | | |
Short-Term Investments - Affiliated Mutual Funds: | | | | | | | | | | | | |
|
PGIM Core Government Money Market Fund(1)(wb) | |
$ — | | $ | 46,367,928 | | | $ | 46,367,508 | | | $ — | | $ — | | | $420 | | | | 420 | | | | $53,229 | |
34
| | | | | | | | | | | | | | |
| | | | | | | | |
Value,
Beginning
of Year | | Cost of
Purchases | | Proceeds
from Sales | | Change in
Unrealized
Gain (Loss) | | Realized Gain (Loss) | | Value, End of Year | | Shares, End of Year | | Income |
|
PGIM Institutional Money Market Fund(1)(b)(wb) |
| $15,193,517 | | $239,765,618 | | $254,971,840 | | $(793) | | $13,498 | | $ — | | — | | $11,485(2) |
| $15,193,517 | | $286,133,546 | | $301,339,348 | | $(793) | | $13,498 | | $420 | | | | $64,714 |
| (1) | The Fund did not have any capital gain distributions during the reporting period. |
| (2) | The amount, or a portion thereof, represents the affiliated securities lending income shown on the Statement of Operations. |
| (b) | Represents security, or portion thereof, purchased with cash collateral received for securities on loan and includes dividend reinvestment. |
| (wb) | Represents an investment in a Fund affiliated with the Manager. |
| 6. | Distributions and Tax Information |
Distributions to shareholders, which are determined in accordance with federal income tax regulations and which may differ from GAAP, are recorded on the ex-date. In order to present total distributable earnings (loss) and paid-in capital in excess of par on the Statement of Assets and Liabilities that more closely represent their tax character, certain adjustments have been made to total distributable earnings (loss) and paid-in capital in excess of par for the Fund.
For the year ended October 31, 2023, the adjustments were as follows:
| | |
| | |
Total Distributable
Earnings (Loss) | | Paid-in Capital in Excess of Par |
$50,245 | | $(50,245) |
For the year ended October 31, 2023, the tax character of dividends paid as reflected in the Statement of Changes in Net Assets were as follows:
| | | | | | |
| | | | |
Ordinary
Income | | Long-Term Capital Gains | | Tax Return of Capital | | Total Dividends and Distributions |
$5,015,279 | | $— | | $— | | $5,015,279 |
For the year ended October 31, 2022, the tax character of dividends paid as reflected in the Statement of Changes in Net Assets were as follows:
| | | | | | |
| | | | |
Ordinary
Income | | Long-Term Capital Gains | | Tax Return of Capital | | Total Dividends and Distributions |
$14,767,334 | | $1,759,316 | | $964,065 | | $17,490,715 |
PGIM Select Real Estate Fund 35
Notes to Financial Statements (continued)
For the year ended October 31, 2023, the Fund had the following amounts of accumulated undistributed earnings on a tax basis:
| | |
| | |
Undistributed
Ordinary
Income | | Undistributed Long-Term Capital Gains |
$1,028,834 | | $— |
The United States federal income tax basis of the Fund’s investments and the net unrealized depreciation as of October 31, 2023 were as follows:
| | | | | | |
| | | | |
| Tax Basis | | Gross Unrealized Appreciation | | Gross Unrealized Depreciation | | Net Unrealized Depreciation |
$183,862,620 | | $9,213,638 | | $(20,930,636) | | $(11,716,998) |
The GAAP basis differs from tax basis primarily due to deferred losses on wash sales and investments in passive foreign investment companies.
For federal income tax purposes, the Fund had an approximated capital loss carryforward as of October 31, 2023 which can be carried forward for an unlimited period. No capital gains distributions are expected to be paid to shareholders until net gains have been realized in excess of such losses.
| | |
| | |
Capital Loss
Carryforward | | Capital Loss Carryforward Utilized |
$65,188,000 | | $— |
The Manager has analyzed the Fund’s tax positions taken on federal, state and local income tax returns for all open tax years and has concluded that no provision for income tax is required in the Fund’s financial statements for the current reporting period. Since tax authorities can examine previously filed tax returns, the Fund’s U.S. federal and state tax returns for each of the four fiscal years up to the most recent fiscal year ended October 31, 2023 are subject to such review.
The Fund offers Class A, Class C, Class Z and Class R6 shares. Class A shares are sold with a maximum front-end sales charge of 5.50%. Investors who purchase $1 million or more of Class A shares and sell these shares within 12 months of purchase are subject to a CDSC of 1%, although they are not subject to an initial sales charge. The Class A CDSC is waived for certain retirement and/or benefit plans. A special exchange privilege is also available for shareholders who qualified to purchase Class A shares at net asset value. Class C shares are sold with a CDSC of 1% on sales made within 12 months of purchase. Class C shares will
36
automatically convert to Class A shares on a monthly basis approximately eight years (ten years prior to January 22, 2021) after purchase. Class Z and Class R6 shares are not subject to any sales or redemption charges and are available exclusively for sale to a limited group of investors.
Under certain circumstances, an exchange may be made from specified share classes of the Fund to one or more other share classes of the Fund as presented in the table of transactions in shares of beneficial interest, below.
The RIC has authorized an unlimited number of shares of beneficial interest of the Fund at $0.001 par value per share, currently divided into four classes, designated Class A, Class C, Class Z and Class R6.
As of October 31, 2023, Prudential, through its affiliated entities, including affiliated funds (if applicable), owned shares of the Fund as follows:
| | | | |
| | | |
Class | | Number of Shares | | Percentage of Outstanding Shares |
C | | 1,295 | | 0.8% |
R6 | | 1,552,463 | | 82.0 |
At the reporting period end, the number of shareholders holding greater than 5% of the Fund are as follows:
| | | | |
| | | |
| | | Number of Shareholders | | Percentage of Outstanding Shares |
Affiliated | | 1 | | 9.3% |
Unaffiliated | | 3 | | 75.7 |
Transactions in shares of beneficial interest were as follows:
| | | | | | | | |
| | | |
| Share Class | | Shares | | | Amount | |
| | |
Class A | | | | | | | | |
Year ended October 31, 2023: | | | | | | | | |
Shares sold | | | 98,715 | | | $ | 1,153,903 | |
Shares issued in reinvestment of dividends and distributions | | | 14,810 | | | | 170,993 | |
Shares purchased | | | (621,093 | ) | | | (7,305,097 | ) |
Net increase (decrease) in shares outstanding before conversion | | | (507,568 | ) | | | (5,980,201 | ) |
Shares issued upon conversion from other share class(es) | | | 6,087 | | | | 70,327 | |
Shares purchased upon conversion into other share class(es) | | | (12,103 | ) | | | (140,249 | ) |
Net increase (decrease) in shares outstanding | | | (513,584 | ) | | $ | (6,050,123 | ) |
PGIM Select Real Estate Fund 37
Notes to Financial Statements (continued)
| | | | | | | | |
| | | |
Share Class | | | Shares | | | | Amount | |
| | |
Year ended October 31, 2022: | | | | | | | | |
Shares sold | | | 729,508 | | | $ | 10,506,840 | |
Shares issued in reinvestment of dividends and distributions | | | 31,595 | | | | 438,849 | |
Shares purchased | | | (187,168 | ) | | | (2,503,324 | ) |
Net increase (decrease) in shares outstanding before conversion | | | 573,935 | | | | 8,442,365 | |
Shares issued upon conversion from other share class(es) | | | 7,131 | | | | 78,490 | |
Shares purchased upon conversion into other share class(es) | | | (1,433 | ) | | | (21,124 | ) |
Net increase (decrease) in shares outstanding | | | 579,633 | | | $ | 8,499,731 | |
| | |
Class C | | | | | | | | |
Year ended October 31, 2023: | | | | | | | | |
Shares sold | | | 47,930 | | | $ | 545,368 | |
Shares issued in reinvestment of dividends and distributions | | | 1,875 | | | | 21,318 | |
Shares purchased | | | (53,248 | ) | | | (609,473 | ) |
Net increase (decrease) in shares outstanding before conversion | | | (3,443 | ) | | | (42,787 | ) |
Shares purchased upon conversion into other share class(es) | | | (5,474 | ) | | | (62,252 | ) |
Net increase (decrease) in shares outstanding | | | (8,917 | ) | | $ | (105,039 | ) |
| | |
Year ended October 31, 2022: | | | | | | | | |
Shares sold | | | 122,024 | | | $ | 1,749,306 | |
Shares issued in reinvestment of dividends and distributions | | | 6,629 | | | | 94,764 | |
Shares purchased | | | (64,019 | ) | | | (849,402 | ) |
Net increase (decrease) in shares outstanding before conversion | | | 64,634 | | | | 994,668 | |
Shares purchased upon conversion into other share class(es) | | | (7,369 | ) | | | (80,418 | ) |
Net increase (decrease) in shares outstanding | | | 57,265 | | | $ | 914,250 | |
| | |
Class Z | | | | | | | | |
Year ended October 31, 2023: | | | | | | | | |
Shares sold | | | 6,472,628 | | | $ | 74,952,042 | |
Shares issued in reinvestment of dividends and distributions | | | 331,388 | | | | 3,805,130 | |
Shares purchased | | | (8,718,343 | ) | | | (99,098,086 | ) |
Net increase (decrease) in shares outstanding before conversion | | | (1,914,327 | ) | | | (20,340,914 | ) |
Shares issued upon conversion from other share class(es) | | | 12,484 | | | | 144,855 | |
Shares purchased upon conversion into other share class(es) | | | (3,338 | ) | | | (38,972 | ) |
Net increase (decrease) in shares outstanding | | | (1,905,181 | ) | | $ | (20,235,031 | ) |
38
| | | | | | | | |
| | | |
| Share Class | | Shares | | | Amount | |
| | |
Year ended October 31, 2022: | | | | | | | | |
Shares sold | | | 8,857,165 | | | $ | 124,834,508 | |
Shares issued in reinvestment of dividends and distributions | | | 819,289 | | | | 11,616,446 | |
Shares purchased | | | (8,410,286 | ) | | | (106,630,767 | ) |
Net increase (decrease) in shares outstanding before conversion | | | 1,266,168 | | | | 29,820,187 | |
Shares issued upon conversion from other share class(es) | | | 1,826 | | | | 26,512 | |
Net increase (decrease) in shares outstanding | | | 1,267,994 | | | $ | 29,846,699 | |
| | |
Class R6 | | | | | | | | |
Year ended October 31, 2023: | | | | | | | | |
Shares sold | | | 1,674,290 | | | $ | 19,459,385 | |
Shares issued in reinvestment of dividends and distributions | | | 89,449 | | | | 1,010,854 | |
Shares purchased | | | (6,962,409 | ) | | | (81,859,852 | ) |
Net increase (decrease) in shares outstanding before conversion | | | (5,198,670 | ) | | | (61,389,613 | ) |
Shares issued upon conversion from other share class(es) | | | 2,696 | | | | 30,897 | |
Shares purchased upon conversion into other share class(es) | | | (408 | ) | | | (4,606 | ) |
Net increase (decrease) in shares outstanding | | | (5,196,382 | ) | | $ | (61,363,322 | ) |
| | |
Year ended October 31, 2022: | | | | | | | | |
Shares sold | | | 3,629,909 | | | $ | 51,332,792 | |
Shares issued in reinvestment of dividends and distributions | | | 383,091 | | | | 5,330,798 | |
Shares purchased | | | (3,053,513 | ) | | | (41,705,247 | ) |
Net increase (decrease) in shares outstanding before conversion | | | 959,487 | | | | 14,958,343 | |
Shares purchased upon conversion into other share class(es) | | | (263 | ) | | | (3,460 | ) |
Net increase (decrease) in shares outstanding | | | 959,224 | | | $ | 14,954,883 | |
The RIC, on behalf of the Fund, along with other affiliated registered investment companies (the “Participating Funds”), is a party to a Syndicated Credit Agreement (“SCA”) with a group of banks. The purpose of the SCA is to provide an alternative source of temporary funding for capital share redemptions. The table below provides details of the current SCA in effect at the reporting period-end as well as the prior SCA.
| | | | |
| | | |
| | | Current SCA | | Prior SCA |
Term of Commitment | | 9/29/2023 - 9/26/2024 | | 9/30/2022 – 9/28/2023 |
Total Commitment | | $ 1,200,000,000 | | $ 1,200,000,000 |
Annualized Commitment Fee on the Unused Portion of the SCA | | 0.15% | | 0.15% |
Annualized Interest Rate on Borrowings | | 1.00% plus the higher of (1)
the effective federal funds rate, (2) the daily SOFR rate plus 0.10% or (3) zero percent | | 1.00% plus the higher of (1) the effective federal funds rate, (2) the daily SOFR rate plus 0.10% or (3) zero percent |
Certain affiliated registered investment companies that are parties to the SCA include portfolios that are subject to a predetermined mathematical formula used to manage certain
PGIM Select Real Estate Fund 39
Notes to Financial Statements (continued)
benefit guarantees offered under variable annuity contracts. The formula may result in large scale asset flows into and out of these portfolios. Consequently, these portfolios may be more likely to utilize the SCA for purposes of funding redemptions. It may be possible for those portfolios to fully exhaust the committed amount of the SCA, thereby requiring the Manager to allocate available funding per a Board-approved methodology designed to treat the Participating Funds in the SCA equitably.
The Fund utilized the SCA during the year ended October 31, 2023. The average daily balance for the 67 days that the Fund had loans outstanding during the period was approximately $3,051,194, borrowed at a weighted average interest rate of 5.99%. The maximum loan outstanding amount during the period was $57,496,000. At October 31, 2023, the Fund had an outstanding loan balance of $8,596,000.
| 9. | Risks of Investing in the Fund |
The Fund’s risks include, but are not limited to, some or all of the risks discussed below. For further information on the Fund’s risks, please refer to the Fund’s Prospectus and Statement of Additional Information.
Active Trading Risk: The Fund actively and frequently trades its portfolio securities. High portfolio turnover results in higher transaction costs, which can affect the Fund’s performance and have adverse tax consequences. In addition, high portfolio turnover may also mean that a proportionately greater amount of distributions to shareholders will be taxed as ordinary income rather than long-term capital gains compared to investment companies with lower portfolio turnover.
Distribution Risk: The Fund’s distributions may consist of net investment income, if any, and net realized gains, if any, from the sale of investments and/or return of capital. The Fund will provide to shareholders early in each calendar year the final tax character of the Fund’s distributions for the previous year. Also, at such time that the Fund distribution is expected to be from sources other than current or accumulated net income, a notice to shareholders may be required.
Economic and Market Events Risk: Events in the U.S. and global financial markets, including actions taken by the U.S. Federal Reserve or foreign central banks to stimulate or stabilize economic growth or the functioning of the securities markets, or otherwise reduce inflation, may at times result in unusually high market volatility, which could negatively impact performance. Governmental efforts to curb inflation often have negative effects on the level of economic activity. Relatively reduced liquidity in credit and fixed income markets could adversely affect issuers worldwide.
40
Emerging Markets Risk: The risks of foreign investments are greater for investments in or exposed to emerging markets. Emerging market countries typically have economic and political systems that are less fully developed, and can be expected to be less stable, than those of more developed countries. For example, the economies of such countries can be subject to rapid and unpredictable rates of inflation or deflation. Low trading volumes may result in a lack of liquidity and price volatility. Emerging market countries may have policies that restrict investment by non-U.S. investors, or that prevent non-U.S. investors from withdrawing their money at will.
The Fund may invest in some emerging markets that subject it to risks such as those associated with illiquidity, custody of assets, different settlement and clearance procedures and asserting legal title under a developing legal and regulatory regime to a greater degree than in developed markets or even in other emerging markets.
Equity and Equity-Related Securities Risk: Equity and equity-related securities may be subject to changes in value, and their values may be more volatile than those of other asset classes. In addition to an individual security losing value, the value of the equity markets or a sector in which the Fund invests could go down. Different parts of a market can react differently to adverse issuer, market, regulatory, political and economic developments.
Foreign Securities Risk: Investments in securities of non-U.S. issuers (including those denominated in U.S. dollars) may involve more risk than investing in securities of U.S. issuers. Foreign political, economic and legal systems, especially those in developing and emerging market countries, may be less stable and more volatile than in the United States. Foreign legal systems generally have fewer regulatory requirements than the U.S. legal system, particularly those of emerging markets. In general, less information is publicly available with respect to non-U.S. companies than U.S. companies. Non-U.S. companies generally are not subject to the same accounting, auditing, and financial reporting standards as are U.S. companies. Additionally, the changing value of foreign currencies and changes in exchange rates could also affect the value of the assets the Fund holds and the Fund’s performance. Certain foreign countries may impose restrictions on the ability of issuers of foreign securities to make payment of principal and interest or dividends to investors located outside the country, due to blockage of foreign currency exchanges or otherwise. Investments in emerging markets are subject to greater volatility and price declines.
In addition, the Fund’s investments in non-U.S. securities may be subject to the risks of nationalization or expropriation of assets, imposition of currency exchange controls or restrictions on the repatriation of non-U.S. currency, confiscatory taxation and adverse diplomatic developments. Special U.S. tax considerations may apply.
Increase in Expenses Risk: Your actual cost of investing in the Fund may be higher than the expenses shown in the expense table in the Fund’s prospectus for a variety of reasons. For example, expense ratios may be higher than those shown if average net assets decrease.
PGIM Select Real Estate Fund 41
Notes to Financial Statements (continued)
Net assets are more likely to decrease and Fund expense ratios are more likely to increase when markets are volatile. Active and frequent trading of Fund securities can increase expenses.
Large Shareholder and Large Scale Redemption Risk: Certain individuals, accounts, funds (including funds affiliated with the Manager) or institutions, including the Manager and its affiliates, may from time to time own or control a substantial amount of the Fund’s shares. There is no requirement that these entities maintain their investment in the Fund. There is a risk that such large shareholders or that the Fund’s shareholders generally may redeem all or a substantial portion of their investments in the Fund in a short period of time, which could have a significant negative impact on the Fund’s NAV, liquidity, and brokerage costs. Large redemptions could also result in tax consequences to shareholders and impact the Fund’s ability to implement its investment strategy. The Fund’s ability to pursue its investment objective after one or more large scale redemptions may be impaired and, as a result, the Fund may invest a larger portion of its assets in cash or cash equivalents.
Market Capitalization Risk: The Fund may invest in companies of any market capitalization. Generally, the stock prices of small-and mid-cap companies are less stable than the prices of large-cap stocks and may present greater risks. Large capitalization companies as a group could fall out of favor with the market, causing the Fund to underperform compared to investments that focus on smaller capitalized companies.
Market Disruption and Geopolitical Risks: Market disruption can be caused by economic, financial or political events and factors, including but not limited to, international wars or conflicts (including Russia’s military invasion of Ukraine), geopolitical developments (including trading and tariff arrangements, sanctions and cybersecurity attacks), instability in regions such as Asia, Eastern Europe and the Middle East, terrorism, natural disasters and public health epidemics (including the outbreak of COVID-19 globally).
The extent and duration of such events and resulting market disruptions cannot be predicted, but could be substantial and could magnify the impact of other risks to the Fund. These and other similar events could adversely affect the U.S. and foreign financial markets and lead to increased market volatility, reduced liquidity in the securities markets, significant negative impacts on issuers and the markets for certain securities and commodities and/or government intervention. They may also cause short- or long-term economic uncertainties in the United States and worldwide. As a result, whether or not the Fund invests in securities of issuers located in or with significant exposure to the countries directly affected, the value and liquidity of the Fund’s investments may be negatively impacted. Further, due to closures of certain markets and restrictions on trading certain securities, the value of certain securities held by the Fund could be significantly impacted, which could lead to such securities being valued at zero.
42
Market Risk: Securities markets may be volatile and the market prices of the Fund’s securities may decline. Securities fluctuate in price based on changes in an issuer’s financial condition and overall market and economic conditions. If the market prices of the securities owned by the Fund fall, the value of your investment in the Fund will decline.
Real Estate Investment Trust (“REIT”) Risk: Investing in REITs involves certain unique risks in addition to those risks associated with investing in the real estate industry in general. REITs may be affected by changes in the value of the underlying property owned by the REITs, while mortgage REITs may be affected by the quality of any credit extended. REITs are dependent upon management skills, may not be diversified geographically or by property/mortgage asset type, and are subject to heavy cash flow dependency, default by borrowers and self-liquidation. REITs may be more volatile and/or more illiquid than other types of equity securities. REITs (especially mortgage REITs) are subject to interest rate risks. REITs may incur significant amounts of leverage. The Fund will indirectly bear a portion of the expenses, including management fees, paid by each REIT in which it invests, in addition to the expenses of the Fund.
REITs must also meet certain requirements under the Internal Revenue Code of 1986, as amended (the Code) to avoid entity level tax and be eligible to pass-through certain tax attributes of their income to shareholders. REITs are consequently subject to the risk of failing to meet these requirements for favorable tax treatment and of failing to maintain their exemptions from registration under the Investment Company Act of 1940. REITs are subject to the risks of changes in the Code affecting their tax status.
Real Estate Related Securities Risk: Because the Fund invests in real estate securities, including REITs, the Fund is subject to the risks of investing in the real estate industry, such as changes in general and local economic conditions, the supply and demand for real estate and changes in zoning and tax laws. Since the Fund concentrates in the real estate industry, its holdings can vary significantly from broad market indices. As a result, the Fund’s performance can deviate from the performance of such indices. Because the Fund invests in stocks, there is the risk that the price of a particular stock owned by the Fund could go down or pay lower-than-expected or no dividends. In addition to an individual stock losing value, the value of the equity markets or of companies comprising the real estate industry could go down.
An investment in the Fund will be closely linked to the performance of the real estate markets. Real estate securities are subject to the same risks as direct investments in real estate and mortgages, and their value will depend on the value of the underlying properties or the underlying loans or interests. The underlying loans may be subject to the risks of default or of prepayments that occur earlier or later than expected, and such loans may also include so-called “subprime” mortgages. The value of these securities will rise and fall in response to many factors, including economic conditions, the demand for rental property and interest rates. In particular, the value of these securities may decline when interest rates rise and will also be affected by the real estate market and by the management of the underlying properties.
PGIM Select Real Estate Fund 43
Notes to Financial Statements (continued)
Selection Risk: Selection risk is the risk that the securities selected by the subadviser will underperform the market, the relevant indices, or other funds with similar investment objectives and investment strategies. Individual REIT prices may drop because of the failure of borrowers to pay their loans, a dividend reduction, a disruption to the real estate investment sales market, changes in federal or state taxation policies affecting REITs, or poor management of a REIT.
Value Style Risk: Since the Fund follows a value investment style, there is the risk that the value style may be out of favor for long periods of time, that the market will not recognize a security’s intrinsic value for a long time or at all, or that a stock judged to be undervalued may actually be appropriately priced or overvalued. Issuers of value stocks may have experienced adverse business developments or may be subject to special risks that have caused the stock to be out of favor. In addition, the Fund’s value investment style may go out of favor with investors, negatively affecting the Fund’s performance. If the Fund’s assessment of market conditions or a company’s value is inaccurate, the Fund could suffer losses or produce poor performance relative to other funds.
| 10. | Recent Regulatory Developments |
Effective January 24, 2023, the SEC adopted rule and form amendments to require mutual funds and ETFs to transmit concise and visually engaging streamlined annual and semiannual reports to shareholders that highlight key information deemed important for retail investors to assess and monitor their fund investments (the “Rule”). Other information, including financial statements, will no longer appear in the funds’ streamlined shareholder reports but must be available online, delivered free of charge upon request, and filed on a semiannual basis on Form N-CSR. The Rule and form amendments have a compliance date of July 24, 2024. At this time, management is evaluating the Rule and its impact to the Fund.
44
Report of Independent Registered Public Accounting Firm
To the Board of Trustees of Prudential Investment Portfolios 9 and Shareholders of PGIM Select Real Estate Fund
Opinion on the Financial Statements
We have audited the accompanying statement of assets and liabilities, including the schedule of investments, of PGIM Select Real Estate Fund (one of the funds constituting Prudential Investment Portfolios 9, referred to hereafter as the “Fund”) as of October 31, 2023, the related statement of operations for the year ended October 31, 2023, the statements of changes in net assets for each of the two years in the period ended October 31, 2023, including the related notes, and the financial highlights for each of the four years in the period ended October 31, 2023 (collectively referred to as the “financial statements”). In our opinion, the financial statements present fairly, in all material respects, the financial position of the Fund as of October 31, 2023, the results of its operations for the year then ended, the changes in its net assets for each of the two years in the period ended October 31, 2023 and the financial highlights for each of the four years in the period ended October 31, 2023 in conformity with accounting principles generally accepted in the United States of America.
The financial statements of the Fund as of and for the year ended October 31, 2019 and the financial highlights for the period ended October 31, 2019 (not presented herein, other than the financial highlights) were audited by other auditors whose report dated December 19, 2019 expressed an unqualified opinion on those financial statements and financial highlights.
Basis for Opinion
These financial statements are the responsibility of the Fund’s management. Our responsibility is to express an opinion on the Fund’s financial statements based on our audits. We are a public accounting firm registered with the Public Company Accounting Oversight Board (United States) (PCAOB) and are required to be independent with respect to the Fund in accordance with the U.S. federal securities laws and the applicable rules and regulations of the Securities and Exchange Commission and the PCAOB.
We conducted our audits of these financial statements in accordance with the standards of the PCAOB. Those standards require that we plan and perform the audit to obtain reasonable assurance about whether the financial statements are free of material misstatement, whether due to error or fraud.
Our audits included performing procedures to assess the risks of material misstatement of the financial statements, whether due to error or fraud, and performing procedures that respond to those risks. Such procedures included examining, on a test basis, evidence regarding the amounts and disclosures in the financial statements. Our audits also included evaluating the accounting principles used and significant estimates made by management, as well as evaluating the overall presentation of the financial statements. Our procedures included confirmation of securities owned as of October 31, 2023 by correspondence with the custodian, transfer agent and brokers; when replies were not received from brokers, we performed other auditing procedures. We believe that our audits provide a reasonable basis for our opinion.
/s/PricewaterhouseCoopers LLP
New York, New York
December 18, 2023
We have served as the auditor of one or more investment companies in the PGIM Retail Funds complex since 2020.
PGIM Select Real Estate Fund 45
Tax Information (unaudited)
For the year ended October 31, 2023, the Fund reports the maximum amount allowable under Section 854 of the Internal Revenue Code, but not less than 4.35% of the ordinary income dividends paid during the year as qualified dividend income.
In January 2024, you will be advised on IRS Form 1099-DIV or substitute 1099-DIV as to the federal tax status of the distributions received by you in calendar year 2023.
46
INFORMATION ABOUT BOARD MEMBERS AND OFFICERS (unaudited)
Information about Board Members and Officers of the Fund is set forth below. Board Members who are not deemed to be “interested persons” of the Fund, as defined in the 1940 Act, are referred to as “Independent Board Members.” Board Members who are deemed to be “interested persons” of the Fund are referred to as “Interested Board Members.” The Board Members are responsible for the overall supervision of the operations of the Fund and perform the various duties imposed on the directors of investment companies by the 1940 Act. The Board in turn elects the Officers, who are responsible for administering the day-to-day operations of the Fund.
| | | | | | |
| | |
Independent Board Members | | | | |
| | | | |
Name
Year of Birth
Position(s)
Portfolios Overseen | | Principal Occupation(s) During Past Five Years | | Other Directorships Held During Past Five Years | | Length of Board Service |
| | | | |
Ellen S. Alberding 1958 Board Member Portfolios Overseen: 100 | | Chief Executive Officer and President, The Joyce Foundation (charitable foundation) (since 2002); formerly Vice Chair, City Colleges of Chicago (community college system) (2011-2015); formerly Trustee, National Park Foundation (charitable foundation for national park system) (2009-2018); formerly Trustee, Economic Club of Chicago (2009-2016); Trustee, Loyola University (since 2018). | | None. | | Since September 2013 |
| | | | |
Kevin J. Bannon 1952 Board Member Portfolios Overseen: 101 | | Retired; formerly Managing Director (April 2008-May 2015) and Chief Investment Officer (October 2008-November 2013) of Highmount Capital LLC (registered investment adviser); formerly Executive Vice President and Chief Investment Officer (April 1993-August 2007) of Bank of New York Company; formerly President (May 2003-May 2007) of BNY Hamilton Family of Mutual Funds. | | Director of Urstadt Biddle Properties (equity real estate investment trust) (September 2008-August 2023). | | Since July 2008 |
PGIM Select Real Estate Fund
| | | | | | |
| | |
Independent Board Members | | | | |
| | | | |
Name
Year of Birth
Position(s)
Portfolios Overseen | | Principal Occupation(s) During Past Five Years | | Other Directorships Held During Past Five Years | | Length of Board Service |
| | | | |
Linda W. Bynoe 1952 Board Member Portfolios Overseen: 98 | | President and Chief Executive Officer (since March 1995) and formerly Chief Operating Officer (December 1989-February 1995) of Telemat Limited LLC (formerly Telemat Ltd) (management consulting); formerly Vice President (January 1985-June 1989) at Morgan Stanley & Co. (broker-dealer). | | Trustee of Equity Residential (residential real estate) (since December 2009); Director of Northern Trust Corporation (financial services) (since April 2006); formerly Director of Anixter International, Inc. (communication products distributor) (January 2006-June 2020). | | Since March 2005 |
| | | | |
Barry H. Evans 1960 Board Member Portfolios Overseen: 101 | | Retired; formerly President (2005-2016), Global Chief Operating Officer (2014-2016), Chief Investment Officer - Global Head of Fixed Income (1998-2014), and various portfolio manager roles (1986-2006), Manulife Asset Management (asset management). | | Formerly Director, Manulife Trust Company (2011-2018); formerly Director, Manulife Asset Management Limited (2015-2017); formerly Chairman of the Board of Directors of Manulife Asset Management U.S. (2005-2016); formerly Chairman of the Board, Declaration Investment Management and Research (2008-2016). | | Since September 2017 |
| | | | |
Keith F. Hartstein 1956 Board Member & Independent Chair Portfolios Overseen: 101 | | Retired; formerly Member (November 2014-September 2022) of the Governing Council of the Independent Directors Council (IDC) (organization of independent mutual fund directors); formerly Executive Committee of the IDC Board of Governors (October 2019-December 2021); formerly President and Chief Executive Officer (2005-2012), Senior Vice President (2004-2005), Senior Vice President of Sales and Marketing (1997-2004), and various executive management positions (1990-1997), John Hancock Funds, LLC (asset management); formerly Chairman, Investment Company Institute’s Sales Force Marketing Committee (2003-2008). | | None. | | Since September 2013 |
Visit our website at pgim.com/investments
| | | | | | |
| | |
Independent Board Members | | | | |
| | | | |
Name
Year of Birth
Position(s)
Portfolios Overseen | | Principal Occupation(s) During Past Five Years | | Other Directorships Held During Past Five Years | | Length of Board Service |
| | | | |
Laurie Simon Hodrick 1962 Board Member Portfolios Overseen: 98 | | A. Barton Hepburn Professor Emerita of Economics in the Faculty of Business, Columbia Business School (since 2018); Visiting Fellow at the Hoover Institution, Stanford University (since 2015); Sole Member, ReidCourt LLC (since 2008) (a consulting firm); formerly Visiting Professor of Law, Stanford Law School (2015-2021); formerly A. Barton Hepburn Professor of Economics in the Faculty of Business, Columbia Business School (1996-2017); formerly Managing Director, Global Head of Alternative Investment Strategies, Deutsche Bank (2006-2008). | | Independent Director, Andela (since January 2022) (global talent network); Independent Director, Roku (since December 2020) (communication services); formerly Independent Director, Synnex Corporation (2019-2021) (information technology); formerly Independent Director, Kabbage, Inc. (2018-2020) (financial services); formerly Independent Director, Corporate Capital Trust (2017-2018) (a business development company). | | Since September 2017 |
| | | | |
Brian K. Reid 1961 Board Member Portfolios Overseen: 101 | | Retired; formerly Chief Economist for the Investment Company Institute (ICI) (2005-2017); formerly Senior Economist and Director of Industry and Financial Analysis at the ICI (1998-2004); formerly Senior Economist, Industry and Financial Analysis at the ICI (1996-1998); formerly Staff Economist at the Federal Reserve Board (1989-1996); formerly Director, ICI Mutual Insurance Company (2012-2017). | | None. | | Since March 2018 |
PGIM Select Real Estate Fund
| | | | | | |
| | |
Independent Board Members | | | | |
| | | | |
Name
Year of Birth
Position(s)
Portfolios Overseen | | Principal Occupation(s) During Past Five Years | | Other Directorships Held During Past Five Years | | Length of Board Service |
| | | | |
Grace C. Torres 1959 Board Member Portfolios Overseen: 101 | | Retired; formerly Treasurer and Principal Financial and Accounting Officer of the PGIM Funds, Target Funds, Advanced Series Trust, Prudential Variable Contract Accounts and The Prudential Series Fund (1998-June 2014); Assistant Treasurer (March 1999-June 2014) and Senior Vice President (September 1999-June 2014) of PGIM Investments LLC; Assistant Treasurer (May 2003-June 2014) and Vice President (June 2005-June 2014) of AST Investment Services, Inc.; Senior Vice President and Assistant Treasurer (May 2003-June 2014) of Prudential Annuities Advisory Services, Inc. | | Director (since January 2018) of OceanFirst Financial Corp. and OceanFirst Bank; formerly Director (July 2015-January 2018) of Sun Bancorp, Inc. N.A. and Sun National Bank. | | Since November 2014 |
Visit our website at pgim.com/investments
| | | | | | |
| | |
Interested Board Members | | | | |
| | | | |
Name
Year of Birth
Position(s)
Portfolios Overseen | | Principal Occupation(s) During Past Five Years | | Other Directorships Held During Past Five Years | | Length of Board Service |
| | | | |
Stuart S. Parker 1962 Board Member & President Portfolios Overseen: 101 | | President, Chief Executive Officer, Chief Operating Officer and Officer in Charge of PGIM Investments LLC (formerly known as Prudential Investments LLC) (since January 2012); President and Principal Executive Officer (“PEO”) (since December 2023) of the PGIM Credit Income Fund; President and PEO (since September 2022) of the PGIM Private Credit Fund; President and PEO (since March 2022) of the PGIM Private Real Estate Fund, Inc.; formerly Executive Vice President of Jennison Associates LLC and Head of Retail Distribution of PGIM Investments LLC (June 2005-December 2011); Investment Company Institute - Board of Governors (since May 2012). | | None. | | Since January 2012 |
| | | | |
Scott E. Benjamin 1973 Board Member & Vice President Portfolios Overseen: 101 | | Executive Vice President (since May 2009) of PGIM Investments LLC; Vice President (since June 2012) of Prudential Investment Management Services LLC; Executive Vice President (since September 2009) of AST Investment Services, Inc.; Senior Vice President of Product Development and Marketing, PGIM Investments (since February 2006); Vice President (since December 2023) of the PGIM Credit Income Fund; Vice President (since September 2022) of the PGIM Private Credit Fund; Vice President (since March 2022) of the PGIM Private Real Estate Fund, Inc.; formerly Vice President of Product Development and Product Management, PGIM Investments LLC (2003-2006). | | None. | | Since March 2010 |
PGIM Select Real Estate Fund
| | | | |
| | |
Fund Officers(a) | | | | |
| | | |
Name
Year of Birth
Fund Position | | Principal Occupation(s) During Past Five Years | | Length of Service as Fund Officer |
| | | |
Claudia DiGiacomo 1974 Chief Legal Officer | | Chief Legal Officer (since December 2023) of the PGIM Credit Income Fund; Chief Legal Officer (since September 2022) of the PGIM Private Credit Fund; Chief Legal Officer (since July 2022) of the PGIM Private Real Estate Fund, Inc.; Chief Legal Officer, Executive Vice President and Secretary of PGIM Investments LLC (since August 2020); Chief Legal Officer of Prudential Mutual Fund Services LLC (since August 2020); Chief Legal Officer of PIFM Holdco, LLC (since August 2020); Vice President and Corporate Counsel (since January 2005) of Prudential; and Corporate Counsel of AST Investment Services, Inc. (since August 2020); formerly Vice President and Assistant Secretary of PGIM Investments LLC (2005-2020); formerly Associate at Sidley Austin Brown & Wood LLP (1999-2004). | | Since December 2005 |
| | | |
Andrew Donohue 1972 Chief Compliance Officer | | Chief Compliance Officer (since May 2023) of the PGIM Funds, Target Funds, PGIM ETF Trust, PGIM Global High Yield Fund, Inc., PGIM High Yield Bond Fund, Inc., PGIM Short Duration High Yield Opportunities Fund, Advanced Series Trust, The Prudential Series Fund, Prudential’s Gibraltar Fund, Inc., PGIM Private Credit Fund, PGIM Private Real Estate Fund, Inc.; Chief Compliance Officer of AST Investment Services, Inc. (since October 2022); Vice President, Chief Compliance Officer of PGIM Investments LLC (since September 2022); Chief Compliance Officer (since December 2023) of the PGIM Credit Income Fund; formerly various senior compliance roles within Principal Global Investors, LLC., global asset management for Principal Financial (2011-2022), most recently as Global Chief Compliance Officer (2016-2022). | | Since May 2023 |
| | | |
Andrew R. French 1962 Secretary | | Vice President (since December 2018) of PGIM Investments LLC; Secretary (since December 2023) of the PGIM Credit Income Fund; Secretary (since September 2022) of the PGIM Private Credit Fund; Secretary (since March 2022) of the PGIM Private Real Estate Fund, Inc.; formerly Vice President and Corporate Counsel (2010-2018) of Prudential; formerly Director and Corporate Counsel (2006-2010) of Prudential; Vice President and Assistant Secretary (since January 2007) of PGIM Investments LLC; Vice President and Assistant Secretary (since January 2007) of Prudential Mutual Fund Services LLC. | | Since October 2006 |
Visit our website at pgim.com/investments
| | | | |
| | |
Fund Officers(a) | | | | |
| | | |
Name
Year of Birth
Fund Position | | Principal Occupation(s) During Past Five Years | | Length of Service as Fund Officer |
| | | |
Melissa Gonzalez 1980 Assistant Secretary | | Vice President and Corporate Counsel (since September 2018) of Prudential; Vice President and Assistant Secretary (since August 2020) of PGIM Investments LLC; Assistant Secretary (since December 2023) of the PGIM Credit Income Fund; Assistant Secretary (since September 2022) of the PGIM Private Credit Fund; Assistant Secretary (since March 2022) of the PGIM Private Real Estate Fund, Inc.; formerly Director and Corporate Counsel (March 2014-September 2018) of Prudential. | | Since March 2020 |
| | | |
Patrick E. McGuinness 1986 Assistant Secretary | | Vice President and Assistant Secretary (since August 2020) of PGIM Investments LLC; Director and Corporate Counsel (since February 2017) of Prudential; Assistant Secretary (since December 2023) of the PGIM Credit Income Fund; Assistant Secretary (since September 2022) of the PGIM Private Credit Fund; Assistant Secretary (since March 2022) of the PGIM Private Real Estate Fund, Inc. | | Since June 2020 |
| | | |
Debra Rubano 1975 Assistant Secretary | | Vice President and Corporate Counsel (since November 2020) of Prudential; Assistant Secretary (since December 2023) of the PGIM Credit Income Fund; Assistant Secretary (since September 2022) of the PGIM Private Credit Fund; Assistant Secretary (since March 2022) of the PGIM Private Real Estate Fund, Inc; formerly Director and Senior Counsel of Allianz Global Investors U.S. Holdings LLC (2010-2020) and Assistant Secretary of numerous funds in the Allianz fund complex (2015-2020). | | Since December 2020 |
| | | |
George Hoyt 1965 Assistant Secretary | | Vice President and Corporate Counsel of Prudential (since September 2023); formerly Associate General Counsel of Franklin Templeton and Secretary and Chief Legal Officer of certain funds in the Franklin Templeton complex (2020- 2023) and Managing Director (2016-2020) and Associate General Counsel for Legg Mason, Inc. and its predecessors (2004-2020). | | Since December 2023 |
| | | |
Devan Goolsby 1991 Assistant Secretary | | Vice President and Corporate Counsel of Prudential (since May 2023); formerly Associate at Eversheds Sutherland (US) LLP (2021-2023); Compliance Officer at Bloomberg LP (2019-2021); and an Examiner at the Financial Industry Regulatory Authority (2015-2019). | | Since December 2023 |
| | | |
Kelly A. Coyne 1968 Assistant Secretary | | Director, Investment Operations of Prudential Mutual Fund Services LLC (since 2010); Assistant Secretary (since December 2023) of the PGIM Credit Income Fund; Assistant Secretary (since September 2022) of the PGIM Private Credit Fund; Assistant Secretary (since March 2022) of the PGIM Private Real Estate Fund, Inc. | | Since March 2015 |
PGIM Select Real Estate Fund
| | | | |
| | |
Fund Officers(a) | | | | |
| | | |
Name
Year of Birth
Fund Position | | Principal Occupation(s) During Past Five Years | | Length of Service as Fund Officer |
| | | |
Christian J. Kelly 1975 Chief Financial Officer | | Vice President, Global Head of Fund Administration of PGIM Investments LLC (since November 2018); Chief Financial Officer (since March 2023) of PGIM Investments mutual funds, closed end funds and ETFs, Advanced Series Trust Portfolios, Prudential Series Funds and Prudential Gibraltar Fund; Chief Financial Officer (since December 2023) of the PGIM Credit Income Fund; Chief Financial Officer of PGIM Private Credit Fund (since September 2022); Chief Financial Officer of PGIM Private Real Estate Fund, Inc. (since July 2022); formerly Treasurer and Principal Financial Officer (January 2019- March 2023) of PGIM Investments mutual funds, closed end funds and ETFs, Advanced Series Trust Portfolios, Prudential Series Funds and Prudential Gibraltar Fund; formerly Treasurer and Principal Financial Officer (March 2022 – July 2022) of the PGIM Private Real Estate Fund, Inc.; formerly Director of Fund Administration of Lord Abbett & Co. LLC (2009-2018), Treasurer and Principal Accounting Officer of the Lord Abbett Family of Funds (2017-2018); Director of Accounting, Avenue Capital Group (2008-2009); Senior Manager, Investment Management Practice of Deloitte & Touche LLP (1998-2007). | | Since January 2019 |
| | | |
Russ Shupak 1973 Treasurer and Principal Accounting Officer | | Vice President (since 2017) within PGIM Investments Fund Administration; Treasurer and Principal Accounting Officer of PGIM Investments mutual funds, closed end funds and ETFs (since March 2023); Treasurer and Principal Accounting Officer (since December 2023) of the PGIM Credit Income Fund; Treasurer and Principal Accounting Officer (since July 2022) of the PGIM Private Real Estate Fund, Inc.; Assistant Treasurer (since September 2022) of the PGIM Private Credit Fund; formerly Assistant Treasurer (March 2022 – July 2022) of the PGIM Private Real Estate Fund, Inc.; Assistant Treasurer of Advanced Series Trust Portfolios, Prudential Series Funds and Prudential Gibraltar Fund (since October 2019); formerly Director (2013-2017) within PGIM Investments Fund Administration. | | Since October 2019 |
| | | |
Lana Lomuti 1967 Assistant Treasurer | | Vice President (since 2007) within PGIM Investments Fund Administration; formerly Assistant Treasurer (December 2007-February 2014) of The Greater China Fund, Inc.; formerly Director (2005-2007) within PGIM Investments Fund Administration. | | Since April 2014 |
| | | |
Deborah Conway 1969 Assistant Treasurer | | Vice President (since 2017) within PGIM Investments Fund Administration; formerly Director (2007-2017) within PGIM Investments Fund Administration. | | Since October 2019 |
Visit our website at pgim.com/investments
| | | | |
| | |
Fund Officers(a) | | | | |
| | | |
Name
Year of Birth
Fund Position | | Principal Occupation(s) During Past Five Years | | Length of Service as Fund Officer |
| | | |
Elyse M. McLaughlin 1974 Assistant Treasurer | | Vice President (since 2017) within PGIM Investments Fund Administration; Treasurer and Principal Accounting Officer of the Advanced Series Trust, the Prudential Series Fund and the Prudential Gibraltar Fund (since March 2023); Assistant Treasurer (since December 2023) of the PGIM Credit Income Fund; Treasurer and Principal Accounting Officer (since September 2022) of the PGIM Private Credit Fund; Assistant Treasurer (since March 2022) of the PGIM Private Real Estate Fund, Inc.; Assistant Treasurer of PGIM Investments mutual funds, closed end funds and ETFs (since October 2019); formerly Director (2011-2017) within PGIM Investments Fund Administration. | | Since October 2019 |
| | | |
Robert W. McCormack 1973 Assistant Treasurer | | Vice President (since 2019) within PGIM Investments Fund Administration; Assistant Treasurer (since March 2023) of PGIM Investments mutual funds, closed end funds, ETFs, Advanced Series Trust Portfolios, Prudential Series Funds and Prudential Gibraltar Fund; Assistant Treasurer (since December 2023) of the PGIM Credit Income Fund; Assistant Treasurer (since September 2022) of the PGIM Private Credit Fund; Assistant Treasurer (since March 2022) of the PGIM Private Real Estate Fund, Inc.; formerly Director (2016-2019) within PGIM Investments Fund Administration; formerly Vice President within Goldman, Sachs & Co. Investment Management Controllers (2008-2016), Assistant Treasurer of Goldman Sachs Family of Funds (2015-2016). | | Since March 2023 |
| | | |
Kelly Florio 1978 Anti-Money Laundering Compliance Officer | | Vice President, Corporate Compliance, Global Compliance Programs and Compliance Risk Management (since December 2021) of Prudential; formerly Head of Fraud Risk Management (October 2019-December 2021) at New York Life Insurance Company; formerly Head of Key Risk Area Operations (November 2018-October 2019), Director of the US Anti-Money Laundering Compliance Unit (2009-2018) and Bank Loss Prevention Associate (2006-2009) at MetLife. | | Since June 2022 |
(a) Excludes Mr. Parker and Mr. Benjamin, interested Board Members who also serve as President and Vice President, respectively.
Explanatory Notes to Tables:
| ∎ | | Board Members are deemed to be “Interested,” as defined in the 1940 Act, by reason of their affiliation with PGIM Investments LLC and/or an affiliate of PGIM Investments LLC. |
| ∎ | | Unless otherwise noted, the address of all Board Members and Officers is c/o PGIM Investments LLC, 655 Broad Street, Newark, New Jersey 07102-4410. |
| ∎ | | There is no set term of office for Board Members or Officers. The Board Members have adopted a retirement policy, which calls for the retirement of Board Members on December 31 of the year in which they reach the age of 75. |
| ∎ | | “Other Directorships Held” includes all directorships of companies required to register or file reports with the SEC under the 1934 Act (that is, “public companies”) or other investment companies registered under the 1940 Act. |
PGIM Select Real Estate Fund
| ∎ | | “Portfolios Overseen” includes such applicable investment companies managed by PGIM Investments LLC and overseen by the Board Member. The investment companies for which PGIM Investments LLC serves as manager include the PGIM Mutual Funds, Target Funds, PGIM ETF Trust, PGIM Private Real Estate Fund, Inc., PGIM Private Credit Fund, PGIM Credit Income Fund, PGIM High Yield Bond Fund, Inc., PGIM Global High Yield Fund, Inc., PGIM Short Duration High Yield Opportunities Fund, The Prudential Series Fund, Prudential’s Gibraltar Fund, Inc. and the Advanced Series Trust. |
| ∎ | | As used in the Fund Officers table “Prudential” means The Prudential Insurance Company of America. |
Visit our website at pgim.com/investments
Approval of Advisory Agreements (unaudited)
The Fund’s Board of Trustees
The Board of Trustees (the “Board”) of PGIM Select Real Estate Fund (the “Fund”)1 consists of ten individuals, eight of whom are not “interested persons” of the Fund, as defined in the Investment Company Act of 1940, as amended (the “1940 Act”) (the “Independent Trustees”). The Board is responsible for the oversight of the Fund and its operations, and performs the various duties imposed on the directors of investment companies by the 1940 Act. The Independent Trustees have retained independent legal counsel to assist them in connection with their duties. The Chair of the Board is an Independent Trustee. The Board has established five standing committees: the Audit Committee, the Nominating and Governance Committee, the Compliance Committee and two Investment Committees. Each committee is chaired by, and composed of, Independent Trustees.
Annual Approval of the Fund’s Advisory Agreements
As required under the 1940 Act, the Board determines annually whether to renew the Fund’s management agreement with PGIM Investments LLC (“PGIM Investments”) and the Fund’s subadvisory agreement with PGIM, Inc. (“PGIM”) on behalf of its PGIM Real Estate unit (“PGIM Real Estate”), and PGIM Real Estate (UK) Limited (“PGIM RE (UK)”). In considering the renewal of the agreements, the Board, including all of the Independent Trustees, met on May 25 and June 6-8, 2023 (the “Board Meeting”) and approved the renewal of the agreements through July 31, 2024, after concluding that the renewal of the agreements was in the best interests of the Fund and its shareholders.
In advance of the meetings, the Board requested and received materials relating to the agreements, and had the opportunity to ask questions and request further information in connection with its consideration. Among other things, the Board considered comparative fee information from PGIM Investments, PGIM and PGIM RE (UK). Also, the Board considered comparisons with other mutual funds in relevant Peer Universes and Peer Groups, as is further discussed below.
In approving the agreements, the Board, including the Independent Trustees advised by independent legal counsel, considered the factors it deemed relevant, including the nature, quality and extent of services provided by PGIM Investments and the subadvisers, the performance of the Fund, the profitability of PGIM Investments and its affiliates, expenses and fees, and the potential for economies of scale that may be shared with the Fund and its shareholders as the Fund’s assets grow. In their deliberations, the Trustees did not identify any single factor which alone was responsible for the Board’s decision to approve the agreements with respect to the Fund. In connection with its deliberations, the Board considered information provided by PGIM Investments throughout the year at regular Board meetings, presentations from portfolio managers and other information, as well as information furnished at or in advance of the Board Meeting.
1PGIM Select Real Estate Fund is a series of Prudential Investment Portfolios 9.
PGIM Select Real Estate Fund
Approval of Advisory Agreements (continued)
The Trustees determined that the overall arrangements between the Fund and PGIM Investments, which serves as the Fund’s investment manager pursuant to a management agreement, and between PGIM Investments and each of PGIM, which, through its PGIM Real Estate unit, and PGIM RE (UK), serve as the Fund’s subadvisers pursuant to the terms of a subadvisory agreement with PGIM Investments, are in the best interests of the Fund and its shareholders in light of the services performed, fees charged and such other matters as the Trustees considered relevant in the exercise of their business judgment.
The material factors and conclusions that formed the basis for the Trustees’ reaching their determinations to approve the continuance of the agreements are separately discussed below.
Nature, Quality and Extent of Services
The Board received and considered information regarding the nature, quality and extent of services provided to the Fund by PGIM Investments, PGIM Real Estate and PGIM RE (UK). The Board noted that PGIM Real Estate and PGIM RE (UK) are affiliated with PGIM Investments. The Board considered the services provided by PGIM Investments, including but not limited to the oversight of the subadvisers for the Fund, as well as the provision of fund recordkeeping, compliance and other services to the Fund, and PGIM Investments’ role as the administrator for the Fund’s liquidity risk management program. With respect to PGIM Investments’ oversight of the subadvisers, the Board noted that PGIM Investments’ Strategic Investment Research Group (“SIRG”), which is a business unit of PGIM Investments, is responsible for monitoring and reporting to PGIM Investments’ senior management on the performance and operations of the subadvisers. The Board also considered that PGIM Investments pays the salaries of all of the officers and interested Trustees of the Fund who are part of Fund management. The Board also considered the investment subadvisory services provided by PGIM Real Estate and PGIM RE (UK), including investment research and security selection, as well as adherence to the Fund’s investment restrictions and compliance with applicable Fund policies and procedures. The Board considered PGIM Investments’ evaluation of the subadvisers, as well as PGIM Investments’ recommendation, based on its review of the subadvisers, to renew the subadvisory agreement.
The Board considered the qualifications, backgrounds and responsibilities of PGIM Investments’ senior management responsible for the oversight of the Fund, PGIM Real Estate and PGIM RE (UK), and also considered the qualifications, backgrounds and responsibilities of the PGIM Real Estate and PGIM RE (UK) portfolio managers who are responsible for the day-to-day management of the Fund’s portfolio. The Board was provided with information pertaining to PGIM Investments’, PGIM Real Estate’s, PGIM’s and PGIM RE (UK)’s organizational structure, senior management, investment operations, and other relevant information pertaining to PGIM Investments, PGIM Real Estate, PGIM and PGIM RE (UK). The Board also noted that it received favorable
Visit our website at pgim.com/investments
compliance reports from the Fund’s Chief Compliance Officer (“CCO”) as to PGIM Investments, PGIM Real Estate, PGIM and PGIM RE (UK).
The Board concluded that it was satisfied with the nature, extent and quality of the investment management services provided by PGIM Investments and the subadvisory services provided to the Fund by PGIM Real Estate and PGIM RE (UK), and that there was a reasonable basis on which to conclude that the Fund benefits from the services provided by PGIM Investments, PGIM Real Estate and PGIM RE (UK) under the management and subadvisory agreements.
Costs of Services and Profits Realized by PGIM Investments
The Board was provided with information on the profitability of PGIM Investments and its affiliates in serving as the Fund’s investment manager. The Board discussed with PGIM Investments the methodology utilized in assembling the information regarding profitability and considered its reasonableness. The Board recognized that it is difficult to make comparisons of profitability from fund management contracts because comparative information is not generally publicly available and is affected by numerous factors, including the structure of the particular adviser, the types of funds it manages, its business mix, numerous assumptions regarding allocations and the adviser’s capital structure and cost of capital. Taking these factors into account, the Board concluded that the profitability of PGIM Investments and its affiliates in relation to the services rendered was not unreasonable.
Economies of Scale
The Board received and discussed information concerning economies of scale that PGIM Investments may realize as the Fund’s assets grow beyond current levels. The Board noted that the management fee schedule for the Fund includes breakpoints, which have the effect of decreasing the fee rate as assets increase. During the course of time, the Board has considered information regarding the launch date of the Fund, the management fees of the Fund compared to those of similarly managed funds and PGIM Investments’ investment in the Fund over time. The Board noted that economies of scale, can be shared with the Fund in other ways, including low management fees from inception, additional technological and personnel investments to enhance shareholder services, and maintaining existing expense structures in the face of a rising cost environment. The Board also considered PGIM Investments’ assertion that it continually evaluates the management fee schedule of the Fund and the potential to share economies of scale through breakpoints or fee waivers as asset levels increase.
The Board recognized the inherent limitations of any analysis of economies of scale, stemming largely from the Board’s understanding that most of PGIM Investments’ costs are not specific to individual funds, but rather are incurred across a variety of products and services.
PGIM Select Real Estate Fund
Approval of Advisory Agreements (continued)
Other Benefits to PGIM Investments, PGIM Real Estate and PGIM RE (UK)
The Board considered potential ancillary benefits that might be received by PGIM Investments, PGIM Real Estate, PGIM RE (UK) and their affiliates as a result of their relationship with the Fund. The Board concluded that potential benefits to be derived by PGIM Investments included transfer agency fees received by the Fund’s transfer agent (which is affiliated with PGIM Investments), and benefits to its reputation as well as other intangible benefits resulting from PGIM Investments’ association with the Fund. The Board concluded that the potential benefits to be derived by PGIM Real Estate and PGIM RE (UK) included their ability to use soft dollar credits, as well as the potential benefits consistent with those generally resulting from an increase in assets under management, specifically, potential access to additional research resources and benefits to its reputation. The Board concluded that the benefits derived by PGIM Investments, PGIM Real Estate and PGIM RE (UK) were consistent with the types of benefits generally derived by investment managers and subadvisers to mutual funds.
Performance of the Fund /Fees and Expenses
The Board considered certain additional factors and made related conclusions relating to the historical performance of the Fund for the one-, three- and five-year periods ended December 31, 2022. The Board considered that the Fund commenced investment operations on August 1, 2014 and that longer-term performance was not yet available.
The Board also considered the Fund’s actual management fee, as well as the Fund’s net total expense ratio, for the fiscal year ended October 31, 2022. The Board considered the management fee for the Fund as compared to the management fee charged by PGIM Investments to other funds and the fee charged by other advisers to comparable mutual funds in a Peer Group. The actual management fee represents the fee rate actually paid by Fund shareholders and includes any fee waivers or reimbursements. The net total expense ratio for the Fund represents the actual expense ratio incurred by Fund shareholders.
The mutual funds included in the Peer Universe, which was used to consider performance, and the Peer Group, which was used to consider expenses and fees, were objectively determined by Broadridge, an independent provider of mutual fund data. In certain circumstances, PGIM Investments also provided supplemental Peer Universe or Peer Group information for reasons addressed with the Board. The comparisons placed the Fund in various quartiles over various periods, with the first quartile being the best 25% of the mutual funds (for performance, the best performing mutual funds and, for expenses, the lowest cost mutual funds).
The section below summarizes key factors considered by the Board and the Board’s conclusions regarding the Fund’s performance, fees and overall expenses. The table sets forth net performance comparisons (which reflect the impact on performance of fund expenses, or any subsidies, expense caps or waivers that may be applicable) with the Peer Universe, actual management fees with the Peer Group (which reflect the
Visit our website at pgim.com/investments
impact of any subsidies or fee waivers), and net total expenses with the Peer Group, each of which were key factors considered by the Board.
| | | | | | | | |
| Net Performance | | 1 Year | | 3 Years | | 5 Years | | 10 Years |
| | 3rd Quartile | | 1st Quartile | | 1st Quartile | | N/A |
Actual Management Fees: 3rd Quartile | | | | | | |
Net Total Expenses: 2nd Quartile | | | | | | |
| | · | | The Board noted that the Fund outperformed its benchmark index over the three- and five-year periods and underperformed over the one-year period. |
| | · | | The Board and PGIM Investments agreed to retain the existing contractual expense cap that (exclusive of certain fees and expenses) caps total annual operating expenses at 1.30% for Class A shares, 2.05% for Class C shares, 1.05% for Class R6 shares, and 1.05% for Class Z shares through February 29, 2024. |
| | · | | In addition, PGIM Investments will waive management fees or shared operating expenses on any share class to the same extent that it waives such expenses on any other share class and has agreed that total annual fund operating expenses for Class R6 shares will not exceed total annual fund operating expenses for Class Z shares. |
| | · | | The Board concluded that, in light of the above, it would be in the best interests of the Fund and its shareholders to renew the agreements. |
| | · | | The Board concluded that the management fees (including subadvisory fees) and total expenses were reasonable in light of the services provided. |
* * *
After full consideration of these factors, the Board concluded that the approval of the agreements was in the best interests of the Fund and its shareholders.
PGIM Select Real Estate Fund
| | | | |
| | | |
∎ MAIL 655 Broad Street Newark, NJ 07102 | | ∎ TELEPHONE (800) 225-1852 | | ∎ WEBSITE pgim.com/investments |
PROXY VOTING
The Board of Trustees of the Fund has delegated to the Fund’s subadvisers the responsibility for voting any proxies and maintaining proxy recordkeeping with respect to the Fund. A description of these proxy voting policies and procedures is available without charge, upon request, by calling (800) 225-1852 or by visiting the Securities and Exchange Commission’s website at sec.gov. Information regarding how the Fund voted proxies relating to portfolio securities during the most recent 12-month period ended June 30 is available on the Fund’s website and on the Securities and Exchange Commission’s website.
TRUSTEES
Ellen S. Alberding · Kevin J. Bannon · Scott E. Benjamin · Linda W. Bynoe · Barry H. Evans · Keith F. Hartstein · Laurie Simon Hodrick · Stuart S. Parker · Brian K. Reid · Grace C. Torres
OFFICERS
Stuart S. Parker, President · Scott E. Benjamin, Vice President · Christian J. Kelly, Chief Financial Officer · Claudia DiGiacomo, Chief Legal Officer · Andrew Donohue, Chief Compliance Officer · Russ Shupak, Treasurer and Principal Accounting Officer · Kelly Florio, Anti-Money Laundering Compliance Officer · Andrew R. French, Secretary · Melissa Gonzalez, Assistant Secretary · Kelly A. Coyne, Assistant Secretary · Patrick E. McGuinness, Assistant Secretary · Debra Rubano, Assistant Secretary · George Hoyt, Assistant Secretary · Devan Goolsby, Assistant Secretary · Lana Lomuti, Assistant Treasurer · Elyse M. McLaughlin, Assistant Treasurer · Deborah Conway, Assistant Treasurer · Robert W. McCormack, Assistant Treasurer
| | | | |
| | |
MANAGER | | PGIM Investments LLC | | 655 Broad Street Newark, NJ 07102 |
| | |
SUBADVISERS | | PGIM Real Estate | | 655 Broad Street 14th Floor Newark, NJ 07102 |
| | |
| | | PGIM Real Estate (UK) Limited | | Grand Buildings, 1-3 Strand Trafalgar Square London, WC2N 5HR United Kingdom |
| | |
DISTRIBUTOR | | Prudential Investment Management Services LLC | | 655 Broad Street Newark, NJ 07102 |
| | |
CUSTODIAN | | The Bank of New York Mellon | | 240 Greenwich Street New York, NY 10286 |
| | |
| TRANSFER AGENT | | Prudential Mutual Fund Services LLC | | PO Box 534432 Pittsburgh, PA 15253 |
| | |
INDEPENDENT REGISTERED PUBLIC ACCOUNTING FIRM | | PricewaterhouseCoopers LLP | | 300 Madison Avenue New York, NY 10017 |
| | |
FUND COUNSEL | | Willkie Farr &Gallagher LLP | | 787 Seventh Avenue New York, NY 10019 |
An investor should consider the investment objectives, risks, charges, and expenses of the Fund carefully before investing. The prospectus and summary prospectus contain this and other information about the Fund. An investor may obtain the prospectus and summary prospectus by visiting our website at pgim.com/investments or by calling (800) 225-1852. The prospectus and summary prospectus should be read carefully before investing.
E-DELIVERY
To receive your mutual fund documents online, go to pgim.com/investments/resource/edelivery and enroll. Instead of receiving printed documents by mail, you will receive notification via email when new materials are available. You can cancel your enrollment or change your email address at any time by visiting the website address above.
SHAREHOLDER COMMUNICATIONS WITH TRUSTEES
Shareholders can communicate directly with the Board of Trustees by writing to the Chair of the Board, PGIM Select Real Estate Fund, PGIM Investments, Attn: Board of Trustees, 655 Broad Street, Newark, NJ 07102. Shareholders can communicate directly with an individual Trustee by writing to that Trustee at the same address. Communications are not screened before being delivered to the addressee.
AVAILABILITY OF PORTFOLIO HOLDINGS
The Fund files its complete schedule of portfolio holdings with the Securities and Exchange Commission for the first and third quarters of each fiscal year as an exhibit to its reports on Form N-PORT. The Fund’s Form N-PORT filings are available on the Commission’s website at sec.gov.
The Fund’s Statement of Additional Information contains additional information about the Fund’s Trustees and is available without charge, upon request, by calling (800) 225-1852.
Mutual Funds:
| | | | |
| | | |
ARE NOT INSURED BY THE FDIC OR ANY FEDERAL GOVERNMENT AGENCY | | MAY LOSE VALUE | | ARE NOT A DEPOSIT OF OR GUARANTEED BY ANY BANK OR ANY BANK AFFILIATE |
PGIM SELECT REAL ESTATE FUND
| | | | | | | | |
SHARE CLASS | | A | | C | | Z | | R6 |
| | | | |
NASDAQ | | SREAX | | SRECX | | SREZX | | SREQX |
| | | | |
CUSIP | | 74441J811 | | 74441J795 | | 74441J779 | | 74441J787 |
MF223E
Item 2 – Code of Ethics — See Exhibit (a)
As of the end of the period covered by this report, the registrant has adopted a code of ethics (the “Section 406 Standards for Investment Companies – Ethical Standards for Principal Executive and Financial Officers”) that applies to the registrant’s Principal Executive Officer and Principal Financial Officer; the registrant’s Principal Financial Officer also serves as the Principal Accounting Officer.
The registrant hereby undertakes to provide any person, without charge, upon request, a copy of the code of ethics. To request a copy of the code of ethics, contact the registrant 800-225-1852, and ask for a copy of the Section 406 Standards for Investment Companies - Ethical Standards for Principal Executive and Financial Officers.
Item 3 – Audit Committee Financial Expert –
The registrant’s Board has determined that Ms. Grace C. Torres, member of the Board’s Audit Committee is an “audit committee financial expert,” and that she is “independent,” for purposes of this item.
Item 4 – Principal Accountant Fees and Services –
(a) Audit Fees
For the fiscal years ended October 31, 2023 and October 31, 2022, PricewaterhouseCoopers LLP (“PwC”), the Registrant’s principal accountant, billed the Registrant $161,544 and $206,750, respectively, for professional services rendered for the audit of the Registrant’s annual financial statements or services that are normally provided in connection with statutory and regulatory filings.
(b) Audit-Related Fees
For the fiscal years ended October 31, 2023 and October 31, 2022: none.
(c) Tax Fees
For the fiscal years ended October 31, 2023 and October 31, 2022: none.
(d) All Other Fees
For the fiscal years ended October 31, 2023 and October 31, 2022: none.
(e) (1) Audit Committee Pre-Approval Policies and Procedures
THE PGIM MUTUAL FUNDS
AUDIT COMMITTEE POLICY
on
Pre-Approval of Services Provided by the Independent Accountants
The Audit Committee of each PGIM Mutual Fund is charged with the responsibility to monitor the independence of the Fund’s independent accountants. As part of this responsibility, the Audit Committee must pre-approve the independent accounting firm’s engagement to render audit and/or permissible non-audit services, as required by law. In evaluating a proposed engagement of the independent accountants, the Audit Committee will assess the effect that the engagement might reasonably be expected to have on the accountant’s independence. The Committee’s evaluation will be based on:
| | • | | a review of the nature of the professional services expected to be provided, |
| | • | | a review of the safeguards put into place by the accounting firm to safeguard independence, and |
| | • | | periodic meetings with the accounting firm. |
Policy for Audit and Non-Audit Services Provided to the Funds
On an annual basis, the scope of audits for each Fund, audit fees and expenses, and audit-related and non-audit services (and fees proposed in respect thereof) proposed to be performed by the Fund’s independent accountants will be presented by the Treasurer and the independent accountants to the Audit Committee for review and, as appropriate, approval prior to the initiation of such services.
Such presentation shall be accompanied by confirmation by both the Treasurer and the independent accountants that the proposed non-audit services will not adversely affect the independence of the independent accountants. Such proposed non-audit services shall be described in sufficient detail to enable the Audit Committee to assess the appropriateness of such services and fees, and the compatibility of the provision of such services with the auditor’s independence. The Committee shall receive periodic reports on the progress of the audit and other services which are approved by the Committee or by the Committee Chair pursuant to authority delegated in this Policy.
The categories of services enumerated under “Audit Services”, “Audit-related Services”, and “Tax Services” are intended to provide guidance to the Treasurer and the independent accountants as to those categories of services which the Committee believes are generally consistent with the independence of the independent accountants and which the Committee (or the Committee Chair) would expect upon the presentation of specific proposals to pre-approve. The enumerated categories are not intended as an exclusive list of audit, audit-related or tax services, which the Committee (or the Committee Chair) would consider for pre-approval.
Audit Services
The following categories of audit services are considered to be consistent with the role of the Fund’s independent accountants:
| | • | | Annual Fund financial statement audits |
| | • | | Seed audits (related to new product filings, as required) |
| | • | | SEC and regulatory filings and consents |
Audit-related Services
The following categories of audit-related services are considered to be consistent with the role of the Fund’s independent accountants:
| | • | | Accounting consultations |
| | • | | Fund merger support services |
| | • | | Agreed Upon Procedure Reports |
| | • | | Other Internal Control Reports |
Individual audit-related services that fall within one of these categories (except for fund merger support services) and are not presented to the Audit Committee as part of the annual pre-approval process are subject to an authorized pre-approval by the Audit Committee so long as the estimated fee for those services does not exceed $30,000. Any services provided under such pre-approval will be reported to the Audit Committee at its next regular meeting. Should the amount of such services exceed $30,000 any additional fees will be subject to pre-approval by the Committee Chair (or any other Committee member on whom this responsibility has been delegated). Fees related to fund merger support services are subject to a separate authorized
pre-approval by the Audit Committee with fees determined on a per occurrence and merger complexity basis.
Tax Services
The following categories of tax services are considered to be consistent with the role of the Fund’s independent accountants:
| | • | | Tax compliance services related to the filing or amendment of the following: |
| | • | | Federal, state and local income tax compliance; and, |
| | • | | Sales and use tax compliance |
| | • | | Timely RIC qualification reviews |
| | • | | Tax distribution analysis and planning |
| | • | | Tax authority examination services |
| | • | | Tax appeals support services |
| | • | | Accounting methods studies |
| | • | | Fund merger support services |
| | • | | Tax consulting services and related projects |
Individual tax services that fall within one of these categories and are not presented to the Audit Committee as part of the annual pre-approval process are subject to an authorized pre-approval by the Audit Committee so long as the estimated fee for those services does not exceed $30,000. Any services provided under such pre-approval will be reported to the Audit Committee at its next regular meeting. Should the amount of such services exceed $30,000 any additional fees will be subject to pre-approval by the Committee Chair (or any other Committee member on whom this responsibility has been delegated).
Other Non-Audit Services
Certain non-audit services that the independent accountants are legally permitted to render will be subject to pre-approval by the Committee or by one or more Committee members to whom the Committee has delegated this authority and who will report to the full Committee any pre-approval decisions made pursuant to this Policy. Non-audit services presented for pre-approval pursuant to this paragraph will be accompanied by a confirmation from both the Treasurer and the independent accountants that the proposed services will not adversely affect the independence of the independent accountants.
Proscribed Services
The Fund’s independent accountants will not render services in the following categories of non-audit services:
| | • | | Bookkeeping or other services related to the accounting records or financial statements of the Fund |
| | • | | Financial information systems design and implementation |
| | • | | Appraisal or valuation services, fairness opinions, or contribution-in-kind reports |
| | • | | Internal audit outsourcing services |
| | • | | Management functions or human resources |
| | • | | Broker or dealer, investment adviser, or investment banking services |
| | • | | Legal services and expert services unrelated to the audit |
| | • | | Any other service that the Public Company Accounting Oversight Board determines, by regulation, is impermissible. |
Pre-approval of Non-Audit Services Provided to Other Entities Within the PGIM Fund Complex
Certain non-audit services provided to PGIM Investments LLC or any of its affiliates that also provide ongoing services to the PGIM Mutual Funds will be subject to pre-approval by the Audit Committee. The only non-audit services provided to these entities that will require pre-approval are those related directly to the operations and financial reporting of the Funds.
Individual projects that are not presented to the Audit Committee as part of the annual pre-approval process will be subject to pre-approval by the Committee Chair (or any other Committee member on whom this responsibility has been delegated) so long as the estimated fee for those services does not exceed $30,000. Services presented for pre-approval pursuant to this paragraph will be accompanied by a confirmation from both the Treasurer and the independent accountants that the proposed services will not adversely affect the independence of the independent accountants.
Although the Audit Committee will not pre-approve all services provided to PGIM Investments LLC and its affiliates, the Committee will receive an annual report from the Fund’s independent accounting firm showing the aggregate fees for all services provided to PGIM Investments and its affiliates.
(e) (2) Percentage of services described in each of paragraphs (b) through (d) of this Item that were approved by the audit committee pursuant to paragraph (c)(7)(i)(C) of Rule 2-01 of Regulation S-X –
| | | | | | | | | | |
| | | | | Fiscal Year Ended October 31, 2023 | | | | Fiscal Year Ended October 31, 2022 | | |
| | 4(b) | | Not applicable. | | | | Not applicable. | | |
| | 4(c) | | Not applicable. | | | | Not applicable. | | |
| | 4(d) | | Not applicable. | | | | Not applicable. | | |
(f) Percentage of hours expended attributable to work performed by other than full time employees of principal accountant if greater than 50%.
The percentage of hours expended on the principal accountant’s engagement to audit the registrant’s financial statements for the most recent fiscal year that were attributed to work performed by persons other than the principal accountant’s full-time, permanent employees was 0%.
(g) Non-Audit Fees
The aggregate non-audit fees billed by the Registrant’s principal accountant for services rendered to the registrant’s investment adviser and any entity controlling, controlled by, or under common control with the investment adviser that provides ongoing services to the registrant for the fiscal years ended October 31, 2023 and October 31, 2022 was $0 and $0, respectively.
(h) Principal Accountant’s Independence
Not applicable as the Registrant’s principal accountant has not provided non-audit services to the registrant’s investment adviser and any entity controlling, controlled by, or under common control with the investment adviser that provides ongoing services to the registrant that were not pre-approved pursuant to Rule 2-01(c)(7)(ii) of Regulation S-X.
(i) Not applicable.
(j) Not applicable.
Item 5 – Audit Committee of Listed Registrants – Not applicable.
Item 6 – Schedule of Investments – The schedule is included as part of the report to shareholders filed under Item 1 of this Form.
Item 7 – Disclosure of Proxy Voting Policies and Procedures for Closed-End Management Investment Companies – Not applicable.
Item 8 – Portfolio Managers of Closed-End Management Investment Companies – Not applicable.
Item 9 – Purchases of Equity Securities by Closed-End Management Investment Company and Affiliated Purchasers – Not applicable.
Item 10 – Submission of Matters to a Vote of Security Holders – There have been no material changes to these procedures.
Item 11 – Controls and Procedures
| | (a) | It is the conclusion of the registrant’s principal executive officer and principal financial officer that the effectiveness of the registrant’s current disclosure controls and procedures (such disclosure controls and procedures having been evaluated within 90 days of the date of this filing) provide reasonable assurance that the information required to be disclosed by the registrant has been recorded, processed, summarized and reported within the time period specified in the Commission’s rules and forms and that the information required to be disclosed by the registrant has been accumulated and communicated to the registrant’s principal executive officer and principal financial officer in order to allow timely decisions regarding required disclosure. |
| | (b) | There has been no significant change in the registrant’s internal control over financial reporting (as defined in Rule 30a-3(d) under the Act (17 CFR 270.30a-3(d))) that occurred during the period covered by this report that has materially affected, or is reasonably likely to materially affect, the registrant’s internal control over financial reporting. |
Item 12 – Controls and Procedures - Disclosure of Securities Lending Activities for Closed-End Management Investment Companies – Not applicable.
Item 13 – Exhibits
(a)(1) Code of Ethics – Attached hereto as Exhibit EX-99.CODE-ETH.
(a)(2) Certifications pursuant to Section 302 of the Sarbanes-Oxley Act – Attached hereto as Exhibit EX-99.CERT.
(a)(2)(1) Any written solicitation to purchase securities under Rule 23c-1 – Not applicable.
(a)(2)(2) Change in the registrant’s independent public accountant – Not applicable.
(b) Certifications pursuant to Section 906 of the Sarbanes-Oxley Act – Attached hereto as Exhibit EX-99.906CERT.
SIGNATURES
Pursuant to the requirements of the Securities Exchange Act of 1934 and the Investment Company Act of 1940, the registrant has duly caused this report to be signed on its behalf by the undersigned, thereunto duly authorized.
| | |
| Registrant: | | Prudential Investment Portfolios 9 |
| |
| By: | | /s/ Andrew R. French |
| | Andrew R. French |
| | Secretary |
| |
| Date: | | December 19, 2023 |
Pursuant to the requirements of the Securities Exchange Act of 1934 and the Investment Company Act of 1940, this report has been signed below by the following persons on behalf of the registrant and in the capacities and on the dates indicated.
| | |
| |
| By: | | /s/ Stuart S. Parker |
| | Stuart S. Parker |
| | President and Principal Executive Officer |
| |
| Date: | | December 19, 2023 |
| |
| By: | | /s/ Christian J. Kelly |
| | Christian J. Kelly |
| | Chief Financial Officer (Principal Financial Officer) |
| |
| Date: | | December 19, 2023 |