UNITED STATES
SECURITIES AND EXCHANGE COMMISSION
Washington, D.C. 20549
FORM N-CSR
CERTIFIED SHAREHOLDER REPORT OF REGISTERED MANAGEMENT INVESTMENT COMPANIES
| Investment Company Act file number: | 811-09101 | |
| Exact name of registrant as specified in charter: | Prudential Investment Portfolios 9 | |
| Address of principal executive offices: | 655 Broad Street, 17th Floor | |
| Newark, New Jersey 07102 | ||
| Name and address of agent for service: | Deborah A. Docs | |
| 655 Broad Street, 17th Floor | ||
| Newark, New Jersey 07102 | ||
| Registrant’s telephone number, including area code: | 800-225-1852 | |
| Date of fiscal year end: | 10/31/2017 | |
| Date of reporting period: | 10/31/2017 | |
Item 1 – Reports to Stockholders

PRUDENTIAL ABSOLUTE RETURN BOND FUND
ANNUAL REPORT
OCTOBER 31, 2017

To enroll in e-delivery, go to pgiminvestments.com/edelivery
| Objective: To seek positive returns over the long term, regardless of market conditions |
Highlights
| • | The Fund significantly outperformed the ICE BofAML USD LIBOR 3-Month Constant Maturity Index during the reporting period, led by strong sector allocation, security selection, and yield curve positioning. |
| • | Security selection was the largest positive contributor to performance, highlighted by positioning in non-agency mortgage-backed securities, collateralized loan obligations, investment-grade corporate bonds, high yield corporate bonds, and emerging markets securities. |
| • | Within corporate bonds, security selection in the retailers & restaurants and cable & satellite sectors modestly detracted from performance. |
This report is not authorized for distribution to prospective investors unless preceded or accompanied by a current prospectus.
The views expressed in this report and information about the Fund’s portfolio holdings are for the period covered by this report and are subject to change thereafter.
Mutual funds are distributed by Prudential Investment Management Services LLC (PIMS), member SIPC. PGIM Fixed Income is a unit of PGIM, Inc. (PGIM), a registered investment adviser. PIMS and PGIM are Prudential Financial companies. © 2017 Prudential Financial, Inc. and its related entities. PGIM and the PGIM logo are service marks of Prudential Financial, Inc. and its related entities, registered in many jurisdictions worldwide.
| 2 | Visit our website at pgiminvestments.com |
PRUDENTIAL FUNDS — UPDATE
The Board of Directors/Trustees for the Fund has approved renaming the Fund’s Class Q shares as Class R6 shares, effective on or about June 15, 2018. The renaming of Class Q shares as Class R6 shares will not result in any changes to pricing, eligibility, or shareholder rights and obligations. The renamed Class R6 shares will not be exchangeable with Class R6 shares of the Prudential Day One Funds or the Prudential 60/40 Allocation Fund.
LR993
| Prudential Absolute Return Bond Fund | 3 |
PRUDENTIAL FUNDS — UPDATE
Effective on or about June 1, 2018 (the “Effective Date”), the Fund’s Class A, Class C, Class R, and Class Z shares, as applicable, will be closed to investments by new group retirement plans, except as discussed below. Existing group retirement plans as of the Effective Date may keep their investments in their current share class and may continue to make additional purchases or exchanges of that class of shares. As of the Effective Date, all new group retirement plans wishing to add the Fund as a new addition to the plan generally will be into one of the available Class Q shares, Class R2 shares, or Class R4 shares of the Fund.
In addition, on or about the Effective Date, the Class R shares of the Fund will be closed to all new investors, except as discussed below. Due to the closing of the Class R shares to new investors, effective on or about the Effective Date new IRA investors may only purchase Class A, Class C, Class Z, or Class Q shares of the Fund, subject to share class eligibility. Following the Effective Date, no new accounts may be established in the Fund’s Class R shares and no Class R shares may be purchased or acquired by any new Class R shareholder, except as discussed below.
| Class A | Class C | Class Z | Class R | |||||
Existing Investors (Group Retirement Plans, IRAs, and all other investors) | No Change | No Change | No Change | No Change | ||||
| New Group Retirement Plans | Closed to group retirement plans wishing to add the share classes as new additions to plan menus on or about June 1, 2018, subject to certain exceptions below | |||||||
New IRAs | No Change | No Change | No Change | Closed to all new investors on or about June 1, 2018, subject to certain exceptions below | ||||
| All Other New Investors | No Change | No Change | No Change | |||||
| 4 | Visit our website at pgiminvestments.com |
However, the following new investors may continue to purchase Class A, Class C, Class R, and Class Z shares of the Fund, as applicable:
| • | Eligible group retirement plans who are exercising their one-time 90-day repurchase privilege in the Fund will be permitted to purchase such share classes. |
| • | Plan participants in a group retirement plan that offers Class A, Class C, Class R, or Class Z shares of the Fund as of the Effective Date will be permitted to purchase such share classes of the Fund, even if the plan participant did not own shares of that class of the Fund as of the Effective Date. |
| • | Certain new group retirement plans will be permitted to offer such share classes of the Fund after the Effective Date, provided that the plan has or is actively negotiating a contractual agreement with the Fund’s distributor or service provider to offer such share classes of the Fund prior to or on the Effective Date. |
| • | New group retirement plans that combine with, replace, or are otherwise affiliated with a current plan that invests in such share classes prior to or on the Effective Date will be permitted to purchase such share classes. |
The Fund also reserves the right to refuse any purchase order that might disrupt management of the Fund or to otherwise modify the closure policy at any time on a case-by-case basis.
| Prudential Absolute Return Bond Fund | 5 |
This Page Intentionally Left Blank
| 6 | Visit our website at pgiminvestments.com |
Letter from the President

Dear Shareholder:
We hope you find the annual report for the Prudential Absolute Return Bond Fund informative and useful. The report covers performance for the 12-month period ended October 31, 2017.
Significant events during the reporting period included a new US president, followed by uncertainty in Congress over implementing the Trump administration’s policy initiatives. Elsewhere, Britain began its formal legal process to leave the European Union. France elected a more centrist president, which was viewed as a pro-euro referendum. North Korea’s missile launches escalated geopolitical tensions. Also, late in the period, a series of hurricanes caused damage in the US and the Caribbean.
Despite some turbulence in the macro-environment, solid economic fundamentals in the US economy included moderate gross domestic product expansion, robust employment, and accelerating corporate profit growth. Inflation remained tame. The Federal Reserve raised its federal funds rate twice in 2017, and is in the process of winding down its stimulus program.
Global economic growth remained mostly positive. Equities in the US reached new highs amid low volatility, while international equities posted strong gains. European stocks continued to gain. Asian markets were solid, and emerging markets outperformed most regions. Fixed income markets were mixed. High yield and emerging markets bonds were the top performers.
Given the uncertainty in today’s investment environment, we believe that active professional portfolio management offers a potential advantage. Active managers often have the knowledge and flexibility to find the best investment opportunities in the most challenging markets.
Even so, it’s best if investment decisions are based on your long-term goals rather than on short-term market and economic developments. We also encourage you to work with an experienced financial advisor who can help you set goals, determine your tolerance for risk, and build a diversified plan that’s right for you and make adjustments when necessary.
At PGIM Investments, we consider it a great privilege and responsibility to help investors participate in opportunities across global markets while meeting their toughest investment challenges. We’re part of PGIM, a top-10 global investment manager with more than $1 trillion in assets under management. This investment expertise allows us to deliver actively managed funds and strategies to meet the needs of investors around the globe.
Thank you for choosing our family of funds.
Sincerely,

Stuart S. Parker, President
Prudential Absolute Return Bond Fund
December 15, 2017
| Prudential Absolute Return Bond Fund | 7 |
Your Fund’s Performance (unaudited)
Performance data quoted represents past performance. Past performance does not guarantee future results. The investment return and principal value of an investment will fluctuate, so that an investor’s shares, when redeemed, may be worth more or less than their original cost. Current performance may be lower or higher than the past performance data quoted. An investor may obtain performance data as of the most recent month-end by visiting our website at www.pgiminvestments.com or by calling (800) 225-1852.
| Average Annual Total Returns as of 10/31/17 (with sales charges) | ||||||||||
| One Year (%) | Five Years (%) | Since Inception (%) | ||||||||
| Class A | 1.18 | 1.66 | 1.89 (3/30/11) | |||||||
| Class C | 4.16 | 1.86 | 1.85 (3/30/11) | |||||||
| Class Q | 6.26 | 2.91 | 2.93 (3/30/11) | |||||||
| Class Z | 6.19 | 2.87 | 2.87 (3/30/11) | |||||||
| ICE BofAML USD LIBOR 3-Month CM Index | 1.06 | 0.48 | 0.46 | |||||||
| Lipper Alternative Credit Focus Funds Average | 4.35 | 2.02 | 2.41 | |||||||
| Average Annual Total Returns as of 10/31/17 (without sales charges) | ||||||||||
| One Year (%) | Five Years (%) | Since Inception (%) | ||||||||
| Class A | 5.95 | 2.60 | 2.60 (3/30/11) | |||||||
| Class C | 5.16 | 1.86 | 1.85 (3/30/11) | |||||||
| Class Q | 6.26 | 2.91 | 2.93 (3/30/11) | |||||||
| Class Z | 6.19 | 2.87 | 2.87 (3/30/11) | |||||||
| ICE BofAML USD LIBOR 3-Month CM Index | 1.06 | 0.48 | 0.46 | |||||||
| Lipper Alternative Credit Focus Funds Average | 4.35 | 2.02 | 2.41 | |||||||
| 8 | Visit our website at pgiminvestments.com |
Growth of a $10,000 Investment

The graph compares a $10,000 investment in the Prudential Absolute Return Bond Fund (Class Z shares) with a similar investment in the ICE BofAML USD LIBOR 3-Month CM Index by portraying the initial account values at the commencement of operations for Class Z shares (March 30, 2011) and the account values at the end of the current fiscal year (October 31, 2017) as measured on a quarterly basis. For purposes of the graph, and unless otherwise indicated, it has been assumed that (a) all recurring fees (including management fees) were deducted; and (b) all dividends and distributions were reinvested. The line graph provides information for Class Z shares only. As indicated in the tables provided earlier, performance for Class A, Class C, and Class Q shares will vary due to the differing charges and expenses applicable to each share class (as indicated in the following paragraphs). Without waiver of fees and/or expense reimbursements, if any, the Fund’s returns would have been lower.
Past performance does not predict future performance. Total returns and the ending account values in the graph include changes in share price and reinvestment of dividends and capital gains distributions in a hypothetical investment for the periods shown. The Fund’s total returns do not reflect the deduction of income taxes on an individual’s investment. Taxes may reduce your actual investment returns on income or gains paid by the Fund or any gains you may realize if you sell your shares.
Source: PGIM Investments LLC and Lipper Inc.
Since Inception returns are provided since the Fund has less than 10 fiscal years of returns. Since Inception returns for the Index and the Lipper Average are measured from the closest month-end to the Fund’s inception date.
| Prudential Absolute Return Bond Fund | 9 |
Your Fund’s Performance (continued)
The returns in the tables do not reflect the deduction of taxes that a shareholder would pay on Fund distributions or following the redemption of Fund shares. The average annual total returns take into account applicable sales charges, which are described for each share class in the table below.
| Class A* | Class C* | Class Q | Class Z* | |||||
| Maximum initial sales charge | 4.50% of the public offering price | None | None | None | ||||
| Contingent deferred sales charge (CDSC) (as a percentage of the lower of original purchase price or net asset value at redemption) | 1.00% on sales of $1 million or more made within 12 months of purchase | 1.00% on sales made within 12 months of purchase | None | None | ||||
| Annual distribution and service (12b-1) fees (shown as a percentage of average daily net assets) | 0.25% | 1.00% | None | None |
*Certain share classes will be generally closed to investments by new group retirement plans effective on or about June 1, 2018. Please see the “PRUDENTIAL FUNDS—UPDATE” on page 4 of this report for more information.
Benchmark Definitions
ICE BofAML USD LIBOR 3-Month CM Index—The ICE BofA Merrill Lynch US Dollar LIBOR 3-Month Constant Maturity Index is an unmanaged index that tracks the performance of a synthetic asset paying LIBOR to a stated maturity. The Index is based on the assumed purchase at par of a synthetic instrument having exactly its stated maturity and with a coupon equal to that current day fixing rate. That issue is assumed to be sold the following business day (priced at a yield equal to the current day fixing rate) and rolled into a new instrument.
Lipper Alternative Credit Focus Funds Average—The Lipper Alternative Credit Focus Funds Average (Lipper Average) is based on the average return of all funds in the Lipper Alternative Credit Focus Funds universe for the periods noted. Funds in the Lipper Average are funds that, by prospectus language, invest in a wide range of credit-structured vehicles by using either fundamental credit research analysis or quantitative credit portfolio modeling trying to benefit from any changes in credit quality, credit spreads, and market liquidity.
Investors cannot invest directly in an index or average. The returns for the Index would be lower if they included the effects of sales charges, operating expenses of a mutual fund, or taxes. Returns for the Lipper Average reflect the deduction of operating expenses of a mutual fund, but not sales charges or taxes.
| 10 | Visit our website at pgiminvestments.com |
| Distributions and Yields as of 10/31/17 | ||||||
| Total Distributions Paid for 12 Months ($) | SEC 30-Day Subsidized Yield* (%) | SEC 30-Day Unsubsidized Yield** (%) | ||||
| Class A | 0.22 | 1.92 | 1.95 | |||
| Class C | 0.15 | 1.25 | 1.28 | |||
| Class Q | 0.25 | 2.14 | 2.14 | |||
| Class Z | 0.25 | 2.24 | 2.27 | |||
*SEC 30-Day Subsidized Yield (%)—A standardized yield calculation created by the Securities and Exchange Commission, it reflects the income earned during a 30-day period, after the deduction of the Fund’s net expenses (net of any expense waivers or reimbursements).
**SEC 30-Day Unsubsidized Yield (%)—A standardized yield calculation created by the Securities and Exchange Commission, it reflects the income earned during a 30-day period, after the deduction of the Fund’s gross expenses.
| Credit Quality expressed as a percentage of total investments as of 10/31/17 (%) | ||||
| AAA | 28.7 | |||
| AA | 5.9 | |||
| A | 9.8 | |||
| BBB | 16.2 | |||
| BB | 16.3 | |||
| B | 9.8 | |||
| CCC | 0.6 | |||
| C | 0.1 | |||
| D | 0.2 | |||
| Not Rated | 4.9 | |||
| Cash/Cash Equivalents | 7.4 | |||
| Total Investments | 100.0 | |||
Source: PGIM Fixed Income
Credit ratings reflect the highest rating assigned by a nationally recognized statistical rating organization (NRSRO) such as Moody’s Investor Service, Inc. (Moody’s), S&P Global Ratings (S&P), or Fitch, Inc. (Fitch). Credit ratings reflect the common nomenclature used by both S&P and Fitch. Where applicable, ratings are converted to the comparable S&P/Fitch rating tier nomenclature. These rating agencies are independent and are widely used. The Not Rated category consists of securities that have not been rated by a NRSRO. Credit ratings are subject to change. Values may not sum to 100.0% due to rounding.
| Prudential Absolute Return Bond Fund | 11 |
Strategy and Performance Overview
How did the Fund perform?
The Prudential Absolute Return Bond Fund’s Class Z shares returned 6.19% for the 12-month period ended October 31, 2017, outperforming the 1.06% gain of the ICE BofAML USD LIBOR 3-Month Constant Maturity Index (the Index). The Fund also outperformed the 4.35% return of the Lipper Alternative Credit Focus Funds Average.
What were market conditions?
| • | At the beginning of the reporting period, the markets had to digest a US presidential election in which Republican candidate Donald Trump bested Democratic candidate Hillary Clinton. The outcome caused global equities to rally and interest rates to rise, as investors anticipated a buoyant US economy, based on their expectations of a pro-business and pro-growth Trump administration. Meanwhile, breakeven inflation rates moved higher as consumer confidence reached its highest level since 2001. (The breakeven inflation rate is a market-based measure of expected inflation.) |
| • | The first quarter of 2017 was dominated by rising expectations for growth and inflation, as well as signals from the European Central Bank about the potential for further tapering of its asset purchases and/or possible interest rate hikes. Additionally, the Federal Reserve (Fed) raised rates in March and continued to signal that further increases lay ahead. Nevertheless, interest rates in the US, Europe, and Japan generally stopped rising and credit spreads compressed. (Spreads are yield differentials between bonds of comparable maturity.) In this environment, investment-grade corporate bonds generated modestly positive returns, while high yield corporate bonds and emerging markets debt produced slightly stronger gains. |
| • | During the second quarter, bond market returns were respectable, led by higher yielding/more economically sensitive sectors. The Fed unveiled its plan to start trimming its balance sheet before year-end 2017, while Washington, DC was bogged down in political intrigue, hearings, and investigations, as well as the normal legislative hurdles. Policy disappointment, along with modestly softer economic data, resulted in a modest decline in long-term US interest rates. |
| • | During the third quarter, the US economy grew at a robust 3% pace for the second consecutive quarter, due in part to a buildup of business inventories. Underlying private-sector domestic demand slowed, likely dampened by the effects of Hurricanes Harvey and Irma. However, strong job gains continued to support consumer spending. Tax reform, if enacted, seemed likely to provide additional support to an already solid growth outlook. |
| • | In October, broad-based economic momentum continued, as monthly volatility in US economic data, driven by the hurricanes, largely subsided. Underlying growth remained solid, although perhaps a bit less than the third quarter’s 3% pace might suggest. |
| 12 | Visit our website at pgiminvestments.com |
What worked?
| • | The Fund significantly outperformed the Index during the reporting period, led by strong sector allocation, security selection, and yield curve positioning. |
| • | Security selection was the largest positive contributor to performance, highlighted by positioning in non-agency mortgage-backed securities, collateralized loan obligations (CLOs), investment-grade corporate bonds, high yield corporate bonds, and emerging markets securities. |
| • | Positioning within corporate bonds, specifically foreign non-corporate bonds, and bonds in the gaming/lodging/leisure sectors added to performance. Among foreign non-corporate bonds, overweight positions in Portugal, Argentina, and Mexican petroleum company Petroleos Mexicanos were positive. Within the gaming/lodging/leisure sector, the Fund was helped by overweights in Scientific Games and Jack Ohio Finance. |
| • | Sector allocation also added to relative returns. More specifically, the Fund benefited from its overweight positions within credit sectors, including high yield bonds, investment-grade bonds, emerging markets debt, and commercial mortgage-backed securities (CMBS). |
| • | Also contributing positively was the Fund’s positioning for flatter yield curves. Yield curves are single line graphs that illustrate the relationship between the yields and maturities of fixed income securities. |
What didn’t work?
| • | Within corporate bonds, security selection in the retailers & restaurants and cable & satellite sectors modestly detracted from performance. Among retailers & restaurants, detractors included overweights in L Brands and CVS Health. Within cable & satellite, an overweight in Charter Communications was negative. |
| • | The Fund employs an absolute return strategy that seeks to mitigate (or even eliminate) interest-rate risk when appropriate. During the period, the Fund was hurt by its strategy to manage duration, which is a measure of the interest-rate sensitivity of a bond portfolio or debt securities that is expressed as a number of years. The underperformance from duration positioning strategy occurred in November 2016 when the Fund held a long duration position as interest rates rose following the US election. The Fund’s active duration positioning ranged from 0.1 years short to 1.0 years long during the period, ending October at the longer end of the range at +0.7 years. |
Did the Fund use derivatives and how did they affect performance?
| • | During the reporting period, the Fund utilized derivative instruments. Interest rate derivatives were additive to performance, currency derivatives had a negligible impact, |
| Prudential Absolute Return Bond Fund | 13 |
Strategy and Performance Overview (continued)
| and credit derivatives were modestly positive. For additional information regarding the Fund’s derivative exposures please refer to the Fund’s Financial Statements. |
Current outlook
| • | Now that the Fed has begun to taper reinvestments of the maturing Treasuries and mortgage-backed securities on its balance sheet, PGIM Fixed Income expects it to resume gradual rate hikes by raising interest rates 25 basis points at the December policy meeting and then three times in 2018. (A basis point is 1/100th of a percent.) There are risks to this outlook if, for example, the Republicans’ tax package turns out to be more stimulative in 2018 than expected. Modest downside risks include the possibility that the housing market will react more sharply than expected to potential tax law changes. |
| • | Significant turnover at the Fed creates additional uncertainty over the likely path of rate hikes going forward. Trump’s nomination of current Governor Jerome Powell to be the next Fed chair appeased the market, as he is considered likely to provide continuity with the cautious, gradual policies of Janet Yellen’s term. |
| • | PGIM Fixed Income maintains a positive view of fundamentals in credit sectors, and at the end of the reporting period, the Fund continues to have exposure to an array of spread sectors, including high yield corporate bonds, investment-grade corporate bonds, emerging markets debt, and structured products, including CMBS, CLOs, and asset-backed securities. Spread sectors are corporate bonds, emerging markets debt, and other types of debt securities that provide extra yield (spread) over similar-duration government bond sectors to compensate for the greater credit risk associated with investing in them. |
| • | In investment-grade corporate bonds, the Fund continues to have a longer duration emphasis, with an overweight to financials. PGIM Fixed Income continues to favor US financials over industrials, especially US money center banks, given their strong capital requirements, generally solid earnings, and lower event risk. Within industrials, the focus is on names where an “event” has passed as issuers of higher-quality corporate bonds continue to add debt and consolidation remains a concern. Overall, US-centric issuers are favored over multinationals or exporters that are vulnerable to potential protectionist trade policies. The Fund remains overweight BBB-rated issuers because PGIM Fixed Income considers the spread pickup attractive on based expectations of steady economic growth. |
| • | PGIM Fixed Income continues to be rather constructive on high yield corporate bonds in expectation that defaults will remain low and below historical averages. In addition, mergers and acquisitions have generally been positive for high yield credits and they are expected to increase under Republican oversight. However, many macro concerns could weigh on the high yield bond market, including uncertainty about China, North Korea, the Middle East, and the Fed. Donald Trump’s anti-globalization policies, unconventional |
| 14 | Visit our website at pgiminvestments.com |
rhetoric, and his mounting political adversity should also elevate risk premiums. Populism, nationalism, and isolationism are on the rise globally, which is negative for economic growth longer term. |
| • | PGIM Fixed Income remains very positive on structured products at the top of the capital structure, especially AAA-rated CLOs and AAA-rated CMBS. At the same time, PGIM Fixed Income continues to find value in consumer loan securitizations from originators that focus on income-verified underwriting, as well as select subprime auto loans and private refinance student loans. PGIM Fixed Income also likes high-quality credit roll-down plays in five-year prime auto revolver loans and five- to seven-year bank credit cards. Within CMBS, high-quality securities of new issue conduit deals continue to offer value. |
| • | US government-related sectors, including Treasuries, agency bonds, and agency mortgage-backed securities, remain a significant underweight as PGIM Fixed Income finds more compelling value in the aforementioned sectors. The Fund also occasionally features a modest notional exposure to non-US dollar currencies across a diversified basket of currencies in faster-growing emerging and developed countries, with positioning at the end of the period featuring an underweight in the US dollar. |
| Prudential Absolute Return Bond Fund | 15 |
Fees and Expenses (unaudited)
As a shareholder of the Fund, you incur two types of costs: (1) transaction costs, including sales charges (loads) on purchase payments and redemptions, as applicable, and (2) ongoing costs, including management fees, distribution and/or service (12b-1) fees, and other Fund expenses, as applicable. This example is intended to help you understand your ongoing costs (in dollars) of investing in the Fund and to compare these costs with the ongoing costs of investing in other mutual funds.
The example is based on an investment of $1,000 held through the six-month period ended October 31, 2017. The example is for illustrative purposes only; you should consult the Prospectus for information on initial and subsequent minimum investment requirements.
Actual Expenses
The first line for each share class in the table on the following page provides information about actual account values and actual expenses. You may use the information on this line, together with the amount you invested, to estimate the expenses that you paid over the period. Simply divide your account value by $1,000 (for example, an $8,600 account value ÷ $1,000 = 8.6), then multiply the result by the number on the first line under the heading “Expenses Paid During the Six-Month Period” to estimate the expenses you paid on your account during this period.
Hypothetical Example for Comparison Purposes
The second line for each share class in the table on the following page provides information about hypothetical account values and hypothetical expenses based on the Fund’s actual expense ratio and an assumed rate of return of 5% per year before expenses, which is not the Fund’s actual return. The hypothetical account values and expenses may not be used to estimate the actual ending account balance or expenses you paid for the period. You may use this information to compare the ongoing costs of investing in the Fund and other funds. To do so, compare this 5% hypothetical example with the 5% hypothetical examples that appear in the shareholder reports of the other funds.
The Fund’s transfer agent may charge additional fees to holders of certain accounts that are not included in the expenses shown in the table on the following page. These fees apply to individual retirement accounts (IRAs) and Section 403(b) accounts. As of the close of the six-month period covered by the table, IRA fees included an annual maintenance fee of $15 per account (subject to a maximum annual maintenance fee of $25 for all accounts held by the same shareholder). Section 403(b) accounts are charged an annual $25 fiduciary maintenance fee. Some of the fees may vary in amount, or may be waived, based on your total account balance or the number of Prudential funds, including the Fund, that you own. You should consider the additional fees that were charged to your Fund account over the six-month period when you estimate the total ongoing expenses paid over the
| 16 | Visit our website at pgiminvestments.com |
period and the impact of these fees on your ending account value, as these additional expenses are not reflected in the information provided in the expense table. Additional fees have the effect of reducing investment returns.
Please note that the expenses shown in the table are meant to highlight your ongoing costs only and do not reflect any transactional costs such as sales charges (loads). Therefore, the second line for each share class in the table is useful in comparing ongoing costs only and will not help you determine the relative total costs of owning different funds. In addition, if these transactional costs were included, your costs would have been higher.
| Prudential Absolute Return Bond Fund | Beginning Account Value May 1, 2017 | Ending Account Value October 31, 2017 | Annualized Expense Ratio Based on the Six-Month Period | Expenses Paid During the Six-Month Period* | ||||||||||||||
| Class A | Actual | $ | 1,000.00 | $ | 1,031.20 | 1.15 | % | $ | 5.89 | |||||||||
| Hypothetical | $ | 1,000.00 | $ | 1,019.41 | 1.15 | % | $ | 5.85 | ||||||||||
| Class C | Actual | $ | 1,000.00 | $ | 1,027.30 | 1.90 | % | $ | 9.71 | |||||||||
| Hypothetical | $ | 1,000.00 | $ | 1,015.63 | 1.90 | % | $ | 9.65 | ||||||||||
| Class Q | Actual | $ | 1,000.00 | $ | 1,032.50 | 0.93 | % | $ | 4.76 | |||||||||
| Hypothetical | $ | 1,000.00 | $ | 1,020.52 | 0.93 | % | $ | 4.74 | ||||||||||
| Class Z | Actual | $ | 1,000.00 | $ | 1,032.40 | 0.90 | % | $ | 4.61 | |||||||||
| Hypothetical | $ | 1,000.00 | $ | 1,020.67 | 0.90 | % | $ | 4.58 | ||||||||||
*Fund expenses (net of fee waivers or subsidies, if any) for each share class are equal to the annualized expense ratio for each share class (provided in the table), multiplied by the average account value over the period, multiplied by the 184 days in the six-month period ended October 31, 2017, and divided by the 365 days in the Fund’s fiscal year ended October 31, 2017 (to reflect the six-month period). Expenses presented in the table include the expenses of any underlying funds in which the Fund may invest.
| Prudential Absolute Return Bond Fund | 17 |
Schedule of Investments
as of October 31, 2017
| Description | Interest Rate | Maturity Date | Principal Amount (000)# | Value | ||||||||||||
LONG-TERM INVESTMENTS 90.5% |
| |||||||||||||||
ASSET-BACKED SECURITIES 29.9% |
| |||||||||||||||
Automobiles 0.2% |
| |||||||||||||||
OneMain Direct Auto Receivables Trust, Series 2017-1A, Class C, 144A | 3.910 | % | 08/16/21 | 4,100 | $ | 4,092,267 | ||||||||||
Collateralized Loan Obligations 19.1% |
| |||||||||||||||
A Voce CLO Ltd. (Cayman Islands), Series 2014-1A, Class A1R, 144A, 3 Month LIBOR + 1.160% | 2.519 | (c) | 07/15/26 | 13,250 | 13,295,789 | |||||||||||
Anchorage Capital CLO Ltd. (Cayman Islands), Series 2015-6A, Class AR, 144A, 3 Month LIBOR + 1.270% | 2.629 | (c) | 07/15/30 | 1,750 | 1,762,083 | |||||||||||
ArrowMark Colorado Holdings (Cayman Islands), | 2.639 | (c) | 07/15/29 | 2,500 | 2,518,249 | |||||||||||
Atlas Senior Loan Fund Ltd. (Cayman Islands), Series 2017-8A, Class A, 144A | 2.607 | (cc) | 01/16/30 | 4,500 | 4,523,043 | |||||||||||
Atlas Senior Loan Fund V Ltd. (Cayman Islands), | 2.619 | (c) | 07/16/29 | 2,000 | 2,013,944 | |||||||||||
Babson Euro CLO (Netherlands), Series 2015-1A, Class A1R, 144A, 3 Month Euribor + 0.820% | 0.491 | (c) | 10/25/29 | EUR | 4,000 | 4,670,068 | ||||||||||
Battalion CLO Ltd. (Cayman Islands), | ||||||||||||||||
Series 2013-4A, Class A1R, 144A, 3 Month LIBOR + 1.140% | 2.503 | (c) | 10/22/25 | 5,000 | 5,013,904 | |||||||||||
Series 2014-5A, Class A1R, 144A, 3 Month LIBOR + 1.170% | 2.523 | (c) | 04/17/26 | 7,250 | 7,251,261 | |||||||||||
Series 2015-8A, Class A1R, 144A, 3 Month LIBOR + 1.340% | 2.694 | (c) | 07/18/30 | 2,000 | 2,013,596 | |||||||||||
Benefit Street Partners CLO Ltd. (Cayman Islands), | ||||||||||||||||
Series 2013-IIA, Class A1R, 144A, 3 Month LIBOR + 1.250% | 2.609 | (c) | 07/15/29 | 3,500 | 3,502,515 | |||||||||||
Series 2014-VA, Class AR, 144A, 3 Month LIBOR + 1.200% | 2.563 | (c) | 10/20/26 | 10,000 | 10,058,308 | |||||||||||
Series 2017-12A, Class A1, 144A, 3 Month LIBOR + 1.250% | 2.597 | (c) | 10/15/30 | 9,250 | 9,291,427 | |||||||||||
Brookside Mill CLO Ltd. (Cayman Islands), | ||||||||||||||||
Series 2013-1A, Class B1, 144A, 3 Month LIBOR + 1.750% | 3.103 | (c) | 04/17/25 | 5,250 | 5,250,233 | |||||||||||
Series 2013-1A, Class B2, 144A | 3.020 | 04/17/25 | 6,200 | 6,199,125 | ||||||||||||
Carlyle US CLO Ltd. (Cayman Islands), Series 2017-2A, Class A1B, 144A, 3 Month LIBOR + 1.220% | 2.552 | (c) | 07/20/31 | 3,000 | 3,019,402 | |||||||||||
See Notes to Financial Statements.
| Prudential Absolute Return Bond Fund | 19 |
Schedule of Investments (continued)
as of October 31, 2017
| Description | Interest Rate | Maturity Date | Principal Amount (000)# | Value | ||||||||||||
ASSET-BACKED SECURITIES (Continued) |
| |||||||||||||||
Collateralized Loan Obligations (cont’d.) |
| |||||||||||||||
Catamaran CLO (Cayman Islands), Series 2014-1A, Class A1AR, 144A, 3 Month LIBOR + 1.260% | 2.623 | %(c) | 04/22/30 | 10,500 | $ | 10,500,000 | ||||||||||
Eaton Vance CLO Ltd. (Cayman Islands), | 2.559 | (c) | 07/15/26 | 5,000 | 5,023,041 | |||||||||||
ECP CLO Ltd. (Cayman Islands), Series 2014-6A, Class A1A, 144A, 3 Month LIBOR + 1.450% | 2.809 | (c) | 07/15/26 | 7,600 | 7,606,082 | |||||||||||
Elevation CLO (Cayman Islands), Series 2017-7A, Class A, 144A | — | (p) | 07/15/30 | 4,000 | 4,000,000 | |||||||||||
Flagship CLO Ltd. (Cayman Islands), | 2.609 | (c) | 01/16/26 | 2,500 | 2,511,564 | |||||||||||
Highbridge Loan Management Ltd. (Cayman Islands), Series 2015-6A, Class A, 144A, 3 Month LIBOR + 1.450% | 2.762 | (c) | 05/05/27 | 15,250 | 15,271,955 | |||||||||||
ICG US CLO Ltd. (Cayman Islands), | ||||||||||||||||
Series 2014-3A, Class A1AR, 144A, 3 Month LIBOR + 1.230% | 2.597 | (c) | 01/25/27 | 12,500 | 12,525,451 | |||||||||||
Series 2017-2A, Class A1, 144A, 3 Month LIBOR + 1.280% | 2.597 | (c) | 10/23/29 | 3,000 | 3,020,112 | |||||||||||
ING Investment Management CLO Ltd. (Cayman Islands), Series 2013-2A, Class A2B, 144A | 3.070 | 04/25/25 | 2,000 | 1,981,156 | ||||||||||||
Jackson Mill CLO Ltd. (Cayman Islands), | 2.899 | (c) | 04/15/27 | 12,000 | 12,014,902 | |||||||||||
Jubilee CLO (Netherlands), | ||||||||||||||||
Series 2017-19A, Class A1, 144A | — | (p) | 07/15/30 | EUR | 1,500 | 1,747,274 | ||||||||||
Series 2017-19A, Class A2, 144A | 1.150 | 07/15/30 | EUR | 1,000 | 1,164,849 | |||||||||||
KKR CLO Ltd. (Cayman Islands), Series 18, Class A, 144A, 3 Month LIBOR + 1.270% | 2.624 | (c) | 07/18/30 | 8,000 | 8,073,874 | |||||||||||
KVK CLO Ltd. (Cayman Islands), Series 2014-1A, Class A1R, 144A, 3 Month LIBOR + 1.300% | 2.615 | (c) | 05/15/26 | 10,000 | 10,002,096 | |||||||||||
MJX Venture Management II LLC (Cayman Islands), Series 2017-29RR, Class A, 144A, 3 Month LIBOR + 1.630%^ | 2.947 | (c) | 09/08/30 | 12,800 | 12,800,000 | |||||||||||
Mountain View CLO Ltd. (Cayman Islands), | 2.599 | (c) | 10/15/26 | 7,000 | 7,032,051 | |||||||||||
North Westerly CLO BV (Netherlands), Series IV-A, Class A2R, 144A | 1.250 | 01/15/26 | EUR | 1,500 | 1,745,471 | |||||||||||
OCP CLO Ltd. (Cayman Islands), Series 2017-13A, Class A1A, 144A, 3 Month LIBOR + 1.260% | 2.561 | (c) | 07/15/30 | 5,750 | 5,794,538 | |||||||||||
See Notes to Financial Statements.
| 20 |
| Description | Interest Rate | Maturity Date | Principal Amount (000)# | Value | ||||||||||||
ASSET-BACKED SECURITIES (Continued) |
| |||||||||||||||
Collateralized Loan Obligations (cont’d.) |
| |||||||||||||||
OZLM Ltd. (Cayman Islands), | ||||||||||||||||
Series 2015-11A, Class A1R, 144A, 3 Month LIBOR + 1.250% | 2.628 | %(c) | 10/30/30 | 3,000 | $ | 3,021,875 | ||||||||||
Series 2016-15A, Class A1, 144A, 3 Month LIBOR + 1.490% | 2.853 | (c) | 01/20/29 | 22,750 | 23,010,149 | |||||||||||
Palmer Square CLO Ltd. (Cayman Islands), | ||||||||||||||||
Series 2015-1A, Class A1R, 144A, 3 Month LIBOR + 1.300% | 2.616 | (c) | 05/21/29 | 10,200 | 10,248,719 | |||||||||||
Series 2015-2A, Class A1AR, 144A, 3 Month LIBOR + 1.270% | 2.633 | (c) | 07/20/30 | 5,750 | 5,789,392 | |||||||||||
Regatta Funding LP (Cayman Islands), Series 2013-2A, Class A1R, 144A, 3 Month LIBOR + 1.540% | 2.899 | (c) | 01/15/29 | 7,250 | 7,314,978 | |||||||||||
Regatta Funding Ltd. (Cayman Islands), Series 2017-1A, Class A, 144A, 3 Month LIBOR + 1.250% | 2.619 | (c) | 10/17/30 | 4,750 | 4,768,098 | |||||||||||
Shackleton CLO Ltd. (Cayman Islands), Series 2017-11A, Class A, 144A, 3 Month LIBOR + 1.270% | 2.582 | (c) | 08/15/30 | 2,500 | 2,511,180 | |||||||||||
Sound Point CLO Ltd. (Cayman Islands), | ||||||||||||||||
Series 2015-2A, Class AR, 144A, 3 Month LIBOR + 0.880% | 2.243 | (c) | 07/20/27 | 7,500 | 7,502,728 | |||||||||||
Series 2017-2A, Class A, 144A, 3 Month LIBOR + 1.280% | 2.567 | (c) | 07/25/30 | 8,500 | 8,561,862 | |||||||||||
Series 2017-3A, Class A1B, 144A, 3 Month LIBOR + 1.220% | 2.580 | (c) | 10/20/30 | 8,750 | 8,750,000 | |||||||||||
St. Pauls CLO (Ireland), Series 4A, Class A2BR, 144A | 2.050 | 04/25/30 | EUR | 4,625 | 5,387,429 | |||||||||||
THL Credit Wind River CLO Ltd. (Cayman Islands), Series 2014-1A, Class AR, 144A, 3 Month LIBOR + 1.180% | 2.534 | (c) | 04/18/26 | 4,250 | 4,263,854 | |||||||||||
TICP CLO Ltd. (Cayman Islands), Series 2017-7A, Class AS, 144A, 3 Month LIBOR + 1.230% | 2.534 | (c) | 07/15/29 | 5,500 | 5,518,060 | |||||||||||
Trinitas CLO Ltd. (Cayman Islands), Series 2017-6A Class A, 144A, 3 Month LIBOR + 1.320% | 2.655 | (c) | 07/25/29 | 9,750 | 9,779,770 | |||||||||||
Venture CLO Ltd. (Cayman Islands), Series 2015-21A, Class AR, 144A, 3 Month LIBOR + 0.880% | 2.239 | (c) | 07/15/27 | 7,500 | 7,501,353 | |||||||||||
Voya CLO Ltd. (Cayman Islands), | ||||||||||||||||
Series 2013-1A, Class A1AR, 144A, 3 Month LIBOR + 1.210% | 2.569 | (c) | 10/15/30 | 2,750 | 2,751,774 | |||||||||||
Series 2014-3A, Class A1, 144A, 3 Month LIBOR + 1.420% | 2.787 | (c) | 07/25/26 | 3,250 | 3,266,845 | |||||||||||
Washington Mill CLO Ltd. (Cayman Islands), Series 2014-1A, Class A1R, 144A, 3 Month LIBOR + 1.220% | 2.583 | (c) | 04/20/26 | 1,500 | 1,503,307 | |||||||||||
See Notes to Financial Statements.
| Prudential Absolute Return Bond Fund | 21 |
Schedule of Investments (continued)
as of October 31, 2017
| Description | Interest Rate | Maturity Date | Principal Amount (000)# | Value | ||||||||||||
ASSET-BACKED SECURITIES (Continued) |
| |||||||||||||||
Collateralized Loan Obligations (cont’d.) |
| |||||||||||||||
Wellfleet CLO Ltd. (Cayman Islands), | ||||||||||||||||
Series 2017-1A, Class A1, 144A, 3 Month LIBOR + 1.320% | 2.683 | %(c) | 04/20/29 | 4,000 | $ | 4,023,025 | ||||||||||
Series 2017-2A, Class A1, 144A, 3 Month LIBOR + 1.250% | 2.626 | (c) | 10/20/29 | 7,000 | 7,055,030 | |||||||||||
West CLO Ltd. (Cayman Islands), Series 2012-1A, Class B, 144A, 3 Month LIBOR + 3.400% | 4.778 | (c) | 10/30/23 | 1,750 | 1,750,430 | |||||||||||
Zais CLO Ltd. (Cayman Islands), | ||||||||||||||||
Series 2017-1A, Class A1, 144A, 3 Month LIBOR + 1.370% | 2.729 | (c) | 07/15/29 | 8,750 | 8,835,678 | |||||||||||
Series 2017-2A, Class A, 144A, 3 Month LIBOR + 1.290% | 2.647 | (c) | 04/15/30 | 4,750 | 4,771,755 | |||||||||||
|
| |||||||||||||||
| 351,084,654 | ||||||||||||||||
Consumer Loans 2.7% |
| |||||||||||||||
Lendmark Funding Trust, Series 2017-1A, Class B, 144A | 3.770 | 12/22/25 | 1,300 | 1,313,084 | ||||||||||||
OneMain Financial Issuance Trust, | ||||||||||||||||
Series 2014-2A, Class C, 144A | 4.330 | 09/18/24 | 8,000 | 8,043,338 | ||||||||||||
Series 2015-1A, Class B, 144A | 3.850 | 03/18/26 | 2,000 | 2,028,243 | ||||||||||||
Series 2015-2A, Class B, 144A | 3.100 | 07/18/25 | 5,246 | 5,243,379 | ||||||||||||
Series 2015-2A, Class C, 144A | 4.320 | 07/18/25 | 2,100 | 2,102,832 | ||||||||||||
Series 2017-1A, Class A2, 144A, 1 Month LIBOR + 0.800% | 2.039 | (c) | 09/14/32 | 4,300 | 4,324,117 | |||||||||||
Series 2017-1A, Class C, 144A | 3.350 | 09/14/32 | 700 | 694,431 | ||||||||||||
Oportun Funding LLC, | ||||||||||||||||
Series 2016-C, Class B, 144A | 4.850 | 11/08/21 | 6,665 | 6,746,509 | ||||||||||||
Series 2017-B, Class B, 144A | 4.260 | 10/10/23 | 6,550 | 6,541,103 | ||||||||||||
PNMAC GMSR Issuer Trust, Series 2017-GT2, Class A, 144A, 1 Month LIBOR + 4.000% | 5.238 | (c) | 08/25/23 | 3,800 | 3,801,334 | |||||||||||
Springleaf Funding Trust, | ||||||||||||||||
Series 2015-AA, Class B, 144A | 3.620 | 11/15/24 | 3,430 | 3,455,578 | ||||||||||||
Series 2015-AA, Class C, 144A | 5.040 | 11/15/24 | 6,000 | 6,079,573 | ||||||||||||
|
| |||||||||||||||
| 50,373,521 | ||||||||||||||||
Home Equity Loans 4.2% |
| |||||||||||||||
Accredited Mortgage Loan Trust, | ||||||||||||||||
Series 2004-3, Class 2A2, 1 Month LIBOR + 1.200% | 2.438 | (c) | 10/25/34 | 3,423 | 3,495,353 | |||||||||||
Series 2004-3, Class 2A5, 1 Month LIBOR + 1.080% | 2.318 | (c) | 10/25/34 | 1,883 | 1,915,697 | |||||||||||
Series 2005-3, Class M1, 1 Month LIBOR + 0.450% | 1.690 | (c) | 09/25/35 | 700 | 700,231 | |||||||||||
See Notes to Financial Statements.
| 22 |
| Description | Interest Rate | Maturity Date | Principal Amount (000)# | Value | ||||||||||||
ASSET-BACKED SECURITIES (Continued) |
| |||||||||||||||
Home Equity Loans (cont’d.) |
| |||||||||||||||
Ameriquest Mortgage Securities, Inc., Asset-Backed Pass-Through Certificates, | ||||||||||||||||
Series 2003-1, Class M1, 1 Month LIBOR + 1.350% | 2.588 | %(c) | 02/25/33 | 1,731 | $ | 1,709,639 | ||||||||||
Series 2003-10, Class AV1, 1 Month LIBOR + 0.760% | 1.998 | (c) | 12/25/33 | 3,275 | 3,255,666 | |||||||||||
Argent Securities, Inc., Asset-Backed Pass-Through Certificates, | ||||||||||||||||
Series 2003-W5, Class M1, 1 Month LIBOR + 1.050% | 2.288 | (c) | 10/25/33 | 32 | 31,994 | |||||||||||
Series 2003-W7, Class M1, 1 Month LIBOR + 1.035% | 2.273 | (c) | 03/25/34 | 1,054 | 1,056,858 | |||||||||||
Series 2003-W8, Class M1, 1 Month LIBOR + 1.050% | 2.288 | (c) | 12/25/33 | 809 | 813,518 | |||||||||||
Series 2003-W9, Class M1, 1 Month LIBOR + 1.035% | 2.273 | (c) | 01/25/34 | 1,988 | 1,990,672 | |||||||||||
Series 2004-W6, Class AF | 4.123 | 05/25/34 | 218 | 225,781 | ||||||||||||
Series 2004-W6, Class AV5, 1 Month LIBOR + 0.800% | 2.038 | (c) | 05/25/34 | 587 | 561,179 | |||||||||||
Asset Backed Funding CertificatesTrust, | 1.938 | (c) | 06/25/34 | 1,350 | 1,316,832 | |||||||||||
Asset-Backed Securities Corp. Home Equity Loan Trust, | ||||||||||||||||
Series 2003-HE6, Class A2, 1 Month LIBOR + 0.680% | 1.918 | (c) | 11/25/33 | 1,758 | 1,694,611 | |||||||||||
Series 2003-HE6, Class A3B, 1 Month LIBOR + 0.960% | 2.198 | (c) | 11/25/33 | 3,546 | 3,419,117 | |||||||||||
Series 2004-HE3, Class M1, 1 Month LIBOR + 0.810% | 2.048 | (c) | 06/25/34 | 3,016 | 3,004,966 | |||||||||||
Bear Stearns Asset-Backed Securities Trust, | ||||||||||||||||
Series 2002-2, Class A1, 1 Month LIBOR + 0.660% | 1.898 | (c) | 10/25/32 | 1,195 | 1,173,015 | |||||||||||
Series 2003-3, Class A2, 1 Month LIBOR + 1.180% | 2.418 | (c) | 06/25/43 | 141 | 139,237 | |||||||||||
Series 2003-HE1, Class M1, 1 Month LIBOR + 1.095% | 2.333 | (c) | 01/25/34 | 2,418 | 2,375,187 | |||||||||||
Series 2004-FR2, Class M2, 1 Month LIBOR + 1.020% | 2.258 | (c) | 06/25/34 | 1,100 | 1,111,078 | |||||||||||
Series 2004-HE11, Class M2, 1 Month LIBOR + 1.575% | 2.813 | (c) | 12/25/34 | 3,752 | 3,845,173 | |||||||||||
Series 2004-HE5, Class M1, 1 Month LIBOR + 0.855% | 2.093 | (c) | 07/25/34 | 5,039 | 4,995,019 | |||||||||||
Home Equity Asset Trust, | ||||||||||||||||
Series 2003-6, Class M1, 1 Month LIBOR + 1.050% | 2.288 | (c) | 02/25/34 | 1,193 | 1,166,815 | |||||||||||
Series 2004-7, Class A2, 1 Month LIBOR + 0.840% | 2.078 | (c) | 01/25/35 | 1,050 | 1,048,793 | |||||||||||
See Notes to Financial Statements.
| Prudential Absolute Return Bond Fund | 23 |
Schedule of Investments (continued)
as of October 31, 2017
| Description | Interest Rate | Maturity Date | Principal Amount (000)# | Value | ||||||||||||
ASSET-BACKED SECURITIES (Continued) |
| |||||||||||||||
Home Equity Loans (cont’d.) |
| |||||||||||||||
HSBC Home Equity Loan Trust U.S.A., Series 2007-3, Class A4, 1 Month LIBOR + 1.500% | 2.739 | %(c) | 11/20/36 | 21 | $ | 21,378 | ||||||||||
Mastr Asset-Backed Securities Trust, | ||||||||||||||||
Series 2003-OPT1, Class M2, 1 Month LIBOR + 2.775% | 4.013 | (c) | 12/25/32 | 513 | 515,861 | |||||||||||
Series 2003-WMC2, Class M2, 1 Month LIBOR + 2.475% | 3.713 | (c) | 08/25/33 | 1,064 | 1,059,276 | |||||||||||
Series 2005-NC1, Class M1, 1 Month LIBOR + 0.720% | 1.958 | (c) | 12/25/34 | 8,247 | 8,051,023 | |||||||||||
Merrill Lynch Mortgage Investors Trust, | 2.238 | (c) | 08/25/32 | 3,158 | 3,104,317 | |||||||||||
Morgan Stanley ABS Capital I, Inc. Trust, | ||||||||||||||||
Series 2003-HE3, Class M1, 1 Month LIBOR + 1.020% | 2.258 | (c) | 10/25/33 | 3,258 | 3,257,518 | |||||||||||
Series 2003-NC10, Class M1, 1 Month LIBOR + 1.020% | 2.258 | (c) | 10/25/33 | 857 | 848,450 | |||||||||||
Series 2003-NC8, Class M1, 1 Month LIBOR + 1.050% | 2.288 | (c) | 09/25/33 | 652 | 646,933 | |||||||||||
Series 2004-HE3, Class M1, 1 Month LIBOR + 0.855% | 2.093 | (c) | 03/25/34 | 658 | 640,084 | |||||||||||
Series 2004-HE4, Class M1, 1 Month LIBOR + 0.900% | 2.138 | (c) | 05/25/34 | 5,568 | 5,554,905 | |||||||||||
Series 2004-HE5, Class M1, 1 Month LIBOR + 0.945% | 2.183 | (c) | 06/25/34 | 889 | 889,500 | |||||||||||
Series 2004-OP1, Class M1, 1 Month LIBOR + 0.870% | 2.108 | (c) | 11/25/34 | 1,941 | 1,934,626 | |||||||||||
Morgan Stanley Home Equity Loan Trust, | 1.568 | (c) | 12/25/35 | 169 | 169,389 | |||||||||||
Option One Mortgage Accep Corp. Asset-Backed Certificates, Series 2003-4, Class A2, 1 Month LIBOR + 0.640% | 1.878 | (c) | 07/25/33 | 791 | 767,365 | |||||||||||
Option One Mortgage Loan Trust, | ||||||||||||||||
Series 2004-1, Class M1, 1 Month LIBOR + 0.900% | 2.138 | (c) | 01/25/34 | 1,843 | 1,828,560 | |||||||||||
Series 2005-1, Class A4, 1 Month LIBOR + 0.800% | 2.038 | (c) | 02/25/35 | 200 | 199,191 | |||||||||||
RAMP Trust, Series 2005-EFC3, Class M3, 1 Month LIBOR + 0.490% | 1.728 | (c) | 08/25/35 | 355 | 355,790 | |||||||||||
RASC Trust, | ||||||||||||||||
Series 2005-KS11, Class M1, 1 Month LIBOR + 0.400% | 1.638 | (c) | 12/25/35 | 704 | 703,696 | |||||||||||
Series 2005-KS3, Class M4, 1 Month LIBOR + 0.705% | 1.943 | (c) | 04/25/35 | 238 | 237,650 | |||||||||||
See Notes to Financial Statements.
| 24 |
| Description | Interest Rate | Maturity Date | Principal Amount (000)# | Value | ||||||||||||
ASSET-BACKED SECURITIES (Continued) |
| |||||||||||||||
Home Equity Loans (cont’d.) |
| |||||||||||||||
Securitized Asset-Backed Receivables LLC Trust, | ||||||||||||||||
Series 2004-NC1, Class M1, 1 Month | 2.018 | %(c) | 02/25/34 | 1,268 | $ | 1,276,690 | ||||||||||
Series 2004-OP1, Class M1, 1 Month | 2.003 | (c) | 02/25/34 | 4,233 | 4,116,921 | |||||||||||
|
| |||||||||||||||
| 77,225,554 | ||||||||||||||||
Residential Mortgage-Backed Securities 3.7% |
| |||||||||||||||
Ameriquest Mortgage Securities, Inc., Asset-Backed Pass-Through Certificates, Series 2005-R10, Class A2C, 1 Month LIBOR + 0.330% | 1.568 | (c) | 01/25/36 | 187 | 187,334 | |||||||||||
Amortizing Residential Collateral Trust, | 2.238 | (c) | 11/25/32 | 752 | 746,121 | |||||||||||
Chase Funding Trust, | ||||||||||||||||
Series 2002-3, Class 2A1, 1 Month | 1.878 | (c) | 08/25/32 | 312 | 286,076 | |||||||||||
Series 2003-4, Class 1A5 | 5.277 | 05/25/33 | 796 | 806,469 | ||||||||||||
Citigroup Mortgage Loan Trust, Inc., | ||||||||||||||||
Series 2005-OPT1, Class M1, 1 Month | 1.868 | (c) | 02/25/35 | 317 | 312,073 | |||||||||||
Series 2005-WF1, Class A5 | 5.010 | (cc) | 11/25/34 | 54 | 55,076 | |||||||||||
Countrywide Asset-Backed Certificates, | ||||||||||||||||
Series 2003-BC4, Class M1, 1 Month | 2.288 | (c) | 07/25/33 | 1,048 | 1,043,362 | |||||||||||
Series 2004-1, Class M1, 1 Month LIBOR + 0.750% | 1.988 | (c) | 03/25/34 | 156 | 157,264 | |||||||||||
Series 2004-3, Class 1A, 1 Month LIBOR + 0.420% | 1.658 | (c) | 08/25/34 | 8,501 | 8,050,694 | |||||||||||
Series 2004-6, Class 1A1, 1 Month | 1.778 | (c) | 12/25/34 | 2,135 | 2,068,694 | |||||||||||
Series 2004-BC4, Class M1, 1 Month | 2.288 | (c) | 11/25/34 | 757 | 757,740 | |||||||||||
Credit-Based Asset Servicing and Securitization LLC, | ||||||||||||||||
Series 2003-CB3, Class AF1 | 3.379 | 12/25/32 | 158 | 156,450 | ||||||||||||
Series 2003-CB5, Class M1, 1 Month | 2.258 | (c) | 11/25/33 | 795 | 774,882 | |||||||||||
Series 2004-CB1, Class AF1 | 4.520 | 10/25/32 | 1,974 | 1,991,403 | ||||||||||||
CSMC Trust, | ||||||||||||||||
Series 2016-RPL1, Class A1, 144A, 1 Month | 4.385 | (c) | 12/26/46 | 5,983 | 6,001,581 | |||||||||||
Series 2017-6R, 144A, 1M LIBOR + 1.550% | 2.786 | (c) | 03/06/47 | 3,105 | 3,112,838 | |||||||||||
Finance America Mortgage Loan Trust, | ||||||||||||||||
Series 2003-1, Class M1, 1 Month LIBOR + 1.050% | 2.288 | (c) | 09/25/33 | 2,057 | 1,999,196 | |||||||||||
Series 2004-2, Class M1, 1 Month LIBOR + 0.825% | 2.063 | (c) | 08/25/34 | 6,157 | 6,071,277 | |||||||||||
See Notes to Financial Statements.
| Prudential Absolute Return Bond Fund | 25 |
Schedule of Investments (continued)
as of October 31, 2017
| Description | Interest Rate | Maturity Date | Principal Amount (000)# | Value | ||||||||||||
ASSET-BACKED SECURITIES (Continued) |
| |||||||||||||||
Residential Mortgage-Backed Securities (cont’d.) |
| |||||||||||||||
First Franklin Mortgage Loan Trust, Series 2004-FF5, Class A2, 1 Month LIBOR + 0.760% | 1.998 | %(c) | 08/25/34 | 1,279 | $ | 1,230,871 | ||||||||||
Fremont Home Loan Trust, Series 2004-4, Class M1, 1 Month LIBOR + 0.795% | 2.033 | (c) | 03/25/35 | 2,512 | 2,498,136 | |||||||||||
GSAMP Trust, | ||||||||||||||||
Series 2003-HE2, Class A1A, 144A, 1 Month LIBOR + 0.600% | 1.838 | (c) | 08/25/33 | 930 | 901,804 | |||||||||||
Series 2004-AR1, Class A2B, 1 Month | 2.438 | (c) | 06/25/34 | 1,422 | 1,414,112 | |||||||||||
Series 2004-NC2, Class A1B, 1 Month | 2.138 | (c) | 10/25/34 | 1,787 | 1,618,982 | |||||||||||
JPMorgan Mortgage Acquisition Corp., | 1.668 | (c) | 12/25/35 | 708 | 707,491 | |||||||||||
Long Beach Mortgage Loan Trust, | ||||||||||||||||
Series 2003-4, Class AV1, 1 Month | 1.858 | (c) | 08/25/33 | 1,464 | 1,431,357 | |||||||||||
Series 2004-2, Class A1, 1 Month | 1.678 | (c) | 06/25/34 | 985 | 946,848 | |||||||||||
Morgan Stanley ABS Capital I, Inc., Trust, | ||||||||||||||||
Series 2004-NC5, Class M1, 1 Month | 2.138 | (c) | 05/25/34 | 288 | 286,118 | |||||||||||
Series 2004-NC6, Class M1, 1 Month | 2.138 | (c) | 07/25/34 | 1,867 | 1,787,910 | |||||||||||
Park Place Securities, Inc., Asset-Backed Pass-Through Certificates, | ||||||||||||||||
Series 2005-WCH1, Class M3, 1 Month | 2.078 | (c) | 01/25/36 | 1,406 | 1,411,808 | |||||||||||
Series 2005-WCW1, Class M1, 1 Month | 1.688 | (c) | 09/25/35 | 672 | 672,753 | |||||||||||
Saxon Asset Securities Trust, Series 2005-3, Class M1, 1 Month LIBOR + 0.460% | 1.698 | (c) | 11/25/35 | 74 | 74,033 | |||||||||||
Specialty Underwriting & Residential Finance Trust, | ||||||||||||||||
Series 2003-BC4, Class M1, 1 Month | 2.138 | (c) | 11/25/34 | 1,580 | 1,514,889 | |||||||||||
Series 2004-BC2, Class M1, 1 Month | 2.063 | (c) | 05/25/35 | 2,394 | 2,386,823 | |||||||||||
Series 2004-BC3, Class M1, 1 Month | 2.168 | (c) | 07/25/35 | 1,365 | 1,356,453 | |||||||||||
Series 2004-BC4, Class A2C, 1 Month | 2.218 | (c) | 10/25/35 | 1,379 | 1,352,041 | |||||||||||
See Notes to Financial Statements.
| 26 |
| Description | Interest Rate | Maturity Date | Principal Amount (000)# | Value | ||||||||||||
ASSET-BACKED SECURITIES (Continued) |
| |||||||||||||||
Residential Mortgage-Backed Securities (cont’d.) |
| |||||||||||||||
Structured Asset Investment Loan Trust, | ||||||||||||||||
Series 2004-8, Class A8, 1 Month LIBOR + 1.000% | 2.238 | %(c) | 09/25/34 | 2,123 | $ | 2,077,671 | ||||||||||
Series 2004-BNC1, Class A2, 1 Month LIBOR + 1.000% | 2.238 | (c) | 09/25/34 | 3,730 | 3,729,603 | |||||||||||
Series 2005-3, Class M2, 1 Month LIBOR + 0.660% | 1.898 | (c) | 04/25/35 | 1,272 | 1,272,541 | |||||||||||
VOLT LVII LLC, Series 2017-NPL4, Class A1, 144A | 3.375 | 04/25/47 | 559 | 562,431 | ||||||||||||
VOLT LX LLC, Series 2017-NPL7, Class A1, 144A | 3.250 | 04/25/59 | 679 | 682,814 | ||||||||||||
VOLT LXIII LLC, Series 2017-NP10, Class A1, 144A^ | 3.000 | 10/25/47 | 2,900 | 2,900,000 | ||||||||||||
|
| |||||||||||||||
| 67,396,019 | ||||||||||||||||
|
| |||||||||||||||
TOTAL ASSET-BACKED SECURITIES |
| 550,172,015 | ||||||||||||||
|
| |||||||||||||||
BANK LOANS 1.6% |
| |||||||||||||||
Capital Goods 0.1% |
| |||||||||||||||
Richmond UK Bidco, Ltd. (United Kingdom), Facility B, 3 Month GBP LIBOR + 4.250% | 4.650 | (c) | 03/03/24 | GBP | 1,000 | 1,322,500 | ||||||||||
Chemicals 0.1% |
| |||||||||||||||
Ceramtec Service Gmbh (Germany), | ||||||||||||||||
Initial Euro Term B-1 Loan, 3 Month EURIBOR + 3.000% | 3.750 | (c) | 08/28/20 | EUR | 1,304 | 1,522,196 | ||||||||||
Initial Euro Term B-2 Loan, 3 Month EURIBOR + 3.000% | 3.750 | (c) | 08/28/20 | EUR | 396 | 462,999 | ||||||||||
|
| |||||||||||||||
| 1,985,195 | ||||||||||||||||
Consumer 0.2% |
| |||||||||||||||
CD&R Firefly Bidco, Ltd. (United Kingdom), Facility B1, 3 Month GBP LIBOR + 4.500% | 4.840 | (c) | 07/15/22 | GBP | 3,000 | 4,028,263 | ||||||||||
Diversified Financial Services 0.3% |
| |||||||||||||||
McAfee LLC, | ||||||||||||||||
First Lien Closing Date USD Term Loan, 3 Month LIBOR + 4.500% | 5.830 | (c) | 09/30/24 | 3,275 | 3,295,161 | |||||||||||
Second Lien Initial Loan, 3 Month LIBOR + 8.500% | 9.830 | (c) | 09/29/25 | 1,950 | 1,965,843 | |||||||||||
|
| |||||||||||||||
| 5,261,004 | ||||||||||||||||
Electric 0.1% |
| |||||||||||||||
Lightstone Holdco LLC, | ||||||||||||||||
Refinancing Term B Loan, 1 Month LIBOR + 4.500% | 5.740 | (c) | 01/30/24 | 1,539 | 1,544,973 | |||||||||||
Refinancing Term C Loan, 1 Month LIBOR + 4.500% | 5.740 | (c) | 01/30/24 | 96 | 96,268 | |||||||||||
|
| |||||||||||||||
| 1,641,241 | ||||||||||||||||
See Notes to Financial Statements.
| Prudential Absolute Return Bond Fund | 27 |
Schedule of Investments (continued)
as of October 31, 2017
| Description | Interest Rate | Maturity Date | Principal Amount (000)# | Value | ||||||||||||
BANK LOANS (Continued) |
| |||||||||||||||
Gaming 0.1% |
| |||||||||||||||
Cyan Blue Holdco 3, Ltd. (United Kingdom), | ||||||||||||||||
Term Loan | 4.250 | % | 07/31/24 | GBP | 1,200 | $ | 1,604,841 | |||||||||
Health Care & Pharmaceutical 0.3% |
| |||||||||||||||
Avantor, Term Loan, 3 Month EURIBOR + 4.250% | 4.250 | (c) | 09/30/24 | EUR | 1,375 | 1,611,678 | ||||||||||
Nidda Healthcare Holdings AG (Germany), Term Loan, 3 Month GBP LIBOR + 4.500% | 4.171 | (c) | 09/30/24 | GBP | 1,700 | 2,274,376 | ||||||||||
Valeant Pharmaceuticals International, Inc., Series F Tranche B Term Loan, 1 Month LIBOR + 4.750% | 5.990 | (c) | 04/01/22 | 1,132 | 1,153,978 | |||||||||||
|
| |||||||||||||||
| 5,040,032 | ||||||||||||||||
Retail 0.1% |
| |||||||||||||||
Intervias Finco, Ltd. (United Kingdom), Facility D1, 3 Month GBP LIBOR + 5.000% | 5.440 | (c) | 01/31/23 | GBP | 2,100 | 2,803,825 | ||||||||||
Technology 0.3% |
| |||||||||||||||
BMC Software Finance, Inc., Initial B-1 US Term Loans, 1 Month LIBOR + 4.000% | 5.240 | (c) | 09/10/22 | 1,897 | 1,908,570 | |||||||||||
First Data Corp., 2020 Term A Loan, 1 Month LIBOR + 1.750% - 2.000% | 3.115 | (c) | 06/02/20 | 3,128 | 3,132,035 | |||||||||||
|
| |||||||||||||||
| 5,040,605 | ||||||||||||||||
|
| |||||||||||||||
TOTAL BANK LOANS |
| 28,727,506 | ||||||||||||||
|
| |||||||||||||||
COMMERCIAL MORTGAGE-BACKED SECURITIES 6.6% |
| |||||||||||||||
BANK, Series 2017-BNK8, Class A3^ | 3.229 | 11/15/50 | 1,300 | 1,312,964 | ||||||||||||
COMM Mortgage Trust, | ||||||||||||||||
Series 2012-CR1, Class XA, IO | 1.879 | (cc) | 05/15/45 | 11,711 | 813,006 | |||||||||||
Series 2013-CR7, Class A3 | 2.929 | 03/10/46 | 243 | 246,680 | ||||||||||||
Series 2015-LC19, Class XB, IO, 144A | 0.268 | (cc) | 02/10/48 | 123,049 | 2,159,202 | |||||||||||
Commercial Mortgage Loan Trust, Series 2008-LS1, Class A1A | 6.031 | (cc) | 12/10/49 | 152 | 152,014 | |||||||||||
CSAIL Commercial Mortgage Trust, Series 2015-C1, Class XB, IO | 0.255 | (cc) | 04/15/50 | 66,743 | 1,159,880 | |||||||||||
CSMC Trust, | ||||||||||||||||
Series 2017-LSTK, Class D, 144A | 3.331 | (cc) | 04/05/33 | 6,850 | 6,847,111 | |||||||||||
Series 2017-LSTK, Class E, 144A | 3.331 | (cc) | 04/05/33 | 12,575 | 12,489,767 | |||||||||||
DBWF Mortgage Trust, Series 2016-85T, Class E, 144A | 3.808 | (cc) | 12/10/36 | 15,500 | 14,660,911 | |||||||||||
See Notes to Financial Statements.
| 28 |
| Description | Interest Rate | Maturity Date | Principal Amount (000)# | Value | ||||||||||||
COMMERCIAL MORTGAGE-BACKED SECURITIES (Continued) |
| |||||||||||||||
FHLMC Multifamily Structured Pass-Through Certificates, | ||||||||||||||||
Series K007, Class X1, IO | 1.219 | %(cc) | 04/25/20 | 4,174 | $ | 88,442 | ||||||||||
Series K008, Class X1, IO | 1.537 | 06/25/20 | 18,726 | 619,591 | ||||||||||||
Series K010, Class X1, IO | 0.174 | 10/25/20 | 18,378 | 89,559 | ||||||||||||
Series K018, Class X1, IO | 1.376 | 01/25/22 | 15,568 | 721,868 | ||||||||||||
Series K020, Class X1, IO | 1.429 | (cc) | 05/25/22 | 20,353 | 1,084,230 | |||||||||||
Series K021, Class X1, IO | 1.468 | 06/25/22 | 4,198 | 235,051 | ||||||||||||
Series K025, Class X1, IO | 0.999 | (cc) | 10/25/22 | 93,240 | 3,307,858 | |||||||||||
Series K055, Class X1, IO | 1.368 | (cc) | 03/25/26 | 23,225 | 2,170,767 | |||||||||||
Series K066, Class X1,IO | 0.753 | (cc) | 06/25/27 | 237,331 | 14,378,449 | |||||||||||
Series K710, Class X1, IO | 1.735 | (cc) | 05/25/19 | 450 | 9,055 | |||||||||||
Series K711, Class X1, IO | 1.685 | (cc) | 07/25/19 | 3,725 | 76,850 | |||||||||||
GS Mortgage Securities Corp. II, | ||||||||||||||||
Series 2013-GC10, Class XB, IO, 144A | 0.498 | (cc) | 02/10/46 | 103,126 | 2,507,282 | |||||||||||
Series 2014-GC20, Class XB, IO | 0.330 | (cc) | 04/10/47 | 28,307 | 750,022 | |||||||||||
GS Mortgage Securities Trust, Series 2017-GS7, Class A3 | 3.167 | 08/10/50 | 16,900 | 17,262,432 | ||||||||||||
JPMBB Commercial Mortgage Securities Trust, | ||||||||||||||||
Series 2014-C21, Class XB, IO | 0.319 | (cc) | 08/15/47 | 45,056 | 937,827 | |||||||||||
Series 2015-C27, Class XB, IO | 0.446 | (cc) | 02/15/48 | 52,766 | 1,465,945 | |||||||||||
JPMorgan Chase Commercial Mortgage Securities Trust, Series 2013-LC11, Class XB, IO | 0.548 | (cc) | 04/15/46 | 34,956 | 930,857 | |||||||||||
Morgan Stanley Bank of America Merrill Lynch Trust, | ||||||||||||||||
Series 2012-C5, Class XB, IO, 144A | 0.245 | (cc) | 08/15/45 | 65,968 | 777,644 | |||||||||||
Series 2013-C8, Class XB, IO, 144A | 0.497 | (cc) | 12/15/48 | 68,276 | 1,489,332 | |||||||||||
Morgan Stanley Capital I Trust, Series 2015-XLF1, Class B, 144A, 1 Month LIBOR + 1.750% | 2.989 | (cc) | 08/14/31 | 7,709 | 7,736,136 | |||||||||||
UBS-Barclays Commercial Mortgage Trust, Series 2013-C6, Class XB, IO, 144A | 0.400 | (cc) | 04/10/46 | 140,883 | 2,881,903 | |||||||||||
Wells Fargo Commercial Mortgage Trust, | ||||||||||||||||
Series 2017-C39, Class A4 | 3.157 | 09/15/50 | 15,000 | 15,152,968 | ||||||||||||
Series 2017-C39, Class A5 | 3.418 | 09/15/50 | 4,330 | 4,459,558 | ||||||||||||
Series 2017-C40, Class A3 | 3.317 | 10/15/50 | 3,380 | 3,461,826 | ||||||||||||
|
| |||||||||||||||
TOTAL COMMERCIAL MORTGAGE-BACKED SECURITIES |
| 122,436,987 | ||||||||||||||
|
| |||||||||||||||
CORPORATE BONDS 33.6% |
| |||||||||||||||
Airlines 0.6% |
| |||||||||||||||
American Airlines, Pass-Through Trust, Series 2013-1, Class A, Pass Through Certificates | 4.000 | 01/15/27 | 2,876 | 2,987,319 | ||||||||||||
See Notes to Financial Statements.
| Prudential Absolute Return Bond Fund | 29 |
Schedule of Investments (continued)
as of October 31, 2017
| Description | Interest Rate | Maturity Date | Principal Amount (000)# | Value | ||||||||||||
CORPORATE BONDS (Continued) |
| |||||||||||||||
Airlines (cont’d.) |
| |||||||||||||||
Continental Airlines, Inc., Pass-Through Trust, | ||||||||||||||||
Series 2007-1, Class A, Pass-Through Certificates | 5.983 | % | 10/19/23 | 877 | $ | 970,008 | ||||||||||
Series 2012-2, Class A, Pass-Through Certificates | 4.000 | 04/29/26 | 100 | 104,016 | ||||||||||||
Series 2012-3, Class C, Pass-Through Certificates | 6.125 | 04/29/18 | 3,000 | 3,044,100 | ||||||||||||
Delta Air Lines, Inc., Pass-Through Trust | 6.821 | 02/10/24 | 697 | 802,871 | ||||||||||||
Series 2011-1, Class A, Pass-Through Certificates | 5.300 | 10/15/20 | 58 | 60,251 | ||||||||||||
United Airlines Pass-Through Trust, Series 2013-1, Class A, Pass-Through Certificates | 4.300 | 02/15/27 | 2,088 | 2,218,286 | ||||||||||||
|
| |||||||||||||||
| 10,186,851 | ||||||||||||||||
Auto Manufacturers 0.2% |
| |||||||||||||||
General Motors Co., Sr. Unsec’d. Notes | 6.250 | 10/02/43 | 2,230 | 2,574,012 | ||||||||||||
Jaguar Land Rover Automotive PLC (United Kingdom), Gtd. Notes, 144A | 2.200 | 01/15/24 | EUR | 450 | 533,356 | |||||||||||
|
| |||||||||||||||
| 3,107,368 | ||||||||||||||||
Auto Parts & Equipment 0.4% |
| |||||||||||||||
Lear Corp., | ||||||||||||||||
Sr. Unsec’d. Notes | 5.250 | 01/15/25 | 5,375 | 5,759,694 | ||||||||||||
Sr. Unsec’d. Notes | 5.375 | 03/15/24 | 1,410 | 1,504,425 | ||||||||||||
|
| |||||||||||||||
| 7,264,119 | ||||||||||||||||
Banks 5.9% |
| |||||||||||||||
Banco de Costa Rica (Costa Rica), Gov’t. Gtd. Notes | 5.250 | 08/12/18 | 3,328 | 3,369,600 | ||||||||||||
Bank of America Corp., | ||||||||||||||||
Jr. Sub. Notes, 3 Month LIBOR + 3.387% | 5.125 | (c) | 12/31/49 | 2,175 | 2,226,656 | |||||||||||
Jr. Sub. Notes, 3 Month LIBOR + 3.898% | 6.100 | (c) | 12/31/49 | 8,820 | 9,845,325 | |||||||||||
Sr. Unsec’d. Notes, 3 Month LIBOR + 1.990%, MTN | 4.443 | (c) | 01/20/48 | 1,560 | 1,690,696 | |||||||||||
Sr. Unsec’d. Notes, MTN | 5.000 | 01/21/44 | 690 | 801,978 | ||||||||||||
Citigroup, Inc., | ||||||||||||||||
Jr. Sub. Notes, 3 Month LIBOR + 4.095% | 5.950 | (c) | 12/31/49 | 12,685 | 13,384,958 | |||||||||||
Sr. Unsec’d. Notes | 8.125 | 07/15/39 | 1,455 | 2,285,546 | ||||||||||||
Sub. Notes | 4.400 | 06/10/25 | 405 | 427,954 | ||||||||||||
Sub. Notes | 4.750 | 05/18/46 | 395 | 428,776 | ||||||||||||
Credit Suisse AG (Switzerland), Sr. Unsec’d. Notes, MTN | 3.625 | 09/09/24 | 2,375 | 2,472,714 | ||||||||||||
Credit Suisse Group Funding Guernsey Ltd. (Switzerland), Gtd. Notes(a) | 3.750 | % | 3/26/25 | 1,200 | 1,232,449 | |||||||||||
Development Bank of Japan, Inc. (Japan), Gov’t. Gtd. Notes, GMTN | 2.125 | 01/30/19 | 3,000 | 3,001,962 | ||||||||||||
Dexia Credit Local SA (France), | ||||||||||||||||
Gov’t. Liquid Gtd. Notes | 1.875 | 01/29/20 | 1,000 | 995,841 | ||||||||||||
Gov’t. Liquid Gtd. Notes, 144A | 1.875 | 09/15/21 | 2,000 | 1,966,565 | ||||||||||||
See Notes to Financial Statements.
| 30 |
| Description | Interest Rate | Maturity Date | Principal Amount (000)# | Value | ||||||||||||
CORPORATE BONDS (Continued) |
| |||||||||||||||
Banks (cont’d.) |
| |||||||||||||||
Discover Bank, | ||||||||||||||||
Sr. Unsec’d. Notes | 4.200 | % | 08/08/23 | 5,500 | $ | 5,844,300 | ||||||||||
Sub. Notes | 7.000 | 04/15/20 | 800 | 883,846 | ||||||||||||
Goldman Sachs Group, Inc. (The), | ||||||||||||||||
Jr. Sub. Notes | 5.375 | 12/31/49 | 5,225 | 5,420,938 | ||||||||||||
Sr. Unsec’d. Notes | 3.850 | 01/26/27 | 3,940 | 4,031,328 | ||||||||||||
Sr. Unsec’d. Notes | 6.250 | 02/01/41 | 345 | 456,550 | ||||||||||||
Sr. Unsec’d. Notes, MTN | 4.800 | 07/08/44 | 2,105 | 2,350,588 | ||||||||||||
JPMorgan Chase & Co., | ||||||||||||||||
Jr. Sub. Notes | 5.150 | 12/31/49 | 3,725 | 3,919,631 | ||||||||||||
Jr. Sub. Notes | 6.000 | 12/31/49 | 7,707 | 8,496,968 | ||||||||||||
Jr. Sub. Notes | 6.100 | 12/31/49 | 3,400 | 3,791,000 | ||||||||||||
Jr. Sub. Notes | 7.900 | 12/31/49 | 130 | 133,315 | ||||||||||||
Morgan Stanley, | ||||||||||||||||
Jr. Sub. Notes | 5.450 | 12/31/49 | 13,110 | 13,595,070 | ||||||||||||
Sr. Unsec’d. Notes | 4.375 | 01/22/47 | 2,435 | 2,586,025 | ||||||||||||
Sr. Unsec’d. Notes | 3.971 | 07/22/38 | 465 | 470,981 | ||||||||||||
Sr. Unsec’d. Notes, MTN | 6.375 | 07/24/42 | 700 | 950,639 | ||||||||||||
Sub. Notes, MTN | 4.100 | 05/22/23 | 1,710 | 1,800,300 | ||||||||||||
National Savings Bank (Sri Lanka), Sr. Unsec’d. Notes | 8.875 | 09/18/18 | 1,000 | 1,044,600 | ||||||||||||
People’s United Bank, Sub. Notes | 4.000 | 07/15/24 | 1,125 | 1,152,981 | ||||||||||||
Russian Agricultural Bank OJSC Via RSHB Capital SA (Russia), Sr. Unsec’d. Notes, 144A | 7.750 | 05/29/18 | 1,485 | 1,524,961 | ||||||||||||
State Street Corp., Jr. Sub. Notes, 3 Month | 5.250 | (c) | 12/31/49 | 3,555 | 3,746,081 | |||||||||||
Turkiye Garanti Bankasi AS (Turkey), Sr. Unsec’d. Notes, 144A | 5.875 | 03/16/23 | 2,435 | 2,504,398 | ||||||||||||
|
| |||||||||||||||
| 108,835,520 | ||||||||||||||||
Beverages 0.2% |
| |||||||||||||||
Anheuser-Busch InBev Worldwide, Inc. (Belgium), Gtd. Notes | 8.200 | 01/15/39 | 250 | 395,053 | ||||||||||||
Central American Bottling Corp. (Guatemala), Gtd. Notes, 144A | 5.750 | 01/31/27 | 1,500 | 1,583,760 | ||||||||||||
Coca-Cola Icecek A/S (Turkey), Sr. Unsec’d. Notes, 144A | 4.750 | 10/01/18 | 950 | 964,852 | ||||||||||||
Constellation Brands, Inc., Gtd. Notes | 6.000 | 05/01/22 | 450 | 511,606 | ||||||||||||
|
| |||||||||||||||
| 3,455,271 | ||||||||||||||||
Biotechnology 0.1% |
| |||||||||||||||
Amgen, Inc., Sr. Unsec’d. Notes | 4.663 | 06/15/51 | 439 | 474,779 | ||||||||||||
Celgene Corp., | ||||||||||||||||
Sr. Unsec’d. Notes | 2.125 | 08/15/18 | 30 | 30,085 | ||||||||||||
Sr. Unsec’d. Notes | 4.350 | 11/15/47 | 2,100 | 2,094,393 | ||||||||||||
|
| |||||||||||||||
| 2,599,257 | ||||||||||||||||
See Notes to Financial Statements.
| Prudential Absolute Return Bond Fund | 31 |
Schedule of Investments (continued)
as of October 31, 2017
| Description | Interest Rate | Maturity Date | Principal Amount (000)# | Value | ||||||||||||
CORPORATE BONDS (Continued) |
| |||||||||||||||
Building Materials 1.1% |
| |||||||||||||||
Cemex SAB de CV (Mexico), Sr. Sec’d. Notes, 144A | 4.750 | % | 01/11/22 | EUR | 1,600 | $ | 1,922,076 | |||||||||
Griffon Corp., Gtd. Notes | 5.250 | 03/01/22 | 6,450 | 6,544,815 | ||||||||||||
Johnson Controls International PLC, Sr. Unsec’d. Notes | 4.250 | 03/01/21 | 3,090 | 3,262,013 | ||||||||||||
Owens Corning, Inc., Gtd. Notes | 4.200 | 12/15/22 | 125 | 132,391 | ||||||||||||
Standard Industries Inc., Sr. Unsec’d. Notes, 144A | 5.375 | 11/15/24 | 5,000 | 5,274,500 | ||||||||||||
US Concrete, Inc., Gtd. Notes | 6.375 | 06/01/24 | 2,400 | 2,580,000 | ||||||||||||
|
| |||||||||||||||
| 19,715,795 | ||||||||||||||||
Chemicals 1.0% |
| |||||||||||||||
Agrium, Inc. (Canada), | ||||||||||||||||
Sr. Unsec’d. Notes | 4.900 | 06/01/43 | 1,350 | 1,489,879 | ||||||||||||
Sr. Unsec’d. Notes | 6.125 | 01/15/41 | 170 | 213,537 | ||||||||||||
Ashland, Inc., Gtd. Notes | 6.875 | 05/15/43 | 4,100 | 4,592,000 | ||||||||||||
CF Industries, Inc., | ||||||||||||||||
Gtd. Notes | 4.950 | 06/01/43 | 1,765 | 1,619,387 | ||||||||||||
Gtd. Notes | 5.375 | 03/15/44 | 1,300 | 1,248,000 | ||||||||||||
Gtd. Notes | 6.875 | 05/01/18 | 160 | 163,800 | ||||||||||||
Gtd. Notes | 7.125 | 05/01/20 | 125 | 137,500 | ||||||||||||
Dow Chemical Co. (The), | ||||||||||||||||
Sr. Unsec’d. Notes | 4.625 | 10/01/44 | 15 | 16,071 | ||||||||||||
Sr. Unsec’d. Notes | 5.250 | 11/15/41 | 125 | 143,681 | ||||||||||||
Sr. Unsec’d. Notes | 9.400 | 05/15/39 | 95 | 159,788 | ||||||||||||
Eastman Chemical Co., Sr. Unsec’d. Notes | 4.650 | 10/15/44 | 1,210 | 1,300,520 | ||||||||||||
LYB International Finance BV, | ||||||||||||||||
Gtd. Notes | 4.875 | 03/15/44 | 1,160 | 1,270,931 | ||||||||||||
Gtd. Notes | 5.250 | 07/15/43 | 415 | 479,268 | ||||||||||||
LyondellBasell Industries NV, Sr. Unsec’d. Notes | 4.625 | 02/26/55 | 2,765 | 2,831,141 | ||||||||||||
Mexichem SAB de CV (Mexico), Sr. Unsec’d. Notes, 144A | 5.500 | 01/15/48 | 1,175 | 1,140,573 | ||||||||||||
Sherwin-Williams Co. (The), Sr. Unsec’d. Notes | 3.450 | 06/01/27 | 635 | 645,065 | ||||||||||||
|
| |||||||||||||||
| 17,451,141 | ||||||||||||||||
Commercial Services 0.8% |
| |||||||||||||||
ERAC USA Finance LLC, | ||||||||||||||||
Gtd. Notes, 144A | 6.700 | 06/01/34 | 110 | 138,011 | ||||||||||||
Gtd. Notes, 144A(a) | 7.000 | 10/15/37 | 1,725 | 2,288,029 | ||||||||||||
Laureate Education, Inc., Gtd. Notes, 144A | 8.250 | 05/01/25 | 4,125 | 4,439,531 | ||||||||||||
United Rentals North America, Inc., | ||||||||||||||||
Gtd. Notes | 4.875 | 01/15/28 | 875 | 879,375 | ||||||||||||
Gtd. Notes(a) | 5.500 | 07/15/25 | 925 | 992,641 | ||||||||||||
Gtd. Notes(a) | 5.500 | 05/15/27 | 1,600 | 1,712,000 | ||||||||||||
See Notes to Financial Statements.
| 32 |
| Description | Interest Rate | Maturity Date | Principal Amount (000)# | Value | ||||||||||||
CORPORATE BONDS (Continued) |
| |||||||||||||||
Commercial Services (cont’d.) |
| |||||||||||||||
Western Union Co. (The), Sr. Unsec’d. Notes, 3 Month LIBOR + 0.800% | 2.115 | %(c) | 05/22/19 | 4,300 | $ | 4,304,962 | ||||||||||
|
| |||||||||||||||
| 14,754,549 | ||||||||||||||||
Computers 0.0% |
| |||||||||||||||
NCR Corp., Gtd. Notes | 6.375 | 12/15/23 | 790 | 841,397 | ||||||||||||
Diversified Financial Services 0.2% |
| |||||||||||||||
Grain Spectrum Funding II LLC, Sec’d. Notes, 144A^ | 3.290 | 10/10/34 | 746 | 743,919 | ||||||||||||
International Lease Finance Corp., Sr. Unsec’d. Notes | 6.250 | 05/15/19 | 25 | 26,510 | ||||||||||||
Intrum Justitia AB (Sweden), Sr. Unsec’d. Notes, 144A | 3.125 | 07/15/24 | EUR | 1,225 | 1,464,155 | |||||||||||
Jefferies Group LLC, Sr. Unsec’d. Notes | 6.500 | 01/20/43 | 175 | 200,714 | ||||||||||||
Navient Corp., | ||||||||||||||||
Sr. Unsec’d. Notes, MTN | 4.875 | 06/17/19 | 970 | 997,888 | ||||||||||||
Sr. Unsec’d. Notes, MTN | 5.500 | 01/15/19 | 185 | 190,781 | ||||||||||||
Peru Enhanced Pass-Through Finance Ltd. (Peru), Pass-Through Certificates | 1.610 | (s) | 05/31/18 | 108 | 106,168 | |||||||||||
|
| |||||||||||||||
| 3,730,135 | ||||||||||||||||
Electric 1.4% |
| |||||||||||||||
Calpine Corp., | ||||||||||||||||
Sr. Unsec’d. Notes(a) | 5.375 | 01/15/23 | 1,080 | 1,048,950 | ||||||||||||
Sr. Unsec’d. Notes(a) | 5.750 | 01/15/25 | 3,575 | 3,396,250 | ||||||||||||
Comision Federal de Electricidad (Mexico), Sr. Unsec’d. Notes, 144A | 4.875 | 01/15/24 | 1,350 | 1,442,812 | ||||||||||||
DPL, Inc., | ||||||||||||||||
Sr. Unsec’d. Notes | 6.750 | 10/01/19 | 1,650 | 1,736,625 | ||||||||||||
Sr. Unsec’d. Notes(a) | 7.250 | 10/15/21 | 1,475 | 1,628,400 | ||||||||||||
Duke Energy Carolinas LLC, First Ref. Mtge. | 4.000 | 09/30/42 | 50 | 52,655 | ||||||||||||
Dynegy, Inc., Gtd. Notes(a) | 7.375 | 11/01/22 | 6,925 | 7,435,719 | ||||||||||||
FirstEnergy Transmission LLC, Sr. Unsec’d. Notes, 144A | 5.450 | 07/15/44 | 800 | 925,355 | ||||||||||||
Majapahit Holding BV (Indonesia), Gtd. Notes | 7.750 | 01/20/20 | 2,180 | 2,406,284 | ||||||||||||
NextEra Energy Capital Holdings, Inc., Gtd. Notes | 3.625 | 06/15/23 | 1,575 | 1,636,674 | ||||||||||||
NRG Energy, Inc., | ||||||||||||||||
Gtd. Notes | 6.250 | 05/01/24 | 1,748 | 1,857,250 | ||||||||||||
Gtd. Notes | 6.625 | 03/15/23 | 823 | 851,805 | ||||||||||||
South Carolina Electric & Gas Co., First Mtge. | 4.350 | 02/01/42 | 130 | 130,506 | ||||||||||||
Westar Energy, Inc., First Mtge. | 4.100 | 04/01/43 | 325 | 342,899 | ||||||||||||
|
| |||||||||||||||
| 24,892,184 | ||||||||||||||||
See Notes to Financial Statements.
| Prudential Absolute Return Bond Fund | 33 |
Schedule of Investments (continued)
as of October 31, 2017
| Description | Interest Rate | Maturity Date | Principal Amount (000)# | Value | ||||||||||||
CORPORATE BONDS (Continued) |
| |||||||||||||||
Electronics 0.3% |
| |||||||||||||||
Jabil Circuit, Inc., | ||||||||||||||||
Sr. Unsec’d. Notes | 4.700 | % | 09/15/22 | 80 | $ | 85,144 | ||||||||||
Sr. Unsec’d. Notes | 5.625 | 12/15/20 | 5,400 | 5,832,000 | ||||||||||||
|
| |||||||||||||||
| 5,917,144 | ||||||||||||||||
Entertainment 1.5% |
| |||||||||||||||
AMC Entertainment Holdings, Inc., | ||||||||||||||||
Gtd. Notes(a) | 5.875 | 11/15/26 | 900 | 878,625 | ||||||||||||
Gtd. Notes | 6.375 | 11/15/24 | GBP | 1,875 | 2,557,509 | |||||||||||
Cedar Fair LP/Canada’s Wonderland Co./Magnum Management Corp., Gtd. Notes | 5.375 | 06/01/24 | 1,015 | 1,068,287 | ||||||||||||
Cinemark USA, Inc., | ||||||||||||||||
Gtd. Notes | 4.875 | 06/01/23 | 5,500 | 5,603,125 | ||||||||||||
Gtd. Notes(a) | 5.125 | 12/15/22 | 3,200 | 3,280,000 | ||||||||||||
CPUK Finance Ltd. (United Kingdom), | ||||||||||||||||
Sec’d. Notes, 144A | 4.250 | 02/28/47 | GBP | 550 | 747,646 | |||||||||||
Sec’d. Notes, 144A | 4.875 | 02/28/47 | GBP | 200 | 271,141 | |||||||||||
Eldorado Resorts, Inc., Gtd. Notes | 7.000 | 08/01/23 | 3,500 | 3,780,000 | ||||||||||||
NAI Entertainment Holdings/NAI Entertainment Holdings Finance Corp., Sr. Sec’d. Notes, Priv. Placement, 144A | 5.000 | 08/01/18 | 4,615 | 4,619,615 | ||||||||||||
National CineMedia LLC, Sr. Unsec’d. Notes | 5.750 | 08/15/26 | 2,925 | 2,698,312 | ||||||||||||
Scientific Games International, Inc., Gtd. Notes | 10.000 | 12/01/22 | 2,000 | 2,212,360 | ||||||||||||
|
| |||||||||||||||
| 27,716,620 | ||||||||||||||||
Foods 0.5% |
| |||||||||||||||
Ingles Markets, Inc., Sr. Unsec’d. Notes | 5.750 | 06/15/23 | 4,500 | 4,421,250 | ||||||||||||
JBS Investments GmbH (Brazil), Gtd. Notes, 144A | 7.750 | 10/28/20 | 775 | 790,887 | ||||||||||||
JBS USA LLC/JBS USA Finance, Inc. (Brazil), | ||||||||||||||||
Gtd. Notes(a) | 8.250 | 02/01/20 | 1,500 | 1,513,125 | ||||||||||||
Gtd. Notes, 144A | 7.250 | 06/01/21 | 1,300 | 1,325,324 | ||||||||||||
Gtd. Notes, 144A | 7.250 | 06/01/21 | 1,000 | 1,019,480 | ||||||||||||
|
| |||||||||||||||
| 9,070,066 | ||||||||||||||||
Forest Products & Paper 0.6% |
| |||||||||||||||
Cascades, Inc. (Canada), Gtd. Notes, 144A | 5.500 | 07/15/22 | 3,000 | 3,090,000 | ||||||||||||
Georgia-Pacific LLC, | ||||||||||||||||
Gtd. Notes, 144A | 5.400 | 11/01/20 | 35 | 38,219 | ||||||||||||
Sr. Unsec’d. Notes | 7.375 | 12/01/25 | 400 | 511,615 | ||||||||||||
See Notes to Financial Statements.
| 34 |
| Description | Interest Rate | Maturity Date | Principal Amount (000)# | Value | ||||||||||||
CORPORATE BONDS (Continued) |
| |||||||||||||||
Forest Products & Paper (cont’d.) |
| |||||||||||||||
International Paper Co., | ||||||||||||||||
Sr. Unsec’d. Notes | 4.800 | % | 06/15/44 | 2,770 | $ | 3,017,427 | ||||||||||
Sr. Unsec’d. Notes | 6.000 | 11/15/41 | 610 | 760,021 | ||||||||||||
Sr. Unsec’d. Notes | 9.375 | 05/15/19 | 100 | 110,770 | ||||||||||||
Smurfit Kappa Acquisitions (Ireland), Gtd. Notes, 144A | 4.875 | 09/15/18 | 3,647 | 3,702,799 | ||||||||||||
|
| |||||||||||||||
| 11,230,851 | ||||||||||||||||
Gas 0.1% |
| |||||||||||||||
AGL Capital Corp., Gtd. Notes | 4.400 | 06/01/43 | 1,375 | 1,430,783 | ||||||||||||
CenterPoint Energy Resources Corp., Sr. Unsec’d. Notes | 5.850 | 01/15/41 | 700 | 872,271 | ||||||||||||
Dominion Gas Holdings LLC, Sr. Unsec’d. Notes | 4.800 | 11/01/43 | 125 | 136,435 | ||||||||||||
|
| |||||||||||||||
| 2,439,489 | ||||||||||||||||
Healthcare-Services 2.2% |
| |||||||||||||||
Aetna, Inc., | ||||||||||||||||
Sr. Unsec’d. Notes | 2.750 | 11/15/22 | 450 | 452,811 | ||||||||||||
Sr. Unsec’d. Notes | 4.125 | 11/15/42 | 325 | 321,020 | ||||||||||||
Sr. Unsec’d. Notes | 4.500 | 05/15/42 | 530 | 552,107 | ||||||||||||
Anthem, Inc., | ||||||||||||||||
Sr. Unsec’d. Notes(a) | 4.650 | 01/15/43 | 120 | 129,843 | ||||||||||||
Sr. Unsec’d. Notes | 5.100 | 01/15/44 | 515 | 594,394 | ||||||||||||
CHS/Community Health Systems, Inc., | ||||||||||||||||
Gtd. Notes(a) | 8.000 | 11/15/19 | 4,800 | 4,572,000 | ||||||||||||
Sr. Sec’d. Notes | 5.125 | 08/01/21 | 1,550 | 1,507,375 | ||||||||||||
Cigna Corp., Sr. Unsec’d. Notes | 3.250 | 04/15/25 | 890 | 896,931 | ||||||||||||
HCA, Inc., | ||||||||||||||||
Gtd. Notes | 5.375 | 02/01/25 | 4,500 | 4,640,625 | ||||||||||||
Gtd. Notes, Global | 5.875 | 05/01/23 | 2,000 | 2,142,500 | ||||||||||||
Sr. Sec’d. Notes | 5.250 | 04/15/25 | 2,000 | 2,130,000 | ||||||||||||
HealthSouth Corp., | ||||||||||||||||
Gtd. Notes | 5.125 | 03/15/23 | 1,200 | 1,224,000 | ||||||||||||
Gtd. Notes | 5.750 | 11/01/24 | 2,900 | 2,968,875 | ||||||||||||
Laboratory Corp. of America Holdings, | ||||||||||||||||
Sr. Unsec’d. Notes | 3.200 | 02/01/22 | 25 | 25,614 | ||||||||||||
Sr. Unsec’d. Notes | 4.625 | 11/15/20 | 4,500 | 4,773,771 | ||||||||||||
Memorial Sloan-Kettering Cancer Center, Sr. Unsec’d. Notes | 4.125 | 07/01/52 | 75 | 77,229 | ||||||||||||
Select Medical Corp., Gtd. Notes | 6.375 | 06/01/21 | 5,371 | 5,525,416 | ||||||||||||
Tenet Healthcare Corp., | ||||||||||||||||
Sr. Sec’d. Notes | 4.375 | 10/01/21 | 2,125 | 2,117,562 | ||||||||||||
Sr. Unsec’d. Notes(a) | 8.125 | 04/01/22 | 2,700 | 2,713,500 | ||||||||||||
Sr. Unsec’d. Notes, 144A(a) | 7.000 | 08/01/25 | 2,950 | 2,702,937 | ||||||||||||
See Notes to Financial Statements.
| Prudential Absolute Return Bond Fund | 35 |
Schedule of Investments (continued)
as of October 31, 2017
| Description | Interest Rate | Maturity Date | Principal Amount (000)# | Value | ||||||||||||
CORPORATE BONDS (Continued) |
| |||||||||||||||
Healthcare-Services (cont’d.) |
| |||||||||||||||
UnitedHealth Group, Inc., | ||||||||||||||||
Sr. Unsec’d. Notes | 3.950 | % | 10/15/42 | 175 | $ | 179,159 | ||||||||||
Sr. Unsec’d. Notes | 4.375 | 03/15/42 | 1,055 | 1,143,825 | ||||||||||||
|
| |||||||||||||||
| 41,391,494 | ||||||||||||||||
Home Builders 2.1% |
| |||||||||||||||
Brookfield Residential Properties, Inc./Brookfield Residential US Corp. (Canada), Gtd. Notes, 144A(a) | 6.125 | 07/01/22 | 5,000 | 5,218,750 | ||||||||||||
CalAtlantic Group, Inc., Gtd. Notes | 8.375 | 05/15/18 | 4,553 | 4,700,972 | ||||||||||||
KB Home, Gtd. Notes | 7.500 | 09/15/22 | 3,425 | 3,964,438 | ||||||||||||
M/I Homes, Inc., Gtd. Notes | 6.750 | 01/15/21 | 5,850 | 6,084,000 | ||||||||||||
Meritage Homes Corp., Gtd. Notes | 5.125 | 06/06/27 | 3,500 | 3,539,375 | ||||||||||||
PulteGroup, Inc., Gtd. Notes(a) | 5.500 | 03/01/26 | 4,000 | 4,385,000 | ||||||||||||
Taylor Morrison Communities, Inc./Taylor Morrison Holdings II, Inc., Gtd. Notes, 144A | 5.250 | 04/15/21 | 6,700 | 6,842,308 | ||||||||||||
William Lyon Homes, Inc., Gtd. Notes | 5.750 | 04/15/19 | 4,725 | 4,784,062 | ||||||||||||
|
| |||||||||||||||
| 39,518,905 | ||||||||||||||||
Housewares 0.1% |
| |||||||||||||||
Newell Brands, Inc., Sr. Unsec’d. Notes | 5.500 | 04/01/46 | 2,000 | 2,373,904 | ||||||||||||
Insurance 1.1% |
| |||||||||||||||
Hartford Financial Services Group, Inc. (The), | ||||||||||||||||
Sr. Unsec’d. Notes | 5.950 | 10/15/36 | 215 | 269,563 | ||||||||||||
Sr. Unsec’d. Notes | 6.100 | 10/01/41 | 280 | 364,660 | ||||||||||||
Liberty Mutual Group, Inc., | ||||||||||||||||
Gtd. Notes, 144A | 4.250 | 06/15/23 | 1,975 | 2,100,285 | ||||||||||||
Gtd. Notes, 144A | 4.850 | 08/01/44 | 1,000 | 1,088,362 | ||||||||||||
Gtd. Notes, 144A | 4.950 | 05/01/22 | 75 | 81,915 | ||||||||||||
Gtd. Notes, 144A | 6.500 | 05/01/42 | 1,530 | 2,011,722 | ||||||||||||
Lincoln National Corp., Sr. Unsec’d. Notes | 7.000 | 06/15/40 | 695 | 933,530 | ||||||||||||
Markel Corp., | ||||||||||||||||
Sr. Unsec’d. Notes | 4.900 | 07/01/22 | 2,020 | 2,197,853 | ||||||||||||
Sr. Unsec’d. Notes | 5.000 | 03/30/43 | 3,125 | 3,422,170 | ||||||||||||
Nuveen Finance LLC, Sr. Unsec’d. Notes, 144A | 2.950 | 11/01/19 | 1,720 | 1,744,943 | ||||||||||||
Principal Financial Group, Inc., Gtd. Notes | 4.350 | 05/15/43 | 975 | 1,025,540 | ||||||||||||
Swiss Re Treasury US Corp. (Switzerland), Gtd. Notes, 144A | 4.250 | 12/06/42 | 795 | 816,991 | ||||||||||||
See Notes to Financial Statements.
| 36 |
| Description | Interest Rate | Maturity Date | Principal Amount (000)# | Value | ||||||||||||
CORPORATE BONDS (Continued) |
| |||||||||||||||
Insurance (cont’d.) |
| |||||||||||||||
Teachers Insurance & Annuity Association of America, | ||||||||||||||||
Sub. Notes, 144A | 4.270 | % | 05/15/47 | 640 | $ | 664,954 | ||||||||||
Sub. Notes, 144A | 4.900 | 09/15/44 | 1,950 | 2,215,044 | ||||||||||||
Sub. Notes, 144A | 6.850 | 12/16/39 | 54 | 74,742 | ||||||||||||
W.R. Berkley Corp., Sr. Unsec’d. Notes | 4.625 | 03/15/22 | 1,435 | 1,540,323 | ||||||||||||
|
| |||||||||||||||
| 20,552,597 | ||||||||||||||||
Internet 0.2% |
| |||||||||||||||
Netflix, Inc., Sr. Unsec’d. Notes, 144A | 3.625 | 05/15/27 | EUR | 2,600 | 3,108,110 | |||||||||||
Iron/Steel 0.0% |
| |||||||||||||||
Vale Overseas Ltd. (Brazil), Gtd. Notes(a) | 6.250 | 08/10/26 | 404 | 465,509 | ||||||||||||
Leisure Time 0.1% |
| |||||||||||||||
Silversea Cruise Finance Ltd., Sr. Sec’d. Notes, 144A | 7.250 | 02/01/25 | 2,225 | 2,386,312 | ||||||||||||
Lodging 0.6% |
| |||||||||||||||
Jack Ohio Finance LLC/Jack Ohio Finance 1 Corp., Sr. Sec’d. Notes, 144A | 6.750 | 11/15/21 | 4,500 | 4,803,750 | ||||||||||||
Marriott International, Inc., | ||||||||||||||||
Sr. Unsec’d. Notes | 3.250 | 09/15/22 | 75 | 76,268 | ||||||||||||
Sr. Unsec’d. Notes | 7.150 | 12/01/19 | 550 | 604,648 | ||||||||||||
MGM Resorts International, Gtd. Notes(a) | 6.000 | 03/15/23 | 3,600 | 3,947,040 | ||||||||||||
Studio City Co. Ltd. (Hong Kong), | ||||||||||||||||
Sr. Sec’d. Notes | 7.250 | 11/30/21 | 500 | 535,050 | ||||||||||||
Sr. Sec’d. Notes, 144A | 7.250 | 11/30/21 | 1,200 | 1,284,120 | ||||||||||||
|
| |||||||||||||||
| 11,250,876 | ||||||||||||||||
Machinery-Diversified 0.0% |
| |||||||||||||||
Xylem, Inc., Sr. Unsec’d. Notes | 4.875 | 10/01/21 | 50 | 54,323 | ||||||||||||
Media 2.4% |
| |||||||||||||||
CCO Holdings LLC/CCO Holdings Capital Corp., | ||||||||||||||||
Sr. Unsec’d. Notes | 5.750 | 01/15/24 | 1,100 | 1,142,625 | ||||||||||||
Sr. Unsec’d. Notes, 144A | 5.125 | 05/01/23 | 2,625 | 2,736,562 | ||||||||||||
Sr. Unsec’d. Notes, 144A | 5.375 | 05/01/25 | 1,650 | 1,711,875 | ||||||||||||
Sr. Unsec’d. Notes, 144A | 5.875 | 05/01/27 | 5,075 | 5,314,540 | ||||||||||||
Cequel Communications Holdings I LLC/Cequel Capital Corp., | ||||||||||||||||
Sr. Unsec’d. Notes, 144A | 5.125 | 12/15/21 | 5,500 | 5,596,250 | ||||||||||||
Sr. Unsec’d. Notes, 144A | 5.125 | 12/15/21 | 706 | 718,355 | ||||||||||||
Sr. Unsec’d. Notes, 144A | 6.375 | 09/15/20 | 4,408 | 4,496,689 | ||||||||||||
See Notes to Financial Statements.
| Prudential Absolute Return Bond Fund | 37 |
Schedule of Investments (continued)
as of October 31, 2017
| Description | Interest Rate | Maturity Date | Principal Amount (000)# | Value | ||||||||||||
CORPORATE BONDS (Continued) |
| |||||||||||||||
Media (cont’d.) |
| |||||||||||||||
Charter Communications Operating LLC/Charter Communications Operating Capital, | ||||||||||||||||
Sr. Sec’d. Notes | 6.384 | % | 10/23/35 | 1,525 | $ | 1,757,528 | ||||||||||
Sr. Sec’d. Notes | 6.834 | 10/23/55 | 485 | 582,721 | ||||||||||||
Clear Channel Worldwide Holdings, Inc., | ||||||||||||||||
Gtd. Notes | 6.500 | 11/15/22 | 135 | 139,388 | ||||||||||||
Gtd. Notes(a) | 6.500 | 11/15/22 | 365 | 377,775 | ||||||||||||
Gtd. Notes(a) | 7.625 | 03/15/20 | 3,200 | 3,196,000 | ||||||||||||
CSC Holdings LLC, Sr. Unsec’d. Notes | 7.875 | 02/15/18 | 1,040 | 1,055,725 | ||||||||||||
Discovery Communications LLC, | ||||||||||||||||
Gtd. Notes | 5.000 | 09/20/37 | 225 | 231,965 | ||||||||||||
Gtd. Notes | 5.200 | 09/20/47 | 600 | 611,603 | ||||||||||||
DISH DBS Corp., Gtd. Notes | 7.750 | 07/01/26 | 2,300 | 2,515,625 | ||||||||||||
Liberty Interactive LLC, Sr. Unsec’d. Notes(a) | 8.250 | 02/01/30 | 2,500 | 2,750,000 | ||||||||||||
TEGNA, Inc., Gtd. Notes, 144A | 4.875 | 09/15/21 | 1,625 | 1,661,563 | ||||||||||||
Time Warner, Inc., Gtd. Notes | 3.800 | 02/15/27 | 1,350 | 1,349,411 | ||||||||||||
Unitymedia Hessen GmbH & Co. KG/Unitymedia NRW GmbH (Germany), Sr. Sec’d. Notes, 144A, MTN | 5.125 | 01/21/23 | EUR | 452 | 545,263 | |||||||||||
Univision Communications, Inc., Sr. Sec’d. Notes, 144A | 6.750 | 09/15/22 | 1,292 | 1,338,835 | ||||||||||||
Videotron Ltd. (Canada), | ||||||||||||||||
Gtd. Notes | 5.000 | 07/15/22 | 3,000 | 3,240,000 | ||||||||||||
Gtd. Notes, 144A | 5.375 | 06/15/24 | 865 | 934,200 | ||||||||||||
|
| |||||||||||||||
| 44,004,498 | ||||||||||||||||
Mining 0.3% |
| |||||||||||||||
Eldorado Gold Corp. (Canada), Gtd. Notes, 144A | 6.125 | 12/15/20 | 2,375 | 2,363,125 | ||||||||||||
Southern Copper Corp. (Peru), Sr. Unsec’d. Notes(a) | 6.750 | 04/16/40 | 2,575 | 3,223,602 | ||||||||||||
|
| |||||||||||||||
| 5,586,727 | ||||||||||||||||
Miscellaneous Manufacturing 0.3% |
| |||||||||||||||
Actuant Corp., Gtd. Notes(a) | 5.625 | 06/15/22 | 3,075 | 3,159,562 | ||||||||||||
General Electric Co., Sr. Unsec’d. Notes | 0.875 | 05/17/25 | EUR | 2,200 | 2,574,619 | |||||||||||
|
| |||||||||||||||
| 5,734,181 | ||||||||||||||||
Oil & Gas 2.1% |
| |||||||||||||||
Anadarko Petroleum Corp., Sr. Unsec’d. Notes | 6.450 | 09/15/36 | 750 | 910,663 | ||||||||||||
California Resources Corp., Sec’d. Notes, 144A(a) | 8.000 | 12/15/22 | 600 | 396,000 | ||||||||||||
Cenovus Energy, Inc. (Canada), Sr. Unsec’d. Notes | 4.450 | 09/15/42 | 1,070 | 976,623 | ||||||||||||
Concho Resources, Inc., Gtd. Notes | 4.875 | 10/01/47 | 275 | 292,582 | ||||||||||||
Denbury Resources, Inc., Gtd. Notes(a) | 5.500 | 05/01/22 | 2,000 | 1,255,000 | ||||||||||||
See Notes to Financial Statements.
| 38 |
| Description | Interest Rate | Maturity Date | Principal Amount (000)# | Value | ||||||||||||
CORPORATE BONDS (Continued) |
| |||||||||||||||
Oil & Gas (cont’d.) |
| |||||||||||||||
Gazprom OAO Via Gaz Capital SA (Russia), | ||||||||||||||||
Sr. Unsec’d. Notes, 144A | 4.950 | % | 07/19/22 | 730 | $ | 763,971 | ||||||||||
Sr. Unsec’d. Notes, 144A | 6.510 | 03/07/22 | 3,420 | 3,787,486 | ||||||||||||
HPCL-Mittal Energy Ltd. (India), Sr. Unsec’d. Notes | 5.250 | 04/28/27 | 1,478 | 1,541,561 | ||||||||||||
KazMunayGas National Co. JSC (Kazakhstan), | ||||||||||||||||
Sr. Unsec’d. Notes | 7.000 | 05/05/20 | 4,140 | 4,515,374 | ||||||||||||
Sr. Unsec’d. Notes, 144A | 3.875 | 04/19/22 | 1,520 | 1,537,434 | ||||||||||||
Sr. Unsec’d. Notes, 144A, MTN | 6.375 | 04/09/21 | 1,440 | 1,576,800 | ||||||||||||
Nabors Industries, Inc., | ||||||||||||||||
Gtd. Notes(a) | 4.625 | 09/15/21 | 762 | 735,940 | ||||||||||||
Gtd. Notes | 6.150 | 02/15/18 | 62 | 62,155 | ||||||||||||
Noble Energy, Inc., | ||||||||||||||||
Sr. Unsec’d. Notes | 4.150 | 12/15/21 | 500 | 527,459 | ||||||||||||
Sr. Unsec’d. Notes | 5.250 | 11/15/43 | 395 | 421,584 | ||||||||||||
Sr. Unsec’d. Notes | 6.000 | 03/01/41 | 1,390 | 1,596,639 | ||||||||||||
Petrobras Global Finance BV (Brazil), | ||||||||||||||||
Gtd. Notes | 6.125 | 01/17/22 | 200 | 216,200 | ||||||||||||
Gtd. Notes | 7.375 | 01/17/27 | 560 | 621,880 | ||||||||||||
Gtd. Notes | 8.375 | 05/23/21 | 3,875 | 4,468,359 | ||||||||||||
Gtd. Notes, 144A | 5.299 | 01/27/25 | 975 | 978,169 | ||||||||||||
Petroleos Mexicanos (Mexico), | ||||||||||||||||
Gtd. Notes, 144A, MTN | 6.500 | 03/13/27 | 1,550 | 1,692,600 | ||||||||||||
Gtd. Notes, 144A, MTN | 6.750 | 09/21/47 | 1,650 | 1,700,655 | ||||||||||||
Sasol Financing International PLC (South Africa), Gtd. Notes | 4.500 | 11/14/22 | 2,800 | 2,809,240 | ||||||||||||
Sinopec Group Overseas Development 2017 Ltd. (China), Gtd. Notes, 144A | 2.250 | 09/13/20 | 4,350 | 4,327,093 | ||||||||||||
|
| |||||||||||||||
| 37,711,467 | ||||||||||||||||
Oil & Gas Services 0.0% |
| |||||||||||||||
Cameron International Corp., Gtd. Notes | 5.950 | 06/01/41 | 100 | 122,210 | ||||||||||||
Packaging & Containers 0.3% |
| |||||||||||||||
Ball Corp., Gtd. Notes | 4.375 | 12/15/23 | EUR | 1,825 | 2,438,882 | |||||||||||
Horizon Parent Holdings Sarl (France), Sr. Sec’d. Notes, Pays cash 8.25% or PIK 9.00%, 144A | 8.250 | 02/15/22 | EUR | 825 | 1,027,070 | |||||||||||
WestRock RKT Co., | ||||||||||||||||
Gtd. Notes | 4.450 | 03/01/19 | 35 | 36,019 | ||||||||||||
Gtd. Notes | 4.900 | 03/01/22 | 1,190 | 1,293,336 | ||||||||||||
|
| |||||||||||||||
| 4,795,307 | ||||||||||||||||
See Notes to Financial Statements.
| Prudential Absolute Return Bond Fund | 39 |
Schedule of Investments (continued)
as of October 31, 2017
| Description | Interest Rate | Maturity Date | Principal Amount (000)# | Value | ||||||||||||
CORPORATE BONDS (Continued) |
| |||||||||||||||
Pharmaceuticals 0.7% |
| |||||||||||||||
AbbVie, Inc., Sr. Unsec’d. Notes | 4.500 | % | 05/14/35 | 4,085 | $ | 4,377,479 | ||||||||||
Actavis Funding SCS, | ||||||||||||||||
Gtd. Notes | 4.550 | 03/15/35 | 4,020 | 4,227,546 | ||||||||||||
Gtd. Notes | 4.750 | 03/15/45 | 114 | 120,261 | ||||||||||||
Catalent Pharma Solutions, Inc., Gtd. Notes, 144A | 4.750 | 12/15/24 | EUR | 980 | 1,231,854 | |||||||||||
Nidda Healthcare Holding AG (Germany), Sr. Sec’d. Notes, 144A | 3.500 | 09/30/24 | EUR | 800 | 953,872 | |||||||||||
Valeant Pharmaceuticals International, Inc., | ||||||||||||||||
Gtd. Notes, 144A(a) | 6.125 | 04/15/25 | 1,275 | 1,071,000 | ||||||||||||
Sr. Sec’d. Notes, 144A | 6.500 | 03/15/22 | 600 | 636,000 | ||||||||||||
|
| |||||||||||||||
| 12,618,012 | ||||||||||||||||
Pipelines 0.9% |
| |||||||||||||||
DCP Midstream Operating LP, | ||||||||||||||||
Gtd. Notes | 2.500 | 12/01/17 | 225 | 225,000 | ||||||||||||
Gtd. Notes, 144A | 5.350 | 03/15/20 | 227 | 236,647 | ||||||||||||
Enterprise Products Operating LLC, Gtd. Notes | 4.950 | 10/15/54 | 2,700 | 2,932,142 | ||||||||||||
Fermaca Enterprises S de RL de CV (Mexico), Sr. Sec’d. Notes, 144A | 6.375 | 03/30/38 | 543 | 591,739 | ||||||||||||
Magellan Midstream Partners LP, | ||||||||||||||||
Sr. Unsec’d. Notes | 4.200 | 12/01/42 | 125 | 118,068 | ||||||||||||
Sr. Unsec’d. Notes | 4.250 | 02/01/21 | 1,950 | 2,059,257 | ||||||||||||
Sr. Unsec’d. Notes | 5.150 | 10/15/43 | 1,350 | 1,509,829 | ||||||||||||
MPLX LP, Sr. Unsec’d. Notes | 5.200 | 03/01/47 | 145 | 155,245 | ||||||||||||
NGPL PipeCo LLC, | ||||||||||||||||
Sr. Unsec’d. Notes, 144A | 4.375 | 08/15/22 | 150 | 154,313 | ||||||||||||
Sr. Unsec’d. Notes, 144A | 4.875 | 08/15/27 | 500 | 517,500 | ||||||||||||
ONEOK, Inc., Gtd. Notes | 4.950 | 07/13/47 | 1,060 | 1,084,215 | ||||||||||||
Rockies Express Pipeline LLC, | ||||||||||||||||
Sr. Unsec’d. Notes, 144A | 5.625 | 04/15/20 | 3,700 | 3,922,000 | ||||||||||||
Sr. Unsec’d. Notes, 144A | 6.875 | 04/15/40 | 1,850 | 2,062,750 | ||||||||||||
Western Gas Partners LP, Sr. Unsec’d. Notes | 4.000 | 07/01/22 | 75 | 77,413 | ||||||||||||
|
| |||||||||||||||
| 15,646,118 | ||||||||||||||||
Real Estate Investment Trusts (REITs) 1.2% |
| |||||||||||||||
FelCor Lodging LP, | ||||||||||||||||
Gtd. Notes | 6.000 | 06/01/25 | 3,400 | 3,663,500 | ||||||||||||
Sr. Sec’d. Notes | 5.625 | 03/01/23 | 1,050 | 1,085,438 | ||||||||||||
Mack-Cali Realty LP, Sr. Unsec’d. Notes | 2.500 | 12/15/17 | 100 | 100,021 | ||||||||||||
MPT Operating Partnership LP/MPT Finance Corp., Gtd. Notes | 3.325 | 03/24/25 | EUR | 3,775 | 4,631,947 | |||||||||||
Rialto Holdings LLC/Rialto Corp., Gtd. Notes, 144A | 7.000 | 12/01/18 | 7,100 | 7,117,750 | ||||||||||||
See Notes to Financial Statements.
| 40 |
| Description | Interest Rate | Maturity Date | Principal Amount (000)# | Value | ||||||||||||
CORPORATE BONDS (Continued) |
| |||||||||||||||
Real Estate Investment Trusts (REITs) (cont’d.) |
| |||||||||||||||
Sabra Health Care LP/Sabra Capital Corp., | ||||||||||||||||
Gtd. Notes | 5.375 | % | 06/01/23 | 1,965 | $ | 2,028,862 | ||||||||||
Gtd. Notes | 5.500 | 02/01/21 | 1,500 | 1,546,875 | ||||||||||||
Trust F/1401 (Mexico), Sr. Unsec’d. Notes, 144A | 5.250 | 12/15/24 | 2,000 | 2,135,000 | ||||||||||||
|
| |||||||||||||||
| 22,309,393 | ||||||||||||||||
Retail 1.1% |
| |||||||||||||||
Claire’s Stores, Inc., Sr. Sec’d. Notes, 144A | 9.000 | 03/15/19 | 275 | 168,438 | ||||||||||||
CVS Health Corp., | ||||||||||||||||
Sr. Unsec’d. Notes | 5.125 | 07/20/45 | 1,765 | 1,972,264 | ||||||||||||
Sr. Unsec’d. Notes | 5.300 | 12/05/43 | 475 | 540,212 | ||||||||||||
Douglas GmbH (Germany), Sr. Sec’d. Notes, 144A | 6.250 | 07/15/22 | EUR | 1,200 | 1,495,807 | |||||||||||
Golden Nugget, Inc., Sr. Unsec’d. Notes, 144A | 6.750 | 10/15/24 | 2,750 | 2,798,125 | ||||||||||||
Grupo Unicomer Co. Ltd. (El Salvador), Gtd. Notes, 144A | 7.875 | 04/01/24 | 2,080 | 2,267,200 | ||||||||||||
L Brands, Inc., Gtd. Notes(a) | 5.625 | 02/15/22 | 6,205 | 6,636,247 | ||||||||||||
Macy’s Retail Holdings, Inc., Gtd. Notes(a) | 4.300 | 02/15/43 | 705 | 542,924 | ||||||||||||
PetSmart, Inc., Sr. Sec’d. Notes, 144A(a) | 5.875 | 06/01/25 | 1,775 | 1,548,687 | ||||||||||||
Rite Aid Corp., Gtd. Notes, 144A(a) | 6.125 | 04/01/23 | 1,975 | 1,836,750 | ||||||||||||
Tops Holding LLC/Tops Markets II Corp., Sr. Sec’d. Notes, 144A(a) | 8.000 | 06/15/22 | 1,150 | 690,000 | ||||||||||||
|
| |||||||||||||||
| 20,496,654 | ||||||||||||||||
Savings & Loans 0.0% |
| |||||||||||||||
People’s United Financial, Inc., Sr. Unsec’d. Notes | 3.650 | 12/06/22 | 325 | 334,066 | ||||||||||||
Semiconductors 0.5% |
| |||||||||||||||
Broadcom Corp./Broadcom Cayman Finance Ltd., Gtd. Notes, 144A | 3.875 | 01/15/27 | 2,905 | 2,988,735 | ||||||||||||
Micron Technology, Inc., Sr. Unsec’d. Notes | 5.500 | 02/01/25 | 2,100 | 2,231,250 | ||||||||||||
NXP BV/NXP Funding LLC (Netherlands), Gtd. Notes, 144A | 3.750 | 06/01/18 | 1,300 | 1,308,125 | ||||||||||||
Sensata Technologies BV, Gtd. Notes, 144A | 5.000 | 10/01/25 | 2,750 | 2,915,000 | ||||||||||||
|
| |||||||||||||||
| 9,443,110 | ||||||||||||||||
Software 0.5% |
| |||||||||||||||
BMC Software Finance, Inc., Sr. Unsec’d. Notes, 144A | 8.125 | 07/15/21 | 2,500 | 2,559,375 | ||||||||||||
First Data Corp., Gtd. Notes, 144A | 7.000 | 12/01/23 | 6,150 | 6,580,623 | ||||||||||||
|
| |||||||||||||||
| 9,139,998 | ||||||||||||||||
See Notes to Financial Statements.
| Prudential Absolute Return Bond Fund | 41 |
Schedule of Investments (continued)
as of October 31, 2017
| Description | Interest Rate | Maturity Date | Principal Amount (000)# | Value | ||||||||||||
CORPORATE BONDS (Continued) |
| |||||||||||||||
Telecommunications 1.3% |
| |||||||||||||||
Bharti Airtel International Netherlands BV (India), Gtd. Notes, Notes, 144A | 5.125 | % | 03/11/23 | 3,725 | $ | 3,989,773 | ||||||||||
CommScope Technologies Finance LLC, Gtd. Notes, 144A | 6.000 | 06/15/25 | 1,225 | 1,293,906 | ||||||||||||
CommScope, Inc., Gtd. Notes, 144A | 5.000 | 06/15/21 | 2,275 | 2,320,500 | ||||||||||||
Digicel Group Ltd. (Jamaica), | ||||||||||||||||
Gtd. Notes, 144A | 6.750 | 03/01/23 | 2,050 | 2,023,473 | ||||||||||||
Sr. Unsec’d. Notes | 8.250 | 09/30/20 | 1,500 | 1,483,125 | ||||||||||||
Sprint Capital Corp., Gtd. Notes | 8.750 | 03/15/32 | 3,275 | 3,970,937 | ||||||||||||
Sprint Communications, Inc., Gtd. Notes, 144A | 7.000 | 03/01/20 | 650 | 705,250 | ||||||||||||
Veon Holdings BV (Netherlands), Sr. Unsec’d. Notes, 144A | 4.950 | 06/16/24 | 3,500 | 3,581,410 | ||||||||||||
Wind Tre Spa, 144A | 2.625 | 01/20/23 | EUR | 1,375 | 1,608,876 | |||||||||||
Wind Tre Spa, 144A | 3.125 | 01/20/25 | EUR | 3,000 | 3,505,032 | |||||||||||
|
| |||||||||||||||
| 24,482,282 | ||||||||||||||||
Textiles 0.2% |
| |||||||||||||||
Mohawk Industries, Inc., Sr. Unsec’d. Notes | 3.850 | 02/01/23 | 104 | 108,220 | ||||||||||||
Springs Industries, Inc., Sr. Sec’d. Notes | 6.250 | 06/01/21 | 3,425 | 3,527,750 | ||||||||||||
|
| |||||||||||||||
| 3,635,970 | ||||||||||||||||
Transportation 0.3% |
| |||||||||||||||
AP Moeller-Maersk A/S (Denmark), Sr. Unsec’d. Notes, 144A | 2.550 | 09/22/19 | 2,450 | 2,461,776 | ||||||||||||
Moby SpA (Italy), Sr. Sec’d. Notes, 144A(a) | 7.750 | 02/15/23 | EUR | 3,000 | 3,494,968 | |||||||||||
Union Pacific Corp., Sr. Unsec’d. Notes | 3.799 | 10/01/51 | 207 | 205,113 | ||||||||||||
|
| |||||||||||||||
| 6,161,857 | ||||||||||||||||
Trucking & Leasing 0.0% |
| |||||||||||||||
Penske Truck Leasing Co. LP/PTL Finance Corp., Sr. Unsec’d. Notes, 144A | 2.875 | 07/17/18 | 450 | 453,431 | ||||||||||||
CORPORATE BONDS (Continued) |
| |||||||||||||||
Water 0.2% |
| |||||||||||||||
Aegea Finance Sarl (Brazil), Gtd. Notes, 144A | 5.750 | 10/10/24 | 3,015 | 3,097,008 | ||||||||||||
|
| |||||||||||||||
TOTAL CORPORATE BONDS |
| 620,082,076 | ||||||||||||||
|
| |||||||||||||||
See Notes to Financial Statements.
| 42 |
| Description | Interest Rate | Maturity Date | Principal Amount (000)# | Value | ||||||||||||
MUNICIPAL BONDS 0.8% |
| |||||||||||||||
California 0.5% |
| |||||||||||||||
Bay Area Toll Authority, BABs, Revenue Bonds | 6.263 | % | 04/01/49 | 550 | $ | 801,322 | ||||||||||
Los Angeles Department of Water & Power, | ||||||||||||||||
BABs, Revenue Bonds | 6.008 | 07/01/39 | 3,610 | 4,636,540 | ||||||||||||
BABs, Revenue Bonds(a) | 6.574 | 07/01/45 | 585 | 860,605 | ||||||||||||
University of California, | ||||||||||||||||
BABs, Revenue Bonds | 5.770 | 05/15/43 | 390 | 507,920 | ||||||||||||
Taxable, Revenue Bonds, Series AP | 3.931 | 05/15/45 | 625 | 632,144 | ||||||||||||
Taxable, Revenue Bonds, Series J | 4.131 | 05/15/45 | 675 | 698,126 | ||||||||||||
|
| |||||||||||||||
| 8,136,657 | ||||||||||||||||
Colorado 0.1% |
| |||||||||||||||
Regional Transportation District, BABs, Revenue Bonds, Series 2010B | 5.844 | 11/01/50 | 1,190 | 1,586,901 | ||||||||||||
Illinois 0.0% |
| |||||||||||||||
Chicago O’Hare International Airport, BABs, Revenue Bonds | 6.395 | 01/01/40 | 360 | 489,571 | ||||||||||||
New Jersey 0.2% | ||||||||||||||||
New Jersey State Turnpike Authority, Revenue Bonds, Series F, BABs | 7.414 | 01/01/40 | 2,000 | 3,042,740 | ||||||||||||
Rutgers State University, BABs, Revenue Bonds | 5.665 | 05/01/40 | 200 | 242,610 | ||||||||||||
|
| |||||||||||||||
| 3,285,350 | ||||||||||||||||
New York 0.0% | ||||||||||||||||
New York City Water & Sewer System, BABs, Taxable, Revenue Bonds | 5.882 | 06/15/44 | 400 | 539,064 | ||||||||||||
Ohio 0.0% | ||||||||||||||||
Ohio State University, Taxable, Revenue Bonds, Series A | 4.800 | 06/01/2111 | 180 | 196,171 | ||||||||||||
Texas 0.0% | ||||||||||||||||
City of San Antonio Electric and Gas Systems, BABs, Taxable, Revenue Bonds | 4.427 | 02/01/42 | 120 | 133,810 | ||||||||||||
|
| |||||||||||||||
TOTAL MUNICIPAL BONDS | 14,367,524 | |||||||||||||||
|
| |||||||||||||||
See Notes to Financial Statements.
| Prudential Absolute Return Bond Fund | 43 |
Schedule of Investments (continued)
as of October 31, 2017
| Description | Interest Rate | Maturity Date | Principal Amount (000)# | Value | ||||||||||||
MUNICIPAL BONDS (Continued) |
| |||||||||||||||
RESIDENTIAL MORTGAGE-BACKED SECURITIES 5.3% |
| |||||||||||||||
Banc of America Funding Corp., | ||||||||||||||||
Series 2014-R2, Class 2A1, 144A, | 1.450 | %(c) | 05/26/37 | 2,559 | $ | 2,457,599 | ||||||||||
Series 2014-R5, Class 1A1, 144A, | 2.991 | (c) | 09/26/45 | 3,539 | 3,560,887 | |||||||||||
Series 2015-R3, Class 1A1, 144A, | 1.428 | (c) | 03/27/36 | 12,065 | 11,686,029 | |||||||||||
Series 2015-R3, Class 6A1, 144A, | 1.408 | (c) | 05/27/36 | 2,866 | 2,808,791 | |||||||||||
Series 2015-R4, Class 4A1, 144A | 3.500 | (cc) | 01/27/30 | 2,914 | 2,903,560 | |||||||||||
Bayview Opportunity Master Fund Iiib Trust, Series 2017-CRT2, Class M, 144A, | 3.240 | (c) | 11/25/27 | 926 | 925,785 | |||||||||||
Bayview Opportunity Master Fund IVb Trust, Series 2017-CRT1, Class M, 144A, 1 Month LIBOR + 2.150% | 3.390 | (c) | 10/25/28 | 1,701 | 1,703,580 | |||||||||||
Bellemeade Re Ltd. (Bermuda), Series 2017-1, Class M1, 144A, 1 Month LIBOR + 1.700%^ | 2.738 | (c) | 10/25/27 | 1,250 | 1,252,344 | |||||||||||
Chase Mortgage Finance Trust, Series 2007-A1, Class 1A3 | 3.615 | (cc) | 02/25/37 | 200 | 199,113 | |||||||||||
CHI Mortgage Pass-through Trust, Series 2007-17, Class 2A1 | 6.500 | 10/25/37 | 4,135 | 3,365,845 | ||||||||||||
CIM Trust, Series 2017-3, Class A1, 144A, | 3.235 | (c) | 01/25/57 | 5,924 | 5,995,694 | |||||||||||
CIM Trust, | ||||||||||||||||
Series 2017-6, Class A1, 144A | 3.015 | (cc) | 06/25/57 | 2,484 | 2,470,935 | |||||||||||
Series 2017-8, 144A^ | 3.000 | (cc) | 12/25/65 | 5,620 | 5,623,125 | |||||||||||
Freddie Mac Structured Agency Credit Risk Debt Notes, Series 2015-DNA1, Class M3, | 4.538 | (c) | 10/25/27 | 2,000 | 2,225,770 | |||||||||||
GSMSC Resecuritization Trust, | ||||||||||||||||
Series 2015-3R, Class 1A1, 144A, | 1.377 | (c) | 01/26/37 | 3,179 | 3,119,640 | |||||||||||
Series 2015-3R, Class 1A2, 144A, | 1.377 | (c) | 01/26/37 | 1,670 | 1,519,141 | |||||||||||
Series 2015-3R, Class 2A1, 144A, | 1.377 | (c) | 10/26/36 | 4,112 | 3,999,122 | |||||||||||
Series 2015-3R, Class 2A2, 144A, | 1.377 | (c) | 10/26/36 | 1,400 | 1,197,942 | |||||||||||
Series 2015-4R, Class A1, 144A, | 1.377 | (c) | 03/26/37 | 7,598 | 7,388,968 | |||||||||||
See Notes to Financial Statements.
| 44 |
| Description | Interest Rate | Maturity Date | Principal Amount (000)# | Value | ||||||||||||
RESIDENTIAL MORTGAGE-BACKED SECURITIES (Continued) |
| |||||||||||||||
GSMSC Resecuritization Trust, (cont’d.) | ||||||||||||||||
Series 2015-4R, Class A2, 144A, | 1.377 | %(c) | 03/26/37 | 2,702 | $ | 2,332,745 | ||||||||||
JPMorgan Mortgage Trust, Series 2007-A1, Class 4A1 | 3.729 | (cc) | 07/25/35 | 205 | 208,549 | |||||||||||
LSTAR Securities Investment Ltd. (Cayman Islands), Series 2016-5, Class A1, 144A, | 3.235 | (c) | 11/01/21 | 1,374 | 1,374,530 | |||||||||||
LSTAR Securities Investment Ltd., Series 2017-3, Class A1, 144A, 1 Month LIBOR + 2.000% | 3.235 | (c) | 04/01/22 | 2,909 | 2,920,768 | |||||||||||
LSTAR Securities Investment Ltd. (Cayman Islands), Series 2017-4, Class A, 144A, | 3.235 | (c) | 05/01/22 | 9,576 | 9,557,269 | |||||||||||
LSTAR Securities Investment Ltd., | ||||||||||||||||
Series 2017-5, Class A, 144A, | 3.235 | (c) | 05/01/22 | 9,495 | 9,495,667 | |||||||||||
Series 2017-6, Class A, 144A, | 2.985 | (c) | 09/01/22 | 2,463 | 2,462,206 | |||||||||||
Mortgage Repurchase Agreement Financing Trust, Series 2017-1, Class A2, 144A, | 2.085 | (c) | 07/10/19 | 3,260 | 3,260,911 | |||||||||||
Structured Asset Securities Corp., | 3.366 | (cc) | 12/25/33 | 826 | 819,165 | |||||||||||
Structured Asset Securities Corp. Mortgage Pass-Through Certificates, Series 2003-30, Class 2A1 | 5.136 | (cc) | 10/25/33 | 292 | 297,683 | |||||||||||
Wells Fargo Mortgage-Backed Securities Trust, Series 2004-EE, Class 2A1 | 3.399 | (cc) | 12/25/34 | 172 | 174,618 | |||||||||||
|
| |||||||||||||||
TOTAL RESIDENTIAL MORTGAGE-BACKED SECURITIES | 97,307,981 | |||||||||||||||
|
| |||||||||||||||
SOVEREIGN BONDS 8.1% | ||||||||||||||||
Argentine Republic Government International Bond (Argentina), | ||||||||||||||||
Sr. Unsec’d. Notes | 6.875 | 04/22/21 | 7,175 | 7,820,750 | ||||||||||||
Unsec’d. Notes(a) | 5.000 | 01/15/27 | EUR | 3,970 | 4,664,916 | |||||||||||
Brazil Minas SPE via State of Minas Gerais (Brazil), Gov’t. Gtd. Notes | 5.333 | 02/15/28 | 6,070 | 6,176,225 | ||||||||||||
Dominican Republic International Bond (Dominican Republic), | ||||||||||||||||
Sr. Unsec’d. Notes | 7.500 | 05/06/21 | 6,075 | 6,720,469 | ||||||||||||
Sr. Unsec’d. Notes, 144A | 7.500 | 05/06/21 | 1,300 | 1,438,125 | ||||||||||||
See Notes to Financial Statements.
| Prudential Absolute Return Bond Fund | 45 |
Schedule of Investments (continued)
as of October 31, 2017
| Description | Interest Rate | Maturity Date | Principal Amount (000)# | Value | ||||||||||||
SOVEREIGN BONDS (Continued) | ||||||||||||||||
Gabon Government International Bond (Gabon), Unsec’d. Notes | 8.200 | % | 12/12/17 | 5,125 | $ | 5,144,618 | ||||||||||
Hellenic Republic Government International Bond (Greece), | ||||||||||||||||
Sr. Unsec’d. Notes | 3.000 | (cc) | 02/24/29 | EUR | 1,100 | 1,073,643 | ||||||||||
Sr. Unsec’d. Notes | 3.000 | (cc) | 02/24/31 | EUR | 1,330 | 1,251,473 | ||||||||||
Sr. Unsec’d. Notes | 3.000 | (cc) | 02/24/32 | EUR | 1,355 | 1,258,751 | ||||||||||
Sr. Unsec’d. Notes | 3.000 | (cc) | 02/24/39 | EUR | 1,100 | 949,610 | ||||||||||
Sr. Unsec’d. Notes | 3.000 | (cc) | 02/24/35 | EUR | 705 | 629,284 | ||||||||||
Sr. Unsec’d. Notes | 5.200 | 07/17/34 | EUR | 3,500 | 3,646,820 | |||||||||||
Sr. Unsec’d. Notes, 144A | 4.375 | 08/01/22 | EUR | 3,425 | 3,982,588 | |||||||||||
Hungary Government International Bond (Hungary), Sr. Unsec’d. Notes | 6.375 | 03/29/21 | 6,470 | 7,238,312 | ||||||||||||
Indonesia Government International Bond (Indonesia), | ||||||||||||||||
Sr. Unsec’d. Notes | 3.375 | 07/30/25 | EUR | 2,975 | 3,859,377 | |||||||||||
Sr. Unsec’d. Notes, MTN | 3.750 | 06/14/28 | EUR | 775 | 1,022,735 | |||||||||||
Ivory Coast Government International Bond (Cote D’lvoire), Sr. Unsec’d. Notes, 144A | 5.125 | 06/15/25 | EUR | 2,250 | 2,768,416 | |||||||||||
Japan Bank for International Cooperation (Japan), | ||||||||||||||||
Gov’t. Gtd. Notes | 1.750 | 07/31/18 | 3,000 | 2,999,550 | ||||||||||||
Gov’t. Gtd. Notes | 1.875 | 11/13/19 | 4,000 | 3,975,428 | ||||||||||||
Gov’t. Gtd. Notes | 2.125 | 06/01/20 | 200 | 199,999 | ||||||||||||
Gov’t. Gtd. Notes | 2.125 | 07/21/20 | 600 | 600,448 | ||||||||||||
Gov’t. Gtd. Notes | 2.500 | 06/01/22 | 600 | 603,175 | ||||||||||||
Japan Finance Organization for Municipalities (Japan), | ||||||||||||||||
Sr. Unsec’d. Notes, EMTN | 1.375 | 02/05/18 | 6,000 | 5,989,134 | ||||||||||||
Sr. Unsec’d. Notes, MTN | 2.500 | 09/12/18 | 5,000 | 5,013,410 | ||||||||||||
Japan Government Ten Year Bond (Japan), Sr. Unsec’d. Notes | 1.500 | 12/20/17 | JPY | 4,000,000 | 35,255,090 | |||||||||||
Portugal Government International Bond (Portugal), Sr. Unsec’d. Notes, MTN | 5.125 | 10/15/24 | 15,515 | 16,424,800 | ||||||||||||
Portugal Obrigacoes do Tesouro OT (Portugal), Sr. Unsec’d. Notes, 144A | 3.875 | 02/15/30 | EUR | 2,215 | 2,926,371 | |||||||||||
Provincia de Buenos Aires (Argentina), Sr. Unsec’d. Notes, 144A | 9.950 | 06/09/21 | 1,050 | 1,220,783 | ||||||||||||
Republic of Belarus International Bond (Belarus), Sr. Unsec’d. Notes | 8.950 | 01/26/18 | 4,340 | 4,383,747 | ||||||||||||
Tokyo Metropolitan Government (Japan), | ||||||||||||||||
Sr. Unsec’d. Notes | 2.125 | 05/19/20 | 2,500 | 2,488,535 | ||||||||||||
Sr. Unsec’d. Notes | 2.125 | 05/20/19 | 1,000 | 1,000,670 | ||||||||||||
Sr. Unsec’d. Notes, 144A | 2.500 | 06/08/22 | 1,000 | 999,890 | ||||||||||||
See Notes to Financial Statements.
| 46 |
| Description | Interest Rate | Maturity Date | Principal Amount (000)# | Value | ||||||||||||
SOVEREIGN BONDS (Continued) | ||||||||||||||||
Turkey Government International Bond (Turkey), Sr. Unsec’d. Notes | 5.625 | % | 03/30/21 | 1,450 | $ | 1,528,401 | ||||||||||
Ukraine Government International Bond (Ukraine), Sr. Unsec’d. Notes(a) | 7.750 | 09/01/21 | 4,135 | 4,414,278 | ||||||||||||
|
| |||||||||||||||
TOTAL SOVEREIGN BONDS | 149,669,821 | |||||||||||||||
|
| |||||||||||||||
U.S. TREASURY OBLIGATIONS 4.5% | ||||||||||||||||
U.S. Treasury Bonds(k)(h) | 2.500 | 02/15/45 | 38,760 | 36,055,884 | ||||||||||||
U.S. Treasury Bonds(k)(h) | 2.500 | 05/15/46 | 4,110 | 3,807,369 | ||||||||||||
U.S. Treasury Bonds | 2.875 | 11/15/46 | 255 | 255,000 | ||||||||||||
U.S. Treasury Bonds(k) | 3.000 | 02/15/47 | 3,100 | 3,177,621 | ||||||||||||
U.S. Treasury Bonds(k)(h) | 3.000 | 05/15/47 | 1,345 | 1,378,783 | ||||||||||||
U.S. Treasury Notes | 0.750 | 07/31/18 | 250 | 248,789 | ||||||||||||
U.S. Treasury Notes | 1.750 | 06/30/22 | 355 | 351,242 | ||||||||||||
U.S. Treasury Notes | 2.000 | 10/31/22 | 9,255 | 9,249,577 | ||||||||||||
U.S. Treasury Notes | 2.250 | 10/31/24 | 8,320 | 8,331,050 | ||||||||||||
U.S. Treasury Notes | 2.250 | 08/15/27 | 7,990 | 7,901,985 | ||||||||||||
U.S. Treasury Strips Coupon(k) | 2.143 | (s) | 11/15/28 | 1,820 | 1,377,401 | |||||||||||
U.S. Treasury Strips Coupon(k) | 2.174 | (s) | 05/15/29 | 4,420 | 3,298,458 | |||||||||||
U.S. Treasury Strips Coupon | 2.783 | (s) | 08/15/29 | 2,100 | 1,556,225 | |||||||||||
U.S. Treasury Strips Coupon(k) | 2.878 | (s) | 05/15/31 | 2,100 | 1,468,401 | |||||||||||
U.S. Treasury Strips Coupon(k) | 3.042 | (s) | 11/15/35 | 4,200 | 2,538,182 | |||||||||||
U.S. Treasury Strips Coupon(k) | 3.202 | (s) | 08/15/40 | 4,200 | 2,162,335 | |||||||||||
|
| |||||||||||||||
TOTAL U.S. TREASURY OBLIGATIONS |
| 83,158,302 | ||||||||||||||
|
| |||||||||||||||
Shares | ||||||||||||||||
COMMON STOCK 0.1% | ||||||||||||||||
Oil, Gas & Consumable Fuels | ||||||||||||||||
Frontera Energy Corp. (Colombia)*(a) | 66,217 | 1,979,768 | ||||||||||||||
|
| |||||||||||||||
TOTAL LONG-TERM INVESTMENTS | 1,667,901,980 | |||||||||||||||
|
| |||||||||||||||
SHORT-TERM INVESTMENTS 13.5% | ||||||||||||||||
AFFILIATED MUTUAL FUNDS 11.5% | ||||||||||||||||
Prudential Investment Portfolios 2 - Prudential Core | 143,027,511 | 143,027,511 | ||||||||||||||
See Notes to Financial Statements.
| Prudential Absolute Return Bond Fund | 47 |
Schedule of Investments (continued)
as of October 31, 2017
| Description | Shares | Value | ||||||||||||||
AFFILIATED MUTUAL FUNDS (Continued) | ||||||||||||||||
Prudential Investment Portfolios 2 - Prudential | 68,462,190 | $ | 68,469,036 | |||||||||||||
|
| |||||||||||||||
TOTAL AFFILIATED MUTUAL FUNDS | 211,496,547 | |||||||||||||||
|
| |||||||||||||||
Interest | Maturity | Principal | ||||||||||||||
FOREIGN TREASURY OBLIGATIONS 1.8% | ||||||||||||||||
Japan Treasury Bill | 0.000 | %(ss) | 11/20/17 | JPY | 454,600 | 3,998,285 | ||||||||||
Japan Treasury Bill | 0.000 | %(ss) | 11/27/17 | JPY | 1,000,000 | 8,795,409 | ||||||||||
Japan Treasury Bill | 0.000 | %(ss) | 01/15/18 | JPY | 2,431,400 | 21,388,879 | ||||||||||
|
| |||||||||||||||
TOTAL FOREIGN TREASURY OBLIGATIONS | 34,182,573 | |||||||||||||||
|
| |||||||||||||||
OPTIONS PURCHASED* 0.2% | 3,731,529 | |||||||||||||||
|
| |||||||||||||||
TOTAL SHORT-TERM INVESTMENTS | 249,410,649 | |||||||||||||||
|
| |||||||||||||||
TOTAL INVESTMENTS BEFORE OPTIONS WRITTEN 104.0% |
| 1,917,312,629 | ||||||||||||||
|
| |||||||||||||||
OPTIONS WRITTEN* (0.1)% | (2,482,073 | ) | ||||||||||||||
|
| |||||||||||||||
TOTAL INVESTMENTS 103.9% | 1,914,830,556 | |||||||||||||||
Liabilities in excess of other assets(z) (3.9)% |
| (72,418,983 | ) | |||||||||||||
|
| |||||||||||||||
NET ASSETS 100.0% | $ | 1,842,411,573 | ||||||||||||||
|
| |||||||||||||||
The following abbreviations are used in the annual report:
(A)—Annual payment frequency for swaps
(M)—Monthly payment frequency for swaps
(Q)—Quarterly payment frequency for swaps
(S)—Semiannual payment frequency for swaps
(T)—Swap payment upon termination
144A—Security was purchased pursuant to Rule 144A under the Securities Act of 1933 and may not be resold subject to that rule except to qualified institutional buyers. Unless otherwise noted, 144A securities are deemed to be liquid.
ABS—Asset-Backed Security
BABs—Build America Bonds
BBSW—Australian Bank Bill Swap Reference Rate
bps—Basis Points
BROIS—Brazil Overnight Interbank Deposit
CDS—Credit Default Swap
CDX—Credit Derivative Index
CPI—Consumer Price Index
See Notes to Financial Statements.
| 48 |
CLO—Collateralized Loan Obligation
CMBX—Commercial Mortgage Backed Securities Index
EMTN—Euro Medium Term Note
EONIA—Euro Overnight Index Average
EURIBOR—Euro Interbank Offered Rate
FHLMC—Federal Home Loan Mortgage Corp.
GMTN—Global Medium Term Note
HICP—Harmonized Index of Consumer Prices
iBoxx—Bond Market Indices
IO—Interest Only
iTraxx—International Credit Derivative Index
L2—Level 2
L3—Level 3
LIBOR—London Interbank Offered Rate
MTN—Medium Term Note
OTC—Over-the-counter
PIK—Payment-in-Kind
PRIBOR—Prague Interbank Offered Rate
REIT—Real Estate Investment Trust
SONIA—Sterling Overnight Index Average
STRIPS—Separate Trading of Registered Interest and Principal of Securities
USOIS—United States Overnight Index Swap
AUD—Australian Dollar
BRL—Brazilian Real
CAD—Canadian Dollar
CHF—Swiss Franc
CNH—Chinese Renminbi
CZK—Czech Koruna
EUR—Euro
GBP—British Pound
HUF—Hungarian Forint
IDR—Indonesian Rupiah
ILS—Israeli Shekel
INR—Indian Rupee
JPY—Japanese Yen
KRW—South Korean Won
MXN—Mexican Peso
NOK—Norwegian Krone
NZD—New Zealand Dollar
PHP—Philippine Peso
PLN—Polish Zloty
RUB—Russian Ruble
SEK—Swedish Krona
SGD—Singapore Dollar
TRY—Turkish Lira
TWD—New Taiwanese Dollar
ZAR—South African Rand
See Notes to Financial Statements.
| Prudential Absolute Return Bond Fund | 49 |
Schedule of Investments (continued)
as of October 31, 2017
| ^ | Indicates a Level 3 security. The aggregate value of Level 3 securities is $27,126,975 and 1.5% of net assets. |
| (a) | All or a portion of security is on loan. The aggregate market value of such securities, including those sold and pending settlement, is $66,763,349; cash collateral of $68,394,799 (included in liabilities) was received with which the Fund purchased highly liquid short-term investments. |
| (b) | Represents security purchased with cash collateral received for securities on loan and includes dividend reinvestment. |
| (c) | Variable rate instrument. The interest rate shown reflects the rate in effect at October 31, 2017. |
| (cc) | Variable rate instrument. The rate shown is based on the latest available information as of October 31, 2017. Certain variable rate securities are not based on a published reference rate and spread but are determined by the issuer or agent and are based on current market conditions. These securities do not indicate a reference rate and spread in their description above. |
| (h) | Represents security, or a portion thereof, segregated as collateral for OTC derivatives. |
| (k) | Represents security, or a portion thereof, segregated as collateral for centrally cleared/exchange-traded derivatives. |
| (p) | Interest rate not available as of October 31, 2017. |
| (s) | Represents zero coupon bond or principal only securities. Rate represents yield to maturity at purchase date. |
| (ss) | Represents zero coupon bond. |
| (w) | PGIM Investments LLC, the manager of the Fund, also serves as manager of the Prudential Investment Portfolios 2 - Prudential Core Ultra Short Bond Fund and Prudential Institutional Money Market Fund. |
| (z) | Includes net unrealized appreciation (depreciation) on the following derivative contracts held at reporting period end, with the exception of options which are included in total investments, net of options written, at market value. |
Exchange-Traded Options Purchased:
Description | Call/Put | Expiration Date | Strike Price | Contracts | Notional Amount (000)# | Value | ||||||||||||||||||
| 10 Year U.S. Treasury Notes Futures | Call | 11/24/17 | $125.50 | 3,182 | 3,182 | $ | 795,500 | |||||||||||||||||
| 10 Year U.S. Treasury Notes Futures | Call | 11/24/17 | $127.50 | 3,182 | 3,182 | 49,719 | ||||||||||||||||||
|
| |||||||||||||||||||||||
| $ | 845,219 | |||||||||||||||||||||||
|
| |||||||||||||||||||||||
| Exchange-Traded Options Written: | ||||||||||||||||||||||||
Description | Call/Put | Expiration Date | Strike Price | Contracts | Notional Amount (000)# | Value | ||||||||||||||||||
| 10 Year U.S. Treasury Notes Futures | Call | 11/24/17 | $ | 126.50 | 6,364 | 6,364 | $ | (397,750 | ) | |||||||||||||||
|
| |||||||||||||||||||||||
OTC Options Purchased:
Description | Call/Put | Counterparty | Expiration Date | Strike Price | Contracts | Notional Amount (000)# | Value | |||||||||||||||||
| Currency Option EUR vs BRL | Call | Citigroup Global Markets | 04/04/18 | 3.40 | — | EUR | 2,200 | $ | 343,287 | |||||||||||||||
| Currency Option EUR vs ZAR | Call | Goldman Sachs & Co. | 04/04/18 | 15.00 | — | EUR | 1,000 | 147,536 | ||||||||||||||||
| Currency Option USD vs MXN | Call | Citigroup Global Markets | 03/23/18 | 19.25 | — | 7,500 | 297,180 | |||||||||||||||||
|
| |||||||||||||||||||||||
| $ | 788,003 | |||||||||||||||||||||||
|
| |||||||||||||||||||||||
See Notes to Financial Statements.
| 50 |
OTC Options Written:
Description | Call/Put | Counterparty | Expiration Date | Strike Price | Contracts | Notional Amount (000)# | Value | |||||||||||||||||
| Currency Option EUR vs BRL | Call | Citigroup Global Markets | 04/04/18 | 3.80 | — | EUR | 2,200 | $ | (122,828 | ) | ||||||||||||||
| Currency Option EUR vs ZAR | Call | Goldman Sachs & Co. | 04/04/18 | 17.00 | — | EUR | 1,000 | (53,767 | ) | |||||||||||||||
| Currency Option USD vs MXN | Call | Citigroup Global Markets | 03/23/18 | 21.25 | — | 7,500 | (78,997 | ) | ||||||||||||||||
| Currency Option EUR vs BRL | Put | Citigroup Global Markets | 04/04/18 | 3.20 | — | EUR | 2,200 | (472 | ) | |||||||||||||||
| Currency Option EUR vs ZAR | Put | Goldman Sachs & Co. | 04/04/18 | 14.00 | — | EUR | 1,000 | (1,669 | ) | |||||||||||||||
| Currency Option USD vs MXN | Put | Citigroup Global Markets | 03/23/18 | 17.75 | — | 7,500 | (17,539 | ) | ||||||||||||||||
|
| |||||||||||||||||||||||
| $ | (275,272 | ) | ||||||||||||||||||||||
|
| |||||||||||||||||||||||
OTC Swaptions Purchased:
Description | Call/Put | Counterparty | Expiration Date | Strike Price | Receive | Pay | Notional Amount (000)# | Value | ||||||||||||||||
| 5-Year x 10-Year Interest Rate Swap, 10/16/33 | Call | JPMorgan Chase | 04/12/18 | 1.80 | % | 1.80%(S) | 3 Month LIBOR(Q) | 101,840 | $ | 54,626 | ||||||||||||||
| 5-Year x 10-Year Interest Rate Swap, 10/16/33 | Call | JPMorgan Chase | 10/12/18 | 2.60 | % | 2.60%(S) | 3 Month LIBOR(Q) | 101,840 | 1,637,922 | |||||||||||||||
| 30-Year Interest Rate Swap, 04/24/48 | Put | Citigroup Global Markets | 04/20/18 | 2.75 | % | 3 Month LIBOR(Q) | 2.75%(S) | 1,560 | 370,710 | |||||||||||||||
| 30-Year Interest Rate Swap, 04/24/48 | Put | Barclays Capital Group | 04/20/18 | 2.75 | % | 3 Month LIBOR(Q) | 2.75%(S) | 16,500 | 35,049 | |||||||||||||||
|
| |||||||||||||||||||||||
| $ | 2,098,307 | |||||||||||||||||||||||
|
| |||||||||||||||||||||||
OTC Swaptions Written:
Description | Call/Put | Counterparty | Expiration Date | Strike Price | Receive | Pay | Notional Amount (000)# | Value | ||||||||||||||||
| 5-Year x 10-Year Interest Rate Swap, 10/16/33 | Call | JPMorgan Chase | 10/12/18 | 2.10 | % | 3 Month LIBOR(Q) | 2.10%(S) | 101,840 | $ | (566,481 | ) | |||||||||||||
| 5-Year x 10-Year Interest Rate Swap, 10/16/33 | Call | JPMorgan Chase | 10/12/18 | 2.30 | % | 3 Month LIBOR(Q) | 2.30%(S) | 101,840 | (885,142 | ) | ||||||||||||||
| 30-Year Interest Rate Swap, 04/24/48 | Put | Barclays Capital Group | 04/20/18 | 3.05 | % | 3.05%(S) | 3 Month LIBOR(Q) | 16,500 | (125,598 | ) | ||||||||||||||
| 30-Year Interest Rate Swap, 04/24/48 | Put | Citigroup Global Markets | 04/20/18 | 3.05 | % | 3.05%(S) | 3 Month LIBOR(Q) | 1,560 | (11,875 | ) | ||||||||||||||
| CDX.NA.HY.28.V1, 06/20/22 | Put | Goldman Sachs & Co. | 12/20/17 | $ | 100.00 | 5.00%(Q) | CDX.NA.HY.28.V1(Q) | 400,000 | (182,352 | ) | ||||||||||||||
| iTraxx.XO.28.V1, 12/20/22 | Put | Goldman Sachs & Co. | 01/17/18 | EUR | 450.00 | 5.00%(Q) | iTraxx.XO.28.V1(Q) | EUR | 100,000 | (37,603 | ) | |||||||||||||
|
| |||||||||||||||||||||||
| $ | (1,809,051 | ) | ||||||||||||||||||||||
|
| |||||||||||||||||||||||
See Notes to Financial Statements.
| Prudential Absolute Return Bond Fund | 51 |
Schedule of Investments (continued)
as of October 31, 2017
Futures contracts outstanding at October 31, 2017:
| Number of Contracts | Type | Expiration Date | Value at Trade Date | Current Notional Amount | Value / Unrealized Appreciation (Depreciation) | |||||||||||||||
| Long Positions: | ||||||||||||||||||||
| 629 | 10 Year Euro-Bund | Dec. 2017 | $ | 118,595,626 | $ | 119,245,352 | $ | 649,726 | ||||||||||||
| 228 | 10 Year U.K. Gilt | Dec. 2017 | 37,473,476 | 37,649,237 | 175,761 | |||||||||||||||
| 5,332 | 10 Year U.S. Treasury Notes | Dec. 2017 | 669,792,542 | 666,166,750 | (3,625,792 | ) | ||||||||||||||
| 1,177 | 10 Year U.S. Ultra Treasury Notes | Dec. 2017 | 159,599,703 | 157,626,047 | (1,973,656 | ) | ||||||||||||||
| 563 | 30 Year U.S. Ultra Treasury Bonds | Dec. 2017 | 94,023,085 | 92,771,844 | (1,251,241 | ) | ||||||||||||||
|
| |||||||||||||||||||
| (6,025,202 | ) | |||||||||||||||||||
|
| |||||||||||||||||||
| Short Positions: | ||||||||||||||||||||
| 4,228 | 2 Year U.S. Treasury Notes | Dec. 2017 | 914,379,656 | 910,539,437 | 3,840,219 | |||||||||||||||
| 2,584 | 5 Year U.S. Treasury Notes | Dec. 2017 | 305,563,764 | 302,812,500 | 2,751,264 | |||||||||||||||
| 25 | 10 Year Japanese Bonds | Dec. 2017 | 33,185,979 | 33,083,418 | 102,561 | |||||||||||||||
| 1,096 | 20 Year U.S. Treasury Bonds | Dec. 2017 | 169,674,810 | 167,105,750 | 2,569,060 | |||||||||||||||
| 189 | 30 Year Euro Buxl | Dec. 2017 | 36,634,195 | 36,572,407 | 61,788 | |||||||||||||||
|
| |||||||||||||||||||
| 9,324,892 | ||||||||||||||||||||
|
| |||||||||||||||||||
| $ | 3,299,690 | |||||||||||||||||||
|
| |||||||||||||||||||
Securities, including those sold and pending settlement, with a combined market value of $6,814,114 have been segregated with Citigroup Global Markets to cover requirements for open futures contracts at October 31, 2017.
Forward foreign currency exchange contracts outstanding at October 31, 2017:
Purchase Contracts | Counterparty | Notional Amount (000) | Value at Settlement Date | Current Value | Unrealized Appreciation (Depreciation) | |||||||||||||
OTC forward foreign currency exchange contracts: |
| |||||||||||||||||
Australian Dollar, |
| |||||||||||||||||
Expiring 01/12/2018 | Barclays Capital Group | AUD | 1,607 | $ | 1,266,450 | $ | 1,229,417 | $ | (37,033 | ) | ||||||||
Expiring 01/12/2018 | Barclays Capital Group | AUD | 1,541 | 1,204,175 | 1,178,989 | (25,186 | ) | |||||||||||
Expiring 01/12/2018 | Barclays Capital Group | AUD | 1,525 | 1,200,000 | 1,166,168 | (33,832 | ) | |||||||||||
Expiring 01/12/2018 | Citigroup Global Markets | AUD | 1,540 | 1,204,175 | 1,178,226 | (25,949 | ) | |||||||||||
Expiring 01/12/2018 | JPMorgan Chase | AUD | 1,546 | 1,214,897 | 1,182,764 | (32,133 | ) | |||||||||||
Expiring 01/12/2018 | UBS AG | AUD | 1,542 | 1,214,897 | 1,179,767 | (35,130 | ) | |||||||||||
Expiring 01/12/2018 | UBS AG | AUD | 1,523 | 1,200,000 | 1,164,578 | (35,422 | ) | |||||||||||
Brazilian Real, |
| |||||||||||||||||
Expiring 11/03/2017 | Citigroup Global Markets | BRL | 6,636 | 2,071,837 | 2,027,626 | (44,211 | ) | |||||||||||
Expiring 11/03/2017 | Citigroup Global Markets | BRL | 4,209 | 1,318,186 | 1,286,190 | (31,996 | ) | |||||||||||
Expiring 11/03/2017 | UBS AG | BRL | 4,912 | 1,583,037 | 1,500,860 | (82,177 | ) | |||||||||||
Expiring 11/03/2017 | UBS AG | BRL | 3,628 | 1,129,041 | 1,108,571 | (20,470 | ) | |||||||||||
Expiring 02/02/2018 | Citigroup Global Markets | BRL | 6,180 | 1,862,881 | 1,866,501 | 3,620 | ||||||||||||
See Notes to Financial Statements.
| 52 |
Forward foreign currency exchange contracts outstanding at October 31, 2017 (continued):
Purchase Contracts | Counterparty | Notional Amount (000) | Value at Settlement Date | Current Value | Unrealized Appreciation (Depreciation) | |||||||||||||
OTC forward foreign currency exchange contracts (cont’d.): |
| |||||||||||||||||
British Pound, |
| |||||||||||||||||
Expiring 01/26/2018 | Citigroup Global Markets | GBP | 1,524 | $ | 2,016,699 | $ | 2,030,081 | $ | 13,382 | |||||||||
Canadian Dollar, |
| |||||||||||||||||
Expiring 01/12/2018 | Barclays Capital Group | CAD | 1,517 | 1,214,356 | 1,176,457 | (37,899 | ) | |||||||||||
Expiring 01/12/2018 | Barclays Capital Group | CAD | 1,514 | 1,214,356 | 1,174,573 | (39,783 | ) | |||||||||||
Expiring 01/12/2018 | Citigroup Global Markets | CAD | 2,003 | 1,604,187 | 1,553,534 | (50,653 | ) | |||||||||||
Expiring 01/12/2018 | UBS AG | CAD | 2,667 | 2,134,121 | 2,068,693 | (65,428 | ) | |||||||||||
Expiring 01/12/2018 | UBS AG | CAD | 1,258 | 1,002,032 | 976,240 | (25,792 | ) | |||||||||||
Czech Koruna, |
| |||||||||||||||||
Expiring 01/08/2018 | UBS AG | CZK | 35,705 | 1,635,486 | 1,628,474 | (7,012 | ) | |||||||||||
Expiring 01/08/2018 | UBS AG | CZK | 35,705 | 1,635,000 | 1,628,474 | (6,526 | ) | |||||||||||
Euro, | ||||||||||||||||||
Expiring 01/26/2018 | Hong Kong & Shanghai Bank | EUR | 1,156 | 1,372,000 | 1,353,485 | (18,515 | ) | |||||||||||
Hungarian Forint, | ||||||||||||||||||
Expiring 01/24/2018 | Goldman Sachs & Co. | HUF | 1,842,964 | 7,075,802 | 6,925,606 | (150,196 | ) | |||||||||||
Indian Rupee, | ||||||||||||||||||
Expiring 11/03/2017 | Citigroup Global Markets | INR | 321,635 | 5,006,266 | 4,963,684 | (42,582 | ) | |||||||||||
Expiring 11/03/2017 | UBS AG | INR | 214,423 | 3,314,116 | 3,309,122 | (4,994 | ) | |||||||||||
Expiring 01/30/2018 | Bank of America | INR | 198,088 | 3,021,702 | 3,023,574 | 1,872 | ||||||||||||
Expiring 01/30/2018 | Citigroup Global Markets | INR | 139,883 | 2,129,087 | 2,135,151 | 6,064 | ||||||||||||
Expiring 01/30/2018 | Morgan Stanley | INR | 198,088 | 3,010,680 | 3,023,574 | 12,894 | ||||||||||||
Indonesian Rupiah, | ||||||||||||||||||
Expiring 11/16/2017 | Citigroup Global Markets | IDR | 105,290,491 | 7,798,718 | 7,752,855 | (45,863 | ) | |||||||||||
Expiring 11/16/2017 | Citigroup Global Markets | IDR | 15,619,309 | 1,183,818 | 1,150,096 | (33,722 | ) | |||||||||||
Expiring 02/12/2018 | Morgan Stanley | IDR | 64,429,754 | 4,708,711 | 4,702,857 | (5,854 | ) | |||||||||||
Japanese Yen, | ||||||||||||||||||
Expiring 01/26/2018 | UBS AG | JPY | 323,049 | 2,847,969 | 2,854,308 | 6,339 | ||||||||||||
Mexican Peso, | ||||||||||||||||||
Expiring 11/10/2017 | Citigroup Global Markets | MXN | 136,609 | 7,533,100 | 7,112,538 | (420,562 | ) | |||||||||||
Expiring 03/27/2018 | Citigroup Global Markets | MXN | 61,272 | 3,080,000 | 3,116,820 | 36,820 | ||||||||||||
New Taiwanese Dollar, | ||||||||||||||||||
Expiring 11/08/2017 | Citigroup Global Markets | TWD | 104,604 | 3,519,650 | 3,469,634 | (50,016 | ) | |||||||||||
New Zealand Dollar, | ||||||||||||||||||
Expiring 01/12/2018 | Barclays Capital Group | NZD | 3,639 | 2,574,919 | 2,486,846 | (88,073 | ) | |||||||||||
Expiring 01/12/2018 | Barclays Capital Group | NZD | 1,148 | 822,400 | 784,482 | (37,918 | ) | |||||||||||
Expiring 01/12/2018 | UBS AG | NZD | 3,503 | 2,435,263 | 2,393,737 | (41,526 | ) | |||||||||||
Expiring 01/12/2018 | UBS AG | NZD | 1,145 | 822,400 | 782,352 | (40,048 | ) | |||||||||||
Expiring 01/12/2018 | UBS AG | NZD | 1,072 | 732,300 | 732,955 | 655 | ||||||||||||
Norwegian Krone, | ||||||||||||||||||
Expiring 01/24/2018 | Citigroup Global Markets | NOK | 20,733 | 2,610,007 | 2,544,114 | (65,893 | ) | |||||||||||
See Notes to Financial Statements.
| Prudential Absolute Return Bond Fund | 53 |
Schedule of Investments (continued)
as of October 31, 2017
Forward foreign currency exchange contracts outstanding at October 31, 2017 (continued):
Purchase Contracts | Counterparty | Notional Amount (000) | Value at Settlement Date | Current Value | Unrealized Appreciation (Depreciation) | |||||||||||||
OTC forward foreign currency exchange contracts (cont’d.): |
| |||||||||||||||||
Philippine Peso, | ||||||||||||||||||
Expiring 12/15/2017 | Citigroup Global Markets | PHP | 2,766 | $ | 53,894 | $ | 53,421 | $ | (473 | ) | ||||||||
Expiring 12/15/2017 | UBS AG | PHP | 61,161 | 1,201,821 | 1,181,290 | (20,531 | ) | |||||||||||
Polish Zloty, | ||||||||||||||||||
Expiring 01/24/2018 | Barclays Capital Group | PLN | 20,543 | 5,717,151 | 5,646,900 | (70,251 | ) | |||||||||||
Russian Ruble, | ||||||||||||||||||
Expiring 11/17/2017 | Citigroup Global Markets | RUB | 56,873 | 940,665 | 969,719 | 29,054 | ||||||||||||
Expiring 11/17/2017 | Citigroup Global Markets | RUB | 56,823 | 940,665 | 968,869 | 28,204 | ||||||||||||
Expiring 11/17/2017 | Citigroup Global Markets | RUB | 55,114 | 912,413 | 939,739 | 27,326 | ||||||||||||
Expiring 01/12/2018 | JPMorgan Chase | RUB | 433,670 | 7,362,502 | 7,321,284 | (41,218 | ) | |||||||||||
Singapore Dollar, | ||||||||||||||||||
Expiring 11/13/2017 | UBS AG | SGD | 5,097 | 3,773,450 | 3,739,272 | (34,178 | ) | |||||||||||
Expiring 11/13/2017 | UBS AG | SGD | 5,061 | 3,767,475 | 3,713,021 | (54,454 | ) | |||||||||||
Expiring 11/13/2017 | UBS AG | SGD | 5,060 | 3,767,475 | 3,712,551 | (54,924 | ) | |||||||||||
South African Rand, | ||||||||||||||||||
Expiring 12/15/2017 | Citigroup Global Markets | ZAR | 60,468 | 4,385,000 | 4,242,841 | (142,159 | ) | |||||||||||
South Korean Won, | ||||||||||||||||||
Expiring 11/17/2017 | JPMorgan Chase | KRW | 2,122,744 | 1,882,700 | 1,894,859 | 12,159 | ||||||||||||
Swedish Krona, | ||||||||||||||||||
Expiring 01/24/2018 | Citigroup Global Markets | SEK | 23,778 | 2,849,148 | 2,856,127 | 6,979 | ||||||||||||
Expiring 01/24/2018 | JPMorgan Chase | SEK | 27,005 | 3,330,974 | 3,243,761 | (87,213 | ) | |||||||||||
Turkish Lira, | ||||||||||||||||||
Expiring 12/15/2017 | Hong Kong & Shanghai Bank | TRY | 18,376 | 5,176,924 | 4,779,429 | (397,495 | ) | |||||||||||
|
|
|
|
|
| |||||||||||||
| $ | 140,586,978 | $ | 138,187,056 | (2,399,922 | ) | |||||||||||||
|
|
|
|
|
| |||||||||||||
Sale Contracts | Counterparty | Notional Amount (000) | Value at Settlement Date | Current Value | Unrealized Appreciation (Depreciation) | |||||||||||||
OTC forward foreign currency exchange contracts: |
| |||||||||||||||||
Australian Dollar, |
| |||||||||||||||||
Expiring 01/12/2018 | Barclays Capital Group | AUD | 898 | $ | 702,100 | $ | 686,931 | $ | 15,169 | |||||||||
Expiring 01/12/2018 | Barclays Capital Group | AUD | 897 | 702,100 | 686,405 | 15,695 | ||||||||||||
Expiring 01/12/2018 | Citigroup Global Markets | AUD | 1,782 | 1,371,950 | 1,362,806 | 9,144 | ||||||||||||
Expiring 01/12/2018 | Citigroup Global Markets | AUD | 1,551 | 1,202,438 | 1,186,234 | 16,204 | ||||||||||||
Expiring 01/12/2018 | Citigroup Global Markets | AUD | 1,550 | 1,202,437 | 1,185,791 | 16,646 | ||||||||||||
Expiring 01/12/2018 | Citigroup Global Markets | AUD | 1,481 | 1,150,400 | 1,132,778 | 17,622 | ||||||||||||
Expiring 01/12/2018 | Citigroup Global Markets | AUD | 1,426 | 1,097,600 | 1,091,000 | 6,600 | ||||||||||||
Expiring 01/12/2018 | Citigroup Global Markets | AUD | 1,076 | 836,857 | 822,597 | 14,260 | ||||||||||||
Expiring 01/12/2018 | UBS AG | AUD | 3,082 | 2,402,322 | 2,356,985 | 45,337 | ||||||||||||
Expiring 01/12/2018 | UBS AG | AUD | 1,782 | 1,371,950 | 1,362,710 | 9,240 | ||||||||||||
See Notes to Financial Statements.
| 54 |
Forward foreign currency exchange contracts outstanding at October 31, 2017 (continued):
Sale Contracts | Counterparty | Notional Amount (000) | Value at Settlement Date | Current Value | Unrealized Appreciation (Depreciation) | |||||||||||||
OTC forward foreign currency exchange contracts (cont’d.): |
| |||||||||||||||||
Brazilian Real, |
| |||||||||||||||||
Expiring 11/03/2017 | Barclays Capital Group | BRL | 6,630 | $ | 2,040,238 | $ | 2,025,815 | $ | 14,423 | |||||||||
Expiring 11/03/2017 | Citigroup Global Markets | BRL | 6,574 | 2,045,751 | 2,008,898 | 36,853 | ||||||||||||
Expiring 11/03/2017 | Citigroup Global Markets | BRL | 6,180 | 1,884,294 | 1,888,534 | (4,240 | ) | |||||||||||
British Pound, |
| |||||||||||||||||
Expiring 01/26/2018 | Citigroup Global Markets | GBP | 492 | 653,300 | 654,821 | (1,521 | ) | |||||||||||
Expiring 01/26/2018 | UBS AG | GBP | 7,235 | 9,556,192 | 9,637,139 | (80,947 | ) | |||||||||||
Expiring 01/26/2018 | UBS AG | GBP | 492 | 653,427 | 654,823 | (1,396 | ) | |||||||||||
Expiring 04/24/2018 | Citigroup Global Markets | GBP | 2,179 | 2,852,558 | 2,910,161 | (57,603 | ) | |||||||||||
Canadian Dollar, |
| |||||||||||||||||
Expiring 01/12/2018 | Barclays Capital Group | CAD | 1,582 | 1,266,450 | 1,227,279 | 39,171 | ||||||||||||
Expiring 01/12/2018 | Citigroup Global Markets | CAD | 806 | 642,900 | 625,010 | 17,890 | ||||||||||||
Expiring 01/12/2018 | Hong Kong & Shanghai Bank | CAD | 805 | 642,900 | 624,751 | 18,149 | ||||||||||||
Expiring 01/12/2018 | JPMorgan Chase | CAD | 1,561 | 1,239,600 | 1,211,218 | 28,382 | ||||||||||||
Expiring 01/12/2018 | JPMorgan Chase | CAD | 1,556 | 1,239,600 | 1,207,053 | 32,547 | ||||||||||||
Expiring 01/12/2018 | UBS AG | CAD | 3,650 | 2,847,968 | 2,831,801 | 16,167 | ||||||||||||
Expiring 01/12/2018 | UBS AG | CAD | 944 | 732,300 | 732,093 | 207 | ||||||||||||
Chinese Renminbi, | ||||||||||||||||||
Expiring 01/26/2018 | Citigroup Global Markets | CNH | 14,708 | 2,200,755 | 2,204,333 | (3,578 | ) | |||||||||||
Euro, | ||||||||||||||||||
Expiring 01/26/2018 | Citigroup Global Markets | EUR | 20,086 | 23,839,329 | 23,520,462 | 318,867 | ||||||||||||
Expiring 01/26/2018 | Citigroup Global Markets | EUR | 2,446 | 2,849,148 | 2,864,370 | (15,222 | ) | |||||||||||
Expiring 01/26/2018 | Citigroup Global Markets | EUR | 1,766 | 2,060,726 | 2,067,966 | (7,240 | ) | |||||||||||
Expiring 01/26/2018 | Citigroup Global Markets | EUR | 1,766 | 2,055,949 | 2,067,966 | (12,017 | ) | |||||||||||
Expiring 01/26/2018 | UBS AG | EUR | 20,086 | 23,845,277 | 23,520,464 | 324,813 | ||||||||||||
Expiring 04/06/2018 | Citigroup Global Markets | EUR | 1,880 | 2,247,532 | 2,210,406 | 37,126 | ||||||||||||
Indian Rupee, | ||||||||||||||||||
Expiring 11/03/2017 | Bank of America | INR | 198,088 | 3,051,728 | 3,058,265 | (6,537 | ) | |||||||||||
Expiring 11/03/2017 | Citigroup Global Markets | INR | 139,883 | 2,150,064 | 2,158,769 | (8,705 | ) | |||||||||||
Expiring 11/03/2017 | Morgan Stanley | INR | 198,088 | 3,040,951 | 3,057,018 | (16,067 | ) | |||||||||||
Israeli Shekel, | ||||||||||||||||||
Expiring 01/24/2018 | Citigroup Global Markets | ILS | 9,576 | 2,736,278 | 2,727,685 | 8,593 | ||||||||||||
Expiring 01/24/2018 | Citigroup Global Markets | ILS | 7,128 | 2,040,239 | 2,030,447 | 9,792 | ||||||||||||
Japanese Yen, | ||||||||||||||||||
Expiring 12/20/2017 | JPMorgan Chase | JPY | 4,031,473 | 35,887,283 | 35,548,516 | 338,767 | ||||||||||||
Expiring 01/16/2018 | Citigroup Global Markets | JPY | 14,707 | 132,071 | 129,874 | 2,197 | ||||||||||||
Expiring 01/16/2018 | JPMorgan Chase | JPY | 1,417,329 | 12,676,567 | 12,516,537 | 160,030 | ||||||||||||
Expiring 01/26/2018 | Bank of America | JPY | 300,000 | 2,647,214 | 2,650,655 | (3,441 | ) | |||||||||||
Expiring 01/26/2018 | Barclays Capital Group | JPY | 323,320 | 2,856,212 | 2,856,702 | (490 | ) | |||||||||||
Expiring 01/26/2018 | Citigroup Global Markets | JPY | 2,846,890 | 25,115,921 | 25,153,742 | (37,821 | ) | |||||||||||
Expiring 01/26/2018 | Citigroup Global Markets | JPY | 183,966 | 1,626,021 | 1,625,432 | 589 | ||||||||||||
See Notes to Financial Statements.
| Prudential Absolute Return Bond Fund | 55 |
Schedule of Investments (continued)
as of October 31, 2017
Forward foreign currency exchange contracts outstanding at October 31, 2017 (continued):
Sale Contracts | Counterparty | Notional Amount (000) | Value at Settlement Date | Current Value | Unrealized Appreciation (Depreciation) | |||||||||||||
OTC forward foreign currency exchange contracts (cont’d.): |
| |||||||||||||||||
Mexican Peso, | ||||||||||||||||||
Expiring 11/10/2017 | Citigroup Global Markets | MXN | 16,921 | $ | 941,320 | $ | 881,014 | $ | 60,306 | |||||||||
New Taiwanese Dollar, | ||||||||||||||||||
Expiring 11/08/2017 | Citigroup Global Markets | TWD | 178,899 | 5,927,742 | 5,933,951 | (6,209 | ) | |||||||||||
Expiring 11/08/2017 | Citigroup Global Markets | TWD | 34,378 | 1,135,700 | 1,140,280 | (4,580 | ) | |||||||||||
New Zealand Dollar, | ||||||||||||||||||
Expiring 01/12/2018 | Citigroup Global Markets | NZD | 2,273 | 1,604,188 | 1,553,324 | 50,864 | ||||||||||||
Expiring 01/12/2018 | JPMorgan Chase | NZD | 3,264 | 2,242,953 | 2,230,425 | 12,528 | ||||||||||||
Expiring 01/12/2018 | JPMorgan Chase | NZD | 2,314 | 1,619,863 | 1,581,126 | 38,737 | ||||||||||||
Expiring 01/12/2018 | JPMorgan Chase | NZD | 2,309 | 1,619,863 | 1,578,058 | 41,805 | ||||||||||||
Norwegian Krone, | ||||||||||||||||||
Expiring 01/24/2018 | Bank of America | NOK | 5,570 | 700,150 | 683,496 | 16,654 | ||||||||||||
Expiring 01/24/2018 | Barclays Capital Group | NOK | 4,824 | 607,448 | 591,998 | 15,450 | ||||||||||||
Expiring 01/24/2018 | UBS AG | NOK | 5,576 | 700,150 | 684,206 | 15,944 | ||||||||||||
Expiring 01/24/2018 | UBS AG | NOK | 4,813 | 607,449 | 590,637 | 16,812 | ||||||||||||
Polish Zloty, |
| |||||||||||||||||
Expiring 01/24/2018 | Citigroup Global Markets | PLN | 7,500 | 2,050,669 | 2,061,609 | (10,940 | ) | |||||||||||
Russian Ruble, |
| |||||||||||||||||
Expiring 01/12/2018 | Barclays Capital Group | RUB | 199,780 | 3,408,339 | 3,372,715 | 35,624 | ||||||||||||
Expiring 01/12/2018 | Barclays Capital Group | RUB | 101,638 | 1,717,150 | 1,715,871 | 1,279 | ||||||||||||
Expiring 01/12/2018 | Barclays Capital Group | RUB | 101,190 | 1,717,150 | 1,708,305 | 8,845 | ||||||||||||
Singapore Dollar, |
| |||||||||||||||||
Expiring 11/13/2017 | Citigroup Global Markets | SGD | 5,114 | 3,773,450 | 3,752,423 | 21,027 | ||||||||||||
Expiring 11/13/2017 | Morgan Stanley | SGD | 12,692 | 9,323,220 | 9,312,104 | 11,116 | ||||||||||||
Expiring 11/13/2017 | UBS AG | SGD | 3,169 | 2,334,909 | 2,325,062 | 9,847 | ||||||||||||
Expiring 11/13/2017 | UBS AG | SGD | 2,659 | 1,959,512 | 1,950,771 | 8,741 | ||||||||||||
Expiring 11/13/2017 | UBS AG | SGD | 1,836 | 1,343,700 | 1,347,069 | (3,369 | ) | |||||||||||
South African Rand, |
| |||||||||||||||||
Expiring 12/15/2017 | UBS AG | ZAR | 40,126 | 2,988,848 | 2,815,492 | 173,356 | ||||||||||||
Expiring 12/15/2017 | UBS AG | ZAR | 40,126 | 2,988,846 | 2,815,491 | 173,355 | ||||||||||||
South Korean Won, |
| |||||||||||||||||
Expiring 11/17/2017 | Citigroup Global Markets | KRW | 2,127,762 | 1,868,999 | 1,899,338 | (30,339 | ) | |||||||||||
Swedish Krona, |
| |||||||||||||||||
Expiring 01/24/2018 | Barclays Capital Group | SEK | 4,928 | 607,448 | 591,889 | 15,559 | ||||||||||||
Expiring 01/24/2018 | Hong Kong & Shanghai Bank | SEK | 8,622 | 1,060,700 | 1,035,671 | 25,029 | ||||||||||||
Expiring 01/24/2018 | UBS AG | SEK | 8,602 | 1,060,700 | 1,033,221 | 27,479 | ||||||||||||
Expiring 01/24/2018 | UBS AG | SEK | 4,915 | 607,449 | 590,367 | 17,082 | ||||||||||||
Swiss Franc, |
| |||||||||||||||||
Expiring 01/26/2018 | Bank of America | CHF | 5,139 | 5,219,149 | 5,183,426 | 35,723 | ||||||||||||
Expiring 01/26/2018 | Citigroup Global Markets | CHF | 1,998 | 2,016,700 | 2,015,769 | 931 | ||||||||||||
See Notes to Financial Statements.
| 56 |
Forward foreign currency exchange contracts outstanding at October 31, 2017 (continued):
Sale Contracts | Counterparty | Notional Amount (000) | Value at Settlement Date | Current Value | Unrealized Appreciation (Depreciation) | |||||||||||||
OTC forward foreign currency exchange contracts (cont’d.): |
| |||||||||||||||||
Swiss Franc, (cont’d.) |
| |||||||||||||||||
Expiring 01/26/2018 | JPMorgan Chase | CHF | 5,139 | $ | 5,219,493 | $ | 5,183,426 | $ | 36,067 | |||||||||
Expiring 01/26/2018 | UBS AG | CHF | 10,278 | 10,423,318 | 10,366,853 | 56,465 | ||||||||||||
Turkish Lira, |
| |||||||||||||||||
Expiring 12/15/2017 | UBS AG | TRY | 7,716 | 2,045,752 | 2,006,833 | 38,919 | ||||||||||||
|
|
|
|
|
| |||||||||||||
| $ | 274,839,224 | $ | 272,615,462 | 2,223,762 | ||||||||||||||
|
|
|
|
|
| |||||||||||||
| $ | (176,160 | ) | ||||||||||||||||
|
| |||||||||||||||||
Cross currency exchange contracts outstanding at October 31, 2017:
Settlement | Type | Notional Amount (000) | In Exchange For (000) | Unrealized Appreciation (Depreciation) | Counterparty | |||||||||||
OTC cross currency exchange contracts: | ||||||||||||||||
Expiring 01/12/2018 | Buy | EUR | 876 | CAD | 1,319 | $ | 1,299 | Barclays Capital Group | ||||||||
Expiring 01/12/2018 | Buy | EUR | 1,753 | NZD | 2,998 | 2,333 | Citigroup Global Markets | |||||||||
Expiring 01/12/2018 | Buy | EUR | 1,753 | AUD | 2,677 | 3,803 | Citigroup Global Markets | |||||||||
Expiring 01/12/2018 | Buy | EUR | 876 | CAD | 1,320 | 789 | Barclays Capital Group | |||||||||
Expiring 01/26/2018 | Buy | CHF | 4,058 | EUR | 3,509 | (16,343 | ) | UBS AG | ||||||||
Expiring 01/26/2018 | Buy | EUR | 1,404 | CHF | 1,628 | 2,223 | Barclays Capital Group | |||||||||
Expiring 01/26/2018 | Buy | EUR | 945 | JPY | 124,753 | 4,685 | Citigroup Global Markets | |||||||||
Expiring 01/26/2018 | Buy | JPY | 324,019 | EUR | 2,437 | 8,578 | Barclays Capital Group | |||||||||
Expiring 01/26/2018 | Buy | JPY | 375,849 | EUR | 2,849 | (15,514 | ) | Citigroup Global Markets | ||||||||
Expiring 04/06/2018 | Buy | BRL | 3,308 | EUR | 911 | (79,433 | ) | Citigroup Global Markets | ||||||||
Expiring 04/06/2018 | Buy | ZAR | 6,875 | EUR | 432 | (34,266 | ) | �� | Goldman Sachs & Co. | |||||||
|
| |||||||||||||||
| $ | (121,846 | ) | ||||||||||||||
|
| |||||||||||||||
Credit default swap agreements outstanding at October 31, 2017:
Reference | Termination Date | Fixed Rate | Notional Amount (000)#(3) | Fair Value(4) | Upfront Premiums Paid (Received) | Unrealized Appreciation (Depreciation) | Counterparty | |||||||||||||||||||
OTC credit default swaps on asset-backed securities—Sell Protection(2)^: | ||||||||||||||||||||||||||
Ameriquest Home Equity | 11/30/17 | 1.500%(M) | 457 | $ | 589 | $ | — | $ | 589 | Goldman Sachs & Co. | ||||||||||||||||
Banc of America Commercial Mortgage Trust | 11/29/17 | 1.500%(M) | 51 | 68 | — | 68 | Goldman Sachs & Co. | |||||||||||||||||||
See Notes to Financial Statements.
| Prudential Absolute Return Bond Fund | 57 |
Schedule of Investments (continued)
as of October 31, 2017
Credit default swap agreements outstanding at October 31, 2017 (continued):
Reference | Termination Date | Fixed Rate | Notional Amount (000)#(3) | Fair Value(4) | Upfront Premiums Paid (Received) | Unrealized Appreciation (Depreciation) | Counterparty | |||||||||||||||||||
OTC credit default swaps on asset-backed securities—Sell Protection(2) (cont’d.)^: | ||||||||||||||||||||||||||
Bank of America Prime Mortgage | 11/30/17 | 1.500%(M) | 1,541 | $ | 1,989 | $ | — | $ | 1,989 | Goldman Sachs & Co. | ||||||||||||||||
Battalion CLO Ltd. | 11/06/17 | 1.000%(M) | 136 | 149 | — | 149 | Goldman Sachs & Co. | |||||||||||||||||||
Bear Stearns Asset Backed Securities Trust | 11/30/17 | 1.500%(M) | 878 | 1,133 | — | 1,133 | Goldman Sachs & Co. | |||||||||||||||||||
CBASS Home Equity | 11/30/17 | 1.500%(M) | 758 | 126 | — | 126 | Goldman Sachs & Co. | |||||||||||||||||||
Chase Mortgage | 11/30/17 | 1.500%(M) | 336 | 434 | — | 434 | Goldman Sachs & Co. | |||||||||||||||||||
Chase Mortgage | 11/30/17 | 1.500%(M) | 216 | 36 | — | 36 | Goldman Sachs & Co. | |||||||||||||||||||
Chase Mortgage | 11/30/17 | 1.500%(M) | 758 | 126 | — | 126 | Goldman Sachs & Co. | |||||||||||||||||||
Chase Mortgage | 11/30/17 | 1.500%(M) | 1,119 | 1,444 | — | 1,444 | Goldman Sachs & Co. | |||||||||||||||||||
Chase Mortgage | 11/30/17 | 1.500%(M) | 939 | 1,211 | — | 1,211 | Goldman Sachs & Co. | |||||||||||||||||||
COMM Mortgage Trust | 11/29/17 | 1.500%(M) | 359 | 478 | — | 478 | Goldman Sachs & Co. | |||||||||||||||||||
COMM Mortgage Trust | 11/29/17 | 1.500%(M) | 64 | 85 | — | 85 | Goldman Sachs & Co. | |||||||||||||||||||
COMM Mortgage Trust | 11/29/17 | 1.500%(M) | 67 | 89 | — | 89 | Goldman Sachs & Co. | |||||||||||||||||||
COMM Mortgage Trust | 11/29/17 | 1.500%(M) | 329 | 438 | — | 438 | Goldman Sachs & Co. | |||||||||||||||||||
COMM Mortgage Trust | 11/29/17 | 1.500%(M) | 61 | 81 | — | 81 | Goldman Sachs & Co. | |||||||||||||||||||
COMM Mortgage Trust | 11/29/17 | 1.500%(M) | 52 | 69 | — | 69 | Goldman Sachs & Co. | |||||||||||||||||||
COMM Mortgage Trust | 11/29/17 | 1.500%(M) | 87 | 116 | — | 116 | Goldman Sachs & Co. | |||||||||||||||||||
Commercial Mortgage Pass Through Certificate | 11/29/17 | 1.500%(M) | 87 | 116 | — | 116 | Goldman Sachs & Co. | |||||||||||||||||||
Conneticut Avenue Securities | 11/30/17 | 1.500%(M) | 637 | 823 | — | 823 | Goldman Sachs & Co. | |||||||||||||||||||
Conneticut Avenue Securities | 11/30/17 | 1.500%(M) | 396 | 511 | — | 511 | Goldman Sachs & Co. | |||||||||||||||||||
Countrywide Home Equity | 11/30/17 | 1.500%(M) | 1,662 | 277 | — | 277 | Goldman Sachs & Co. | |||||||||||||||||||
Ellington CLO I Ltd. | 11/06/17 | 1.000%(M) | 130 | 143 | — | 143 | Goldman Sachs & Co. | |||||||||||||||||||
Equity One Home Equity | 11/30/17 | 1.500%(M) | 216 | 278 | — | 278 | Goldman Sachs & Co. | |||||||||||||||||||
Federal Home Loan Mortgage Corp. | 11/29/17 | 1.500%(M) | 111 | 148 | — | 148 | Goldman Sachs & Co. | |||||||||||||||||||
Federal Home Loan Mortgage Corp. | 11/29/17 | 1.500%(M) | 250 | 333 | — | 333 | Goldman Sachs & Co. | |||||||||||||||||||
Federal Home Loan Mortgage Corp. | 11/29/17 | 1.500%(M) | 219 | 292 | — | 292 | Goldman Sachs & Co. | |||||||||||||||||||
Federal Home Loan Mortgage Corp. | 11/29/17 | 1.500%(M) | 108 | 144 | — | 144 | Goldman Sachs & Co. | |||||||||||||||||||
Flatiron CLO Ltd. | 11/06/17 | 1.000%(M) | 326 | 359 | — | 359 | Goldman Sachs & Co. | |||||||||||||||||||
Flatiron CLO Ltd. | 11/06/17 | 1.000%(M) | 254 | 279 | — | 279 | Goldman Sachs & Co. | |||||||||||||||||||
See Notes to Financial Statements.
| 58 |
Credit default swap agreements outstanding at October 31, 2017 (continued):
Reference | Termination Date | Fixed Rate | Notional Amount (000)#(3) | Fair Value(4) | Upfront Premiums Paid (Received) | Unrealized Appreciation (Depreciation) | Counterparty | |||||||||||||||||||
OTC credit default swaps on asset-backed securities—Sell Protection(2) (cont’d.)^: | ||||||||||||||||||||||||||
GS Mortgage Securities Trust | 11/29/17 | 1.500%(M) | 372 | $ | 496 | $ | — | $ | 496 | Goldman Sachs & Co. | ||||||||||||||||
GS Mortgage Securities Trust | 11/29/17 | 1.500%(M) | 149 | 199 | — | 199 | Goldman Sachs & Co. | |||||||||||||||||||
GS Mortgage Securities Trust | 11/29/17 | 1.500%(M) | 72 | 96 | — | 96 | Goldman Sachs & Co. | |||||||||||||||||||
GS Mortgage Securities Trust | 11/29/17 | 1.500%(M) | 66 | 88 | — | 88 | Goldman Sachs & Co. | |||||||||||||||||||
GS Mortgage Securities Trust | 11/29/17 | 1.500%(M) | 85 | 113 | — | 113 | Goldman Sachs & Co. | |||||||||||||||||||
GS Mortgage Securities Trust | 11/29/17 | 1.500%(M) | 311 | 414 | — | 414 | Goldman Sachs & Co. | |||||||||||||||||||
GS Mortgage Securities Trust | 11/29/17 | 1.500%(M) | 304 | 405 | — | 405 | Goldman Sachs & Co. | |||||||||||||||||||
GSAMP Home Equity | 11/30/17 | 1.500%(M) | 336 | 434 | — | 434 | Goldman Sachs & Co. | |||||||||||||||||||
GSO | 11/06/17 | 1.000%(M) | 164 | 155 | — | 155 | Goldman Sachs & Co. | |||||||||||||||||||
Guggenheim Investment Partners | 11/06/17 | 1.000%(M) | 520 | 491 | — | 491 | Goldman Sachs & Co. | |||||||||||||||||||
Harbourview CLO | 11/06/17 | 1.000%(M) | 191 | 180 | — | 180 | Goldman Sachs & Co. | |||||||||||||||||||
IndyMac Subprime Mortgage | 11/30/17 | 1.500%(M) | 276 | 356 | — | 356 | Goldman Sachs & Co. | |||||||||||||||||||
JPMBB Commercial Mortgage Securities Trust | 11/29/17 | 1.500%(M) | 185 | 247 | — | 247 | Goldman Sachs & Co. | |||||||||||||||||||
JPMBB Commercial Mortgage Securities Trust | 11/29/17 | 1.500%(M) | 53 | 71 | — | 71 | Goldman Sachs & Co. | |||||||||||||||||||
Lehman Home Equity | 11/30/17 | 1.500%(M) | 758 | 978 | — | 978 | Goldman Sachs & Co. | |||||||||||||||||||
Lehman Home Equity | 11/30/17 | 1.500%(M) | 878 | 1,133 | — | 1,133 | Goldman Sachs & Co. | |||||||||||||||||||
LNR CDO Ltd. | 11/10/17 | 1.500%(M) | 1,562 | 2,081 | — | 2,081 | Goldman Sachs & Co. | |||||||||||||||||||
Longfellow Place CLO Ltd. | 11/06/17 | 1.000%(M) | 275 | 260 | — | 260 | Goldman Sachs & Co. | |||||||||||||||||||
Morgan Stanley BAML Trust | 11/29/17 | 1.500%(M) | 447 | 595 | — | 595 | Goldman Sachs & Co. | |||||||||||||||||||
Morgan Stanley BAML Trust | 11/29/17 | 1.500%(M) | 66 | 88 | — | 88 | Goldman Sachs & Co. | |||||||||||||||||||
Morgan Stanley BAML Trust | 11/29/17 | 1.500%(M) | 79 | 105 | — | 105 | Goldman Sachs & Co. | |||||||||||||||||||
Morgan Stanley BAML Trust | 11/29/17 | 1.500%(M) | 88 | 117 | — | 117 | Goldman Sachs & Co. | |||||||||||||||||||
See Notes to Financial Statements.
| Prudential Absolute Return Bond Fund | 59 |
Schedule of Investments (continued)
as of October 31, 2017
Credit default swap agreements outstanding at October 31, 2017 (continued):
Reference | Termination Date | Fixed Rate | Notional Amount (000)#(3) | Fair Value(4) | Upfront Premiums Paid (Received) | Unrealized Appreciation (Depreciation) | Counterparty | |||||||||||||||||||
OTC credit default swaps on asset-backed securities—Sell Protection(2) (cont’d.)^: | ||||||||||||||||||||||||||
Morgan Stanley BAML Trust | 11/29/17 | 1.500%(M) | 67 | $ | 89 | $ | — | $ | 89 | Goldman Sachs & Co. | ||||||||||||||||
Morgan Stanley Home Equity | 11/30/17 | 1.500%(M) | 276 | 356 | — | 356 | Goldman Sachs & Co. | |||||||||||||||||||
Morgan Stanley Home Equity | 11/30/17 | 1.500%(M) | 216 | 278 | — | 278 | Goldman Sachs & Co. | |||||||||||||||||||
New Century Home Equity | 11/30/17 | 1.500%(M) | 577 | 745 | — | 745 | Goldman Sachs & Co. | |||||||||||||||||||
New Century Home Equity | 11/30/17 | 1.500%(M) | 396 | 511 | — | 511 | Goldman Sachs & Co. | |||||||||||||||||||
New Century Home Equity | 11/30/17 | 1.500%(M) | 457 | 589 | — | 589 | Goldman Sachs & Co. | |||||||||||||||||||
North End CLO Ltd. | 11/06/17 | 1.000%(M) | 253 | 239 | — | 239 | Goldman Sachs & Co. | |||||||||||||||||||
Onex | 11/06/17 | 1.000%(M) | 274 | 206 | — | 206 | Goldman Sachs & Co. | |||||||||||||||||||
Option One Home Equity | 11/30/17 | 1.500%(M) | 457 | 589 | — | 589 | Goldman Sachs & Co. | |||||||||||||||||||
Option One Home Equity | 11/30/17 | 1.500%(M) | 336 | 56 | — | 56 | Goldman Sachs & Co. | |||||||||||||||||||
Option One Home Equity | 11/30/17 | 1.500%(M) | 396 | 511 | — | 511 | Goldman Sachs & Co. | |||||||||||||||||||
Option One Home Equity | 11/30/17 | 1.500%(M) | 1,360 | 1,755 | — | 1,755 | Goldman Sachs & Co. | |||||||||||||||||||
Pinebridge | 11/06/17 | 1.000%(M) | 136 | 128 | — | 128 | Goldman Sachs & Co. | |||||||||||||||||||
Sankaty | 11/06/17 | 1.000%(M) | 460 | 435 | — | 435 | Goldman Sachs & Co. | |||||||||||||||||||
Shenkman Capital | 11/06/17 | 1.000%(M) | 177 | 167 | — | 167 | Goldman Sachs & Co. | |||||||||||||||||||
Soundview Home Equity | 11/30/17 | 1.500%(M) | 1,059 | 1,367 | — | 1,367 | Goldman Sachs & Co. | |||||||||||||||||||
Staniford Street CLO Ltd. | 11/06/17 | 1.000%(M) | 147 | 139 | — | 139 | Goldman Sachs & Co. | |||||||||||||||||||
Structured Agency Credit Risk | 11/30/17 | 1.500%(M) | 577 | 745 | — | 745 | Goldman Sachs & Co. | |||||||||||||||||||
Structured Agency Credit Risk | 11/30/17 | 1.500%(M) | 818 | 1,056 | — | 1,056 | Goldman Sachs & Co. | |||||||||||||||||||
Ventrue CDO Ltd. | 11/06/17 | 1.000%(M) | 235 | 222 | — | 222 | Goldman Sachs & Co. | |||||||||||||||||||
Ventrue CDO Ltd. | 11/06/17 | 1.000%(M) | 213 | 225 | — | 225 | Goldman Sachs & Co. | |||||||||||||||||||
WF-RBS Commercial Mortgage Trust | 11/29/17 | 1.500%(M) | 43 | 57 | — | 57 | Goldman Sachs & Co. | |||||||||||||||||||
WF-RBS Commercial Mortgage Trust | 11/29/17 | 1.500%(M) | 65 | 87 | — | 87 | Goldman Sachs & Co. | |||||||||||||||||||
Wood Street CLO BV | 11/06/17 | 1.000%(M) | 195 | 184 | — | 184 | Goldman Sachs & Co. | |||||||||||||||||||
Z Capital Credit Partners CLO | 11/06/17 | 1.000%(M) | 227 | 215 | — | 215 | Goldman Sachs & Co. | |||||||||||||||||||
|
|
|
|
|
| |||||||||||||||||||||
| $ | 32,417 | $ | — | $ | 32,417 | |||||||||||||||||||||
|
|
|
|
|
| |||||||||||||||||||||
See Notes to Financial Statements.
| 60 |
Credit default swap agreements outstanding at October 31, 2017 (continued):
Reference | Termination Date | Fixed Rate | Notional Amount (000)#(3) | Implied Credit Spread at October 31, 2017(5) | Value at Trade Date | Value at October 31, 2017 | Unrealized Appreciation (Depreciation) | |||||||||||||||||||||
Centrally cleared credit default swaps on corporate and/or sovereign issues—Sell Protection(2): |
| |||||||||||||||||||||||||||
Anadarko Petroleum Corp. | 06/20/21 | 1.000%(Q) | 750 | 0.633 | % | $ | (56,543 | ) | $ | 10,482 | $ | 67,025 | ||||||||||||||||
AT&T, Inc. | 06/20/21 | 1.000%(Q) | 6,540 | 0.396 | % | 47,134 | 146,526 | 99,392 | ||||||||||||||||||||
CIT Group, Inc. | 06/20/18 | 5.000%(Q) | 2,740 | 0.085 | % | 175,137 | 102,121 | (73,016 | ) | |||||||||||||||||||
Eastman Chemical Co. | 06/20/21 | 1.000%(Q) | 4,860 | 0.259 | % | 46,754 | 132,832 | 86,078 | ||||||||||||||||||||
Ford Motor Co. | 06/20/21 | 5.000%(Q) | 8,000 | 0.384 | % | 1,391,644 | 1,345,491 | (46,153 | ) | |||||||||||||||||||
|
|
|
|
|
| |||||||||||||||||||||||
| $ | 1,604,126 | $ | 1,737,452 | $ | 133,326 | |||||||||||||||||||||||
|
|
|
|
|
| |||||||||||||||||||||||
Reference | Termination Date | Fixed Rate | Notional Amount (000)#(3) | Value at Trade Date | Value at October 31, 2017(4) | Unrealized Appreciation (Depreciation) | ||||||||||||||||||
Centrally cleared credit default swap on credit indices—Sell Protection(2): |
| |||||||||||||||||||||||
CDX.NA.IG.29.V1 | 12/20/22 | 1.000%(Q) | 50,000 | $ | (1,019,251 | ) | $ | (1,214,783 | ) | $ | (195,532 | ) | ||||||||||||
|
|
|
|
|
| |||||||||||||||||||
Reference | Termination Date | Fixed Rate | Notional Amount (000)#(3) | Fair Value(4) | Upfront Premiums Paid (Received) | Unrealized Appreciation (Depreciation) | Counterparty | |||||||||||||||||||
OTC credit default swaps on credit indices—Sell Protection(2): | ||||||||||||||||||||||||||
CMBX.NA.6.AA | 05/11/63 | 1.500%(M) | 23,500 | $ | (86,216 | ) | $ | 312,157 | $ | (398,373 | ) | Credit Suisse First Boston Corp. | ||||||||||||||
CMBX.NA.6.AA | 05/11/63 | 1.500%(M) | 3,500 | (12,841 | ) | 44,114 | (56,955 | ) | Credit Suisse First Boston Corp. | |||||||||||||||||
CMBX.NA.6.AA | 05/11/63 | 1.500%(M) | 9,000 | (33,019 | ) | (4,454 | ) | (28,565 | ) | Goldman Sachs & Co. | ||||||||||||||||
CMBX.NA.6.AA | 05/11/63 | 1.500%(M) | 23,000 | (84,382 | ) | 268,547 | (352,929 | ) | Deutsche Bank AG | |||||||||||||||||
CMBX.NA.6.AA | 05/11/63 | 1.500%(M) | 7,000 | (25,681 | ) | 38,819 | (64,500 | ) | UBS AG | |||||||||||||||||
CMBX.NA.6.AA | 05/11/63 | 1.500%(M) | 8,000 | (29,350 | ) | (489,693 | ) | 460,343 | Credit Suisse First Boston Corp. | |||||||||||||||||
CMBX.NA.6.AA | 05/11/63 | 1.500%(M) | 20,000 | (73,376 | ) | (669,507 | ) | 596,131 | JPMorgan Chase | |||||||||||||||||
|
|
|
|
|
| |||||||||||||||||||||
| $ | (344,865 | ) | $ | (500,017 | ) | $ | 155,152 | |||||||||||||||||||
|
|
|
|
|
| |||||||||||||||||||||
See Notes to Financial Statements.
| Prudential Absolute Return Bond Fund | 61 |
Schedule of Investments (continued)
as of October 31, 2017
Credit default swap agreements outstanding at October 31, 2017 (continued):
Reference | Termination Date | Fixed Rate | Notional Amount (000)#(3) | Implied Credit Spread at October 31, 2017(5) | Fair Value | Upfront Premiums Paid (Received) | Unrealized Appreciation (Depreciation) | Counterparty | ||||||||||||||||||||||
OTC credit default swaps on corporate and/or sovereign issues-Buy Protection(1): | ||||||||||||||||||||||||||||||
Argentina Republic | 06/20/18 | 5.000%(Q) | 3,970 | 0.568 | % | $ | (135,455 | ) | $ | (170,257 | ) | $ | 34,802 | BNP Paribas SA | ||||||||||||||||
|
|
|
|
|
| |||||||||||||||||||||||||
Reference | Termination Date | Fixed Rate | Notional Amount (000)#(3) | Implied Credit Spread at October 31, 2017(5) | Fair Value | Upfront Premiums Paid (Received) | Unrealized Appreciation (Depreciation) | Counterparty | ||||||||||||||||||||||
OTC credit default swaps on corporate and/or sovereign issues-Sell Protection(2): | ||||||||||||||||||||||||||||||
Hellenic Republic | 06/20/22 | 1.000%(Q) | 2,160 | 4.638 | % | $ | (304,897 | ) | $ | (372,840 | ) | $ | 67,943 | Citigroup Global Markets | ||||||||||||||||
Hellenic Republic | 06/20/22 | 1.000%(Q) | 540 | 4.638 | % | (76,224 | ) | (95,850 | ) | 19,626 | Goldman Sachs & Co. | |||||||||||||||||||
Hellenic Republic | 06/20/24 | 1.000%(Q) | 1,000 | 4.716 | % | (188,612 | ) | (216,250 | ) | 27,638 | Barclays Capital Group | |||||||||||||||||||
Kingdom of Saudi Arabia | 12/20/21 | 1.000%(Q) | 7,700 | 0.622 | % | 124,808 | (156,937 | ) | 281,745 | Barclays Capital Group | ||||||||||||||||||||
People’s Republic of China | 03/20/22 | 1.000%(Q) | 5,000 | 0.436 | % | 124,640 | (79,787 | ) | 204,427 | Deutsche Bank AG | ||||||||||||||||||||
Petroleo Brasileiro SA | 06/20/18 | 1.000%(Q) | 3,750 | 0.420 | % | 18,257 | (287,530 | ) | 305,787 | Morgan Stanley | ||||||||||||||||||||
Petroleos Mexicanos | 12/20/18 | 1.000%(Q) | 8,000 | 0.464 | % | 58,042 | 4,231 | 53,811 | Citigroup Global Markets | |||||||||||||||||||||
Petroleos Mexicanos | 06/20/23 | 1.000%(Q) | 9,450 | 1.926 | % | (439,355 | ) | (1,224,841 | ) | 785,486 | BNP Paribas SA | |||||||||||||||||||
Republic of Indonesia | 09/20/20 | 1.000%(Q) | 8,000 | 0.518 | % | 118,150 | (322,295 | ) | 440,445 | Barclays Capital Group | ||||||||||||||||||||
Republic of Indonesia | 06/20/21 | 1.000%(Q) | 2,100 | 0.657 | % | 27,723 | (83,337 | ) | 111,060 | JPMorgan Chase | ||||||||||||||||||||
Republic of Italy | 09/20/20 | 1.000%(Q) | 12,000 | 0.852 | % | 63,785 | (63,450 | ) | 127,235 | JPMorgan Chase | ||||||||||||||||||||
See Notes to Financial Statements.
| 62 |
Credit default swap agreements outstanding at October 31, 2017 (continued):
Reference | Termination Date | Fixed Rate | Notional Amount (000)#(3) | Implied Credit Spread at October 31, 2017(5) | Fair Value | Upfront Premiums Paid (Received) | Unrealized Appreciation (Depreciation) | Counterparty | ||||||||||||||||||||||
OTC credit default swaps on corporate and/or sovereign issues-Sell Protection(2) (cont’d.): | ||||||||||||||||||||||||||||||
Republic of Panama Government | 09/20/20 | 1.000%(Q) | 1,700 | 0.329 | % | $ | 34,326 | $ | (43,542 | ) | $ | 77,868 | Deutsche Bank AG | |||||||||||||||||
Republic of Turkey | 09/20/20 | 1.000%(Q) | 2,000 | 1.090 | % | (2,709 | ) | (148,017 | ) | 145,308 | Barclays Capital Group | |||||||||||||||||||
United Mexico States Government | 12/20/20 | 1.000%(Q) | 7,000 | 0.628 | % | 87,733 | (123,938 | ) | 211,671 | Goldman Sachs & Co. | ||||||||||||||||||||
|
|
|
|
|
| |||||||||||||||||||||||||
| $ | (354,333 | ) | $ | (3,214,383 | ) | $ | 2,860,050 | |||||||||||||||||||||||
|
|
|
|
|
| |||||||||||||||||||||||||
The Fund entered into credit default swaps (“CDS”) to provide a measure of protection against defaults or to take an active long or short position with respect to the likelihood of a particular issuer’s default or the reference entity’s credit soundness. CDS contracts generally trade based on a spread which represents the cost a protection buyer has to pay the protection seller. The protection buyer is said to be short the credit as the value of the contract rises the more the credit deteriorates. The value of the CDS contract increases for the protection buyer if the spread increases.
| (1) | If the Fund is a buyer of protection, it pays the fixed rate. When a credit event occurs, as defined under the terms of that particular swap agreement, the Fund will either (i) receive from the seller of protection an amount equal to the notional amount of the swap and make delivery of the referenced obligation or underlying securities comprising the referenced index or (ii) receive a net settlement amount in the form of cash or securities equal to the notional amount of the swap less the recovery value of the referenced obligation or underlying securities comprising the referenced index. |
| (2) | If the Fund is a seller of protection, it receives the fixed rate. When a credit event occurs, as defined under the terms of that particular swap agreement, the Fund will either (i) pay to the buyer of protection an amount equal to the notional amount and take delivery of the referenced obligation or underlying securities comprising the referenced index or (ii) pay a net settlement amount in the form of cash or securities equal to the notional amount of the swap less the recovery value of the referenced obligation or underlying securities comprising the referenced index. |
| (3) | Notional amount represents the maximum potential amount the Fund could be required to pay as a seller of credit protection or receive as a buyer of credit protection if a credit event occurs as defined under the terms of that particular swap agreement. |
| (4) | The fair value of credit default swap agreements on credit indices and asset-backed securities serves as an indicator of the current status of the payment/performance risk and represents the likelihood of an expected liability (or profit) for the credit derivative should the notional amount of the swap agreement be closed/sold as of the reporting date. Increasing fair value in absolute terms, when compared to the notional amount of the swap, represents a deterioration of the referenced entity’s credit soundness and a greater likelihood of risk of default or other credit event occurring as defined under the terms of the agreement. |
See Notes to Financial Statements.
| Prudential Absolute Return Bond Fund | 63 |
Schedule of Investments (continued)
as of October 31, 2017
| (5) | Implied credit spreads, represented in absolute terms, utilized in determining the fair value of credit default swap agreements on corporate issues or sovereign issues of an emerging country as of the reporting date serve as an indicator of the current status of the payment/performance risk and represent the likelihood of risk of default for the credit derivative. The implied credit spread of a particular referenced entity reflects the cost of buying/selling protection and may include up-front payments required to be made to enter into the agreement. Wider credit spreads represent a deterioration of the referenced entity’s credit soundness and a greater likelihood of risk of default or other credit event occurring as defined under the terms of the agreement. |
Inflation Swap Agreements outstanding at October 31, 2017:
Notional | Termination Date | Fixed | Floating Rate | Value at Trade Date | Value at October 31, 2017 | Unrealized Appreciation (Depreciation) | ||||||||||||||||
Centrally cleared swap agreements: | ||||||||||||||||||||||
| EUR | 9,020 | 08/15/22 | 1.240%(T) | Eurostat Eurozone HICP ex Tobacco(2)(T) | $ | — | $ | (29,299 | ) | $ | (29,299 | ) | ||||||||||
| EUR | 15,305 | 09/15/22 | 1.260%(T) | Eurostat Eurozone HICP ex Tobacco(2)(T) | — | (35,598 | ) | (35,598 | ) | |||||||||||||
| EUR | 4,510 | 08/15/27 | 1.415%(T) | Eurostat Eurozone HICP ex Tobacco(1)(T) | — | 30,455 | 30,455 | |||||||||||||||
| EUR | 7,450 | 09/15/27 | 1.438%(T) | Eurostat Eurozone HICP ex Tobacco(1)(T) | — | 35,758 | 35,758 | |||||||||||||||
| GBP | 3,570 | 08/15/24 | 3.346%(T) | U.K. Retail Price Index(2)(T) | — | (25,629 | ) | (25,629 | ) | |||||||||||||
| GBP | 4,700 | 08/15/27 | 3.344%(T) | U.K. Retail Price Index(1)(T) | — | 66,490 | 66,490 | |||||||||||||||
| GBP | 1,885 | 08/15/29 | 3.380%(T) | U.K. Retail Price Index(2)(T) | — | (27,523 | ) | (27,523 | ) | |||||||||||||
| GBP | 4,985 | 07/15/32 | 3.513%(T) | U.K. Retail Price Index(2)(T) | — | (11,804 | ) | (11,804 | ) | |||||||||||||
| GBP | 6,770 | 07/15/37 | 3.515%(T) | U.K. Retail Price Index(2)(T) | — | (95,376 | ) | (95,376 | ) | |||||||||||||
| GBP | 1,415 | 08/15/42 | 3.520%(T) | U.K. Retail Price Index(2)(T) | — | (30,310 | ) | (30,310 | ) | |||||||||||||
| GBP | 5,155 | 07/15/47 | 3.458%(T) | U.K. Retail Price Index(1)(T) | (169,306 | ) | 170,918 | 340,224 | ||||||||||||||
| GBP | 1,070 | 08/15/47 | 3.469%(T) | U.K. Retail Price Index(1)(T) | — | 25,195 | 25,195 | |||||||||||||||
| GBP | 575 | 10/15/47 | 3.535%(T) | U.K. Retail Price Index(2)(T) | — | 22,315 | 22,315 | |||||||||||||||
| GBP | 380 | 07/15/57 | 3.325%(T) | U.K. Retail Price Index(1)(T) | — | 23,217 | 23,217 | |||||||||||||||
| GBP | 355 | 10/15/57 | 3.418%(T) | U.K. Retail Price Index(1)(T) | — | (23,496 | ) | (23,496 | ) | |||||||||||||
| 16,500 | 10/25/27 | 2.160%(T) | U.S. CPI Urban Consumers NSA Index(2)(T) | 511 | (14,930 | ) | (15,441 | ) | ||||||||||||||
|
|
|
|
|
| |||||||||||||||||
| $ | (168,795 | ) | $ | 80,383 | $ | 249,178 | ||||||||||||||||
|
|
|
|
|
| |||||||||||||||||
Interest rate swap agreements outstanding at October 31, 2017:
Notional | Termination Date | Fixed | Floating Rate | Value at Trade Date | Value at October 31, 2017 | Unrealized Appreciation (Depreciation) | ||||||||||||||||
Centrally cleared swap agreements: | ||||||||||||||||||||||
| AUD | 34,680 | 07/07/22 | 2.460%(S) | 6 Month BBSW(2)(S) | $ | (1,341 | ) | $ | 124,021 | $ | 125,362 | |||||||||||
| AUD | 33,065 | 09/25/22 | 2.958%(S) | 6 Month BBSW(2)(S) | 3,434 | 83,632 | 80,198 | |||||||||||||||
See Notes to Financial Statements.
| 64 |
Interest rate swap agreements outstanding at October 31, 2017 (continued):
Notional | Termination Date | Fixed | Floating Rate | Value at Trade Date | Value at October 31, 2017 | Unrealized Appreciation (Depreciation) | ||||||||||||||||
Centrally cleared swap agreements (cont’d.): | ||||||||||||||||||||||
| AUD | 26,170 | 09/28/22 | 2.988%(S) | 6 Month BBSW(2)(S) | $ | (1,720 | ) | $ | 76,469 | $ | 78,189 | |||||||||||
| AUD | 9,720 | 07/19/27 | 3.355%(S) | 6 Month BBSW(2)(S) | — | 19,423 | 19,423 | |||||||||||||||
| AUD | 3,585 | 07/19/32 | 3.130%(S) | 6 Month BBSW(2)(S) | (1,851 | ) | 29,724 | 31,575 | ||||||||||||||
| BRL | 110,795 | 01/02/19 | 0.000%(T) | 1 Day BROIS(1)(T) | — | 20,027 | 20,027 | |||||||||||||||
| BRL | 66,586 | 01/02/19 | 0.000%(T) | 1 Day BROIS(1)(T) | — | 11,376 | 11,376 | |||||||||||||||
| BRL | 82,781 | 01/04/21 | 0.000%(T) | 1 Day BROIS(2)(T) | — | (280,544 | ) | (280,544 | ) | |||||||||||||
| BRL | 50,005 | 01/04/21 | 0.000%(T) | 1 Day BROIS(2)(T) | — | (174,462 | ) | (174,462 | ) | |||||||||||||
| BRL | 55,620 | 01/04/21 | 0.000%(T) | 1 Day BROIS(2)(T) | — | 751,222 | 751,222 | |||||||||||||||
| BRL | 27,101 | 01/04/21 | 0.000%(T) | 1 Day BROIS(2)(T) | — | 351,220 | 351,220 | |||||||||||||||
| BRL | 28,099 | 01/04/21 | 0.000%(T) | 1 Day BROIS(2)(T) | — | 285,587 | 285,587 | |||||||||||||||
| BRL | 17,139 | 01/04/21 | 0.000%(T) | 1 Day BROIS(2)(T) | — | 183,424 | 183,424 | |||||||||||||||
| BRL | 40,640 | 01/04/21 | 0.000%(T) | 1 Day BROIS(1)(T) | — | (198,041 | ) | (198,041 | ) | |||||||||||||
| BRL | 41,616 | 01/04/21 | 0.000%(T) | 1 Day BROIS(1)(T) | — | (148,445 | ) | (148,445 | ) | |||||||||||||
| BRL | 14,961 | 01/02/23 | 0.000%(T) | 1 Day BROIS(1)(T) | — | 89,791 | 89,791 | |||||||||||||||
| BRL | 25,174 | 01/02/23 | 0.000%(T) | 1 Day BROIS(1)(T) | — | 149,298 | 149,298 | |||||||||||||||
| BRL | 16,970 | 01/02/25 | 0.000%(T) | 1 Day BROIS(2)(T) | — | 81,630 | 81,630 | |||||||||||||||
| BRL | 17,286 | 01/02/25 | 0.000%(T) | 1 Day BROIS(2)(T) | — | 30,458 | 30,458 | |||||||||||||||
| CAD | 97,210 | 07/26/19 | 1.605%(S) | 3 Month Canadian Banker’s Acceptance(2)(S) | (96,872 | ) | (92,477 | ) | 4,395 | |||||||||||||
| CHF | 6,010 | 10/12/27 | 0.746%(A) | 6 Month CHF LIBOR(1)(S) | — | (14,909 | ) | (14,909 | ) | |||||||||||||
| CZK | 590,905 | 07/03/22 | 0.820%(A) | 6 Month PRIBOR(2)(S) | — | (801,838 | ) | (801,838 | ) | |||||||||||||
| CZK | 307,115 | 07/03/27 | 1.115%(A) | 6 Month PRIBOR(1)(S) | — | 801,165 | 801,165 | |||||||||||||||
| EUR | 5,735 | 05/11/19 | (0.144%)(A) | 6 Month EURIBOR(1)(S) | (8,233 | ) | (13,160 | ) | (4,927 | ) | ||||||||||||
| EUR | 21,525 | 05/11/22 | 0.156%(A) | 6 Month EURIBOR(1)(S) | 23,463 | (82,094 | ) | (105,557 | ) | |||||||||||||
| EUR | 22,120 | 07/03/22 | 0.182%(A) | 6 Month EURIBOR(1)(S) | — | (80,600 | ) | (80,600 | ) | |||||||||||||
| EUR | 1,690 | 05/11/23 | 0.650%(A) | 6 Month EURIBOR(1)(S) | (33,130 | ) | (50,345 | ) | (17,215 | ) | ||||||||||||
| EUR | 3,670 | 05/11/24 | 0.396%(A) | 6 Month EURIBOR(1)(S) | (11,357 | ) | (11,034 | ) | 323 | |||||||||||||
| EUR | 2,530 | 05/11/25 | 0.650%(A) | 6 Month EURIBOR(1)(S) | (5,355 | ) | (37,901 | ) | (32,546 | ) | ||||||||||||
| EUR | 2,740 | 05/11/26 | 0.750%(A) | 6 Month EURIBOR(1)(S) | (3,999 | ) | (38,811 | ) | (34,812 | ) | ||||||||||||
| EUR | 42,560 | 08/15/26 | 0.634%(A) | 1 Day EONIA(1)(A) | 12,523 | (710,918 | ) | (723,441 | ) | |||||||||||||
| EUR | 61,605 | 08/15/26 | 0.655%(A) | 1 Day EONIA(1)(A) | (18,455 | ) | (1,161,985 | ) | (1,143,530 | ) | ||||||||||||
| EUR | 460 | 05/11/27 | 0.736%(A) | 6 Month EURIBOR(2)(S) | (5,608 | ) | 204 | 5,812 | ||||||||||||||
| EUR | 11,275 | 07/03/27 | 0.795%(A) | 6 Month EURIBOR(2)(S) | — | 41,159 | 41,159 | |||||||||||||||
| EUR | 5,580 | 10/12/27 | 1.556%(A) | 6 Month EURIBOR(2)(S) | — | 20,947 | 20,947 | |||||||||||||||
| EUR | 2,040 | 02/15/30 | 1.124%(A) | 6 Month EURIBOR(1)(S) | (488 | ) | (26,972 | ) | (26,484 | ) | ||||||||||||
| EUR | 2,860 | 05/11/30 | 0.850%(A) | 6 Month EURIBOR(1)(S) | 105,810 | 72,643 | (33,167 | ) | ||||||||||||||
| EUR | 16,020 | 10/04/32 | 2.000%(A) | 1 Day EONIA(2)(A) | — | (44,086 | ) | (44,086 | ) | |||||||||||||
| EUR | 16,020 | 10/04/32 | 2.080%(A) | 3 Month EURIBOR(1)(Q) | — | (10,927 | ) | (10,927 | ) | |||||||||||||
| EUR | 430 | 05/11/37 | 1.253%(A) | 6 Month EURIBOR(1)(S) | 19,085 | 11,021 | (8,064 | ) | ||||||||||||||
| EUR | 31,515 | 08/24/37 | 1.960%(A) | 1 Day EONIA(2)(A) | — | (296,640 | ) | (296,640 | ) | |||||||||||||
See Notes to Financial Statements.
| Prudential Absolute Return Bond Fund | 65 |
Schedule of Investments (continued)
as of October 31, 2017
Interest rate swap agreements outstanding at October 31, 2017 (continued):
Notional | Termination Date | Fixed | Floating Rate | Value at Trade Date | Value at October 31, 2017 | Unrealized Appreciation (Depreciation) | ||||||||||||||||
Centrally cleared swap agreements (cont’d.): | ||||||||||||||||||||||
| EUR | 31,515 | 08/24/37 | 2.033%(A) | 3 Month EURIBOR(1)(Q) | $ | (5,748 | ) | $ | 92,268 | $ | 98,016 | |||||||||||
| EUR | 18,530 | 10/25/37 | 2.085%(A) | 3 Month EURIBOR(2)(Q) | — | (68,197 | ) | (68,197 | ) | |||||||||||||
| EUR | 18,530 | 10/25/37 | 2.114%(A) | 6 Month EURIBOR(1)(S) | — | 15,522 | 15,522 | |||||||||||||||
| EUR | 1,090 | 05/11/42 | 1.350%(A) | 6 Month EURIBOR(1)(S) | 50,926 | 30,782 | (20,144 | ) | ||||||||||||||
| EUR | 8,250 | 07/04/42 | 1.416%(A) | 1 Day EONIA(2)(A) | (16,441 | ) | 174,720 | 191,161 | ||||||||||||||
| EUR | 17,850 | 07/04/42 | 1.438%(A) | 1 Day EONIA(2)(A) | — | 480,610 | 480,610 | |||||||||||||||
| GBP | 680,585 | 12/14/17 | 0.419%(T) | 1 Day SONIA(2)(T) | — | (13,223 | ) | (13,223 | ) | |||||||||||||
| GBP | 509,140 | 02/08/18 | 0.442%(T) | 1 Day SONIA(1)(T) | — | 17,023 | 17,023 | |||||||||||||||
| GBP | 3,280 | 05/08/21 | 0.716%(S) | 6 Month GBP LIBOR(1)(S) | 39,091 | 36,429 | (2,662 | ) | ||||||||||||||
| GBP | 25,060 | 12/07/27 | 1.444%(S) | 6 Month GBP LIBOR(1)(S) | 11,304 | (152,489 | ) | (163,793 | ) | |||||||||||||
| GBP | 3,060 | 07/06/32 | 1.933%(S) | 6 Month GBP LIBOR(2)(S) | — | 61,963 | 61,963 | |||||||||||||||
| GBP | 11,905 | 10/30/32 | 1.633%(S) | 6 Month GBP LIBOR(2)(S) | 2,806 | 211,855 | 209,049 | |||||||||||||||
| GBP | 3,680 | 07/06/42 | 1.850%(S) | 6 Month GBP LIBOR(1)(S) | — | (43,546 | ) | (43,546 | ) | |||||||||||||
| GBP | 6,665 | 10/30/47 | 1.680%(S) | 6 Month GBP LIBOR(1)(S) | — | (194,825 | ) | (194,825 | ) | |||||||||||||
| JPY | 3,647,030 | 12/20/24 | 0.126%(S) | 6 Month JPY LIBOR(2)(S) | (31,244 | ) | (90,212 | ) | (58,968 | ) | ||||||||||||
| MXN | 89,000 | 10/15/26 | 6.445%(M) | 28 Day Mexican Interbank Rate(2)(M) | 43 | (304,309 | ) | (304,352 | ) | |||||||||||||
| MXN | 182,400 | 12/09/26 | 7.780%(M) | 28 Day Mexican Interbank Rate(2)(M) | (91,712 | ) | 235,747 | 327,459 | ||||||||||||||
| NZD | 45,930 | 12/15/17 | 2.125%(Q) | 3 Month New Zealand Bank Bill(2)(Q) | 138 | 182,571 | 182,433 | |||||||||||||||
| 111,480 | 11/01/17 | 0.639%(T) | 1 Day USOIS(1)(T) | 401 | 273,473 | 273,072 | ||||||||||||||||
| 230,920 | 11/14/17 | 0.675%(T) | 1 Day USOIS(1)(T) | (20,052 | ) | 544,463 | 564,515 | |||||||||||||||
| 116,245 | 11/22/17 | 0.716%(T) | 1 Day USOIS(1)(T) | 412 | 245,012 | 244,600 | ||||||||||||||||
| 127,210 | 01/07/18 | 1.093%(T) | 1 Day USOIS(1)(T) | — | 23,113 | 23,113 | ||||||||||||||||
| 346,000 | 01/26/18 | 1.124%(S) | 3 Month LIBOR(1)(Q) | (66,156 | ) | (726,559 | ) | (660,403 | ) | |||||||||||||
| 154,300 | 02/08/18 | 0.884%(S) | 3 Month LIBOR(1)(Q) | 500 | 390,911 | 390,411 | ||||||||||||||||
| 61,940 | 07/11/18 | 0.947%(S) | 3 Month LIBOR(1)(Q) | 292 | 132,323 | 132,031 | ||||||||||||||||
| 42,075 | 10/07/18 | 1.253%(A) | 1 Day USOIS(1)(A) | — | 79,003 | 79,003 | ||||||||||||||||
| 58,600 | 11/09/18 | 1.160%(S) | 3 Month LIBOR(1)(Q) | (22,227 | ) | 147,983 | 170,210 | |||||||||||||||
| 116,540 | 11/17/18 | 1.080%(T) | 1 Day USOIS(1)(T) | 412 | 486,482 | 486,070 | ||||||||||||||||
| 175,200 | 11/18/18 | 0.911%(A) | 1 Day USOIS(1)(A) | (9,360 | ) | 1,035,102 | 1,044,462 | |||||||||||||||
| 76,310 | 11/22/18 | 1.297%(S) | 3 Month LIBOR(1)(Q) | 324 | 50,182 | 49,858 | ||||||||||||||||
| 496,570 | 05/11/19 | 1.613%(S) | 3 Month LIBOR(1)(Q) | (11,550 | ) | (1,306,358 | ) | (1,294,808 | ) | |||||||||||||
| 44,680 | 06/30/19 | 1.487%(A) | 1 Day USOIS(1)(A) | (10,717 | ) | 53,461 | 64,178 | |||||||||||||||
| 99,170 | 06/30/19 | 1.502%(A) | 1 Day USOIS(1)(A) | (67,560 | ) | 91,449 | 159,009 | |||||||||||||||
| 61,890 | 09/08/19 | 1.290%(A) | 1 Day USOIS(1)(A) | — | 341,204 | 341,204 | ||||||||||||||||
| 30,675 | 04/04/20 | —(3)(S) | —(3)(S) | — | 275 | 275 | ||||||||||||||||
| 63,165 | 05/11/20 | 1.763%(S) | 3 Month LIBOR(2)(Q) | 218,834 | 155,011 | (63,823 | ) | |||||||||||||||
| 4,605 | 05/11/21 | 1.600%(S) | 3 Month LIBOR(1)(Q) | 29,953 | 37,347 | 7,394 | ||||||||||||||||
See Notes to Financial Statements.
| 66 |
Interest rate swap agreements outstanding at October 31, 2017 (continued):
Notional | Termination Date | Fixed | Floating Rate | Value at Trade Date | Value at October 31, 2017 | Unrealized Appreciation (Depreciation) | ||||||||||||||||
Centrally cleared swap agreements (cont’d.): | ||||||||||||||||||||||
| 263,500 | 05/15/21 | 2.202%(S) | 3 Month LIBOR(1)(Q) | $ | (3,255,762 | ) | $ | (3,997,946 | ) | $ | (742,184 | ) | ||||||||||
| 72,470 | 05/31/21 | 1.849%(S) | 3 Month LIBOR(2)(Q) | 433 | 82,097 | 81,664 | ||||||||||||||||
| 79,680 | 05/31/21 | 1.948%(S) | 3 Month LIBOR(2)(Q) | 476 | 398,743 | 398,267 | ||||||||||||||||
| 363,990 | 05/31/21 | 1.953%(S) | 3 Month LIBOR(2)(Q) | 435,959 | 1,888,347 | 1,452,388 | ||||||||||||||||
| 191,000 | 05/31/21 | 1.980%(S) | 3 Month LIBOR(2)(Q) | 931 | 1,192,646 | 1,191,715 | ||||||||||||||||
| 2,570 | 07/31/21 | 2.290%(S) | 3 Month LIBOR(1)(Q) | (42,741 | ) | (42,761 | ) | (20 | ) | |||||||||||||
| 91,955 | 08/31/21 | 2.015%(S) | 3 Month LIBOR(2)(Q) | 755,220 | 183,685 | (571,535 | ) | |||||||||||||||
| 5,870 | 11/22/21 | 1.792%(S) | 3 Month LIBOR(2)(Q) | 39 | (20,022 | ) | (20,061 | ) | ||||||||||||||
| 127,355 | 11/30/21 | 1.762%(S) | 3 Month LIBOR(2)(Q) | — | (1,233,549 | ) | (1,233,549 | ) | ||||||||||||||
| 15,925 | 04/04/22 | —(4)(S) | —(4)(S) | — | (4,000 | ) | (4,000 | ) | ||||||||||||||
| 84,360 | 05/11/22 | 1.982%(S) | 3 Month LIBOR(2)(Q) | 965,757 | 294,587 | (671,170 | ) | |||||||||||||||
| 167,900 | 06/30/22 | 2.020%(S) | 3 Month LIBOR(1)(Q) | 1,056 | (701,975 | ) | (703,031 | ) | ||||||||||||||
| 157,080 | 07/17/22 | —(5)(Q) | —(5)(Q) | 3,290 | 112,189 | 108,899 | ||||||||||||||||
| 10,550 | 09/28/22 | 2.177%(S) | 3 Month LIBOR(1)(Q) | — | 27,304 | 27,304 | ||||||||||||||||
| 88,865 | 11/01/22 | 1.815%(S) | 3 Month LIBOR(2)(Q) | — | (1,134,067 | ) | (1,134,067 | ) | ||||||||||||||
| 24,000 | 04/03/23 | 2.015%(S) | 3 Month LIBOR(1)(Q) | 387,010 | 103,339 | (283,671 | ) | |||||||||||||||
| 16,300 | 06/20/23 | 2.604%(S) | 3 Month LIBOR(1)(Q) | (423,981 | ) | (549,010 | ) | (125,029 | ) | |||||||||||||
| 101,900 | 09/24/23 | 2.903%(S) | 3 Month LIBOR(1)(Q) | (4,887,263 | ) | (4,502,604 | ) | 384,659 | ||||||||||||||
| 51,250 | 11/15/23 | 2.209%(S) | 3 Month LIBOR(1)(Q) | 429 | (551,092 | ) | (551,521 | ) | ||||||||||||||
| 160 | 11/15/23 | 2.217%(S) | 3 Month LIBOR(1)(Q) | (181 | ) | (1,796 | ) | (1,615 | ) | |||||||||||||
| 124,000 | 11/15/23 | 2.230%(S) | 3 Month LIBOR(1)(Q) | 827 | (1,492,615 | ) | (1,493,442 | ) | ||||||||||||||
| 22,745 | 02/15/24 | 2.115%(S) | 3 Month LIBOR(1)(Q) | 56,894 | 29,923 | (26,971 | ) | |||||||||||||||
| 25,504 | 02/15/24 | 2.151%(S) | 3 Month LIBOR(1)(Q) | (46,430 | ) | (22,584 | ) | 23,846 | ||||||||||||||
| 47,110 | 02/15/24 | 2.167%(S) | 3 Month LIBOR(1)(Q) | (362,553 | ) | (88,000 | ) | 274,553 | ||||||||||||||
| 45,915 | 02/15/24 | 2.183%(S) | 3 Month LIBOR(1)(Q) | (51,777 | ) | (132,343 | ) | (80,566 | ) | |||||||||||||
| 184,151 | 05/11/24 | 2.139%(S) | 3 Month LIBOR(1)(Q) | (1,924,561 | ) | (894,780 | ) | 1,029,781 | ||||||||||||||
| 14,520 | 05/15/24 | 1.956%(S) | 3 Month LIBOR(2)(Q) | 18,558 | (187,963 | ) | (206,521 | ) | ||||||||||||||
| 28,490 | 08/15/24 | 2.168%(S) | 3 Month LIBOR(1)(Q) | — | 75,502 | 75,502 | ||||||||||||||||
| 244,920 | 08/15/24 | 2.170%(S) | 3 Month LIBOR(1)(Q) | 926,938 | 623,713 | (303,225 | ) | |||||||||||||||
| 13,795 | 08/15/24 | 2.176%(S) | 3 Month LIBOR(1)(Q) | — | 30,358 | 30,358 | ||||||||||||||||
| 98,000 | 08/15/24 | 2.559%(S) | 3 Month LIBOR(1)(Q) | (1,570,311 | ) | (2,551,000 | ) | (980,689 | ) | |||||||||||||
| 30,195 | 09/01/24 | 1.972%(S) | 3 Month LIBOR(2)(Q) | — | (393,943 | ) | (393,943 | ) | ||||||||||||||
| 9,895 | 09/01/24 | 2.117%(S) | 3 Month LIBOR(1)(Q) | — | 34,841 | 34,841 | ||||||||||||||||
| 56,550 | 09/09/24 | 2.558%(S) | 3 Month LIBOR(1)(Q) | (904,581 | ) | (1,426,436 | ) | (521,855 | ) | |||||||||||||
| 4,300 | 02/23/25 | 2.232%(S) | 3 Month LIBOR(1)(Q) | 181 | (10,217 | ) | (10,398 | ) | ||||||||||||||
| 44,450 | 02/25/25 | 2.208%(S) | 3 Month LIBOR(1)(Q) | 453 | (29,119 | ) | (29,572 | ) | ||||||||||||||
| 9,975 | 04/28/26 | 1.809%(S) | 3 Month LIBOR(1)(Q) | 136 | 366,742 | 366,606 | ||||||||||||||||
| 52,572 | 02/15/27 | 1.824%(A) | 1 Day USOIS(1)(A) | 667,355 | 825,077 | 157,722 | ||||||||||||||||
| 53,535 | 02/15/27 | 1.899%(A) | 1 Day USOIS(1)(A) | 38,164 | 492,534 | 454,370 | ||||||||||||||||
| 12,575 | 02/15/27 | 1.965%(A) | 1 Day USOIS(1)(A) | — | 44,006 | 44,006 | ||||||||||||||||
See Notes to Financial Statements.
| Prudential Absolute Return Bond Fund | 67 |
Schedule of Investments (continued)
as of October 31, 2017
Interest rate swap agreements outstanding at October 31, 2017 (continued):
Notional | Termination Date | Fixed | Floating Rate | Value at Trade Date | Value at October 31, 2017 | Unrealized Appreciation (Depreciation) | ||||||||||||||||
Centrally cleared swap agreements (cont’d.): | ||||||||||||||||||||||
| 23,100 | 02/15/27 | 2.068%(A) | 1 Day USOIS(1)(A) | $ | (15,257 | ) | $ | (124,946 | ) | $ | (109,689 | ) | ||||||||||
| 11,080 | 05/08/27 | 2.309%(S) | 3 Month LIBOR(1)(Q) | — | (74,147 | ) | (74,147 | ) | ||||||||||||||
| 92,560 | 05/11/27 | 2.305%(S) | 3 Month LIBOR(2)(Q) | 14,731 | 578,934 | 564,203 | ||||||||||||||||
| 9,360 | 05/15/27 | 1.823%(A) | 1 Day USOIS(1)(A) | — | 171,796 | 171,796 | ||||||||||||||||
| 6,290 | 05/15/27 | 2.295%(S) | 3 Month LIBOR(1)(Q) | — | 25,647 | 25,647 | ||||||||||||||||
| 14,995 | 05/11/28 | 2.000%(S) | 3 Month LIBOR(1)(Q) | 270,490 | 421,321 | 150,831 | ||||||||||||||||
| 21,875 | 05/03/32 | 2.434%(S) | 3 Month LIBOR(2)(Q) | — | 72,704 | 72,704 | ||||||||||||||||
| 4,160 | 05/11/32 | 2.465%(S) | 3 Month LIBOR(1)(Q) | (99,865 | ) | (29,013 | ) | 70,852 | ||||||||||||||
| 46,295 | 02/15/36 | 2.338%(S) | 3 Month LIBOR(2)(Q) | (284,412 | ) | (1,355,619 | ) | (1,071,207 | ) | |||||||||||||
| 17,310 | 05/03/37 | 2.508%(S) | 3 Month LIBOR(1)(Q) | — | (37,398 | ) | (37,398 | ) | ||||||||||||||
| 27,915 | 05/11/37 | 2.537%(S) | 3 Month LIBOR(1)(Q) | (66,107 | ) | (185,877 | ) | (119,770 | ) | |||||||||||||
| 8,500 | 02/15/40 | 3.192%(S) | 3 Month LIBOR(1)(Q) | (567,613 | ) | (963,452 | ) | (395,839 | ) | |||||||||||||
| 14,000 | 02/15/41 | 2.647%(S) | 3 Month LIBOR(1)(Q) | 402 | (215,014 | ) | (215,416 | ) | ||||||||||||||
| 5,520 | 11/15/41 | 1.869%(S) | 3 Month LIBOR(1)(Q) | 33,885 | 701,757 | 667,872 | ||||||||||||||||
| 31,400 | 05/11/42 | 2.562%(S) | 3 Month LIBOR(2)(Q) | 204,061 | 171,845 | (32,216 | ) | |||||||||||||||
| 7,280 | 10/04/42 | 2.527%(S) | 3 Month LIBOR(2)(Q) | — | (70,805 | ) | (70,805 | ) | ||||||||||||||
| 1,300 | 12/12/42 | 2.590%(S) | 3 Month LIBOR(1)(Q) | 65,803 | (12,495 | ) | (78,298 | ) | ||||||||||||||
| 13,400 | 08/21/44 | 3.190%(S) | 3 Month LIBOR(1)(Q) | (926,224 | ) | (1,685,662 | ) | (759,438 | ) | |||||||||||||
| 4,000 | 07/02/45 | 2.937%(S) | 3 Month LIBOR(1)(Q) | 222 | (323,834 | ) | (324,056 | ) | ||||||||||||||
| 3,755 | 09/27/46 | 1.380%(A) | 1 Day USOIS(1)(A) | 218 | 675,618 | 675,400 | ||||||||||||||||
| 2,085 | 05/11/47 | 2.570%(S) | 3 Month LIBOR(2)(Q) | 10,852 | 10,670 | (182 | ) | |||||||||||||||
| 6,420 | 10/04/47 | 2.536%(S) | 3 Month LIBOR(1)(Q) | (1 | ) | 68,618 | 68,619 | |||||||||||||||
| 2,410 | 04/09/48 | 2.545%(S) | 3 Month LIBOR(1)(Q) | — | 34,370 | 34,370 | ||||||||||||||||
| 2,225 | 05/08/48 | 2.627%(S) | 3 Month LIBOR(1)(Q) | — | (6,187 | ) | (6,187 | ) | ||||||||||||||
| ZAR | 134,055 | 09/23/22 | 7.430%(Q) | 3 Month JIBAR(2)(Q) | (12,136 | ) | (156,112 | ) | (143,976 | ) | ||||||||||||
|
|
|
|
|
| |||||||||||||||||
| $ | (10,602,411 | ) | $ | (13,784,652 | ) | $ | (3,182,241 | ) | ||||||||||||||
|
|
|
|
|
| |||||||||||||||||
Cash of $1,877,000 and securities with a combined market value of $44,882,281 have been segregated with Citigroup Global Markets to cover requirements for open centrally cleared swap contracts at October 31, 2017.
| (1) | The Fund pays the fixed rate and receives the floating rate. |
| (2) | The Fund pays the floating rate and receives the fixed rate. |
| (3) | The Fund pays the floating rate of 3 Month LIBOR plus 12 bps and receives the floating rate of 6 Month LIBOR. |
| (4) | The Fund pays the floating rate of 6 Month LIBOR and receives the floating rate of 3 Month LIBOR plus 11.75 bps. |
| (5) | The Fund pays the floating rate of 3 Month LIBOR and receives the floating rate of 1 Day USOIS plus 28 bps. |
See Notes to Financial Statements.
| 68 |
Total return swap agreements outstanding at October 31, 2017:
Counterparty | Termination Date | Long (Short) Notional Amount (000)# | Description | Fair Value | Upfront Premiums Paid (Received) | Unrealized Appreciation (Depreciation)(1) | ||||||||||||||||
OTC Total Return Swap Agreements : | ||||||||||||||||||||||
| Credit Suisse First Boston Corp. | 01/12/41 | 9,267 | Pay monthly variable payments based on 1 Month LIBOR and receive monthly fixed payments based on the IOS.FN30.450.10 Index | $ | 6,158 | $ | (28,299 | ) | $ | 34,457 | ||||||||||||
| Goldman Sachs & Co. | 12/20/17 | 7,290 | Pay termination date variable payments based on 3 Month LIBOR and receive termination date fixed payments based on the iBoxx USD Liquid High Yield Index | 142,457 | (20,058 | ) | 162,515 | |||||||||||||||
|
|
|
|
|
| |||||||||||||||||
| $ | 148,615 | $ | (48,357 | ) | $ | 196,972 | ||||||||||||||||
|
|
|
|
|
| |||||||||||||||||
| (1) | Upfront/recurring fees or commissions, as applicable, are included in the net unrealized appreciation (depreciation). |
Fair Value Measurements:
Various inputs are used in determining the value of the Fund’s investments. These inputs are summarized in the three broad levels listed below.
Level 1—unadjusted quoted prices generally in active markets for identical securities.
Level 2—quoted prices for similar securities, interest rates and yield curves, prepayment speeds, foreign currency exchange rates and other observable inputs.
Level 3—unobservable inputs for securities valued in accordance with Board approved fair valuation procedures.
The following is a summary of the inputs used as of October 31, 2017 in valuing such portfolio securities:
| Level 1 | Level 2 | Level 3 | ||||||||||
Investments in Securities | ||||||||||||
Asset-Backed Securities | ||||||||||||
Automobiles | $ | — | $ | 4,092,267 | $ | — | ||||||
Collateralized Loan Obligations | — | 338,284,654 | 12,800,000 | |||||||||
See Notes to Financial Statements.
| Prudential Absolute Return Bond Fund | 69 |
Schedule of Investments (continued)
as of October 31, 2017
| Level 1 | Level 2 | Level 3 | ||||||||||
Investments in Securities (continued) | ||||||||||||
Asset-Backed Securities (continued) | ||||||||||||
Consumer Loans | $ | — | $ | 50,373,521 | $ | — | ||||||
Home Equity Loans | — | 77,225,554 | — | |||||||||
Residential Mortgage-Backed Securities | — | 64,496,019 | 2,900,000 | |||||||||
Bank Loans | — | 28,727,506 | — | |||||||||
Commercial Mortgage-Backed Securities | — | 121,124,023 | 1,312,964 | |||||||||
Corporate Bonds | — | 619,338,157 | 743,919 | |||||||||
Municipal Bonds | — | 14,367,524 | — | |||||||||
Residential Mortgage-Backed Securities | — | 87,970,306 | 9,337,675 | |||||||||
Sovereign Bonds | — | 149,669,821 | — | |||||||||
U.S. Treasury Obligations | — | 83,158,302 | — | |||||||||
Common Stock | 1,979,768 | — | — | |||||||||
Affiliated Mutual Funds | 211,496,547 | — | — | |||||||||
Foreign Treasury Obligations | — | 34,182,573 | — | |||||||||
Options Purchased | 845,219 | 2,886,310 | — | |||||||||
Options Written | (397,750 | ) | (2,084,323 | ) | — | |||||||
Other Financial Instruments* | ||||||||||||
Futures Contracts | 3,299,690 | — | — | |||||||||
OTC Forward Foreign Currency Exchange Contracts | — | (176,160 | ) | — | ||||||||
OTC Cross Currency Exchange Contracts | — | (121,846 | ) | — | ||||||||
OTC Credit Default Swap Agreements | — | (834,653 | ) | 32,417 | ||||||||
Centrally Cleared Credit Default Swap Agreements | — | (62,206 | ) | — | ||||||||
Centrally Cleared Inflation Swaps Agreements | — | 249,178 | — | |||||||||
Centrally Cleared Interest Rate Swap Agreements | — | (3,182,241 | ) | — | ||||||||
OTC Total Return Swap Agreements | — | 148,615 | — | |||||||||
|
|
|
|
|
| |||||||
Total | $ | 217,223,474 | $ | 1,669,832,901 | $ | 27,126,975 | ||||||
|
|
|
|
|
| |||||||
The following is a reconciliation of assets in which unobservable inputs (Level 3) were used in determining fair value:
| Asset-Backed Securities— Collateralized Loan Obligations | Asset-Backed Securities— Residential Mortgage- Backed Securities | Bank Loans | Commercial Mortgage- Backed Securities | Corporate Bonds | Residential Mortgage- Backed Securities | Forward Rate Agreements | Credit Default Swap Agreements | |||||||||||||||||||||||||
Balance as of 10/31/16 | $ | — | $ | — | $ | 1,462,445 | $ | — | $ | — | $ | 15,706,240 | $ | (5,076 | ) | $ | 17,900 | |||||||||||||||
Realized gain (loss) | — | — | 23,610 | — | — | 112,649 | — | ** | — | |||||||||||||||||||||||
Change in unrealized appreciation (depreciation)*** | — | — | (16,371 | ) | — | (2,285 | ) | 156,109 | 5,076 | 14,517 | ||||||||||||||||||||||
Purchases/Exchanges/Issuances | 12,800,000 | 2,900,000 | — | 1,312,964 | — | 9,361,034 | — | — | ||||||||||||||||||||||||
See Notes to Financial Statements.
| 70 |
The following is a reconciliation of assets in which unobservable inputs (Level 3) were used in determining fair value (continued):
| Asset-Backed Securities— Collateralized Loan Obligations | Asset-Backed Securities— Residential Mortgage- Backed Securities | Bank Loans | Commercial Mortgage- Backed Securities | Corporate Bonds | Residential Mortgage- Backed Securities | Forward Rate Agreements | Credit Default Swap Agreements | |||||||||||||||||||||||||
Sales/Paydowns | $ | — | $ | — | $ | (1,469,684 | ) | $ | — | $ | (18,072 | ) | $ | (16,013,404 | ) | $ | — | $ | — | |||||||||||||
Accrued discounts/premiums | — | — | — | — | — | 15,047 | — | — | ||||||||||||||||||||||||
Transfer into Level 3 | — | — | — | — | 764,276 | — | — | — | ||||||||||||||||||||||||
Transfer out of Level 3 | — | — | — | — | — | — | — | — | ||||||||||||||||||||||||
|
|
|
|
|
|
|
|
|
|
|
|
|
|
|
| |||||||||||||||||
Balance as of 10/31/17 | $ | 12,800,000 | $ | 2,900,000 | $ | — | $ | 1,312,964 | $ | 743,919 | $ | 9,337,675 | $ | — | $ | 32,417 | ||||||||||||||||
|
|
|
|
|
|
|
|
|
|
|
|
|
|
|
| |||||||||||||||||
| * | Other financial instruments are derivative instruments not reflected in the Schedule of Investments, such as futures, forwards and centrally cleared swaps contracts, which are recorded at the unrealized appreciation (depreciation) of the instrument, and OTC swap contracts which are recorded at fair value. |
| ** | The realized gain incurred during the period for other financial instruments was $80,721. |
| *** | Of which, $34,160 was relating to securities held at the reporting period end. |
Level 3 securities as presented in the table above are being fair valued using pricing methodologies approved by Board, which contain unobservable inputs as follows:
Level 3 Securities | Fair Value as of October 31, 2017 | Valuation Methodology | Unobservable Inputs | |||||||||
Asset-Backed Securities—Collateralized Loan Obligations | $ | 12,800,000 | Market Approach | Single Broker Indicative Quote | ||||||||
Asset-Backed Securities—Residential Mortgage-Backed Securities | 2,900,000 | Market Approach | Single Broker Indicative Quote | |||||||||
Commercial Mortgage-Backed Securities | 1,312,964 | Market Approach | Single Broker Indicative Quote | |||||||||
Corporate Bonds | 743,919 | Market Approach | Single Broker Indicative Quote | |||||||||
Residential Mortgage-Backed Securities | 9,337,675 | Market Approach | Single Broker Indicative Quote | |||||||||
Credit Default Swaps | 32,417 | Market Approach | Single Broker Indicative Quote | |||||||||
|
| |||||||||||
| $ | 27,126,975 | |||||||||||
|
| |||||||||||
It is the Fund’s policy to recognize transfers in and transfers out at the fair value as of the beginning of period.
See Notes to Financial Statements.
| Prudential Absolute Return Bond Fund | 71 |
Schedule of Investments (continued)
as of October 31, 2017
Securities transferred levels as follows:
Investments in Securities | Amount Transferred | Level Transfer | Logic | |||||||||
Corporate Bonds | $ | 764,276 | L2 to L3 | | Evaluated Bid to Single Broker Indicative Quote | | ||||||
Industry Classification:
The industry classification of investments and liabilities in excess of other assets shown as a percentage of net assets as of October 31, 2017 were as follows (unaudited):
Collateralized Loan Obligations | 19.1 | % | ||
Affiliated Mutual Funds (including 3.7% of collateral for securities on loan) | 11.5 | |||
Residential Mortgage-Backed Securities | 9.0 | |||
Sovereign Bonds | 8.1 | |||
Commercial Mortgage-Backed Securities | 6.6 | |||
Banks | 5.9 | |||
U.S. Treasury Obligations | 4.5 | |||
Home Equity Loans | 4.2 | |||
Consumer Loans | 2.7 | |||
Media | 2.4 | |||
Healthcare-Services | 2.2 | |||
Home Builders | 2.1 | |||
Oil & Gas | 2.1 | |||
Foreign Treasury Obligations | 1.8 | |||
Entertainment | 1.5 | |||
Electric | 1.5 | |||
Telecommunications | 1.3 | |||
Retail | 1.2 | |||
Real Estate Investment Trusts (REITs) | 1.2 | |||
Insurance | 1.1 | |||
Building Materials | 1.1 | |||
Chemicals | 1.1 | |||
Pipelines | 0.9 | |||
Commercial Services | 0.8 | |||
Municipal Bonds | 0.8 | |||
Pharmaceuticals | 0.7 | |||
Lodging | 0.6 | |||
Forest Products & Paper | 0.6 | |||
Airlines | 0.6 | |||
Semiconductors | 0.5 | |||
Software | 0.5 | |||
Foods | 0.5 | |||
Diversified Financial Services | 0.5 | |||
Auto Parts & Equipment | 0.4 | |||
Transportation | 0.3 | % | ||
Electronics | 0.3 | |||
Miscellaneous Manufacturing | 0.3 | |||
Mining | 0.3 | |||
Technology | 0.3 | |||
Health Care & Pharmaceutical | 0.3 | |||
Packaging & Containers | 0.3 | |||
Automobiles | 0.2 | |||
Consumer | 0.2 | |||
Options Purchased | 0.2 | |||
Textiles | 0.2 | |||
Beverages | 0.2 | |||
Internet | 0.2 | |||
Auto Manufacturers | 0.2 | |||
Water | 0.2 | |||
Biotechnology | 0.1 | |||
Gas | 0.1 | |||
Leisure Time | 0.1 | |||
Housewares | 0.1 | |||
Oil, Gas & Consumable Fuels | 0.1 | |||
Gaming | 0.1 | |||
Capital Goods | 0.1 | |||
Computers | 0.0 | * | ||
Iron/Steel | 0.0 | * | ||
Trucking & Leasing | 0.0 | * | ||
Savings & Loans | 0.0 | * | ||
Oil & Gas Services | 0.0 | * | ||
Machinery-Diversified | 0.0 | * | ||
|
| |||
| 104.0 | ||||
Options Written | (0.1 | ) | ||
Liabilities in excess of other assets | (3.9 | ) | ||
|
| |||
| 100.0 | % | |||
|
|
| * | Less than +/- 0.05% |
See Notes to Financial Statements.
| 72 |
Effects of Derivative Instruments on the Financial Statements and Primary Underlying Risk Exposure:
The Fund invested in derivative instruments during the reporting period. The primary types of risk associated with these derivative instruments are credit contracts risk, foreign exchange contracts risk and interest rate contracts risk. The effect of such derivative instruments on the Fund’s financial position and financial performance as reflected in the Statement of Assets and Liabilities and Statement of Operations is presented in the summary below.
Fair values of derivative instruments as of October 31, 2017 as presented in the Statement of Assets and Liabilities:
Derivatives not accounted | Asset Derivatives | Liability Derivatives | ||||||||||
Balance Sheet | Fair Value | Balance Sheet | Fair Value | |||||||||
| Credit contracts | Due from/to broker—variation margin swaps | $ | 252,495 | * | Due from/to broker—variation margin swaps | $ | 314,701 | * | ||||
| Credit contracts | Premiums paid for OTC swap agreements | 667,868 | Premiums received for OTC swap agreements | 4,552,525 | ||||||||
| Credit contracts | — | — | Options written outstanding, at value | 219,955 | ||||||||
| Credit contracts | Unrealized appreciation on OTC swap agreements | 3,983,743 | Unrealized depreciation on OTC swap agreements | 901,322 | ||||||||
| Foreign exchange contracts | Unaffiliated investments | 788,003 | Options written outstanding, at value | 275,272 | ||||||||
| Foreign exchange contracts | Unrealized appreciation on OTC cross currency exchange contracts | 23,710 | Unrealized depreciation on OTC cross currency exchange contracts | 145,556 | ||||||||
| Foreign exchange contracts | Unrealized appreciation on OTC forward foreign currency exchange contracts | 2,721,392 | Unrealized depreciation on OTC forward foreign currency exchange contracts | 2,897,552 | ||||||||
| Interest rate contracts | Due from/to broker—variation margin futures | 10,150,379 | * | Due from/to broker—variation margin futures | 6,850,689 | * | ||||||
| Interest rate contracts | Due from/to broker—variation margin swaps | 17,957,651 | * | Due from/to broker—variation margin swaps | 20,890,714 | * | ||||||
| Interest rate contracts | — | — | Premiums received for OTC swap agreements | 48,357 | ||||||||
| Interest rate contracts | Unaffiliated investments | 2,943,526 | Options written outstanding, at value | 1,986,846 | ||||||||
| Interest rate contracts | Unrealized appreciation on OTC swap agreements | 196,972 | — | — | ||||||||
|
|
|
| |||||||||
Total | $ | 39,685,739 | $ | 39,083,489 | ||||||||
|
|
|
| |||||||||
| * | Includes cumulative appreciation (depreciation) as reported in the schedule of open futures and centrally cleared swap contracts. Only unsettled variation margin receivable (payable) is reported within the Statement of Assets and Liabilities. |
See Notes to Financial Statements.
| Prudential Absolute Return Bond Fund | 73 |
Schedule of Investments (continued)
as of October 31, 2017
The effects of derivative instruments on the Statement of Operations for the year ended October 31, 2017 are as follows:
Amount of Realized Gain (Loss) on Derivatives Recognized in Income | ||||||||||||||||||||||||||||
Derivatives not accounted | Options Purchased(1) | Options Written | Futures | Forward & Cross Currency Contracts | Forward Rate Agreements | Swaps | Total | |||||||||||||||||||||
Credit contracts | $ | (142,063 | ) | $ | 986,850 | $ | — | $ | — | $ | — | $ | 3,242,970 | $ | 4,087,757 | |||||||||||||
Equity contracts | — | — | — | — | — | — | — | |||||||||||||||||||||
Foreign exchange contracts | — | — | — | (2,696,963 | ) | — | — | (2,696,963 | ) | |||||||||||||||||||
Interest rate contracts | (5,539,661 | ) | 4,521,147 | (19,281,235 | ) | — | (2,081,409 | ) | (4,912,347 | ) | (27,293,505 | ) | ||||||||||||||||
|
|
|
|
|
|
|
|
|
|
|
|
|
| |||||||||||||||
Total | $ | (5,681,724 | ) | $ | 5,507,997 | $ | (19,281,235 | ) | $ | (2,696,963 | ) | $ | (2,081,409 | ) | $ | (1,669,377 | ) | $ | (25,902,711 | ) | ||||||||
|
|
|
|
|
|
|
|
|
|
|
|
|
| |||||||||||||||
| (1) | Included in net realized gain (loss) on investment transactions in the Statement of Operations. |
Change in Unrealized Appreciation (Depreciation) on Derivatives Recognized in Income | ||||||||||||||||||||||||||||
Derivatives not | Options Purchased(2) | Options Written | Futures | Forward & Cross Currency Contracts | Forward Rate Agreements | Swaps | Total | |||||||||||||||||||||
Credit contracts | $ | — | $ | 711,848 | $ | — | $ | — | $ | — | $ | 2,581,284 | $ | 3,293,132 | ||||||||||||||
Equity contracts | — | — | — | — | — | — | — | |||||||||||||||||||||
Foreign exchange contracts | (56,295 | ) | 252,035 | — | 55,123 | — | — | 250,863 | ||||||||||||||||||||
Interest rate contracts | (1,016,974 | ) | 819,953 | 12,373,675 | — | 5,076 | 33,473,976 | 45,655,706 | ||||||||||||||||||||
|
|
|
|
|
|
|
|
|
|
|
|
|
| |||||||||||||||
Total | $ | (1,073,269 | ) | $ | 1,783,836 | $ | 12,373,675 | $ | 55,123 | $ | 5,076 | $ | 36,055,260 | $ | 49,199,701 | |||||||||||||
|
|
|
|
|
|
|
|
|
|
|
|
|
| |||||||||||||||
| (2) | Included in net change in unrealized appreciation (depreciation) on investments in the Statement of Operations. |
For the year ended October 31, 2017, the average volume of derivative activities are as follows:
| Options Purchased(1) | Options Written(4) | Futures Contracts— Long Positions(2) | Futures Contracts— Short Positions(2) | Forward Foreign Currency Exchange Contracts— Purchased(3) | Forward Foreign Currency Exchange Contracts— Sold(3) | Cross Currency Exchange Contracts(2) | ||||||||||||||||||||
| $ | 3,501,501 | $ | 585,273,225 | $ | 899,715,648 | $ | 619,449,163 | $ | 123,119,225 | $ | 197,943,830 | $ | 18,024,831 | |||||||||||||
See Notes to Financial Statements.
| 74 |
Credit | Credit Default Swap Agreements— Sell Protection(4) | Currency Swap Agreements(4) | Forward Rate Agreements(4) | Inflation Rate Swap Agreements(4) | Interest Rate Swap Agreements(4) | Total Return Swap Agreements(4) | ||||||||||||||||||||
| $ | 41,588,000 | $ | 240,192,000 | $ | 26,738,400 | $ | 2,127,480,000 | $ | 35,198,619 | $ | 5,809,395,611 | $ | 19,609,400 | |||||||||||||
| (1) | Cost. |
| (2) | Value at Trade Date. |
| (3) | Value at Settlement Date. |
| (4) | Notional Amount in USD. |
Financial Instruments/Transactions—Summary of Offsetting and Netting Arrangements:
The Fund invested in OTC derivatives and entered into financial instruments/transactions during the reporting period that are either offset in accordance with current requirements or are subject to enforceable master netting arrangements or similar agreements that permit offsetting. The information about offsetting and related netting arrangements for OTC derivatives and financial instruments/transactions, where the legal right to set-off exists, is presented in the summary below.
Offsetting of financial instruments/transactions assets and liabilities:
Description | Gross Market Value of Recognized Assets/(Liabilities) | Collateral Pledged/(Received)(2) | Net Amount | |||||||||
Securities on Loan | $ | 66,763,349 | $ | (66,763,349 | ) | $ | — | |||||
|
| |||||||||||
Offsetting of OTC derivative assets and liabilities:
Counterparty | Gross Amounts of Recognized Assets(1) | Gross Amounts of Recognized Liabilities(1) | Net Amounts of Recognized Assets/(Liabilities) | Collateral Pledged/(Received)(2) | Net Amount | |||||||||||||||
Bank of America | $ | 54,249 | $ | (9,978 | ) | $ | 44,271 | $ | — | $ | 44,271 | |||||||||
Barclays Capital Group | 1,104,289 | (1,339,562 | ) | (235,273 | ) | — | (235,273 | ) | ||||||||||||
BNP Paribas | 820,288 | (1,395,098 | ) | (574,810 | ) | 574,810 | — | |||||||||||||
Citigroup Global Markets | 1,944,943 | (1,853,592 | ) | 91,351 | — | 91,351 | ||||||||||||||
Credit Suisse First Boston Corp. | 851,071 | (973,320 | ) | (122,249 | ) | — | (122,249 | ) | ||||||||||||
Deutsche Bank AG | 550,842 | (476,258 | ) | 74,584 | (74,584 | ) | — | |||||||||||||
Goldman Sachs & Co. | 573,765 | (732,718 | ) | (158,953 | ) | 158,953 | — | |||||||||||||
See Notes to Financial Statements.
| Prudential Absolute Return Bond Fund | 75 |
Schedule of Investments (continued)
as of October 31, 2017
Offsetting of OTC derivative assets and liabilities (cont’d.):
Counterparty | Gross Amounts of Recognized Assets(1) | Gross Amounts of Recognized Liabilities(1) | Net Amounts of Recognized Assets/(Liabilities) | Collateral Pledged/(Received)(2) | Net Amount | |||||||||||||||
Hong Kong & Shanghai Bank | $ | 43,178 | $ | (416,010 | ) | $ | (372,832 | ) | $ | 278,832 | $ | (94,000 | ) | |||||||
JPMorgan Chase | 3,227,996 | (2,428,481 | ) | 799,515 | (799,515 | ) | — | |||||||||||||
Morgan Stanley | 329,797 | (309,451 | ) | 20,346 | (10,000 | ) | 10,346 | |||||||||||||
UBS AG | 979,577 | (695,167 | ) | 284,410 | (284,410 | ) | — | |||||||||||||
|
|
|
|
|
|
|
|
|
| |||||||||||
| $ | 10,479,995 | $ | (10,629,635 | ) | $ | (149,640 | ) | $ | (155,914 | ) | $ | (305,554 | ) | |||||||
|
|
|
|
|
|
|
|
|
| |||||||||||
| (1) | Includes unrealized appreciation/(depreciation) on swaps and forwards, premiums paid/(received) on swap agreements and market value of purchased and written options, as represented on the Statement of Assets and Liabilities. |
| (2) | Collateral amount disclosed by the Fund is limited to the market value of financial instruments/transactions and the Fund’s OTC derivative exposure by counterparty. |
See Notes to Financial Statements.
| 76 |
This Page Intentionally Left Blank
Statement of Assets & Liabilities
as of October 31, 2017
Assets | ||||
Investments at value, including securities on loan of $66,763,349: | ||||
Unaffiliated investments (cost $1,673,208,365) | $ | 1,705,816,082 | ||
Affiliated investments (cost $211,491,931) | 211,496,547 | |||
Cash | 24,273 | |||
Foreign currency, at value (cost $2,173,784) | 2,183,608 | |||
Deposit with broker for centrally cleared swaps | 1,877,000 | |||
Receivable for investments sold | 16,224,589 | |||
Dividends receivable | 13,588,760 | |||
Receivable for Fund shares sold | 4,785,970 | |||
Unrealized appreciation on OTC swap agreements | 4,180,715 | |||
Unrealized appreciation on OTC forward foreign currency exchange contracts | 2,721,392 | |||
Due from broker—variation margin swaps | 753,764 | |||
Premiums paid for OTC swap agreements | 667,868 | |||
Unrealized appreciation on OTC cross currency exchange contracts | 23,710 | |||
Tax reclaim receivable | 2,743 | |||
Prepaid expenses | 14,629 | |||
|
| |||
Total Assets | 1,964,361,650 | |||
|
| |||
Liabilities | ||||
Payable to broker for collateral for securities on loan | 68,394,799 | |||
Payable for investments purchased | 35,676,341 | |||
Premiums received for OTC swap agreements | 4,600,882 | |||
Payable for Fund shares reacquired | 3,692,017 | |||
Unrealized depreciation on OTC forward foreign currency exchange contracts | 2,897,552 | |||
Options written outstanding, at value (premiums received $4,265,909) | 2,482,073 | |||
Management fee payable | 1,260,062 | |||
Dividends payable | 1,223,315 | |||
Unrealized depreciation on OTC swap agreements | 901,322 | |||
Accrued expenses and other liabilities | 416,268 | |||
Unrealized depreciation on OTC cross currency exchange contracts | 145,556 | |||
Distribution fee payable | 110,134 | |||
Due to broker—variation margin futures | 107,997 | |||
Affiliated transfer agent fee payable | 41,759 | |||
|
| |||
Total Liabilities | 121,950,077 | |||
|
| |||
Net Assets | $ | 1,842,411,573 | ||
|
| |||
Net assets were comprised of: | ||||
Shares of beneficial interest, at par | $ | 184,932 | ||
Paid-in capital in excess of par | 1,866,587,152 | |||
|
| |||
| 1,866,772,084 | ||||
Undistributed net investment income | 5,723,264 | |||
Accumulated net realized loss on investment and foreign currency transactions | (67,516,035 | ) | ||
Net unrealized appreciation on investments and foreign currencies | 37,432,260 | |||
|
| |||
Net assets, October 31, 2017 | $ | 1,842,411,573 | ||
|
| |||
See Notes to Financial Statements.
| 78 |
Class A | ||||
Net asset value and redemption price per share | $ | 9.93 | ||
Maximum sales charge (4.50% of offering price) | 0.47 | |||
|
| |||
Maximum offering price to public | $ | 10.40 | ||
|
| |||
Class C | ||||
Net asset value, offering price and redemption price per share | $ | 9.96 | ||
|
| |||
Class Q | ||||
Net asset value, offering price and redemption price per share ($346,252,627 ÷ 34,835,903 shares of beneficial interest issued and outstanding) | $ | 9.94 | ||
|
| |||
Class Z | ||||
Net asset value, offering price and redemption price per share | $ | 9.97 | ||
|
| |||
See Notes to Financial Statements.
| Prudential Absolute Return Bond Fund | 79 |
Statement of Operations
Year Ended October 31, 2017
Net Investment Income (Loss) | ||||
Income | ||||
Interest income | $ | 55,540,932 | ||
Affiliated dividend income | 1,580,868 | |||
Income from securities lending, net (including affiliated income of $52,235) | 347,335 | |||
|
| |||
Total income | 57,469,135 | |||
|
| |||
Expenses | ||||
Management fee | 13,148,806 | |||
Distribution fee(a) | 1,424,950 | |||
Transfer agent’s fees and expenses (including affiliated expense of $449,600)(a) | 1,986,000 | |||
Custodian and accounting fees | 220,000 | |||
Registration fees(a) | 105,000 | |||
Audit fee | 65,000 | |||
Shareholders’ reports | 54,000 | |||
Legal fees and expenses | 28,000 | |||
Trustees’ fees | 21,000 | |||
Miscellaneous | 35,429 | |||
|
| |||
Total expenses | 17,088,185 | |||
Less: Management fee waiver and/or expense reimbursement(a) | (883,093 | ) | ||
|
| |||
Net expenses | 16,205,092 | |||
|
| |||
Net investment income (loss) | 41,264,043 | |||
|
| |||
Realized And Unrealized Gain (Loss) On Investments And Foreign Currency Transactions | ||||
Net realized gain (loss) on: | ||||
Investment transactions (including affiliated of $1,742) | (10,872,853 | ) | ||
Futures transactions | (19,281,235 | ) | ||
Options written transactions | 5,507,997 | |||
Swap agreement transactions | (1,669,377 | ) | ||
Forward and cross currency contract transactions | (2,696,963 | ) | ||
Foreign currency transactions | 3,121,431 | |||
Forward rate agreements | (2,081,409 | ) | ||
|
| |||
| (27,972,409 | ) | |||
|
| |||
Net change in unrealized appreciation (depreciation) on: | ||||
Investments (including affiliated of ($6,802)) | 34,130,612 | |||
Futures | 12,373,675 | |||
Options written | 1,783,836 | |||
Swap agreements | 36,055,260 | |||
Forward and cross currency contracts | 55,123 | |||
Foreign currencies | (218,837 | ) | ||
Forward rate agreements | 5,076 | |||
|
| |||
| 84,184,745 | ||||
|
| |||
Net gain (loss) on investment and foreign currency transactions | 56,212,336 | |||
|
| |||
Net Increase (Decrease) In Net Assets Resulting From Operations | $ | 97,476,379 | ||
|
| |||
See Notes to Financial Statements.
| 80 |
| (a) | Class specific expenses and waivers were as follows: |
| Class A | Class C | Class Q | Class Z | |||||||||||||
Distribution fee | 363,225 | 1,061,725 | — | — | ||||||||||||
Transfer Agency fees and expenses | 197,500 | 142,300 | 160,000 | 1,486,200 | ||||||||||||
Including affiliated expenses | 44,600 | 31,700 | 70,100 | 303,200 | ||||||||||||
Registration fees | 10,100 | 7,900 | 24,500 | 62,500 | ||||||||||||
Management fee waiver and/or expense reimbursement | (106,251 | ) | (73,576 | ) | — | (703,266 | ) | |||||||||
See Notes to Financial Statements.
| Prudential Absolute Return Bond Fund | 81 |
Statement of Changes in Net Assets
| Year Ended October 31, | ||||||||
| 2017 | 2016 | |||||||
Increase (Decrease) in Net Assets | ||||||||
Operations | ||||||||
Net investment income (loss) | $ | 41,264,043 | $ | 54,432,562 | ||||
Net realized gain (loss) on investment and foreign currency transactions | (27,972,409 | ) | (7,385,746 | ) | ||||
Net change in unrealized appreciation (depreciation) on investments and foreign currencies | 84,184,745 | 5,935,891 | ||||||
|
|
|
| |||||
Net increase (decrease) in net assets resulting from operations | 97,476,379 | 52,982,707 | ||||||
|
|
|
| |||||
Dividends and Distributions | ||||||||
Dividends from net investment income | ||||||||
Class A | (3,294,330 | ) | (3,937,295 | ) | ||||
Class C | (1,651,332 | ) | (1,419,933 | ) | ||||
Class Q | (7,126,086 | ) | (2,935,476 | ) | ||||
Class Z | (28,720,055 | ) | (24,849,029 | ) | ||||
|
|
|
| |||||
| (40,791,803 | ) | (33,141,733 | ) | |||||
|
|
|
| |||||
Tax return of capital distributions | ||||||||
Class A | — | (1,373,095 | ) | |||||
Class C | — | (495,189 | ) | |||||
Class Q | — | (1,023,721 | ) | |||||
Class Z | — | (8,665,867 | ) | |||||
|
|
|
| |||||
| — | (11,557,872 | ) | ||||||
|
|
|
| |||||
Fund share transactions (Net of share conversions) | ||||||||
Net proceeds from shares sold | 772,806,468 | 378,115,109 | ||||||
Net asset value of shares issued in reinvestment of dividends and distributions | 29,178,897 | 32,218,965 | ||||||
Cost of shares reacquired | (527,204,224 | ) | (1,291,525,424 | ) | ||||
|
|
|
| |||||
Net increase (decrease) in net assets from Fund share transactions | 274,781,141 | (881,191,350 | ) | |||||
|
|
|
| |||||
Total increase (decrease) | 331,465,717 | (872,908,248 | ) | |||||
Net Assets: | ||||||||
Beginning of year | 1,510,945,856 | 2,383,854,104 | ||||||
|
|
|
| |||||
End of year(a) | $ | 1,842,411,573 | $ | 1,510,945,856 | ||||
|
|
|
| |||||
(a) Includes undistributed net investment income of: | $ | 5,723,264 | $ | — | ||||
|
|
|
| |||||
See Notes to Financial Statements.
| 82 |
Notes to Financial Statements
Prudential Investment Portfolios 9 (the “Trust”) is registered under the Investment Company Act of 1940, as amended (“1940 Act”), as an open-end management investment company. The Trust was established as a Delaware business trust on September 18, 1998. The Trust currently consists of five funds: Prudential Absolute Return Bond Fund and Prudential QMA Large-Cap Core Equity Fund which are diversified funds and Prudential International Bond Fund, Prudential Select Real Estate Fund and Prudential Real Estate Income Fund which are non-diversified funds. These financial statements relate to Prudential Absolute Return Bond Fund (the “Fund”).
The investment objective of the Fund is to seek positive returns over the long term, regardless of market conditions.
1. Accounting Policies
The Fund follows investment company accounting and reporting guidance of the Financial Accounting Standards Board (“FASB”) Accounting Standard Codification Topic 946 Financial Services—Investment Companies. The following accounting policies conform to U.S. generally accepted accounting principles. The Fund consistently follows such policies in the preparation of its financial statements.
Securities Valuation: The Fund holds securities and other assets and liabilities that are fair valued at the close of each day (generally, 4:00 PM Eastern time) the New York Stock Exchange (“NYSE”) is open for trading. Fair value is the price that would be received to sell an asset or paid to transfer a liability in an orderly transaction between market participants on the measurement date. The Board of Trustees (the “Board”) has adopted valuation procedures for security valuation under which fair valuation responsibilities have been delegated to PGIM Investments LLC (“PGIM Investments” or “the Manager”) (formerly known as Prudential Investments LLC). Under the current valuation procedures, the Valuation Committee is responsible for supervising the valuation of portfolio securities and other assets and liabilities. The valuation procedures permit the Fund to utilize independent pricing vendor services, quotations from market makers, and alternative valuation methods when market quotations are either not readily available or not deemed representative of fair value. A record of the Valuation Committee’s actions is subject to the Board’s review, approval, and ratification at its next regularly scheduled quarterly meeting.
Various inputs determine how the Fund’s investments are valued, all of which are categorized according to the three broad levels (Level 1, 2, or 3) detailed in the Schedule of Investments.
| Prudential Absolute Return Bond Fund | 83 |
Notes to Financial Statements (continued)
Common stocks and derivative instruments, such as futures or options, that are traded on a national securities exchange are valued at the last sale price as of the close of trading on the applicable exchange where the security principally trades. Securities traded via NASDAQ are valued at the NASDAQ official closing price. To the extent these securities are valued at the last sale price or NASDAQ official closing price, they are classified as Level 1 in the fair value hierarchy. In the event that no sale or official closing price on valuation date exists, these securities are generally valued at the mean between the last reported bid and ask prices, or at the last bid price in the absence of an ask price. These securities are classified as level 2 in the fair value hierarchy.
Investments in open-end, non-exchange-traded mutual funds are valued at their net asset values as of the close of the NYSE on the date of valuation. These securities are classified as Level 1 in the fair value hierarchy since they may be purchased or sold at their net asset values on the date of valuation.
Fixed income securities traded in the OTC market are generally classified as Level 2 in the fair value hierarchy. Such fixed income securities are typically valued using the market approach which generally involves obtaining data from an approved independent third-party vendor source. The Fund utilizes the market approach as the primary method to value securities when market prices of identical or comparable instruments are available. The third-party vendors’ valuation techniques used to derive the evaluated bid price are based on evaluating observable inputs, including but not limited to, yield curves, yield spreads, credit ratings, deal terms, tranche level attributes, default rates, cash flows, prepayment speeds, broker/dealer quotations and reported trades. Certain Level 3 securities are also valued using the market approach when obtaining a single broker quote or when utilizing recent transaction prices for identical or comparable securities. During the reporting period, there were no changes to report with respect to the valuation approach and/or valuation techniques discussed above.
Bank loans are generally valued at prices provided by approved independent pricing vendors. The pricing vendors utilize broker/dealer quotations and provide prices based on the average of such quotations. Bank loans valued using such vendor prices are generally classified as Level 2 in the fair value hierarchy. Bank loans valued based on a single broker quote or at the original transaction price are classified as Level 3 in the fair value hierarchy.
OTC derivative instruments are generally classified as Level 2 in the fair value hierarchy. Such derivative instruments are typically valued using the market approach and/or income approach which generally involves obtaining data from an approved independent third-party vendor source. The Fund utilizes the market approach when quoted prices in broker-dealer markets are available but also includes consideration of alternative valuation
| 84 |
approaches, including the income approach. In the absence of reliable market quotations, the income approach is typically utilized for purposes of valuing OTC derivatives such as interest rate swaps based on a discounted cash flow analysis whereby the value of the instrument is equal to the present value of its future cash inflows or outflows. Such analysis includes projecting future cash flows and determining the discount rate (including the present value factors that affect the discount rate) used to discount the future cash flows. In addition, the third-party vendors’ valuation techniques used to derive the evaluated OTC derivative price is based on evaluating observable inputs, including but not limited to, underlying asset prices, indices, spreads, interest rates and exchange rates. Certain OTC derivatives may be classified as Level 3 when valued using the market approach by obtaining a single broker quote or when utilizing unobservable inputs in the income approach. During the reporting period, there were no changes to report with respect to the valuation approach and/or valuation techniques discussed above.
Centrally cleared swaps listed or traded on a multilateral or trade facility platform, such as a registered exchange, are generally valued at the daily settlement price determined by the respective exchange. These securities are classified as Level 2 in the fair value hierarchy, as the daily settlement price is not public.
Securities and other assets that cannot be priced according to the methods described above are valued based on pricing methodologies approved by the Board. In the event that unobservable inputs are used when determining such valuations, the securities will be classified as Level 3 in the fair value hierarchy.
When determining the fair value of securities, some of the factors influencing the valuation include: the nature of any restrictions on disposition of the securities; assessment of the general liquidity of the securities; the issuer’s financial condition and the markets in which it does business; the cost of the investment; the size of the holding and the capitalization of the issuer; the prices of any recent transactions or bids/offers for such securities or any comparable securities; any available analyst media or other reports or information deemed reliable by the investment manager regarding the issuer or the markets or industry in which it operates. Using fair value to price securities may result in a value that is different from a security’s most recent closing price and from the price used by other unaffiliated mutual funds to calculate their net asset values.
Restricted and Illiquid Securities: Subject to guidelines adopted by the Board, the Fund may invest up to 15% of its net assets in illiquid securities, including those which are restricted as to disposition under securities law (“restricted securities”). Restricted securities are valued pursuant to the valuation procedures noted above. Illiquid securities are those that, because of the absence of a readily available market or due to legal or contractual restrictions on resale, cannot be sold within seven days in the ordinary course of business at approximately the amount at which the Fund has valued the investment. Therefore, the Fund may find it difficult to sell illiquid securities at the time considered most advantageous by its Subadviser and may incur expenses that would not be incurred in the sale of securities that were freely marketable. Certain securities that would otherwise be
| Prudential Absolute Return Bond Fund | 85 |
Notes to Financial Statements (continued)
considered illiquid because of legal restrictions on resale to the general public may be traded among qualified institutional buyers under Rule 144A of the Securities Act of 1933. These Rule 144A securities, as well as commercial paper that is sold in private placements under Section 4(2) of the Securities Act, may be deemed liquid by the Fund’s Subadviser under the guidelines adopted by the Trustees of the Fund. However, the liquidity of the Fund’s investments in Rule 144A securities could be impaired if trading does not develop or declines.
Connecticut Avenue Securities (CAS) and Structured Agency Credit Risk (STACR): The Fund purchased government controlled Fannie Mae and Freddie Mac securities that transfer most of the cost of defaults to private investors including the Fund. These are insurance-like products that are called CAS by Fannie Mae and STACR securities by Freddie Mac. Payments on the securities are based primarily on the performance of a reference pool of underlying mortgages. With such securities, the Fund could lose some or all of its principal if the underlying mortgages experience credit defaults.
Foreign Currency Translation: The books and records of the Fund are maintained in U.S. dollars. Foreign currency amounts are translated into U.S. dollars on the following basis:
(i) market value of investment securities, other assets and liabilities—at the current rates of exchange;
(ii) purchases and sales of investment securities, income and expenses—at the rates of exchange prevailing on the respective dates of such transactions.
Although the net assets of the Fund are presented at the foreign exchange rates and market values at the close of the period, the Fund does not generally isolate that portion of the results of operations arising as a result of changes in the foreign exchange rates from the fluctuations arising from changes in the market prices of long-term portfolio securities held at the end of the period. Similarly, the Fund does not isolate the effect of changes in foreign exchange rates from the fluctuations arising from changes in the market prices of long-term portfolio securities sold during the period. Accordingly, holding period realized foreign currency gains (losses) are included in the reported net realized gains (losses) on investment transactions.
Net realized gains (losses) on foreign currency transactions represent net foreign exchange gains (losses) from the disposition of holdings of foreign currencies, currency gains (losses) realized between the trade and settlement dates on securities transactions, and the difference between the amounts of interest, dividends and foreign withholding taxes recorded on the Fund’s books and the U.S. dollar equivalent amounts actually received or paid. Net unrealized currency gains (losses) from valuing foreign currency denominated
| 86 |
assets and liabilities (other than investments) at period end exchange rates are reflected as a component of net unrealized appreciation (depreciation) on foreign currencies.
Forward and Cross Currency Contracts: A forward currency contract is a commitment to purchase or sell a foreign currency at a future date at a negotiated forward rate. The Fund enters into forward currency contracts in order to hedge its exposure to changes in foreign currency exchange rates on its foreign portfolio holdings or specific receivables and payables denominated in a foreign currency and to gain exposure to certain currencies. The contracts are valued daily at current forward exchange rates and any unrealized gain (loss) is included in net unrealized appreciation (depreciation) on investments and foreign currencies. Gain (loss) is realized on the settlement date of the contract equal to the difference between the settlement value of the original and negotiated forward contracts. This gain (loss), if any, is included in net realized gain (loss) on forward and cross currency contract transactions. Risks may arise upon entering into these contracts from the potential inability of the counterparties to meet the terms of their contracts. Forward currency contracts involve risks from currency exchange rate and credit risk in excess of the amounts reflected on the Statement of Assets and Liabilities. The Fund’s maximum risk of loss from counterparty credit risk is the net value of the cash flows to be received from the counterparty at the end of the contract’s life. A cross currency contract is a forward contract where a specified amount of one foreign currency will be exchanged for a specified amount of another foreign currency.
Options: The Fund purchased or wrote options in order to hedge against adverse market movements or fluctuations in value caused by changes in prevailing interest rates, value of equities or foreign currency exchange rates with respect to securities or financial instruments which the Fund currently owns or intends to purchase. The Fund may also use options to gain additional market exposure. The Fund’s principal reason for writing options is to realize, through receipt of premiums, a greater current return than would be realized on the underlying security alone. When the Fund purchases an option, it pays a premium and an amount equal to that premium is recorded as an asset. When the Fund writes an option, it receives a premium and an amount equal to that premium is recorded as a liability. The asset or liability is adjusted daily to reflect the current market value of the option. If an option expires unexercised, the Fund realizes a gain (loss) to the extent of the premium received or paid. If an option is exercised, the premium received or paid is recorded as an adjustment to the proceeds from the sale or the cost of the purchase in determining whether the Fund has realized a gain (loss). The difference between the premium and the amount received or paid at the closing of a purchase or sale transaction is also treated as a realized gain (loss). Gain (loss) on purchased options is included in net realized gain (loss) on investment transactions. Gain (loss) on written options is presented separately as net realized gain (loss) on options written transactions.
The Fund, as writer of an option, may have no control over whether the underlying securities or financial instruments may be sold (called) or purchased (put). As a result, the Fund bears the market risk of an unfavorable change in the price of the security or financial instrument underlying the written option. The Fund, as purchaser or an OTC option, bears
| Prudential Absolute Return Bond Fund | 87 |
Notes to Financial Statements (continued)
the risk of the potential inability of the counterparties to meet the terms of their contracts. With exchange-traded options contracts, there is minimal counterparty credit risk to the Fund since the exchanges’ clearinghouse acts as counterparty to all exchange-traded options and guarantees the options contracts against default.
When the Fund writes an option on a swap, an amount equal to any premium received by the Fund is recorded as a liability and is subsequently adjusted to the current market value of the written option on the swap. If a call option on a swap is exercised, the Fund becomes obligated to pay a fixed interest rate (noted as the strike price) and receive a variable interest rate on a notional amount. If a put option on a swap is exercised, the Fund becomes obligated to pay a variable interest rate and receive a fixed interest rate (noted as the strike price) on a notional amount. Premiums received from writing options on swaps that expire or are exercised are treated as realized gains upon the expiration or exercise of such options on swaps. The risk associated with writing put and call options on swaps is that the Fund will be obligated to be party to a swap agreement if an option on a swap is exercised.
Financial Futures Contracts: A financial futures contract is an agreement to purchase (long) or sell (short) an agreed amount of securities at a set price for delivery on a future date. Upon entering into a financial futures contract, the Fund is required to pledge to the broker an amount of cash and/or other assets equal to a certain percentage of the contract amount. This amount is known as the “initial margin.” Subsequent payments, known as “variation margin,” are made or received by the Fund each day, depending on the daily fluctuations in the value of the underlying security. Such variation margin is recorded for financial statement purposes on a daily basis as unrealized gain (loss). When the contract expires or is closed, the gain (loss) is realized and is presented in the Statement of Operations as net realized gain (loss) on futures transactions.
The Fund invested in financial futures contracts in order to hedge its existing portfolio securities, or securities the Fund intends to purchase, against fluctuations in value caused by changes in prevailing interest rates. Should interest rates move unexpectedly, the Fund may not achieve the anticipated benefits of the financial futures contracts and may realize a loss. The use of futures transactions involves the risk of imperfect correlation in movements in the price of futures contracts, interest rates and the underlying hedged assets. Since futures contracts are exchange-traded, there is minimal counterparty credit risk to the Fund since the exchanges’ clearinghouse acts as counterparty to all exchange-traded futures and guarantees the futures contracts against default.
Bank Loans: The Fund may invest in bank loans. Bank loans include fixed and floating rate loans that are privately negotiated between a corporate borrower and one or more financial institutions, including, but not limited to, term loans, revolvers, and other instruments issued in the bank loan market. The Fund may acquire interests in loans directly (by way of
| 88 |
assignment from the selling institution) or indirectly (by way of the purchase of a participation interest from the selling institution). Under a bank loan assignment, the Fund generally will succeed to all the rights and obligations of an assigning lending institution and becomes a lender under the loan agreement with the relevant borrower in connection with that loan. Under a bank loan participation, the Fund generally will have a contractual relationship only with the lender, not with the relevant borrower. As a result, the Fund generally will have the right to receive payments of principal, interest, and any fees to which it is entitled only from the lender selling the participation and only upon receipt by the lender of the payments from the relevant borrower. The Fund may not directly benefit from the collateral supporting the debt obligation in which it has purchased the participation. As a result, the Fund will assume the credit risk of both the borrower and the institution selling the participation to the Fund.
Forward Rate Agreements: Forward rate agreements represent an agreement between counterparties to exchange cash flows based on the difference between two interest rates, applied to a notional principal amount on a fixed future date. The Fund entered into forward rate agreements to gain yield exposure based on anticipated market conditions at the specified termination date of the agreement.
Swap Agreements: The Fund may enter into credit default, interest rate and other types of swap agreements. A swap agreement is an agreement to exchange the return generated by one instrument for the return generated by another instrument. Swap agreements are negotiated in the OTC market and may be executed either directly with counterparty (“OTC-traded”) or through a central clearing facility, such as a registered exchange. Swap agreements are valued daily at current market value and any change in value is included in the net unrealized appreciation (depreciation) on swap agreements. Centrally cleared swaps pay or receive an amount known as “variation margin”, based on daily changes in the valuation of the swap contract. Any upfront premiums paid and received are shown as swap premiums paid and swap premiums received in the Statement of Assets and Liabilities. Risk of loss may exceed amounts recognized on the Statement of Assets and Liabilities. Swap agreements outstanding at period end, if any, are listed on the Schedule of Investments.
Interest Rate Swaps: Interest rate swaps represent an agreement between counterparties to exchange cash flows based on the difference between two interest rates, applied to a notional principal amount for a specified period. The Fund is subject to interest rate risk exposure in the normal course of pursuing its investment objectives. The Fund used interest rate swaps to maintain its ability to generate steady cash flow by receiving a stream of fixed-rate payments and to increase exposure to prevailing market rates by receiving floating rate payments. The Fund’s maximum risk of loss from counterparty credit risk is the discounted net present value of the cash flows to be received from the counterparty over the contract’s remaining life.
Inflation Swaps: The Fund entered into inflation swap agreements to protect against fluctuations in inflation rates. Inflation swaps are characterized by one party paying a fixed rate in exchange for a floating rate that is derived from an inflation index, such as the
| Prudential Absolute Return Bond Fund | 89 |
Notes to Financial Statements (continued)
Consumer Price Index or UK Retail Price Index. Inflation swaps subject the Fund to interest rate risk.
Credit Default Swaps (“CDS”): CDS involve one party (the protection buyer) making a stream of payments to another party (the protection seller) in exchange for the right to receive a specified payment in the event of a default or as a result of a default (collectively a “credit event”) for the referenced entity (typically corporate issues or sovereign issues of an emerging country) on its obligation; or in the event of a write-down, principal shortfall, interest shortfall or default of all or part of the referenced entities comprising a credit index.
The Fund is subject to credit risk in the normal course of pursuing its investment objectives, and as such, has entered into CDS contracts to provide a measure of protection against defaults or to take an active long or short position with respect to the likelihood of a particular issuer’s default or the reference entity’s credit soundness. CDS contracts generally trade based on a spread which represents the cost a protection buyer has to pay the protection seller. The protection buyer is said to be short the credit as the value of the contract rises the more the credit deteriorates. The value of the CDS contract increases for the protection buyer if the spread increases. The Fund’s maximum risk of loss from counterparty credit risk for purchased CDS is the inability of the counterparty to honor the contract up to the notional value due to a credit event.
As a seller of protection on credit default swap agreements, the Fund generally receives an agreed upon payment from the buyer of protection throughout the term of the swap, provided no credit event occurs. As the seller, the Fund effectively increases its investment risk because, in addition to its total net assets, the Fund may be subject to investment exposure on the notional amount of the swap.
The maximum amount of the payment that the Fund, as a seller of protection, could be required to make under a credit default swap agreement would be equal to the notional amount of the underlying security or index contract as a result of a credit event. This potential amount will be partially offset by any recovery values of the respective referenced obligations, or net amounts received from the settlement of buy protection credit default swap agreements which the Fund entered into for the same referenced entity or index. As a buyer of protection, the Fund generally receives an amount up to the notional value of the swap if a credit event occurs.
Implied credit spreads, represented in absolute terms, utilized in determining the market value of credit default swap agreements on corporate or sovereign issues of an emerging country as of period end are disclosed in the footnotes to the Schedule of Investments, if applicable. These spreads serve as indicators of the current status of the payment/
| 90 |
performance risk and represent the likelihood of default risk for the credit derivative. The implied credit spread of a particular referenced entity reflects the cost of buying/selling protection and may include upfront payments required to enter into the agreement. For credit default swap agreements on asset-backed securities and credit indices, the quoted market prices and resulting values serve as indicators of the current status of the payment/performance risk. Wider credit spreads and increased market value in absolute terms, when compared to the notional amount of the swap, represent a deterioration of the referenced entity’s credit soundness and a greater likelihood of risk of default or other credit event occurring as defined under the terms of the agreement.
Currency Swaps: The Fund entered into currency swap agreements primarily to gain yield exposure on foreign bonds. Currency swap agreements involve two parties exchanging two different currencies with an agreement to reverse the exchange at a later date at specified exchange rates.
Total Return Swaps: In a total return swap, one party would receive payments based on the market value of the security or the commodity involved, or total return of a specific referenced asset, such as an equity, index or bond, and in return pay a fixed amount. The Fund is subject to risk exposures associated with the referenced asset in the normal course of pursuing its investment objectives. The Fund entered into total return swaps to manage its exposure to a security or an index. The Fund’s maximum risk of loss from counterparty credit risk is the change in the value of the security, in the Fund’s favor, from the point of entering into the contract.
Master Netting Arrangements: The Trust, on behalf of the Fund, is subject to various Master Agreements, or netting arrangements, with select counterparties. These are agreements which a subadviser may have negotiated and entered into on behalf of the Fund. A master netting arrangement between the Fund and the counterparty permits the Fund to offset amounts payable by the Fund to the same counterparty against amounts to be received; and by the receipt of collateral from the counterparty by the Fund to cover the Fund’s exposure to the counterparty. However, there is no assurance that such mitigating factors are easily enforceable. In addition to master netting arrangements, the right to set-off exists when all the conditions are met such that each of the parties owes the other determinable amounts, the reporting party has the right to set-off the amount owed with the amount owed by the other party, the reporting party intends to set-off and the right of set-off is enforceable by law. During the reporting period, there was no intention to settle on a net basis and all amounts are presented on a gross basis on the Statement of Assets and Liabilities.
The Trust, on behalf of the Fund, is a party to ISDA (International Swaps and Derivatives Association, Inc.) Master Agreements with certain counterparties that govern OTC derivative and foreign exchange contracts entered into from time to time. The Master Agreements may contain provisions regarding, among other things, the parties’ general obligations, representations, agreements, collateral requirements, events of default and early termination. With respect to certain counterparties, in accordance with the terms of the Master Agreements, collateral posted to the Fund is held in a segregated account by the
| Prudential Absolute Return Bond Fund | 91 |
Notes to Financial Statements (continued)
Fund’s custodian and with respect to those amounts which can be sold or re-pledged, is presented in the Schedule of Investments. Collateral pledged by the Fund is segregated by the Fund’s custodian and identified in the Schedule of Investments. Collateral can be in the form of cash or debt securities issued by the U.S. Government or related agencies or other securities as agreed to by the Fund and the applicable counterparty. Collateral requirements are determined based on the Fund’s net position with each counterparty. Termination events applicable to the Fund may occur upon a decline in the Fund’s net assets below a specified threshold over a certain period of time. Termination events applicable to counterparties may occur upon a decline in the counterparty’s long-term and short-term credit ratings below a specified level. In each case, upon occurrence, the other party may elect to terminate early and cause settlement of all derivative and foreign exchange contracts outstanding, including the payment of any losses and costs resulting from such early termination, as reasonably determined by the terminating party. Any decision by one or more of the Fund’s counterparties to elect early termination could impact the Fund’s future derivative activity.
In addition to each instrument’s primary underlying risk exposure (e.g. interest rate, credit, equity or foreign exchange, etc.), swap agreements involve, to varying degrees, elements of credit, market and documentation risk. Such risks involve the possibility that no liquid market for these agreements will exist, the counterparty to the agreement may default on its obligation to perform or disagree on the contractual terms of the agreement, and changes in net interest rates will be unfavorable. In connection with these agreements, securities in the portfolio may be identified or received as collateral from the counterparty in accordance with the terms of the respective swap agreements to provide or receive assets of value and to serve as recourse in the event of default or bankruptcy/insolvency of either party. Such OTC derivative agreements include conditions which, when materialized, give the counterparty the right to cause an early termination of the transactions under those agreements. Any election by the counterparty for early termination of the contract(s) may impact the amounts reported on financial statements.
As of October 31, 2017, the Fund has not met conditions under such agreements which give the counterparty the right to call for an early termination.
Forward currency contracts, forward rate agreements, written options, short sales, swaps and financial futures contracts involve elements of both market and credit risk in excess of the amounts reflected on the Statement of Assets and Liabilities. Such risks may be mitigated by engaging in master netting arrangements.
Payment-In-Kind: The Fund may invest in the open market or receive pursuant to debt restructuring, securities that pay-in-kind (PIK) the interest due on such debt instruments.
| 92 |
The PIK interest, computed at the contractual rate specified, is added to the existing principal balance of the debt when issued bonds have same terms as the bond or recorded as a separate bond when terms are different from the existing debt, and is recorded as interest income.
Securities Lending: The Fund may lend its portfolio securities to banks and broker-dealers. The loans are secured by collateral at least equal to the market value of the securities loaned. Collateral pledged by each borrower is invested in an affiliated money market fund and is marked to market daily, based on the previous day’s market value, such that the value of the collateral exceeds the value of the loaned securities. Loans are subject to termination at the option of the borrower or the Fund. Upon termination of the loan, the borrower will return to the Fund securities identical to the loaned securities. Should the borrower of the securities fail financially, the Fund has the right to repurchase the securities in the open market using the collateral. The Fund recognizes income, net of any rebate and securities lending agent fees, for lending its securities in the form of fees or interest on the investment of any cash received as collateral. The borrower receives all interest and dividends from the securities loaned and such payments are passed back to the lender in amounts equivalent thereto. The Fund also continues to recognize any unrealized gain (loss) in the market price of the securities loaned and on the change in the value of the collateral invested that may occur during the term of the loan. In addition, realized gain (loss) is recognized on changes in the value of the collateral invested upon liquidation of the collateral. Net earnings from securities lending are disclosed on the Statement of Operations as “Income from securities lending, net”.
Concentration of Risk: The ability of debt securities issuers (other than those issued or guaranteed by the U.S. Government) held by the Fund to meet their obligations may be affected by the economic or political developments in a specific industry, region or country. Foreign security and currency transactions may involve certain considerations and risks not typically associated with those of domestic origin as a result of, among other factors, the possibility of political or economic instability or the level of governmental supervision and regulation of foreign securities markets.
Securities Transactions and Net Investment Income: Securities transactions are recorded on the trade date. Realized gains (losses) from investment and currency transactions are calculated on the specific identification method. Dividend income is recorded on the ex-date. Expenses are recorded on an accrual basis, which may require the use of certain estimates by management that may differ from actual. Net investment income or loss (other than class specific expenses and waivers, which are allocated as noted below) and unrealized and realized gains (losses) are allocated daily to each class of shares based upon the relative proportion of adjusted net assets of each class at the beginning of the day.
Class specific expenses and waivers, where applicable, are charged to the respective share classes. Class specific expenses include Distribution fees and Distribution fee waivers, and effective August 1, 2017, Transfer Agent’s fees and expenses, Registration fees and
| Prudential Absolute Return Bond Fund | 93 |
Notes to Financial Statements (continued)
Management fee waivers. Prior to August 1, 2017 Transfer Agent’s fees and expenses, Registration fees and Management fee waivers were not designated as class specific expenses and were allocated daily to each class of shares based upon the relative proportion of adjusted net assets of each class at the beginning of the day.
Taxes: It is the Fund’s policy to continue to meet the requirements of the Internal Revenue Code applicable to regulated investment companies and to distribute all of its taxable net investment income and capital gains, if any, to its shareholders. Therefore, no federal income tax provision is required. Withholding taxes on foreign dividends, interest and capital gains, if any, are recorded, net of reclaimable amounts, at the time the related income is earned.
Dividends and Distributions: The Fund expects to pay dividends from net investment income monthly and distributions from net realized capital gains, if any, annually. Dividends and distributions to shareholders, which are determined in accordance with federal income tax regulations and which may differ from generally accepted accounting principles, are recorded on the ex-date. Permanent book/tax differences relating to income and gain (loss) are reclassified amongst undistributed net investment income, accumulated net realized gain (loss) and paid-in capital in excess of par, as appropriate.
Estimates: The preparation of financial statements requires management to make estimates and assumptions that affect the reported amounts and disclosures in the financial statements. Actual results could differ from those estimates.
2. Agreements
The Trust, on behalf of the Fund, has a management agreement with PGIM Investments. Pursuant to this agreement, PGIM Investments has responsibility for all investment advisory services and supervises the subadviser’s performance of such services. PGIM Investments has entered into a subadvisory agreement with PGIM, Inc., which provides subadvisory services to the Fund through its subsidiary PGIM Fixed Income. The subadvisory agreement provides that PGIM, Inc. will furnish investment advisory services in connection with the management of the Fund. In connection therewith, PGIM, Inc. is obligated to keep certain books and records of the Fund. PGIM Investments pays for the services of PGIM, Inc., the cost of compensation of officers of the Fund, occupancy and certain clerical and bookkeeping costs of the Fund. The Fund bears all other costs and expenses.
The management fee paid to PGIM Investments is accrued daily and payable monthly at an annual rate of .80% of the Fund’s average daily net assets up to $2.5 billion, .775% of the next $2.5 billion and .75% of such assets in excess of $5 billion. The effective management
| 94 |
fee rate before any waivers and/or expense reimbursements was .80% for the year ended October 31, 2017. The effective management fee rate, net of waivers and/or expense reimbursement was .75%.
PGIM Investments has contractually agreed through February 28, 2018 to limit the net annual operating expenses (exclusive of distribution and service (12b-1) fees, taxes (such as income and foreign withholdings taxes, stamp duty and deferred tax expenses), interest, underlying funds, brokerage, extraordinary and certain other expenses such as dividend, broker charges and interest expense on short sales) of each class of shares of the Fund to .90% of the Fund’s average daily net assets. Expenses waived/reimbursed by the Manager in accordance with this agreement may be recouped by the Manager within the same fiscal year during which such waiver/reimbursement is made if such recoupment can be realized without exceeding the expense limit in effect at the time of the recoupment for that fiscal year.
The Trust, on behalf of the Fund, has a distribution agreement with Prudential Investment Management Services LLC (“PIMS”) which acts as the distributor of the Class A, Class C, Class Q and Class Z shares of the Fund. The Fund compensates PIMS for distributing and servicing the Fund’s Class A and Class C shares, pursuant to the plans of distribution (the “Distribution Plans”), regardless of expenses actually incurred by PIMS. The distribution fees are accrued daily and payable monthly. No distribution or service fees are paid to PIMS as distributor of the Class Q or Class Z shares of the Fund.
Pursuant to the Fund’s Distribution Plans, the Fund compensates PIMS for distribution related activities at an annual rate of up to .25% and 1% of the average daily net assets of the Class A and C shares, respectively.
PIMS has advised the Fund that it has received $136,096 in front-end sales charges resulting from sales of Class A shares, during the year ended October 31, 2017. From these fees, PIMS paid such sales charges to affiliated broker-dealers, which in turn paid commissions to sales persons and incurred other distribution costs.
PIMS has advised the Fund that for the year ended October 31, 2017, it received $13,206 and $4,319 in contingent deferred sales charges imposed upon redemptions by certain Class A and Class C shareholders, respectively.
PGIM Investments, PGIM, Inc., PGIM Fixed Income and PIMS are indirect, wholly-owned subsidiaries of Prudential Financial, Inc. (“Prudential”).
3. Other Transactions with Affiliates
Prudential Mutual Fund Services LLC (“PMFS”), an affiliate of PGIM Investments and an indirect, wholly-owned subsidiary of Prudential, serves as the Fund’s transfer agent. Transfer agent’s fees and expenses in the Statement of Operations include certain out-of-pocket expenses paid to non-affiliates, where applicable.
| Prudential Absolute Return Bond Fund | 95 |
Notes to Financial Statements (continued)
The Fund may enter into certain securities purchase or sale transactions under Board approved Rule 17a-7 procedures. Rule 17a-7 is an exemptive rule under the 1940 Act, that permits purchase and sale transactions among affiliated investment companies, or between an investment company and a person that is affiliated solely by reason of having a common (or affiliated) investment adviser, common directors, and/or common officers. Such transactions are subject to ratification by the Board. For the reporting period ended October 31, 2017 no such transactions were entered into by the Fund.
The Fund may invest its overnight sweep cash in the Prudential Core Ultra Short Bond Fund (the “Core Fund”), and its securities lending cash collateral in the Prudential Institutional Money Market Fund (the “Money Market Fund”), each a series of Prudential Investment Portfolios 2, registered under the 1940 Act and managed by PGIM Investments. For the reporting period ended October 31, 2017, PGIM, Inc. was compensated $47,526 by PGIM Investments for managing the Fund’s securities lending cash collateral as subadviser to the Money Market Fund. Earnings from the Core Fund and Money Market Fund are disclosed on the Statement of Operations as “Affiliated dividend income” and “Income from securities lending, net”, respectively.
4. Portfolio Securities
The aggregate cost of purchases and proceeds from sales of portfolio securities (excluding short-term investments and U.S. Government securities) for the year ended October 31, 2017 were $844,462,997 and $755,985,757, respectively.
5. Distributions and Tax Information
Distributions to shareholders, which are determined in accordance with federal income tax regulations and which may differ from generally accepted accounting principles, are recorded on the ex-date. In order to present undistributed net investment income, accumulated net realized loss on investment and foreign currency transactions and paid-in capital in excess of par on the Statement of Assets and Liabilities that more closely represent their tax character, certain adjustments have been made to undistributed net investment income and accumulated net realized loss on investment and foreign currency transactions. For the year ended October 31, 2017, the adjustments were to increase undistributed net investment income and increase accumulated net realized loss on investment and foreign currency transactions by $13,935,475 primarily due to the difference between financial and tax reporting purposes of premium amortization, certain transactions involving foreign currencies, paydown gains (losses), swaps and other book to tax adjustments. Net investment income, net realized gain (loss) on investment and foreign currency transactions and net assets were not affected by this change.
| 96 |
For the year ended October 31, 2017, the tax character of dividends paid by the Fund was $40,791,803 of ordinary income. For the year ended October 31, 2016, the tax character of dividends paid by the Fund were $33,141,733 of ordinary income and $11,557,872 of tax return of capital.
As of October 31, 2017, the accumulated undistributed earnings on a tax basis was $4,227,452 of ordinary income. This differs from the amount shown on the Statement of Assets and Liabilities primarily due to cumulative timing differences between financial and tax reporting.
The United States federal income tax basis of the Fund’s investments and the net unrealized appreciation as of October 31, 2017 were as follows:
Tax Basis | Gross | Gross | Net | |||
| $1,882,819,874 | $45,039,287 | $(13,675,811) | $31,363,476 |
The differences between book basis and tax basis were primarily attributable to deferred losses on wash sales, difference in the treatment of premium amortization and other cost basis differences between financial and tax accounting.
For federal income tax purposes, the Fund had a capital loss carryforward as of October 31, 2017 of approximately $58,727,000 which can be carried forward for an unlimited period. No capital gains distributions are expected to be paid to shareholders until net gains have been realized in excess of such losses.
Management has analyzed the Fund’s tax positions taken on federal, state and local income tax returns for all open tax years and has concluded that no provision for income tax is required in the Fund’s financial statements for the current reporting period. The Fund’s federal, state and local income and federal excise tax returns for tax years for which the applicable statutes of limitations have not expired are subject to examination by the Internal Revenue Service and state departments of revenue.
6. Capital
The Fund offers Class A, Class C, Class Q and Class Z shares. Class A shares are sold with a maximum front-end sales charge of 4.50%. Investors who purchase $1 million or more of Class A shares and sell these shares within 12 months of purchase are subject to a contingent deferred sales charge (“CDSC”) of 1%, although they are not subject to an initial sales charge. The Class A CDSC is waived for certain retirement and/or benefit plans. Class C shares are sold with a CDSC of 1% on sales made within 12 months of purchase. A special exchange privilege is also available for shareholders who qualify to purchase Class A shares at net asset value. Class Q and Class Z shares are not subject to any sales or redemption charge and are offered exclusively for sale to a limited group of investors.
| Prudential Absolute Return Bond Fund | 97 |
Notes to Financial Statements (continued)
Under certain circumstances, an exchange may be made from specified share classes of the Fund to one or more other share classes of the Fund as presented in the table of transactions in shares of beneficial interest.
The Trust has authorized an unlimited number of shares of beneficial interest at $.001 par value per share, divided into four classes, designated Class A, Class C, Class Q and Class Z.
As of October 31, 2017, Prudential through its affiliate entities, including affiliated funds, owned 2,758,591 shares of Class Q. At reporting period end, seven shareholders of record held 77% of the Fund’s outstanding shares on behalf of multiple beneficial owners.
Transactions in shares of beneficial interest were as follows:
Class A | Shares | Amount | ||||||
Year ended October 31, 2017: |
| |||||||
Shares sold | 5,287,444 | $ | 51,389,408 | |||||
Shares issued in reinvestment of dividends and distributions | 263,023 | 2,563,014 | ||||||
Shares reacquired | (6,475,151 | ) | (62,665,690 | ) | ||||
|
|
|
| |||||
Net increase (decrease) in shares outstanding before conversion | (924,684 | ) | (8,713,268 | ) | ||||
Shares issued upon conversion from other share class(es) | 260,628 | 2,533,357 | ||||||
Shares reacquired upon conversion into other share class(es) | (7,865,438 | ) | (76,474,888 | ) | ||||
|
|
|
| |||||
Net increase (decrease) in shares outstanding | (8,529,494 | ) | $ | (82,654,799 | ) | |||
|
|
|
| |||||
Year ended October 31, 2016: |
| |||||||
Shares sold | 3,440,458 | $ | 32,494,477 | |||||
Shares issued in reinvestment of dividends and distributions | 440,040 | 4,141,204 | ||||||
Shares reacquired | (14,830,739 | ) | (138,911,852 | ) | ||||
|
|
|
| |||||
Net increase (decrease) in shares outstanding before conversion | (10,950,241 | ) | (102,276,171 | ) | ||||
Shares issued upon conversion from other share class(es) | 236,862 | 2,227,068 | ||||||
Shares reacquired upon conversion into other share class(es) | (1,938,955 | ) | (18,349,729 | ) | ||||
|
|
|
| |||||
Net increase (decrease) in shares outstanding | (12,652,334 | ) | $ | (118,398,832 | ) | |||
|
|
|
| |||||
| 98 |
Class C | Shares | Amount | ||||||
Year ended October 31, 2017: | ||||||||
Shares sold | 1,372,212 | $ | 13,418,733 | |||||
Shares issued in reinvestment of dividends and distributions | 136,492 | 1,336,820 | ||||||
Shares reacquired | (2,985,937 | ) | (29,077,382 | ) | ||||
|
|
|
| |||||
Net increase (decrease) in shares outstanding before conversion | (1,477,233 | ) | (14,321,829 | ) | ||||
Shares reacquired upon conversion into other share class(es) | (875,243 | ) | (8,568,509 | ) | ||||
|
|
|
| |||||
Net increase (decrease) in shares outstanding | (2,352,476 | ) | $ | (22,890,338 | ) | |||
|
|
|
| |||||
Year ended October 31, 2016: | ||||||||
Shares sold | 791,028 | $ | 7,508,773 | |||||
Shares issued in reinvestment of dividends and distributions | 161,297 | 1,523,492 | ||||||
Shares reacquired | (5,247,367 | ) | (49,413,539 | ) | ||||
|
|
|
| |||||
Net increase (decrease) in shares outstanding before conversion | (4,295,042 | ) | (40,381,274 | ) | ||||
Shares issued upon conversion from other share class(es) | 7,065 | 66,762 | ||||||
Shares reacquired upon conversion into other share class(es) | (444,614 | ) | (4,219,724 | ) | ||||
|
|
|
| |||||
Net increase (decrease) in shares outstanding | (4,732,591 | ) | $ | (44,534,236 | ) | |||
|
|
|
| |||||
Class Q | ||||||||
Year ended October 31, 2017: | ||||||||
Shares sold | 13,571,706 | $ | 133,355,079 | |||||
Shares issued in reinvestment of dividends and distributions | 422,868 | 4,125,496 | ||||||
Shares reacquired | (14,035,658 | ) | (137,572,290 | ) | ||||
|
|
|
| |||||
Net increase (decrease) in shares outstanding before conversion | (41,084 | ) | (91,715 | ) | ||||
Shares issued upon conversion from other share class(es) | 17,546,616 | 170,377,523 | ||||||
Shares reacquired upon conversion into other share class(es) | (978,301 | ) | (9,521,365 | ) | ||||
|
|
|
| |||||
Net increase (decrease) in shares outstanding | 16,527,231 | $ | 160,764,443 | |||||
|
|
|
| |||||
Year ended October 31, 2016: | ||||||||
Shares sold | 808,821 | $ | 7,619,847 | |||||
Shares issued in reinvestment of dividends and distributions | 419,707 | 3,965,545 | ||||||
Shares reacquired† | (873,487 | ) | (8,265,086 | ) | ||||
|
|
|
| |||||
Net increase (decrease) in shares outstanding before conversion | 355,041 | 3,320,306 | ||||||
Shares issued upon conversion from other share class(es) | 2,012,539 | 19,107,874 | ||||||
|
|
|
| |||||
Net increase (decrease) in shares outstanding | 2,367,580 | $ | 22,428,180 | |||||
|
|
|
| |||||
| Prudential Absolute Return Bond Fund | 99 |
Notes to Financial Statements (continued)
Class Z | Shares | Amount | ||||||
Year ended October 31, 2017: | ||||||||
Shares sold | 58,776,093 | $ | 574,643,248 | |||||
Shares issued in reinvestment of dividends and distributions | 2,154,719 | 21,153,567 | ||||||
Shares reacquired | (30,565,874 | ) | (297,888,862 | ) | ||||
|
|
|
| |||||
Net increase (decrease) in shares outstanding before conversion | 30,364,938 | 297,907,953 | ||||||
Shares issued upon conversion from other share class(es) | 9,644,649 | 94,171,386 | ||||||
Shares reacquired upon conversion into other share class(es) | (17,693,832 | ) | (172,517,504 | ) | ||||
|
|
|
| |||||
Net increase (decrease) in shares outstanding | 22,315,755 | $ | 219,561,835 | |||||
|
|
|
| |||||
Year ended October 31, 2016: | ||||||||
Shares sold | 34,920,821 | $ | 330,492,012 | |||||
Shares issued in reinvestment of dividends and distributions | 2,388,839 | 22,588,724 | ||||||
Shares reacquired | (116,138,163 | ) | (1,094,934,947 | ) | ||||
|
|
|
| |||||
Net increase (decrease) in shares outstanding before conversion | (78,828,503 | ) | (741,854,211 | ) | ||||
Shares issued upon conversion from other shares class(es) | 2,343,730 | 22,263,641 | ||||||
Shares reacquired upon conversion into other share class(es) | (2,217,019 | ) | (21,095,892 | ) | ||||
|
|
|
| |||||
Net increase (decrease) in shares outstanding | (78,701,792 | ) | $ | (740,686,462 | ) | |||
|
|
|
| |||||
| † | Includes affiliated redemption of 116 shares with a value of $1,093 for Class Q shares. |
7. Borrowings
The Trust, on behalf of the Fund, along with other affiliated registered investment companies (the “Funds”), is a party to a Syndicated Credit Agreement (“SCA”) with a group of banks. The purpose of the SCA is to provide an alternative source of temporary funding for capital share redemptions. The SCA provides for a commitment of $900 million for the period October 5, 2017 through October 4, 2018. The Funds pay an annualized commitment fee of .15% of the unused portion of the SCA. The Fund’s portion of the commitment fee for the unused amount, allocated based upon a method approved by the Board, is accrued daily and paid quarterly. Prior to October 5, 2017, the Funds had another SCA that provided a commitment of $900 million and the Funds paid an annualized commitment fee of .15% of the unused portion of the SCA. The interest on borrowings under the SCAs is paid monthly and at a per annum interest rate based upon a contractual spread plus the higher of (1) the effective federal funds rate, (2) the 1-month LIBOR rate or (3) zero percent.
Other affiliated registered investment companies that are parties to the SCA include portfolios that are subject to a predetermined mathematical formula used to manage certain benefit guarantees offered under variable annuity contracts. The formula may result in large scale asset flows into and out of these portfolios. Consequently, these portfolios may be more likely to utilize the SCA for purposes of funding redemptions. It may be
| 100 |
possible for those portfolios to fully exhaust the committed amount of the SCA, thereby requiring the Manager to allocate available funding per a Board-approved methodology designed to treat the Funds in the SCA equitably.
The Fund did not utilize the SCA during the reporting period ended October 31, 2017.
| Prudential Absolute Return Bond Fund | 101 |
Financial Highlights
| Class A Shares | ||||||||||||||||||||
| Year Ended October 31, | ||||||||||||||||||||
| 2017 | 2016 | 2015 | 2014 | 2013 | ||||||||||||||||
| Per Share Operating Performance(a): | ||||||||||||||||||||
| Net Asset Value, Beginning of Year | $9.59 | $9.48 | $9.79 | $9.82 | $9.92 | |||||||||||||||
| Income (loss) from investment operations: | ||||||||||||||||||||
| Net investment income (loss) | .23 | .25 | .23 | .25 | .21 | |||||||||||||||
| Net realized and unrealized gain (loss) on investment transactions | .33 | .06 | (.30 | ) | .02 | (.03 | ) | |||||||||||||
| Total from investment operations | .56 | .31 | (.07 | ) | .27 | .18 | ||||||||||||||
| Less Dividends and Distributions: | ||||||||||||||||||||
| Dividends from net investment income | (.22 | ) | (.15 | ) | (.21 | ) | (.30 | ) | (.23 | ) | ||||||||||
| Tax return of capital | - | (.05 | ) | (.03 | ) | - | (.05 | ) | ||||||||||||
| Total dividends and distributions | (.22 | ) | (.20 | ) | (.24 | ) | (.30 | ) | (.28 | ) | ||||||||||
| Net asset value, end of Year | $9.93 | $9.59 | $9.48 | $9.79 | $9.82 | |||||||||||||||
| Total Return(b): | 5.95% | 3.36% | (.78)% | 2.76% | 1.86% | |||||||||||||||
| Ratios/Supplemental Data: | ||||||||||||||||||||
| Net assets, end of year (000) | $119,969 | $197,713 | $315,214 | $452,955 | $469,604 | |||||||||||||||
| Average net assets (000) | $145,290 | $246,082 | $383,950 | $483,199 | $303,234 | |||||||||||||||
| Ratios to average net assets(c)(d): | ||||||||||||||||||||
| Expenses after waivers and/or expense reimbursement | 1.15% | 1.15% | 1.15% | 1.15% | 1.14% | |||||||||||||||
| Expenses before waivers and/or expense reimbursement | 1.22% | 1.24% | 1.24% | 1.27% | 1.28% | |||||||||||||||
| Net investment income (loss) | 2.31% | 2.67% | 2.39% | 2.58% | 2.17% | |||||||||||||||
| Portfolio turnover rate | 72% | 38% | 64% | 64% | 125% | |||||||||||||||
| (a) | Calculated based on average shares outstanding during the year. |
| (b) | Total return does not consider the effects of sales loads. Total return is calculated assuming a purchase of a share on the first day and a sale on the last day of each year reported and includes reinvestment of dividends and distributions, if any. Total returns may reflect adjustments to conform to generally accepted accounting principles. |
| (c) | Does not include expenses of the underlying funds in which the Fund invests. |
| (d) | Effective March 9, 2015, the contractual distribution and service (12b-1) fees were reduced from .30% to .25% of the average daily net assets and the .05% contractual 12b-1 waiver was terminated. |
See Notes to Financial Statements.
| 102 |
| Class C Shares | ||||||||||||||||||||
| Year Ended October 31, | ||||||||||||||||||||
| 2017 | 2016 | 2015 | 2014 | 2013 | ||||||||||||||||
| Per Share Operating Performance(a): | ||||||||||||||||||||
| Net Asset Value, Beginning of Year | $9.62 | $9.51 | $9.82 | $9.85 | $9.94 | |||||||||||||||
| Income (loss) from investment operations: | ||||||||||||||||||||
| Net investment income (loss) | .15 | .18 | .16 | .18 | .14 | |||||||||||||||
| Net realized and unrealized gain (loss) on investment transactions | .34 | .06 | (.31 | ) | .01 | (.02 | ) | |||||||||||||
| Total from investment operations | .49 | .24 | (.15 | ) | .19 | .12 | ||||||||||||||
| Less Dividends and Distributions: | ||||||||||||||||||||
| Dividends from net investment income | (.15 | ) | (.10 | ) | (.13 | ) | (.22 | ) | (.16 | ) | ||||||||||
| Tax return of capital | - | (.03 | ) | (.03 | ) | - | (.05 | ) | ||||||||||||
| Total dividends and distributions | (.15 | ) | (.13 | ) | (.16 | ) | (.22 | ) | (.21 | ) | ||||||||||
| Net asset value, end of year | $9.96 | $9.62 | $9.51 | $9.82 | $9.85 | |||||||||||||||
| Total Return(b): | 5.16% | 2.59% | (1.51)% | 1.97% | 1.18% | |||||||||||||||
| Ratios/Supplemental Data: | ||||||||||||||||||||
| Net assets, end of year (000) | $98,789 | $118,092 | $161,679 | $195,312 | $172,326 | |||||||||||||||
| Average net assets (000) | $106,174 | $135,510 | $183,419 | $183,745 | $97,736 | |||||||||||||||
| Ratios to average net assets(c): | ||||||||||||||||||||
| Expenses after waivers and/or expense reimbursement | 1.90% | 1.90% | 1.90% | 1.90% | 1.89% | |||||||||||||||
| Expenses before waivers and/or expense reimbursement | 1.97% | 1.99% | 1.97% | 1.97% | 1.98% | |||||||||||||||
| Net investment income (loss) | 1.58% | 1.91% | 1.62% | 1.81% | 1.41% | |||||||||||||||
| Portfolio turnover rate | 72% | 38% | 64% | 64% | 125% | |||||||||||||||
| (a) | Calculated based on average shares outstanding during the year. |
| (b) | Total return does not consider the effects of sales loads. Total return is calculated assuming a purchase of a share on the first day and a sale on the last day of each year reported and includes reinvestment of dividends and distributions, if any. Total returns may reflect adjustments to conform to generally accepted accounting principles. |
| (c) | Does not include expenses of the underlying funds in which the Fund invests. |
See Notes to Financial Statements.
| Prudential Absolute Return Bond Fund | 103 |
Financial Highlights (continued)
| Class Q Shares | ||||||||||||||||||||
| Year Ended October 31, | ||||||||||||||||||||
| 2017 | 2016 | 2015 | 2014 | 2013 | ||||||||||||||||
| Per Share Operating Performance(a): | ||||||||||||||||||||
| Net Asset Value, Beginning of Year | $9.61 | $9.49 | $9.81 | $9.83 | $9.94 | |||||||||||||||
| Income (loss) from investment operations: | ||||||||||||||||||||
| Net investment income (loss) | .26 | .28 | .25 | .28 | .27 | |||||||||||||||
| Net realized and unrealized gain (loss) on investment transactions | .32 | .07 | (.30 | ) | .03 | (.06 | ) | |||||||||||||
| Total from investment operations | .58 | .35 | (.05 | ) | .31 | .21 | ||||||||||||||
| Less Dividends and Distributions: | ||||||||||||||||||||
| Dividends from net investment income | (.25 | ) | (.17 | ) | (.24 | ) | (.33 | ) | (.27 | ) | ||||||||||
| Tax return of capital | - | (.06 | ) | (.03 | ) | - | (.05 | ) | ||||||||||||
| Total dividends and distributions | (.25 | ) | (.23 | ) | (.27 | ) | (.33 | ) | (.32 | ) | ||||||||||
| Net asset value, end of year | $9.94 | $9.61 | $9.49 | $9.81 | $9.83 | |||||||||||||||
| Total Return(b): | 6.15% | 3.81% | (.57)% | 3.16% | 2.10% | |||||||||||||||
| Ratios/Supplemental Data: | ||||||||||||||||||||
| Net assets, end of year (000) | $346,253 | $175,887 | $151,294 | $19,025 | $17,829 | |||||||||||||||
| Average net assets (000) | $270,229 | $158,967 | $125,910 | $18,604 | $3,144 | |||||||||||||||
| Ratios to average net assets(c): | ||||||||||||||||||||
| Expenses after waivers and/or expense reimbursement | .90% | .84% | .85% | .85% | .90% | |||||||||||||||
| Expenses before waivers and/or expense reimbursement | .90% | .84% | .85% | .85% | .94% | |||||||||||||||
| Net investment income (loss) | 2.64% | 2.97% | 2.61% | 2.87% | 2.87% | |||||||||||||||
| Portfolio turnover rate | 72% | 38% | 64% | 64% | 125% | |||||||||||||||
| (a) | Calculated based on average shares outstanding during the year. |
| (b) | Total return is calculated assuming a purchase of a share on the first day and a sale on the last day of each year reported and includes reinvestment of dividends and distributions, if any. Total returns may reflect adjustments to conform to generally accepted accounting principles. |
| (c) | Does not include expenses of the underlying funds in which the Fund invests. |
See Notes to Financial Statements.
| 104 |
| Class Z Shares | ||||||||||||||||||||
| Year Ended October 31, | ||||||||||||||||||||
| 2017 | 2016 | 2015 | 2014 | 2013 | ||||||||||||||||
| Per Share Operating Performance(a): | ||||||||||||||||||||
| Net Asset Value, Beginning of Year | $9.64 | $9.52 | $9.83 | $9.86 | $9.95 | |||||||||||||||
| Income (loss) from investment operations: | ||||||||||||||||||||
| Net investment income (loss) | .25 | .27 | .25 | .27 | .24 | |||||||||||||||
| Net realized and unrealized gain (loss) on investment transactions | .33 | .08 | (.30 | ) | .02 | (.02 | ) | |||||||||||||
| Total from investment operations | .58 | .35 | (.05 | ) | .29 | .22 | ||||||||||||||
| Less Dividends and Distributions: | ||||||||||||||||||||
| Dividends from net investment income | (.25 | ) | (.17 | ) | (.23 | ) | (.32 | ) | (.26 | ) | ||||||||||
| Tax return of capital | - | (.06 | ) | (.03 | ) | - | (.05 | ) | ||||||||||||
| Total dividends and distributions | (.25 | ) | (.23 | ) | (.26 | ) | (.32 | ) | (.31 | ) | ||||||||||
| Net asset value, end of year | $9.97 | $9.64 | $9.52 | $9.83 | $9.86 | |||||||||||||||
| Total Return(b): | 6.08% | 3.71% | (.53)% | 3.00% | 2.21% | |||||||||||||||
| Ratios/Supplemental Data: | ||||||||||||||||||||
| Net assets, end of year (000) | $1,277,401 | $1,019,254 | $1,755,667 | $2,070,862 | $1,201,383 | |||||||||||||||
| Average net assets (000) | $1,121,943 | $1,396,060 | $2,029,397 | $1,484,697 | $672,382 | |||||||||||||||
| Ratios to average net assets(c): | ||||||||||||||||||||
| Expenses after waivers and/or expense reimbursement | .90% | .90% | .90% | .90% | .90% | |||||||||||||||
| Expenses before waivers and/or expense reimbursement | .96% | .99% | .97% | .97% | .99% | |||||||||||||||
| Net investment income (loss) | 2.59% | 2.91% | 2.61% | 2.79% | 2.43% | |||||||||||||||
| Portfolio turnover rate | 72% | 38% | 64% | 64% | 125% | |||||||||||||||
| (a) | Calculated based on average shares outstanding during the year. |
| (b) | Total return is calculated assuming a purchase of a share on the first day and a sale on the last day of each year reported and includes reinvestment of dividends and distributions, if any. Total returns may reflect adjustments to conform to generally accepted accounting principles. |
| (c) | Does not include expenses of the underlying funds in which the Fund invests. |
See Notes to Financial Statements.
| Prudential Absolute Return Bond Fund | 105 |
Report of Independent Registered Public Accounting Firm
The Board of Trustees and Shareholders
Prudential Investment Portfolios 9:
We have audited the accompanying statement of assets and liabilities of Prudential Absolute Return Bond Fund (the “Fund”), a series of Prudential Investment Portfolios 9, including the schedule of investments, as of October 31, 2017, and the related statement of operations for the year then ended, the statements of changes in net assets for each of the years in the two-year period then ended, and the financial highlights for each of the years in the five-year period then ended. These financial statements and financial highlights are the responsibility of the Fund’s management. Our responsibility is to express an opinion on these financial statements and financial highlights based on our audits.
We conducted our audits in accordance with the standards of the Public Company Accounting Oversight Board (United States). Those standards require that we plan and perform the audit to obtain reasonable assurance about whether the financial statements and financial highlights are free of material misstatement. An audit includes examining, on a test basis, evidence supporting the amounts and disclosures in the financial statements. Our procedures included confirmation of securities owned as of October 31, 2017, by correspondence with the custodian, transfer agent and brokers or by other appropriate auditing procedures when replies from brokers were not received. An audit also includes assessing the accounting principles used and significant estimates made by management, as well as evaluating the overall financial statement presentation. We believe that our audits provide a reasonable basis for our opinion.
In our opinion, the financial statements and financial highlights referred to above present fairly, in all material respects, the financial position of the Fund as of October 31, 2017, and the results of its operations for the year then ended, the changes in its net assets for each of the years in the two-year period then ended, and the financial highlights for each of the years in the five-year period then ended, in conformity with U.S. generally accepted accounting principles.

New York, New York
December 18, 2017
| 106 |
Federal Income Tax Information (unaudited)
For the year ended October 31, 2017, the Fund reports the maximum amount allowable but not less than 77.56% as interest related dividends in accordance with Section 871(k)(1) and 881(e)(1) of the Internal Revenue Code.
In January 2018, you will be advised on IRS Form 1099-DIV or substitute Form 1099-DIV as to the federal tax status of the distributions received by you in calendar year 2017.
We are required by Massachusetts, Missouri and Oregon to inform you that dividends which have been derived from interest on federal obligations are not taxable to shareholders providing the Mutual Fund meets certain requirements mandated by the respective state’s taxing authorities. We are pleased to report that 2.07% of the dividends paid by the Fund qualifies for such deduction.
Please consult your tax adviser or state/local authorities to properly report this information on your tax return. If you have any questions concerning the amounts listed above, please call your financial adviser.
| Prudential Absolute Return Bond Fund | 107 |
INFORMATION ABOUT BOARD MEMBERS AND OFFICERS
(Unaudited)
Information about Board Members and Officers of the Fund is set forth below. Board Members who are not deemed to be “interested persons” of the Fund, as defined in the 1940 Act, are referred to as “Independent Board Members.” Board Members who are deemed to be “interested persons” of the Fund are referred to as “Interested Board Members.” The Board Members are responsible for the overall supervision of the operations of the Fund and perform the various duties imposed on the directors of investment companies by the 1940 Act. The Board in turn elects the Officers, who are responsible for administering the day-to-day operations of the Fund.
| Independent Board Members(1) | ||||
Name, Address, Age Position(s) Portfolios Overseen | Principal Occupation(s) During Past Five Years | Other Directorships Held During Past Five Years | ||
Ellen S. Alberding (59) Board Member Portfolios Overseen: 89 | President and Board Member, The Joyce Foundation (charitable foundation) (since 2002); Vice Chair, City Colleges of Chicago (community college system) (since 2011); Trustee, Skills for America’s Future (national initiative to connect employers to community colleges) (since 2011); Trustee, National Park Foundation (charitable foundation for national park system) (since 2009); Trustee, Economic Club of Chicago (since 2009). | None. | ||
Kevin J. Bannon (65) Board Member Portfolios Overseen: 89 | Retired; Managing Director (April 2008-May 2015) and Chief Investment Officer (October 2008-November 2013) of Highmount Capital LLC (registered investment adviser); formerly Executive Vice President and Chief Investment Officer (April 1993-August 2007) of Bank of New York Company; President (May 2003-May 2007) of BNY Hamilton Family of Mutual Funds. | Director of Urstadt Biddle Properties (equity real estate investment trust) (since September 2008). | ||
Linda W. Bynoe (65) Board Member Portfolios Overseen: 89 | President and Chief Executive Officer (since March 1995) and formerly Chief Operating Officer (December 1989-February 1995) of Telemat Ltd. (management consulting); formerly Vice President (January 1985-June 1989) at Morgan Stanley & Co. (broker-dealer). | Director of Simon Property Group, Inc. (retail real estate) (May 2003-May 2012); Director of Anixter International, Inc. (communication products distributor) (since January 2006); Director of Northern Trust Corporation (financial services) (since April 2006); Trustee of Equity Residential (residential real estate) (since December 2009). | ||
Prudential Absolute Return Bond Fund
| Independent Board Members(1) | ||||
Name, Address, Age Position(s) Portfolios Overseen | Principal Occupation(s) During Past Five Years | Other Directorships Held During Past Five Years | ||
Barry H. Evans (57)± Board Member Portfolios Overseen: 89 | Retired; Formerly President (2005-2016), Global Chief Operating Officer (2014-2016), Chief Investment Officer-Global Head of Fixed Income (1998-2014), and various portfolio manager roles (1986-2006), Manulife Asset Management U.S. | Director, Manulife Trust Company (201-present); Director, Manulife Asset Management Limited (2015-present); Formerly Chairman of the Board of Directors of Manulife Asset Management U.S. (2005-2016); Formerly Chairman of the Board, Declaration Investment Management and Research (2008-2016). | ||
Keith F. Hartstein (61) Board Member & Independent Chair Portfolios Overseen: 89 | Retired; Member (since November 2014) of the Governing Council of the Independent Directors Council (organization of independent mutual fund directors); formerly President and Chief Executive Officer (2005-2012), Senior Vice President (2004-2005), Senior Vice President of Sales and Marketing (1997-2004), and various executive management positions (1990-1997), John Hancock Funds, LLC (asset management); Chairman, Investment Company Institute’s Sales Force Marketing Committee (2003-2008). | None. | ||
Laurie Simon Hodrick (55)± Board Member Portfolios Overseen: 89 | A. Barton Hepburn Professor of Economics in the Faculty of Business, Columbia Business School (since 1996); Visiting Professor of Law and Rock Center for Corporate Governance Fellow, Stanford Law School (since 2015); Visiting Fellow, Hoover Institution, Stanford University (since 2015); Sole Member, ReidCourt LLC (since 2008) (a consulting firm); Formerly Managing Director, Global Head of Alternative Investment Strategies, Deutsche Bank (2006-2008); Formerly Director/Trustee, Merrill Lynch Investment Managers Funds (1999-2006). | Independent Director, Corporate Capital Trust (since April 2017) (a business development company). | ||
Michael S. Hyland, CFA (72) Board Member Portfolios Overseen: 89 | Retired (since February 2005); formerly Senior Managing Director (July 2001-February 2005) of Bear Stearns & Co, Inc.; Global Partner, INVESCO (1999-2001); Managing Director and President of Salomon Brothers Asset Management (1989-1999). | None. | ||
Visit our website at pgiminvestments.com
| Independent Board Members(1) | ||||
Name, Address, Age Position(s) Portfolios Overseen | Principal Occupation(s) During Past Five Years | Other Directorships Held During Past Five Years | ||
Richard A. Redeker (74) Board Member & Independent Vice Chair9 Portfolios Overseen: 87 | Retired Mutual Fund Senior Executive (47 years); Management Consultant; Director, Mutual Fund Directors Forum (since 2014); Independent Directors Council (organization of independent mutual fund directors)-Executive Committee, Chair of Policy Steering Committee, Governing Council. | None. | ||
Stephen G. Stoneburn (74) Board Member Portfolios Overseen: 89 | Chairman (since July 2011), President and Chief Executive Officer (since June 1996) of Frontline Medical Communications (publishing company); formerly President (June 1995-June 1996) of Argus Integrated Media, Inc.; Senior Vice President and Managing Director (January 1993-1995) of Cowles Business Media; Senior Vice President of Fairchild Publications, Inc. (1975-1989). | None. | ||
±Mr. Evans and Ms. Hodrick joined the Board effective as of September 1, 2017.
| Interested Board Members(1) | ||||
Name, Address, Age Position(s) Portfolios Overseen | Principal Occupation(s) During Past Five Years | Other Directorships Held During Past Five Years | ||
Stuart S. Parker (55) Board Member & President Portfolios Overseen: 89 | President of PGIM Investments LLC (formerly known as Prudential Investments LLC) (since January 2012); Executive Vice President of Prudential Investment Management Services LLC (since December 2012); Executive Vice President of Jennison Associates LLC and Head of Retail Distribution of PGIM Investments LLC (June 2005-December 2011). | None. | ||
Prudential Absolute Return Bond Fund
| Interested Board Members(1) | ||||
Name, Address, Age Position(s) Portfolios Overseen | Principal Occupation(s) During Past Five Years | Other Directorships Held During Past Five Years | ||
Scott E. Benjamin (44) Board Member & Vice President Portfolios Overseen: 89 | Executive Vice President (since June 2009) of PGIM Investments LLC; Executive Vice President (June 2009-June 2012) and Vice President (since June 2012) of Prudential Investment Management Services LLC; Executive Vice President (since September 2009) of AST Investment Services, Inc.; Senior Vice President of Product Development and Marketing, PGIM Investments (since February 2006); Vice President of Product Development and Product Management, Prudential Investments (2003-2006). | None. | ||
Grace C. Torres* (58) Board Member Portfolios Overseen: 88 | Retired; formerly Treasurer and Principal Financial and Accounting Officer of the Prudential Funds, Target Funds, Advanced Series Trust, Prudential Variable Contract Accounts and The Prudential Series Fund (1998-June 2014); Assistant Treasurer (March 1999-June 2014) and Senior Vice President (September 1999-June 2014) of PGIM Investments LLC; Assistant Treasurer (May 2003-June 2014) and Vice President (June 2005-June 2014) of AST Investment Services, Inc.; Senior Vice President and Assistant Treasurer (May 2003-June 2014) of Prudential Annuities Advisory Services, Inc. | Director (since July 2015) of Sun Bancorp, Inc. N.A. and Sun National Bank | ||
* Note: Prior to her retirement in 2014, Ms. Torres was employed by PGIM Investments LLC. Due to her prior employment, she is considered to be an “interested person” under the 1940 Act. Ms. Torres is a Non-Management Interested Board Member.
(1) The year that each individual joined the Board is as follows:
Ellen S. Alberding, 2013; Linda W. Bynoe, 2005; Barry H. Evans, 2017; Richard A. Redeker, 1998; Stephen G. Stoneburn, 2003; Kevin J. Bannon, 2008; Keith F. Hartstein, 2013; Laurie Simon Hodrick, 2017; Michael S. Hyland, 2008; Stuart S. Parker, Board Member since 2012 and President since 2012; Scott E. Benjamin, Board Member since 2010 and Vice President since 2009; Grace C. Torres, 2014.
Visit our website at pgiminvestments.com
| Fund Officers(a) | ||||
Name, Address and Age Position with Fund | Principal Occupation(s) During Past Five Years | Length of Service as Fund Officer | ||
Raymond A. O’Hara (62) Chief Legal Officer | Vice President and Corporate Counsel (since July 2010) of Prudential Insurance Company of America (Prudential); Vice President (March 2011-Present) of Pruco Life Insurance Company and Pruco Life Insurance Company of New Jersey; Vice President and Corporate Counsel (March 2011-Present) of Prudential Annuities Life Assurance Corporation; Chief Legal Officer of PGIM Investments LLC (since June 2012); Chief Legal Officer of Prudential Mutual Fund Services LLC (since June 2012) and Corporate Counsel of AST Investment Services, Inc. (since June 2012); formerly Assistant Vice President and Corporate Counsel (September 2008-July 2010) of The Hartford Financial Services Group, Inc.; formerly Associate (September 1980-December 1987) and Partner (January 1988-August 2008) of Blazzard & Hasenauer, P.C. (formerly, Blazzard, Grodd & Hasenauer, P.C.). | Since 2012 | ||
Chad A. Earnst (42) Chief Compliance Officer | Chief Compliance Officer (September 2014-Present) of PGIM Investments LLC; Chief Compliance Officer (September 2014-Present) of the Prudential Funds, Target Funds, Advanced Series Trust, The Prudential Series Fund, Prudential’s Gibraltar Fund, Inc., Prudential Global Short Duration High Yield Income Fund, Inc., Prudential Short Duration High Yield Fund, Inc. and Prudential Jennison MLP Income Fund, Inc.; formerly Assistant Director (March 2010-August 2014) of the Asset Management Unit, Division of Enforcement, US Securities & Exchange Commission; Assistant Regional Director (January 2010-August 2014), Branch Chief (June 2006-December 2009) and Senior Counsel (April 2003-May 2006) of the Miami Regional Office, Division of Enforcement, US Securities & Exchange Commission. | Since 2014 | ||
Deborah A. Docs (59) Secretary | Vice President and Corporate Counsel (since January 2001) of Prudential; Vice President (since December 1996) and Assistant Secretary (since March 1999) of PGIM Investments LLC; formerly Vice President and Assistant Secretary (May 2003-June 2005) of AST Investment Services, Inc. | Since 2004 | ||
Jonathan D. Shain (59) Assistant Secretary | Vice President and Corporate Counsel (since August 1998) of Prudential; Vice President and Assistant Secretary (since May 2001) of PGIM Investments LLC; Vice President and Assistant Secretary (since February 2001) of Prudential Mutual Fund Services LLC; formerly Vice President and Assistant Secretary (May 2003-June 2005) of AST Investment Services, Inc. | Since 2005 | ||
Claudia DiGiacomo (43) Assistant Secretary | Vice President and Corporate Counsel (since January 2005) of Prudential; Vice President and Assistant Secretary of PGIM Investments LLC (since December 2005); Associate at Sidley Austin Brown & Wood LLP (1999-2004). | Since 2005 | ||
Prudential Absolute Return Bond Fund
| Fund Officers(a) | ||||
Name, Address and Age Position with Fund | Principal Occupation(s) During Past Five Years | Length of Service as Fund Officer | ||
Andrew R. French (54) Assistant Secretary | Vice President and Corporate Counsel (since February 2010) of Prudential; formerly Director and Corporate Counsel (2006-2010) of Prudential; Vice President and Assistant Secretary (since January 2007) of PGIM Investments LLC; Vice President and Assistant Secretary (since January 2007) of Prudential Mutual Fund Services LLC. | Since 2006 | ||
Charles H. Smith (44) Anti-Money Laundering Compliance Officer | Vice President, Corporate Compliance, Anti-Money Laundering Unit (since January 2015) of Prudential; committee member of the American Council of Life Insurers Anti-Money Laundering and Critical Infrastructure Committee (since January 2016); formerly Global Head of Economic Sanctions Compliance at AIG Property Casualty (February 2007-December 2014); Assistant Attorney General at the New York State Attorney General’s Office, Division of Public Advocacy. (August 1998-January 2007). | Since 2016 | ||
M. Sadiq Peshimam (53) Treasurer and Principal Financial and Accounting Officer | Vice President (since 2005) of PGIM Investments LLC; formerly Assistant Treasurer of funds in the Prudential Mutual Fund Complex (2006-2014). | Since 2006 | ||
Peter Parrella (59) Assistant Treasurer | Vice President (since 2007) and Director (2004-2007) within Prudential Mutual Fund Administration; formerly Tax Manager at SSB Citi Fund Management LLC (1997-2004). | Since 2007 | ||
Lana Lomuti (50) Assistant Treasurer | Vice President (since 2007) and Director (2005-2007), within Prudential Mutual Fund Administration; formerly Assistant Treasurer (December 2007-February 2014) of The Greater China Fund, Inc. | Since 2014 | ||
Linda McMullin (56) Assistant Treasurer | Vice President (since 2011) and Director (2008-2011) within Prudential Mutual Fund Administration. | Since 2014 | ||
Kelly A. Coyne (49) Assistant Treasurer | Director, Investment Operations of Prudential Mutual Fund Services LLC (since 2010). | Since 2015 | ||
(a) Excludes Mr. Parker and Mr. Benjamin, interested Board Members who also serve as President and Vice President, respectively.
Explanatory Notes to Tables:
| ∎ | Board Members are deemed to be “Interested,” as defined in the 1940 Act, by reason of their affiliation with PGIM Investments LLC and/or an affiliate of PGIM Investments LLC. |
| ∎ | Unless otherwise noted, the address of all Board Members and Officers is c/o PGIM Investments LLC, 655 Broad Street, Newark, New Jersey 07102-4410. |
| ∎ | There is no set term of office for Board Members or Officers. The Board Members have adopted a retirement policy, which calls for the retirement of Board Members on December 31 of the year in which they reach the age of 75. |
| ∎ | “Other Directorships Held” includes only directorships of companies required to register or file reports with the SEC under the 1934 Act (that is, “public companies”) or other investment companies registered under the 1940 Act. |
| ∎ | “Portfolios Overseen” includes all investment companies managed by PGIM Investments LLC. The investment companies for which PGIM Investments LLC serves as manager include the Prudential Mutual Funds, The Prudential Variable Contract Accounts, Target Mutual Funds, Prudential Short Duration High Yield Fund, Inc., Prudential Global Short Duration High Yield Fund, Inc., The Prudential Series Fund, Prudential’s Gibraltar Fund, Inc. and the Advanced Series Trust. |
Visit our website at pgiminvestments.com
Approval of Advisory Agreements
The Fund’s Board of Trustees
The Board of Trustees (the “Board”) of Prudential Absolute Return Bond Fund (the “Fund”)1 consists of twelve individuals, nine of whom are not “interested persons” of the Fund, as defined in the Investment Company Act of 1940, as amended (the “1940 Act”) (the “Independent Trustees”). The Board is responsible for the oversight of the Fund and its operations, and performs the various duties imposed on the Trustees of investment companies by the 1940 Act. The Independent Trustees have retained independent legal counsel to assist them in connection with their duties. The Chair of the Board is an Independent Trustee. The Board has established four standing committees: the Audit Committee, the Nominating and Governance Committee, and two Investment Committees. Each committee is chaired by, and composed of, Independent Trustees.
Annual Approval of the Fund’s Advisory Agreements
As required under the 1940 Act, the Board determines annually whether to renew the Fund’s management agreement with PGIM Investments LLC (“PGIM Investments”), the Fund’s subadvisory agreement with PGIM, Inc. (“PGIM”) on behalf of its PGIM Fixed Income unit, and the Fund’s sub-subadvisory agreement with PGIM Limited (“PGIML”). In considering the renewal of the agreements, the Board, including all of the Independent Trustees,2 met on June 6-8, 2017 and approved the renewal of the agreements through July 31, 2018, after concluding that the renewal of the agreements was in the best interests of the Fund and its shareholders.
In advance of the meetings, the Board requested and received materials relating to the agreements, and had the opportunity to ask questions and request further information in connection with its consideration. Among other things, the Board considered comparative fee information from PGIM Investments and PGIM. Also, the Board considered comparisons with other mutual funds in relevant Peer Universes and Peer Groups, as is further discussed below.
In approving the agreements, the Board, including the Independent Trustees advised by independent legal counsel, considered the factors it deemed relevant, including the nature, quality and extent of services provided by PGIM Investments and the subadviser, the performance of the Fund, the profitability of PGIM Investments and its affiliates, expenses and fees, and the potential for economies of scale that may be shared with the Fund and its shareholders as the Fund’s assets grow. In their deliberations, the Trustees did not identify any single factor which alone was responsible for the Board’s decision to approve the
| 1 | Prudential Absolute Return Bond Fund is a series of Prudential Investment Portfolios 9. |
| 2 | Barry H. Evans and Laurie Simon Hodrick joined the Board effective as of September 1, 2017. Neither Mr. Evans nor Ms. Hodrick participated in the consideration of the renewal of the Fund’s advisory agreements. |
| Prudential Absolute Return Bond Fund | ||
Approval of Advisory Agreements (continued)
agreements with respect to the Fund. In connection with its deliberations, the Board considered information provided by PGIM Investments throughout the year at regular Board meetings, presentations from portfolio managers and other information, as well as information furnished at or in advance of the meetings on June 6-8, 2017.
The Trustees determined that the overall arrangements between the Fund and PGIM Investments, which serves as the Fund’s investment manager pursuant to a management agreement, between PGIM Investments and PGIM, which, through its PGIM Fixed Income unit, serves as the Fund’s subadviser pursuant to the terms of a subadvisory agreement with PGIM Investments, and between PGIM and PGIML, which serves as the Fund’s sub-subadviser pursuant to the terms of a sub-subadvisory agreement with PGIM, are in the best interests of the Fund and its shareholders in light of the services performed, fees charged and such other matters as the Trustees considered relevant in the exercise of their business judgment.
The material factors and conclusions that formed the basis for the Trustees’ reaching their determinations to approve the continuance of the agreements are separately discussed below.
Nature, Quality and Extent of Services
The Board received and considered information regarding the nature, quality and extent of services provided to the Fund by PGIM Investments, PGIM Fixed Income, and PGIML. The Board considered the services provided by PGIM Investments, including but not limited to the oversight of the subadviser and sub-subadviser for the Fund, as well as the provision of fund recordkeeping, compliance, and other services to the Fund. With respect to PGIM Investments’ oversight of the subadviser and sub-subadviser, the Board noted that PGIM Investments’ Strategic Investment Research Group (“SIRG”), which is a business unit of PGIM Investments, is responsible for monitoring and reporting to PGIM Investments senior management on the performance and operations of the subadviser and sub-subadviser. The Board also considered that PGIM Investments pays the salaries of all of the officers and interested Trustees of the Fund who are part of Fund management. The Board also considered the investment subadvisory services provided by PGIM Fixed Income and PGIML, including investment research and security selection, as well as adherence to the Fund’s investment restrictions and compliance with applicable Fund policies and procedures. The Board considered PGIM Investments’ evaluation of the subadviser and sub-subadviser, as well as PGIM Investments’ recommendation, based on its review of the subadviser and sub-subadviser, to renew the subadvisory and sub-subadvisory agreements.
The Board considered the qualifications, backgrounds and responsibilities of PGIM Investments’ senior management responsible for the oversight of the Fund, PGIM Fixed
| Visit our website at pgiminvestments.com |
Income, and PGIML, and also considered the qualifications, backgrounds and responsibilities of PGIM Fixed Income’s portfolio managers who are responsible for the day-to-day management of the Fund’s portfolio. The Board was provided with information pertaining to PGIM Investments’, PGIM Fixed Income’s, and PGIML’s organizational structure, senior management, investment operations, and other relevant information pertaining to PGIM Investments, PGIM Fixed Income, and PGIML. The Board also noted that it received favorable compliance reports from the Fund’s Chief Compliance Officer (“CCO”) as to PGIM Investments, PGIM Fixed Income, and PGIML. The Board noted that PGIM Fixed Income and PGIML are affiliated with PGIM Investments.
The Board concluded that it was satisfied with the nature, extent and quality of the investment management services provided by PGIM Investments, the subadvisory services provided to the Fund by PGIM Fixed Income, and the sub-subadvisory services provided by PGIML, and that there was a reasonable basis on which to conclude that the Fund benefits from the services provided by PGIM Investments, PGIM Fixed Income, and PGIML under the management, subadvisory and sub-subadvisory agreements.
Costs of Services and Profits Realized by PGIM Investments
The Board was provided with information on the profitability of PGIM Investments and its affiliates in serving as the Fund’s investment manager. The Board discussed with PGIM Investments the methodology utilized in assembling the information regarding profitability and considered its reasonableness. The Board recognized that it is difficult to make comparisons of profitability from fund management contracts because comparative information is not generally publicly available and is affected by numerous factors, including the structure of the particular adviser, the types of funds it manages, its business mix, numerous assumptions regarding allocations and the adviser’s capital structure and cost of capital. The Board further noted that the subadviser and sub-subadviser are affiliated with PGIM Investments and that their profitability is reflected in PGIM Investments’ profitability report. Taking these factors into account, the Board concluded that the profitability of PGIM Investments and its affiliates in relation to the services rendered was not unreasonable.
Economies of Scale
The Board received and discussed information concerning economies of scale that PGIM Investments may realize as the Fund’s assets grow beyond current levels. The Board noted that the management fee schedule for the Fund includes breakpoints, which have the effect of decreasing the fee rate as assets increase, but at its current level of assets the Fund does not realize the effect of those rate reductions. The Board took note that the Fund’s fee structure currently results in benefits to Fund shareholders whether or not PGIM
| Prudential Absolute Return Bond Fund | ||
Approval of Advisory Agreements (continued)
Investments realizes any economies of scale. The Board noted that economies of scale can be shared with the Fund in other ways, including low management fees from inception, additional technological and personnel investments to enhance shareholder services, and maintaining existing expense structures in the face of a rising cost environment. The Board also considered PGIM Investments’ assertion that it continually evaluates the management fee schedule of the Fund and the potential to share economies of scale through breakpoints or fee waivers as asset levels increase.
The Board recognized the inherent limitations of any analysis of economies of scale, stemming largely from the Board’s understanding that most of PGIM Investments’ costs are not specific to individual funds, but rather are incurred across a variety of products and services.
Other Benefits to PGIM Investments, PGIM Fixed Income, and PGIML
The Board considered potential ancillary benefits that might be received by PGIM Investments, PGIM Fixed Income, and PGIML and their affiliates as a result of their relationship with the Fund. The Board concluded that potential benefits to be derived by PGIM Investments included transfer agency fees received by the Fund’s transfer agent (which is affiliated with PGIM Investments), as well as benefits to its reputation or other intangible benefits resulting from PGIM Investments’ association with the Fund. The Board concluded that the potential benefits to be derived by PGIM Fixed Income and PGIML included the ability to use soft dollar credits, as well as the potential benefits consistent with those generally resulting from an increase in assets under management, specifically, potential access to additional research resources and benefits to their reputations. The Board concluded that the benefits derived by PGIM Investments, PGIM Fixed Income, and PGIML were consistent with the types of benefits generally derived by investment managers and subadvisers to mutual funds.
Performance of the Fund / Fees and Expenses
The Board considered certain additional specific factors and made related conclusions relating to the historical performance of the Fund for the one, three-, and five-year periods ended December 31, 2016.
The Board also considered the Fund’s actual management fee, as well as the Fund’s net total expense ratio, for the fiscal year ended October 31, 2016. The Board considered the management fee for the Fund as compared to the management fee charged by PGIM Investments to other funds and the fee charged by other advisers to comparable mutual funds in a Peer Group. The actual management fee represents the fee rate actually paid by Fund shareholders and includes any fee waivers or reimbursements. The net total expense ratio for the Fund represents the actual expense ratio incurred by Fund shareholders.
| Visit our website at pgiminvestments.com |
The mutual funds included in the Peer Universe (the Lipper Alternative Credit Focus Funds Performance Universe), which was used to consider performance, and the Peer Group, which was used to consider expenses and fees, were objectively determined by Broadridge, an independent provider of mutual fund data. The comparisons placed the Fund in various quartiles, with the first quartile being the best 25% of the mutual funds (for performance, the best performing mutual funds and, for expenses, the lowest cost mutual funds).
The section below summarizes key factors considered by the Board and the Board’s conclusions regarding the Fund’s performance, fees and overall expenses. The table sets forth gross performance comparisons (which do not reflect the impact on performance of fund expenses, or any subsidies, expense caps or waivers that may be applicable) with the Peer Universe, actual management fees with the Peer Group (which reflect the impact of any subsidies or fee waivers), and net total expenses with the Peer Group, each of which were key factors considered by the Board.
| Performance | 1 Year | 3 Years | 5 Years | 10 Years | ||||
3rd Quartile | 2nd Quartile | 3rd Quartile | N/A | |||||
| Actual Management Fees: 4th Quartile | ||||||||
| Net Total Expenses: 3rd Quartile | ||||||||
| • | The Board noted that the Fund outperformed its benchmark index over all periods. |
| • | The Board also noted that the Fund’s performance against its Peer Universe had improved, with the Fund ranked in the second quartile of its Peer Universe for the first quarter of 2017. |
| • | The Board and PGIM Investments agreed to continue the existing expense cap, which caps the Fund’s annual operating expenses at 0.90% (exclusive of 12b-1 fees and certain other fees), through February 28, 2018. |
| • | The Board concluded that, in light of the above, it would be in the best interests of the Fund and its shareholders to renew the agreements. |
| • | The Board concluded that the management fees (including subadvisory fees) and total expenses were reasonable in light of the services provided. |
* * *
After full consideration of these factors, the Board concluded that the approval of the agreements was in the best interests of the Fund and its shareholders.
| Prudential Absolute Return Bond Fund | ||
| ∎ TELEPHONE | ∎ WEBSITE | |||
655 Broad Street | (800) 225-1852 | www.pgiminvestments.com |
| PROXY VOTING |
| The Board of Trustees of the Fund has delegated to the Fund’s investment subadviser the responsibility for voting any proxies and maintaining proxy recordkeeping with respect to the Fund. A description of these proxy voting policies and procedures is available without charge, upon request, by calling (800) 225-1852. Information regarding how the Fund voted proxies relating to portfolio securities during the most recent 12-month period ended June 30 is available on the Fund’s website and on the Securities and Exchange Commission’s website. |
| TRUSTEES |
| Ellen S. Alberding • Kevin J. Bannon • Scott E. Benjamin • Linda W. Bynoe • Barry H. Evans • Keith F. Hartstein • Laurie Simon Hodrick • Michael S. Hyland • Stuart S. Parker • Richard A. Redeker • Stephen G. Stoneburn • Grace C. Torres |
| OFFICERS |
| Stuart S. Parker, President • Scott E. Benjamin, Vice President • M. Sadiq Peshimam, Treasurer and Principal Financial and Accounting Officer • Raymond A. O’Hara, Chief Legal Officer • Deborah A. Docs, Secretary • Chad A. Earnst, Chief Compliance Officer • Charles H. Smith, Anti-Money Laundering Compliance Officer • Jonathan D. Shain, Assistant Secretary • Claudia DiGiacomo, Assistant Secretary • Andrew R. French, Assistant Secretary • Peter Parrella, Assistant Treasurer • Lana Lomuti, Assistant Treasurer • Linda McMullin, Assistant Treasurer • Kelly A. Coyne, Assistant Treasurer |
| MANAGER | PGIM Investments LLC | 655 Broad Street Newark, NJ 07102 | ||
| ||||
| INVESTMENT SUBADVISER | PGIM Fixed Income | 655 Broad Street Newark, NJ 07102 | ||
| ||||
| DISTRIBUTOR | Prudential Investment Management Services LLC | 655 Broad Street Newark, NJ 07102 | ||
| ||||
| CUSTODIAN | The Bank of New York Mellon | 225 Liberty Street New York, NY 10286 | ||
| ||||
| TRANSFER AGENT | Prudential Mutual Fund Services LLC | PO Box 9658 Providence, RI 02940 | ||
| ||||
| INDEPENDENT REGISTERED PUBLIC ACCOUNTING FIRM | KPMG LLP | 345 Park Avenue New York, NY 10154 | ||
| ||||
| FUND COUNSEL | Willkie Farr & Gallagher LLP | 787 Seventh Avenue New York, NY 10019 | ||
| ||||
| An investor should consider the investment objectives, risks, charges, and expenses of the Fund carefully before investing. The prospectus and summary prospectus contain this and other information about the Fund. An investor may obtain a prospectus and summary prospectus by visiting our website at www.pgiminvestments.com or by calling (800) 225-1852. The prospectus and summary prospectus should be read carefully before investing. |
| E-DELIVERY |
| To receive your mutual fund documents online, go to www.pgiminvestments.com/edelivery and enroll. Instead of receiving printed documents by mail, you will receive notification via email when new materials are available. You can cancel your enrollment or change your email address at any time by visiting the website address above. |
| SHAREHOLDER COMMUNICATIONS WITH TRUSTEES |
| Shareholders can communicate directly with the Board of Trustees by writing to the Chair of the Board, Prudential Absolute Return Bond Fund, PGIM Investments, Attn: Board of Trustees, 655 Broad Street, Newark, NJ 07102. Shareholders can communicate directly with an individual Trustee by writing to the same address. Communications are not screened before being delivered to the addressee. |
| AVAILABILITY OF PORTFOLIO SCHEDULE |
| The Fund files its complete schedule of portfolio holdings with the Securities and Exchange Commission for the first and third quarters of each fiscal year on Form N-Q. The Fund’s Forms N-Q are available on the Commission’s website at www.sec.gov. The Fund’s Forms N-Q may also be reviewed and copied at the Commission’s Public Reference Room in Washington, D.C. Information on the operation and location of the Public Reference Room may be obtained by calling 1-800-SEC-0330. The Fund’s schedule of portfolio holdings is also available on the Fund’s website as of the end of each month no sooner than 15 days after the end of the month. |
| The Fund’s Statement of Additional Information contains additional information about the Fund’s Trustees and is available without charge, upon request, by calling (800) 225-1852. |
Mutual Funds:
| ARE NOT INSURED BY THE FDIC OR ANY FEDERAL GOVERNMENT AGENCY | MAY LOSE VALUE | ARE NOT A DEPOSIT OF OR GUARANTEED BY ANY BANK OR ANY BANK AFFILIATE |
PRUDENTIAL ABSOLUTE RETURN BOND FUND
| SHARE CLASS | A | C | Q | Z | ||||
| NASDAQ | PADAX | PADCX | PADQX | PADZX | ||||
| CUSIP | 74441J852 | 74441J845 | 74441J837 | 74441J829 |
MF213E

PRUDENTIAL QMA LARGE-CAP CORE EQUITY FUND
ANNUAL REPORT
OCTOBER 31, 2017

To enroll in e-delivery, go to pgiminvestments.com/edelivery
| Objective: Long-term growth of capital |
Highlights
| • | The Fund is comprised of a diversified portfolio of stocks that QMA identifies as attractive using a proprietary quantitative model. The model evaluates stocks with regard to quality, earnings expectations, and relative value. Our emphasis on these metrics vary based on the growth rate of the company QMA is evaluating. |
| • | Favoring companies with improving earnings prospects and good quality was particularly valuable over the trailing year, and was the primary driver of good performance over the S&P 500 across a majority of the sectors. |
This report is not authorized for distribution to prospective investors unless preceded or accompanied by a current prospectus.
The views expressed in this report and information about the Fund’s portfolio holdings are for the period covered by this report and are subject to change thereafter.
Mutual funds are distributed by Prudential Investment Management Services LLC, a Prudential Financial company and member SIPC. QMA is the primary business name of Quantitative Management Associates LLC, a wholly owned subsidiary of PGIM, Inc. (PGIM), a Prudential Financial company. © 2017 Prudential Financial, Inc. and its related entities. PGIM and the PGIM logo are service marks of Prudential Financial, Inc. and its related entities, registered in many jurisdictions worldwide.
| 2 | Visit our website at pgiminvestments.com |
PRUDENTIAL FUNDS — UPDATE
The Board of Directors/Trustees for the Fund has approved renaming the Fund’s Class Q shares as Class R6 shares, effective on or about June 15, 2018. The renaming of Class Q shares as Class R6 shares will not result in any changes to pricing, eligibility, or shareholder rights and obligations. The renamed Class R6 shares will not be exchangeable with Class R6 shares of the Prudential Day One Funds or the Prudential 60/40 Allocation Fund.
LR993
| Prudential QMA Large-Cap Core Equity Fund | 3 |
PRUDENTIAL FUNDS — UPDATE
Effective on or about June 1, 2018 (the “Effective Date”), the Fund’s Class A, Class C, Class R, and Class Z shares, as applicable, will be closed to investments by new group retirement plans, except as discussed below. Existing group retirement plans as of the Effective Date may keep their investments in their current share class and may continue to make additional purchases or exchanges of that class of shares. As of the Effective Date, all new group retirement plans wishing to add the Fund as a new addition to the plan generally will be into one of the available Class Q shares, Class R2 shares, or Class R4 shares of the Fund.
In addition, on or about the Effective Date, the Class R shares of the Fund will be closed to all new investors, except as discussed below. Due to the closing of the Class R shares to new investors, effective on or about the Effective Date new IRA investors may only purchase Class A, Class C, Class Z, or Class Q shares of the Fund, subject to share class eligibility. Following the Effective Date, no new accounts may be established in the Fund’s Class R shares and no Class R shares may be purchased or acquired by any new Class R shareholder, except as discussed below.
| Class A | Class C | Class Z | Class R | |||||
Existing Investors (Group Retirement Plans, IRAs, and all other investors) | No Change | No Change | No Change | No Change | ||||
| New Group Retirement Plans | Closed to group retirement plans wishing to add the share classes as new additions to plan menus on or about June 1, 2018, subject to certain exceptions below | |||||||
New IRAs | No Change | No Change | No Change | Closed to all new investors on or about June 1, 2018, subject to certain exceptions below | ||||
| All Other New Investors | No Change | No Change | No Change | |||||
| 4 | Visit our website at pgiminvestments.com |
However, the following new investors may continue to purchase Class A, Class C, Class R, and Class Z shares of the Fund, as applicable:
| • | Eligible group retirement plans who are exercising their one-time 90-day repurchase privilege in the Fund will be permitted to purchase such share classes. |
| • | Plan participants in a group retirement plan that offers Class A, Class C, Class R, or Class Z shares of the Fund as of the Effective Date will be permitted to purchase such share classes of the Fund, even if the plan participant did not own shares of that class of the Fund as of the Effective Date. |
| • | Certain new group retirement plans will be permitted to offer such share classes of the Fund after the Effective Date, provided that the plan has or is actively negotiating a contractual agreement with the Fund’s distributor or service provider to offer such share classes of the Fund prior to or on the Effective Date. |
| • | New group retirement plans that combine with, replace, or are otherwise affiliated with a current plan that invests in such share classes prior to or on the Effective Date will be permitted to purchase such share classes. |
The Fund also reserves the right to refuse any purchase order that might disrupt management of the Fund or to otherwise modify the closure policy at any time on a case-by-case basis.
| Prudential QMA Large-Cap Core Equity Fund | 5 |
This Page Intentionally Left Blank
| 6 | Visit our website at pgiminvestments.com |
Letter from the President

Dear Shareholder:
We hope you find the annual report for the Prudential QMA Large-Cap Core Equity Fund informative and useful. The report covers performance for the 12-month period ended October 31, 2017.
Significant events during the reporting period included a new US president, followed by uncertainty in Congress over implementing the Trump administration’s policy initiatives. Elsewhere, Britain began its formal legal process to leave the European Union. France elected a more centrist president, which was viewed as a pro-euro referendum. North Korea’s missile launches escalated geopolitical tensions. Also, late in the period, a series of hurricanes caused damage in the US and the Caribbean.
Despite some turbulence in the macro-environment, solid economic fundamentals in the US economy included moderate gross domestic product expansion, robust employment, and accelerating corporate profit growth. Inflation remained tame. The Federal Reserve raised its federal funds rate twice in 2017, and is in the process of winding down its stimulus program.
Global economic growth remained mostly positive. Equities in the US reached new highs amid low volatility, while international equities posted strong gains. European stocks continued to gain. Asian markets were solid, and emerging markets outperformed most regions. Fixed income markets were mixed. High yield and emerging markets bonds were the top performers.
Given the uncertainty in today’s investment environment, we believe that active professional portfolio management offers a potential advantage. Active managers often have the knowledge and flexibility to find the best investment opportunities in the most challenging markets.
Even so, it’s best if investment decisions are based on your long-term goals rather than on short-term market and economic developments. We also encourage you to work with an experienced financial advisor who can help you set goals, determine your tolerance for risk, and build a diversified plan that’s right for you and make adjustments when necessary.
At PGIM Investments, we consider it a great privilege and responsibility to help investors participate in opportunities across global markets while meeting their toughest investment challenges. We’re part of PGIM, a top-10 global investment manager with more than $1 trillion in assets under management. This investment expertise allows us to deliver actively managed funds and strategies to meet the needs of investors around the globe.
Thank you for choosing our family of funds.
Sincerely,

Stuart S. Parker, President
Prudential QMA Large-Cap Core Equity Fund
December 15, 2017
| Prudential QMA Large-Cap Core Equity Fund | 7 |
Your Fund’s Performance (unaudited)
Performance data quoted represents past performance. Past performance does not guarantee future results. The investment return and principal value of an investment will fluctuate, so that an investor’s shares, when redeemed, may be worth more or less than their original cost. Current performance may be lower or higher than the past performance data quoted. An investor may obtain performance data as of the most recent month-end by visiting our website at www.pgiminvestments.com or by calling (800) 225-1852.
| Average Annual Total Returns as of 10/31/17 (with sales charges) | ||||||||
| One Year (%) | Five Years (%) | Ten Years (%) | Since Inception (%) | |||||
| Class A | 17.87 | 13.49 | 5.99 | — | ||||
| Class B | 18.75 | 13.79 | 5.80 | — | ||||
| Class C | 22.80 | 13.91 | 5.81 | — | ||||
| Class Q | N/A | N/A | N/A | 17.12* (12/28/16) | ||||
| Class Z | 24.93 | 15.05 | 6.85 | — | ||||
| S&P 500 Index | 23.61 | 15.17 | 7.51 | — | ||||
| Lipper Large-Cap Core Funds Average | 22.24 | 13.73 | 6.58 | — | ||||
| Average Annual Total Returns as of 10/31/17 (without sales charges) | ||||||||
| One Year (%) | Five Years (%) | Ten Years (%) | Since Inception (%) | |||||
| Class A | 24.73 | 14.78 | 6.59 | — | ||||
| Class B | 23.75 | 13.91 | 5.80 | — | ||||
| Class C | 23.80 | 13.91 | 5.81 | — | ||||
| Class Q | N/A | N/A | N/A | 17.12* (12/28/16) | ||||
| Class Z | 24.93 | 15.05 | 6.85 | — | ||||
| S&P 500 Index | 23.61 | 15.17 | 7.51 | — | ||||
| Lipper Large-Cap Core Funds Average | 22.24 | 13.73 | 6.58 | — | ||||
*Not annualized
| 8 | Visit our website at pgiminvestments.com |
Growth of a $10,000 Investment

The graph compares a $10,000 investment in the Prudential QMA Large-Cap Core Equity Fund (Class Z shares) with a similar investment in the S&P 500 Index by portraying the initial account values at the beginning of the 10-year period for Class Z shares (October 31, 2007) and the account values at the end of the current fiscal year (October 31, 2017) as measured on a quarterly basis. For purposes of the graph, and unless otherwise indicated, it has been assumed that (a) all recurring fees (including management fees) were deducted; and (b) all dividends and distributions were reinvested. The line graph provides information for Class Z shares only. As indicated in the tables provided earlier, performance for Class A, Class B, Class C, and Class Q shares will vary due to the differing charges and expenses applicable to each share class (as indicated in the following paragraphs). Without waiver of fees and/or expense reimbursements, if any, the Fund’s returns would have been lower.
Past performance does not predict future performance. Total returns and the ending account values in the graph include changes in share price and reinvestment of dividends and capital gains distributions in a hypothetical investment for the periods shown. The Fund’s total returns do not reflect the deduction of income taxes on an individual’s investment. Taxes may reduce your actual investment returns on income or gains paid by the Fund or any gains you may realize if you sell your shares.
Source: PGIM Investments LLC and Lipper Inc.
Since Inception returns are provided for any share class with less than 10 fiscal years of returns. Since Inception returns for the Index and the Lipper Average are measured from the closest month-end to the Fund’s inception date.
| Prudential QMA Large-Cap Core Equity Fund | 9 |
Your Fund’s Performance (continued)
The returns in the tables do not reflect the deduction of taxes that a shareholder would pay on Fund distributions or following the redemption of Fund shares. The average annual total returns take into account applicable sales charges, which are described for each share class in the table below.
| Class A* | Class B** | Class C* | Class Q | Class Z* | ||||||
| Maximum initial sales charge | 5.50% of the public offering price | None | None | None | None | |||||
| Contingent deferred sales charge (CDSC) (as a percentage of the lower of original purchase price or net asset value at redemption) | 1.00% on sales of $1 million or more made within 12 months of purchase | 5.00% (Yr. 1) 4.00% (Yr. 2) 3.00% (Yr. 3) 2.00% (Yr. 4) 1.00% (Yr. 5) 1.00% (Yr. 6) 0.00% (Yr. 7) | 1.00% on sales made within 12 months of purchase | None | None | |||||
| Annual distribution and service (12b-1) fees (shown as a percentage of average daily net assets) | 0.30% (0.25% currently) | 1.00% | 1.00% | None | None |
*Certain share classes will be generally closed to investments by new group retirement plans effective on or about June 1, 2018. Please see the “PRUDENTIAL FUNDS—UPDATE” on page 4 of this report for more information.
**Class B shares are closed to all purchase activity and no additional Class B shares may be purchased or acquired except by exchange from Class B shares of another Fund or through dividend or capital gains reinvestment.
Benchmark Definitions
S&P 500 Index—The Standard & Poor’s 500 Composite Stock Price Index (S&P 500 Index) is an unmanaged index of over 500 stocks of large US public companies. It gives a broad look at how stock prices in the United States have performed. The cumulative total return for the Index measured from the month-end closest to the inception date of the Fund’s Class Q shares through 10/31/17 is 16.89%.
Lipper Large-Cap Core Funds Average—The Lipper Large-Cap Core Funds Average (Lipper Average) is based on the average return of all funds in the Lipper Large-Cap Core Funds universe for the periods noted. Funds in the Lipper Average invest at least 75% of their equity assets in companies with market capitalizations (on a three-year weighted basis) greater than 300% of the dollar-weighted median market capitalization of the middle 1,000 securities of the S&P SuperComposite 1500 Index. Large-cap core funds have wide latitude in the companies in which they invest. These funds typically have a below-average price-to-earnings ratio, price-to-book ratio, and three-year sales-per-share-growth value compared with the S&P 500 Index. The cumulative total return for the Lipper Average measured from the month-end closest to the inception date of the Fund’s Class Q shares through 10/31/17 is 15.86%.
| 10 | Visit our website at pgiminvestments.com |
Investors cannot invest directly in an index or average. The returns for the Index would be lower if they included the effects of sales charges, operating expenses of a mutual fund, or taxes. Returns for the Lipper Average reflect the deduction of operating expenses of a mutual fund, but not sales charges or taxes.
Presentation of Fund Holdings
| Five Largest Holdings expressed as a percentage of net assets as of 10/31/17 (%) | ||||
Apple, Inc., Technology Hardware, Storage & Peripherals | 3.7 | |||
Facebook, Inc., (Class A Stock), Internet Software & Services | 2.3 | |||
JPMorgan Chase & Co., Banks | 2.2 | |||
Alphabet, Inc., (Class C Stock), Internet Software & Services | 1.9 | |||
Microsoft Corp., Software | 1.7 | |||
Holdings reflect only long-term investments and are subject to change.
| Five Largest Industries expressed as a percentage of net assets as of 10/31/17 (%) | ||||
Banks | 7.1 | |||
Software | 6.0 | |||
Oil, Gas & Consumable Fuels | 5.8 | |||
Internet Software & Services | 5.6 | |||
Semiconductors & Semiconductor Equipment | 4.7 | |||
Industry weightings reflect only long-term investments and are subject to change.
| Prudential QMA Large-Cap Core Equity Fund | 11 |
Strategy and Performance Overview
How did the Fund perform?
For the 12-month period ended October 31, 2017, the Prudential QMA Large-Cap Core Equity Fund’s class Z shares returned 24.93% versus the 23.61% return of the S&P 500 Index. The Fund outperformed the 22.24% Lipper Large-Cap Core Funds Average over the period1.
What were the market conditions?
| • | In November 2016, after the reporting period began, the US election resulted in an upset Republican sweep. US stocks, especially financials, surged on optimism about President-Elect Donald Trump’s growth-friendly agenda. International stocks experienced lackluster performance, especially in Europe, which was fraught with political uncertainty. Meanwhile, fixed income investors appeared to believe the new US political landscape could lead to a stronger US economy, as evidenced by the rise in Treasury yields and the narrowing of credit spreads (yield differentials between corporate bonds and US Treasuries of comparable maturity). In December, the Federal Reserve (Fed) raised short-term interest rates and said it expected to hike rates three times in 2017. |
| • | In the first quarter of 2017, US stocks soared in anticipation of policies by the new administration that could result in a more business-friendly market environment. However, in March, a failed attempt to repeal and replace the Affordable Care Act soured investor enthusiasm and US stocks gave up some of their gains. International stocks rose significantly, supported by a strengthening global economy. The fixed income market was buoyed by expectations of stimulative policies from the new administration and a modest upswing in US economic growth and inflation. In March, the Fed once again raised short-term interest rates. |
| • | Heading into the second quarter, Washington, DC was bogged down in political intrigue, hearings, and investigations, as well as normal legislative challenges, rather than previously anticipated broad health care reform and fast-tracked stimulative fiscal policy. Nevertheless, US stocks advanced amid higher corporate earnings growth and sound economic fundamentals. International stocks also posted significant gains. European stocks continued their run, even as the UK began its formal legal process to leave the European Union. In the bond market, the political turmoil in Washington, DC, combined with modestly softer economic data, led to a modest decline in long-term US Treasury yields. The front, or short-term, end of the Treasury yield curve rose as the Fed implemented another rate hike in June and set the stage to start tapering its balance sheet by the end of 2017. |
| 1 | Effective June 6, 2017, the Fund’s investment objective and investment strategies were changed. The Fund’s performance prior to June 6, 2017 is based on its former investment objective and strategies. |
| 12 | Visit our website at pgiminvestments.com |
| • | During the third quarter, US stocks marched to record highs, though they experienced some volatility in August amid geopolitical tensions in Asia. Gains were driven by robust second-quarter earnings, a solid labor market, a strengthening economy, and expectations for a business-friendly tax agenda from the Trump administration. International equities recorded double-digit gains, fueled by strong performance in Europe and the Pacific region. In the bond market, volatility remained near historic lows. Treasury yields were relatively stable, which along with improving global growth, sustained investors’ search for yield. Near the end of the reporting period in the fourth quarter, equities powered forward, and the Fed provided information on how it planned to reduce its balance sheet. |
What worked?
| • | The Fund is comprised of a diversified portfolio of stocks that QMA identifies as attractive using a proprietary quantitative model. The model evaluates stocks with regard to quality, earnings expectations, and relative value. The emphasis on these metrics vary based on the growth rate of the company under evaluation. |
| • | Favoring companies with improving earnings prospects and good quality was particularly valuable over the trailing year, and was the primary driver of good performance over the S&P 500 across a majority of the sectors. |
| • | The Fund’s sector weights are established from bottom-up stock selection, and limits are placed on how much the Fund’s sector weights can differ from the S&P 500. That said, a modest underweight of the telecommunication and real estate sectors was a positive for the Fund. |
What didn’t work?
| • | QMA favors stocks that are inexpensive relative to industry peers. Over the trailing year, this relative value strategy was not profitable. In general, stocks that were more expensive based on measures like forward price-to-earnings, price-to-book, and price-to-sales lagged those that were more reasonably priced. |
| • | Stock selection in the technology and consumer discretionary sectors lagged the S&P 500. This was driven primarily by Internet-related companies. The Fund avoided some companies that, despite their prospects for reasonable growth, were very expensive relative to peers. Those expensive stocks continued to do well through the year, but the Fund did not hold them. |
Did the Fund hold derivatives and how did they affect performance?
| • | The Fund held futures contracts on the S&P 500 Index. QMA uses these instruments primarily to manage daily cash flows, provide liquidity, and equitize cash, and not as a means of adding to performance. Subsequently, the effect on performance was minimal. |
| Prudential QMA Large-Cap Core Equity Fund | 13 |
Strategy and Performance Overview (continued)
The percentage points shown in the tables below identify each security’s positive or negative contribution to the Fund’s return relative to the benchmark, which is the sum of all contributions by individual holdings.
| Top Contributors (%) | Top Detractors (%) | |||||
| Apple Inc. | 1.66 | QUALCOMM Inc. | –0.22 | |||
| Bank of America Corporation | 1.00 | Allergan plc | –0.21 | |||
| JPMorgan Chase & Co. | 0.98 | Akamai Technologies, Inc. | –0.18 | |||
| Facebook, Inc. Class A | 0.68 | CVS Health Corporation | –0.15 | |||
| UnitedHealth Group Incorporated | 0.65 | Newmont Mining Corporation | –0.15 | |||
Current outlook
The current US economic expansion is one of the longest in history, lasting eight years. At this time, QMA does not see warning signs that a recession is imminent. This bodes well for the US stock market, which can continue to advance on solid earnings growth. QMA does, however, believe the extremely low volatility environment will not persist as various risks, including geopolitical, could disrupt the positive market backdrop. Within equities, the enthusiasm for fast-growing stocks at any price has left an imbalance, and an opportunity, for value stocks to rebound. Timing of such a reversal, however, is notoriously hard to predict.
Faced with increased uncertainty, the Fund is well positioned to navigate such an environment. The Fund maintains a balance of both growth and value stocks. This diversified exposure helps ensure stock selection will be effective in different market environments. The Fund also focuses on managing unintended exposures in the portfolio, which can decrease macro exposures and mitigate the impact of exogenous shocks. Overall, uncertainty can produce attractive opportunities for active investors. When uncertainty increases, prices are more likely to become dislocated from fundamentals. The Fund is well placed to exploit such opportunities while simultaneously managing the associated increased risks.
| 14 | Visit our website at pgiminvestments.com |
Fees and Expenses (unaudited)
As a shareholder of the Fund, you incur two types of costs: (1) transaction costs, including sales charges (loads) on purchase payments and redemptions, as applicable, and (2) ongoing costs, including management fees, distribution, and/or service (12b-1) fees, and other Fund expenses, as applicable. This example is intended to help you understand your ongoing costs (in dollars) of investing in the Fund and to compare these costs with the ongoing costs of investing in other mutual funds.
The example is based on an investment of $1,000 held through the six-month period ended October 31, 2017. The example is for illustrative purposes only; you should consult the Prospectus for information on initial and subsequent minimum investment requirements.
Actual Expenses
The first line for each share class in the table on the following page provides information about actual account values and actual expenses. You may use the information on this line, together with the amount you invested, to estimate the expenses that you paid over the period. Simply divide your account value by $1,000 (for example, an $8,600 account value ÷ $1,000 = 8.6), then multiply the result by the number on the first line under the heading “Expenses Paid During the Six-Month Period” to estimate the expenses you paid on your account during this period.
Hypothetical Example for Comparison Purposes
The second line for each share class in the table on the following page provides information about hypothetical account values and hypothetical expenses based on the Fund’s actual expense ratio and an assumed rate of return of 5% per year before expenses, which is not the Fund’s actual return. The hypothetical account values and expenses may not be used to estimate the actual ending account balance or expenses you paid for the period. You may use this information to compare the ongoing costs of investing in the Fund and other funds. To do so, compare this 5% hypothetical example with the 5% hypothetical examples that appear in the shareholder reports of the other funds.
The Fund’s transfer agent may charge additional fees to holders of certain accounts that are not included in the expenses shown in the table on the following page. These fees apply to individual retirement accounts (IRAs) and Section 403(b) accounts. As of the close of the six-month period covered by the table, IRA fees included an annual maintenance fee of $15 per account (subject to a maximum annual maintenance fee of $25 for all accounts held by the same shareholder). Section 403(b) accounts are charged an annual $25 fiduciary maintenance fee. Some of the fees may vary in amount, or may be waived, based on your total account balance or the number of Prudential funds, including the Fund, that you own. You should consider the additional fees that were charged to your Fund account over the six-month period when you estimate the total ongoing expenses paid over the
| Prudential QMA Large-Cap Core Equity Fund | 15 |
Fees and Expenses (continued)
period and the impact of these fees on your ending account value, as these additional expenses are not reflected in the information provided in the expense table. Additional fees have the effect of reducing investment returns.
Please note that the expenses shown in the table are meant to highlight your ongoing costs only and do not reflect any transactional costs such as sales charges (loads). Therefore, the second line for each share class in the table is useful in comparing ongoing costs only and will not help you determine the relative total costs of owning different funds. In addition, if these transactional costs were included, your costs would have been higher.
| Prudential QMA Large-Cap Core Equity Fund | Beginning Account Value May 1, 2017 | Ending Account Value October 31, 2017 | Annualized Expense Ratio Based on the Six-Month Period | Expenses Paid During the Six-Month Period* | ||||||||||||||
| Class A | Actual | $ | 1,000.00 | $ | 1,104.60 | 0.73 | % | $ | 3.87 | |||||||||
| Hypothetical | $ | 1,000.00 | $ | 1,021.53 | 0.73 | % | $ | 3.72 | ||||||||||
| Class B | Actual | $ | 1,000.00 | $ | 1,100.50 | 1.48 | % | $ | 7.84 | |||||||||
| Hypothetical | $ | 1,000.00 | $ | 1,017.74 | 1.48 | % | $ | 7.53 | ||||||||||
| Class C | Actual | $ | 1,000.00 | $ | 1,101.00 | 1.48 | % | $ | 7.84 | |||||||||
| Hypothetical | $ | 1,000.00 | $ | 1,017.74 | 1.48 | % | $ | 7.53 | ||||||||||
| Class Q | Actual | $ | 1,000.00 | $ | 1,106.50 | 0.35 | % | $ | 1.86 | |||||||||
| Hypothetical | $ | 1,000.00 | $ | 1,023.44 | 0.35 | % | $ | 1.79 | ||||||||||
| Class Z | Actual | $ | 1,000.00 | $ | 1,106.00 | 0.48 | % | $ | 2.55 | |||||||||
| Hypothetical | $ | 1,000.00 | $ | 1,022.79 | 0.48 | % | $ | 2.45 | ||||||||||
*Fund expenses (net of fee waivers or subsidies, if any) for each share class are equal to the annualized expense ratio for each share class (provided in the table), multiplied by the average account value over the period, multiplied by the 184 days in the six-month period ended October 31, 2017, and divided by the 365 days in the Fund’s fiscal year ended October 31, 2017 (to reflect the six-month period). Expenses presented in the table include the expenses of any underlying funds in which the Fund may invest.
| 16 | Visit our website at pgiminvestments.com |
Schedule of Investments
as of October 31, 2017
| Description | Shares | Value | ||||||
LONG-TERM INVESTMENTS 97.5% | ||||||||
COMMON STOCKS | ||||||||
CONSUMER DISCRETIONARY 11.8% | ||||||||
Auto Components 0.9% | ||||||||
Adient PLC | 6,000 | $ | 506,160 | |||||
BorgWarner, Inc. | 21,700 | 1,144,024 | ||||||
Cooper-Standard Holdings, Inc.* | 1,000 | 111,480 | ||||||
Delphi Automotive PLC | 4,500 | 447,210 | ||||||
Tenneco, Inc. | 3,500 | 203,385 | ||||||
|
| |||||||
| 2,412,259 | ||||||||
Automobiles ��1.1% | ||||||||
General Motors Co. | 48,700 | 2,093,126 | ||||||
Thor Industries, Inc. | 4,900 | 667,478 | ||||||
|
| |||||||
| 2,760,604 | ||||||||
Distributors 0.5% | ||||||||
LKQ Corp.* | 33,000 | 1,243,770 | ||||||
Diversified Consumer Services 0.1% | ||||||||
Grand Canyon Education, Inc.* | 1,600 | 143,216 | ||||||
Hotels, Restaurants & Leisure 2.4% | ||||||||
Biglari Holdings, Inc.* | 200 | 71,488 | ||||||
Hilton Grand Vacations, Inc.* | 3,600 | 147,456 | ||||||
Hilton Worldwide Holdings, Inc. | 3,000 | 216,840 | ||||||
Las Vegas Sands Corp. | 14,000 | 887,320 | ||||||
McDonald’s Corp. | 20,600 | 3,438,346 | ||||||
Yum China Holdings, Inc.* | 9,900 | 399,465 | ||||||
Yum! Brands, Inc. | 16,800 | 1,250,760 | ||||||
|
| |||||||
| 6,411,675 | ||||||||
Household Durables 0.4% | ||||||||
NVR, Inc.* | 240 | 787,529 | ||||||
Taylor Morrison Home Corp., (Class A Stock)* | 9,100 | 219,765 | ||||||
|
| |||||||
| 1,007,294 | ||||||||
Internet & Direct Marketing Retail 2.0% | ||||||||
Amazon.com, Inc.* | 2,000 | 2,210,560 | ||||||
FTD Cos., Inc.* | 11,300 | 122,040 | ||||||
Liberty Interactive Corp. QVC Group, (Class A Stock)* | 56,700 | 1,288,224 | ||||||
Netflix, Inc.* | 900 | 176,787 | ||||||
See Notes to Financial Statements.
| Prudential QMA Large-Cap Core Equity Fund | 17 |
Schedule of Investments (continued)
as of October 31, 2017
| Description | Shares | Value | ||||||
CONSUMER DISCRETIONARY (Continued) | ||||||||
Internet & Direct Marketing Retail (cont’d.) | ||||||||
Nutrisystem, Inc. | 10,300 | $ | 514,485 | |||||
PetMed Express, Inc. | 8,800 | 311,168 | ||||||
Priceline Group, Inc. (The)* | 290 | 554,468 | ||||||
|
| |||||||
| 5,177,732 | ||||||||
Media 1.9% | ||||||||
Comcast Corp., (Class A Stock) | 83,800 | 3,019,314 | ||||||
Discovery Communications, Inc., (Class C Stock)* | 30,800 | 548,548 | ||||||
Sinclair Broadcast Group, Inc., (Class A Stock) | 4,900 | 155,330 | ||||||
TEGNA, Inc. | 16,400 | 200,572 | ||||||
Twenty-First Century Fox, Inc., (Class A Stock) | 11,700 | 305,955 | ||||||
Twenty-First Century Fox, Inc., (Class B Stock) | 28,300 | 720,235 | ||||||
|
| |||||||
| 4,949,954 | ||||||||
Multiline Retail 0.4% | ||||||||
Macy’s, Inc. | 63,100 | 1,183,756 | ||||||
Specialty Retail 1.4% | ||||||||
Burlington Stores, Inc.* | 4,700 | 441,283 | ||||||
Dick’s Sporting Goods, Inc. | 6,000 | 146,820 | ||||||
Foot Locker, Inc. | 17,500 | 526,400 | ||||||
Gap, Inc. (The) | 32,000 | 831,680 | ||||||
Ross Stores, Inc. | 28,000 | 1,777,720 | ||||||
Tilly’s, Inc., (Class A Stock) | 4,800 | 57,168 | ||||||
|
| |||||||
| 3,781,071 | ||||||||
Textiles, Apparel & Luxury Goods 0.7% | ||||||||
Lululemon Athletica, Inc.* | 9,100 | 559,741 | ||||||
PVH Corp. | 7,000 | 887,670 | ||||||
Wolverine World Wide, Inc. | 10,900 | 297,570 | ||||||
|
| |||||||
| 1,744,981 | ||||||||
CONSUMER STAPLES 7.1% | ||||||||
Beverages 2.2% | ||||||||
Coca-Cola Co. (The) | 27,300 | 1,255,254 | ||||||
Constellation Brands, Inc., (Class A Stock) | 6,200 | 1,358,358 | ||||||
PepsiCo, Inc. | 27,994 | 3,085,778 | ||||||
|
| |||||||
| 5,699,390 | ||||||||
See Notes to Financial Statements.
| 18 |
| Description | Shares | Value | ||||||
CONSUMER STAPLES (Continued) | ||||||||
Food & Staples Retailing 1.8% | ||||||||
CVS Health Corp. | 29,300 | $ | 2,007,929 | |||||
Performance Food Group Co.* | 4,600 | 130,180 | ||||||
Wal-Mart Stores, Inc. | 29,970 | 2,616,681 | ||||||
|
| |||||||
| 4,754,790 | ||||||||
Food Products 1.2% | ||||||||
Conagra Brands, Inc. | 14,600 | 498,736 | ||||||
Pilgrim’s Pride Corp.* | 7,800 | 247,884 | ||||||
Sanderson Farms, Inc. | 3,600 | 538,452 | ||||||
Tyson Foods, Inc., (Class A Stock) | 24,400 | 1,779,004 | ||||||
|
| |||||||
| 3,064,076 | ||||||||
Household Products 0.8% | ||||||||
Kimberly-Clark Corp. | 4,600 | 517,546 | ||||||
Procter & Gamble Co. (The) | 20,164 | 1,740,960 | ||||||
|
| |||||||
| 2,258,506 | ||||||||
Tobacco 1.1% | ||||||||
Altria Group, Inc. | 43,900 | 2,819,258 | ||||||
ENERGY 5.9% | ||||||||
Energy Equipment & Services 0.1% | ||||||||
Halliburton Co. | 9,100 | 388,934 | ||||||
Oil, Gas & Consumable Fuels 5.8% | ||||||||
Anadarko Petroleum Corp. | 24,200 | 1,194,754 | ||||||
Andeavor | 12,400 | 1,317,376 | ||||||
Chevron Corp. | 14,184 | 1,643,784 | ||||||
Devon Energy Corp. | 40,700 | 1,501,830 | ||||||
Exxon Mobil Corp. | 37,574 | 3,131,793 | ||||||
Kinder Morgan, Inc. | 90,900 | 1,646,199 | ||||||
Marathon Petroleum Corp. | 29,600 | 1,768,304 | ||||||
Newfield Exploration Co.* | 33,500 | 1,031,465 | ||||||
Phillips 66 | 200 | 18,216 | ||||||
Valero Energy Corp. | 23,500 | 1,853,915 | ||||||
|
| |||||||
| 15,107,636 | ||||||||
FINANCIALS 13.7% | ||||||||
Banks 7.1% | ||||||||
Bank of America Corp. | 161,768 | 4,430,825 | ||||||
Citigroup, Inc. | 46,700 | 3,432,450 | ||||||
See Notes to Financial Statements.
| Prudential QMA Large-Cap Core Equity Fund | 19 |
Schedule of Investments (continued)
as of October 31, 2017
| Description | Shares | Value | ||||||
FINANCIALS (Continued) | ||||||||
Banks (cont’d.) | ||||||||
JPMorgan Chase & Co. | 58,000 | $ | 5,835,380 | |||||
PNC Financial Services Group, Inc. (The) | 2,400 | 328,296 | ||||||
Popular, Inc. (Puerto Rico) | 2,600 | 95,368 | ||||||
Regions Financial Corp. | 20,100 | 311,148 | ||||||
Wells Fargo & Co. | 74,364 | 4,174,795 | ||||||
|
| |||||||
| 18,608,262 | ||||||||
Capital Markets 2.4% | ||||||||
Ameriprise Financial, Inc. | 10,600 | 1,659,324 | ||||||
Evercore, Inc., (Class A Stock) | 2,300 | 184,230 | ||||||
Invesco Ltd. | 28,100 | 1,005,699 | ||||||
Raymond James Financial, Inc. | 5,600 | 474,768 | ||||||
S&P Global, Inc. | 11,400 | 1,783,758 | ||||||
State Street Corp. | 4,300 | 395,600 | ||||||
T. Rowe Price Group, Inc. | 6,600 | 613,140 | ||||||
|
| |||||||
| 6,116,519 | ||||||||
Consumer Finance 1.3% | ||||||||
Capital One Financial Corp. | 21,000 | 1,935,780 | ||||||
Navient Corp. | 49,900 | 621,754 | ||||||
Nelnet, Inc., (Class A Stock) | 9,000 | 526,860 | ||||||
Synchrony Financial | 10,400 | 339,248 | ||||||
|
| |||||||
| 3,423,642 | ||||||||
Diversified Financial Services 0.9% | ||||||||
Berkshire Hathaway, Inc., (Class B Stock)* | 12,500 | 2,336,750 | ||||||
Insurance 1.9% | ||||||||
Aflac, Inc. | 19,600 | 1,644,244 | ||||||
American International Group, Inc. | 31,200 | 2,015,832 | ||||||
Assured Guaranty Ltd. | 4,100 | 152,110 | ||||||
Unum Group | 24,100 | 1,254,164 | ||||||
|
| |||||||
| 5,066,350 | ||||||||
Thrifts & Mortgage Finance 0.1% | ||||||||
Radian Group, Inc. | 8,100 | 169,776 | ||||||
HEALTH CARE 14.4% | ||||||||
Biotechnology 3.4% | ||||||||
AbbVie, Inc. | 36,100 | 3,258,025 | ||||||
Amgen, Inc. | 8,500 | 1,489,370 | ||||||
See Notes to Financial Statements.
| 20 |
| Description | Shares | Value | ||||||
HEALTH CARE (Continued) | ||||||||
Biotechnology (cont’d.) | ||||||||
Biogen, Inc.* | 3,900 | $ | 1,215,474 | |||||
Celgene Corp.* | 18,500 | 1,867,945 | ||||||
Gilead Sciences, Inc. | 13,400 | 1,004,464 | ||||||
|
| |||||||
| 8,835,278 | ||||||||
Health Care Equipment & Supplies 3.4% | ||||||||
Abbott Laboratories | 35,100 | 1,903,473 | ||||||
Baxter International, Inc. | 28,100 | 1,811,607 | ||||||
Boston Scientific Corp.* | 40,500 | 1,139,670 | ||||||
Danaher Corp. | 22,200 | 2,048,394 | ||||||
Medtronic PLC | 26,400 | 2,125,728 | ||||||
|
| |||||||
| 9,028,872 | ||||||||
Health Care Providers & Services 3.5% | ||||||||
Aetna, Inc. | 11,700 | 1,989,351 | ||||||
Anthem, Inc. | 10,300 | 2,154,863 | ||||||
Express Scripts Holding Co.* | 25,400 | 1,556,766 | ||||||
UnitedHealth Group, Inc. | 17,100 | 3,594,762 | ||||||
|
| |||||||
| 9,295,742 | ||||||||
Health Care Technology 0.1% | ||||||||
Cerner Corp.* | 3,400 | 229,568 | ||||||
Life Sciences Tools & Services 0.1% | ||||||||
Bruker Corp. | 2,800 | 87,920 | ||||||
Thermo Fisher Scientific, Inc. | 700 | 135,681 | ||||||
|
| |||||||
| 223,601 | ||||||||
Pharmaceuticals 3.9% | ||||||||
Allergan PLC | 9,900 | 1,754,577 | ||||||
Bristol-Myers Squibb Co. | 14,200 | 875,572 | ||||||
Corcept Therapeutics, Inc.* | 6,500 | 127,985 | ||||||
Johnson & Johnson | 21,699 | 3,025,058 | ||||||
Mallinckrodt PLC* | 11,800 | 373,706 | ||||||
Merck & Co., Inc. | 4,900 | 269,941 | ||||||
Pfizer, Inc. | 67,134 | 2,353,718 | ||||||
Zoetis, Inc. | 20,700 | 1,321,074 | ||||||
|
| |||||||
| 10,101,631 | ||||||||
See Notes to Financial Statements.
| Prudential QMA Large-Cap Core Equity Fund | 21 |
Schedule of Investments (continued)
as of October 31, 2017
| Description | Shares | Value | ||||||
INDUSTRIALS 9.1% | ||||||||
Aerospace & Defense 2.7% | ||||||||
Huntington Ingalls Industries, Inc. | 1,900 | $ | 442,377 | |||||
Lockheed Martin Corp. | 7,100 | 2,187,936 | ||||||
Northrop Grumman Corp. | 8,400 | 2,482,452 | ||||||
Raytheon Co. | 6,900 | 1,243,380 | ||||||
Spirit AeroSystems Holdings, Inc., (Class A Stock) | 9,400 | 752,940 | ||||||
|
| |||||||
| 7,109,085 | ||||||||
Air Freight & Logistics 0.1% | ||||||||
United Parcel Service, Inc., (Class B Stock) | 1,600 | 188,048 | ||||||
Building Products 0.0% | ||||||||
Builders FirstSource, Inc.* | 5,300 | 95,506 | ||||||
Commercial Services & Supplies 0.1% | ||||||||
Steelcase, Inc., (Class A Stock) | 1,000 | 14,550 | ||||||
Waste Management, Inc. | 1,900 | 156,123 | ||||||
|
| |||||||
| 170,673 | ||||||||
Construction & Engineering 0.4% | ||||||||
Argan, Inc. | 1,200 | 82,500 | ||||||
EMCOR Group, Inc. | 4,300 | 346,193 | ||||||
MasTec, Inc.* | 11,500 | 500,825 | ||||||
Valmont Industries, Inc. | 600 | 95,340 | ||||||
|
| |||||||
| 1,024,858 | ||||||||
Electrical Equipment 0.8% | ||||||||
AMETEK, Inc. | 5,500 | 371,195 | ||||||
Emerson Electric Co. | 26,200 | 1,688,852 | ||||||
|
| |||||||
| 2,060,047 | ||||||||
Industrial Conglomerates 1.3% | ||||||||
General Electric Co. | 40,079 | 807,993 | ||||||
Honeywell International, Inc. | 17,700 | 2,551,632 | ||||||
|
| |||||||
| 3,359,625 | ||||||||
Machinery 2.1% | ||||||||
Cummins, Inc. | 9,100 | 1,609,608 | ||||||
Fortive Corp. | 6,700 | 484,142 | ||||||
Illinois Tool Works, Inc. | 4,700 | 735,644 | ||||||
Ingersoll-Rand PLC | 10,900 | 965,740 | ||||||
Kadant, Inc. | 900 | 102,240 | ||||||
See Notes to Financial Statements.
| 22 |
| Description | Shares | Value | ||||||
INDUSTRIALS (Continued) | ||||||||
Machinery (cont’d.) | ||||||||
Lincoln Electric Holdings, Inc. | 2,800 | $ | 256,676 | |||||
Lydall, Inc.* | 1,600 | 92,480 | ||||||
Oshkosh Corp. | 9,200 | 842,352 | ||||||
PACCAR, Inc. | 5,100 | 365,823 | ||||||
|
| |||||||
| 5,454,705 | ||||||||
Professional Services 0.1% | ||||||||
Insperity, Inc. | 2,300 | 218,270 | ||||||
Road & Rail 1.4% | ||||||||
Norfolk Southern Corp. | 12,900 | 1,695,318 | ||||||
Union Pacific Corp. | 18,200 | 2,107,378 | ||||||
|
| |||||||
| 3,802,696 | ||||||||
Trading Companies & Distributors 0.1% | ||||||||
Univar, Inc.* | 6,000 | 178,500 | ||||||
INFORMATION TECHNOLOGY 24.6% | ||||||||
Communications Equipment 0.3% | ||||||||
Juniper Networks, Inc. | 29,500 | 732,485 | ||||||
Internet Software & Services 5.6% | ||||||||
Alphabet, Inc., (Class C Stock)* | 4,777 | 4,856,489 | ||||||
Alphabet, Inc., (Class A Stock)* | 3,470 | 3,584,649 | ||||||
Etsy, Inc.* | 9,100 | 151,970 | ||||||
Facebook, Inc., (Class A Stock)* | 33,500 | 6,032,010 | ||||||
|
| |||||||
| 14,625,118 | ||||||||
IT Services 3.6% | ||||||||
Accenture PLC, (Class A Stock) | 16,800 | 2,391,648 | ||||||
Cognizant Technology Solutions Corp., (Class A Stock) | 24,800 | 1,876,616 | ||||||
DST Systems, Inc. | 4,500 | 263,790 | ||||||
First Data Corp., (Class A Stock)* | 500 | 8,905 | ||||||
Sykes Enterprises, Inc.* | 1,400 | 40,516 | ||||||
Total System Services, Inc. | 17,000 | 1,224,850 | ||||||
Visa, Inc., (Class A Stock) | 32,600 | 3,585,348 | ||||||
|
| |||||||
| 9,391,673 | ||||||||
Semiconductors & Semiconductor Equipment 4.7% | ||||||||
Advanced Energy Industries, Inc.* | 4,400 | 372,768 | ||||||
Applied Materials, Inc. | 47,200 | 2,663,496 | ||||||
Broadcom Ltd. | 10,100 | 2,665,491 | ||||||
See Notes to Financial Statements.
| Prudential QMA Large-Cap Core Equity Fund | 23 |
Schedule of Investments (continued)
as of October 31, 2017
| Description | Shares | Value | ||||||
INFORMATION TECHNOLOGY (Continued) | ||||||||
Semiconductors & Semiconductor Equipment (cont’d.) | ||||||||
Intel Corp. | 65,400 | $ | 2,975,046 | |||||
Micron Technology, Inc.* | 21,600 | 957,096 | ||||||
Texas Instruments, Inc. | 26,400 | 2,552,616 | ||||||
|
| |||||||
| 12,186,513 | ||||||||
Software 6.0% | ||||||||
Activision Blizzard, Inc. | 29,300 | 1,918,857 | ||||||
Adobe Systems, Inc.* | 14,800 | 2,592,368 | ||||||
Dell Technologies, Inc., (Class V Stock)* | 48 | 3,973 | ||||||
Electronic Arts, Inc.* | 14,200 | 1,698,320 | ||||||
Intuit, Inc. | 9,600 | 1,449,792 | ||||||
Microsoft Corp. | 54,900 | 4,566,582 | ||||||
Oracle Corp. | 60,600 | 3,084,540 | ||||||
salesforce.com, Inc.* | 3,600 | 368,424 | ||||||
Synopsys, Inc.* | 800 | 69,216 | ||||||
|
| |||||||
| 15,752,072 | ||||||||
Technology Hardware, Storage & Peripherals 4.4% | ||||||||
Apple, Inc. | 56,720 | 9,587,949 | ||||||
HP, Inc. | 83,300 | 1,795,115 | ||||||
Western Digital Corp. | 2,300 | 205,321 | ||||||
|
| |||||||
| 11,588,385 | ||||||||
MATERIALS 3.6% | ||||||||
Chemicals 2.1% | ||||||||
Air Products & Chemicals, Inc. | 10,700 | 1,705,901 | ||||||
Chemours Co. (The) | 31,100 | 1,760,571 | ||||||
Ingevity Corp.* | 1,400 | 99,722 | ||||||
LyondellBasell Industries NV, (Class A Stock) | 18,000 | 1,863,540 | ||||||
|
| |||||||
| 5,429,734 | ||||||||
Containers & Packaging 0.5% | ||||||||
Greif, Inc., (Class A Stock) | 4,300 | 238,779 | ||||||
Owens-Illinois, Inc.* | 12,100 | 289,069 | ||||||
WestRock Co. | 12,100 | 742,093 | ||||||
|
| |||||||
| 1,269,941 | ||||||||
Metals & Mining 0.9% | ||||||||
Alcoa Corp.* | 7,200 | 344,016 | ||||||
Freeport-McMoRan, Inc.* | 102,400 | 1,431,552 | ||||||
See Notes to Financial Statements.
| 24 |
| Description | Shares | Value | ||||||
MATERIALS (Continued) | ||||||||
Metals & Mining (cont’d.) | ||||||||
Southern Copper Corp. (Peru) | 8,700 | $ | 373,665 | |||||
Steel Dynamics, Inc. | 10,100 | 375,821 | ||||||
|
| |||||||
| 2,525,054 | ||||||||
Paper & Forest Products 0.1% | ||||||||
Louisiana-Pacific Corp.* | 9,900 | 269,082 | ||||||
REAL ESTATE 2.7% | ||||||||
Equity Real Estate Investment Trusts (REITs) 2.1% | ||||||||
Hospitality Properties Trust | 4,300 | 122,894 | ||||||
DDR Corp. | 17,800 | 136,526 | ||||||
Xenia Hotels & Resorts, Inc. | 59,300 | 1,290,368 | ||||||
GEO Group, Inc. (The) | 17,250 | 447,637 | ||||||
Prologis, Inc. | 23,300 | 1,504,714 | ||||||
American Tower Corp. | 14,000 | 2,011,380 | ||||||
CoreCivic, Inc. | 1,600 | 39,456 | ||||||
|
| |||||||
| 5,552,975 | ||||||||
Real Estate Management & Development 0.6% | ||||||||
CBRE Group, Inc., (Class A Stock)* | 37,100 | 1,458,772 | ||||||
TELECOMMUNICATIONS SERVICES 1.6% | ||||||||
Diversified Telecommunication Services 1.6% | ||||||||
AT&T, Inc. | 64,654 | 2,175,607 | ||||||
Verizon Communications, Inc. | 40,000 | 1,914,800 | ||||||
|
| |||||||
| 4,090,407 | ||||||||
Wireless Telecommunication Services 0.0% | ||||||||
Telephone & Data Systems, Inc. | 3,000 | 87,450 | ||||||
UTILITIES 3.0% |
| |||||||
Electric Utilities 1.2% |
| |||||||
Exelon Corp. | 42,400 | 1,704,904 | ||||||
PPL Corp. | 41,400 | 1,554,984 | ||||||
|
| |||||||
| 3,259,888 | ||||||||
Gas Utilities 0.3% |
| |||||||
Atmos Energy Corp. | 2,000 | 174,480 | ||||||
UGI Corp. | 11,600 | 555,176 | ||||||
|
| |||||||
| 729,656 | ||||||||
See Notes to Financial Statements.
| Prudential QMA Large-Cap Core Equity Fund | 25 |
Schedule of Investments (continued)
as of October 31, 2017
| Description | Shares | Value | ||||||
UTILITIES (Continued) |
| |||||||
Independent Power & Renewable Electricity Producers 0.8% | ||||||||
AES Corp. | 113,400 | $ | 1,205,442 | |||||
NRG Energy, Inc. | 30,100 | 752,500 | ||||||
|
| |||||||
| 1,957,942 | ||||||||
Multi-Utilities 0.7% | ||||||||
CenterPoint Energy, Inc. | 10,400 | 307,632 | ||||||
MDU Resources Group, Inc. | 12,300 | 336,405 | ||||||
NiSource, Inc. | 6,800 | 179,316 | ||||||
SCANA Corp. | 25,900 | 1,117,326 | ||||||
|
| |||||||
| 1,940,679 | ||||||||
|
| |||||||
TOTAL LONG-TERM INVESTMENTS | 254,854,732 | |||||||
|
| |||||||
SHORT-TERM INVESTMENTS 2.3% | ||||||||
AFFILIATED MUTUAL FUNDS 2.2% | ||||||||
Prudential Investment Portfolios 2 - | 5,787,229 | 5,787,229 | ||||||
Prudential Investment Portfolios 2 - | 170 | 170 | ||||||
|
| |||||||
TOTAL AFFILIATED MUTUAL FUNDS | 5,787,399 | |||||||
|
| |||||||
Principal | ||||||||
U.S. TREASURY OBLIGATION(k)(n) 0.1% | ||||||||
U.S. Treasury Bill, | 300 | 299,598 | ||||||
|
| |||||||
TOTAL SHORT-TERM INVESTMENTS |
| 6,086,997 | ||||||
|
| |||||||
TOTAL INVESTMENTS 99.8% | 260,941,729 | |||||||
Other assets in excess of liabilities(z) 0.2% | 580,471 | |||||||
|
| |||||||
NET ASSETS 100.0% | $ | 261,522,200 | ||||||
|
| |||||||
See Notes to Financial Statements.
| 26 |
The following abbreviation is used in the annual report:
LIBOR—London Interbank Offered Rate
| * | Non-income producing security. |
| # | Principal amount is shown in U.S. dollars unless otherwise stated. |
| (k) | Represents security, or a portion thereof, segregated as collateral for centrally cleared/exchanged-traded derivatives. |
| (n) | Rate shown reflects yield to maturity at purchase date. |
| (w) | PGIM Investments LLC, the manager of the Fund, also serves as manager of the Prudential Investment Portfolios 2 - Prudential Core Ultra Short Bond Fund and Prudential Institutional Money Market Fund. |
| (z) | Includes net unrealized appreciation (depreciation) on the following derivative contracts held at reporting period end: |
Futures contracts outstanding at October 31, 2017:
| Number of Contracts | Type | Expiration Date | Value at Trade Date | Current Notional Amount | Value / Unrealized Appreciation (Depreciation) | |||||||||||||||
| Long Positions: | ||||||||||||||||||||
| 47 | S&P 500 E-Mini Index | Dec. 2017 | $ | 5,954,037 | $ | 6,045,845 | $ | 91,808 | ||||||||||||
|
| |||||||||||||||||||
A security with a market value of $299,598 has been segregated with Goldman Sachs & Co. to cover requirements for open futures contracts at October 31, 2017.
Fair Value Measurements:
Various inputs are used in determining the value of the Fund’s investments. These inputs are summarized in the three broad levels listed below.
Level 1—unadjusted quoted prices generally in active markets for identical securities.
Level 2—quoted prices for similar securities, interest rates and yield curves, prepayment speeds, foreign currency exchange rates and other observable inputs.
Level 3—unobservable inputs for securities valued in accordance with Board approved fair valuation procedures.
The following is a summary of the inputs used as of October 31, 2017 in valuing such portfolio securities:
| Level 1 | Level 2 | Level 3 | ||||||||||
Investments in Securities | ||||||||||||
Common Stocks | ||||||||||||
Consumer Discretionary | $ | 30,816,312 | $ | — | $ | — | ||||||
Consumer Staples | 18,596,020 | — | — | |||||||||
Energy | 15,496,570 | — | — | |||||||||
See Notes to Financial Statements.
| Prudential QMA Large-Cap Core Equity Fund | 27 |
Schedule of Investments (continued)
as of October 31, 2017
| Level 1 | Level 2 | Level 3 | ||||||||||
Investments in Securities (continued) | ||||||||||||
Common Stocks (continued) | ||||||||||||
Financials | $ | 35,721,299 | $ | — | $ | — | ||||||
Health Care | 37,714,692 | — | — | |||||||||
Industrials | 23,662,013 | — | — | |||||||||
Information Technology | 64,276,246 | — | — | |||||||||
Materials | 9,493,811 | — | — | |||||||||
Real Estate | 7,011,747 | — | — | |||||||||
Telecommunications Services | 4,177,857 | — | — | |||||||||
Utilities | 7,888,165 | — | — | |||||||||
Affiliated Mutual Funds | 5,787,399 | — | — | |||||||||
U.S. Treasury Obligation | — | 299,598 | — | |||||||||
Other Financial Instruments* | ||||||||||||
Futures Contracts | 91,808 | — | — | |||||||||
|
|
|
|
|
| |||||||
Total | $ | 260,733,939 | $ | 299,598 | $ | — | ||||||
|
|
|
|
|
| |||||||
| * | Other financial instruments are derivative instruments not reflected in the Schedule of Investments, such as futures, forwards and centrally cleared swap contracts, which are recorded at the unrealized appreciation (depreciation) on the instrument, and OTC swap contracts which are recorded at fair value. |
During the period, there were no transfers between Level 1, Level 2 and Level 3 to report.
Industry Classification:
The industry classification of investments and other assets in excess of liabilities shown as a percentage of net assets as of October 31, 2017 were as follows (unaudited):
Information Technology | 24.6 | % | ||
Health Care | 14.4 | |||
Financials | 13.7 | |||
Consumer Discretionary | 11.8 | |||
Industrials | 9.1 | |||
Consumer Staples | 7.1 | |||
Energy | 5.9 | |||
Materials | 3.6 | |||
Utilities | 3.0 | |||
Real Estate | 2.7 | % | ||
Affiliated Mutual Funds | 2.2 | |||
Telecommunications Services | 1.6 | |||
U.S. Treasury Obligation | 0.1 | |||
|
| |||
| 99.8 | ||||
Other assets in excess of liabilities | 0.2 | |||
|
| |||
| 100.0 | % | |||
|
|
Effects of Derivative Instruments on the Financial Statements and Primary Underlying Risk Exposure:
The Fund invested in derivative instruments during the reporting period. The primary type of risk associated with these derivative instruments is equity contracts risk. The effect of
See Notes to Financial Statements.
| 28 |
such derivative instruments on the Fund’s financial position and financial performance as reflected in the Statement of Assets and Liabilities and Statement of Operations is presented in the summary below.
Fair values of derivative instruments as of October 31, 2017 as presented in the Statement of Assets and Liabilities:
Derivatives not accounted | Asset Derivatives | Liability Derivatives | ||||||||||
| Balance Sheet Location | Fair Value | Balance Sheet Location | Fair Value | |||||||||
| Equity contracts | Due from/to broker— variation margin futures | $ | 91,808 | * | — | $ | — | |||||
|
|
|
| |||||||||
| * | Includes cumulative appreciation (depreciation) as reported in the schedule of open futures contracts and centrally cleared swap contracts. Only unsettled variation margin receivable (payable) is reported within the Statement of Assets and Liabilities. |
The effects of derivative instruments on the Statement of Operations for the year ended October, 31, 2017 are as follows:
Amount of Realized Gain (Loss) on Derivatives Recognized in Income | ||||
Derivatives not accounted for as hedging | Futures | |||
Equity contracts | $ | 452,278 | ||
|
| |||
Change in Unrealized Appreciation (Depreciation) on Derivatives Recognized in Income | ||||
Derivatives not accounted for as hedging | Futures | |||
Equity contracts | $ | 111,040 | ||
|
| |||
For the year ended October 31, 2017, the Fund’s average volume of derivative activities is as follows:
| Futures Contracts— Long Positions(1) | ||||||
| $ | 5,019,138 | |||||
| (1) | Value at Trade Date. |
See Notes to Financial Statements.
| Prudential QMA Large-Cap Core Equity Fund | 29 |
Statement of Assets & Liabilities
as of October 31, 2017
Assets | ||||
Investments at value: | ||||
Unaffiliated investments (cost $182,694,630) | $ | 255,154,330 | ||
Affiliated investments (cost $5,787,399) | 5,787,399 | |||
Receivable for Fund shares sold | 1,168,281 | |||
Dividends receivable | 220,374 | |||
Due from broker—variation margin futures | 8,769 | |||
Tax reclaim receivable | 525 | |||
Prepaid expenses | 1,876 | |||
|
| |||
Total Assets | 262,341,554 | |||
|
| |||
Liabilities | ||||
Payable for Fund shares reacquired | 653,238 | |||
Distribution fee payable | 52,517 | |||
Accrued expenses and other liabilities | 50,826 | |||
Management fee payable | 42,203 | |||
Affiliated transfer agent fee payable | 20,570 | |||
|
| |||
Total Liabilities | 819,354 | |||
|
| |||
Net Assets | $ | 261,522,200 | ||
|
| |||
Net assets were comprised of: | ||||
Shares of beneficial interest, at par | $ | 14,258 | ||
Paid-in capital in excess of par | 152,475,798 | |||
|
| |||
| 152,490,056 | ||||
Undistributed net investment income | 2,178,899 | |||
Accumulated net realized gain on investment transactions | 34,301,737 | |||
Net unrealized appreciation on investments | 72,551,508 | |||
|
| |||
Net assets, October 31, 2017 | $ | 261,522,200 | ||
|
| |||
See Notes to Financial Statements.
| 30 |
Class A | ||||
Net asset value and redemption price per share | $ | 18.37 | ||
Maximum sales charge (5.50% of offering price) | 1.07 | |||
|
| |||
Maximum offering price to public | $ | 19.44 | ||
|
| |||
Class B | ||||
Net asset value, offering price and redemption price per share | ||||
($2,291,232 ÷ 135,842 shares of beneficial interest issued and outstanding) | $ | 16.87 | ||
|
| |||
Class C | ||||
Net asset value, offering price and redemption price per share | ||||
($31,517,830 ÷ 1,866,406 shares of beneficial interest issued and outstanding) | $ | 16.89 | ||
|
| |||
Class Q | ||||
Net asset value, offering price and redemption price per share | ||||
($58,304,428 ÷ 3,099,079 shares of beneficial interest issued and outstanding) | $ | 18.81 | ||
|
| |||
Class Z | ||||
Net asset value, offering price and redemption price per share | ||||
($56,065,766 ÷ 2,984,909 shares of beneficial interest issued and outstanding) | $ | 18.78 | ||
|
| |||
See Notes to Financial Statements.
| Prudential QMA Large-Cap Core Equity Fund | 31 |
Statement of Operations
Year Ended October 31, 2017
Net Investment Income (Loss) | ||||
Income | ||||
Unaffiliated dividend income | $ | 4,293,898 | ||
Affiliated dividend income | 35,315 | |||
Interest income | 2,209 | |||
Income from securities lending, net (including affiliated income of $286) | 898 | |||
|
| |||
Total income | 4,332,320 | |||
|
| |||
Expenses | ||||
Management fee | 860,823 | |||
Distribution fee—Class A | 305,550 | |||
Distribution fee—Class B | 23,109 | |||
Distribution fee—Class C | 346,953 | |||
Transfer agent’s fees and expenses (including affiliated expense of $105,500) | 254,000 | |||
Registration fees | 84,000 | |||
Custodian and accounting fees | 65,000 | |||
Shareholders’ reports | 42,000 | |||
Audit fee | 29,000 | |||
Legal fees and expenses | 26,000 | |||
Trustees’ fees | 13,000 | |||
Miscellaneous | 15,038 | |||
|
| |||
Total expenses | 2,064,473 | |||
Less: Management fee waiver and/or expense reimbursement | (245,019 | ) | ||
Distribution fee waiver-Class A | (50,926 | ) | ||
|
| |||
Net expenses | 1,768,528 | |||
|
| |||
Net investment income (loss) | 2,563,792 | |||
|
| |||
Realized And Unrealized Gain (Loss) On Investments | ||||
Net realized gain (loss) on: | ||||
Investment transactions (including affiliated of $(120)) | 33,958,049 | |||
Futures transactions | 452,278 | |||
|
| |||
| 34,410,327 | ||||
|
| |||
Net change in unrealized appreciation (depreciation) on: | ||||
Investments | 12,773,717 | |||
Futures | 111,040 | |||
|
| |||
| 12,884,757 | ||||
|
| |||
Net gain (loss) on investment transactions | 47,295,084 | |||
|
| |||
Net Increase (Decrease) In Net Assets Resulting From Operations | $ | 49,858,876 | ||
|
| |||
See Notes to Financial Statements.
| 32 |
Statement of Changes in Net Assets
| Year Ended October 31, | ||||||||
| 2017 | 2016 | |||||||
Increase (Decrease) in Net Assets | ||||||||
Operations | ||||||||
Net investment income (loss) | $ | 2,563,792 | $ | 1,769,071 | ||||
Net realized gain (loss) on investment transactions | 34,410,327 | 8,868,421 | ||||||
Net change in unrealized appreciation (depreciation) on investments | 12,884,757 | (4,644,002 | ) | |||||
|
|
|
| |||||
Net increase (decrease) in net assets resulting from operations | 49,858,876 | 5,993,490 | ||||||
|
|
|
| |||||
Dividends and Distributions | ||||||||
Dividends from net investment income | ||||||||
Class A | (856,818 | ) | (774,919 | ) | ||||
Class B | (6,885 | ) | (5,279 | ) | ||||
Class C | (126,338 | ) | (81,031 | ) | ||||
Class Z | (837,894 | ) | (852,298 | ) | ||||
|
|
|
| |||||
| (1,827,935 | ) | (1,713,527 | ) | |||||
|
|
|
| |||||
Distributions from net realized gains | ||||||||
Class A | (3,797,694 | ) | (4,028,233 | ) | ||||
Class B | (96,656 | ) | (123,545 | ) | ||||
Class C | (1,773,534 | ) | (1,896,176 | ) | ||||
Class Z | (2,963,939 | ) | (3,445,643 | ) | ||||
|
|
|
| |||||
| (8,631,823 | ) | (9,493,597 | ) | |||||
|
|
|
| |||||
Fund share transactions (Net of share conversions) | ||||||||
Net proceeds from shares sold | 59,068,734 | 26,627,981 | ||||||
Net asset value of shares issued in reinvestment of dividends and distributions | 10,162,081 | 10,951,763 | ||||||
Cost of shares reacquired | (49,132,723 | ) | (40,951,564 | ) | ||||
|
|
|
| |||||
Net increase (decrease) in net assets from Fund share transactions | 20,098,092 | (3,371,820 | ) | |||||
|
|
|
| |||||
Total increase (decrease) | 59,497,210 | (8,585,454 | ) | |||||
Net Assets: | ||||||||
Beginning of year | 202,024,990 | 210,610,444 | ||||||
|
|
|
| |||||
End of year(a) | $ | 261,522,200 | $ | 202,024,990 | ||||
|
|
|
| |||||
(a) Includes undistributed net investment income of: | $ | 2,178,899 | $ | 1,421,946 | ||||
|
|
|
| |||||
See Notes to Financial Statements.
| Prudential QMA Large-Cap Core Equity Fund | 33 |
Notes to Financial Statements
Prudential Investment Portfolios 9 (the “Trust”) is registered under the Investment Company Act of 1940, as amended (“1940 Act”), as an open-end management investment company. The Trust was established as a Delaware business trust on September 18, 1998. The Trust currently consists of five funds: Prudential Absolute Return Bond Fund and Prudential QMA Large-Cap Core Equity Fund which are diversified funds and Prudential International Bond Fund, Prudential Select Real Estate Fund and Prudential Real Estate Income Fund which are non-diversified funds. These financial statements relate to the Prudential QMA Large-Cap Core Equity Fund (the “Fund”).
The investment objective of the Fund is to seek long-term growth of capital.
1. Accounting Policies
The Fund follows investment company accounting and reporting guidance of the Financial Accounting Standards Board (“FASB”) Accounting Standard Codification Topic 946 Financial Services—Investment Companies. The following accounting policies conform to U.S. generally accepted accounting principles. The Fund consistently follows such policies in the preparation of its financial statements.
Securities Valuation: The Fund holds securities and other assets and liabilities that are fair valued at the close of each day (generally, 4:00 PM Eastern time) the New York Stock Exchange (“NYSE”) is open for trading. Fair value is the price that would be received to sell an asset or paid to transfer a liability in an orderly transaction between market participants on the measurement date. The Board of Trustees (the “Board”) has adopted valuation procedures for security valuation under which fair valuation responsibilities have been delegated to PGIM Investments LLC (“PGIM Investments” or “the Manager”) (formerly known as Prudential Investments LLC). Under the current valuation procedures, the Valuation Committee is responsible for supervising the valuation of portfolio securities and other assets and liabilities. The valuation procedures permit the Fund to utilize independent pricing vendor services, quotations from market makers, and alternative valuation methods when market quotations are either not readily available or not deemed representative of fair value. A record of the Valuation Committee’s actions is subject to the Board’s review, approval, and ratification at its next regularly scheduled quarterly meeting.
Various inputs determine how the Fund’s investments are valued, all of which are categorized according to the three broad levels (Level 1, 2, or 3) detailed in the Schedule of Investments.
Common and preferred stocks, exchange-traded funds, and derivative instruments, such as futures or options, that are traded on a national securities exchange are valued at the
| 34 |
last sale price as of the close of trading on the applicable exchange where the security principally trades. Securities traded via NASDAQ are valued at the NASDAQ official closing price. To the extent these securities are valued at the last sale price or NASDAQ official closing price, they are classified as Level 1 in the fair value hierarchy. In the event that no sale or official closing price on valuation date exists, these securities are generally valued at the mean between the last reported bid and ask prices, or at the last bid price in the absence of an ask price. These securities are classified as Level 2 in the fair value hierarchy.
Foreign equities traded on foreign securities exchanges are generally valued using pricing vendor services that provide model prices derived using adjustment factors based on information such as local closing price, relevant general and sector indices, currency fluctuations, depositary receipts, and futures, as applicable. Securities valued using such model prices are classified as Level 2 in the fair value hierarchy. The models generate an evaluated adjustment factor for each security, which is applied to the local closing price to adjust it for post closing market movements. Utilizing that evaluated adjustment factor, the vendor provides an evaluated price for each security. If the vendor does not provide an evaluated price, securities are valued in accordance with exchange-traded common and preferred stock valuation policies discussed above.
Investments in open-end, non-exchange-traded mutual funds are valued at their net asset values as of the close of the NYSE on the date of valuation. These securities are classified as Level 1 in the fair value hierarchy since they may be purchased or sold at their net asset values on the date of valuation.
Securities and other assets that cannot be priced according to the methods described above are valued based on pricing methodologies approved by the Board. In the event that unobservable inputs are used when determining such valuations, the securities will be classified as Level 3 in the fair value hierarchy.
When determining the fair value of securities, some of the factors influencing the valuation include: the nature of any restrictions on disposition of the securities; assessment of the general liquidity of the securities; the issuer’s financial condition and the markets in which it does business; the cost of the investment; the size of the holding and the capitalization of the issuer; the prices of any recent transactions or bids/offers for such securities or any comparable securities; any available analyst media or other reports or information deemed reliable by the investment manager regarding the issuer or the markets or industry in which it operates. Using fair value to price securities may result in a value that is different from a security’s most recent closing price and from the price used by other unaffiliated mutual funds to calculate their net asset values.
Restricted and Illiquid Securities: Subject to guidelines adopted by the Board, the Fund may invest up to 15% of its net assets in illiquid securities, including those which are restricted as to disposition under securities law (“restricted securities”). Restricted securities are valued pursuant to the valuation procedures noted above. Illiquid securities are those that, because of the absence of a readily available market or due to legal or
| Prudential QMA Large-Cap Core Equity Fund | 35 |
Notes to Financial Statements (continued)
contractual restrictions on resale, cannot be sold within seven days in the ordinary course of business at approximately the amount at which the Fund has valued the investment. Therefore, the Fund may find it difficult to sell illiquid securities at the time considered most advantageous by its Subadviser and may incur expenses that would not be incurred in the sale of securities that were freely marketable. Certain securities that would otherwise be considered illiquid because of legal restrictions on resale to the general public may be traded among qualified institutional buyers under Rule 144A of the Securities Act of 1933. These Rule 144A securities, as well as commercial paper that is sold in private placements under Section 4(2) of the Securities Act, may be deemed liquid by the Fund’s Subadviser under the guidelines adopted by the Trustees of the Fund. However, the liquidity of the Fund’s investments in Rule 144A securities could be impaired if trading does not develop or declines.
Financial Futures Contracts: A financial futures contract is an agreement to purchase (long) or sell (short) an agreed amount of securities at a set price for delivery on a future date. Upon entering into a financial futures contract, the Fund is required to pledge to the broker an amount of cash and/or other assets equal to a certain percentage of the contract amount. This amount is known as the “initial margin.” Subsequent payments, known as “variation margin,” are made or received by the Fund each day, depending on the daily fluctuations in the value of the underlying security. Such variation margin is recorded for financial statement purposes on a daily basis as unrealized gain (loss). When the contract expires or is closed, the gain (loss) is realized and is presented in the Statement of Operations as net realized gain (loss) on futures transactions.
The Fund invested in financial futures contracts in order to hedge its existing portfolio securities, or securities the Fund intends to purchase, against fluctuations in value caused by changes in value of equities. The use of futures transactions involves the risk of imperfect correlation in movements in the price of futures contracts and the underlying hedged assets. Since futures contracts are exchange-traded, there is minimal counterparty credit risk to the Fund since the exchanges’ clearinghouse acts as counterparty to all exchange-traded futures and guarantees the futures contracts against default.
Master Netting Arrangements: The Trust, on behalf of the Fund, is subject to various Master Agreements, or netting arrangements, with select counterparties. These are agreements which a subadviser may have negotiated and entered into on behalf of the Fund. A master netting arrangement between the Fund and the counterparty permits the Fund to offset amounts payable by the Fund to the same counterparty against amounts to be received; and by the receipt of collateral from the counterparty by the Fund to cover the Fund’s exposure to the counterparty. However, there is no assurance that such mitigating factors are easily enforceable. In addition to master netting arrangements, the right to set-off exists when all
| 36 |
the conditions are met such that each of the parties owes the other determinable amounts, the reporting party has the right to set-off the amount owed with the amount owed by the other party, the reporting party intends to set-off and the right of set-off is enforceable by law. During the reporting period, there was no intention to settle on a net basis and all amounts are presented on a gross basis on the Statement of Assets and Liabilities.
Securities Lending: The Fund may lend its portfolio securities to banks and broker-dealers. The loans are secured by collateral at least equal to the market value of the securities loaned. Collateral pledged by each borrower is invested in an affiliated money market fund and is marked to market daily, based on the previous day’s market value, such that the value of the collateral exceeds the value of the loaned securities. Loans are subject to termination at the option of the borrower or the Fund. Upon termination of the loan, the borrower will return to the Fund securities identical to the loaned securities. Should the borrower of the securities fail financially, the Fund has the right to repurchase the securities in the open market using the collateral. The Fund recognizes income, net of any rebate and securities lending agent fees, for lending its securities in the form of fees or interest on the investment of any cash received as collateral. The borrower receives all interest and dividends from the securities loaned and such payments are passed back to the lender in amounts equivalent thereto. The Fund also continues to recognize any unrealized gain (loss) in the market price of the securities loaned and on the change in the value of the collateral invested that may occur during the term of the loan. In addition, realized gain (loss) is recognized on changes in the value of the collateral invested upon liquidation of the collateral. Net earnings from securities lending are disclosed on the Statement of Operations as “Income from securities lending, net”.
Securities Transactions and Net Investment Income: Securities transactions are recorded on the trade date. Realized gains (losses) from investment and currency transactions are calculated on the specific identification method. Dividend income is recorded on the ex-date. Interest income, including amortization of premium and accretion of discount on debt securities, as required, is recorded on the accrual basis. Expenses are recorded on an accrual basis, which may require the use of certain estimates by management that may differ from actual.
Net investment income or loss (other than distribution fees which are charged directly to the respective class and transfer agency fees specific to Class Q shares which are charged to that share class) and unrealized and realized gains (losses) are allocated daily to each class of shares based upon the relative proportion of adjusted net assets of each class at the beginning of the day.
Taxes: It is the Fund’s policy to continue to meet the requirements of the Internal Revenue Code applicable to regulated investment companies and to distribute all of its taxable net investment income and capital gains, if any, to its shareholders. Therefore, no federal income tax provision is required. Withholding taxes on foreign dividends, interest and capital gains, if any, are recorded, net of reclaimable amounts, at the time the related income is earned.
| Prudential QMA Large-Cap Core Equity Fund | 37 |
Notes to Financial Statements (continued)
Dividends and Distributions: The Fund expects to pay dividends from net investment income and distributions from net realized capital gains, if any, annually. Dividends and distributions to shareholders, which are determined in accordance with federal income tax regulations and which may differ from generally accepted accounting principles, are recorded on the ex-date. Permanent book/tax differences relating to income and gain (loss) are reclassified amongst undistributed net investment income, accumulated net realized gain (loss) and paid-in capital in excess of par, as appropriate.
Estimates: The preparation of financial statements requires management to make estimates and assumptions that affect the reported amounts and disclosures in the financial statements. Actual results could differ from those estimates.
2. Agreements
The Trust, on behalf of the Fund, has a management agreement with PGIM Investments. Pursuant to this agreement, PGIM Investments has responsibility for all investment advisory services and supervises the subadviser’s performance of such services. PGIM Investments has entered into a subadvisory agreement with Quantitative Management Associates, LLC (“QMA”). The subadvisory agreement provides that QMA will furnish investment advisory services in connection with the management of the Fund. In connection therewith, QMA is obligated to keep certain books and records of the Fund. PGIM Investments pays for the services of QMA, the cost of compensation of officers of the Fund, occupancy and certain clerical and bookkeeping costs of the Fund. The Fund bears all other costs and expenses.
Effective December 9, 2016, the management fee paid to PGIM Investments is accrued daily and payable monthly at an annual rate of .35% of the Fund’s average daily net assets up to and including $5 billion and .34% of the Fund’s average daily net assets in excess of $5 billion. Prior to December 9, 2016, the management fee paid to PGIM investments was accrued daily and payable monthly at an annual rate of .65% of the Fund’s average daily net assets up to and including $500 million and .60% of the Fund’s average daily net assets in excess of $500 million. The effective management fee rate, before any waivers and/or expense reimbursement, was .38% for the year ended October 31, 2017. The effective management fee rate, net of waivers and/or expense reimbursement, was .27%.
Effective December 9, 2016, PGIM Investments has contractually agreed through February 28, 2019 to limit the net annual operating expenses (exclusive of distribution and service(12b-1) fees, transfer agency expenses (including sub-transfer agency and networking fees), taxes (such as income and foreign withholdings taxes, stamp duty and deferred tax expenses), interest, underlying funds, brokerage, extraordinary and certain other expenses such as dividend, broker charges and interest expense on short sales) of
| 38 |
each class of shares of the Fund to .35% of the Fund’s average daily net assets. Expenses waived/reimbursed by the Manager in accordance with this agreement may be recouped by the Manager within the same fiscal year during which such waiver/reimbursement is made if such recoupment can be realized without exceeding the expense limit in effect at the time of the recoupment for that fiscal year.
The Trust, on behalf of the Fund, has a distribution agreement with Prudential Investment Management Services LLC (“PIMS”), which acts as the distributor of the Class A, Class B, Class C shares, Class Q and Class Z of the Fund. The Fund compensates PIMS for distributing and servicing the Fund’s Class A, Class B and Class C shares, pursuant to plans of distribution (the “Distribution Plans”), regardless of expenses actually incurred by PIMS. The distribution fees are accrued daily and payable monthly. No distribution or service fees are paid to PIMS as distributor of the Class Q and Class Z shares of the Fund.
Pursuant to the Distribution Plans, the Fund compensates PIMS for distribution related activities at an annual rate of up to .30%, 1% and 1% of the average daily net assets of the Class A, Class B and C shares, respectively. PIMS has contractually agreed through February 28, 2019 to limit such fees to .25% of the averse daily net assets of the Class A shares.
PIMS has advised the Fund that it received $77,793 in front-end sales charges resulting from sales of Class A shares during the year ended October 31, 2017. From these fees, PIMS paid such sales charges to affiliated broker-dealers, which in turn paid commissions to salespersons and incurred other distribution costs.
PIMS has advised the Fund that for the year ended October 31, 2017, it received $32, $1,415 and $2,802 in contingent deferred sales charges imposed upon redemptions by certain Class A, Class B and Class C shareholders, respectively.
PGIM Investments, PIMS and QMA are indirect, wholly-owned subsidiaries of Prudential Financial, Inc. (“Prudential”).
3. Other Transactions with Affiliates
Prudential Mutual Fund Services LLC (“PMFS”), an affiliate of PGIM Investments and an indirect, wholly-owned subsidiary of Prudential, serves as the Fund’s transfer agent. Transfer agent’s fees and expenses in the Statement of Operations include certain out-of-pocket expenses paid to non-affiliates, where applicable.
The Fund may enter into certain securities purchase or sale transactions under Board approved Rule 17a-7 procedures. Rule 17a-7 is an exemptive rule under the 1940 Act, that permits purchase and sale transactions among affiliated investment companies, or between an investment company and a person that is affiliated solely by reason of having a common (or affiliated) investment adviser, common directors, and/or common officers.
| Prudential QMA Large-Cap Core Equity Fund | 39 |
Notes to Financial Statements (continued)
Such transactions are subject to ratification by the Board. For the reporting period ended October 31, 2017 no such transactions were entered into by the Fund.
The Fund may invest its overnight sweep cash in the Prudential Core Ultra Short Bond Fund (the “Core Fund”), and its securities lending cash collateral in the Prudential Institutional Money Market Fund (the “Money Market Fund”), each a series of Prudential Investment Portfolios 2, registered under the 1940 Act and managed by PGIM Investments. For the reporting period ended October 31, 2017, PGIM, Inc. was compensated $153 by PGIM Investments for managing the Fund’s securities lending cash collateral as subadviser to the Money Market Fund. Earnings from the Core Fund and Money Market Fund are disclosed on the Statement of Operations as “Affiliated dividend income” and “Income from securities lending, net”, respectively.
4. Portfolio Securities
The aggregate cost of purchases and proceeds from sales of portfolio securities (excluding short-term investments and U.S. Government securities) for the year ended October 31, 2017, were $209,704,269 and $200,138,097, respectively.
5. Distributions and Tax Information
Distributions to shareholders, which are determined in accordance with federal income tax regulations and which may differ from generally accepted accounting principles, are recorded on the ex-date. In order to present undistributed net investment income, accumulated net realized gain on investment transactions and paid-in capital in excess of par on the Statement of Assets and Liabilities that more closely represent their tax character, certain adjustments have been made to undistributed net investment income and accumulated net realized gain on investment transactions. For the year ended October 31, 2017, the adjustments were to increase undistributed net investment income and decrease accumulated net realized gain on investment transactions by $21,096 due to certain book to tax differences. Net investment income, net realized gain (loss) on investment transactions and net assets were not affected by this change.
The tax character of dividends paid by the Fund were $1,827,935 of ordinary income and $8,631,823 of long-term capital gains for the year ended October 31, 2017 and $1,713,527 of ordinary income and $9,493,597 of long-term capital gains for the year ended October 31, 2016.
As of October 31, 2017, the accumulated undistributed earnings on a tax basis were $3,714,081 of ordinary income and $32,958,690 of long-term capital gains. This differs
| 40 |
from the amount on the Statement of Assets and Liabilities primarily due to cumulative timing differences.
The United States federal income tax basis of the Fund’s investments and the net unrealized appreciation as of October 31, 2017 were as follows:
Tax Basis | Gross Unrealized | Gross Unrealized | Net Unrealized | |||
| $188,674,165 | $75,701,127 | $(3,341,755) | $72,359,372 |
The difference between book basis and tax basis is primarily attributable to deferred losses on wash sales and other cost basis differences between financial and tax accounting.
Management has analyzed the Fund’s tax positions taken on federal, state and local income tax returns for all open tax years and has concluded that no provision for income tax is required in the Fund’s financial statements for the current reporting period. The Fund’s federal, state and local income and federal excise tax returns for tax years for which the applicable statutes of limitations have not expired are subject to examination by the Internal Revenue Service and state departments of revenue.
6. Capital
The Fund offers Class A, Class B, Class C, Class Q and Class Z shares. Class A shares are sold with a maximum front-end sales charge of 5.50%. Investors who purchase $1 million or more of Class A shares and sell these shares within 12 months of purchase are subject to a contingent deferred sales charge (“CDSC”) of 1%, although they are not subject to an initial sales charge. The Class A CDSC is waived for certain retirement and/or benefit plans. Class B shares are sold with a CDSC which declines from 5% to zero depending upon the period of time the shares are held. Class B shares will automatically convert to Class A shares approximately seven years after purchase. Class B shares are closed to new purchases. Class C shares are sold with a CDSC of 1% on sales made within 12 months of purchase. A special exchange privilege is also available for shareholders who qualified to purchase Class A shares at net asset value. Class Q shares and Class Z Shares are not subject to any sales or redemption charge and are offered exclusively for sale to a limited group of investors.
Under certain circumstances, an exchange may be made from specified share classes of the Fund to one or more other share classes of the Fund as presented in the table of transactions in shares of beneficial interest.
The Trust has authorized an unlimited number of shares of beneficial interest at $.001 par value per share, divided into five classes, designated Class A, Class B, Class C, Class Q and Class Z.
As of October 31, 2017, Prudential through its affiliate entities, including affiliated funds, owned 2,982,133 shares of Class Q. At reporting period end, four shareholders of record held 48% of the Fund’s outstanding shares, of which 6% were held by the affiliates of Prudential.
| Prudential QMA Large-Cap Core Equity Fund | 41 |
Notes to Financial Statements (continued)
Transactions in shares of beneficial interest were as follows:
Class A | Shares | Amount | ||||||
Year ended October 31, 2017: | ||||||||
Shares sold | 998,488 | $ | 16,661,824 | |||||
Shares issued in reinvestment of dividends and distributions | 283,780 | 4,492,233 | ||||||
Shares reacquired | (814,914 | ) | (13,634,813 | ) | ||||
|
|
|
| |||||
Net increase (decrease) in shares outstanding before conversion | 467,354 | 7,519,244 | ||||||
Shares issued upon conversion from other share class(es) | 71,380 | 1,202,394 | ||||||
Shares reacquired upon conversion into other share class(es) | (122,876 | ) | (2,056,576 | ) | ||||
|
|
|
| |||||
Net increase (decrease) in shares outstanding | 415,858 | $ | 6,665,062 | |||||
|
|
|
| |||||
Year ended October 31, 2016: | ||||||||
Shares sold | 452,917 | $ | 6,798,596 | |||||
Shares issued in reinvestment of dividends and distributions | 320,176 | 4,668,169 | ||||||
Shares reacquired | (627,853 | ) | (9,479,684 | ) | ||||
|
|
|
| |||||
Net increase (decrease) in shares outstanding before conversion | 145,240 | 1,987,081 | ||||||
Shares issued upon conversion from other share class(es) | 33,899 | 516,900 | ||||||
Shares reacquired upon conversion into other share class(es) | (10,357 | ) | (161,318 | ) | ||||
|
|
|
| |||||
Net increase (decrease) in shares outstanding | 168,782 | $ | 2,342,663 | |||||
|
|
|
| |||||
Class B | ||||||||
Year ended October 31, 2017: | ||||||||
Shares sold | 32,575 | $ | 484,522 | |||||
Shares issued in reinvestment of dividends and distributions | 6,633 | 97,048 | ||||||
Shares reacquired | (21,465 | ) | (328,742 | ) | ||||
|
|
|
| |||||
Net increase (decrease) in shares outstanding before conversion | 17,743 | 252,828 | ||||||
Shares reacquired upon conversion into other share class(es) | (31,013 | ) | (480,554 | ) | ||||
|
|
|
| |||||
Net increase (decrease) in shares outstanding | (13,270 | ) | $ | (227,726 | ) | |||
|
|
|
| |||||
Year ended October 31, 2016: | ||||||||
Shares sold | 19,444 | $ | 275,278 | |||||
Shares issued in reinvestment of dividends and distributions | 8,828 | 119,535 | ||||||
Shares reacquired | (26,494 | ) | (365,317 | ) | ||||
|
|
|
| |||||
Net increase (decrease) in shares outstanding before conversion | 1,778 | 29,496 | ||||||
Shares reacquired upon conversion into other share class(es) | (34,070 | ) | (480,472 | ) | ||||
|
|
|
| |||||
Net increase (decrease) in shares outstanding | (32,292 | ) | $ | (450,976 | ) | |||
|
|
|
| |||||
| 42 |
Class C | Shares | Amount | ||||||
Year ended October 31, 2017: | ||||||||
Shares sold | 176,345 | $ | 2,686,035 | |||||
Shares issued in reinvestment of dividends and distributions | 124,849 | 1,829,037 | ||||||
Shares reacquired | (876,008 | ) | (13,327,502 | ) | ||||
|
|
|
| |||||
Net increase (decrease) in shares outstanding before conversion | (574,814 | ) | (8,812,430 | ) | ||||
Shares reacquired upon conversion into other share class(es) | (298,698 | ) | (4,536,579 | ) | ||||
|
|
|
| |||||
Net increase (decrease) in shares outstanding | (873,512 | ) | $ | (13,349,009 | ) | |||
|
|
|
| |||||
Year ended October 31, 2016: | ||||||||
Shares sold | 247,662 | $ | 3,502,745 | |||||
Shares issued in reinvestment of dividends and distributions | 141,301 | 1,916,041 | ||||||
Shares reacquired | (260,669 | ) | (3,626,640 | ) | ||||
|
|
|
| |||||
Net increase (decrease) in shares outstanding before conversion | 128,294 | 1,792,146 | ||||||
Shares reacquired upon conversion into other share class(es) | (23,953 | ) | (341,855 | ) | ||||
|
|
|
| |||||
Net increase (decrease) in shares outstanding | 104,341 | $ | 1,450,291 | |||||
|
|
|
| |||||
Class Q | ||||||||
Period ended October 31, 2017*: | ||||||||
Shares sold | 1,679,002 | $ | 29,529,005 | |||||
Shares reacquired | (458,288 | ) | (8,134,949 | ) | ||||
|
|
|
| |||||
Net increase (decrease) in shares outstanding before conversion | 1,220,714 | 21,394,056 | ||||||
Shares issued upon conversion from other share class(es) | 1,878,365 | 30,168,028 | ||||||
|
|
|
| |||||
Net increase (decrease) in shares outstanding | 3,099,079 | $ | 51,562,084 | |||||
|
|
|
| |||||
Class Z | ||||||||
Year ended October 31, 2017: | ||||||||
Shares sold | 578,951 | $ | 9,707,348 | |||||
Shares issued in reinvestment of dividends and distributions | 231,812 | 3,743,763 | ||||||
Shares reacquired | (813,565 | ) | (13,706,717 | ) | ||||
|
|
|
| |||||
Net increase (decrease) in shares outstanding before conversion | (2,802 | ) | (255,606 | ) | ||||
Shares issued upon conversion from other share class(es) | 350,173 | 5,899,969 | ||||||
Shares reacquired upon conversion into other share class(es) | (1,880,034 | ) | (30,196,682 | ) | ||||
|
|
|
| |||||
Net increase (decrease) in shares outstanding | (1,532,663 | ) | $ | (24,552,319 | ) | |||
|
|
|
| |||||
Year ended October 31, 2016: | ||||||||
Shares sold | 1,054,880 | $ | 16,051,362 | |||||
Shares issued in reinvestment of dividends and distributions | 285,869 | 4,248,018 | ||||||
Shares reacquired | (1,783,223 | ) | (27,479,923 | ) | ||||
|
|
|
| |||||
Net increase (decrease) in shares outstanding before conversion | (442,474 | ) | (7,180,543 | ) | ||||
Shares issued upon conversion from other shares class(es) | 30,619 | 482,907 | ||||||
Shares reacquired upon conversion into other share class(es) | (1,046 | ) | (16,162 | ) | ||||
|
|
|
| |||||
Net increase (decrease) in shares outstanding | (412,901 | ) | $ | (6,713,798 | ) | |||
|
|
|
| |||||
| * | Commencement of operations was December 28, 2016. |
7. Borrowings
The Trust, on behalf of the Fund, along with other affiliated registered investment companies (the “Funds”), is a party to a Syndicated Credit Agreement (“SCA”) with a group of banks. The purpose of the SCA is to provide an alternative source of temporary funding for capital share redemptions. The SCA provides for a commitment of $900 million for the
| Prudential QMA Large-Cap Core Equity Fund | 43 |
Notes to Financial Statements (continued)
period October 5, 2017 through October 4, 2018. The Funds pay an annualized commitment fee of .15% of the unused portion of the SCA. The Fund’s portion of the commitment fee for the unused amount, allocated based upon a method approved by the Board, is accrued daily and paid quarterly. Prior to October 5, 2017, the Funds had another SCA that provided a commitment of $900 million and the Funds paid an annualized commitment fee of .15% of the unused portion of the SCA. The interest on borrowings under the SCAs is paid monthly and at a per annum interest rate based upon a contractual spread plus the higher of (1) the effective federal funds rate, (2) the 1-month LIBOR rate or (3) zero percent.
Other affiliated registered investment companies that are parties to the SCA include portfolios that are subject to a predetermined mathematical formula used to manage certain benefit guarantees offered under variable annuity contracts. The formula may result in large scale asset flows into and out of these portfolios. Consequently, these portfolios may be more likely to utilize the SCA for purposes of funding redemptions. It may be possible for those portfolios to fully exhaust the committed amount of the SCA, thereby requiring the Manager to allocate available funding per a Board-approved methodology designed to treat the Funds in the SCA equitably.
The Fund did not utilize the SCA during the reporting period ended October 31, 2017.
8. Dividends and Distributions to Shareholders
Subsequent to the fiscal year end, the Fund declared ordinary income dividends and capital gain distributions on December 11, 2017 to shareholders of record on December 12, 2017. The ex-date was December 13, 2017. The per share amounts declared were as follows:
| Ordinary Income | Short-Term Capital Gains | Long-Term Capital Gains | ||||||||||
Class A | $ | 0.17860 | $ | 0.11200 | $ | 2.31750 | ||||||
Class B | $ | 0.05922 | $ | 0.11200 | $ | 2.31750 | ||||||
Class C | $ | 0.06541 | $ | 0.11200 | $ | 2.31750 | ||||||
Class Q | $ | 0.24495 | $ | 0.11200 | $ | 2.31750 | ||||||
Class Z | $ | 0.22246 | $ | 0.11200 | $ | 2.31750 | ||||||
9. Other
At the Trust’s Board meeting in March 2017, the Board approved a change in the methodology of allocating certain expenses, such as Transfer Agent fees (including sub-transfer agent and networking fees) and Blue Sky fees. PGIM Investments implemented the changes effective November 1, 2017.
| 44 |
Financial Highlights
| Class A Shares | ||||||||||||||||||||
| Year Ended October 31, | ||||||||||||||||||||
| 2017 | 2016 | 2015 | 2014 | 2013 | ||||||||||||||||
| Per Share Operating Performance(a): | ||||||||||||||||||||
| Net Asset Value, Beginning of Year | $15.49 | $15.92 | $16.55 | $15.23 | $12.70 | |||||||||||||||
| Income (loss) from investment operations: | ||||||||||||||||||||
| Net investment income (loss) | .19 | .14 | .14 | .11 | .14 | |||||||||||||||
| Net realized and unrealized gain (loss) on investment transactions | 3.51 | .29 | .55 | 2.46 | 3.01 | |||||||||||||||
| Total from investment operations | 3.70 | .43 | .69 | 2.57 | 3.15 | |||||||||||||||
| Less Dividends and Distributions: | ||||||||||||||||||||
| Dividends from net investment income | (.15 | ) | (.14 | ) | (.11 | ) | (.13 | ) | (.13 | ) | ||||||||||
| Distributions from net realized gains | (.67 | ) | (.72 | ) | (1.21 | ) | (1.12 | ) | (.49 | ) | ||||||||||
| Total dividends and distributions | (.82 | ) | (.86 | ) | (1.32 | ) | (1.25 | ) | (.62 | ) | ||||||||||
| Net asset value, end of year | $18.37 | $15.49 | $15.92 | $16.55 | $15.23 | |||||||||||||||
| Total Return(b): | 24.73% | 3.02% | 4.20% | 18.09% | 26.00% | |||||||||||||||
| Ratios/Supplemental Data: | ||||||||||||||||||||
| Net assets, end of year (000) | $113,343 | $89,169 | $88,920 | $88,561 | $81,558 | |||||||||||||||
| Average net assets (000) | $101,852 | $88,443 | $90,171 | $86,047 | $76,459 | |||||||||||||||
| Ratios to average net assets(c): | ||||||||||||||||||||
| Expenses after waivers and/or expense reimbursement | .77% | 1.17% | 1.14% | 1.16% | 1.20% | |||||||||||||||
| Expenses before waivers and/or expense reimbursement | .93% | 1.22% | 1.19% | 1.21% | 1.30% | |||||||||||||||
| Net investment income (loss) | 1.13% | .91% | .89% | .74% | .99% | |||||||||||||||
| Portfolio turnover rate | 89% | 89% | 112% | 91% | 94% | |||||||||||||||
| (a) | Calculated based on average shares outstanding during the year. |
| (b) | Total return does not consider the effects of sales loads. Total return is calculated assuming a purchase of a share on the first day and a sale on the last day of each year reported and includes reinvestment of dividends and distributions, if any. Total return may reflect adjustments to conform to generally accepted accounting principles. |
| (c) | Does not include the expenses of the underlying funds in which the Fund invests. |
See Notes to Financial Statements.
| Prudential QMA Large-Cap Core Equity Fund | 45 |
Financial Highlights (continued)
| Class B Shares | ||||||||||||||||||||
| Year Ended October 31, | ||||||||||||||||||||
| 2017 | 2016 | 2015 | 2014 | 2013 | ||||||||||||||||
| Per Share Operating Performance(a): | ||||||||||||||||||||
| Net Asset Value, Beginning of Year | $14.30 | $14.75 | $15.43 | $14.29 | $11.96 | |||||||||||||||
| Income (loss) from investment operations: | ||||||||||||||||||||
| Net investment income (loss) | .06 | .03 | .02 | - | (d) | .03 | ||||||||||||||
| Net realized and unrealized gain (loss) on investment transactions | 3.23 | .27 | .51 | 2.29 | 2.84 | |||||||||||||||
| Total from investment operations | 3.29 | .30 | .53 | 2.29 | 2.87 | |||||||||||||||
| Less Dividends and Distributions: | ||||||||||||||||||||
| Dividends from net investment income | (.05 | ) | (.03 | ) | - | (d) | (.03 | ) | (.05 | ) | ||||||||||
| Distributions from net realized gains | (.67 | ) | (.72 | ) | (1.21 | ) | (1.12 | ) | (.49 | ) | ||||||||||
| Total dividends and distributions | (.72 | ) | (.75 | ) | (1.21 | ) | (1.15 | ) | (.54 | ) | ||||||||||
| Net asset value, end of year | $16.87 | $14.30 | $14.75 | $15.43 | $14.29 | |||||||||||||||
| Total Return(b): | 23.75% | 2.31% | 3.42% | 17.16% | 25.02% | |||||||||||||||
| Ratios/Supplemental Data: | ||||||||||||||||||||
| Net assets, end of year (000) | $2,291 | $2,132 | $2,676 | $3,052 | $3,275 | |||||||||||||||
| Average net assets (000) | $2,311 | $2,348 | $3,018 | $3,150 | $3,085 | |||||||||||||||
| Ratios to average net assets(c): | ||||||||||||||||||||
| Expenses after waivers and/or expense reimbursement | 1.52% | 1.92% | 1.89% | 1.91% | 1.95% | |||||||||||||||
| Expenses before waivers and/or expense reimbursement | 1.63% | 1.92% | 1.89% | 1.91% | 2.00% | |||||||||||||||
| Net investment income (loss) | .40% | .19% | .15% | - | (e) | .25% | ||||||||||||||
| Portfolio turnover rate | 89% | 89% | 112% | 91% | 94% | |||||||||||||||
| (a) | Calculated based on average shares outstanding during the year. |
| (b) | Total return does not consider the effects of sales loads. Total return is calculated assuming a purchase of a share on the first day and a sale on the last day of each year reported and includes reinvestment of dividends and distributions, if any. Total return may reflect adjustments to conform to generally accepted accounting principles. |
| (c) | Does not include the expenses of the underlying funds in which the Fund invests. |
| (d) | Less than $.005 per share. |
| (e) | Less than .005%. |
See Notes to Financial Statements.
| 46 |
| Class C Shares | ||||||||||||||||||||
| Year Ended October 31, | ||||||||||||||||||||
| 2017 | 2016 | 2015 | 2014 | 2013 | ||||||||||||||||
| Per Share Operating Performance(a): | ||||||||||||||||||||
| Net Asset Value, Beginning of Year | $14.31 | $14.77 | $15.45 | $14.30 | $11.97 | |||||||||||||||
| Income (loss) from investment operations: | ||||||||||||||||||||
| Net investment income (loss) | .06 | .02 | .02 | - | (d) | .03 | ||||||||||||||
| Net realized and unrealized gain (loss) on investment transactions | 3.24 | .27 | .51 | 2.30 | 2.84 | |||||||||||||||
| Total from investment operations | 3.30 | .29 | .53 | 2.30 | 2.87 | |||||||||||||||
| Less Dividends and Distributions: | ||||||||||||||||||||
| Dividends from net investment income | (.05 | ) | (.03 | ) | - | (d) | (.03 | ) | (.05 | ) | ||||||||||
| Distributions from net realized gains | (.67 | ) | (.72 | ) | (1.21 | ) | (1.12 | ) | (.49 | ) | ||||||||||
| Total dividends and distributions | (.72 | ) | (.75 | ) | (1.21 | ) | (1.15 | ) | (.54 | ) | ||||||||||
| Net asset value, end of year | $16.89 | $14.31 | $14.77 | $15.45 | $14.30 | |||||||||||||||
| Total Return(b): | 23.80% | 2.24% | 3.42% | 17.21% | 24.99% | |||||||||||||||
| Ratios/Supplemental Data: | ||||||||||||||||||||
| Net assets, end of year (000) | $31,518 | $39,218 | $38,919 | $37,681 | $32,128 | |||||||||||||||
| Average net assets (000) | $34,697 | $38,344 | $38,738 | $35,817 | $23,702 | |||||||||||||||
| Ratios to average net assets(c): | ||||||||||||||||||||
| Expenses after waivers and/or expense reimbursement | 1.53% | 1.92% | 1.89% | 1.91% | 1.95% | |||||||||||||||
| Expenses before waivers and/or expense reimbursement | 1.64% | 1.92% | 1.89% | 1.91% | 2.00% | |||||||||||||||
| Net investment income (loss) | .40% | .16% | .14% | (.01)% | .20% | |||||||||||||||
| Portfolio turnover rate | 89% | 89% | 112% | 91% | 94% | |||||||||||||||
| (a) | Calculated based on average shares outstanding during the year. |
| (b) | Total return does not consider the effects of sales loads. Total return is calculated assuming a purchase of a share on the first day and a sale on the last day of each year reported and includes reinvestment of dividends and distributions, if any. Total return may reflect adjustments to conform to generally accepted accounting principles. |
| (c) | Does not include the expenses of the underlying funds in which the Fund invests. |
| (d) | Less than $.005 per share. |
See Notes to Financial Statements.
| Prudential QMA Large-Cap Core Equity Fund | 47 |
Financial Highlights (continued)
| Class Q Shares | ||||
| December 28, 2016(a) through October 31, 2017 | ||||
| Per Share Operating Performance(b): | ||||
| Net Asset Value, Beginning of Period | $16.06 | |||
| Income (loss) from investment operations: | ||||
| Net investment income (loss) | .21 | |||
| Net realized and unrealized gain (loss) on investment transactions | 2.54 | |||
| Total from investment operations | 2.75 | |||
| Net asset value, end of period | $18.81 | |||
| Total Return(c): | 17.12% | |||
| Ratios/Supplemental Data: | ||||
| Net assets, end of period (000) | $58,304 | |||
| Average net assets (000) | $40,448 | |||
| Ratios to average net assets(d): | ||||
| Expenses after waivers and/or expense reimbursement | .35% | (e) | ||
| Expenses before waivers and/or expense reimbursement | .47% | (e) | ||
| Net investment income (loss) | 1.44% | (e) | ||
| Portfolio turnover rate | 89% | (f) | ||
| (a) | Commencement of operations. |
| (b) | Calculated based on average shares outstanding during the period. |
| (c) | Total return is calculated assuming a purchase of a share on the first day and a sale on the last day of each period reported and includes reinvestment of dividends and distributions, if any. Total return may reflect adjustments to conform to generally accepted accounting principles. Total returns for periods less than one full year are not annualized. |
| (d) | Does not include the expenses of the underlying funds in which the Fund invests. |
| (e) | Annualized. |
| (f) | Not annualized. |
See Notes to Financial Statements.
| 48 |
| Class Z Shares | ||||||||||||||||||||
| Year Ended October 31, | ||||||||||||||||||||
| 2017 | 2016 | 2015 | 2014 | 2013 | ||||||||||||||||
| Per Share Operating Performance(a): | ||||||||||||||||||||
| Net Asset Value, Beginning of Year | $15.83 | $16.24 | $16.86 | $15.49 | $12.91 | |||||||||||||||
| Income (loss) from investment operations: | ||||||||||||||||||||
| Net investment income (loss) | .24 | .18 | .18 | .16 | .17 | |||||||||||||||
| Net realized and unrealized gain (loss) on investment transactions | 3.57 | .31 | .55 | 2.49 | 3.06 | |||||||||||||||
| Total from investment operations | 3.81 | .49 | .73 | 2.65 | 3.23 | |||||||||||||||
| Less Dividends and Distributions: | ||||||||||||||||||||
| Dividends from net investment income | (.19 | ) | (.18 | ) | (.14 | ) | (.16 | ) | (.16 | ) | ||||||||||
| Distributions from net realized gains | (.67 | ) | (.72 | ) | (1.21 | ) | (1.12 | ) | (.49 | ) | ||||||||||
| Total dividends and distributions | (.86 | ) | (.90 | ) | (1.35 | ) | (1.28 | ) | (.65 | ) | ||||||||||
| Net asset value, end of year | $18.78 | $15.83 | $16.24 | $16.86 | $15.49 | |||||||||||||||
| Total Return(b): | 24.93% | 3.35% | 4.41% | 18.39% | 26.28% | |||||||||||||||
| Ratios/Supplemental Data: | ||||||||||||||||||||
| Net assets, end of year (000) | $56,066 | $71,506 | $80,096 | $42,134 | $34,851 | |||||||||||||||
| Average net assets (000) | $54,787 | $75,803 | $57,677 | $38,052 | $37,799 | |||||||||||||||
| Ratios to average net assets(c): | ||||||||||||||||||||
| Expenses after waivers and/or expense reimbursement | .54% | .92% | .89% | .91% | .95% | |||||||||||||||
| Expenses before waivers and/or expense reimbursement | .64% | .92% | .89% | .91% | 1.00% | |||||||||||||||
| Net investment income (loss) | 1.42% | 1.18% | 1.12% | .99% | 1.25% | |||||||||||||||
| Portfolio turnover rate | 89% | 89% | 112% | 91% | 94% | |||||||||||||||
| (a) | Calculated based on average shares outstanding during the year. |
| (b) | Total return is calculated assuming a purchase of a share on the first day and a sale on the last day of each year reported and includes reinvestment of dividends and distributions, if any. Total returns may reflect adjustments to conform to generally accepted accounting principles. |
| (c) | Does not include the expenses of the underlying funds in which the Fund invests. |
See Notes to Financial Statements.
| Prudential QMA Large-Cap Core Equity Fund | 49 |
Report of Independent Registered Public Accounting Firm
The Board of Trustees and Shareholders
Prudential Investment Portfolios 9:
We have audited the accompanying statement of assets and liabilities of Prudential QMA Large-Cap Core Equity Fund (the “Fund”), a series of Prudential Investment Portfolios 9, including the schedule of investments, as of October 31, 2017, and the related statement of operations for the year then ended, the statements of changes in net assets for each of the years in the two-year period then ended, and the financial highlights for each of the years or periods in the five-year period then ended. These financial statements and financial highlights are the responsibility of the Fund’s management. Our responsibility is to express an opinion on these financial statements and financial highlights based on our audits.
We conducted our audits in accordance with the standards of the Public Company Accounting Oversight Board (United States). Those standards require that we plan and perform the audit to obtain reasonable assurance about whether the financial statements and financial highlights are free of material misstatement. An audit includes examining, on a test basis, evidence supporting the amounts and disclosures in the financial statements. Our procedures included confirmation of securities owned as of October 31, 2017, by correspondence with the custodian, transfer agent and brokers or by other appropriate auditing procedures when replies from brokers were not received. An audit also includes assessing the accounting principles used and significant estimates made by management, as well as evaluating the overall financial statement presentation. We believe that our audits provide a reasonable basis for our opinion.
In our opinion, the financial statements and financial highlights referred to above present fairly, in all material respects, the financial position of the Fund as of October 31, 2017, and the results of its operations for the year then ended, the changes in its net assets for each of the years in the two-year period then ended, and the financial highlights for each of the years or periods in the five-year period then ended, in conformity with U.S. generally accepted accounting principles.

New York, New York
December 15, 2017
| 50 |
Federal Income Tax Information (unaudited)
We are advising you that during the fiscal year ended October 31, 2017, the Fund reports the maximum amount allowed per share but not less than $0.67 for Class A, B, C and Z shares as a capital gain distribution in accordance with Section 852(b)(3)(C) of the Internal Revenue Code.
For the year ended October 31, 2017, the Fund reports the maximum amount allowable under Section 854 of the Internal Revenue Code, but not less than, the following percentages of the ordinary income dividends paid as 1) qualified dividend income (QDI); and 2) eligible for corporate dividends received deduction (DRD):
| QDI | DRD | |||||||
Prudential QMA Large-Cap Core Equity Fund | 100 | % | 99.35 | % | ||||
In January 2018, you will be advised on IRS Form 1099-DIV or substitute 1099-DIV, as to the federal tax status of dividends and distributions received by you in calendar year 2017.
| Prudential QMA Large-Cap Core Equity Fund | 51 |
INFORMATION ABOUT BOARD MEMBERS AND OFFICERS
(Unaudited)
Information about Board Members and Officers of the Fund is set forth below. Board Members who are not deemed to be “interested persons” of the Fund, as defined in the 1940 Act, are referred to as “Independent Board Members.” Board Members who are deemed to be “interested persons” of the Fund are referred to as “Interested Board Members.” The Board Members are responsible for the overall supervision of the operations of the Fund and perform the various duties imposed on the directors of investment companies by the 1940 Act. The Board in turn elects the Officers, who are responsible for administering the day-to-day operations of the Fund.
| Independent Board Members(1) | ||||
Name, Address, Age Position(s) Portfolios Overseen | Principal Occupation(s) During Past Five Years | Other Directorships Held During Past Five Years | ||
Ellen S. Alberding (59) Board Member Portfolios Overseen: 89 | President and Board Member, The Joyce Foundation (charitable foundation) (since 2002); Vice Chair, City Colleges of Chicago (community college system) (since 2011); Trustee, Skills for America’s Future (national initiative to connect employers to community colleges) (since 2011); Trustee, National Park Foundation (charitable foundation for national park system) (since 2009); Trustee, Economic Club of Chicago (since 2009). | None. | ||
Kevin J. Bannon (65) Board Member Portfolios Overseen: 89 | Retired; Managing Director (April 2008-May 2015) and Chief Investment Officer (October 2008-November 2013) of Highmount Capital LLC (registered investment adviser); formerly Executive Vice President and Chief Investment Officer (April 1993-August 2007) of Bank of New York Company; President (May 2003-May 2007) of BNY Hamilton Family of Mutual Funds. | Director of Urstadt Biddle Properties (equity real estate investment trust) (since September 2008). | ||
Linda W. Bynoe (65) Board Member Portfolios Overseen: 89 | President and Chief Executive Officer (since March 1995) and formerly Chief Operating Officer (December 1989-February 1995) of Telemat Ltd. (management consulting); formerly Vice President (January 1985-June 1989) at Morgan Stanley & Co. (broker-dealer). | Director of Simon Property Group, Inc. (retail real estate) (May 2003-May 2012); Director of Anixter International, Inc. (communication products distributor) (since January 2006); Director of Northern Trust Corporation (financial services) (since April 2006); Trustee of Equity Residential (residential real estate) (since December 2009). | ||
Prudential QMA Large-Cap Core Equity Fund
| Independent Board Members(1) | ||||
Name, Address, Age Position(s) Portfolios Overseen | Principal Occupation(s) During Past Five Years | Other Directorships Held During Past Five Years | ||
Barry H. Evans (57)± Board Member Portfolios Overseen: 89 | Retired; Formerly President (2005-2016), Global Chief Operating Officer (2014-2016), Chief Investment Officer-Global Head of Fixed Income (1998-2014), and various portfolio manager roles (1986-2006), Manulife Asset Management U.S. | Director, Manulife Trust Company (2011- present); Director, Manulife Asset Management Limited (2015-present); Formerly Chairman of the Board of Directors of Manulife Asset Management U.S. (2005-2016); Formerly Chairman of the Board, Declaration Investment Management and Research (2008-2016). | ||
Keith F. Hartstein (61) Board Member & Independent Chair Portfolios Overseen: 89 | Retired; Member (since November 2014) of the Governing Council of the Independent Directors Council (organization of independent mutual fund directors); formerly President and Chief Executive Officer (2005-2012), Senior Vice President (2004-2005), Senior Vice President of Sales and Marketing (1997-2004), and various executive management positions (1990-1997), John Hancock Funds, LLC (asset management); Chairman, Investment Company Institute’s Sales Force Marketing Committee (2003-2008). | None. | ||
Laurie Simon Hodrick (55)± Board Member Portfolios Overseen: 89 | A. Barton Hepburn Professor of Economics in the Faculty of Business, Columbia Business School (since 1996); Visiting Professor of Law and Rock Center for Corporate Governance Fellow, Stanford Law School (since 2015); Visiting Fellow, Hoover Institution, Stanford University (since 2015); Sole Member, ReidCourt LLC (since 2008) (a consulting firm); Formerly Managing Director, Global Head of Alternative Investment Strategies, Deutsche Bank (2006-2008); Formerly Director/Trustee, Merrill Lynch Investment Managers Funds (1999-2006). | Independent Director, Corporate Capital Trust (since April 2017) (a business development company). | ||
Michael S. Hyland, CFA (72) Board Member Portfolios Overseen: 89 | Retired (since February 2005); formerly Senior Managing Director (July 2001-February 2005) of Bear Stearns & Co, Inc.; Global Partner, INVESCO (1999-2001); Managing Director and President of Salomon Brothers Asset Management (1989-1999). | None. | ||
Visit our website at pgiminvestments.com
| Independent Board Members(1) | ||||
| Name, Address, Age Position(s) Portfolios Overseen | Principal Occupation(s) During Past Five Years | Other Directorships Held During Past Five Years | ||
Richard A. Redeker (74) Independent Vice Chair9 Portfolios Overseen: 87 | Retired Mutual Fund Senior Executive (47 years); Management Consultant; Director, Mutual Fund Directors Forum (since 2014); Independent Directors Council (organization of independent mutual fund directors)-Executive Committee, Chair of Policy Steering Committee, Governing Council. | None. | ||
| Stephen G. Stoneburn (74) Board Member Portfolios Overseen: 89 | Chairman (since July 2011), President and Chief Executive Officer (since June 1996) of Frontline Medical Communications (publishing company); formerly President (June 1995-June 1996) of Argus Integrated Media, Inc.; Senior Vice President and Managing Director (January 1993-1995) of Cowles Business Media; Senior Vice President of Fairchild Publications, Inc. (1975-1989). | None. | ||
± Mr. Evans and Ms. Hodrick joined the Board effective as of September 1, 2017.
| Interested Board Members(1) | ||||
| Name, Address, Age Position(s) Portfolios Overseen | Principal Occupation(s) During Past Five Years | Other Directorships Held During Past Five Years | ||
Stuart S. Parker (55) Board Member & President Portfolios Overseen: 89 | President of PGIM Investments LLC (formerly known as Prudential Investments LLC) (since January 2012); Executive Vice President of Prudential Investment Management Services LLC (since December 2012); Executive Vice President of Jennison Associates LLC and Head of Retail Distribution of PGIM Investments LLC (June 2005-December 2011). | None. | ||
Prudential QMA Large-Cap Core Equity Fund
| Interested Board Members(1) | ||||
| Name, Address, Age Position(s) Portfolios Overseen | Principal Occupation(s) During Past Five Years | Other Directorships Held During Past Five Years | ||
| Scott E. Benjamin (44) Board Member & Vice President Portfolios Overseen: 89 | Executive Vice President (since June 2009) of PGIM Investments LLC; Executive Vice President (June 2009-June 2012) and Vice President (since June 2012) of Prudential Investment Management Services LLC; Executive Vice President (since September 2009) of AST Investment Services, Inc.; Senior Vice President of Product Development and Marketing, PGIM Investments (since February 2006); Vice President of Product Development and Product Management, Prudential Investments (2003-2006). | None. | ||
| Grace C. Torres* (58) Board Member Portfolios Overseen: 88 | Retired; formerly Treasurer and Principal Financial and Accounting Officer of the Prudential Funds, Target Funds, Advanced Series Trust, Prudential Variable Contract Accounts and The Prudential Series Fund (1998-June 2014); Assistant Treasurer (March 1999-June 2014) and Senior Vice President (September 1999-June 2014) of PGIM Investments LLC; Assistant Treasurer (May 2003-June 2014) and Vice President (June 2005-June 2014) of AST Investment Services, Inc.; Senior Vice President and Assistant Treasurer (May 2003-June 2014) of Prudential Annuities Advisory Services, Inc. | Director (since July 2015) of Sun Bancorp, Inc. N.A. and Sun National Bank | ||
* Note: Prior to her retirement in 2014, Ms. Torres was employed by PGIM Investments LLC. Due to her prior employment, she is considered to be an “interested person” under the 1940 Act. Ms. Torres is a Non-Management Interested Board Member.
(1) The year that each individual joined the Board is as follows:
Ellen S. Alberding, 2013; Linda W. Bynoe, 2005; Barry H. Evans, 2017; Richard A. Redeker, 1998; Stephen G. Stoneburn, 2003; Kevin J. Bannon, 2008; Keith F. Hartstein, 2013; Laurie Simon Hodrick, 2017; Michael S. Hyland, 2008; Stuart S. Parker, Board Member since 2012 and President since 2012; Scott E. Benjamin, Board Member since 2010 and Vice President since 2009; Grace C. Torres, 2014.
Visit our website at pgiminvestments.com
| Fund Officers(a) | ||||
Name, Address and Age Position with Fund | Principal Occupation(s) During Past Five Years | Length of Service as Fund Officer | ||
Raymond A. O’Hara (62) Chief Legal Officer | Vice President and Corporate Counsel (since July 2010) of Prudential Insurance Company of America (Prudential); Vice President (March 2011-Present) of Pruco Life Insurance Company and Pruco Life Insurance Company of New Jersey; Vice President and Corporate Counsel (March 2011-Present) of Prudential Annuities Life Assurance Corporation; Chief Legal Officer of PGIM Investments LLC (since June 2012); Chief Legal Officer of Prudential Mutual Fund Services LLC (since June 2012) and Corporate Counsel of AST Investment Services, Inc. (since June 2012); formerly Assistant Vice President and Corporate Counsel (September 2008-July 2010) of The Hartford Financial Services Group, Inc.; formerly Associate (September 1980-December 1987) and Partner (January 1988-August 2008) of Blazzard & Hasenauer, P.C. (formerly, Blazzard, Grodd & Hasenauer, P.C.). | Since 2012 | ||
Chad A. Earnst (42) Chief Compliance Officer | Chief Compliance Officer (September 2014-Present) of PGIM Investments LLC; Chief Compliance Officer (September 2014-Present) of the Prudential Funds, Target Funds, Advanced Series Trust, The Prudential Series Fund, Prudential’s Gibraltar Fund, Inc., Prudential Global Short Duration High Yield Income Fund, Inc., Prudential Short Duration High Yield Fund, Inc. and Prudential Jennison MLP Income Fund, Inc.; formerly Assistant Director (March 2010-August 2014) of the Asset Management Unit, Division of Enforcement, US Securities & Exchange Commission; Assistant Regional Director (January 2010-August 2014), Branch Chief (June 2006-December 2009) and Senior Counsel (April 2003-May 2006) of the Miami Regional Office, Division of Enforcement, US Securities & Exchange Commission. | Since 2014 | ||
Deborah A. Docs (59) Secretary | Vice President and Corporate Counsel (since January 2001) of Prudential; Vice President (since December 1996) and Assistant Secretary (since March 1999) of PGIM Investments LLC; formerly Vice President and Assistant Secretary (May 2003-June 2005) of AST Investment Services, Inc. | Since 2004 | ||
Jonathan D. Shain (59) Assistant Secretary | Vice President and Corporate Counsel (since August 1998) of Prudential; Vice President and Assistant Secretary (since May 2001) of PGIM Investments LLC; Vice President and Assistant Secretary (since February 2001) of Prudential Mutual Fund Services LLC; formerly Vice President and Assistant Secretary (May 2003-June 2005) of AST Investment Services, Inc. | Since 2005 | ||
Claudia DiGiacomo (43) Assistant Secretary | Vice President and Corporate Counsel (since January 2005) of Prudential; Vice President and Assistant Secretary of PGIM Investments LLC (since December 2005); Associate at Sidley Austin Brown & Wood LLP (1999-2004). | Since 2005 | ||
Prudential QMA Large-Cap Core Equity Fund
| Fund Officers(a) | ||||
Name, Address and Age Position with Fund | Principal Occupation(s) During Past Five Years | Length of Service as Fund Officer | ||
Andrew R. French (54) Assistant Secretary | Vice President and Corporate Counsel (since February 2010) of Prudential; formerly Director and Corporate Counsel (2006-2010) of Prudential; Vice President and Assistant Secretary (since January 2007) of PGIM Investments LLC; Vice President and Assistant Secretary (since January 2007) of Prudential Mutual Fund Services LLC. | Since 2006 | ||
Charles H. Smith (44) Anti-Money Laundering Compliance Officer | Vice President, Corporate Compliance, Anti-Money Laundering Unit (since January 2015) of Prudential; committee member of the American Council of Life Insurers Anti-Money Laundering and Critical Infrastructure Committee (since January 2016); formerly Global Head of Economic Sanctions Compliance at AIG Property Casualty (February 2007-December 2014); Assistant Attorney General at the New York State Attorney General’s Office, Division of Public Advocacy. (August 1998-January 2007). | Since 2016 | ||
M. Sadiq Peshimam (53) Treasurer and Principal Financial and Accounting Officer | Vice President (since 2005) of PGIM Investments LLC; formerly Assistant Treasurer of funds in the Prudential Mutual Fund Complex (2006-2014). | Since 2006 | ||
Peter Parrella (59) Assistant Treasurer | Vice President (since 2007) and Director (2004-2007) within Prudential Mutual Fund Administration; formerly Tax Manager at SSB Citi Fund Management LLC (1997-2004). | Since 2007 | ||
Lana Lomuti (50) Assistant Treasurer | Vice President (since 2007) and Director (2005-2007), within Prudential Mutual Fund Administration; formerly Assistant Treasurer (December 2007-February 2014) of The Greater China Fund, Inc. | Since 2014 | ||
Linda McMullin (56) Assistant Treasurer | Vice President (since 2011) and Director (2008-2011) within Prudential Mutual Fund Administration. | Since 2014 | ||
Kelly A. Coyne (49) Assistant Treasurer | Director, Investment Operations of Prudential Mutual Fund Services LLC (since 2010). | Since 2015 | ||
(a) Excludes Mr. Parker and Mr. Benjamin, interested Board Members who also serve as President and Vice President, respectively.
Explanatory Notes to Tables:
| ∎ | Board Members are deemed to be “Interested,” as defined in the 1940 Act, by reason of their affiliation with PGIM Investments LLC and/or an affiliate of PGIM Investments LLC. |
| ∎ | Unless otherwise noted, the address of all Board Members and Officers is c/o PGIM Investments LLC, 655 Broad Street, Newark, New Jersey 07102-4410. |
| ∎ | There is no set term of office for Board Members or Officers. The Board Members have adopted a retirement policy, which calls for the retirement of Board Members on December 31 of the year in which they reach the age of 75. |
| ∎ | “Other Directorships Held” includes only directorships of companies required to register or file reports with the SEC under the 1934 Act (that is, “public companies”) or other investment companies registered under the 1940 Act. |
| ∎ | “Portfolios Overseen” includes all investment companies managed by PGIM Investments LLC. The investment companies for which PGIM Investments LLC serves as manager include the Prudential Mutual Funds, The Prudential Variable Contract Accounts, Target Mutual Funds, Prudential Short Duration High Yield Fund, Inc., Prudential Global Short Duration High Yield Fund, Inc., The Prudential Series Fund, Prudential’s Gibraltar Fund, Inc. and the Advanced Series Trust. |
Visit our website at pgiminvestments.com
Approval of Advisory Agreements
The Fund’s Board of Trustees
The Board of Trustees (the “Board”) of Prudential QMA Large-Cap Core Equity Fund (the “Fund”)1 consists of twelve individuals, nine of whom are not “interested persons” of the Fund, as defined in the Investment Company Act of 1940, as amended (the “1940 Act”) (the “Independent Trustees”). The Board is responsible for the oversight of the Fund and its operations, and performs the various duties imposed on the directors of investment companies by the 1940 Act. The Independent Trustees have retained independent legal counsel to assist them in connection with their duties. The Chair of the Board is an Independent Trustee. The Board has established four standing committees: the Audit Committee, the Nominating and Governance Committee, and two Investment Committees. Each committee is chaired by, and composed of, Independent Trustees.
Annual Approval of the Fund’s Advisory Agreements
As required under the 1940 Act, the Board determines annually whether to renew the Fund’s management agreement with PGIM Investments LLC (“PGIM Investments”) and the Fund’s subadvisory agreement with Quantitative Management Associates LLC (“QMA”). In considering the renewal of the agreements, the Board, including all of the Independent Trustees,2 met on June 6-8, 2017 and approved the renewal of the agreements through July 31, 2018, after concluding that the renewal of the agreements was in the best interests of the Fund and its shareholders.
In advance of the meetings, the Board received materials relating to the agreements, and had the opportunity to ask questions and request further information in connection with its consideration. Among other things, the Board considered comparative fee information from PGIM Investments and QMA. Also, the Board considered comparisons with other mutual funds in relevant Peer Universes and Peer Groups, as is further discussed below.
In approving the agreements, the Board, including the Independent Trustees advised by independent legal counsel, considered the factors it deemed relevant, including the nature, quality and extent of services provided by PGIM Investments and the subadviser, the performance of the Fund, the profitability of PGIM Investments and its affiliates, expenses and fees, and the potential for economies of scale that may be shared with the Fund and its shareholders as the Fund’s assets grow. In their deliberations, the Trustees did not identify any single factor which alone was responsible for the Board’s decision to approve the agreements with respect to the Fund. In connection with its deliberations, the Board considered information provided by PGIM Investments throughout the year at regular Board
| 1 | Prudential QMA Large-Cap Core Equity Fund is a series of Prudential Investment Portfolios 9. |
| 2 | Barry H. Evans and Laurie Simon Hodrick joined the Board effective as of September 1, 2017. Neither Mr. Evans nor Ms. Hodrick participated in the consideration of the renewal of the Fund’s advisory agreements. |
| Prudential QMA Large-Cap Core Equity Fund | ||
Approval of Advisory Agreements (continued)
meetings, presentations from portfolio managers and other information, as well as information furnished at or in advance of the meetings on June 6-8, 2017.
The Trustees determined that the overall arrangements between the Fund and PGIM Investments, which serves as the Fund’s investment manager pursuant to a management agreement, and between PGIM Investments and QMA, which serves as the Fund’s subadviser pursuant to the terms of a subadvisory agreement with PGIM Investments, are in the best interests of the Fund and its shareholders in light of the services performed, fees charged and such other matters as the Trustees considered relevant in the exercise of their business judgment.
The material factors and conclusions that formed the basis for the Trustees’ reaching their determinations to approve the continuance of the agreements are separately discussed below.
Nature, Quality and Extent of Services
The Board received and considered information regarding the nature, quality and extent of services provided to the Fund by PGIM Investments and QMA. The Board considered the services provided by PGIM Investments, including but not limited to the oversight of the subadviser for the Fund, as well as the provision of fund recordkeeping, compliance, and other services to the Fund. With respect to PGIM Investments’ oversight of the subadviser, the Board noted that PGIM Investments’ Strategic Investment Research Group (“SIRG”), which is a business unit of PGIM Investments, is responsible for monitoring and reporting to PGIM Investments’ senior management on the performance and operations of the subadviser. The Board also considered that PGIM Investments pays the salaries of all of the officers and interested Trustees of the Fund who are part of Fund management. The Board also considered the investment subadvisory services provided by QMA, as well as adherence to the Fund’s investment restrictions and compliance with applicable Fund policies and procedures. The Board considered PGIM Investments, evaluation of the subadviser, as well as PGIM Investments’ recommendation, based on its review of the subadviser, to renew the subadvisory agreement.
The Board considered the qualifications, backgrounds and responsibilities of PGIM Investments’ senior management responsible for the oversight of the Fund and QMA, and also considered the qualifications, backgrounds and responsibilities of QMA’s portfolio managers who are responsible for the day-to-day management of the Fund’s portfolio. The Board was provided with information pertaining to PGIM Investments’ and QMA’s organizational structure, senior management, investment operations, and other relevant information pertaining to both PGIM Investments and QMA. The Board also noted that it received favorable compliance reports from the Fund’s Chief Compliance Officer (“CCO”) as to both PGIM Investments and QMA. The Board noted that QMA is affiliated with PGIM Investments.
| Visit our website at pgiminvestments.com |
The Board concluded that it was satisfied with the nature, extent and quality of the investment management services provided by PGIM Investments and the subadvisory services provided to the Fund by QMA, and that there was a reasonable basis on which to conclude that the Fund benefits from the services provided by PGIM Investments and QMA under the management and subadvisory agreements.
Costs of Services and Profits Realized by PGIM Investments
The Board was provided with information on the profitability of PGIM Investments and its affiliates in serving as the Fund’s investment manager. The Board discussed with PGIM Investments the methodology utilized in assembling the information regarding profitability and considered its reasonableness. The Board recognized that it is difficult to make comparisons of profitability from fund management contracts because comparative information is not generally publicly available and is affected by numerous factors, including the structure of the particular adviser, the types of funds it manages, its business mix, numerous assumptions regarding allocations and the adviser’s capital structure and cost of capital. The Board further noted that the subadviser is affiliated with PGIM Investments and that its profitability is reflected in PGIM Investments’ profitability report. Taking these factors into account, the Board concluded that the profitability of PGIM Investments and its affiliates in relation to the services rendered was not unreasonable.
Economies of Scale
The Board received and discussed information concerning economies of scale that PGIM Investments may realize as the Fund’s assets grow beyond current levels. The Board noted that the management fee schedule for the Fund includes breakpoints, which have the effect of decreasing the fee rate as assets increase, but that at its current level of assets the Fund did not realize the effect of those rate reductions. The Board took note that the Fund’s fee structure currently results in benefits to Fund shareholders whether or not PGIM Investments realizes any economies of scale. The Board noted that economies of scale can be shared with the Fund in other ways, including low management fees from inception, additional technological and personnel investments to enhance shareholder services, and maintaining existing expense structures in the face of a rising cost environment. The Board also considered PGIM Investments’ assertion that it continually evaluates the management fee schedule of the Fund and the potential to share economies of scale through breakpoints or fee waivers as asset levels increase.
The Board recognized the inherent limitations of any analysis of economies of scale, stemming largely from the Board’s understanding that most of PGIM Investments’ costs are not specific to individual funds, but rather are incurred across a variety of products and services.
| Prudential QMA Large-Cap Core Equity Fund | ||
Approval of Advisory Agreements (continued)
Other Benefits to PGIM Investments and QMA
The Board considered potential ancillary benefits that might be received by PGIM Investments and QMA and their affiliates as a result of their relationship with the Fund. The Board concluded that potential benefits to be derived by PGIM Investments included transfer agency fees received by the Fund’s transfer agent (which is affiliated with PGIM Investments), and benefits to its reputation as well as other intangible benefits resulting from PGIM Investments’ association with the Fund. The Board concluded that the potential benefits to be derived by QMA included its ability to use soft dollar credits, as well as the potential benefits consistent with those generally resulting from an increase in assets under management, specifically, potential access to additional research resources and benefits to its reputation. The Board concluded that the benefits derived by PGIM Investments and QMA were consistent with the types of benefits generally derived by investment managers and subadvisers to mutual funds.
Performance of the Fund / Fees and Expenses
The Board considered certain additional specific factors and made related conclusions relating to the historical performance of the Fund for the one-, three-, five- and ten-year periods ended December 31, 2016.
The Board also considered the Fund’s actual management fee, as well as the Fund’s net total expense ratio, for the fiscal year ended October 31, 2016. The Board considered the management fee for the Fund as compared to the management fee charged by PGIM Investments to other funds and the fee charged by other advisers to comparable mutual funds in a Peer Group. The actual management fee represents the fee rate actually paid by Fund shareholders and includes any fee waivers or reimbursements. The net total expense ratio for the Fund represents the actual expense ratio incurred by Fund shareholders.
The mutual funds included in the Peer Universe (the Lipper Large-Cap Core Funds Performance Universe), which was used to consider performance, and the Peer Group, which was used to consider expenses and fees, were objectively determined by Broadridge, an independent provider of mutual fund data. The comparisons placed the Fund in various quartiles, with the first quartile being the best 25% of the mutual funds (for performance, the best performing mutual funds and, for expenses, the lowest cost mutual funds).
The section below summarizes key factors considered by the Board and the Board’s conclusions regarding the Fund’s performance, fees and overall expenses. The table sets forth gross performance comparisons (which do not reflect the impact on performance of fund expenses, or any subsidies, expense caps or waivers that may be applicable) with the Peer Universe, actual management fees with the Peer Group (which reflect the impact of
| Visit our website at pgiminvestments.com |
any subsidies or fee waivers), and net total expenses with the Peer Group, each of which were key factors considered by the Board.
| Performance | 1 Year | 3 Years | 5 Years | 10 Years | ||||
2nd Quartile | 1st Quartile | 1st Quartile | 2nd Quartile | |||||
| Actual Management Fees: 2nd Quartile | ||||||||
| Net Total Expenses: 2nd Quartile | ||||||||
| • | The Board noted that the Fund outperformed its benchmark index over all periods. |
| • | The Board concluded that, in light of the above, it would be in the best interests of the Fund and its shareholders to renew the agreements. |
| • | The Board concluded that the management fees (including subadvisory fees) and total expenses were reasonable in light of the services provided. |
* * *
After full consideration of these factors, the Board concluded that the approval of the agreements was in the best interests of the Fund and its shareholders.
| Prudential QMA Large-Cap Core Equity Fund | ||
| ∎ TELEPHONE | ∎ WEBSITE | |||
655 Broad Street Newark, NJ 07102 | (800) 225-1852 | www.pgiminvestments.com |
| PROXY VOTING |
| The Board of Trustees of the Fund has delegated to the Fund’s investment subadviser the responsibility for voting any proxies and maintaining proxy recordkeeping with respect to the Fund. A description of these proxy voting policies and procedures is available without charge, upon request, by calling (800) 225-1852. Information regarding how the Fund voted proxies relating to portfolio securities during the most recent 12-month period ended June 30 is available on the Fund’s website and on the Securities and Exchange Commission’s website. |
| TRUSTEES |
| Ellen S. Alberding • Kevin J. Bannon • Scott E. Benjamin • Linda W. Bynoe • Barry H. Evans • Keith F. Hartstein • Laurie Simon Hodrick • Michael S. Hyland • Stuart S. Parker • Richard A. Redeker • Stephen G. Stoneburn • Grace C. Torres |
| OFFICERS |
| Stuart S. Parker, President • Scott E. Benjamin, Vice President • M. Sadiq Peshimam, Treasurer and Principal Financial and Accounting Officer • Raymond A. O’Hara, Chief Legal Officer • Deborah A. Docs, Secretary • Chad A. Earnst, Chief Compliance Officer • Charles H. Smith, Anti-Money Laundering Compliance Officer • Jonathan D. Shain, Assistant Secretary • Claudia DiGiacomo, Assistant Secretary • Andrew R. French, Assistant Secretary • Peter Parrella, Assistant Treasurer • Lana Lomuti, Assistant Treasurer • Linda McMullin, Assistant Treasurer • Kelly A. Coyne, Assistant Treasurer |
| MANAGER | PGIM Investments LLC | 655 Broad Street Newark, NJ 07102 | ||
| ||||
| INVESTMENT SUBADVISER | Quantitative Management Associates LLC | Gateway Center Two 100 Mulberry Street Newark, NJ 07102 | ||
| ||||
| DISTRIBUTOR | Prudential Investment Management Services LLC | 655 Broad Street Newark, NJ 07102 | ||
| ||||
| CUSTODIAN | The Bank of New York Mellon | 225 Liberty Street New York, NY 10286 | ||
| ||||
| TRANSFER AGENT | Prudential Mutual Fund Services LLC | PO Box 9658 Providence, RI 02940 | ||
| ||||
| INDEPENDENT REGISTERED PUBLIC ACCOUNTING FIRM | KPMG LLP | 345 Park Avenue New York, NY 10154 | ||
| ||||
| FUND COUNSEL | Willkie Farr & Gallagher LLP | 787 Seventh Avenue New York, NY 10019 | ||
| ||||
| An investor should consider the investment objectives, risks, charges, and expenses of the Fund carefully before investing. The prospectus and summary prospectus contain this and other information about the Fund. An investor may obtain a prospectus and summary prospectus by visiting our website at www.pgiminvestments.com or by calling (800) 225-1852. The prospectus and summary prospectus should be read carefully before investing. |
| E-DELIVERY |
| To receive your mutual fund documents online, go to www.pgiminvestments.com/edelivery and enroll. Instead of receiving printed documents by mail, you will receive notification via email when new materials are available. You can cancel your enrollment or change your email address at any time by visiting the website address above. |
| SHAREHOLDER COMMUNICATIONS WITH TRUSTEES |
| Shareholders can communicate directly with the Board of Trustees by writing to the Chair of the Board, Prudential QMA Large-Cap Core Equity Fund, PGIM Investments, Attn: Board of Trustees, 655 Broad Street, Newark, NJ 07102. Shareholders can communicate directly with an individual Trustee by writing to the same address. Communications are not screened before being delivered to the addressee. |
| AVAILABILITY OF PORTFOLIO SCHEDULE |
| The Fund files its complete schedule of portfolio holdings with the Securities and Exchange Commission for the first and third quarters of each fiscal year on Form N-Q. The Fund’s Forms N-Q are available on the Commission’s website at www.sec.gov. The Fund’s Forms N-Q may also be reviewed and copied at the Commission’s Public Reference Room in Washington, D.C. Information on the operation and location of the Public Reference Room may be obtained by calling 1-800-SEC-0330. The Fund’s schedule of portfolio holdings is also available on the Fund’s website as of the end of each month no sooner than 15 days after the end of the month. |
| The Fund’s Statement of Additional Information contains additional information about the Fund’s Trustees and is available without charge, upon request, by calling (800) 225-1852. |
Mutual Funds:
| ARE NOT INSURED BY THE FDIC OR ANY FEDERAL GOVERNMENT AGENCY | MAY LOSE VALUE | ARE NOT A DEPOSIT OF OR GUARANTEED BY ANY BANK OR ANY BANK AFFILIATE |
PRUDENTIAL QMA LARGE-CAP CORE EQUITY FUND
| SHARE CLASS | A | B | C | Q | Z | |||||
| NASDAQ | PTMAX | PTMBX | PTMCX | PTMQX | PTEZX | |||||
| CUSIP | 74441J100 | 74441J209 | 74441J308 | 74441J688 | 74441J407 |
MF187E

PRUDENTIAL REAL ESTATE INCOME FUND
ANNUAL REPORT
OCTOBER 31, 2017

To enroll in e-delivery, go to pgiminvestments.com/edelivery
| Objective: To seek income and capital appreciation |
Highlights
| • | The Asia Pacific region posted the strongest relative performance in the Fund for the reporting period, as both Singapore and Japan performed favorably. North America also contributed to performance, due to sound results in the US health care and hotel sectors. The office and specialty sectors also positively impacted performance. |
| • | On a regional basis, Europe detracted from performance. Germany and the United Kingdom saw the greatest underperformance due to asset allocation, however, most countries lagged. In the US the shopping center and industrial and data center sectors negatively impacted performance, as did Hong Kong in the Asia Pacific region. |
This report is not authorized for distribution to prospective investors unless preceded or accompanied by a current prospectus.
The views expressed in this report and information about the Fund’s portfolio holdings are for the period covered by this report and are subject to change thereafter.
Mutual funds are distributed by Prudential Investment Management Services LLC (PIMS). PGIM Real Estate is a unit of PGIM, Inc. (PGIM), a registered investment advisor. PIMS and PGIM are Prudential Financial companies. © 2017 Prudential Financial, Inc. and its related entities. PGIM Real Estate, PGIM, and the PGIM logo are service marks of Prudential Financial, Inc. and its related entities, registered in many jurisdictions worldwide.
| 2 | Visit our website at pgiminvestments.com |
PRUDENTIAL FUNDS — UPDATE
The Board of Directors/Trustees for the Fund has approved renaming the Fund’s Class Q shares as Class R6 shares, effective on or about June 15, 2018. The renaming of Class Q shares as Class R6 shares will not result in any changes to pricing, eligibility, or shareholder rights and obligations. The renamed Class R6 shares will not be exchangeable with Class R6 shares of the Prudential Day One Funds or the Prudential 60/40 Allocation Fund.
LR993
| Prudential Real Estate Income Fund | 3 |
PRUDENTIAL FUNDS — UPDATE
Effective on or about June 1, 2018 (the “Effective Date”), the Fund’s Class A, Class C, Class R, and Class Z shares, as applicable, will be closed to investments by new group retirement plans, except as discussed below. Existing group retirement plans as of the Effective Date may keep their investments in their current share class and may continue to make additional purchases or exchanges of that class of shares. As of the Effective Date, all new group retirement plans wishing to add the Fund as a new addition to the plan generally will be into one of the available Class Q shares, Class R2 shares, or Class R4 shares of the Fund.
In addition, on or about the Effective Date, the Class R shares of the Fund will be closed to all new investors, except as discussed below. Due to the closing of the Class R shares to new investors, effective on or about the Effective Date new IRA investors may only purchase Class A, Class C, Class Z, or Class Q shares of the Fund, subject to share class eligibility. Following the Effective Date, no new accounts may be established in the Fund’s Class R shares and no Class R shares may be purchased or acquired by any new Class R shareholder, except as discussed below.
| Class A | Class C | Class Z | Class R | |||||
Existing Investors (Group Retirement Plans, IRAs, and all other investors) | No Change | No Change | No Change | No Change | ||||
| New Group Retirement Plans | Closed to group retirement plans wishing to add the share classes as new additions to plan menus on or about June 1, 2018, subject to certain exceptions below | |||||||
New IRAs | No Change | No Change | No Change | Closed to all new investors on or about June 1, 2018, subject to certain exceptions below | ||||
| All Other New Investors | No Change | No Change | No Change | |||||
| 4 | Visit our website at pgiminvestments.com |
However, the following new investors may continue to purchase Class A, Class C, Class R, and Class Z shares of the Fund, as applicable:
| • | Eligible group retirement plans who are exercising their one-time 90-day repurchase privilege in the Fund will be permitted to purchase such share classes. |
| • | Plan participants in a group retirement plan that offers Class A, Class C, Class R, or Class Z shares of the Fund as of the Effective Date will be permitted to purchase such share classes of the Fund, even if the plan participant did not own shares of that class of the Fund as of the Effective Date. |
| • | Certain new group retirement plans will be permitted to offer such share classes of the Fund after the Effective Date, provided that the plan has or is actively negotiating a contractual agreement with the Fund’s distributor or service provider to offer such share classes of the Fund prior to or on the Effective Date. |
| • | New group retirement plans that combine with, replace, or are otherwise affiliated with a current plan that invests in such share classes prior to or on the Effective Date will be permitted to purchase such share classes. |
The Fund also reserves the right to refuse any purchase order that might disrupt management of the Fund or to otherwise modify the closure policy at any time on a case-by-case basis.
| Prudential Real Estate Income Fund | 5 |
This Page Intentionally Left Blank
| 6 | Visit our website at pgiminvestments.com |
Letter from the President

Dear Shareholder:
We hope you find the annual report for the Prudential Real Estate Income Fund informative and useful. The report covers performance for the 12-month period ended October 31, 2017.
Significant events during the reporting period included a new US president, followed by uncertainty in Congress over implementing the Trump
administration’s policy initiatives. Elsewhere, Britain began its formal legal process to leave the European Union. France elected a more centrist president, which was viewed as a pro-euro referendum. North Korea’s missile launches escalated geopolitical tensions. Also, late in the period, a series of hurricanes caused damage in the US and the Caribbean.
Despite some turbulence in the macro-environment, solid economic fundamentals in the US economy included moderate gross domestic product expansion, robust employment, and accelerating corporate profit growth. Inflation remained tame. The Federal Reserve raised its federal funds rate twice in 2017, and is in the process of winding down its stimulus program.
Global economic growth remained mostly positive. Equities in the US reached new highs amid low volatility, while international equities posted strong gains. European stocks continued to gain. Asian markets were solid, and emerging markets outperformed most regions. Fixed income markets were mixed. High yield and emerging markets bonds were the top performers.
Given the uncertainty in today’s investment environment, we believe that active professional portfolio management offers a potential advantage. Active managers often have the knowledge and flexibility to find the best investment opportunities in the most challenging markets.
Even so, it’s best if investment decisions are based on your long-term goals rather than on short-term market and economic developments. We also encourage you to work with an experienced financial advisor who can help you set goals, determine your tolerance for risk, and build a diversified plan that’s right for you and make adjustments when necessary.
At PGIM Investments, we consider it a great privilege and responsibility to help investors participate in opportunities across global markets while meeting their toughest investment challenges. We’re part of PGIM, a top-10 global investment manager with more than $1 trillion in assets under management. This investment expertise allows us to deliver actively managed funds and strategies to meet the needs of investors around the globe.
Thank you for choosing our family of funds.
Sincerely,

Stuart S. Parker, President
Prudential Real Estate Income Fund
December 15, 2017
| Prudential Real Estate Income Fund | 7 |
Your Fund’s Performance (unaudited)
Performance data quoted represents past performance. Past performance does not guarantee future results. The investment return and principal value of an investment will fluctuate, so that an investor’s shares, when redeemed, may be worth more or less than their original cost. Current performance may be lower or higher than the past performance data quoted. An investor may obtain performance data as of the most recent month-end by visiting our website at www.pgiminvestments.com or by calling (800) 225-1852.
Average Annual Total Returns as of 10/31/17 (with sales charges) | ||||||
| One Year (%) | Since Inception (%) | |||||
| Class A | –1.15 | 1.22 (6/3/15) | ||||
| Class C | 2.83 | 2.87 (6/3/15) | ||||
| Class Q | N/A | 7.43* (12/28/16) | ||||
| Class Z | 4.85 | 3.87 (6/3/15) | ||||
| Custom Blend Index | 3.42 | — | ||||
| Lipper Global Real Estate Funds Average | 7.24 | — | ||||
| Average Annual Total Returns as of 10/31/17 (without sales charges) | ||||||
| One Year (%) | Since Inception (%) | |||||
| Class A | 4.60 | 3.62 (6/3/15) | ||||
| Class C | 3.83 | 2.87 (6/3/15) | ||||
| Class Q | N/A | 7.43* (12/28/16) | ||||
| Class Z | 4.85 | 3.87 (6/3/15) | ||||
| Custom Blend Index | 3.42 | — | ||||
| Lipper Global Real Estate Funds Average | 7.24 | — | ||||
*Not annualized
| 8 | Visit our website at pgiminvestments.com |
Growth of a $10,000 Investment
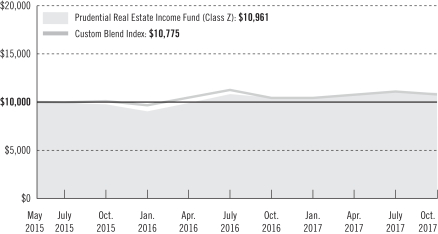
The graph compares a $10,000 investment in the Prudential Real Estate Income Fund (Class Z shares) with a similar investment in the Custom Blend Index by portraying the initial account values at the commencement of operations for Class Z shares (June 3, 2015) and the account values at the end of the current fiscal year (October 31, 2017) as measured on a quarterly basis. For purposes of the graph, and unless otherwise indicated, it has been assumed that (a) all recurring fees (including management fees) were deducted; and (b) all dividends and distributions were reinvested. The line graph provides information for Class Z shares only. As indicated in the tables provided earlier, performance for Class A, Class C, and Class Q shares will vary due to the differing charges and expenses applicable to each share class (as indicated in the following paragraphs). Without waiver of fees and/or expense reimbursements, if any, the returns would have been lower.
Past performance does not predict future performance. Total returns and the ending account values in the graph include changes in share price and reinvestment of dividends and capital gains distributions in a hypothetical investment for the periods shown. The Fund’s total returns do not reflect the deduction of income taxes on an individual’s investment. Taxes may reduce your actual investment returns on income or gains paid by the Fund or any gains you may realize if you sell your shares.
Source: PGIM Investments LLC and Lipper Inc.
Since Inception returns are provided since the Fund has than 10 fiscal years of returns. Since Inception returns for the Index and the Lipper Average are measured from the closest month-end to the inception date for the indicated share class.
| Prudential Real Estate Income Fund | 9 |
Your Fund’s Performance (continued)
The returns in the tables do not reflect the deduction of taxes that a shareholder would pay on Fund distributions or following the redemption of Fund shares. The average annual total returns take into account applicable sales charges, which are described for each share class in the table below.
| Class A* | Class C* | Class Q | Class Z* | |||||
| Maximum initial sales charge | 5.50% of the public offering price | None | None | None | ||||
| Contingent deferred sales charge (CDSC) (as a percentage of the lower of original purchase price or net asset value at redemption) | 1.00% on sales of $1 million or more made within 12 months of purchase | 1.00% on sales made within 12 months of purchase | None | None | ||||
| Annual distribution and service (12b-1) fees (shown as a percentage of average daily net assets) | 0.30% (0.25% currently) | 1.00% | None | None |
*Certain share classes will be generally closed to investments by new group retirement plans effective on or about June 1, 2018. Please see the “PRUDENTIAL FUNDS—UPDATE” on page 4 of this report for more information.
Benchmark Definitions
Custom Blend Index—The Custom Blend Index is a model portfolio consisting of the FTSE EPRA/NAREIT Developed Index (80%), which is an unmanaged index and reflects the stock performance of companies engaged in specific aspects of the major real estate markets/regions of the world; and the BofA Merrill Lynch 7% Constrained REIT Preferred Securities Index (20%), which is an unmanaged index that is a subset of the BofA Merrill Lynch Fixed Rate Preferred Securities Index including all REIT-issued preferred securities. The average annual total return for the Custom Blend Index measured from the month-end closest to the inception date of the Fund’s Class A, Class, C, and Class Z shares through 10/31/17 is 3.14%. Class Q shares have been in existence for less than one year and have no average annual total return performance information available.
Lipper Global Real Estate Funds Average—The Lipper Global Real Estate Funds Average includes funds that invest at least 25% but less than 75% of their equity portfolios in shares of companies engaged in the real estate industry that are strictly outside of the US or whose securities are principally traded outside of the US. The average annual total return for the Lipper Average measured from the month-end closest to the inception date of the Fund’s Class A, Class, C, and Class Z shares through 10/31/17 is 3.34%. Class Q shares have been in existence for less than one year and have no average annual total return performance information available.
| 10 | Visit our website at pgiminvestments.com |
Investors cannot invest directly in an index or average. The returns for the Index would be lower if they included the effects of sales charges, operating expenses of a mutual fund, or taxes. Returns for the Lipper Average reflect the deduction of operating expenses, but not sales charges or taxes.
Presentation of Fund Holdings
| Five Largest Holdings expressed as a percentage of net assets as of 10/31/17 (%) | ||||
| Community Healthcare Trust, Inc., Health Care REITs | 6.3 | |||
| Park Hotels & Resorts, Inc., Hotel & Resort REITs | 5.1 | |||
| MedEquities Realty Trust, Inc., Health Care REITs | 5.0 | |||
| EPR Properties, Specialized REITs | 4.8 | |||
| Medical Properties Trust, Inc., Health Care REITs | 4.8 | |||
Holdings reflect only long-term investments and are subject to change.
| Five Largest Real Estate Industries expressed as a percentage of net assets as of 10/31/17 (%) | ||||
| Health Care | 30.7 | |||
| Retail | 20.7 | |||
| Industrial | 14.6 | |||
| Hotel & Resort | 13.0 | |||
| Diversified | 8.4 | |||
Industry weightings reflect only long-term investments and are subject to change.
| Prudential Real Estate Income Fund | 11 |
Strategy and Performance Overview
How did the Fund perform?
The Prudential Real Estate Income Fund’s Class Z shares gained 4.85%, for the 12-month reporting period ended October 31, 2017. The Fund outperformed the 3.42% return of the Custom Blend Index (the Index) and underperformed the 7.24% return of the Lipper Global Real Estate Funds Average.
What were conditions like in the global real estate securities market?
| • | In the US, real estate investment trust (REIT) returns were primarily driven by shifting views on interest rates, tax legislation, concerns over where we are in the real estate cycle, as well as continued strong real estate fundamentals. Investors rewarded property types that demonstrated the best cash flow growth with premium multiples for the top- performing industrial and data center sectors. |
| • | The level of jobs growth continued to create ample real estate demand to absorb vacancies and create pricing power in most property types and markets. However, the growth in jobs was not so much that it created material supply additions, with the exception of apartments, self-storage, and select industrial and hotel markets. New supply, remains well below historical averages and near historical lows at 1% of existing supply. M&A (merger and acquisition) activity accelerated during the year as a low cost of capital combined with REITs trading at discounts to net asset value provided a good environment for deals. From a relative valuation perspective, certain core real estate property types are trading at wide discounts relative to their historical levels. |
| • | Europe has been the global region with the strongest performance over the last 12 months. While political risk troubled investors at the beginning of 2017 with numerous upcoming elections across Europe, the Index began a strong recovery beginning in late April following positive results in the Dutch and French elections. |
| • | The very low interest rate environment has persisted in the eurozone for longer than investors had originally anticipated, creating downward pressure on capitalization rates (the rate of return on a real estate investment property based on the expected income that the property will generate) across the region, especially for core properties in the more liquid markets. |
| • | Foreign investor demand was strong and rental growth momentum was robust in the major continental markets. The UK also kept pace with the wider European market. Stock prices and the currency bounced from their post-Brexit lows in the third quarter of 2016, as the real estate market did not experience the sudden contraction that had been feared. However, the UK began underperforming the rest of Europe following the June 2017 election that weakened the current government as uncertainty over the shape and implications of Brexit grew. |
| 12 | Visit our website at pgiminvestments.com |
| • | Asia Pacific developers had their best showing in years, led by Singapore and Hong Kong developers. Positive growth expectations, lower interest rates, and reduced housing policy risk were factors contributing to their re-rating. The Hong Kong developers also had the added advantage of firm mainland Chinese investment demand, value-accretive asset disposals, farmland conversions, and more shareholders’ friendly policies. |
| • | Japanese developers did well on better than expected condominium sales and solid office demand. The electoral victory by Shinzo Abe’s Liberal Democratic Party (LDP) reinforced reflation (an uptick in market prices) expectations and accommodative monetary policy – a positive for real estate developers. |
| • | Asia Pacific REITs showed mixed performance in the past 12 months, with Singapore REITs leading the pack, followed by the Australian REITs. In Singapore, office REITs benefited from a recovery given limited Grade A completions in the next two years. In Australia, demand for the highest-quality or Grade-A offices remained robust whereas retail faced ongoing challenges, with competition from Amazon and a cyclical consumption slowdown. Given the sharp escalation in physical asset pricing, While Japanese developers did well, Japanese REITs corrected the most as a result of diminished acquisition growth expectations. |
What worked and didn’t work?
| • | The Asia Pacific region posted the strongest relative performance in the Fund for the reporting period, as both Singapore and Japan performed favorably. North America also contributed to performance, due to sound results in the US health care and hotel sectors. The office and specialty sectors also positively impacted performance for the period. |
| • | On a regional basis, Europe detracted from performance. Germany and the United Kingdom saw the greatest underperformance due to asset allocation; however, most countries lagged. In the US the shopping center, industrial and data center sectors negatively impacted performance, as did Hong Kong in the Asia Pacific region. |
Current outlook
| • | In the US, REITs should experience continued improvement in operating fundamentals and are expected to deliver a high dividend and 5%-7% cash flow growth in the next 12 months. US REITs offer a valuable combination of income and growth in a volatile market. The market continues to revise its expectations around the timing and magnitude of interest-rate policy changes. Merger and acquisition activity has picked up and is expected to continue for the remainder of 2017, particularly if small capitalization REITs continue to trade at discounts to private real estate value. |
| • | Eurozone economic indicators continue to improve slowly and the monetary policy backdrop remains loose. While the European Central Bank (ECB) has announced plans |
| Prudential Real Estate Income Fund | 13 |
Strategy and Performance Overview (continued)
| to gradually scale back quantitative easing, the overall economic and real estate environment in Europe is modestly positive. The exception to this benign environment appears to be the UK, where the process of the UK’s exit from the EU only began at the end of March 2017. Real estate fundamentals look solid across continental Europe. New supply is generally under control and there is evidence of at least modest rental growth in most markets. The backdrop of monetary policy is expected to remain supportive for some time. |
| • | The Asia Pacific region should continue to see value, notwithstanding rising interest rates that could pose a challenge to REITs. The themes we see that could be favorable in the coming months are: strategic review/asset disposal on the back of strong capital appreciation, especially in Hong Kong office and retail stocks, flight-to-quality, particularly among Singapore office securities, and lastly, conducive monetary policy among the Japan developers. A weaker US dollar/stronger yen could derail economic momentum in Japan and impact underlying demand for condos and office space. On the other hand, lowered expectations of Fed hikes and an easing in monetary conditions would be viewed positively for Hong Kong developers. |
The percentage points shown in the tables below identify each security’s positive or negative contribution to the Fund’s return relative to the benchmark, which is the sum of all contributions by individual holdings.
| Top Contributors (%) | Top Detractors (%) | |||||
| Community Healthcare Trust, Inc. | 2.46 | Prologis Property Mexico, S.A. de C.V | –0.31 | |||
| DiamondRock Hospitality Company | 0.89 | CBL & Associates Properties, Inc. | –0.39 | |||
| MGM Growth Properties LLC Class A | 0.88 | Washington Prime Group Inc. | –0.59 | |||
| Park Hotels & Resorts, Inc. | 0.80 | Spirit Realty Capital, Inc. | –1.68 | |||
| Cache Logistics Trust | 0.75 | DDR Corp. | –1.85 | |||
| 14 | Visit our website at pgiminvestments.com |
Comments on Largest Holdings
| 6.3% | Community Healthcare Trust Inc., Health Care REITs |
Community Healthcare Trust is a fully integrated health care real estate company which acquires and owns properties that are leased to hospitals, doctors, health care systems or other health care service providers in non-urban markets.
| 5.1% | Park Hotels & Resorts, Inc., Hotel & Resort REITs |
Park Hotels & Resorts owns and operates hotels. It offers services and amenities such as accommodations, dining, meeting and wedding rooms, spas, and fitness centers. Park Hotels & Resorts serves customers worldwide.
| 5.0% | MedEquities Realty Trust, Inc., Health Care REITs |
MedEquities Realty Trust focuses on investment in a diversified mix of health care properties and health care related real estate debt investments. MedEquities Realty Trust owns, develops, operates, leases, and disposes of health care properties and portfolios.
| 4.8% | EPR Properties, Specialized REITs |
EPR Properties is a real estate investment trust. It acquires and develops properties leased to entertainment and entertainment-related business operators, generally under long-term triple net leases. It plans to focus primarily on megaplex theaters and entertainment-themed retail centers.
| 4.8% | Medical Properties Trust, Inc., Health Care REITs |
Medical Properties Trust was formed to acquire and develop net-leased health-care facilities. These facilities include inpatient rehabilitation hospitals, long-term acute care hospitals, regional acute care hospitals, ambulatory surgery centers, and other single-discipline health-care facilities such as heart hospitals.
| Prudential Real Estate Income Fund | 15 |
Fees and Expenses (unaudited)
As a shareholder of the Fund, you incur two types of costs: (1) transaction costs, including sales charges (loads) on purchase payments and redemptions, as applicable, and (2) ongoing costs, including management fees, distribution and/or service (12b-1) fees, and other Fund expenses, as applicable. This example is intended to help you understand your ongoing costs (in dollars) of investing in the Fund and to compare these costs with the ongoing costs of investing in other mutual funds.
The example is based on an investment of $1,000 held through the six-month period ended October 31, 2017. The example is for illustrative purposes only; you should consult the Prospectus for information on initial and subsequent minimum investment requirements.
Actual Expenses
The first line for each share class in the table on the following page provides information about actual account values and actual expenses. You may use the information on this line, together with the amount you invested, to estimate the expenses that you paid over the period. Simply divide your account value by $1,000 (for example, an $8,600 account value ÷ $1,000 = 8.6), then multiply the result by the number on the first line under the heading “Expenses Paid During the Six-Month Period” to estimate the expenses you paid on your account during this period.
Hypothetical Example for Comparison Purposes
The second line for each share class in the table on the following page provides information about hypothetical account values and hypothetical expenses based on the Fund’s actual expense ratio and an assumed rate of return of 5% per year before expenses, which is not the Fund’s actual return. The hypothetical account values and expenses may not be used to estimate the actual ending account balance or expenses you paid for the period. You may use this information to compare the ongoing costs of investing in the Fund and other funds. To do so, compare this 5% hypothetical example with the 5% hypothetical examples that appear in the shareholder reports of the other funds.
The Fund’s transfer agent may charge additional fees to holders of certain accounts that are not included in the expenses shown in the table on the following page. These fees apply to individual retirement accounts (IRAs) and Section 403(b) accounts. As of the close of the six-month period covered by the table, IRA fees included an annual maintenance fee of $15 per account (subject to a maximum annual maintenance fee of $25 for all accounts held by the same shareholder). Section 403(b) accounts are charged an annual $25 fiduciary maintenance fee. Some of the fees may vary in amount, or may be waived, based on your total account balance or the number of Prudential funds, including the Fund, that you own. You should consider the additional fees that were charged to your Fund account over the six-month period when you estimate the total ongoing expenses paid over the
| 16 | Visit our website at pgiminvestments.com |
period and the impact of these fees on your ending account value, as these additional expenses are not reflected in the information provided in the expense table. Additional fees have the effect of reducing investment returns.
Please note that the expenses shown in the table are meant to highlight your ongoing costs only and do not reflect any transactional costs such as sales charges (loads). Therefore, the second line for each share class in the table is useful in comparing ongoing costs only and will not help you determine the relative total costs of owning different funds. In addition, if these transactional costs were included, your costs would have been higher.
| Prudential Real Estate Income Fund | Beginning Account Value May 1, 2017 | Ending Account Value October 31, 2017 | Annualized Expense Ratio Based on the Six-Month Period | Expenses Paid During the Six-Month Period* | ||||||||||||||
| Class A | Actual | $ | 1,000.00 | $ | 1,020.80 | 1.35 | % | $ | 6.88 | |||||||||
| Hypothetical | $ | 1,000.00 | $ | 1,018.40 | 1.35 | % | $ | 6.87 | ||||||||||
| Class C | Actual | $ | 1,000.00 | $ | 1,016.80 | 2.10 | % | $ | 10.68 | |||||||||
| Hypothetical | $ | 1,000.00 | $ | 1,014.62 | 2.10 | % | $ | 10.66 | ||||||||||
| Class Q | Actual | $ | 1,000.00 | $ | 1,021.00 | 1.10 | % | $ | 5.60 | |||||||||
| Hypothetical | $ | 1,000.00 | $ | 1,019.66 | 1.10 | % | $ | 5.60 | ||||||||||
| Class Z | Actual | $ | 1,000.00 | $ | 1,021.00 | 1.10 | % | $ | 5.60 | |||||||||
| Hypothetical | $ | 1,000.00 | $ | 1,019.66 | 1.10 | % | $ | 5.60 | ||||||||||
*Fund expenses (net of fee waivers or subsidies, if any) for each share class are equal to the annualized expense ratio for each share class (provided in the table), multiplied by the average account value over the period, multiplied by the 184 days in the six-month period ended October 31, 2017, and divided by the 365 days in the Fund’s fiscal year ended October 31, 2017 (to reflect the six-month period). Expenses presented in the table include the expenses of any underlying funds in which the Fund may invest.
| Prudential Real Estate Income Fund | 17 |
Schedule of Investments
as of October 31, 2017
| Description | Shares | Value | ||||||
LONG-TERM INVESTMENTS 99.5% | ||||||||
COMMON STOCKS 79.1% | ||||||||
Diversified REITs 6.8% | ||||||||
AEW UK REIT PLC (United Kingdom) | 150,000 | $ | 202,188 | |||||
Gramercy Property Trust | 7,805 | 231,808 | ||||||
Lexington Realty Trust | 25,450 | 257,554 | ||||||
Suntec Real Estate Investment Trust (Singapore) | 82,549 | 118,176 | ||||||
|
| |||||||
| 809,726 | ||||||||
Health Care REITs 30.7% | ||||||||
Community Healthcare Trust, Inc. | 27,360 | 750,485 | ||||||
MedEquities Realty Trust, Inc. | 51,213 | 595,095 | ||||||
Medical Properties Trust, Inc. | 42,984 | 568,678 | ||||||
Omega Healthcare Investors, Inc. | 11,465 | 330,880 | ||||||
Physicians Realty Trust | 23,947 | 416,199 | ||||||
Sabra Health Care REIT, Inc. | 14,600 | 290,832 | ||||||
Senior Housing Properties Trust | 15,254 | 280,674 | ||||||
Welltower, Inc. | 6,246 | 418,232 | ||||||
|
| |||||||
| 3,651,075 | ||||||||
Hotel & Resort REITs 9.5% | ||||||||
Invincible Investment Corp. (Japan) | 288 | 116,727 | ||||||
MGM Growth Properties LLC, (Class A Stock) | 13,552 | 399,919 | ||||||
Park Hotels & Resorts, Inc. | 21,283 | 612,738 | ||||||
|
| |||||||
| 1,129,384 | ||||||||
Industrial REITs 10.6% | ||||||||
Ascendas Real Estate Investment Trust (Singapore) | 71,465 | 143,691 | ||||||
Cache Logistics Trust (Singapore) | 914,067 | 549,731 | ||||||
Frasers Logistics & Industrial Trust (Singapore) | 173,418 | 141,849 | ||||||
Prologis Property Mexico SA de CV (Mexico) | 98,151 | 191,216 | ||||||
STAG Industrial, Inc. | 8,524 | 232,705 | ||||||
|
| |||||||
| 1,259,192 | ||||||||
Residential REITs 1.0% | ||||||||
Empiric Student Property PLC (United Kingdom) | 90,623 | 117,097 | ||||||
Retail REITs 14.8% | ||||||||
Eurocommercial Properties NV (Netherlands) | 5,627 | 234,302 | ||||||
NewRiver REIT PLC (United Kingdom) | 26,442 | 117,656 | ||||||
Retail Properties of America, Inc., (Class A Stock) | 33,090 | 404,360 | ||||||
Slate Retail REIT (Canada) | 13,014 | 133,156 | ||||||
Starhill Global REIT (Singapore) | 250,105 | 141,318 | ||||||
Taubman Centers, Inc. | 4,790 | 226,184 | ||||||
See Notes to Financial Statements.
| Prudential Real Estate Income Fund | 19 |
Schedule of Investments (continued)
as of October 31, 2017
| Description | Shares | Value | ||||||
COMMON STOCKS (Continued) | ||||||||
Retail REITs (cont’d.) | ||||||||
Vicinity Centres (Australia) | 1 | $ | 2 | |||||
Washington Prime Group, Inc. | 40,631 | 318,141 | ||||||
Wereldhave NV (Netherlands) | 4,075 | 185,250 | ||||||
|
| |||||||
| 1,760,369 | ||||||||
Specialized REITs 5.7% | ||||||||
EPR Properties | 8,226 | 569,075 | ||||||
Life Storage, Inc. | 1,433 | 115,815 | ||||||
|
| |||||||
| 684,890 | ||||||||
|
| |||||||
TOTAL COMMON STOCKS | 9,411,733 | |||||||
|
| |||||||
PREFERRED STOCKS 20.4% | ||||||||
Diversified REITs 1.6% | ||||||||
Investors Real Estate Trust* | 7,250 | 183,063 | ||||||
Hotel & Resort REITs 3.5% | ||||||||
Pebblebrook Hotel Trust | 4,648 | 120,313 | ||||||
Sunstone Hotel Investors, Inc. | 11,200 | 297,360 | ||||||
|
| |||||||
| 417,673 | ||||||||
Industrial REITs 4.0% | ||||||||
Monmouth Real Estate Investment Corp. | 7,100 | 178,849 | ||||||
Rexford Industrial Realty, Inc. | 4,600 | 116,380 | ||||||
STAG Industrial, Inc. | 6,901 | 185,292 | ||||||
|
| |||||||
| 480,521 | ||||||||
Residential REITs 5.4% | ||||||||
American Homes 4 Rent | 13,650 | 354,900 | ||||||
UMH Properties, Inc.(a) | 10,410 | 290,959 | ||||||
|
| |||||||
| 645,859 | ||||||||
Retail REITs 5.9% | ||||||||
Cedar Realty Trust, Inc.* | 8,250 | 208,106 | ||||||
Pennsylvania Real Estate Investment Trust | 9,400 | 247,220 | ||||||
Urstadt Biddle Properties, Inc. | 9,231 | 245,453 | ||||||
|
| |||||||
| 700,779 | ||||||||
|
| |||||||
TOTAL PREFERRED STOCKS | 2,427,895 | |||||||
|
| |||||||
TOTAL LONG-TERM INVESTMENTS | 11,839,628 | |||||||
|
| |||||||
See Notes to Financial Statements.
| 20 |
| Description | Shares | Value | ||||||
SHORT-TERM INVESTMENTS 0.4% | ||||||||
AFFILIATED MUTUAL FUNDS | ||||||||
Prudential Investment Portfolios 2 - Prudential Core Ultra Short Bond Fund(w) | 6,055 | $ | 6,055 | |||||
Prudential Investment Portfolios 2 - Prudential Institutional Money Market Fund | 39,581 | 39,585 | ||||||
|
| |||||||
TOTAL SHORT-TERM INVESTMENTS | 45,640 | |||||||
|
| |||||||
TOTAL INVESTMENTS 99.9% | 11,885,268 | |||||||
Other assets in excess of liabilities 0.1% | 13,170 | |||||||
|
| |||||||
NET ASSETS 100.0% | $ | 11,898,438 | ||||||
|
| |||||||
The following abbreviations are used in the annual report:
LIBOR—London Interbank Offered Rate
REIT(s)—Real Estate Investment Trust(s)
| * | Non-income producing security. |
| (a) | All or a portion of security is on loan. The aggregate market value of such securities, including those sold and pending settlement, is $38,942; cash collateral of $39,550 (included in liabilities) was received with which the Fund purchased highly liquid short-term investments. |
| (b) | Represents security purchased with cash collateral received for securities on loan and includes dividend reinvestment. |
| (w) | PGIM Investments LLC, the manager of the Fund, also serves as manager of the Prudential Investment Portfolios 2 - Prudential Core Ultra Short Bond Fund and Prudential Institutional Money Market Fund. |
Fair Value Measurements:
Various inputs are used in determining the value of the Fund’s investments. These inputs are summarized in the three broad levels listed below.
Level 1—unadjusted quoted prices generally in active markets for identical securities.
Level 2—quoted prices for similar securities, interest rates and yield curves, prepayment speeds, foreign currency exchange rates and other observable inputs.
Level 3—unobservable inputs for securities valued in accordance with Board approved fair valuation procedures.
See Notes to Financial Statements.
| Prudential��Real Estate Income Fund | 21 |
Schedule of Investments (continued)
as of October 31, 2017
The following is a summary of the inputs used as of October 31, 2017 in valuing such portfolio securities:
| Level 1 | Level 2 | Level 3 | ||||||||||
Investments in Securities | ||||||||||||
Common Stocks | ||||||||||||
Diversified REITs | $ | 489,362 | $ | 320,364 | $ | — | ||||||
Health Care REITs | 3,651,075 | — | — | |||||||||
Hotel & Resort REITs | 1,012,657 | 116,727 | — | |||||||||
Industrial REITs | 423,921 | 835,271 | — | |||||||||
Residential REITs | — | 117,097 | — | |||||||||
Retail REITs | 1,081,841 | 678,528 | — | |||||||||
Specialized REITs | 684,890 | — | — | |||||||||
Preferred Stocks | ||||||||||||
Diversified REITs | 183,063 | — | — | |||||||||
Hotel & Resort REITs | 417,673 | — | — | |||||||||
Industrial REITs | 480,521 | — | — | |||||||||
Residential REITs | 645,859 | — | — | |||||||||
Retail REITs | 700,779 | — | — | |||||||||
Affiliated Mutual Funds | 45,640 | — | — | |||||||||
|
|
|
|
|
| |||||||
Total | $ | 9,817,281 | $ | 2,067,987 | $ | — | ||||||
|
|
|
|
|
| |||||||
It is the Fund’s policy to recognize transfers in and transfers out at the fair value as of the beginning of period. Securities transferred levels as follows:
Investments in Securities | Amount Transferred | Level Transfer | Logic | |||||||||
Preferred Stocks | $ | 193,130 | L2 to L1 | Model Price to Official Close | ||||||||
Industry Classification:
The industry classification of investments and other assets in excess of liabilities shown as a percentage of net assets as of October 31, 2017 were as follows (unaudited):
Health Care REITs | 30.7 | % | ||
Retail REITs | 20.7 | |||
Industrial REITs | 14.6 | |||
Hotel & Resort REITs | 13.0 | |||
Diversified REITs | 8.4 | |||
Residential REITs | 6.4 | |||
Specialized REITs | 5.7 | |||
Affiliated Mutual Funds (including 0.3% of collateral for securities on loan) | 0.4 | % | ||
|
| |||
| 99.9 | ||||
Other assets in excess of liabilities | 0.1 | |||
|
| |||
| 100.0 | % | |||
|
|
See Notes to Financial Statements.
| 22 |
Financial Instruments/Transactions—Summary of Offsetting and Netting Arrangements:
The Fund entered into financial instruments/transactions during the reporting period that are either offset in accordance with current requirements or are subject to enforceable master netting arrangements or similar agreements that permit offsetting. The information about offsetting and related netting arrangements for financial instruments/transactions, where the legal right to set-off exists, is presented in the summary below.
Offsetting of financial instruments/transactions assets and liabilities:
Description | Gross Market Value of Recognized Assets/ (Liabilities) | Collateral Pledged/ (Received)(1) | Net Amount | |||||||||
Securities on Loan | $ | 38,942 | $ | (38,942 | ) | $ | — | |||||
|
| |||||||||||
| (1) | Collateral amount disclosed by the Fund is limited to the market value of financial instruments/transactions. |
See Notes to Financial Statements.
| Prudential Real Estate Income Fund | 23 |
Statement of Assets & Liabilities
as of October 31, 2017
Assets | ||||
Investments at value, including securities on loan of $38,942: | ||||
Unaffiliated investments (cost $11,474,341) | $ | 11,839,628 | ||
Affiliated investments (cost $45,640) | 45,640 | |||
Receivable for investments sold | 114,432 | |||
Dividends and interest receivable | 29,157 | |||
Due from Manager | 15,252 | |||
Tax reclaim receivable | 2,293 | |||
Prepaid expenses | 835 | |||
|
| |||
Total assets | 12,047,237 | |||
|
| |||
Liabilities | ||||
Loan payable | 45,000 | |||
Payable for investments purchased | 43,659 | |||
Payable to broker for collateral for securities on loan | 39,550 | |||
Accrued expenses and other liabilities | 16,555 | |||
Payable for Fund shares reacquired | 3,358 | |||
Distribution fee payable | 453 | |||
Affiliated transfer agent fee payable | 176 | |||
Loan interest payable | 48 | |||
|
| |||
Total liabilities | 148,799 | |||
|
| |||
Net Assets | $ | 11,898,438 | ||
|
| |||
Net assets were comprised of: | ||||
Shares of beneficial interest, at par | $ | 1,237 | ||
Paid-in capital in excess of par | 12,004,448 | |||
|
| |||
| 12,005,685 | ||||
Undistributed net investment income | 26,927 | |||
Accumulated net realized loss on investment and foreign currency transactions | (499,203 | ) | ||
Net unrealized appreciation on investments and foreign currencies | 365,029 | |||
|
| |||
Net assets, October 31, 2017 | $ | 11,898,438 | ||
|
| |||
See Notes to Financial Statements.
| 24 |
Class A | ||||
Net asset value and redemption price per share, | $ | 9.62 | ||
Maximum sales charge (5.50% of offering price) | 0.56 | |||
|
| |||
Maximum offering price to public | $ | 10.18 | ||
|
| |||
Class C | ||||
Net asset value, offering price and redemption price per share, | $ | 9.62 | ||
|
| |||
Class Q | ||||
Net asset value, offering price and redemption price per share, | $ | 9.62 | ||
|
| |||
Class Z | ||||
Net asset value, offering price and redemption price per share, | $ | 9.62 | ||
|
| |||
See Notes to Financial Statements.
| Prudential Real Estate Income Fund | 25 |
Statement of Operations
Year Ended October 31, 2017
Net Investment Income (Loss) | ||||
Income | ||||
Unaffiliated dividend income (net of foreign withholding taxes of $13,460) | $ | 526,862 | ||
Affiliated dividend income | 1,458 | |||
Income from securities lending, net (including affiliated income of $109) | 1,272 | |||
|
| |||
Total income | 529,592 | |||
|
| |||
Expenses | ||||
Management fee | 80,185 | |||
Distribution fee—Class A | 2,231 | |||
Distribution fee—Class C | 3,095 | |||
Custodian and accounting fees | 54,000 | |||
Registration fees | 49,000 | |||
Audit fee | 32,000 | |||
Legal fees and expenses | 24,000 | |||
Shareholders’ reports | 23,000 | |||
Trustees’ fees | 10,000 | |||
Transfer agent’s fees and expenses (including affiliated expense of $1,100) | 8,000 | |||
Miscellaneous | 16,520 | |||
|
| |||
Total expenses | 302,031 | |||
Less: Management fee waiver and/or expense reimbursement | (186,402 | ) | ||
Distribution fee waiver—Class A | (372 | ) | ||
|
| |||
Net expenses | 115,257 | |||
|
| |||
Net investment income (loss) | 414,335 | |||
|
| |||
Realized And Unrealized Gain (Loss) On Investments And Foreign Currency Transactions | ||||
Net realized gain (loss) on: | ||||
Investment transactions (including affiliated of $19) | (234,545 | ) | ||
Foreign currency transactions | (506 | ) | ||
|
| |||
| (235,051 | ) | |||
|
| |||
Net change in unrealized appreciation (depreciation) on: | ||||
Investments (including affiliated of $(32)) | 398,205 | |||
Foreign currencies | (208 | ) | ||
|
| |||
| 397,997 | ||||
|
| |||
Net gain (loss) on investment and foreign currency transactions | 162,946 | |||
|
| |||
Net Increase (Decrease) In Net Assets Resulting From Operations | $ | 577,281 | ||
|
| |||
See Notes to Financial Statements.
| 26 |
Statement of Changes in Net Assets
| Year Ended October 31, | ||||||||
| 2017 | 2016 | |||||||
Increase (Decrease) in Net Assets | ||||||||
Operations | ||||||||
Net investment income (loss) | $ | 414,335 | $ | 206,945 | ||||
Net realized gain (loss) on investment and foreign currency transactions | (235,051 | ) | 55,424 | |||||
Net change in unrealized appreciation (depreciation) on investments and foreign currencies | 397,997 | 103,089 | ||||||
|
|
|
| |||||
Net increase (decrease) in net assets resulting from operations | 577,281 | 365,458 | ||||||
|
|
|
| |||||
Dividends from net investment income | ||||||||
Class A | (37,709 | ) | (11,790 | ) | ||||
Class C | (12,902 | ) | (6,735 | ) | ||||
Class Q | (438 | ) | — | |||||
Class Z | (475,529 | ) | (308,719 | ) | ||||
|
|
|
| |||||
| (526,578 | ) | (327,244 | ) | |||||
|
|
|
| |||||
Fund share transactions (Net of share conversions) | ||||||||
Net proceeds from shares sold | 6,003,066 | 1,198,822 | ||||||
Net asset value of shares issued in reinvestment of dividends | 524,023 | 327,133 | ||||||
Cost of shares reacquired | (1,149,313 | ) | (26,047 | ) | ||||
|
|
|
| |||||
Net increase (decrease) in net assets from Fund share transactions | 5,377,776 | 1,499,908 | ||||||
|
|
|
| |||||
Total increase (decrease) | 5,428,479 | 1,538,122 | ||||||
Net Assets: | ||||||||
Beginning of year | 6,469,959 | 4,931,837 | ||||||
|
|
|
| |||||
End of year(a) | $ | 11,898,438 | $ | 6,469,959 | ||||
|
|
|
| |||||
(a) Includes undistributed net investment income of: | $ | 26,927 | $ | — | ||||
|
|
|
| |||||
See Notes to Financial Statements.
| Prudential Real Estate Income Fund | 27 |
Notes to Financial Statements
Prudential Investment Portfolios 9 (the “Trust”) is registered under the Investment Company Act of 1940, as amended (“1940 Act”), as an open-end management investment company. The Trust was established as a Delaware business trust on September 18, 1998. The Trust currently consists of five funds: Prudential Absolute Return Bond Fund and Prudential QMA Large-Cap Core Equity Fund which are diversified funds and Prudential International Bond Fund, Prudential Select Real Estate Fund and Prudential Real Estate Income Fund which are non-diversified funds. These financial statements relate to Prudential Real Estate Income Fund (the “Fund”).
The investment objective of the Fund is to seek income and capital appreciation.
1. Accounting Policies
The Fund follows investment company accounting and reporting guidance of the Financial Accounting Standards Board (“FASB”) Accounting Standard Codification Topic 946 Financial Services—Investment Companies. The following accounting policies conform to U.S. generally accepted accounting principles. The Fund consistently follows such policies in the preparation of its financial statements.
Securities Valuation: The Fund holds securities and other assets and liabilities that are fair valued at the close of each day (generally, 4:00 PM Eastern time) the New York Stock Exchange (“NYSE”) is open for trading. Fair value is the price that would be received to sell an asset or paid to transfer a liability in an orderly transaction between market participants on the measurement date. The Board of Trustees (the “Board”) has adopted valuation procedures for security valuation under which fair valuation responsibilities have been delegated to PGIM Investments LLC (“PGIM Investments” or “the Manager”) (formerly known as Prudential Investments LLC). Under the current valuation procedures, the Valuation Committee is responsible for supervising the valuation of portfolio securities and other assets and liabilities. The valuation procedures permit the Fund to utilize independent pricing vendor services, quotations from market makers, and alternative valuation methods when market quotations are either not readily available or not deemed representative of fair value. A record of the Valuation Committee’s actions is subject to the Board’s review, approval, and ratification at its next regularly scheduled quarterly meeting.
Various inputs determine how the Fund’s investments are valued, all of which are categorized according to the three broad levels (Level 1, 2, or 3) detailed in the Schedule of Investments.
Common and preferred stocks, exchange-traded funds, and derivative instruments, such as futures or options, that are traded on a national securities exchange are valued at the last
| 28 |
sale price as of the close of trading on the applicable exchange where the security principally trades. Securities traded via NASDAQ are valued at the NASDAQ official closing price. To the extent these securities are valued at the last sale price or NASDAQ official closing price, they are classified as Level 1 in the fair value hierarchy. In the event that no sale or official closing price on valuation date exists, these securities are generally valued at the mean between the last reported bid and ask prices, or at the last bid price in the absence of an ask price. These securities are classified as Level 2 in the fair value hierarchy.
Foreign equities traded on foreign securities exchanges are generally valued using pricing vendor services that provide model prices derived using adjustment factors based on information such as local closing price, relevant general and sector indices, currency fluctuations, depositary receipts, and futures, as applicable. Securities valued using such model prices are classified as Level 2 in the fair value hierarchy. The models generate an evaluated adjustment factor for each security, which is applied to the local closing price to adjust it for post closing market movements. Utilizing that evaluated adjustment factor, the vendor provides an evaluated price for each security. If the vendor does not provide an evaluated price, securities are valued in accordance with exchange-traded common and preferred stock valuation policies discussed above.
Investments in open-end, non-exchange-traded mutual funds are valued at their net asset values as of the close of the NYSE on the date of valuation. These securities are classified as Level 1 in the fair value hierarchy since they may be purchased or sold at their net asset values on the date of valuation.
Securities and other assets that cannot be priced according to the methods described above are valued based on pricing methodologies approved by the Board. In the event that unobservable inputs are used when determining such valuations, the securities will be classified as Level 3 in the fair value hierarchy.
When determining the fair value of securities, some of the factors influencing the valuation include: the nature of any restrictions on disposition of the securities; assessment of the general liquidity of the securities; the issuer’s financial condition and the markets in which it does business; the cost of the investment; the size of the holding and the capitalization of the issuer; the prices of any recent transactions or bids/offers for such securities or any comparable securities; any available analyst media or other reports or information deemed reliable by the investment manager regarding the issuer or the markets or industry in which it operates. Using fair value to price securities may result in a value that is different from a security’s most recent closing price and from the price used by other unaffiliated mutual funds to calculate their net asset values.
Restricted and Illiquid Securities: Subject to guidelines adopted by the Board, the Fund may invest up to 15% of its net assets in illiquid securities, including those which are restricted as to disposition under securities law (“restricted securities”). Restricted securities are valued pursuant to the valuation procedures noted above. Illiquid securities are those that, because of the absence of a readily available market or due to legal or
| Prudential Real Estate Income Fund | 29 |
Notes to Financial Statements (continued)
contractual restrictions on resale, cannot be sold within seven days in the ordinary course of business at approximately the amount at which the Fund has valued the investment. Therefore, the Fund may find it difficult to sell illiquid securities at the time considered most advantageous by its Subadviser and may incur expenses that would not be incurred in the sale of securities that were freely marketable. Certain securities that would otherwise be considered illiquid because of legal restrictions on resale to the general public may be traded among qualified institutional buyers under Rule 144A of the Securities Act of 1933. These Rule 144A securities, as well as commercial paper that is sold in private placements under Section 4(2) of the Securities Act, may be deemed liquid by the Fund’s Subadviser under the guidelines adopted by the Trustees of the Fund. However, the liquidity of the Fund’s investments in Rule 144A securities could be impaired if trading does not develop or declines.
Foreign Currency Translation: The books and records of the Fund are maintained in U.S. dollars. Foreign currency amounts are translated into U.S. dollars on the following basis:
(i) market value of investment securities, other assets and liabilities—at the current rates of exchange;
(ii) purchases and sales of investment securities, income and expenses—at the rates of exchange prevailing on the respective dates of such transactions.
Although the net assets of the Fund are presented at the foreign exchange rates and market values at the close of the period, the Fund does not generally isolate that portion of the results of operations arising as a result of changes in the foreign exchange rates from the fluctuations arising from changes in the market prices of long-term portfolio securities held at the end of the period. Similarly, the Fund does not isolate the effect of changes in foreign exchange rates from the fluctuations arising from changes in the market prices of long-term portfolio securities sold during the period. Accordingly, holding period realized foreign currency gains (losses) are included in the reported net realized gains (losses) on investment transactions.
Net realized gains (losses) on foreign currency transactions represent net foreign exchange gains (losses) from the disposition of holdings of foreign currencies, currency gains (losses) realized between the trade and settlement dates on securities transactions, and the difference between the amounts of interest, dividends and foreign withholding taxes recorded on the Fund’s books and the U.S. dollar equivalent amounts actually received or paid. Net unrealized currency gains (losses) from valuing foreign currency denominated assets and liabilities (other than investments) at period end exchange rates are reflected as a component of net unrealized appreciation (depreciation) on foreign currencies.
| 30 |
Master Netting Arrangements: The Trust, on behalf of the Fund, is subject to various Master Agreements, or netting arrangements, with select counterparties. These are agreements which a subadviser may have negotiated and entered into on behalf of the Fund. A master netting arrangement between the Fund and the counterparty permits the Fund to offset amounts payable by the Fund to the same counterparty against amounts to be received; and by the receipt of collateral from the counterparty by the Fund to cover the Fund’s exposure to the counterparty. However, there is no assurance that such mitigating factors are easily enforceable. In addition to master netting arrangements, the right to set-off exists when all the conditions are met such that each of the parties owes the other determinable amounts, the reporting party has the right to set-off the amount owed with the amount owed by the other party, the reporting party intends to set-off and the right of set-off is enforceable by law. During the reporting period, there was no intention to settle on a net basis and all amounts are presented on a gross basis on the Statement of Assets and Liabilities.
Securities Lending: The Fund may lend its portfolio securities to banks and broker-dealers. The loans are secured by collateral at least equal to the market value of the securities loaned. Collateral pledged by each borrower is invested in an affiliated money market fund and is marked to market daily, based on the previous day’s market value, such that the value of the collateral exceeds the value of the loaned securities. Loans are subject to termination at the option of the borrower or the Fund. Upon termination of the loan, the borrower will return to the Fund securities identical to the loaned securities. Should the borrower of the securities fail financially, the Fund has the right to repurchase the securities in the open market using the collateral. The Fund recognizes income, net of any rebate and securities lending agent fees, for lending its securities in the form of fees or interest on the investment of any cash received as collateral. The borrower receives all interest and dividends from the securities loaned and such payments are passed back to the lender in amounts equivalent thereto. The Fund also continues to recognize any unrealized gain (loss) in the market price of the securities loaned and on the change in the value of the collateral invested that may occur during the term of the loan. In addition, realized gain (loss) is recognized on changes in the value of the collateral invested upon liquidation of the collateral. Net earnings from securities lending are disclosed on the Statement of Operations as “Income from securities lending, net”.
Equity and Mortgage Real Estate Investment Trusts (REITs): The Fund invests in equity REITs, which report information on the source of their distributions annually. Based on current and historical information, a portion of distributions received from equity REITs during the period is estimated to be dividend income, capital gain or return of capital and recorded accordingly. When material, these estimates are adjusted periodically when the actual source of distributions is disclosed by the equity REITs.
Concentration of Risk for REITs: Real estate securities are subject to the same risks as direct investments in real estate and mortgages, and their value will depend on the value of the underlying properties or the underlying loans or interests. The underlying loans may be subject to the risks of default or of prepayments that occur earlier or later than expected,
| Prudential Real Estate Income Fund | 31 |
Notes to Financial Statements (continued)
and such loans may also include so-called “subprime” mortgages. The value of these securities will rise and fall in response to many factors, including economic conditions, the demand for rental property and interest rates. In particular, the value of these securities may decline when interest rates rise and will also be affected by the real estate market and by the management of the underlying properties.
Concentration of Risk: Foreign security and currency transactions may involve certain considerations and risks not typically associated with those of domestic origin as a result of, among other factors, the possibility of political or economic instability or the level of governmental supervision and regulation of foreign securities markets.
In addition, investing in REITs involves certain unique risks in addition to those risks associated with investing in the real estate industry in general. Equity REITs may be affected by changes in the value of the underlying property owned by the REITs, while mortgage REITs may be affected by the quality of any credit extended. REITs are dependent upon management skills, may not be diversified geographically or by property/mortgage asset type, and are subject to heavy cash flow dependency, default by borrowers and self-liquidation. REITs may be more volatile and/or more illiquid than other types of equity securities. REITs (especially mortgage REITs) are subject to interest rate risks. REITs may incur significant amounts of leverage. The Fund will indirectly bear a portion of the expenses, including management fees, paid by each REIT in which it invests, in addition to the expenses of the Fund.
Securities Transactions and Net Investment Income: Securities transactions are recorded on the trade date. Realized gains (losses) from investment and currency transactions are calculated on the specific identification method. Dividend income is recorded on the ex-date. Interest income, including amortization of premium and accretion of discount on debt securities, as required, is recorded on the accrual basis. Expenses are recorded on an accrual basis, which may require the use of certain estimates by management that may differ from actual.
Net investment income or loss (other than distribution fees which are charged directly to the respective class and transfer agency fees specific to Class Q shares which are charged to that share class) and unrealized and realized gains (losses) are allocated daily to each class of shares based upon the relative proportion of adjusted net assets of each class at the beginning of the day.
Taxes: It is the Fund’s policy to continue to meet the requirements of the Internal Revenue Code applicable to regulated investment companies and to distribute all of its taxable net investment income and capital gains, if any, to its shareholders. Therefore, no federal income tax provision is required. Withholding taxes on foreign dividends, interest and
| 32 |
capital gains, if any, are recorded, net of reclaimable amounts, at the time the related income is earned.
Dividends and Distributions: The Fund expects to pay dividends from net investment income quarterly. Distributions from net realized capital and currency gains, if any, are declared and paid annually. Dividends and distributions to shareholders, which are determined in accordance with federal income tax regulations and which may differ from generally accepted accounting principles, are recorded on the ex-date. Permanent book/tax differences relating to income and gain(loss) are reclassified amongst undistributed net investment income, accumulated net realized gain (loss) and paid-in capital in excess of par, as appropriate.
Estimates: The preparation of financial statements requires management to make estimates and assumptions that affect the reported amounts and disclosures in the financial statements. Actual results could differ from those estimates.
2. Agreements
The Trust, on behalf of the Fund, has a management agreement with PGIM Investments. Pursuant to this agreement, PGIM Investments has responsibility for all investment advisory services and supervises the subadviser’s performance of such services. PGIM Investments has entered into a subadvisory agreement with PGIM, Inc., which provides subadvisory services to the Fund through its subsidiary PGIM Real Estate. The subadvisory agreement provides that PGIM Real Estate will furnish investment advisory services in connection with the management of the Fund. In connection therewith, PGIM Real Estate is obligated to keep certain books and records of the Fund. PGIM Investments pays for the services of PGIM Real Estate, the cost of compensation of officers of the Fund, occupancy and certain clerical and bookkeeping costs of the Fund. The Fund bears all other costs and expenses.
The management fee paid to PGIM Investments is accrued daily and payable monthly at an annual rate of annual rate of .80% of the Fund’s average daily net assets up to and including $1 billion, .78% of the next $2 billion, .76% of the next $2 billion, .75% of the next $5 billion and .74% of the Fund’s average daily net assets in excess of $10 billion. For the year ended October 31, 2017, the effective management fee rate before any waivers and/or expense reimbursement was .80%. For the year ended October 31, 2017, the waiver and/or expense reimbursement exceeded the effective management fee rate.
PGIM Investments has contractually agreed through February 28, 2019 to limit the net annual operating expenses (exclusive of distribution and service (12b-1) fees, taxes (such as income and foreign withholdings taxes, stamp duty and deferred tax expenses), interest, underlying funds, brokerage, extraordinary and certain other expenses such as dividend, broker charges and interest expense on short sales) of each class of shares of the Fund to 1.10% of the Fund’s average daily net assets. Expenses waived/reimbursed by the Manager in accordance with this agreement may be recouped by the Manager within the same fiscal year during which such waiver/reimbursement is made if such recoupment can be realized without exceeding the expense limit in effect at the time of the recoupment for that fiscal year.
| Prudential Real Estate Income Fund | 33 |
Notes to Financial Statements (continued)
The Trust, on behalf of the Fund, has a distribution agreement with Prudential Investment Management Services LLC (“PIMS”), which acts as the distributor of the Class A, Class C, Class Q and Class Z shares of the Fund. The Fund compensates PIMS for distributing and servicing the Fund’s Class A and Class C shares, pursuant to plans of distribution (the “Distribution Plans”), regardless of expenses actually incurred by PIMS. The distribution fees are accrued daily and payable monthly. No distribution or service fees are paid to PIMS as distributor of the Class Q and Class Z shares of the Fund.
Pursuant to the Distribution Plans, the Fund compensates PIMS for distribution related activities at an annual rate of up to .30% and 1% of the average daily net assets of the Class A and C shares, respectively. PIMS has contractually agreed through February 28, 2019 to limit such fees to .25% of the average daily net assets of Class A shares.
PIMS has advised the Fund that it received $5,714 in front-end sales charges resulting from sales of Class A shares during the year ended October 31, 2017. From these fees, PIMS paid such sales charges to affiliated broker-dealers, which in turn paid commissions to salespersons and incurred other distribution costs.
PIMS has advised the Fund that for the year ended October 31, 2017, it received $300 in contingent deferred sales charges imposed upon redemptions by certain Class C shareholders.
PGIM Investments, PGIM, Inc., PGIM Real Estate and PIMS are indirect, wholly-owned subsidiaries of Prudential Financial, Inc. (“Prudential”).
3. Other Transactions with Affiliates
Prudential Mutual Fund Services LLC (“PMFS”), an affiliate of PGIM Investments and an indirect, wholly-owned subsidiary of Prudential, serves as the Fund’s transfer agent. Transfer agent’s fees and expenses in the Statement of Operations include certain out-of-pocket expenses paid to non-affiliates, where applicable.
The Fund may enter into certain securities purchase or sale transactions under Board approved Rule 17a-7 procedures. Rule 17a-7 is an exemptive rule under the 1940 Act, that permits purchase and sale transactions among affiliated investment companies, or between an investment company and a person that is affiliated solely by reason of having a common (or affiliated) investment adviser, common directors, and/or common officers. Such transactions are subject to ratification by the Board. For the reporting period ended October 31, 2017 no such transactions were entered into by the Fund.
| 34 |
The Fund may invest its overnight sweep cash in the Prudential Core Ultra Short Bond Fund (the “Core Fund”), and its securities lending cash collateral in the Prudential Institutional Money Market Fund (the “Money Market Fund”), each a series of Prudential Investment Portfolios 2, registered under the 1940 Act and managed by PGIM Investments. For the reporting period ended October 31, 2017, PGIM, Inc. was compensated $103 by PGIM Investments for managing the Fund’s securities lending cash collateral as subadviser to the Money Market Fund. Earnings from the Core Fund and Money Market Fund are disclosed on the Statement of Operations as “Affiliated dividend income” and “Income from securities lending, net”, respectively.
4. Portfolio Securities
The aggregate cost of purchases and proceeds from sales of portfolio securities (excluding short-term investments and U.S. Government securities) for the year ended October 31, 2017, were $18,990,199 and $13,622,905, respectively.
5. Distributions and Tax Information
Distributions to shareholders, which are determined in accordance with federal income tax regulations and which may differ from generally accepted accounting principles, are recorded on the ex-date. In order to present undistributed net investment income, accumulated net realized loss on investment and foreign currency transactions and paid-in capital in excess of par on the Statement of Assets and Liabilities that more closely represent their tax character, certain adjustments have been made to undistributed net investment income and accumulated net realized loss on investment and foreign currency transactions. For the year ended October 31, 2017, the adjustments were to increase undistributed net investment income and increase accumulated net realized loss on investment and foreign currency transactions by $171,858 due to foreign currency transactions and investment in passive foreign investment companies. Net investment income, net realized gain (loss) on investment and foreign currency transactions and net assets were not affected by this change.
For the year ended October 31, 2017, the tax character of dividends paid by the Fund was $526,578 of ordinary income. For the year ended October 31, 2016, the tax character of dividends paid by the Fund was $327,244 of ordinary income.
As of October 31, 2017, the accumulated undistributed earnings on a tax basis was $135,193 of ordinary income. This differs from the amount shown on the Statement of Assets and Liabilities primarily due to cumulative timing differences between financial and tax reporting.
| Prudential Real Estate Income Fund | 35 |
Notes to Financial Statements (continued)
The United States federal income tax basis of the Fund’s investments and the net unrealized appreciation as of October 31, 2017 were as follows:
Tax Basis | Gross | Gross | Net | |||
| $11,704,361 | $494,920 | $(314,013) | $180,907 |
The book basis differs from tax basis primarily due to deferred losses on wash sales, book/tax differences in the treatment of passive foreign investment companies and other cost basis adjustments.
For federal income tax purposes, the Fund had a capital loss carryforward as of October 31, 2017 of approximately $420,000 which can be carried forward for an unlimited period. No capital gains distributions are expected to be paid to shareholders until net gains have been realized in excess of such losses.
Management has analyzed the Fund’s tax positions taken on federal, state and local income tax returns for all open tax years and has concluded that no provision for income tax is required in the Fund’s financial statements for the current reporting period. The Fund’s federal, state and local income and federal excise tax returns for tax years for which the applicable statutes of limitations have not expired are subject to examination by the Internal Revenue Service and state departments of revenue.
6. Capital
The Fund offers Class A, Class C, Class Q and Class Z shares. Class A shares are sold with a maximum front-end sales charge of 5.50%. Investors who purchase $1 million or more of Class A shares and sell these shares within 12 months of purchase are subject to a contingent deferred sales charge (“CDSC”) of 1%, although they are not subject to an initial sales charge. The Class A CDSC is waived for certain retirement and/or benefit plans. Class C shares are sold with a CDSC of 1% on sales made within 12 months of purchase. Class Q and Class Z shares are not subject to any sales or redemption charge and are offered exclusively for a sale to a limited group of investors.
Under certain circumstances, an exchange may be made from specified share classes of the Fund to one or more other share classes of the Fund as presented in the table of transactions in shares of beneficial interest.
The Trust has authorized an unlimited number of shares of beneficial interest at $.001 par value per share, divided four into classes, designated Class A, Class C, Class Q and Class Z.
| 36 |
As of October 31, 2017, Prudential through its affiliate entities, including affiliated funds, owned 1,113 shares of Class C, 1,117 shares of Class Q and 569,705 shares of Class Z, respectively. At reporting period end, three shareholders of record held 94% of the Fund’s outstanding shares on behalf of multiple beneficial owners, of which 46% were held by an affiliate of Prudential.
Transactions in shares of beneficial interest were as follows:
Class A | Shares | Amount | ||||||
Year ended October 31, 2017: | ||||||||
Shares sold | 57,202 | $ | 553,052 | |||||
Shares issued in reinvestment of dividends and distributions | 3,754 | 36,283 | ||||||
Shares reacquired† | (31,815 | ) | (307,255 | ) | ||||
|
|
|
| |||||
Net increase (decrease) in shares outstanding | 29,141 | $ | 282,080 | |||||
|
|
|
| |||||
Year ended October 31, 2016: | ||||||||
Shares sold | 63,740 | $ | 626,085 | |||||
Shares issued in reinvestment of dividends and distributions | 1,199 | 11,679 | ||||||
Shares reacquired | (2,470 | ) | (24,165 | ) | ||||
|
|
|
| |||||
Net increase (decrease) in shares outstanding | 62,469 | $ | 613,599 | |||||
|
|
|
| |||||
Class C | ||||||||
Year ended October 31, 2017: | ||||||||
Shares sold | 11,112 | $ | 104,326 | |||||
Shares issued in reinvestment of dividends and distributions | 1,336 | 12,902 | ||||||
Shares reacquired | (14,228 | ) | (136,422 | ) | ||||
|
|
|
| |||||
Net increase (decrease) in shares outstanding before conversion | (1,780 | ) | (19,194 | ) | ||||
Shares reacquired upon conversion into other share class(es) | (1,001 | ) | (9,843 | ) | ||||
|
|
|
| |||||
Net increase (decrease) in shares outstanding | (2,781 | ) | $ | (29,037 | ) | |||
|
|
|
| |||||
Year ended October 31, 2016: | ||||||||
Shares sold | 31,258 | $ | 296,223 | |||||
Shares issued in reinvestment of dividends and distributions | 689 | 6,735 | ||||||
Shares reacquired | (31 | ) | (313 | ) | ||||
|
|
|
| |||||
Net increase (decrease) in shares outstanding before conversion | 31,916 | $ | 302,645 | |||||
|
|
|
| |||||
Class Q | ||||||||
Period ended October 31, 2017*: | ||||||||
Shares sold | 1,072 | $ | 10,000 | |||||
Shares issued in reinvestment of dividends and distributions | 45 | 438 | ||||||
|
|
|
| |||||
Net increase (decrease) in shares outstanding | 1,117 | $ | 10,438 | |||||
|
|
|
| |||||
| Prudential Real Estate Income Fund | 37 |
Notes to Financial Statements (continued)
Class Z | Shares | Amount | ||||||
Year ended October 31, 2017: | ||||||||
Shares sold | 562,232 | $ | 5,335,688 | |||||
Shares issued in reinvestment of dividends and distributions | 49,025 | 474,400 | ||||||
Shares reacquired† | (72,695 | ) | (705,636 | ) | ||||
|
|
|
| |||||
Net increase (decrease) in shares outstanding before conversion | 538,562 | 5,104,452 | ||||||
Shares issued upon conversion from other share class(es) | 999 | 9,843 | ||||||
|
|
|
| |||||
Net increase (decrease) in shares outstanding | 539,561 | $ | 5,114,295 | |||||
|
|
|
| |||||
Year ended October 31, 2016: | ||||||||
Shares sold | 28,115 | $ | 276,514 | |||||
Shares issued in reinvestment of dividends and distributions | 32,928 | 308,719 | ||||||
Shares reacquired | (155 | ) | (1,569 | ) | ||||
|
|
|
| |||||
Net increase (decrease) in shares outstanding before conversion | 60,888 | $ | 583,664 | |||||
|
|
|
| |||||
| * | Commencement of offering was December 28, 2016. |
| † | Includes affiliated redemption of 1,123 and 1,129 shares with a value of $10,836 and $10,892 for Class A and Z shares, respectively. |
7. Borrowings
The Trust, on behalf of the Fund, along with other affiliated registered investment companies (the “Funds”), is a party to a Syndicated Credit Agreement (“SCA”) with a group of banks. The purpose of the SCA is to provide an alternative source of temporary funding for capital share redemptions. The SCA provides for a commitment of $900 million for the period October 5, 2017 through October 4, 2018. The Funds pay an annualized commitment fee of .15% of the unused portion of the SCA. The Fund’s portion of the commitment fee for the unused amount, allocated based upon a method approved by the Board, is accrued daily and paid quarterly. Prior to October 5, 2017, the Funds had another SCA that provided a commitment of $900 million and the Funds paid an annualized commitment fee of .15% of the unused portion of the SCA. The interest on borrowings under the SCAs is paid monthly and at a per annum interest rate based upon a contractual spread plus the higher of (1) the effective federal funds rate, (2) the 1-month LIBOR rate or (3) zero percent.
Other affiliated registered investment companies that are parties to the SCA include portfolios that are subject to a predetermined mathematical formula used to manage certain benefit guarantees offered under variable annuity contracts. The formula may result in large scale asset flows into and out of these portfolios. Consequently, these portfolios may be more likely to utilize the SCA for purposes of funding redemptions. It may be possible for those portfolios to fully exhaust the committed amount of the SCA, thereby requiring the Manager to allocate available funding per a Board-approved methodology designed to treat the Funds in the SCA equitably.
| 38 |
The Fund utilized the SCA during the reporting period ended October 31, 2017. The average daily balance for the 6 days that the Fund had loans outstanding during the period was $116,333 borrowed at a weighted average interest rate of 2.49%. The maximum loan balance outstanding during the period was $152,000. At October 31, 2017, the Fund had an outstanding loan balance of $45,000.
8. Other
At the Trust’s Board meeting in March 2017, the Board approved a change in the methodology of allocating certain expenses, such as Transfer Agent fees (including sub-transfer agent and networking fees) and Blue Sky fees. PGIM Investments implemented the changes effective November 1, 2017.
| Prudential Real Estate Income Fund | 39 |
Financial Highlights
| Class A Shares | ||||||||||||||||||||
Year Ended | June 3, 2015(b) through | |||||||||||||||||||
| 2017 | 2016 | October 31, 2015 | ||||||||||||||||||
| Per Share Operating Performance(c): | ||||||||||||||||||||
| Net Asset Value, Beginning of Period | $9.66 | $9.59 | $10.00 | |||||||||||||||||
| Income (loss) from investment operations: | ||||||||||||||||||||
| Net investment income (loss) | .39 | .24 | .13 | |||||||||||||||||
| Net realized and unrealized gain (loss) on investment transactions | .05 | .39 | (.38 | ) | ||||||||||||||||
| Total from investment operations | .44 | .63 | (.25 | ) | ||||||||||||||||
| Less Dividends: | ||||||||||||||||||||
| Dividends from net investment income | (.48 | ) | (.56 | ) | (.16 | ) | ||||||||||||||
| Net asset value, end of period | $9.62 | $9.66 | $9.59 | |||||||||||||||||
| Total Return(a) | 4.60% | 6.92% | (2.55 | )% | ||||||||||||||||
| Ratios/Supplemental Data: | ||||||||||||||||||||
| Net assets, end of period (000) | $914 | $637 | $33 | |||||||||||||||||
| Average net assets (000) | $744 | $186 | $24 | |||||||||||||||||
| Ratios to average net assets(d): | ||||||||||||||||||||
| Expenses after waivers and/or expense reimbursement | 1.35% | 1.35% | 1.36% | (e) | ||||||||||||||||
| Expenses before waivers and/or expense reimbursement | 3.30% | 3.37% | 9.50% | (e) | ||||||||||||||||
| Net investment income (loss) | 4.00% | 2.45% | 3.15% | (e) | ||||||||||||||||
| Portfolio turnover rate | 137% | 113% | 98% | (f) | ||||||||||||||||
| (a) | Total return does not consider the effects of sales loads. Total return is calculated assuming a purchase of a share on the first day and a sale on the last day of each period reported and includes reinvestment of dividends and distributions, if any. Total returns may reflect adjustments to conform to generally accepted accounting principles. Total returns for periods less than one full year are not annualized. |
| (b) | Commencement of operations. |
| (c) | Calculated based on average shares outstanding during the period. |
| (d) | Does not include expenses of the underlying portfolios in which the Fund invests. |
| (e) | Annualized. |
| (f) | Not annualized. |
See Notes to Financial Statements.
| 40 |
| Class C Shares | ||||||||||||||||||||
Year Ended | June 3, 2015(b) through | |||||||||||||||||||
| 2017 | 2016 | October 31, 2015 | ||||||||||||||||||
| Per Share Operating Performance(c): | ||||||||||||||||||||
| Net Asset Value, Beginning of Period | $9.66 | $9.58 | $10.00 | |||||||||||||||||
| Income (loss) from investment operations: | ||||||||||||||||||||
| Net investment income (loss) | .32 | .19 | .11 | |||||||||||||||||
| Net realized and unrealized gain (loss) on investment transactions | .05 | .38 | (.40 | ) | ||||||||||||||||
| Total from investment operations | .37 | .57 | (.29 | ) | ||||||||||||||||
| Less Dividends: | ||||||||||||||||||||
| Dividends from net investment income | (.41 | ) | (.49 | ) | (.13 | ) | ||||||||||||||
| Net asset value, end of period | $9.62 | $9.66 | $9.58 | |||||||||||||||||
| Total Return(a) | 3.83% | 6.22% | (2.91)% | |||||||||||||||||
| Ratios/Supplemental Data: | ||||||||||||||||||||
| Net assets, end of period (000) | $293 | $321 | $13 | |||||||||||||||||
| Average net assets (000) | $309 | $151 | $11 | |||||||||||||||||
| Ratios to average net assets(d): | ||||||||||||||||||||
| Expenses after waivers and/or expense reimbursement | 2.10% | 2.10% | 2.13% | (e) | ||||||||||||||||
| Expenses before waivers and/or expense reimbursement | 4.00% | 4.78% | 10.11% | (e) | ||||||||||||||||
| Net investment income (loss) | 3.29% | 1.98% | 2.87% | (e) | ||||||||||||||||
| Portfolio turnover rate | 137% | 113% | 98% | (f) | ||||||||||||||||
| (a) | Total return does not consider the effects of sales loads. Total return is calculated assuming a purchase of a share on the first day and a sale on the last day of each period reported and includes reinvestment of dividends and distributions, if any. Total returns may reflect adjustments to conform to generally accepted accounting principles. Total returns for periods less than one full year are not annualized. |
| (b) | Commencement of operations. |
| (c) | Calculated based on average shares outstanding during the period. |
| (d) | Does not include expenses of the underlying portfolios in which the Fund invests. |
| (e) | Annualized. |
| (f) | Not annualized. |
See Notes to Financial Statements.
| Prudential Real Estate Income Fund | 41 |
Financial Highlights (continued)
| Class Q Shares | ||||
| December 28, 2016(b) through October 31, 2017 | ||||
| Per Share Operating Performance(c): | ||||
| Net Asset Value, Beginning of Period | $9.33 | |||
| Income (loss) from investment operations: | ||||
| Net investment income (loss) | .31 | |||
| Net realized and unrealized gain (loss) on investment transactions | .38 | |||
| Total from investment operations | .69 | |||
| Less Dividends: | ||||
| Dividends from net investment income | (.40 | ) | ||
| Net asset value, end of period | $9.62 | |||
| Total Return(a) | 7.43% | |||
| Ratios/Supplemental Data: | ||||
| Net assets, end of period (000) | $11 | |||
| Average net assets (000) | $11 | |||
| Ratios to average net assets(d): | ||||
| Expenses after waivers and/or expense reimbursement | 1.10% | (e) | ||
| Expenses before waivers and/or expense reimbursement | 2.79% | (e) | ||
| Net investment income (loss) | 3.78% | (e) | ||
| Portfolio turnover rate | 137% | (f) | ||
| (a) | Total return is calculated assuming a purchase of a share on the first day and a sale on the last day of each period reported and includes reinvestment of dividends and distributions, if any. Total returns may reflect adjustments to conform to generally accepted accounting principles. Total returns for periods less than one full year are not annualized. |
| (b) | Commencement of offering. |
| (c) | Calculated based on average shares outstanding during the period. |
| (d) | Does not include expenses of the underlying portfolios in which the Fund invests. |
| (e) | Annualized. |
| (f) | Not annualized. |
See Notes to Financial Statements.
| 42 |
| Class Z Shares | ||||||||||||||||||||
Year Ended | June 3, 2015(b) through | |||||||||||||||||||
| 2017 | 2016 | October 31, 2015 | ||||||||||||||||||
| Per Share Operating Performance(c): | ||||||||||||||||||||
| Net Asset Value, Beginning of Period | $9.66 | $9.59 | $10.00 | |||||||||||||||||
| Income (loss) from investment operations: | ||||||||||||||||||||
| Net investment income (loss) | .40 | .38 | .16 | |||||||||||||||||
| Net realized and unrealized gain (loss) on investment transactions | .06 | .28 | (.41 | ) | ||||||||||||||||
| Total from investment operations | .46 | .66 | (.25 | ) | ||||||||||||||||
| Less Dividends: | ||||||||||||||||||||
| Dividends from net investment income | (.50 | ) | (.59 | ) | (.16 | ) | ||||||||||||||
| Net asset value, end of period | $9.62 | $9.66 | $9.59 | |||||||||||||||||
| Total Return(a) | 4.85% | 7.19% | (2.47)% | |||||||||||||||||
| Ratios/Supplemental Data: | ||||||||||||||||||||
| Net assets, end of period (000) | $10,681 | $5,512 | $4,886 | |||||||||||||||||
| Average net assets (000) | $8,961 | $5,008 | $4,868 | |||||||||||||||||
| Ratios to average net assets(d): | ||||||||||||||||||||
| Expenses after waivers and/or expense reimbursement | 1.10% | 1.10% | 1.10% | (e) | ||||||||||||||||
| Expenses before waivers and/or expense reimbursement | 2.96% | 4.85% | 8.98% | (e) | ||||||||||||||||
| Net investment income (loss) | 4.17% | 3.98% | 4.08% | (e) | ||||||||||||||||
| Portfolio turnover rate | 137% | 113% | 98% | (f) | ||||||||||||||||
| (a) | Total return is calculated assuming a purchase of a share on the first day and a sale on the last day of each period reported and includes reinvestment of dividends and distributions, if any. Total returns may reflect adjustments to conform to generally accepted accounting principles. Total returns for periods less than one full year are not annualized. |
| (b) | Commencement of operations. |
| (c) | Calculated based on average shares outstanding during the period. |
| (d) | Does not include expenses of the underlying portfolios in which the Fund invests. |
| (e) | Annualized. |
| (f) | Not annualized. |
See Notes to Financial Statements.
| Prudential Real Estate Income Fund | 43 |
Report of Independent Registered Public Accounting Firm
The Board of Trustees and Shareholders
Prudential Investment Portfolios 9:
We have audited the accompanying statement of assets and liabilities of Prudential Real Estate Income Fund (the “Fund”), a series of Prudential Investment Portfolios 9, including the schedule of investments, as of October 31, 2017, and the related statement of operations for the year then ended, the statements of changes in net assets for each of the years in the two-year period then ended, and the financial highlights for each of the years or periods in the two-year period then ended and the period from June 3, 2015 (commencement of operations) to October 31, 2015. These financial statements and financial highlights are the responsibility of the Fund’s management. Our responsibility is to express an opinion on these financial statements and financial highlights based on our audits.
We conducted our audits in accordance with the standards of the Public Company Accounting Oversight Board (United States). Those standards require that we plan and perform the audit to obtain reasonable assurance about whether the financial statements and financial highlights are free of material misstatement. An audit includes examining, on a test basis, evidence supporting the amounts and disclosures in the financial statements. Our procedures included confirmation of securities owned as of October 31, 2017, by correspondence with the custodian, transfer agent and brokers or by other appropriate auditing procedures when replies from brokers were not received. An audit also includes assessing the accounting principles used and significant estimates made by management, as well as evaluating the overall financial statement presentation. We believe that our audits provide a reasonable basis for our opinion.
In our opinion, the financial statements and financial highlights referred to above present fairly, in all material respects, the financial position of the Fund as of October 31, 2017, and the results of its operations, the changes in its net assets, and the financial highlights for the years or periods described in the first paragraph, in conformity with U.S. generally accepted accounting principles.

New York, New York
December 15, 2017
| 44 |
Federal Income Tax Information (unaudited)
For the year ended October 31, 2017, the Fund reports the maximum amount allowable, but not less than 7.34% of the ordinary income dividends paid during the year as qualified dividend income in accordance with Section 854 of the Internal Revenue Code.
In January 2018, you will be advised on IRS Form 1099-DIV or substitute 1099-DIV as to the federal tax status of the dividends received by you in calendar year 2017.
| Prudential Real Estate Income Fund | 45 |
INFORMATION ABOUT BOARD MEMBERS AND OFFICERS
(Unaudited)
Information about Board Members and Officers of the Fund is set forth below. Board Members who are not deemed to be “interested persons” of the Fund, as defined in the 1940 Act, are referred to as “Independent Board Members.” Board Members who are deemed to be “interested persons” of the Fund are referred to as “Interested Board Members.” The Board Members are responsible for the overall supervision of the operations of the Fund and perform the various duties imposed on the directors of investment companies by the 1940 Act. The Board in turn elects the Officers, who are responsible for administering the day-to-day operations of the Fund.
| Independent Board Members(1) | ||||
Name, Address, Age Position(s) Portfolios Overseen | Principal Occupation(s) During Past Five Years | Other Directorships Held During Past Five Years | ||
Ellen S. Alberding (59) Board Member Portfolios Overseen: 89 | President and Board Member, The Joyce Foundation (charitable foundation) (since 2002); Vice Chair, City Colleges of Chicago (community college system) (since 2011); Trustee, Skills for America’s Future (national initiative to connect employers to community colleges) (since 2011); Trustee, National Park Foundation (charitable foundation for national park system) (since 2009); Trustee, Economic Club of Chicago (since 2009). | None. | ||
Kevin J. Bannon (65) Board Member Portfolios Overseen: 89 | Retired; Managing Director (April 2008-May 2015) and Chief Investment Officer (October 2008-November 2013) of Highmount Capital LLC (registered investment adviser); formerly Executive Vice President and Chief Investment Officer (April 1993-August 2007) of Bank of New York Company; President (May 2003-May 2007) of BNY Hamilton Family of Mutual Funds. | Director of Urstadt Biddle Properties (equity real estate investment trust) (since September 2008). | ||
Linda W. Bynoe (65) Board Member Portfolios Overseen: 89 | President and Chief Executive Officer (since March 1995) and formerly Chief Operating Officer (December 1989-February 1995) of Telemat Ltd. (management consulting); formerly Vice President (January 1985-June 1989) at Morgan Stanley & Co. (broker-dealer). | Director of Simon Property Group, Inc. (retail real estate) (May 2003-May 2012); Director of Anixter International, Inc. (communication products distributor) (since January 2006); Director of Northern Trust Corporation (financial services) (since April 2006); Trustee of Equity Residential (residential real estate) (since December 2009). | ||
Prudential Real Estate Income Fund
| Independent Board Members(1) | ||||
Name, Address, Age Position(s) Portfolios Overseen | Principal Occupation(s) During Past Five Years | Other Directorships Held During Past Five Years | ||
Barry H. Evans (57)± Board Member Portfolios Overseen: 89 | Retired; Formerly President (2005-2016), Global Chief Operating Officer (2014-2016), Chief Investment Officer-Global Head of Fixed Income (1998-2014), and various portfolio manager roles (1986-2006), Manulife Asset Management U.S. | Director, Manulife Trust Company (2011-present); Director, Manulife Asset Management Limited (2015-present); Formerly Chairman of the Board of Directors of Manulife Asset Management U.S. (2005-2016); Formerly Chairman of the Board, Declaration Investment Management and Research (2008-2016). | ||
Keith F. Hartstein (61) Board Member & Independent Chair Portfolios Overseen: 89 | Retired; Member (since November 2014) of the Governing Council of the Independent Directors Council (organization of independent mutual fund directors); formerly President and Chief Executive Officer (2005-2012), Senior Vice President (2004-2005), Senior Vice President of Sales and Marketing (1997-2004), and various executive management positions (1990-1997), John Hancock Funds, LLC (asset management); Chairman, Investment Company Institute’s Sales Force Marketing Committee (2003-2008). | None. | ||
Laurie Simon Hodrick (55)± Board Member Portfolios Overseen: 89 | A. Barton Hepburn Professor of Economics in the Faculty of Business, Columbia Business School (since 1996); Visiting Professor of Law and Rock Center for Corporate Governance Fellow, Stanford Law School (since 2015); Visiting Fellow, Hoover Institution, Stanford University (since 2015); Sole Member, ReidCourt LLC (since 2008) (a consulting firm); Formerly Managing Director, Global Head of Alternative Investment Strategies, Deutsche Bank (2006-2008); Formerly Director/Trustee, Merrill Lynch Investment Managers Funds (1999-2006). | Independent Director, Corporate Capital Trust (since April 2017) (a business development company). | ||
Michael S. Hyland, CFA (72) Board Member Portfolios Overseen: 89 | Retired (since February 2005); formerly Senior Managing Director (July 2001-February 2005) of Bear Stearns & Co, Inc.; Global Partner, INVESCO (1999-2001); Managing Director and President of Salomon Brothers Asset Management (1989-1999). | None. | ||
Visit our website at pgiminvestments.com
| Independent Board Members(1) | ||||
Name, Address, Age Position(s) Portfolios Overseen | Principal Occupation(s) During Past Five Years | Other Directorships Held During Past Five Years | ||
Richard A. Redeker (74) Board Member & Independent Vice Chair9 Portfolios Overseen: 87 | Retired Mutual Fund Senior Executive (47 years); Management Consultant; Director, Mutual Fund Directors Forum (since 2014); Independent Directors Council (organization of independent mutual fund directors)-Executive Committee, Chair of Policy Steering Committee, Governing Council. | None. | ||
Stephen G. Stoneburn (74) Board Member Portfolios Overseen: 89 | Chairman (since July 2011), President and Chief Executive Officer (since June 1996) of Frontline Medical Communications (publishing company); formerly President (June 1995-June 1996) of Argus Integrated Media, Inc.; Senior Vice President and Managing Director (January 1993-1995) of Cowles Business Media; Senior Vice President of Fairchild Publications, Inc. (1975-1989). | None. | ||
± Mr. Evans and Ms. Hodrick joined the Board effective as of September 1, 2017.
| Interested Board Members(1) | ||||
Name, Address, Age Position(s) Portfolios Overseen | Principal Occupation(s) During Past Five Years | Other Directorships Held During Past Five Years | ||
Stuart S. Parker (55) Board Member & President Portfolios Overseen: 89 | President of PGIM Investments LLC (formerly known as Prudential Investments LLC) (since January 2012); Executive Vice President of Prudential Investment Management Services LLC (since December 2012); Executive Vice President of Jennison Associates LLC and Head of Retail Distribution of PGIM Investments LLC (June 2005-December 2011). | None. | ||
Prudential Real Estate Income Fund
| Interested Board Members(1) | ||||
Name, Address, Age Position(s) Portfolios Overseen | Principal Occupation(s) During Past Five Years | Other Directorships Held During Past Five Years | ||
Scott E. Benjamin (44) Board Member & Vice President Portfolios Overseen: 89 | Executive Vice President (since June 2009) of PGIM Investments LLC; Executive Vice President (June 2009-June 2012) and Vice President (since June 2012) of Prudential Investment Management Services LLC; Executive Vice President (since September 2009) of AST Investment Services, Inc.; Senior Vice President of Product Development and Marketing, PGIM Investments (since February 2006); Vice President of Product Development and Product Management, Prudential Investments (2003-2006). | None. | ||
Grace C. Torres* (58) Board Member Portfolios Overseen: 88 | Retired; formerly Treasurer and Principal Financial and Accounting Officer of the Prudential Funds, Target Funds, Advanced Series Trust, Prudential Variable Contract Accounts and The Prudential Series Fund (1998-June 2014); Assistant Treasurer (March 1999-June 2014) and Senior Vice President (September 1999-June 2014) of PGIM Investments LLC; Assistant Treasurer (May 2003-June 2014) and Vice President (June 2005-June 2014) of AST Investment Services, Inc.; Senior Vice President and Assistant Treasurer (May 2003-June 2014) of Prudential Annuities Advisory Services, Inc. | Director (since July 2015) of Sun Bancorp, Inc. N.A. and Sun National Bank | ||
* Note: Prior to her retirement in 2014, Ms. Torres was employed by PGIM Investments LLC. Due to her prior employment, she is considered to be an “interested person” under the 1940 Act. Ms. Torres is a Non-Management Interested Board Member.
(1) The year that each individual joined the Board is as follows:
Ellen S. Alberding, 2013; Linda W. Bynoe, 2005; Barry H. Evans, 2017; Richard A. Redeker, 1998; Stephen G. Stoneburn, 2003; Kevin J. Bannon, 2008; Keith F. Hartstein, 2013; Laurie Simon Hodrick, 2017; Michael S. Hyland, 2008; Stuart S. Parker, Board Member since 2012 and President since 2012; Scott E. Benjamin, Board Member since 2010 and Vice President since 2009; Grace C. Torres, 2014.
Visit our website at pgiminvestments.com
| Fund Officers(a) | ||||
Name, Address and Age Position with Fund | Principal Occupation(s) During Past Five Years | Length of Service as Fund Officer | ||
Raymond A. O’Hara (62) Chief Legal Officer | Vice President and Corporate Counsel (since July 2010) of Prudential Insurance Company of America (Prudential); Vice President (March 2011-Present) of Pruco Life Insurance Company and Pruco Life Insurance Company of New Jersey; Vice President and Corporate Counsel (March 2011-Present) of Prudential Annuities Life Assurance Corporation; Chief Legal Officer of PGIM Investments LLC (since June 2012); Chief Legal Officer of Prudential Mutual Fund Services LLC (since June 2012) and Corporate Counsel of AST Investment Services, Inc. (since June 2012); formerly Assistant Vice President and Corporate Counsel (September 2008-July 2010) of The Hartford Financial Services Group, Inc.; formerly Associate (September 1980-December 1987) and Partner (January 1988-August 2008) of Blazzard & Hasenauer, P.C. (formerly, Blazzard, Grodd & Hasenauer, P.C.). | Since 2012 | ||
Chad A. Earnst (42) Chief Compliance Officer | Chief Compliance Officer (September 2014-Present) of PGIM Investments LLC; Chief Compliance Officer (September 2014-Present) of the Prudential Funds, Target Funds, Advanced Series Trust, The Prudential Series Fund, Prudential’s Gibraltar Fund, Inc., Prudential Global Short Duration High Yield Income Fund, Inc., Prudential Short Duration High Yield Fund, Inc. and Prudential Jennison MLP Income Fund, Inc.; formerly Assistant Director (March 2010-August 2014) of the Asset Management Unit, Division of Enforcement, US Securities & Exchange Commission; Assistant Regional Director (January 2010-August 2014), Branch Chief (June 2006-December 2009) and Senior Counsel (April 2003-May 2006) of the Miami Regional Office, Division of Enforcement, US Securities & Exchange Commission. | Since 2014 | ||
Deborah A. Docs (59) Secretary | Vice President and Corporate Counsel (since January 2001) of Prudential; Vice President (since December 1996) and Assistant Secretary (since March 1999) of PGIM Investments LLC; formerly Vice President and Assistant Secretary (May 2003-June 2005) of AST Investment Services, Inc. | Since 2004 | ||
Jonathan D. Shain (59) Assistant Secretary | Vice President and Corporate Counsel (since August 1998) of Prudential; Vice President and Assistant Secretary (since May 2001) of PGIM Investments LLC; Vice President and Assistant Secretary (since February 2001) of Prudential Mutual Fund Services LLC; formerly Vice President and Assistant Secretary (May 2003-June 2005) of AST Investment Services, Inc. | Since 2005 | ||
Claudia DiGiacomo (43) Assistant Secretary | Vice President and Corporate Counsel (since January 2005) of Prudential; Vice President and Assistant Secretary of PGIM Investments LLC (since December 2005); Associate at Sidley Austin Brown & Wood LLP (1999-2004). | Since 2005 | ||
Prudential Real Estate Income Fund
| Fund Officers(a) | ||||
Name, Address and Age Position with Fund | Principal Occupation(s) During Past Five Years | Length of Service as Fund Officer | ||
Andrew R. French (54) Assistant Secretary | Vice President and Corporate Counsel (since February 2010) of Prudential; formerly Director and Corporate Counsel (2006-2010) of Prudential; Vice President and Assistant Secretary (since January 2007) of PGIM Investments LLC; Vice President and Assistant Secretary (since January 2007) of Prudential Mutual Fund Services LLC. | Since 2006 | ||
Charles H. Smith (44) Anti-Money Laundering Compliance Officer | Vice President, Corporate Compliance, Anti-Money Laundering Unit (since January 2015) of Prudential; committee member of the American Council of Life Insurers Anti-Money Laundering and Critical Infrastructure Committee (since January 2016); formerly Global Head of Economic Sanctions Compliance at AIG Property Casualty (February 2007-December 2014); Assistant Attorney General at the New York State Attorney General’s Office, Division of Public Advocacy. (August 1998-January 2007). | Since 2016 | ||
M. Sadiq Peshimam (53) Treasurer and Principal Financial and Accounting Officer | Vice President (since 2005) of PGIM Investments LLC; formerly Assistant Treasurer of funds in the Prudential Mutual Fund Complex (2006-2014). | Since 2006 | ||
Peter Parrella (59) Assistant Treasurer | Vice President (since 2007) and Director (2004-2007) within Prudential Mutual Fund Administration; formerly Tax Manager at SSB Citi Fund Management LLC (1997-2004). | Since 2007 | ||
Lana Lomuti (50) Assistant Treasurer | Vice President (since 2007) and Director (2005-2007), within Prudential Mutual Fund Administration; formerly Assistant Treasurer (December 2007-February 2014) of The Greater China Fund, Inc. | Since 2014 | ||
Linda McMullin (56) Assistant Treasurer | Vice President (since 2011) and Director (2008-2011) within Prudential Mutual Fund Administration. | Since 2014 | ||
Kelly A. Coyne (49) Assistant Treasurer | Director, Investment Operations of Prudential Mutual Fund Services LLC (since 2010). | Since 2015 | ||
(a) Excludes Mr. Parker and Mr. Benjamin, interested Board Members who also serve as President and Vice President, respectively.
Explanatory Notes to Tables:
| ∎ | Board Members are deemed to be “Interested,” as defined in the 1940 Act, by reason of their affiliation with PGIM Investments LLC and/or an affiliate of PGIM Investments LLC. |
| ∎ | Unless otherwise noted, the address of all Board Members and Officers is c/o PGIM Investments LLC, 655 Broad Street, Newark, New Jersey 07102-4410. |
| ∎ | There is no set term of office for Board Members or Officers. The Board Members have adopted a retirement policy, which calls for the retirement of Board Members on December 31 of the year in which they reach the age of 75. |
| ∎ | “Other Directorships Held” includes only directorships of companies required to register or file reports with the SEC under the 1934 Act (that is, “public companies”) or other investment companies registered under the 1940 Act. |
| ∎ | “Portfolios Overseen” includes all investment companies managed by PGIM Investments LLC. The investment companies for which PGIM Investments LLC serves as manager include the Prudential Mutual Funds, The Prudential Variable Contract Accounts, Target Mutual Funds, Prudential Short Duration High Yield Fund, Inc., Prudential Global Short Duration High Yield Fund, Inc., The Prudential Series Fund, Prudential’s Gibraltar Fund, Inc. and the Advanced Series Trust. |
Visit our website at pgiminvestments.com
Approval of Advisory Agreements
The Fund’s Board of Trustees
The Board of Trustees (the “Board”) of Prudential Real Estate Income Fund (the “Fund”)1 consists of twelve individuals, nine of whom are not “interested persons” of the Fund, as defined in the Investment Company Act of 1940, as amended (the “1940 Act”) (the “Independent Trustees”). The Board is responsible for the oversight of the Fund and its operations, and performs the various duties imposed on the directors of investment companies by the 1940 Act. The Independent Trustees have retained independent legal counsel to assist them in connection with their duties. The Chair of the Board is an Independent Trustee. The Board has established four standing committees: the Audit Committee, the Nominating and Governance Committee, and two Investment Committees. Each committee is chaired by, and composed of, Independent Trustees.
Annual Approval of the Fund’s Advisory Agreements
As required under the 1940 Act, the Board determines annually whether to renew the Fund’s management agreement with PGIM Investments LLC (“PGIM Investments”) and the Fund’s subadvisory agreement with PGIM, Inc. (“PGIM”), which provides subadvisory services to the Fund through its PGIM Real Estate unit. In considering the renewal of the agreements, the Board, including all of the Independent Trustees,2 met on June 6-8, 2017 and approved the renewal of the agreements through July 31, 2018, after concluding that the renewal of the agreements was in the best interests of the Fund and its shareholders.
In advance of the meetings, the Board requested and received materials relating to the agreements, and had the opportunity to ask questions and request further information in connection with its consideration. Among other things, the Board considered comparative fee information from PGIM Investments and PGIM. Also, the Board considered comparisons with other mutual funds in relevant Peer Universes and Peer Groups, as is further discussed below.
In approving the agreements, the Board, including the Independent Trustees advised by independent legal counsel, considered the factors it deemed relevant, including the nature, quality and extent of services provided by PGIM Investments and the subadviser, the performance of the Fund, the profitability of PGIM Investments and its affiliates, expenses and fees, and the potential for economies of scale that may be shared with the Fund and its shareholders as the Fund’s assets grow. In their deliberations, the Trustees did not identify any single factor which alone was responsible for the Board’s decision to approve the agreements with respect to the Fund. In connection with its deliberations, the Board
| 1 | Prudential Real Estate Income Fund is a series of Prudential Investment Portfolios 9. |
| 2 | Barry H. Evans and Laurie Simon Hodrick joined the Board effective as of September 1, 2017. Neither Mr. Evans nor Ms. Hodrick participated in the consideration of the renewal of the Fund’s advisory agreements. |
| Prudential Real Estate Income Fund | ||
Approval of Advisory Agreements (continued)
considered information provided by PGIM Investments throughout the year at regular Board meetings, presentations from portfolio managers and other information, as well as information furnished at or in advance of the meetings on June 6-8, 2017.
The Trustees determined that the overall arrangements between the Fund and PGIM Investments, which serves as the Fund’s investment manager pursuant to a management agreement, and between PGIM Investments and PGIM, which serves as the Fund’s subadviser pursuant to the terms of a subadvisory agreement with PGIM Investments, are in the best interests of the Fund and its shareholders in light of the services performed, fees charged and such other matters as the Trustees considered relevant in the exercise of their business judgment.
The material factors and conclusions that formed the basis for the Trustees’ reaching their determinations to approve the continuance of the agreements are separately discussed below.
Nature, Quality and Extent of services
The Board received and considered information regarding the nature, quality and extent of services provided to the Fund by PGIM Investments and PGIM Real Estate. The Board considered the services provided by PGIM Investments, including but not limited to the oversight of the subadviser for the Fund, as well as the provision of fund recordkeeping, compliance, and other services to the Fund. With respect to PGIM Investments’ oversight of the subadviser, the Board noted that PGIM Investments’ Strategic Investment Research Group (“SIRG”), which is a business unit of PGIM Investments, is responsible for monitoring and reporting to PGIM Investments’ senior management on the performance and operations of the subadviser. The Board also considered that PGIM Investments pays the salaries of all of the officers and interested Trustees of the Fund who are part of Fund management. The Board also considered the investment subadvisory services provided by PGIM Real Estate, as well as adherence to the Fund’s investment restrictions and compliance with applicable Fund policies and procedures. The Board considered PGIM Investments’ evaluation of the subadviser, as well as PGIM Investments’ recommendation, based on its review of the subadviser, to renew the subadvisory agreement.
The Board considered the qualifications, backgrounds and responsibilities of PGIM Investments’ senior management responsible for the oversight of the Fund and PGIM Real Estate, and also considered the qualifications, backgrounds and responsibilities of the PGIM Real Estate’s portfolio managers who are responsible for the day-to-day management of the Fund’s portfolio. The Board was provided with information pertaining to PGIM Investments’, PGIM Real Estate’s, and PGIM’s organizational structure, senior management, investment operations, and other relevant information pertaining to PGIM Investments, PGIM Real Estate, and PGIM. The Board also noted that it received favorable
| Visit our website at pgiminvestments.com |
compliance reports from the Fund’s Chief Compliance Officer (“CCO”) as to PGIM Investments, PGIM Real Estate, and PGIM. The Board noted that PGIM Real Estate and PGIM are affiliated with PGIM Investments.
The Board concluded that it was satisfied with the nature, extent and quality of the investment management services provided by PGIM Investments and the subadvisory services provided to the Fund by PGIM through PGIM Real Estate, and that there was a reasonable basis on which to conclude that the Fund benefits from the services provided by PGIM Investments and PGIM through PGIM Real Estate under the management and subadvisory agreements.
Costs of Services and Profits Realized by PGIM Investments
The Board was provided with information on the profitability of PGIM Investments and its affiliates in serving as the Fund’s investment manager. The Board discussed with PGIM Investments the methodology utilized in assembling the information regarding profitability and considered its reasonableness. The Board recognized that it is difficult to make comparisons of profitability from fund management contracts because comparative information is not generally publicly available and is affected by numerous factors, including the structure of the particular adviser, the types of funds it manages, its business mix, numerous assumptions regarding allocations and the adviser’s capital structure and cost of capital. However, the Board considered that the cost of services provided by PGIM Investments to the Fund during the year ended December 31, 2016 exceeded the management fees paid by the Fund, resulting in an operating loss to PGIM Investments. The Board further noted that the subadviser is affiliated with PGIM Investments and that its profitability is reflected in PGIM Investments’ profitability report. Taking these factors into account, the Board concluded that the profitability of PGIM Investments and its affiliates in relation to the services rendered was not unreasonable.
Economies of Scale
The Board received and discussed information concerning economies of scale that PGIM Investments may realize as the Fund’s assets grow beyond current levels. The Board noted that the management fee schedule for the Fund includes breakpoints, which have the effect of decreasing the fee rate as assets increase, but that at its current level of assets the Fund does not realize the effect of those rate reductions. The Board took note that the Fund’s fee structure currently results in benefits to Fund shareholders whether or not PGIM Investments realizes any economies of scale. The Board noted that economies of scale can be shared with the Fund in other ways, including low management fees from inception, additional technological and personnel investments to enhance shareholder services, and maintaining existing expense structures in the face of a rising cost environment. The Board
| Prudential Real Estate Income Fund | ||
Approval of Advisory Agreements (continued)
also considered PGIM Investments’ assertion that it continually evaluates the management fee schedule of the Fund and the potential to share economies of scale through breakpoints or fee waivers as asset levels increase.
The Board recognized the inherent limitations of any analysis of economies of scale, stemming largely from the Board’s understanding that most of PGIM Investments’ costs are not specific to individual funds, but rather are incurred across a variety of products and services.
Other Benefits to PGIM Investments and PGIM
The Board considered potential ancillary benefits that might be received by PGIM Investments and PGIM and their affiliates as a result of their relationship with the Fund. The Board concluded that potential benefits to be derived by PGIM Investments included transfer agency fees received by the Fund’s transfer agent (which is affiliated with PGIM Investments), and benefits to its reputation as well as other intangible benefits resulting from PGIM Investments’ association with the Fund. The Board concluded that the potential benefits to be derived by PGIM included its ability to use soft dollar credits, as well as the potential benefits consistent with those generally resulting from an increase in assets under management, specifically, potential access to additional research resources and benefits to its reputation. The Board concluded that the benefits derived by PGIM Investments and PGIM were consistent with the types of benefits generally derived by investment managers and subadvisers to mutual funds.
Performance of the Fund / Fees and Expenses
The Board considered certain additional specific factors and made related conclusions relating to the historical performance of the Fund for the one-year period ended December 31, 2016. The Board considered that the Fund commenced operations on June 3, 2015 and that longer-term performance was not yet available.
The Board also considered the Fund’s actual management fee, as well as the Fund’s net total expense ratio, for the fiscal year ended October 31, 2016. The Board considered the management fee for the Fund as compared to the management fee charged by PGIM Investments to other funds and the fee charged by other advisers to comparable mutual funds in a Peer Group. The actual management fee represents the fee rate actually paid by Fund shareholders and includes any fee waivers or reimbursements. The net total expense ratio for the Fund represents the actual expense ratio incurred by Fund shareholders.
The mutual funds included in the Peer Universe (the Lipper Global Real Estate Funds Performance Universe), which was used to consider performance, and the Peer Group, which was used to consider expenses and fees, were objectively determined by Broadridge,
| Visit our website at pgiminvestments.com |
an independent provider of mutual fund data. The comparisons placed the Fund in various quartiles, with the first quartile being the best 25% of the mutual funds (for performance, the best performing mutual funds and, for expenses, the lowest cost mutual funds).
The section below summarizes key factors considered by the Board and the Board’s conclusions regarding the Fund’s performance, fees and overall expenses. The table sets forth gross performance comparisons (which do not reflect the impact on performance of fund expenses, or any subsidies, expense caps or waivers that may be applicable) with the Peer Universe, actual management fees with the Peer Group (which reflect the impact of any subsidies or fee waivers), and net total expenses with the Peer Group, each of which were key factors considered by the Board.
| Performance | 1 Year | 3 Years | 5 Years | 10 Years | ||||
1st Quartile | N/A | N/A | N/A | |||||
| Actual Management Fees: 1st Quartile | ||||||||
| Net Total Expenses: 1st Quartile | ||||||||
| • | The Board noted that the Fund outperformed its benchmark over the one-year period. |
| • | The Board noted that the Fund does not yet have a three-year performance record and that, therefore, the subadviser should have more time to develop that record. |
| • | The Board and PGIM Investments agreed to continue the Fund’s existing expense cap, which caps the Fund’s annual operating expenses at 1.10% (exclusive of 12b-1 and certain other fees), through February 28, 2018. |
| • | The Board concluded that in light of the above, it would be in the best interests of the Fund and its shareholders to continue to allow the Fund to create a performance record, and to renew the agreements. |
| • | The Board concluded that the management fees (including subadvisory fees) and total expenses were reasonable in light of the services provided. |
* * *
After full consideration of these factors, the Board concluded that the approval of the agreements was in the best interests of the Fund and its shareholders.
| Prudential Real Estate Income Fund | ||
| ∎ TELEPHONE | ∎ WEBSITE | |||
655 Broad Street Newark, NJ 07102 | (800) 225-1852 | www.pgiminvestments.com |
| PROXY VOTING |
| The Board of Trustees of the Fund has delegated to the Fund’s investment subadviser the responsibility for voting any proxies and maintaining proxy recordkeeping with respect to the Fund. A description of these proxy voting policies and procedures is available without charge, upon request, by calling (800) 225-1852. Information regarding how the Fund voted proxies relating to portfolio securities during the most recent 12-month period ended June 30 is available on the Fund’s website and on the Securities and Exchange Commission’s website. |
| TRUSTEES |
| Ellen S. Alberding • Kevin J. Bannon • Scott E. Benjamin • Linda W. Bynoe • Barry H. Evans • Keith F. Hartstein • Laurie Simon Hodrick • Michael S. Hyland • Stuart S. Parker • Richard A. Redeker • Stephen G. Stoneburn • Grace C. Torres |
| OFFICERS |
| Stuart S. Parker, President • Scott E. Benjamin, Vice President • M. Sadiq Peshimam, Treasurer and Principal Financial and Accounting Officer • Raymond A. O’Hara, Chief Legal Officer • Deborah A. Docs, Secretary • Chad A. Earnst, Chief Compliance Officer • Charles H. Smith, Anti-Money Laundering Compliance Officer • Jonathan D. Shain, Assistant Secretary • Claudia DiGiacomo, Assistant Secretary • Andrew R. French, Assistant Secretary • Peter Parrella, Assistant Treasurer • Lana Lomuti, Assistant Treasurer • Linda McMullin, Assistant Treasurer • Kelly A. Coyne, Assistant Treasurer |
| MANAGER | PGIM Investments LLC | 655 Broad Street Newark, NJ 07102 | ||
| ||||
| INVESTMENT SUBADVISER | PGIM Real Estate | 7 Giralda Farms Madison, NJ 07940 | ||
| ||||
| DISTRIBUTOR | Prudential Investment Management Services LLC | 655 Broad Street Newark, NJ 07102 | ||
| ||||
| CUSTODIAN | The Bank of New York Mellon | 225 Liberty Street New York, NY 10286 | ||
| ||||
| TRANSFER AGENT | Prudential Mutual Fund Services LLC | PO Box 9658 Providence, RI 02940 | ||
| ||||
| INDEPENDENT REGISTERED PUBLIC ACCOUNTING FIRM | KPMG LLP | 345 Park Avenue New York, NY 10154 | ||
| ||||
| FUND COUNSEL | Willkie Farr & Gallagher LLP | 787 Seventh Avenue New York, NY 10019 | ||
| ||||
| An investor should consider the investment objectives, risks, charges, and expenses of the Fund carefully before investing. The prospectus and summary prospectus contain this and other information about the Fund. An investor may obtain a prospectus and summary prospectus by visiting our website at www.pgiminvestments.com or by calling (800) 225-1852. The prospectus and summary prospectus should be read carefully before investing. |
| E-DELIVERY |
| To receive your mutual fund documents online, go to www.pgiminvestments.com/edelivery and enroll. Instead of receiving printed documents by mail, you will receive notification via email when new materials are available. You can cancel your enrollment or change your email address at any time by visiting the website address above. |
| SHAREHOLDER COMMUNICATIONS WITH TRUSTEES |
| Shareholders can communicate directly with the Board of Trustees by writing to the Chair of the Board, Prudential Real Estate Income Fund, PGIM Investments, Attn: Board of Trustees, 655 Broad Street, Newark, NJ 07102. Shareholders can communicate directly with an individual Trustee by writing to the same address. Communications are not screened before being delivered to the addressee. |
| AVAILABILITY OF PORTFOLIO SCHEDULE |
| The Fund files its complete schedule of portfolio holdings with the Securities and Exchange Commission for the first and third quarters of each fiscal year on Form N-Q. The Fund’s Forms N-Q are available on the Commission’s website at www.sec.gov. The Fund’s Forms N-Q may also be reviewed and copied at the Commission’s Public Reference Room in Washington, D.C. Information on the operation and location of the Public Reference Room may be obtained by calling 1-800-SEC-0330. The Fund’s schedule of portfolio holdings is also available on the Fund’s website as of the end of each month. |
| The Fund’s Statement of Additional Information contains additional information about the Fund’s Trustees and is available without charge, upon request, by calling (800) 225-1852. |
Mutual Funds:
| ARE NOT INSURED BY THE FDIC OR ANY FEDERAL GOVERNMENT AGENCY | MAY LOSE VALUE | ARE NOT A DEPOSIT OF OR GUARANTEED BY ANY BANK OR ANY BANK AFFILIATE |
PRUDENTIAL REAL ESTATE INCOME FUND
| SHARE CLASS | A | C | Q | Z | ||||
| NASDAQ | PRKAX | PRKCX | PRKQX | PRKZX | ||||
| CUSIP | 74441J761 | 74441J753 | 74441J670 | 74441J746 |
MF228E

PRUDENTIAL SELECT REAL ESTATE FUND
ANNUAL REPORT
OCTOBER 31, 2017

To enroll in e-delivery, go to pgiminvestments.com/edelivery
| Objective: Capital appreciation and income |
Highlights
| • | Strong outperformance of the Fund was primarily driven by favorable stock selection in the US. Most property types in the US outperformed, with the most notable performers being the health care, data center, residential, office, and hotel sectors. |
| • | Asia also outperformed, albeit to a lesser degree, as stock selection among Japanese companies was favorable and an underweight allocation to Japan in the Fund helped relative performance. Lastly, an overweight allocation to Ireland and sound security selection in that country contributed to performance. |
| • | The main detractors from performance for the period were the Fund’s overweight allocation to the US shopping center sector and an underweight allocation to Hong Kong. |
This report is not authorized for distribution to prospective investors unless preceded or accompanied by a current prospectus.
The views expressed in this report and information about the Fund’s portfolio holdings are for the period covered by this report and are subject to change thereafter.
Mutual funds are distributed by Prudential Investment Management Services LLC (PIMS). PGIM Real Estate is a unit of PGIM, Inc. (PGIM), a registered investment advisor. PIMS and PGIM are Prudential Financial companies. © 2017 Prudential Financial, Inc. and its related entities. PGIM Real Estate, PGIM, and the PGIM logo are service marks of Prudential Financial, Inc. and its related entities, registered in many jurisdictions worldwide.
| 2 | Visit our website at pgiminvestments.com |
PRUDENTIAL FUNDS — UPDATE
The Board of Directors/Trustees for the Fund has approved renaming the Fund’s Class Q shares as Class R6 shares, effective on or about June 15, 2018. The renaming of Class Q shares as Class R6 shares will not result in any changes to pricing, eligibility, or shareholder rights and obligations. The renamed Class R6 shares will not be exchangeable with Class R6 shares of the Prudential Day One Funds or the Prudential 60/40 Allocation Fund.
LR993
| Prudential Select Real Estate Fund | 3 |
PRUDENTIAL FUNDS — UPDATE
Effective on or about June 1, 2018 (the “Effective Date”), the Fund’s Class A, Class C, Class R, and Class Z shares, as applicable, will be closed to investments by new group retirement plans, except as discussed below. Existing group retirement plans as of the Effective Date may keep their investments in their current share class and may continue to make additional purchases or exchanges of that class of shares. As of the Effective Date, all new group retirement plans wishing to add the Fund as a new addition to the plan generally will be into one of the available Class Q shares, Class R2 shares, or Class R4 shares of the Fund.
In addition, on or about the Effective Date, the Class R shares of the Fund will be closed to all new investors, except as discussed below. Due to the closing of the Class R shares to new investors, effective on or about the Effective Date new IRA investors may only purchase Class A, Class C, Class Z, or Class Q shares of the Fund, subject to share class eligibility. Following the Effective Date, no new accounts may be established in the Fund’s Class R shares and no Class R shares may be purchased or acquired by any new Class R shareholder, except as discussed below.
| Class A | Class C | Class Z | Class R | |||||
Existing Investors (Group Retirement Plans, IRAs, and all other investors) | No Change | No Change | No Change | No Change | ||||
| New Group Retirement Plans | Closed to group retirement plans wishing to add the share classes as new additions to plan menus on or about June 1, 2018, subject to certain exceptions below | |||||||
New IRAs | No Change | No Change | No Change | Closed to all new investors on or about June 1, 2018, subject to certain exceptions below | ||||
| All Other New Investors | No Change | No Change | No Change | |||||
| 4 | Visit our website at pgiminvestments.com |
However, the following new investors may continue to purchase Class A, Class C, Class R, and Class Z shares of the Fund, as applicable:
| • | Eligible group retirement plans who are exercising their one-time 90-day repurchase privilege in the Fund will be permitted to purchase such share classes. |
| • | Plan participants in a group retirement plan that offers Class A, Class C, Class R, or Class Z shares of the Fund as of the Effective Date will be permitted to purchase such share classes of the Fund, even if the plan participant did not own shares of that class of the Fund as of the Effective Date. |
| • | Certain new group retirement plans will be permitted to offer such share classes of the Fund after the Effective Date, provided that the plan has or is actively negotiating a contractual agreement with the Fund’s distributor or service provider to offer such share classes of the Fund prior to or on the Effective Date. |
| • | New group retirement plans that combine with, replace, or are otherwise affiliated with a current plan that invests in such share classes prior to or on the Effective Date will be permitted to purchase such share classes. |
The Fund also reserves the right to refuse any purchase order that might disrupt management of the Fund or to otherwise modify the closure policy at any time on a case-by-case basis.
| Prudential Select Real Estate Fund | 5 |
This Page Intentionally Left Blank
| 6 | Visit our website at pgiminvestments.com |
Letter from the President

Dear Shareholder:
We hope you find the annual report for the Prudential Select Real Estate Fund informative and useful. The report covers performance for the 12-month period ended October 31, 2017.
Significant events during the reporting period included a new US president, followed by uncertainty in Congress over implementing the Trump
administration’s policy initiatives. Elsewhere, Britain began its formal legal process to leave the European Union. France elected a more centrist president, which was viewed as a pro-euro referendum. North Korea’s missile launches escalated geopolitical tensions. Also, late in the period, a series of hurricanes caused damage in the US and the Caribbean.
Despite some turbulence in the macro-environment, solid economic fundamentals in the US economy included moderate gross domestic product expansion, robust employment, and accelerating corporate profit growth. Inflation remained tame. The Federal Reserve raised its federal funds rate twice in 2017, and is in the process of winding down its stimulus program.
Global economic growth remained mostly positive. Equities in the US reached new highs amid low volatility, while international equities posted strong gains. European stocks continued to gain. Asian markets were solid, and emerging markets outperformed most regions. Fixed income markets were mixed. High yield and emerging markets bonds were the top performers.
Given the uncertainty in today’s investment environment, we believe that active professional portfolio management offers a potential advantage. Active managers often have the knowledge and flexibility to find the best investment opportunities in the most challenging markets.
Even so, it’s best if investment decisions are based on your long-term goals rather than on short-term market and economic developments. We also encourage you to work with an experienced financial advisor who can help you set goals, determine your tolerance for risk, and build a diversified plan that’s right for you and make adjustments when necessary.
At PGIM Investments, we consider it a great privilege and responsibility to help investors participate in opportunities across global markets while meeting their toughest investment challenges. We’re part of PGIM, a top-10 global investment manager with more than $1 trillion in assets under management. This investment expertise allows us to deliver actively managed funds and strategies to meet the needs of investors around the globe.
Thank you for choosing our family of funds.
Sincerely,

Stuart S. Parker, President
Prudential Select Real Estate Fund
December 15, 2017
| Prudential Select Real Estate Fund | 7 |
Your Fund’s Performance (unaudited)
Performance data quoted represents past performance. Past performance does not guarantee future results. The investment return and principal value of an investment will fluctuate, so that an investor’s shares, when redeemed, may be worth more or less than their original cost. Current performance may be lower or higher than the past performance data quoted. An investor may obtain performance data as of the most recent month-end by visiting our website at www.pgiminvestments.com or by calling (800) 225-1852.
| Average Annual Total Returns as of 10/31/17 (with sales charges) | ||||
| One Year (%) | Since Inception (%) | |||
| Class A | 3.08 | 3.36 (8/1/14) | ||
| Class C | 7.11 | 4.34 (8/1/14) | ||
| Class Q | 9.25 | 5.39 (8/1/14) | ||
| Class Z | 9.32 | 5.44 (8/1/14) | ||
| FTSE EPRA/NAREIT Developed Index | 6.12 | 3.64 | ||
| S&P 500 Index | 23.61 | 11.57 | ||
| Lipper Global Real Estate Funds Average | 7.24 | 3.70 | ||
| Average Annual Total Returns as of 10/31/17 (without sales charges) | ||||
| One Year (%) | Since Inception (%) | |||
| Class A | 9.08 | 5.17 (8/1/14) | ||
| Class C | 8.11 | 4.34 (8/1/14) | ||
| Class Q | 9.25 | 5.39 (8/1/14) | ||
| Class Z | 9.32 | 5.44 (8/1/14) | ||
| FTSE EPRA/NAREIT Developed Index | 6.12 | 3.64 | ||
| S&P 500 Index | 23.61 | 11.57 | ||
| Lipper Global Real Estate Funds Average | 7.24 | 3.70 | ||
| 8 | Visit our website at pgiminvestments.com |
Growth of a $10,000 Investment
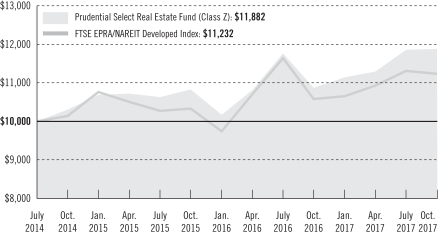
The graph compares a $10,000 investment in the Prudential Select Real Estate Fund (Class Z shares) with a similar investment in the FTSE EPRA/NAREIT Developed Index, by portraying the initial account values at the commencement of operations for Class Z shares (August 1, 2014) and the account values at the end of the current fiscal year (October 31, 2017) as measured on a quarterly basis. For purposes of the graph, and unless otherwise indicated, it has been assumed that (a) all recurring fees (including management fees) were deducted; and (b) all dividends and distributions were reinvested. The line graph provides information for Class Z shares only. As indicated in the tables provided earlier, performance for Class A, Class C, and Class Q shares will vary due to the differing charges and expenses applicable to each share class (as indicated in the following paragraphs). Without waiver of fees and/or expense reimbursements, if any, the Fund’s returns would have been lower.
Past performance does not predict future performance. Total returns and the ending account values in the graph include changes in share price and reinvestment of dividends and capital gains distributions in a hypothetical investment for the periods shown. The Fund’s total returns do not reflect the deduction of income taxes on an individual’s investment. Taxes may reduce your actual investment returns on income or gains paid by the Fund or any gains you may realize if you sell your shares.
Source: PGIM Investments LLC and Lipper Inc.
Since Inception returns are provided since the Fund has less than 10 fiscal years of returns. Since Inception returns for the Indexes and the Lipper Average are measured from the closest month-end to the Fund’s inception date.
| Prudential Select Real Estate Fund | 9 |
Your Fund’s Performance (continued)
The returns in the tables do not reflect the deduction of taxes that a shareholder would pay on Fund distributions or following the redemption of Fund shares. The average annual total returns take into account applicable sales charges, which are described for each share class in the table below.
| Class A* | Class C* | Class Q | Class Z* | |||||
| Maximum initial sales charge | 5.50% of the public offering price | None | None | None | ||||
| Contingent deferred sales charge (CDSC) (as a percentage of the lower of original purchase price or net asset value at redemption) | 1.00% on sales of $1 million or more made within 12 months of purchase | 1.00% on sales made within 12 months of purchase | None | None | ||||
| Annual distribution and service (12b-1) fees (shown as a percentage of average daily net assets) | 0.30% (0.25% currently) | 1.00% | None | None |
*Certain share classes will be generally closed to investments by new group retirement plans effective on or about June 1, 2018. Please see the “PRUDENTIAL FUNDS—UPDATE” on page 4 of this report for more information.
Benchmark Definitions
FTSE EPRA/NAREIT Developed Index—The Financial Times Stock Exchange European Public Real Estate Association/National Association of Real Estate Investment Trusts (FTSE EPRA/NAREIT) Developed Index reflects the stock performance of companies engaged in specific aspects of the major real estate markets/regions of the world.
S&P 500 Index—The Standard & Poor’s 500 Composite Stock Price Index (S&P 500 Index) is an unmanaged index of over 500 stocks of large US public companies. It gives a broad look at how stock prices in the United States have performed.
Lipper Global Real Estate Funds Average—The Lipper Global Real Estate Funds Average (Lipper Average) includes funds that invest at least 25% but less than 75% of their equity portfolios in shares of companies engaged in the real estate industry that are strictly outside of the US or whose securities are principally traded outside of the US.
Investors cannot invest directly in an index or average. The returns for the Indexes would be lower if they included the effects of sales charges, operating expenses of a mutual fund, or taxes. Returns for the Lipper Average reflect the deduction of operating expenses, but not sales charges or taxes.
| 10 | Visit our website at pgiminvestments.com |
Presentation of Fund Holdings
| Five Holdings expressed as a percentage of net assets as of 10/31/17 (%) | ||||
Hudson Pacific Properties, Inc., Office REITs | 4.4 | |||
| Forest City Realty Trust, Inc. (Class A Stock), Diversified REITs | 3.8 | |||
| MGM Growth Properties LLC (Class A Stock), Hotel & Resort REITs | 3.4 | |||
| CoreSite Realty Corp., Specialized REITs | 3.1 | |||
| Equity LifeStyle Properties, Inc., Residential REITs | 3.0 | |||
Holdings reflect only long-term investments and are subject to change.
| Five Largest Industries expressed as a percentage of net assets as of 10/31/17 (%) | ||||
Residential | 16.4 | |||
| Industrial | 15.1 | |||
| Office | 13.2 | |||
| Diversified | 10.2 | |||
| Hotel & Resort | 8.8 | |||
Industry weightings reflect only long-term investments and are subject to change.
| Prudential Select Real Estate Fund | 11 |
Strategy and Performance Overview
How did the Fund perform?
The Prudential Select Real Estate Fund’s Class Z shares gained 9.32% for the 12-month period ended October 31, 2017, outperforming the 6.12% gain of the FTSE EPRA/NAREIT Developed Index (Index) and the 7.24% gain of the Lipper Global Real Estate Funds Average.
What were conditions like in the global real estate securities market?
| • | In the US, real estate investment trust (REIT) returns were primarily driven by shifting views on interest rates, tax legislation, concerns over where we are in the real estate cycle, as well as continued strong real estate fundamentals. Investors rewarded property types that demonstrated the best cash flow growth with premium multiples like the top-performing industrial and data center sectors. |
| • | The level of jobs growth continued to create ample real estate demand to absorb vacancies and create pricing power in most property types and markets. However, it was not so much that it created material supply additions, with the exception of apartments, self-storage, and select industrial and hotel markets. New supply remains well below historical averages and near historical lows at 1% of existing supply. M&A (merger and acquisition) activity accelerated during the year as a low cost of capital combined, with REITs trading at discounts to NAV, provided a good environment for deals. From a relative valuation perspective, certain core real estate property types are trading at wide discounts relative to their historical levels. |
| • | Europe has been the global region with the strongest performance over the last 12 months, with the European index returning 18.6% during the reporting period. While political risk troubled investors at the beginning of 2017 with numerous upcoming elections across Europe, the index began a strong recovery from late April following positive results in the Dutch and French elections. |
| • | The very low interest rate environment has persisted in the euro zone for longer than investors had originally anticipated, creating downward pressure on capitalization rates (the rate of return on a real estate investment property based on the expected income that the property will generate) across the region, especially for core properties in the more liquid markets. |
| • | Foreign investor demand has been strong and rental growth momentum has been robust in the major continental markets. The UK also kept pace with the wider European market, returning 19.0%. Stock prices and the currency bounced from their post-Brexit lows in 3Q16 as the real estate market did not experience the sudden contraction that had been feared. However, the UK began underperforming the rest of Europe since the June 2017 election that weakened the current government as uncertainty over the shape and implications of Brexit have grown. |
| 12 | Visit our website at prudentialfunds.com |
| • | Asia Pacific developers had their best showing in years, led by Singapore developers and Hong Kong developers. Positive growth expectations, lower interest rates, and reduced housing policy risk were factors contributing to their performance. The Hong Kong developers also had the added advantage of firm mainland Chinese investment demand, value-accretive asset disposals, farmland conversions, and more shareholder friendly policies. |
| • | Japan developers did well on better-than-expected condominium sales and solid office demand. The electoral victory by Shinzo Abe’s Liberal Democratic Party (LDP) reinforced reflation (an uptick in market prices) expectations and accommodative monetary policy—a positive for real estate developers. |
| • | On the other hand, Asia Pacific REITs have shown mixed performance in the past 12 months, with Singapore REITs leading the pack, followed by the Australian REITs. In Singapore, office REITs benefited from a recovery given limited Grade A completions in the next two years. In Australia, demand for the highest-quality or Grade-A offices remains robust, whereas retail faces ongoing challenges with competition from Amazon and a cyclical consumption slowdown. Given the sharp escalation in physical asset pricing, Japanese REITs corrected the most as a result of diminished acquisition growth expectations. |
What worked?
| • | Strong outperformance of the Fund was primarily driven by favorable stock selection in the US. Most property types in the US outperformed, with the most notable performers being the health care, data center, residential, office, and hotel sectors. |
| • | Asia also outperformed, albeit to a lesser degree, as stock selection among Japanese companies was favorable and an underweight allocation to Japan in the Fund helped relative performance. Lastly, an overweight allocation to Ireland and sound security selection in that country contributed to performance. |
What didn’t work?
| • | The main detractors of performance for the period were the Fund’s overweight allocation to the US shopping center sector and an underweight allocation to Hong Kong. |
| • | Although Europe as a region underperformed, there were no noteworthy underperformers:—lagging performance occurred across numerous countries. |
| Prudential Select Real Estate Fund | 13 |
Strategy and Performance Overview (continued)
The percentage points shown in the tables below identify each security’s positive or negative contribution to the Fund’s return relative to the benchmark, which is the sum of all contributions by individual holdings.
| Top Contributors (%) | Top Detractors (%) | |||||||||
| CoreSite Realty Corporation | 0.91 | Federal Realty Investment Trust | –0.42 | |||||||
| Rexford Industrial Realty, Inc. | 0.90 | Retail Properties of America, Inc. Class A | –0.42 | |||||||
| Four Corners Property Trust, Inc. | 0.83 | Taubman Centers, Inc. | –0.54 | |||||||
| Forest City Realty Trust Inc. Class A | 0.58 | DDR Corp. | –0.80 | |||||||
| DiamondRock Hospitality Company | 0.55 | Spirit Realty Capital, Inc. | –0.93 | |||||||
| • | In the US, REITs should experience continued improvement in operating fundamentals and are expected to deliver high single digit dividend and 5%–7% cash flow growth in the next 12 months. US REITs offer a valuable combination of income and growth in a volatile market. The market continues to revise its expectations around the timing and magnitude of policy changes. Merger and acquisition activity has picked up and is expected to continue for the remainder of 2017, particularly if small capitalization REITs continue to trade at discounts to private real estate value. |
| • | Eurozone economic indicators continue to improve slowly and the monetary policy backdrop remains loose. While the European Central Bank (ECB) has announced plans to gradually scale back quantitative easing, the overall economic and real estate environment in Europe is modestly positive. The exception to this benign environment appears to be the UK, where the process of the UK’s exit from the EU only began at the end of March 2017. Real estate fundamentals look solid across continental Europe. New supply is generally under control and there is evidence of at least modest rental growth in most markets. The backdrop of monetary policy is expected to remain supportive for some time. |
| • | The Asia Pacific region should continue to see value, notwithstanding rising interest rates that could pose a challenge to REITs. The themes we see that could be favorable in the coming months are: strategic review/asset disposal on the back of strong capital appreciation, especially in Hong Kong office and retail stocks, flight-to-quality, particularly among Singapore office securities, and lastly, conducive monetary policy among Japanese developers. A weaker US dollar/stronger yen could derail economic momentum in Japan and impact underlying demand for condos and office space. On the other hand, lowered expectations of Fed rate hikes and an easing in monetary conditions would be viewed positively for Hong Kong developers. |
| 14 | Visit our website at pgiminvestments.com |
Comments on Largest Holdings
| 4.4% | Hudson Pacific Properties, Inc., Office REITs |
One of Hollywood’s biggest landlords, Hudson Pacific buys and manages primarily office buildings, but also media and entertainment properties, in California and the Pacific Northwest, in areas such as Los Angeles, Orange County, San Diego, San Francisco, and Seattle. It owns more than 55 properties totaling some 15 million sq. ft., including two production studios on Hollywood’s Sunset Boulevard. Its largest tenants range from tech giants such as Google, Cisco Systems, and Uber, to Hollywood producers including Warner Bros. Entertainment and Warner Music Group.
| 3.8% | Forest City Realty Trust, Inc. (Class A Stock), Diversified REITs |
Forest City Realty Trust owns, develops, manages, and acquires commercial real estate properties. Forest City Realty Trust, Inc. serves customers in the United States.
| 3.4% | MGM Growth Properties LLC (Class A Stock), Hotel & Resort REITs |
As one of the top five largest hotel owners, in the US, MGM hotel owns around 10 former-MGM properties in Las Vegas, including the Mandalay Bay, The Mirage, Excalibur, Monte Carlo, Luxor, The Park, and New York New York. Outside of Las Vegas, MGM owns the MGM Grand in Detroit, and the Beau Rivage and Gold Strike hotels in Mississippi. Altogether, its properties carry almost 24,500 hotel rooms, some 2.5 million sq. ft. of convention space, 100-plus retail outlets, over 200 food and beverage outlets, and 20 entertainment venues. The REIT was formed in April 2016 to operate as MGM Resort International’s landlord.
| 3.1% | CoreSite Realty Corp., Specialized REITs |
CoreSite Realty Corp. develops, owns and operates data centers in the United States. The data centers include ample and redundant power and advanced cooling and security systems, and many are points of dense network interconnection.
| 3.0% | Equity LifeStyle Properties, Inc., Residential REITs |
Equity LifeStyle owns and operates lifestyle-oriented residential properties aimed at retirees, vacationers, and second home owners. Other properties provide affordable housing for families. Equity LifeStyle Properties leases lots for factory-built homes, cottages, cabins, and recreational vehicles. Available homes range in size and style. The REIT’s portfolio includes more than 380 properties containing some 141,000 lots in about 30 states and Canada. Properties are similar to site-built residential subdivisions, with centralized entrances, utilities, gutters, curbs, and paved streets.
| Prudential Select Real Estate Fund | 15 |
Fees and Expenses (unaudited)
As a shareholder of the Fund, you incur two types of costs: (1) transaction costs, including sales charges (loads) on purchase payments and redemptions, as applicable, and (2) ongoing costs, including management fees, distribution, and/or service (12b-1) fees, and other Fund expenses, as applicable. This example is intended to help you understand your ongoing costs (in dollars) of investing in the Fund and to compare these costs with the ongoing costs of investing in other mutual funds.
The example is based on an investment of $1,000 held through the six-month period ended October 31, 2017. The example is for illustrative purposes only; you should consult the Prospectus for information on initial and subsequent minimum investment requirements.
Actual Expenses
The first line for each share class in the table on the following page provides information about actual account values and actual expenses. You may use the information on this line, together with the amount you invested, to estimate the expenses that you paid over the period. Simply divide your account value by $1,000 (for example, an $8,600 account value ÷ $1,000 = 8.6), then multiply the result by the number on the first line under the heading “Expenses Paid During the Six-Month Period” to estimate the expenses you paid on your account during this period.
Hypothetical Example for Comparison Purposes
The second line for each share class in the table on the following page provides information about hypothetical account values and hypothetical expenses based on the Fund’s actual expense ratio and an assumed rate of return of 5% per year before expenses, which is not the Fund’s actual return. The hypothetical account values and expenses may not be used to estimate the actual ending account balance or expenses you paid for the period. You may use this information to compare the ongoing costs of investing in the Fund and other funds. To do so, compare this 5% hypothetical example with the 5% hypothetical examples that appear in the shareholder reports of the other funds.
The Fund’s transfer agent may charge additional fees to holders of certain accounts that are not included in the expenses shown in the table on the following page. These fees apply to individual retirement accounts (IRAs) and Section 403(b) accounts. As of the close of the period covered by the table, IRA fees included an annual maintenance fee of $15 per account (subject to a maximum annual maintenance fee of $25 for all accounts held by the same shareholder). Section 403(b) accounts are charged an annual $25 fiduciary maintenance fee. Some of the fees may vary in amount, or may be waived, based on your total account balance or the number of Prudential funds, including the Fund, that you own. You should consider the additional fees that were charged to your Fund account over the six-month period when you estimate the total ongoing expenses paid over the period and the impact of these fees on your ending account value, as these additional expenses are
| 16 | Visit our website at pgiminvestments.com |
not reflected in the information provided in the expense table. Additional fees have the effect of reducing investment returns.
Please note that the expenses shown in the table are meant to highlight your ongoing costs only and do not reflect any transactional costs such as sales charges (loads). Therefore, the second line for each share class in the table is useful in comparing ongoing costs only and will not help you determine the relative total costs of owning different funds. In addition, if these transactional costs were included, your costs would have been higher.
| Prudential Select Real Estate Fund | Beginning Account Value May 1, 2017 | Ending Account Value October 31, 2017 | Annualized Expense Ratio Based on the Six-Month Period | Expenses Paid During the Six-Month Period* | ||||||||||||||
| Class A | Actual | $ | 1,000.00 | $ | 1,051.00 | 1.30 | % | $ | 6.72 | |||||||||
| Hypothetical | $ | 1,000.00 | $ | 1,018.66 | 1.30 | % | $ | 6.61 | ||||||||||
| Class C | Actual | $ | 1,000.00 | $ | 1,046.50 | 2.05 | % | $ | 10.57 | |||||||||
| Hypothetical | $ | 1,000.00 | $ | 1,014.88 | 2.05 | % | $ | 10.41 | ||||||||||
| Class Q | Actual | $ | 1,000.00 | $ | 1,052.00 | 1.05 | % | $ | 5.43 | |||||||||
| Hypothetical | $ | 1,000.00 | $ | 1,019.91 | 1.05 | % | $ | 5.35 | ||||||||||
| Class Z | Actual | $ | 1,000.00 | $ | 1,052.30 | 1.05 | % | $ | 5.43 | |||||||||
| Hypothetical | $ | 1,000.00 | $ | 1,019.91 | 1.05 | % | $ | 5.35 | ||||||||||
*Fund expenses (net of fee waivers or subsidies, if any) for each share class are equal to the annualized expense ratio for each share class (provided in the table), multiplied by the average account value over the period, multiplied by the 184 days in the six-month period ended October 31, 2017, and divided by the 365 days in the Fund’s fiscal year ended October 31, 2017 (to reflect the six-month period). Expenses presented in the table include the expenses of any underlying funds in which the Fund may invest.
| Prudential Select Real Estate Fund | 17 |
Schedule of Investments
as of October 31, 2017
| Description | Shares | Value | ||||||
LONG-TERM INVESTMENTS 96.0% | ||||||||
COMMON STOCKS | ||||||||
Diversified Real Estate Activities 6.9% | ||||||||
Daiwa House Industry Co. Ltd. (Japan) | 5,042 | $ | 184,804 | |||||
Sumitomo Realty & Development Co. Ltd. (Japan) | 4,215 | 141,170 | ||||||
Sun Hung Kai Properties Ltd. (Hong Kong) | 7,034 | 115,072 | ||||||
|
| |||||||
| 441,046 | ||||||||
Diversified REITs 10.2% | ||||||||
American Assets Trust, Inc. | 2,400 | 93,096 | ||||||
Empire State Realty Trust, Inc. (Class A Stock) | 5,000 | 100,250 | ||||||
Forest City Realty Trust, Inc. (Class A Stock) | 9,850 | 242,606 | ||||||
ICADE (France) | 838 | 73,233 | ||||||
Suntec Real Estate Investment Trust (Singapore) | 100,675 | 144,124 | ||||||
|
| |||||||
| 653,309 | ||||||||
Health Care REITs 4.8% | ||||||||
Community Healthcare Trust, Inc. | 2,711 | 74,363 | ||||||
Medical Properties Trust, Inc. | 9,829 | 130,037 | ||||||
Physicians Realty Trust | 6,000 | 104,280 | ||||||
|
| |||||||
| 308,680 | ||||||||
Hotel & Resort REITs 8.8% | ||||||||
DiamondRock Hospitality Co. | 16,000 | 173,760 | ||||||
Invincible Investment Corp. (Japan) | 180 | 72,954 | ||||||
MGM Growth Properties LLC (Class A Stock) | 7,471 | 220,469 | ||||||
Park Hotels & Resorts, Inc. | 3,400 | 97,886 | ||||||
|
| |||||||
| 565,069 | ||||||||
Hotels, Resorts & Cruise Lines 1.8% | ||||||||
Mandarin Oriental International Ltd. (Hong Kong) | 51,600 | 113,520 | ||||||
Industrial REITs 15.1% | ||||||||
Duke Realty Corp. | 6,200 | 176,576 | ||||||
First Industrial Realty Trust, Inc. | 4,000 | 123,520 | ||||||
Goodman Group (Australia) | 19,000 | 121,823 | ||||||
LaSalle Logiport REIT (Japan) | 97 | 91,265 | ||||||
Rexford Industrial Realty, Inc. | 6,266 | 186,038 | ||||||
STAG Industrial, Inc. | 5,200 | 141,960 | ||||||
Warehouse REIT PLC (United Kingdom)* | 96,982 | 125,747 | ||||||
|
| |||||||
| 966,929 | ||||||||
See Notes to Financial Statements.
| Prudential Select Real Estate Fund | 19 |
Schedule of Investments (continued)
as of October 31, 2017
| Description | Shares | Value | ||||||
COMMON STOCKS (Continued) | ||||||||
Office REITs 13.2% | ||||||||
Axiare Patrimonio SOCIMI SA, REIT (Spain) | 6,000 | $ | 112,525 | |||||
Hibernia REIT PLC (Ireland) | 70,630 | 121,297 | ||||||
Hudson Pacific Properties, Inc. | 8,350 | 282,397 | ||||||
Keppel REIT (Singapore) | 160,630 | 138,461 | ||||||
Kilroy Realty Corp. | 1,200 | 85,476 | ||||||
Piedmont Office Realty Trust, Inc. REIT (Class A Stock) | 5,500 | 106,370 | ||||||
|
| |||||||
| 846,526 | ||||||||
Real Estate Development 1.5% | ||||||||
Yanlord Land Group Ltd. (Singapore) | 76,000 | 99,868 | ||||||
Real Estate Operating Companies 4.1% | ||||||||
First Capital Realty, Inc. (Canada) | 8,100 | 128,460 | ||||||
TLG Immobilien AG (Germany) | 5,698 | 132,169 | ||||||
|
| |||||||
| 260,629 | ||||||||
Residential REITs 16.4% | ||||||||
American Homes 4 Rent (Class A Stock) | 7,500 | 159,600 | ||||||
AvalonBay Communities, Inc. | 700 | 126,931 | ||||||
Camden Property Trust | 1,100 | 100,364 | ||||||
Empiric Student Property PLC (United Kingdom) | 95,181 | 122,987 | ||||||
Equity LifeStyle Properties, Inc. | 2,200 | 194,656 | ||||||
Equity Residential | 1,880 | 126,449 | ||||||
Invitation Homes, Inc. | 6,000 | 135,420 | ||||||
Mid-America Apartment Communities, Inc. | 830 | 84,951 | ||||||
|
| |||||||
| 1,051,358 | ||||||||
Retail REITs 7.1% | ||||||||
Federal Realty Investment Trust | 940 | 113,289 | ||||||
GGP, Inc. | 6,500 | 126,490 | ||||||
Kenedix Retail REIT Corp. (Japan) | 46 | 90,780 | ||||||
NewRiver REIT PLC (United Kingdom) | 28,444 | 126,564 | ||||||
|
| |||||||
| 457,123 | ||||||||
Specialized REITs 6.1% | ||||||||
CoreSite Realty Corp. | 1,800 | 199,350 | ||||||
Four Corners Property Trust, Inc. | 7,690 | 189,789 | ||||||
|
| |||||||
| 389,139 | ||||||||
|
| |||||||
TOTAL LONG-TERM INVESTMENTS | 6,153,196 | |||||||
|
| |||||||
See Notes to Financial Statements.
| 20 |
| Description | Shares | Value | ||||||
SHORT-TERM INVESTMENT 6.2% | ||||||||
AFFILIATED MUTUAL FUND | ||||||||
Prudential Investment Portfolios 2 - Prudential Core | 398,187 | $ | 398,187 | |||||
|
| |||||||
TOTAL INVESTMENTS 102.2% | 6,551,383 | |||||||
Liabilities in excess of other assets (2.2)% | (139,457 | ) | ||||||
|
| |||||||
NET ASSETS 100.0% | $ | 6,411,926 | ||||||
|
| |||||||
The following abbreviations are used in the annual report:
LIBOR—London Interbank Offered Rate
REIT(s)—Real Estate Investment Trust(s)
| * | Non-income producing security. |
| (w) | Prudential Investments LLC, the manager of the Fund, also serves as manager of the Prudential Investment Portfolios 2 - Prudential Core Ultra Short Bond Fund. |
Fair Value Measurements:
Various inputs are used in determining the value of the Fund’s investments. These inputs are summarized in the three broad levels listed below.
Level 1—unadjusted quoted prices generally in active markets for identical securities.
Level 2—quoted prices for similar securities, interest rates and yield curves, prepayment speeds, foreign currency exchange rates and other observable inputs.
Level 3—unobservable inputs for securities valued in accordance with Board approved fair valuation procedures.
The following is a summary of the inputs used as of October 31, 2017 in valuing such portfolio securities:
| Level 1 | Level 2 | Level 3 | ||||||||||
Investments in Securities | ||||||||||||
Common Stocks | ||||||||||||
Diversified Real Estate Activities | $ | — | $ | 441,046 | $ | — | ||||||
Diversified REITs | 435,952 | 217,357 | — | |||||||||
Health Care REITs | 308,680 | — | — | |||||||||
Hotel & Resort REITs | 492,115 | 72,954 | — | |||||||||
Hotels, Resorts & Cruise Lines | — | 113,520 | — | |||||||||
Industrial REITs | 753,841 | 213,088 | — | |||||||||
See Notes to Financial Statements.
| Prudential Select Real Estate Fund | 21 |
Schedule of Investments (continued)
as of October 31, 2017
| Level 1 | Level 2 | Level 3 | ||||||||||
Investments in Securities (continued) | ||||||||||||
Common Stocks (continued) | ||||||||||||
Office REITs | $ | 474,243 | $ | 372,283 | $ | — | ||||||
Real Estate Development | — | 99,868 | — | |||||||||
Real Estate Operating Companies | 128,460 | 132,169 | — | |||||||||
Residential REITs | 928,371 | 122,987 | — | |||||||||
Retail REITs | 239,779 | 217,344 | — | |||||||||
Specialized REITs | 389,139 | — | — | |||||||||
Affiliated Mutual Fund | 398,187 | — | — | |||||||||
|
|
|
|
|
| |||||||
Total | $ | 4,548,767 | $ | 2,002,616 | $ | — | ||||||
|
|
|
|
|
| |||||||
During the period, there were no transfers between Level 1, Level 2 and Level 3 to report.
Industry Classification:
The industry classification of investments and liabilities in excess of other assets shown as a percentage of net assets as of October 31, 2017 were as follows (unaudited):
Residential REITs | 16.4 | % | ||
Industrial REITs | 15.1 | |||
Office REITs | 13.2 | |||
Diversified REITs | 10.2 | |||
Hotel & Resort REITs | 8.8 | |||
Retail REITs | 7.1 | |||
Diversified Real Estate Activities | 6.9 | |||
Affiliated Mutual Fund | 6.2 | |||
Specialized REITs | 6.1 | |||
Health Care REITs | 4.8 | % | ||
Real Estate Operating Companies | 4.1 | |||
Hotels, Resorts & Cruise Lines | 1.8 | |||
Real Estate Development | 1.5 | |||
|
| |||
| 102.2 | ||||
Liabilities in excess of other assets | (2.2 | ) | ||
|
| |||
| 100.0 | % | |||
|
|
See Notes to Financial Statements.
| 22 |
This Page Intentionally Left Blank
Statement of Assets & Liabilities
as of October 31, 2017
Assets | ||||
Investments at value: | ||||
Unaffiliated investments (cost $5,835,864) | $ | 6,153,196 | ||
Affiliated investments (cost $398,187) | 398,187 | |||
Dividends receivable | 10,952 | |||
Due from Manager | 3,459 | |||
Tax reclaim receivable | 837 | |||
Prepaid expenses and other assets | 843 | |||
|
| |||
Total assets | 6,567,474 | |||
|
| |||
Liabilities | ||||
Payable for investments purchased | 130,195 | |||
Shareholders’ reports payable | 8,416 | |||
Custodian and accounting fees payable | 8,389 | |||
Accrued expenses and other liabilities | 4,760 | |||
Payable for Fund shares reacquired | 3,544 | |||
Affiliated transfer agent fee payable | 126 | |||
Distribution fee payable | 118 | |||
|
| |||
Total liabilities | 155,548 | |||
|
| |||
Net Assets | $ | 6,411,926 | ||
|
| |||
Net assets were comprised of: | ||||
Shares of beneficial interest, at par | $ | 616 | ||
Paid-in capital in excess of par | 6,172,020 | |||
|
| |||
| 6,172,636 | ||||
Undistributed net investment income | 24,151 | |||
Accumulated net realized loss on investment and foreign currency transactions | (102,147 | ) | ||
Net unrealized appreciation on investments and foreign currencies | 317,286 | |||
|
| |||
Net assets, October 31, 2017 | $ | 6,411,926 | ||
|
| |||
See Notes to Financial Statements.
| 24 |
Class A | ||||
Net asset value and redemption price per share, | $ | 10.54 | ||
Maximum sales charge (5.50% of offering price) | 0.61 | |||
|
| |||
Maximum offering price to public | $ | 11.15 | ||
|
| |||
Class C | ||||
Net asset value, offering price and redemption price per share, | $ | 10.44 | ||
|
| |||
Class Q | ||||
Net asset value, offering price and redemption price per share, | $ | 10.40 | ||
|
| |||
Class Z | ||||
Net asset value, offering price and redemption price per share, | $ | 10.56 | ||
|
| |||
See Notes to Financial Statements.
| Prudential Select Real Estate Fund | 25 |
Statement of Operations
Year Ended October 31, 2017
Net Investment Income (Loss) | ||||
Income | ||||
Unaffiliated dividend income (net of foreign withholding taxes of $6,955) | $ | 149,418 | ||
Affiliated dividend income | 2,319 | |||
|
| |||
Total income | 151,737 | |||
|
| |||
Expenses | ||||
Management fee | 49,174 | |||
Distribution fee—Class A | 726 | |||
Distribution fee—Class C | 703 | |||
Custodian and accounting fees | 52,000 | |||
Registration fees | 51,000 | |||
Audit fee | 34,000 | |||
Legal fees and expenses | 22,000 | |||
Shareholders’ reports | 15,000 | |||
Trustees’ fees | 10,000 | |||
Transfer agent’s fees and expenses (including affiliated expense of $800) | 1,000 | |||
Miscellaneous | 14,690 | |||
|
| |||
Total expenses | 250,293 | |||
Less: Management fee waiver and/or expense reimbursement | (184,323 | ) | ||
Distribution fee waiver—Class A | (121 | ) | ||
|
| |||
Net expenses | 65,849 | |||
|
| |||
Net investment income (loss) | 85,888 | |||
|
| |||
Realized And Unrealized Gain (Loss) On Investments And Foreign Currency Transactions | ||||
Net realized gain (loss) on: | ||||
Investment transactions | (23,221 | ) | ||
Foreign currency transactions | (1,057 | ) | ||
|
| |||
| (24,278 | ) | |||
|
| |||
Net change in unrealized appreciation (depreciation) on: | ||||
Investments | 480,175 | |||
Foreign currencies | 131 | |||
|
| |||
| 480,306 | ||||
|
| |||
Net gain (loss) on investment and foreign currency transactions | 456,028 | |||
|
| |||
Net Increase (Decrease) In Net Assets Resulting From Operations | $ | 541,916 | ||
|
| |||
See Notes to Financial Statements.
| 26 |
Statement of Changes in Net Assets
| Year Ended October 31, | ||||||||
| 2017 | 2016 | |||||||
Increase (Decrease) in Net Assets | ||||||||
Operations | ||||||||
Net investment income (loss) | $ | 85,888 | $ | 123,586 | ||||
Net realized gain (loss) on investment and foreign currency transactions | (24,278 | ) | 141,152 | |||||
Net change in unrealized appreciation (depreciation) on investments and foreign currencies | 480,306 | (262,492 | ) | |||||
|
|
|
| |||||
Net increase (decrease) in net assets resulting from operations | 541,916 | 2,246 | ||||||
|
|
|
| |||||
Dividends and Distributions | ||||||||
Dividends from net investment income | ||||||||
Class A | (2,718 | ) | (3,136 | ) | ||||
Class C | (368 | ) | (677 | ) | ||||
Class Q | (79,212 | ) | (184,388 | ) | ||||
Class Z | (2,014 | ) | (4,261 | ) | ||||
|
|
|
| |||||
| (84,312 | ) | (192,462 | ) | |||||
|
|
|
| |||||
Distributions from net realized gains | ||||||||
Class A | (4,612 | ) | (3,969 | ) | ||||
Class C | (1,220 | ) | (1,433 | ) | ||||
Class Q | (125,625 | ) | (215,530 | ) | ||||
Class Z | (3,060 | ) | (5,495 | ) | ||||
|
|
|
| |||||
| (134,517 | ) | (226,427 | ) | |||||
|
|
|
| |||||
Fund share transactions (Net of share conversions) | ||||||||
Net proceeds from shares sold | 145,782 | 341,596 | ||||||
Net asset value of shares issued in reinvestment of dividends and distributions | 218,829 | 418,881 | ||||||
Cost of shares reacquired | (99,213 | ) | (147,504 | ) | ||||
|
|
|
| |||||
Net increase (decrease) in net assets from Fund share transactions | 265,398 | 612,973 | ||||||
|
|
|
| |||||
Total increase (decrease) | 588,485 | 196,330 | ||||||
Net Assets: | ||||||||
Beginning of year | 5,823,441 | 5,627,111 | ||||||
|
|
|
| |||||
End of year(a) | $ | 6,411,926 | $ | 5,823,441 | ||||
|
|
|
| |||||
(a) Includes undistributed net investment income of: | $ | 24,151 | $ | — | ||||
|
|
|
| |||||
See Notes to Financial Statements.
| Prudential Select Real Estate Fund | 27 |
Notes to Financial Statements
Prudential Investment Portfolios 9 (the “Trust”) is registered under the Investment Company Act of 1940, as amended (“1940 Act”), as an open-end management investment company. The Trust was established as a Delaware business trust on September 18, 1998. The Trust currently consists of five funds: Prudential Absolute Return Bond Fund and Prudential QMA Large-Cap Core Equity Fund which are diversified funds and Prudential International Bond Fund, Prudential Select Real Estate Fund and Prudential Real Estate Income Fund which are non-diversified funds. These financial statements relate to the Prudential Select Real Estate Fund (the “Fund”).
The investment objective of the Fund is to seek income and capital appreciation.
1. Accounting Policies
The Fund follows investment company accounting and reporting guidance of the Financial Accounting Standards Board (“FASB”) Accounting Standard Codification Topic 946 Financial Services—Investment Companies. The following accounting policies conform to U.S. generally accepted accounting principles. The Fund consistently follows such policies in the preparation of its financial statements.
Securities Valuation: The Fund holds securities and other assets and liabilities that are fair valued at the close of each day (generally, 4:00 PM Eastern time) the New York Stock Exchange (“NYSE”) is open for trading. Fair value is the price that would be received to sell an asset or paid to transfer a liability in an orderly transaction between market participants on the measurement date. The Board of Trustees (the “Board”) has adopted valuation procedures for security valuation under which fair valuation responsibilities have been delegated to PGIM Investments LLC (“PGIM Investments” or “the Manager”) (formerly known as Prudential Investments LLC). Under the current valuation procedures, the Valuation Committee is responsible for supervising the valuation of portfolio securities and other assets and liabilities. The valuation procedures permit the Fund to utilize independent pricing vendor services, quotations from market makers, and alternative valuation methods when market quotations are either not readily available or not deemed representative of fair value. A record of the Valuation Committee’s actions is subject to the Board’s review, approval, and ratification at its next regularly scheduled quarterly meeting.
Various inputs determine how the Fund’s investments are valued, all of which are categorized according to the three broad levels (Level 1, 2, or 3) detailed in the Schedule of Investments.
Common and preferred stocks, exchange-traded funds, and derivative instruments, such as futures or options, that are traded on a national securities exchange are valued at the last sale price as of the close of trading on the applicable exchange where the security
| 28 |
principally trades. Securities traded via NASDAQ are valued at the NASDAQ official closing price. To the extent these securities are valued at the last sale price or NASDAQ official closing price, they are classified as Level 1 in the fair value hierarchy. In the event that no sale or official closing price on valuation date exists, these securities are generally valued at the mean between the last reported bid and ask prices, or at the last bid price in the absence of an ask price. These securities are classified as Level 2 in the fair value hierarchy.
Foreign equities traded on foreign securities exchanges are generally valued using pricing vendor services that provide model prices derived using adjustment factors based on information such as local closing price, relevant general and sector indices, currency fluctuations, depositary receipts, and futures, as applicable. Securities valued using such model prices are classified as Level 2 in the fair value hierarchy. The models generate an evaluated adjustment factor for each security, which is applied to the local closing price to adjust it for post closing market movements. Utilizing that evaluated adjustment factor, the vendor provides an evaluated price for each security. If the vendor does not provide an evaluated price, securities are valued in accordance with exchange-traded common and preferred stock valuation policies discussed above.
Investments in open-end, non-exchange-traded mutual funds are valued at their net asset values as of the close of the NYSE on the date of valuation. These securities are classified as Level 1 in the fair value hierarchy since they may be purchased or sold at their net asset values on the date of valuation.
Securities and other assets that cannot be priced according to the methods described above are valued based on pricing methodologies approved by the Board. In the event that unobservable inputs are used when determining such valuations, the securities will be classified as Level 3 in the fair value hierarchy.
When determining the fair value of securities, some of the factors influencing the valuation include: the nature of any restrictions on disposition of the securities; assessment of the general liquidity of the securities; the issuer’s financial condition and the markets in which it does business; the cost of the investment; the size of the holding and the capitalization of the issuer; the prices of any recent transactions or bids/offers for such securities or any comparable securities; any available analyst media or other reports or information deemed reliable by the investment manager regarding the issuer or the markets or industry in which it operates. Using fair value to price securities may result in a value that is different from a security’s most recent closing price and from the price used by other unaffiliated mutual funds to calculate their net asset values.
Restricted and Illiquid Securities: Subject to guidelines adopted by the Board, the Fund may invest up to 15% of its net assets in illiquid securities, including those which are restricted as to disposition under securities law (“restricted securities”). Restricted securities are valued pursuant to the valuation procedures noted above. Illiquid securities are those that, because of the absence of a readily available market or due to legal or
| Prudential Select Real Estate Fund | 29 |
Notes to Financial Statements (continued)
contractual restrictions on resale, cannot be sold within seven days in the ordinary course of business at approximately the amount at which the Fund has valued the investment. Therefore, the Fund may find it difficult to sell illiquid securities at the time considered most advantageous by its Subadviser and may incur expenses that would not be incurred in the sale of securities that were freely marketable. Certain securities that would otherwise be considered illiquid because of legal restrictions on resale to the general public may be traded among qualified institutional buyers under Rule 144A of the Securities Act of 1933. These Rule 144A securities, as well as commercial paper that is sold in private placements under Section 4(2) of the Securities Act, may be deemed liquid by the Fund’s Subadviser under the guidelines adopted by the Trustees of the Fund. However, the liquidity of the Fund’s investments in Rule 144A securities could be impaired if trading does not develop or declines.
Foreign Currency Translation: The books and records of the Fund are maintained in U.S. dollars. Foreign currency amounts are translated into U.S. dollars on the following basis:
(i) market value of investment securities, other assets and liabilities—at the current rates of exchange;
(ii) purchases and sales of investment securities, income and expenses—at the rates of exchange prevailing on the respective dates of such transactions.
Although the net assets of the Fund are presented at the foreign exchange rates and market values at the close of the period, the Fund does not generally isolate that portion of the results of operations arising as a result of changes in the foreign exchange rates from the fluctuations arising from changes in the market prices of long-term portfolio securities held at the end of the period. Similarly, the Fund does not isolate the effect of changes in foreign exchange rates from the fluctuations arising from changes in the market prices of long-term portfolio securities sold during the period. Accordingly, holding period realized foreign currency gains (losses) are included in the reported net realized gains (losses) on investment transactions.
Net realized gains (losses) on foreign currency transactions represent net foreign exchange gains (losses) from the disposition of holdings of foreign currencies, forward currency contracts, currency gains (losses) realized between the trade and settlement dates on securities transactions, and the difference between the amounts of interest, dividends and foreign withholding taxes recorded on the Fund’s books and the U.S. dollar equivalent amounts actually received or paid. Net unrealized currency gains (losses) from valuing foreign currency denominated assets and liabilities (other than investments) at period end exchange rates are reflected as a component of net unrealized appreciation (depreciation) on foreign currencies.
| 30 |
Concentration of Risk: Foreign security and currency transactions may involve certain considerations and risks not typically associated with those of domestic origin as a result of, among other factors, the possibility of political or economic instability or the level of governmental supervision and regulation of foreign securities markets.
Equity and Mortgage Real Estate Investment Trusts (REITs): The Fund invests in equity REITs, which report information on the source of their distributions annually. Based on current and historical information, a portion of distributions received from equity REITs during the period is estimated to be dividend income, capital gain or return of capital and recorded accordingly. When material, these estimates are adjusted periodically when the actual source of distributions is disclosed by the equity REITs.
Concentration of Risk for REITs: Real estate securities are subject to the same risks as direct investments in real estate and mortgages, and their value will depend on the value of the underlying properties or the underlying loans or interests. The underlying loans may be subject to the risks of default or of prepayments that occur earlier or later than expected, and such loans may also include so-called “subprime” mortgages. The value of these securities will rise and fall in response to many factors, including economic conditions, the demand for rental property and interest rates. In particular, the value of these securities may decline when interest rates rise and will also be affected by the real estate market and by the management of the underlying properties.
In addition, investing in REITs involves certain unique risks in addition to those risks associated with investing in the real estate industry in general. Equity REITs may be affected by changes in the value of the underlying property owned by the REITs, while mortgage REITs may be affected by the quality of any credit extended. REITs are dependent upon management skills, may not be diversified geographically or by property/mortgage asset type, and are subject to heavy cash flow dependency, default by borrowers and self-liquidation. REITs may be more volatile and/or more illiquid than other types of equity securities. REITs (especially mortgage REITs) are subject to interest rate risks. REITs may incur significant amounts of leverage. The Fund will indirectly bear a portion of the expenses, including management fees, paid by each REIT in which it invests, in addition to the expenses of the Fund.
Securities Transactions and Net Investment Income: Securities transactions are recorded on the trade date. Realized gains (losses) from investment and currency transactions are calculated on the specific identification method. Dividend income is recorded on the ex-date. Interest income, including amortization of premium and accretion of discount on debt securities, as required, is recorded on the accrual basis. Expenses are recorded on an accrual basis, which may require the use of certain estimates by management that may differ from actual.
Net investment income or loss (other than distribution fees which are charged directly to the respective class and transfer agency fees specific to Class Q shares which are charged to that share class) and unrealized and realized gains (losses) are allocated daily to each
| Prudential Select Real Estate Fund | 31 |
Notes to Financial Statements (continued)
class of shares based upon the relative proportion of adjusted net assets of each class at the beginning of the day.
Taxes: It is the Fund’s policy to continue to meet the requirements of the Internal Revenue Code applicable to regulated investment companies and to distribute all of its taxable net investment income and capital gains, if any, to its shareholders. Therefore, no federal income tax provision is required. Withholding taxes on foreign dividends, interest and capital gains, if any, are recorded, net of reclaimable amounts, at the time the related income is earned.
Dividends and Distributions: The Fund expects to pay dividends from net investment income quarterly. Distributions from net realized capital and currency gains, if any, are declared and paid annually. Dividends and distributions to shareholders, which are determined in accordance with federal income tax regulations and which may differ from generally accepted accounting principles, are recorded on the ex-date. Permanent book/tax differences relating to income and gain(loss) are reclassified amongst undistributed net investment income, accumulated net realized gain (loss) and paid-in capital in excess of par, as appropriate.
Estimates: The preparation of financial statements requires management to make estimates and assumptions that affect the reported amounts and disclosures in the financial statements. Actual results could differ from those estimates.
2. Agreements
The Trust, on behalf of the Fund, has a management agreement with PGIM Investments. Pursuant to this agreement, PGIM Investments has responsibility for all investment advisory services and supervises the subadviser’s performance of such services. PGIM Investments has entered into a subadvisory agreement with PGIM, Inc., which provides subadvisory services to the Fund through its subsidiary PGIM Real Estate unit. The subadvisory agreement provides that PGIM Real Estate will furnish investment advisory services in connection with the management of the Fund. In connection therewith, PGIM Real Estate is obligated to keep certain books and records of the Fund. PGIM Investments pays for the services of PGIM Real Estate, the cost of compensation of officers of the Fund, occupancy and certain clerical and bookkeeping costs of the Fund. The Fund bears all other costs and expenses.
The management fee paid to PGIM Investments is accrued daily and payable monthly at an annual rate of .80% of the Fund’s average daily net assets up to and including $1 billion, .78% of the next $2 billion, .76% of the next $2 billion, .75% of the next $5 billion and .74% of the Fund’s average daily net assets in excess of $10 billion. For the year ended October 31, 2017, the effective management fee rate before any waivers and/or expense
| 32 |
reimbursement was .80%. For the year ended October 31, 2017, the waiver and/or expense reimbursement exceeded the effective management fee rate.
PGIM Investments has contractually agreed through February 28, 2019 to limit the net annual operating expenses (exclusive of distribution and service (12b-1) fees, taxes (such as income and foreign withholdings taxes, stamp duty and deferred tax expenses), interest, underlying funds, brokerage, extraordinary and certain other expenses such as dividend, broker charges and interest expense on short sales) of each class of shares of the Fund to 1.05% of the Fund’s average daily net assets. Expenses waived/reimbursed by the Manager in accordance with this agreement may be recouped by the Manager within the same fiscal year during which such waiver/reimbursement is made if such recoupment can be realized without exceeding the expense limit in effect at the time of the recoupment for that fiscal year.
The Trust, on behalf of the Fund, has a distribution agreement with Prudential Investment Management Services LLC (“PIMS”), which acts as the distributor of the Class A, C, Q and Z shares of the Fund. The Fund compensates PIMS for distributing and servicing the Fund’s Class A and C shares, pursuant to plans of distribution (the “Distribution Plans”), regardless of expenses actually incurred by PIMS. The distribution fees are accrued daily and payable monthly. No distribution or service fees are paid to PIMS as distributor of the Class Q or Class Z shares of the Fund.
Pursuant to the Distribution Plans, the Fund compensates PIMS for distribution related activities at an annual rate of up to .30% and 1% of the average daily net assets of the Class A and C shares, respectively. PIMS has contractually agreed through February 28, 2019 to limit such fees to .25% of the average daily net assets of the Class A shares.
PIMS has advised the Fund that it received $1,183 in front-end sales charges resulting from sales of Class A shares during the year ended October 31, 2017. From these fees, PIMS paid such sales charges to affiliated broker-dealers, which in turn paid commissions to salespersons and incurred other distribution costs.
PIMS has advised the Fund that for the year ended October 31, 2017, it has not received any contingent deferred sales charges imposed upon redemptions by certain Class A and Class C shareholders.
PGIM Investments, PGIM, Inc., PGIM Real Estate and PIMS are indirect, wholly-owned subsidiaries of Prudential Financial, Inc. (“Prudential”).
3. Other Transactions with Affiliates
Prudential Mutual Fund Services LLC (“PMFS”), an affiliate of PGIM Investments and an indirect, wholly-owned subsidiary of Prudential, serves as the Fund’s transfer agent. Transfer agent’s fees and expenses in the Statement of Operations include certain out-of-pocket expenses paid to non-affiliates, where applicable.
| Prudential Select Real Estate Fund | 33 |
Notes to Financial Statements (continued)
The Fund may enter into certain securities purchase or sale transactions under Board approved Rule 17a-7 procedures. Rule 17a-7 is an exemptive rule under the 1940 Act, that permits purchase and sale transactions among affiliated investment companies, or between an investment company and a person that is affiliated solely by reason of having a common (or affiliated) investment adviser, common directors, and/or common officers. Such transactions are subject to ratification by the Board. For the reporting period ended October 31, 2017 no such transactions were entered into by the Fund.
The Fund may invest its overnight sweep cash in the Prudential Core Ultra Short Bond Fund (the “Core Fund”), a series of Prudential Investment Portfolios 2, registered under the 1940 Act and managed by PGIM Investments. Earnings from the Core Fund are disclosed on the Statement of Operations as “Affiliated dividend income”.
4. Portfolio Securities
The aggregate cost of purchases and proceeds from sales of portfolio securities (excluding short-term investments and U.S. Government securities) for the year ended October 31, 2017, were $8,640,367 and $8,396,704, respectively.
5. Distributions and Tax Information
Distributions to shareholders, which are determined in accordance with federal income tax regulations and which may differ from generally accepted accounting principles, are recorded on the ex-date. In order to present undistributed net investment income, accumulated net realized loss on investment and foreign currency transactions and paid-in capital in excess of par on the Statement of Assets and Liabilities that more closely represent their tax character, certain adjustments have been made to undistributed net investment income and accumulated net realized loss on investment and foreign currency transactions. For the year ended October 31, 2017, the adjustments were to increase undistributed net investment income and increase accumulated net realized loss on investment and foreign currency transactions by $36,904 due to differences in the treatment for book and tax purposes of certain transactions involving foreign currencies, reclassification of dividends and investments in passive foreign investment companies. Net investment income, net realized gain (loss) on investment transactions and net assets were not affected by this change.
For the year ended October 31, 2017, the tax character of distributions paid by the Fund was $218,829 of ordinary income. For the year ended October 31, 2016, the tax character of distributions paid by the Fund were $341,110 of ordinary income and $77,779 of long-term capital gains.
| 34 |
As of October 31, 2017, the accumulated undistributed earnings on a tax basis was $59,150 of ordinary income. This differs from the amount shown on the Statement of Assets and Liabilities primarily due to cumulative timing differences between financial and tax reporting.
The United States federal income tax basis of the Fund’s investments and the net unrealized appreciation as of October 31, 2017 were as follows:
Tax Basis | Gross | Gross | Net | |||
| $6,270,905 | $424,093 | $(143,615) | $280,478 |
The book basis differs from tax basis primarily due to deferred losses on wash sales and other cost basis differences between financial and tax accounting.
For federal income tax purposes, the Fund had a capital loss carryforward as of October 31, 2017 of approximately $100,000 which can be carried forward for an unlimited period. No capital gains distributions are expected to be paid to shareholders until net gains have been realized in excess of such losses.
Management has analyzed the Fund’s tax positions taken on federal, state and local income tax returns for all open tax years and has concluded that no provision for income tax is required in the Fund’s financial statements for the current reporting period. The Fund’s federal, state and local income and federal excise tax returns for tax years for which the applicable statutes of limitations have not expired are subject to examination by the Internal Revenue Service and state departments of revenue.
6. Capital
The Fund offers Class A, Class C, Class Q and Class Z shares. Class A shares are sold with a maximum front-end sales charge of 5.50%. Investors who purchase $1 million or more of Class A shares and sell these shares within 12 months of purchase are subject to a contingent deferred sales charge (“CDSC”) of 1%, although they are not subject to an initial sales charge. The Class A CDSC is waived for certain retirement and/or benefit plans. Class C shares are sold with a CDSC of 1% on sales made within 12 months of purchase. A special exchange privilege is also available for shareholders who qualified to purchase Class A shares at net asset value. Class Q and Class Z shares are not subject to any sales or redemption charge and are offered exclusively for sale to a limited group of investors.
Under certain circumstances, an exchange may be made from specified share classes of the Fund to one or more other share classes of the Fund as presented in the table of transactions in shares of beneficial interest.
The Trust has authorized an unlimited number of shares of beneficial interest at $.001 par value per share, divided into four classes, designated Class A, Class C, Class Q and Class Z.
| Prudential Select Real Estate Fund | 35 |
Notes to Financial Statements (continued)
As of October 31, 2017, Prudential through its affiliate entities, including affiliated funds, owned 1,118 Class A shares, 1,100 Class C shares, 570,345 Class Q shares and 1,125 Class Z shares of the Fund, which represents 93% of the Fund’s outstanding shares on behalf of multiple beneficial owners.
Transactions in shares of beneficial interest were as follows:
Class A | Shares | Amount | ||||||
Year ended October 31, 2017: | ||||||||
Shares sold | 9,285 | $ | 93,616 | |||||
Shares issued in reinvestment of dividends and distributions | 736 | 7,330 | ||||||
Shares reacquired | (4,230 | ) | (43,679 | ) | ||||
|
|
|
| |||||
Net increase (decrease) in shares outstanding | 5,791 | $ | 57,267 | |||||
|
|
|
| |||||
Year ended October 31, 2016: | ||||||||
Shares sold | 14,750 | $ | 152,673 | |||||
Shares issued in reinvestment of dividends and distributions | 709 | 7,104 | ||||||
Shares reacquired | (2,707 | ) | (24,987 | ) | ||||
|
|
|
| |||||
Net increase (decrease) in shares outstanding | 12,752 | 134,790 | ||||||
Shares reacquired upon conversion into other share class(es) | (52 | ) | (567 | ) | ||||
|
|
|
| |||||
Net increase (decrease) in shares outstanding | 12,700 | $ | 134,223 | |||||
|
|
|
| |||||
Class C | ||||||||
Year ended October 31, 2017: | ||||||||
Shares sold | 3,437 | $ | 34,300 | |||||
Shares issued in reinvestment of dividends and distributions | 162 | 1,588 | ||||||
Shares reacquired | (2,880 | ) | (28,902 | ) | ||||
|
|
|
| |||||
Net increase (decrease) in shares outstanding | 719 | $ | 6,986 | |||||
|
|
|
| |||||
Year ended October 31, 2016: | ||||||||
Shares sold | 2,332 | $ | 24,001 | |||||
Shares issued in reinvestment of dividends and distributions | 212 | 2,110 | ||||||
|
|
|
| |||||
Net increase (decrease) in shares outstanding | 2,544 | $ | 26,111 | |||||
|
|
|
| |||||
Class Q | ||||||||
Year ended October 31, 2017: | ||||||||
Shares issued in reinvestment of dividends and distributions | 20,831 | 204,837 | ||||||
Shares reacquired† | (1,137 | ) | (11,789 | ) | ||||
|
|
|
| |||||
Net increase (decrease) in shares outstanding | 19,694 | $ | 193,048 | |||||
|
|
|
| |||||
Year ended October 31, 2016: | ||||||||
Shares issued in reinvestment of dividends and distributions | 40,399 | $ | 399,911 | |||||
|
|
|
| |||||
Net increase (decrease) in shares outstanding | 40,399 | $ | 399,911 | |||||
|
|
|
| |||||
| 36 |
Class Z | Shares | Amount | ||||||
Year ended October 31, 2017: | ||||||||
Shares sold | 1,761 | $ | 17,866 | |||||
Shares issued in reinvestment of dividends and distributions | 508 | 5,074 | ||||||
Shares reacquired | (1,446 | ) | (14,843 | ) | ||||
|
|
|
| |||||
Net increase (decrease) in shares outstanding | 823 | $ | 8,097 | |||||
|
|
|
| |||||
Year ended October 31, 2016: | ||||||||
Shares sold | 16,305 | $ | 164,922 | |||||
Shares issued in reinvestment of dividends and distributions | 974 | 9,756 | ||||||
Shares reacquired | (13,445 | ) | (122,517 | ) | ||||
|
|
|
| |||||
Net increase (decrease) in shares outstanding | 3,834 | 52,161 | ||||||
Shares issued upon conversion from other share class(es) | 52 | 567 | ||||||
|
|
|
| |||||
Net increase (decrease) in shares outstanding | 3,886 | $ | 52,728 | |||||
|
|
|
| |||||
| † | Includes affiliated redemption of 1,137 shares with a value of $11,789 for Class Q shares. |
7. Borrowings
The Trust, on behalf of the Fund, along with other affiliated registered investment companies (the “Funds”), is a party to a Syndicated Credit Agreement (“SCA”) with a group of banks. The purpose of the SCA is to provide an alternative source of temporary funding for capital share redemptions. The SCA provides for a commitment of $900 million for the period October 5, 2017 through October 4, 2018. The Funds pay an annualized commitment fee of .15% of the unused portion of the SCA. The Fund’s portion of the commitment fee for the unused amount, allocated based upon a method approved by the Board, is accrued daily and paid quarterly. Prior to October 5, 2017, the Funds had another SCA that provided a commitment of $900 million and the Funds paid an annualized commitment fee of .15% of the unused portion of the SCA. The interest on borrowings under the SCAs is paid monthly and at a per annum interest rate based upon a contractual spread plus the higher of (1) the effective federal funds rate, (2) the 1-month LIBOR rate or (3) zero percent.
Other affiliated registered investment companies that are parties to the SCA include portfolios that are subject to a predetermined mathematical formula used to manage certain benefit guarantees offered under variable annuity contracts. The formula may result in large scale asset flows into and out of these portfolios. Consequently, these portfolios may be more likely to utilize the SCA for purposes of funding redemptions. It may be possible for those portfolios to fully exhaust the committed amount of the SCA, thereby requiring the Manager to allocate available funding per a Board-approved methodology designed to treat the Funds in the SCA equitably.
The Fund did not utilize the SCA during the reporting period ended October 31, 2017.
| Prudential Select Real Estate Fund | 37 |
Notes to Financial Statements (continued)
8. Other
At the Trust’s Board meeting in March 2017, the Board approved a change in the methodology of allocating certain expenses, such as Transfer Agent fees (including sub-transfer agent and networking fees) and Blue Sky fees. PGIM Investments implemented the changes effective November 1, 2017.
| 38 |
Financial Highlights
| Class A Shares | ||||||||||||||||||||
| Year Ended October 31, | August 1, 2014(b) through October 31, | |||||||||||||||||||
| 2017 | 2016 | 2015 | 2014 | |||||||||||||||||
| Per Share Operating Performance(c): | ||||||||||||||||||||
| Net Asset Value, Beginning of Period | $10.00 | $10.71 | $10.30 | $10.00 | ||||||||||||||||
| Income (loss) from investment operations: | ||||||||||||||||||||
| Net investment income (loss) | .12 | .17 | .09 | .01 | ||||||||||||||||
| Net realized and unrealized gain (loss) on investment and foreign currency transactions | .76 | (.18 | ) | .41 | .29 | |||||||||||||||
| Total from investment operations | .88 | (.01 | ) | .50 | .30 | |||||||||||||||
| Less Dividends and Distributions: | ||||||||||||||||||||
| Dividends from net investment income | (.11 | ) | (.28 | ) | - | - | ||||||||||||||
| Distributions from net realized gains | (.23 | ) | (.42 | ) | (.09 | ) | - | |||||||||||||
| Total dividends and distributions | (.34 | ) | (.70 | ) | (.09 | ) | - | |||||||||||||
| Net asset value, end of period | $10.54 | $10.00 | $10.71 | $10.30 | ||||||||||||||||
| Total Return(a) | 9.08% | .01% | 4.85% | 3.00% | ||||||||||||||||
| Ratios/Supplemental Data: | ||||||||||||||||||||
| Net assets, end of period (000) | $256 | $185 | $62 | $18 | ||||||||||||||||
| Average net assets (000) | $242 | $119 | $27 | $15 | ||||||||||||||||
| Ratios to average net assets(d): | ||||||||||||||||||||
| Expenses after waivers and/or expense reimbursement | 1.30% | 1.33% | 1.35% | 1.35% | (e) | |||||||||||||||
| Expenses before waivers and/or expense reimbursement | 4.63% | 4.81% | 5.16% | 20.58% | (e) | |||||||||||||||
| Net investment income (loss) | 1.15% | 1.70% | .86% | .46% | (e) | |||||||||||||||
| Portfolio turnover rate | 142% | 158% | 150% | 18% | (f) | |||||||||||||||
| (a) | Total return does not consider the effect of sales load. Total return is calculated assuming a purchase of a share on the first day and a sale on the last day of each period reported and includes reinvestment of dividends and distributions, if any. Total returns may reflect adjustments to conform to generally accepted accounting principles. Total returns for periods less than one full year are not annualized. |
| (b) | Commencement of operations. |
| (c) | Calculated based on average shares outstanding during the period. |
| (d) | Does not include expenses of the underlying portfolios in which the Fund invests. |
| (e) | Annualized. |
| (f) | Not annualized. |
See Notes to Financial Statements.
| Prudential Select Real Estate Fund | 39 |
Financial Highlights (continued)
| Class C Shares | ||||||||||||||||||||
| Year Ended October 31, | August 1, 2014(b) through October 31, | |||||||||||||||||||
| 2017 | 2016 | 2015 | 2014 | |||||||||||||||||
| Per Share Operating Performance(c): | ||||||||||||||||||||
| Net Asset Value, Beginning of Period | $9.94 | $10.60 | $10.28 | $10.00 | ||||||||||||||||
| Income (loss) from investment operations: | ||||||||||||||||||||
| Net investment income (loss) | .04 | .11 | (.03 | ) | (.01 | ) | ||||||||||||||
| Net realized and unrealized gain (loss) on investment and foreign currency transactions | .75 | (.18 | ) | .44 | .29 | |||||||||||||||
| Total from investment operations | .79 | (.07 | ) | .41 | .28 | |||||||||||||||
| Less Dividends and Distributions: | ||||||||||||||||||||
| Dividends from net investment income | (.06 | ) | (.17 | ) | - | - | ||||||||||||||
| Distributions from net realized gains | (.23 | ) | (.42 | ) | (.09 | ) | - | |||||||||||||
| Total dividends and distributions | (.29 | ) | (.59 | ) | (.09 | ) | - | |||||||||||||
| Net asset value, end of period | $10.44 | $9.94 | $10.60 | $10.28 | ||||||||||||||||
| Total Return(a) | 8.11% | (.63)% | 3.98% | 2.80% | ||||||||||||||||
| Ratios/Supplemental Data: | ||||||||||||||||||||
| Net assets, end of period (000) | $69 | $59 | $36 | $10 | ||||||||||||||||
| Average net assets (000) | $70 | $48 | $46 | $10 | ||||||||||||||||
| Ratios to average net assets(d): | ||||||||||||||||||||
| Expenses after waivers and/or expense reimbursement | 2.05% | 2.08% | 2.10% | 2.10% | (e) | |||||||||||||||
| Expenses before waivers and/or expense reimbursement | 5.33% | 5.64% | 5.54% | 20.42% | (e) | |||||||||||||||
| Net investment income (loss) | .36% | 1.08% | (.30)% | (.26)% | (e) | |||||||||||||||
| Portfolio turnover rate | 142% | 158% | 150% | 18% | (f) | |||||||||||||||
| (a) | Total return does not consider the effect of sales load. Total return is calculated assuming a purchase of a share on the first day and a sale on the last day of each period reported and includes reinvestment of dividends and distributions, if any. Total returns may reflect adjustments to conform to generally accepted accounting principles. Total returns for periods less than one full year are not annualized. |
| (b) | Commencement of operations. |
| (c) | Calculated based on average shares outstanding during the period. |
| (d) | Does not include expenses of the underlying portfolios in which the Fund invests. |
| (e) | Annualized. |
| (f) | Not annualized. |
See Notes to Financial Statements.
| 40 |
| Class Q Shares | ||||||||||||||||||||
| Year Ended October 31, | August 1, 2014(b) through October 31, | |||||||||||||||||||
| 2017 | 2016 | 2015 | 2014 | |||||||||||||||||
| Per Share Operating Performance(c): | ||||||||||||||||||||
| Net Asset Value, Beginning of Period | $9.88 | $10.63 | $10.31 | $10.00 | ||||||||||||||||
| Income (loss) from investment operations: | ||||||||||||||||||||
| Net investment income (loss) | .14 | .22 | .10 | .02 | ||||||||||||||||
| Net realized and unrealized gain (loss) on investment and foreign currency transactions | .75 | (.20 | ) | .41 | .29 | |||||||||||||||
| Total from investment operations | .89 | .02 | .51 | .31 | ||||||||||||||||
| Less Dividends and Distributions: | ||||||||||||||||||||
| Dividends from net investment income | (.14 | ) | (.35 | ) | (.10 | ) | - | |||||||||||||
| Distributions from net realized gains | (.23 | ) | (.42 | ) | (.09 | ) | - | |||||||||||||
| Total dividends and distributions | (.37 | ) | (.77 | ) | (.19 | ) | - | |||||||||||||
| Net asset value, end of period | $10.40 | $9.88 | $10.63 | $10.31 | ||||||||||||||||
| Total Return(a) | 9.25% | .30% | 5.01% | 3.10% | ||||||||||||||||
| Ratios/Supplemental Data: | ||||||||||||||||||||
| Net assets, end of period (000) | $5,932 | $5,441 | $5,423 | $5,165 | ||||||||||||||||
| Average net assets (000) | $5,687 | $5,413 | $5,288 | $4,983 | ||||||||||||||||
| Ratios to average net assets(d): | ||||||||||||||||||||
| Expenses after waivers and/or expense reimbursement | 1.05% | 1.08% | 1.10% | 1.10% | (e) | |||||||||||||||
| Expenses before waivers and/or expense reimbursement | 4.02% | 4.40% | 4.51% | 14.06% | (e) | |||||||||||||||
| Net investment income (loss) | 1.42% | 2.18% | .96% | .75% | (e) | |||||||||||||||
| Portfolio turnover rate | 142% | 158% | 150% | 18% | (f) | |||||||||||||||
| (a) | Total return is calculated assuming a purchase of a shares on the first day and a sale on the last day of each period reported and includes reinvestment of dividends and distributions, if any. Total returns may reflect adjustments to conform to generally accepted accounting principles. Total returns for periods less than one full year are not annualized. |
| (b) | Commencement of operations. |
| (c) | Calculated based on average shares outstanding during the period. |
| (d) | Does not include expenses of the underlying portfolios in which the Fund invests. |
| (e) | Annualized. |
| (f) | Not annualized. |
See Notes to Financial Statements.
| Prudential Select Real Estate Fund | 41 |
Financial Highlights (continued)
| Class Z Shares | ||||||||||||||||||||
| Year Ended October 31, | August 1, 2014(b) through October 31, | |||||||||||||||||||
| 2017 | 2016 | 2015 | 2014 | |||||||||||||||||
| Per Share Operating Performance(c): | ||||||||||||||||||||
| Net Asset Value, Beginning of Period | $10.02 | $10.74 | $10.31 | $10.00 | ||||||||||||||||
| Income (loss) from investment operations: | ||||||||||||||||||||
| Net investment income (loss) | .15 | .21 | .10 | .02 | ||||||||||||||||
| Net realized and unrealized gain (loss) on investment and foreign currency transactions | .76 | (.18 | ) | .42 | .29 | |||||||||||||||
| Total from investment operations | .91 | .03 | .52 | .31 | ||||||||||||||||
| Less Dividends and Distributions: | ||||||||||||||||||||
| Dividends from net investment income | (.14 | ) | (.33 | ) | - | - | ||||||||||||||
| Distributions from net realized gains | (.23 | ) | (.42 | ) | (.09 | ) | - | |||||||||||||
| Total dividends and distributions | (.37 | ) | (.75 | ) | (.09 | ) | - | |||||||||||||
| Net asset value, end of period | $10.56 | $10.02 | $10.74 | $10.31 | ||||||||||||||||
| Total Return(a) | 9.32% | .36% | 5.04% | 3.10% | ||||||||||||||||
| Ratios/Supplemental Data: | ||||||||||||||||||||
| Net assets, end of period (000) | $154 | $138 | $107 | $10 | ||||||||||||||||
| Average net assets (000) | $148 | $139 | $39 | $10 | ||||||||||||||||
| Ratios to average net assets(d): | ||||||||||||||||||||
| Expenses after waivers and/or expense reimbursement | 1.05% | 1.08% | 1.10% | 1.10% | (e) | |||||||||||||||
| Expenses before waivers and/or expense reimbursement | 4.35% | 4.82% | 5.16% | 19.50% | (e) | |||||||||||||||
| Net investment income (loss) | 1.43% | 2.09% | .98% | .77% | (e) | |||||||||||||||
| Portfolio turnover rate | 142% | 158% | 150% | 18% | (f) | |||||||||||||||
| (a) | Total return is calculated assuming a purchase of a share on the first day and a sale on the last day of each period reported and includes reinvestment of dividends and distributions, if any. Total returns may reflect adjustments to conform to generally accepted accounting principles. Total returns for periods less than one full year are not annualized. |
| (b) | Commencement of operations. |
| (c) | Calculated based on average shares outstanding during the period. |
| (d) | Does not include expenses of the underlying portfolios in which the Fund invests. |
| (e) | Annualized. |
| (f) | Not annualized. |
See Notes to Financial Statements.
| 42 |
Report of Independent Registered Public Accounting Firm
The Board of Trustees and Shareholders
Prudential Investment Portfolios 9:
We have audited the accompanying statement of assets and liabilities of Prudential Select Real Estate Fund (the “Fund”), a series of Prudential Investment Portfolios 9, including the schedule of investments, as of October 31, 2017, and the related statement of operations for the year then ended, the statements of changes in net assets for each of the years in the two-year period then ended and the financial highlights for each of the years in the three-year period then ended and the period from August 1, 2014 (commencement of operations) to October 31, 2014. These financial statements and financial highlights are the responsibility of the Fund’s management. Our responsibility is to express an opinion on these financial statements and financial highlights based on our audits.
We conducted our audits in accordance with the standards of the Public Company Accounting Oversight Board (United States). Those standards require that we plan and perform the audit to obtain reasonable assurance about whether the financial statements and financial highlights are free of material misstatement. An audit includes examining, on a test basis, evidence supporting the amounts and disclosures in the financial statements. Our procedures included confirmation of securities owned as of October 31, 2017, by correspondence with the custodian, transfer agent and brokers or by other appropriate auditing procedures when replies from brokers were not received. An audit also includes assessing the accounting principles used and significant estimates made by management, as well as evaluating the overall financial statement presentation. We believe that our audits provide a reasonable basis for our opinion.
In our opinion, the financial statements and financial highlights referred to above present fairly, in all material respects, the financial position of the Fund as of October 31, 2017, and the results of its operations, the changes in its net assets, and the financial highlights for the years or periods described in the first paragraph, in conformity with U.S. generally accepted accounting principles.

New York, New York
December 15, 2017
| Prudential Select Real Estate Fund | 43 |
Federal Income Tax Information (unaudited)
For the year ended October 31, 2017, the Fund reports the maximum amount allowable under Section 854 of the Internal Revenue Code, but not less than 13.66% of the ordinary income dividends paid during the year as qualified dividend income.
In January 2018, you will be advised on IRS Form 1099-DIV or substitute 1099-DIV as to the federal tax status of the distributions received by you in calendar year 2017.
| 44 |
INFORMATION ABOUT BOARD MEMBERS AND OFFICERS
(Unaudited)
Information about Board Members and Officers of the Fund is set forth below. Board Members who are not deemed to be “interested persons” of the Fund, as defined in the 1940 Act, are referred to as “Independent Board Members.” Board Members who are deemed to be “interested persons” of the Fund are referred to as “Interested Board Members.” The Board Members are responsible for the overall supervision of the operations of the Fund and perform the various duties imposed on the directors of investment companies by the 1940 Act. The Board in turn elects the Officers, who are responsible for administering the day-to-day operations of the Fund.
| Independent Board Members(1) | ||||
Name, Address, Age Position(s) Portfolios Overseen | Principal Occupation(s) During Past Five Years | Other Directorships Held During Past Five Years | ||
Ellen S. Alberding (59) Board Member Portfolios Overseen: 89 | President and Board Member, The Joyce Foundation (charitable foundation) (since 2002); Vice Chair, City Colleges of Chicago (community college system) (since 2011); Trustee, Skills for America’s Future (national initiative to connect employers to community colleges) (since 2011); Trustee, National Park Foundation (charitable foundation for national park system) (since 2009); Trustee, Economic Club of Chicago (since 2009). | None. | ||
Kevin J. Bannon (65) Board Member Portfolios Overseen: 89 | Retired; Managing Director (April 2008-May 2015) and Chief Investment Officer (October 2008-November 2013) of Highmount Capital LLC (registered investment adviser); formerly Executive Vice President and Chief Investment Officer (April 1993-August 2007) of Bank of New York Company; President (May 2003-May 2007) of BNY Hamilton Family of Mutual Funds. | Director of Urstadt Biddle Properties (equity real estate investment trust) (since September 2008). | ||
Linda W. Bynoe (65) Board Member Portfolios Overseen: 89 | President and Chief Executive Officer (since March 1995) and formerly Chief Operating Officer (December 1989-February 1995) of Telemat Ltd. (management consulting); formerly Vice President (January 1985-June 1989) at Morgan Stanley & Co. (broker-dealer). | Director of Simon Property Group, Inc. (retail real estate) (May 2003-May 2012); Director of Anixter International, Inc. (communication products distributor) (since January 2006); Director of Northern Trust Corporation (financial services) (since April 2006); Trustee of Equity Residential (residential real estate) (since December 2009). | ||
Prudential Select Real Estate Fund
| Independent Board Members(1) | ||||
Name, Address, Age Position(s) Portfolios Overseen | Principal Occupation(s) During Past Five Years | Other Directorships Held During Past Five Years | ||
Barry H. Evans (57)± Board Member Portfolios Overseen: 89 | Retired; Formerly President (2005-2016), Global Chief Operating Officer (2014-2016), Chief Investment Officer-Global Head of Fixed Income (1998-2014), and various portfolio manager roles (1986-2006), Manulife Asset Management U.S. | Director, Manulife Trust Company (2011-present); Director, Manulife Asset Management Limited (2015-present); Formerly Chairman of the Board of Directors of Manulife Asset Management U.S. (2005-2016); Formerly Chairman of the Board, Declaration Investment Management and Research (2008-2016). | ||
Keith F. Hartstein (61) Board Member & Independent Chair Portfolios Overseen: 89 | Retired; Member (since November 2014) of the Governing Council of the Independent Directors Council (organization of independent mutual fund directors); formerly President and Chief Executive Officer (2005-2012), Senior Vice President (2004-2005), Senior Vice President of Sales and Marketing (1997-2004), and various executive management positions (1990-1997), John Hancock Funds, LLC (asset management); Chairman, Investment Company Institute’s Sales Force Marketing Committee (2003-2008). | None. | ||
Laurie Simon Hodrick (55)± Board Member Portfolios Overseen: 89 | A. Barton Hepburn Professor of Economics in the Faculty of Business, Columbia Business School (since 1996); Visiting Professor of Law and Rock Center for Corporate Governance Fellow, Stanford Law School (since 2015); Visiting Fellow, Hoover Institution, Stanford University (since 2015); Sole Member, ReidCourt LLC (since 2008) (a consulting firm); Formerly Managing Director, Global Head of Alternative Investment Strategies, Deutsche Bank (2006-2008); Formerly Director/Trustee, Merrill Lynch Investment Managers Funds (1999-2006). | Independent Director, Corporate Capital Trust (since April 2017) (a business development company). | ||
Michael S. Hyland, CFA (72) Board Member Portfolios Overseen: 89 | Retired (since February 2005); formerly Senior Managing Director (July 2001-February 2005) of Bear Stearns & Co, Inc.; Global Partner, INVESCO (1999-2001); Managing Director and President of Salomon Brothers Asset Management (1989-1999). | None. | ||
Visit our website at pgiminvestments.com
| Independent Board Members(1) | ||||
Name, Address, Age Position(s) Portfolios Overseen | Principal Occupation(s) During Past Five Years | Other Directorships Held During Past Five Years | ||
Richard A. Redeker (74) Board Member & Independent Vice Chair9 Portfolios Overseen: 87 | Retired Mutual Fund Senior Executive (47 years); Management Consultant; Director, Mutual Fund Directors Forum (since 2014); Independent Directors Council (organization of independent mutual fund directors)-Executive Committee, Chair of Policy Steering Committee, Governing Council. | None. | ||
Stephen G. Stoneburn (74) Board Member Portfolios Overseen: 89 | Chairman (since July 2011), President and Chief Executive Officer (since June 1996) of Frontline Medical Communications (publishing company); formerly President (June 1995-June 1996) of Argus Integrated Media, Inc.; Senior Vice President and Managing Director (January 1993-1995) of Cowles Business Media; Senior Vice President of Fairchild Publications, Inc. (1975-1989). | None. | ||
± Mr. Evans and Ms. Hodrick joined the Board effective as of September 1, 2017.
| Interested Board Members(1) | ||||
Name, Address, Age Position(s) Portfolios Overseen | Principal Occupation(s) During Past Five Years | Other Directorships Held During Past Five Years | ||
Stuart S. Parker (55) Board Member & President Portfolios Overseen: 89 | President of PGIM Investments LLC (formerly known as Prudential Investments LLC) (since January 2012); Executive Vice President of Prudential Investment Management Services LLC (since December 2012); Executive Vice President of Jennison Associates LLC and Head of Retail Distribution of PGIM Investments LLC (June 2005-December 2011). | None. | ||
Prudential Select Real Estate Fund
| Interested Board Members(1) | ||||
Name, Address, Age Position(s) Portfolios Overseen | Principal Occupation(s) During Past Five Years | Other Directorships Held During Past Five Years | ||
Scott E. Benjamin (44) Board Member & Vice President Portfolios Overseen: 89 | Executive Vice President (since June 2009) of PGIM Investments LLC; Executive Vice President (June 2009-June 2012) and Vice President (since June 2012) of Prudential Investment Management Services LLC; Executive Vice President (since September 2009) of AST Investment Services, Inc.; Senior Vice President of Product Development and Marketing, PGIM Investments (since February 2006); Vice President of Product Development and Product Management, Prudential Investments (2003-2006). | None. | ||
Grace C. Torres* (58) Board Member Portfolios Overseen: 88 | Retired; formerly Treasurer and Principal Financial and Accounting Officer of the Prudential Funds, Target Funds, Advanced Series Trust, Prudential Variable Contract Accounts and The Prudential Series Fund (1998-June 2014); Assistant Treasurer (March 1999-June 2014) and Senior Vice President (September 1999-June 2014) of PGIM Investments LLC; Assistant Treasurer (May 2003-June 2014) and Vice President (June 2005-June 2014) of AST Investment Services, Inc.; Senior Vice President and Assistant Treasurer (May 2003-June 2014) of Prudential Annuities Advisory Services, Inc. | Director (since July 2015) of Sun Bancorp, Inc. N.A. and Sun National Bank | ||
* Note: Prior to her retirement in 2014, Ms. Torres was employed by PGIM Investments LLC. Due to her prior employment, she is considered to be an “interested person” under the 1940 Act. Ms. Torres is a Non-Management Interested Board Member.
(1) The year that each individual joined the Board is as follows:
Ellen S. Alberding, 2013; Linda W. Bynoe, 2005; Barry H. Evans, 2017; Richard A. Redeker, 1998; Stephen G. Stoneburn, 2003; Kevin J. Bannon, 2008; Keith F. Hartstein, 2013; Laurie Simon Hodrick, 2017; Michael S. Hyland, 2008; Stuart S. Parker, Board Member since 2012 and President since 2012; Scott E. Benjamin, Board Member since 2010 and Vice President since 2009; Grace C. Torres, 2014.
Visit our website at pgiminvestments.com
| Fund Officers(a) | ||||
| Name, Address and Age Position with Fund | Principal Occupation(s) During Past Five Years | Length of Service as Fund Officer | ||
| Raymond A. O’Hara (62) Chief Legal Officer | Vice President and Corporate Counsel (since July 2010) of Prudential Insurance Company of America (Prudential); Vice President (March 2011-Present) of Pruco Life Insurance Company and Pruco Life Insurance Company of New Jersey; Vice President and Corporate Counsel (March 2011-Present) of Prudential Annuities Life Assurance Corporation; Chief Legal Officer of PGIM Investments LLC (since June 2012); Chief Legal Officer of Prudential Mutual Fund Services LLC (since June 2012) and Corporate Counsel of AST Investment Services, Inc. (since June 2012); formerly Assistant Vice President and Corporate Counsel (September 2008-July 2010) of The Hartford Financial Services Group, Inc.; formerly Associate (September 1980-December 1987) and Partner (January 1988-August 2008) of Blazzard & Hasenauer, P.C. (formerly, Blazzard, Grodd & Hasenauer, P.C.). | Since 2012 | ||
| Chad A. Earnst (42) Chief Compliance Officer | Chief Compliance Officer (September 2014-Present) of PGIM Investments LLC; Chief Compliance Officer (September 2014-Present) of the Prudential Funds, Target Funds, Advanced Series Trust, The Prudential Series Fund, Prudential’s Gibraltar Fund, Inc., Prudential Global Short Duration High Yield Income Fund, Inc., Prudential Short Duration High Yield Fund, Inc. and Prudential Jennison MLP Income Fund, Inc.; formerly Assistant Director (March 2010-August 2014) of the Asset Management Unit, Division of Enforcement, US Securities & Exchange Commission; Assistant Regional Director (January 2010-August 2014), Branch Chief (June 2006-December 2009) and Senior Counsel (April 2003-May 2006) of the Miami Regional Office, Division of Enforcement, US Securities & Exchange Commission. | Since 2014 | ||
| Deborah A. Docs (59) Secretary | Vice President and Corporate Counsel (since January 2001) of Prudential; Vice President (since December 1996) and Assistant Secretary (since March 1999) of PGIM Investments LLC; formerly Vice President and Assistant Secretary (May 2003-June 2005) of AST Investment Services, Inc. | Since 2004 | ||
| Jonathan D. Shain (59) Assistant Secretary | Vice President and Corporate Counsel (since August 1998) of Prudential; Vice President and Assistant Secretary (since May 2001) of PGIM Investments LLC; Vice President and Assistant Secretary (since February 2001) of Prudential Mutual Fund Services LLC; formerly Vice President and Assistant Secretary (May 2003-June 2005) of AST Investment Services, Inc. | Since 2005 | ||
| Claudia DiGiacomo (43) Assistant Secretary | Vice President and Corporate Counsel (since January 2005) of Prudential; Vice President and Assistant Secretary of PGIM Investments LLC (since December 2005); Associate at Sidley Austin Brown & Wood LLP (1999-2004). | Since 2005 | ||
Prudential Select Real Estate Fund
| Fund Officers(a) | ||||
| Name, Address and Age Position with Fund | Principal Occupation(s) During Past Five Years | Length of Service as Fund Officer | ||
Andrew R. French (54) Assistant Secretary | Vice President and Corporate Counsel (since February 2010) of Prudential; formerly Director and Corporate Counsel (2006-2010) of Prudential; Vice President and Assistant Secretary (since January 2007) of PGIM Investments LLC; Vice President and Assistant Secretary (since January 2007) of Prudential Mutual Fund Services LLC. | Since 2006 | ||
Charles H. Smith (44) Anti-Money Laundering Compliance Officer | Vice President, Corporate Compliance, Anti-Money Laundering Unit (since January 2015) of Prudential; committee member of the American Council of Life Insurers Anti-Money Laundering and Critical Infrastructure Committee (since January 2016); formerly Global Head of Economic Sanctions Compliance at AIG Property Casualty (February 2007-December 2014); Assistant Attorney General at the New York State Attorney General’s Office, Division of Public Advocacy. (August 1998-January 2007). | Since 2016 | ||
M. Sadiq Peshimam (53) Treasurer and Principal Financial and Accounting Officer | Vice President (since 2005) of PGIM Investments LLC; formerly Assistant Treasurer of funds in the Prudential Mutual Fund Complex (2006-2014). | Since 2006 | ||
Peter Parrella (59) Assistant Treasurer | Vice President (since 2007) and Director (2004-2007) within Prudential Mutual Fund Administration; formerly Tax Manager at SSB Citi Fund Management LLC (1997-2004). | Since 2007 | ||
Lana Lomuti (50) Assistant Treasurer | Vice President (since 2007) and Director (2005-2007), within Prudential Mutual Fund Administration; formerly Assistant Treasurer (December 2007-February 2014) of The Greater China Fund, Inc. | Since 2014 | ||
Linda McMullin (56) Assistant Treasurer | Vice President (since 2011) and Director (2008-2011) within Prudential Mutual Fund Administration. | Since 2014 | ||
Kelly A. Coyne (49) Assistant Treasurer | Director, Investment Operations of Prudential Mutual Fund Services LLC (since 2010). | Since 2015 | ||
(a) Excludes Mr. Parker and Mr. Benjamin, interested Board Members who also serve as President and Vice President, respectively.
Explanatory Notes to Tables:
| ∎ | Board Members are deemed to be “Interested,” as defined in the 1940 Act, by reason of their affiliation with PGIM Investments LLC and/or an affiliate of PGIM Investments LLC. |
| ∎ | Unless otherwise noted, the address of all Board Members and Officers is c/o PGIM Investments LLC, 655 Broad Street, Newark, New Jersey 07102-4410. |
| ∎ | There is no set term of office for Board Members or Officers. The Board Members have adopted a retirement policy, which calls for the retirement of Board Members on December 31 of the year in which they reach the age of 75. |
| ∎ | “Other Directorships Held” includes only directorships of companies required to register or file reports with the SEC under the 1934 Act (that is, “public companies”) or other investment companies registered under the 1940 Act. |
| ∎ | “Portfolios Overseen” includes all investment companies managed by PGIM Investments LLC. The investment companies for which PGIM Investments LLC serves as manager include the Prudential Mutual Funds, The Prudential Variable Contract Accounts, Target Mutual Funds, Prudential Short Duration High Yield Fund, Inc., Prudential Global Short Duration High Yield Fund, Inc., The Prudential Series Fund, Prudential’s Gibraltar Fund, Inc. and the Advanced Series Trust. |
Visit our website at pgiminvestments.com
Approval of Advisory Agreements
The Fund’s Board of Trustees
The Board of Trustees (the “Board”) of Prudential Select Real Estate Fund (the “Fund”)1 consists of twelve individuals, nine of whom are not “interested persons” of the Fund, as defined in the Investment Company Act of 1940, as amended (the “1940 Act”) (the “Independent Trustees”). The Board is responsible for the oversight of the Fund and its operations, and performs the various duties imposed on the directors of investment companies by the 1940 Act. The Independent Trustees have retained independent legal counsel to assist them in connection with their duties. The Chair of the Board is an Independent Trustee. The Board has established four standing committees: the Audit Committee, the Nominating and Governance Committee, and two Investment Committees. Each committee is chaired by, and composed of, Independent Trustees.
Annual Approval of the Fund’s Advisory Agreements
As required under the 1940 Act, the Board determines annually whether to renew the Fund’s management agreement with PGIM Investments LLC (“PGIM Investments”) and the Fund’s subadvisory agreement with PGIM, Inc. (“PGIM”), which provides subadvisory services to the Fund through its PGIM Real Estate unit. In considering the renewal of the agreements, the Board, including all of the Independent Trustees, 2 met on June 6-8, 2017 and approved the renewal of the agreements through July 31, 2018, after concluding that the renewal of the agreements was in the best interests of the Fund and its shareholders.
In advance of the meetings, the Board requested and received materials relating to the agreements, and had the opportunity to ask questions and request further information in connection with its consideration. Among other things, the Board considered comparative fee information from PGIM Investments and PGIM. Also, the Board considered comparisons with other mutual funds in relevant Peer Universes and Peer Groups, as is further discussed below.
In approving the agreements, the Board, including the Independent Trustees advised by independent legal counsel, considered the factors it deemed relevant, including the nature, quality and extent of services provided by PGIM Investments and the subadviser, the performance of the Fund, the profitability of PGIM Investments and its affiliates, expenses and fees, and the potential for economies of scale that may be shared with the Fund and its shareholders as the Fund’s assets grow. In their deliberations, the Trustees did not identify any single factor which alone was responsible for the Board’s decision to approve the agreements with respect to the Fund. In connection with its deliberations, the Board considered information provided by PGIM Investments throughout the year at regular Board
| 1 | Prudential Select Real Estate Fund is a series of Prudential Investment Portfolios 9. |
| 2 | Barry H. Evans and Laurie Simon Hodrick joined the Board effective as of September 1, 2017. Neither Mr. Evans nor Ms. Hodrick participated in the consideration of the renewal of the Fund’s advisory agreements. |
| Prudential Select Real Estate Fund | ||
Approval of Advisory Agreements (continued)
meetings, presentations from portfolio managers and other information, as well as information furnished at or in advance of the meetings on June 6-8, 2017.
The Trustees determined that the overall arrangements between the Fund and PGIM Investments, which serves as the Fund’s investment manager pursuant to a management agreement, and between PGIM Investments and PGIM, which serves as the Fund’s subadviser pursuant to the terms of a subadvisory agreement with PGIM Investments, are in the best interests of the Fund and its shareholders in light of the services performed, fees charged and such other matters as the Trustees considered relevant in the exercise of their business judgment.
The material factors and conclusions that formed the basis for the Trustees’ reaching their determinations to approve the continuance of the agreements are separately discussed below.
Nature, Quality and Extent of Services
The Board received and considered information regarding the nature, quality and extent of services provided to the Fund by PGIM Investments and PGIM Real Estate. The Board considered the services provided by PGIM Investments, including but not limited to the oversight of the subadviser for the Fund, as well as the provision of fund recordkeeping, compliance, and other services to the Fund. With respect to PGIM Investments’ oversight of the subadviser, the Board noted that PGIM Investments’ Strategic Investment Research Group (“SIRG”), which is a business unit of PGIM Investments, is responsible for monitoring and reporting to PGIM Investments’ senior management on the performance and operations of the subadviser. The Board also considered that PGIM Investments pays the salaries of all of the officers and interested Trustees of the Fund who are part of Fund management. The Board also considered the investment subadvisory services provided by PGIM Real Estate, as well as adherence to the Fund’s investment restrictions and compliance with applicable Fund policies and procedures. The Board considered PGIM Investments’ evaluation of the subadviser, as well as PGIM Investments’ recommendation, based on its review of the subadviser, to renew the subadvisory agreement.
The Board considered the qualifications, backgrounds and responsibilities of PGIM Investments’ senior management responsible for the oversight of the Fund and PGIM Real Estate, and also considered the qualifications, backgrounds and responsibilities of the PGIM Real Estate’s portfolio managers who are responsible for the day-to-day management of the Fund’s portfolio. The Board was provided with information pertaining to PGIM Investments’, PGIM Real Estate’s, and PGIM’s organizational structure, senior management, investment operations, and other relevant information pertaining to PGIM Investments, PGIM Real Estate, and PGIM. The Board also noted that it received favorable
| Visit our website at pgiminvestments.com |
compliance reports from the Fund’s Chief Compliance Officer (“CCO”) as to PGIM Investments, PGIM Real Estate, and PGIM. The Board noted that PGIM Real Estate and PGIM are affiliated with PGIM Investments.
The Board concluded that it was satisfied with the nature, extent and quality of the investment management services provided by PGIM Investments and the subadvisory services provided to the Fund by PGIM through PGIM Real Estate, and that there was a reasonable basis on which to conclude that the Fund benefits from the services provided by PGIM Investments and PGIM Real Estate under the management and subadvisory agreements.
Costs of Services and Profits Realized by PGIM Investments
The Board was provided with information on the profitability of PGIM Investments and its affiliates in serving as the Fund’s investment manager. The Board discussed with PGIM Investments the methodology utilized in assembling the information regarding profitability and considered its reasonableness. The Board recognized that it is difficult to make comparisons of profitability from fund management contracts because comparative information is not generally publicly available and is affected by numerous factors, including the structure of the particular adviser, the types of funds it manages, its business mix, numerous assumptions regarding allocations and the adviser’s capital structure and cost of capital. However, the Board considered that the cost of services provided by PGIM Investments to the Fund during the year ended December 31, 2016 exceeded the management fees paid by the Fund, resulting in an operating loss to PGIM Investments. The Board further noted that the subadviser is affiliated with PGIM Investments and that its profitability is reflected in PGIM Investments’ profitability report. Taking these factors into account, the Board concluded that the profitability of PGIM Investments and its affiliates in relation to the services rendered was not unreasonable.
Economies of Scale
The Board received and discussed information concerning economies of scale that PGIM Investments may realize as the Fund’s assets grow beyond current levels. The Board noted that the management fee schedule for the Fund includes breakpoints, which have the effect of decreasing the fee rate as assets increase, but that at its current level of assets the Fund does not realize the effect of those rate reductions. The Board took note that the Fund’s fee structure currently results in benefits to Fund shareholders whether or not PGIM Investments realizes any economies of scale. The Board noted that economies of scale, can be shared with the Fund in several ways, including low management fees from inception, additional technological and personnel investments to enhance shareholder services, and maintaining existing expense structures in the face of a rising cost environment. The Board considered PGIM Investments’ assertion that it continually evaluates the management fee
| Prudential Select Real Estate Fund | ||
Approval of Advisory Agreements (continued)
schedule of the Fund and the potential to share economies of scale through breakpoints or fee waivers as asset levels increase. The Board also recognized the inherent limitations of any analysis of economies of scale, stemming largely from the Board’s understanding that most of PGIM Investments’ costs are not specific to individual funds, but rather are incurred across a variety of products and services.
Other Benefits to PGIM Investments and PGIM
The Board considered potential ancillary benefits that might be received by PGIM Investments and PGIM and their affiliates as a result of their relationship with the Fund. The Board concluded that potential benefits to be derived by PGIM Investments included transfer agency fees received by the Fund’s transfer agent (which is affiliated with PGIM Investments), and benefits to its reputation as well as other intangible benefits resulting from PGIM Investments’ association with the Fund. The Board concluded that the potential benefits to be derived by PGIM included its ability to use soft dollar credits, as well as the potential benefits consistent with those generally resulting from an increase in assets under management, specifically, potential access to additional research resources and benefits to its reputation. The Board concluded that the benefits derived by PGIM Investments and PGIM were consistent with the types of benefits generally derived by investment managers and subadvisers to mutual funds.
Performance of the Fund / Fees and Expenses
The Board considered certain additional specific factors and made related conclusions relating to the historical performance of the Fund for the one-year period ended December 31, 2016. The Board considered that the Fund commenced investment operations on August 1, 2014 and that longer-term performance was not yet available.
The Board also considered the Fund’s actual management fee, as well as the Fund’s net total expense ratio, for the fiscal year ended October 31, 2016. The Board considered the management fee for the Fund as compared to the management fee charged by PGIM Investments to other funds and the fee charged by other advisers to comparable mutual funds in a Peer Group. The actual management fee represents the fee rate actually paid by Fund shareholders and includes any fee waivers or reimbursements. The net total expense ratio for the Fund represents the actual expense ratio incurred by Fund shareholders.
The mutual funds included in the Peer Universe (the Global Real Estate Funds Performance Universe), which was used to consider performance, and the Peer Group, which was used to consider expenses and fees, were objectively determined by Broadridge, an independent provider of mutual fund data. The comparisons placed the Fund in various quartiles, with the first quartile being the best 25% of the mutual funds (for performance, the best performing mutual funds and, for expenses, the lowest cost mutual funds).
| Visit our website at pgiminvestments.com |
The section below summarizes key factors considered by the Board and the Board’s conclusions regarding the Fund’s performance, fees and overall expenses. The table sets forth gross performance comparisons (which do not reflect the impact on performance of fund expenses, or any subsidies, expense caps or waivers that may be applicable) with the Peer Universe, actual management fees with the Peer Group (which reflect the impact of any subsidies or fee waivers), and net total expenses with the Peer Group, each of which were key factors considered by the Board.
| Performance | 1 Year | 3 Years | 5 Years | 10 Years | ||||
2nd Quartile | N/A | N/A | N/A | |||||
| Actual Management Fees: 1st Quartile | ||||||||
| Net Total Expenses: 1st Quartile | ||||||||
| • | The Board noted that the Fund outperformed its benchmark index over the one-year period. |
| • | The Board noted that the Fund does not yet have a three-year performance record and that, therefore, the subadviser should have more time to develop that record. |
| • | The Board and PGIM Investments agreed to continue the Fund’s existing expense cap, which caps the Fund’s annual operating expenses at 1.05% (exclusive of 12b-1 and certain other fees), through February 28, 2018. |
| • | The Board concluded that in light of the above, it would be in the best interests of the Fund and its shareholders to continue to allow the Fund to create a performance record, and to renew the agreements with the permanent reduction in fees. |
| • | The Board concluded that the management fees (including subadvisory fees) and total expenses were reasonable in light of the services provided. |
* * *
After full consideration of these factors, the Board concluded that the approval of the agreements was in the best interests of the Fund and its shareholders.
| Prudential Select Real Estate Fund | ||
| ∎ TELEPHONE | ∎ WEBSITE | |||
655 Broad Street | (800) 225-1852 | www.pgiminvestments.com |
| PROXY VOTING |
| The Board of Trustees of the Fund has delegated to the Fund’s investment subadviser the responsibility for voting any proxies and maintaining proxy recordkeeping with respect to the Fund. A description of these proxy voting policies and procedures is available without charge, upon request, by calling (800) 225-1852. Information regarding how the Fund voted proxies relating to portfolio securities during the most recent 12-month period ended June 30 is available on the Fund’s website and on the Securities and Exchange Commission’s website. |
| TRUSTEES |
| Ellen S. Alberding • Kevin J. Bannon • Scott E. Benjamin • Linda W. Bynoe • Barry H. Evans • Keith F. Hartstein • Laurie Simon Hodrick • Michael S. Hyland • Stuart S. Parker • Richard A. Redeker • Stephen G. Stoneburn • Grace C. Torres |
| OFFICERS |
| Stuart S. Parker, President • Scott E. Benjamin, Vice President • M. Sadiq Peshimam, Treasurer and Principal Financial and Accounting Officer • Raymond A. O’Hara, Chief Legal Officer • Chad A. Earnst, Chief Compliance Officer • Deborah A. Docs, Secretary • Charles H. Smith, Anti-Money Laundering Compliance Officer • Jonathan D. Shain, Assistant Secretary • Claudia DiGiacomo, Assistant Secretary • Andrew R. French, Assistant Secretary • Peter Parrella, Assistant Treasurer • Lana Lomuti, Assistant Treasurer • Linda McMullin, Assistant Treasurer • Kelly A. Coyne, Assistant Treasurer |
| MANAGER | PGIM Investments LLC | 655 Broad Street Newark, NJ 07102 | ||
| ||||
| INVESTMENT SUBADVISER | PGIM Real Estate | 7 Giralda Farms Madison, NJ 07940 | ||
| ||||
| DISTRIBUTOR | Prudential Investment Management Services LLC | 655 Broad Street Newark, NJ 07102 | ||
| ||||
| CUSTODIAN | The Bank of New York Mellon | 225 Liberty Street New York, NY 10286 | ||
| ||||
| TRANSFER AGENT | Prudential Mutual Fund Services LLC | PO Box 9658 Providence, RI 02940 | ||
| ||||
| INDEPENDENT REGISTERED PUBLIC ACCOUNTING FIRM | KPMG LLP | 345 Park Avenue New York, NY 10154 | ||
| ||||
| FUND COUNSEL | Willkie Farr & Gallagher LLP | 787 Seventh Avenue New York, NY 10019 | ||
| ||||
| An investor should consider the investment objectives, risks, charges, and expenses of the Fund carefully before investing. The prospectus and summary prospectus contain this and other information about the Fund. An investor may obtain a prospectus and summary prospectus by visiting our website at www.pgiminvestments.com or by calling (800) 225-1852. The prospectus and summary prospectus should be read carefully before investing. |
| E-DELIVERY |
| To receive your mutual fund documents online, go to www.pgiminvestments.com/edelivery and enroll. Instead of receiving printed documents by mail, you will receive notification via email when new materials are available. You can cancel your enrollment or change your email address at any time by visiting the website address above. |
| SHAREHOLDER COMMUNICATIONS WITH TRUSTEES |
| Shareholders can communicate directly with the Board of Trustees by writing to the Chair of the Board, Prudential Select Real Estate Fund, PGIM Investments, Attn: Board of Trustees, 655 Broad Street, Newark, NJ 07102. Shareholders can communicate directly with an individual Director by writing to the same address. Communications are not screened before being delivered to the addressee. |
| AVAILABILITY OF PORTFOLIO SCHEDULE |
| The Fund files its complete schedule of portfolio holdings with the Securities and Exchange Commission for the first and third quarters of each fiscal year on Form N-Q. The Fund’s Forms N-Q are available on the Commission’s website at www.sec.gov. The Fund’s Forms N-Q may also be reviewed and copied at the Commission’s Public Reference Room in Washington, D.C. Information on the operation and location of the Public Reference Room may be obtained by calling 1-800-SEC-0330. The Fund’s schedule of portfolio holdings is also available on the Fund’s website as of the end of each month no sooner than 15 days after the end of the month. |
| The Fund’s Statement of Additional Information contains additional information about the Fund’s Trustees and is available without charge, upon request, by calling (800) 225-1852. |
Mutual Funds:
| ARE NOT INSURED BY THE FDIC OR ANY FEDERAL GOVERNMENT AGENCY | MAY LOSE VALUE | ARE NOT A DEPOSIT OF OR GUARANTEED BY ANY BANK OR ANY BANK AFFILIATE |
PRUDENTIAL SELECT REAL ESTATE FUND
| SHARE CLASS | A | C | Q | Z | ||||
| NASDAQ | SREAX | SRECX | SREQX | SREZX | ||||
| CUSIP | 74441J811 | 74441J795 | 74441J787 | 74441J779 |
MF223E

PRUDENTIAL INTERNATIONAL BOND FUND
ANNUAL REPORT
OCTOBER 31, 2017

To enroll in e-delivery, go to pgiminvestments.com/edelivery
| Objective: Total return, made up of current income and capital appreciation |
Highlights
| • | The Fund outperformed the Bloomberg Barclays Global Aggregate ex USD (USD Hedged) Index primarily because of strong sector and issuer selection across hard currency emerging markets sovereign debt, bonds in non-core European countries, high yield corporate bonds, and high-quality structured securities. |
| • | Yield curve and duration positioning also helped Fund performance. |
| • | The Fund’s position in South Korean interest rates detracted from relative performance during the period. |
This report is not authorized for distribution to prospective investors unless preceded or accompanied by a current prospectus.
The views expressed in this report and information about the Fund’s portfolio holdings are for the period covered by this report and are subject to change thereafter.
Mutual funds are distributed by Prudential Investment Management Services LLC (PIMS), member SIPC. PGIM Fixed Income is a unit of PGIM, Inc. (PGIM), a registered investment adviser. PIMS and PGIM are Prudential Financial companies. © 2017 Prudential Financial, Inc. and its related entities. PGIM and the PGIM logo are service marks of Prudential Financial, Inc. and its related entities, registered in many jurisdictions worldwide.
| 2 | Visit our website at pgiminvestments.com |
PRUDENTIAL FUNDS — UPDATE
The Board of Directors/Trustees for the Fund has approved renaming the Fund’s Class Q shares as Class R6 shares, effective on or about June 15, 2018. The renaming of Class Q shares as Class R6 shares will not result in any changes to pricing, eligibility, or shareholder rights and obligations. The renamed Class R6 shares will not be exchangeable with Class R6 shares of the Prudential Day One Funds or the Prudential 60/40 Allocation Fund.
LR993
| Prudential International Bond Fund | 3 |
PRUDENTIAL FUNDS — UPDATE
Effective on or about June 1, 2018 (the “Effective Date”), the Fund’s Class A, Class C, Class R, and Class Z shares, as applicable, will be closed to investments by new group retirement plans, except as discussed below. Existing group retirement plans as of the Effective Date may keep their investments in their current share class and may continue to make additional purchases or exchanges of that class of shares. As of the Effective Date, all new group retirement plans wishing to add the Fund as a new addition to the plan generally will be into one of the available Class Q shares, Class R2 shares, or Class R4 shares of the Fund.
In addition, on or about the Effective Date, the Class R shares of the Fund will be closed to all new investors, except as discussed below. Due to the closing of the Class R shares to new investors, effective on or about the Effective Date new IRA investors may only purchase Class A, Class C, Class Z, or Class Q shares of the Fund, subject to share class eligibility. Following the Effective Date, no new accounts may be established in the Fund’s Class R shares and no Class R shares may be purchased or acquired by any new Class R shareholder, except as discussed below.
| Class A | Class C | Class Z | Class R | |||||
Existing Investors (Group Retirement Plans, IRAs, and all other investors) | No Change | No Change | No Change | No Change | ||||
| New Group Retirement Plans | Closed to group retirement plans wishing to add the share classes as new additions to plan menus on or about June 1, 2018, subject to certain exceptions below | |||||||
New IRAs | No Change | No Change | No Change | Closed to all new investors on or about June 1, 2018, subject to certain exceptions below | ||||
| All Other New Investors | No Change | No Change | No Change | |||||
| 4 | Visit our website at pgiminvestments.com |
However, the following new investors may continue to purchase Class A, Class C, Class R, and Class Z shares of the Fund, as applicable:
| • | Eligible group retirement plans who are exercising their one-time 90-day repurchase privilege in the Fund will be permitted to purchase such share classes. |
| • | Plan participants in a group retirement plan that offers Class A, Class C, Class R, or Class Z shares of the Fund as of the Effective Date will be permitted to purchase such share classes of the Fund, even if the plan participant did not own shares of that class of the Fund as of the Effective Date. |
| • | Certain new group retirement plans will be permitted to offer such share classes of the Fund after the Effective Date, provided that the plan has or is actively negotiating a contractual agreement with the Fund’s distributor or service provider to offer such share classes of the Fund prior to or on the Effective Date. |
| • | New group retirement plans that combine with, replace, or are otherwise affiliated with a current plan that invests in such share classes prior to or on the Effective Date will be permitted to purchase such share classes. |
The Fund also reserves the right to refuse any purchase order that might disrupt management of the Fund or to otherwise modify the closure policy at any time on a case-by-case basis.
| Prudential International Bond Fund | 5 |
This Page Intentionally Left Blank
| 6 | Visit our website at pgiminvestments.com |
Letter from the President

Dear Shareholder:
We hope you find the annual report for the Prudential International Bond Fund informative and useful. The report covers performance for the 12-month period ended October 31, 2017.
Significant events during the reporting period included a new US president, followed by uncertainty in Congress over implementing the Trump administration’s policy initiatives. Elsewhere, Britain began its formal legal process to leave the European Union. France elected a more centrist president, which was viewed as a pro-euro referendum. North Korea’s missile launches escalated geopolitical tensions. Also, late in the period, a series of hurricanes caused damage in the US and the Caribbean.
Despite some turbulence in the macro-environment, solid economic fundamentals in the US economy included moderate gross domestic product expansion, robust employment, and accelerating corporate profit growth. Inflation remained tame. The Federal Reserve raised its federal funds rate twice in 2017, and is in the process of winding down its stimulus program.
Global economic growth remained mostly positive. Equities in the US reached new highs amid low volatility, while international equities posted strong gains. European stocks continued to gain. Asian markets were solid, and emerging markets outperformed most regions. Fixed income markets were mixed. High yield and emerging markets bonds were the top performers.
Given the uncertainty in today’s investment environment, we believe that active professional portfolio management offers a potential advantage. Active managers often have the knowledge and flexibility to find the best investment opportunities in the most challenging markets.
Even so, it’s best if investment decisions are based on your long-term goals rather than on short-term market and economic developments. We also encourage you to work with an experienced financial advisor who can help you set goals, determine your tolerance for risk, and build a diversified plan that’s right for you and make adjustments when necessary.
At PGIM Investments, we consider it a great privilege and responsibility to help investors participate in opportunities across global markets while meeting their toughest investment challenges. We’re part of PGIM, a top-10 global investment manager with more than $1 trillion in assets under management. This investment expertise allows us to deliver actively managed funds and strategies to meet the needs of investors around the globe.
Thank you for choosing our family of funds.
Sincerely,

Stuart S. Parker, President
Prudential International Bond Fund
December 15, 2017
| Prudential International Bond Fund | 7 |
Your Fund’s Performance (unaudited)
Performance data quoted represents past performance. Past performance does not guarantee future results. The investment return and principal value of an investment will fluctuate, so that an investor’s shares, when redeemed, may be worth more or less than their original cost. Current performance may be lower or higher than the past performance data quoted. An investor may obtain performance data as of the most recent month-end by visiting our website at www.pgiminvestments.com or by calling (800) 225-1852.
Total Returns as of 10/31/17 | ||
| Since Inception* (%) | ||
| Class A | 6.42 (12/14/16) | |
| Class C | 5.73 (12/14/16) | |
| Class Q | 6.65 (12/14/16) | |
| Class Z | 6.67 (12/14/16) | |
| Bloomberg Barclays Global Aggregate ex USD (USD Hedged) Index | 2.42 | |
| Lipper International Income Funds Average | 7.13 |
*Not annualized
Growth of a $10,000 Investment
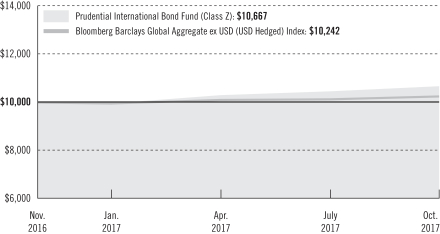
The graph compares a $10,000 investment in the Prudential International Bond Fund (Class Z shares) with a similar investment in the Bloomberg Barclays Global Aggregate ex USD (USD Hedged) Index by portraying the initial account values at the commencement of operations for Class Z shares (December 14, 2016) and the account values at the end of the current fiscal year (October 31, 2017) as measured on a quarterly basis. For purposes of the graph, and unless otherwise indicated, it has been assumed that (a) all recurring fees (including management fees) were deducted; and (b) all dividends and distributions were reinvested. The line graph provides information for Class Z shares only. As indicated in the tables provided earlier, performance for Class A, Class C, and Class Q shares will vary due to the differing charges and
| 8 | Visit our website at pgiminvestments.com |
expenses applicable to each share class (as indicated in the following paragraphs). Without waiver of fees and/or expense reimbursements, if any, the returns would have been lower.
Past performance does not predict future performance. Total returns and the ending account values in the graph include changes in share price and reinvestment of dividends and capital gains distributions in a hypothetical investment for the periods shown. The Fund’s total returns do not reflect the deduction of income taxes on an individual’s investment. Taxes may reduce your actual investment returns on income or gains paid by the Fund or any gains you may realize if you sell your shares.
Source: PGIM Investments LLC and Lipper Inc.
Since Inception returns for the Index and the Lipper Average are measured from the closest month-end to the Fund’s inception date.
The returns in the tables do not reflect the deduction of taxes that a shareholder would pay on Fund distributions or following the redemption of Fund shares. The average annual total returns take into account applicable sales charges, which are described for each share class in the table below.
| Class A* | Class C* | Class Q | Class Z* | |||||
| Maximum initial sales charge | 4.50% of the public offering price | None | None | None | ||||
| Contingent deferred sales charge (CDSC) (as a percentage of the lower of original purchase price or net asset value at redemption) | 1.00% on sales of $1 million or more made within 12 months of purchase | 1.00% on sales made within 12 months of purchase | None | None | ||||
| Annual distribution and service (12b-1) fees (shown as a percentage of average daily net assets) | 0.25% | 1.00% | None | None |
*Certain share classes will be generally closed to investments by new group retirement plans effective on or about June 1, 2018. Please see the “PRUDENTIAL FUNDS—UPDATE” on page 4 of this report for more information.
Benchmark Definitions
Bloomberg Barclays Global Aggregate ex USD (USD Hedged) Index—Provides a broad-based measure of the global investment-grade fixed income markets. The Index includes government, government agency, corporate, and securitized non-US investment-grade fixed income investments, all issued in currencies other than the US dollar and with maturities of more than one year. The Index is US dollar hedged.
The Lipper International Income Funds Average—Funds in the Lipper International Income Funds Average invest primarily in non-US dollar and US dollar debt securities of issuers located in at least three countries, excluding the US, except in periods of market weakness.
| Prudential International Bond Fund | 9 |
Your Fund’s Performance (continued)
Investors cannot invest directly in an index or average. The returns for the Index would be lower if they included the effects of sales charges, operating expenses of a mutual fund, or taxes. Returns for the Lipper Average reflect the deduction of operating expenses of a mutual fund, but not sales charges or taxes.
| Distributions and Yields as of 10/31/17 | ||||||
| Total Distributions Paid for Since Inception ($) | SEC 30-Day Subsidized Yield* (%) | SEC 30-Day Unsubsidized Yield** (%) | ||||
| Class A | 0.20 | 0.76 | –3.13 | |||
| Class C | 0.13 | 0.04 | 14.70 | |||
| Class Q | 0.22 | 1.05 | –2.34 | |||
| Class Z | 0.22 | 1.03 | 15.57 |
*SEC 30-Day Subsidized Yield (%)—A standardized yield calculation created by the Securities and Exchange Commission, it reflects the income earned during a 30-day period, after the deduction of the Fund’s net expenses (net of any expense waivers or reimbursements).
**SEC 30-Day Unsubsidized Yield (%)—A standardized yield calculation created by the Securities and Exchange Commission, it reflects the income earned during a 30-day period, after the deduction of the Fund’s gross expenses.
| Credit Quality expressed as a percentage of total investments as of 10/31/17 (%) | ||||
| AAA | 20.0 | |||
| AA | 13.3 | |||
| A | 16.4 | |||
| BBB | 24.8 | |||
| BB | 15.6 | |||
| B | 6.1 | |||
| CCC | 0.2 | |||
| Not Rated | –0.2 | |||
| Cash/Cash Equivalents | 3.8 | |||
| Total Investments | 100.0 | |||
Source: PGIM Fixed Income
Credit ratings reflect the highest rating assigned by a nationally recognized statistical rating organization (NRSRO) such as Moody’s Investor Service, Inc. (Moody’s), S&P Global Ratings (S&P), or Fitch, Inc. (Fitch). Credit ratings reflect the common nomenclature used by both S&P and Fitch. Where applicable, ratings are converted to the comparable S&P/Fitch rating tier nomenclature. These rating agencies are independent and are widely used. The Not Rated category consists of securities that have not been rated by an NRSRO. Credit ratings are subject to change. Values may not sum to 100.0% due to rounding.
| 10 | Visit our website at pgiminvestments.com |
Strategy and Performance Overview
How did the Fund perform?
The Prudential International Bond Fund’s Class Z shares returned 6.67% for the period from inception on December 14, 2016 through October 31, 2017, outperforming the 2.42% return of the Bloomberg Barclays Global Aggregate ex USD (USD Hedged) Index (the Index). The Fund underperformed the 7.13% return of the Lipper International Income Funds Average
What were market conditions?
| • | The close of 2016 was largely about the surprise result of the US presidential election, in which populist Donald Trump managed an electoral college win against former US Senator Hillary Clinton. Given that Trump campaigned on tax cuts and deregulation, bond investors responded by sending US intermediate- and longer-term interest rates higher and driving credit spreads tighter. Credit spreads are differences in yield between government bonds and debt securities of comparable maturity but lower credit quality. |
| • | In the first quarter of 2017, US 10-year yields fell back somewhat, as market participants began to see that recent inflation increases were the result of a recovery in commodity prices, rather than the tightening of slack in the global labor markets and an overheating world economy. Emerging markets currencies rallied, interest rates broadly declined, and spreads continued to compress. |
| • | During the second quarter, the bond market focused on the potential downside of the Trump administration’s protectionist agenda, instead of the Federal Reserve’s (Fed) plans to shrink its balance sheet. Considering how difficult it was to find yield globally, investors spent the quarter looking for opportunities further out among spread sectors, with emerging markets debt drawing an especially large inflow of assets. (Spread sectors are corporate bonds, emerging markets debt, and other types of debt securities that provide extra yield (spread) over similar-maturity government bond sectors to compensate for the greater credit risk associated with investing in them.) Looking at various regions of emerging markets, the recession in Russia had ended, while fiscal and credit stimulus was boosting growth in Turkey. In Latin America, the recession in Brazil had given way to a moderate recovery, and concerns had eased about Mexico’s outlook, despite the US’s desire to renegotiate the North American Free Trade Agreement (NAFTA). |
| • | In the third quarter and through October 2017, overall economic growth rates remained somewhat below those recorded before the 2008-2009 financial crisis, but the global expansion became increasingly balanced across regions, with the US, the eurozone, Japan, and China all growing in tandem at above-potential rates. In this environment, US intermediate-term interest rates remained rather flat, but the front, or short-term, end of the US Treasury yield curve rose in anticipation of ongoing tighter monetary policy by the Fed. Spreads continued to compress because of the scarcity of yield globally and strong corporate earnings. |
| Prudential International Bond Fund | 11 |
Strategy and Performance Overview (continued)
What worked?
| • | During the reporting period, the Fund’s sector allocation emphasized global spread sectors rather than government bond sectors. The Fund outperformed the Index primarily because of strong sector and issuer selection across hard currency emerging markets sovereign debt, bonds in non-core European countries, high yield corporate bonds, and high-quality structured securities. |
| • | The Fund’s yield curve and duration positioning also helped performance. Within developed markets, this contribution was driven by the Fund’s positioning on the European, New Zealand, and Australian yield curves. Within emerging markets, gains were produced by positioning on Israeli, Hungarian, and Brazilian yield curves. Duration is a measure of the interest rate sensitivity of a bond portfolio or individual debt securities that is expressed as a number of years. The longer the duration, the greater the potential risk or reward when interest rates move. |
| • | Currency positions also added to relative returns, with tactical positioning in Mexico generating gains as the US dollar rallied in the wake of the US election. The Fund’s overweight positions compared to the Index in the Indian rupee and Russian ruble also bore fruit. |
What didn’t work?
| • | The Fund’s position in South Korean interest rates detracted from relative performance during the period. |
| • | Currency positions in the Japanese yen, British pound, and South Korean won had a negative impact on returns. |
Did the Fund hold derivatives and how did they affect performance?
| • | During the reporting period, the Fund utilized derivative instruments. Interest rate derivatives were additive to performance, currency derivatives were a contributor, and credit derivatives also had a positive impact. For additional information regarding the Fund’s derivative exposures please refer to the Fund’s Financial Statements. |
Current outlook
| • | PGIM Fixed Income maintains a positive view of credit sectors, and at the end of the reporting period, the Fund held positions in an array of spread sectors, including high yield corporate bonds, developed and emerging markets sovereign debt, and structured products, including commercial mortgage-backed securities (CMBS) and asset-backed securities. |
| • | The Fund is also overweight the debt of non-core European countries, as well as a select group of emerging markets issues, mostly sovereign debt. |
| 12 | Visit our website at pgiminvestments.com |
| • | In terms of currency positioning, relative to the Index, the Fund holds underweight positions in the US dollar, Japanese yen, and Swiss franc while maintaining an overweight to the euro. |
| • | Additionally, the Fund maintains a select set of small allocations, both underweight and overweight, within emerging markets and “commodity” currencies. These include overweights in the Indian rupee, Russian ruble, Indonesian rupiah, and Mexican peso and underweights in the Taiwanese dollar, Singaporean dollar, and Israeli new shekel. |
| • | US government-related sectors, including Treasuries, agency bonds, and agency mortgage-backed securities, remain a significant underweight as PGIM Fixed Income finds more compelling value in the aforementioned sectors. |
| Prudential International Bond Fund | 13 |
Fees and Expenses (unaudited)
As a shareholder of the Fund, you incur two types of costs: (1) transaction costs, including sales charges (loads) on purchase payments and redemptions, as applicable, and (2) ongoing costs, including management fees, distribution and/or service (12b-1) fees, and other Fund expenses, as applicable. This example is intended to help you understand your ongoing costs (in dollars) of investing in the Fund and to compare these costs with the ongoing costs of investing in other mutual funds.
The example is based on an investment of $1,000 held through the six-month period ended October 31, 2017. The example is for illustrative purposes only; you should consult the Prospectus for information on initial and subsequent minimum investment requirements.
Actual Expenses
The first line for each share class in the table on the following page provides information about actual account values and actual expenses. You may use the information on this line, together with the amount you invested, to estimate the expenses that you paid over the period. Simply divide your account value by $1,000 (for example, an $8,600 account value ÷ $1,000 = 8.6), then multiply the result by the number on the first line under the heading “Expenses Paid During the Six-Month Period” to estimate the expenses you paid on your account during this period.
Hypothetical Example for Comparison Purposes
The second line for each share class in the table on the following page provides information about hypothetical account values and hypothetical expenses based on the Fund’s actual expense ratio and an assumed rate of return of 5% per year before expenses, which is not the Fund’s actual return. The hypothetical account values and expenses may not be used to estimate the actual ending account balance or expenses you paid for the period. You may use this information to compare the ongoing costs of investing in the Fund and other funds. To do so, compare this 5% hypothetical example with the 5% hypothetical examples that appear in the shareholder reports of the other funds.
The Fund’s transfer agent may charge additional fees to holders of certain accounts that are not included in the expenses shown in the table on the following page. These fees apply to individual retirement accounts (IRAs) and Section 403(b) accounts. As of the close of the six-month period covered by the table, IRA fees included an annual maintenance fee of $15 per account (subject to a maximum annual maintenance fee of $25 for all accounts held by the same shareholder). Section 403(b) accounts are charged an annual $25 fiduciary maintenance fee. Some of the fees may vary in amount, or may be waived, based on your total account balance or the number of Prudential funds, including the Fund, that you own. You should consider the additional fees that were charged to your Fund account over the six-month period when you estimate the total ongoing expenses paid over the
| 14 | Visit our website at pgiminvestments.com |
period and the impact of these fees on your ending account value, as these additional expenses are not reflected in the information provided in the expense table. Additional fees have the effect of reducing investment returns.
Please note that the expenses shown in the table are meant to highlight your ongoing costs only and do not reflect any transactional costs such as sales charges (loads). Therefore, the second line for each share class in the table is useful in comparing ongoing costs only and will not help you determine the relative total costs of owning different funds. In addition, if these transactional costs were included, your costs would have been higher.
| Prudential International Return Bond Fund | Beginning Account Value May 1, 2017 | Ending Account Value October 31, 2017 | Annualized Expense Ratio Based on the Six-Month Period | Expenses Paid During the Six-Month Period* | ||||||||||||||
| Class A | Actual | $ | 1,000.00 | $ | 1,033.90 | 0.99 | % | $ | 5.08 | |||||||||
| Hypothetical | $ | 1,000.00 | $ | 1,020.21 | 0.99 | % | $ | 5.04 | ||||||||||
| Class C | Actual | $ | 1,000.00 | $ | 1,029.90 | 1.74 | % | $ | 8.90 | |||||||||
| Hypothetical | $ | 1,000.00 | $ | 1,016.43 | 1.74 | % | $ | 8.84 | ||||||||||
| Class Q | Actual | $ | 1,000.00 | $ | 1,035.20 | 0.74 | % | $ | 3.80 | |||||||||
| Hypothetical | $ | 1,000.00 | $ | 1,021.48 | 0.74 | % | $ | 3.77 | ||||||||||
| Class Z | Actual | $ | 1,000.00 | $ | 1,035.30 | 0.74 | % | $ | 3.79 | |||||||||
| Hypothetical | $ | 1,000.00 | $ | 1,021.48 | 0.74 | % | $ | 3.77 | ||||||||||
*Fund expenses (net of fee waivers or subsidies, if any) for each share class are equal to the annualized expense ratio for each share class (provided in the table), multiplied by the average account value over the period, multiplied by the 184 days in the six-month period ended October 31, 2017, and divided by the 365 days in the Fund’s fiscal year ended October 31, 2017 (to reflect the six-month period). Expenses presented in the table include the expenses of any underlying funds in which the Fund may invest.
| Prudential International Bond Fund | 15 |
Schedule of Investments
as of October 31, 2017
| Description | Interest Rate | Maturity Date | Principal Amount (000)# | Value | ||||||||||||
LONG-TERM INVESTMENTS 95.5% |
| |||||||||||||||
ASSET-BACKED SECURITIES 11.3% |
| |||||||||||||||
Automobiles 0.4% | ||||||||||||||||
United States 0.4% | ||||||||||||||||
OneMain Direct Auto Receivables Trust, Series 2017-1A, Class C, 144A | 3.910 | % | 08/16/21 | 100 | $ | 99,811 | ||||||||||
Collaterlized Loan Obligations 10.6% |
| |||||||||||||||
Cayman Islands 1.9% |
| |||||||||||||||
Silver Creek CLO Ltd., Series 2014-1A, Class AR, 144A, 3 Month LIBOR + 1.240% | 2.603 | (c) | 07/20/30 | 250 | 251,673 | |||||||||||
West CLO Ltd., Series 2012-1A, Class B, 144A, 3 Month LIBOR + 3.400% | 4.778 | (c) | 10/30/23 | 250 | 250,061 | |||||||||||
|
| |||||||||||||||
| 501,734 | ||||||||||||||||
Netherlands 5.4% |
| |||||||||||||||
Babson Euro CLO BV, Series 2015-1A, Class A2R, 144A^ | 1.100 | 10/25/29 | EUR | 250 | 291,213 | |||||||||||
Jubilee CLO BV, Series 2017-19A, | — | (p) | 07/15/30 | EUR | 250 | 291,212 | ||||||||||
North Westerly CLO BV, Series IV-A, Class A2R, 144A | 1.250 | 01/15/26 | EUR | 250 | 291,385 | |||||||||||
St. Paul’s CLO DAC, Series 7A, | 2.400 | 04/30/30 | EUR | 500 | 581,429 | |||||||||||
|
| |||||||||||||||
| 1,455,239 | ||||||||||||||||
United Kingdom 3.3% |
| |||||||||||||||
Carlyle Global Market Strategies Euro CLO, Series 14-2A, Class A, 144A | 2.250 | 08/15/27 | EUR | 750 | 877,860 | |||||||||||
Home Equity Loans 0.3% |
| |||||||||||||||
United States 0.3% |
| |||||||||||||||
CIM Trust, Series 2017-3, Class A1, 144A, 1 Month LIBOR + 2.000% | 3.235 | (c) | 01/25/57 | 88 | 89,355 | |||||||||||
|
| |||||||||||||||
TOTAL ASSET-BACKED SECURITIES |
| 3,023,999 | ||||||||||||||
|
| |||||||||||||||
CORPORATE BONDS 27.7% |
| |||||||||||||||
Australia 0.9% |
| |||||||||||||||
European Investment Bank, Sr. Unsec’d. Notes, EMTN | 0.500 | 10/26/23 | AUD | 160 | 104,884 | |||||||||||
Transurban Finance Co. Pty Ltd., Sr. Sec’d. Notes, EMTN | 2.000 | 08/28/25 | EUR | 100 | 124,957 | |||||||||||
|
| |||||||||||||||
| 229,841 | ||||||||||||||||
See Notes to Financial Statements.
| Prudential International Bond Fund | 17 |
Schedule of Investments (continued)
as of October 31, 2017
| Description | Interest Rate | Maturity Date | Principal Amount (000)# | Value | ||||||||||||
CORPORATE BONDS (Continued) |
| |||||||||||||||
Austria 0.9% |
| |||||||||||||||
Jab Holdings BV, Gtd. Notes | 1.750 | % | 05/25/23 | EUR | 200 | $ | 247,192 | |||||||||
Brazil 0.5% |
| |||||||||||||||
Petrobras Global Finance BV, Gtd. Notes | 3.750 | 01/14/21 | EUR | 100 | 125,199 | |||||||||||
China 0.9% |
| |||||||||||||||
State Grid Europe Development PLC, Gtd. Notes | 1.500 | 01/26/22 | EUR | 200 | 240,884 | |||||||||||
France 1.2% |
| |||||||||||||||
BNP Paribas SA, Sub. Notes, EMTN | 2.250 | 01/11/27 | EUR | 100 | 122,194 | |||||||||||
TOTAL SA, Jr. Sub. Notes, EMTN | 3.875 | 12/31/49 | EUR | 150 | 196,152 | |||||||||||
|
| |||||||||||||||
| 318,346 | ||||||||||||||||
Germany 3.0% | ||||||||||||||||
Allianz SE, Sub. Notes, | 5.625 | 10/17/42 | EUR | 200 | 286,400 | |||||||||||
Commerzbank AG, Sub. Notes, EMTN | 7.750 | 03/16/21 | EUR | 100 | 142,935 | |||||||||||
IHO Verwaltungs GmbH, Sr. Sec’d. Notes, | 3.750 | 09/15/26 | EUR | 100 | 124,639 | |||||||||||
Nidda Healthcare Holding AG, Sr. Sec’d. | 3.500 | 09/30/24 | EUR | 100 | 119,234 | |||||||||||
Unitymedia Hessen GmbH & Co. KG/Unitymedia NRW GmbH, Sr. Sec’d. Notes | 4.000 | 01/15/25 | EUR | 100 | 124,071 | |||||||||||
|
| |||||||||||||||
| 797,279 | ||||||||||||||||
Ireland 0.4% | ||||||||||||||||
Smurfit Kappa Acquisitions, Gtd. Notes | 2.750 | 02/01/25 | EUR | 100 | 122,728 | |||||||||||
Italy 0.5% | ||||||||||||||||
Telecom Italia SpA Milano, Sr. Unsec’d. | 3.250 | 01/16/23 | EUR | 100 | 130,200 | |||||||||||
Luxembourg 0.5% | ||||||||||||||||
B&M European Value Retail SA, Sr. Sec’d. Notes, 144A, MTN | 4.125 | 02/01/22 | GBP | 100 | 137,685 | |||||||||||
Mexico 0.5% | ||||||||||||||||
Petroleos Mexicanos, Gtd. Notes | 5.500 | 02/24/25 | EUR | 100 | 135,276 | |||||||||||
Netherlands 1.6% | ||||||||||||||||
Nederlandse Waterschapsbank NV, Sr. Unsec’d. Notes, EMTN | 5.200 | 03/31/25 | CAD | 200 | 179,936 | |||||||||||
UPCB Finance IV Ltd., Sr. Sec’d. Notes | 4.000 | 01/15/27 | EUR | 100 | 124,045 | |||||||||||
Ziggo Secured Finance BV, Sr. Sec’d. Notes | 3.750 | 01/15/25 | EUR | 100 | 122,506 | |||||||||||
|
| |||||||||||||||
| 426,487 | ||||||||||||||||
See Notes to Financial Statements.
| 18 |
| Description | Interest Rate | Maturity Date | Principal Amount (000)# | Value | ||||||||||||
CORPORATE BONDS (Continued) |
| |||||||||||||||
Norway 0.4% | ||||||||||||||||
Silk Bidco AS, Sr. Sec’d. Notes | 7.500 | % | 02/01/22 | EUR | 100 | $ | 121,785 | |||||||||
Russia 0.5% | ||||||||||||||||
Gazprom Oao Via Gaz Capital SA, Sr. Unsec’d. Notes, EMTN | 3.389 | 03/20/20 | EUR | 100 | 122,892 | |||||||||||
Spain 0.9% | ||||||||||||||||
Merlin Properties Socimi SA, Sr. Unsec’d. | 2.375 | 05/23/22 | EUR | 100 | 124,545 | |||||||||||
NH Hotel Group SA, Sr. Sec’d. Notes | 3.750 | 10/01/23 | EUR | 100 | 123,372 | |||||||||||
|
| |||||||||||||||
| 247,917 | ||||||||||||||||
United Kingdom 4.8% | ||||||||||||||||
Arrow Global Finance PLC, | 5.125 | 09/15/24 | GBP | 100 | 137,808 | |||||||||||
Barclays PLC, Sub. Notes, EMTN | 2.625 | 11/11/25 | EUR | 150 | 181,948 | |||||||||||
CPUK Finance Ltd., Sec’d. Notes, 144A | 4.250 | 08/28/47 | GBP | 100 | 135,936 | |||||||||||
EI Group PLC, First Mortgage | 6.375 | 02/15/22 | GBP | 100 | 142,459 | |||||||||||
FCE Bank PLC, Sr. Unsec’d. | 1.615 | 05/11/23 | EUR | 150 | 183,088 | |||||||||||
Royal Bank of Scotland Group PLC, | 2.000 | 03/08/23 | EUR | 100 | 122,321 | |||||||||||
Tesco PLC, Sr. Unsec’d. Notes, EMTN | 5.000 | 03/24/23 | GBP | 80 | 119,992 | |||||||||||
Virgin Media Secured Finance PLC, | 5.500 | 01/15/25 | GBP | 90 | 125,875 | |||||||||||
William Hill PLC, Gtd. Notes | 4.875 | 09/07/23 | GBP | 100 | 138,525 | |||||||||||
|
| |||||||||||||||
| 1,287,952 | ||||||||||||||||
United States 10.2% | ||||||||||||||||
Adient Global Holdings Ltd., Gtd. Notes | 3.500 | 08/15/24 | EUR | 100 | 122,979 | |||||||||||
American International Group, Inc., Sr. Unsec’d. Notes | 1.875 | 06/21/27 | EUR | 100 | 119,082 | |||||||||||
Ball Corp., Gtd. Notes | 4.375 | 12/15/23 | EUR | 100 | 133,637 | |||||||||||
Becton, Dickinson and Co., Sr. Unsec’d. Notes | 0.368 | 06/06/19 | EUR | 100 | 117,344 | |||||||||||
Belden, Inc., Gtd. Notes | 4.125 | 10/15/26 | EUR | 100 | 125,396 | |||||||||||
Catalent Pharma Solutions, Inc., Gtd. Notes | 4.750 | 12/15/24 | EUR | 100 | 125,699 | |||||||||||
Discovery Communications LLC, Gtd. Notes | 2.500 | 09/20/24 | GBP | 100 | 130,235 | |||||||||||
Fidelity National Information Services, Inc., | 1.100 | 07/15/24 | EUR | 100 | 116,929 | |||||||||||
Hanesbrands Finance Luxembourg SCA, Gtd. Notes | 3.500 | 06/15/24 | EUR | 100 | 125,792 | |||||||||||
International Game Technology PLC, Sr. Sec’d. Notes | 4.750 | 02/15/23 | EUR | 100 | 131,337 | |||||||||||
Kraft Heinz Foods Co., Gtd. Notes | 2.250 | 05/25/28 | EUR | 100 | 121,314 | |||||||||||
LKQ Italia Bondco SpA, Gtd. Notes | 3.875 | 04/01/24 | EUR | 100 | 128,772 | |||||||||||
Morgan Stanley, Sr. Unsec’d. Notes, GMTN | 1.000 | 12/02/22 | EUR | 200 | 238,920 | |||||||||||
PVH Corp., Sr. Unsec’d. Notes | 3.625 | 07/15/24 | EUR | 100 | 128,761 | |||||||||||
See Notes to Financial Statements.
| Prudential International Bond Fund | 19 |
Schedule of Investments (continued)
as of October 31, 2017
| Description | Interest Rate | Maturity Date | Principal Amount (000)# | Value | ||||||||||||
CORPORATE BONDS (Continued) |
| |||||||||||||||
United States (cont’d.) | ||||||||||||||||
Quintiles IMS, Inc., Gtd. Notes | 3.500 | % | 10/15/24 | EUR | 100 | $ | 122,474 | |||||||||
Spectrum Brands, Inc., Gtd. Notes | 4.000 | 10/01/26 | EUR | 100 | 123,456 | |||||||||||
Thermo Fisher Scientific, Inc., Sr. Unsec’d. Notes | 1.400 | 01/23/26 | EUR | 100 | 118,243 | |||||||||||
VWR Funding, Inc., Gtd. Notes | 4.625 | 04/15/22 | EUR | 100 | 121,197 | |||||||||||
Xylem, Inc., Sr. Unsec’d. Notes | 2.250 | 03/11/23 | EUR | 100 | 125,268 | |||||||||||
Zimmer Biomet Holdings, Inc., | ||||||||||||||||
Sr. Unsec’d. Notes | 1.414 | 12/13/22 | EUR | 100 | 120,692 | |||||||||||
Sr. Unsec’d. Notes | 2.425 | 12/13/26 | EUR | 100 | 124,650 | |||||||||||
|
| |||||||||||||||
| 2,722,177 | ||||||||||||||||
|
| |||||||||||||||
TOTAL CORPORATE BONDS | 7,413,840 | |||||||||||||||
|
| |||||||||||||||
FOREIGN GOVERNMENT BONDS 52.7% | ||||||||||||||||
Argentina 0.9% | ||||||||||||||||
Argentine Republic Government International Bond, | ||||||||||||||||
Sr. Unsec’d. Notes | 3.875 | 01/15/22 | EUR | 100 | 120,399 | |||||||||||
Unsec’d. Notes | 5.000 | 01/15/27 | EUR | 100 | 117,504 | |||||||||||
|
| |||||||||||||||
| 237,903 | ||||||||||||||||
Australia 0.1% | ||||||||||||||||
Australia Government Bond, | 3.000 | 03/21/47 | AUD | 50 | 35,110 | |||||||||||
Belgium 5.2% | ||||||||||||||||
Kingdom of Belgium Government Bond, Unsec’d. Notes | 4.000 | 03/28/22 | EUR | 1,000 | 1,390,850 | |||||||||||
Brazil 1.4% | ||||||||||||||||
Brazilian Government International Bond, | 2.875 | 04/01/21 | EUR | 300 | 373,043 | |||||||||||
Bulgaria 1.3% | ||||||||||||||||
Bulgaria Government International Bond, | 2.950 | 09/03/24 | EUR | 260 | 347,533 | |||||||||||
Canada 0.7% | ||||||||||||||||
Province of British Columbia, Unsec’d. Notes | 7.875 | 11/30/23 | CAD | 200 | 200,148 | |||||||||||
Colombia 1.0% |
| |||||||||||||||
Colombia Government International Bond, | 3.875 | 03/22/26 | EUR | 200 | 269,638 | |||||||||||
See Notes to Financial Statements.
| 20 |
| Description | Interest Rate | Maturity Date | Principal Amount (000)# | Value | ||||||||||||
FOREIGN GOVERNMENT BONDS (Continued) | ||||||||||||||||
Cyprus 2.4% |
| |||||||||||||||
Cyprus Government International Bond, | 3.750 | % | 07/26/23 | EUR | 485 | $ | 650,027 | |||||||||
France 4.5% |
| |||||||||||||||
French Republic Government Bond OAT, Bonds | 3.000 | 04/25/22 | EUR | 900 | 1,205,292 | |||||||||||
Greece 3.2% |
| |||||||||||||||
Hellenic Republic Government Bond, | ||||||||||||||||
Bonds | 3.000 | (cc) | 02/24/23 | EUR | 50 | 55,183 | ||||||||||
Bonds | 3.000 | (cc) | 02/24/24 | EUR | 125 | 135,310 | ||||||||||
Bonds | 3.000 | (cc) | 02/24/25 | EUR | 85 | 90,610 | ||||||||||
Bonds | 3.000 | (cc) | 02/24/26 | EUR | 45 | 47,176 | ||||||||||
Bonds | 3.000 | (cc) | 02/24/27 | EUR | 195 | 200,774 | ||||||||||
Bonds | 3.000 | (cc) | 02/24/28 | EUR | 60 | 59,948 | ||||||||||
Bonds | 3.000 | (cc) | 02/24/29 | EUR | 50 | 48,802 | ||||||||||
Bonds | 3.000 | (cc) | 02/24/31 | EUR | 140 | 131,734 | ||||||||||
Bonds | - | (p) | 10/15/42 | EUR | 4,155 | 16,940 | ||||||||||
Sr. Unsec’d. Notes, 144A | 4.375 | 08/01/22 | EUR | 60 | 69,768 | |||||||||||
|
| |||||||||||||||
| 856,245 | ||||||||||||||||
Hungary 0.4% |
| |||||||||||||||
Hungary Government International Bond, | 5.750 | 06/11/18 | EUR | 100 | 120,562 | |||||||||||
Indonesia 1.6% |
| |||||||||||||||
Indonesia Government International Bond, | ||||||||||||||||
Sr. Unsec’d. Notes, 144A, MTN | 2.150 | 07/18/24 | EUR | 140 | 168,705 | |||||||||||
Sr. Unsec’d. Notes, MTN | 3.750 | 06/14/28 | EUR | 200 | 263,932 | |||||||||||
|
| |||||||||||||||
| 432,637 | ||||||||||||||||
Ireland 0.8% |
| |||||||||||||||
Ireland Government Bond, Bonds | 2.400 | 05/15/30 | EUR | 150 | 202,436 | |||||||||||
Israel 0.4% |
| |||||||||||||||
Israel Government International Bond, Sr. Unsec’d. Notes, EMTN | 1.500 | 01/18/27 | EUR | 100 | 119,252 | |||||||||||
Italy 6.9% |
| |||||||||||||||
Italy Buoni Poliennali del Tesoro, | ||||||||||||||||
Bonds | 2.050 | 08/01/27 | EUR | 140 | 166,471 | |||||||||||
Bonds | 3.750 | 09/01/24 | EUR | 640 | 868,959 | |||||||||||
See Notes to Financial Statements.
| Prudential International Bond Fund | 21 |
Schedule of Investments (continued)
as of October 31, 2017
| Description | Interest Rate | Maturity Date | Principal Amount (000)# | Value | ||||||||||||
FOREIGN GOVERNMENT BONDS (Continued) | ||||||||||||||||
Italy (cont’d.) | ||||||||||||||||
Italy Buoni Poliennali del Tesoro, (cont’d.) | ||||||||||||||||
Bonds | 4.500 | % | 03/01/26 | EUR | 455 | $ | 653,053 | |||||||||
Bonds, TIPS | 1.650 | 04/23/20 | EUR | 130 | 160,768 | |||||||||||
|
| |||||||||||||||
| 1,849,251 | ||||||||||||||||
Mexico 1.0% |
| |||||||||||||||
Mexico Government International Bond, | 2.750 | 04/22/23 | EUR | 200 | 254,776 | |||||||||||
Norway 1.0% | ||||||||||||||||
Kommunalbanken AS, Sr. Unsec’d. Notes, EMTN | 5.320 | 03/05/18 | NZD | 400 | 276,104 | |||||||||||
Peru 1.1% | ||||||||||||||||
Peruvian Government International Bond, | 3.750 | 03/01/30 | EUR | 200 | 281,917 | |||||||||||
Portugal 3.6% | ||||||||||||||||
Portugal Obrigacoes do Tesouro OT, | ||||||||||||||||
Sr. Unsec’d. Notes, 144A | 3.875 | 02/15/30 | EUR | 300 | 396,348 | |||||||||||
Sr. Unsec’d. Notes, 144A | 5.650 | 02/15/24 | EUR | 390 | 574,211 | |||||||||||
|
| |||||||||||||||
| 970,559 | ||||||||||||||||
Romania 0.9% | ||||||||||||||||
Romanian Government International Bond, | ||||||||||||||||
Sr. Unsec’d. Notes, 144A, MTN | 2.375 | 04/19/27 | EUR | 100 | 118,326 | |||||||||||
Sr. Unsec’d. Notes, MTN | 3.875 | 10/29/35 | EUR | 100 | 125,765 | |||||||||||
|
| |||||||||||||||
| 244,091 | ||||||||||||||||
South Korea 1.4% | ||||||||||||||||
Export-import Bank of Korea, | ||||||||||||||||
Sr. Unsec’d. Notes, EMTN | 2.000 | 04/30/20 | EUR | 100 | 121,755 | |||||||||||
Sr. Unsec’d. Notes, EMTN^ | 4.460 | 09/26/19 | NZD | 200 | 139,604 | |||||||||||
Sr. Unsec’d. Notes, MTN | 3.500 | 07/28/21 | NZD | 150 | 102,520 | |||||||||||
|
| |||||||||||||||
| 363,879 | ||||||||||||||||
Spain 6.5% | ||||||||||||||||
Instituto de Credito Oficial, Gov’t. Gtd. | 5.000 | 03/31/20 | CAD | 160 | 131,319 | |||||||||||
Spain Government Bond, | ||||||||||||||||
Sr. Unsec’d. Notes, 144A | 1.450 | 10/31/27 | EUR | 265 | 308,431 | |||||||||||
Sr. Unsec’d. Notes, 144A | 4.650 | 07/30/25 | EUR | 870 | 1,290,923 | |||||||||||
|
| |||||||||||||||
| 1,730,673 | ||||||||||||||||
See Notes to Financial Statements.
| 22 |
| Description | Interest Rate | Maturity Date | Principal Amount (000)# | Value | ||||||||||||
FOREIGN GOVERNMENT BONDS (Continued) | ||||||||||||||||
Turkey 0.8% | ||||||||||||||||
Turkey Government Bond, Bonds | 9.000 | % | 07/24/24 | TRY | 90 | $ | 20,973 | |||||||||
Turkey Government International Bond, | 4.125 | 04/11/23 | EUR | 155 | 194,118 | |||||||||||
|
| |||||||||||||||
| 215,091 | ||||||||||||||||
United Kingdom 5.5% | ||||||||||||||||
United Kingdom Gilt, Bonds(k) | 4.250 | 03/07/36 | GBP | 800 | 1,464,249 | |||||||||||
United States 0.1% | ||||||||||||||||
Indonesia Government AID Bond, Gov’t. Gtd. Notes | 8.900 | 06/01/21 | 20 | 23,146 | ||||||||||||
|
| |||||||||||||||
TOTAL FOREIGN GOVERNMENT BONDS | 14,114,412 | |||||||||||||||
|
| |||||||||||||||
RESIDENTIAL MORTGAGE-BACKED SECURITIES 3.8% | ||||||||||||||||
Alba PLC (United Kingdom), Series 2007-1, Class B | 0.573 | (cc) | 03/17/39 | GBP | 88 | 107,804 | ||||||||||
Newgate Funding (United Kingdom), | ||||||||||||||||
Series 2006-2, Class M | 0.556 | (cc) | 12/01/50 | GBP | 164 | 204,527 | ||||||||||
Series 2007-2X, Class A3 | 0.487 | (cc) | 12/15/50 | GBP | 100 | 121,934 | ||||||||||
Paragon Mortgages PLC (United Kingdom), | ||||||||||||||||
Series 10X, Class B1A | 0.867 | (cc) | 06/15/41 | GBP | 111 | 137,809 | ||||||||||
Series 12X, Class B1A | 0.760 | (cc) | 11/15/38 | GBP | 100 | 124,647 | ||||||||||
Series 12X, Class B1B 3 Month EURIBOR + 0.480% | 0.151 | (c) | 11/15/38 | EUR | 100 | 108,988 | ||||||||||
Ripon (United Kingdom), Series 2017-1A, Class B1 | 1.482 | (cc) | 08/20/56 | GBP | 100 | 132,663 | ||||||||||
RMAC Securities PLC (United Kingdom), | 0.000 | (cc) | 06/12/44 | EUR | 69 | 74,974 | ||||||||||
|
| |||||||||||||||
TOTAL RESIDENTIAL MORTGAGE-BACKED SECURITIES | 1,013,346 | |||||||||||||||
|
| |||||||||||||||
TOTAL LONG-TERM INVESTMENTS | 25,565,597 | |||||||||||||||
|
| |||||||||||||||
See Notes to Financial Statements.
| Prudential International Bond Fund | 23 |
Schedule of Investments (continued)
as of October 31, 2017
| Description | Shares | Value | ||||||||||||||
SHORT-TERM INVESTMENTS 1.0% | ||||||||||||||||
AFFILIATED MUTUAL FUND 0.8% | ||||||||||||||||
Prudential Investment Portfolios 2 - Prudential Core Ultra | 212,885 | $ | 212,885 | |||||||||||||
|
| |||||||||||||||
TOTAL OPTIONS PURCHASED* 0.2% | 54,191 | |||||||||||||||
|
| |||||||||||||||
TOTAL SHORT-TERM INVESTMENTS | 267,076 | |||||||||||||||
|
| |||||||||||||||
TOTAL INVESTMENTS, BEFORE OPTIONS WRITTEN 96.5% |
| 25,832,673 | ||||||||||||||
|
| |||||||||||||||
TOTAL OPTIONS WRITTEN* (0.3)% |
| (92,860 | ) | |||||||||||||
|
| |||||||||||||||
TOTAL INVESTMENTS, NET OF OPTIONS WRITTEN 96.2% |
| 25,739,813 | ||||||||||||||
Other assets in excess of liabilities(z) 3.8% | 1,027,250 | |||||||||||||||
|
| |||||||||||||||
NET ASSETS 100.0% |
| $ | 26,767,063 | |||||||||||||
|
| |||||||||||||||
The following abbreviations are used in the annual report:
A—Annual payment frequency for swaps
D—Daily payment frequency for swaps
Q—Quarterly payment frequency for swaps
S—Semiannual payment frequency for swaps
T—Swap payment upon termination
144A—Security was purchased pursuant to Rule 144A under the Securities Act of 1933 and may not be resold subject to that rule except to qualified institutional buyers. Unless otherwise noted, 144A securities are deemed to be liquid.
BBSW—Australian Bank Bill Swap Reference Rate
BROIS—Brazil Overnight Interbank Deposit
BUBOR—Budapest Interbank Offered Rate
CDX—Credit Derivative Index
CLO—Collateralized Loan Obligation
EMTN—Euro Medium Term Note
EONIA—Euro Overnight Index Average
EURIBOR—Euro Interbank Offered Rate
GMTN—Global Medium Term Note
HICP—Harmonized Index of Consumer Prices
iTraxx—International Credit Derivative Index
JIBAR—Johannesburg Interbank Agreed Rate
KWCDC—Korean Won Certificate of Deposit
LIBOR—London Interbank Offered Rate
MTN—Medium Term Note
OAT—Obligations Assimiilables du Tresor (French Treasury Bond)
See Notes to Financial Statements.
| 24 |
OTC—Over-the-counter
PIK—Payment-in-Kind
STIBOR—Stockholm Interbank Offered Rate
TELBOR—Tel Aviv Interbank Offered Rate
TIPS—Treasury Inflation-Protected Securities
USOIS—United States Overnight Index Swap
WIBOR—Warsaw Interbank Offered Rate
ARS—Argentine Peso
AUD—Australian Dollar
BRL—Brazilian Real
CAD—Canadian Dollar
CHF—Swiss Franc
CLP—Chilean Peso
CNH—Chinese Renminbi (offshore)
COP—Colombian Peso
CZK—Czech Koruna
EUR—Euro
GBP—British Pound
HUF—Hungarian Forint
IDR—Indonesian Rupiah
ILS—Israeli Shekel
INR—Indian Rupee
JPY—Japanese Yen
KRW—South Korean Won
MXN—Mexican Peso
NOK—Norwegian Krone
NZD—New Zealand Dollar
PEN—Peruvian Nuevo Sol
PHP—Philippine Peso
PLN—Polish Zloty
RUB—Russian Ruble
SEK—Swedish Krona
SGD—Singapore Dollar
THB—Thai Baht
TRY—Turkish Lira
TWD—New Taiwanese Dollar
USD—United States Dollar
ZAR—South African Rand
| * | Non-income producing security. |
| # | Principal or notional amount is shown in U.S. dollars unless otherwise stated. |
| ^ | Indicates a Level 3 security. The aggregate value of Level 3 securities is $722,029 and 2.7% of net assets. |
| (c) | Variable rate instrument. The interest rate shown reflects the rate in effect at October 31, 2017. |
| (cc) | Variable rate instrument. The rate shown is based on the latest available information as of October 31, 2017. Certain variable rate securities are not based on a published reference rate and spread but are determined by the issuer or agent and are based on current market conditions. These securities do not indicate a reference rate and spread in their description. |
See Notes to Financial Statements.
| Prudential International Bond Fund | 25 |
Schedule of Investments (continued)
as of October 31, 2017
| (k) | Represents security, or a portion thereof, segregated as collateral for centrally cleared/exchange-traded derivatives. |
| (p) | Interest rate not available as of October 31, 2017. |
| (s) | Represents zero coupon bond or principal only securities. Rate represents yield to maturity at purchase date. |
| (w) | PGIM Investments LLC, the manager of the Fund, also serves as manager of the Prudential Investment Portfolios 2 - Prudential Core Ultra Short Bond Fund. |
| (z) | Includes net unrealized appreciation (depreciation) on the following derivative contracts held at reporting period end, with the exception of options which are included in total investments, net of options written, at market value: |
OTC Options Purchased:
Description | Call/ | Counterparty | Expiration Date | Strike Price | Contracts | Notional Amount (000)# | Value | |||||||||||||||||
Currency Option | Call | Citigroup Global Markets | 04/04/18 | 3.40 | — | EUR | 100 | $ | 15,604 | |||||||||||||||
Currency Option | Call | BNP Paribas | 02/26/18 | 6.00 | — | EUR | 500 | 653 | ||||||||||||||||
Currency Option | Call | BNP Paribas | 11/28/17 | 22.00 | — | EUR | 400 | 9 | ||||||||||||||||
Currency Option | Call | BNP Paribas | 02/26/18 | 5.50 | — | 1,000 | 108 | |||||||||||||||||
Currency Option | Call | JPMorgan Chase | 09/26/18 | 4.75 | — | 750 | 3,843 | |||||||||||||||||
Currency Option | Call | Citigroup Global Markets | 03/23/18 | 19.25 | — | 300 | 11,887 | |||||||||||||||||
|
| |||||||||||||||||||||||
| $ | 32,104 | |||||||||||||||||||||||
|
| |||||||||||||||||||||||
OTC Options Written:
Description | Call/ | Counterparty | Expiration Date | Strike Price | Contracts | Notional Amount (000)# | Value | |||||||||||||||||
Currency Option | Call | Citigroup Global Markets | 04/04/18 | 3.80 | — | EUR | 100 | $ | (5,583 | ) | ||||||||||||||
Currency Option | Call | BNP Paribas | 04/26/19 | 6.00 | — | EUR | 500 | (23,133 | ) | |||||||||||||||
Currency Option | Call | BNP Paribas | 09/26/18 | 22.00 | — | EUR | 400 | (6,927 | ) | |||||||||||||||
Currency Option | Call | Morgan Stanley | 09/26/18 | 4.75 | — | 750 | (3,843 | ) | ||||||||||||||||
Currency Option | Call | Hong Kong & Shanghai Bank | 04/26/19 | 5.00 | — | 500 | (6,438 | ) | ||||||||||||||||
Currency Option | Call | Hong Kong & Shanghai Bank | 02/26/18 | 5.50 | — | 500 | (54 | ) | ||||||||||||||||
See Notes to Financial Statements.
| 26 |
OTC Options Written (continued):
Description | Call/ | Counterparty | Expiration Date | Strike Price | Contracts | Notional Amount (000)# | Value | |||||||||||||||||
Currency Option | Call | Citigroup Global Markets | 03/23/18 | 21.25 | — | 300 | $ | (3,160 | ) | |||||||||||||||
Currency Option | Put | Citigroup Global Markets | 04/04/18 | 3.20 | — | EUR | 100 | (21 | ) | |||||||||||||||
Currency Option | Put | Citigroup Global Markets | 03/23/18 | 17.75 | — | 300 | (702 | ) | ||||||||||||||||
|
| |||||||||||||||||||||||
| $ | (49,861 | ) | ||||||||||||||||||||||
|
| |||||||||||||||||||||||
OTC Swaptions Purchased:
Description | Call/ | Counterparty | Expiration Date | Strike Price | Receive | Pay | Notional Amount (000)# | Value | ||||||||||||||||
5 Year x 10 Year Interest Rate Swap, 04/17/2033 | Call | JPMorgan Chase | 04/12/18 | 1.80 | % | 1.80%(Q) | 3 Month LIBOR(Q) | 950 | $ | 510 | ||||||||||||||
5 Year x 10 Year Interest Rate Swap, 10/16/2033 | Call | JPMorgan Chase | 10/12/18 | 2.60 | % | 2.60%(Q) | 3 Month LIBOR(Q) | 950 | 15,279 | |||||||||||||||
iTraxx.FINSR.28.V1, 12/20/2022 | Call | Citigroup Global Markets | 11/15/17 | EUR | 50.00 | 1.00%(Q) | iTraxx.FINSR. | EUR | 10,000 | 5,153 | ||||||||||||||
iTraxx.FINSR.28.V1, 12/20/2022 | Put | Citigroup Global Markets | 11/15/17 | EUR | 67.50 | iTraxx.FINSR. 28.V1(Q) | 1.00%(Q) | EUR | 10,000 | 303 | ||||||||||||||
iTraxx.XO.28.V1, 12/20/2022 | Put | BNP Paribas | 12/20/17 | EUR | 400.00 | iTraxx.XO. 28.V1(Q) | 5.00%(Q) | EUR | 3,000 | 842 | ||||||||||||||
|
| |||||||||||||||||||||||
| $ | 22,087 | |||||||||||||||||||||||
|
| |||||||||||||||||||||||
OTC Swaptions Written:
Description | Call/ | Counterparty | Expiration Date | Strike Price | Receive | Pay | Notional Amount (000)# | Value | ||||||||||||||||
5 Year x 10 Year Interest Rate Swap, 10/16/2033 | Call | JPMorgan Chase | 10/12/18 | 2.30 | % | 3 Month LIBOR(Q) | 2.30%(Q) | 950 | $ | (8,257 | ) | |||||||||||||
5 Year x 10 Year Interest Rate Swap, 10/16/2033 | Call | JPMorgan Chase | 10/12/18 | 2.10 | % | 3 Month LIBOR(Q) | 2.10%(Q) | 950 | (5,284 | ) | ||||||||||||||
See Notes to Financial Statements.
| Prudential International Bond Fund | 27 |
Schedule of Investments (continued)
as of October 31, 2017
OTC Swaptions Written (continued):
Description | Call/ | Counter | Expiration Date | Strike Price | Receive | Pay | Notional Amount (000)# | Value | ||||||||||||||||
iTraxx.FINSR.28.V1, 12/20/2022 | Call | Citigroup Global Markets | 11/15/17 | | EUR 55.00 |
| iTraxx.FINSR.28.V1(Q) | 1.00%(Q) | | EUR 10,000 |
| $ | (23,735 | ) | ||||||||||
iTraxx.FINSR.28.V1, 12/20/2022 | Put | Citigroup Global Markets | 11/15/17 | | EUR 90.00 |
| 1.00%(Q) | iTraxx.FINSR.28.V1(Q) | | EUR 10,000 |
| (7 | ) | |||||||||||
iTraxx.XO.28.V1, 12/20/2022 | Put | BNP Paribas | 03/21/18 | | EUR 400.00 |
| 5.00%(S) | iTraxx.XO.28.V1(Q) | | EUR 3,000 |
| (5,716 | ) | |||||||||||
|
| |||||||||||||||||||||||
| $ | (42,999 | ) | ||||||||||||||||||||||
|
| |||||||||||||||||||||||
Futures contracts outstanding at October 31, 2017:
| Number of Contracts | Type | Expiration Date | Value at Trade Date | Current Notional Amount | Value / Unrealized Appreciation (Depreciation) | |||||||||||||||
Long Positions: | ||||||||||||||||||||
| 28 | 5 Year U.S. Treasury Notes | Dec. 2017 | $ | 3,278,625 | $ | 3,281,250 | $ | 2,625 | ||||||||||||
| 7 | 10 Year Australian Treasury Bonds | Dec. 2017 | 5,277,228 | 5,283,200 | 5,972 | |||||||||||||||
| 2 | 10 Year Japanese Bonds | Dec. 2017 | 2,644,914 | 2,646,673 | 1,759 | |||||||||||||||
| 3 | 10 Year U.K. Gilt | Dec. 2017 | 494,628 | 495,385 | 757 | |||||||||||||||
| 42 | 10 Year U.S. Treasury Notes | Dec. 2017 | 5,236,280 | 5,247,375 | 11,095 | |||||||||||||||
| 1 | 10 Year U.S. Ultra Treasury Notes | Dec. 2017 | 133,516 | 133,922 | 406 | |||||||||||||||
| 2 | 30 Year Euro Buxl | Dec. 2017 | 379,275 | 387,010 | 7,735 | |||||||||||||||
| 11 | 30 Year U.S. Ultra Treasury Bonds | Dec. 2017 | 1,798,214 | 1,812,594 | 14,380 | |||||||||||||||
| 3 | Euro-BTP Italian Government Bond | Dec. 2017 | 477,495 | 487,804 | 10,309 | |||||||||||||||
|
| |||||||||||||||||||
| 55,038 | ||||||||||||||||||||
|
| |||||||||||||||||||
Short Positions: | ||||||||||||||||||||
| 16 | 2 Year U.S. Treasury Notes | Dec. 2017 | 3,446,163 | 3,445,750 | 413 | |||||||||||||||
| 27 | 5 Year Euro-Bobl | Dec. 2017 | 4,126,992 | 4,144,604 | (17,612 | ) | ||||||||||||||
| 11 | 10 Year Euro-Bund | Dec. 2017 | 2,065,721 | 2,085,372 | (19,651 | ) | ||||||||||||||
| 7 | 20 Year U.S. Treasury Bonds | Dec. 2017 | 1,061,812 | 1,067,281 | (5,469 | ) | ||||||||||||||
| 89 | Euro Schatz DUA Index | Dec. 2017 | 11,628,844 | 11,638,693 | (9,849 | ) | ||||||||||||||
|
| |||||||||||||||||||
| (52,168 | ) | |||||||||||||||||||
|
| |||||||||||||||||||
| $ | 2,870 | |||||||||||||||||||
|
| |||||||||||||||||||
Cash and foreign currency of $340,039 has been segregated with JPMorgan Chase to cover requirements for open futures contracts at October 31, 2017.
See Notes to Financial Statements.
| 28 |
Forward foreign currency exchange contracts outstanding at October 31, 2017:
Purchase Contracts | Counterparty | Notional Amount (000) | Value at Settlement Date | Current Value | Unrealized Appreciation (Depreciation) | |||||||||||||
OTC forward foreign currency exchange contracts: |
| |||||||||||||||||
Argentine Peso, |
| |||||||||||||||||
Expiring 11/21/17 | Citigroup Global Markets | ARS | 2,616 | $ | 147,479 | $ | 146,156 | $ | (1,323 | ) | ||||||||
Australian Dollar, |
| |||||||||||||||||
Expiring 01/12/18 | Barclays Capital Group | AUD | 49 | 38,800 | 37,706 | (1,094 | ) | |||||||||||
Expiring 01/12/18 | Barclays Capital Group | AUD | 50 | 38,925 | 38,111 | (814 | ) | |||||||||||
Expiring 01/12/18 | Barclays Capital Group | AUD | 132 | 104,200 | 101,152 | (3,048 | ) | |||||||||||
Expiring 01/12/18 | Citigroup Global Markets | AUD | 50 | 38,925 | 38,086 | (839 | ) | |||||||||||
Expiring 01/12/18 | JPMorgan Chase | AUD | 51 | 39,934 | 38,878 | (1,056 | ) | |||||||||||
Expiring 01/12/18 | UBS AG | AUD | 49 | 38,800 | 37,654 | (1,146 | ) | |||||||||||
Expiring 01/12/18 | UBS AG | AUD | 51 | 39,934 | 38,779 | (1,155 | ) | |||||||||||
Expiring 01/12/18 | UBS AG | AUD | 54 | 42,600 | 41,383 | (1,217 | ) | |||||||||||
Expiring 04/27/18 | Citigroup Global Markets | AUD | 33 | 25,584 | 25,173 | (411 | ) | |||||||||||
Brazilian Real, |
| |||||||||||||||||
Expiring 11/03/17 | Barclays Capital Group | BRL | 218 | 66,497 | 66,584 | 87 | ||||||||||||
Expiring 11/03/17 | Citigroup Global Markets | BRL | 99 | 30,102 | 30,141 | 39 | ||||||||||||
Expiring 11/03/17 | Citigroup Global Markets | BRL | 33 | 10,614 | 10,182 | (432 | ) | |||||||||||
Expiring 11/03/17 | Citigroup Global Markets | BRL | 148 | 46,346 | 45,221 | (1,125 | ) | |||||||||||
Expiring 11/03/17 | Citigroup Global Markets | BRL | 215 | 65,695 | 65,781 | 86 | ||||||||||||
Expiring 11/03/17 | Citigroup Global Markets | BRL | 287 | 87,600 | 87,714 | 114 | ||||||||||||
Expiring 11/03/17 | Citigroup Global Markets | BRL | 344 | 107,324 | 105,034 | (2,290 | ) | |||||||||||
Expiring 11/03/17 | UBS AG | BRL | 127 | 39,619 | 38,901 | (718 | ) | |||||||||||
Expiring 11/03/17 | UBS AG | BRL | 167 | 53,667 | 50,881 | (2,786 | ) | |||||||||||
Expiring 01/31/18 | Citigroup Global Markets | BRL | 23 | 7,000 | 6,970 | (30 | ) | |||||||||||
Expiring 02/02/18 | Citigroup Global Markets | BRL | 287 | 86,522 | 86,690 | 168 | ||||||||||||
Expiring 07/31/18 | UBS AG | BRL | 220 | 65,859 | 64,959 | (900 | ) | |||||||||||
Expiring 09/28/18 | JPMorgan Chase | BRL | 99 | 30,000 | 29,161 | (839 | ) | |||||||||||
Expiring 04/30/19 | JPMorgan Chase | BRL | 98 | 28,206 | 27,813 | (393 | ) | |||||||||||
| British Pound, | ||||||||||||||||||
Expiring 01/26/18 | Citigroup Global Markets | GBP | 72 | 95,700 | 96,335 | 635 | ||||||||||||
Expiring 01/26/18 | UBS AG | GBP | 22 | 29,000 | 29,007 | 7 | ||||||||||||
| Canadian Dollar, | ||||||||||||||||||
Expiring 01/12/18 | Barclays Capital Group | CAD | 50 | 39,943 | 38,635 | (1,308 | ) | |||||||||||
Expiring 01/12/18 | Barclays Capital Group | CAD | 50 | 39,943 | 38,697 | (1,246 | ) | |||||||||||
Expiring 01/12/18 | Citigroup Global Markets | CAD | 66 | 52,858 | 51,189 | (1,669 | ) | |||||||||||
Expiring 01/12/18 | JPMorgan Chase | CAD | 66 | 53,300 | 51,525 | (1,775 | ) | |||||||||||
Expiring 01/12/18 | UBS AG | CAD | 42 | 33,072 | 32,221 | (851 | ) | |||||||||||
| Colombian Peso, | ||||||||||||||||||
Expiring 12/18/17 | Citigroup Global Markets | COP | 106,671 | 36,099 | 34,904 | (1,195 | ) | |||||||||||
Expiring 12/18/17 | Citigroup Global Markets | COP | 196,115 | 66,892 | 64,171 | (2,721 | ) | |||||||||||
See Notes to Financial Statements.
| Prudential International Bond Fund | 29 |
Schedule of Investments (continued)
as of October 31, 2017
Forward foreign currency exchange contracts outstanding at October 31, 2017 (continued):
Purchase Contracts | Counterparty | Notional Amount (000) | Value at Settlement Date | Current Value | Unrealized Appreciation (Depreciation) | |||||||||||||
OTC forward foreign currency exchange contracts (cont’d): |
| |||||||||||||||||
| Czech Koruna, | ||||||||||||||||||
Expiring 01/08/18 | UBS AG | CZK | 2,151 | $ | 98,508 | $ | 98,115 | $ | (393 | ) | ||||||||
Expiring 01/08/18 | UBS AG | CZK | 2,151 | 98,538 | 98,115 | (423 | ) | |||||||||||
| Euro, | ||||||||||||||||||
Expiring 01/26/18 | Hong Kong & Shanghai Bank | EUR | 34 | 39,900 | 39,362 | (538 | ) | |||||||||||
Expiring 01/31/18 | Hong Kong & Shanghai Bank | EUR | 34 | 40,622 | 40,238 | (384 | ) | |||||||||||
Expiring 01/31/18 | UBS AG | EUR | 16 | 19,000 | 18,911 | (89 | ) | |||||||||||
Expiring 01/31/18 | UBS AG | EUR | 13 | 15,000 | 14,854 | (146 | ) | |||||||||||
Expiring 01/31/18 | UBS AG | EUR | 12 | 14,000 | 13,807 | (193 | ) | |||||||||||
| Hungarian Forint, | ||||||||||||||||||
Expiring 01/24/18 | Goldman Sachs & Co. | HUF | 55,498 | 213,076 | 208,553 | (4,523 | ) | |||||||||||
| Indian Rupee, | ||||||||||||||||||
Expiring 11/03/17 | Barclays Capital Group | INR | 2,870 | 44,000 | 44,288 | 288 | ||||||||||||
Expiring 11/03/17 | Citigroup Global Markets | INR | 21,320 | 331,853 | 329,030 | (2,823 | ) | |||||||||||
Expiring 11/03/17 | Citigroup Global Markets | INR | 1,248 | 19,000 | 19,256 | 256 | ||||||||||||
Expiring 11/03/17 | UBS AG | INR | 14,214 | 219,685 | 219,353 | (332 | ) | |||||||||||
Expiring 01/30/18 | Bank of America | INR | 11,175 | 170,466 | 170,571 | 105 | ||||||||||||
Expiring 01/30/18 | Citigroup Global Markets | INR | 7,891 | 120,110 | 120,452 | 342 | ||||||||||||
Expiring 01/30/18 | Morgan Stanley | INR | 11,175 | 169,844 | 170,571 | 727 | ||||||||||||
Indonesian Rupiah, | ||||||||||||||||||
Expiring 11/16/17 | Citigroup Global Markets | IDR | 532,233 | 40,339 | 39,190 | (1,149 | ) | |||||||||||
Expiring 11/16/17 | Citigroup Global Markets | IDR | 253,836 | 18,802 | 18,691 | (111 | ) | |||||||||||
Expiring 02/12/18 | Morgan Stanley | IDR | 3,093,994 | 226,118 | 225,832 | (286 | ) | |||||||||||
Japanese Yen, | ||||||||||||||||||
Expiring 01/26/18 | Barclays Capital Group | JPY | 10,912 | 96,900 | 96,411 | (489 | ) | |||||||||||
Expiring 01/26/18 | UBS AG | JPY | 10,554 | 93,045 | 93,252 | 207 | ||||||||||||
Mexican Peso, | ||||||||||||||||||
Expiring 11/10/17 | Citigroup Global Markets | MXN | 5,253 | 289,664 | 273,491 | (16,173 | ) | |||||||||||
Expiring 11/10/17 | JPMorgan Chase | MXN | 475 | 26,600 | 24,733 | (1,867 | ) | |||||||||||
Expiring 03/27/18 | Citigroup Global Markets | MXN | 2,387 | 120,000 | 121,429 | 1,429 | ||||||||||||
New Taiwanese Dollar, | ||||||||||||||||||
Expiring 11/08/17 | Barclays Capital Group | TWD | 1,731 | 57,000 | 57,419 | 419 | ||||||||||||
Expiring 11/08/17 | Barclays Capital Group | TWD | 3,426 | 113,000 | 113,624 | 624 | ||||||||||||
Expiring 11/08/17 | Citigroup Global Markets | TWD | 603 | 20,000 | 20,001 | 1 | ||||||||||||
Expiring 11/08/17 | Citigroup Global Markets | TWD | 815 | 27,000 | 27,046 | 46 | ||||||||||||
Expiring 11/08/17 | Citigroup Global Markets | TWD | 1,581 | 53,200 | 52,444 | (756 | ) | |||||||||||
Expiring 11/08/17 | UBS AG | TWD | 1,886 | 62,000 | 62,565 | 565 | ||||||||||||
See Notes to Financial Statements.
| 30 |
Forward foreign currency exchange contracts outstanding at October 31, 2017 (continued):
Purchase Contracts | Counterparty | Notional Amount (000) | Value at Settlement Date | Current Value | Unrealized Appreciation (Depreciation) | |||||||||||||
OTC forward foreign currency exchange contracts (cont’d): |
| |||||||||||||||||
New Zealand Dollar, | ||||||||||||||||||
Expiring 01/12/18 | Barclays Capital Group | NZD | 37 | $ | 26,850 | $ | 25,612 | $ | (1,238 | ) | ||||||||
Expiring 01/12/18 | UBS AG | NZD | 28 | 19,000 | 18,978 | (22 | ) | |||||||||||
Expiring 01/12/18 | UBS AG | NZD | 37 | 26,851 | 25,543 | (1,308 | ) | |||||||||||
Expiring 01/12/18 | UBS AG | NZD | 82 | 55,800 | 55,850 | 50 | ||||||||||||
Expiring 01/12/18 | UBS AG | NZD | 115 | 79,744 | 78,383 | (1,361 | ) | |||||||||||
Norwegian Krone, | ||||||||||||||||||
Expiring 01/24/18 | Citigroup Global Markets | NOK | 571 | 71,894 | 70,079 | (1,815 | ) | |||||||||||
Philippine Peso, | ||||||||||||||||||
Expiring 12/15/17 | Citigroup Global Markets | PHP | 2,247 | 43,774 | 43,390 | (384 | ) | |||||||||||
Expiring 12/15/17 | UBS AG | PHP | 2,041 | 40,104 | 39,418 | (686 | ) | |||||||||||
Expiring 12/15/17 | UBS AG | PHP | 4,094 | 79,000 | 79,079 | 79 | ||||||||||||
Expiring 01/25/18 | Citigroup Global Markets | PHP | 5,234 | 102,529 | 100,847 | (1,682 | ) | |||||||||||
Polish Zloty, | ||||||||||||||||||
Expiring 01/24/18 | Barclays Capital Group | PLN | 540 | 150,210 | 148,364 | (1,846 | ) | |||||||||||
Russian Ruble, | ||||||||||||||||||
Expiring 11/17/17 | Citigroup Global Markets | RUB | 1,979 | 32,763 | 33,744 | 981 | ||||||||||||
Expiring 11/17/17 | Citigroup Global Markets | RUB | 2,013 | 33,324 | 34,323 | 999 | ||||||||||||
Expiring 11/17/17 | Citigroup Global Markets | RUB | 2,015 | 33,324 | 34,353 | 1,029 | ||||||||||||
Expiring 01/12/18 | JPMorgan Chase | RUB | 18,396 | 312,317 | 310,568 | (1,749 | ) | |||||||||||
Singapore Dollar, | ||||||||||||||||||
Expiring 11/13/17 | Citigroup Global Markets | SGD | 40 | 30,000 | 29,493 | (507 | ) | |||||||||||
Expiring 11/13/17 | Citigroup Global Markets | SGD | 65 | 48,000 | 47,529 | (471 | ) | |||||||||||
Expiring 11/13/17 | Citigroup Global Markets | SGD | 104 | 77,000 | 76,122 | (878 | ) | |||||||||||
Expiring 11/13/17 | UBS AG | SGD | 95 | 70,725 | 69,694 | (1,031 | ) | |||||||||||
Expiring 11/13/17 | UBS AG | SGD | 95 | 70,725 | 69,703 | (1,022 | ) | |||||||||||
Expiring 11/13/17 | UBS AG | SGD | 165 | 122,300 | 121,192 | (1,108 | ) | |||||||||||
South African Rand, | ||||||||||||||||||
Expiring 12/15/17 | Citigroup Global Markets | ZAR | 2,216 | 160,700 | 155,489 | (5,211 | ) | |||||||||||
Expiring 01/31/18 | Citigroup Global Markets | ZAR | 171 | 12,000 | 11,898 | (102 | ) | |||||||||||
South Korean Won, | ||||||||||||||||||
Expiring 11/17/17 | JPMorgan Chase | KRW | 64,155 | 56,900 | 57,267 | 367 | ||||||||||||
Expiring 11/17/17 | UBS AG | KRW | 66,284 | 59,000 | 59,168 | 168 | ||||||||||||
Swedish Krona, | ||||||||||||||||||
Expiring 01/24/18 | Citigroup Global Markets | SEK | 776 | 92,980 | 93,208 | 228 | ||||||||||||
Expiring 01/24/18 | JPMorgan Chase | SEK | 622 | 76,743 | 74,734 | (2,009 | ) | |||||||||||
Thai Baht, | ||||||||||||||||||
Expiring 11/10/17 | Citigroup Global Markets | THB | 1,998 | 60,000 | 60,157 | 157 | ||||||||||||
Expiring 11/10/17 | Citigroup Global Markets | THB | 2,356 | 71,000 | 70,924 | (76 | ) | |||||||||||
See Notes to Financial Statements.
| Prudential International Bond Fund | 31 |
Schedule of Investments (continued)
as of October 31, 2017
Forward foreign currency exchange contracts outstanding at October 31, 2017 (continued):
Purchase Contracts | Counterparty | Notional Amount (000) | Value at Settlement Date | Current Value | Unrealized Appreciation (Depreciation) | |||||||||||||
OTC forward foreign currency exchange contracts (cont’d): |
| |||||||||||||||||
Turkish Lira, | ||||||||||||||||||
Expiring 12/15/17 | Hong Kong & Shanghai Bank | TRY | 870 | $ | 245,023 | $ | 226,205 | $ | (18,818 | ) | ||||||||
Expiring 01/31/18 | Citigroup Global Markets | TRY | 39 | 10,001 | 9,957 | (44 | ) | |||||||||||
|
|
|
|
|
| |||||||||||||
| $ | 6,954,890 | $ | 6,858,669 | $ | (96,221 | ) | ||||||||||||
|
|
|
|
|
| |||||||||||||
Sale Contracts | Counterparty | Notional Amount (000) | Value at Settlement Date | Current Value | Unrealized Appreciation (Depreciation) | |||||||||||||
OTC forward foreign currency exchange contracts: |
| |||||||||||||||||
Australian Dollar, |
| |||||||||||||||||
Expiring 01/12/18 | Barclays Capital Group | AUD | 69 | $ | 53,700 | $ | 52,540 | $ | 1,160 | |||||||||
Expiring 01/12/18 | Barclays Capital Group | AUD | 69 | 53,700 | 52,499 | 1,201 | ||||||||||||
Expiring 01/12/18 | Citigroup Global Markets | AUD | 191 | 148,337 | 145,808 | 2,529 | ||||||||||||
Expiring 01/12/18 | Citigroup Global Markets | AUD | 62 | 47,800 | 47,512 | 288 | ||||||||||||
Expiring 01/12/18 | Citigroup Global Markets | AUD | 55 | 43,000 | 42,038 | 962 | ||||||||||||
Expiring 01/12/18 | Citigroup Global Markets | AUD | 52 | 39,850 | 39,584 | 266 | ||||||||||||
Expiring 01/12/18 | Citigroup Global Markets | AUD | 51 | 39,686 | 39,151 | 535 | ||||||||||||
Expiring 01/12/18 | Citigroup Global Markets | AUD | 51 | 39,686 | 39,136 | 550 | ||||||||||||
Expiring 01/12/18 | Citigroup Global Markets | AUD | 48 | 37,550 | 36,975 | 575 | ||||||||||||
Expiring 01/12/18 | UBS AG | AUD | 102 | 79,325 | 77,827 | 1,498 | ||||||||||||
Expiring 01/12/18 | UBS AG | AUD | 52 | 39,850 | 39,581 | 269 | ||||||||||||
Expiring 01/12/18 | UBS AG | AUD | 22 | 17,000 | 17,003 | (3 | ) | |||||||||||
| Brazilian Real, | ||||||||||||||||||
Expiring 11/03/17 | Barclays Capital Group | BRL | 218 | 67,058 | 66,584 | 474 | ||||||||||||
Expiring 11/03/17 | Citigroup Global Markets | BRL | 344 | 104,898 | 105,034 | (136 | ) | |||||||||||
Expiring 11/03/17 | Citigroup Global Markets | BRL | 287 | 87,517 | 87,714 | (197 | ) | |||||||||||
Expiring 11/03/17 | Citigroup Global Markets | BRL | 215 | 66,988 | 65,781 | 1,207 | ||||||||||||
Expiring 11/03/17 | Citigroup Global Markets | BRL | 148 | 45,162 | 45,221 | (59 | ) | |||||||||||
Expiring 11/03/17 | Citigroup Global Markets | BRL | 99 | 31,000 | 30,141 | 859 | ||||||||||||
Expiring 11/03/17 | Citigroup Global Markets | BRL | 33 | 10,169 | 10,182 | (13 | ) | |||||||||||
Expiring 11/03/17 | UBS AG | BRL | 167 | 50,815 | 50,881 | (66 | ) | |||||||||||
Expiring 11/03/17 | UBS AG | BRL | 127 | 38,850 | 38,901 | (51 | ) | |||||||||||
Expiring 01/31/18 | UBS AG | BRL | 26 | 8,000 | 8,001 | (1 | ) | |||||||||||
Expiring 09/28/18 | Morgan Stanley | BRL | 314 | 90,000 | 92,037 | (2,037 | ) | |||||||||||
Expiring 04/30/19 | Hong Kong & Shanghai Bank | BRL | 211 | 58,000 | 59,767 | (1,767 | ) | |||||||||||
| British Pound, | ||||||||||||||||||
Expiring 01/26/18 | Citigroup Global Markets | GBP | 1,202 | 1,597,424 | 1,601,143 | (3,719 | ) | |||||||||||
Expiring 01/26/18 | UBS AG | GBP | 1,202 | 1,597,731 | 1,601,144 | (3,413 | ) | |||||||||||
Expiring 01/26/18 | UBS AG | GBP | 180 | 237,809 | 239,823 | (2,014 | ) | |||||||||||
See Notes to Financial Statements.
| 32 |
Forward foreign currency exchange contracts outstanding at October 31, 2017 (continued):
Sale Contracts | Counterparty | Notional Amount (000) | Value at Settlement Date | Current Value | Unrealized Appreciation (Depreciation) | |||||||||||||
OTC forward foreign currency exchange contracts (cont’d): |
| |||||||||||||||||
| Canadian Dollar, | ||||||||||||||||||
Expiring 01/12/18 | Barclays Capital Group | CAD | 130 | $ | 104,200 | $ | 100,978 | $ | 3,222 | |||||||||
Expiring 01/12/18 | Barclays Capital Group | CAD | 18 | 14,000 | 13,920 | 80 | ||||||||||||
Expiring 01/12/18 | Citigroup Global Markets | CAD | 64 | 51,450 | 50,019 | 1,431 | ||||||||||||
Expiring 01/12/18 | Citigroup Global Markets | CAD | 63 | 50,000 | 48,741 | 1,259 | ||||||||||||
Expiring 01/12/18 | Hong Kong & Shanghai Bank | CAD | 64 | 51,450 | 49,998 | 1,452 | ||||||||||||
Expiring 01/12/18 | JPMorgan Chase | CAD | 52 | 41,150 | 40,208 | 942 | ||||||||||||
Expiring 01/12/18 | JPMorgan Chase | CAD | 52 | 41,150 | 40,070 | 1,080 | ||||||||||||
Expiring 01/12/18 | UBS AG | CAD | 502 | 401,661 | 389,348 | 12,313 | ||||||||||||
Expiring 01/12/18 | UBS AG | CAD | 119 | 93,044 | 92,517 | 527 | ||||||||||||
Expiring 01/12/18 | UBS AG | CAD | 72 | 55,800 | 55,784 | 16 | ||||||||||||
Expiring 01/12/18 | UBS AG | CAD | 59 | 46,000 | 45,960 | 40 | ||||||||||||
Expiring 01/12/18 | UBS AG | CAD | 25 | 19,038 | 19,024 | 14 | ||||||||||||
| Chilean Peso, | ||||||||||||||||||
Expiring 01/17/18 | Barclays Capital Group | CLP | 21,427 | 34,000 | 33,630 | 370 | ||||||||||||
Expiring 01/17/18 | Citigroup Global Markets | CLP | 37,578 | 59,627 | 58,979 | 648 | ||||||||||||
| Chinese Renminbi, | ||||||||||||||||||
Expiring 01/26/18 | Citigroup Global Markets | CNH | 491 | 73,401 | 73,520 | (119 | ) | |||||||||||
| Colombian Peso, | ||||||||||||||||||
Expiring 12/18/17 | Barclays Capital Group | COP | 135,907 | 46,000 | 44,470 | 1,530 | ||||||||||||
Expiring 12/18/17 | Citigroup Global Markets | COP | 198,820 | 66,988 | 65,056 | 1,932 | ||||||||||||
| Czech Koruna, | ||||||||||||||||||
Expiring 01/08/18 | Citigroup Global Markets | CZK | 1,316 | 60,000 | 60,032 | (32 | ) | |||||||||||
| Euro, | ||||||||||||||||||
Expiring 01/26/18 | Citigroup Global Markets | EUR | 8,298 | 9,848,855 | 9,717,127 | 131,728 | ||||||||||||
Expiring 01/26/18 | Citigroup Global Markets | EUR | 80 | 92,980 | 93,477 | (497 | ) | |||||||||||
Expiring 01/26/18 | Citigroup Global Markets | EUR | 58 | 67,169 | 67,562 | (393 | ) | |||||||||||
Expiring 01/26/18 | Citigroup Global Markets | EUR | 58 | 67,325 | 67,562 | (237 | ) | |||||||||||
Expiring 01/26/18 | UBS AG | EUR | 8,298 | 9,851,312 | 9,717,128 | 134,184 | ||||||||||||
Expiring 01/26/18 | UBS AG | EUR | 101 | 117,818 | 117,841 | (23 | ) | |||||||||||
Expiring 01/26/18 | UBS AG | EUR | 24 | 28,000 | 28,164 | (164 | ) | |||||||||||
Expiring 01/31/18 | Citigroup Global Markets | EUR | 14 | 16,001 | 16,033 | (32 | ) | |||||||||||
| Indian Rupee, | ||||||||||||||||||
Expiring 11/03/17 | Bank of America | INR | 11,175 | 172,159 | 172,458 | (299 | ) | |||||||||||
Expiring 11/03/17 | Citigroup Global Markets | INR | 7,891 | 121,293 | 121,784 | (491 | ) | |||||||||||
Expiring 11/03/17 | Citigroup Global Markets | INR | 5,289 | 82,000 | 81,623 | 377 | ||||||||||||
Expiring 11/03/17 | Citigroup Global Markets | INR | 4,121 | 64,000 | 63,604 | 396 | ||||||||||||
Expiring 01/30/18 | Morgan Stanley | INR | 11,175 | 171,552 | 172,458 | (906 | ) | |||||||||||
See Notes to Financial Statements.
| Prudential International Bond Fund | 33 |
Schedule of Investments (continued)
as of October 31, 2017
Forward foreign currency exchange contracts outstanding at October 31, 2017 (continued):
Sale Contracts | Counterparty | Notional Amount (000) | Value at Settlement Date | Current Value | Unrealized Appreciation (Depreciation) | |||||||||||||
OTC forward foreign currency exchange contracts (cont’d): |
| |||||||||||||||||
| Israeli Shekel, | ||||||||||||||||||
Expiring 01/24/18 | Citigroup Global Markets | ILS | 296 | $ | 84,612 | $ | 84,346 | $ | 266 | |||||||||
Expiring 01/24/18 | Citigroup Global Markets | ILS | 234 | 67,059 | 66,737 | 322 | ||||||||||||
| Japanese Yen, | ||||||||||||||||||
Expiring 01/26/18 | Barclays Capital Group | JPY | 6,634 | 58,602 | 58,612 | (10 | ) | |||||||||||
Expiring 01/26/18 | Citigroup Global Markets | JPY | 34,749 | 306,561 | 307,023 | (462 | ) | |||||||||||
Expiring 01/26/18 | Citigroup Global Markets | JPY | 6,012 | 53,139 | 53,119 | 20 | ||||||||||||
Expiring 01/26/18 | UBS AG | JPY | 2,949 | 26,001 | 26,058 | (57 | ) | |||||||||||
Expiring 04/27/18 | Goldman Sachs & Co. | JPY | 4,863 | 43,136 | 43,186 | (50 | ) | |||||||||||
| Mexican Peso, | ||||||||||||||||||
Expiring 11/10/17 | Citigroup Global Markets | MXN | 599 | 33,335 | 31,199 | 2,136 | ||||||||||||
Expiring 11/10/17 | JPMorgan Chase | MXN | 705 | 37,000 | 36,725 | 275 | ||||||||||||
Expiring 11/10/17 | UBS AG | MXN | 405 | 21,000 | 21,102 | (102 | ) | |||||||||||
| New Taiwanese Dollar, | ||||||||||||||||||
Expiring 11/08/17 | Barclays Capital Group | TWD | 1,176 | 39,000 | 39,021 | (21 | ) | |||||||||||
Expiring 11/08/17 | Citigroup Global Markets | TWD | 10,283 | 340,734 | 341,091 | (357 | ) | |||||||||||
Expiring 11/08/17 | Citigroup Global Markets | TWD | 1,210 | 39,989 | 40,150 | (161 | ) | |||||||||||
Expiring 11/08/17 | UBS AG | TWD | 2,548 | 85,000 | 84,508 | 492 | ||||||||||||
| New Zealand Dollar, | ||||||||||||||||||
Expiring 01/12/18 | Barclays Capital Group | NZD | 686 | 485,709 | 469,096 | 16,613 | ||||||||||||
Expiring 01/12/18 | Citigroup Global Markets | NZD | 75 | 52,858 | 51,182 | 1,676 | ||||||||||||
Expiring 01/12/18 | JPMorgan Chase | NZD | 111 | 76,513 | 76,086 | 427 | ||||||||||||
Expiring 01/12/18 | JPMorgan Chase | NZD | 76 | 53,246 | 51,973 | 1,273 | ||||||||||||
Expiring 01/12/18 | JPMorgan Chase | NZD | 76 | 53,246 | 51,871 | 1,375 | ||||||||||||
Norwegian Krone, |
| |||||||||||||||||
Expiring 01/24/18 | Bank of America | NOK | 128 | 16,100 | 15,717 | 383 | ||||||||||||
Expiring 01/24/18 | Barclays Capital Group | NOK | 159 | 19,967 | 19,459 | 508 | ||||||||||||
Expiring 01/24/18 | UBS AG | NOK | 158 | 19,967 | 19,414 | 553 | ||||||||||||
Expiring 01/24/18 | UBS AG | NOK | 128 | 16,100 | 15,733 | 367 | ||||||||||||
Peruvian Nuevo Sol, |
| |||||||||||||||||
Expiring 01/12/18 | Citigroup Global Markets | PEN | 407 | 123,829 | 124,659 | (830 | ) | |||||||||||
Philippine Peso, |
| |||||||||||||||||
Expiring 12/15/17 | Barclays Capital Group | PHP | 3,793 | 74,000 | 73,250 | 750 | ||||||||||||
Expiring 12/15/17 | UBS AG | PHP | 4,638 | 90,000 | 89,585 | 415 | ||||||||||||
Polish Zloty, |
| |||||||||||||||||
Expiring 01/24/18 | Citigroup Global Markets | PLN | 245 | 66,996 | 67,354 | (358 | ) | |||||||||||
Russian Ruble, |
| |||||||||||||||||
Expiring 11/17/17 | Citigroup Global Markets | RUB | 1,857 | 32,000 | 31,661 | 339 | ||||||||||||
Expiring 01/12/18 | Barclays Capital Group | RUB | 7,480 | 127,611 | 126,277 | 1,334 | ||||||||||||
Expiring 01/12/18 | Barclays Capital Group | RUB | 3,801 | 64,225 | 64,177 | 48 | ||||||||||||
Expiring 01/12/18 | Barclays Capital Group | RUB | 3,785 | 64,225 | 63,894 | 331 | ||||||||||||
See Notes to Financial Statements.
| 34 |
Forward foreign currency exchange contracts outstanding at October 31, 2017 (continued):
Sale Contracts | Counterparty | Notional Amount (000) | Value at Settlement Date | Current Value | Unrealized Appreciation (Depreciation) | |||||||||||||
OTC forward foreign currency exchange contracts (cont’d): |
| |||||||||||||||||
Singapore Dollar, |
| |||||||||||||||||
Expiring 11/13/17 | Citigroup Global Markets | SGD | 166 | $ | 122,301 | $ | 121,619 | $ | 682 | |||||||||
Expiring 11/13/17 | Citigroup Global Markets | SGD | 139 | 102,001 | 101,829 | 172 | ||||||||||||
Expiring 11/13/17 | Morgan Stanley | SGD | 392 | 288,057 | 287,715 | 342 | ||||||||||||
Expiring 11/13/17 | UBS AG | SGD | 108 | 79,650 | 79,314 | 336 | ||||||||||||
Expiring 11/13/17 | UBS AG | SGD | 91 | 66,881 | 66,584 | 297 | ||||||||||||
South African Rand, |
| |||||||||||||||||
Expiring 12/15/17 | UBS AG | ZAR | 1,043 | 77,698 | 73,191 | 4,507 | ||||||||||||
Expiring 12/15/17 | UBS AG | ZAR | 1,043 | 77,698 | 73,191 | 4,507 | ||||||||||||
Expiring 01/31/18 | Bank of America | ZAR | 57 | 4,091 | 3,971 | 120 | ||||||||||||
Expiring 01/31/18 | UBS AG | ZAR | 158 | 11,000 | 11,027 | (27 | ) | |||||||||||
Expiring 01/31/18 | UBS AG | ZAR | 142 | 10,000 | 9,880 | 120 | ||||||||||||
South Korean Won, |
| |||||||||||||||||
Expiring 11/17/17 | Citigroup Global Markets | KRW | 63,638 | 56,000 | 56,807 | (807 | ) | |||||||||||
Expiring 11/17/17 | Citigroup Global Markets | KRW | 54,636 | 48,000 | 48,771 | (771 | ) | |||||||||||
Expiring 11/17/17 | Citigroup Global Markets | KRW | 5,555 | 4,879 | 4,958 | (79 | ) | |||||||||||
Swedish Krona, |
| |||||||||||||||||
Expiring 01/24/18 | Barclays Capital Group | SEK | 162 | 19,967 | 19,456 | 511 | ||||||||||||
Expiring 01/24/18 | Citigroup Global Markets | SEK | 258 | 31,000 | 31,033 | (33 | ) | |||||||||||
Expiring 01/24/18 | Hong Kong & Shanghai Bank | SEK | 169 | 20,800 | 20,309 | 491 | ||||||||||||
Expiring 01/24/18 | UBS AG | SEK | 169 | 20,800 | 20,261 | 539 | ||||||||||||
Expiring 01/24/18 | UBS AG | SEK | 162 | 19,967 | 19,406 | 561 | ||||||||||||
Swiss Franc, |
| |||||||||||||||||
Expiring 01/26/18 | Bank of America | CHF | 175 | 177,944 | 176,726 | 1,218 | ||||||||||||
Expiring 01/26/18 | Citigroup Global Markets | CHF | 95 | 95,700 | 95,656 | 44 | ||||||||||||
Expiring 01/26/18 | JPMorgan Chase | CHF | 175 | 177,956 | 176,726 | 1,230 | ||||||||||||
Expiring 01/26/18 | UBS AG | CHF | 350 | 355,375 | 353,450 | 1,925 | ||||||||||||
Expiring 01/26/18 | UBS AG | CHF | 15 | 15,000 | 14,992 | 8 | ||||||||||||
Thai Baht, |
| |||||||||||||||||
Expiring 11/10/17 | Citigroup Global Markets | THB | 2,428 | 73,045 | 73,079 | (34 | ) | |||||||||||
Turkish Lira, |
| |||||||||||||||||
Expiring 12/15/17 | UBS AG | TRY | 253 | 66,988 | 65,712 | 1,276 | ||||||||||||
Expiring 12/15/17 | UBS AG | TRY | 96 | 25,000 | 24,906 | 94 | ||||||||||||
Expiring 12/15/17 | UBS AG | TRY | 84 | 23,000 | 21,783 | 1,217 | ||||||||||||
Expiring 01/31/18 | UBS AG | TRY | 47 | 12,000 | 12,052 | (52 | ) | |||||||||||
Expiring 01/31/18 | UBS AG | TRY | 31 | 8,000 | 7,891 | 109 | ||||||||||||
Expiring 01/31/18 | UBS AG | TRY | 27 | 7,000 | 7,019 | (19 | ) | |||||||||||
Expiring 04/30/19 | BNP Paribas | TRY | 108 | 24,932 | 24,429 | 503 | ||||||||||||
Expiring 04/30/19 | BNP Paribas | TRY | 23 | 5,330 | 5,224 | 106 | ||||||||||||
|
|
|
|
|
| |||||||||||||
| $ | 31,540,148 | $ | 31,204,315 | 335,833 | ||||||||||||||
|
|
|
|
|
| |||||||||||||
| $ | 239,612 | |||||||||||||||||
|
| |||||||||||||||||
See Notes to Financial Statements.
| Prudential International Bond Fund | 35 |
Schedule of Investments (continued)
as of October 31, 2017
Cross currency exchange contracts outstanding at October 31, 2017:
Settlement | Type | Notional Amount (000) | In Exchange For (000) | Unrealized Appreciation (Depreciation) | Counterparty | |||||||||||||||
OTC cross currency exchange contracts: | ||||||||||||||||||||
01/12/2018 | Buy | EUR | 29 | CAD | 43 | $ | 26 | Barclays Capital Group | ||||||||||||
01/12/2018 | Buy | EUR | 57 | AUD | 87 | 125 | Citigroup Global Markets | |||||||||||||
01/12/2018 | Buy | EUR | 82 | NZD | 141 | 110 | Citigroup Global Markets | |||||||||||||
01/12/2018 | Buy | EUR | 29 | CAD | 43 | 42 | Barclays Capital Group | |||||||||||||
01/26/2018 | Buy | CHF | 133 | EUR | 115 | (534 | ) | UBS AG | ||||||||||||
01/26/2018 | Buy | EUR | 46 | CHF | 53 | 73 | Barclays Capital Group | |||||||||||||
01/26/2018 | Buy | JPY | 10,586 | EUR | 80 | 280 | Barclays Capital Group | |||||||||||||
01/26/2018 | Buy | JPY | 12,266 | EUR | 93 | (506 | ) | Citigroup Global Markets | ||||||||||||
04/06/2018 | Buy | BRL | 149 | EUR | 41 | (3,576 | ) | Citigroup Global Markets | ||||||||||||
04/27/2018 | Buy | JPY | 16,602 | AUD | 190 | 2,202 | BNP Paribas | |||||||||||||
04/27/2018 | Buy | AUD | 157 | JPY | 12,824 | 6,128 | BNP Paribas | |||||||||||||
09/28/2018 | Buy | EUR | 50 | ZAR | 784 | 6,949 | BNP Paribas | |||||||||||||
04/30/2019 | Buy | EUR | 107 | TRY | 520 | 11,965 | BNP Paribas | |||||||||||||
|
| |||||||||||||||||||
| $ | 23,284 | |||||||||||||||||||
|
| |||||||||||||||||||
Credit default swap agreements outstanding at October 31, 2017:
Reference | Termination Date | Fixed Rate | Notional Amount (000)#(3) | Implied Credit Spread at October 31, 2017(5) | Fair Value | Upfront Premiums Paid (Received) | Unrealized Appreciation (Depreciation) | Counterparty | ||||||||||||||||||||||
OTC credit default swaps on corporate and/or sovereign Issues—Buy Protection:(1) |
| |||||||||||||||||||||||||||||
Republic | 06/20/18 | 5.000%(Q) | 100 | 0.568 | % | $ | (3,412 | ) | $ | (4,289 | ) | $ | 877 | BNP Paribas | ||||||||||||||||
Republic | 06/20/18 | 1.000%(Q) | 1,000 | 0.484 | % | (4,460 | ) | (8,383 | ) | 3,923 | Barclays Capital Group | |||||||||||||||||||
Republic | 06/20/22 | 1.000%(Q) | 65 | 63.486 | % | 44,798 | 41,283 | 3,515 | Citigroup Global Markets | |||||||||||||||||||||
|
|
|
|
|
| |||||||||||||||||||||||||
| $ | 36,926 | $ | 28,611 | $ | 8,315 | |||||||||||||||||||||||||
|
|
|
|
|
| |||||||||||||||||||||||||
See Notes to Financial Statements.
| 36 |
Reference | Termination Date | Fixed Rate | Notional Amount (000)#(3) | Implied Credit Spread at October 31, 2017(5) | Fair Value | Upfront Premiums Paid (Received) | Unrealized Appreciation (Depreciation) | Counterparty | ||||||||||||||||||||||
OTC credit default swaps on corporate and/or sovereign Issues—Sell Protection:(2) |
| |||||||||||||||||||||||||||||
Federation of Russia | 12/20/26 | 1.000%(Q) | 100 | 1.990 | % | $ | (7,522 | ) | $ | (10,974 | ) | $ | 3,452 | Barclays Capital Group | ||||||||||||||||
Generalitat De Cataluna | 12/20/22 | 1.000%(Q) | 110 | 4.093 | % | (14,235 | ) | (16,416 | ) | 2,181 | Citigroup Global Markets | |||||||||||||||||||
Republic of Hungary | 06/20/22 | 1.000%(Q) | 450 | 0.835 | % | 3,801 | (2,888 | ) | 6,689 | Citigroup Global Markets | ||||||||||||||||||||
Republic of Ireland | 06/20/27 | 1.000%(Q) | 100 | 0.586 | % | 3,655 | 2,524 | 1,131 | Morgan Stanley | |||||||||||||||||||||
Republic of Korea | 06/20/22 | 1.000%(Q) | 500 | 0.683 | % | 7,529 | 9,982 | (2,453 | ) | Barclays Capital Group | ||||||||||||||||||||
Republic of Panama | 06/20/22 | 1.000%(Q) | 100 | 0.634 | % | 1,741 | 853 | 888 | Citigroup Global Markets | |||||||||||||||||||||
|
|
|
|
|
| |||||||||||||||||||||||||
| $ | (5,031 | ) | $ | (16,919 | ) | $ | 11,888 | |||||||||||||||||||||||
|
|
|
|
|
| |||||||||||||||||||||||||
Reference | Termination Date | Fixed Rate | Notional Amount (000)#(3) | Value at Trade Date | Value at October 31, 2017(4) | Unrealized Appreciation (Depreciation) | ||||||||||||||||||
Centrally cleared credit default swap on credit indices—Sell Protection:(2) |
| |||||||||||||||||||||||
CDX.EM.28.V1 | 12/20/22 | 1.000%(Q) | 1,700 | $ | (70,210 | ) | $ | (57,126 | ) | $ | 13,084 | |||||||||||||
|
|
|
|
|
| |||||||||||||||||||
Reference | Termination Date | Fixed Rate | Notional Amount (000)#(3) | Fair Value(4) | Upfront Premiums Paid (Received) | Unrealized Appreciation (Depreciation)(3) | Counterparty | |||||||||||||||||||
OTC credit default swaps on credit indices—Sell Protection:(2) |
| |||||||||||||||||||||||||
CDX.EM.27.V1 | 06/20/22 | 1.000%(Q) | 500 | $ | (12,772 | ) | $ | (21,606 | ) | $ | 8,834 | Citigroup Global Markets | ||||||||||||||
|
|
|
|
|
| |||||||||||||||||||||
The Fund entered into credit default swaps (“CDS”) to provide a measure of protection against defaults or to take an active long or short position with respect to the likelihood of a particular issuer’s default or the reference entity’s credit soundness. CDS contracts generally trade based on a spread which represents the cost a protection buyer has to pay the protection seller. The protection buyer is said to be short the credit as the value of the contract rises the more the credit deteriorates. The value of the CDS contract increases for the protection buyer if the spread increases.
| (1) | If the Fund is a buyer of protection, it pays the fixed rate. When a credit event occurs, as defined under the terms of that particular swap agreement, the Fund will either (i) receive from the seller of protection an amount equal to the notional amount of the swap and make delivery of the referenced obligation or underlying securities comprising the referenced index or (ii) receive a net settlement amount in the form of cash or securities equal to the notional amount of the swap less the recovery value of the referenced obligation or underlying securities comprising the referenced index. |
See Notes to Financial Statements.
| Prudential International Bond Fund | 37 |
Schedule of Investments (continued)
as of October 31, 2017
| (2) | If the Fund is a seller of protection, it receives the fixed rate. When a credit event occurs, as defined under the terms of that particular swap agreement, the Fund will either (i) pay to the buyer of protection an amount equal to the notional amount and take delivery of the referenced obligation or underlying securities comprising the referenced index or (ii) pay a net settlement amount in the form of cash or securities equal to the notional amount of the swap less the recovery value of the referenced obligation or underlying securities comprising the referenced index. |
| (3) | Notional amount represents the maximum potential amount the Fund could be required to pay as a seller of credit protection or receive as a buyer of credit protection if a credit event occurs as defined under the terms of that particular swap agreement. |
| (4) | The fair value of credit default swap agreements on credit indices and asset-backed securities serves as an indicator of the current status of the payment/performance risk and represents the likelihood of an expected liability (or profit) for the credit derivative should the notional amount of the swap agreement be closed/sold as of the reporting date. Increasing fair value in absolute terms, when compared to the notional amount of the swap, represents a deterioration of the referenced entity’s credit soundness and a greater likelihood of risk of default or other credit event occurring as defined under the terms of the agreement. |
| (5) | Implied credit spreads, represented in absolute terms, utilized in determining the fair value of credit default swap agreements on corporate issues or sovereign issues of an emerging country as of the reporting date serve as an indicator of the current status of the payment/performance risk and represent the likelihood of risk of default for the credit derivative. The implied credit spread of a particular referenced entity reflects the cost of buying/selling protection and may include up-front payments required to be made to enter into the agreement. Wider credit spreads represent a deterioration of the referenced entity’s credit soundness and a greater likelihood of risk of default or other credit event occurring as defined under the terms of the agreement. |
Inflation Swap Agreements outstanding at October 31, 2017:
Notional | Termination Date | Fixed Rate | Floating Rate | Value at Trade Date | Value at October 31, 2017 | Unrealized Appreciation (Depreciation) | ||||||||||||||||||
Centrally cleared swap agreements: | ||||||||||||||||||||||||
| EUR | 90 | 08/15/22 | 1.240 | %(T) | Eurostat Eurozone HICP ex Tobacco(2)(T) | $ | — | $ | (292 | ) | $ | (292 | ) | |||||||||||
| EUR | 310 | 09/15/22 | 1.260 | %(T) | Eurostat Eurozone HICP ex Tobacco(2)(T) | — | (721 | ) | (721 | ) | ||||||||||||||
| EUR | 45 | 08/15/27 | 1.415 | %(T) | Eurostat Eurozone HICP ex Tobacco(1)(T) | — | 304 | 304 | ||||||||||||||||
| EUR | 150 | 09/15/27 | 1.438 | %(T) | Eurostat Eurozone HICP ex Tobacco(1)(T) | — | 720 | 720 | ||||||||||||||||
| GBP | 55 | 08/15/24 | 3.346 | %(T) | U.K. Retail Price Index(2)(T) | — | (552 | ) | (552 | ) | ||||||||||||||
| GBP | 75 | 08/15/27 | 3.344 | %(T) | U.K. Retail Price Index(1)(T) | — | 1,061 | 1,061 | ||||||||||||||||
| GBP | 30 | 08/15/29 | 3.380 | %(T) | U.K. Retail Price Index(2)(T) | — | (438 | ) | (438 | ) | ||||||||||||||
| GBP | 55 | 07/15/32 | 3.513 | %(T) | U.K. Retail Price Index(2)(T) | — | (130 | ) | (130 | ) | ||||||||||||||
| GBP | 75 | 07/15/37 | 3.515 | %(T) | U.K. Retail Price Index(2)(T) | — | (1,057 | ) | (1,057 | ) | ||||||||||||||
| GBP | 20 | 08/15/42 | 3.520 | %(T) | U.K. Retail Price Index(2)(T) | — | (428 | ) | (428 | ) | ||||||||||||||
| GBP | 45 | 07/15/47 | 3.458 | %(T) | U.K. Retail Price Index(1)(T) | (2,292 | ) | 1,492 | 3,784 | |||||||||||||||
| GBP | 15 | 08/15/47 | 3.469 | %(T) | U.K. Retail Price Index(1)(T) | — | 353 | 353 | ||||||||||||||||
| GBP | 5 | 10/15/47 | 3.535 | %(T) | U.K. Retail Price Index(2)(T) | — | 194 | 194 | ||||||||||||||||
| GBP | 10 | 07/15/57 | 3.325 | %(T) | U.K. Retail Price Index(1)(T) | — | 611 | 611 | ||||||||||||||||
| GBP | 5 | 10/15/57 | 3.418 | %(T) | U.K. Retail Price Index(1)(T) | — | (331 | ) | (331 | ) | ||||||||||||||
|
|
|
|
|
| |||||||||||||||||||
| $ | (2,292 | ) | $ | 786 | $ | 3,078 | ||||||||||||||||||
|
|
|
|
|
| |||||||||||||||||||
See Notes to Financial Statements.
| 38 |
Interest rate swap agreements outstanding at October 31, 2017:
Notional | Termination Date | Fixed Rate | Floating Rate | Value at Trade Date | Value at October 31, 2017 | Unrealized Appreciation (Depreciation) | ||||||||||||||||||
Centrally cleared swap agreements: | ||||||||||||||||||||||||
| AUD | 560 | 09/25/22 | 2.958 | %(S) | 6 Month BBSW(2)(S) | $ | — | $ | 1,416 | $ | 1,416 | |||||||||||||
| AUD | 150 | 05/09/32 | 3.140 | %(S) | 6 Month BBSW(2)(S) | (4 | ) | 1,689 | 1,693 | |||||||||||||||
| AUD | 165 | 07/19/32 | 3.130 | %(S) | 6 Month BBSW(2)(S) | (4 | ) | 1,377 | 1,381 | |||||||||||||||
| BRL | 6,765 | 01/02/19 | 0.000 | %(T) | 1 Day BROIS(1)(T) | — | (316 | ) | (316 | ) | ||||||||||||||
| BRL | 5,105 | 01/04/21 | 0.000 | %(T) | 1 Day BROIS(2)(T) | — | (16,736 | ) | (16,736 | ) | ||||||||||||||
| BRL | 1,572 | 01/02/23 | 0.000 | %(T) | 1 Day BROIS(1)(T) | — | 10,101 | 10,101 | ||||||||||||||||
| BRL | 925 | 01/02/23 | 0.000 | %(T) | 1 Day BROIS(2)(T) | — | 13,580 | 13,580 | ||||||||||||||||
| BRL | 756 | 01/02/23 | 0.000 | %(T) | 1 Day BROIS(2)(T) | — | 10,131 | 10,131 | ||||||||||||||||
| CAD | 3,500 | 12/22/18 | 1.178 | %(S) | 3 Month Canadian Bankers Acceptance(2)(S) | — | (11,779 | ) | (11,779 | ) | ||||||||||||||
| CAD | 930 | 05/08/19 | 1.032 | %(S) | 3 Month Canadian Bankers Acceptance(2)(S) | (2 | ) | (6,735 | ) | (6,733 | ) | |||||||||||||
| CAD | 195 | 06/20/19 | 1.265 | %(S) | 3 Month Canadian Bankers Acceptance(2)(S) | (2 | ) | (926 | ) | (924 | ) | |||||||||||||
| CAD | 2,935 | 07/26/19 | 1.605 | %(S) | 3 Month Canadian Bankers Acceptance(2)(S) | (2,306 | ) | (2,854 | ) | (548 | ) | |||||||||||||
| CAD | 330 | 04/05/22 | 1.445 | %(S) | 3 Month Canadian Bankers Acceptance(1)(S) | 4 | 5,824 | 5,820 | ||||||||||||||||
| CAD | 550 | 05/08/22 | 1.367 | %(S) | 3 Month Canadian Bankers Acceptance(1)(S) | 5 | 10,480 | 10,475 | ||||||||||||||||
| CAD | 110 | 05/30/37 | 2.240 | %(S) | 3 Month Canadian Bankers Acceptance(2)(S) | (82 | ) | (4,500 | ) | (4,418 | ) | |||||||||||||
| CAD | 150 | 05/30/47 | 2.240 | %(S) | 3 Month Canadian Bankers Acceptance(2)(S) | (8,007 | ) | (7,562 | ) | 445 | ||||||||||||||
| CHF | 440 | 06/03/27 | 0.750 | %(S) | 6 Month CHF LIBOR(1)(A) | — | 684 | 684 | ||||||||||||||||
| CHF | 240 | 07/14/27 | 0.763 | %(S) | 6 Month CHF LIBOR(2)(T) | — | 1,247 | 1,247 | ||||||||||||||||
| CHF | 240 | 07/14/32 | 1.108 | %(S) | 6 Month CHF LIBOR(1)(A) | — | (523 | ) | (523 | ) | ||||||||||||||
| CHF | 160 | 10/05/37 | —(3) | —(3) | — | (9 | ) | (9 | ) | |||||||||||||||
| EUR | 7,450 | 08/11/19 | (0.238 | %)(A) | 3 Month EURIBOR(2)(Q) | 1,619 | 8,227 | 6,608 | ||||||||||||||||
| EUR | 624 | 09/08/19 | 0.195 | %(A) | 6 Month EURIBOR(2)(S) | — | 244 | 244 | ||||||||||||||||
| EUR | 500 | 09/08/22 | 0.140 | %(A) | 6 Month EURIBOR(1)(S) | — | 812 | 812 | ||||||||||||||||
| EUR | 490 | 08/15/26 | 0.504 | %(A) | 1 Day EONIA(1)(A) | — | (1,479 | ) | (1,479 | ) | ||||||||||||||
| EUR | 320 | 08/15/26 | 0.655 | %(A) | 1 Day EONIA(1)(A) | (664 | ) | (6,036 | ) | (5,372 | ) | |||||||||||||
| EUR | 425 | 06/03/27 | 1.655 | %(A) | 6 Month EURIBOR(2)(S) | — | 27 | 27 | ||||||||||||||||
| EUR | 127 | 09/08/27 | 0.770 | %(A) | 6 Month EURIBOR(2)(S) | — | (528 | ) | (528 | ) | ||||||||||||||
| EUR | 95 | 02/15/30 | 1.124 | %(A) | 6 Month EURIBOR(1)(S) | (3 | ) | (1,194 | ) | (1,191 | ) | |||||||||||||
| EUR | 1,225 | 06/28/32 | 0.785 | %(S) | 6 Month EURIBOR(2)(S) | (82,828 | ) | (82,174 | ) | 654 | ||||||||||||||
| EUR | 160 | 10/04/32 | 2.000 | %(A) | 1 Day EONIA(2)(A) | — | (192 | ) | (192 | ) | ||||||||||||||
| EUR | 160 | 10/04/32 | 2.080 | %(A) | 3 Month EURIBOR(1)(Q) | — | (109 | ) | (109 | ) | ||||||||||||||
| EUR | 305 | 10/30/32 | 1.302 | %(A) | 6 Month EURIBOR(2)(S) | — | 3,215 | 3,215 | ||||||||||||||||
See Notes to Financial Statements.
| Prudential International Bond Fund | 39 |
Schedule of Investments (continued)
as of October 31, 2017
Interest rate swap agreements outstanding at October 31, 2017 (continued):
Notional | Termination Date | Fixed Rate | Floating Rate | Value at Trade Date | Value at October 31, 2017 | Unrealized Appreciation (Depreciation) | ||||||||||||||||||
Centrally cleared swap agreements (cont’d): | ||||||||||||||||||||||||
| EUR | 550 | 08/24/37 | 1.960%(A) | 1 Day EONIA(2)(A) | $ | — | $ | (3,607 | ) | $ | (3,607 | ) | ||||||||||||
| EUR | 550 | 08/24/37 | 2.033%(A) | 3 Month EURIBOR(1)(Q) | (137 | ) | 1,610 | 1,747 | ||||||||||||||||
| EUR | 170 | 10/25/37 | 2.085%(A) | 3 Month EURIBOR(2)(Q) | — | (626 | ) | (626 | ) | |||||||||||||||
| EUR | 170 | 10/25/37 | 2.114%(A) | 6 Month EURIBOR(1)(S) | — | 142 | 142 | |||||||||||||||||
| EUR | 135 | 07/04/42 | 1.416%(A) | 1 Day EONIA(2)(A) | — | 2,859 | 2,859 | |||||||||||||||||
| EUR | 110 | 05/11/47 | 1.450%(A) | 6 Month EURIBOR(2)(A) | (4,554 | ) | (1,840 | ) | 2,714 | |||||||||||||||
| GBP | 220 | 12/07/27 | 1.444%(S) | 6 Month GBP LIBOR(1)(S) | (63 | ) | (1,339 | ) | (1,276 | ) | ||||||||||||||
| GBP | 265 | 02/26/32 | —(4) | —(4) | — | 348 | 348 | |||||||||||||||||
| GBP | 320 | 02/27/32 | 1.374%(S) | 6 Month GBP LIBOR(2)(S) | (1,845 | ) | (7,396 | ) | (5,551 | ) | ||||||||||||||
| GBP | 125 | 05/08/32 | 1.323%(S) | 6 Month GBP LIBOR(2)(S) | (4,422 | ) | (3,608 | ) | 814 | |||||||||||||||
| GBP | 165 | 12/13/46 | 1.615%(S) | 6 Month GBP LIBOR(1)(S) | (8,280 | ) | (2,093 | ) | 6,187 | |||||||||||||||
| HUF | 95,000 | 01/12/27 | 4.150%(S) | 6 Month BUBOR(2)(S) | — | 17,611 | 17,611 | |||||||||||||||||
| JPY | 180,000 | 12/22/36 | 0.641%(S) | 6 Month JPY LIBOR(2)(S) | — | 2,655 | 2,655 | |||||||||||||||||
| JPY | 18,500 | 02/28/37 | 0.681%(S) | 6 Month JPY LIBOR(2)(S) | — | 1,148 | 1,148 | |||||||||||||||||
| JPY | 95,000 | 07/26/37 | 0.676%(S) | 6 Month JPY LIBOR(2)(S) | — | 5,052 | 5,052 | |||||||||||||||||
| JPY | 45,000 | 12/22/41 | 0.732%(S) | 6 Month JPY LIBOR(2)(S) | — | (3,415 | ) | (3,415 | ) | |||||||||||||||
| JPY | 6,200 | 04/07/42 | 0.803%(S) | 6 Month JPY LIBOR(2)(S) | — | 235 | 235 | |||||||||||||||||
| MXN | 4,685 | 12/09/26 | 7.780%(D) | 28 Day Mexican Interbank Rate(2)(D) | (1,031 | ) | 6,097 | 7,128 | ||||||||||||||||
| MXN | 8,000 | 06/11/27 | 7.210%(D) | 28 Day Mexican Interbank Rate(2)(D) | 1,947 | (6,691 | ) | (8,638 | ) | |||||||||||||||
| NZD | 300 | 05/01/20 | 3.628%(S) | 3 Month New Zealand Bank Bill(2)(Q) | 8,462 | 9,829 | 1,367 | |||||||||||||||||
| NZD | 600 | 01/10/27 | 3.420%(S) | 3 Month New Zealand Bank Bill(2)(Q) | — | 15,001 | 15,001 | |||||||||||||||||
| PLN | 700 | 06/13/22 | 2.220%(A) | 6 Month WIBOR(2)(S) | 57 | (1,923 | ) | (1,980 | ) | |||||||||||||||
| PLN | 1,000 | 01/10/27 | 3.030%(A) | 6 Month WIBOR(2)(S) | — | 6,979 | 6,979 | |||||||||||||||||
| SEK | 2,500 | 12/30/26 | 1.106%(A) | 3 Month STIBOR(2)(Q) | — | 3,987 | 3,987 | |||||||||||||||||
| 215 | 06/30/19 | 1.502%(A) | 1 Day USOIS(1)(A) | (311 | ) | 198 | 509 | |||||||||||||||||
| 11,900 | 08/04/19 | 1.372%(A) | 1 Day USOIS(1)(A) | (1,915 | ) | 40,537 | 42,452 | |||||||||||||||||
| 440 | 09/28/22 | 2.177%(S) | 3 Month LIBOR(1)(Q) | — | 1,139 | 1,139 | ||||||||||||||||||
| 500 | 08/15/24 | 2.168%(S) | 3 Month LIBOR(1)(Q) | — | 1,325 | 1,325 | ||||||||||||||||||
| 4,065 | 08/15/24 | 2.170%(S) | 3 Month LIBOR(1)(Q) | 14,581 | 10,352 | (4,229 | ) | |||||||||||||||||
| 245 | 08/15/24 | 2.176%(S) | 3 Month LIBOR(1)(Q) | — | 539 | 539 | ||||||||||||||||||
| 130 | 05/15/27 | 2.295%(S) | 3 Month LIBOR(1)(Q) | — | 530 | 530 | ||||||||||||||||||
| 70 | 10/04/42 | 2.527%(S) | 3 Month LIBOR(2)(Q) | — | (679 | ) | (679 | ) | ||||||||||||||||
| 60 | 10/04/47 | 2.536%(S) | 3 Month LIBOR(1)(Q) | — | 639 | 639 | ||||||||||||||||||
| ZAR | 3,800 | 09/23/22 | 7.430%(Q) | 3 Month JIBAR(2)(Q) | — | (4,425 | ) | (4,425 | ) | |||||||||||||||
| ZAR | 2,035 | 06/30/27 | 8.015%(Q) | 3 Month JIBAR(2)(Q) | (13 | ) | (2,933 | ) | (2,920 | ) | ||||||||||||||
|
|
|
|
|
| |||||||||||||||||||
| $ | (89,798 | ) | $ | 13,639 | $ | 103,437 | ||||||||||||||||||
|
|
|
|
|
| |||||||||||||||||||
See Notes to Financial Statements.
| 40 |
Notional | Termination Date | Fixed Rate | Floating Rate | Fair Value | Upfront Premiums Paid (Received) | Unrealized Appreciation (Depreciation) | Counterparty | |||||||||||||||||||
OTC swap agreements: | ||||||||||||||||||||||||||
| CNH | 700 | 10/18/22 | 3.910%(Q) | 7 Day China Fixing Repo Rates(2)(Q) | $ | (341 | ) | $ | (12 | ) | $ | (329 | ) | Morgan Stanley | ||||||||||||
| ILS | 1,600 | 07/13/20 | 0.405%(S) | 3 Month TELBOR(1)(Q) | (1,755 | ) | — | (1,755 | ) | Citigroup Global Markets | ||||||||||||||||
| ILS | 1,150 | 01/12/27 | 1.975%(S) | 3 Month TELBOR(2)(Q) | 15,508 | — | 15,508 | Citigroup Global Markets | ||||||||||||||||||
| KRW | 850,000 | 01/06/27 | 1.800%(Q) | 3 Month KWCDC(2)(Q) | (28,881 | ) | (19 | ) | (28,862 | ) | Citigroup Global Markets | |||||||||||||||
| ZAR | 3,300 | 09/22/42 | 8.020%(Q) | 3 Month JIBAR(2)(Q) | (14,751 | ) | (32 | ) | (14,719 | ) | Deutsche Bank AG | |||||||||||||||
| ZAR | 3,100 | 09/22/47 | 7.890%(Q) | 3 Month JIBAR(1)(Q) | 14,941 | 26 | 14,915 | Deutsche Bank AG | ||||||||||||||||||
|
|
|
|
|
| |||||||||||||||||||||
| $ | (15,279 | ) | $ | (37 | ) | $ | (15,242 | ) | ||||||||||||||||||
|
|
|
|
|
| |||||||||||||||||||||
Cash of $278,000 and a security with a market value of $512,487 have been segregated with Citigroup Global Markets to cover requirements for open centrally cleared swap contracts at October 31, 2017.
| (1) | The Fund pays the fixed rate and receives the floating rate. |
| (2) | The Fund pays the floating rate and receives the fixed rate. |
| (3) | The Fund pays quarterly the floating rate of 3 Month LIBOR plus 1.75 bps and receives semiannually the floating rate of 6 Month LIBOR. |
| (4) | The Fund pays quarterly the floating rate of 3 Month LIBOR plus 3.1bps and receives semiannually the floating rate of 6 Month LIBOR. |
Fair Value Measurements:
Various inputs are used in determining the value of the Fund’s investments. These inputs are summarized in the three broad levels listed below.
Level 1—unadjusted quoted prices generally in active markets for identical securities.
Level 2—quoted prices for similar securities, interest rates and yield curves, prepayment speeds, foreign currency exchange rates and other observable inputs.
Level 3—unobservable inputs for securities valued in accordance with Board approved fair valuation procedures.
See Notes to Financial Statements.
| Prudential International Bond Fund | 41 |
Schedule of Investments (continued)
as of October 31, 2017
The following is a summary of the inputs used as of October 31, 2017 in valuing such portfolio securities:
| Level 1 | Level 2 | Level 3 | ||||||||||
Investments in Securities | ||||||||||||
Asset-Backed Securities | ||||||||||||
Cayman Islands | $ | — | $ | 501,734 | $ | — | ||||||
Netherlands | — | 872,814 | 582,425 | |||||||||
United Kingdom | — | 877,860 | — | |||||||||
United States | — | 189,166 | — | |||||||||
Corporate Bonds | ||||||||||||
Australia | — | 229,841 | — | |||||||||
Austria | — | 247,192 | — | |||||||||
Brazil | — | 125,199 | — | |||||||||
China | — | 240,884 | — | |||||||||
France | — | 318,346 | — | |||||||||
Germany | — | 797,279 | — | |||||||||
Ireland | — | 122,728 | — | |||||||||
Italy | — | 130,200 | — | |||||||||
Luxembourg | — | 137,685 | — | |||||||||
Mexico | — | 135,276 | — | |||||||||
Netherlands | — | 426,487 | — | |||||||||
Norway | — | 121,785 | — | |||||||||
Russia | — | 122,892 | — | |||||||||
Spain | — | 247,917 | — | |||||||||
United Kingdom | — | 1,287,952 | — | |||||||||
United States | — | 2,722,177 | — | |||||||||
Foreign Government Bonds |
| |||||||||||
Argentina | — | 237,903 | — | |||||||||
Australia | — | 35,110 | — | |||||||||
Belgium | — | 1,390,850 | — | |||||||||
Brazil | — | 373,043 | — | |||||||||
Bulgaria | — | 347,533 | — | |||||||||
Canada | — | 200,148 | — | |||||||||
Colombia | — | 269,638 | — | |||||||||
Cyprus | — | 650,027 | — | |||||||||
France | — | 1,205,292 | — | |||||||||
Greece | — | 856,245 | — | |||||||||
Hungary | — | 120,562 | — | |||||||||
Indonesia | — | 432,637 | — | |||||||||
Ireland | — | 202,436 | — | |||||||||
Israel | — | 119,252 | — | |||||||||
Italy | — | 1,849,251 | — | |||||||||
Mexico | — | 254,776 | — | |||||||||
Norway | — | 276,104 | — | |||||||||
Peru | — | 281,917 | — | |||||||||
See Notes to Financial Statements.
| 42 |
| Level 1 | Level 2 | Level 3 | ||||||||||
Investments in Securities (continued) | ||||||||||||
Foreign Government Bonds (continued) |
| |||||||||||
Portugal | $ | — | $ | 970,559 | $ | — | ||||||
Romania | — | 244,091 | — | |||||||||
South Korea | — | 224,275 | 139,604 | |||||||||
Spain | — | 1,730,673 | — | |||||||||
Turkey | — | 215,091 | — | |||||||||
United Kingdom | — | 1,464,249 | — | |||||||||
United States | — | 23,146 | — | |||||||||
Residential Mortgage-Backed Securities | — | 1,013,346 | — | |||||||||
Affiliated Mutual Funds | 212,885 | — | — | |||||||||
Options Purchased | — | 54,191 | — | |||||||||
Options Written | — | (92,860 | ) | — | ||||||||
Other Financial Instruments* | ||||||||||||
Futures Contracts | 2,870 | — | — | |||||||||
OTC Forward Foreign Currency Exchange Contracts | — | 239,612 | — | |||||||||
OTC Cross Currency Exchange Contracts | — | 23,284 | — | |||||||||
OTC Credit Default Swap Agreements | — | 19,123 | — | |||||||||
Centrally Cleared Credit Default Swap Agreements | — | 13,084 | — | |||||||||
Centrally Cleared Inflation Swap Agreements | — | 3,078 | — | |||||||||
Centrally Cleared Interest Rate Swap Agreements | — | 103,437 | — | |||||||||
OTC Interest Rate Swap Agreements | — | (15,279 | ) | — | ||||||||
|
|
|
|
|
| |||||||
Total | $ | 215,755 | $ | 25,191,238 | $ | 722,029 | ||||||
|
|
|
|
|
| |||||||
| * | Other financial instruments are derivative instruments not reflected in the Schedule of Investments, such as futures, forwards and centrally cleared swap contracts, which are recorded at the unrealized appreciation (depreciation) on the instrument, and OTC swap contracts which are recorded at fair value. |
During the period, there were no transfers between Level 1, Level 2 and Level 3 to report.
The following is a reconciliation of assets in which unobservable inputs (Level 3) were used in determining fair value:
| Asset-Backed Securities— Collateralized Loan Obligations | Foreign Government Bonds | |||||||
Balance as of 12/14/16 | $ | — | $ | — | ||||
Realized gain (loss) | — | — | ||||||
Change in unrealized appreciation (depreciation)** | (8,988 | ) | (6,384 | ) | ||||
Purchases/Exchanges/Issuances | 591,413 | 146,768 | ||||||
Sales/Paydowns | — | — | ||||||
Accrued discount/premium | — | (780 | ) | |||||
Transfers into Level 3 | — | — | ||||||
Transfers out of Level 3 | — | — | ||||||
|
|
|
| |||||
Balance as of 10/31/17 | $ | 582,425 | $ | 139,604 | ||||
|
|
|
| |||||
See Notes to Financial Statements.
| Prudential International Bond Fund | 43 |
Schedule of Investments (continued)
as of October 31, 2017
Level 3 Securities as presented in the table above are being fair valued using priceing methodologies approved by Board, which contain unobservable inputs as follows:
| Level 3 Securities | Fair Value as of October 31,2017 | Valuation Methodology | Unobservable Iputs | |||||||||
Asset-Backed Securities—Collateralized Loan Obligations | $ | 582,425 | Pricing at Cost | Unadjusted Purchase Price | ||||||||
Foreign Government Bonds | 139,604 | Market Approach | Single Broker Indicative Quote | |||||||||
|
| |||||||||||
| $ | 722,029 | |||||||||||
|
| |||||||||||
Industry Classification:
The industry classification of investments and other assets in excess of liabilities shown as a percentage of net assets as of October 31, 2017 were as follows (unaudited):
Foreign Government Bonds | 52.7 | % | ||
Collateralized Loan Obligations | 10.6 | |||
Residential Mortgage-Backed Securities | 3.8 | |||
Banks | 3.7 | |||
Media | 2.3 | |||
Oil & Gas | 2.2 | |||
Healthcare-Products | 1.8 | |||
Retail | 1.5 | |||
Entertainment | 1.5 | |||
Insurance | 1.5 | |||
Auto Parts & Equipment | 1.4 | |||
Investment Companies | 0.9 | |||
Pharmaceuticals | 0.9 | |||
Food | 0.9 | |||
Electric | 0.9 | |||
Software | 0.9 | |||
Affiliated Mutual Fund | 0.8 | |||
Auto Manufacturers | 0.7 | |||
Diversified Financial Services | 0.5 | |||
Containers & Packaging | 0.5 | |||
Telecommunications | 0.5 | % | ||
Apparel | 0.5 | |||
Electrical Components & Equipment | 0.5 | |||
Diversified Machinery | 0.5 | |||
Commercial Services | 0.5 | |||
Real Estate Investment Trusts (REITs) | 0.5 | |||
Household Products/Wares | 0.5 | |||
Lodging | 0.5 | |||
Forest Products & Paper | 0.4 | |||
Transportation | 0.4 | |||
Distribution/Wholesale | 0.4 | |||
Multi-National | 0.4 | |||
Automobiles | 0.4 | |||
Home Equity Loans | 0.3 | |||
Options Purchased | 0.2 | |||
|
| |||
| 96.5 | ||||
Options Written | (0.3 | ) | ||
Other assets in excess of liabilities | 3.8 | |||
|
| |||
| 100.0 | % | |||
|
|
Effects of Derivative Instruments on the Financial Statements and Primary Underlying Risk Exposure:
The Fund invested in derivative instruments during the reporting period. The primary types of risk associated with these derivative instruments are credit contracts risk, foreign exchange contracts risk and interest rate contracts risk. The effect of such derivative instruments on the Fund’s financial position and financial performance as reflected in the Statement of Assets and Liabilities and Statement of Operations is presented in the summary below.
See Notes to Financial Statements.
| 44 |
Fair values of derivative instruments as of October 31, 2017 as presented in the Statement of Assets and Liabilities:
Derivatives not accounted carried at fair value | Asset Derivatives | Liability Derivatives | ||||||||||
Balance Sheet | Fair Value | Balance Sheet | Fair Value | |||||||||
| Credit contracts | Due from/to broker—variation margin swaps | $ | 13,084 | * | — | $ | — | |||||
| Credit contracts | Premiums paid for OTC swap agreements | 54,642 | Premiums received for OTC swap agreements | 64,556 | ||||||||
| Credit contracts | Unaffiliated investments | 6,298 | Options written outstanding, at value | 29,458 | ||||||||
| Credit contracts | Unrealized appreciation on OTC swap agreements | 31,490 | Unrealized depreciation on OTC swap agreements | 2,453 | ||||||||
| Foreign exchange contracts | Unaffiliated investments | 32,104 | Options written outstanding, at value | 49,861 | ||||||||
| Foreign exchange contracts | Unrealized appreciation on OTC cross currency exchange contracts | 27,900 | Unrealized depreciation on OTC cross currency exchange contracts | 4,616 | ||||||||
| Foreign exchange contracts | Unrealized appreciation on OTC forward foreign currency exchange contracts | 366,935 | Unrealized depreciation on OTC forward foreign currency exchange contracts | 127,323 | ||||||||
| Interest rate contracts | Due from/to broker—variation margin futures | 55,451 | * | Due from/to broker—variation margin futures | 52,581 | * | ||||||
| Interest rate contracts | Due from/to broker—variation margin swaps | 198,667 | * | Due from/to broker—variation margin swaps | 92,152 | * | ||||||
| Interest rate contracts | Premiums paid for OTC swap agreements | 26 | Premiums received for OTC swap agreements | 63 | ||||||||
| Interest rate contracts | Unaffiliated investments | 15,789 | Options written outstanding, at value | 13,541 | ||||||||
| Interest rate contracts | Unrealized appreciation on OTC swap agreements | 30,423 | Unrealized depreciation on OTC swap agreements | 45,665 | ||||||||
|
|
|
| |||||||||
Total | $ | 832,809 | $ | 482,269 | ||||||||
|
|
|
| |||||||||
| * | Includes cumulative appreciation (depreciation) as reported in the schedule of open futures and centrally cleared swap contracts. Only unsettled variation margin receivable (payable) is reported within the Statement of Assets and Liabilities. |
See Notes to Financial Statements.
| Prudential International Bond Fund | 45 |
Schedule of Investments (continued)
as of October 31, 2017
The effects of derivative instruments on the Statement of Operations for the period ended October 31, 2017 are as follows:
Amount of Realized Gain (Loss) on Derivatives Recognized in Income | ||||||||||||||||||||||||
Derivatives not accounted | Options Purchased(1) | Options Written | Futures | Forward & Cross Currency Contracts | Swaps | Total | ||||||||||||||||||
Credit contracts | $ | (2,014 | ) | $ | 22,947 | $ | — | $ | — | $ | 83,460 | $ | 104,393 | |||||||||||
Foreign exchange contracts | (59,990 | ) | 57,706 | — | (2,040,465 | ) | 4,448 | (2,038,301 | ) | |||||||||||||||
Interest rate contracts | (10,688 | ) | 9,283 | 29,495 | — | 24,596 | 52,686 | |||||||||||||||||
|
|
|
|
|
|
|
|
|
|
|
| |||||||||||||
Total | $ | (72,692 | ) | $ | 89,936 | $ | 29,495 | $ | (2,040,465 | ) | $ | 112,504 | $ | (1,881,222 | ) | |||||||||
|
|
|
|
|
|
|
|
|
|
|
| |||||||||||||
| (1) | Included in net realized gain (loss) on investment transactions in the Statement of Operations. |
Change in Unrealized Appreciation (Depreciation) on Derivatives Recognized in Income | ||||||||||||||||||||||||
Derivatives not accounted | Options Purchased(2) | Options Written | Futures | Forward & Cross Currency Contracts | Swaps | Total | ||||||||||||||||||
Credit contracts | $ | (9,085 | ) | $ | (662 | ) | $ | — | $ | — | $ | 42,121 | $ | 32,374 | ||||||||||
Foreign exchange contracts | (5,940 | ) | 16,935 | — | 262,896 | — | 273,891 | |||||||||||||||||
Interest rate contracts | (1,596 | ) | 1,089 | 2,870 | — | 91,273 | 93,636 | |||||||||||||||||
|
|
|
|
|
|
|
|
|
|
|
| |||||||||||||
Total | $ | (16,621 | ) | $ | 17,362 | $ | 2,870 | $ | 262,896 | $ | 133,394 | $ | 399,901 | |||||||||||
|
|
|
|
|
|
|
|
|
|
|
| |||||||||||||
| (2) | Included in net change in unrealized appreciation (depreciation) on investments in the Statement of Operations. |
For the period ended October 31, 2017, the average volume of derivative activities is as follows:
Options | Options Written(4) | Futures Contracts— Long Positions(2) | Futures Contracts— Short Positions(2) | Forward Foreign Currency Exchange Contracts— Purchased(3) | Forward Foreign Currency Exchange Contracts— Sold(3) | |||||||||||||||||
| $ | 66,325 | $ | 15,011,405 | $ | 11,289,776 | $ | 13,090,395 | $ | 7,883,714 | $ | 31,838,422 | |||||||||||
Cross | Credit Default Swap Agreements— Buy Protection(4) | Credit Default Swap Agreements— Sell Protection(4) | Currency Swap Agreements(4) | Interest Rate Swap Agreements(4) | ||||||||||||||
| $ | 975,796 | $ | 832,500 | $ | 3,072,812 | $ | 158,500 | $ | 23,461,972 | |||||||||
| (1) | Cost. |
| (2) | Value at Trade Date. |
| (3) | Value at Settlement Date. |
| (4) | Notional Amount in USD. |
See Notes to Financial Statements.
| 46 |
Financial Instruments/Transactions—Summary of Offsetting and Netting Arrangements:
The Fund invested in OTC derivatives during the reporting period that are either offset in accordance with current requirements or are subject to enforceable master netting arrangements or similar agreements that permit offsetting. The information about offsetting and related netting arrangements for OTC derivatives, where the legal right to set-off exists, is presented in the summary below.
Offsetting of OTC derivative assets and liabilities:
Counterparty | Gross Amounts of Recognized Assets(1) | Gross Amounts of Recognized Liabilities(1) | Net Amounts of Recognized Assets/ (Liabilities) | Collateral Pledged/ (Received)(2) | Net Amount | |||||||||||||||
Bank of America | $ | 1,826 | $ | (299 | ) | $ | 1,527 | $ | — | $ | 1,527 | |||||||||
Barclays Capital Group | 47,328 | (32,924 | ) | 14,404 | — | 14,404 | ||||||||||||||
BNP Paribas | 30,342 | (40,065 | ) | (9,723 | ) | — | (9,723 | ) | ||||||||||||
Citigroup Global Markets | 270,642 | (162,870 | ) | 107,772 | — | 107,772 | ||||||||||||||
Deutsche Bank AG | 14,941 | (14,751 | ) | 190 | — | 190 | ||||||||||||||
Goldman Sachs & Co. | — | (4,573 | ) | (4,573 | ) | — | (4,573 | ) | ||||||||||||
Hong Kong & Shanghai Bank | 1,943 | (27,999 | ) | (26,056 | ) | — | (26,056 | ) | ||||||||||||
JPMorgan Chase | 26,601 | (23,229 | ) | 3,372 | — | 3,372 | ||||||||||||||
Morgan Stanley | 4,724 | (7,413 | ) | (2,689 | ) | — | (2,689 | ) | ||||||||||||
UBS AG | 167,260 | (23,413 | ) | 143,847 | — | 143,847 | ||||||||||||||
|
|
|
|
|
|
|
|
|
| |||||||||||
| $ | 565,607 | $ | (337,536 | ) | $ | 228,071 | $ | — | $ | 228,071 | ||||||||||
|
|
|
|
|
|
|
|
|
| |||||||||||
| (1) | Includes unrealized appreciation/(depreciation) on swaps and forwards, premiums paid/(received) on swap agreements and market value of purchased and written options, as represented on the Statement of Assets and Liabilities. |
| (2) | Collateral amount disclosed by the Fund is limited to the Fund’s OTC derivative exposure by counterparty. |
See Notes to Financial Statements.
| Prudential International Bond Fund | 47 |
Statement of Assets & Liabilities
as of October 31, 2017
Assets |
| |||
Investments at value: |
| |||
Unaffiliated investments (cost $23,394,026) | $ | 25,619,788 | ||
Affiliated investments (cost $212,885) | 212,885 | |||
Foreign currency, at value (cost $60,526) | 61,073 | |||
Deposit with broker for futures | 340,039 | |||
Deposit with broker for centrally cleared swaps | 278,000 | |||
Unrealized appreciation on OTC forward foreign currency exchange contracts | 366,935 | |||
Interest receivable | 277,601 | |||
Due from Manager | 66,248 | |||
Due from broker—variation margin swaps | 57,302 | |||
Premium paid for OTC swap agreements | 54,668 | |||
Unrealized appreciation on OTC swap agreements | 61,913 | |||
Unrealized appreciation on OTC cross currency exchange contracts | 27,900 | |||
Due from broker—variation margin futures | 5,777 | |||
Prepaid expenses | 835 | |||
|
| |||
Total assets | 27,430,964 | |||
|
| |||
Liabilities |
| |||
Payable for investments purchased | 291,212 | |||
Unrealized depreciation on OTC forward foreign currency exchange contracts | 127,323 | |||
Options written outstanding, at value (premiums received $110,222) | 92,860 | |||
Premium received for OTC swap agreements | 64,619 | |||
Unrealized depreciation on OTC swap agreements | 48,118 | |||
Accrued expenses and other liabilities | 34,959 | |||
Unrealized depreciation on OTC cross currency exchange contracts | 4,616 | |||
Payable for Fund shares reacquired | 132 | |||
Affiliated transfer agent fee payable | 34 | |||
Distribution fee payable | 28 | |||
|
| |||
Total liabilities | 663,901 | |||
|
| |||
Net Assets | $ | 26,767,063 | ||
|
| |||
Net assets were comprised of: |
| |||
Shares of beneficial interest, at par | $ | 2,565 | ||
Paid-in capital in excess of par | 24,677,499 | |||
|
| |||
| 24,680,064 | ||||
Distributions in excess of net investment income | (318,233 | ) | ||
Accumulated net realized loss on investment and foreign currency transactions | (243,926 | ) | ||
Net unrealized appreciation on investments and foreign currencies | 2,649,158 | |||
|
| |||
Net assets, October 31, 2017 | $ | 26,767,063 | ||
|
| |||
See Notes to Financial Statements.
| 48 |
Class A | ||||
Net asset value and redemption price per share, | $ | 10.44 | ||
Maximum sales charge (4.50% of offering price) | 0.49 | |||
|
| |||
Maximum offering price to public | $ | 10.93 | ||
|
| |||
Class C | ||||
Net asset value, offering price and redemption price per share, | $ | 10.44 | ||
|
| |||
Class Q | ||||
Net asset value, offering price and redemption price per share, | $ | 10.44 | ||
|
| |||
Class Z | ||||
Net asset value, offering price and redemption price per share, | $ | 10.44 | ||
|
| |||
See Notes to Financial Statements.
| Prudential International Bond Fund | 49 |
Statement of Operations
Period* Ended October 31, 2017
Net Investment Income (Loss) |
| |||
Income |
| |||
Interest income | $ | 394,301 | ||
Affiliated dividend income | 7,724 | |||
|
| |||
Total income | 402,025 | |||
|
| |||
Expenses |
| |||
Management fee | 113,917 | |||
Distribution fee—Class A | 84 | |||
Distribution fee—Class C | 91 | |||
Registration fees | 120,000 | |||
Custodian and accounting fees | 114,000 | |||
Legal fees and expenses | 35,000 | |||
Audit fee | 30,000 | |||
Shareholders’ reports | 23,000 | |||
Trustees’ fees | 8,000 | |||
Transfer agent’s fees and expenses (including affiliated expense of $200) | 259 | |||
Miscellaneous | 10,718 | |||
|
| |||
Total expenses | 455,069 | |||
Less: Management fee waiver and/or expense reimbursement | (286,297 | ) | ||
|
| |||
Net expenses | 168,772 | |||
|
| |||
Net investment income (loss) | 233,253 | |||
|
| |||
Realized And Unrealized Gain (Loss) On Investments And Foreign Currency Transactions |
| |||
Net realized gain (loss) on: |
| |||
Investment transactions | 19,832 | |||
Futures transactions | 29,495 | |||
Options written transactions | 89,936 | |||
Swap agreement transactions | 112,504 | |||
Forward and cross currency contract transactions | (2,040,465 | ) | ||
Foreign currency transactions | 564,957 | |||
|
| |||
| (1,223,741 | ) | |||
|
| |||
Net change in unrealized appreciation (depreciation) on: |
| |||
Investments | 2,225,762 | |||
Futures | 2,870 | |||
Options Written | 17,362 | |||
Swap agreements | 133,394 | |||
Forward and cross currency contracts | 262,896 | |||
Foreign currencies | 6,874 | |||
|
| |||
| 2,649,158 | ||||
|
| |||
Net gain (loss) on investment and foreign currency transactions | 1,425,417 | |||
|
| |||
Net Increase (Decrease) In Net Assets Resulting From Operations | $ | 1,658,670 | ||
|
| |||
| * | Commencement of operations was December 14, 2016. |
See Notes to Financial Statements.
| 50 |
Statement of Changes in Net Assets
| December 14, 2016* through October 31, 2017 | ||||
Increase (Decrease) in Net Assets | ||||
Operations | ||||
Net investment income (loss) | $ | 233,253 | ||
Net realized gain (loss) on investment and foreign currency transactions | (1,223,741 | ) | ||
Net change in unrealized appreciation (depreciation) on investments and foreign currencies | 2,649,158 | |||
|
| |||
Net increase (decrease) in net assets resulting from operations | 1,658,670 | |||
|
| |||
Tax return of capital distributions | ||||
Class A | (771 | ) | ||
Class C | (130 | ) | ||
Class Q | (553,162 | ) | ||
Class Z | (223 | ) | ||
|
| |||
| (554,286 | ) | |||
|
| |||
Fund Share transactions | ||||
Net proceeds from shares sold | 25,119,515 | |||
Net asset value of shares issued in reinvestment of dividends and distributions | 554,265 | |||
Cost of shares reacquired | (11,101 | ) | ||
|
| |||
Net increase (decrease) in net assets from Fund share transactions | 25,662,679 | |||
|
| |||
Total increase (decrease) | 26,767,063 | |||
Net Assets: | ||||
Beginning of period | — | |||
|
| |||
End of period | $ | 26,767,063 | ||
|
| |||
| * | Commencement of operations. |
See Notes to Financial Statements.
| Prudential International Bond Fund | 51 |
Notes to Financial Statements
Prudential Investment Portfolios 9 (the “Trust”) is registered under the Investment Company Act of 1940, as amended (“1940 Act”), as an open-end management investment company. The Trust was established as a Delaware business trust on September 18, 1998. The Trust currently consists of five funds: Prudential Absolute Return Bond Fund and Prudential QMA Large-Cap Core Equity Fund which are diversified funds and Prudential International Bond Fund, Prudential Select Real Estate Fund and Prudential Real Estate Income Fund which are non-diversified funds. These financial statements relate to the Prudential International Bond Fund (the “Fund”). The Fund commenced operations on December 14, 2016.
The investment objective of the Fund is to seek total return, made up of current income and capital appreciation.
1. Accounting Policies
The Fund follows investment company accounting and reporting guidance of the Financial Accounting Standards Board (“FASB”) Accounting Standard Codification Topic 946 Financial Services—Investment Companies. The following accounting policies conform to U.S. generally accepted accounting principles. The Fund consistently follows such policies in the preparation of its financial statements.
Securities Valuation: The Fund holds securities and other assets and liabilities that are fair valued at the close of each day (generally, 4:00 PM Eastern time) the New York Stock Exchange (“NYSE”) is open for trading. Fair value is the price that would be received to sell an asset or paid to transfer a liability in an orderly transaction between market participants on the measurement date. The Board of Trustees (the “Board”) has adopted valuation procedures for security valuation under which fair valuation responsibilities have been delegated to PGIM Investments LLC (“PGIM Investments” or “the Manager”) (formerly known as Prudential Investments LLC). Under the current valuation procedures, the Valuation Committee is responsible for supervising the valuation of portfolio securities and other assets and liabilities. The valuation procedures permit the Fund to utilize independent pricing vendor services, quotations from market makers, and alternative valuation methods when market quotations are either not readily available or not deemed representative of fair value. A record of the Valuation Committee’s actions is subject to the Board’s review, approval, and ratification at its next regularly scheduled quarterly meeting.
Various inputs determine how the Fund’s investments are valued, all of which are categorized according to the three broad levels (Level 1, 2, or 3) detailed in the Schedule of Investments.
Derivative instruments, such as futures or options, that are traded on a national securities exchange are valued at the last sale price as of the close of trading on the applicable
| 52 |
exchange where the security principally trades. Securities traded via NASDAQ are valued at the NASDAQ official closing price. To the extent these securities are valued at the last sale price or NASDAQ official closing price, they are classified as Level 1 in the fair value hierarchy.
Investments in open-end, non-exchange-traded mutual funds are valued at their net asset values as of the close of the NYSE on the date of valuation. These securities are classified as Level 1 in the fair value hierarchy since they may be purchased or sold at their net asset values on the date of valuation.
Fixed income securities traded in the OTC market are generally classified as Level 2 in the fair value hierarchy. Such fixed income securities are typically valued using the market approach which generally involves obtaining data from an approved independent third-party vendor source. The Fund utilizes the market approach as the primary method to value securities when market prices of identical or comparable instruments are available. The third-party vendors’ valuation techniques used to derive the evaluated bid price are based on evaluating observable inputs, including but not limited to, yield curves, yield spreads, credit ratings, deal terms, tranche level attributes, default rates, cash flows, prepayment speeds, broker/dealer quotations and reported trades. Certain Level 3 securities are also valued using the market approach when obtaining a single broker quote or when utilizing recent transaction prices for identical or comparable securities. During the reporting period, there were no changes to report with respect to the valuation approach and/or valuation techniques discussed above.
OTC derivative instruments are generally classified as Level 2 in the fair value hierarchy. Such derivative instruments are typically valued using the market approach and/or income approach which generally involves obtaining data from an approved independent third-party vendor source. The Fund utilizes the market approach when quoted prices in broker-dealer markets are available but also includes consideration of alternative valuation approaches, including the income approach. In the absence of reliable market quotations, the income approach is typically utilized for purposes of valuing OTC derivatives such as interest rate swaps based on a discounted cash flow analysis whereby the value of the instrument is equal to the present value of its future cash inflows or outflows. Such analysis includes projecting future cash flows and determining the discount rate (including the present value factors that affect the discount rate) used to discount the future cash flows. In addition, the third-party vendors’ valuation techniques used to derive the evaluated OTC derivative price is based on evaluating observable inputs, including but not limited to, underlying asset prices, indices, spreads, interest rates and exchange rates. Certain OTC derivatives may be classified as Level 3 when valued using the market approach by obtaining a single broker quote or when utilizing unobservable inputs in the income approach. During the reporting period, there were no changes to report with respect to the valuation approach and/or valuation techniques discussed above.
Centrally cleared swaps listed or traded on a multilateral or trade facility platform, such as a registered exchange, are generally valued at the daily settlement price determined by the respective exchange. These securities are classified as Level 2 in the fair value hierarchy, as the daily settlement price is not public.
| Prudential International Bond Fund | 53 |
Notes to Financial Statements (continued)
Securities and other assets that cannot be priced according to the methods described above are valued based on pricing methodologies approved by the Board. In the event that unobservable inputs are used when determining such valuations, the securities will be classified as Level 3 in the fair value hierarchy.
When determining the fair value of securities, some of the factors influencing the valuation include: the nature of any restrictions on disposition of the securities; assessment of the general liquidity of the securities; the issuer’s financial condition and the markets in which it does business; the cost of the investment; the size of the holding and the capitalization of the issuer; the prices of any recent transactions or bids/offers for such securities or any comparable securities; any available analyst media or other reports or information deemed reliable by the investment manager regarding the issuer or the markets or industry in which it operates. Using fair value to price securities may result in a value that is different from a security’s most recent closing price and from the price used by other unaffiliated mutual funds to calculate their net asset values.
Foreign Currency Translation: The books and records of the Fund are maintained in U.S. dollars. Foreign currency amounts are translated into U.S. dollars on the following basis:
(i) market value of investment securities, other assets and liabilities—at the current rates of exchange;
(ii) purchases and sales of investment securities, income and expenses—at the rates of exchange prevailing on the respective dates of such transactions.
Although the net assets of the Fund are presented at the foreign exchange rates and market values at the close of the period, the Fund does not generally isolate that portion of the results of operations arising as a result of changes in the foreign exchange rates from the fluctuations arising from changes in the market prices of long-term portfolio securities held at the end of the period. Similarly, the Fund does not isolate the effect of changes in foreign exchange rates from the fluctuations arising from changes in the market prices of long-term portfolio securities sold during the period. Accordingly, holding period realized foreign currency gains (losses) are included in the reported net realized gains (losses) on investment transactions. Notwithstanding the above, the Fund does isolate the effect of fluctuations in foreign currency exchange rates when determining the gain (loss) upon the sale or maturity of foreign currency denominated debt obligations; such amounts are included in net realized gains (losses) on foreign currency transactions.
Net realized gains (losses) on foreign currency transactions represent net foreign exchange gains (losses) from the disposition of holdings of foreign currencies, currency gains (losses) realized between the trade and settlement dates on securities transactions, and the
| 54 |
difference between the amounts of interest, dividends and foreign withholding taxes recorded on the Fund’s books and the U.S. dollar equivalent amounts actually received or paid. Net unrealized currency gains (losses) from valuing foreign currency denominated assets and liabilities (other than investments) at period end exchange rates are reflected as a component of net unrealized appreciation (depreciation) on foreign currencies.
Forward and Cross Currency Contracts: A forward currency contract is a commitment to purchase or sell a foreign currency at a future date at a negotiated forward rate. The Fund enters into forward currency contracts in order to hedge its exposure to changes in foreign currency exchange rates on its foreign portfolio holdings or specific receivables and payables denominated in a foreign currency and to gain exposure to certain currencies. The contracts are valued daily at current forward exchange rates and any unrealized gain (loss) is included in net unrealized appreciation (depreciation) on investments and foreign currencies. Gain (loss) is realized on the settlement date of the contract equal to the difference between the settlement value of the original and negotiated forward contracts. This gain (loss), if any, is included in net realized gain (loss) on forward and cross currency contract transactions. Risks may arise upon entering into these contracts from the potential inability of the counterparties to meet the terms of their contracts. Forward currency contracts involve risks from currency exchange rate and credit risk in excess of the amounts reflected on the Statement of Assets and Liabilities. The Fund’s maximum risk of loss from counterparty credit risk is the net value of the cash flows to be received from the counterparty at the end of the contract’s life. A cross currency contract is a forward contract where a specified amount of one foreign currency will be exchanged for a specified amount of another foreign currency.
Options: The Fund purchased or wrote options in order to hedge against adverse market movements or fluctuations in value caused by changes in prevailing interest rates, value of equities or foreign currency exchange rates with respect to securities or financial instruments which the Fund currently owns or intends to purchase. The Fund may also use options to gain additional market exposure. The Fund’s principal reason for writing options is to realize, through receipt of premiums, a greater current return than would be realized on the underlying security alone. When the Fund purchases an option, it pays a premium and an amount equal to that premium is recorded as an asset. When the Fund writes an option, it receives a premium and an amount equal to that premium is recorded as a liability. The asset or liability is adjusted daily to reflect the current market value of the option. If an option expires unexercised, the Fund realizes a gain (loss) to the extent of the premium received or paid. If an option is exercised, the premium received or paid is recorded as an adjustment to the proceeds from the sale or the cost of the purchase in determining whether the Fund has realized a gain (loss). The difference between the premium and the amount received or paid at the closing of a purchase or sale transaction is also treated as a realized gain (loss). Gain (loss) on purchased options is included in net realized gain (loss) on investment transactions. Gain (loss) on written options is presented separately as net realized gain (loss) on options written transactions.
The Fund, as writer of an option, may have no control over whether the underlying securities or financial instruments may be sold (called) or purchased (put). As a result, the
| Prudential International Bond Fund | 55 |
Notes to Financial Statements (continued)
Fund bears the market risk of an unfavorable change in the price of the security or financial instrument underlying the written option. The Fund, as purchaser or an OTC option, bears the risk of the potential inability of the counterparties to meet the terms of their contracts. With exchange-traded options contracts, there is minimal counterparty credit risk to the Fund since the exchanges’ clearinghouse acts as counterparty to all exchange-traded options and guarantees the options contracts against default.
When the Fund writes an option on a swap, an amount equal to any premium received by the Fund is recorded as a liability and is subsequently adjusted to the current market value of the written option on the swap. If a call option on a swap is exercised, the Fund becomes obligated to pay a fixed interest rate (noted as the strike price) and receive a variable interest rate on a notional amount. If a put option on a swap is exercised, the Fund becomes obligated to pay a variable interest rate and receive a fixed interest rate (noted as the strike price) on a notional amount. Premiums received from writing options on swaps that expire or are exercised are treated as realized gains upon the expiration or exercise of such options on swaps. The risk associated with writing put and call options on swaps is that the Fund will be obligated to be party to a swap agreement if an option on a swap is exercised.
Financial Futures Contracts: A financial futures contract is an agreement to purchase (long) or sell (short) an agreed amount of securities at a set price for delivery on a future date. Upon entering into a financial futures contract, the Fund is required to pledge to the broker an amount of cash and/or other assets equal to a certain percentage of the contract amount. This amount is known as the “initial margin.” Subsequent payments, known as “variation margin,” are made or received by the Fund each day, depending on the daily fluctuations in the value of the underlying security. Such variation margin is recorded for financial statement purposes on a daily basis as unrealized gain (loss). When the contract expires or is closed, the gain (loss) is realized and is presented in the Statement of Operations as net realized gain (loss) on futures transactions.
The Fund invested in financial futures contracts in order to hedge its existing portfolio securities, or securities the Fund intends to purchase, against fluctuations in value caused by changes in prevailing interest rates. Should interest rates move unexpectedly, the Fund may not achieve the anticipated benefits of the financial futures contracts and may realize a loss. The use of futures transactions involves the risk of imperfect correlation in movements in the price of futures contracts, interest rates and the underlying hedged assets. Since futures contracts are exchange-traded, there is minimal counterparty credit risk to the Fund since the exchanges’ clearinghouse acts as counterparty to all exchange-traded futures and guarantees the futures contracts against default.
Swap Agreements: The Fund may enter into credit default, interest rate and other types of swap agreements. A swap agreement is an agreement to exchange the return generated by
| 56 |
one instrument for the return generated by another instrument. Swap agreements are negotiated in the OTC market and may be executed either directly with counterparty (“OTC-traded”) or through a central clearing facility, such as a registered exchange. Swap agreements are valued daily at current market value and any change in value is included in the net unrealized appreciation (depreciation) on swap agreements. Centrally cleared swaps pay or receive an amount known as “variation margin”, based on daily changes in the valuation of the swap contract. Any upfront premiums paid and received are shown as swap premiums paid and swap premiums received in the Statement of Assets and Liabilities. Risk of loss may exceed amounts recognized on the Statement of Assets and Liabilities. Swap agreements outstanding at period end, if any, are listed on the Schedule of Investments.
Interest Rate Swaps: Interest rate swaps represent an agreement between counterparties to exchange cash flows based on the difference between two interest rates, applied to a notional principal amount for a specified period. The Fund is subject to interest rate risk exposure in the normal course of pursuing its investment objectives. The Fund used interest rate swaps to maintain its ability to generate steady cash flow by receiving a stream of fixed-rate payments and to increase exposure to prevailing market rates by receiving floating rate payments. The Fund’s maximum risk of loss from counterparty credit risk is the discounted net present value of the cash flows to be received from the counterparty over the contract’s remaining life.
Inflation Swaps: The Fund entered into inflation swap agreements to protect against fluctuations in inflation rates. Inflation swaps are characterized by one party paying a fixed rate in exchange for a floating rate that is derived from an inflation index, such as the Consumer Price Index or UK Retail Price Index. Inflation swaps subject the Fund to interest rate risk.
Credit Default Swaps (“CDS”): CDS involve one party (the protection buyer) making a stream of payments to another party (the protection seller) in exchange for the right to receive a specified payment in the event of a default or as a result of a default (collectively a “credit event”) for the referenced entity (typically corporate issues or sovereign issues of an emerging country) on its obligation; or in the event of a write-down, principal shortfall, interest shortfall or default of all or part of the referenced entities comprising a credit index.
The Fund is subject to credit risk in the normal course of pursuing its investment objectives, and as such, has entered into CDS contracts to provide a measure of protection against defaults or to take an active long or short position with respect to the likelihood of a particular issuer’s default or the reference entity’s credit soundness. CDS contracts generally trade based on a spread which represents the cost a protection buyer has to pay the protection seller. The protection buyer is said to be short the credit as the value of the contract rises the more the credit deteriorates. The value of the CDS contract increases for the protection buyer if the spread increases. The Fund’s maximum risk of loss from counterparty credit risk for purchased CDS is the inability of the counterparty to honor the contract up to the notional value due to a credit event.
| Prudential International Bond Fund | 57 |
Notes to Financial Statements (continued)
As a seller of protection on credit default swap agreements, the Fund generally receives an agreed upon payment from the buyer of protection throughout the term of the swap, provided no credit event occurs. As the seller, the Fund effectively increases its investment risk because, in addition to its total net assets, the Fund may be subject to investment exposure on the notional amount of the swap.
The maximum amount of the payment that the Fund, as a seller of protection, could be required to make under a credit default swap agreement would be equal to the notional amount of the underlying security or index contract as a result of a credit event. This potential amount will be partially offset by any recovery values of the respective referenced obligations, or net amounts received from the settlement of buy protection credit default swap agreements which the Fund entered into for the same referenced entity or index. As a buyer of protection, the Fund generally receives an amount up to the notional value of the swap if a credit event occurs.
Implied credit spreads, represented in absolute terms, utilized in determining the market value of credit default swap agreements on corporate or sovereign issues of an emerging country as of period end are disclosed in the footnotes to the Schedule of Investments, if applicable. These spreads serve as indicators of the current status of the payment/performance risk and represent the likelihood of default risk for the credit derivative. The implied credit spread of a particular referenced entity reflects the cost of buying/selling protection and may include upfront payments required to enter into the agreement. For credit default swap agreements on asset-backed securities and credit indices, the quoted market prices and resulting values serve as indicators of the current status of the payment/performance risk. Wider credit spreads and increased market value in absolute terms, when compared to the notional amount of the swap, represent a deterioration of the referenced entity’s credit soundness and a greater likelihood of risk of default or other credit event occurring as defined under the terms of the agreement.
Currency Swaps: The Fund entered into currency swap agreements primarily to gain yield exposure on foreign bonds. Currency swap agreements involve two parties exchanging two different currencies with an agreement to reverse the exchange at a later date at specified exchange rates.
Master Netting Arrangements: The Trust, on behalf of the Fund, is subject to various Master Agreements, or netting arrangements, with select counterparties. These are agreements which a subadviser may have negotiated and entered into on behalf of the Fund. A master netting arrangement between the Fund and the counterparty permits the Fund to offset amounts payable by the Fund to the same counterparty against amounts to be received; and by the receipt of collateral from the counterparty by the Fund to cover the
| 58 |
Fund’s exposure to the counterparty. However, there is no assurance that such mitigating factors are easily enforceable. In addition to master netting arrangements, the right to set-off exists when all the conditions are met such that each of the parties owes the other determinable amounts, the reporting party has the right to set-off the amount owed with the amount owed by the other party, the reporting party intends to set-off and the right of set-off is enforceable by law. During the reporting period, there was no intention to settle on a net basis and all amounts are presented on a gross basis on the Statement of Assets and Liabilities.
The Trust, on behalf of the Fund, is a party to ISDA (International Swaps and Derivatives Association, Inc.) Master Agreements with certain counterparties that govern OTC derivative and foreign exchange contracts entered into from time to time. The Master Agreements may contain provisions regarding, among other things, the parties’ general obligations, representations, agreements, collateral requirements, events of default and early termination. With respect to certain counterparties, in accordance with the terms of the Master Agreements, collateral posted to the Fund is held in a segregated account by the Fund’s custodian and with respect to those amounts which can be sold or re-pledged, is presented in the Schedule of Investments. Collateral pledged by the Fund is segregated by the Fund’s custodian and identified in the Schedule of Investments. Collateral can be in the form of cash or debt securities issued by the U.S. Government or related agencies or other securities as agreed to by the Fund and the applicable counterparty. Collateral requirements are determined based on the Fund’s net position with each counterparty. Termination events applicable to the Fund may occur upon a decline in the Fund’s net assets below a specified threshold over a certain period of time. Termination events applicable to counterparties may occur upon a decline in the counterparty’s long-term and short-term credit ratings below a specified level. In each case, upon occurrence, the other party may elect to terminate early and cause settlement of all derivative and foreign exchange contracts outstanding, including the payment of any losses and costs resulting from such early termination, as reasonably determined by the terminating party. Any decision by one or more of the Fund’s counterparties to elect early termination could impact the Fund’s future derivative activity.
In addition to each instrument’s primary underlying risk exposure (e.g. interest rate, credit, equity or foreign exchange, etc.), swap agreements involve, to varying degrees, elements of credit, market and documentation risk. Such risks involve the possibility that no liquid market for these agreements will exist, the counterparty to the agreement may default on its obligation to perform or disagree on the contractual terms of the agreement, and changes in net interest rates will be unfavorable. In connection with these agreements, securities in the portfolio may be identified or received as collateral from the counterparty in accordance with the terms of the respective swap agreements to provide or receive assets of value and to serve as recourse in the event of default or bankruptcy/insolvency of either party. Such OTC derivative agreements include conditions which, when materialized, give the counterparty the right to cause an early termination of the transactions under those agreements. Any election by the counterparty for early termination of the contract(s) may impact the amounts reported on financial statements.
| Prudential International Bond Fund | 59 |
Notes to Financial Statements (continued)
As of October 31, 2017, the Fund has not met conditions under such agreements which give the counterparty the right to call for an early termination.
Forward currency contracts, forward rate agreements, written options, short sales, swaps and financial futures contracts involve elements of both market and credit risk in excess of the amounts reflected on the Statement of Assets and Liabilities. Such risks may be mitigated by engaging in master netting arrangements.
Concentration of Risk: The ability of debt securities issuers (other than those issued or guaranteed by the U.S. Government) held by the Fund to meet their obligations may be affected by the economic or political developments in a specific industry, region or country. Foreign security and currency transactions may involve certain considerations and risks not typically associated with those of domestic origin as a result of, among other factors, the possibility of political or economic instability or the level of governmental supervision and regulation of foreign securities markets.
Securities Transactions and Net Investment Income: Securities transactions are recorded on the trade date. Realized gains (losses) from investment and currency transactions are calculated on the specific identification method. Dividend income is recorded on the ex-date. Interest income, including amortization of premium and accretion of discount on debt securities, as required, is recorded on the accrual basis. Expenses are recorded on an accrual basis, which may require the use of certain estimates by management that may differ from actual.
Net investment income or loss (other than distribution fees which are charged directly to the respective class and transfer agency fees specific to Class Q shares which are charged to that share class) and unrealized and realized gains (losses) are allocated daily to each class of shares based upon the relative proportion of adjusted net assets of each class at the beginning of the day.
Taxes: It is the Fund’s policy to meet the requirements of the Internal Revenue Code applicable to regulated investment companies and to distribute all of its taxable net investment income and capital gains, if any, to its shareholders. Therefore, no federal income tax provision is required. Withholding taxes on foreign dividends, interest and capital gains, if any, are recorded, net of reclaimable amounts, at the time the related income is earned.
Dividends and Distributions: The Fund expects to pay dividends from net investment income monthly and distributions from net realized capital gains, if any, annually. Dividends and distributions to shareholders, which are determined in accordance with
| 60 |
federal income tax regulations and which may differ from generally accepted accounting principles, are recorded on the ex-date. Permanent book/tax differences relating to income and gain (loss) are reclassified amongst undistributed net investment income, accumulated net realized gain (loss) and paid-in capital in excess of par, as appropriate.
Estimates: The preparation of financial statements requires management to make estimates and assumptions that affect the reported amounts and disclosures in the financial statements. Actual results could differ from those estimates.
2. Agreements
The Trust, on behalf of the Fund, has a management agreement with PGIM Investments. Pursuant to this agreement, PGIM Investments has responsibility for all investment advisory services and supervises the subadviser’s performance of such services. PGIM Investments has entered into a subadvisory agreement with PGIM, Inc., which provides subadvisory services to the Fund through its PGIM Fixed Income unit. The subadvisory agreement provides that PGIM, Inc. will furnish investment advisory services in connection with the management of the Fund. In connection therewith, PGIM, Inc. is obligated to keep certain books and records of the Fund. PGIM Investments pays for the services of PGIM, Inc., the cost of compensation of officers of the Fund, occupancy and certain clerical and bookkeeping costs of the Fund. The Fund bears all other costs and expenses.
The management fee paid to PGIM Investments is accrued daily and payable monthly at an annual rate of .50% of the Fund’s average daily net assets up to $2 billion and .485% of such assets in excess of $2 billion. The effective management fee rate before any waivers and/or expense reimbursements was .50% for the period ended October 31, 2017. For the period ended October 31, 2017, the waiver and/or expense reimbursement exceeded the effective management fee rate.
PGIM Investments has contractually agreed through February 28, 2019 to limit the net annual operating expenses (exclusive of distribution and service (12b-1) fees, taxes (such as income and foreign withholdings taxes, stamp duty and deferred tax expenses), interest, underlying funds, brokerage, extraordinary and certain other expenses such as dividend, broker charges and interest expense on short sales) of each class of shares of the Fund to .74% of the Fund’s average daily net assets. Expenses waived/reimbursed by the Manager in accordance with this agreement may be recouped by the Manager within the same fiscal year during which such waiver/reimbursement is made if such recoupment can be realized without exceeding the expense limit in effect at the time of the recoupment for that fiscal year.
The Trust, on behalf of the Fund, has a distribution agreement with Prudential Investment Management Services LLC (“PIMS”) which acts as the distributor of the Class A, Class C, Class Q, and Class Z shares of the Fund. The Fund compensates PIMS for distributing and servicing the Fund’s Class A and Class C shares, pursuant to the plans of distribution (the “Distribution Plans”), regardless of expenses actually incurred by PIMS. The distribution fees are accrued daily and payable monthly. No distribution or service fees are paid to PIMS as distributor of the Class Q or Class Z shares of the Fund.
| Prudential International Bond Fund | 61 |
Notes to Financial Statements (continued)
Pursuant to the Fund’s Distribution Plans, the Fund compensates PIMS for distribution related activities at an annual rate of up to .25% and 1% of the average daily net assets of the Class A and C, respectively.
PIMS has advised the Fund that it has received $1,841 in front-end sales charges resulting from sales of Class A shares, during the period ended October 31, 2017. From these fees, PIMS paid such sales charges to affiliated broker-dealers, which in turn paid commissions to sales persons and incurred other distribution costs.
PIMS has advised the Fund that for the period ended October 31, 2017, it did not receive any in contingent deferred sales charges imposed upon redemptions by certain Class A and Class C shareholders, respectively.
PGIM Investments, PGIM, Inc. and PIMS are indirect, wholly-owned subsidiaries of Prudential Financial, Inc. (“Prudential”).
3. Other Transactions with Affiliates
Prudential Mutual Fund Services LLC (“PMFS”), an affiliate of PGIM Investments and an indirect, wholly-owned subsidiary of Prudential, serves as the Fund’s transfer agent. Transfer agent’s fees and expenses in the Statement of Operations include certain out-of-pocket expenses paid to non-affiliates, where applicable.
The Fund may enter into certain securities purchase or sale transactions under Board approved Rule 17a-7 procedures. Rule 17a-7 is an exemptive rule under the 1940 Act, that permits purchase and sale transactions among affiliated investment companies, or between an investment company and a person that is affiliated solely by reason of having a common (or affiliated) investment adviser, common directors, and/or common officers. Such transactions are subject to ratification by the Board. For the reporting period ended October 31, 2017 no such transactions were entered into by the Fund.
The Fund may invest its overnight sweep cash in the Prudential Core Ultra Short Bond Fund (the “Core Fund”), a series of Prudential Investment Portfolios 2, registered under the 1940 Act and managed by PGIM Investments. Earnings from the Core Fund are disclosed on the Statement of Operations as “Affiliated dividend income”.
4. Portfolio Securities
The aggregate cost of purchases and proceeds from sales of portfolio securities (excluding short-term investments and U.S. Government securities) for the period ended October 31, 2017 were $39,144,623 and $16,086,353, respectively.
| 62 |
5. Distributions and Tax Information
Distributions to shareholders, which are determined in accordance with federal income tax regulations and which may differ from generally accepted accounting principles, are recorded on the ex-date. In order to present distributions in excess of net investment income, accumulated net realized loss on investment and foreign currency transactions and paid-in capital in excess of par on the Statement of Assets and Liabilities that more closely represent their tax character, certain adjustments have been made to distributions in excess of net investment income, accumulated net realized loss on investment and foreign currency transactions and paid-in capital in excess of par. For the period ended October 31, 2017 the adjustments were to increase distributions in excess of net investment income by $551,486, decrease accumulated net realized loss on investment and foreign currency transactions by $979,815 and decrease paid-in capital in excess of par by $428,329 due to differences in the treatment for book and tax purposes of certain transactions involving foreign securities and currencies, swaps, net operating loss and other book to tax differences. Net investment income, net realized gain (loss) on investments and foreign currency transactions and net assets were not affected by this change.
For the period ended October 31, 2017, the tax character of dividends paid by the Fund was $554,286 of tax return of capital.
As of October 31, 2017, the Fund had no undistributed earnings on a tax basis.
The United States federal income tax basis of the Fund’s investments and the net unrealized appreciation as of October 31, 2017 were as follows:
Tax Basis | Gross Unrealized | Gross Unrealized | Net Unrealized | |||
| $24,042,023 | $2,271,160 | $(184,161) | $2,086,999 |
The differences between book basis and tax basis were primarily attributable to deferred losses on wash sales and other cost basis differences between financial and tax accounting.
Management has analyzed the Fund’s tax positions and has concluded that no provision for income tax is required in the Fund’s financial statements for the current reporting period. The Fund’s federal excise tax returns for tax years for which the applicable statutes of limitations have not expired are subject to examination by the Internal Revenue Service and state departments of revenue.
6. Capital
The Fund offers Class A, Class C, Class Q and Class Z shares. Class A shares are sold with a maximum front-end sales charge of 4.50%. Investors who purchase $1 million or more of Class A shares and sell these shares within 12 months of purchase are subject to a contingent deferred sales charge (“CDSC”) of 1%, although they are not subject to an initial
| Prudential International Bond Fund | 63 |
Notes to Financial Statements (continued)
sales charge. The Class A CDSC is waived for certain retirement and/or benefit plans. Class C shares are sold with a CDSC of 1% on sales made within 12 months of purchase. A special exchange privilege is also available for shareholders who qualified to purchase Class A shares at net asset value. Class Q and Class Z shares are not subject to any sales or redemption charge and are offered exclusively for sale to a limited group of investors.
Under certain circumstances, an exchange may be made from specified share classes of the Fund to one or more other share classes of the Fund as presented in the table of transactions in shares of beneficial interest.
The Trust has authorized an unlimited number of shares of beneficial interest at $.001 par value per share, divided into four classes, designated Class A, Class C, Class Q and Class Z.
As of October 31, 2017, Prudential owned 99.6% of the outstanding shares of the Fund.
Transactions in shares of beneficial interest were as follows:
Class A | Shares | Amount | ||||||
Period* ended October 31, 2017: | ||||||||
Shares sold | 8,745 | $ | 89,467 | |||||
Shares issued in reinvestment of dividends and distributions | 74 | 771 | ||||||
Shares reacquired | (52 | ) | (546 | ) | ||||
|
|
|
| |||||
Net increase (decrease) in shares outstanding | 8,767 | $ | 89,692 | |||||
|
|
|
| |||||
Class C | ||||||||
Period* ended October 31, 2017: | ||||||||
Shares sold | 1,000 | $ | 10,000 | |||||
Shares issued in reinvestment of dividends and distributions | 12.7 | 130 | ||||||
|
|
|
| |||||
Net increase (decrease) in shares outstanding | 1,012.7 | $ | 10,130 | |||||
|
|
|
| |||||
Class Q | ||||||||
Period* ended October 31, 2017: | ||||||||
Shares sold | 2,501,000 | $ | 25,010,000 | |||||
Shares issued in reinvestment of dividends and distributions | 53,965 | 553,141 | ||||||
Shares reacquired** | (1,015 | ) | (10,555 | ) | ||||
|
|
|
| |||||
Net increase (decrease) in shares outstanding | 2,553,950 | $ | 25,552,586 | |||||
|
|
|
| |||||
Class Z | ||||||||
Period* ended October 31, 2017: | ||||||||
Shares sold | 1,005 | $ | 10,048 | |||||
Shares issued in reinvestment of dividends and distributions | 21 | 223 | ||||||
|
|
|
| |||||
Net increase (decrease) in shares outstanding | 1,026 | $ | 10,271 | |||||
|
|
|
| |||||
| * | Commencement of operations was December 14, 2016. |
| ** | Includes affiliated redemption of 1,015 shares with a value of $10,555 for Class Q. |
| 64 |
7. Borrowings
The Trust, on behalf of the Fund, along with other affiliated registered investment companies (the “Funds”), is a party to a Syndicated Credit Agreement (��SCA”) with a group of banks. The purpose of the SCA is to provide an alternative source of temporary funding for capital share redemptions. The SCA provides for a commitment of $900 million for the period October 5, 2017 through October 4, 2018. The Funds pay an annualized commitment fee of .15% of the unused portion of the SCA. The Fund’s portion of the commitment fee for the unused amount, allocated based upon a method approved by the Board, is accrued daily and paid quarterly. Prior to October 5, 2017, the Funds had another SCA that provided a commitment of $900 million and the Funds paid an annualized commitment fee of .15% of the unused portion of the SCA. The interest on borrowings under the SCAs is paid monthly and at a per annum interest rate based upon a contractual spread plus the higher of (1) the effective federal funds rate, (2) the 1-month LIBOR rate or (3) zero percent.
Other affiliated registered investment companies that are parties to the SCA include portfolios that are subject to a predetermined mathematical formula used to manage certain benefit guarantees offered under variable annuity contracts. The formula may result in large scale asset flows into and out of these portfolios. Consequently, these portfolios may be more likely to utilize the SCA for purposes of funding redemptions. It may be possible for those portfolios to fully exhaust the committed amount of the SCA, thereby requiring the Manager to allocate available funding per a Board-approved methodology designed to treat the Funds in the SCA equitably.
The Fund did not utilize the SCA during the reporting period ended October 31, 2017.
8. Other
At the Trust’s Board meeting in March 2017, the Board approved a change in the methodology of allocating certain expenses, such as Transfer Agent fees (including sub-transfer agent and networking fees) and Blue Sky fees. PGIM Investments implemented the changes effective November 1, 2017.
| Prudential International Bond Fund | 65 |
Financial Highlights
| Class A Shares | ||||
| December 14, 2016(a) through October 31, 2017 | ||||
| Per Share Operating Performance(b): | ||||
| Net Asset Value, Beginning of Period | $10.00 | |||
| Income (loss) from investment operations: | ||||
| Net investment income (loss) | .07 | |||
| Net realized and unrealized gain (loss) on investments | .57 | |||
| Total from investment operations | .64 | |||
| Less Dividends: | ||||
Tax return of capital distributions | (.20 | ) | ||
| Net asset value, end of period | $10.44 | |||
| Total Return(c): | 6.42% | |||
| Ratios/Supplemental Data: | ||||
| Net assets, end of period (000) | $91 | |||
| Average net assets (000) | $38 | |||
| Ratios to average net assets(d): | ||||
| Expenses after waivers and/or expense reimbursement | .99% | (e) | ||
| Expenses before waivers and/or expense reimbursement | 3.39% | (e) | ||
| Net investment income (loss) | .85% | (e) | ||
| Portfolio turnover rate | 66% | (f) | ||
| (a) | Commencement of operations. |
| (b) | Calculated based on average shares outstanding during the period. |
| (c) | Total return does not consider the effects of sales loads. Total return is calculated assuming a purchase of a share on the first day and a sale on the last day of each period reported and includes reinvestment of dividends and distributions, if any. Total returns may reflect adjustments to conform to generally accepted accounting principles. Total returns for periods less than one full year are not annualized. |
| (d) | Does not include expenses of the underlying funds in which the Fund invests. |
| (e) | Annualized. |
| (f) | Not annualized. |
See Notes to Financial Statements.
| 66 |
| Class C Shares | ||||
| December 14, 2016(a) through October 31, 2017 | ||||
| Per Share Operating Performance(b): | ||||
| Net Asset Value, Beginning of Period | $10.00 | |||
| Income (loss) from investment operations: | ||||
| Net investment income (loss) | - | |||
| Net realized and unrealized gain (loss) on investments | .57 | |||
| Total from investment operations | .57 | |||
| Less Dividends: | ||||
Tax return of capital distributions | (.13 | ) | ||
| Net asset value, end of period | $10.44 | |||
| Total Return(c): | 5.73% | |||
| Ratios/Supplemental Data: | ||||
| Net assets, end of period (000) | $11 | |||
| Average net assets (000) | $10 | |||
| Ratios to average net assets(d): | ||||
| Expenses after waivers and/or expense reimbursement | 1.74% | (e) | ||
| Expenses before waivers and/or expense reimbursement | 3.26% | (e) | ||
| Net investment income (loss) | .06% | (e) | ||
| Portfolio turnover rate | 66% | (f) | ||
| (a) | Commencement of operations. |
| (b) | Calculated based on average shares outstanding during the period. |
| (c) | Total return does not consider the effects of sales loads. Total return is calculated assuming a purchase of a share on the first day and a sale on the last day of each period reported and includes reinvestment of dividends and distributions, if any. Total returns may reflect adjustments to conform to generally accepted accounting principles. Total returns for periods less than one full year are not annualized. |
| (d) | Does not include expenses of the underlying funds in which the Fund invests. |
| (e) | Annualized. |
| (f) | Not annualized. |
See Notes to Financial Statements.
| Prudential International Bond Fund | 67 |
Financial Highlights (continued)
| Class Q Shares | ||||
December 14, | ||||
| Per Share Operating Performance(b): | ||||
| Net Asset Value, Beginning of Period | $10.00 | |||
| Income (loss) from investment operations: | ||||
| Net investment income (loss) | .09 | |||
| Net realized and unrealized gain (loss) on investments | .57 | |||
| Total from investment operations | .66 | |||
| Less Dividends: | ||||
Tax return of capital distributions | (.22 | ) | ||
| Net asset value, end of period | $10.44 | |||
| Total Return(c): | 6.65% | |||
| Ratios/Supplemental Data: | ||||
| Net assets, end of period (000) | $26,654 | |||
| Average net assets (000) | $25,767 | |||
| Ratios to average net assets(d): | ||||
| Expenses after waivers and/or expense reimbursement | .74% | (e) | ||
| Expenses before waivers and/or expense reimbursement | 1.99% | (e) | ||
| Net investment income (loss) | 1.07% | (e) | ||
| Portfolio turnover rate | 66% | (f) | ||
| (a) | Commencement of operations. |
| (b) | Calculated based on average shares outstanding during the period. |
| (c) | Total return is calculated assuming a purchase of a share on the first day and a sale on the last day of each period reported and includes reinvestment of dividends and distributions, if any. Total returns may reflect adjustments to conform to generally accepted accounting principles. Total returns for periods less than one full year are not annualized. |
| (d) | Does not include expenses of the underlying funds in which the Fund invests. |
| (e) | Annualized. |
| (f) | Not annualized. |
See Notes to Financial Statements.
| 68 |
| Class Z Shares | ||||
December 14, | ||||
| Per Share Operating Performance(b): | ||||
| Net Asset Value, Beginning of Period | $10.00 | |||
| Income (loss) from investment operations: | ||||
| Net investment income (loss) | .09 | |||
| Net realized and unrealized gain (loss) on investments | .57 | |||
| Total from investment operations | .66 | |||
| Less Dividends: | ||||
Tax return of capital distributions | (.22 | ) | ||
| Net asset value, end of period | $10.44 | |||
| Total Return(c): | 6.67% | |||
| Ratios/Supplemental Data: | ||||
| Net assets, end of period (000) | $11 | |||
| Average net assets (000) | $10 | |||
| Ratios to average net assets(d): | ||||
| Expenses after waivers and/or expense reimbursement | .74% | (e) | ||
| Expenses before waivers and/or expense reimbursement | 2.24% | (e) | ||
| Net investment income (loss) | 1.09% | (e) | ||
| Portfolio turnover rate | 66% | (f) | ||
| (a) | Commencement of operations. |
| (b) | Calculated based on average shares outstanding during the period. |
| (c) | Total return is calculated assuming a purchase of a share on the first day and a sale on the last day of each period reported and includes reinvestment of dividends and distributions, if any. Total returns may reflect adjustments to conform to generally accepted accounting principles. Total returns for periods less than one full year are not annualized. |
| (d) | Does not include expenses of the underlying funds in which the Fund invests. |
| (e) | Annualized. |
| (f) | Not annualized. |
See Notes to Financial Statements.
| Prudential International Bond Fund | 69 |
Report of Independent Registered Public Accounting Firm
The Board of Trustees and Shareholders
Prudential Investment Portfolios 9:
We have audited the accompanying statement of assets and liabilities of Prudential International Bond Fund (the “Fund”), a series of Prudential Investment Portfolios 9, including the schedule of investments, as of October 31, 2017, and the related statements of operations and changes in net assets, and the financial highlights for the period from December 14, 2016 (commencement of operations) to October 31, 2017. These financial statements and financial highlights are the responsibility of the Fund’s management. Our responsibility is to express an opinion on these financial statements and financial highlights based on our audit.
We conducted our audit in accordance with the standards of the Public Company Accounting Oversight Board (United States). Those standards require that we plan and perform the audit to obtain reasonable assurance about whether the financial statements and financial highlights are free of material misstatement. An audit includes examining, on a test basis, evidence supporting the amounts and disclosures in the financial statements. Our procedures included confirmation of securities owned as of October 31, 2017, by correspondence with the custodian, transfer agent and brokers or by other appropriate auditing procedures when replies from brokers were not received. An audit also includes assessing the accounting principles used and significant estimates made by management, as well as evaluating the overall financial statement presentation. We believe that our audit provides a reasonable basis for our opinion.
In our opinion, the financial statements and financial highlights referred to above present fairly, in all material respects, the financial position of the Fund as of October 31, 2017, and the results of its operations, the changes in its net assets, and the financial highlights for the period described in the first paragraph, in conformity with U.S. generally accepted accounting principles.

New York, New York
December 18, 2017
| 70 |
INFORMATION ABOUT BOARD MEMBERS AND OFFICERS
(Unaudited)
Information about Board Members and Officers of the Fund is set forth below. Board Members who are not deemed to be “interested persons” of the Fund, as defined in the 1940 Act, are referred to as “Independent Board Members.” Board Members who are deemed to be “interested persons” of the Fund are referred to as “Interested Board Members.” The Board Members are responsible for the overall supervision of the operations of the Fund and perform the various duties imposed on the directors of investment companies by the 1940 Act. The Board in turn elects the Officers, who are responsible for administering the day-to-day operations of the Fund.
| Independent Board Members(1) | ||||
Name, Address, Age Position(s) Portfolios Overseen | Principal Occupation(s) During Past Five Years | Other Directorships Held During Past Five Years | ||
Ellen S. Alberding (59) Board Member Portfolios Overseen: 89 | President and Board Member, The Joyce Foundation (charitable foundation) (since 2002); Vice Chair, City Colleges of Chicago (community college system) (since 2011); Trustee, Skills for America’s Future (national initiative to connect employers to community colleges) (since 2011); Trustee, National Park Foundation (charitable foundation for national park system) (since 2009); Trustee, Economic Club of Chicago (since 2009). | None. | ||
Kevin J. Bannon (65) Board Member Portfolios Overseen: 89 | Retired; Managing Director (April 2008-May 2015) and Chief Investment Officer (October 2008-November 2013) of Highmount Capital LLC (registered investment adviser); formerly Executive Vice President and Chief Investment Officer (April 1993-August 2007) of Bank of New York Company; President (May 2003-May 2007) of BNY Hamilton Family of Mutual Funds. | Director of Urstadt Biddle Properties (equity real estate investment trust) (since September 2008). | ||
Linda W. Bynoe (65) Board Member Portfolios Overseen: 89 | President and Chief Executive Officer (since March 1995) and formerly Chief Operating Officer (December 1989-February 1995) of Telemat Ltd. (management consulting); formerly Vice President (January 1985-June 1989) at Morgan Stanley & Co. (broker-dealer). | Director of Simon Property Group, Inc. (retail real estate) (May 2003-May 2012); Director of Anixter International, Inc. (communication products distributor) (since January 2006); Director of Northern Trust Corporation (financial services) (since April 2006); Trustee of Equity Residential (residential real estate) (since December 2009). | ||
Prudential International Bond Fund
| Independent Board Members(1) | ||||
Name, Address, Age Position(s) Portfolios Overseen | Principal Occupation(s) During Past Five Years | Other Directorships Held During Past Five Years | ||
Barry H. Evans (57)± Board Member Portfolios Overseen: 89 | Retired; Formerly President (2005-2016), Global Chief Operating Officer (2014-2016), Chief Investment Officer-Global Head of Fixed Income (1998-2014), and various portfolio manager roles (1986-2006), Manulife Asset Management U.S. | Director, Manulife Trust Company (2011-present); Director, Manulife Asset Management Limited (2015-present); Formerly Chairman of the Board of Directors of Manulife Asset Management U.S. (2005-2016); Formerly Chairman of the Board, Declaration Investment Management and Research (2008-2016). | ||
Keith F. Hartstein (61) Board Member & Independent Chair Portfolios Overseen: 89 | Retired; Member (since November 2014) of the Governing Council of the Independent Directors Council (organization of independent mutual fund directors); formerly President and Chief Executive Officer (2005-2012), Senior Vice President (2004-2005), Senior Vice President of Sales and Marketing (1997-2004), and various executive management positions (1990-1997), John Hancock Funds, LLC (asset management); Chairman, Investment Company Institute’s Sales Force Marketing Committee (2003-2008). | None. | ||
Laurie Simon Hodrick (55)± Board Member Portfolios Overseen: 89 | A. Barton Hepburn Professor of Economics in the Faculty of Business, Columbia Business School (since 1996); Visiting Professor of Law and Rock Center for Corporate Governance Fellow, Stanford Law School (since 2015); Visiting Fellow, Hoover Institution, Stanford University (since 2015); Sole Member, ReidCourt LLC (since 2008) (a consulting firm); Formerly Managing Director, Global Head of Alternative Investment Strategies, Deutsche Bank (2006-2008); Formerly Director/Trustee, Merrill Lynch Investment Managers Funds (1999-2006). | Independent Director, Corporate Capital Trust (since April 2017) (a business development company). | ||
Michael S. Hyland, CFA (72) Board Member Portfolios Overseen: 89 | Retired (since February 2005); formerly Senior Managing Director (July 2001-February 2005) of Bear Stearns & Co, Inc.; Global Partner, INVESCO (1999-2001); Managing Director and President of Salomon Brothers Asset Management (1989-1999). | None. | ||
Visit our website at pgiminvestments.com
| Independent Board Members(1) | ||||
Name, Address, Age Position(s) Portfolios Overseen | Principal Occupation(s) During Past Five Years | Other Directorships Held During Past Five Years | ||
Richard A. Redeker (74) Board Member & Independent Vice Chair9 Portfolios Overseen: 87 | Retired Mutual Fund Senior Executive (47 years); Management Consultant; Director, Mutual Fund Directors Forum (since 2014); Independent Directors Council (organization of independent mutual fund directors)-Executive Committee, Chair of Policy Steering Committee, Governing Council. | None. | ||
Stephen G. Stoneburn (74) Board Member Portfolios Overseen: 89 | Chairman (since July 2011), President and Chief Executive Officer (since June 1996) of Frontline Medical Communications (publishing company); formerly President (June 1995-June 1996) of Argus Integrated Media, Inc.; Senior Vice President and Managing Director (January 1993-1995) of Cowles Business Media; Senior Vice President of Fairchild Publications, Inc. (1975-1989). | None. | ||
± Mr. Evans and Ms. Hodrick joined the Board effective as of September 1, 2017.
| Interested Board Members(1) | ||||
Name, Address, Age Position(s) Portfolios Overseen | Principal Occupation(s) During Past Five Years | Other Directorships Held During Past Five Years | ||
Stuart S. Parker (55) Board Member & President Portfolios Overseen: 89 | President of PGIM Investments LLC (formerly known as Prudential Investments LLC) (since January 2012); Executive Vice President of Prudential Investment Management Services LLC (since December 2012); Executive Vice President of Jennison Associates LLC and Head of Retail Distribution of PGIM Investments LLC (June 2005-December 2011). | None. | ||
Prudential International Bond Fund
| Interested Board Members(1) | ||||
| Name, Address, Age Position(s) Portfolios Overseen | Principal Occupation(s) During Past Five Years | Other Directorships Held During Past Five Years | ||
| Scott E. Benjamin (44) Board Member & Vice President Portfolios Overseen: 89 | Executive Vice President (since June 2009) of PGIM Investments LLC; Executive Vice President (June 2009-June 2012) and Vice President (since June 2012) of Prudential Investment Management Services LLC; Executive Vice President (since September 2009) of AST Investment Services, Inc.; Senior Vice President of Product Development and Marketing, PGIM Investments (since February 2006); Vice President of Product Development and Product Management, Prudential Investments (2003-2006). | None. | ||
| Grace C. Torres* (58) Board Member Portfolios Overseen: 88 | Retired; formerly Treasurer and Principal Financial and Accounting Officer of the Prudential Funds, Target Funds, Advanced Series Trust, Prudential Variable Contract Accounts and The Prudential Series Fund (1998-June 2014); Assistant Treasurer (March 1999-June 2014) and Senior Vice President (September 1999-June 2014) of PGIM Investments LLC; Assistant Treasurer (May 2003-June 2014) and Vice President (June 2005-June 2014) of AST Investment Services, Inc.; Senior Vice President and Assistant Treasurer (May 2003-June 2014) of Prudential Annuities Advisory Services, Inc. | Director (since July 2015) of Sun Bancorp, Inc. N.A. and Sun National Bank | ||
* Note: Prior to her retirement in 2014, Ms. Torres was employed by PGIM Investments LLC. Due to her prior employment, she is considered to be an “interested person” under the 1940 Act. Ms. Torres is a Non-Management Interested Board Member.
(1) The year that each individual joined the Board is as follows:
Ellen S. Alberding, 2013; Linda W. Bynoe, 2005; Barry H. Evans, 2017; Richard A. Redeker, 1998; Stephen G. Stoneburn, 2003; Kevin J. Bannon, 2008; Keith F. Hartstein, 2013; Laurie Simon Hodrick, 2017; Michael S. Hyland, 2008; Stuart S. Parker, Board Member since 2012 and President since 2012; Scott E. Benjamin, Board Member since 2010 and Vice President since 2009; Grace C. Torres, 2014.
Visit our website at pgiminvestments.com
| Fund Officers(a) | ||||
| Name, Address and Age Position with Fund | Principal Occupation(s) During Past Five Years | Length of Service as Fund Officer | ||
| Raymond A. O’Hara (62) Chief Legal Officer | Vice President and Corporate Counsel (since July 2010) of Prudential Insurance Company of America (Prudential); Vice President (March 2011-Present) of Pruco Life Insurance Company and Pruco Life Insurance Company of New Jersey; Vice President and Corporate Counsel (March 2011-Present) of Prudential Annuities Life Assurance Corporation; Chief Legal Officer of PGIM Investments LLC (since June 2012); Chief Legal Officer of Prudential Mutual Fund Services LLC (since June 2012) and Corporate Counsel of AST Investment Services, Inc. (since June 2012); formerly Assistant Vice President and Corporate Counsel (September 2008-July 2010) of The Hartford Financial Services Group, Inc.; formerly Associate (September 1980-December 1987) and Partner (January 1988–August 2008) of Blazzard & Hasenauer, P.C. (formerly, Blazzard, Grodd & Hasenauer, P.C.). | Since 2012 | ||
| Chad A. Earnst (42) Chief Compliance Officer | Chief Compliance Officer (September 2014-Present) of PGIM Investments LLC; Chief Compliance Officer (September 2014-Present) of the Prudential Funds, Target Funds, Advanced Series Trust, The Prudential Series Fund, Prudential’s Gibraltar Fund, Inc., Prudential Global Short Duration High Yield Income Fund, Inc., Prudential Short Duration High Yield Fund, Inc. and Prudential Jennison MLP Income Fund, Inc.; formerly Assistant Director (March 2010-August 2014) of the Asset Management Unit, Division of Enforcement, US Securities & Exchange Commission; Assistant Regional Director (January 2010-August 2014), Branch Chief (June 2006–December 2009) and Senior Counsel (April 2003-May 2006) of the Miami Regional Office, Division of Enforcement, US Securities & Exchange Commission. | Since 2014 | ||
| Deborah A. Docs (59) Secretary | Vice President and Corporate Counsel (since January 2001) of Prudential; Vice President (since December 1996) and Assistant Secretary (since March 1999) of PGIM Investments LLC; formerly Vice President and Assistant Secretary (May 2003-June 2005) of AST Investment Services, Inc. | Since 2004 | ||
| Jonathan D. Shain (59) Assistant Secretary | Vice President and Corporate Counsel (since August 1998) of Prudential; Vice President and Assistant Secretary (since May 2001) of PGIM Investments LLC; Vice President and Assistant Secretary (since February 2001) of Prudential Mutual Fund Services LLC; formerly Vice President and Assistant Secretary (May 2003-June 2005) of AST Investment Services, Inc. | Since 2005 | ||
| Claudia DiGiacomo (43) Assistant Secretary | Vice President and Corporate Counsel (since January 2005) of Prudential; Vice President and Assistant Secretary of PGIM Investments LLC (since December 2005); Associate at Sidley Austin Brown & Wood LLP (1999-2004). | Since 2005 | ||
Prudential International Bond Fund
| Fund Officers(a) | ||||
| Name, Address and Age Position with Fund | Principal Occupation(s) During Past Five Years | Length of Service as Fund Officer | ||
| Andrew R. French (54) Assistant Secretary | Vice President and Corporate Counsel (since February 2010) of Prudential; formerly Director and Corporate Counsel (2006-2010) of Prudential; Vice President and Assistant Secretary (since January 2007) of PGIM Investments LLC; Vice President and Assistant Secretary (since January 2007) of Prudential Mutual Fund Services LLC. | Since 2006 | ||
| Charles H. Smith (44) Anti-Money Laundering Compliance Officer | Vice President, Corporate Compliance, Anti-Money Laundering Unit (since January 2015) of Prudential; committee member of the American Council of Life Insurers Anti-Money Laundering and Critical Infrastructure Committee (since January 2016); formerly Global Head of Economic Sanctions Compliance at AIG Property Casualty (February 2007-December 2014); Assistant Attorney General at the New York State Attorney General’s Office, Division of Public Advocacy. (August 1998-January 2007). | Since 2016 | ||
| M. Sadiq Peshimam (53) Treasurer and Principal Financial and Accounting Officer | Vice President (since 2005) of PGIM Investments LLC; formerly Assistant Treasurer of funds in the Prudential Mutual Fund Complex (2006-2014). | Since 2006 | ||
| Peter Parrella (59) Assistant Treasurer | Vice President (since 2007) and Director (2004-2007) within Prudential Mutual Fund Administration; formerly Tax Manager at SSB Citi Fund Management LLC (1997-2004). | Since 2007 | ||
| Lana Lomuti (50) Assistant Treasurer | Vice President (since 2007) and Director (2005-2007), within Prudential Mutual Fund Administration; formerly Assistant Treasurer (December 2007-February 2014) of The Greater China Fund, Inc. | Since 2014 | ||
| Linda McMullin (56) Assistant Treasurer | Vice President (since 2011) and Director (2008-2011) within Prudential Mutual Fund Administration. | Since 2014 | ||
| Kelly A. Coyne (49) Assistant Treasurer | Director, Investment Operations of Prudential Mutual Fund Services LLC (since 2010). | Since 2015 | ||
(a) Excludes Mr. Parker and Mr. Benjamin, interested Board Members who also serve as President and Vice President, respectively.
Explanatory Notes to Tables:
| ∎ | Board Members are deemed to be “Interested,” as defined in the 1940 Act, by reason of their affiliation with PGIM Investments LLC and/or an affiliate of PGIM Investments LLC. |
| ∎ | Unless otherwise noted, the address of all Board Members and Officers is c/o PGIM Investments LLC, 655 Broad Street, Newark, New Jersey 07102-4410. |
| ∎ | There is no set term of office for Board Members or Officers. The Board Members have adopted a retirement policy, which calls for the retirement of Board Members on December 31 of the year in which they reach the age of 75. |
| ∎ | “Other Directorships Held” includes only directorships of companies required to register or file reports with the SEC under the 1934 Act (that is, “public companies”) or other investment companies registered under the 1940 Act. |
| ∎ | “Portfolios Overseen” includes all investment companies managed by PGIM Investments LLC. The investment companies for which PGIM Investments LLC serves as manager include the Prudential Mutual Funds, The Prudential Variable Contract Accounts, Target Mutual Funds, Prudential Short Duration High Yield Fund, Inc., Prudential Global Short Duration High Yield Fund, Inc., The Prudential Series Fund, Prudential’s Gibraltar Fund, Inc. and the Advanced Series Trust. |
Visit our website at pgiminvestments.com
Approval of Advisory Agreements
Initial Approval of the Fund’s Advisory Agreements
As required by the Investment Company Act of 1940 (the 1940 Act), the Board of Trustees (the Board) considered the proposed management agreement with Prudential Investments LLC (the Manager) 1 and the proposed subadvisory agreement between the Manager and PGIM, Inc. (PGIM) and PGIM Ltd. (together with PGIM, the Subadviser) with respect to the Fund prior to the Fund’s commencement of operations. The Board, including a majority of the Independent Trustees, met on September 20-22, 2016 and approved the agreements for an initial two year period, after concluding that approval of the agreements was in the best interests of the Fund.
In advance of the meetings, the Board requested and received materials relating to the agreements, and had the opportunity to ask questions and request further information in connection with its consideration.
In approving the agreements, the Board, including the Independent Trustees advised by independent legal counsel, considered the factors it deemed relevant, including the nature, quality and extent of services to be provided to the Fund by the Manager, PGIM and PGIM Ltd.; any relevant comparable performance and the qualifications and track record of PGIM and PGIM Ltd. in serving other affiliated mutual funds; the fees proposed to be paid by the Fund to the Manager and by the Manager to the Subadviser, under the agreements; and the potential for economies of scale that may be shared with the Fund and its shareholders. In connection with its deliberations, the Board considered information provided by the Manager, PGIM and PGIM Ltd. at or in advance of the meetings on September 20-22, 2016. The Board also considered information provided by the Manager with respect to other funds managed by the Manager, PGIM and PGIM Ltd., which information had been provided throughout the year at regular Board meetings. In their deliberations, the Trustees did not identify any single factor which alone was responsible for the Board’s decision to approve the agreements with respect to the Fund.
The Trustees determined that the overall arrangements between the Fund and the Manager, which will serve as the Fund’s investment manager pursuant to a management agreement, and between the Manager and PGIM and PGIM Ltd., which will serve as the Fund’s subadviser pursuant to the terms of a subadvisory agreement, were in the best interests of the Fund in light of the services to be performed and the fees to be charged under the agreements and such other matters as the Trustees considered relevant in the exercise of their business judgment.
The material factors and conclusions that formed the basis for the Trustees’ reaching their determinations to approve the agreements are separately discussed below.
| Prudential International Bond Fund | ||
Approval of Advisory Agreements (continued)
Nature, Quality and Extent of Services
With respect to the Manager, the Board noted that it had received and considered information about the Manager at the June 7-9, 2016 meetings in connection with the renewal of the management agreements between the Manager and the other Prudential Retail Funds. The Board also noted that it received and considered information at other regular meetings throughout the year, regarding the nature, quality and extent of services provided by the Manager. The Board considered the services to be provided by the Manager, including but not limited to the oversight of PGIM and PGIM Ltd., as well as the provision of fund recordkeeping, compliance and other services to the Fund. With respect to the Manager’s oversight of PGIM and PGIM Ltd., the Board noted that the Manager’s Strategic Investment Research Group, which is a business unit of the Manager, is responsible for monitoring and reporting to the Manager’s senior management on the performance and operations of PGIM and PGIM Ltd. The Board also noted that the Manager pays the salaries of all the officers and interested Trustees of the Fund who are members of management. The Board reviewed the qualifications, backgrounds and responsibilities of the Manager’s senior management responsible for the oversight of the Fund, PGIM and PGIM Ltd., and was also provided with information pertaining to the Manager’s organizational structure, senior management, investment operations and other relevant information. The Board further noted that it received favorable compliance reports from the Fund’s Chief Compliance Officer as to the Manager. The Board noted that it had concluded that it was satisfied with the nature, quality and extent of the services provided by the Manager to the other Prudential Retail Funds and determined that it was reasonable to conclude that the nature, quality and extent of services to be provided by the Manager under the management agreement for the Fund would be similar in nature to those provided under the other management agreements.
With respect to the Subadviser, the Board noted that it had received and considered information about PGIM and PGIM Ltd. at the June 7-9, 2016 meetings in connection with the renewal of the subadvisory agreements between the Manager and PGIM and the sub-subadvisory agreements between PGIM and PGIM Ltd. with respect to other Prudential Retail Funds. The Board also noted that it received and considered information at other regular meetings throughout the year, regarding the nature, quality and extent of services provided by PGIM and PGIM Ltd. The Board considered, among other things, the qualifications, background and experience of PGIM’s portfolio managers who will be responsible for the day-to-day management of the Fund’s portfolio, as well as information on the organizational structure, senior management, investment operations and other relevant information of PGIM and PGIM Ltd. The Board further noted that it received favorable compliance reports from the Fund’s Chief Compliance Officer as to PGIM and PGIM Ltd. The Board noted that it was satisfied with the nature, quality and extent of services provided by PGIM and PGIM Ltd. with respect to the other Prudential Retail Funds
| Visit our website at pgiminvestments.com |
served by PGIM and PGIM Ltd. and determined that it was reasonable to conclude that the nature, quality and extent of services to be provided by PGIM and PGIM Ltd. under the subadvisory agreement for the Fund would be similar in nature to those provided under the other subadvisory agreements. The Board noted that PGIM and PGIM Ltd. are affiliated with the Manager.
Performance
Because the Fund had not yet commenced operations, no investment performance for the Fund existed for Board review. The Board did consider PGIM and PGIM Ltd.’s track record in managing other registered investment companies that follow similar investment strategies. The Board considered the background and professional experience of the proposed portfolio management team for the Fund. The Manager will provide information relating to performance to the Board in connection with future annual reviews of the management agreement and subadvisory agreement.
Fee Rates
The Board considered the proposed management fees of 0.50% of the Fund’s average daily net assets up to $2 billion and 0.485% of the Fund’s average daily net assets over $2 billion to be paid by the Fund to the Manager, and the proposed subadvisory fees at the annual rate of 0.275% of the Fund’s average daily net assets up to $2 billion and 0.235% of the Fund’s daily net assets over $2 billion to be paid by the Manager to the Subadviser.
The Board considered information provided by the Manager comparing the Fund’s proposed management fee rate and total expenses for Class A shares to the Lipper 15(c) Peer Group. The Board noted that the Fund’s contractual management fee was in the first quartile of the Lipper Peer Group (first quartile being the lowest fee). The Board further noted that the anticipated net total expenses for Class A shares were in the first quartile of the Lipper Peer Group (first quartile being the lowest expenses).
Profitability
Because the Fund had not yet commenced operations and the actual asset base of the Fund has not yet been determined, the Board noted that there was no historical profitability information with respect to the Fund to be reviewed. The Board noted that PGIM and PGIM Ltd. are affiliated with the Manager and, as a result, the Board will not separately consider the PGIM’s and PGIM Ltd.’s profitability since their profitability will be reflected in the Manager’s profitability report. The Board noted that it would review profitability information in connection with the annual renewal of the advisory and subadvisory agreements.
| Prudential International Bond Fund | ||
Approval of Advisory Agreements (continued)
Economies of Scale
The Board noted that the proposed management fees payable by the Fund to the Manager contained breakpoints that would reduce the fee rates on assets above specified levels, as did the subadvisory fee payable by the Manager to the Subadviser. The Board considered the potential for the Manager and the Subadviser to experience economies of scale as the amount of assets managed by the Manager and the Subadviser, respectively, increased in size. Because the Fund had not yet commenced operations and the actual asset base of the Fund has not yet been determined, the Board noted that there was no historical information regarding economies of scale with respect to the Fund to be reviewed. The Board noted that it would review such information in connection with the annual renewal of the advisory and subadvisory agreements.
Other Benefits to the Manager and the Subadviser
The Board considered potential “fall-out” or ancillary benefits anticipated to be received by the Manager, PGIM, PGIM Ltd. and their affiliates as a result of their relationships with the Fund. The Board concluded that any potential benefits to be derived by the Manager were similar to benefits derived by the Manager in connection with its management of the other Prudential Retail Funds, which are reviewed on an annual basis. The Board also concluded that any potential benefits to be derived by PGIM and PGIM Ltd. were consistent with those generally derived by subadvisers to the Prudential Retail Funds, and that those benefits are reviewed on an annual basis. The Board concluded that any potential benefits derived by the Manager, PGIM and PGIM Ltd. were consistent with the types of benefits generally derived by investment managers and subadvisers to mutual funds.
* * *
After full consideration of these factors, the Board concluded that the approval of the agreements was in the best interests of the Fund.
| 1 | Prudential Investments LLC is now known as PGIM Investments LLC |
| Visit our website at pgiminvestments.com |
| ∎ TELEPHONE | ∎ WEBSITE | |||
655 Broad Street | (800) 225-1852 | www.pgiminvestments.com |
| PROXY VOTING |
| The Board of Trustees of the Fund has delegated to the Fund’s investment subadviser the responsibility for voting any proxies and maintaining proxy recordkeeping with respect to the Fund. A description of these proxy voting policies and procedures is available without charge, upon request, by calling (800) 225-1852. Information regarding how the Fund voted proxies relating to portfolio securities during the most recent 12-month period ended June 30 is available on the Fund’s website and on the Securities and Exchange Commission’s website. |
| TRUSTEES |
| Ellen S. Alberding • Kevin J. Bannon • Scott E. Benjamin • Linda W. Bynoe • Barry H. Evans • Keith F. Hartstein • Laurie Simon Hodrick • Michael S. Hyland • Stuart S. Parker • Richard A. Redeker • Stephen G. Stoneburn • Grace C. Torres |
| OFFICERS |
| Stuart S. Parker, President • Scott E. Benjamin, Vice President • M. Sadiq Peshimam, Treasurer and Principal Financial and Accounting Officer • Raymond A. O’Hara, Chief Legal Officer • Deborah A. Docs, Secretary • Chad A. Earnst, Chief Compliance Officer • Charles H. Smith, Anti-Money Laundering Compliance Officer • Jonathan D. Shain, Assistant Secretary • Claudia DiGiacomo, Assistant Secretary • Andrew R. French, Assistant Secretary • Peter Parrella, Assistant Treasurer • Lana Lomuti, Assistant Treasurer • Linda McMullin, Assistant Treasurer • Kelly A. Coyne, Assistant Treasurer |
| MANAGER | PGIM Investments LLC | 655 Broad Street Newark, NJ 07102 | ||
| ||||
| INVESTMENT SUBADVISER | PGIM Fixed Income | 655 Broad Street Newark, NJ 07102 | ||
| ||||
| DISTRIBUTOR | Prudential Investment Management Services LLC | 655 Broad Street Newark, NJ 07102 | ||
| ||||
| CUSTODIAN | The Bank of New York Mellon | 225 Liberty Street New York, NY 10286 | ||
| ||||
| TRANSFER AGENT | Prudential Mutual Fund Services LLC | PO Box 9658 Providence, RI 02940 | ||
| ||||
| INDEPENDENT REGISTERED PUBLIC ACCOUNTING FIRM | KPMG LLP | 345 Park Avenue New York, NY 10154 | ||
| ||||
| FUND COUNSEL | Willkie Farr & Gallagher LLP | 787 Seventh Avenue New York, NY 10019 | ||
| ||||
| An investor should consider the investment objectives, risks, charges, and expenses of the Fund carefully before investing. The prospectus and summary prospectus contain this and other information about the Fund. An investor may obtain a prospectus and summary prospectus by visiting our website at www.pgiminvestments.com or by calling (800) 225-1852. The prospectus and summary prospectus should be read carefully before investing. |
| E-DELIVERY |
| To receive your mutual fund documents online, go to www.pgiminvestments.com/edelivery and enroll. Instead of receiving printed documents by mail, you will receive notification via email when new materials are available. You can cancel your enrollment or change your email address at any time by visiting the website address above. |
| SHAREHOLDER COMMUNICATIONS WITH TRUSTEES |
| Shareholders can communicate directly with the Board of Trustees by writing to the Chair of the Board, Prudential International Return Bond Fund, PGIM Investments, Attn: Board of Trustees, 655 Broad Street, Newark, NJ 07102. Shareholders can communicate directly with an individual Trustee by writing to the same address. Communications are not screened before being delivered to the addressee. |
| AVAILABILITY OF PORTFOLIO SCHEDULE |
| The Fund files its complete schedule of portfolio holdings with the Securities and Exchange Commission for the first and third quarters of each fiscal year on Form N-Q. The Fund’s Forms N-Q are available on the Commission’s website at www.sec.gov. The Fund’s Forms N-Q may also be reviewed and copied at the Commission’s Public Reference Room in Washington, D.C. Information on the operation and location of the Public Reference Room may be obtained by calling 1-800-SEC-0330. The Fund’s schedule of portfolio holdings is also available on the Fund’s website as of the end of each month no sooner than 15 days after the end of the month. |
| The Fund’s Statement of Additional Information contains additional information about the Fund’s Trustees and is available without charge, upon request, by calling (800) 225-1852. |
Mutual Funds:
| ARE NOT INSURED BY THE FDIC OR ANY FEDERAL GOVERNMENT AGENCY | MAY LOSE VALUE | ARE NOT A DEPOSIT OF OR GUARANTEED BY ANY BANK OR ANY BANK AFFILIATE |
PRUDENTIAL INTERNATIONAL BOND FUND
| SHARE CLASS | A | C | Q | Z | ||||
| NASDAQ | PXBAX | PXBCX | PXBQX | PXBZX | ||||
| CUSIP | 74441J738 | 74441J720 | 74441J712 | 74441J696 |
MF234E
Item 2 – Code of Ethics — See Exhibit (a)
As of the end of the period covered by this report, the registrant has adopted a code of ethics (the “Section 406 Standards for Investment Companies – Ethical Standards for Principal Executive and Financial Officers”) that applies to the registrant’s Principal Executive Officer and Principal Financial Officer; the registrant’s Principal Financial Officer also serves as the Principal Accounting Officer.
The registrant hereby undertakes to provide any person, without charge, upon request, a copy of the code of ethics. To request a copy of the code of ethics, contact the registrant 800-225-1852, and ask for a copy of the Section 406 Standards for Investment Companies - Ethical Standards for Principal Executive and Financial Officers.
Item 3 – Audit Committee Financial Expert –
The registrant’s Board has determined that Mr. Kevin J. Bannon, member of the Board’s Audit Committee is an “audit committee financial expert,” and that he is “independent,” for purposes of this Item.
Item 4 – Principal Accountant Fees and Services –
(a) Audit Fees
For the fiscal years ended October 31, 2017 and October 31, 2016, KPMG LLP (“KPMG”), the Registrant’s principal accountant, billed the Registrant $190,011 and $155,769 respectively, for professional services rendered for the audit of the Registrant’s annual financial statements or services that are normally provided in connection with statutory and regulatory filings.
(b) Audit-Related Fees
For the fiscal years ended October 31, 2017 and October 31, 2016: none.
(c) Tax Fees
For the fiscal years ended October 31, 2017 and October 31, 2016: none.
(d) All Other Fees
For the fiscal years ended October 31, 2017 and October 31, 2016: none.
(e) (1) Audit Committee Pre-Approval Policies and Procedures
THE PRUDENTIAL MUTUAL FUNDS
AUDIT COMMITTEE POLICY
on
Pre-Approval of Services Provided by the Independent Accountants
The Audit Committee of each Prudential Mutual Fund is charged with the responsibility to monitor the independence of the Fund’s independent accountants. As part of this responsibility, the Audit Committee must pre-approve the independent accounting firm’s engagement to render audit and/or permissible non-audit services, as required by law. In evaluating a proposed engagement of the independent accountants, the Audit Committee will assess the effect that the engagement might reasonably be expected to have on the accountant’s independence. The Committee’s evaluation will be based on:
| • | a review of the nature of the professional services expected to be provided, |
| • | a review of the safeguards put into place by the accounting firm to safeguard independence, and |
| • | periodic meetings with the accounting firm. |
Policy for Audit and Non-Audit Services Provided to the Funds
On an annual basis, the scope of audits for each Fund, audit fees and expenses, and audit-related and non-audit services (and fees proposed in respect thereof) proposed to be performed by the Fund’s independent accountants will be presented by the Treasurer and the independent accountants to the Audit Committee for review and, as appropriate, approval prior to the initiation of such services. Such presentation shall be accompanied by confirmation by both the Treasurer and the independent accountants that the proposed non-audit services will not adversely affect the independence of the independent accountants. Such proposed non-audit services shall be described in sufficient detail to enable the Audit Committee to assess the appropriateness of such services and fees, and the compatibility of the provision of such services with the auditor’s independence. The Committee shall receive periodic reports on the progress of the audit and other services which are approved by the Committee or by the Committee Chair pursuant to authority delegated in this Policy.
The categories of services enumerated under “Audit Services”, “Audit-related Services”, and “Tax Services” are intended to provide guidance to the Treasurer and the independent accountants as to those categories of services which the Committee believes are generally consistent with the independence of the independent accountants and which the Committee (or the Committee Chair) would expect upon the presentation of specific proposals to pre-approve. The enumerated categories are not intended as an exclusive list of audit, audit-related or tax services, which the Committee (or the Committee Chair) would consider for pre-approval.
Audit Services
The following categories of audit services are considered to be consistent with the role of the Fund’s independent accountants:
| Ø | Annual Fund financial statement audits |
| Ø | Seed audits (related to new product filings, as required) |
| Ø | SEC and regulatory filings and consents |
Audit-related Services
The following categories of audit-related services are considered to be consistent with the role of the Fund’s independent accountants:
| Ø | Accounting consultations |
| Ø | Fund merger support services |
| Ø | Agreed Upon Procedure Reports |
| Ø | Attestation Reports |
| Ø | Other Internal Control Reports |
Individual audit-related services that fall within one of these categories (except for fund merger support services) and are not presented to the Audit Committee as part of the annual pre-approval process are subject to an authorized pre-approval by the Audit Committee so long as the estimated fee for those services does not exceed $30,000. Any services provided under such pre-approval will be reported to the Audit Committee at its next regular meeting. Should the amount of such services exceed $30,000 any additional fees will be subject to pre-approval by the Committee Chair (or any other Committee member on whom this responsibility has been delegated). Fees related to fund merger support services are subject to a separate authorized pre-approval by the Audit Committee with fees determined on a per occurrence and merger complexity basis.
Tax Services
The following categories of tax services are considered to be consistent with the role of the Fund’s independent accountants:
| Ø | Tax compliance services related to the filing or amendment of the following: |
| ∎ Federal, state and local income tax compliance; and, |
| ∎ Sales and use tax compliance |
| Ø | Timely RIC qualification reviews |
| Ø | Tax distribution analysis and planning |
| Ø | Tax authority examination services |
| Ø | Tax appeals support services |
| Ø | Accounting methods studies |
| Ø | Fund merger support services |
| Ø | Tax consulting services and related projects |
Individual tax services that fall within one of these categories and are not presented to the Audit Committee as part of the annual pre-approval process are subject to an authorized pre-approval by the Audit Committee so long as the estimated fee for those services does not exceed $30,000. Any services provided under such pre-approval will be reported to the Audit Committee at its next regular meeting. Should the amount of such services exceed $30,000 any additional fees will be subject to pre-approval by the Committee Chair (or any other Committee member on whom this responsibility has been delegated).
Other Non-Audit Services
Certain non-audit services that the independent accountants are legally permitted to render will be subject to pre-approval by the Committee or by one or more Committee members to whom the Committee has
delegated this authority and who will report to the full Committee any pre-approval decisions made pursuant to this Policy. Non-audit services presented for pre-approval pursuant to this paragraph will be accompanied by a confirmation from both the Treasurer and the independent accountants that the proposed services will not adversely affect the independence of the independent accountants.
Proscribed Services
The Fund’s independent accountants will not render services in the following categories of non-audit services:
| Ø | Bookkeeping or other services related to the accounting records or financial statements of the Fund |
| Ø | Financial information systems design and implementation |
| Ø | Appraisal or valuation services, fairness opinions, or contribution-in-kind reports |
| Ø | Actuarial services |
| Ø | Internal audit outsourcing services |
| Ø | Management functions or human resources |
| Ø | Broker or dealer, investment adviser, or investment banking services |
| Ø | Legal services and expert services unrelated to the audit |
| Ø | Any other service that the Public Company Accounting Oversight Board determines, by regulation, is impermissible. |
Pre-approval of Non-Audit Services Provided to Other Entities Within the Prudential Fund Complex
Certain non-audit services provided to PGIM Investments LLC or any of its affiliates that also provide ongoing services to the 30 Mutual Funds will be subject to pre-approval by the Audit Committee. The only non-audit services provided to these entities that will require pre-approval are those related directly to the operations and financial reporting of the Funds. Individual projects that are not presented to the Audit Committee as part of the annual pre-approval process will be subject to pre-approval by the Committee Chair (or any other Committee member on whom this responsibility has been delegated) so long as the estimated fee for those services does not exceed $30,000. Services presented for pre-approval pursuant to this paragraph will be accompanied by a confirmation from both the Treasurer and the independent accountants that the proposed services will not adversely affect the independence of the independent accountants.
Although the Audit Committee will not pre-approve all services provided to PGIM Investments LLC and its affiliates, the Committee will receive an annual report from the Fund’s independent accounting firm showing the aggregate fees for all services provided to PGIM Investments LLC and its affiliates.
(e) (2) Percentage of services referred to in 4(b) – 4(d) that were approved by the audit committee –
For the fiscal years ended October 31, 2017 and October 31, 2016: none.
(f) Percentage of hours expended attributable to work performed by other than full time employees of principal accountant if greater than 50%.
The percentage of hours expended on the principal accountant’s engagement to audit the registrant’s financial statements for the most recent fiscal year that were attributed to work performed by persons other than the principal accountant’s full-time, permanent employees was 0%.
(g) Non-Audit Fees
The aggregate non-audit fees billed by KPMG for services rendered to the registrant’s investment adviser and any entity controlling, controlled by, or under common control with the investment adviser that provides ongoing services to the registrant for the fiscal years ended October 31, 2017 and October 31, 2016 was $0 and $0, respectively.
(h) Principal Accountant’s Independence
Not applicable as KPMG has not provided non-audit services to the registrant’s investment adviser and any entity controlling, controlled by, or under common control with the investment adviser that provides ongoing services to the registrant that were not pre-approved pursuant to Rule 2-01(c)(7)(ii) of Regulation S-X.
| Item 5 – | Audit Committee of Listed Registrants – Not applicable. | |
| Item 6 – | Schedule of Investments – The schedule is included as part of the report to shareholders filed under Item 1 of this Form. | |
| Item 7 – | Disclosure of Proxy Voting Policies and Procedures for Closed-End Management Investment Companies – Not applicable. | |
| Item 8 – | Portfolio Managers of Closed-End Management Investment Companies – Not applicable. | |
| Item 9 – | Purchases of Equity Securities by Closed-End Management Investment Company and Affiliated Purchasers – Not applicable. | |
| Item 10 – | Submission of Matters to a Vote of Security Holders – Not applicable. | |
| Item 11 – | Controls and Procedures | |
| (a) | It is the conclusion of the registrant’s principal executive officer and principal financial officer that the effectiveness of the registrant’s current disclosure controls and procedures (such disclosure controls and procedures having been evaluated within 90 days of the date of this filing) provide reasonable assurance that the information required to be disclosed by the registrant has been recorded, processed, summarized and reported within the time period specified in the Commission’s rules and forms and that the information required to be disclosed by the registrant has been accumulated and communicated to the registrant’s principal executive officer and principal financial officer in order to allow timely decisions regarding required disclosure. |
| (b) | There has been no significant change in the registrant’s internal control over financial reporting that occurred during the registrant’s most recent fiscal quarter of the period covered by this report that has materially affected, or is likely to materially affect, the registrant’s internal control over financial reporting. |
Item 12 – | Exhibits |
| (a) | (1) | Code of Ethics – Attached hereto as Exhibit EX-99.CODE-ETH |
| (2) | Certifications pursuant to Section 302 of the Sarbanes-Oxley Act – Attached hereto as Exhibit EX-99.CERT. | |||||
| (3) | Any written solicitation to purchase securities under Rule 23c-1. – Not applicable. | |||||
| (b) | Certifications pursuant to Section 906 of the Sarbanes-Oxley Act – Attached hereto as Exhibit EX-99.906CERT. | |||||
SIGNATURES
Pursuant to the requirements of the Securities Exchange Act of 1934 and the Investment Company Act of 1940, the registrant has duly caused this report to be signed on its behalf by the undersigned, thereunto duly authorized.
| Registrant: | Prudential Investment Portfolios 9 | |
| By: | /s/ Deborah A. Docs | |
| Deborah A. Docs | ||
| Secretary | ||
| Date: | December 20, 2017 | |
Pursuant to the requirements of the Securities Exchange Act of 1934 and the Investment Company Act of 1940, this report has been signed below by the following persons on behalf of the registrant and in the capacities and on the dates indicated.
| By: | /s/ Stuart S. Parker | |
| Stuart S. Parker | ||
| President and Principal Executive Officer | ||
| Date: | December 20, 2017 | |
| By: | /s/ M. Sadiq Peshimam | |
| M. Sadiq Peshimam | ||
| Treasurer and Principal Financial and Accounting Officer | ||
| Date: | December 20, 2017 | |