UNITED STATES
SECURITIES AND EXCHANGE COMMISSION
Washington, D.C. 20549
FORM N-CSR
CERTIFIED SHAREHOLDER REPORT
OF
REGISTERED MANAGEMENT INVESTMENT COMPANIES
| | |
Investment Company Act file number: | 811-09005 |
Name of Registrant: | Vanguard Massachusetts Tax-Exempt Funds |
Address of Registrant: | P.O. Box 2600 |
| | Valley Forge, PA 19482 |
Name and address of agent for service: | Heidi Stam, Esquire |
| | P.O. Box 876 |
| | Valley Forge, PA 19482 |
Registrant’s telephone number, including area code: (610) 669-1000 |
Date of fiscal year end: November 30 |
Date of reporting period: December 1, 2015 – May 31, 2016 |
Item 1: Reports to Shareholders |

Semiannual Report | May 31, 2016
Vanguard Massachusetts Tax-Exempt Fund
Vanguard’s Principles for Investing Success
We want to give you the best chance of investment success. These principles, grounded in Vanguard’s research and experience, can put you on the right path.
Goals. Create clear, appropriate investment goals.
Balance. Develop a suitable asset allocation using broadly diversified funds. Cost. Minimize cost.
Discipline. Maintain perspective and long-term discipline.
A single theme unites these principles: Focus on the things you can control.
We believe there is no wiser course for any investor.
| |
| Contents | |
| Your Fund’s Total Returns. | 1 |
| Chairman’s Letter. | 2 |
| Advisor’s Report. | 8 |
| Fund Profile. | 11 |
| Performance Summary. | 12 |
| Financial Statements. | 13 |
| About Your Fund’s Expenses. | 34 |
| Trustees Approve Advisory Arrangement. | 36 |
| Glossary. | 37 |
Please note: The opinions expressed in this report are just that—informed opinions. They should not be considered promises or advice.
Also, please keep in mind that the information and opinions cover the period through the date on the front of this report. Of course, the
risks of investing in your fund are spelled out in the prospectus.
See the Glossary for definitions of investment terms used in this report.
About the cover: Pictured is a sailing block on the Brilliant, a 1932 schooner docked in Mystic, Connecticut. A type of pulley, the
sailing block helps coordinate the setting of the sails. At Vanguard, the intricate coordination of technology and people allows
us to help millions of clients around the world reach their financial goals.
Your Fund’s Total Returns
| | | | | |
| Six Months Ended May 31, 2016 | | | | | |
| | | Taxable- | | | |
| | SEC | Equivalent | Income | Capital | Total |
| | Yield | Yield | Returns | Returns | Returns |
| Vanguard Massachusetts Tax-Exempt Fund | 1.60% | 2.98% | 1.53% | 2.27% | 3.80% |
| Barclays MA Municipal Bond Index | | | | | 3.25 |
| Massachusetts Municipal Debt Funds Average | | | | | 3.10 |
Massachusetts Municipal Debt Funds Average: Derived from data provided by Lipper, a Thomson Reuters Company.
The calculation of taxable-equivalent yield assumes a typical itemized tax return and is based on the maximum federal tax rate of 43.4% and
the maximum income tax rate for the state. Local taxes were not considered. Please see the prospectus for a detailed explanation of the
calculation.
| | | | |
| Your Fund’s Performance at a Glance | | | | |
| November 30, 2015, Through May 31, 2016 | | | | |
| | | | Distributions Per Share |
| | Starting | Ending | Income | Capital |
| | Share Price | Share Price | Dividends | Gains |
| Vanguard Massachusetts Tax-Exempt Fund | $10.87 | $11.10 | $0.164 | $0.017 |
1

Chairman’s Letter
Dear Shareholder,
Sustained demand helped the broad U.S. municipal bond market return well over 3% for the six months ended May 31, 2016, outpacing the broad U.S. taxable bond market.
Investors were especially drawn to securities offering additional yield. That preference helped Vanguard Massachusetts Tax-Exempt Fund, as it was tilted toward longer-dated and lower-rated investment-grade munis. The fund returned 3.80% for the six months, exceeding the 3.25% return of its benchmark, the Barclays Massachusetts Municipal Bond Index, and the 3.10% average return of competing Massachusetts tax-exempt funds. The fund’s result also surpassed the 3.42% return for the broad muni bond market, as measured by the Barclays Municipal Bond Index.
Both price appreciation and interest income contributed solidly to the results. The fund’s capital return was 2.27% and its return from interest income was 1.53%.
As municipal bond prices rose, yields fell. (Bond yields and prices move in opposite directions.) The fund’s 30-day SEC yield declined from 2.11% on November 30, 2015, to 1.60% on May 31.
Please note: The fund is permitted to invest in securities whose income is subject to the alternative minimum tax (AMT). However, as of the end of the period, it owned none of these bonds.
2
Bonds enjoyed a strong ride after some early weakness
The broad U.S. taxable bond market returned 3.12% for the half year. After dipping in December, bonds climbed. The yield of the 10-year U.S. Treasury note closed at 1.85% at the end of May, down from 2.22% six months earlier.
The period began with the Federal Reserve’s long-anticipated but small increase in short-term interest rates. Through the succeeding months, mixed signals from Fed officials—as well as from economic data—created uncertainty about when the next increase might take place.
Money market funds and savings accounts produced limited returns as the Fed’s target rate of 0.25%–0.5% remained historically low, despite the quarter-percentage-point rise in December.
International bond markets (as measured by the Barclays Global Aggregate Index ex USD) returned 9.17%. In a reversal from the trend of recent years, foreign currencies strengthened against the dollar, boosting international bonds. Even without this currency benefit, international bond returns were solidly positive.
| | | |
| Market Barometer | | | |
| | Total Returns |
| | Periods Ended May 31, 2016 |
| | Six | One | Five Years |
| | Months | Year | (Annualized) |
| Bonds | | | |
| Barclays U.S. Aggregate Bond Index (Broad taxable | | | |
| market) | 3.12% | 2.99% | 3.33% |
| Barclays Municipal Bond Index (Broad tax-exempt market) | 3.42 | 5.87 | 5.07 |
| Citigroup Three-Month U.S. Treasury Bill Index | 0.10 | 0.12 | 0.05 |
| |
| Stocks | | | |
| Russell 1000 Index (Large-caps) | 1.64% | 0.78% | 11.44% |
| Russell 2000 Index (Small-caps) | -2.86 | -5.97 | 7.86 |
| Russell 3000 Index (Broad U.S. market) | 1.29 | 0.22 | 11.15 |
| FTSE All-World ex US Index (International) | -1.14 | -10.87 | 0.52 |
| |
| CPI | | | |
| Consumer Price Index | 1.22% | 1.02% | 1.23% |
3
In a tale of two halves, stocks fell and then rose
U.S. stocks advanced about 1% for the six months. Equities retreated over the period’s first half before rebounding as a sharp recovery in oil prices seemed to alleviate fears of a global economic slowdown.
International stocks fared worse than their U.S. counterparts, returning about –1%. Emerging-market stocks rose a bit, while stocks from the developed markets of Europe and the Pacific region declined. European stocks lagged amid investor anxiety in the lead-up to the United Kingdom’s June vote on whether to remain in the European Union.
Lower-rated, longer-dated bonds fueled the fund’s strong showing
Even though the Fed raised its target for overnight interest rates toward the close of 2015—the first hike in almost a decade—yields for all but the very shortest-dated munis moved lower. Demand for these longer-dated securities was fueled in part by concerns about the fragile state of global growth.
Other factors included the subdued outlook for inflation (with oil prices volatile but still low) and, toward the end of the period, the Fed’s dampening of expectations for further rate hikes. And with many central banks abroad pursuing further monetary easing, the yields from U.S. bonds, including munis, continued to attract international buyers.
| | |
| Expense Ratios | | |
| Your Fund Compared With Its Peer Group | | |
| | | Peer Group |
| | Fund | Average |
| Massachusetts Tax-Exempt Fund | 0.16% | 1.03% |
The fund expense ratio shown is from the prospectus dated March 29, 2016, and represents estimated costs for the current fiscal year. For
the six months ended May 31, 2016, the fund’s annualized expense ratio was 0.16%. The peer-group expense ratio is derived from data
provided by Lipper, a Thomson Reuters Company, and captures information through year-end 2015.
Peer group: Massachusetts Municipal Debt Funds.
4
In contrast to national trends, tax-exempt bond issuance rose in Massachusetts over the six months. Both refunding of outstanding debt and financing for new capital projects contributed to the increase.
Demand was also solid, and the supply/ demand ratio was relatively balanced compared with some previous periods.
| The potential upside of rising rates |
| |
| Bond fund investors may wonder about the effect of rising interest rates on bond prices— |
| even though the Federal Reserve has raised rates more slowly than anticipated. |
| |
| Initially, as interest rates go up, the market value of bonds in a portfolio will decline, bringing |
| their yields closer to those of newer issues. However, the opportunity to reinvest cash flow |
| into higher-yielding bonds over time can benefit investors who can wait. |
| |
| Consider a hypothetical example of an intermediate-term investment-grade taxable bond fund |
| yielding 2.25%. Assume rates rise by a quarter of a percentage point every January and July |
| from 2016 through 2019, ending at 4.25%. Although the cumulative total return would decline |
| initially, by mid-2023, it would be higher than if rates hadn’t changed. The bond math would be |
| similar for municipal bonds. Of course, the pace and magnitude of rate increases would affect |
| the time until breakeven. |
| |
| The silver lining of higher yields |
| Cumulative rate of return |
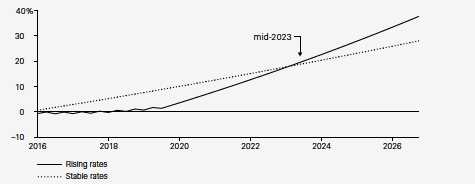
| Notes: This hypothetical example shows the impact on a generic, taxable intermediate-term bond fund if the Federal Reserve raised |
| short-term interest rates by a quarter of a percentage point every January and July from 2016 through 2019. Intermediate-term rates |
| are assumed to rise by the same amount. The bond fund has a duration of 5.5 years. (Duration is a measure of the sensitivity of |
| bond—and bond mutual fund—prices to interest rate movements.) |
| Source: Vanguard. |
5
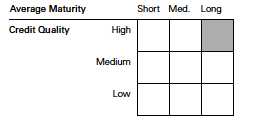
The fund benefited from the expertise and skill of its advisor, Vanguard Fixed Income Group. The fund proved well-positioned as it was overweighted in maturities of ten years or more relative to its benchmark. And it was underweighted in bonds with the highest credit rating in favor of A-rated securities.
The Fixed Income Group also added value by favoring some sectors of the muni market that performed well. Among these were hospital, university, and tax revenue bonds. The advisor’s general obligation holdings also buoyed returns.
For more information about the advisor’s approach and the fund’s positioning during the period, please see the Advisor’s Report that follows this letter.
Consider rebalancing to manage your risk
Let’s say you’ve taken the time to create an appropriate asset allocation for your investment portfolio. Your efforts have produced a diversified mix of stock, bond, and money market funds tailored to your goals, time horizon, and risk tolerance.
But what should you do when your portfolio drifts from its original asset allocation as the financial markets rise or fall? Consider rebalancing to bring it back to the proper mix.
Just one year of outsized returns can throw your allocation out of whack. Take 2013 as an example. That year, the broad stock market (as measured by the Russell 3000 Index) returned 33.55% and the broad taxable bond market (as measured by the Barclays U.S. Aggregate Bond Index) returned –2.02%. A hypothetical portfolio that tracked the broad domestic market indexes and started the year with 60% stocks and 40% bonds would have ended with a more aggressive mix of 67% stocks and 33% bonds.
Rebalancing to bring your portfolio back to its original targets would require you to shift assets away from areas that have been performing well toward those that have been falling behind. That isn’t easy or intuitive. It’s a way to minimize risk rather than maximize returns and to stick with your investment plan through different types of markets. (You can read more about our approach in Best Practices for Portfolio Rebalancing at vanguard.com/research.)
It’s not necessary to check your portfolio every day or every month, much less rebalance it that frequently. It may be more appropriate to monitor it annually or semiannually and rebalance when your allocation swings 5 percentage points or more from its target.
It’s important, of course, to be aware of the tax implications. You’ll want to consult with your tax advisor, but generally speaking, it may be a good idea to make any asset changes within a tax-advantaged retirement account or to direct new cash flows into the underweighted asset class.
6
However you go about it, keeping your asset allocation from drifting too far off target can help you stay on track with the investment plan you’ve crafted to meet your financial goals.
As always, thank you for investing with Vanguard.
Sincerely,

F. William McNabb III
Chairman and Chief Executive Officer
June 10, 2016
7
Advisor’s Report
For the six months ended May 31, 2016, Vanguard Massachusetts Tax-Exempt Fund returned 3.80%. The fund surpassed its benchmark, the Barclays Massachusetts Municipal Bond Index, which returned 3.25%, and its peer group, which had an average return of 3.10%.
The investment environment
When the period began, markets fully expected that the Federal Reserve would start raising interest rates in December. It did raise the federal funds target range that month by a quarter of a percentage point, to 0.25%–0.5%. It cited considerable improvement in labor market conditions and reasonable confidence that inflation would rise over the medium term to the 2% objective. Future rate hikes were expected to be gradual, and the Fed reaffirmed its data-dependent stance.
But a global growth scare and steep declines in commodity prices early in 2016 triggered a large risk-off move in global financial markets. The Fed sounded less eager to raise rates as it considered how deteriorating economic conditions abroad might impede the United States’ ability to reach the central bank’s employment and inflation targets. Market expectations fell from four rate hikes in 2016 to two.
The U.S. economy grew 1.4% in the fourth quarter of 2015, and the growth reading for the first quarter of 2016 was only 0.8%.
| | |
| Yields of Municipal Bonds | | |
| (AAA-Rated General-Obligation Issues) | | |
| | November 30, | May 31, |
| Maturity | 2015 | 2016 |
| 2 years | 0.72% | 0.72% |
| 5 years | 1.26 | 1.09 |
| 10 years | 2.02 | 1.66 |
| 30 years | 2.96 | 2.45 |
| Source: Vanguard. |
8
The strong dollar, combined with weaker global economic and financial conditions overall, is believed to be behind the slowdown; we expect growth to return to about 2% over the coming year.
Although employment gains were strong early in the six-month period, payrolls slumped in May, in part because of a strike by communications workers; that put the average monthly gain for the period at about 170,000. The unemployment rate sank to 4.7% by the end of May, reflecting job gains but also contraction in the labor force. Core inflation ticked up, from 2.1% in December to 2.2% in May, and headline inflation (including food and energy prices, which tend to be volatile) rose from 0.7% in December to 1.0% in May.
The Massachusetts economy has been growing faster than the U.S. economy as a whole, according to a gauge of current economic conditions published monthly by the Federal Reserve Bank of Philadelphia. The bank’s index for Massachusetts rose about 2% between November and April, while the national index rose about 1%.
From its low point in 2009 through April 2016, the bank’s index for Massachusetts climbed about 29%, compared with an increase of about 21% for the U.S. index for the same period. (Each state’s index incorporates data on nonfarm payroll employment, the jobless rate, average hours worked in manufacturing, and inflation-adjusted wage and salary payments.)
Massachusetts’ credit ratings were affirmed by Standard & Poor’s (AA+), Moody’s (Aa1), and Fitch (AA+). Moody’s and Fitch’s outlook for the commonwealth was stable, although S&P’s outlook was negative. While Massachusetts’ solid ratings reflect its fundamentally strong economy, fiscal 2016 revenues lagged projections primarily because of lower investment returns. This left the state with a projected budget gap of over $300 million for the fiscal year ended June 30, 2016. Budget officials reiterated that they had no plans to turn to layoffs, emergency cuts, or reserves to balance the budget.
In January, General Electric announced plans to move its headquarters to Boston from Connecticut—a development that Massachusetts officials hope will boost state revenues. The move is expected to be completed in 2018 and will bring 800 jobs to the commonwealth as well as redevelopment of an area in Boston for GE headquarters.
Management of the fund
We made no material shifts in portfolio strategy or positioning to the Massachusetts Tax-Exempt Fund during the six months. The team continued to focus on driving value through strategic allocation positioning and security selection. Since municipal yields have fallen and the longest-maturity bonds have seen the biggest yield drops and subsequent price increases, the fund’s overweight to bonds with maturities beyond 10 years has provided a performance advantage.
9
A larger allocation to A-rated bonds also helped as investors continued to reach for yield. From a sector standpoint, heavier exposure to hospital, university, and tax-revenue bonds lifted returns. Our general obligation holdings also beat comparative standards.
We continued to overweight premium callable bonds, which outperformed. They will remain a core strategy for us, because they would provide some protection to the funds if rates were to rise sharply. Tactical duration adjustments to take advantage of shorter-term technical conditions added value as well.
We collaborate closely with Vanguard’s experienced team of credit analysts, who perform an objective, thorough, and independent analysis of the overall creditworthiness of these bonds and of every issuer whose bonds we own or consider buying. The muni market is large, fragmented, and often inefficient, so our deep credit analysis bench strength is critical.
A look ahead
Interest rates are likely to remain range-bound for some time, with the pace of U.S. growth setting the floor on rates and weakness in the global economy setting the ceiling.
The Fed left rates unchanged at its May meeting and seems on track to continue tightening at a much slower pace than in previous cycles. That slower pace and possibly a lower final short-term interest rate would most likely keep municipal rates below those of the past 10 to 15 years.
We are starting the second half of the fiscal year neutral on duration and yield-curve positioning but will make tactical adjustments as seasonal opportunities arise.
Higher-yielding segments of the muni market are expected to continue producing modestly positive excess returns, with credit fundamentals improving and investors reaching for yield.
Municipal defaults are likely to remain isolated events. That said, we will try to build an even greater bias in our portfolios toward liquid, favorably structured securities from issuers with solid credit fundamentals. That should provide a cushion if economic growth slackens.
With future Fed hikes remaining dependent on economic data, rate volatility is likely to stay elevated, and short periods of market dislocation are to be expected. The fund’s liquidity should position us to take advantage of any buying opportunities that arise from such dislocation.
As always, our experienced team of portfolio managers, traders, and credit analysts will seek to add value to the portfolio through security selection by identifying bonds that are mispriced by the market.
Christopher W. Alwine, CFA, Principal,
Head of Municipal Group
Marlin G. Brown, Portfolio Manager
Vanguard Fixed Income Group
June 16, 2016
10
Massachusetts Tax-Exempt Fund
Fund Profile
As of May 31, 2016
| | | |
| Financial Attributes | | |
| |
| | | Barclays | MA Barclays |
| | | Municipal | Municipal |
| | | Bond | Bond |
| | Fund | Index | Index |
| Number of Bonds | 351 | 1,774 | 48,863 |
| Yield to Maturity | | | |
| (before expenses) | 1.8% | 1.7% | 1.8% |
| Average Coupon | 4.6% | 4.9% | 4.8% |
| Average Duration | 5.9 years | 6.0 years | 5.8 years |
| Average Stated | | | |
| Maturity | 15.6 years | 12.8 years | 13.0 years |
| Ticker Symbol | VMATX | — | — |
| Expense Ratio1 | 0.16% | — | — |
| 30-Day SEC Yield | 1.60% | — | — |
| Short-Term | | | |
| Reserves | 6.0% | — | — |
| | |
| Volatility Measures | | |
| | Barclays MA | Barclays |
| | Municipal | Municipal |
| | Bond Index | Bond Index |
| R-Squared | 0.99 | 0.98 |
| Beta | 1.21 | 1.18 |
| These measures show the degree and timing of the fund’s |
| fluctuations compared with the indexes over 36 months. |
| |
| Distribution by Stated Maturity | |
| (% of portfolio) | |
| Under 1 Year | 7.9% |
| 1 - 3 Years | 5.3 |
| 3 - 5 Years | 2.8 |
| 5 - 10 Years | 9.8 |
| 10 - 20 Years | 37.6 |
| 20 - 30 Years | 35.0 |
| Over 30 Years | 1.6 |
| |
| Distribution by Credit Quality (% of portfolio) |
| AAA | 14.2% |
| AA | 65.1 |
| A | 12.5 |
| BBB | 7.4 |
| Not Rated | 0.8 |
Credit-quality ratings are obtained from Moody's and S&P, and the higher rating for each issue is shown. "Not Rated" is used to
classify securities for which a rating is not available. Not rated securities include a fund's investment in Vanguard Market Liquidity
Fund or Vanguard Municipal Cash Management Fund, each of which invests in high-quality money market instruments and may
serve as a cash management vehicle for the Vanguard funds, trusts, and accounts. For more information about these ratings, see
the Glossary entry for Credit Quality.
Investment Focus
1 The expense ratio shown is from the prospectus dated March 29, 2016, and represents estimated costs for the current fiscal year. For the
six months ended May 31, 2016, the annualized expense ratio was 0.16%.
11
Massachusetts Tax-Exempt Fund
Performance Summary
All of the returns in this report represent past performance, which is not a guarantee of future results that may be achieved by the fund. (Current performance may be lower or higher than the performance data cited. For performance data current to the most recent month-end, visit our website at vanguard.com/performance.) Note, too, that both investment returns and principal value can fluctuate widely, so an investor’s shares, when sold, could be worth more or less than their original cost. The returns shown do not reflect taxes that a shareholder would pay on fund distributions or on the sale of fund shares.
| | | | |
| Fiscal-Year Total Returns (%): November 30, 2005, Through May 31, 2016 | |
| | | | | Barclays MA |
| | | | | Municipal |
| | | | | Bond Index |
| Fiscal Year | Income Returns | Capital Returns | Total Returns | Total Returns |
| 2006 | 4.38% | 2.16% | 6.54% | 6.13% |
| 2007 | 4.18 | -2.03 | 2.15 | 3.27 |
| 2008 | 4.00 | -6.72 | -2.72 | -1.30 |
| 2009 | 4.42 | 7.94 | 12.36 | 13.60 |
| 2010 | 3.80 | -0.39 | 3.41 | 3.96 |
| 2011 | 3.76 | 2.56 | 6.32 | 6.41 |
| 2012 | 3.49 | 6.92 | 10.41 | 9.57 |
| 2013 | 3.02 | -7.73 | -4.71 | -3.52 |
| 2014 | 3.48 | 5.84 | 9.32 | 7.72 |
| 2015 | 3.15 | 0.62 | 3.77 | 3.14 |
| 2016 | 1.53 | 2.27 | 3.80 | 3.25 |
| Note: For 2016, performance data reflect the six months ended May 31, 2016. |
Average Annual Total Returns: Periods Ended March 31, 2016
This table presents returns through the latest calendar quarter—rather than through the end of the fiscal period.
Securities and Exchange Commission rules require that we provide this information.
| | | | | | |
| | | | | Ten Years |
| | Inception Date | One Year | Five Years | Income | Capital | Total |
| Massachusetts | | | | | | |
| Tax-Exempt Fund | 12/9/1998 | 4.51% | 5.63% | 3.73% | 0.98% | 4.71% |
See Financial Highlights for dividend and capital gains information.
12
Massachusetts Tax-Exempt Fund
Financial Statements (unaudited)
Statement of Net Assets
As of May 31, 2016
The fund reports a complete list of its holdings in regulatory filings four times in each fiscal year, at the quarter-ends. For the second and fourth fiscal quarters, the lists appear in the fund’s semiannual and annual reports to shareholders. For the first and third fiscal quarters, the fund files the lists with the Securities and Exchange Commission on Form N-Q. Shareholders can look up the fund’s Forms N-Q on the SEC’s website at sec.gov. Forms N-Q may also be reviewed and copied at the SEC’s Public Reference Room (see the back cover of this report for further information).
| | | | |
| | | | Face | Market |
| | | Maturity | Amount | Value• |
| | Coupon | Date | ($000) | ($000) |
| Tax-Exempt Municipal Bonds (98.9%) | | | | |
| Massachusetts (98.5%) | | | | |
| Boston MA GO | 5.000% | 2/1/24 | 2,345 | 2,820 |
| Boston MA GO | 5.000% | 3/1/24 | 3,000 | 3,723 |
| Boston MA Housing Authority Revenue | 5.000% | 4/1/23 (4) | 2,000 | 2,144 |
| Boston MA Housing Authority Revenue | 5.000% | 4/1/25 (4) | 5,440 | 5,825 |
| Boston MA Water & Sewer Commission Revenue | 5.000% | 5/1/19 (Prere.) | 3,725 | 4,167 |
| Boston MA Water & Sewer Commission Revenue | 5.000% | 11/1/20 | 1,550 | 1,820 |
| Boston MA Water & Sewer Commission Revenue | 5.000% | 11/1/30 | 1,000 | 1,134 |
| Boston MA Water & Sewer Commission Revenue | 5.000% | 11/1/30 | 750 | 904 |
| Braintree MA GO | 5.000% | 5/15/19 (Prere.) | 4,000 | 4,481 |
| Braintree MA GO | 5.000% | 5/15/26 | 2,300 | 2,976 |
| Cambridge MA GO | 5.000% | 1/1/23 | 850 | 1,019 |
| Cambridge MA GO | 4.000% | 1/1/26 | 1,600 | 1,901 |
| Cambridge MA GO | 4.000% | 1/1/27 | 1,000 | 1,175 |
| Essex MA North Shore Agricultural & Technical | | | | |
| School District GO | 4.000% | 6/1/39 | 2,810 | 3,060 |
| Holyoke MA GO | 5.000% | 9/1/30 | 1,690 | 2,009 |
| Massachusetts Bay Transportation Authority | | | | |
| Assessment Revenue | 5.250% | 7/1/31 | 2,285 | 3,102 |
| Massachusetts Bay Transportation Authority | | | | |
| Assessment Revenue | 5.000% | 7/1/41 | 7,430 | 8,738 |
| Massachusetts Bay Transportation Authority | | | | |
| Sales Tax Revenue | 5.500% | 7/1/17 (ETM) | 75 | 79 |
| Massachusetts Bay Transportation Authority | | | | |
| Sales Tax Revenue | 5.250% | 7/1/18 (Prere.) | 5,215 | 5,691 |
| Massachusetts Bay Transportation Authority | | | | |
| Sales Tax Revenue | 5.250% | 7/1/22 | 3,500 | 4,290 |
| Massachusetts Bay Transportation Authority | | | | |
| Sales Tax Revenue | 5.500% | 7/1/22 | 5,285 | 6,555 |
| Massachusetts Bay Transportation Authority | | | | |
| Sales Tax Revenue | 5.000% | 7/1/23 | 4,000 | 4,936 |
| Massachusetts Bay Transportation Authority | | | | |
| Sales Tax Revenue | 5.250% | 7/1/23 | 2,825 | 3,535 |
| Massachusetts Bay Transportation Authority | | | | |
| Sales Tax Revenue | 5.500% | 7/1/26 (14) | 2,000 | 2,658 |
| Massachusetts Bay Transportation Authority | | | | |
| Sales Tax Revenue | 5.000% | 7/1/27 | 5,000 | 6,456 |
| Massachusetts Bay Transportation Authority | | | | |
| Sales Tax Revenue | 0.000% | 7/1/29 | 1,020 | 571 |
13
| | | | |
| Massachusetts Tax-Exempt Fund | | | | |
| |
| |
| |
| | | | Face | Market |
| | | Maturity | Amount | Value• |
| | Coupon | Date | ($000) | ($000) |
| Massachusetts Bay Transportation Authority | | | | |
| Sales Tax Revenue | 4.000% | 7/1/32 | 2,870 | 3,243 |
| Massachusetts Bay Transportation Authority | | | | |
| Sales Tax Revenue | 5.250% | 7/1/32 | 2,900 | 3,976 |
| Massachusetts Bay Transportation Authority | | | | |
| Sales Tax Revenue | 5.250% | 7/1/33 | 2,000 | 2,768 |
| Massachusetts Bay Transportation Authority | | | | |
| Sales Tax Revenue | 5.250% | 7/1/33 | 10,000 | 13,838 |
| Massachusetts Bay Transportation Authority | | | | |
| Sales Tax Revenue | 5.250% | 7/1/34 | 12,785 | 13,905 |
| Massachusetts Bay Transportation Authority | | | | |
| Sales Tax Revenue | 4.000% | 7/1/35 | 1,980 | 2,200 |
| Massachusetts Bay Transportation Authority | | | | |
| Sales Tax Revenue | 4.000% | 7/1/35 | 3,000 | 3,345 |
| Massachusetts Bay Transportation Authority | | | | |
| Sales Tax Revenue | 5.000% | 7/1/35 | 2,145 | 2,444 |
| 1 Massachusetts Bay Transportation Authority | | | | |
| Sales Tax Revenue TOB VRDO | 0.500% | 6/7/16 | 2,883 | 2,882 |
| Massachusetts Clean Energy Cooperative Corp. | | | | |
| Revenue (Municipal Lighting Plant) | 5.000% | 7/1/26 | 2,875 | 3,486 |
| Massachusetts Clean Energy Cooperative Corp. | | | | |
| Revenue (Municipal Lighting Plant) | 5.000% | 7/1/29 | 2,000 | 2,393 |
| Massachusetts Clean Energy Cooperative Corp. | | | | |
| Revenue (Municipal Lighting Plant) | 5.000% | 7/1/32 | 2,500 | 2,964 |
| Massachusetts Clean Water Trust Revenue | 5.000% | 2/1/28 | 3,000 | 3,705 |
| Massachusetts Clean Water Trust Revenue | 5.000% | 2/1/35 | 3,000 | 3,620 |
| Massachusetts Clean Water Trust Revenue | 5.000% | 2/1/45 | 2,085 | 2,477 |
| Massachusetts College Building Authority | | | | |
| Revenue | 0.000% | 5/1/17 (10) | 3,340 | 3,312 |
| Massachusetts College Building Authority | | | | |
| Revenue | 5.000% | 5/1/25 | 1,100 | 1,327 |
| Massachusetts College Building Authority | | | | |
| Revenue | 5.000% | 5/1/26 | 1,430 | 1,740 |
| Massachusetts College Building Authority | | | | |
| Revenue | 5.000% | 5/1/27 | 1,200 | 1,458 |
| Massachusetts College Building Authority | | | | |
| Revenue | 5.000% | 5/1/29 | 1,500 | 1,711 |
| Massachusetts College Building Authority | | | | |
| Revenue | 5.000% | 5/1/30 | 1,610 | 1,846 |
| Massachusetts College Building Authority | | | | |
| Revenue | 5.000% | 5/1/30 | 1,075 | 1,279 |
| Massachusetts College Building Authority | | | | |
| Revenue | 5.000% | 5/1/31 | 2,000 | 2,421 |
| Massachusetts College Building Authority | | | | |
| Revenue | 5.000% | 5/1/36 | 4,000 | 4,693 |
| Massachusetts College Building Authority | | | | |
| Revenue | 5.000% | 5/1/39 | 3,000 | 3,555 |
| Massachusetts College Building Authority | | | | |
| Revenue | 5.000% | 5/1/41 | 5,000 | 5,830 |
| Massachusetts College Building Authority | | | | |
| Revenue | 5.000% | 5/1/43 | 3,285 | 3,830 |
| Massachusetts Department of Transportation | | | | |
| Metropolitan Highway System Revenue | 5.000% | 1/1/20 | 3,500 | 3,968 |
| Massachusetts Department of Transportation | | | | |
| Metropolitan Highway System Revenue | 5.000% | 1/1/23 | 3,000 | 3,413 |
14
| | | | |
| Massachusetts Tax-Exempt Fund | | | | |
| |
| |
| |
| | | | Face | Market |
| | | Maturity | Amount | Value• |
| | Coupon | Date | ($000) | ($000) |
| Massachusetts Department of Transportation | | | | |
| Metropolitan Highway System Revenue | 5.000% | 1/1/32 | 5,620 | 6,346 |
| Massachusetts Department of Transportation | | | | |
| Metropolitan Highway System Revenue | 5.000% | 1/1/35 | 2,350 | 2,667 |
| Massachusetts Department of Transportation | | | | |
| Metropolitan Highway System Revenue | 5.000% | 1/1/37 | 3,000 | 3,358 |
| Massachusetts Development Finance Agency | | | | |
| Higher Education Revenue (Emerson College) | 5.000% | 1/1/17 (Prere.) | 1,985 | 2,036 |
| Massachusetts Development Finance Agency | | | | |
| Higher Education Revenue (Emerson College) | 5.000% | 1/1/17 (Prere.) | 3,105 | 3,184 |
| Massachusetts Development Finance Agency | | | | |
| Higher Education Revenue (Emerson College) | 5.000% | 1/1/17 (Prere.) | 2,000 | 2,051 |
| Massachusetts Development Finance Agency | | | | |
| Hospital Revenue (Cape Cod Healthcare | | | | |
| Obligated Group) | 5.250% | 11/15/36 | 5,130 | 5,997 |
| Massachusetts Development Finance Agency | | | | |
| Revenue (Baystate Medical Obligated Group) | 5.000% | 7/1/34 | 1,500 | 1,748 |
| Massachusetts Development Finance Agency | | | | |
| Revenue (Bentley University) | 5.000% | 7/1/40 | 3,000 | 3,585 |
| Massachusetts Development Finance Agency | | | | |
| Revenue (Berklee College of Music) | 5.250% | 10/1/41 | 3,300 | 3,873 |
| Massachusetts Development Finance Agency | | | | |
| Revenue (Berkshire Health System) | 5.000% | 10/1/22 | 2,000 | 2,325 |
| Massachusetts Development Finance Agency | | | | |
| Revenue (Berkshire Health System) | 5.000% | 10/1/28 | 1,250 | 1,413 |
| Massachusetts Development Finance Agency | | | | |
| Revenue (Berkshire Health System) | 5.000% | 10/1/29 | 1,500 | 1,691 |
| Massachusetts Development Finance Agency | | | | |
| Revenue (Berkshire Health System) | 5.000% | 10/1/30 | 1,430 | 1,608 |
| Massachusetts Development Finance Agency | | | | |
| Revenue (Berkshire Health System) | 5.000% | 10/1/31 | 1,250 | 1,402 |
| Massachusetts Development Finance Agency | | | | |
| Revenue (Boston College) | 5.000% | 7/1/19 | 500 | 562 |
| Massachusetts Development Finance Agency | | | | |
| Revenue (Boston College) | 5.000% | 7/1/40 | 2,000 | 2,269 |
| Massachusetts Development Finance Agency | | | | |
| Revenue (Boston Medical Center) | 5.000% | 7/1/22 (Prere.) | 470 | 570 |
| Massachusetts Development Finance Agency | | | | |
| Revenue (Boston Medical Center) | 5.000% | 7/1/22 (Prere.) | 2,995 | 3,629 |
| Massachusetts Development Finance Agency | | | | |
| Revenue (Boston Medical Center) | 5.000% | 7/1/29 | 2,535 | 2,858 |
| Massachusetts Development Finance Agency | | | | |
| Revenue (Boston Medical Center) | 5.000% | 7/1/44 | 2,000 | 2,282 |
| Massachusetts Development Finance Agency | | | | |
| Revenue (Boston University) | 6.000% | 5/15/29 (2) | 1,400 | 1,786 |
| Massachusetts Development Finance Agency | | | | |
| Revenue (Boston University) | 5.375% | 5/15/39 | 1,575 | 2,037 |
| Massachusetts Development Finance Agency | | | | |
| Revenue (Boston University) | 5.000% | 7/1/42 | 10,000 | 10,438 |
| Massachusetts Development Finance Agency | | | | |
| Revenue (Boston University) | 5.000% | 10/1/48 | 5,000 | 5,832 |
| Massachusetts Development Finance Agency | | | | |
| Revenue (Boston University) | 6.000% | 5/15/59 (10) | 5,575 | 7,361 |
| 2 Massachusetts Development Finance Agency | | | | |
| Revenue (Boston University) PUT | 0.980% | 3/30/17 | 5,000 | 4,995 |
15
| | | | |
| Massachusetts Tax-Exempt Fund | | | | |
| |
| |
| |
| | | | Face | Market |
| | | Maturity | Amount | Value• |
| | Coupon | Date | ($000) | ($000) |
| Massachusetts Development Finance Agency | | | | |
| Revenue (Broad Institute Inc.) | 5.250% | 4/1/37 | 4,000 | 4,650 |
| Massachusetts Development Finance Agency | | | | |
| Revenue (CareGroup Inc.) | 5.000% | 7/1/28 | 3,000 | 3,666 |
| Massachusetts Development Finance Agency | | | | |
| Revenue (CareGroup Inc.) | 5.000% | 7/1/32 | 1,000 | 1,189 |
| Massachusetts Development Finance Agency | | | | |
| Revenue (CareGroup Inc.) | 5.000% | 7/1/33 | 1,000 | 1,187 |
| Massachusetts Development Finance Agency | | | | |
| Revenue (CareGroup Inc.) | 5.000% | 7/1/37 | 1,000 | 1,177 |
| Massachusetts Development Finance Agency | | | | |
| Revenue (CareGroup Inc.) | 5.000% | 7/1/38 | 1,000 | 1,175 |
| Massachusetts Development Finance Agency | | | | |
| Revenue (Carleton-Willard Village) | 5.250% | 12/1/25 | 600 | 669 |
| Massachusetts Development Finance Agency | | | | |
| Revenue (Carleton-Willard Village) | 5.625% | 12/1/30 | 550 | 619 |
| Massachusetts Development Finance Agency | | | | |
| Revenue (Children’s Hospital) | 5.000% | 10/1/34 | 2,440 | 2,941 |
| Massachusetts Development Finance Agency | | | | |
| Revenue (Children’s Hospital) | 5.000% | 10/1/46 | 5,500 | 6,488 |
| Massachusetts Development Finance Agency | | | | |
| Revenue (Commonwealth Contract Assistance) | 5.000% | 5/1/35 | 5,210 | 6,231 |
| Massachusetts Development Finance Agency | | | | |
| Revenue (Commonwealth Contract Assistance) | 5.500% | 2/1/40 | 2,160 | 2,472 |
| Massachusetts Development Finance Agency | | | | |
| Revenue (Deerfield Academy) | 5.000% | 10/1/40 | 4,665 | 5,382 |
| Massachusetts Development Finance Agency | | | | |
| Revenue (Draper Laboratory) | 5.750% | 9/1/18 (Prere.) | 5,000 | 5,548 |
| Massachusetts Development Finance Agency | | | | |
| Revenue (Emerson College) | 5.000% | 1/1/28 | 1,825 | 2,163 |
| Massachusetts Development Finance Agency | | | | |
| Revenue (Emerson College) | 5.000% | 1/1/35 | 3,000 | 3,439 |
| Massachusetts Development Finance Agency | | | | |
| Revenue (Emerson College) | 5.000% | 1/1/40 | 6,000 | 6,487 |
| Massachusetts Development Finance Agency | | | | |
| Revenue (Emerson College) | 5.000% | 1/1/41 | 2,960 | 3,359 |
| Massachusetts Development Finance Agency | | | | |
| Revenue (Harvard University) | 5.000% | 10/15/28 | 1,000 | 1,158 |
| Massachusetts Development Finance Agency | | | | |
| Revenue (Harvard University) | 5.250% | 2/1/34 | 6,000 | 7,065 |
| Massachusetts Development Finance Agency | | | | |
| Revenue (Harvard University) | 5.000% | 10/15/40 | 9,790 | 11,324 |
| Massachusetts Development Finance Agency | | | | |
| Revenue (Lahey Clinic Obligated Group) | 5.000% | 8/15/28 | 750 | 856 |
| Massachusetts Development Finance Agency | | | | |
| Revenue (Lahey Clinic Obligated Group) | 5.000% | 8/15/40 | 1,750 | 2,047 |
| Massachusetts Development Finance Agency | | | | |
| Revenue (Lahey Clinic Obligated Group) | 5.000% | 8/15/45 | 5,000 | 5,824 |
| Massachusetts Development Finance Agency | | | | |
| Revenue (Loomis Obligated Group) | 6.000% | 1/1/33 | 4,000 | 4,583 |
| Massachusetts Development Finance Agency | | | | |
| Revenue (Lowell General Hospital) | 5.000% | 7/1/37 | 4,800 | 5,350 |
| Massachusetts Development Finance Agency | | | | |
| Revenue (Lowell General Hospital) | 5.000% | 7/1/44 | 4,000 | 4,445 |
16
| | | | |
| Massachusetts Tax-Exempt Fund | | | | |
| |
| |
| |
| | | | Face | Market |
| | | Maturity | Amount | Value• |
| | Coupon | Date | ($000) | ($000) |
| Massachusetts Development Finance Agency | | | | |
| Revenue (Massachusetts College of Pharmacy | | | | |
| & Allied Health Sciences) | 5.000% | 7/1/19 | 175 | 196 |
| Massachusetts Development Finance Agency | | | | |
| Revenue (Massachusetts College of Pharmacy | | | | |
| & Allied Health Sciences) | 5.000% | 7/1/21 | 300 | 354 |
| Massachusetts Development Finance Agency | | | | |
| Revenue (Massachusetts College of Pharmacy | | | | |
| & Allied Health Sciences) | 5.000% | 7/1/23 | 250 | 306 |
| Massachusetts Development Finance Agency | | | | |
| Revenue (Massachusetts College of Pharmacy | | | | |
| & Allied Health Sciences) | 5.000% | 7/1/26 | 1,380 | 1,646 |
| Massachusetts Development Finance Agency | | | | |
| Revenue (MCPHS University) | 5.000% | 7/1/31 | 400 | 482 |
| Massachusetts Development Finance Agency | | | | |
| Revenue (MCPHS University) | 5.000% | 7/1/32 | 300 | 361 |
| Massachusetts Development Finance Agency | | | | |
| Revenue (MCPHS University) | 5.000% | 7/1/37 | 450 | 532 |
| Massachusetts Development Finance Agency | | | | |
| Revenue (Merrimack College) | 5.000% | 7/1/32 | 2,000 | 2,147 |
| Massachusetts Development Finance Agency | | | | |
| Revenue (Merrimack College) | 5.250% | 7/1/42 | 1,470 | 1,576 |
| Massachusetts Development Finance Agency | | | | |
| Revenue (Merrimack College) | 5.125% | 7/1/44 | 2,500 | 2,707 |
| Massachusetts Development Finance Agency | | | | |
| Revenue (Milford Regional Medical Center) | 5.625% | 7/15/36 | 1,000 | 1,124 |
| Massachusetts Development Finance Agency | | | | |
| Revenue (Milford Regional Medical Center) | 5.750% | 7/15/43 | 5,755 | 6,499 |
| Massachusetts Development Finance Agency | | | | |
| Revenue (Mount Holyoke College) | 5.000% | 7/1/36 | 1,500 | 1,619 |
| Massachusetts Development Finance Agency | | | | |
| Revenue (Northeastern University) | 5.000% | 10/1/29 | 3,250 | 3,825 |
| Massachusetts Development Finance Agency | | | | |
| Revenue (Northeastern University) | 5.000% | 10/1/30 | 1,750 | 2,063 |
| Massachusetts Development Finance Agency | | | | |
| Revenue (Northeastern University) | 5.000% | 3/1/32 | 950 | 1,115 |
| Massachusetts Development Finance Agency | | | | |
| Revenue (Northeastern University) | 5.000% | 3/1/39 | 3,500 | 4,044 |
| Massachusetts Development Finance Agency | | | | |
| Revenue (Northeastern University) | 5.000% | 3/1/44 | 3,750 | 4,310 |
| Massachusetts Development Finance Agency | | | | |
| Revenue (Olin College) | 5.000% | 11/1/38 | 6,000 | 7,076 |
| Massachusetts Development Finance Agency | | | | |
| Revenue (Partners Healthcare) | 5.000% | 7/1/28 | 2,000 | 2,377 |
| Massachusetts Development Finance Agency | | | | |
| Revenue (Partners Healthcare) | 5.000% | 7/1/29 | 6,000 | 7,493 |
| Massachusetts Development Finance Agency | | | | |
| Revenue (Partners Healthcare) | 5.000% | 7/1/30 | 1,500 | 1,769 |
| Massachusetts Development Finance Agency | | | | |
| Revenue (Partners Healthcare) | 5.000% | 7/1/31 | 5,705 | 6,670 |
| Massachusetts Development Finance Agency | | | | |
| Revenue (Partners Healthcare) | 4.000% | 7/1/32 | 8,000 | 8,988 |
| Massachusetts Development Finance Agency | | | | |
| Revenue (Partners Healthcare) | 5.000% | 7/1/36 | 4,000 | 4,636 |
17
| | | | |
| Massachusetts Tax-Exempt Fund | | | | |
| |
| |
| |
| | | | Face | Market |
| | | Maturity | Amount | Value• |
| | Coupon | Date | ($000) | ($000) |
| Massachusetts Development Finance Agency | | | | |
| Revenue (Partners Healthcare) | 5.000% | 7/1/40 | 3,000 | 3,542 |
| Massachusetts Development Finance Agency | | | | |
| Revenue (Partners Healthcare) | 5.375% | 7/1/41 | 4,000 | 4,574 |
| Massachusetts Development Finance Agency | | | | |
| Revenue (Partners Healthcare) | 5.000% | 7/1/45 | 3,775 | 4,434 |
| Massachusetts Development Finance Agency | | | | |
| Revenue (Phillips Academy) | 5.000% | 9/1/38 | 1,545 | 1,851 |
| Massachusetts Development Finance Agency | | | | |
| Revenue (Phillips Academy) | 5.000% | 9/1/43 | 8,295 | 9,886 |
| Massachusetts Development Finance Agency | | | | |
| Revenue (Seven Hills Foundation Obligated | | | | |
| Group) | 5.000% | 9/1/35 | 2,500 | 2,710 |
| Massachusetts Development Finance Agency | | | | |
| Revenue (Simmons College) | 5.500% | 10/1/28 | 1,000 | 1,201 |
| Massachusetts Development Finance Agency | | | | |
| Revenue (Simmons College) | 5.125% | 10/1/33 | 2,000 | 2,304 |
| Massachusetts Development Finance Agency | | | | |
| Revenue (Simmons College) | 5.000% | 10/1/36 | 2,250 | 2,624 |
| Massachusetts Development Finance Agency | | | | |
| Revenue (Simmons College) | 5.250% | 10/1/39 | 3,000 | 3,486 |
| Massachusetts Development Finance Agency | | | | |
| Revenue (South Shore Hospital Inc.) | 5.000% | 7/1/41 | 2,000 | 2,342 |
| Massachusetts Development Finance Agency | | | | |
| Revenue (Southcoast Health System Obligated | | | | |
| Group) | 5.000% | 7/1/27 | 1,550 | 1,843 |
| Massachusetts Development Finance Agency | | | | |
| Revenue (Sterling & Francine Clark Art Institute) | 5.000% | 7/1/34 | 1,000 | 1,216 |
| Massachusetts Development Finance Agency | | | | |
| Revenue (Sterling & Francine Clark Art Institute) | 5.000% | 7/1/35 | 2,000 | 2,429 |
| Massachusetts Development Finance Agency | | | | |
| Revenue (Suffolk University) | 5.000% | 7/1/30 | 3,000 | 3,273 |
| Massachusetts Development Finance Agency | | | | |
| Revenue (Suffolk University) | 5.125% | 7/1/40 | 3,000 | 3,253 |
| Massachusetts Development Finance Agency | | | | |
| Revenue (Tufts Medical Center) | 6.250% | 1/1/27 | 3,545 | 4,183 |
| Massachusetts Development Finance Agency | | | | |
| Revenue (Tufts Medical Center) | 7.250% | 1/1/32 | 4,500 | 5,457 |
| Massachusetts Development Finance Agency | | | | |
| Revenue (Tufts Medical Center) | 6.750% | 1/1/36 | 850 | 1,005 |
| Massachusetts Development Finance Agency | | | | |
| Revenue (Tufts Medical Center) | 6.875% | 1/1/41 | 2,000 | 2,372 |
| Massachusetts Development Finance Agency | | | | |
| Revenue (Tufts University) | 5.000% | 8/15/38 | 1,000 | 1,206 |
| Massachusetts Development Finance Agency | | | | |
| Revenue (UMass Memorial Medical Center) | 5.000% | 7/1/16 | 275 | 276 |
| Massachusetts Development Finance Agency | | | | |
| Revenue (UMass Memorial Medical Center) | 5.125% | 7/1/26 | 2,750 | 3,126 |
| Massachusetts Development Finance Agency | | | | |
| Revenue (UMass Memorial Medical Center) | 5.500% | 7/1/31 | 5,500 | 6,255 |
| Massachusetts Development Finance Agency | | | | |
| Revenue (Wellesley College) | 5.000% | 7/1/42 | 2,000 | 2,347 |
| Massachusetts Development Finance Agency | | | | |
| Revenue (Western New England University) | 5.000% | 9/1/45 | 2,825 | 3,200 |
18
| | | | |
| Massachusetts Tax-Exempt Fund | | | | |
| |
| |
| |
| | | | Face | Market |
| | | Maturity | Amount | Value• |
| | Coupon | Date | ($000) | ($000) |
| Massachusetts Development Finance Agency | | | | |
| Revenue (WGBH Educational Foundation) | 5.000% | 1/1/36 (12) | 5,000 | 5,272 |
| Massachusetts Development Finance Agency | | | | |
| Revenue (Williams College) | 5.000% | 7/1/38 | 4,000 | 4,777 |
| Massachusetts Development Finance Agency | | | | |
| Revenue (Worcester Polytechnic Institute) | 5.000% | 9/1/50 | 2,650 | 3,021 |
| Massachusetts Development Finance Agency | | | | |
| Special Obligation Revenue | 5.000% | 5/1/34 | 1,295 | 1,527 |
| Massachusetts Development Finance Agency | | | | |
| Special Obligation Revenue | 5.000% | 5/1/39 | 6,470 | 7,552 |
| Massachusetts Development Finance Agency | | | | |
| Special Obligation Revenue | 5.000% | 5/1/39 | 1,000 | 1,167 |
| Massachusetts Educational Financing Authority | | | | |
| Education Loan Revenue | 5.500% | 1/1/17 | 3,000 | 3,081 |
| Massachusetts Federal Highway GAN | | | | |
| (Accelerated Bridge Program) | 5.000% | 6/15/26 | 3,000 | 3,617 |
| Massachusetts Federal Highway Revenue | 5.000% | 6/15/27 | 6,000 | 7,455 |
| Massachusetts GO | 5.000% | 8/1/17 (Prere.) | 1,250 | 1,312 |
| Massachusetts GO | 5.250% | 8/1/17 (Prere.) | 1,500 | 1,579 |
| Massachusetts GO | 5.500% | 11/1/17 | 3,000 | 3,205 |
| Massachusetts GO | 5.000% | 8/1/18 (Prere.) | 4,185 | 4,555 |
| 3 Massachusetts GO | 5.000% | 8/1/18 (Prere.) | 4,535 | 4,942 |
| Massachusetts GO | 5.000% | 8/1/18 (Prere.) | 4,500 | 4,898 |
| Massachusetts GO | 5.000% | 7/1/19 (Prere.) | 780 | 877 |
| Massachusetts GO | 5.500% | 8/1/19 | 5,000 | 5,708 |
| Massachusetts GO | 5.500% | 10/1/19 (12) | 1,000 | 1,149 |
| Massachusetts GO | 5.500% | 10/1/19 (2) | 2,000 | 2,297 |
| Massachusetts GO | 5.500% | 11/1/19 (4) | 5,550 | 6,393 |
| Massachusetts GO | 5.000% | 8/1/22 | 4,400 | 5,362 |
| Massachusetts GO | 5.250% | 8/1/22 | 5,000 | 6,167 |
| Massachusetts GO | 5.000% | 5/1/23 | 2,500 | 3,098 |
| Massachusetts GO | 5.250% | 8/1/23 | 1,000 | 1,263 |
| Massachusetts GO | 5.000% | 11/1/23 | 4,000 | 4,897 |
| Massachusetts GO | 5.000% | 6/1/24 | 3,615 | 4,150 |
| Massachusetts GO | 5.000% | 7/1/24 | 5,765 | 7,018 |
| Massachusetts GO | 5.000% | 11/1/24 | 3,500 | 4,278 |
| Massachusetts GO | 5.000% | 6/1/25 | 3,000 | 3,444 |
| Massachusetts GO | 5.000% | 7/1/25 | 9,000 | 10,943 |
| Massachusetts GO | 5.000% | 11/1/25 (2) | 3,000 | 3,857 |
| Massachusetts GO | 5.000% | 7/1/26 | 9,000 | 10,930 |
| Massachusetts GO | 5.000% | 8/1/26 | 6,500 | 7,742 |
| Massachusetts GO | 5.000% | 7/1/28 | 10,740 | 13,680 |
| Massachusetts GO | 5.000% | 7/1/29 | 16,015 | 20,307 |
| Massachusetts GO | 5.000% | 7/1/30 | 560 | 708 |
| Massachusetts GO | 5.500% | 8/1/30 (2) | 7,000 | 9,664 |
| Massachusetts GO | 4.000% | 8/1/32 | 5,000 | 5,450 |
| Massachusetts GO | 5.000% | 7/1/33 | 7,000 | 8,580 |
| Massachusetts GO | 5.000% | 8/1/33 | 2,000 | 2,348 |
| Massachusetts GO | 4.000% | 5/1/35 | 5,000 | 5,467 |
| Massachusetts GO | 5.000% | 7/1/35 | 4,000 | 4,884 |
| Massachusetts GO | 5.000% | 8/1/36 | 9,000 | 10,494 |
| Massachusetts GO | 5.000% | 7/1/37 | 500 | 606 |
| Massachusetts GO | 5.000% | 8/1/37 | 5,000 | 5,816 |
| Massachusetts GO | 5.000% | 7/1/40 | 13,055 | 15,727 |
| Massachusetts GO | 5.000% | 3/1/41 | 8,000 | 9,506 |
19
| | | | |
| Massachusetts Tax-Exempt Fund | | | | |
| |
| |
| |
| | | | Face | Market |
| | | Maturity | Amount | Value• |
| | Coupon | Date | ($000) | ($000) |
| Massachusetts GO | 4.000% | 9/1/41 | 3,000 | 3,294 |
| Massachusetts GO | 4.000% | 6/1/43 | 7,820 | 8,362 |
| Massachusetts GO | 4.500% | 8/1/43 | 3,705 | 4,104 |
| Massachusetts GO | 4.000% | 5/1/45 | 10,000 | 10,743 |
| Massachusetts GO | 5.000% | 7/1/45 | 12,000 | 14,381 |
| Massachusetts Health & Educational Facilities | | | | |
| Authority Revenue (Baystate Medical Center) | | | | |
| VRDO | 0.350% | 6/1/16 LOC | 6,345 | 6,345 |
| Massachusetts Health & Educational Facilities | | | | |
| Authority Revenue (Baystate Medical Center) | | | | |
| VRDO | 0.350% | 6/1/16 LOC | 4,100 | 4,100 |
| Massachusetts Health & Educational Facilities | | | | |
| Authority Revenue (Baystate Medical Center) | | | | |
| VRDO | 0.390% | 6/7/16 LOC | 4,865 | 4,865 |
| Massachusetts Health & Educational Facilities | | | | |
| Authority Revenue (Berklee College of Music) | 5.000% | 10/1/26 | 1,755 | 1,849 |
| Massachusetts Health & Educational Facilities | | | | |
| Authority Revenue (Boston Medical Center) | 5.000% | 7/1/18 (Prere.) | 315 | 342 |
| Massachusetts Health & Educational Facilities | | | | |
| Authority Revenue (Boston Medical Center) | 5.000% | 7/1/28 | 2,575 | 2,714 |
| Massachusetts Health & Educational Facilities | | | | |
| Authority Revenue (CareGroup) | 5.000% | 7/1/18 (Prere.) | 2,000 | 2,171 |
| Massachusetts Health & Educational Facilities | | | | |
| Authority Revenue (CareGroup) | 5.125% | 7/1/18 (Prere.) | 3,015 | 3,280 |
| Massachusetts Health & Educational Facilities | | | | |
| Authority Revenue (CareGroup) | 5.125% | 7/1/18 (Prere.) | 3,500 | 3,808 |
| Massachusetts Health & Educational Facilities | | | | |
| Authority Revenue (Children’s Hospital) | 5.500% | 12/1/39 | 4,000 | 4,532 |
| Massachusetts Health & Educational Facilities | | | | |
| Authority Revenue (Dana-Farber Cancer Institute) | 5.000% | 12/1/37 | 5,000 | 5,441 |
| Massachusetts Health & Educational Facilities | | | | |
| Authority Revenue (Harvard University) | 6.250% | 4/1/20 | 3,000 | 3,591 |
| Massachusetts Health & Educational Facilities | | | | |
| Authority Revenue (Harvard University) | 5.000% | 12/15/24 | 810 | 929 |
| Massachusetts Health & Educational Facilities | | | | |
| Authority Revenue (Harvard University) | 5.000% | 12/15/30 | 925 | 1,064 |
| Massachusetts Health & Educational Facilities | | | | |
| Authority Revenue (Harvard University) | 5.500% | 11/15/36 | 25,340 | 28,301 |
| Massachusetts Health & Educational Facilities | | | | |
| Authority Revenue (Harvard University) | 5.000% | 10/1/38 | 1,405 | 1,486 |
| Massachusetts Health & Educational Facilities | | | | |
| Authority Revenue (Isabella Stewart Gardner | | | | |
| Museum) | 5.000% | 5/1/27 | 1,650 | 1,835 |
| Massachusetts Health & Educational Facilities | | | | |
| Authority Revenue (Isabella Stewart Gardner | | | | |
| Museum) | 5.000% | 5/1/28 | 2,080 | 2,311 |
| Massachusetts Health & Educational Facilities | | | | |
| Authority Revenue (Lahey Clinic Medical Center) | 5.250% | 8/15/17 (Prere.) | 6,650 | 7,016 |
| Massachusetts Health & Educational Facilities | | | | |
| Authority Revenue (MIT) | 5.000% | 7/1/17 (Prere.) | 3,500 | 3,664 |
| Massachusetts Health & Educational Facilities | | | | |
| Authority Revenue (MIT) | 6.000% | 7/1/18 (Prere.) | 5,000 | 5,538 |
| Massachusetts Health & Educational Facilities | | | | |
| Authority Revenue (MIT) | 5.250% | 7/1/30 | 3,000 | 4,125 |
20
| | | | |
| Massachusetts Tax-Exempt Fund | | | | |
| |
| |
| |
| | | | Face | Market |
| | | Maturity | Amount | Value• |
| | Coupon | Date | ($000) | ($000) |
| Massachusetts Health & Educational Facilities | | | | |
| Authority Revenue (Museum of Fine Arts) VRDO | 0.340% | 6/1/16 | 15,800 | 15,800 |
| Massachusetts Health & Educational Facilities | | | | |
| Authority Revenue (Museum of Fine Arts) VRDO | 0.370% | 6/1/16 | 14,230 | 14,230 |
| Massachusetts Health & Educational Facilities | | | | |
| Authority Revenue (Northeastern University) | 5.000% | 10/1/19 | 3,000 | 3,376 |
| Massachusetts Health & Educational Facilities | | | | |
| Authority Revenue (Northeastern University) | 5.000% | 10/1/23 | 3,435 | 3,742 |
| Massachusetts Health & Educational Facilities | | | | |
| Authority Revenue (Northeastern University) | 5.000% | 10/1/32 | 1,000 | 1,167 |
| Massachusetts Health & Educational Facilities | | | | |
| Authority Revenue (Northeastern University) | 5.000% | 10/1/33 | 3,000 | 3,255 |
| Massachusetts Health & Educational Facilities | | | | |
| Authority Revenue (Partners Healthcare System) | 5.250% | 7/1/29 | 10,000 | 11,238 |
| Massachusetts Health & Educational Facilities | | | | |
| Authority Revenue (Partners Healthcare System) | 5.000% | 7/1/39 | 500 | 556 |
| 1 Massachusetts Health & Educational Facilities | | | | |
| Authority Revenue (Partners Healthcare System) | | | | |
| TOB VRDO | 0.430% | 6/7/16 | 3,800 | 3,800 |
| Massachusetts Health & Educational Facilities | | | | |
| Authority Revenue (Partners Healthcare System) | | | | |
| VRDO | 0.390% | 6/7/16 | 5,100 | 5,100 |
| Massachusetts Health & Educational Facilities | | | | |
| Authority Revenue (South Coast Health System) | 5.000% | 7/1/39 | 6,000 | 6,478 |
| Massachusetts Health & Educational Facilities | | | | |
| Authority Revenue (Tufts University) | 5.250% | 2/15/22 | 1,400 | 1,705 |
| Massachusetts Health & Educational Facilities | | | | |
| Authority Revenue (Tufts University) | 5.250% | 2/15/26 | 1,880 | 2,410 |
| Massachusetts Health & Educational Facilities | | | | |
| Authority Revenue (Tufts University) VRDO | 0.330% | 6/1/16 | 3,700 | 3,700 |
| Massachusetts Health & Educational Facilities | | | | |
| Authority Revenue (Tufts University) VRDO | 0.330% | 6/1/16 | 1,000 | 1,000 |
| Massachusetts Health & Educational Facilities | | | | |
| Authority Revenue (Tufts University) VRDO | 0.330% | 6/1/16 | 9,200 | 9,200 |
| Massachusetts Health & Educational Facilities | | | | |
| Authority Revenue (UMass Memorial Medical | | | | |
| Center) | 5.000% | 7/1/21 | 100 | 113 |
| Massachusetts Health & Educational Facilities | | | | |
| Authority Revenue (Wellesley College) VRDO | 0.380% | 6/7/16 | 1,500 | 1,500 |
| Massachusetts Health & Educational Facilities | | | | |
| Authority Revenue (Williams College) | 5.000% | 7/1/31 | 385 | 386 |
| Massachusetts Health & Educational Facilities | | | | |
| Authority Revenue (Winchester Hospital) | 5.250% | 7/1/38 | 2,840 | 3,195 |
| Massachusetts Housing Finance Agency Single | | | | |
| Family Housing Revenue | 2.650% | 12/1/41 | 3,820 | 3,891 |
| Massachusetts Housing Finance Agency Single | | | | |
| Family Housing Revenue | 2.750% | 12/1/41 | 1,150 | 1,168 |
| Massachusetts Housing Finance Agency Single | | | | |
| Family Housing Revenue | 3.500% | 6/1/42 | 1,100 | 1,173 |
| Massachusetts Housing Finance Agency Single | | | | |
| Family Housing Revenue | 4.000% | 12/1/43 | 3,140 | 3,312 |
| Massachusetts Housing Finance Agency Single | | | | |
| Family Housing Revenue | 4.000% | 12/1/44 | 3,140 | 3,362 |
| Massachusetts Housing Finance Agency Single | | | | |
| Family Housing Revenue | 4.000% | 6/1/45 | 1,620 | 1,734 |
21
| | | | |
| Massachusetts Tax-Exempt Fund | | | | |
| |
| |
| |
| | | | Face | Market |
| | | Maturity | Amount | Value• |
| | Coupon | Date | ($000) | ($000) |
| Massachusetts Port Authority Revenue | 5.500% | 7/1/16 (4) | 4,000 | 4,016 |
| Massachusetts Port Authority Revenue | 5.000% | 7/1/17 (4) | 3,000 | 3,137 |
| Massachusetts Port Authority Revenue | 5.000% | 7/1/25 | 1,230 | 1,485 |
| Massachusetts Port Authority Revenue | 5.000% | 7/1/30 | 2,000 | 2,379 |
| Massachusetts Port Authority Revenue | 5.000% | 7/1/31 | 1,800 | 2,134 |
| Massachusetts Port Authority Revenue | 5.000% | 7/1/33 | 4,650 | 5,501 |
| Massachusetts Port Authority Revenue | 5.000% | 7/1/34 | 3,845 | 4,635 |
| Massachusetts Port Authority Revenue | 5.000% | 7/1/35 | 1,500 | 1,821 |
| Massachusetts Port Authority Revenue | 5.000% | 7/1/40 | 6,850 | 8,209 |
| Massachusetts School Building Authority | | | | |
| Dedicated Sales Tax Revenue | 5.000% | 8/15/17 (Prere.) | 4,715 | 4,958 |
| Massachusetts School Building Authority | | | | |
| Dedicated Sales Tax Revenue | 5.000% | 8/15/22 | 5,000 | 6,082 |
| Massachusetts School Building Authority | | | | |
| Dedicated Sales Tax Revenue | 5.000% | 8/15/25 | 3,110 | 3,782 |
| Massachusetts School Building Authority | | | | |
| Dedicated Sales Tax Revenue | 5.000% | 8/15/26 | 5,000 | 6,072 |
| Massachusetts School Building Authority | | | | |
| Dedicated Sales Tax Revenue | 5.000% | 8/15/27 | 10,000 | 12,121 |
| Massachusetts School Building Authority | | | | |
| Dedicated Sales Tax Revenue | 5.000% | 8/15/28 | 7,250 | 8,776 |
| Massachusetts School Building Authority | | | | |
| Dedicated Sales Tax Revenue | 5.000% | 8/15/29 | 10,000 | 12,059 |
| Massachusetts School Building Authority | | | | |
| Dedicated Sales Tax Revenue | 5.000% | 8/15/30 | 8,000 | 9,661 |
| Massachusetts School Building Authority | | | | |
| Dedicated Sales Tax Revenue | 4.000% | 8/15/32 | 4,000 | 4,487 |
| Massachusetts School Building Authority | | | | |
| Dedicated Sales Tax Revenue | 5.000% | 10/15/32 | 2,400 | 2,811 |
| Massachusetts School Building Authority | | | | |
| Dedicated Sales Tax Revenue | 5.250% | 10/15/35 | 10,000 | 11,842 |
| Massachusetts School Building Authority | | | | |
| Dedicated Sales Tax Revenue | 4.000% | 8/15/36 | 5,000 | 5,531 |
| Massachusetts School Building Authority | | | | |
| Dedicated Sales Tax Revenue | 4.000% | 1/15/37 | 3,000 | 3,272 |
| Massachusetts School Building Authority | | | | |
| Dedicated Sales Tax Revenue | 5.000% | 8/15/37 (2) | 20 | 21 |
| Massachusetts School Building Authority | | | | |
| Dedicated Sales Tax Revenue | 5.000% | 11/15/37 | 5,000 | 6,080 |
| Massachusetts School Building Authority | | | | |
| Dedicated Sales Tax Revenue | 5.000% | 5/15/38 | 2,660 | 3,151 |
| Massachusetts Special Obligation Dedicated | | | | |
| Tax Revenue | 5.500% | 1/1/27 (14) | 13,000 | 16,987 |
| Massachusetts Special Obligation Dedicated | | | | |
| Tax Revenue | 5.500% | 1/1/28 (14) | 3,750 | 4,942 |
| Massachusetts Transportation Fund Revenue | | | | |
| (Accelerated Bridge Program) | 5.000% | 6/1/29 | 2,000 | 2,330 |
| Massachusetts Transportation Fund Revenue | | | | |
| (Accelerated Bridge Program) | 5.000% | 6/1/33 | 2,050 | 2,387 |
| Massachusetts Transportation Fund Revenue | | | | |
| (Accelerated Bridge Program) | 4.000% | 6/1/37 | 1,960 | 2,134 |
| Massachusetts Transportation Fund Revenue | | | | |
| (Accelerated Bridge Program) | 5.000% | 6/1/38 | 2,750 | 3,201 |
22
| | | | |
| Massachusetts Tax-Exempt Fund | | | | |
| |
| |
| |
| | | | Face | Market |
| | | Maturity | Amount | Value• |
| | Coupon | Date | ($000) | ($000) |
| Massachusetts Transportation Fund Revenue | | | | |
| (Accelerated Bridge Program) | 5.000% | 6/1/43 | 5,000 | 5,808 |
| Massachusetts Transportation Fund Revenue | | | | |
| (Accelerated Bridge Program) | 5.000% | 6/1/44 | 5,000 | 5,945 |
| Massachusetts Transportation Fund Revenue | | | | |
| (Rail Enhancement Program) | 5.000% | 6/1/40 | 5,000 | 6,015 |
| Massachusetts Transportation Fund Revenue | | | | |
| (Rail Enhancement Program) | 4.000% | 6/1/45 | 7,300 | 7,999 |
| Massachusetts Transportation Fund Revenue | | | | |
| (Rail Enhancement Program) | 5.000% | 6/1/45 | 5,640 | 6,760 |
| Massachusetts Turnpike Authority Revenue | | | | |
| (Metropolitan Highway System) | 0.000% | 1/1/20 (14) | 3,000 | 2,852 |
| Massachusetts Turnpike Authority Revenue | | | | |
| (Metropolitan Highway System) | 0.000% | 1/1/25 (14) | 5,000 | 4,215 |
| Massachusetts Turnpike Authority Revenue | | | | |
| (Metropolitan Highway System) | 0.000% | 1/1/28 (14) | 6,000 | 4,678 |
| Massachusetts Water Pollution Abatement | | | | |
| Trust Revenue | 5.250% | 8/1/17 | 540 | 542 |
| Massachusetts Water Pollution Abatement | | | | |
| Trust Revenue | 5.000% | 8/1/22 | 3,000 | 3,662 |
| Massachusetts Water Pollution Abatement | | | | |
| Trust Revenue | 5.000% | 8/1/27 | 8,000 | 10,022 |
| Massachusetts Water Pollution Abatement | | | | |
| Trust Revenue | 5.000% | 8/1/28 | 975 | 1,216 |
| Massachusetts Water Pollution Abatement | | | | |
| Trust Revenue | 5.250% | 8/1/29 | 1,520 | 2,060 |
| Massachusetts Water Pollution Abatement | | | | |
| Trust Revenue | 5.750% | 8/1/29 | 190 | 191 |
| Massachusetts Water Pollution Abatement | | | | |
| Trust Revenue | 5.000% | 8/1/32 | 2,415 | 2,792 |
| Massachusetts Water Resources Authority | | | | |
| Revenue | 5.000% | 8/1/16 (Prere.) | 2,005 | 2,020 |
| Massachusetts Water Resources Authority | | | | |
| Revenue | 5.000% | 8/1/16 (Prere.) | 2,995 | 3,017 |
| Massachusetts Water Resources Authority | | | | |
| Revenue | 5.000% | 8/1/17 (Prere.) | 875 | 919 |
| Massachusetts Water Resources Authority | | | | |
| Revenue | 5.000% | 8/1/17 (Prere.) | 500 | 525 |
| Massachusetts Water Resources Authority | | | | |
| Revenue | 5.000% | 8/1/19 (Prere.) | 2,950 | 3,324 |
| Massachusetts Water Resources Authority | | | | |
| Revenue | 5.000% | 8/1/20 (Prere.) | 500 | 580 |
| Massachusetts Water Resources Authority | | | | |
| Revenue | 5.000% | 8/1/20 (Prere.) | 2,775 | 3,218 |
| Massachusetts Water Resources Authority | | | | |
| Revenue | 5.500% | 8/1/20 (4) | 1,000 | 1,180 |
| Massachusetts Water Resources Authority | | | | |
| Revenue | 5.000% | 8/1/21 (Prere.) | 180 | 214 |
| Massachusetts Water Resources Authority | | | | |
| Revenue | 5.000% | 8/1/22 (Prere.) | 2,400 | 2,927 |
| Massachusetts Water Resources Authority | | | | |
| Revenue | 5.500% | 8/1/22 (4) | 1,490 | 1,860 |
| Massachusetts Water Resources Authority | | | | |
| Revenue | 5.000% | 8/1/27 | 5,000 | 6,428 |
| Massachusetts Water Resources Authority | | | | |
| Revenue | 5.000% | 8/1/27 | 2,000 | 2,316 |
23
| | | | |
| Massachusetts Tax-Exempt Fund | | | | |
| |
| |
| |
| | | | Face | Market |
| | | Maturity | Amount | Value• |
| | Coupon | Date | ($000) | ($000) |
| Massachusetts Water Resources Authority | | | | |
| Revenue | 5.000% | 8/1/28 | 800 | 1,022 |
| Massachusetts Water Resources Authority | | | | |
| Revenue | 5.250% | 8/1/31 (4) | 1,000 | 1,367 |
| Massachusetts Water Resources Authority | | | | |
| Revenue | 5.000% | 8/1/34 (14) | 7,500 | 7,856 |
| Massachusetts Water Resources Authority | | | | |
| Revenue | 5.000% | 8/1/35 (14) | 13,025 | 13,658 |
| Massachusetts Water Resources Authority | | | | |
| Revenue | 5.250% | 8/1/35 (4) | 6,310 | 8,774 |
| Massachusetts Water Resources Authority | | | | |
| Revenue | 4.000% | 8/1/36 | 7,200 | 8,082 |
| Massachusetts Water Resources Authority | | | | |
| Revenue | 5.000% | 8/1/36 | 1,700 | 1,712 |
| Massachusetts Water Resources Authority | | | | |
| Revenue | 5.000% | 8/1/36 | 820 | 956 |
| Massachusetts Water Resources Authority | | | | |
| Revenue | 5.000% | 8/1/36 | 2,710 | 3,254 |
| Massachusetts Water Resources Authority | | | | |
| Revenue | 5.000% | 8/1/40 | 2,690 | 3,288 |
| Massachusetts Water Resources Authority | | | | |
| Revenue | 5.000% | 8/1/40 | 5,000 | 6,111 |
| Massachusetts Water Resources Authority | | | | |
| Revenue | 5.000% | 8/1/41 | 4,450 | 5,165 |
| Massachusetts Water Resources Authority | | | | |
| Revenue | 5.000% | 8/1/42 | 1,000 | 1,173 |
| Massachusetts Water Resources Authority | | | | |
| Revenue | 5.250% | 8/1/42 | 10,000 | 11,680 |
| Massachusetts Water Resources Authority | | | | |
| Revenue | 5.000% | 8/1/44 | 8,000 | 9,501 |
| Massachusetts Water Resources Authority | | | | |
| Revenue VRDO | 0.390% | 6/7/16 | 1,550 | 1,550 |
| Massachusetts Water Resources Authority | | | | |
| Revenue VRDO | 0.400% | 6/7/16 | 1,100 | 1,100 |
| Massachusetts Water Resources Authority | | | | |
| Revenue VRDO | 0.420% | 6/7/16 | 11,900 | 11,900 |
| Metropolitan Boston MA Transit Parking Corp. | | | | |
| Revenue | 5.000% | 7/1/31 | 1,000 | 1,147 |
| Metropolitan Boston MA Transit Parking Corp. | | | | |
| Revenue | 5.250% | 7/1/36 | 7,000 | 8,198 |
| Scituate MA GO | 4.000% | 9/15/39 | 3,000 | 3,262 |
| University of Massachusetts Building Authority | | | | |
| Revenue | 5.000% | 11/1/31 | 2,500 | 3,097 |
| University of Massachusetts Building Authority | | | | |
| Revenue | 5.000% | 11/1/32 | 4,060 | 5,003 |
| University of Massachusetts Building Authority | | | | |
| Revenue | 5.000% | 5/1/38 | 2,000 | 2,370 |
| University of Massachusetts Building Authority | | | | |
| Revenue | 5.000% | 5/1/38 (4) | 1,615 | 1,735 |
| University of Massachusetts Building Authority | | | | |
| Revenue | 5.000% | 11/1/39 | 6,695 | 7,930 |
| University of Massachusetts Building Authority | | | | |
| Revenue | 5.000% | 11/1/39 | 3,000 | 3,586 |
| University of Massachusetts Building Authority | | | | |
| Revenue | 5.000% | 11/1/40 | 3,000 | 3,609 |
24
Massachusetts Tax-Exempt Fund
| | | | |
| | | | Face | Market |
| | | Maturity | Amount | Value• |
| | Coupon | Date | ($000) | ($000) |
| University of Massachusetts Building Authority | | | | |
| Revenue | 5.000% | 11/1/44 | 3,365 | 4,003 |
| Worcester MA GO | 5.250% | 8/15/21 (14) | 315 | 316 |
| | | | | 1,446,351 |
| Guam (0.4%) | | | | |
| Guam Government Business Privilege Tax | | | | |
| Revenue | 5.000% | 11/15/33 | 3,000 | 3,515 |
| Guam Government Waterworks Authority Water | | | | |
| & Waste Water System Revenue | 5.500% | 7/1/43 | 2,250 | 2,635 |
| | | | | 6,150 |
| Total Tax-Exempt Municipal Bonds (Cost $1,357,460) | | | 1,452,501 |
| |
| | | | | Amount |
| | | | | ($000) |
| Other Assets and Liabilities (1.1%) | | | | |
| Other Assets | | | | |
| Investment in Vanguard | | | | 119 |
| Receivables for Accrued Income | | | | 17,627 |
| Receivables for Capital Shares Issued | | | | 1,553 |
| Other Assets | | | | 192 |
| Total Other Assets | | | | 19,491 |
| Liabilities | | | | |
| Payables for Capital Shares Redeemed | | | | (915) |
| Payables for Distributions | | | | (930) |
| Payables to Vanguard | | | | (1,247) |
| Other Liabilities | | | | (38) |
| Total Liabilities | | | | (3,130) |
| Net Assets (100%) | | | | |
| Applicable to 132,286,494 outstanding $.001 par value shares of | | | |
| beneficial interest (unlimited authorization) | | | | 1,468,862 |
| Net Asset Value Per Share | | | | $11.10 |
| |
| |
| At May 31, 2016, net assets consisted of: | | | | |
| | | | | Amount |
| | | | | ($000) |
| Paid-in Capital | | | | 1,371,299 |
| Overdistributed Net Investment Income | | | | (24) |
| Accumulated Net Realized Gains | | | | 2,521 |
| Unrealized Appreciation (Depreciation) | | | | |
| Investment Securities | | | | 95,041 |
| Futures Contracts | | | | 25 |
| Net Assets | | | | 1,468,862 |
• See Note A in Notes to Financial Statements.
1 Security exempt from registration under Rule 144A of the Securities Act of 1933. Such securities may be sold in transactions exempt from
registration, normally to qualified institutional buyers. At May 31, 2016, the aggregate value of these securities was $6,682,000,
representing 0.5% of net assets.
2 Adjustable-rate security.
3 Securities with a value of $545,000 have been segregated as initial margin for open futures contracts.
A key to abbreviations and other references follows the Statement of Net Assets.
See accompanying Notes, which are an integral part of the Financial Statements.
25
Massachusetts Tax-Exempt Fund
Key to Abbreviations
ARS—Auction Rate Security.
BAN—Bond Anticipation Note.
COP—Certificate of Participation.
CP—Commercial Paper.
FR—Floating Rate.
GAN—Grant Anticipation Note.
GO—General Obligation Bond.
PILOT—Payments in Lieu of Taxes.
PUT—Put Option Obligation.
RAN—Revenue Anticipation Note.
TAN—Tax Anticipation Note.
TOB—Tender Option Bond.
TRAN—Tax Revenue Anticipation Note.
VRDO—Variable Rate Demand Obligation.
VRDP—Variable Rate Demand Preferred.
(ETM)—Escrowed to Maturity.
(Prere.)—Prerefunded.
Scheduled principal and interest payments are guaranteed by:
(1) MBIA (Municipal Bond Investors Assurance).
(2) AMBAC (Ambac Assurance Corporation).
(3) FGIC (Financial Guaranty Insurance Company).
(4) AGM (Assured Guaranty Municipal Corporation).
(5) BIGI (Bond Investors Guaranty Insurance).
(6) Connie Lee Inc.
(7) FHA (Federal Housing Authority).
(8) CapMAC (Capital Markets Assurance Corporation).
(9) American Capital Access Financial Guaranty Corporation.
(10) XL Capital Assurance Inc.
(11) CIFG (CDC IXIS Financial Guaranty).
(12) AGC (Assured Guaranty Corporation).
(13) BHAC (Berkshire Hathaway Assurance Corporation).
(14) NPFG (National Public Finance Guarantee Corporation).
(15) BAM (Build America Mutual Assurance Company).
(16) MAC (Municipal Assurance Corporation).
(17) RAA (Radian Asset Assurance Inc.).
The insurance does not guarantee the market value of the municipal bonds.
LOC—Scheduled principal and interest payments are guaranteed by bank letter of credit.
26
Massachusetts Tax-Exempt Fund
Statement of Operations
| |
| | Six Months Ended |
| | May 31, 2016 |
| | ($000) |
| Investment Income | |
| Income | |
| Interest | 21,595 |
| Total Income | 21,595 |
| Expenses | |
| The Vanguard Group—Note B | |
| Investment Advisory Services | 75 |
| Management and Administrative | 872 |
| Marketing and Distribution | 142 |
| Custodian Fees | 9 |
| Shareholders’ Reports | 5 |
| Total Expenses | 1,103 |
| Net Investment Income | 20,492 |
| Realized Net Gain (Loss) | |
| Investment Securities Sold | 3,297 |
| Futures Contracts | 78 |
| Realized Net Gain (Loss) | 3,375 |
| Change in Unrealized Appreciation (Depreciation) | |
| Investment Securities | 27,808 |
| Futures Contracts | 25 |
| Change in Unrealized Appreciation (Depreciation) | 27,833 |
| Net Increase (Decrease) in Net Assets Resulting from Operations | 51,700 |
See accompanying Notes, which are an integral part of the Financial Statements.
27
Massachusetts Tax-Exempt Fund
Statement of Changes in Net Assets
| | |
| | Six Months Ended | Year Ended |
| | May 31, | November 30, |
| | 2016 | 2015 |
| | ($000) | ($000) |
| Increase (Decrease) in Net Assets | | |
| Operations | | |
| Net Investment Income | 20,492 | 37,794 |
| Realized Net Gain (Loss) | 3,375 | 2,279 |
| Change in Unrealized Appreciation (Depreciation) | 27,833 | 5,073 |
| Net Increase (Decrease) in Net Assets Resulting from Operations | 51,700 | 45,146 |
| Distributions | | |
| Net Investment Income | (20,482) | (37,794) |
| Realized Capital Gain1 | (2,006) | (7,117) |
| Total Distributions | (22,488) | (44,911) |
| Capital Share Transactions | | |
| Issued | 210,920 | 242,766 |
| Issued in Lieu of Cash Distributions | 16,482 | 32,933 |
| Redeemed | (73,781) | (138,306) |
| Net Increase (Decrease) from Capital Share Transactions | 153,621 | 137,393 |
| Total Increase (Decrease) | 182,833 | 137,628 |
| Net Assets | | |
| Beginning of Period | 1,286,029 | 1,148,401 |
| End of Period2 | 1,468,862 | 1,286,029 |
1 Includes fiscal 2016 and 2015 short-term gain distributions totaling $204,000 and $1,785,000, respectively. Short-term gain distributions are
treated as ordinary income dividends for tax purposes.
2 Net Assets—End of Period includes undistributed (overdistributed) net investment income of ($24,000) and $0.
See accompanying Notes, which are an integral part of the Financial Statements.
28
Massachusetts Tax-Exempt Fund
Financial Highlights
| | | | | | |
| Six Months | | | | | |
| | Ended | | | | | |
| For a Share Outstanding | May 31, | Year Ended November 30, |
| Throughout Each Period | 2016 | 2015 | 2014 | 2013 | 2012 | 2011 |
| Net Asset Value, Beginning of Period | $10.87 | $10.87 | $10.27 | $11.13 | $10.41 | $10.15 |
| Investment Operations | | | | | | |
| Net Investment Income | .164 | .334 | .345 | .340 | .349 | .366 |
| Net Realized and Unrealized Gain (Loss) | | | | | | |
| on Investments | .247 | .067 | .600 | (.860) | .720 | .260 |
| Total from Investment Operations | .411 | .401 | .945 | (.520) | 1.069 | .626 |
| Distributions | | | | | | |
| Dividends from Net Investment Income | (.164) | (. 334) | (. 345) | (. 340) | (. 349) | (. 366) |
| Distributions from Realized Capital Gains | (.017) | (.067) | — | — | — | — |
| Total Distributions | (.181) | (. 401) | (. 345) | (. 340) | (. 349) | (. 366) |
| Net Asset Value, End of Period | $11.10 | $10.87 | $10.87 | $10.27 | $11.13 | $10.41 |
| |
| Total Return1 | 3.80% | 3.77% | 9.32% | -4.71% | 10.41% | 6.32% |
| |
| Ratios/Supplemental Data | | | | | | |
| Net Assets, End of Period (Millions) | $1,469 | $1,286 | $1,148 | $1,001 | $1,127 | $942 |
| Ratio of Total Expenses to | | | | | | |
| Average Net Assets | 0.16% | 0.16% | 0.16% | 0.16% | 0.16% | 0.17% |
| Ratio of Net Investment Income to | | | | | | |
| Average Net Assets | 2.97% | 3.09% | 3.24% | 3.21% | 3.22% | 3.61% |
| Portfolio Turnover Rate | 12% | 15% | 27% | 36% | 13% | 13% |
The expense ratio, net investment income ratio, and turnover rate for the current period have been annualized.
1 Total returns do not include account service fees that may have applied in the periods shown. Fund prospectuses provide information about
any applicable account service fees.
See accompanying Notes, which are an integral part of the Financial Statements.
29
Massachusetts Tax-Exempt Fund
Notes to Financial Statements
Vanguard Massachusetts Tax-Exempt Fund is registered under the Investment Company Act of 1940 as an open-end investment company, or mutual fund. The fund invests in debt instruments of municipal issuers whose ability to meet their obligations may be affected by economic and political developments in the state.
A. The following significant accounting policies conform to generally accepted accounting principles for U.S. investment companies. The fund consistently follows such policies in preparing its financial statements.
1. Security Valuation: Securities are valued as of the close of trading on the New York Stock Exchange (generally 4 p.m., Eastern time) on the valuation date. Bonds and temporary cash investments acquired over 60 days to maturity are valued using the latest bid prices or using valuations based on a matrix system (which considers such factors as security prices, yields, maturities, and ratings), both as furnished by independent pricing services. Other temporary cash investments are valued at amortized cost, which approximates market value. Securities for which market quotations are not readily available, or whose values have been affected by events occurring before the fund’s pricing time but after the close of the securities’ primary markets, are valued by methods deemed by the board of trustees to represent fair value.
2. Futures Contracts: The fund uses futures contracts to invest in fixed income asset classes with greater efficiency and lower cost than is possible through direct investment, to add value when these instruments are attractively priced, or to adjust sensitivity to changes in interest rates. The primary risks associated with the use of futures contracts are imperfect correlation between changes in market values of bonds held by the fund and the prices of futures contracts, and the possibility of an illiquid market. Counterparty risk involving futures is mitigated because a regulated clearinghouse is the counterparty instead of the clearing broker. To further mitigate counterparty risk, the fund trades futures contracts on an exchange, monitors the financial strength of its clearing brokers and clearinghouse, and has entered into clearing agreements with its clearing brokers. The clearinghouse imposes initial margin requirements to secure the fund’s performance and requires daily settlement of variation margin representing changes in the market value of each contract.
Futures contracts are valued at their quoted daily settlement prices. The aggregate settlement values of the contracts are not recorded in the Statement of Net Assets. Fluctuations in the value of the contracts are recorded in the Statement of Net Assets as an asset (liability) and in the Statement of Operations as unrealized appreciation (depreciation) until the contracts are closed, when they are recorded as realized futures gains (losses).
During the six months ended May 31, 2016, the fund’s average investments in long and short futures contracts represented less than 1% and 0% of net assets, respectively, based on the average of aggregate settlement values at each quarter-end during the period.
3. Federal Income Taxes: The fund intends to continue to qualify as a regulated investment company and distribute all of its income. Management has analyzed the fund’s tax positions taken for all open federal income tax years (November 30, 2012–2015), and for the period ended May 31, 2016, and has concluded that no provision for federal income tax is required in the fund’s financial statements.
4. Distributions: Distributions from net investment income are declared daily and paid on the first business day of the following month. Annual distributions from realized capital gains, if any, are recorded on the ex-dividend date.
30
Massachusetts Tax-Exempt Fund
5. Credit Facility: The fund and certain other funds managed by The Vanguard Group (“Vanguard”) participate in a $3.1 billion committed credit facility provided by a syndicate of lenders pursuant to a credit agreement that may be renewed annually; each fund is individually liable for its borrowings, if any, under the credit facility. Borrowings may be utilized for temporary and emergency purposes, and are subject to the fund’s regulatory and contractual borrowing restrictions. The participating funds are charged administrative fees and an annual commitment fee of 0.10% of the undrawn amount of the facility; these fees are allocated to the funds based on a method approved by the fund’s board of trustees and included in Management and Administrative expenses on the fund’s Statement of Operations. Any borrowings under this facility bear interest at a rate based upon the higher of the one-month London Interbank Offered Rate, federal funds effective rate, or overnight bank funding rate plus an agreed-upon spread.
The fund had no borrowings outstanding at May 31, 2016, or at any time during the period then ended.
6. Other: Interest income is accrued daily. Premiums and discounts on debt securities purchased are amortized and accreted, respectively, to interest income over the lives of the respective securities. Security transactions are accounted for on the date securities are bought or sold. Costs used to determine realized gains (losses) on the sale of investment securities are those of the specific securities sold.
B. In accordance with the terms of a Funds’ Service Agreement (the “FSA”) between Vanguard and the fund, Vanguard furnishes to the fund investment advisory, corporate management, administrative, marketing, and distribution services at Vanguard’s cost of operations (as defined by the FSA). These costs of operations are allocated to the fund based on methods and guidelines approved by the board of trustees. Vanguard does not require reimbursement in the current period for certain costs of operations (such as deferred compensation/benefits and risk/insurance costs); the fund’s liability for these costs of operations is included in Payables to Vanguard on the Statement of Net Assets.
Upon the request of Vanguard, the fund may invest up to 0.40% of its net assets as capital in Vanguard. At May 31, 2016, the fund had contributed to Vanguard capital in the amount of $119,000, representing 0.01% of the fund’s net assets and 0.05% of Vanguard’s capitalization. The fund’s trustees and officers are also directors and employees, respectively, of Vanguard.
C. Various inputs may be used to determine the value of the fund’s investments. These inputs are summarized in three broad levels for financial statement purposes. The inputs or methodologies used to value securities are not necessarily an indication of the risk associated with investing in those securities.
Level 1—Quoted prices in active markets for identical securities.
Level 2—Other significant observable inputs (including quoted prices for similar securities, interest rates, prepayment speeds, credit risk, etc.).
Level 3—Significant unobservable inputs (including the fund’s own assumptions used to determine the fair value of investments).
31
Massachusetts Tax-Exempt Fund
The following table summarizes the market value of the fund’s investments as of May 31, 2016, based on the inputs used to value them:
| | | |
| | Level 1 | Level 2 | Level 3 |
| Investments | ($000) | ($000) | ($000) |
| Tax-Exempt Municipal Bonds | — | 1,452,501 | — |
| Futures Contracts—Assets1 | 17 | — | — |
| Futures Contracts—Liabilities1 | (38) | — | — |
| Total | (21) | 1,452,501 | — |
| 1 Represents variation margin on the last day of the reporting period. |
D. At May 31, 2016, the aggregate settlement value of open futures contracts and the related unrealized appreciation (depreciation) were:
| | | | |
| | | | ($000) |
| | | | Aggregate | |
| | | Number of | Settlement | Unrealized |
| | | Long (Short) | Value | Appreciation |
| Futures Contracts | Expiration | Contracts | Long (Short) | (Depreciation) |
| 5-Year U.S. Treasury Note | September 2016 | 81 | 9,729 | 16 |
| 30-Year U.S. Treasury Bond | September 2016 | 26 | 4,246 | 9 |
| | | | | 25 |
Unrealized appreciation (depreciation) on open futures contracts is required to be treated as realized gain (loss) for tax purposes.
E. Capital gain distributions are determined on a tax basis and may differ from realized capital gains for financial reporting purposes. Differences may be permanent or temporary. Permanent differences are reclassified among capital accounts in the financial statements to reflect their tax character. Temporary differences arise when gains or losses are recognized in different periods for financial statement and tax purposes. These differences will reverse at some time in the future. The fund’s tax-basis capital gains and losses are determined only at the end of each fiscal year.
At May 31, 2016, the cost of investment securities for tax purposes was $1,358,318,000. Net unrealized appreciation of investment securities for tax purposes was $94,183,000, consisting of unrealized gains of $94,300,000 on securities that had risen in value since their purchase and $117,000 in unrealized losses on securities that had fallen in value since their purchase.
F. During the six months ended May 31, 2016, the fund purchased $201,315,000 of investment securities and sold $76,037,000 of investment securities, other than temporary cash investments.
32
Massachusetts Tax-Exempt Fund
G. Capital shares issued and redeemed were:
| | |
| | Six Months Ended | Year Ended |
| | May 31, 2016 | November 30, 2015 |
| | Shares | Shares |
| | (000) | (000) |
| Issued | 19,134 | 22,432 |
| Issued in Lieu of Cash Distributions | 1,496 | 3,042 |
| Redeemed | (6,699) | (12,798) |
| Net Increase (Decrease) in Shares Outstanding | 13,931 | 12,676 |
H. Management has determined that no material events or transactions occurred subsequent to May 31, 2016, that would require recognition or disclosure in these financial statements.
33
About Your Fund’s Expenses
As a shareholder of the fund, you incur ongoing costs, which include costs for portfolio management, administrative services, and shareholder reports (like this one), among others. Operating expenses, which are deducted from a fund’s gross income, directly reduce the investment return of the fund.
A fund’s expenses are expressed as a percentage of its average net assets. This figure is known as the expense ratio. The following examples are intended to help you understand the ongoing costs (in dollars) of investing in your fund and to compare these costs with those of other mutual funds. The examples are based on an investment of $1,000 made at the beginning of the period shown and held for the entire period.
The accompanying table illustrates your fund’s costs in two ways:
• Based on actual fund return. This section helps you to estimate the actual expenses that you paid over the period. The ”Ending Account Value“ shown is derived from the fund‘s actual return, and the third column shows the dollar amount that would have been paid by an investor who started with $1,000 in the fund. You may use the information here, together with the amount you invested, to estimate the expenses that you paid over the period.
To do so, simply divide your account value by $1,000 (for example, an $8,600 account value divided by $1,000 = 8.6), then multiply the result by the number given for your fund under the heading ”Expenses Paid During Period.“
• Based on hypothetical 5% yearly return. This section is intended to help you compare your fund‘s costs with those of other mutual funds. It assumes that the fund had a yearly return of 5% before expenses, but that the expense ratio is unchanged. In this case—because the return used is not the fund’s actual return—the results do not apply to your investment. The example is useful in making comparisons because the Securities and Exchange Commission requires all mutual funds to calculate expenses based on a 5% return. You can assess your fund’s costs by comparing this hypothetical example with the hypothetical examples that appear in shareholder reports of other funds.
Note that the expenses shown in the table are meant to highlight and help you compare ongoing costs only and do not reflect transaction costs incurred by the fund for buying and selling securities. Further, the expenses do not include any purchase, redemption, or account service fees described in the fund prospectus. If such fees were applied to your account, your costs would be higher. Your fund does not carry a “sales load.”
The calculations assume no shares were bought or sold during the period. Your actual costs may have been higher or lower, depending on the amount of your investment and the timing of any purchases or redemptions.
You can find more information about the fund’s expenses, including annual expense ratios, in the Financial Statements section of this report. For additional information on operating expenses and other shareholder costs, please refer to your fund’s current prospectus.
34
| | | |
| Six Months Ended May 31, 2016 | | | |
| | Beginning | Ending | Expenses |
| | Account Value | Account Value | Paid During |
| Massachusetts Tax-Exempt Fund | 11/30/2015 | 5/31/2016 | Period |
| Based on Actual Fund Return | $1,000.00 | $1,038.02 | $0.82 |
| Based on Hypothetical 5% Yearly Return | 1,000.00 | 1,024.20 | 0.81 |
The calculations are based on expenses incurred in the most recent six-month period. The fund’s annualized six-month expense ratio for that
period is 0.16%. The dollar amounts shown as “Expenses Paid” are equal to the annualized expense ratio multiplied by the average account
value over the period, multiplied by the number of days in the most recent six-month period, then divided by the number of days in the most
recent 12-month period (183/366).
35
Trustees Approve Advisory Arrangement
The board of trustees of Vanguard Massachusetts Tax-Exempt Fund has renewed the fund’s investment advisory arrangement with The Vanguard Group, Inc. (Vanguard)—through its Fixed Income Group. The board determined that continuing the fund’s internalized management structure was in the best interests of the fund and its shareholders.
The board based its decision upon an evaluation of the advisor’s investment staff, portfolio management process, and performance. The trustees considered the factors discussed below, among others. However, no single factor determined whether the board approved the arrangement. Rather, it was the totality of the circumstances that drove the board’s decision.
Nature, extent, and quality of services
The board reviewed the quality of the fund’s investment management services over both the short and long term, and took into account the organizational depth and stability of the advisor. The board considered that Vanguard has been managing investments for more than three decades. The Fixed Income Group adheres to a sound, disciplined investment management process; the team has considerable experience, stability, and depth.
The board concluded that Vanguard’s experience, stability, depth, and performance, among other factors, warranted continuation of the advisory arrangement.
Investment performance
The board considered the short- and long-term performance of the fund, including any periods of outperformance or underperformance relative to a benchmark index and peer group. The board concluded that the performance was such that the advisory arrangement should continue. Information about the fund’s most recent performance can be found in the Performance Summary section of this report.
Cost
The board concluded that the fund’s expense ratio was well below the average expense ratio charged by funds in its peer group and that the fund’s advisory fee rate was also well below its peer-group average. Information about the fund’s expenses appears in the About Your Fund’s Expenses section of this report as well as in the Financial Statements section.
The board does not conduct a profitability analysis of Vanguard, because of Vanguard’s unique “at-cost” structure. Unlike most other mutual fund management companies, Vanguard is owned by the funds it oversees, and produces “profits” only in the form of reduced expenses for fund shareholders.
The benefit of economies of scale
The board concluded that the fund’s at-cost arrangement with Vanguard ensures that the fund will realize economies of scale as it grows, with the cost to shareholders declining as fund assets increase.
The board will consider whether to renew the advisory arrangement again after a one-year period.
36
Glossary
30-Day SEC Yield. A fund’s 30-day SEC yield is derived using a formula specified by the U.S. Securities and Exchange Commission. Under the formula, data related to the fund’s security holdings in the previous 30 days are used to calculate the fund’s hypothetical net income for that period, which is then annualized and divided by the fund’s estimated average net assets over the calculation period. For the purposes of this calculation, a security’s income is based on its current market yield to maturity (for bonds), its actual income (for asset-backed securities), or its projected dividend yield (for stocks). Because the SEC yield represents hypothetical annualized income, it will differ—at times significantly—from the fund’s actual experience. As a result, the fund’s income distributions may be higher or lower than implied by the SEC yield.
Average Coupon. The average interest rate paid on the fixed income securities held by a fund. It is expressed as a percentage of face value.
Average Duration. An estimate of how much the value of the bonds held by a fund will fluctuate in response to a change in interest rates. To see how the value could change, multiply the average duration by the change in rates. If interest rates rise by 1 percentage point, the value of the bonds in a fund with an average duration of five years would decline by about 5%. If rates decrease by a percentage point, the value would rise by 5%.
Average Stated Maturity. The average length of time until fixed income securities held by a fund reach maturity and are repaid using the maturity date of the security. The figure reflects the proportion of fund assets represented by each security; it also reflects any futures contracts held. In general, the longer the average stated maturity, the more a fund’s share price will fluctuate in response to changes in market interest rates.
Beta. A measure of the magnitude of a fund’s past share-price fluctuations in relation to the ups and downs of a given market index. The index is assigned a beta of 1.00. Compared with a given index, a fund with a beta of 1.20 typically would have seen its share price rise or fall by 12% when the index rose or fell by 10%. For this report, beta is based on returns over the past 36 months for both the fund and the index. Note that a fund’s beta should be reviewed in conjunction with its R-squared (see definition). The lower the R-squared, the less correlation there is between the fund and the index, and the less reliable beta is as an indicator of volatility.
Credit Quality. Credit-quality ratings are measured on a scale that generally ranges from AAA (highest) to D (lowest). Credit-quality ratings are obtained from Moody’s and S&P, and the higher rating for each issue is used. ”Not Rated” is used to classify securities for which a rating is not available.
Expense Ratio. A fund’s total annual operating expenses expressed as a percentage of the fund’s average net assets. The expense ratio includes management and administrative expenses, but does not include the transaction costs of buying and selling portfolio securities.
Inception Date. The date on which the assets of a fund (or one of its share classes) are first invested in accordance with the fund’s investment objective. For funds with a subscription period, the inception date is the day after that period ends. Investment performance is measured from the inception date.
37
R-Squared. A measure of how much of a fund’s past returns can be explained by the returns from the market in general, as measured by a given index. If a fund’s total returns were precisely synchronized with an index’s returns, its R-squared would be 1.00. If the fund’s returns bore no relationship to the index’s returns, its R-squared would be 0. For this report, R-squared is based on returns over the past 36 months for both the fund and the index.
Short-Term Reserves. The percentage of a fund invested in highly liquid, short-term securities that can be readily converted to cash.
Yield to Maturity. The rate of return an investor would receive if the fixed income securities held by a fund were held to their maturity dates.
38
This page intentionally left blank.
The People Who Govern Your Fund
The trustees of your mutual fund are there to see that the fund is operated and managed in your best interests since, as a shareholder, you are a part owner of the fund. Your fund’s trustees also serve on the board of directors of The Vanguard Group, Inc., which is owned by the Vanguard funds and provides services to them on an at-cost basis.
A majority of Vanguard’s board members are independent, meaning that they have no affiliation with Vanguard or the funds they oversee, apart from the sizable personal investments they have made as private individuals. The independent board members have distinguished backgrounds in business, academia, and public service. Each of the trustees and executive officers oversees 198 Vanguard funds.
The following table provides information for each trustee and executive officer of the fund. More information about the trustees is in the Statement of Additional Information, which can be obtained, without charge, by contacting Vanguard at 800-662-7447, or online at vanguard.com.
| |
| InterestedTrustee1 | Rajiv L. Gupta |
| | Born 1945. Trustee Since December 2001.2 Principal |
| F. William McNabb III | Occupation(s) During the Past Five Years and Other |
| Born 1957. Trustee Since July 2009. Chairman of | Experience: Chairman and Chief Executive Officer |
| the Board. Principal Occupation(s) During the Past | (retired 2009) and President (2006–2008) of |
| Five Years and Other Experience: Chairman of the | Rohm and Haas Co. (chemicals); Director of Tyco |
| Board of The Vanguard Group, Inc., and of each of | International plc (diversified manufacturing and |
| the investment companies served by The Vanguard | services), HP Inc. (printer and personal computer |
| Group, since January 2010; Director of The Vanguard | manufacturing), and Delphi Automotive plc |
| Group since 2008; Chief Executive Officer and | (automotive components); Senior Advisor at |
| President of The Vanguard Group, and of each of | New Mountain Capital. |
| the investment companies served by The Vanguard | |
| Group, since 2008; Director of Vanguard Marketing | Amy Gutmann |
| Corporation; Managing Director of The Vanguard | Born 1949. Trustee Since June 2006. Principal |
| Group (1995–2008). | Occupation(s) During the Past Five Years and |
| | Other Experience: President of the University of |
| IndependentTrustees | Pennsylvania; Christopher H. Browne Distinguished |
| | Professor of Political Science, School of Arts and |
| Emerson U. Fullwood | Sciences, and Professor of Communication, Annenberg |
| Born 1948. Trustee Since January 2008. Principal | School for Communication, with secondary faculty |
| Occupation(s) During the Past Five Years and Other | appointments in the Department of Philosophy, School |
| Experience: Executive Chief Staff and Marketing | of Arts and Sciences, and at the Graduate School of |
| Officer for North America and Corporate Vice President | Education, University of Pennsylvania; Trustee of the |
| (retired 2008) of Xerox Corporation (document manage- | National Constitution Center; Chair of the Presidential |
| ment products and services); Executive in Residence | Commission for the Study of Bioethical Issues. |
| and 2009–2010 Distinguished Minett Professor at | |
| the Rochester Institute of Technology; Lead Director | JoAnn Heffernan Heisen |
| of SPX FLOW, Inc. (multi-industry manufacturing); | Born 1950. Trustee Since July 1998. Principal |
| Director of the United Way of Rochester, the University | Occupation(s) During the Past Five Years and |
| of Rochester Medical Center, Monroe Community | Other Experience: Corporate Vice President and |
| College Foundation, North Carolina A&T University, | Chief Global Diversity Officer (retired 2008) and |
| and Roberts Wesleyan College. | Member of the Executive Committee (1997–2008) |
| | of Johnson & Johnson (pharmaceuticals/medical |
| | devices/consumer products); Director of Skytop |
| | Lodge Corporation (hotels) and the Robert Wood |
| | Johnson Foundation; Member of the Advisory |
| | Board of the Institute for Women’s Leadership |
| | at Rutgers University. |
| | |
| F. Joseph Loughrey | Executive Officers | |
| Born 1949. Trustee Since October 2009. Principal | | |
| Occupation(s) During the Past Five Years and Other | Glenn Booraem | |
| Experience: President and Chief Operating Officer | Born 1967. Treasurer Since May 2015. Principal |
| (retired 2009) of Cummins Inc. (industrial machinery); | Occupation(s) During the Past Five Years and |
| Chairman of the Board of Hillenbrand, Inc. (specialized | Other Experience: Principal of The Vanguard Group, |
| consumer services), and of Oxfam America; Director | Inc.; Treasurer of each of the investment companies |
| of SKF AB (industrial machinery), Hyster-Yale Materials | served by The Vanguard Group; Controller of each of |
| Handling, Inc. (forklift trucks), the Lumina Foundation | the investment companies served by The Vanguard |
| for Education, and the V Foundation for Cancer | Group (2010–2015); Assistant Controller of each of |
| Research; Member of the Advisory Council for the | the investment companies served by The Vanguard |
| College of Arts and Letters and of the Advisory Board | Group (2001–2010). | |
| to the Kellogg Institute for International Studies, both | | |
| at the University of Notre Dame. | Thomas J. Higgins | |
| Born 1957. Chief Financial Officer Since September |
| Mark Loughridge | 2008. Principal Occupation(s) During the Past Five |
| Born 1953. Trustee Since March 2012. Principal | Years and Other Experience: Principal of The Vanguard |
| Occupation(s) During the Past Five Years and Other | Group, Inc.; Chief Financial Officer of each of the |
| Experience: Senior Vice President and Chief Financial | investment companies served by The Vanguard Group; |
| Officer (retired 2013) at IBM (information technology | Treasurer of each of the investment companies served |
| services); Fiduciary Member of IBM’s Retirement Plan | by The Vanguard Group (1998–2008). |
| Committee (2004–2013); Director of the Dow Chemical | | |
| Company; Member of the Council on Chicago Booth. | Peter Mahoney | |
| Born 1974. Controller Since May 2015. Principal |
| Scott C. Malpass | Occupation(s) During the Past Five Years and |
| Born 1962. Trustee Since March 2012. Principal | Other Experience: Head of Global Fund Accounting |
| Occupation(s) During the Past Five Years and Other | at The Vanguard Group, Inc.; Controller of each of the |
| Experience: Chief Investment Officer and Vice | investment companies served by The Vanguard Group; |
| President at the University of Notre Dame; Assistant | Head of International Fund Services at The Vanguard |
| Professor of Finance at the Mendoza College of | Group (2008–2014). | |
| Business at Notre Dame; Member of the Notre Dame | | |
| 403(b) Investment Committee, the Board of Advisors | Heidi Stam | |
| for Spruceview Capital Partners, and the Investment | Born 1956. Secretary Since July 2005. Principal |
| Advisory Committee of Major League Baseball; Board | Occupation(s) During the Past Five Years and Other |
| Member of TIFF Advisory Services, Inc., and Catholic | Experience: Managing Director of The Vanguard |
| Investment Services, Inc. (investment advisors). | Group, Inc.; General Counsel of The Vanguard Group; |
| Secretary of The Vanguard Group and of each of the |
| André F. Perold | investment companies served by The Vanguard Group; |
| Born 1952. Trustee Since December 2004. Principal | Director and Senior Vice President of Vanguard |
| Occupation(s) During the Past Five Years and Other | Marketing Corporation. | |
| Experience: George Gund Professor of Finance and | | |
| Banking, Emeritus at the Harvard Business School | Vanguard Senior ManagementTeam |
| (retired 2011); Chief Investment Officer and Managing | Mortimer J. Buckley | James M. Norris |
| Partner of HighVista Strategies LLC (private investment | Kathleen C. Gubanich | Thomas M. Rampulla |
| firm); Director of Rand Merchant Bank; Overseer of | Martha G. King | Glenn W. Reed |
| the Museum of Fine Arts Boston. | John T. Marcante | Karin A. Risi |
| Chris D. McIsaac | |
| Peter F. Volanakis | | |
| Born 1955. Trustee Since July 2009. Principal | | |
| Occupation(s) During the Past Five Years and Other | Chairman Emeritus and Senior Advisor |
| Experience: President and Chief Operating Officer | | |
| (retired 2010) of Corning Incorporated (communications | John J. Brennan | |
| equipment); Trustee of Colby-Sawyer College and | Chairman, 1996–2009 | |
| Chairman of its Finance and Enrollment Committee; | Chief Executive Officer and President, 1996–2008 |
| Member of the Advisory Board of the Norris Cotton | | |
| Cancer Center. | Founder | |
| | John C. Bogle | |
| | Chairman and Chief Executive Officer, 1974–1996 |
1 Mr. McNabb is considered an “interested person,” as defined in the Investment Company Act of 1940, because he is an officer of the Vanguard funds.
2 December 2002 for Vanguard Equity Income Fund, the Vanguard Municipal Bond Funds, and the Vanguard State Tax-Exempt Funds.
| |  |
| | | P.O. Box 2600 |
| | | Valley Forge, PA 19482-2600 |
| |
| |
| |
| Connect with Vanguard® > vanguard.com |
| |
| |
| |
| Fund Information > 800-662-7447 | | CFA® is a registered trademark owned by CFA Institute. |
| Direct Investor Account Services > 800-662-2739 | |
| Institutional Investor Services > 800-523-1036 | |
| Text Telephone for People | | |
| Who Are Deaf or Hard of Hearing> 800-749-7273 | |
| |
| This material may be used in conjunction | |
| with the offering of shares of any Vanguard | |
| fund only if preceded or accompanied by | |
| the fund’s current prospectus. | |
| |
| All comparative mutual fund data are from Lipper, a | |
| Thomson Reuters Company, or Morningstar, Inc., unless | |
| otherwise noted. | | |
| |
| You can obtain a free copy of Vanguard’s proxy voting | |
| guidelines by visiting vanguard.com/proxyreporting or by | |
| calling Vanguard at 800-662-2739. The guidelines are | |
| also available from the SEC’s website, sec.gov. In | |
| addition, you may obtain a free report on how your fund | |
| voted the proxies for securities it owned during the 12 | |
| months ended June 30. To get the report, visit either | |
| vanguard.com/proxyreporting or sec.gov. | |
| |
| You can review and copy information about your fund at | |
| the SEC’s Public Reference Room in Washington, D.C. To | |
| find out more about this public service, call the SEC at | |
| 202-551-8090. Information about your fund is also | |
| available on the SEC’s website, and you can receive | |
| copies of this information, for a fee, by sending a | |
| request in either of two ways: via email addressed to | |
| publicinfo@sec.gov or via regular mail addressed to the | |
| Public Reference Section, Securities and Exchange | |
| Commission, Washington, DC 20549-1520. | |
| |
| | | © 2016 The Vanguard Group, Inc. |
| | | All rights reserved. |
| | | Vanguard Marketing Corporation, Distributor. |
| |
| | | Q1682 072016 |
Item 2: Code of Ethics.
Not Applicable.
Item 3: Audit Committee Financial Expert.
Not Applicable.
Item 4: Principal Accountant Fees and Services.
(a) Audit Fees.
Not Applicable.
Item 5: Audit Committee of Listed Registrants.
Not Applicable.
Item 6: Investments.
Not Applicable.
Item 7: Disclosure of Proxy Voting Policies and Procedures for Closed-End Management
Investment Companies.
Not Applicable.
Item 8: Portfolio Managers of Closed-End Management Investment Companies.
Not Applicable.
Item 9: Purchase of Equity Securities by Closed-End Management Investment Company and
Affiliated Purchasers.
Not Applicable.
Item 10: Submission of Matters to a Vote of Security Holders.
Not Applicable.
Item 11: Controls and Procedures.
(a) Disclosure Controls and Procedures. The Principal Executive and Financial Officers concluded that the Registrant’s Disclosure Controls and Procedures are effective based on their evaluation of the Disclosure Controls and Procedures as of a date within 90 days of the filing date of this report.
(b) Internal Control Over Financial Reporting. There were no significant changes in Registrant’s Internal Control Over Financial Reporting or in other factors that could significantly affect this control subsequent to the date of the evaluation, including any corrective actions with regard to significant deficiencies and material weaknesses.
Item 12: Exhibits.
(a) Certifications.
Pursuant to the requirements of the Securities Exchange Act of 1934 and the Investment Company Act of 1940, the registrant has duly caused this report to be signed on its behalf by the undersigned, thereunto duly authorized.
| |
| | VANGUARD MASSACHUSETTS TAX-EXEMPT FUNDS |
| |
| |
| BY: | /s/ F. WILLIAM MCNABB III* |
| | F. WILLIAM MCNABB III |
| | CHIEF EXECUTIVE OFFICER |
| |
| Date: July 15, 2016 |
Pursuant to the requirements of the Securities Exchange Act of 1934 and the Investment Company Act of 1940, this report has been signed below by the following persons on behalf of the registrant and in the capacities and on the dates indicated.
| |
| | VANGUARD MASSACHUSETTS TAX-EXEMPT FUNDS |
| |
| BY: | /s/ F. WILLIAM MCNABB III* |
| | F. WILLIAM MCNABB III |
| | CHIEF EXECUTIVE OFFICER |
| Date: July 15, 2016 |
| | VANGUARD MASSACHUSETTS TAX-EXEMPT FUNDS |
| |
| BY: | /s/ THOMAS J. HIGGINS* |
| | THOMAS J. HIGGINS |
| | CHIEF FINANCIAL OFFICER |
| Date: July 15, 2016 |
* By: /s/ Heidi Stam
Heidi Stam, pursuant to a Power of Attorney filed on April 22, 2014 see file Number 2-17620, Incorporated by Reference.