UNITED STATES
SECURITIES AND EXCHANGE COMMISSION
Washington, D.C. 20549
FORM N-CSR
CERTIFIED SHAREHOLDER REPORT
OF
REGISTERED MANAGEMENT INVESTMENT COMPANIES
Investment Company Act file number: 811-09005
Name of Registrant: Vanguard Massachusetts Tax-Exempt Funds
Address of Registrant:
P.O. Box 2600
Valley Forge, PA 19482
Name and address of agent for service:
Heidi Stam, Esquire
P.O. Box 876
Valley Forge, PA 19482
Registrant’s telephone number, including area code: (610) 669-1000
Date of fiscal year end: November 30
Date of reporting period: December 1, 2013 – May 31, 2014
Item 1: Reports to Shareholders

|
| Semiannual Report | May 31, 2014 |
|
| Vanguard Massachusetts Tax-Exempt Fund |

Vanguard’s Principles for Investing Success
We want to give you the best chance of investment success. These principles, grounded in Vanguard’s research and experience, can put you on the right path.
Goals. Create clear, appropriate investment goals.
Balance. Develop a suitable asset allocation using broadly diversified funds. Cost. Minimize cost.
Discipline. Maintain perspective and long-term discipline.
A single theme unites these principles: Focus on the things you can control.
We believe there is no wiser course for any investor.
| |
| Contents | |
| Your Fund’s Total Returns. | 1 |
| Chairman’s Letter. | 2 |
| Advisor’s Report. | 8 |
| Fund Profile. | 11 |
| Performance Summary. | 12 |
| Financial Statements. | 13 |
| About Your Fund’s Expenses. | 31 |
| Trustees Approve Advisory Arrangement. | 33 |
| Glossary. | 34 |
Please note: The opinions expressed in this report are just that—informed opinions. They should not be considered promises or advice.
Also, please keep in mind that the information and opinions cover the period through the date on the front of this report. Of course, the
risks of investing in your fund are spelled out in the prospectus.
See the Glossary for definitions of investment terms used in this report.
About the cover: The ship’s wheel represents leadership and guidance, essential qualities in navigating difficult seas.
This one is a replica based on an 18th-century British vessel. The HMSVanguard, another ship of that era, served as the
flagship for British Admiral Horatio Nelson when he defeated a French fleet at the Battle of the Nile.
Your Fund’s Total Returns
| | | | | |
| Six Months Ended May 31, 2014 | | | | | |
| | | Taxable- | | | |
| | SEC | Equivalent | Income | Capital | Total |
| | Yield | Yield | Returns | Returns | Returns |
| Vanguard Massachusetts Tax-Exempt Fund | 2.40% | 4.47% | 1.76% | 4.77% | 6.53% |
| Barclays MA Municipal Bond Index | | | | | 5.27 |
| Massachusetts Municipal Debt Funds Average | | | | | 6.37 |
Massachusetts Municipal Debt Funds Average: Derived from data provided by Lipper, a Thomson Reuters Company.
The calculation of taxable-equivalent yield assumes a typical itemized tax return and is based on the maximum federal tax rate of 43.4% and
the maximum income tax rate for the state. Local taxes were not considered. Please see the prospectus for a detailed explanation of the
calculation.
Your Fund’s Performance at a Glance
November 30, 2013, Through May 31, 2014
| | | | |
| | | | Distributions Per Share |
| | Starting | Ending | Income | Capital |
| | Share Price | Share Price | Dividends | Gains |
| Vanguard Massachusetts Tax-Exempt Fund | $10.27 | $10.76 | $0.175 | $0.000 |

Chairman’s Letter
Dear Shareholder,
Putting recent challenges behind them, municipal bonds rebounded over the six months ended May 31, 2014.
The bond market as a whole came under pressure in 2013 as interest rates headed higher on the prospect of reduced support from the Federal Reserve. Headlines about the fiscal challenges facing Detroit and Puerto Rico further concerned muni investors. But the tide turned at the beginning of this year when interest rates unexpectedly reversed course. This rekindled investor demand for bonds in general, especially those offering higher yields.
That focus on yield helped lower-rated and longer-dated muni bonds—those segments of the muni market hardest hit by last year’s rise in rates—produce the biggest gains for the period. Vanguard Massachusetts Tax-Exempt Fund returned 6.53%, surpassing the 5.27% return of its benchmark, the Barclays Massachusetts Municipal Bond Index, as well as the 6.37% average return of its peers.
As municipal bond prices rose, yields fell. (Bond yields and prices move in opposite directions.) The fund’s 30-day SEC yield declined from 2.94% on November 30, 2013, to 2.40% on May 31.
2
The fund’s return was both its best fiscal-first-half return since 2009 and one of its highest half-year returns to date. Robust demand and limited supply played a role: The fund’s capital return (from price appreciation) was more than double its income return. Given the current low level of bond yields, however, we shouldn’t expect such exceptionally strong returns from municipal bonds to continue.
Please note: The fund is permitted to invest in securities whose income is subject to the alternative minimum tax (AMT). As of May 31, the fund owned no securities that would generate income distributions subject to the AMT.
Taxable bond yields retreated and stocks continued to rise
Over the six months, the broad U.S. taxable bond market returned 3.28%. The yield of the benchmark 10-year Treasury note ended the six months at 2.47%, down from 2.74% on November 30 and almost 3% on December 31.
It’s worth remembering that these low yields imply lower future returns: As yields tumble, the scope for further declines—and increases in prices—diminishes. This, of course, is true of both taxable and tax-exempt bonds.
International bond markets (as measured by the Barclays Global Aggregate Index ex USD) returned 3.69%.
| | | |
| Market Barometer | | | |
| | Total Returns |
| | Periods Ended May 31, 2014 |
| | Six | One | Five Years |
| | Months | Year | (Annualized) |
| Bonds | | | |
| Barclays U.S. Aggregate Bond Index (Broad taxable | | | |
| market) | 3.28% | 2.71% | 4.96% |
| Barclays Municipal Bond Index (Broad tax-exempt market) | 5.63 | 3.05 | 5.59 |
| Citigroup Three-Month U.S. Treasury Bill Index | 0.00 | 0.04 | 0.07 |
| |
| Stocks | | | |
| Russell 1000 Index (Large-caps) | 7.71% | 20.90% | 18.77% |
| Russell 2000 Index (Small-caps) | -0.10 | 16.79 | 19.32 |
| Russell 3000 Index (Broad U.S. market) | 7.08 | 20.57 | 18.82 |
| FTSE All-World ex US Index (International) | 4.79 | 14.65 | 10.79 |
| |
| CPI | | | |
| Consumer Price Index | 2.07% | 2.13% | 2.15% |
3
The Fed’s target of 0%–0.25% for short-term interest rates continued to restrict returns for money market funds and savings accounts.
U.S. stocks, meanwhile, returned about 7% for the half year ended May 31. Results were positive in five of the six months, declining in January as investors focused on China’s slow growth but then resuming their spirited advance. The Standard & Poor’s 500 Index closed the period at an all-time high.
International stocks, in aggregate, advanced about 5%. Emerging markets and the developed markets of the Pacific region showed some improvement after declines related to the slowdown in China. But they still lagged the robust performance of European stocks.
Appetite for yield, limited supply buoyed Massachusetts munis
The past half year serves as an example of how holding steady with your investments can work out better than trying to time the markets. Last spring, the Fed began bracing investors for a scaling back of its massive bond-buying program, which had been designed to speed the economy’s recovery. Many investors reasonably assumed that reduced demand from the Fed for bonds could hurt prices. And bond prices did decline through the end of 2013.
| | |
| Expense Ratios | | |
| Your Fund Compared With Its Peer Group | | |
| | | Peer Group |
| | Fund | Average |
| Massachusetts Tax-Exempt Fund | 0.16% | 1.10% |
The fund expense ratio shown is from the prospectus dated March 27, 2014, and represents estimated costs for the current fiscal year. For
the six months ended May 31, 2014, the fund’s annualized expense ratio was 0.16%. The peer-group expense ratio is derived from data
provided by Lipper, a Thomson Reuters Company, and captures information through year-end 2013.
Peer group: Massachusetts Municipal Debt Funds.4
The markets rarely evolve precisely as expected, however, and investors who exited the bond market in the second half of 2013 or sought safety in short-term
maturities in anticipation of the Fed’s tapering missed out on the recovery that began early this year, particularly among longer-dated and lower-rated bonds.
| Despite the headlines, muni credit quality remains strong |
| |
| News reports tracking Detroit’s bankruptcy proceedings and Puerto Rico’s continuing fiscal |
| struggles have added to investors’ concerns about the financial strength of state and local |
| governments across the country. But it would be a mistake to paint the more than 55,000 |
| issuers in the $3.7 trillion municipal bond market with the same brush.1 |
| |
| To be sure, some muni issuers face challenges because of unfunded pensions and health |
| care costs. That’s why we believe that in-depth credit research and monitoring are particularly |
| important when investing in this segment of the bond market. That said, U.S. investment-grade |
| muni bonds have a high credit-quality profile overall, especially compared with corporate |
| bonds. As the chart below illustrates, more than 60% of bonds in the Barclays Municipal Bond |
| Index fall into the two highest credit-rating categories (Aaa and Aa) as measured by Moody’s |
| Investors Service. The comparable figure for bonds in the Barclays U.S. Corporate Investment |
| Grade Bond Index is about 11%. |
| |
| Municipal and corporate investment-grade bonds compared by credit rating |
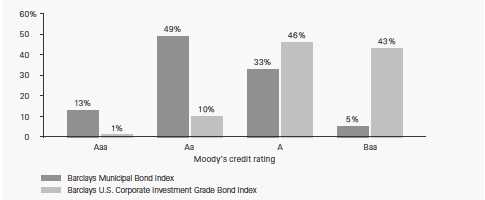
| Note: Data as of May 30, 2014. |
| Sources: Moody’s Investors Service, Barclays, and Vanguard. |
| |
| |
| 1 Number of issuers is from the Municipal Securities Rulemaking Board; size of the municipal bond market is from |
| the Securities Industry and Financial Markets Association. |
5
Several developments were behind the increased demand for bonds, including winter-related weakness in the U.S. economy, slowing growth in China, and political and economic turmoil in some emerging markets.
The muni market saw an even sharper rebound. Muni yields reached levels in the new year that were attractive both on an absolute basis and relative to Treasuries and corporate bonds, and this enticed banks, insurance companies, and hedge funds to buy. Individuals in high income-tax brackets—munis’ traditional buyer base—stepped back in as well, partly attracted by the added allure of tax-exempt securities.
Even as demand for munis grew over the six months, their supply shrank. With municipal issuers still shying away from initiating capital projects and with refinancing to cut borrowing costs having largely run its course, issuance was down by about 25% from the year-earlier period.
As investors continued to search for yield, both the interest rate risk and the credit risk taken by the fund’s advisor, Vanguard Fixed Income Group, were, in general, well-rewarded. The advisor’s outsized allocations to securities with longer maturities contributed the most to the fund’s outperformance of its benchmark and peers.
Credit analysis, an increasingly important tool for navigating the muni market, helped boost the fund’s results. Our in-house analysts’ original, in-depth research helped the advisor identify issues that offered relative value. The advisor was able to largely avoid bonds for which investors were unlikely to be adequately compensated for the risk they would assume.
For better results later, pull the savings lever now
Given the nature of my job, I’m often asked for investment advice—whether I’m at an industry conference or a family gathering. The best guidance I can give? Develop good savings habits. Being a dedicated saver is the first and most important step to becoming a successful investor.
Jack Brennan, my friend and predecessor as Vanguard CEO, devoted an entire chapter to the topic of savings in his 2002 book, Straight Talk on Investing. I think it’s the most valuable chapter in a very valuable book.
As Jack noted, saving is integral to investing. Vanguard’s deeply held investment principles––goals, balance, cost, and discipline––mean nothing if you have no savings to invest in the first place.
We can’t control how the financial markets perform, but we can control how much we save. And it’s those savings that can most affect how much wealth we build. A Vanguard research paper found that “increasing the savings rate can have substantially more positive impact on wealth accumulation than shifting to a more aggressive portfolio.” (You can read the full paper, Penny Saved, Penny Earned, at vanguard.com/research.)
Small shifts from spending to savings can make a meaningful difference. Here’s an example, similar to one Jack cites in his
6
book: A $3 latte each business day adds up to about $750 per year. If instead of buying lattes, you invested that $750 annually and earned a 3% return after reinvesting dividends, you’d end up with about $20,100 after 20 years.
There are a variety of ways to save effectively. First and foremost, if at all possible, contribute to a 401(k), an IRA, or a similar plan to maximize any tax-advantaged opportunities. Whatever you do, pay yourself first. As Warren Buffett said, “Don’t save what is left after spending; spend what is left after saving.”
As always, thank you for investing with Vanguard.
Sincerely,

F. William McNabb III
Chairman and Chief Executive Officer
June 12, 2014
7
Advisor’s Report
For the six months ended May 31, 2014, Vanguard Massachusetts Tax-Exempt Fund returned 6.53%. The fund surpassed its benchmark, the Barclays Massachusetts Municipal Bond Index, which returned 5.27%, and its peer group, which had an average return of 6.37%.
The investment environment
Despite challenges, the municipal market performed strongly over the half year. Cheap valuations, reduced supply, and increasingly attractive tax advantages for those in the highest income brackets pulled investors back into the market. In contrast to most of the nation, however, supply actually increased in Massachusetts, a difference we’ll address in more detail later in this letter.
As the period began, valuations of municipal bonds were low because of the sharp slump last spring and summer, precipitated by expectations that the Federal Reserve would begin tapering its bond-buying program. The Fed eventually succeeded in persuading the markets that dialing back its purchases of about $85 billion per month of U.S. Treasuries and mortgage-backed securities did not mean it would soon raise interest rates. Starting in January, it gradually reduced its purchases to about $45 billion per month as bond yields moved lower.
At times, media attention surrounding the fiscal woes of Puerto Rico and Detroit also weighed on investor sentiment. Puerto Rico, the third-largest bond issuer after California and New York, saw its bonds
| | |
| Yields of Tax-Exempt Municipal Securities | | |
| (AAA-Rated General-Obligation Issues) | | |
| | November 30, | May 31, |
| Maturity | 2013 | 2014 |
| 2 years | 0.33% | 0.15% |
| 5 years | 1.16 | 0.86 |
| 10 years | 2.65 | 2.05 |
| 30 years | 4.10 | 3.26 |
| Source: Vanguard. |
8
downgraded to junk status as it struggled with a weak economy, a budget deficit, and a large debt load. And Detroit’s bankruptcy proceedings took some sharp turns amid wrangling over how much pension funds and bondholders would receive in a final settlement.
Muni investors, however, began to look past such outliers to see that many issuers have made progress in putting their fiscal houses in order since the Great Recession. For states as a whole, tax revenues have been rising for four years. Local governments are also in better shape now that property taxes, which make up a good part of their total revenues, have started to pick up along with the housing market.
Over the past five years, Massachusetts’ labor markets grew more than the nation’s as a whole, according to a gauge of current economic conditions for each state that is published monthly by the Federal Reserve Bank of Philadelphia. The bank’s index for Massachusetts climbed 18% from its low point in 2009 through April 2014, compared with a 12% increase for the U.S. index. (Each state’s index incorporates data on nonfarm payroll employment, the jobless rate, average hours worked in manufacturing, and inflation-adjusted wage and salary payments.)
Through April 2014, Massachusetts’ revenues for its fiscal year (which ends June 30) were trending about 6% higher than for the same period last year, in line with January’s revised forecast. The state’s labor market is also improving: Unemployment declined to 6.0% in April from 7.2% in October. National unemployment fell to 6.3% from 7.2% over the same period.
Management of the fund
During the six months, we focused on opportunities where we believed that holding more risk than the benchmark would be rewarded. That proved to be the case with our overweighting of longer-maturity bonds. These securities, which had fallen out of favor in 2013 as investors expected interest rates to keep rising, contributed significantly to the fund’s performance in the first four months of 2014 as rates actually moved lower.
The fund also earned incrementally more income from some larger allocations to securities considered more risky. With the economy improving and investors reaching for yield, the fund’s lower-rated bonds performed well.
However, unlike many states, Massa-chusetts saw an uptick in its bond issuance—for the first five months of calendar year 2014, its issuance was almost 11% higher than in the same period a year ago. While this increased supply slightly detracted from overall performance of bonds in the state, it did provide opportunities for the fund.
Although the fund turned in a strong performance, there were weak spots along the way. Callable bonds, particularly those issued more than three years ago, did particularly well on a risk-adjusted
9
basis, and the Massachusetts Tax-Exempt Fund’s modest underweighting of these bonds restrained returns a bit.
A look ahead
The strong performance of municipal bonds over the six months has resulted in much fuller valuations, and returns may be more modest for the rest of 2014. Income—rather than price appreciation—is likely to be the main driver of performance.
We expect economic growth to accelerate, allowing the Fed to wrap up its bond purchases by year-end and to begin slowly tightening its monetary policy by raising the federal funds target rate in the second half of 2015. The tightening is likely to end, however, with the rate at a level below the historical average.
After the strong rally that left yields at relatively low levels, we are entering the second half of the fund’s fiscal year in a more defensive stance, with an average duration that is shorter than the benchmark’s. And because investors are likely to keep reaching for yield, the fund remains overweighted in bonds with longer maturities and lower credit-quality ratings as well as to sectors offering an attractive reward for the level of risk taken.
As an eventual tightening of monetary policy is likely to mean more market volatility, we will maintain above-average levels of liquidity to take advantage of any pricing dislocations that may occur.
With regard to Puerto Rico, we are likely to remain largely on the sidelines until we see sustained growth and budget discipline.
Whatever the markets may bring, our experienced team of portfolio managers, traders, and credit analysts will continue to seek out opportunities to add to the fund’s performance through security selection.
Christopher W. Alwine, CFA, Principal,
Head of Municipal Bond Group
Marlin G. Brown, Portfolio Manager
Vanguard Fixed Income Group
June 17, 2014
10
Massachusetts Tax-Exempt Fund
Fund Profile
As of May 31, 2014
| | | |
| Financial Attributes | | |
| |
| | | Barclays | |
| | | MA Barclays |
| | | Municipal | Municipal |
| | | Bond | Bond |
| | Fund | Index | Index |
| Number of Bonds | 269 | 1,607 | 46,274 |
| Yield to Maturity | | | |
| (before expenses) | 2.4% | 2.1% | 2.3% |
| Average Coupon | 4.6% | 4.9% | 4.8% |
| Average Duration | 6.5 years | 7.1 years | 7.2 years |
| Average Stated | | | |
| Maturity | 16.2 years | 12.8 years | 13.4 years |
| Ticker Symbol | VMATX | — | — |
| Expense Ratio1 | 0.16% | — | — |
| 30-Day SEC Yield | 2.40% | — | — |
| Short-Term | | | |
| Reserves | 5.6% | — | — |
| | |
| Volatility Measures | | |
| | Barclays MA | Barclays |
| | Municipal | Municipal |
| | Bond Index | Bond Index |
| R-Squared | 0.99 | 0.99 |
| Beta | 1.14 | 1.17 |
| These measures show the degree and timing of the fund’s fluctuations compared with the indexes over 36 months. |
| |
| Distribution by Stated Maturity | |
| (% of portfolio) | |
| Under 1 Year | 5.3% |
| 1 - 3 Years | 6.3 |
| 3 - 5 Years | 3.0 |
| 5 - 10 Years | 12.2 |
| 10 - 20 Years | 32.0 |
| 20 - 30 Years | 38.1 |
| Over 30 Years | 3.1 |
| |
| Distribution by Credit Quality (% of portfolio) |
| AAA | 16.7% |
| AA | 61.2 |
| A | 14.5 |
| BBB | 7.5 |
| Not Rated | 0.1 |
| For information about these ratings, see the Glossary entry for Credit Quality. |
Investment Focus
1 The expense ratio shown is from the prospectus dated March 27, 2014, and represents estimated costs for the current fiscal year. For the six
months ended May 31, 2014, the annualized expense ratio was 0.16%.
11
Massachusetts Tax-Exempt Fund
Performance Summary
All of the returns in this report represent past performance, which is not a guarantee of future results that may be achieved by the fund. (Current performance may be lower or higher than the performance data cited. For performance data current to the most recent month-end, visit our website at vanguard.com/performance.) Note, too, that both investment returns and principal value can fluctuate widely, so an investor’s shares, when sold, could be worth more or less than their original cost. The returns shown do not reflect taxes that a shareholder would pay on fund distributions or on the sale of fund shares.
| | | | |
| Fiscal-Year Total Returns (%): November 30, 2003, Through May 31, 2014 |
| | | | | Barclays MA |
| | | | | Municipal |
| | | | | Bond Index |
| Fiscal Year | Income Returns | Capital Returns | Total Returns | Total Returns |
| 2004 | 4.13% | -0.88% | 3.25% | 3.82% |
| 2005 | 4.12 | -0.59 | 3.53 | 3.43 |
| 2006 | 4.38 | 2.16 | 6.54 | 6.13 |
| 2007 | 4.18 | -2.03 | 2.15 | 3.27 |
| 2008 | 4.00 | -6.72 | -2.72 | -1.30 |
| 2009 | 4.42 | 7.94 | 12.36 | 13.60 |
| 2010 | 3.80 | -0.39 | 3.41 | 3.96 |
| 2011 | 3.76 | 2.56 | 6.32 | 6.41 |
| 2012 | 3.49 | 6.92 | 10.41 | 9.57 |
| 2013 | 3.02 | -7.73 | -4.71 | -3.52 |
| 2014 | 1.76 | 4.77 | 6.53 | 5.27 |
| Note: For 2014, performance data reflect the six months ended May 31, 2014. |
Average Annual Total Returns: Periods Ended March 31, 2014
This table presents returns through the latest calendar quarter—rather than through the end of the fiscal period.
Securities and Exchange Commission rules require that we provide this information.
| | | | | | |
| | | | | Ten Years |
| | Inception Date | One Year | Five Years | Income | Capital | Total |
| Massachusetts | | | | | | |
| Tax-Exempt Fund | 12/9/1998 | 0.41% | 5.01% | 3.91% | 0.18% | 4.09% |
See Financial Highlights for dividend and capital gains information.12
Massachusetts Tax-Exempt Fund
Financial Statements (unaudited)
Statement of Net Assets
As of May 31, 2014
The fund reports a complete list of its holdings in regulatory filings four times in each fiscal year, at the quarter-ends. For the second and fourth fiscal quarters, the lists appear in the fund’s semiannual and annual reports to shareholders. For the first and third fiscal quarters, the fund files the lists with the Securities and Exchange Commission on Form N-Q. Shareholders can look up the fund’s Forms N-Q on the SEC’s website at sec.gov. Forms N-Q may also be reviewed and copied at the SEC’s Public Reference Room (see the back cover of this report for further information).
| | | | |
| | | | Face | Market |
| | | Maturity | Amount | Value |
| | Coupon | Date | ($000) | ($000) |
| Tax-Exempt Municipal Bonds (99.6%) | | | | |
| Massachusetts (99.1%) | | | | |
| Boston MA GO | 5.000% | 2/1/24 | 2,345 | 2,821 |
| Boston MA GO | 5.000% | 3/1/24 | 5,745 | 7,057 |
| Boston MA Housing Authority Revenue | 5.000% | 4/1/23 (4) | 2,000 | 2,165 |
| Boston MA Housing Authority Revenue | 5.000% | 4/1/25 (4) | 5,440 | 5,819 |
| Boston MA Water & Sewer Commission Revenue | 5.000% | 11/1/20 | 1,550 | 1,867 |
| Boston MA Water & Sewer Commission Revenue | 5.000% | 11/1/25 | 3,725 | 4,280 |
| Boston MA Water & Sewer Commission Revenue | 5.000% | 11/1/30 | 1,000 | 1,139 |
| Boston MA Water & Sewer Commission Revenue | 5.000% | 11/1/30 | 750 | 870 |
| Braintree MA GO | 5.000% | 5/15/27 | 4,000 | 4,632 |
| Cambridge MA GO | 5.000% | 1/1/23 | 850 | 1,023 |
| Holyoke MA GO | 5.000% | 9/1/30 | 1,690 | 1,923 |
| Massachusetts Bay Transportation Authority | | | | |
| Assessment Revenue | 5.250% | 7/1/31 | 2,285 | 2,880 |
| Massachusetts Bay Transportation Authority | | | | |
| Assessment Revenue | 5.250% | 7/1/34 | 15,000 | 17,192 |
| Massachusetts Bay Transportation Authority | | | | |
| Assessment Revenue | 5.000% | 7/1/41 | 5,000 | 5,576 |
| Massachusetts Bay Transportation Authority | | | | |
| General Transportation Revenue | 6.200% | 3/1/16 | 1,920 | 2,032 |
| Massachusetts Bay Transportation Authority | | | | |
| Sales Tax Revenue | 5.500% | 7/1/17 (ETM) | 75 | 86 |
| Massachusetts Bay Transportation Authority | | | | |
| Sales Tax Revenue | 5.250% | 7/1/22 | 3,500 | 4,347 |
| Massachusetts Bay Transportation Authority | | | | |
| Sales Tax Revenue | 5.500% | 7/1/22 | 5,285 | 6,662 |
| Massachusetts Bay Transportation Authority | | | | |
| Sales Tax Revenue | 5.000% | 7/1/23 | 4,000 | 4,925 |
| Massachusetts Bay Transportation Authority | | | | |
| Sales Tax Revenue | 5.250% | 7/1/23 | 2,825 | 3,542 |
| Massachusetts Bay Transportation Authority | | | | |
| Sales Tax Revenue | 5.000% | 7/1/24 | 1,325 | 1,647 |
| Massachusetts Bay Transportation Authority | | | | |
| Sales Tax Revenue | 5.500% | 7/1/24 | 3,020 | 3,898 |
| Massachusetts Bay Transportation Authority | | | | |
| Sales Tax Revenue | 5.500% | 7/1/26 (14) | 2,000 | 2,553 |
| Massachusetts Bay Transportation Authority | | | | |
| Sales Tax Revenue | 0.000% | 7/1/29 | 1,020 | 527 |
13
Massachusetts Tax-Exempt Fund
| | | | |
| | | | Face | Market |
| | | Maturity | Amount | Value |
| | Coupon | Date | ($000) | ($000) |
| Massachusetts Bay Transportation Authority | | | | |
| Sales Tax Revenue | 5.250% | 7/1/33 | 4,025 | 5,064 |
| 1 Massachusetts Bay Transportation Authority | | | | |
| Sales Tax Revenue TOB VRDO | 0.240% | 6/6/14 | 2,891 | 2,890 |
| Massachusetts Clean Energy Cooperative Corp. | | | | |
| Revenue (Municipal Lighting Plant) | 5.000% | 7/1/26 | 2,875 | 3,362 |
| Massachusetts Clean Energy Cooperative Corp. | | | | |
| Revenue (Municipal Lighting Plant) | 5.000% | 7/1/28 | 2,000 | 2,306 |
| Massachusetts Clean Energy Cooperative Corp. | | | | |
| Revenue (Municipal Lighting Plant) | 5.000% | 7/1/29 | 3,300 | 3,779 |
| Massachusetts Clean Energy Cooperative Corp. | | | | |
| Revenue (Municipal Lighting Plant) | 5.000% | 7/1/32 | 2,500 | 2,819 |
| Massachusetts College Building | | | | |
| Authority Revenue | 0.000% | 5/1/17 (10) | 3,340 | 3,238 |
| Massachusetts College Building | | | | |
| Authority Revenue | 5.000% | 5/1/25 | 1,100 | 1,313 |
| Massachusetts College Building | | | | |
| Authority Revenue | 5.000% | 5/1/26 | 1,430 | 1,707 |
| Massachusetts College Building | | | | |
| Authority Revenue | 5.000% | 5/1/27 | 1,200 | 1,421 |
| Massachusetts College Building | | | | |
| Authority Revenue | 5.000% | 5/1/29 | 1,500 | 1,748 |
| Massachusetts College Building | | | | |
| Authority Revenue | 5.000% | 5/1/30 | 1,610 | 1,862 |
| Massachusetts College Building | | | | |
| Authority Revenue | 5.000% | 5/1/30 | 1,075 | 1,229 |
| Massachusetts College Building | | | | |
| Authority Revenue | 5.000% | 5/1/36 | 4,000 | 4,473 |
| Massachusetts College Building | | | | |
| Authority Revenue | 5.000% | 5/1/41 | 5,000 | 5,548 |
| Massachusetts College Building | | | | |
| Authority Revenue | 5.000% | 5/1/43 | 3,285 | 3,626 |
| Massachusetts College Building | | | | |
| Authority Revenue | 4.500% | 5/1/48 | 3,000 | 3,130 |
| Massachusetts Department of Transportation | | | | |
| Metropolitan Highway System Revenue | 5.000% | 1/1/20 | 3,500 | 4,089 |
| Massachusetts Department of Transportation | | | | |
| Metropolitan Highway System Revenue | 5.000% | 1/1/32 | 5,620 | 6,083 |
| Massachusetts Department of Transportation | | | | |
| Metropolitan Highway System Revenue | 5.000% | 1/1/35 | 2,350 | 2,546 |
| Massachusetts Department of Transportation | | | | |
| Metropolitan Highway System Revenue | 5.000% | 1/1/37 | 3,000 | 3,214 |
| Massachusetts Department of Transportation | | | | |
| Metropolitan Highway System Revenue VRDO | 0.040% | 6/6/14 | 7,000 | 7,000 |
| Massachusetts Development Finance Agency | | | | |
| Higher Education Revenue (Emerson College) | 5.000% | 1/1/18 | 2,000 | 2,176 |
| Massachusetts Development Finance Agency | | | | |
| Higher Education Revenue (Emerson College) | 5.000% | 1/1/20 | 3,105 | 3,348 |
| Massachusetts Development Finance Agency | | | | |
| Higher Education Revenue (Emerson College) | 5.000% | 1/1/22 | 1,985 | 2,118 |
| Massachusetts Development Finance Agency | | | | |
| Hospital Revenue (Cape Cod Healthcare | | | | |
| Obligated Group) | 5.250% | 11/15/36 | 5,130 | 5,644 |
| Massachusetts Development Finance Agency | | | | |
| Revenue (Berklee College of Music) | 5.250% | 10/1/41 | 3,300 | 3,604 |
14
Massachusetts Tax-Exempt Fund
| | | | |
| | | | Face | Market |
| | | Maturity | Amount | Value |
| | Coupon | Date | ($000) | ($000) |
| Massachusetts Development Finance | | | | |
| Agency Revenue (Berkshire Health System) | 5.000% | 10/1/22 | 2,000 | 2,264 |
| Massachusetts Development Finance | | | | |
| Agency Revenue (Berkshire Health System) | 5.000% | 10/1/28 | 1,250 | 1,359 |
| Massachusetts Development Finance | | | | |
| Agency Revenue (Berkshire Health System) | 5.000% | 10/1/29 | 1,500 | 1,623 |
| Massachusetts Development Finance | | | | |
| Agency Revenue (Berkshire Health System) | 5.000% | 10/1/30 | 1,430 | 1,540 |
| Massachusetts Development Finance | | | | |
| Agency Revenue (Berkshire Health System) | 5.000% | 10/1/31 | 1,250 | 1,341 |
| Massachusetts Development Finance | | | | |
| Agency Revenue (Boston College) | 5.000% | 7/1/19 | 500 | 592 |
| Massachusetts Development Finance | | | | |
| Agency Revenue (Boston College) | 5.000% | 7/1/40 | 2,000 | 2,172 |
| Massachusetts Development Finance | | | | |
| Agency Revenue (Boston Medical Center) | 5.000% | 7/1/29 | 6,000 | 6,368 |
| Massachusetts Development Finance | | | | |
| Agency Revenue (Boston University) | 6.000% | 5/15/29 (2) | 1,400 | 1,737 |
| Massachusetts Development Finance | | | | |
| Agency Revenue (Boston University) | 5.000% | 10/1/35 (2) | 2,000 | 2,091 |
| Massachusetts Development Finance | | | | |
| Agency Revenue (Boston University) | 5.375% | 5/15/39 | 1,575 | 1,867 |
| Massachusetts Development Finance | | | | |
| Agency Revenue (Boston University) | 5.000% | 7/1/42 | 10,000 | 10,975 |
| Massachusetts Development Finance | | | | |
| Agency Revenue (Boston University) | 5.000% | 10/1/48 | 7,400 | 8,088 |
| Massachusetts Development Finance | | | | |
| Agency Revenue (Boston University) | 6.000% | 5/15/59 (10) | 5,575 | 6,822 |
| 2 Massachusetts Development Finance | | | | |
| Agency Revenue (Boston University) PUT | 0.640% | 3/30/17 | 5,000 | 5,000 |
| Massachusetts Development Finance | | | | |
| Agency Revenue (Broad Institute Inc.) | 5.250% | 4/1/37 | 4,000 | 4,397 |
| Massachusetts Development Finance | | | | |
| Agency Revenue (Carleton-Willard Village) | 5.250% | 12/1/25 | 600 | 644 |
| Massachusetts Development Finance | | | | |
| Agency Revenue (Carleton-Willard Village) | 5.625% | 12/1/30 | 550 | 593 |
| Massachusetts Development Finance | | | | |
| Agency Revenue (Children’s Hospital) | 5.000% | 10/1/34 | 2,000 | 2,277 |
| Massachusetts Development Finance | | | | |
| Agency Revenue (Children’s Hospital) | 5.000% | 10/1/46 | 3,000 | 3,327 |
| Massachusetts Development Finance | | | | |
| Agency Revenue (College of the | | | | |
| Holy Cross) VRDO | 0.070% | 6/2/14 LOC | 3,460 | 3,460 |
| Massachusetts Development Finance | | | | |
| Agency Revenue (Commonwealth | | | | |
| Contract Assistance) | 5.500% | 2/1/40 | 2,160 | 2,452 |
| Massachusetts Development Finance | | | | |
| Agency Revenue (Deerfield Academy) | 5.000% | 10/1/40 | 2,050 | 2,265 |
| Massachusetts Development Finance | | | | |
| Agency Revenue (Draper Laboratory) | 5.750% | 9/1/25 | 5,000 | 5,879 |
| Massachusetts Development Finance | | | | |
| Agency Revenue (Emerson College) | 5.000% | 1/1/40 | 5,000 | 5,190 |
| Massachusetts Development Finance | | | | |
| Agency Revenue (Harvard University) | 5.000% | 10/15/28 | 1,000 | 1,177 |
15
Massachusetts Tax-Exempt Fund
| | | | |
| | | | Face | Market |
| | | Maturity | Amount | Value |
| | Coupon | Date | ($000) | ($000) |
| Massachusetts Development Finance | | | | |
| Agency Revenue (Harvard University) | 5.250% | 2/1/34 | 6,000 | 7,003 |
| Massachusetts Development Finance | | | | |
| Agency Revenue (Harvard University) | 5.000% | 10/15/40 | 7,000 | 8,026 |
| Massachusetts Development Finance | | | | |
| Agency Revenue (Lawrence General Hospital) | 5.250% | 7/1/34 | 2,245 | 2,367 |
| Massachusetts Development Finance | | | | |
| Agency Revenue (Loomis Obligated Group) | 6.000% | 1/1/33 | 4,000 | 4,346 |
| Massachusetts Development Finance | | | | |
| Agency Revenue (Lowell General Hospital) | 5.000% | 7/1/37 | 2,800 | 2,927 |
| Massachusetts Development Finance | | | | |
| Agency Revenue (Lowell General Hospital) | 5.000% | 7/1/44 | 5,000 | 5,188 |
| Massachusetts Development Finance | | | | |
| Agency Revenue (Massachusetts College of | | | | |
| Pharmacy & Allied Health Sciences) | 5.000% | 7/1/19 | 175 | 204 |
| Massachusetts Development Finance | | | | |
| Agency Revenue (Massachusetts College of | | | | |
| Pharmacy & Allied Health Sciences) | 5.000% | 7/1/21 | 300 | 353 |
| Massachusetts Development Finance | | | | |
| Agency Revenue (Massachusetts College of | | | | |
| Pharmacy & Allied Health Sciences) | 5.000% | 7/1/23 | 250 | 296 |
| Massachusetts Development Finance | | | | |
| Agency Revenue (Massachusetts College of | | | | |
| Pharmacy & Allied Health Sciences) | 5.000% | 7/1/26 | 1,380 | 1,603 |
| Massachusetts Development Finance | | | | |
| Agency Revenue (Merrimack College) | 5.000% | 7/1/32 | 4,260 | 4,453 |
| Massachusetts Development Finance | | | | |
| Agency Revenue (Merrimack College) | 5.250% | 7/1/42 | 1,470 | 1,536 |
| Massachusetts Development Finance | | | | |
| Agency Revenue (Milford Regional | | | | |
| Medical Center) | 5.750% | 7/15/43 | 6,755 | 7,307 |
| Massachusetts Development Finance | | | | |
| Agency Revenue (Mount Holyoke College) | 5.000% | 7/1/36 | 1,500 | 1,665 |
| Massachusetts Development Finance | | | | |
| Agency Revenue (Northeastern University) | 5.000% | 10/1/29 | 3,250 | 3,650 |
| Massachusetts Development Finance | | | | |
| Agency Revenue (Northeastern University) | 5.000% | 10/1/30 | 1,750 | 1,954 |
| Massachusetts Development Finance | | | | |
| Agency Revenue (Northeastern University) | 5.000% | 3/1/32 | 950 | 1,063 |
| Massachusetts Development Finance | | | | |
| Agency Revenue (Northeastern University) | 5.000% | 3/1/39 | 3,500 | 3,836 |
| Massachusetts Development Finance | | | | |
| Agency Revenue (Northeastern University) | 5.000% | 3/1/44 | 3,750 | 4,094 |
| Massachusetts Development Finance | | | | |
| Agency Revenue (Olin College) | 5.000% | 11/1/38 | 6,000 | 6,531 |
| Massachusetts Development Finance | | | | |
| Agency Revenue (Partners Healthcare) | 5.000% | 7/1/28 | 2,000 | 2,304 |
| Massachusetts Development Finance | | | | |
| Agency Revenue (Partners Healthcare) | 5.000% | 7/1/30 | 1,500 | 1,718 |
| Massachusetts Development Finance | | | | |
| Agency Revenue (Partners Healthcare) | 5.000% | 7/1/31 | 5,705 | 6,344 |
| Massachusetts Development Finance | | | | |
| Agency Revenue (Partners Healthcare) | 5.000% | 7/1/36 | 4,000 | 4,397 |
| Massachusetts Development Finance | | | | |
| Agency Revenue (Partners Healthcare) | 5.000% | 7/1/41 | 8,000 | 8,726 |
16
Massachusetts Tax-Exempt Fund
| | | | |
| | | | Face | Market |
| | | Maturity | Amount | Value |
| | Coupon | Date | ($000) | ($000) |
| Massachusetts Development Finance | | | | |
| Agency Revenue (Partners Healthcare) | 5.375% | 7/1/41 | 4,000 | 4,424 |
| 2 Massachusetts Development Finance | | | | |
| Agency Revenue (Partners Healthcare) PUT | 0.610% | 1/30/18 | 7,945 | 7,946 |
| Massachusetts Development Finance | | | | |
| Agency Revenue (Phillips Academy) | 5.000% | 9/1/38 | 1,545 | 1,753 |
| Massachusetts Development Finance | | | | |
| Agency Revenue (Phillips Academy) | 5.000% | 9/1/43 | 2,500 | 2,830 |
| Massachusetts Development Finance | | | | |
| Agency Revenue (Simmons College) | 5.500% | 10/1/28 | 1,000 | 1,140 |
| Massachusetts Development Finance | | | | |
| Agency Revenue (Simmons College) | 5.125% | 10/1/33 | 2,000 | 2,158 |
| Massachusetts Development Finance | | | | |
| Agency Revenue (Simmons College) | 5.250% | 10/1/39 | 3,000 | 3,227 |
| Massachusetts Development Finance | | | | |
| Agency Revenue (Southcoast Health | | | | |
| System Obligated Group) | 5.000% | 7/1/27 | 1,550 | 1,772 |
| Massachusetts Development Finance | | | | |
| Agency Revenue (Southcoast Health | | | | |
| System Obligated Group) | 5.000% | 7/1/37 | 2,700 | 2,917 |
| Massachusetts Development Finance | | | | |
| Agency Revenue (Suffolk University) | 5.000% | 7/1/30 | 3,000 | 3,159 |
| Massachusetts Development Finance | | | | |
| Agency Revenue (Suffolk University) | 5.125% | 7/1/40 | 3,000 | 3,111 |
| Massachusetts Development Finance | | | | |
| Agency Revenue (Tufts Medical Center) | 7.250% | 1/1/32 | 2,500 | 3,039 |
| Massachusetts Development Finance | | | | |
| Agency Revenue (Tufts Medical Center) | 6.875% | 1/1/41 | 2,000 | 2,357 |
| Massachusetts Development Finance | | | | |
| Agency Revenue (UMass Memorial | | | | |
| Medical Center) | 5.125% | 7/1/26 | 2,750 | 2,893 |
| Massachusetts Development Finance | | | | |
| Agency Revenue (UMass Memorial | | | | |
| Medical Center) | 5.500% | 7/1/31 | 4,750 | 5,029 |
| Massachusetts Development Finance | | | | |
| Agency Revenue (Wellesley College) | 5.000% | 7/1/42 | 2,000 | 2,225 |
| Massachusetts Development Finance | | | | |
| Agency Revenue | | | | |
| (WGBH Educational Foundation) | 5.000% | 1/1/36 (12) | 5,000 | 5,258 |
| Massachusetts Development Finance | | | | |
| Agency Revenue (Williams College) | 5.000% | 7/1/38 | 4,000 | 4,530 |
| Massachusetts Development Finance | | | | |
| Agency Revenue (Williams College) | 5.000% | 7/1/43 | 2,000 | 2,252 |
| Massachusetts Development Finance | | | | |
| Agency Revenue (Worcester | | | | |
| Polytechnic Institute) | 5.000% | 9/1/50 | 2,650 | 2,864 |
| Massachusetts Development Finance | | | | |
| Agency Special Obligation Revenue | 5.000% | 5/1/39 | 6,470 | 7,188 |
| Massachusetts Educational Financing | | | | |
| Authority Education Loan Revenue | 5.500% | 1/1/17 | 3,000 | 3,346 |
| Massachusetts Federal Highway GAN | | | | |
| (Accelerated Bridge Program) | 5.000% | 6/15/26 | 3,000 | 3,558 |
| 2 Massachusetts GO | 0.180% | 2/1/16 | 5,000 | 4,990 |
| 2 Massachusetts GO | 0.420% | 2/1/17 | 10,000 | 10,016 |
17
Massachusetts Tax-Exempt Fund
| | | | |
| | | | Face | Market |
| | | Maturity | Amount | Value |
| | Coupon | Date | ($000) | ($000) |
| Massachusetts GO | 5.000% | 10/1/17 | 4,000 | 4,563 |
| Massachusetts GO | 5.500% | 11/1/17 | 3,000 | 3,482 |
| 2 Massachusetts GO | 0.490% | 1/1/18 | 3,000 | 3,013 |
| Massachusetts GO | 5.500% | 8/1/19 | 5,000 | 6,045 |
| Massachusetts GO | 5.500% | 10/1/19 (2) | 2,000 | 2,424 |
| Massachusetts GO | 5.500% | 10/1/19 (12) | 1,000 | 1,212 |
| Massachusetts GO | 5.500% | 11/1/19 (4) | 5,550 | 6,732 |
| Massachusetts GO | 5.000% | 8/1/20 | 4,185 | 4,861 |
| Massachusetts GO | 5.000% | 8/1/21 | 5,000 | 6,068 |
| Massachusetts GO | 5.000% | 8/1/22 | 4,500 | 5,207 |
| Massachusetts GO | 5.250% | 8/1/22 | 5,000 | 6,201 |
| Massachusetts GO | 5.250% | 8/1/23 | 1,000 | 1,254 |
| Massachusetts GO | 5.000% | 6/1/24 | 3,490 | 4,148 |
| Massachusetts GO | 5.250% | 8/1/24 (4) | 1,500 | 1,698 |
| Massachusetts GO | 5.250% | 9/1/24 (4) | 7,800 | 9,844 |
| Massachusetts GO | 5.000% | 8/1/26 | 6,500 | 7,685 |
| Massachusetts GO | 5.000% | 8/1/28 | 4,535 | 5,174 |
| Massachusetts GO | 5.500% | 8/1/30 (2) | 9,000 | 11,717 |
| Massachusetts GO | 4.000% | 8/1/32 | 5,000 | 5,180 |
| Massachusetts GO | 5.000% | 8/1/33 | 2,000 | 2,269 |
| Massachusetts GO | 5.000% | 8/1/36 | 9,000 | 10,091 |
| Massachusetts GO | 5.000% | 8/1/37 | 5,000 | 5,593 |
| Massachusetts GO | 5.000% | 8/1/40 | 10,000 | 11,131 |
| Massachusetts GO | 4.000% | 6/1/42 | 8,000 | 8,085 |
| Massachusetts GO | 4.000% | 6/1/43 | 5,000 | 5,059 |
| Massachusetts GO | 4.500% | 8/1/43 | 3,705 | 3,864 |
| Massachusetts GO VRDO | 0.070% | 6/2/14 | 5,500 | 5,500 |
| Massachusetts GO VRDO | 0.070% | 6/2/14 | 1,030 | 1,030 |
| Massachusetts GO VRDO | 0.070% | 6/2/14 | 11,160 | 11,160 |
| Massachusetts Health & Educational Facilities | | | | |
| Authority Revenue (Berklee College of Music) | 5.000% | 10/1/26 | 1,755 | 1,946 |
| Massachusetts Health & Educational Facilities | | | | |
| Authority Revenue (Boston Medical Center) | 5.000% | 7/1/28 | 3,000 | 3,126 |
| Massachusetts Health & Educational Facilities | | | | |
| Authority Revenue (Caregroup) | 5.000% | 7/1/28 | 2,000 | 2,103 |
| Massachusetts Health & Educational Facilities | | | | |
| Authority Revenue (Caregroup) | 5.125% | 7/1/33 | 3,015 | 3,173 |
| Massachusetts Health & Educational Facilities | | | | |
| Authority Revenue (Caregroup) | 5.125% | 7/1/38 | 3,500 | 3,654 |
| Massachusetts Health & Educational Facilities | | | | |
| Authority Revenue (Children’s Hospital) | 5.500% | 12/1/39 | 4,000 | 4,567 |
| Massachusetts Health & Educational Facilities | | | | |
| Authority Revenue (Dana-Farber Cancer Institute) | 5.000% | 12/1/37 | 5,000 | 5,261 |
| Massachusetts Health & Educational Facilities | | | | |
| Authority Revenue (Harvard University) | 6.250% | 4/1/20 | 3,000 | 3,811 |
| Massachusetts Health & Educational Facilities | | | | |
| Authority Revenue (Harvard University) | 5.000% | 12/15/21 | 2,000 | 2,452 |
| 3 Massachusetts Health & Educational Facilities | | | | |
| Authority Revenue (Harvard University) | 5.500% | 11/15/36 | 14,945 | 17,502 |
| 1 Massachusetts Health & Educational Facilities | | | | |
| Authority Revenue (Harvard University) | | | | |
| TOB VRDO | 0.080% | 6/2/14 | 2,575 | 2,575 |
| Massachusetts Health & Educational Facilities | | | | |
| Authority Revenue (Isabella Stewart | | | | |
| Gardner Museum) | 5.000% | 5/1/27 | 1,650 | 1,881 |
18
Massachusetts Tax-Exempt Fund
| | | | |
| | | | Face | Market |
| | | Maturity | Amount | Value |
| | Coupon | Date | ($000) | ($000) |
| Massachusetts Health & Educational Facilities | | | | |
| Authority Revenue (Isabella Stewart | | | | |
| Gardner Museum) | 5.000% | 5/1/28 | 2,080 | 2,355 |
| Massachusetts Health & Educational Facilities | | | | |
| Authority Revenue (Lahey Clinic Medical Center) | 5.250% | 8/15/37 | 6,650 | 7,000 |
| Massachusetts Health & Educational Facilities | | | | |
| Authority Revenue (MIT) | 5.250% | 7/1/16 | 4,090 | 4,512 |
| Massachusetts Health & Educational Facilities | | | | |
| Authority Revenue (MIT) | 5.000% | 7/1/23 | 6,000 | 7,461 |
| Massachusetts Health & Educational Facilities | | | | |
| Authority Revenue (MIT) | 5.250% | 7/1/25 | 3,605 | 4,618 |
| Massachusetts Health & Educational Facilities | | | | |
| Authority Revenue (MIT) | 5.250% | 7/1/30 | 5,000 | 6,540 |
| Massachusetts Health & Educational Facilities | | | | |
| Authority Revenue (MIT) | 6.000% | 7/1/36 | 4,500 | 5,368 |
| Massachusetts Health & Educational Facilities | | | | |
| Authority Revenue (Museum of Fine Arts) VRDO | 0.050% | 6/2/14 | 7,150 | 7,150 |
| Massachusetts Health & Educational Facilities | | | | |
| Authority Revenue (Northeastern University) | 5.000% | 10/1/19 | 3,000 | 3,519 |
| Massachusetts Health & Educational Facilities | | | | |
| Authority Revenue (Northeastern University) | 5.000% | 10/1/23 | 3,435 | 3,932 |
| Massachusetts Health & Educational Facilities | | | | |
| Authority Revenue (Northeastern University) | 5.000% | 10/1/32 | 1,000 | 1,108 |
| Massachusetts Health & Educational Facilities | | | | |
| Authority Revenue (Northeastern University) | 5.000% | 10/1/33 | 3,000 | 3,307 |
| Massachusetts Health & Educational Facilities | | | | |
| Authority Revenue (Partners Healthcare System) | 5.250% | 7/1/29 | 5,000 | 5,678 |
| 1 Massachusetts Health & Educational Facilities | | | | |
| Authority Revenue (Partners Healthcare System) | | | | |
| TOB VRDO | 0.070% | 6/6/14 | 600 | 600 |
| Massachusetts Health & Educational Facilities | | | | |
| Authority Revenue (Partners Healthcare System) | | | | |
| VRDO | 0.040% | 6/6/14 | 5,000 | 5,000 |
| Massachusetts Health & Educational Facilities | | | | |
| Authority Revenue (Simmons College) | 8.000% | 10/1/15 (Prere.) | 1,025 | 1,132 |
| Massachusetts Health & Educational Facilities | | | | |
| Authority Revenue (Simmons College) | 8.000% | 10/1/39 | 1,475 | 1,615 |
| Massachusetts Health & Educational Facilities | | | | |
| Authority Revenue (South Coast Health System) | 5.000% | 7/1/39 | 6,000 | 6,333 |
| Massachusetts Health & Educational Facilities | | | | |
| Authority Revenue (Sterling & Francine Clark) | 5.000% | 7/1/36 | 6,000 | 6,402 |
| Massachusetts Health & Educational Facilities | | | | |
| Authority Revenue (Stonehill College) VRDO | 0.070% | 6/2/14 LOC | 10,715 | 10,715 |
| Massachusetts Health & Educational Facilities | | | | |
| Authority Revenue (Tufts University) | 5.250% | 2/15/22 | 1,400 | 1,717 |
| Massachusetts Health & Educational Facilities | | | | |
| Authority Revenue (Tufts University) | 5.250% | 2/15/26 | 1,880 | 2,334 |
| Massachusetts Health & Educational Facilities | | | | |
| Authority Revenue (Tufts University) VRDO | 0.060% | 6/2/14 | 400 | 400 |
| Massachusetts Health & Educational Facilities | | | | |
| Authority Revenue (Tufts University) VRDO | 0.060% | 6/2/14 | 3,700 | 3,700 |
| Massachusetts Health & Educational Facilities | | | | |
| Authority Revenue (Williams College) | 5.000% | 7/1/31 | 385 | 412 |
| Massachusetts Health & Educational Facilities | | | | |
| Authority Revenue (Winchester Hospital) | 5.250% | 7/1/38 | 1,840 | 1,945 |
19
Massachusetts Tax-Exempt Fund
| | | | |
| | | | Face | Market |
| | | Maturity | Amount | Value |
| | Coupon | Date | ($000) | ($000) |
| Massachusetts Housing Finance Agency | | | | |
| Single Family Housing Revenue | 2.650% | 12/1/41 | 5,915 | 6,117 |
| Massachusetts Housing Finance Agency | | | | |
| Single Family Housing Revenue | 2.750% | 12/1/41 | 1,780 | 1,834 |
| Massachusetts Housing Finance Agency | | | | |
| Single Family Housing Revenue | 4.000% | 12/1/43 | 4,000 | 4,368 |
| Massachusetts Housing Finance Agency | | | | |
| Single Family Housing Revenue | 4.000% | 12/1/44 | 3,500 | 3,822 |
| Massachusetts Port Authority Revenue | 5.500% | 7/1/16 (4) | 4,000 | 4,406 |
| Massachusetts Port Authority Revenue | 5.000% | 7/1/17 (4) | 9,600 | 10,776 |
| Massachusetts Port Authority Revenue | 5.000% | 7/1/25 | 1,230 | 1,443 |
| Massachusetts Port Authority Revenue | 5.000% | 7/1/30 | 2,000 | 2,271 |
| Massachusetts Port Authority Revenue | 5.000% | 7/1/31 | 1,800 | 2,035 |
| Massachusetts Port Authority Revenue | 5.000% | 7/1/33 | 4,650 | 5,200 |
| Massachusetts School Building Authority | | | | |
| Dedicated Sales Tax Revenue | 5.000% | 8/15/15 (Prere.) | 645 | 682 |
| Massachusetts School Building Authority | | | | |
| Dedicated Sales Tax Revenue | 5.000% | 8/15/15 (Prere.) | 10,000 | 10,580 |
| Massachusetts School Building Authority | | | | |
| Dedicated Sales Tax Revenue | 5.000% | 8/15/22 | 5,000 | 6,087 |
| Massachusetts School Building Authority | | | | |
| Dedicated Sales Tax Revenue | 5.000% | 8/15/25 | 3,110 | 3,704 |
| Massachusetts School Building Authority | | | | |
| Dedicated Sales Tax Revenue | 5.000% | 8/15/26 | 5,000 | 5,912 |
| Massachusetts School Building Authority | | | | |
| Dedicated Sales Tax Revenue | 5.000% | 8/15/27 | 10,000 | 11,754 |
| Massachusetts School Building Authority | | | | |
| Dedicated Sales Tax Revenue | 5.000% | 8/15/28 | 7,250 | 8,478 |
| Massachusetts School Building Authority | | | | |
| Dedicated Sales Tax Revenue | 5.000% | 8/15/29 | 10,000 | 11,611 |
| Massachusetts School Building Authority | | | | |
| Dedicated Sales Tax Revenue | 5.000% | 8/15/30 | 8,000 | 9,232 |
| Massachusetts School Building Authority | | | | |
| Dedicated Sales Tax Revenue | 5.000% | 8/15/30 (4) | 2,500 | 2,630 |
| Massachusetts School Building Authority | | | | |
| Dedicated Sales Tax Revenue | 5.000% | 10/15/32 | 2,400 | 2,740 |
| Massachusetts School Building Authority | | | | |
| Dedicated Sales Tax Revenue | 5.250% | 10/15/35 | 10,000 | 11,533 |
| Massachusetts School Building Authority | | | | |
| Dedicated Sales Tax Revenue | 5.000% | 8/15/37 (2) | 4,735 | 5,192 |
| Massachusetts Special Obligation | | | | |
| Dedicated Tax Revenue | 5.500% | 1/1/27 (14) | 13,000 | 15,956 |
| Massachusetts Special Obligation | | | | |
| Dedicated Tax Revenue | 5.500% | 1/1/28 (14) | 3,750 | 4,615 |
| Massachusetts Transportation Fund Revenue | | | | |
| (Accelerated Bridge Program) | 5.000% | 6/1/21 | 5,000 | 6,091 |
| Massachusetts Transportation Fund Revenue | | | | |
| (Accelerated Bridge Program) | 5.000% | 6/1/29 | 2,000 | 2,315 |
| Massachusetts Transportation Fund Revenue | | | | |
| (Accelerated Bridge Program) | 5.000% | 6/1/33 | 2,050 | 2,331 |
| Massachusetts Transportation Fund Revenue | | | | |
| (Accelerated Bridge Program) | 4.000% | 6/1/37 | 1,960 | 2,012 |
| Massachusetts Transportation Fund Revenue | | | | |
| (Accelerated Bridge Program) | 5.000% | 6/1/38 | 2,750 | 3,082 |
| Massachusetts Transportation Fund Revenue | | | | |
| (Accelerated Bridge Program) | 5.000% | 6/1/43 | 5,000 | 5,577 |
20
Massachusetts Tax-Exempt Fund
| | | | |
| | | | Face | Market |
| | | Maturity | Amount | Value |
| | Coupon | Date | ($000) | ($000) |
| Massachusetts Turnpike Authority Revenue | | | | |
| (Metropolitan Highway System) | 0.000% | 1/1/20 (14) | 3,000 | 2,716 |
| Massachusetts Turnpike Authority Revenue | | | | |
| (Metropolitan Highway System) | 0.000% | 1/1/25 (14) | 5,000 | 3,694 |
| Massachusetts Turnpike Authority Revenue | | | | |
| (Metropolitan Highway System) | 0.000% | 1/1/28 (14) | 7,000 | 4,535 |
| Massachusetts Water Pollution | | | | |
| Abatement Trust Revenue | 5.250% | 8/1/17 | 540 | 571 |
| Massachusetts Water Pollution | | | | |
| Abatement Trust Revenue | 5.000% | 8/1/20 | 1,180 | 1,424 |
| 4 Massachusetts Water Pollution | | | | |
| Abatement Trust Revenue | 5.000% | 8/1/27 | 3,500 | 4,254 |
| 4 Massachusetts Water Pollution | | | | |
| Abatement Trust Revenue | 5.000% | 8/1/28 | 975 | 1,177 |
| Massachusetts Water Pollution | | | | |
| Abatement Trust Revenue | 5.250% | 8/1/29 | 1,520 | 1,934 |
| Massachusetts Water Pollution | | | | |
| Abatement Trust Revenue | 5.750% | 8/1/29 | 190 | 191 |
| Massachusetts Water Resources | | | | |
| Authority Revenue | 5.000% | 8/1/16 (Prere.) | 2,005 | 2,209 |
| Massachusetts Water Resources | | | | |
| Authority Revenue | 5.500% | 8/1/22 (4) | 1,490 | 1,869 |
| Massachusetts Water Resources | | | | |
| Authority Revenue | 5.000% | 8/1/29 | 2,400 | 2,785 |
| Massachusetts Water Resources | | | | |
| Authority Revenue | 5.000% | 8/1/31 | 2,230 | 2,595 |
| Massachusetts Water Resources | | | | |
| Authority Revenue | 5.250% | 8/1/31 (4) | 1,000 | 1,254 |
| Massachusetts Water Resources | | | | |
| Authority Revenue | 5.000% | 8/1/34 (14) | 8,000 | 8,809 |
| Massachusetts Water Resources | | | | |
| Authority Revenue | 5.000% | 8/1/35 (14) | 13,900 | 15,346 |
| Massachusetts Water Resources | | | | |
| Authority Revenue | 5.250% | 8/1/35 (4) | 1,310 | 1,639 |
| Massachusetts Water Resources | | | | |
| Authority Revenue | 5.000% | 8/1/36 | 2,710 | 3,081 |
| Massachusetts Water Resources | | | | |
| Authority Revenue | 5.000% | 8/1/36 | 1,700 | 1,822 |
| Massachusetts Water Resources | | | | |
| Authority Revenue | 5.000% | 8/1/36 (2) | 2,995 | 3,208 |
| Massachusetts Water Resources | | | | |
| Authority Revenue | 5.000% | 8/1/36 | 1,000 | 1,132 |
| Massachusetts Water Resources | | | | |
| Authority Revenue | 5.000% | 8/1/39 | 2,950 | 3,314 |
| Massachusetts Water Resources | | | | |
| Authority Revenue | 5.000% | 8/1/40 | 500 | 546 |
| Massachusetts Water Resources | | | | |
| Authority Revenue | 5.000% | 8/1/41 | 5,990 | 6,426 |
| Massachusetts Water Resources | | | | |
| Authority Revenue | 5.000% | 8/1/41 | 4,450 | 4,996 |
| Massachusetts Water Resources | | | | |
| Authority Revenue | 5.000% | 8/1/42 | 1,000 | 1,111 |
| Massachusetts Water Resources | | | | |
| Authority Revenue | 5.250% | 8/1/42 | 10,000 | 11,276 |
21
Massachusetts Tax-Exempt Fund
| | | | |
| | | | Face | Market |
| | | Maturity | Amount | Value |
| | Coupon | Date | ($000) | ($000) |
| Metropolitan Boston MA Transit | | | | |
| Parking Corp. Revenue | 5.000% | 7/1/31 | 1,000 | 1,106 |
| Metropolitan Boston MA Transit | | | | |
| Parking Corp. Revenue | 5.250% | 7/1/36 | 7,000 | 7,828 |
| University of Massachusetts Building | | | | |
| Authority Revenue | 5.000% | 11/1/15 (Prere.) | 5,680 | 6,065 |
| University of Massachusetts Building | | | | |
| Authority Revenue | 5.000% | 11/1/15 (Prere.) | 2,695 | 2,877 |
| University of Massachusetts Building | | | | |
| Authority Revenue | 5.000% | 11/1/15 (Prere.) | 1,760 | 1,879 |
| University of Massachusetts Building | | | | |
| Authority Revenue | 5.000% | 11/1/15 (Prere.) | 1,980 | 2,114 |
| University of Massachusetts Building | | | | |
| Authority Revenue | 5.000% | 11/1/15 (Prere.) | 1,990 | 2,125 |
| University of Massachusetts Building | | | | |
| Authority Revenue | 5.000% | 11/1/19 | 2,000 | 2,374 |
| University of Massachusetts Building | | | | |
| Authority Revenue | 5.000% | 5/1/38 (4) | 1,615 | 1,792 |
| University of Massachusetts Building | | | | |
| Authority Revenue | 5.000% | 5/1/38 | 2,000 | 2,239 |
| University of Massachusetts Building | | | | |
| Authority Revenue | 5.000% | 11/1/39 | 3,000 | 3,412 |
| University of Massachusetts Building | | | | |
| Authority Revenue | 5.000% | 11/1/39 | 6,695 | 7,453 |
| Worcester MA GO | 5.500% | 8/15/14 (14) | 280 | 281 |
| Worcester MA GO | 5.500% | 8/15/15 (14) | 240 | 241 |
| Worcester MA GO | 5.250% | 8/15/21 (14) | 315 | 316 |
| | | | | 1,077,769 |
| Guam (0.4%) | | | | |
| Guam Government Waterworks Authority | | | | |
| Water & Waste Water System Revenue | 5.500% | 7/1/43 | 4,500 | 4,803 |
| |
| Virgin Islands (0.1%) | | | | |
| Virgin Islands Public Finance Authority Revenue | 5.250% | 10/1/14 (Prere.) | 1,000 | 1,017 |
| Total Tax-Exempt Municipal Bonds (Cost $1,028,089) | | | 1,083,589 |
| Other Assets and Liabilities (0.4%) | | | | |
| Other Assets | | | | 14,747 |
| Liabilities | | | | (10,440) |
| | | | | 4,307 |
| Net Assets (100%) | | | | |
| Applicable to 101,083,178 outstanding $.001 par value shares of | | | |
| beneficial interest (unlimited authorization) | | | | 1,087,896 |
| Net Asset Value Per Share | | | | $10.76 |
22
Massachusetts Tax-Exempt Fund
| |
| At May 31, 2014, net assets consisted of: | |
| | Amount |
| | ($000) |
| Paid-in Capital | 1,029,655 |
| Undistributed Net Investment Income | — |
| Accumulated Net Realized Gains | 2,780 |
| Unrealized Appreciation (Depreciation) | |
| Investment Securities | 55,500 |
| Futures Contracts | (39) |
| Net Assets | 1,087,896 |
See Note A in Notes to Financial Statements.
1 Security exempt from registration under Rule 144A of the Securities Act of 1933. Such securities may be sold in transactions exempt
from registration, normally to qualified institutional buyers. At May 31, 2014, the aggregate value of these securities was $6,065,000,
representing 0.6% of net assets.
2 Adjustable-rate security.
3 Securities with a value of $351,000 have been segregated as initial margin for open futures contracts.
4 Security purchased on a when-issued or delayed-delivery basis for which the fund has not taken delivery as of May 31, 2014.
A key to abbreviations and other references follows the Statement of Net Assets.
See accompanying Notes, which are an integral part of the Financial Statements.23
Massachusetts Tax-Exempt Fund
Key to Abbreviations
ARS—Auction Rate Security.
BAN—Bond Anticipation Note.
COP—Certificate of Participation.
CP—Commercial Paper.
FR—Floating Rate.
GAN—Grant Anticipation Note.
GO—General Obligation Bond.
PILOT—Payments in Lieu of Taxes.
PUT—Put Option Obligation.
RAN—Revenue Anticipation Note.
TAN—Tax Anticipation Note.
TOB—Tender Option Bond.
TRAN—Tax Revenue Anticipation Note.
VRDO—Variable Rate Demand Obligation.
VRDP—Variable Rate Demand Preferred.
(ETM)—Escrowed to Maturity.
(Prere.)—Prerefunded.
Scheduled principal and interest payments are guaranteed by:
(1) MBIA (Municipal Bond Investors Assurance).
(2) AMBAC (Ambac Assurance Corporation).
(3) FGIC (Financial Guaranty Insurance Company).
(4) AGM (Assured Guaranty Municipal Corporation).
(5) BIGI (Bond Investors Guaranty Insurance).
(6) Connie Lee Inc.
(7) FHA (Federal Housing Authority).
(8) CapMAC (Capital Markets Assurance Corporation).
(9) American Capital Access Financial Guaranty Corporation.
(10) XL Capital Assurance Inc.
(11) CIFG (CDC IXIS Financial Guaranty).
(12) AGC (Assured Guaranty Corporation).
(13) BHAC (Berkshire Hathaway Assurance Corporation).
(14) NPFG (National Public Finance Guarantee Corporation).
(15) BAM (Build America Mutual Assurance Company).
(16) MAC (Municipal Assurance Corporation).
(17) RAA (Radian Asset Assurance Inc.).
The insurance does not guarantee the market value of the municipal bonds.
LOC—Scheduled principal and interest payments are guaranteed by bank letter of credit.
24
Massachusetts Tax-Exempt Fund
Statement of Operations
| |
| | Six Months Ended |
| | May 31, 2014 |
| | ($000) |
| Investment Income | |
| Income | |
| Interest | 18,049 |
| Total Income | 18,049 |
| Expenses | |
| The Vanguard Group—Note B | |
| Investment Advisory Services | 47 |
| Management and Administrative | 653 |
| Marketing and Distribution | 108 |
| Custodian Fees | 8 |
| Shareholders’ Reports | 5 |
| Total Expenses | 821 |
| Net Investment Income | 17,228 |
| Realized Net Gain (Loss) | |
| Investment Securities Sold | 3,491 |
| Futures Contracts | (240) |
| Realized Net Gain (Loss) | 3,251 |
| Change in Unrealized Appreciation (Depreciation) | |
| Investment Securities | 44,863 |
| Futures Contracts | (39) |
| Change in Unrealized Appreciation (Depreciation) | 44,824 |
| Net Increase (Decrease) in Net Assets Resulting from Operations | 65,303 |
See accompanying Notes, which are an integral part of the Financial Statements.
25
Massachusetts Tax-Exempt Fund
Statement of Changes in Net Assets
| | |
| | Six Months Ended | Year Ended |
| | May 31, | November 30, |
| | 2014 | 2013 |
| | ($000) | ($000) |
| Increase (Decrease) in Net Assets | | |
| Operations | | |
| Net Investment Income | 17,228 | 34,365 |
| Realized Net Gain (Loss) | 3,251 | 8,727 |
| Change in Unrealized Appreciation (Depreciation) | 44,824 | (97,849) |
| Net Increase (Decrease) in Net Assets Resulting from Operations | 65,303 | (54,757) |
| Distributions | | |
| Net Investment Income | (17,228) | (34,365) |
| Realized Capital Gain | — | — |
| Total Distributions | (17,228) | (34,365) |
| Capital Share Transactions | | |
| Issued | 106,089 | 206,683 |
| Issued in Lieu of Cash Distributions | 12,156 | 24,610 |
| Redeemed | (79,740) | (267,510) |
| Net Increase (Decrease) from Capital Share Transactions | 38,505 | (36,217) |
| Total Increase (Decrease) | 86,580 | (125,339) |
| Net Assets | | |
| Beginning of Period | 1,001,316 | 1,126,655 |
| End of Period | 1,087,896 | 1,001,316 |
See accompanying Notes, which are an integral part of the Financial Statements.26
Massachusetts Tax-Exempt Fund
Financial Highlights
| | | | | | |
| Six Months | | | | | |
| | Ended | | | | | |
| For a Share Outstanding | May 31, | Year Ended November 30, |
| Throughout Each Period | 2014 | 2013 | 2012 | 2011 | 2010 | 2009 |
| Net Asset Value, Beginning of Period | $10.27 | $11.13 | $10.41 | $10.15 | $10.19 | $9.44 |
| Investment Operations | | | | | | |
| Net Investment Income | .175 | .340 | .349 | .366 | .386 | .401 |
| Net Realized and Unrealized Gain (Loss) | | | | | | |
| on Investments | .490 | (.860) | .720 | .260 | (.040) | .750 |
| Total from Investment Operations | .665 | (.520) | 1.069 | .626 | .346 | 1.151 |
| Distributions | | | | | | |
| Dividends from Net Investment Income | (.175) | (. 340) | (. 349) | (. 366) | (. 386) | (. 401) |
| Distributions from Realized Capital Gains | — | — | — | — | — | — |
| Total Distributions | (.175) | (. 340) | (. 349) | (. 366) | (. 386) | (. 401) |
| Net Asset Value, End of Period | $10.76 | $10.27 | $11.13 | $10.41 | $10.15 | $10.19 |
| |
| Total Return1 | 6.53% | -4.71% | 10.41% | 6.32% | 3.41% | 12.36% |
| |
| Ratios/Supplemental Data | | | | | | |
| Net Assets, End of Period (Millions) | $1,088 | $1,001 | $1,127 | $942 | $983 | $939 |
| Ratio of Total Expenses to | | | | | | |
| Average Net Assets | 0.16% | 0.16% | 0.16% | 0.17% | 0.17% | 0.17% |
| Ratio of Net Investment Income to | | | | | | |
| Average Net Assets | 3.36% | 3.21% | 3.22% | 3.61% | 3.75% | 4.02% |
| Portfolio Turnover Rate | 30% | 36% | 13% | 13% | 18% | 15% |
The expense ratio, net income ratio, and turnover rate for the current period have been annualized.
1 Total returns do not include account service fees that may have applied in the periods shown. Fund prospectuses provide information about
any applicable account service fees.See accompanying Notes, which are an integral part of the Financial Statements.
27
Massachusetts Tax-Exempt Fund
Notes to Financial Statements
Vanguard Massachusetts Tax-Exempt Fund is registered under the Investment Company Act of 1940 as an open-end investment company, or mutual fund. The fund invests in debt instruments of municipal issuers whose ability to meet their obligations may be affected by economic and political developments in the state.
A. The following significant accounting policies conform to generally accepted accounting principles for U.S. investment companies. The fund consistently follows such policies in preparing its financial statements.
1. Security Valuation: Securities are valued as of the close of trading on the New York Stock Exchange (generally 4 p.m., Eastern time) on the valuation date. Bonds, and temporary cash investments acquired over 60 days to maturity, are valued using the latest bid prices or using valuations based on a matrix system (which considers such factors as security prices, yields, maturities, and ratings), both as furnished by independent pricing services. Other temporary cash investments are valued at amortized cost, which approximates market value. Securities for which market quotations are not readily available, or whose values have been affected by events occurring before the fund’s pricing time but after the close of the securities’ primary markets, are valued by methods deemed by the board of trustees to represent fair value.
2. Futures Contracts: The fund uses futures contracts to invest in fixed income asset classes with greater efficiency and lower cost than is possible through direct investment, to add value when these instruments are attractively priced, or to adjust sensitivity to changes in interest rates. The primary risks associated with the use of futures contracts are imperfect correlation between changes in market values of bonds held by the fund and the prices of futures contracts, and the possibility of an illiquid market. Counterparty risk involving futures is mitigated because a regulated clearinghouse is the counterparty instead of the clearing broker. To further mitigate counterparty risk, the fund trades futures contracts on an exchange, monitors the financial strength of its clearing brokers and clearinghouse, and has entered into clearing agreements with its clearing brokers. The clearinghouse imposes initial margin requirements to secure the fund’s performance and requires daily settlement of variation margin representing changes in the market value of each contract.
Futures contracts are valued at their quoted daily settlement prices. The aggregate notional amounts of the contracts are not recorded in the Statement of Net Assets. Fluctuations in the value of the contracts are recorded in the Statement of Net Assets as an asset (liability) and in the Statement of Operations as unrealized appreciation (depreciation) until the contracts are closed, when they are recorded as realized futures gains (losses).
During the six months ended May 31, 2014, the fund’s average investments in long and short futures contracts each represented less than 1% of net assets, based on quarterly average aggregate settlement values.
3. Federal Income Taxes: The fund intends to continue to qualify as a regulated investment company and distribute all of its income. Management has analyzed the fund’s tax positions taken for all open federal income tax years (November 30, 2010–2013), and for the period ended May 31, 2014, and has concluded that no provision for federal income tax is required in the fund’s financial statements.
4. Distributions: Distributions from net investment income are declared daily and paid on the first business day of the following month. Annual distributions from realized capital gains, if any, are recorded on the ex-dividend date.
28
Massachusetts Tax-Exempt Fund
5. Credit Facility: The fund and certain other funds managed by The Vanguard Group participate in a $2.89 billion committed credit facility provided by a syndicate of lenders pursuant to a credit agreement that may be renewed annually; each fund is individually liable for its borrowings, if any, under the credit facility. Borrowings may be utilized for temporary and emergency purposes, and are subject to the fund’s regulatory and contractual borrowing restrictions. The participating funds are charged administrative fees and an annual commitment fee of 0.06% of the undrawn amount of the facility; these fees are allocated to the funds based on a method approved by the fund’s board of trustees and included in Management and Administrative expenses on the fund’s Statement of Operations. Any borrowings under this facility bear interest at a rate equal to the higher of the federal funds rate or LIBOR reference rate plus an agreed-upon spread.
The fund had no borrowings outstanding at May 31, 2014, or at any time during the period then ended.
6. Other: Interest income is accrued daily. Premiums and discounts on debt securities purchased are amortized and accreted, respectively, to interest income over the lives of the respective securities. Security transactions are accounted for on the date securities are bought or sold. Costs used to determine realized gains (losses) on the sale of investment securities are those of the specific securities sold.
B. The Vanguard Group furnishes at cost investment advisory, corporate management, administrative, marketing, and distribution services. The costs of such services are allocated to the fund based on methods approved by the board of trustees. The fund has committed to provide up to 0.40% of its net assets in capital contributions to Vanguard. At May 31, 2014, the fund had contributed capital of $112,000 to Vanguard (included in Other Assets), representing 0.01% of the fund’s net assets and 0.04% of Vanguard’s capitalization. The fund’s trustees and officers are also directors and officers of Vanguard.
C. Various inputs may be used to determine the value of the fund’s investments. These inputs are summarized in three broad levels for financial statement purposes. The inputs or methodologies used to value securities are not necessarily an indication of the risk associated with investing in those securities.
Level 1—Quoted prices in active markets for identical securities.
Level 2—Other significant observable inputs (including quoted prices for similar securities, interest rates, prepayment speeds, credit risk, etc.).
Level 3—Significant unobservable inputs (including the fund’s own assumptions used to determine the fair value of investments).
The following table summarizes the market value of the fund’s investments as of May 31, 2014, based on the inputs used to value them:
| | | |
| | Level 1 | Level 2 | Level 3 |
| Investments | ($000) | ($000) | ($000) |
| Tax-Exempt Municipal Bonds | — | 1,083,589 | — |
| Futures Contracts—Assets1 | 14 | — | — |
| Total | 14 | 1,083,589 | — |
| 1 Represents variation margin on the last day of the reporting period. |
29
Massachusetts Tax-Exempt Fund
D. At May 31, 2014, the aggregate settlement value of open futures contracts and the related
unrealized appreciation (depreciation) were:
| | | | |
| | | | ($000) |
| | | | Aggregate | |
| | | Number of | Settlement | Unrealized |
| | | Long (Short) | Value | Appreciation |
| Futures Contracts | Expiration | Contracts | Long (Short) | (Depreciation) |
| 10-Year U.S. Treasury Note | September 2014 | (131) | (16,443) | (39) |
Unrealized appreciation (depreciation) on open futures contracts is required to be treated as realized gain (loss) for tax purposes.
E. Capital gain distributions are determined on a tax basis and may differ from realized capital gains for financial reporting purposes. Differences may be permanent or temporary. Permanent differences are reclassified among capital accounts in the financial statements to reflect their tax character. Temporary differences arise when gains or losses are recognized in different periods for financial statement and tax purposes. These differences will reverse at some time in the future. The fund’s tax-basis capital gains and losses are determined only at the end of each fiscal year.
At May 31, 2014, the cost of investment securities for tax purposes was $1,028,560,000. Net unrealized appreciation of investment securities for tax purposes was $55,029,000, consisting of unrealized gains of $57,136,000 on securities that had risen in value since their purchase and $2,107,000 in unrealized losses on securities that had fallen in value since their purchase.
F. During the six months ended May 31, 2014, the fund purchased $171,545,000 of investment securities and sold $146,149,000 of investment securities, other than temporary cash investments.
| | |
| G. Capital shares issued and redeemed were: | | |
| | Six Months Ended | Year Ended |
| | May 31, 2014 | November 30, 2013 |
| | Shares | Shares |
| | (000) | (000) |
| Issued | 10,123 | 19,417 |
| Issued in Lieu of Cash Distributions | 1,156 | 2,333 |
| Redeemed | (7,658) | (25,509) |
| Net Increase (Decrease) in Shares Outstanding | 3,621 | (3,759) |
H. Management has determined that no material events or transactions occurred subsequent to May 31, 2014, that would require recognition or disclosure in these financial statements.
30
About Your Fund’s Expenses
As a shareholder of the fund, you incur ongoing costs, which include costs for portfolio management, administrative services, and shareholder reports (like this one), among others. Operating expenses, which are deducted from a fund’s gross income, directly reduce the investment return of the fund.
A fund’s expenses are expressed as a percentage of its average net assets. This figure is known as the expense ratio. The following examples are intended to help you understand the ongoing costs (in dollars) of investing in your fund and to compare these costs with those of other mutual funds. The examples are based on an investment of $1,000 made at the beginning of the period shown and held for the entire period.
The accompanying table illustrates your fund’s costs in two ways:
• Based on actual fund return. This section helps you to estimate the actual expenses that you paid over the period. The ”Ending Account Value“ shown is derived from the fund‘s actual return, and the third column shows the dollar amount that would have been paid by an investor who started with $1,000 in the fund. You may use the information here, together with the amount you invested, to estimate the expenses that you paid over the period.
To do so, simply divide your account value by $1,000 (for example, an $8,600 account value divided by $1,000 = 8.6), then multiply the result by the number given for your fund under the heading ”Expenses Paid During Period.“
• Based on hypothetical 5% yearly return. This section is intended to help you compare your fund‘s costs with those of other mutual funds. It assumes that the fund had a yearly return of 5% before expenses, but that the expense ratio is unchanged. In this case—because the return used is not the fund’s actual return—the results do not apply to your investment. The example is useful in making comparisons because the Securities and Exchange Commission requires all mutual funds to calculate expenses based on a 5% return. You can assess your fund’s costs by comparing this hypothetical example with the hypothetical examples that appear in shareholder reports of other funds.
Note that the expenses shown in the table are meant to highlight and help you compare ongoing costs only and do not reflect transaction costs incurred by the fund for buying and selling securities. Further, the expenses do not include any purchase, redemption, or account service fees described in the fund prospectus. If such fees were applied to your account, your costs would be higher. Your fund does not carry a “sales load.”
The calculations assume no shares were bought or sold during the period. Your actual costs may have been higher or lower, depending on the amount of your investment and the timing of any purchases or redemptions.
You can find more information about the fund’s expenses, including annual expense ratios, in the Financial Statements section of this report. For additional information on operating expenses and other shareholder costs, please refer to your fund’s current prospectus.
31
| | | |
| Six Months Ended May 31, 2014 | | | |
| | Beginning | Ending | Expenses |
| | Account Value | Account Value | Paid During |
| Massachusetts Tax-Exempt Fund | 11/30/2013 | 5/31/2014 | Period |
| Based on Actual Fund Return | $1,000.00 | $1,065.31 | $0.82 |
| Based on Hypothetical 5% Yearly Return | 1,000.00 | 1,024.13 | 0.81 |
The calculations are based on expenses incurred in the most recent six-month period. The fund’s annualized six-month expense ratio for that
period is 0.16%. The dollar amounts shown as “Expenses Paid” are equal to the annualized expense ratio multiplied by the average account
value over the period, multiplied by the number of days in the most recent six-month period, then divided by the number of days in the most
recent 12-month period.32
Trustees Approve Advisory Arrangement
The board of trustees of Vanguard Massachusetts Tax-Exempt Fund has renewed the fund’s investment advisory arrangement with The Vanguard Group, Inc. (Vanguard). Vanguard—through its Fixed Income Group—serves as the investment advisor for the fund. The board determined that continuing the fund’s internalized management structure was in the best interests of the fund and its shareholders.
The board based its decision upon an evaluation of the advisor’s investment staff, portfolio management process, and performance. The trustees considered the factors discussed below, among others. However, no single factor determined whether the board approved the arrangement. Rather, it was the totality of the circumstances that drove the board’s decision.
Nature, extent, and quality of services
The board considered the quality of the fund’s investment management services over both the short and long term, and took into account the organizational depth and stability of the advisor. The board noted that Vanguard has been managing investments for more than three decades. The Fixed Income Group adheres to a sound, disciplined investment management process; the team has considerable experience, stability, and depth.
The board concluded that Vanguard’s experience, stability, depth, and performance, among other factors, warranted continuation of the advisory arrangement.
Investment performance
The board considered the short- and long-term performance of the fund, including any periods of outperformance or underperformance relative to a benchmark index and peer group. The board concluded that the performance was such that the advisory arrangement should continue. Information about the fund’s most recent performance can be found in the Performance Summary section of this report.
Cost
The board concluded that the fund’s expense ratio was well below the average expense ratio charged by funds in its peer group and that the fund’s advisory fee rate was also well below its peer-group average. Information about the fund’s expenses appears in the About Your Fund’s Expenses section of this report as well as in the Financial Statements section.
The board does not conduct a profitability analysis of Vanguard, because of Vanguard’s unique “at-cost” structure. Unlike most other mutual fund management companies, Vanguard is owned by the funds it oversees, and produces “profits” only in the form of reduced expenses for fund shareholders.
The benefit of economies of scale
The board concluded that the fund’s at-cost arrangement with Vanguard ensures that the fund will realize economies of scale as it grows, with the cost to shareholders declining as fund assets increase.
The board will consider whether to renew the advisory arrangement again after a one-year period.
33
Glossary
30-Day SEC Yield. A fund’s 30-day SEC yield is derived using a formula specified by the U.S. Securities and Exchange Commission. Under the formula, data related to the fund’s security holdings in the previous 30 days are used to calculate the fund’s hypothetical net income for that period, which is then annualized and divided by the fund’s estimated average net assets over the calculation period. For the purposes of this calculation, a security’s income is based on its current market yield to maturity (for bonds), its actual income (for asset-backed securities), or its projected dividend yield (for stocks). Because the SEC yield represents hypothetical annualized income, it will differ—at times significantly—from the fund’s actual experience. As a result, the fund’s income distributions may be higher or lower than implied by the SEC yield.
Average Coupon. The average interest rate paid on the fixed income securities held by a fund. It is expressed as a percentage of face value.
Average Duration. An estimate of how much the value of the bonds held by a fund will fluctuate in response to a change in interest rates. To see how the value could change, multiply the average duration by the change in rates. If interest rates rise by 1 percentage point, the value of the bonds in a fund with an average duration of five years would decline by about 5%. If rates decrease by a percentage point, the value would rise by 5%.
Average Stated Maturity. The average length of time until fixed income securities held by a fund reach maturity and are repaid using the maturity date of the security. The figure reflects the proportion of fund assets represented by each security; it also reflects any futures contracts held. In general, the longer the average stated maturity, the more a fund’s share price will fluctuate in response to changes in market interest rates.
Beta. A measure of the magnitude of a fund’s past share-price fluctuations in relation to the ups and downs of a given market index. The index is assigned a beta of 1.00. Compared with a given index, a fund with a beta of 1.20 typically would have seen its share price rise or fall by 12% when the index rose or fell by 10%. For this report, beta is based on returns over the past 36 months for both the fund and the index. Note that a fund’s beta should be reviewed in conjunction with its R-squared (see definition). The lower the R-squared, the less correlation there is between the fund and the index, and the less reliable beta is as an indicator of volatility.
Credit Quality. For Vanguard tax-exempt bond funds, credit-quality ratings are measured on a scale that generally ranges from AAA (highest) to D (lowest). “Not Rated” is used to classify securities for which a rating is not available. Credit-quality ratings are obtained from Moody’s and S&P, and the higher rating for each issue is used.
Expense Ratio. A fund’s total annual operating expenses expressed as a percentage of the fund’s average net assets. The expense ratio includes management and administrative expenses, but does not include the transaction costs of buying and selling portfolio securities.
Inception Date. The date on which the assets of a fund (or one of its share classes) are first invested in accordance with the fund’s investment objective. For funds with a subscription period, the inception date is the day after that period ends. Investment performance is measured from the inception date.
34
R-Squared. A measure of how much of a fund’s past returns can be explained by the returns from the market in general, as measured by a given index. If a fund’s total returns were precisely synchronized with an index’s returns, its R-squared would be 1.00. If the fund’s returns bore no relationship to the index’s returns, its R-squared would be 0. For this report, R-squared is based on returns over the past 36 months for both the fund and the index.
Short-Term Reserves. The percentage of a fund invested in highly liquid, short-term securities that can be readily converted to cash.
Yield to Maturity. The rate of return an investor would receive if the fixed income securities held by a fund were held to their maturity dates.
35
The People Who Govern Your Fund
The trustees of your mutual fund are there to see that the fund is operated and managed in your best interests since, as a shareholder, you are a part owner of the fund. Your fund’s trustees also serve on the board of directors of The Vanguard Group, Inc., which is owned by the Vanguard funds and provides services to them on an at-cost basis.
A majority of Vanguard’s board members are independent, meaning that they have no affiliation with Vanguard or the funds they oversee, apart from the sizable personal investments they have made as private individuals. The independent board members have distinguished backgrounds in business, academia, and public service. Each of the trustees and executive officers oversees 177 Vanguard funds.
The following table provides information for each trustee and executive officer of the fund. More information about the trustees is in the Statement of Additional Information, which can be obtained, without charge, by contacting Vanguard at 800-662-7447, or online at vanguard.com.
| |
| InterestedTrustee1 | and Delphi Automotive LLP (automotive components); |
| | Senior Advisor at New Mountain Capital. |
| F. William McNabb III | |
| Born 1957. Trustee Since July 2009. Chairman of the | Amy Gutmann |
| Board. Principal Occupation(s) During the Past Five | Born 1949. Trustee Since June 2006. Principal |
| Years: Chairman of the Board of The Vanguard Group, | Occupation(s) During the Past Five Years: President of |
| Inc., and of each of the investment companies served | the University of Pennsylvania; Christopher H. Browne |
| by The Vanguard Group, since January 2010; Director | Distinguished Professor of Political Science, School of |
| of The Vanguard Group since 2008; Chief Executive | Arts and Sciences, and Professor of Communication, |
| Officer and President of The Vanguard Group, and of | Annenberg School for Communication, with secondary |
| each of the investment companies served by The | faculty appointments in the Department of Philosophy, |
| Vanguard Group, since 2008; Director of Vanguard | School of Arts and Sciences, and at the Graduate |
| Marketing Corporation; Managing Director of The | School of Education, University of Pennsylvania; |
| Vanguard Group (1995–2008). | Trustee of the National Constitution Center; Chair |
| | of the Presidential Commission for the Study of |
| | Bioethical Issues. |
| IndependentTrustees | |
| | JoAnn Heffernan Heisen |
| Emerson U. Fullwood | Born 1950. Trustee Since July 1998. Principal |
| Born 1948. Trustee Since January 2008. Principal | Occupation(s) During the Past Five Years: Corporate |
| Occupation(s) During the Past Five Years: Executive | Vice President and Chief Global Diversity Officer |
| Chief Staff and Marketing Officer for North America | (retired 2008) and Member of the Executive |
| and Corporate Vice President (retired 2008) of Xerox | Committee (1997–2008) of Johnson & Johnson |
| Corporation (document management products and | (pharmaceuticals/medical devices/consumer |
| services); Executive in Residence and 2009–2010 | products); Director of Skytop Lodge Corporation |
| Distinguished Minett Professor at the Rochester | (hotels), the University Medical Center at Princeton, |
| Institute of Technology; Director of SPX Corporation | the Robert Wood Johnson Foundation, and the Center |
| (multi-industry manufacturing), the United Way of | for Talent Innovation; Member of the Advisory Board |
| Rochester, Amerigroup Corporation (managed health | of the Maxwell School of Citizenship and Public Affairs |
| care), the University of Rochester Medical Center, | at Syracuse University. |
| Monroe Community College Foundation, and North | |
| Carolina A&T University. | F. Joseph Loughrey |
| | Born 1949. Trustee Since October 2009. Principal |
| Rajiv L. Gupta | Occupation(s) During the Past Five Years: President |
| Born 1945. Trustee Since December 2001.2 | and Chief Operating Officer (retired 2009) of Cummins |
| Principal Occupation(s) During the Past Five Years: | Inc. (industrial machinery); Chairman of the Board |
| Chairman and Chief Executive Officer (retired 2009) | of Hillenbrand, Inc. (specialized consumer services), |
| and President (2006–2008) of Rohm and Haas Co. | and of Oxfam America; Director of SKF AB (industrial |
| (chemicals); Director of Tyco International, Ltd. | machinery), Hyster-Yale Materials Handling, Inc. |
| (diversified manufacturing and services), Hewlett- | (forklift trucks), the Lumina Foundation for Education, |
| Packard Co. (electronic computer manufacturing), | |
| | |
| and the V Foundation for Cancer Research; Member | Executive Officers | |
| of the Advisory Council for the College of Arts and | | |
| Letters and of the Advisory Board to the Kellogg | Glenn Booraem | |
| Institute for International Studies, both at the | Born 1967. Controller Since July 2010. Principal |
| University of Notre Dame. | Occupation(s) During the Past Five Years: Principal |
| | of The Vanguard Group, Inc.; Controller of each of |
| Mark Loughridge | the investment companies served by The Vanguard |
| Born 1953. Trustee Since March 2012. Principal | Group; Assistant Controller of each of the investment |
| Occupation(s) During the Past Five Years: Senior Vice | companies served by The Vanguard Group (2001–2010). |
| President and Chief Financial Officer (retired 2013) | | |
| at IBM (information technology services); Fiduciary | Thomas J. Higgins | |
| Member of IBM’s Retirement Plan Committee (2004– | Born 1957. Chief Financial Officer Since September |
| 2013); Member of the Council on Chicago Booth. | 2008. Principal Occupation(s) During the Past Five |
| | Years: Principal of The Vanguard Group, Inc.; Chief |
| Scott C. Malpass | Financial Officer of each of the investment companies |
| Born 1962. Trustee Since March 2012. Principal | served by The Vanguard Group; Treasurer of each of |
| Occupation(s) During the Past Five Years: Chief | the investment companies served by The Vanguard |
| Investment Officer and Vice President at the University | Group (1998–2008). | |
| of Notre Dame; Assistant Professor of Finance at the | | |
| Mendoza College of Business at Notre Dame; Member | Kathryn J. Hyatt | |
| of the Notre Dame 403(b) Investment Committee; | Born 1955. Treasurer Since November 2008. Principal |
| Board Member of TIFF Advisory Services, Inc. | Occupation(s) During the Past Five Years: Principal of |
| (investment advisor); Member of the Investment | The Vanguard Group, Inc.; Treasurer of each of the |
| Advisory Committees of the Financial Industry | investment companies served by The Vanguard |
| Regulatory Authority (FINRA) and of Major League | Group; Assistant Treasurer of each of the investment |
| Baseball. | companies served by The Vanguard Group (1988–2008). |
| |
| André F. Perold | Heidi Stam | |
| Born 1952. Trustee Since December 2004. Principal | Born 1956. Secretary Since July 2005. Principal |
| Occupation(s) During the Past Five Years: George | Occupation(s) During the Past Five Years: Managing |
| Gund Professor of Finance and Banking, Emeritus | Director of The Vanguard Group, Inc.; General Counsel |
| at the Harvard Business School (retired 2011); | of The Vanguard Group; Secretary of The Vanguard |
| Chief Investment Officer and Managing Partner of | Group and of each of the investment companies |
| HighVista Strategies LLC (private investment firm); | served by The Vanguard Group; Director and Senior |
| Director of Rand Merchant Bank; Overseer of the | Vice President of Vanguard Marketing Corporation. |
| Museum of Fine Arts Boston. | | |
| | Vanguard Senior ManagementTeam |
| Alfred M. Rankin, Jr. | | |
| Born 1941. Trustee Since January 1993. Principal | Mortimer J. Buckley | Chris D. McIsaac |
| Occupation(s) During the Past Five Years: Chairman, | Kathleen C. Gubanich | Michael S. Miller |
| President, and Chief Executive Officer of NACCO | Paul A. Heller | James M. Norris |
| Industries, Inc. (housewares/lignite), and of Hyster- | Martha G. King | Glenn W. Reed |
| Yale Materials Handling, Inc. (forklift trucks); Chairman | John T. Marcante | |
| of the Board of University Hospitals of Cleveland. | | |
| |
| Peter F. Volanakis | Chairman Emeritus and Senior Advisor |
| Born 1955. Trustee Since July 2009. Principal | | |
| Occupation(s) During the Past Five Years: President | John J. Brennan | |
| and Chief Operating Officer (retired 2010) of Corning | Chairman, 1996–2009 | |
| Incorporated (communications equipment); Trustee of | Chief Executive Officer and President, 1996–2008 |
| Colby-Sawyer College; Member of the Advisory Board | | |
| of the Norris Cotton Cancer Center and of the Advisory | Founder | |
| Board of the Parthenon Group (strategy consulting). | | |
| | John C. Bogle | |
| | Chairman and Chief Executive Officer, 1974–1996 |
1 Mr. McNabb is considered an “interested person,” as defined in the Investment Company Act of 1940, because he is an officer of the
Vanguard funds.
2 December 2002 for Vanguard Equity Income Fund, the Vanguard Municipal Bond Funds, and the Vanguard State Tax-Exempt Funds.
| |  |
| | | P.O. Box 2600 |
| | | Valley Forge, PA 19482-2600 |
| |
| |
| |
| Connect with Vanguard® > vanguard.com |
| |
| |
| |
| Fund Information > 800-662-7447 | | CFA® is a trademark owned by CFA Institute. |
| Direct Investor Account Services > 800-662-2739 | |
| Institutional Investor Services > 800-523-1036 | |
| Text Telephone for People | | |
| With Hearing Impairment > 800-749-7273 | |
| |
| This material may be used in conjunction | |
| with the offering of shares of any Vanguard | |
| fund only if preceded or accompanied by | |
| the fund’s current prospectus. | |
| |
| All comparative mutual fund data are from Lipper, a | |
| Thomson Reuters Company, or Morningstar, Inc., unless | |
| otherwise noted. | | |
| |
| You can obtain a free copy of Vanguard’s proxy voting | |
| guidelines by visiting vanguard.com/proxyreporting or by | |
| calling Vanguard at 800-662-2739. The guidelines are | |
| also available from the SEC’s website, sec.gov. In | |
| addition, you may obtain a free report on how your fund | |
| voted the proxies for securities it owned during the 12 | |
| months ended June 30. To get the report, visit either | |
| vanguard.com/proxyreporting or sec.gov. | |
| |
| You can review and copy information about your fund at | |
| the SEC’s Public Reference Room in Washington, D.C. To | |
| find out more about this public service, call the SEC at | |
| 202-551-8090. Information about your fund is also | |
| available on the SEC’s website, and you can receive | |
| copies of this information, for a fee, by sending a | |
| request in either of two ways: via e-mail addressed to | |
| publicinfo@sec.gov or via regular mail addressed to the | |
| Public Reference Section, Securities and Exchange | |
| Commission, Washington, DC 20549-1520. | |
| |
| | | © 2014 The Vanguard Group, Inc. |
| | | All rights reserved. |
| | | Vanguard Marketing Corporation, Distributor. |
| |
| | | Q1682 072014 |
Item 2: Code of Ethics.
Not Applicable.
Item 3:
Not Applicable.
Item 4: Principal Accountant Fees and Services.
Not. Applicable.
Item 5: Audit Committee of Listed Registrants.
Not Applicable.
Item 6: Investments.
Not Applicable.
Item 7: Disclosure of Proxy Voting Policies and Procedures for Closed-End Management Investment
Companies.
Not Applicable.
Item 8: Portfolio Managers of Closed-End Management Investment Companies.
Not Applicable.
Item 9: Purchase of Equity Securities by Closed-End Management Investment Company and
Affiliated Purchasers.
Not Applicable.
Item 10: Submission of Matters to a Vote of Security Holders.
Not Applicable.
Item 11: Controls and Procedures.
(a) Disclosure Controls and Procedures. The Principal Executive and Financial Officers concluded that the Registrant’s Disclosure Controls and Procedures are effective based on their evaluation of the Disclosure Controls and Procedures as of a date within 90 days of the filing date of this report.
(b) Internal Control Over Financial Reporting. There were no significant changes in Registrant’s Internal Control Over Financial Reporting or in other factors that could significantly
affect this control subsequent to the date of the evaluation, including any corrective actions with regard to significant deficiencies and material weaknesses.
Item 12: Exhibits.
(a) Certifications.
Pursuant to the requirements of the Securities Exchange Act of 1934 and the Investment Company Act of 1940, the registrant has duly caused this report to be signed on its behalf by the undersigned, thereunto duly authorized.
| |
| | VANGUARD MASSACHUSETTS TAX-EXEMPT FUNDS |
| |
| |
| BY: | /s/ F. WILLIAM MCNABB III* |
| | F. WILLIAM MCNABB III |
| | CHIEF EXECUTIVE OFFICER |
| |
| Date: July 17, 2014 |
Pursuant to the requirements of the Securities Exchange Act of 1934 and the Investment Company Act of 1940, this report has been signed below by the following persons on behalf of the registrant and in the capacities and on the dates indicated.
| |
| | VANGUARD MASSACHUSETTS TAX-EXEMPT FUNDS |
| |
| BY: | /s/ F. WILLIAM MCNABB III* |
| | F. WILLIAM MCNABB III |
| | CHIEF EXECUTIVE OFFICER |
| Date: July 17, 2014 |
|
| | VANGUARD MASSACHUSETTS TAX-EXEMPT FUNDS |
| |
| BY: | /s/ THOMAS J. HIGGINS* |
| | THOMAS J. HIGGINS |
| | CHIEF FINANCIAL OFFICER |
| Date: July 17, 2014 |
* By: /s/ Heidi Stam
Heidi Stam, pursuant to a Power of Attorney filed on April 22, 2014 see file Number
2-17620, Incorporated by Reference.