UNITED STATES
SECURITIES AND EXCHANGE COMMISSION
Washington, D.C. 20549
FORM N-CSR
CERTIFIED SHAREHOLDER REPORT
OF
REGISTERED MANAGEMENT INVESTMENT COMPANIES
| | |
| Investment Company Act file number: 811-09005 |
Name of Registrant: | Vanguard Massachusetts Tax-Exempt Funds |
Address of Registrant: | P.O. Box 2600 |
| | Valley Forge, PA 19482 |
Name and address of agent for service: | Anne E. Robinson, Esquire |
| | P.O. Box 876 |
| | Valley Forge, PA 19482 |
Registrant’s telephone number, including area code: (610) 669-1000 |
Date of fiscal year end: November 30 | |
Date of reporting period: November 30, 2016 – May 31, 2017 |
Item 1: Reports to Shareholders | |

Semiannual Report | May 31, 2017
Vanguard Massachusetts Tax-Exempt Fund
A new format, unwavering commitment
As you begin reading this report, you’ll notice that we’ve made some improvements to the opening sections—based on feedback from you, our clients.
Page 1 starts with a new ”Your Fund’s Performance at a Glance,” a concise, handy summary of how your fund performed during the period.
In the renamed ”Chairman’s Perspective,” Bill McNabb will focus on enduring principles and investment insights.
We’ve modified some tables, and eliminated some redundancy, but we haven’t removed any information.
At Vanguard, we’re always looking for better ways to communicate and to help you make sound investment decisions. Thank you for entrusting your assets to us.
| |
| Contents | |
| Your Fund’s Performance at a Glance. | 1 |
| Chairman’s Perspective. | 2 |
| Advisor’s Report. | 6 |
| Fund Profile. | 9 |
| Performance Summary. | 10 |
| Financial Statements. | 11 |
| About Your Fund’s Expenses. | 35 |
| Trustees Approve Advisory Arrangement. | 37 |
| Glossary. | 39 |
Please note: The opinions expressed in this report are just that—informed opinions. They should not be considered promises or advice. Also, please keep in mind that the information and opinions cover the period through the date on the front of this report. Of course, the risks of investing in your fund are spelled out in the prospectus.
See the Glossary for definitions of investment terms used in this report.
About the cover: No matter what language you speak, Vanguard has one consistent message and set of principles. Our primary focus is on you, our clients. We conduct our business with integrity as a faithful steward of your assets. This message is shown translated into seven languages, reflecting our expanding global presence.
Your Fund’s Performance at a Glance
• For the six months ended May 31, 2017, Vanguard Massachusetts Tax-Exempt Fund returned 5.33%, as did its benchmark index. The average return of its peer funds was 3.82%.
• The fund’s capital return was 3.77% and its return from interest income was 1.56%.
• Municipal bond prices slumped in the wake of the U.S. presidential election but later regained some ground.
• Investor appetite for yield led to tighter overall credit spreads. As spreads narrowed, the fund received a boost from its overweight allocation to lower-rated investment-grade bonds.
• The fund also benefited from greater exposure to longer-dated bonds than the benchmark and peers.
| | | | | |
| Total Returns: Six Months Ended May 31, 2017 | | | | |
| | | Taxable- | | | |
| | 30-Day SEC | Equivalent | Income | Capital | Total |
| | Yield | Yield | Return | Return | Returns |
| Vanguard Massachusetts Tax-Exempt Fund | 2.34% | 4.36% | 1.56% | 3.77% | 5.33% |
| Bloomberg Barclays MA Municipal Bond Index | | | | | 5.33 |
| Massachusetts Municipal Debt Funds Average | | | | | 3.82 |
| Massachusetts Municipal Debt Funds Average: Derived from data provided by Lipper, a Thomson Reuters Company. | | |
| The calculation of taxable-equivalent yield assumes a typical itemized tax return and is based on the maximum federal tax rate of 43.4% and |
| the maximum income tax rate for the state. Local taxes were not considered. Please see the prospectus for a detailed explanation of the |
| calculation. | | | | | |
| | |
| Expense Ratios | | |
| Your Fund Compared With Its Peer Group | | |
| | | Peer Group |
| | Fund | Average |
| Massachusetts Tax-Exempt Fund | 0.15% | 1.03% |
| The fund expense ratio shown is from the prospectus dated March 28, 2017, and represents estimated costs for the current fiscal year. For |
| the six months ended May 31, 2017, the fund’s annualized expense ratio was 0.15%. The peer-group expense ratio is derived from data |
| provided by Lipper, a Thomson Reuters Company, and captures information through year-end 2016. | |
| |
| Peer group: Massachusetts Municipal Debt Funds. | | |
1
Chairman’s Perspective

Bill McNabb
Chairman and Chief Executive Officer
Dear Shareholder,
At the end of May, we completed the latest round of expense ratio changes for our U.S.-based funds. The estimated savings for our investors during the six-month period was more than $300 million across our fund lineup—another record for us.1
That’s a remarkable amount, but it’s also business as usual here at Vanguard. After all, we’ve been cutting costs for investors for more than 40 years. Indeed, we’ve become so synonymous with driving down costs that when other investment companies lower their fees, the financial press often refers to it as the “Vanguard effect.”
To be sure, high costs persist in some areas of the industry. But the good news is, our 40-year campaign to lower costs seems to be approaching its mathematical limits, with some fund expenses now near zero not just at Vanguard but at other investment companies as well.
What makes investors successful?
While we’ll continue our drive for cost efficiency, we’ll also keep vigorously promoting our three other linchpin investment principles:
• Goals. Create clear, appropriate investment goals.
• Balance. Develop a suitable asset allocation using broadly diversified funds.
1 This figure represents cumulative net savings from expense ratio changes for all Vanguard fund share classes announced from December 2016
through May 2017. The estimated savings is the difference between prior and current expense ratios multiplied by average assets under
management (AUM). Average AUM is based on averaging one month’s daily average assets over the 12 months of each fund’s fiscal year.
2
• Discipline. Maintain perspective and long-term discipline.
Today, these tenets are more relevant than ever. They’re essential elements of our Personal Advisor Services recommendations, the model portfolios we develop for financial advisors, and our target-date funds.
We’re convinced that as investors increasingly adopt low-cost portfolios, focusing on goals, balance, and discipline could make the difference between achieving financial objectives and falling short.
Of course, there’s nothing new about our philosophy. And it seems simple enough. But unfortunately, we all have built-in behavioral biases that can make it hard to stick to the plan. We might, for example, allow natural inertia to keep us from rebalancing our portfolios to control risk, or we may become too wedded to an opinion or approach.
Lessons from the last crisis
Although it can be difficult at times to follow proven investing principles, it’s not impossible, even under the most challenging circumstances.
During the financial crisis of 2008–2009, various media outlets asked me whether our investors were pulling out of the
| | | |
| Market Barometer | | | |
| | | | Total Returns |
| | | Periods Ended May 31, 2017 |
| | Six | One | Five Years |
| | Months | Year | (Annualized) |
| Stocks | | | |
| Russell 1000 Index (Large-caps) | 10.55% | 17.48% | 15.37% |
| Russell 2000 Index (Small-caps) | 4.33 | 20.36 | 14.04 |
| Russell 3000 Index (Broad U.S. market) | 10.06 | 17.69 | 15.26 |
| FTSE All-World ex US Index (International) | 16.80 | 18.45 | 8.86 |
| |
| Bonds | | | |
| Bloomberg Barclays U.S. Aggregate Bond Index | | | |
| (Broad taxable market) | 2.52% | 1.58% | 2.24% |
| Bloomberg Barclays Municipal Bond Index | | | |
| (Broad tax-exempt market) | 5.16 | 1.46 | 3.31 |
| Citigroup Three-Month U.S. Treasury Bill Index | 0.26 | 0.41 | 0.12 |
| |
| CPI | | | |
| Consumer Price Index | 1.40% | 1.87% | 1.27% |
3
market and running for the hills. In actuality, we didn’t see that at Vanguard. Our clients were certainly nervous, and they contacted us more often. But for the most part, they didn’t engage in the excessive, panicked trading that can be so destructive to building wealth. Those who relied on financial advisors who follow our philosophy were wisely counseled to stay the course.
The accompanying chart shows the importance of patience and discipline. Investors who maintained a 60% stock/ 40% bond mix through the bear market were amply rewarded afterward, while those who fled stocks when they hit bottom were left far behind.
It’s not different this time
Today, nearly a decade after the global financial crisis, the world seems very different. Market indexes recently hit a series of all-time highs. With the wind at their backs and the increasing availability of low-cost funds, investors may be tempted to ask, “What could go wrong?” The answer is, “A lot.” Performance chasing and market-timing won’t be any more effective with low-cost funds than they are with high-cost funds.
| Reacting to volatility can hurt returns |
| Investors who kept a balanced portfolio through the 2008–2009 crash were rewarded |
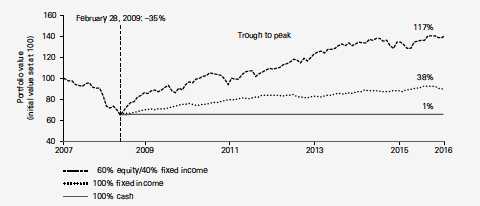
| Notes: On October 31, 2007, close to the equity market’s peak, the value of a hypothetical 60/40 portfolio is set at 100. Subsequent returns |
| are calculated relative to this starting value of 100. It is assumed that all dividends and income are reinvested in the components of the |
| indexes. The initial allocation for the portfolios was 42% U.S. stocks, 18% international stocks, and 40% U.S. bonds. The rebalanced portfolio |
| is returned to this allocation every month-end. Returns for the U.S. stock allocation are based on the MSCI US Broad Market Index. Returns for |
| the international stock allocation are based on the MSCI All Country World Index ex USA. Returns for the bond allocation are based on the |
| Bloomberg Barclays U.S. Aggregate Bond Index. Returns for the cash allocation are based on the Citigroup 3-Month U.S. Treasury Bill Index. |
| Sources: Vanguard, using data provided by Thomson Reuters Datastream. |
4
Whether markets are sunny or stormy, investors need to stick to their investment plans, maintain balanced and diversified portfolios, and think long-term.
We strive to help investors follow the principles that lead to enduring success. I’d like to think that will be the real “Vanguard effect.”
As always, thank you for investing with Vanguard.
Sincerely,

F. William McNabb III
Chairman and Chief Executive Officer
June 14, 2017
5
Advisor’s Report
For the six months ended May 31, 2017, Vanguard Massachusetts Tax-Exempt Fund returned 5.33%, matching its benchmark, the Bloomberg Barclays Massachusetts Municipal Bond Index, and surpassing the 3.82% average return of its peer funds.
Both price appreciation and interest income contributed solidly to the results. The fund’s capital return was 3.77% and its return from interest income was 1.56%. Municipal bond yields crept a bit higher over the period. The fund’s 30-day SEC yield inched to 2.34% from 2.31% six months earlier.
Please note: The fund is permitted to invest in bonds whose income is subject to the alternative minimum tax (AMT). However, as of the end of the period, it did not own any AMT bonds.
The investment environment
During the period, the Federal Reserve increased interest rates twice; the second move, in March, put the federal funds rate at 0.75%–1.00% and marked just the third time the Fed had raised rates since the financial crisis. (After the period, in June, the Fed raised rates again.)
The Fed’s decisions signaled a normalization of monetary policy and came as the U.S. economy posted mostly positive results. In May, unemployment hit 4.3%, its lowest level since 2001. Wages ticked up and some commodities posted price increases, pushing inflation closer to the Fed’s 2% target.
In Massachusetts, the unemployment rate increased from 3.1% to 3.9% over the period but still remained below the national average. The commonwealth’s
| | |
| Yields of Municipal Securities | | |
| (AAA-Rated General Obligation Issues) | | |
| | November 30, | May 31, |
| Maturity | 2016 | 2017 |
| 2 years | 1.16% | 0.89% |
| 5 years | 1.85 | 1.22 |
| 10 years | 2.52 | 1.90 |
| 30 years | 3.26 | 2.74 |
| Source: Vanguard. | | |
6
economy over the period has lagged that of the United States as a whole, according to a gauge of current economic conditions published monthly by the Federal Reserve Bank of Philadelphia. The bank’s index for Massachusetts declined about 1% between November 2016 and April 2017, while at the national level it rose slightly more than 1%.
However, Massachusetts’ economy has outpaced the nation’s in the years since the financial crisis. From its low point in 2009 through April 2017, the bank’s index for Massachusetts climbed about 40%, compared with an increase of about 24% for the U.S. index. (Each state’s index incorporates data on nonfarm payroll employment, the jobless rate, average hours worked in manufacturing, and inflation-adjusted wage and salary payments.)
The Massachusetts economy remains fundamentally strong, and is bolstered by large education, health care, finance, and technology sectors. Massachusetts’ population has grown over 3% between 2010 and 2016. The population enjoys a highly educated workforce and wealth and income levels that are among the highest in the nation.
Despite the strong economy and year-over-year revenue growth of over 1% in the fiscal year through April 30, tax collections have underperformed estimates, a trend seen in many states nationwide. After mid-year budget cuts were implemented in December 2016 to balance the fiscal-year budget as a result of lower-than-expected revenues, revenues continued to underperform in the following months, leaving a projected gap of over $400 million on a $39 billion budget as of the end of May.
The state is reducing revenue projections for fiscal year 2018 based on results from fiscal 2017. While Governor Baker is generally opposed to tax increases, the legislature is expected to place a ballot initiative before voters in November 2018 to add language to the state constitution creating a surtax on incomes over $1 million. If implemented, the surtax is expected to generate an additional $2 billion in annual collections.
Massachusetts’ credit ratings from Moody’s, Fitch, and Standard & Poor’s remained unchanged during the fund’s reporting period ended May 31—Aa1 with a stable outlook from Moody’s, AA+ with a stable outlook from Fitch, and AA+ with a negative outlook from S&P. In June, however, S&P downgraded Massachusetts debt to AA.
Management of the fund
We strive to add value through a diversified mix of strategies that include duration, yield-curve positioning, credit-quality decisions, and security selection. Vanguard’s experienced team of credit analysts perform objective, independent analyses of bonds owned by the fund. Our investment process relies on robust risk management that monitors the positioning of the fund.
7
The fund’s A-rated and Baa-rated bonds and its bonds with maturities of 10–20 years and 20–30 years boosted its performance compared with its benchmark index.
Weaker results among general obligation state holdings were somewhat offset by our stronger university revenue and hospital revenue issues.
A look ahead
Absent an unexpected external shock, the U.S. economy looks set to continue its steady growth, with real GDP likely to be around 2% in 2017, or perhaps closer to 2.5% if implementation of the Trump administration’s agenda has a positive effect on the economy. While job growth may slow given the tightening we’ve seen in the labor market, competition for labor could increase the pace of annual wage increases. That should provide some support to inflation in the short term, but not so much that it would significantly overshoot the central bank’s 2% target. We’re encouraged by the Fed’s decision to continue normalizing rates, which have been near zero since 2009. By year end, the federal funds rate could increase to 1.25%–1.5% and we might see the Fed begin to reduce its balance sheet; in any case, we think the Fed will maintain its gradual, “dovish” policy approach given the structural anti-inflationary forces still at work in the global economy.
If growth and inflation remain modest, the cost of borrowing shouldn’t get out of hand, especially if yields in the United States remain attractive compared with those in other developed economies. International demand should help cap U.S. bond yields.
Although the pro-business, pro-growth agenda of the new administration could give the economy a boost, it remains to be seen what will get passed into law and what the financial markets’ reaction will be. Needless to say, we will closely monitor developments that could cloud the outlook for munis, such as changes to the marginal tax rates for individuals and corporations, a cap on the level of tax exemption for munis, and increased muni issuance if infrastructure spending ramps up significantly.
Although we may see more volatility in 2017, we expect munis to continue to offer relative stability and a steady stream of income. And whatever the markets may bring, our experienced team of portfolio managers, traders, and credit analysts will continue to seek opportunities to produce competitive returns.
Christopher W. Alwine, CFA, Principal,
Head of Municipal Group
Mathew M. Kiselak, Principal,
Portfolio Manager,
Head of Municipal Bond Desk
Vanguard Fixed Income Group
June 16, 2017
8
Massachusetts Tax-Exempt Fund
| | | |
| Fund Profile | | |
| As of May 31, 2017 | | |
|
| Financial Attributes | | |
| |
| | | Bloomberg | |
| | | Barclays | Bloomberg |
| | | MA | Barclays |
| | | Municipal | Municipal |
| | | Bond | Bond |
| | Fund | Index | Index |
| Number of Bonds | 403 | 1,896 | 50,785 |
| Yield to Maturity | | | |
| (before expenses) | 2.3% | 2.0% | 2.1% |
| Average Coupon | 4.7% | 4.8% | 4.8% |
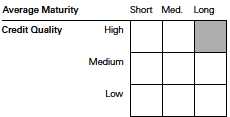
| Average Duration | 7.1 years | 6.6 years | 6.2 years |
| Average Stated | | | |
| Maturity | 16.8 years | 12.8 years | 12.9 years |
| Ticker Symbol | VMATX | — | — |
| Expense Ratio1 | 0.15% | — | — |
| 30-Day SEC Yield | 2.34% | — | — |
| Short-Term | | | |
| Reserves | 3.3% | — | — |
| | |
| Volatility Measures | | |
| | Bloomberg | Bloomberg |
| | Barclays MA | Barclays |
| | Municipal | Municipal |
| | Bond Index | Bond Index |
| R-Squared | 0.98 | 0.98 |
| Beta | 1.10 | 1.18 |
These measures show the degree and timing of the fund’s fluctuations compared with the indexes over 36 months.
| |
| Distribution by Stated Maturity | |
| (% of portfolio) | |
| Under 1 Year | 3.9% |
| 1 - 3 Years | 3.2 |
| 3 - 5 Years | 3.3 |
| 5 - 10 Years | 7.7 |
| 10 - 20 Years | 43.8 |
| 20 - 30 Years | 35.2 |
| Over 30 Years | 2.9 |
Distribution by Credit Quality (% of portfolio)
| |
| AAA | 15.8% |
| AA | 60.9 |
| A | 13.2 |
| BBB | 10.0 |
| Not Rated | 0.1 |
Credit-quality ratings are obtained from Moody's and S&P, and the
higher rating for each issue is shown. "Not Rated" is used to
classify securities for which a rating is not available. Not rated
securities include a fund's investment in Vanguard Market Liquidity
Fund or Vanguard Municipal Cash Management Fund, each of
which invests in high-quality money market instruments and may
serve as a cash management vehicle for the Vanguard funds,
trusts, and accounts. For more information about these ratings, see
the Glossary entry for Credit Quality.
Investment Focus
1 The expense ratio shown is from the prospectus dated March 28, 2017, and represents estimated costs for the current fiscal year. For the six months ended May 31, 2017, the annualized expense ratio was 0.15%.
9
Massachusetts Tax-Exempt Fund
Performance Summary
All of the returns in this report represent past performance, which is not a guarantee of future results that may be achieved by the fund. (Current performance may be lower or higher than the performance data cited. For performance data current to the most recent month-end, visit our website at vanguard.com/performance.) Note, too, that both investment returns and principal value can fluctuate widely, so an investor’s shares, when sold, could be worth more or less than their original cost. The returns shown do not reflect taxes that a shareholder would pay on fund distributions or on the sale of fund shares.
| | | | |
| Fiscal-Year Total Returns (%): November 30, 2006, Through May 31, 2017 | |
| | | | | Bloomberg |
| | | | | Barclays MA |
| | | | | Municipal |
| | | | | Bond Index |
| Fiscal Year | Income Returns | Capital Returns | Total Returns | Total Returns |
| 2007 | 4.18% | -2.03% | 2.15% | 3.27% |
| 2008 | 4.00 | -6.72 | -2.72 | -1.30 |
| 2009 | 4.42 | 7.94 | 12.36 | 13.60 |
| 2010 | 3.80 | -0.39 | 3.41 | 3.96 |
| 2011 | 3.76 | 2.56 | 6.32 | 6.41 |
| 2012 | 3.49 | 6.92 | 10.41 | 9.57 |
| 2013 | 3.02 | -7.73 | -4.71 | -3.52 |
| 2014 | 3.48 | 5.84 | 9.32 | 7.72 |
| 2015 | 3.15 | 0.62 | 3.77 | 3.14 |
| 2016 | 2.85 | -3.53 | -0.68 | -0.82 |
| 2017 | 1.56 | 3.77 | 5.33 | 5.33 |
| Note: For 2017, performance data reflect the six months ended May 31, 2017. | | |
Average Annual Total Returns: Periods Ended March 31, 2017
This table presents returns through the latest calendar quarter—rather than through the end of the fiscal period.
Securities and Exchange Commission rules require that we provide this information.
| | | | | | |
| | | | | | | Ten Years |
| | Inception Date | One Year | Five Years | Income | Capital | Total |
| Massachusetts | | | | | | |
| Tax-Exempt Fund | 12/9/1998 | -0.65% | 3.29% | 3.58% | 0.50% | 4.08% |
See Financial Highlights for dividend and capital gains information.
10
Massachusetts Tax-Exempt Fund
Financial Statements (unaudited)
Statement of Net Assets
As of May 31, 2017
The fund reports a complete list of its holdings in regulatory filings four times in each fiscal year, at the quarter-ends. For the second and fourth fiscal quarters, the lists appear in the fund’s semiannual and annual reports to shareholders. For the first and third fiscal quarters, the fund files the lists with the Securities and Exchange Commission on Form N-Q. Shareholders can look up the fund’s Forms N-Q on the SEC’s website at sec.gov. Forms N-Q may also be reviewed and copied at the SEC’s Public Reference Room (see the back cover of this report for further information).
| | | | |
| | | | Face | Market |
| | | Maturity | Amount | Value• |
| | Coupon | Date | ($000) | ($000) |
| Tax-Exempt Municipal Bonds (99.2%) | | | | |
| Massachusetts (98.9%) | | | | |
| Boston MA GO | 5.000% | 2/1/24 | 2,345 | 2,733 |
| Boston MA GO | 5.000% | 3/1/24 | 3,000 | 3,608 |
| Boston MA GO | 5.000% | 4/1/28 | 1,940 | 2,359 |
| Boston MA Housing Authority Revenue | 5.000% | 4/1/23 (4) | 2,000 | 2,066 |
| Boston MA Housing Authority Revenue | 5.000% | 4/1/25 (4) | 5,440 | 5,617 |
| Boston MA Water & Sewer Commission Revenue | 5.000% | 5/1/19 (Prere.) | 3,725 | 4,010 |
| Boston MA Water & Sewer Commission Revenue | 5.000% | 11/1/19 (Prere.) | 1,000 | 1,095 |
| Boston MA Water & Sewer Commission Revenue | 5.000% | 11/1/20 | 1,550 | 1,757 |
| Boston MA Water & Sewer Commission Revenue | 5.000% | 11/1/30 | 750 | 876 |
| Cambridge MA GO | 5.000% | 1/1/23 | 850 | 990 |
| Cambridge MA GO | 4.000% | 1/1/26 | 1,600 | 1,856 |
| Cambridge MA GO | 4.000% | 1/1/27 | 1,000 | 1,149 |
| Essex MA North Shore Agricultural & Technical | | | | |
| School District GO | 4.000% | 6/1/39 | 2,810 | 2,953 |
| Holyoke MA GO | 5.000% | 9/1/30 | 1,690 | 1,927 |
| Massachusetts Bay Transportation Authority | | | | |
| Assessment Revenue | 5.250% | 7/1/31 | 2,285 | 2,961 |
| Massachusetts Bay Transportation Authority | | | | |
| Assessment Revenue | 4.000% | 7/1/37 | 5,000 | 5,248 |
| Massachusetts Bay Transportation Authority | | | | |
| Assessment Revenue | 5.000% | 7/1/41 | 7,430 | 8,487 |
| Massachusetts Bay Transportation Authority | | | | |
| General Transportation Revenue VRDO | 0.710% | 6/7/17 | 900 | 900 |
| Massachusetts Bay Transportation Authority | | | | |
| Sales Tax Revenue | 0.000% | 7/1/17 (Prere.) | 1,020 | 578 |
| Massachusetts Bay Transportation Authority | | | | |
| Sales Tax Revenue | 5.500% | 7/1/17 (ETM) | 75 | 75 |
| Massachusetts Bay Transportation Authority | | | | |
| Sales Tax Revenue | 5.250% | 7/1/22 | 3,500 | 4,179 |
| Massachusetts Bay Transportation Authority | | | | |
| Sales Tax Revenue | 5.000% | 7/1/23 | 4,000 | 4,825 |
| Massachusetts Bay Transportation Authority | | | | |
| Sales Tax Revenue | 5.250% | 7/1/23 | 2,825 | 3,451 |
| Massachusetts Bay Transportation Authority | | | | |
| Sales Tax Revenue | 5.000% | 7/1/27 | 5,950 | 7,449 |
| Massachusetts Bay Transportation Authority | | | | |
| Sales Tax Revenue | 4.000% | 7/1/32 | 2,870 | 3,100 |
11
| | | | |
| Massachusetts Tax-Exempt Fund | | | | |
| |
| |
| |
| | | | Face | Market |
| | | Maturity | Amount | Value• |
| | Coupon | Date | ($000) | ($000) |
| Massachusetts Bay Transportation Authority | | | | |
| Sales Tax Revenue | 5.250% | 7/1/32 | 2,900 | 3,769 |
| Massachusetts Bay Transportation Authority | | | | |
| Sales Tax Revenue | 5.250% | 7/1/33 | 2,000 | 2,607 |
| Massachusetts Bay Transportation Authority | | | | |
| Sales Tax Revenue | 5.250% | 7/1/33 | 10,000 | 13,033 |
| Massachusetts Bay Transportation Authority | | | | |
| Sales Tax Revenue | 4.000% | 7/1/35 | 1,980 | 2,107 |
| Massachusetts Bay Transportation Authority | | | | |
| Sales Tax Revenue | 4.000% | 7/1/35 | 3,000 | 3,192 |
| Massachusetts Bay Transportation Authority | | | | |
| Sales Tax Revenue | 5.000% | 7/1/35 | 2,145 | 2,359 |
| 1 Massachusetts Bay Transportation Authority | | | | |
| Sales Tax Revenue TOB VRDO | 0.880% | 6/7/17 | 2,879 | 2,879 |
| Massachusetts Clean Energy Cooperative | | | | |
| Corp. Revenue (Municipal Lighting Plant) | 5.000% | 7/1/26 | 2,875 | 3,384 |
| Massachusetts Clean Energy Cooperative | | | | |
| Corp. Revenue (Municipal Lighting Plant) | 5.000% | 7/1/29 | 2,000 | 2,313 |
| Massachusetts Clean Energy Cooperative | | | | |
| Corp. Revenue (Municipal Lighting Plant) | 5.000% | 7/1/32 | 2,500 | 2,857 |
| Massachusetts Clean Water Trust Revenue | 5.000% | 2/1/28 | 3,000 | 3,583 |
| Massachusetts Clean Water Trust Revenue | 5.000% | 8/1/28 | 4,485 | 5,747 |
| Massachusetts Clean Water Trust Revenue | 5.000% | 2/1/29 | 405 | 498 |
| Massachusetts Clean Water Trust Revenue | 5.000% | 8/1/29 | 3,545 | 4,555 |
| Massachusetts Clean Water Trust Revenue | 5.000% | 2/1/30 | 405 | 494 |
| Massachusetts Clean Water Trust Revenue | 5.000% | 2/1/35 | 3,000 | 3,474 |
| Massachusetts Clean Water Trust Revenue | 5.000% | 2/1/45 | 2,085 | 2,387 |
| Massachusetts College Building Authority | | | | |
| Revenue | 5.000% | 5/1/25 | 1,100 | 1,279 |
| Massachusetts College Building Authority | | | | |
| Revenue | 5.000% | 5/1/26 | 1,430 | 1,706 |
| Massachusetts College Building Authority | | | | |
| Revenue | 5.000% | 5/1/27 | 1,200 | 1,425 |
| Massachusetts College Building Authority | | | | |
| Revenue | 4.000% | 5/1/29 | 2,015 | 2,247 |
| Massachusetts College Building Authority | | | | |
| Revenue | 5.000% | 5/1/29 | 1,500 | 1,659 |
| Massachusetts College Building Authority | | | | |
| Revenue | 5.000% | 5/1/30 | 1,610 | 1,776 |
| Massachusetts College Building Authority | | | | |
| Revenue | 5.000% | 5/1/30 | 1,075 | 1,248 |
| Massachusetts College Building Authority | | | | |
| Revenue | 5.000% | 5/1/31 | 2,000 | 2,325 |
| Massachusetts College Building Authority | | | | |
| Revenue | 5.000% | 5/1/36 | 4,000 | 4,557 |
| Massachusetts College Building Authority | | | | |
| Revenue | 5.000% | 5/1/39 | 3,000 | 3,418 |
| Massachusetts College Building Authority | | | | |
| Revenue | 5.000% | 5/1/41 | 5,000 | 5,661 |
| Massachusetts College Building Authority | | | | |
| Revenue | 5.000% | 5/1/43 | 3,285 | 3,715 |
| Massachusetts Department of Transportation | | | | |
| Metropolitan Highway System Revenue | 5.000% | 1/1/20 | 3,500 | 3,840 |
12
| | | | |
| Massachusetts Tax-Exempt Fund | | | | |
| |
| |
| |
| | | | Face | Market |
| | | Maturity | Amount | Value• |
| | Coupon | Date | ($000) | ($000) |
| Massachusetts Department of Transportation | | | | |
| Metropolitan Highway System Revenue | 5.000% | 1/1/23 | 3,000 | 3,300 |
| Massachusetts Department of Transportation | | | | |
| Metropolitan Highway System Revenue | 5.000% | 1/1/32 | 5,620 | 6,117 |
| Massachusetts Department of Transportation | | | | |
| Metropolitan Highway System Revenue | 5.000% | 1/1/35 | 2,350 | 2,566 |
| Massachusetts Department of Transportation | | | | |
| Metropolitan Highway System Revenue | 5.000% | 1/1/37 | 3,000 | 3,244 |
| Massachusetts Department of Transportation | | | | |
| Metropolitan Highway System Revenue VRDO | 0.710% | 6/7/17 | 3,600 | 3,600 |
| Massachusetts Department of Transportation | | | | |
| Metropolitan Highway System Revenue VRDO | 0.740% | 6/7/17 | 3,900 | 3,900 |
| Massachusetts Development Finance Agency | | | | |
| Hospital Revenue (Cape Cod Healthcare | | | | |
| Obligated Group) | 5.250% | 11/15/36 | 5,130 | 5,841 |
| Massachusetts Development Finance Agency | | | | |
| Revenue (Baystate Medical Obligated Group) | 5.000% | 7/1/34 | 1,500 | 1,701 |
| Massachusetts Development Finance Agency | | | | |
| Revenue (Bentley University) | 5.000% | 7/1/40 | 5,750 | 6,594 |
| Massachusetts Development Finance Agency | | | | |
| Revenue (Berklee College of Music) | 5.000% | 10/1/31 | 1,685 | 2,003 |
| Massachusetts Development Finance Agency | | | | |
| Revenue (Berklee College of Music) | 5.250% | 10/1/41 | 3,300 | 3,738 |
| Massachusetts Development Finance Agency | | | | |
| Revenue (Berklee College of Music) | 5.000% | 10/1/46 | 1,500 | 1,724 |
| Massachusetts Development Finance Agency | | | | |
| Revenue (Berkshire Health System) | 5.000% | 10/1/22 | 2,000 | 2,275 |
| Massachusetts Development Finance Agency | | | | |
| Revenue (Berkshire Health System) | 5.000% | 10/1/28 | 1,250 | 1,382 |
| Massachusetts Development Finance Agency | | | | |
| Revenue (Berkshire Health System) | 5.000% | 10/1/29 | 1,500 | 1,652 |
| Massachusetts Development Finance Agency | | | | |
| Revenue (Berkshire Health System) | 5.000% | 10/1/30 | 1,430 | 1,569 |
| Massachusetts Development Finance Agency | | | | |
| Revenue (Berkshire Health System) | 5.000% | 10/1/31 | 1,250 | 1,368 |
| Massachusetts Development Finance Agency | | | | |
| Revenue (Boston College) | 5.000% | 7/1/19 | 520 | 564 |
| Massachusetts Development Finance Agency | | | | |
| Revenue (Boston College) | 5.000% | 7/1/38 | 2,950 | 3,500 |
| Massachusetts Development Finance Agency | | | | |
| Revenue (Boston College) | 5.000% | 7/1/40 | 2,000 | 2,192 |
| Massachusetts Development Finance Agency | | | | |
| Revenue (Boston College) | 5.000% | 7/1/42 | 2,000 | 2,363 |
| Massachusetts Development Finance Agency | | | | |
| Revenue (Boston Medical Center) | 5.000% | 7/1/22 (Prere.) | 470 | 554 |
| Massachusetts Development Finance Agency | | | | |
| Revenue (Boston Medical Center) | 5.000% | 7/1/22 (Prere.) | 2,995 | 3,532 |
| Massachusetts Development Finance Agency | | | | |
| Revenue (Boston Medical Center) | 5.000% | 7/1/29 | 2,535 | 2,802 |
| Massachusetts Development Finance Agency | | | | |
| Revenue (Boston Medical Center) | 5.000% | 7/1/29 | 3,100 | 3,528 |
| Massachusetts Development Finance Agency | | | | |
| Revenue (Boston Medical Center) | 5.000% | 7/1/30 | 2,450 | 2,760 |
13
| | | | |
| Massachusetts Tax-Exempt Fund | | | | |
| |
| |
| |
| | | | Face | Market |
| | | Maturity | Amount | Value• |
| | Coupon | Date | ($000) | ($000) |
| Massachusetts Development Finance Agency | | | | |
| Revenue (Boston Medical Center) | 5.000% | 7/1/31 | 4,245 | 4,758 |
| Massachusetts Development Finance Agency | | | | |
| Revenue (Boston Medical Center) | 5.000% | 7/1/34 | 1,510 | 1,671 |
| Massachusetts Development Finance Agency | | | | |
| Revenue (Boston Medical Center) | 5.000% | 7/1/37 | 1,000 | 1,099 |
| Massachusetts Development Finance Agency | | | | |
| Revenue (Boston Medical Center) | 5.000% | 7/1/44 | 7,000 | 7,595 |
| Massachusetts Development Finance Agency | | | | |
| Revenue (Boston University) | 5.000% | 7/1/17 (Prere.) | 10,000 | 10,035 |
| Massachusetts Development Finance Agency | | | | |
| Revenue (Boston University) | 6.000% | 5/15/29 (2) | 1,400 | 1,756 |
| Massachusetts Development Finance Agency | | | | |
| Revenue (Boston University) | 5.375% | 5/15/39 | 1,575 | 1,964 |
| Massachusetts Development Finance Agency | | | | |
| Revenue (Boston University) | 4.000% | 10/1/46 | 3,000 | 3,123 |
| Massachusetts Development Finance Agency | | | | |
| Revenue (Boston University) | 5.000% | 10/1/46 | 3,000 | 3,448 |
| Massachusetts Development Finance Agency | | | | |
| Revenue (Boston University) | 5.000% | 10/1/48 | 5,000 | 5,625 |
| Massachusetts Development Finance Agency | | | | |
| Revenue (Boston University) | 6.000% | 5/15/59 (10) | 5,575 | 7,152 |
| Massachusetts Development Finance Agency | | | | |
| Revenue (Broad Institute Inc.) | 5.250% | 4/1/37 | 4,000 | 4,486 |
| Massachusetts Development Finance Agency | | | | |
| Revenue (CareGroup Inc.) | 5.000% | 7/1/28 | 3,000 | 3,595 |
| Massachusetts Development Finance Agency | | | | |
| Revenue (CareGroup Inc.) | 5.000% | 7/1/32 | 1,000 | 1,146 |
| Massachusetts Development Finance Agency | | | | |
| Revenue (CareGroup Inc.) | 5.000% | 7/1/33 | 1,000 | 1,139 |
| Massachusetts Development Finance Agency | | | | |
| Revenue (CareGroup Inc.) | 5.000% | 7/1/37 | 1,000 | 1,150 |
| Massachusetts Development Finance Agency | | | | |
| Revenue (CareGroup Inc.) | 5.000% | 7/1/38 | 1,000 | 1,148 |
| Massachusetts Development Finance Agency | | | | |
| Revenue (Carleton-Willard Village) | 5.250% | 12/1/25 | 600 | 650 |
| Massachusetts Development Finance Agency | | | | |
| Revenue (Carleton-Willard Village) | 5.625% | 12/1/30 | 550 | 595 |
| Massachusetts Development Finance Agency | | | | |
| Revenue (Children’s Hospital) | 5.000% | 10/1/34 | 2,440 | 2,850 |
| Massachusetts Development Finance Agency | | | | |
| Revenue (Children’s Hospital) | 5.000% | 10/1/46 | 4,000 | 4,597 |
| Massachusetts Development Finance Agency | | | | |
| Revenue (Commonwealth Contract Assistance) | 5.000% | 5/1/35 | 5,210 | 5,999 |
| Massachusetts Development Finance Agency | | | | |
| Revenue (Commonwealth Contract Assistance) | 5.500% | 2/1/40 | 2,160 | 2,376 |
| Massachusetts Development Finance Agency | | | | |
| Revenue (Dana-Farber Cancer Institute) | 5.000% | 12/1/30 | 2,115 | 2,526 |
| Massachusetts Development Finance Agency | | | | |
| Revenue (Dana-Farber Cancer Institute) | 5.000% | 12/1/41 | 11,105 | 12,761 |
| Massachusetts Development Finance Agency | | | | |
| Revenue (Dana-Farber Cancer Institute) | 5.000% | 12/1/46 | 4,000 | 4,561 |
| Massachusetts Development Finance Agency | | | | |
| Revenue (Deerfield Academy) | 5.000% | 10/1/40 | 4,665 | 5,189 |
14
| | | | |
| Massachusetts Tax-Exempt Fund | | | | |
| |
| |
| |
| | | | Face | Market |
| | | Maturity | Amount | Value• |
| | Coupon | Date | ($000) | ($000) |
| Massachusetts Development Finance Agency | | | | |
| Revenue (Emerson College) | 5.000% | 1/1/28 | 1,825 | 2,083 |
| Massachusetts Development Finance Agency | | | | |
| Revenue (Emerson College) | 5.000% | 1/1/35 | 3,000 | 3,325 |
| Massachusetts Development Finance Agency | | | | |
| Revenue (Emerson College) | 5.000% | 1/1/40 | 6,000 | 6,273 |
| Massachusetts Development Finance Agency | | | | |
| Revenue (Emerson College) | 5.000% | 1/1/41 | 5,960 | 6,538 |
| Massachusetts Development Finance Agency | | | | |
| Revenue (Emerson College) | 5.250% | 1/1/42 | 1,700 | 1,943 |
| Massachusetts Development Finance Agency | | | | |
| Revenue (Emerson College) | 5.000% | 1/1/47 | 4,330 | 4,810 |
| Massachusetts Development Finance Agency | | | | |
| Revenue (Emmanuel College) | 5.000% | 10/1/43 | 4,000 | 4,447 |
| Massachusetts Development Finance Agency | | | | |
| Revenue (Harvard University) | 5.000% | 10/15/20 (Prere.) | 9,790 | 11,076 |
| Massachusetts Development Finance Agency | | | | |
| Revenue (Harvard University) | 5.000% | 10/15/20 (Prere.) | 740 | 837 |
| Massachusetts Development Finance Agency | | | | |
| Revenue (Harvard University) | 5.000% | 10/15/20 (Prere.) | 260 | 294 |
| Massachusetts Development Finance Agency | | | | |
| Revenue (Harvard University) | 5.250% | 2/1/21 (Prere.) | 11,000 | 12,657 |
| Massachusetts Development Finance Agency | | | | |
| Revenue (Harvard University) | 5.000% | 7/15/33 | 5,340 | 6,476 |
| Massachusetts Development Finance Agency | | | | |
| Revenue (Harvard University) | 5.000% | 7/15/34 | 5,000 | 6,037 |
| Massachusetts Development Finance Agency | | | | |
| Revenue (Harvard University) | 4.000% | 7/15/36 | 3,500 | 3,848 |
| Massachusetts Development Finance Agency | | | | |
| Revenue (Harvard University) | 5.000% | 7/15/36 | 9,340 | 12,219 |
| Massachusetts Development Finance Agency | | | | |
| Revenue (Harvard University) | 5.000% | 7/15/40 | 7,000 | 9,266 |
| Massachusetts Development Finance Agency | | | | |
| Revenue (Lahey Clinic Obligated Group) | 5.000% | 8/15/28 | 750 | 838 |
| Massachusetts Development Finance Agency | | | | |
| Revenue (Lahey Clinic Obligated Group) | 5.000% | 8/15/40 | 1,750 | 1,976 |
| Massachusetts Development Finance Agency | | | | |
| Revenue (Lahey Clinic Obligated Group) | 5.000% | 8/15/45 | 9,000 | 10,119 |
| Massachusetts Development Finance Agency | | | | |
| Revenue (Loomis Obligated Group) | 6.000% | 1/1/33 | 4,000 | 4,452 |
| Massachusetts Development Finance Agency | | | | |
| Revenue (Lowell General Hospital) | 5.000% | 7/1/37 | 4,800 | 5,156 |
| Massachusetts Development Finance Agency | | | | |
| Revenue (Lowell General Hospital) | 5.000% | 7/1/44 | 6,010 | 6,402 |
| Massachusetts Development Finance Agency | | | | |
| Revenue (Massachusetts College of Pharmacy | | | | |
| & Allied Health Sciences) | 5.000% | 7/1/19 | 175 | 189 |
| Massachusetts Development Finance Agency | | | | |
| Revenue (Massachusetts College of Pharmacy | | | | |
| & Allied Health Sciences) | 5.000% | 7/1/21 | 300 | 344 |
| Massachusetts Development Finance Agency | | | | |
| Revenue (Massachusetts College of Pharmacy | | | | |
| & Allied Health Sciences) | 5.000% | 7/1/23 | 250 | 298 |
15
| | | | |
| Massachusetts Tax-Exempt Fund | | | | |
| |
| |
| |
| | | | Face | Market |
| | | Maturity | Amount | Value• |
| | Coupon | Date | ($000) | ($000) |
| Massachusetts Development Finance Agency | | | | |
| Revenue (Massachusetts College of Pharmacy | | | | |
| & Allied Health Sciences) | 5.000% | 7/1/26 | 1,380 | 1,594 |
| Massachusetts Development Finance Agency | | | | |
| Revenue (MCPHS University) | 5.000% | 7/1/31 | 400 | 469 |
| Massachusetts Development Finance Agency | | | | |
| Revenue (MCPHS University) | 5.000% | 7/1/32 | 300 | 350 |
| Massachusetts Development Finance Agency | | | | |
| Revenue (MCPHS University) | 5.000% | 7/1/37 | 450 | 516 |
| Massachusetts Development Finance Agency | | | | |
| Revenue (Merrimack College) | 5.000% | 7/1/32 | 2,000 | 2,143 |
| Massachusetts Development Finance Agency | | | | |
| Revenue (Merrimack College) | 5.000% | 7/1/37 | 300 | 328 |
| Massachusetts Development Finance Agency | | | | |
| Revenue (Merrimack College) | 5.000% | 7/1/42 | 500 | 543 |
| Massachusetts Development Finance Agency | | | | |
| Revenue (Merrimack College) | 5.250% | 7/1/42 | 1,920 | 2,052 |
| Massachusetts Development Finance Agency | | | | |
| Revenue (Merrimack College) | 5.125% | 7/1/44 | 1,500 | 1,613 |
| Massachusetts Development Finance Agency | | | | |
| Revenue (Merrimack College) | 5.000% | 7/1/47 | 2,500 | 2,705 |
| Massachusetts Development Finance Agency | | | | |
| Revenue (Milford Regional Medical Center) | 5.625% | 7/15/36 | 1,000 | 1,124 |
| Massachusetts Development Finance Agency | | | | |
| Revenue (Milford Regional Medical Center) | 5.750% | 7/15/43 | 5,755 | 6,433 |
| Massachusetts Development Finance Agency | | | | |
| Revenue (Mount Holyoke College) | 5.000% | 7/1/18 (Prere.) | 1,500 | 1,567 |
| Massachusetts Development Finance Agency | | | | |
| Revenue (Northeastern University) | 5.000% | 10/1/29 | 3,250 | 3,711 |
| Massachusetts Development Finance Agency | | | | |
| Revenue (Northeastern University) | 5.000% | 10/1/30 | 1,750 | 1,992 |
| Massachusetts Development Finance Agency | | | | |
| Revenue (Northeastern University) | 5.000% | 3/1/32 | 950 | 1,081 |
| Massachusetts Development Finance Agency | | | | |
| Revenue (Northeastern University) | 5.000% | 3/1/39 | 3,500 | 3,918 |
| Massachusetts Development Finance Agency | | | | |
| Revenue (Olin College) | 5.000% | 11/1/38 | 6,000 | 6,815 |
| Massachusetts Development Finance Agency | | | | |
| Revenue (Partners Healthcare) | 5.000% | 7/1/28 | 2,000 | 2,304 |
| Massachusetts Development Finance Agency | | | | |
| Revenue (Partners Healthcare) | 5.000% | 7/1/29 | 6,000 | 7,193 |
| Massachusetts Development Finance Agency | | | | |
| Revenue (Partners Healthcare) | 5.000% | 7/1/30 | 1,500 | 1,709 |
| Massachusetts Development Finance Agency | | | | |
| Revenue (Partners Healthcare) | 5.000% | 7/1/31 | 5,705 | 6,406 |
| Massachusetts Development Finance Agency | | | | |
| Revenue (Partners Healthcare) | 4.000% | 7/1/32 | 8,000 | 8,573 |
| Massachusetts Development Finance Agency | | | | |
| Revenue (Partners Healthcare) | 5.000% | 7/1/36 | 4,000 | 4,467 |
| Massachusetts Development Finance Agency | | | | |
| Revenue (Partners Healthcare) | 5.000% | 7/1/40 | 3,000 | 3,386 |
| Massachusetts Development Finance Agency | | | | |
| Revenue (Partners Healthcare) | 5.375% | 7/1/41 | 4,000 | 4,400 |
16
| | | | |
| Massachusetts Tax-Exempt Fund | | | | |
| |
| |
| |
| | | | Face | Market |
| | | Maturity | Amount | Value• |
| | Coupon | Date | ($000) | ($000) |
| Massachusetts Development Finance Agency | | | | |
| Revenue (Partners Healthcare) | 5.000% | 7/1/45 | 3,775 | 4,241 |
| Massachusetts Development Finance Agency | | | | |
| Revenue (Partners Healthcare) | 5.000% | 7/1/47 | 5,000 | 5,653 |
| Massachusetts Development Finance Agency | | | | |
| Revenue (Phillips Academy) | 5.000% | 9/1/38 | 1,545 | 1,818 |
| Massachusetts Development Finance Agency | | | | |
| Revenue (Phillips Academy) | 5.000% | 9/1/43 | 8,295 | 9,718 |
| Massachusetts Development Finance Agency | | | | |
| Revenue (Seven Hills Foundation Obligated | | | | |
| Group) | 5.000% | 9/1/35 | 1,500 | 1,583 |
| Massachusetts Development Finance Agency | | | | |
| Revenue (Simmons College) | 5.500% | 10/1/28 | 1,000 | 1,165 |
| Massachusetts Development Finance Agency | | | | |
| Revenue (Simmons College) | 5.125% | 10/1/33 | 2,000 | 2,212 |
| Massachusetts Development Finance Agency | | | | |
| Revenue (Simmons College) | 5.000% | 10/1/36 | 2,250 | 2,508 |
| Massachusetts Development Finance Agency | | | | |
| Revenue (Simmons College) | 5.250% | 10/1/39 | 3,000 | 3,341 |
| Massachusetts Development Finance Agency | | | | |
| Revenue (South Shore Hospital Inc.) | 5.000% | 7/1/41 | 2,000 | 2,227 |
| Massachusetts Development Finance Agency | | | | |
| Revenue (Southcoast Health System Obligated | | | | |
| Group) | 5.000% | 7/1/27 | 1,550 | 1,783 |
| Massachusetts Development Finance Agency | | | | |
| Revenue (Sterling & Francine Clark Art Institute) | 5.000% | 7/1/34 | 1,000 | 1,167 |
| Massachusetts Development Finance Agency | | | | |
| Revenue (Sterling & Francine Clark Art Institute) | 5.000% | 7/1/35 | 2,000 | 2,324 |
| Massachusetts Development Finance Agency | | | | |
| Revenue (Sterling & Francine Clark Art Institute) | 4.000% | 7/1/41 | 6,130 | 6,403 |
| Massachusetts Development Finance Agency | | | | |
| Revenue (Suffolk University) | 5.000% | 7/1/30 | 3,000 | 3,184 |
| Massachusetts Development Finance Agency | | | | |
| Revenue (Suffolk University) | 5.000% | 7/1/35 | 1,000 | 1,137 |
| Massachusetts Development Finance Agency | | | | |
| Revenue (Suffolk University) | 5.000% | 7/1/36 | 1,000 | 1,133 |
| Massachusetts Development Finance Agency | | | | |
| Revenue (Suffolk University) | 4.000% | 7/1/39 | 6,975 | 7,120 |
| Massachusetts Development Finance Agency | | | | |
| Revenue (Suffolk University) | 5.125% | 7/1/40 | 3,000 | 3,160 |
| Massachusetts Development Finance Agency | | | | |
| Revenue (Tufts Medical Center) | 6.250% | 1/1/27 | 3,545 | 4,056 |
| Massachusetts Development Finance Agency | | | | |
| Revenue (Tufts Medical Center) | 7.250% | 1/1/32 | 4,500 | 5,284 |
| Massachusetts Development Finance Agency | | | | |
| Revenue (Tufts Medical Center) | 6.750% | 1/1/36 | 850 | 975 |
| Massachusetts Development Finance Agency | | | | |
| Revenue (Tufts Medical Center) | 6.875% | 1/1/41 | 2,000 | 2,298 |
| Massachusetts Development Finance Agency | | | | |
| Revenue (Tufts University) | 5.000% | 8/15/38 | 1,000 | 1,156 |
| Massachusetts Development Finance Agency | | | | |
| Revenue (UMass Memorial Health Care | | | | |
| Obligated Group) | 5.000% | 7/1/31 | 1,000 | 1,142 |
17
| | | | |
| Massachusetts Tax-Exempt Fund | | | | |
| |
| |
|
| | | | Face | Market |
| | | Maturity | Amount | Value• |
| | Coupon | Date | ($000) | ($000) |
| Massachusetts Development Finance Agency | | | | |
| Revenue (UMass Memorial Health Care | | | | |
| Obligated Group) | 5.000% | 7/1/32 | 1,000 | 1,137 |
| Massachusetts Development Finance Agency | | | | |
| Revenue (UMass Memorial Health Care | | | | |
| Obligated Group) | 5.000% | 7/1/38 | 3,000 | 3,379 |
| Massachusetts Development Finance Agency | | | | |
| Revenue (UMass Memorial Medical Center) | 5.125% | 7/1/26 | 2,750 | 3,067 |
| Massachusetts Development Finance Agency | | | | |
| Revenue (UMass Memorial Medical Center) | 5.000% | 7/1/31 | 1,000 | 1,136 |
| Massachusetts Development Finance Agency | | | | |
| Revenue (UMass Memorial Medical Center) | 5.500% | 7/1/31 | 5,500 | 6,112 |
| Massachusetts Development Finance Agency | | | | |
| Revenue (UMass Memorial Medical Center) | 5.000% | 7/1/41 | 700 | 771 |
| Massachusetts Development Finance Agency | | | | |
| Revenue (UMass Memorial Medical Center) | 5.000% | 7/1/46 | 1,355 | 1,487 |
| Massachusetts Development Finance Agency | | | | |
| Revenue (Wellesley College) | 5.000% | 7/1/42 | 2,000 | 2,296 |
| Massachusetts Development Finance Agency | | | | |
| Revenue (Wentworth Institute | | | | |
| of Technology Inc.) | 5.000% | 10/1/46 | 4,250 | 4,714 |
| Massachusetts Development Finance Agency | | | | |
| Revenue (Western New England University) | 5.000% | 9/1/45 | 2,825 | 3,111 |
| Massachusetts Development Finance Agency | | | | |
| Revenue (WGBH Educational Foundation) | 0.000% | 1/1/32 (12) | 1,620 | 970 |
| Massachusetts Development Finance Agency | | | | |
| Revenue (WGBH Educational Foundation) | 0.000% | 1/1/33 (12) | 3,290 | 1,881 |
| Massachusetts Development Finance Agency | | | | |
| Revenue (WGBH Educational Foundation) | 5.000% | 1/1/35 | 1,720 | 1,993 |
| Massachusetts Development Finance Agency | | | | |
| Revenue (WGBH Educational Foundation) | 5.000% | 1/1/36 | 1,000 | 1,155 |
| Massachusetts Development Finance Agency | | | | |
| Revenue (WGBH Educational Foundation) | 5.000% | 1/1/36 (12) | 2,650 | 2,703 |
| 2 Massachusetts Development Finance Agency | | | | |
| Revenue (Williams College) | 5.000% | 7/1/29 | 1,000 | 1,249 |
| 2 Massachusetts Development Finance Agency | | | | |
| Revenue (Williams College) | 5.000% | 7/1/30 | 1,000 | 1,241 |
| Massachusetts Development Finance Agency | | | | |
| Revenue (Williams College) | 5.000% | 7/1/33 | 5,600 | 6,676 |
| Massachusetts Development Finance Agency | | | | |
| Revenue (Williams College) | 5.000% | 7/1/38 | 4,000 | 4,616 |
| Massachusetts Development Finance Agency | | | | |
| Revenue (Worcester Polytechnic Institute) | 5.000% | 9/1/50 | 2,650 | 2,923 |
| Massachusetts Development Finance Agency | | | | |
| Revenue (Worcester Polytechnic Institute) | 5.000% | 9/1/52 | 10,095 | 11,375 |
| Massachusetts Development Finance Agency | | | | |
| Special Obligation Revenue | 5.000% | 5/1/34 | 1,295 | 1,483 |
| Massachusetts Development Finance Agency | | | | |
| Special Obligation Revenue | 5.000% | 5/1/39 | 6,470 | 7,363 |
| Massachusetts Development Finance Agency | | | | |
| Special Obligation Revenue | 5.000% | 5/1/39 | 1,000 | 1,138 |
| Massachusetts Federal Highway GAN | | | | |
| (Accelerated Bridge Program) | 5.000% | 6/15/26 | 3,000 | 3,494 |
| Massachusetts Federal Highway Revenue | 5.000% | 6/15/27 | 6,000 | 7,213 |
18
| | | | |
| Massachusetts Tax-Exempt Fund | | | | |
| |
| |
| |
| | | | Face | Market |
| | | Maturity | Amount | Value• |
| | Coupon | Date | ($000) | ($000) |
| Massachusetts GO | 5.000% | 8/1/17 (Prere.) | 1,250 | 1,259 |
| Massachusetts GO | 5.250% | 8/1/17 (Prere.) | 1,500 | 1,511 |
| Massachusetts GO | 5.000% | 7/1/19 (Prere.) | 780 | 845 |
| Massachusetts GO | 5.500% | 10/1/19 (2) | 2,025 | 2,238 |
| Massachusetts GO | 5.500% | 10/1/19 (12) | 1,000 | 1,105 |
| Massachusetts GO | 5.000% | 4/1/20 | 2,550 | 2,836 |
| Massachusetts GO | 5.250% | 8/1/20 | 4,740 | 5,364 |
| Massachusetts GO | 5.000% | 8/1/21 (Prere.) | 2,000 | 2,315 |
| Massachusetts GO | 5.000% | 8/1/21 (Prere.) | 6,500 | 7,510 |
| Massachusetts GO | 5.000% | 5/1/23 | 2,500 | 3,010 |
| Massachusetts GO | 5.250% | 8/1/23 | 1,000 | 1,226 |
| Massachusetts GO | 5.000% | 7/1/26 | 9,000 | 10,580 |
| Massachusetts GO | 5.000% | 7/1/27 | 5,000 | 6,338 |
| Massachusetts GO | 5.000% | 7/1/28 | 10,740 | 13,238 |
| Massachusetts GO | 5.000% | 7/1/28 | 2,570 | 3,285 |
| Massachusetts GO | 5.000% | 7/1/29 | 4,900 | 5,990 |
| Massachusetts GO | 5.000% | 7/1/30 | 560 | 680 |
| Massachusetts GO | 5.500% | 8/1/30 (2) | 7,000 | 9,259 |
| Massachusetts GO | 5.000% | 7/1/32 | 3,460 | 4,156 |
| Massachusetts GO | 4.000% | 8/1/32 | 5,000 | 5,326 |
| Massachusetts GO | 5.000% | 7/1/33 | 5,215 | 6,226 |
| Massachusetts GO | 4.500% | 7/1/34 | 11,170 | 12,518 |
| Massachusetts GO | 5.000% | 7/1/34 | 5,000 | 5,943 |
| Massachusetts GO | 5.000% | 12/1/34 | 13,000 | 15,551 |
| Massachusetts GO | 4.000% | 4/1/35 | 5,000 | 5,321 |
| Massachusetts GO | 4.000% | 5/1/35 | 5,000 | 5,264 |
| Massachusetts GO | 5.000% | 7/1/35 | 4,000 | 4,683 |
| Massachusetts GO | 5.000% | 7/1/35 | 5,000 | 5,916 |
| Massachusetts GO | 5.000% | 7/1/36 | 4,000 | 4,719 |
| Massachusetts GO | 5.000% | 8/1/36 | 9,000 | 10,228 |
| Massachusetts GO | 5.000% | 12/1/36 | 3,000 | 3,561 |
| Massachusetts GO | 5.000% | 7/1/37 | 500 | 582 |
| Massachusetts GO | 5.000% | 8/1/37 | 5,000 | 5,660 |
| Massachusetts GO | 4.000% | 4/1/38 | 4,000 | 4,223 |
| Massachusetts GO | 5.000% | 7/1/38 | 5,000 | 5,864 |
| Massachusetts GO | 5.000% | 12/1/38 | 2,500 | 2,949 |
| Massachusetts GO | 4.000% | 12/1/39 | 500 | 530 |
| Massachusetts GO | 5.000% | 7/1/40 | 8,000 | 9,278 |
| Massachusetts GO | 5.000% | 3/1/41 | 8,000 | 9,149 |
| Massachusetts GO | 4.000% | 9/1/41 | 3,000 | 3,159 |
| Massachusetts GO | 5.250% | 4/1/42 | 3,000 | 3,634 |
| Massachusetts GO | 4.000% | 9/1/42 | 6,900 | 7,265 |
| Massachusetts GO | 4.000% | 6/1/43 | 7,820 | 8,016 |
| Massachusetts GO | 4.500% | 8/1/43 | 3,705 | 4,016 |
| Massachusetts GO | 4.000% | 12/1/44 | 7,350 | 7,730 |
| Massachusetts GO | 4.000% | 5/1/45 | 10,000 | 10,390 |
| Massachusetts GO | 5.000% | 7/1/45 | 2,000 | 2,310 |
| Massachusetts GO | 4.000% | 12/1/45 | 5,000 | 5,254 |
| Massachusetts GO | 5.000% | 4/1/47 | 8,950 | 10,506 |
| Massachusetts GO | 5.250% | 4/1/47 | 7,000 | 8,438 |
| 1 Massachusetts GO TOB VRDO | 0.840% | 6/1/17 LOC | 12,010 | 12,010 |
| Massachusetts Health & Educational Facilities | | | | |
| Authority Revenue (Baystate Medical | | | | |
| Center) VRDO | 0.780% | 6/1/17 LOC | 2,100 | 2,100 |
19
| | | | |
| Massachusetts Tax-Exempt Fund | | | | |
| |
| |
| |
| | | | Face | Market |
| | Coupon | Date | ($000) | ($000) |
| Massachusetts Health & Educational Facilities | | | | |
| Authority Revenue (Berklee College of | | | | |
| Music, Inc.) | 5.000% | 10/1/26 | 120 | 122 |
| Massachusetts Health & Educational Facilities | | | | |
| Authority Revenue (Boston Medical Center) | 5.000% | 7/1/18 (Prere.) | 315 | 329 |
| Massachusetts Health & Educational Facilities | | | | |
| Authority Revenue (Boston Medical Center) | 5.000% | 7/1/18 (Prere.) | 2,575 | 2,687 |
| Massachusetts Health & Educational Facilities | | | | |
| Authority Revenue (CareGroup) | 5.000% | 7/1/18 (Prere.) | 2,000 | 2,089 |
| Massachusetts Health & Educational Facilities | | | | |
| Authority Revenue (CareGroup) | 5.125% | 7/1/18 (Prere.) | 3,015 | 3,153 |
| Massachusetts Health & Educational Facilities | | | | |
| Authority Revenue (CareGroup) | 5.125% | 7/1/18 (Prere.) | 3,500 | 3,660 |
| Massachusetts Health & Educational Facilities | | | | |
| Authority Revenue (Children’s Hospital) | 5.500% | 12/1/39 | 4,000 | 4,363 |
| Massachusetts Health & Educational Facilities | | | | |
| Authority Revenue (Children’s Hospital) VRDO | 0.780% | 6/1/17 LOC | 5,400 | 5,400 |
| Massachusetts Health & Educational Facilities | | | | |
| Authority Revenue (Dana-Farber Cancer | | | | |
| Institute) | 5.000% | 12/1/37 | 5,000 | 5,276 |
| Massachusetts Health & Educational Facilities | | | | |
| Authority Revenue (Harvard University) | 5.000% | 12/15/19 (Prere.) | 810 | 892 |
| Massachusetts Health & Educational Facilities | | | | |
| Authority Revenue (Harvard University) | 5.000% | 12/15/19 (Prere.) | 925 | 1,019 |
| Massachusetts Health & Educational Facilities | | | | |
| Authority Revenue (Harvard University) | 6.250% | 4/1/20 | 3,000 | 3,441 |
| Massachusetts Health & Educational Facilities | | | | |
| Authority Revenue (Isabella Stewart Gardner | | | | |
| Museum) | 5.000% | 5/1/19 (Prere.) | 1,650 | 1,776 |
| Massachusetts Health & Educational Facilities | | | | |
| Authority Revenue (Isabella Stewart Gardner | | | | |
| Museum) | 5.000% | 5/1/19 (Prere.) | 2,080 | 2,239 |
| Massachusetts Health & Educational Facilities | | | | |
| Authority Revenue (MIT) | 5.500% | 7/1/18 (Prere.) | 1,000 | 1,051 |
| Massachusetts Health & Educational Facilities | | | | |
| Authority Revenue (MIT) | 5.250% | 7/1/30 | 3,000 | 3,951 |
| Massachusetts Health & Educational Facilities | | | | |
| Authority Revenue (Museum of Fine Arts) | | | | |
| VRDO | 0.790% | 6/1/17 | 4,500 | 4,500 |
| Massachusetts Health & Educational Facilities | | | | |
| Authority Revenue (Museum of Fine Arts) | | | | |
| VRDO | 0.790% | 6/1/17 | 1,100 | 1,100 |
| Massachusetts Health & Educational Facilities | | | | |
| Authority Revenue (Northeastern University) | 5.000% | 10/1/19 | 3,000 | 3,260 |
| Massachusetts Health & Educational Facilities | | | | |
| Authority Revenue (Northeastern University) | 5.000% | 10/1/23 | 3,435 | 3,612 |
| Massachusetts Health & Educational Facilities | | | | |
| Authority Revenue (Northeastern University) | 5.000% | 10/1/32 | 1,000 | 1,126 |
| Massachusetts Health & Educational Facilities | | | | |
| Authority Revenue (Northeastern University) | 5.000% | 10/1/33 | 3,000 | 3,143 |
| Massachusetts Health & Educational Facilities | | | | |
| Authority Revenue (Partners Healthcare System) | 5.250% | 7/1/29 | 10,000 | 10,824 |
| Massachusetts Health & Educational Facilities | | | | |
| Authority Revenue (Partners Healthcare System) | 5.000% | 7/1/39 | 1,680 | 1,788 |
20
| | | | |
| Massachusetts Tax-Exempt Fund | | | | |
| |
| |
| |
| | | | Face | Market |
| | | Maturity | Amount | Value• |
| | Coupon | Date | ($000) | ($000) |
| 1 Massachusetts Health & Educational Facilities | | | | |
| Authority Revenue (Partners Healthcare | | | | |
| System) TOB VRDO | 0.800% | 6/7/17 | 3,800 | 3,800 |
| 2 Massachusetts Health & Educational Facilities | | | | |
| Authority Revenue (Partners Healthcare | | | | |
| System) VRDO | 0.730% | 6/7/17 | 6,700 | 6,700 |
| Massachusetts Health & Educational Facilities | | | | |
| Authority Revenue (Partners Healthcare | | | | |
| System) VRDO | 0.760% | 6/7/17 | 1,100 | 1,100 |
| Massachusetts Health & Educational Facilities | | | | |
| Authority Revenue (South Coast Health System) | 5.000% | 7/1/39 | 6,000 | 6,286 |
| Massachusetts Health & Educational Facilities | | | | |
| Authority Revenue (Tufts University) | 5.250% | 2/15/22 | 1,400 | 1,654 |
| Massachusetts Health & Educational Facilities | | | | |
| Authority Revenue (Tufts University) VRDO | 0.730% | 6/1/17 | 100 | 100 |
| Massachusetts Health & Educational Facilities | | | | |
| Authority Revenue (UMass Memorial Medical | | | | |
| Center) | 5.000% | 7/1/21 | 100 | 110 |
| Massachusetts Health & Educational Facilities | | | | |
| Authority Revenue (Winchester Hospital) | 5.250% | 7/1/38 | 2,840 | 3,086 |
| Massachusetts Housing Finance Agency Single | | | | |
| Family Housing Revenue | 2.650% | 12/1/41 | 2,935 | 2,979 |
| Massachusetts Housing Finance Agency Single | | | | |
| Family Housing Revenue | 2.750% | 12/1/41 | 865 | 876 |
| Massachusetts Housing Finance Agency Single | | | | |
| Family Housing Revenue | 3.500% | 6/1/42 | 990 | 1,047 |
| Massachusetts Housing Finance Agency Single | | | | |
| Family Housing Revenue | 4.000% | 12/1/43 | 2,560 | 2,641 |
| Massachusetts Housing Finance Agency Single | | | | |
| Family Housing Revenue | 4.000% | 12/1/44 | 2,530 | 2,659 |
| Massachusetts Housing Finance Agency Single | | | | |
| Family Housing Revenue | 4.000% | 6/1/45 | 1,360 | 1,443 |
| Massachusetts Housing Finance Agency Single | | | | |
| Family Housing Revenue | 4.050% | 12/1/52 | 4,490 | 4,557 |
| Massachusetts Port Authority Revenue | 5.000% | 7/1/25 | 1,230 | 1,434 |
| Massachusetts Port Authority Revenue | 5.000% | 7/1/30 | 2,000 | 2,304 |
| Massachusetts Port Authority Revenue | 5.000% | 7/1/31 | 1,800 | 2,064 |
| Massachusetts Port Authority Revenue | 5.000% | 7/1/33 | 4,650 | 5,297 |
| Massachusetts Port Authority Revenue | 5.000% | 7/1/34 | 3,845 | 4,468 |
| Massachusetts Port Authority Revenue | 5.000% | 7/1/35 | 1,500 | 1,756 |
| Massachusetts Port Authority Revenue | 5.000% | 7/1/40 | 6,850 | 7,944 |
| Massachusetts School Building Authority | | | | |
| Dedicated Sales Tax Revenue | 5.000% | 8/15/17 (Prere.) | 20 | 20 |
| Massachusetts School Building Authority | | | | |
| Dedicated Sales Tax Revenue | 5.000% | 8/15/22 | 5,000 | 5,920 |
| Massachusetts School Building Authority | | | | |
| Dedicated Sales Tax Revenue | 5.000% | 8/15/25 | 3,110 | 3,657 |
| Massachusetts School Building Authority | | | | |
| Dedicated Sales Tax Revenue | 5.000% | 8/15/26 | 5,000 | 5,872 |
| Massachusetts School Building Authority | | | | |
| Dedicated Sales Tax Revenue | 5.000% | 8/15/27 | 10,000 | 11,733 |
| Massachusetts School Building Authority | | | | |
| Dedicated Sales Tax Revenue | 5.000% | 8/15/28 | 7,250 | 8,490 |
21
| | | | |
| Massachusetts Tax-Exempt Fund | | | | |
| |
| |
| |
| | | | Face | Market |
| | | Maturity | Amount | Value• |
| | Coupon | Date | ($000) | ($000) |
| Massachusetts School Building Authority | | | | |
| Dedicated Sales Tax Revenue | 5.000% | 8/15/29 | 11,450 | 13,384 |
| Massachusetts School Building Authority | | | | |
| Dedicated Sales Tax Revenue | 5.000% | 11/15/29 | 2,400 | 2,941 |
| Massachusetts School Building Authority | | | | |
| Dedicated Sales Tax Revenue | 5.000% | 8/15/30 | 8,000 | 9,241 |
| Massachusetts School Building Authority | | | | |
| Dedicated Sales Tax Revenue | 5.000% | 11/15/30 | 4,700 | 5,733 |
| Massachusetts School Building Authority | | | | |
| Dedicated Sales Tax Revenue | 5.000% | 11/15/31 | 7,855 | 9,522 |
| Massachusetts School Building Authority | | | | |
| Dedicated Sales Tax Revenue | 4.000% | 8/15/32 | 4,000 | 4,334 |
| Massachusetts School Building Authority | | | | |
| Dedicated Sales Tax Revenue | 5.000% | 10/15/32 | 2,400 | 2,741 |
| Massachusetts School Building Authority | | | | |
| Dedicated Sales Tax Revenue | 5.000% | 11/15/34 | 2,000 | 2,359 |
| Massachusetts School Building Authority | | | | |
| Dedicated Sales Tax Revenue | 5.000% | 11/15/34 | 7,000 | 8,361 |
| Massachusetts School Building Authority | | | | |
| Dedicated Sales Tax Revenue | 5.250% | 10/15/35 | 10,000 | 11,503 |
| Massachusetts School Building Authority | | | | |
| Dedicated Sales Tax Revenue | 4.000% | 8/15/36 | 5,000 | 5,316 |
| Massachusetts School Building Authority | | | | |
| Dedicated Sales Tax Revenue | 4.000% | 1/15/37 | 3,000 | 3,159 |
| Massachusetts School Building Authority | | | | |
| Dedicated Sales Tax Revenue | 5.000% | 11/15/37 | 5,000 | 5,823 |
| Massachusetts School Building Authority | | | | |
| Dedicated Sales Tax Revenue | 5.000% | 5/15/38 | 2,660 | 3,045 |
| Massachusetts School Building Authority | | | | |
| Dedicated Sales Tax Revenue | 4.000% | 11/15/46 | 4,700 | 4,919 |
| Massachusetts Special Obligation Dedicated | | | | |
| Tax Revenue | 5.500% | 1/1/27 (14) | 10,000 | 12,797 |
| Massachusetts Special Obligation Dedicated | | | | |
| Tax Revenue | 5.500% | 1/1/28 (14) | 3,750 | 4,827 |
| Massachusetts Transportation Fund Revenue | | | | |
| (Accelerated Bridge Program) | 5.000% | 6/1/21 (Prere.) | 2,000 | 2,304 |
| Massachusetts Transportation Fund Revenue | | | | |
| (Accelerated Bridge Program) | 5.000% | 6/1/33 | 2,050 | 2,303 |
| Massachusetts Transportation Fund Revenue | | | | |
| (Accelerated Bridge Program) | 4.000% | 6/1/37 | 1,960 | 2,054 |
| Massachusetts Transportation Fund Revenue | | | | |
| (Accelerated Bridge Program) | 5.000% | 6/1/38 | 2,750 | 3,090 |
| Massachusetts Transportation Fund Revenue | | | | |
| (Accelerated Bridge Program) | 5.000% | 6/1/43 | 5,000 | 5,607 |
| Massachusetts Transportation Fund Revenue | | | | |
| (Accelerated Bridge Program) | 5.000% | 6/1/44 | 5,000 | 5,729 |
| Massachusetts Transportation Fund Revenue | | | | |
| (Accelerated Bridge Program) | 4.000% | 6/1/45 | 7,000 | 7,373 |
| Massachusetts Transportation Fund Revenue | | | | |
| (Accelerated Bridge Program) | 4.000% | 6/1/46 | 10,000 | 10,525 |
| Massachusetts Transportation Fund Revenue | | | | |
| (Rail Enhancement Program) | 5.000% | 6/1/40 | 5,000 | 5,819 |
| Massachusetts Transportation Fund Revenue | | | | |
| (Rail Enhancement Program) | 5.000% | 6/1/41 | 7,000 | 8,212 |
22
| | | | |
| Massachusetts Tax-Exempt Fund | | | | |
| |
| |
| |
| | | | Face | Market |
| | | Maturity | Amount | Value• |
| | Coupon | Date | ($000) | ($000) |
| Massachusetts Transportation Fund Revenue | | | | |
| (Rail Enhancement Program) | 4.000% | 6/1/45 | 7,300 | 7,709 |
| Massachusetts Transportation Fund Revenue | | | | |
| (Rail Enhancement Program) | 5.000% | 6/1/45 | 5,640 | 6,537 |
| Massachusetts Turnpike Authority Revenue | | | | |
| (Metropolitan Highway System) | 0.000% | 1/1/20 (14) | 3,000 | 2,900 |
| Massachusetts Turnpike Authority Revenue | | | | |
| (Metropolitan Highway System) | 0.000% | 1/1/25 (14) | 5,000 | 4,287 |
| Massachusetts Turnpike Authority Revenue | | | | |
| (Metropolitan Highway System) | 0.000% | 1/1/28 (14) | 6,670 | 5,182 |
| Massachusetts Water Pollution Abatement Trust | | | | |
| Revenue | 5.250% | 8/1/17 | 540 | 542 |
| Massachusetts Water Pollution Abatement Trust | | | | |
| Revenue | 5.000% | 8/1/22 | 3,010 | 3,575 |
| Massachusetts Water Pollution Abatement Trust | | | | |
| Revenue | 5.000% | 8/1/27 | 8,010 | 9,716 |
| Massachusetts Water Pollution Abatement Trust | | | | |
| Revenue | 5.000% | 8/1/28 | 975 | 1,176 |
| Massachusetts Water Pollution Abatement Trust | | | | |
| Revenue | 5.250% | 8/1/29 | 1,520 | 1,980 |
| Massachusetts Water Pollution Abatement Trust | | | | |
| Revenue | 5.750% | 8/1/29 | 190 | 191 |
| Massachusetts Water Pollution Abatement Trust | | | | |
| Revenue | 5.000% | 8/1/32 | 2,415 | 2,687 |
| Massachusetts Water Pollution Abatement Trust | | | | |
| Revenue | 5.000% | 8/1/32 | 5,685 | 6,141 |
| Massachusetts Water Resources Authority | | | | |
| Revenue | 5.000% | 8/1/17 (Prere.) | 500 | 503 |
| Massachusetts Water Resources Authority | | | | |
| Revenue | 5.000% | 8/1/17 (Prere.) | 875 | 881 |
| Massachusetts Water Resources Authority | | | | |
| Revenue | 5.000% | 8/1/19 (Prere.) | 2,950 | 3,204 |
| Massachusetts Water Resources Authority | | | | |
| Revenue | 5.000% | 8/1/20 (Prere.) | 2,775 | 3,119 |
| 3 Massachusetts Water Resources Authority | | | | |
| Revenue | 5.000% | 8/1/20 (Prere.) | 500 | 562 |
| Massachusetts Water Resources Authority | | | | |
| Revenue | 5.500% | 8/1/20 (4) | 1,000 | 1,141 |
| Massachusetts Water Resources Authority | | | | |
| Revenue | 5.000% | 8/1/21 (Prere.) | 180 | 208 |
| Massachusetts Water Resources Authority | | | | |
| Revenue | 5.000% | 8/1/21 (Prere.) | 820 | 948 |
| Massachusetts Water Resources Authority | | | | |
| Revenue | 5.000% | 8/1/22 (Prere.) | 2,400 | 2,842 |
| Massachusetts Water Resources Authority | | | | |
| Revenue | 5.500% | 8/1/22 (4) | 1,490 | 1,807 |
| Massachusetts Water Resources Authority | | | | |
| Revenue | 5.000% | 8/1/27 | 2,000 | 2,238 |
| Massachusetts Water Resources Authority | | | | |
| Revenue | 5.000% | 8/1/27 | 5,000 | 6,247 |
| Massachusetts Water Resources Authority | | | | |
| Revenue | 5.000% | 8/1/28 | 800 | 991 |
| Massachusetts Water Resources Authority | | | | |
| Revenue | 5.000% | 8/1/29 | 6,000 | 6,882 |
23
| | | | |
| Massachusetts Tax-Exempt Fund | | | | |
| |
| |
| |
| | | | Face | Market |
| | | Maturity | Amount | Value• |
| | Coupon | Date | ($000) | ($000) |
| Massachusetts Water Resources Authority | | | | |
| Revenue | 5.000% | 8/1/29 | 1,070 | 1,338 |
| Massachusetts Water Resources Authority | | | | |
| Revenue | 5.000% | 8/1/31 | 2,280 | 2,767 |
| Massachusetts Water Resources Authority | | | | |
| Revenue | 5.250% | 8/1/31 (4) | 1,000 | 1,289 |
| Massachusetts Water Resources Authority | | | | |
| Revenue | 5.000% | 8/1/32 | 5,020 | 6,061 |
| Massachusetts Water Resources Authority | | | | |
| Revenue | 5.000% | 8/1/33 | 3,300 | 4,027 |
| Massachusetts Water Resources Authority | | | | |
| Revenue | 5.000% | 8/1/34 (14) | 7,500 | 7,552 |
| Massachusetts Water Resources Authority | | | | |
| Revenue | 5.000% | 8/1/34 | 3,465 | 4,211 |
| Massachusetts Water Resources Authority | | | | |
| Revenue | 5.000% | 8/1/35 (14) | 13,025 | 13,116 |
| Massachusetts Water Resources Authority | | | | |
| Revenue | 5.250% | 8/1/35 (4) | 6,310 | 8,235 |
| Massachusetts Water Resources Authority | | | | |
| Revenue | 4.000% | 8/1/36 | 7,200 | 7,761 |
| Massachusetts Water Resources Authority | | | | |
| Revenue | 5.000% | 8/1/36 | 2,710 | 3,130 |
| Massachusetts Water Resources Authority | | | | |
| Revenue | 5.000% | 8/1/40 | 2,690 | 3,170 |
| Massachusetts Water Resources Authority | | | | |
| Revenue | 5.000% | 8/1/40 | 9,860 | 11,620 |
| Massachusetts Water Resources Authority | | | | |
| Revenue | 5.000% | 8/1/42 | 1,000 | 1,143 |
| Massachusetts Water Resources Authority | | | | |
| Revenue | 5.250% | 8/1/42 | 10,000 | 11,386 |
| Massachusetts Water Resources Authority | | | | |
| Revenue | 5.000% | 8/1/44 | 8,000 | 9,119 |
| Massachusetts Water Resources Authority | | | | |
| Revenue VRDO | 0.750% | 6/7/17 | 1,400 | 1,400 |
| Massachusetts Water Resources Authority | | | | |
| Revenue VRDO | 0.760% | 6/7/17 | 2,100 | 2,100 |
| Metropolitan Boston MA Transit Parking Corp. | | | | |
| Revenue | 5.000% | 7/1/31 | 1,000 | 1,130 |
| Metropolitan Boston MA Transit Parking Corp. | | | | |
| Revenue | 5.250% | 7/1/36 | 7,000 | 7,930 |
| Scituate MA GO | 4.000% | 9/15/39 | 3,000 | 3,159 |
| University of Massachusetts Building Authority | | | | |
| Revenue | 5.000% | 5/1/18 (Prere.) | 1,615 | 1,676 |
| University of Massachusetts Building Authority | | | | |
| Revenue | 5.000% | 11/1/31 | 2,500 | 2,986 |
| University of Massachusetts Building Authority | | | | |
| Revenue | 5.000% | 11/1/32 | 4,060 | 4,802 |
| University of Massachusetts Building Authority | | | | |
| Revenue | 5.000% | 11/1/35 | 5,460 | 6,566 |
| University of Massachusetts Building Authority | | | | |
| Revenue | 5.000% | 5/1/38 | 2,000 | 2,276 |
| University of Massachusetts Building Authority | | | | |
| Revenue | 5.000% | 11/1/38 | 4,615 | 5,499 |
24
| | | | |
| Massachusetts Tax-Exempt Fund | | | | |
| |
| |
| |
| | | | Face | Market |
| | | Maturity | Amount | Value• |
| | Coupon | Date | ($000) | ($000) |
| University of Massachusetts Building Authority | | | | |
| Revenue | 5.000% | 11/1/39 | 3,000 | 3,437 |
| University of Massachusetts Building Authority | | | | |
| Revenue | 5.000% | 11/1/39 | 6,695 | 7,656 |
| University of Massachusetts Building Authority | | | | |
| Revenue | 5.000% | 11/1/40 | 3,000 | 3,487 |
| University of Massachusetts Building Authority | | | | |
| Revenue | 5.000% | 11/1/44 | 3,365 | 3,843 |
| University of Massachusetts Building Authority | | | | |
| Revenue | 5.250% | 11/1/47 | 5,000 | 6,075 |
| Worcester MA GO | 5.250% | 8/15/21 (14) | 315 | 316 |
| | | | | 1,575,814 |
| Guam (0.3%) | | | | |
| Guam Government Business Privilege Tax | | | | |
| Revenue | 5.000% | 11/15/33 | 3,000 | 3,269 |
| Guam Government Waterworks Authority | | | | |
| Water & Waste Water System Revenue | 5.500% | 7/1/43 | 2,250 | 2,504 |
| | | | | 5,773 |
| Total Tax-Exempt Municipal Bonds (Cost $1,524,885) | | | 1,581,587 |
| |
| | | | | Amount |
| | | | | ($000) |
| Other Assets and Liabilities (0.8%) | | | | |
| Other Assets | | | | |
| Investment in Vanguard | | | | 105 |
| Receivables for Investment Securities Sold | | | | 1,365 |
| Receivables for Accrued Income | | | | 20,823 |
| Receivables for Capital Shares Issued | | | | 1,024 |
| Other Assets | | | | 135 |
| Total Other Assets | | | | 23,452 |
| Liabilities | | | | |
| Payables for Investment Securities Purchased | | | | (7,462) |
| Payables for Capital Shares Redeemed | | | | (1,588) |
| Payables for Distributions | | | | (956) |
| Payables to Vanguard | | | | (1,202) |
| Other Liabilities | | | | (70) |
| Total Liabilities | | | | (11,278) |
| Net Assets (100%) | | | | |
| Applicable to 147,482,661 outstanding $.001 par value shares of | | | |
| beneficial interest (unlimited authorization) | | | | 1,593,761 |
| Net Asset Value Per Share | | | | $10.81 |
25
| |
| Massachusetts Tax-Exempt Fund | |
| |
| |
| |
| At May 31, 2017, net assets consisted of: | |
| | Amount |
| | ($000) |
| Paid-in Capital | 1,536,857 |
| Undistributed Net Investment Income | — |
| Accumulated Net Realized Gains | 238 |
| Unrealized Appreciation (Depreciation) | |
| Investment Securities | 56,702 |
| Futures Contracts | (36) |
| Net Assets | 1,593,761 |
• See Note A in Notes to Financial Statements.
1 Security exempt from registration under Rule 144A of the Securities Act of 1933. Such securities may be sold in transactions exempt from
registration, normally to qualified institutional buyers. At May 31, 2017, the aggregate value of these securities was $18,689,000,
representing 1.2% of net assets.
2 Security purchased on a when-issued or delayed-delivery basis for which the fund has not taken delivery as of May 31, 2017.
3 Securities with a value of $534,000 have been segregated as initial margin for open futures contracts.
A key to abbreviations and other references follows the Statement of Net Assets.
See accompanying Notes, which are an integral part of the Financial Statements.
26
Massachusetts Tax-Exempt Fund
Key to Abbreviations
ARS—Auction Rate Security.
BAN—Bond Anticipation Note.
COP—Certificate of Participation.
CP—Commercial Paper.
FR—Floating Rate.
GAN—Grant Anticipation Note.
GO—General Obligation Bond.
PILOT—Payments in Lieu of Taxes.
PUT—Put Option Obligation.
RAN—Revenue Anticipation Note.
TAN—Tax Anticipation Note.
TOB—Tender Option Bond.
TRAN—Tax Revenue Anticipation Note.
VRDO—Variable Rate Demand Obligation.
VRDP—Variable Rate Demand Preferred.
(ETM)—Escrowed to Maturity.
(Prere.)—Prerefunded.
Scheduled principal and interest payments are guaranteed by:
(1) MBIA (Municipal Bond Investors Assurance).
(2) AMBAC (Ambac Assurance Corporation).
(3) FGIC (Financial Guaranty Insurance Company).
(4) AGM (Assured Guaranty Municipal Corporation).
(5) BIGI (Bond Investors Guaranty Insurance).
(6) Connie Lee Inc.
(7) FHA (Federal Housing Authority).
(8) CapMAC (Capital Markets Assurance Corporation).
(9) American Capital Access Financial Guaranty Corporation.
(10) XL Capital Assurance Inc.
(11) CIFG (CDC IXIS Financial Guaranty).
(12) AGC (Assured Guaranty Corporation).
(13) BHAC (Berkshire Hathaway Assurance Corporation).
(14) NPFG (National Public Finance Guarantee Corporation).
(15) BAM (Build America Mutual Assurance Company).
(16) MAC (Municipal Assurance Corporation).
(17) RAA (Radian Asset Assurance Inc.).
(18) SBLF (Michigan School Bond Loan Fund).
The insurance does not guarantee the market value of the municipal bonds.
LOC—Scheduled principal and interest payments are guaranteed by bank letter of credit.
27
| |
| Massachusetts Tax-Exempt Fund | |
| |
| |
| Statement of Operations | |
| |
| | Six Months Ended |
| | May 31, 2017 |
| | ($000) |
| Investment Income | |
| Income | |
| Interest | 24,067 |
| Total Income | 24,067 |
| Expenses | |
| The Vanguard Group—Note B | |
| Investment Advisory Services | 106 |
| Management and Administrative | 884 |
| Marketing and Distribution | 142 |
| Custodian Fees | 9 |
| Shareholders’ Reports | 12 |
| Total Expenses | 1,153 |
| Net Investment Income | 22,914 |
| Realized Net Gain (Loss) | |
| Investment Securities Sold | 905 |
| Futures Contracts | 11 |
| Realized Net Gain (Loss) | 916 |
| Change in Unrealized Appreciation (Depreciation) | |
| Investment Securities | 54,893 |
| Futures Contracts | 20 |
| Change in Unrealized Appreciation (Depreciation) | 54,913 |
| Net Increase (Decrease) in Net Assets Resulting from Operations | 78,743 |
See accompanying Notes, which are an integral part of the Financial Statements.
28
| | |
| Massachusetts Tax-Exempt Fund | | |
| |
| |
| Statement of Changes in Net Assets | | |
| |
| | Six Months Ended | Year Ended |
| | May 31, | November 30, |
| | 2017 | 2016 |
| | ($000) | ($000) |
| Increase (Decrease) in Net Assets | | |
| Operations | | |
| Net Investment Income | 22,914 | 42,198 |
| Realized Net Gain (Loss) | 916 | 8,350 |
| Change in Unrealized Appreciation (Depreciation) | 54,913 | (65,480) |
| Net Increase (Decrease) in Net Assets Resulting from Operations | 78,743 | (14,932) |
| Distributions | | |
| Net Investment Income | (22,909) | (42,165) |
| Realized Capital Gain1 | (7,445) | (2,006) |
| Total Distributions | (30,354) | (44,171) |
| Capital Share Transactions | | |
| Issued | 257,063 | 386,397 |
| Issued in Lieu of Cash Distributions | 23,365 | 32,506 |
| Redeemed | (193,797) | (187,088) |
| Net Increase (Decrease) from Capital Share Transactions | 86,631 | 231,815 |
| Total Increase (Decrease) | 135,020 | 172,712 |
| Net Assets | | |
| Beginning of Period | 1,458,741 | 1,286,029 |
| End of Period2 | 1,593,761 | 1,458,741 |
1 Includes fiscal 2017 and 2016 short-term gain distributions totaling $578,000 and $204,000, respectively. Short-term gain distributions are
treated as ordinary income dividends for tax purposes.
2 Net Assets—End of Period includes undistributed (overdistributed) net investment income of $0 and $1,000.
See accompanying Notes, which are an integral part of the Financial Statements.
29
| | | | | | |
| Massachusetts Tax-Exempt Fund | | | | | | |
| |
| |
| Financial Highlights | | | | | | |
| |
| |
| Six Months | | | | | |
| | Ended | | | | | |
| For a Share Outstanding | May 31, | | | Year Ended November 30, |
| Throughout Each Period | 2017 | 2016 | 2015 | 2014 | 2013 | 2012 |
| Net Asset Value, Beginning of Period | $10.47 | $10.87 | $10.87 | $10.27 | $11.13 | $10.41 |
| Investment Operations | | | | | | |
| Net Investment Income | .159 | .323 | .334 | .345 | .340 | .349 |
| Net Realized and Unrealized Gain (Loss) | | | | | | |
| on Investments | .393 | (.383) | .067 | .600 | (.860) | .720 |
| Total from Investment Operations | . 552 | (. 060) | . 401 | . 945 | (. 520) | 1.069 |
| Distributions | | | | | | |
| Dividends from Net Investment Income | (.159) | (. 323) | (. 334) | (. 345) | (. 340) | (. 349) |
| Distributions from Realized Capital Gains | (.053) | (.017) | (.067) | — | — | — |
| Total Distributions | (. 212) | (. 340) | (. 401) | (. 345) | (. 340) | (. 349) |
| Net Asset Value, End of Period | $10.81 | $10.47 | $10.87 | $10.87 | $10.27 | $11.13 |
| |
| Total Return1 | 5.33% | -0.68% | 3.77% | 9.32% | -4.71% | 10.41% |
| |
| Ratios/Supplemental Data | | | | | | |
| Net Assets, End of Period (Millions) | $1,594 | $1,459 | $1,286 | $1,148 | $1,001 | $1,127 |
| Ratio of Total Expenses to | | | | | | |
| Average Net Assets | 0.15% | 0.15% | 0.16% | 0.16% | 0.16% | 0.16% |
| Ratio of Net Investment Income to | | | | | | |
| Average Net Assets | 3.01% | 2.91% | 3.09% | 3.24% | 3.21% | 3.22% |
| Portfolio Turnover Rate | 21% | 25% | 15% | 27% | 36% | 13% |
The expense ratio, net investment income ratio, and turnover rate for the current period have been annualized.
1 Total returns do not include account service fees that may have applied in the periods shown. Fund prospectuses provide information
about any applicable account service fees.
See accompanying Notes, which are an integral part of the Financial Statements.
30
Massachusetts Tax-Exempt Fund
Notes to Financial Statements
Vanguard Massachusetts Tax-Exempt Fund is registered under the Investment Company Act of 1940 as an open-end investment company, or mutual fund. The fund invests in debt instruments of municipal issuers whose ability to meet their obligations may be affected by economic and political developments in the state.
A. The following significant accounting policies conform to generally accepted accounting principles for U.S. investment companies. The fund consistently follows such policies in preparing its financial statements.
1. Security Valuation: Securities are valued as of the close of trading on the New York Stock Exchange (generally 4 p.m., Eastern time) on the valuation date. Bonds and temporary cash investments are valued using the latest bid prices or using valuations based on a matrix system (which considers such factors as security prices, yields, maturities, and ratings), both as furnished by independent pricing services. Securities for which market quotations are not readily available, or whose values have been affected by events occurring before the fund’s pricing time but after the close of the securities’ primary markets, are valued by methods deemed by the board of trustees to represent fair value.
2. Futures Contracts: The fund uses futures contracts to invest in fixed income asset classes with greater efficiency and lower cost than is possible through direct investment, to add value when these instruments are attractively priced, or to adjust sensitivity to changes in interest rates. The primary risks associated with the use of futures contracts are imperfect correlation between changes in market values of bonds held by the fund and the prices of futures contracts, and the possibility of an illiquid market. Counterparty risk involving futures is mitigated because a regulated clearinghouse is the counterparty instead of the clearing broker. To further mitigate counterparty risk, the fund trades futures contracts on an exchange, monitors the financial strength of its clearing brokers and clearinghouse, and has entered into clearing agreements with its clearing brokers. The clearinghouse imposes initial margin requirements to secure the fund’s performance and requires daily settlement of variation margin representing changes in the market value of each contract.
Futures contracts are valued at their quoted daily settlement prices. The aggregate settlement values of the contracts are not recorded in the Statement of Net Assets. Fluctuations in the value of the contracts are recorded in the Statement of Net Assets as an asset (liability) and in the Statement of Operations as unrealized appreciation (depreciation) until the contracts are closed, when they are recorded as realized futures gains (losses).
During the six months ended May 31, 2017, the fund’s average investments in long and short futures contracts represented 4% and 2% of net assets, respectively, based on the average of aggregate settlement values at each quarter-end during the period.
3. Federal Income Taxes: The fund intends to continue to qualify as a regulated investment company and distribute all of its income. Management has analyzed the fund’s tax positions taken for all open federal income tax years (November 30, 2013–2016), and for the period ended May 31, 2017, and has concluded that no provision for federal income tax is required in the fund’s financial statements.
4. Distributions: Distributions from net investment income are declared daily and paid on the first business day of the following month. Annual distributions from realized capital gains, if any, are recorded on the ex-dividend date.
31
Massachusetts Tax-Exempt Fund
5. Credit Facility: The fund and certain other funds managed by The Vanguard Group (“Vanguard”) participate in a $3.1 billion committed credit facility provided by a syndicate of lenders pursuant to a credit agreement that may be renewed annually; each fund is individually liable for its borrowings, if any, under the credit facility. Borrowings may be utilized for temporary and emergency purposes, and are subject to the fund’s regulatory and contractual borrowing restrictions. The participating funds are charged administrative fees and an annual commitment fee of 0.10% of the undrawn amount of the facility; these fees are allocated to the funds based on a method approved by the fund’s board of trustees and included in Management and Administrative expenses on the fund’s Statement of Operations. Any borrowings under this facility bear interest at a rate based upon the higher of the one-month London Interbank Offered Rate, federal funds effective rate, or overnight bank funding rate plus an agreed-upon spread.
The fund had no borrowings outstanding at May 31, 2017, or at any time during the period then ended.
6. Other: Interest income is accrued daily. Premiums and discounts on debt securities purchased are amortized and accreted, respectively, to interest income over the lives of the respective securities. Security transactions are accounted for on the date securities are bought or sold. Costs used to determine realized gains (losses) on the sale of investment securities are those of the specific securities sold.
B. In accordance with the terms of a Funds’ Service Agreement (the “FSA”) between Vanguard and the fund, Vanguard furnishes to the fund investment advisory, corporate management, administrative, marketing, and distribution services at Vanguard’s cost of operations (as defined by the FSA) These costs of operations are allocated to the fund based on methods and guidelines approved by board of trustees. Vanguard does not require reimbursement in the current period for certain costs of operations (such as deferred compensation/benefits and risk/insurance costs); the fund’s liability for these costs of operations is included in Payables to Vanguard on the Statement of Net Assets.
Upon the request of Vanguard, the fund may invest up to 0.40% of its net assets as capital in Vanguard At May 31, 2017, the fund had contributed to Vanguard capital in the amount of $105,000, representing 0.01% of the fund’s net assets and 0.04% of Vanguard’s capitalization. The fund’s trustees and officers are also directors and employees, respectively, of Vanguard.
C. Various inputs may be used to determine the value of the fund’s investments. These inputs are summarized in three broad levels for financial statement purposes. The inputs or methodologies used to value securities are not necessarily an indication of the risk associated with investing in those securities.
32
Level 1—Quoted prices in active markets for identical securities.
Level 2—Other significant observable inputs (including quoted prices for similar securities,
interest rates, prepayment speeds, credit risk, etc.).
Level 3—Significant unobservable inputs (including the fund’s own assumptions used
to determine the fair value of investments).
Massachusetts Tax-Exempt Fund
The following table summarizes the market value of the fund’s investments as of May 31, 2017, based on the inputs used to value them:
| | | |
| | Level 1 | Level 2 | Level 3 |
| Investments | ($000) | ($000) | ($000) |
| Tax-Exempt Municipal Bonds | — | 1,581,587 | — |
| Futures Contracts—Assets1 | 20 | — | — |
| Futures Contracts—Liabilities1 | (41) | — | — |
| Total | (21) | 1,581,587 | — |
| 1 Represents variation margin on the last day of the reporting period. | | | |
D. At May 31, 2017, the aggregate settlement value of open futures contracts and the related unrealized appreciation (depreciation) were:
| | | | |
| | | | | ($000) |
| | | | Aggregate | |
| | | Number of | Settlement | Unrealized |
| | | Long (Short) | Value | Appreciation |
| Futures Contracts | Expiration | Contracts | Long (Short) | (Depreciation) |
| 2-Year U.S. Treasury Note | September 2017 | 204 | 44,163 | 35 |
| 5-Year U.S. Treasury Note | September 2017 | 208 | 24,609 | 34 |
| 10-Year U.S. Treasury Note | September 2017 | 48 | 6,062 | 18 |
| Ultra 10-Year U.S. Treasury Note | September 2017 | (133) | (18,053) | (95) |
| 30-Year U.S. Treasury Bond | September 2017 | (22) | (3,384) | (28) |
| | | | | (36) |
Unrealized appreciation (depreciation) on open futures contracts is required to be treated as realized gain (loss) for tax purposes.
E. Capital gain distributions are determined on a tax basis and may differ from realized capital gains for financial reporting purposes. Differences may be permanent or temporary. Permanent differences are reclassified among capital accounts in the financial statements to reflect their tax character. Temporary differences arise when gains or losses are recognized in different periods for financial statement and tax purposes. These differences will reverse at some time in the future. The fund’s tax-basis capital gains and losses are determined only at the end of each fiscal year.
At May 31, 2017, the cost of investment securities for tax purposes was $1,525,618,000. Net unrealized appreciation of investment securities for tax purposes was $55,969,000, consisting of unrealized gains of $63,057,000 on securities that had risen in value since their purchase and $7,088,000 in unrealized losses on securities that had fallen in value since their purchase.
F. During the six months ended May 31, 2017, the fund purchased $246,800,000 of investment securities and sold $154,783,000 of investment securities, other than temporary cash investments.
The fund purchased securities from and sold securities to other Vanguard funds or accounts managed by Vanguard or its affiliates, in accordance with procedures adopted by the board of trustees in compliance with Rule 17a-7 of the Investment Company Act of 1940. For the six months ended May 31, 2017, such purchases and sales were $63,250,000 and $59,795,000, respectively; these amounts are included in the purchases and sales of investment securities noted above.
33
| | |
| Massachusetts Tax-Exempt Fund | | |
| |
| |
| |
| |
| G. Capital shares issued and redeemed were: | | |
| | Six Months Ended | Year Ended |
| | May 31, 2017 | November 30, 2016 |
| | Shares | Shares |
| | (000) | (000) |
| Issued | 24,351 | 35,040 |
| Issued in Lieu of Cash Distributions | 2,206 | 2,947 |
| Redeemed | (18,353) | (17,064) |
| Net Increase (Decrease) in Shares Outstanding | 8,204 | 20,923 |
H. Management has determined that no material events or transactions occurred subsequent to May 31, 2017, that would require recognition or disclosure in these financial statements.
34
About Your Fund’s Expenses
As a shareholder of the fund, you incur ongoing costs, which include costs for portfolio management, administrative services, and shareholder reports (like this one), among others. Operating expenses, which are deducted from a fund’s gross income, directly reduce the investment return of the fund.
A fund’s expenses are expressed as a percentage of its average net assets. This figure is known as the expense ratio. The following examples are intended to help you understand the ongoing costs (in dollars) of investing in your fund and to compare these costs with those of other mutual funds. The examples are based on an investment of $1,000 made at the beginning of the period shown and held for the entire period.
The accompanying table illustrates your fund’s costs in two ways:
• Based on actual fund return. This section helps you to estimate the actual expenses that you paid over the period. The ”Ending Account Value“ shown is derived from the fund‘s actual return, and the third column shows the dollar amount that would have been paid by an investor who started with $1,000 in the fund. You may use the information here, together with the amount you invested, to estimate the expenses that you paid over the period.
To do so, simply divide your account value by $1,000 (for example, an $8,600 account value divided by $1,000 = 8.6), then multiply the result by the number given for your fund under the heading ”Expenses Paid During Period.“
• Based on hypothetical 5% yearly return. This section is intended to help you compare your fund‘s costs with those of other mutual funds. It assumes that the fund had a yearly return of 5% before expenses, but that the expense ratio is unchanged. In this case—because the return used is not the fund’s actual return—the results do not apply to your investment. The example is useful in making comparisons because the Securities and Exchange Commission requires all mutual funds to calculate expenses based on a 5% return. You can assess your fund’s costs by comparing this hypothetical example with the hypothetical examples that appear in shareholder reports of other funds.
Note that the expenses shown in the table are meant to highlight and help you compare ongoing costs only and do not reflect transaction costs incurred by the fund for buying and selling securities. Further, the expenses do not include any purchase, redemption, or account service fees described in the fund prospectus. If such fees were applied to your account, your costs would be higher. Your fund does not carry a “sales load.”
The calculations assume no shares were bought or sold during the period. Your actual costs may have been higher or lower, depending on the amount of your investment and the timing of any purchases or redemptions.
You can find more information about the fund’s expenses, including annual expense ratios, in the Financial Statements section of this report. For additional information on operating expenses and other shareholder costs, please refer to your fund’s current prospectus.
35
| | | |
| Six Months Ended May 31, 2017 | | | |
| | Beginning | Ending | Expenses |
| | Account Value | Account Value | Paid During |
| Massachusetts Tax-Exempt Fund | 11/30/2016 | 5/31/2017 | Period |
| Based on Actual Fund Return | $1,000.00 | $1,053.31 | $0.77 |
| Based on Hypothetical 5% Yearly Return | 1,000.00 | 1,024.18 | 0.76 |
The calculations are based on expenses incurred in the most recent six-month period. The fund’s annualized six-month expense ratio for that
period is 0.15%. The dollar amounts shown as “Expenses Paid” are equal to the annualized expense ratio multiplied by the average account
value over the period, multiplied by the number of days in the most recent six-month period, then divided by the number of days in the most
recent 12-month period (182/365).
36
Trustees Approve Advisory Arrangement
The board of trustees of Vanguard Massachusetts Tax-Exempt Fund has renewed the fund’s investment advisory arrangement with The Vanguard Group, Inc. (Vanguard), through its Fixed Income Group. The board determined that continuing the fund’s internalized management structure was in the best interests of the fund and its shareholders.
The board based its decision upon an evaluation of the advisor’s investment staff, portfolio management process, and performance. This evaluation included information provided to the board by Vanguard’s Portfolio Review Department, which is responsible for fund and advisor oversight and product management. The Portfolio Review Department met regularly with the advisor and made monthly presentations to the board during the fiscal year that directed the board’s focus to relevant information and topics.
The board, or an investment committee made up of board members, also received information throughout the year during advisor presentations. For each advisor presentation, the board was provided with letters and reports that included information about, among other things, the advisory firm and the advisor’s assessment of the investment environment, portfolio performance, and portfolio characteristics.
In addition, the board received monthly reports, which included a Market and Economic Report, a Fund Dashboard Monthly Summary, and a Fund Performance Report.
Prior to their meeting, the trustees were provided with a memo and materials that summarized the information they received over the course of the year. They also considered the factors discussed below, among others. However, no single factor determined whether the board approved the arrangement. Rather, it was the totality of the circumstances that drove the board’s decision.
Nature, extent, and quality of services
The board reviewed the quality of the fund’s investment management services over both the short and long term and took into account the organizational depth and stability of the advisor. The board considered that Vanguard has been managing investments for more than three decades. The Fixed Income Group adheres to a sound, disciplined investment management process; the team has considerable experience, stability, and depth.
The board concluded that Vanguard’s experience, stability, depth, and performance, among other factors, warranted continuation of the advisory arrangement.
Investment performance
The board considered the short- and long-term performance of the fund, including any periods of outperformance or underperformance compared with a relevant benchmark index and peer group. The board concluded that the performance was such that the advisory arrangement should continue. Information about the fund’s most recent performance can be found in the Performance Summary section of this report.
Cost
The board concluded that the fund’s expense ratio was well below the average expense ratio charged by funds in its peer group and that the fund’s advisory expenses were also well below its peer-group average. Information about the fund’s expenses appears in the About Your Fund’s Expenses section of this report as well as in the Financial Statements section.
37
The board does not conduct a profitability analysis of Vanguard because of Vanguard’s unique “at-cost” structure. Unlike most other mutual fund management companies, Vanguard is owned by the funds it oversees and produces “profits” only in the form of reduced expenses for fund shareholders.
The benefit of economies of scale
The board concluded that the fund’s at-cost arrangement with Vanguard ensures that the fund will realize economies of scale as it grows, with the cost to shareholders declining as fund assets increase.
The board will consider whether to renew the advisory arrangement again after a one-year period.
38
Glossary
30-Day SEC Yield. A fund’s 30-day SEC yield is derived using a formula specified by the U.S. Securities and Exchange Commission. Under the formula, data related to the fund’s security holdings in the previous 30 days are used to calculate the fund’s hypothetical net income for that period, which is then annualized and divided by the fund’s estimated average net assets over the calculation period. For the purposes of this calculation, a security’s income is based on its current market yield to maturity (for bonds), its actual income (for asset-backed securities), or its projected dividend yield (for stocks). Because the SEC yield represents hypothetical annualized income, it will differ—at times significantly—from the fund’s actual experience. As a result, the fund’s income distributions may be higher or lower than implied by the SEC yield.
Average Coupon. The average interest rate paid on the fixed income securities held by a fund. It is expressed as a percentage of face value.
Average Duration. An estimate of how much the value of the bonds held by a fund will fluctuate in response to a change in interest rates. To see how the value could change, multiply the average duration by the change in rates. If interest rates rise by 1 percentage point, the value of the bonds in a fund with an average duration of five years would decline by about 5%. If rates decrease by a percentage point, the value would rise by 5%.
Average Stated Maturity. The average length of time until fixed income securities held by a fund reach maturity and are repaid using the maturity date of the security. The figure reflects the proportion of fund assets represented by each security; it also reflects any futures contracts held. In general, the longer the average stated maturity, the more a fund’s share price will fluctuate in response to changes in market interest rates.
Beta. A measure of the magnitude of a fund’s past share-price fluctuations in relation to the ups and downs of a given market index. The index is assigned a beta of 1.00. Compared with a given index, a fund with a beta of 1.20 typically would have seen its share price rise or fall by 12% when the index rose or fell by 10%. For this report, beta is based on returns over the past 36 months for both the fund and the index. Note that a fund’s beta should be reviewed in conjunction with its R-squared (see definition). The lower the R-squared, the less correlation there is between the fund and the index, and the less reliable beta is as an indicator of volatility.
Credit Quality. Credit-quality ratings are measured on a scale that generally ranges from AAA (highest) to D (lowest). Credit-quality ratings are obtained from Moody’s and S&P, and the higher rating for each issue is used. ”Not Rated” is used to classify securities for which a rating is not available. Not rated securities include a fund’s investment in Vanguard Market Liquidity Fund or Vanguard Municipal Cash Management Fund, each of which invests in high-quality money market instruments and may serve as a cash management vehicle for the Vanguard funds, trusts, and accounts.
Expense Ratio. A fund’s total annual operating expenses expressed as a percentage of the fund’s average net assets. The expense ratio includes management and administrative expenses, but does not include the transaction costs of buying and selling portfolio securities.
Inception Date. The date on which the assets of a fund (or one of its share classes) are first invested in accordance with the fund’s investment objective. For funds with a subscription period, the inception date is the day after that period ends. Investment performance is measured from the inception date.
39
R-Squared. A measure of how much of a fund’s past returns can be explained by the returns from the market in general, as measured by a given index. If a fund’s total returns were precisely synchronized with an index’s returns, its R-squared would be 1.00. If the fund’s returns bore no relationship to the index’s returns, its R-squared would be 0. For this report, R-squared is based on returns over the past 36 months for both the fund and the index.
Short-Term Reserves. The percentage of a fund invested in highly liquid, short-term securities that can be readily converted to cash.
Yield to Maturity. The rate of return an investor would receive if the fixed income securities held by a fund were held to their maturity dates.
40
The Vanguard Municipal Bond Funds are not sponsored, endorsed, issued, sold, or promoted by Barclays Risk Analytics and Index Solutions Limited or any of its affiliates (“Barclays”). Barclays makes no representation or warranty, express or implied, to the owners or purchasers of the Vanguard Municipal Bond Funds or any member of the public regarding the advisability of investing in securities generally or in the Vanguard Municipal Bond Funds particularly or the ability of the Bloomberg Barclays Indices to track general bond market performance. Barclays has not passed on the legality or suitability of the Vanguard Municipal Bond Funds with respect to any person or entity. Barclays’ only relationship to Vanguard and the Vanguard Municipal Bond Funds is the licensing of the Bloomberg Barclays Indices, which are determined, composed, and calculated by Barclays without regard to Vanguard or the Vanguard Municipal Bond Funds or any owners or purchasers of the Vanguard Municipal Bond Funds. Barclays has no obligation to take the needs of Vanguard, the Vanguard Municipal Bond Funds, or the owners of the Vanguard Municipal Bond Funds into consideration in determining, composing, or calculating the Bloomberg Barclays Indices. Barclays is not responsible for and has not participated in the determination of the timing of, prices at, or quantities of the Vanguard Municipal Bond Funds to be issued. Barclays has no obligation or liability in connection with the administration, marketing, or trading of the Vanguard Municipal Bond Funds.
BARCLAYS SHALL HAVE NO LIABILITY TO THIRD PARTIES FOR THE QUALITY, ACCURACY AND/OR COMPLETENESS OF THE INDEX OR ANY DATA INCLUDED THEREIN OR FOR INTERRUPTIONS IN THE DELIVERY OF THE INDEX. BARCLAYS MAKES NO WARRANTY, EXPRESS OR IMPLIED, AS TO RESULTS TO BE OBTAINED BY OWNERS OF THE VANGUARD MUNICIPAL BOND FUNDS OR ANY OTHER PERSON OR ENTITY FROM THE USE OF THE INDEX OR ANY DATA INCLUDED THEREIN IN CONNECTION WITH THE RIGHTS LICENSED HEREUNDER OR FOR ANY OTHER USE. BARCLAYS RESERVES THE RIGHT
TO CHANGE THE METHODS OF CALCULATION OR PUBLICATION, OR TO CEASE THE CALCULATION OR PUBLICATION OF THE BLOOMBERG BARCLAYS INDICES, AND BARCLAYS SHALL NOT BE LIABLE FOR ANY MISCALCULATION OF OR ANY INCORRECT, DELAYED OR INTERRUPTED PUBLICATION WITH RESPECT TO ANY OF THE BLOOMBERG BARCLAYS INDICES. BARCLAYS MAKES NO EXPRESS OR IMPLIED WARRANTIES, AND HEREBY EXPRESSLY DISCLAIMS ALL WARRANTIES
OF MERCHANTABILITY OR FITNESS FOR A PARTICULAR PURPOSE OR USE WITH RESPECT TO THE INDEX OR ANY DATA INCLUDED THEREIN. BARCLAYS SHALL NOT BE LIABLE FOR ANY DAMAGES, INCLUDING, WITHOUT LIMITATION, ANY INDIRECT OR CONSEQUENTIAL DAMAGES RESULTING FROM THE USE OF THE INDEX OR ANY DATA INCLUDED THEREIN.
© 2017 Barclays. Used with Permission.
Source: Barclays Global Family of Indices. Copyright 2017, Barclays. All rights reserved.
41
This page intentionally left blank.
This page intentionally left blank.
The People Who Govern Your Fund
The trustees of your mutual fund are there to see that the fund is operated and managed in your best interests since, as a shareholder, you are a part owner of the fund. Your fund’s trustees also serve on the board of directors of The Vanguard Group, Inc., which is owned by the Vanguard funds and provides services to them on an at-cost basis.
A majority of Vanguard’s board members are independent, meaning that they have no affiliation with Vanguard or the funds they oversee, apart from the sizable personal investments they have made as private individuals. The independent board members have distinguished backgrounds in business, academia, and public service. Each of the trustees and executive officers oversees 197 Vanguard funds.
The following table provides information for each trustee and executive officer of the fund. The mailing address of the trustees and officers is P.O. Box 876, Valley Forge, PA 19482. More information about the trustees is in the Statement of Additional Information, which can be obtained, without charge, by contacting Vanguard at 800-662-7447, or online at vanguard.com.
Interested Trustee1
F. William McNabb III
Born 1957. Trustee Since July 2009. Chairman of the Board. Principal Occupation(s) During the Past Five Years and Other Experience: Chairman of the Board of The Vanguard Group, Inc., and of each of the investment companies served by The Vanguard Group, since January 2010; Director of The Vanguard Group since 2008; Chief Executive Officer and President of The Vanguard Group, and of each of the investment companies served by The Vanguard Group, since 2008; Director of Vanguard Marketing Corporation; Managing Director of The Vanguard Group (1995–2008).
Independent Trustees
Emerson U. Fullwood
Born 1948. Trustee Since January 2008. Principal Occupation(s) During the Past Five Years and Other Experience: Executive Chief Staff and Marketing Officer for North America and Corporate Vice President (retired 2008) of Xerox Corporation (document management products and services); Executive in Residence and 2009–2010 Distinguished Minett Professor at the Rochester Institute of Technology; Lead Director of SPX FLOW, Inc. (multi-industry manufacturing); Director of the United Way of Rochester, the University of Rochester Medical Center, Monroe Community College Foundation, North Carolina A&T University, and Roberts Wesleyan College; Trustee of the University of Rochester.
Rajiv L. Gupta
Born 1945. Trustee Since December 2001.2 Principal Occupation(s) During the Past Five Years and Other Experience: Chairman and Chief Executive Officer (retired 2009) and President (2006–2008) of Rohm and Haas Co. (chemicals); Director of Arconic Inc. (diversified manufacturer), HP Inc. (printer and personal computer manufacturing), and Delphi Automotive plc (automotive components); Senior Advisor at New Mountain Capital.
Amy Gutmann
Born 1949. Trustee Since June 2006. Principal Occupation(s) During the Past Five Years and Other Experience: President of the University of Pennsylvania; Christopher H. Browne Distinguished Professor of Political Science, School of Arts and Sciences, and Professor of Communication, Annenberg School for Communication, with secondary faculty appointments in the Department of Philosophy, School of Arts and Sciences, and at the Graduate School of Education, University of Pennsylvania; Trustee of the National Constitution Center.
JoAnn Heffernan Heisen
Born 1950. Trustee Since July 1998. Principal Occupation(s) During the Past Five Years and Other Experience: Corporate Vice President and Member of the Executive Committee (1997–2008), Chief Global Diversity Officer (retired 2008), Vice President and Chief Information Officer (1997–2006), Controller (1995–1997), Treasurer (1991–1995), and Assistant Treasurer (1989–1991) of Johnson & Johnson (pharmaceuticals/medical devices/consumer products); Director of Skytop Lodge Corporation (hotels) and the Robert Wood Johnson Foundation; Member of the Advisory Board of the Institute for Women’s Leadership at Rutgers University.
F. Joseph Loughrey
Born 1949. Trustee Since October 2009. Principal Occupation(s) During the Past Five Years and Other Experience: President and Chief Operating Officer (retired 2009) of Cummins Inc. (industrial machinery); Chairman of the Board of Hillenbrand, Inc. (specialized consumer services), Oxfam America, and the Lumina Foundation for Education; Director of SKF AB (industrial machinery), Hyster-Yale Materials Handling, Inc. (forklift trucks), and the V Foundation for Cancer
Research; Member of the Advisory Council for the College of Arts and Letters and Chair of the Advisory Board to the Kellogg Institute for International Studies, both at the University of Notre Dame.
Mark Loughridge
Born 1953. Trustee Since March 2012. Principal Occupation(s) During the Past Five Years and Other Experience: Senior Vice President and Chief Financial Officer (retired 2013) at IBM (information technology services); Fiduciary Member of IBM’s Retirement Plan Committee (2004–2013); Director of the Dow Chemical Company; Member of the Council on Chicago Booth.
Scott C. Malpass
Born 1962. Trustee Since March 2012. Principal Occupation(s) During the Past Five Years and Other Experience: Chief Investment Officer and Vice President at the University of Notre Dame; Assistant Professor of Finance at the Mendoza College of Business at Notre Dame; Member of the Notre Dame 403(b) Investment Committee, the Board of Advisors for Spruceview Capital Partners, and the Investment Advisory Committee of Major League Baseball; Board Member of TIFF Advisory Services, Inc., and Catholic Investment Services, Inc. (investment advisors); Member of the Board of Superintendence of the Institute for the Works of Religion.
André F. Perold
Born 1952. Trustee Since December 2004. Principal Occupation(s) During the Past Five Years and Other Experience: George Gund Professor of Finance and Banking, Emeritus at the Harvard Business School (retired 2011); Chief Investment Officer and Co-Managing Partner of HighVista Strategies LLC (private investment firm); Overseer of the Museum of Fine Arts Boston.
Peter F. Volanakis
Born 1955. Trustee Since July 2009. Principal Occupation(s) During the Past Five Years and Other Experience: President and Chief Operating Officer (retired 2010) of Corning Incorporated (communications equipment); Chairman of the Board of Trustees of Colby-Sawyer College; Member of the Board of Hypertherm, Inc. (industrial cutting systems, software, and consumables).
Executive Officers
Glenn Booraem
Born 1967. Investment Stewardship Officer Since February 2017. Principal Occupation(s) During the Past Five Years and Other Experience: Principal of The Vanguard Group, Inc.; Treasurer (2015–2017), Controller (2010–2015), and Assistant Controller (2001–2010) of each of the investment companies served by The Vanguard Group.
Thomas J. Higgins
Born 1957. Chief Financial Officer Since September 2008. Principal Occupation(s) During the Past Five Years and Other Experience: Principal of The Vanguard Group, Inc.; Chief Financial Officer of each of the investment companies served by The Vanguard Group; Treasurer of each of the investment companies served by The Vanguard Group (1998–2008).
Peter Mahoney
Born 1974. Controller Since May 2015. Principal Occupation(s) During the Past Five Years and Other Experience: Principal of The Vanguard Group, Inc.; Controller of each of the investment companies served by The Vanguard Group; Head of International Fund Services at The Vanguard Group (2008–2014).
Anne E. Robinson
Born 1970. Secretary Since September 2016. Principal Occupation(s) During the Past Five Years and Other Experience: Managing Director of The Vanguard Group, Inc.; General Counsel of The Vanguard Group; Secretary of The Vanguard Group and of each of the investment companies served by The Vanguard Group; Director and Senior Vice President of Vanguard Marketing Corporation; Managing Director and General Counsel of Global Cards and Consumer Services at Citigroup (2014–2016); Counsel at American Express (2003–2014).
Michael Rollings
Born 1963. Treasurer Since February 2017. Principal Occupation(s) During the Past Five Years and Other Experience: Managing Director of The Vanguard Group, Inc.; Treasurer of each of the investment companies served by The Vanguard Group; Executive Vice President and Chief Financial Officer of MassMutual Financial Group (2006–2016).
| |
| Vanguard Senior Management Team |
| Mortimer J. Buckley | James M. Norris |
| John James | Thomas M. Rampulla |
| Martha G. King | Glenn W. Reed |
| John T. Marcante | Karin A. Risi |
| Chris D. McIsaac | |
| |
| Chairman Emeritus and Senior Advisor |
| John J. Brennan | |
| Chairman, 1996–2009 | |
| Chief Executive Officer and President, 1996–2008 |
| |
| Founder | |
| John C. Bogle | |
| Chairman and Chief Executive Officer, 1974–1996 |
1 Mr. McNabb is considered an “interested person,” as defined in the Investment Company Act of 1940, because he is an officer of the Vanguard funds.
2 December 2002 for Vanguard Equity Income Fund, the Vanguard Municipal Bond Funds, and the Vanguard State Tax-Exempt Funds.
| |  |
| | | P.O. Box 2600 |
| | | Valley Forge, PA 19482-2600 |
| |
| |
| |
| Connect with Vanguard® > vanguard.com | |
| |
| |
| |
| Fund Information > 800-662-7447 | | CFA® is a registered trademark owned by CFA Institute. |
| Direct Investor Account Services > 800-662-2739 | |
| Institutional Investor Services > 800-523-1036 | |
| Text Telephone for People | | |
| Who Are Deaf or Hard of Hearing> 800-749-7273 | |
| |
| This material may be used in conjunction | |
| with the offering of shares of any Vanguard | |
| fund only if preceded or accompanied by | |
| the fund’s current prospectus. | |
| |
| All comparative mutual fund data are from Lipper, a | |
| Thomson Reuters Company, or Morningstar, Inc., unless | |
| otherwise noted. | | |
| |
| You can obtain a free copy of Vanguard’s proxy voting | |
| guidelines by visiting vanguard.com/proxyreporting or by | |
| calling Vanguard at 800-662-2739. The guidelines are | |
| also available from the SEC’s website, sec.gov. In | |
| addition, you may obtain a free report on how your fund | |
| voted the proxies for securities it owned during the 12 | |
| months ended June 30. To get the report, visit either | |
| vanguard.com/proxyreporting or sec.gov. | |
| |
| You can review and copy information about your fund at | |
| the SEC’s Public Reference Room in Washington, D.C. To | |
| find out more about this public service, call the SEC at | |
| 202-551-8090. Information about your fund is also | |
| available on the SEC’s website, and you can receive | |
| copies of this information, for a fee, by sending a | |
| request in either of two ways: via email addressed to | |
| publicinfo@sec.gov or via regular mail addressed to the | |
| Public Reference Section, Securities and Exchange | |
| Commission, Washington, DC 20549-1520. | |
| |
| | | © 2017 The Vanguard Group, Inc. |
| | | All rights reserved. |
| | | Vanguard Marketing Corporation, Distributor. |
| |
| | | Q1682 072017 |
Item 2: Code of Ethics. The Registrant has adopted a code of ethics that applies to the Registrant’s principal executive officer, principal financial officer, principal accounting officer or controller or persons performing similar functions. The Code of Ethics was amended during the reporting period covered by this report to make certain technical, non-material changes.
Item 3: Audit Committee Financial Expert.
Not Applicable.
Item 4: Principal Accountant Fees and Services.
(a) Audit Fees.
Not Applicable.
Item 5: Audit Committee of Listed Registrants.
Not Applicable.
Item 6: Investments.
Not Applicable.
Item 7: Disclosure of Proxy Voting Policies and Procedures for Closed-End Management Investment Companies.
Not Applicable.
Item 8: Portfolio Managers of Closed-End Management Investment Companies.
Not Applicable.
Item 9: Purchase of Equity Securities by Closed-End Management Investment Company and Affiliated Purchasers.
Not Applicable.
Item 10: Submission of Matters to a Vote of Security Holders.
Not Applicable.
Item 11: Controls and Procedures.
(a) Disclosure Controls and Procedures. The Principal Executive and Financial Officers concluded that the Registrant’s Disclosure Controls and Procedures are effective
based on their evaluation of the Disclosure Controls and Procedures as of a date within 90 days of the filing date of this report.
(b) Internal Control Over Financial Reporting. There were no significant changes in Registrant’s Internal Control Over Financial Reporting or in other factors that could significantly affect this control subsequent to the date of the evaluation, including any corrective actions with regard to significant deficiencies and material weaknesses.
Item 12: Exhibits.
(a) Certifications.
Pursuant to the requirements of the Securities Exchange Act of 1934 and the Investment Company Act of 1940, the registrant has duly caused this report to be signed on its behalf by the undersigned, thereunto duly authorized.
| |
| | VANGUARD MASSACHUSETTS TAX-EXEMPT FUNDS |
| |
| |
| BY: | /s/ F. WILLIAM MCNABB III* |
| | F. WILLIAM MCNABB III |
| | CHIEF EXECUTIVE OFFICER |
| |
| Date: July 18, 2017 |
Pursuant to the requirements of the Securities Exchange Act of 1934 and the Investment Company Act of 1940, this report has been signed below by the following persons on behalf of the registrant and in the capacities and on the dates indicated.
| |
| | VANGUARD MASSACHUSETTS TAX-EXEMPT FUNDS |
|
| BY: | /s/ F. WILLIAM MCNABB III* |
| | F. WILLIAM MCNABB III |
| | CHIEF EXECUTIVE OFFICER |
Date: July 18, 2017 |
| | VANGUARD MASSACHUSETTS TAX-EXEMPT FUNDS |
BY: | /s/ THOMAS J. HIGGINS* |
| | THOMAS J. HIGGINS |
| | CHIEF FINANCIAL OFFICER |
Date: July 18, 2017 |
* By: /s/ Anne E. Robinson
Anne E. Robinson, pursuant to a Power of Attorney filed on October 4, 2016 see file Number 33-32548, Incorporated by Reference.
0448435, v0.62