UNITED STATES
SECURITIES AND EXCHANGE COMMISSION
Washington, D.C. 20549
FORM N-CSR
CERTIFIED SHAREHOLDER REPORT
OF
REGISTERED MANAGEMENT INVESTMENT COMPANIES
Investment Company Act file number: 811-09005
| | |
| Name of Registrant: | Vanguard Massachusetts Tax-Exempt Funds |
| |
| Address of Registrant: | P.O. Box 2600 |
| | Valley Forge, PA 19482 |
| |
| Name and address of agent for service: | Anne E. Robinson, Esquire |
| | P.O. Box 876 |
| | Valley Forge, PA 19482 |
Registrant’s telephone number, including area code: (610) 669-1000
Date of fiscal year end: November 30
Date of reporting period: December 31, 2016 – November 30, 2017
Item 1: Reports to Shareholders
0448435, v0.61

Annual Report | November 30, 2017
Vanguard Massachusetts Tax-Exempt Fund
Vanguard’s Principles for Investing Success
We want to give you the best chance of investment success. These principles, grounded in Vanguard’s research and experience, can put you on the right path.
Goals. Create clear, appropriate investment goals.
Balance. Develop a suitable asset allocation using broadly diversified funds.
Cost. Minimize cost.
Discipline. Maintain perspective and long-term discipline.
A single theme unites these principles: Focus on the things you can control.
We believe there is no wiser course for any investor.
| |
| Contents | |
| Your Fund’s Performance at a Glance. | 1 |
| Chairman’s Perspective. | 3 |
| Advisor’s Report. | 7 |
| Results of Proxy Voting. | 11 |
| Fund Profile. | 13 |
| Performance Summary. | 14 |
| Financial Statements. | 16 |
| About Your Fund’s Expenses. | 43 |
| Glossary. | 45 |
Please note: The opinions expressed in this report are just that—informed opinions. They should not be considered promises
or advice. Also, please keep in mind that the information and opinions cover the period through the date on the front of this
report. Of course, the risks of investing in your fund are spelled out in the prospectus.
See the Glossary for definitions of investment terms used in this report.
About the cover: Nautical images have been part of Vanguard’s rich heritage since its start in 1975. For an
incoming ship, a lighthouse offers a beacon and safe path to shore. You can similarly depend on Vanguard to put
you first––and light the way––as you strive to meet your financial goals. Our client focus and low costs,
stemming from our unique ownership structure, assure that your interests are paramount.
Your Fund’s Performance at a Glance
• For the 12 months ended November 30, 2017, Vanguard Massachusetts Tax-Exempt Fund returned 6.19%, ahead of the 5.41% return of its benchmark index and the 3.78% average return of peer funds.
• Demand for municipal bonds rebounded from a slump in the wake of the U.S. presidential election. Municipal bond prices appreciated amid the increasing demand and decreasing supply.
• The fund’s tilt toward longer-dated and lower-quality securities boosted relative performance. By sector, positioning in university- and hospital-revenue bonds added the most value.
• Please note that the fund will adjust its security selection parameters in March.
This change is addressed in the Advisor’s Report later in this report.
| | | | | |
| Total Returns: Fiscal Year Ended November 30, 2017 | | | | |
| | | Taxable- | | | |
| | 30-Day SEC | Equivalent | Income | Capital | Total |
| | Yield | Yield | Returns | Returns | Returns |
| Vanguard Massachusetts Tax-Exempt Fund | 2.28% | 4.24% | 3.10% | 3.09% | 6.19% |
| Bloomberg Barclays MA Municipal Bond Index | | | | | 5.41 |
| Massachusetts Municipal Debt Funds Average | | | | | 3.78 |
| Massachusetts Municipal Debt Funds Average: Derived from data provided by Lipper, a Thomson Reuters Company. | |
The calculation of taxable-equivalent yield assumes a typical itemized tax return and is based on the 2017 maximum federal tax rate of
43.4% and the maximum income tax rate for the state. Local taxes were not considered. Please see the prospectus for a detailed
explanation of the calculation.
| |
| Total Returns: Ten Years Ended November 30, 2017 | |
| | Average |
| | Annual Return |
| Massachusetts Tax-Exempt Fund | 4.22% |
| Bloomberg Barclays MA Municipal Bond Index | 4.30 |
| Massachusetts Municipal Debt Funds Average | 3.55 |
Massachusetts Municipal Debt Funds Average: Derived from data provided by Lipper, a Thomson Reuters Company.
The figures shown represent past performance, which is not a guarantee of future results. (Current performance may be
lower or higher than the performance data cited. For performance data current to the most recent month-end, visit our
website at vanguard.com/performance.) Note, too, that both investment returns and principal value can fluctuate widely,
so an investor’s shares, when sold, could be worth more or less than their original cost.
1
| | |
| Expense Ratios | | |
| Your Fund Compared With Its Peer Group | | |
| | | Peer Group |
| | Fund | Average |
| Massachusetts Tax-Exempt Fund | 0.15% | 1.03% |
The fund expense ratio shown is from the prospectus dated March 28, 2017, and represents estimated costs for the current fiscal year. For
the fiscal year ended November 30, 2017, the fund’s expense ratio was 0.15%. The peer-group expense ratio is derived from data
provided by Lipper, a Thomson Reuters Company, and captures information through year-end 2016.
Peer group: Massachusetts Municipal Debt Funds.
2
Chairman’s Perspective

Bill McNabb
Chairman and Chief Executive Officer
Dear Shareholder,
In my more than 30 years at Vanguard, I’ve seen both the best and worst that the markets have to offer.
A bullish start
The first part of my tenure, from 1986 through 1999, coincided with one of the greatest bull markets in stocks and bonds. To be sure, there were disruptions along the way, including the 1987 stock market crash and the 1997 Asian financial crisis. But the overall experience was that of a seemingly tireless bull, with investors earning robust returns.
U.S. stocks climbed an average of about 19% a year during that period, and U.S. bonds rose almost 9%.1
Of course, I paid close attention to such sound investing practices as choosing the right asset allocation, rebalancing in a disciplined fashion, thinking long-term, and—especially important—keeping costs low. But even investors who didn’t focus on these were doing well. It seemed hard to go wrong when everything was going right.
A tough second half
During the second part of my tenure, the markets have been more challenging. We’ve seen two severe corrections: the 2001–2002 dot-com bust and the brutal 2008–2009 Global Financial Crisis.
1 For calendar years 1986 through 1999, as measured by the Standard & Poor’s 500 Index and the Bloomberg Barclays U.S. Aggregate Bond Index.
3
Markets have clearly performed well over the years since the crisis, but they’ve done so against a backdrop of heightened uncertainty fueled by postcrisis regulatory changes and unprecedented monetary policy stimulus—not to mention stubbornly low economic growth, wage increases, and inflation.
Those factors are reflected in the far more modest market returns from 2000 through 2016: U.S. stocks gained an average of about 6% a year and U.S. bonds about 5%.2
In this more volatile, lower-return environment, those sound investing practices that may not have mattered to some investors in the earlier period actually mattered an awful lot.
What might the future hold?
No one can say for certain what lies ahead for the markets. However—and I realize this isn’t necessarily what investors want to hear—there are signs pointing to an increasingly challenging environment for both stocks and bonds.
| | | |
| Market Barometer | | | |
| | | Average Annual Total Returns |
| | Periods Ended November 30, 2017 |
| | One Year | Three Years | Five Years |
| Stocks | | | |
| Russell 1000 Index (Large-caps) | 22.61% | 10.73% | 15.69% |
| Russell 2000 Index (Small-caps) | 18.34 | 11.14 | 15.02 |
| Russell 3000 Index (Broad U.S. market) | 22.27 | 10.75 | 15.63 |
| FTSE All-World ex US Index (International) | 27.59 | 6.18 | 7.46 |
| |
| Bonds | | | |
| Bloomberg Barclays U.S. Aggregate Bond Index | | | |
| (Broad taxable market) | 3.21% | 2.11% | 1.98% |
| Bloomberg Barclays Municipal Bond Index | | | |
| (Broad tax-exempt market) | 5.58 | 2.79 | 2.55 |
| Citigroup Three-Month U.S. Treasury Bill Index | 0.77 | 0.34 | 0.21 |
| |
| CPI | | | |
| Consumer Price Index | 2.20% | 1.46% | 1.39% |
2 For calendar years 2000 through 2016, as measured by the S&P 500 Index and the Bloomberg Barclays U.S. Aggregate Bond Index.
4
Our economists recently issued Vanguard’s economic and market outlook for 2018. The report is packed with valuable insights about the global economy, inflation, interest rates, monetary policy, stock valuations, and bond yields. (You can read it at vanguard.com/research.)
A key takeaway is that investors should anticipate more “muted”—that’s economist-speak for “lower”—portfolio returns over the next ten years.
Given that outlook, the sound investing practices we’ve long promoted—diversification, rebalancing, discipline, and minimizing of costs—will be even more important for investment success. That’s true whether you’re an individual investor, an institutional investor, or an advisor working with clients.
Expectations for market returns
To develop Vanguard’s outlook, our economists use a proprietary statistical model that looks at a variety of inputs—valuations in particular—to run simulations over extended periods.* The output from the model includes ranges of potential returns from various asset classes and the probabilities of those outcomes.
For global stocks, the model projects that average annual returns over the next ten years could fall anywhere between roughly 0% and more than 10%, with the most likely outcome being 4.5%–6.5%. That range is far from a certainty, but for planning purposes, it’s a solid starting point. And it’s significantly lower than stocks’ long-term historical return of about 10% per year. Largely because of elevated valuations, the projected return range for U.S. stocks over the next ten years is even lower, at 3%–5%.
As for bonds, we expect action by the Federal Reserve and other major central banks to push yields a little higher, especially for shorter-term bonds. That upward movement would weigh on bond prices. Investors, though, would end up earning a little more income, which over time should more than offset any price declines.
The most likely range of average annual returns for global bonds over the next ten years is 2%–3%, according to our model. That’s also significantly lower than the long-term annual historical return of more than 5%.
* IMPORTANT: The projections and other information generated by the Vanguard Capital Markets Model regarding the
likelihood of various investment outcomes are hypothetical in nature, do not reflect actual investment results, and are
not guarantees of future results. VCMM results will vary with each use and over time. For more information, see the
next page.
5
Being a silent partner isn’t enough
One of our senior investment strategists, Fran Kinniry, likes to say that investing is a partnership between you and the markets. Over the last 30 years, the markets have done much of the work for us. But if our outlook for muted returns is borne out, investors will likely have to do more of the heavy lifting. To stretch the analogy, you’ll need to become the majority partner.
I know that’s easier said than done. But boosting savings—putting an extra percent or two away each year for retirement, or, if you’ve already retired, drawing down savings a little more slowly—is within your control. These sacrifices can help offset slimmer returns and pay off for you in greater long-term financial security.
As always, thank you for investing with Vanguard.
Sincerely,

F. William McNabb III
Chairman and Chief Executive Officer December 14, 2017
IMPORTANT: The projections and other information generated by the Vanguard Capital Markets Model regarding the
likelihood of various investment outcomes are hypothetical in nature, do not reflect actual investment results, and are
not guarantees of future results. VCMM results will vary with each use and over time.
The VCMM projections are based on a statistical analysis of historical data. Future returns may behave differently from the historical
patterns captured in the VCMM. More important, the VCMM may be underestimating extreme negative scenarios unobserved in the
historical period on which the model estimation is based.
The VCMM is a proprietary financial simulation tool developed and maintained by Vanguard’s Investment Strategy Group. The model
forecasts distributions of future returns for a wide array of broad asset classes. Those asset classes include U.S. and international equity
markets, several maturities of the U.S. Treasury and corporate fixed income markets, international fixed income markets, U.S. money
markets, commodities, and certain alternative investment strategies. The theoretical and empirical foundation for the Vanguard Capital
Markets Model is that the returns of various asset classes reflect the compensation investors require for bearing different types of
systematic risk (beta). At the core of the model are estimates of the dynamic statistical relationship between risk factors and asset returns,
obtained from statistical analysis based on available monthly financial and economic data. Using a system of estimated equations, the
model then applies a Monte Carlo simulation method to project the estimated interrelationships among risk factors and asset classes as
well as uncertainty and randomness over time. The model generates a large set of simulated outcomes for each asset class over several
time horizons. Forecasts are obtained by computing measures of central tendency in these simulations. Results produced by the tool
will vary with each use and over time.
6
Advisor’s Report
For the 12 months ended November 30, 2017, Vanguard Massachusetts Tax-Exempt Fund returned 6.19%. The fund surpassed its benchmark, the Bloomberg Barclays Massachusetts Municipal Bond Index, which returned 5.41%, and its peer group, which had an average return of 3.78%.
Both price appreciation and interest income contributed solidly to results. The fund’s capital return was 3.09% and its return from interest income was 3.10%. Its 30-day SEC yield dipped to 2.28% from 2.31% a year earlier (and from 2.34% six months earlier).
The fund is permitted to invest in bonds whose income is subject to the alternative minimum tax (AMT). However, as of the end of the period, it did not own any such bonds.
Please note that Vanguard is planning to adjust the security selection parameters for Vanguard Massachusetts Tax-Exempt Fund’s investable universe at the end of March. We are making this change across our state municipal bond fund lineup. Under the new parameters, we will seek to maintain at least 80% of the fund’s assets in investment-grade securities and
| | |
| Yields of Municipal Securities | | |
| (AAA-Rated General Obligation Issues) | | |
| | November 30, | November 30, |
| Maturity | 2016 | 2017 |
| 2 years | 1.16% | 1.57% |
| 5 years | 1.85 | 1.76 |
| 10 years | 2.52 | 2.15 |
| 30 years | 3.26 | 2.79 |
| Source: Vanguard. | | |
7
no more than 20% in non-investment-grade securities at the time of purchase. The previous security selection policy required 75% in securities rated A or better, up to 20% in securities rated BBB, and only 5% in non-investment-grade securities. The new parameters provide greater flexibility with respect to investment selection and may result in a higher risk profile for the fund.
The investment environment
At the beginning of the fiscal year, the Federal Reserve was enthusiastic about the health of the U.S. economy. In December 2016, it raised the federal funds rate by a quarter of a percentage point—only the second increase in a decade—even though inflation was still running below the Fed’s 2% target. The outlook for stronger growth and higher inflation led investors to turn toward riskier assets, causing bond prices to slump while many stock market indexes soared to record highs.
The outlook dimmed a little in the new year, however, as it became clear that the slate of policy initiatives could prove harder to implement than anticipated. Moreover, inflation continued to disappoint, with weak readings proving less transient than expected and wage gains remaining modest despite a strong labor market. Some wary investors hedged their bets by edging back into bonds, lending support to prices.
The macroeconomic backdrop nevertheless stayed positive. Economic growth was in line with recent trends, oscillating around 2%–2.5%. Employment gains were relatively strong, averaging more than 160,000 jobs per month. That helped keep unemployment on a downward trajectory—over the period, it fell from 4.6% to a 17-year low of 4.1%. The housing and manufacturing sectors recorded decent growth as well.
Those developments likely played a part in the Fed’s decisions to raise rates again in March and June, pushing its target range up to 1%–1.25%, and to kick off the reduction of its $4.5 trillion balance sheet in October. All of those developments took the Fed further down the road of monetary policy normalization after its emergency intervention in the wake of the global financial crisis.
In Massachusetts, the unemployment rate increased from 3.1% to 3.7% over the fiscal year. The commonwealth’s economy grew a bit more slowly than that of the United States as a whole, according to a gauge of current economic conditions published monthly by the Federal Reserve Bank of Philadelphia. The bank’s index for Massachusetts climbed less than 1% between November 2016 and October 2017, while the national index rose more than 2%. (Each state’s index incorporates data on nonfarm payroll employment, the jobless rate, average hours worked in manufacturing, and inflation-adjusted wage and salary payments.)
8
Massachusetts closed out a balanced budget for fiscal 2017 after midyear cuts eliminated a modest gap of about 2%. This left the state’s budget stabilization fund unchanged at $1.3 billion, or roughly 3% of expenditures. Through September 2017, tax revenues came in slightly over budget.
Massachusetts’ credit for the fiscal year was rated Aa1 with a stable outlook by Moody’s and AA+ with a stable outlook by Fitch. Standard & Poor’s downgraded the commonwealth in June from AA+ with a negative outlook to AA with a stable outlook. It cited a “failure to follow through on rebuilding reserves” during a period of economic expansion as a key driver of the downgrade. Other factors included revenue volatility, elevated debt levels, and below-average pension fund levels. At the same time, all of the rating agencies recognized the state’s high wealth and income levels, diverse economy, and strong financial, debt, and budget management policies.
Management of the fund
Our investment process relies on risk management as we strive to add value through a diversified mix of strategies including duration, yield-curve positioning, credit-quality decisions, and security selection. Vanguard’s experienced team of credit analysts performs an objective, complete, and independent analysis of the overall creditworthiness of every issuer of bonds we own or consider owning. Our strategic views on the portfolio’s positioning remained unchanged during the fiscal year.
The major drivers of outperformance were our holdings at the lower end of the investment-grade spectrum and longer-dated assets. From a sector standpoint, our university- and hospital-revenue bonds did well and offset a slight lag in our school district and special assessment bonds.
We also benefited from our investments in newly issued securities, most notably from the Massachusetts Commonwealth Transportation Fund and Suffolk University, which received support in an environment characterized by excess demand and lack of supply. The reduction in supply hindered our ability to maneuver the portfolio at times but didn’t detract from returns.
Our holdings of premium callable bonds performed well. Because these bonds may be redeemed before maturity, exposing investors to reinvestment risk, they offer attractive yields and favorable total return potential across many interest rate scenarios.
A look ahead
In spite of long-term structural challenges including slowing productivity growth and unfavorable demographics, the U.S. economy should break above its long-term potential growth rate of about 2% in 2018.
The unemployment rate has fallen to its lowest level since 2000 and is likely to move even lower. A reemergence of upward pressure on wages along with stable and broader global growth and some recovery in commodity prices may lead to
9
stronger inflation than currently anticipated by financial markets. Our long-term inflation outlook, however, is unchanged.
That backdrop should justify the Federal Reserve in raising rates to at least 2% by the end of 2018. The Fed will likely want to stick to the framework and timetable it has laid out for its balance sheet barring unexpected economic data or unintended consequences of tapering in the bond market.
We have been closely monitoring developments in Washington that could affect municipal bonds. The new tax law contains provisions that will marginally affect the municipal bond market. The largest change is the elimination of issuers’ ability to issue advance refunding bonds (bonds issued to effectively repay existing debt at lower rates). This change is expected to modestly reduce municipal supply in 2018, but the reduction should be offset by the reduced demand from the lowering of personal and corporate tax rates. So, we do not expect large changes to the municipal bond market as a result of the tax law changes.
Volatility could well pick up from the very low levels we’ve been experiencing. The list of potential catalysts for that is long and includes an inflation surprise, the federal government debt ceiling, trade negotiations, and geopolitical tensions.
We nevertheless expect municipal bonds to offer relative stability and a steady stream of income. Whatever the markets may bring, our experienced team of portfolio managers, traders, and credit analysts will continue to seek out opportunities to add to the fund’s performance.
Christopher W. Alwine, CFA, Principal,
Head of Municipal Group
Matthew M. Kiselak, Principal, Portfolio
Manager, Head of Municipal Bond Desk
Vanguard Fixed Income Group
December 22, 2017
10
Results of Proxy Voting
At a special meeting of shareholders on November 15, 2017, fund shareholders approved the following proposals:
Proposal 1—Elect trustees for the fund.*
The individuals listed in the table below were elected as trustees for the fund. All trustees with the exception of Ms. Mulligan, Ms. Raskin, and Mr. Buckley (each of whom already serves as a director of The Vanguard Group, Inc.) served as trustees to the funds prior to the shareholder meeting.
| | | |
| | | | Percentage |
| Trustee | For | Withheld | For |
| Mortimer J. Buckley | 108,808,093 | 3,995,386 | 96.5% |
| Emerson U. Fullwood | 108,846,040 | 3,957,438 | 96.5% |
| Amy Gutmann | 108,489,515 | 4,313,964 | 96.2% |
| JoAnn Heffernan Heisen | 108,773,424 | 4,030,055 | 96.4% |
| F. Joseph Loughrey | 108,858,914 | 3,944,565 | 96.5% |
| Mark Loughridge | 108,858,068 | 3,945,410 | 96.5% |
| Scott C. Malpass | 108,780,893 | 4,022,586 | 96.4% |
| F. William McNabb III | 108,692,716 | 4,110,763 | 96.4% |
| Deanna Mulligan | 108,719,733 | 4,083,746 | 96.4% |
| André F. Perold | 108,357,232 | 4,446,247 | 96.1% |
| Sarah Bloom Raskin | 108,653,020 | 4,150,459 | 96.3% |
| Peter F. Volanakis | 108,860,229 | 3,943,250 | 96.5% |
| * Results are for all funds within the same trust. | | | |
Proposal 2—Approve a manager-of-managers arrangement with third-party investment advisors.
This arrangement enables the fund to enter into and materially amend investment advisory arrangements with third-party investment advisors, subject to the approval of the fund’s board of trustees and certain conditions imposed by the Securities and Exchange Commission, while avoiding the costs and delays associated with obtaining future shareholder approval.
| | | | | |
| | | | | Broker | Percentage |
| Vanguard Fund | For | Abstain | Against | Non-Votes | For |
| Massachusetts | | | | | |
| Tax-Exempt Fund | 88,590,387 | 3,368,537 | 3,737,258 | 17,107,296 | 78.5% |
11
Proposal 3—Approve a manager-of-managers arrangement with wholly owned subsidiaries of Vanguard.
This arrangement enables Vanguard or the fund to enter into and materially amend investment advisory arrangements with wholly owned subsidiaries of Vanguard, subject to the approval of the fund’s board of trustees and any conditions imposed by the Securities and Exchange Commission (SEC), while avoiding the costs and delays associated with obtaining future shareholder approval. The ability of the fund to operate in this manner is contingent upon the SEC’s approval of a pending application for an order of exemption.
| | | | | |
| | | | | Broker | Percentage |
| Vanguard Fund | For | Abstain | Against | Non-Votes | For |
| Massachusetts | | | | | |
| Tax-Exempt Fund | 89,337,692 | 3,166,270 | 3,192,220 | 17,107,296 | 79.2% |
12
Massachusetts Tax-Exempt Fund
| | | |
| Fund Profile | | |
| As of November 30, 2017 | | |
| |
| Financial Attributes | | |
| |
| | | Bloomberg | |
| | | Barclays | Bloomberg |
| | | MA | Barclays |
| | | Municipal | Municipal |
| | Fund | Bond Index | Bond Index |
| Number of | | | |
| Bonds | 467 | 1,825 | 50,546 |
| Yield to Maturity | | | |
| (before | | | |
| expenses) | 2.5% | 2.4% | 2.5% |
| Average Coupon | 4.7% | 4.7% | 4.7% |
| Average Duration | 7.1 years | 6.2 years | 5.9 years |
| Average Stated | | | |
| Maturity | 16.7 years | 13.0 years | 13.0 years |
| Ticker Symbol | VMATX | — | — |
| Expense Ratio1 | 0.15% | — | — |
| 30-Day SEC | | | |
| Yield | 2.28% | — | — |
| Short-Term | | | |
| Reserves | 4.0% | — | — |
| | |
| Volatility Measures | | |
| | Bloomberg | Bloomberg |
| | Barclays MA | Barclays |
| | Municipal | Municipal |
| | Bond Index | Bond Index |
| R-Squared | 0.98 | 0.98 |
| Beta | 1.08 | 1.15 |
These measures show the degree and timing of the fund’s
fluctuations compared with the indexes over 36 months.
| |
| Distribution by Stated Maturity | |
| (% of portfolio) | |
| Under 1 Year | 3.8% |
| 1 - 3 Years | 3.9 |
| 3 - 5 Years | 4.9 |
| 5 - 10 Years | 7.6 |
| 10 - 20 Years | 41.4 |
| 20 - 30 Years | 36.5 |
| Over 30 Years | 1.9 |
| |
| Distribution by Credit Quality (% of portfolio) |
| AAA | 15.4% |
| AA | 57.9 |
| A | 13.7 |
| BBB | 11.8 |
| BB | 0.2 |
| Not Rated | 1.0 |
Credit-quality ratings are obtained from Moody's and S&P, and the
higher rating for each issue is shown. "Not Rated" is used to classify
securities for which a rating is not available. Not rated securities
include a fund's investment in Vanguard Market Liquidity Fund or
Vanguard Municipal Cash Management Fund, each of which invests
in high-quality money market instruments and may serve as a cash
management vehicle for the Vanguard funds, trusts, and accounts.
For more information about these ratings, see the Glossary entry for
Credit Quality.
Investment Focus

1 The expense ratio shown is from the prospectus dated March 28, 2017, and represents estimated costs for the current fiscal year. For
the fiscal year ended November 30, 2017, the expense ratio was 0.15%.
13
Massachusetts Tax-Exempt Fund
Performance Summary
All of the returns in this report represent past performance, which is not a guarantee of future results that may be achieved by the fund. (Current performance may be lower or higher than the performance data cited. For performance data current to the most recent month-end, visit our website at vanguard.com/performance.) Note, too, that both investment returns and principal value can fluctuate widely, so an investor’s shares, when sold, could be worth more or less than their original cost. The returns shown do not reflect taxes that a shareholder would pay on fund distributions or on the sale of fund shares.
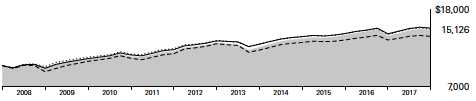
Cumulative Performance: November 30, 2007, Through November 30, 2017
Initial Investment of $10,000
| | | | | |
| | Average Annual Total Returns | |
| | Periods Ended November 30, 2017 | |
| | | | | Final Value |
| | One | Five | Ten | of a $10,000 |
| | Year | Years | Years | Investment |
 | Massachusetts Tax-Exempt Fund | 6.19% | 2.66% | 4.22% | $15,126 |
| Bloomberg Barclays MA Municipal | | | | |
 | Bond Index | 5.41 | 2.31 | 4.30 | 15,231 |
| Massachusetts Municipal Debt Funds | | | | |
 | Average | 3.78 | 1.55 | 3.55 | 14,175 |
| Bloomberg Barclays Municipal Bond | | | | |
 | Index | 5.58 | 2.55 | 4.38 | 15,347 |
Massachusetts Municipal Debt Funds Average: Derived from data provided by Lipper, a Thomson Reuters Company.
See Financial Highlights for dividend and capital gains information.
14
| | | | |
| Massachusetts Tax-Exempt Fund | | | | |
| |
| |
| |
| |
| Fiscal-Year Total Returns (%): November 30, 2007, Through November 30, 2017 | |
| | | | | Bloomberg |
| | | | | Barclays MA |
| | | | | Municipal |
| | | | | Bond Index |
| Fiscal Year | Income Returns | Capital Returns | Total Returns | Total Returns |
| 2008 | 4.00% | -6.72% | -2.72% | -1.30% |
| 2009 | 4.42 | 7.94 | 12.36 | 13.60 |
| 2010 | 3.80 | -0.39 | 3.41 | 3.96 |
| 2011 | 3.76 | 2.56 | 6.32 | 6.41 |
| 2012 | 3.49 | 6.92 | 10.41 | 9.57 |
| 2013 | 3.02 | -7.73 | -4.71 | -3.52 |
| 2014 | 3.48 | 5.84 | 9.32 | 7.72 |
| 2015 | 3.15 | 0.62 | 3.77 | 3.14 |
| 2016 | 2.85 | -3.53 | -0.68 | -0.82 |
| 2017 | 3.10 | 3.09 | 6.19 | 5.41 |
Average Annual Total Returns: Periods Ended September 30, 2017
This table presents returns through the latest calendar quarter—rather than through the end of the fiscal period.
Securities and Exchange Commission rules require that we provide this information.
| | | | | | |
| | | | | | | Ten Years |
| | Inception Date | One Year | Five Years | Income | Capital | Total |
| Massachusetts | | | | | | |
| Tax-Exempt Fund | 12/9/1998 | 0.27% | 3.07% | 3.53% | 0.83% | 4.36% |
15
Massachusetts Tax-Exempt Fund
Financial Statements
Statement of Net Assets
As of November 30, 2017
The fund reports a complete list of its holdings in regulatory filings four times in each fiscal year, at the quarter-ends. For the second and fourth fiscal quarters, the lists appear in the fund’s semiannual and annual reports to shareholders. For the first and third fiscal quarters, the fund files the lists with the Securities and Exchange Commission on Form N-Q. Shareholders can look up the fund’s Forms N-Q on the SEC’s website at sec.gov. Forms N-Q may also be reviewed and copied at the SEC’s Public Reference Room (see the back cover of this report for further information).
| | | | |
| | | | Face | Market |
| | | Maturity | Amount | Value • |
| | Coupon | Date | ($000) | ($000) |
| Tax-Exempt Municipal Bonds (99.8%) | | | | |
| Massachusetts (99.0%) | | | | |
| 1 Arlington MA GO | 5.000% | 12/1/28 | 1,535 | 1,906 |
| 1 Arlington MA GO | 5.000% | 12/1/29 | 1,535 | 1,898 |
| 1 Arlington MA GO | 4.000% | 12/1/30 | 1,535 | 1,720 |
| Boston MA GO | 5.000% | 2/1/24 | 2,345 | 2,652 |
| Boston MA GO | 5.000% | 3/1/24 | 3,000 | 3,465 |
| Boston MA GO | 5.000% | 4/1/28 | 2,140 | 2,585 |
| Boston MA Housing Authority Revenue | 5.000% | 4/1/23 (4) | 1,995 | 2,019 |
| Boston MA Housing Authority Revenue | 5.000% | 4/1/25 (4) | 5,415 | 5,480 |
| 2 Boston MA Water & Sewer Commission | | | | |
| Revenue | 5.000% | 5/1/19 (Prere.) | 3,725 | 3,902 |
| Boston MA Water & Sewer Commission | | | | |
| Revenue | 5.000% | 11/1/20 | 1,550 | 1,696 |
| Boston MA Water & Sewer Commission | | | | |
| Revenue | 5.000% | 11/1/30 | 750 | 858 |
| Cambridge MA GO | 4.000% | 1/1/26 | 1,600 | 1,807 |
| Cambridge MA GO | 4.000% | 1/1/27 | 1,000 | 1,125 |
| Essex MA North Shore Agricultural & | | | | |
| Technical School District GO | 4.000% | 6/1/39 | 2,810 | 2,942 |
| Holyoke MA GO | 5.000% | 9/1/30 | 1,690 | 1,907 |
| Massachusetts Bay Transportation Authority | | | | |
| Assessment Revenue | 5.250% | 7/1/31 | 2,285 | 2,934 |
| Massachusetts Bay Transportation Authority | | | | |
| Assessment Revenue | 4.000% | 7/1/37 | 5,000 | 5,217 |
| Massachusetts Bay Transportation Authority | | | | |
| Assessment Revenue | 5.000% | 7/1/41 | 7,705 | 8,628 |
| Massachusetts Bay Transportation Authority | | | | |
| Revenue VRDO | 0.940% | 12/7/17 | 7,450 | 7,450 |
| Massachusetts Bay Transportation Authority | | | | |
| Sales Tax Revenue | 5.250% | 7/1/22 | 3,500 | 4,020 |
| Massachusetts Bay Transportation Authority | | | | |
| Sales Tax Revenue | 5.000% | 7/1/23 | 4,010 | 4,655 |
| Massachusetts Bay Transportation Authority | | | | |
| Sales Tax Revenue | 5.250% | 7/1/23 | 2,825 | 3,317 |
| Massachusetts Bay Transportation Authority | | | | |
| Sales Tax Revenue | 5.000% | 7/1/27 | 5,960 | 7,319 |
16
| | | | |
| Massachusetts Tax-Exempt Fund | | | | |
| |
| |
| |
| | | | Face | Market |
| | | Maturity | Amount | Value • |
| | Coupon | Date | ($000) | ($000) |
| Massachusetts Bay Transportation Authority | | | | |
| Sales Tax Revenue | 4.000% | 7/1/32 | 2,870 | 3,069 |
| Massachusetts Bay Transportation Authority | | | | |
| Sales Tax Revenue | 5.250% | 7/1/32 | 2,900 | 3,745 |
| Massachusetts Bay Transportation Authority | | | | |
| Sales Tax Revenue | 5.250% | 7/1/33 | 10,000 | 12,972 |
| Massachusetts Bay Transportation Authority | | | | |
| Sales Tax Revenue | 5.250% | 7/1/33 | 2,000 | 2,535 |
| Massachusetts Bay Transportation Authority | | | | |
| Sales Tax Revenue | 4.000% | 7/1/35 | 1,980 | 2,091 |
| Massachusetts Bay Transportation Authority | | | | |
| Sales Tax Revenue | 4.000% | 7/1/35 | 3,000 | 3,169 |
| Massachusetts Bay Transportation Authority | | | | |
| Sales Tax Revenue | 5.000% | 7/1/35 | 2,145 | 2,307 |
| Massachusetts Bay Transportation Authority | | | | |
| Sales Tax Revenue | 5.000% | 7/1/35 | 1,090 | 1,292 |
| Massachusetts Bay Transportation Authority | | | | |
| Sales Tax Revenue | 5.000% | 7/1/36 | 4,695 | 5,553 |
| Massachusetts Bay Transportation Authority | | | | |
| Sales Tax Revenue | 5.000% | 7/1/38 | 250 | 295 |
| Massachusetts Bay Transportation Authority | | | | |
| Sales Tax Revenue | 5.000% | 7/1/39 | 1,045 | 1,229 |
| Massachusetts Bay Transportation Authority | | | | |
| Sales Tax Revenue | 5.000% | 7/1/40 | 3,500 | 4,111 |
| Massachusetts Bay Transportation Authority | | | | |
| Sales Tax Revenue | 5.000% | 7/1/43 | 2,685 | 3,146 |
| Massachusetts Clean Energy Cooperative | | | | |
| Corp. Revenue (Municipal Lighting Plant) | 5.000% | 7/1/26 | 2,875 | 3,321 |
| Massachusetts Clean Energy Cooperative | | | | |
| Corp. Revenue (Municipal Lighting Plant) | 5.000% | 7/1/29 | 2,000 | 2,290 |
| Massachusetts Clean Energy Cooperative | | | | |
| Corp. Revenue (Municipal Lighting Plant) | 5.000% | 7/1/32 | 2,500 | 2,846 |
| Massachusetts Clean Water Trust Revenue | 5.000% | 2/1/28 | 3,000 | 3,493 |
| Massachusetts Clean Water Trust Revenue | 5.000% | 8/1/28 | 4,485 | 5,633 |
| Massachusetts Clean Water Trust Revenue | 5.000% | 8/1/29 | 3,545 | 4,494 |
| Massachusetts Clean Water Trust Revenue | 5.000% | 2/1/35 | 3,000 | 3,444 |
| Massachusetts Clean Water Trust Revenue | 5.000% | 2/1/45 | 2,085 | 2,368 |
| Massachusetts College Building Authority | | | | |
| Revenue | 5.000% | 5/1/25 | 1,100 | 1,241 |
| Massachusetts College Building Authority | | | | |
| Revenue | 5.000% | 5/1/26 | 1,455 | 1,678 |
| Massachusetts College Building Authority | | | | |
| Revenue | 5.000% | 5/1/27 | 1,200 | 1,381 |
| Massachusetts College Building Authority | | | | |
| Revenue | 4.000% | 5/1/29 | 2,015 | 2,225 |
| Massachusetts College Building Authority | | | | |
| Revenue | 5.000% | 5/1/29 | 1,500 | 1,612 |
| Massachusetts College Building Authority | | | | |
| Revenue | 5.000% | 5/1/30 | 1,090 | 1,217 |
| Massachusetts College Building Authority | | | | |
| Revenue | 5.000% | 5/1/30 | 1,610 | 1,730 |
| Massachusetts College Building Authority | | | | |
| Revenue | 5.000% | 5/1/31 | 2,000 | 2,325 |
17
| | | | |
| Massachusetts Tax-Exempt Fund | | | | |
| |
| |
| |
| | | | Face | Market |
| | | Maturity | Amount | Value • |
| | Coupon | Date | ($000) | ($000) |
| Massachusetts College Building Authority | | | | |
| Revenue | 5.000% | 5/1/36 | 4,025 | 4,457 |
| Massachusetts College Building Authority | | | | |
| Revenue | 5.000% | 5/1/39 | 3,000 | 3,443 |
| Massachusetts College Building Authority | | | | |
| Revenue | 5.000% | 5/1/41 | 5,000 | 5,521 |
| Massachusetts College Building Authority | | | | |
| Revenue | 5.000% | 5/1/43 | 3,285 | 3,610 |
| Massachusetts Department of Transportation | | | | |
| Metropolitan Highway System Revenue | 5.000% | 1/1/20 | 3,500 | 3,731 |
| Massachusetts Department of Transportation | | | | |
| Metropolitan Highway System Revenue | 5.000% | 1/1/32 | 5,620 | 5,972 |
| Massachusetts Department of Transportation | | | | |
| Metropolitan Highway System Revenue | 5.000% | 1/1/35 | 2,350 | 2,498 |
| Massachusetts Department of Transportation | | | | |
| Metropolitan Highway System Revenue | 5.000% | 1/1/37 | 3,000 | 3,172 |
| Massachusetts Department of Transportation | | | | |
| Metropolitan Highway System Revenue | | | | |
| VRDO | 0.940% | 12/7/17 LOC | 13,975 | 13,975 |
| Massachusetts Development Finance Agency | | | | |
| Hospital Revenue (Cape Cod Healthcare | | | | |
| Obligated Group) | 5.250% | 11/15/36 | 5,130 | 5,771 |
| Massachusetts Development Finance Agency | | | | |
| Hospital Revenue (Cape Cod Healthcare | | | | |
| Obligated Group) | 5.250% | 11/15/41 | 10 | 11 |
| Massachusetts Development Finance Agency | | | | |
| Revenue (Baystate Medical Obligated Group) | 5.000% | 7/1/34 | 1,500 | 1,681 |
| Massachusetts Development Finance Agency | | | | |
| Revenue (Baystate Medical Obligated Group) | 5.000% | 7/1/44 | 15 | 17 |
| Massachusetts Development Finance Agency | | | | |
| Revenue (Bentley University) | 5.000% | 7/1/40 | 5,750 | 6,590 |
| Massachusetts Development Finance Agency | | | | |
| Revenue (Berklee College of Music) | 5.000% | 10/1/28 | 60 | 72 |
| Massachusetts Development Finance Agency | | | | |
| Revenue (Berklee College of Music) | 5.000% | 10/1/29 | 10 | 12 |
| Massachusetts Development Finance Agency | | | | |
| Revenue (Berklee College of Music) | 5.000% | 10/1/31 | 1,760 | 2,082 |
| Massachusetts Development Finance Agency | | | | |
| Revenue (Berklee College of Music) | 5.250% | 10/1/41 | 3,450 | 3,831 |
| Massachusetts Development Finance Agency | | | | |
| Revenue (Berklee College of Music) | 5.000% | 10/1/46 | 1,500 | 1,727 |
| Massachusetts Development Finance Agency | | | | |
| Revenue (Berkshire Health System) | 5.000% | 10/1/22 | 2,000 | 2,221 |
| Massachusetts Development Finance Agency | | | | |
| Revenue (Berkshire Health System) | 5.000% | 10/1/28 | 1,250 | 1,380 |
| Massachusetts Development Finance Agency | | | | |
| Revenue (Berkshire Health System) | 5.000% | 10/1/29 | 1,500 | 1,655 |
| Massachusetts Development Finance Agency | | | | |
| Revenue (Berkshire Health System) | 5.000% | 10/1/30 | 1,430 | 1,577 |
| Massachusetts Development Finance Agency | | | | |
| Revenue (Berkshire Health System) | 5.000% | 10/1/31 | 1,250 | 1,379 |
| Massachusetts Development Finance Agency | | | | |
| Revenue (Boston College) | 5.000% | 7/1/19 | 540 | 569 |
18
| | | | |
| Massachusetts Tax-Exempt Fund | | | | |
| |
| |
| |
| | | | Face | Market |
| | | Maturity | Amount | Value • |
| | Coupon | Date | ($000) | ($000) |
| Massachusetts Development Finance Agency | | | | |
| Revenue (Boston College) | 5.000% | 7/1/38 | 2,950 | 3,451 |
| Massachusetts Development Finance Agency | | | | |
| Revenue (Boston College) | 5.000% | 7/1/40 | 2,000 | 2,143 |
| Massachusetts Development Finance Agency | | | | |
| Revenue (Boston College) | 5.000% | 7/1/42 | 2,000 | 2,334 |
| Massachusetts Development Finance Agency | | | | |
| Revenue (Boston Medical Center) | 5.000% | 7/1/22 (Prere.) | 2,995 | 3,424 |
| Massachusetts Development Finance Agency | | | | |
| Revenue (Boston Medical Center) | 5.000% | 7/1/22 (Prere.) | 470 | 537 |
| Massachusetts Development Finance Agency | | | | |
| Revenue (Boston Medical Center) | 5.250% | 7/1/24 | 1,610 | 1,812 |
| Massachusetts Development Finance Agency | | | | |
| Revenue (Boston Medical Center) | 5.250% | 7/1/26 | 1,175 | 1,311 |
| Massachusetts Development Finance Agency | | | | |
| Revenue (Boston Medical Center) | 5.000% | 7/1/29 | 2,535 | 2,766 |
| Massachusetts Development Finance Agency | | | | |
| Revenue (Boston Medical Center) | 5.000% | 7/1/29 | 3,100 | 3,551 |
| Massachusetts Development Finance Agency | | | | |
| Revenue (Boston Medical Center) | 5.000% | 7/1/30 | 2,450 | 2,794 |
| Massachusetts Development Finance Agency | | | | |
| Revenue (Boston Medical Center) | 5.000% | 7/1/31 | 4,245 | 4,821 |
| Massachusetts Development Finance Agency | | | | |
| Revenue (Boston Medical Center) | 5.000% | 7/1/32 | 3,000 | 3,390 |
| Massachusetts Development Finance Agency | | | | |
| Revenue (Boston Medical Center) | 5.000% | 7/1/34 | 4,510 | 5,053 |
| Massachusetts Development Finance Agency | | | | |
| Revenue (Boston Medical Center) | 5.000% | 7/1/35 | 1,050 | 1,172 |
| Massachusetts Development Finance Agency | | | | |
| Revenue (Boston Medical Center) | 5.000% | 7/1/37 | 1,000 | 1,111 |
| Massachusetts Development Finance Agency | | | | |
| Revenue (Boston Medical Center) | 5.000% | 7/1/44 | 7,000 | 7,698 |
| Massachusetts Development Finance Agency | | | | |
| Revenue (Boston University) | 6.000% | 5/15/29 (2) | 1,400 | 1,735 |
| Massachusetts Development Finance Agency | | | | |
| Revenue (Boston University) | 5.375% | 5/15/39 | 1,575 | 1,972 |
| Massachusetts Development Finance Agency | | | | |
| Revenue (Boston University) | 4.000% | 10/1/46 | 3,000 | 3,125 |
| Massachusetts Development Finance Agency | | | | |
| Revenue (Boston University) | 5.000% | 10/1/46 | 3,015 | 3,472 |
| Massachusetts Development Finance Agency | | | | |
| Revenue (Boston University) | 5.000% | 10/1/48 | 5,000 | 5,679 |
| Massachusetts Development Finance Agency | | | | |
| Revenue (Boston University) | 6.000% | 5/15/59 (10) | 6,075 | 7,728 |
| Massachusetts Development Finance Agency | | | | |
| Revenue (Broad Institute Inc.) | 5.250% | 4/1/21 (Prere.) | 4,095 | 4,567 |
| Massachusetts Development Finance Agency | | | | |
| Revenue (Broad Institute Inc.) | 4.000% | 4/1/41 | 5,000 | 5,296 |
| Massachusetts Development Finance Agency | | | | |
| Revenue (CareGroup Inc.) | 5.000% | 7/1/28 | 3,030 | 3,573 |
| Massachusetts Development Finance Agency | | | | |
| Revenue (CareGroup Inc.) | 5.000% | 7/1/32 | 1,000 | 1,140 |
| Massachusetts Development Finance Agency | | | | |
| Revenue (CareGroup Inc.) | 5.000% | 7/1/33 | 1,000 | 1,135 |
19
| | | | |
| Massachusetts Tax-Exempt Fund | | | | |
| |
| |
| |
| | | | Face | Market |
| | | Maturity | Amount | Value • |
| | Coupon | Date | ($000) | ($000) |
| Massachusetts Development Finance Agency | | | | |
| Revenue (CareGroup Inc.) | 5.000% | 7/1/37 | 1,000 | 1,132 |
| Massachusetts Development Finance Agency | | | | |
| Revenue (CareGroup Inc.) | 5.000% | 7/1/38 | 1,000 | 1,128 |
| Massachusetts Development Finance Agency | | | | |
| Revenue (Carleton-Willard Village) | 5.250% | 12/1/25 | 600 | 635 |
| Massachusetts Development Finance Agency | | | | |
| Revenue (Carleton-Willard Village) | 5.625% | 12/1/30 | 550 | 584 |
| Massachusetts Development Finance Agency | | | | |
| Revenue (Children’s Hospital) | 5.000% | 10/1/34 | 2,440 | 2,818 |
| Massachusetts Development Finance Agency | | | | |
| Revenue (Children’s Hospital) | 5.000% | 10/1/46 | 4,000 | 4,563 |
| Massachusetts Development Finance Agency | | | | |
| Revenue (Commonwealth Contract | | | | |
| Assistance) | 5.500% | 2/1/20 (Prere.) | 2,185 | 2,367 |
| Massachusetts Development Finance Agency | | | | |
| Revenue (Commonwealth Contract | | | | |
| Assistance) | 5.000% | 5/1/35 | 5,210 | 5,961 |
| Massachusetts Development Finance Agency | | | | |
| Revenue (Dana-Farber Cancer Institute) | 5.000% | 12/1/30 | 2,115 | 2,484 |
| Massachusetts Development Finance Agency | | | | |
| Revenue (Dana-Farber Cancer Institute) | 5.000% | 12/1/41 | 11,125 | 12,709 |
| Massachusetts Development Finance Agency | | | | |
| Revenue (Dana-Farber Cancer Institute) | 5.000% | 12/1/46 | 4,000 | 4,559 |
| Massachusetts Development Finance Agency | | | | |
| Revenue (Deerfield Academy) | 5.000% | 10/1/40 | 4,665 | 5,058 |
| Massachusetts Development Finance Agency | | | | |
| Revenue (Emerson College) | 5.000% | 1/1/20 (Prere.) | 5,460 | 5,843 |
| Massachusetts Development Finance Agency | | | | |
| Revenue (Emerson College) | 5.000% | 1/1/28 | 1,825 | 2,095 |
| Massachusetts Development Finance Agency | | | | |
| Revenue (Emerson College) | 5.000% | 1/1/32 | 1,500 | 1,753 |
| Massachusetts Development Finance Agency | | | | |
| Revenue (Emerson College) | 5.000% | 1/1/33 | 1,500 | 1,746 |
| Massachusetts Development Finance Agency | | | | |
| Revenue (Emerson College) | 5.000% | 1/1/35 | 3,000 | 3,362 |
| Massachusetts Development Finance Agency | | | | |
| Revenue (Emerson College) | 5.000% | 1/1/35 | 1,000 | 1,156 |
| Massachusetts Development Finance Agency | | | | |
| Revenue (Emerson College) | 5.000% | 1/1/36 | 1,670 | 1,925 |
| Massachusetts Development Finance Agency | | | | |
| Revenue (Emerson College) | 5.000% | 1/1/40 | 540 | 561 |
| Massachusetts Development Finance Agency | | | | |
| Revenue (Emerson College) | 5.000% | 1/1/40 | 3,125 | 3,580 |
| Massachusetts Development Finance Agency | | | | |
| Revenue (Emerson College) | 5.000% | 1/1/41 | 5,960 | 6,638 |
| Massachusetts Development Finance Agency | | | | |
| Revenue (Emerson College) | 5.250% | 1/1/42 | 1,700 | 1,955 |
| Massachusetts Development Finance Agency | | | | |
| Revenue (Emerson College) | 5.000% | 1/1/47 | 4,330 | 4,878 |
| Massachusetts Development Finance Agency | | | | |
| Revenue (Emmanuel College) | 5.000% | 10/1/30 | 750 | 867 |
| Massachusetts Development Finance Agency | | | | |
| Revenue (Emmanuel College) | 5.000% | 10/1/43 | 5,205 | 5,852 |
20
| | | | |
| Massachusetts Tax-Exempt Fund | | | | |
| |
| |
| |
| | | | Face | Market |
| | | Maturity | Amount | Value • |
| | Coupon | Date | ($000) | ($000) |
| Massachusetts Development Finance Agency | | | | |
| Revenue (Emmanuel College) | 4.000% | 10/1/46 | 7,065 | 7,138 |
| Massachusetts Development Finance Agency | | | | |
| Revenue (Harvard University) | 5.000% | 10/15/20 (Prere.) | 9,790 | 10,718 |
| Massachusetts Development Finance Agency | | | | |
| Revenue (Harvard University) | 5.000% | 10/15/20 (Prere.) | 740 | 810 |
| Massachusetts Development Finance Agency | | | | |
| Revenue (Harvard University) | 5.000% | 10/15/20 (Prere.) | 260 | 285 |
| Massachusetts Development Finance Agency | | | | |
| Revenue (Harvard University) | 5.250% | 2/1/21 (Prere.) | 11,000 | 12,210 |
| Massachusetts Development Finance Agency | | | | |
| Revenue (Harvard University) | 5.000% | 7/15/27 | 1,770 | 2,165 |
| Massachusetts Development Finance Agency | | | | |
| Revenue (Harvard University) | 4.000% | 7/15/29 | 685 | 774 |
| Massachusetts Development Finance Agency | | | | |
| Revenue (Harvard University) | 5.000% | 7/15/33 | 5,405 | 6,451 |
| Massachusetts Development Finance Agency | | | | |
| Revenue (Harvard University) | 5.000% | 7/15/34 | 5,000 | 5,946 |
| Massachusetts Development Finance Agency | | | | |
| Revenue (Harvard University) | 4.000% | 7/15/36 | 3,500 | 3,783 |
| Massachusetts Development Finance Agency | | | | |
| Revenue (Harvard University) | 5.000% | 7/15/36 | 9,460 | 12,366 |
| Massachusetts Development Finance Agency | | | | |
| Revenue (Harvard University) | 5.000% | 7/15/40 | 9,250 | 12,113 |
| Massachusetts Development Finance Agency | | | | |
| Revenue (Lahey Clinic Obligated Group) | 5.000% | 8/15/28 | 800 | 875 |
| Massachusetts Development Finance Agency | | | | |
| Revenue (Lahey Clinic Obligated Group) | 5.000% | 8/15/31 | 10 | 11 |
| Massachusetts Development Finance Agency | | | | |
| Revenue (Lahey Clinic Obligated Group) | 5.000% | 8/15/32 | 50 | 57 |
| Massachusetts Development Finance Agency | | | | |
| Revenue (Lahey Clinic Obligated Group) | 5.000% | 8/15/40 | 1,750 | 1,964 |
| Massachusetts Development Finance Agency | | | | |
| Revenue (Lahey Clinic Obligated Group) | 5.000% | 8/15/45 | 9,000 | 10,060 |
| Massachusetts Development Finance Agency | | | | |
| Revenue (Lawrence General Hospital | | | | |
| Obligated Group) | 5.000% | 7/1/32 | 605 | 663 |
| Massachusetts Development Finance Agency | | | | |
| Revenue (Lawrence General Hospital | | | | |
| Obligated Group) | 5.000% | 7/1/47 | 2,500 | 2,677 |
| Massachusetts Development Finance Agency | | | | |
| Revenue (Loomis Obligated Group) | 6.000% | 1/1/33 | 4,405 | 5,047 |
| Massachusetts Development Finance Agency | | | | |
| Revenue (Lowell General Hospital) | 5.000% | 7/1/37 | 4,800 | 5,159 |
| Massachusetts Development Finance Agency | | | | |
| Revenue (Lowell General Hospital) | 5.000% | 7/1/44 | 6,010 | 6,431 |
| Massachusetts Development Finance Agency | | | | |
| Revenue (Massachusetts College of | | | | |
| Pharmacy & Allied Health Sciences) | 5.000% | 7/1/19 | 175 | 184 |
| Massachusetts Development Finance Agency | | | | |
| Revenue (Massachusetts College of | | | | |
| Pharmacy & Allied Health Sciences) | 5.000% | 7/1/21 | 300 | 333 |
21
| | | | |
| Massachusetts Tax-Exempt Fund | | | | |
| |
| |
| |
| | | | Face | Market |
| | | Maturity | Amount | Value • |
| | Coupon | Date | ($000) | ($000) |
| Massachusetts Development Finance Agency | | | | |
| Revenue (Massachusetts College of | | | | |
| Pharmacy & Allied Health Sciences) | 5.000% | 7/1/23 | 250 | 288 |
| Massachusetts Development Finance Agency | | | | |
| Revenue (Massachusetts College of | | | | |
| Pharmacy & Allied Health Sciences) | 5.000% | 7/1/26 | 1,380 | 1,567 |
| Massachusetts Development Finance Agency | | | | |
| Revenue (MCPHS University) | 5.000% | 7/1/31 | 400 | 465 |
| Massachusetts Development Finance Agency | | | | |
| Revenue (MCPHS University) | 5.000% | 7/1/32 | 300 | 347 |
| Massachusetts Development Finance Agency | | | | |
| Revenue (MCPHS University) | 5.000% | 7/1/37 | 450 | 515 |
| Massachusetts Development Finance Agency | | | | |
| Revenue (Merrimack College) | 5.000% | 7/1/32 | 2,000 | 2,173 |
| Massachusetts Development Finance Agency | | | | |
| Revenue (Merrimack College) | 5.000% | 7/1/37 | 300 | 331 |
| Massachusetts Development Finance Agency | | | | |
| Revenue (Merrimack College) | 5.000% | 7/1/42 | 500 | 549 |
| Massachusetts Development Finance Agency | | | | |
| Revenue (Merrimack College) | 5.250% | 7/1/42 | 1,920 | 2,077 |
| Massachusetts Development Finance Agency | | | | |
| Revenue (Merrimack College) | 5.125% | 7/1/44 | 1,500 | 1,646 |
| Massachusetts Development Finance Agency | | | | |
| Revenue (Merrimack College) | 5.000% | 7/1/47 | 8,700 | 9,531 |
| Massachusetts Development Finance Agency | | | | |
| Revenue (Milford Regional Medical Center) | 5.625% | 7/15/36 | 1,000 | 1,107 |
| Massachusetts Development Finance Agency | | | | |
| Revenue (Milford Regional Medical Center) | 5.750% | 7/15/43 | 5,755 | 6,406 |
| Massachusetts Development Finance Agency | | | | |
| Revenue (Northeastern University) | 5.000% | 10/1/29 | 3,250 | 3,617 |
| Massachusetts Development Finance Agency | | | | |
| Revenue (Northeastern University) | 5.000% | 10/1/30 | 1,750 | 1,944 |
| Massachusetts Development Finance Agency | | | | |
| Revenue (Northeastern University) | 5.000% | 3/1/32 | 950 | 1,100 |
| Massachusetts Development Finance Agency | | | | |
| Revenue (Northeastern University) | 5.250% | 3/1/37 | 20 | 23 |
| Massachusetts Development Finance Agency | | | | |
| Revenue (Northeastern University) | 5.000% | 3/1/39 | 3,600 | 4,117 |
| Massachusetts Development Finance Agency | | | | |
| Revenue (Olin College) | 5.000% | 11/1/38 | 6,000 | 6,858 |
| Massachusetts Development Finance Agency | | | | |
| Revenue (Partners Healthcare) | 5.000% | 7/1/28 | 2,000 | 2,305 |
| Massachusetts Development Finance Agency | | | | |
| Revenue (Partners Healthcare) | 5.000% | 7/1/29 | 6,000 | 7,074 |
| Massachusetts Development Finance Agency | | | | |
| Revenue (Partners Healthcare) | 5.000% | 7/1/30 | 1,500 | 1,727 |
| Massachusetts Development Finance Agency | | | | |
| Revenue (Partners Healthcare) | 5.000% | 7/1/31 | 5,705 | 6,318 |
| Massachusetts Development Finance Agency | | | | |
| Revenue (Partners Healthcare) | 4.000% | 7/1/32 | 8,000 | 8,502 |
| Massachusetts Development Finance Agency | | | | |
| Revenue (Partners Healthcare) | 5.000% | 7/1/36 | 4,000 | 4,399 |
| Massachusetts Development Finance Agency | | | | |
| Revenue (Partners Healthcare) | 5.000% | 7/1/40 | 3,000 | 3,378 |
22
| | | | |
| Massachusetts Tax-Exempt Fund | | | | |
| |
| |
| |
| | | | Face | Market |
| | | Maturity | Amount | Value • |
| | Coupon | Date | ($000) | ($000) |
| Massachusetts Development Finance Agency | | | | |
| Revenue (Partners Healthcare) | 5.375% | 7/1/41 | 4,000 | 4,330 |
| Massachusetts Development Finance Agency | | | | |
| Revenue (Partners Healthcare) | 5.000% | 7/1/45 | 3,775 | 4,240 |
| Massachusetts Development Finance Agency | | | | |
| Revenue (Phillips Academy) | 5.000% | 9/1/38 | 1,545 | 1,777 |
| Massachusetts Development Finance Agency | | | | |
| Revenue (Phillips Academy) | 5.000% | 9/1/43 | 8,295 | 9,474 |
| Massachusetts Development Finance Agency | | | | |
| Revenue (Seven Hills Foundation Obligated | | | | |
| Group) | 5.000% | 9/1/32 | 500 | 544 |
| Massachusetts Development Finance Agency | | | | |
| Revenue (Seven Hills Foundation Obligated | | | | |
| Group) | 5.000% | 9/1/35 | 1,500 | 1,615 |
| Massachusetts Development Finance Agency | | | | |
| Revenue (Simmons College) | 5.500% | 10/1/28 | 1,000 | 1,162 |
| Massachusetts Development Finance Agency | | | | |
| Revenue (Simmons College) | 5.000% | 10/1/29 | 1,820 | 2,105 |
| Massachusetts Development Finance Agency | | | | |
| Revenue (Simmons College) | 5.125% | 10/1/33 | 2,000 | 2,283 |
| Massachusetts Development Finance Agency | | | | |
| Revenue (Simmons College) | 5.000% | 10/1/36 | 2,250 | 2,584 |
| Massachusetts Development Finance Agency | | | | |
| Revenue (Simmons College) | 5.250% | 10/1/39 | 3,000 | 3,389 |
| Massachusetts Development Finance Agency | | | | |
| Revenue (Simmons College) | 4.000% | 7/1/46 | 4,500 | 4,776 |
| Massachusetts Development Finance Agency | | | | |
| Revenue (South Shore Hospital Inc.) | 5.000% | 7/1/28 | 850 | 987 |
| Massachusetts Development Finance Agency | | | | |
| Revenue (South Shore Hospital Inc.) | 4.000% | 7/1/36 | 4,495 | 4,557 |
| Massachusetts Development Finance Agency | | | | |
| Revenue (South Shore Hospital Inc.) | 5.000% | 7/1/41 | 3,000 | 3,312 |
| Massachusetts Development Finance Agency | | | | |
| Revenue (Southcoast Health System | | | | |
| Obligated Group) | 5.000% | 7/1/27 | 1,550 | 1,744 |
| Massachusetts Development Finance Agency | | | | |
| Revenue (Sterling & Francine Clark Art | | | | |
| Institute) | 5.000% | 7/1/34 | 1,000 | 1,163 |
| Massachusetts Development Finance Agency | | | | |
| Revenue (Sterling & Francine Clark Art | | | | |
| Institute) | 5.000% | 7/1/35 | 2,000 | 2,319 |
| Massachusetts Development Finance Agency | | | | |
| Revenue (Sterling & Francine Clark Art | | | | |
| Institute) | 4.000% | 7/1/41 | 6,130 | 6,469 |
| Massachusetts Development Finance Agency | | | | |
| Revenue (Suffolk University) | 5.000% | 7/1/30 | 3,000 | 3,241 |
| Massachusetts Development Finance Agency | | | | |
| Revenue (Suffolk University) | 5.000% | 7/1/33 | 1,500 | 1,724 |
| Massachusetts Development Finance Agency | | | | |
| Revenue (Suffolk University) | 5.000% | 7/1/35 | 1,000 | 1,145 |
| Massachusetts Development Finance Agency | | | | |
| Revenue (Suffolk University) | 5.000% | 7/1/36 | 1,000 | 1,145 |
| Massachusetts Development Finance Agency | | | | |
| Revenue (Suffolk University) | 4.000% | 7/1/39 | 6,975 | 7,125 |
23
| | | | |
| Massachusetts Tax-Exempt Fund | | | | |
| |
| |
| |
| | | | Face | Market |
| | | Maturity | Amount | Value • |
| | Coupon | Date | ($000) | ($000) |
| Massachusetts Development Finance Agency | | | | |
| Revenue (Suffolk University) | 5.750% | 7/1/39 | 710 | 754 |
| Massachusetts Development Finance Agency | | | | |
| Revenue (Suffolk University) | 5.125% | 7/1/40 | 3,000 | 3,229 |
| Massachusetts Development Finance Agency | | | | |
| Revenue (Tufts Medical Center) | 6.250% | 1/1/21 (Prere.) | 2,125 | 2,413 |
| Massachusetts Development Finance Agency | | | | |
| Revenue (Tufts Medical Center) | 6.750% | 1/1/21 (Prere.) | 510 | 587 |
| Massachusetts Development Finance Agency | | | | |
| Revenue (Tufts Medical Center) | 6.875% | 1/1/21 (Prere.) | 1,195 | 1,379 |
| Massachusetts Development Finance Agency | | | | |
| Revenue (Tufts Medical Center) | 7.250% | 1/1/21 (Prere.) | 2,700 | 3,147 |
| Massachusetts Development Finance Agency | | | | |
| Revenue (Tufts Medical Center) | 6.250% | 1/1/27 | 1,420 | 1,596 |
| Massachusetts Development Finance Agency | | | | |
| Revenue (Tufts Medical Center) | 7.250% | 1/1/32 | 1,800 | 2,077 |
| Massachusetts Development Finance Agency | | | | |
| Revenue (Tufts Medical Center) | 6.750% | 1/1/36 | 340 | 387 |
| Massachusetts Development Finance Agency | | | | |
| Revenue (Tufts Medical Center) | 6.875% | 1/1/41 | 805 | 920 |
| Massachusetts Development Finance Agency | | | | |
| Revenue (Tufts University) | 5.000% | 8/15/38 | 1,015 | 1,170 |
| Massachusetts Development Finance Agency | | | | |
| Revenue (UMass Memorial Health Care | | | | |
| Obligated Group) | 5.000% | 7/1/29 | 25 | 29 |
| Massachusetts Development Finance Agency | | | | |
| Revenue (UMass Memorial Health Care | | | | |
| Obligated Group) | 5.000% | 7/1/31 | 1,000 | 1,137 |
| Massachusetts Development Finance Agency | | | | |
| Revenue (UMass Memorial Health Care | | | | |
| Obligated Group) | 5.000% | 7/1/32 | 1,200 | 1,360 |
| Massachusetts Development Finance Agency | | | | |
| Revenue (UMass Memorial Health Care | | | | |
| Obligated Group) | 5.000% | 7/1/38 | 3,000 | 3,328 |
| Massachusetts Development Finance Agency | | | | |
| Revenue (UMass Memorial Medical Center) | 5.000% | 7/1/20 | 200 | 214 |
| Massachusetts Development Finance Agency | | | | |
| Revenue (UMass Memorial Medical Center) | 5.125% | 7/1/26 | 2,750 | 2,993 |
| Massachusetts Development Finance Agency | | | | |
| Revenue (UMass Memorial Medical Center) | 5.000% | 7/1/31 | 1,000 | 1,138 |
| Massachusetts Development Finance Agency | | | | |
| Revenue (UMass Memorial Medical Center) | 5.500% | 7/1/31 | 5,500 | 6,041 |
| Massachusetts Development Finance Agency | | | | |
| Revenue (UMass Memorial Medical Center) | 5.000% | 7/1/41 | 700 | 773 |
| Massachusetts Development Finance Agency | | | | |
| Revenue (UMass Memorial Medical Center) | 5.000% | 7/1/46 | 1,355 | 1,492 |
| Massachusetts Development Finance Agency | | | | |
| Revenue (Wellesley College) | 5.000% | 7/1/42 | 2,000 | 2,270 |
| Massachusetts Development Finance Agency | | | | |
| Revenue (Wentworth Institute of | | | | |
| Technology Inc.) | 5.000% | 10/1/46 | 4,250 | 4,727 |
| Massachusetts Development Finance Agency | | | | |
| Revenue (Western New England University) | 5.000% | 9/1/45 | 2,825 | 3,101 |
24
| | | | |
| Massachusetts Tax-Exempt Fund | | | | |
| |
| |
| |
| | | | Face | Market |
| | | Maturity | Amount | Value • |
| | Coupon | Date | ($000) | ($000) |
| Massachusetts Development Finance Agency | | | | |
| Revenue (WGBH Educational Foundation) | 0.000% | 1/1/32 (12) | 1,620 | 978 |
| Massachusetts Development Finance Agency | | | | |
| Revenue (WGBH Educational Foundation) | 0.000% | 1/1/33 (12) | 3,290 | 1,899 |
| Massachusetts Development Finance Agency | | | | |
| Revenue (WGBH Educational Foundation) | 5.000% | 1/1/35 | 1,720 | 1,981 |
| Massachusetts Development Finance Agency | | | | |
| Revenue (WGBH Educational Foundation) | 5.000% | 1/1/36 | 1,000 | 1,149 |
| Massachusetts Development Finance Agency | | | | |
| Revenue (WGBH Educational Foundation) | 5.000% | 1/1/36 (12) | 2,650 | 2,657 |
| Massachusetts Development Finance Agency | | | | |
| Revenue (Williams College) | 5.000% | 7/1/29 | 1,025 | 1,256 |
| Massachusetts Development Finance Agency | | | | |
| Revenue (Williams College) | 5.000% | 7/1/30 | 1,000 | 1,218 |
| Massachusetts Development Finance Agency | | | | |
| Revenue (Williams College) | 5.000% | 7/1/33 | 5,600 | 6,622 |
| Massachusetts Development Finance Agency | | | | |
| Revenue (Williams College) | 5.000% | 7/1/34 | 2,390 | 2,816 |
| Massachusetts Development Finance Agency | | | | |
| Revenue (Williams College) | 5.000% | 7/1/38 | 4,000 | 4,560 |
| Massachusetts Development Finance Agency | | | | |
| Revenue (Worcester Polytech Institute) | 3.000% | 9/1/18 | 150 | 152 |
| Massachusetts Development Finance Agency | | | | |
| Revenue (Worcester Polytech Institute) | 4.000% | 9/1/19 | 140 | 145 |
| Massachusetts Development Finance Agency | | | | |
| Revenue (Worcester Polytech Institute) | 4.000% | 9/1/20 | 145 | 154 |
| Massachusetts Development Finance Agency | | | | |
| Revenue (Worcester Polytech Institute) | 5.000% | 9/1/21 | 160 | 179 |
| Massachusetts Development Finance Agency | | | | |
| Revenue (Worcester Polytech Institute) | 5.000% | 9/1/22 | 160 | 183 |
| Massachusetts Development Finance Agency | | | | |
| Revenue (Worcester Polytech Institute) | 5.000% | 9/1/23 | 130 | 151 |
| Massachusetts Development Finance Agency | | | | |
| Revenue (Worcester Polytech Institute) | 5.000% | 9/1/28 | 365 | 441 |
| Massachusetts Development Finance Agency | | | | |
| Revenue (Worcester Polytech Institute) | 5.000% | 9/1/29 | 100 | 120 |
| Massachusetts Development Finance Agency | | | | |
| Revenue (Worcester Polytech Institute) | 5.000% | 9/1/30 | 120 | 143 |
| Massachusetts Development Finance Agency | | | | |
| Revenue (Worcester Polytech Institute) | 5.000% | 9/1/31 | 130 | 154 |
| Massachusetts Development Finance Agency | | | | |
| Revenue (Worcester Polytech Institute) | 5.000% | 9/1/32 | 100 | 118 |
| Massachusetts Development Finance Agency | | | | |
| Revenue (Worcester Polytech Institute) | 5.000% | 9/1/35 | 100 | 117 |
| Massachusetts Development Finance Agency | | | | |
| Revenue (Worcester Polytech Institute) | 5.000% | 9/1/36 | 295 | 344 |
| Massachusetts Development Finance Agency | | | | |
| Revenue (Worcester Polytech Institute) | 5.000% | 9/1/37 | 145 | 169 |
| Massachusetts Development Finance Agency | | | | |
| Revenue (Worcester Polytech Institute) | 5.000% | 9/1/42 | 550 | 636 |
| Massachusetts Development Finance Agency | | | | |
| Revenue (Worcester Polytech Institute) | 5.000% | 9/1/47 | 700 | 806 |
| Massachusetts Development Finance Agency | | | | |
| Revenue (Worcester Polytechnic Institute) | 5.000% | 9/1/50 | 2,650 | 2,913 |
25
| | | | |
| Massachusetts Tax-Exempt Fund | | | | |
| |
| |
| |
| | | | Face | Market |
| | | Maturity | Amount | Value • |
| | Coupon | Date | ($000) | ($000) |
| Massachusetts Development Finance Agency | | | | |
| Revenue (Worcester Polytechnic Institute) | 5.000% | 9/1/52 | 10,095 | 11,462 |
| Massachusetts Development Finance Agency | | | | |
| Special Obligation Revenue | 5.000% | 5/1/34 | 1,295 | 1,449 |
| Massachusetts Development Finance Agency | | | | |
| Special Obligation Revenue | 5.000% | 5/1/39 | 6,470 | 7,193 |
| Massachusetts Development Finance Agency | | | | |
| Special Obligation Revenue | 5.000% | 5/1/39 | 1,000 | 1,112 |
| Massachusetts Federal Highway GAN | | | | |
| (Accelerated Bridge Program) | 5.000% | 6/15/22 (Prere.) | 3,025 | 3,456 |
| Massachusetts Federal Highway Revenue | 5.000% | 6/15/27 | 6,000 | 7,085 |
| Massachusetts GO | 5.000% | 7/1/19 (Prere.) | 780 | 821 |
| Massachusetts GO | 5.500% | 10/1/19 (12) | 1,000 | 1,069 |
| Massachusetts GO | 5.500% | 10/1/19 (2) | 2,025 | 2,165 |
| Massachusetts GO | 5.000% | 4/1/20 | 2,550 | 2,743 |
| Massachusetts GO | 5.250% | 8/1/20 | 4,740 | 5,178 |
| Massachusetts GO | 5.000% | 8/1/21 (Prere.) | 6,500 | 7,255 |
| Massachusetts GO | 5.000% | 8/1/21 (Prere.) | 2,000 | 2,236 |
| Massachusetts GO | 5.000% | 7/1/22 (Prere.) | 9,010 | 10,301 |
| Massachusetts GO | 5.000% | 8/1/23 | 1,000 | 1,164 |
| Massachusetts GO | 5.000% | 7/1/28 | 4,000 | 4,962 |
| Massachusetts GO | 5.000% | 7/1/28 | 10,740 | 12,994 |
| Massachusetts GO | 5.000% | 7/1/28 | 2,630 | 3,262 |
| Massachusetts GO | 5.000% | 7/1/30 | 560 | 670 |
| Massachusetts GO | 5.500% | 8/1/30 (2) | 7,000 | 9,107 |
| Massachusetts GO | 5.000% | 7/1/32 | 3,460 | 4,109 |
| Massachusetts GO | 4.000% | 8/1/32 | 5,000 | 5,268 |
| Massachusetts GO | 4.000% | 12/1/32 | 3,400 | 3,594 |
| Massachusetts GO | 5.000% | 7/1/33 | 5,215 | 6,171 |
| Massachusetts GO | 4.500% | 7/1/34 | 11,170 | 12,409 |
| Massachusetts GO | 5.000% | 7/1/34 | 5,000 | 5,896 |
| Massachusetts GO | 5.000% | 12/1/34 | 13,015 | 15,448 |
| Massachusetts GO | 4.000% | 4/1/35 | 5,010 | 5,320 |
| Massachusetts GO | 4.000% | 5/1/35 | 5,000 | 5,284 |
| Massachusetts GO | 5.000% | 7/1/35 | 4,095 | 4,810 |
| Massachusetts GO | 5.000% | 7/1/35 | 5,000 | 5,879 |
| Massachusetts GO | 5.000% | 8/1/36 | 9,100 | 10,099 |
| Massachusetts GO | 5.000% | 12/1/36 | 3,000 | 3,548 |
| Massachusetts GO | 5.000% | 7/1/37 | 500 | 585 |
| Massachusetts GO | 5.000% | 8/1/37 | 5,000 | 5,527 |
| Massachusetts GO | 5.000% | 11/1/37 | 8,050 | 9,573 |
| Massachusetts GO | 4.000% | 4/1/38 | 4,000 | 4,226 |
| Massachusetts GO | 5.000% | 7/1/38 | 5,000 | 5,854 |
| Massachusetts GO | 5.000% | 12/1/38 | 2,510 | 2,957 |
| Massachusetts GO | 4.000% | 12/1/39 | 500 | 531 |
| Massachusetts GO | 4.250% | 12/1/39 | 5,000 | 5,321 |
| Massachusetts GO | 5.000% | 7/1/40 | 8,000 | 9,318 |
| Massachusetts GO | 5.000% | 3/1/41 | 8,000 | 9,060 |
| Massachusetts GO | 4.000% | 9/1/41 | 3,000 | 3,170 |
| Massachusetts GO | 5.250% | 4/1/42 | 3,000 | 3,616 |
| Massachusetts GO | 4.000% | 9/1/42 | 6,900 | 7,296 |
| Massachusetts GO | 4.000% | 2/1/43 | 6,250 | 6,593 |
| Massachusetts GO | 4.000% | 6/1/43 | 7,820 | 8,059 |
| Massachusetts GO | 4.500% | 8/1/43 | 3,705 | 3,987 |
26
| | | | |
| Massachusetts Tax-Exempt Fund | | | | |
| |
| |
| |
| | | | Face | Market |
| | | Maturity | Amount | Value • |
| | Coupon | Date | ($000) | ($000) |
| Massachusetts GO | 4.500% | 12/1/43 | 3,745 | 4,055 |
| Massachusetts GO | 4.000% | 2/1/44 | 6,140 | 6,472 |
| Massachusetts GO | 4.000% | 12/1/44 | 8,350 | 8,822 |
| Massachusetts GO | 4.000% | 5/1/45 | 10,000 | 10,429 |
| Massachusetts GO | 5.000% | 7/1/45 | 2,000 | 2,318 |
| Massachusetts GO | 4.000% | 12/1/45 | 8,505 | 8,978 |
| Massachusetts GO | 4.000% | 2/1/46 | 5,000 | 5,287 |
| Massachusetts GO | 5.000% | 4/1/47 | 14,950 | 17,472 |
| Massachusetts GO | 5.250% | 4/1/47 | 7,000 | 8,405 |
| Massachusetts GO VRDO | 0.850% | 12/1/17 | 17,500 | 17,500 |
| Massachusetts GO VRDO | 0.990% | 12/7/17 | 1,700 | 1,700 |
| Massachusetts Health & Educational Facilities | | | | |
| Authority Revenue (Baystate Medical Center) | 5.500% | 7/1/28 | 75 | 80 |
| Massachusetts Health & Educational Facilities | | | | |
| Authority Revenue (Baystate Medical Center) | 5.750% | 7/1/36 | 280 | 299 |
| Massachusetts Health & Educational Facilities | | | | |
| Authority Revenue (Baystate Medical Center) | | | | |
| VRDO | 0.920% | 12/1/17 LOC | 1,200 | 1,200 |
| Massachusetts Health & Educational Facilities | | | | |
| Authority Revenue (Baystate Medical Center) | | | | |
| VRDO | 0.930% | 12/1/17 LOC | 10,190 | 10,190 |
| Massachusetts Health & Educational Facilities | | | | |
| Authority Revenue (Berklee College of Music, | | | | |
| Inc.) | 5.000% | 10/1/26 | 120 | 120 |
| Massachusetts Health & Educational Facilities | | | | |
| Authority Revenue (Boston Medical Center) | 5.000% | 7/1/18 (Prere.) | 2,575 | 2,628 |
| Massachusetts Health & Educational Facilities | | | | |
| Authority Revenue (Boston Medical Center) | 5.000% | 7/1/18 (Prere.) | 315 | 322 |
| Massachusetts Health & Educational Facilities | | | | |
| Authority Revenue (CareGroup) | 5.000% | 7/1/18 (Prere.) | 2,000 | 2,042 |
| Massachusetts Health & Educational Facilities | | | | |
| Authority Revenue (CareGroup) | 5.125% | 7/1/18 (Prere.) | 3,500 | 3,576 |
| Massachusetts Health & Educational Facilities | | | | |
| Authority Revenue (CareGroup) | 5.125% | 7/1/18 (Prere.) | 3,015 | 3,081 |
| Massachusetts Health & Educational Facilities | | | | |
| Authority Revenue (Children’s Hospital) | 5.500% | 12/1/39 | 4,000 | 4,312 |
| Massachusetts Health & Educational Facilities | | | | |
| Authority Revenue (Dana-Farber Cancer | | | | |
| Institute) | 5.000% | 12/1/37 | 5,000 | 5,181 |
| Massachusetts Health & Educational Facilities | | | | |
| Authority Revenue (Harvard University) | 5.000% | 12/15/19 (Prere.) | 925 | 989 |
| Massachusetts Health & Educational Facilities | | | | |
| Authority Revenue (Harvard University) | 5.000% | 12/15/19 (Prere.) | 810 | 866 |
| Massachusetts Health & Educational Facilities | | | | |
| Authority Revenue (Harvard University) | 6.250% | 4/1/20 | 3,110 | 3,437 |
| Massachusetts Health & Educational Facilities | | | | |
| Authority Revenue (Isabella Stewart Gardner | | | | |
| Museum) | 5.000% | 5/1/19 (Prere.) | 2,080 | 2,179 |
| Massachusetts Health & Educational Facilities | | | | |
| Authority Revenue (Isabella Stewart Gardner | | | | |
| Museum) | 5.000% | 5/1/19 (Prere.) | 1,650 | 1,728 |
| Massachusetts Health & Educational Facilities | | | | |
| Authority Revenue (Lowell General Hospital) | 5.125% | 7/1/35 | 40 | 43 |
27
| | | | |
| Massachusetts Tax-Exempt Fund | | | | |
| |
| |
| |
| | | | Face | Market |
| | | Maturity | Amount | Value • |
| | Coupon | Date | ($000) | ($000) |
| Massachusetts Health & Educational Facilities | | | | |
| Authority Revenue (MIT) | 5.250% | 7/1/30 | 3,000 | 3,878 |
| Massachusetts Health & Educational Facilities | | | | |
| Authority Revenue (Museum of Fine Arts) | | | | |
| VRDO | 0.930% | 12/1/17 | 945 | 945 |
| Massachusetts Health & Educational Facilities | | | | |
| Authority Revenue (Northeastern University) | 5.000% | 10/1/19 | 3,000 | 3,177 |
| Massachusetts Health & Educational Facilities | | | | |
| Authority Revenue (Northeastern University) | 5.000% | 10/1/23 | 3,435 | 3,536 |
| Massachusetts Health & Educational Facilities | | | | |
| Authority Revenue (Northeastern University) | 5.000% | 10/1/32 | 1,000 | 1,111 |
| Massachusetts Health & Educational Facilities | | | | |
| Authority Revenue (Northeastern University) | 5.000% | 10/1/33 | 3,000 | 3,083 |
| Massachusetts Health & Educational Facilities | | | | |
| Authority Revenue (Partners Healthcare | | | | |
| System) | 5.250% | 7/1/29 | 10,000 | 10,557 |
| Massachusetts Health & Educational Facilities | | | | |
| Authority Revenue (Partners Healthcare | | | | |
| System) | 5.000% | 7/1/39 | 1,680 | 1,761 |
| 3 Massachusetts Health & Educational Facilities | | | | |
| Authority Revenue (Partners Healthcare | | | | |
| System) TOB VRDO | 0.970% | 12/1/17 | 7,000 | 7,000 |
| 3 Massachusetts Health & Educational Facilities | | | | |
| Authority Revenue (Partners Healthcare | | | | |
| System) TOB VRDO | 0.990% | 12/7/17 | 3,800 | 3,800 |
| Massachusetts Health & Educational Facilities | | | | |
| Authority Revenue (South Coast Health | | | | |
| System) | 5.000% | 7/1/39 | 6,000 | 6,260 |
| Massachusetts Health & Educational Facilities | | | | |
| Authority Revenue (Tufts University) VRDO | 0.840% | 12/1/17 | 100 | 100 |
| Massachusetts Health & Educational Facilities | | | | |
| Authority Revenue (Tufts University) VRDO | 0.890% | 12/1/17 | 3,100 | 3,100 |
| Massachusetts Health & Educational Facilities | | | | |
| Authority Revenue (UMass Memorial Medical | | | | |
| Center) | 5.000% | 7/1/21 | 125 | 134 |
| Massachusetts Health & Educational Facilities | | | | |
| Authority Revenue (Winchester Hospital) | 5.250% | 7/1/38 | 2,840 | 3,050 |
| Massachusetts Housing Finance Agency | | | | |
| Single Family Housing Revenue | 2.650% | 12/1/41 | 2,520 | 2,548 |
| Massachusetts Housing Finance Agency | | | | |
| Single Family Housing Revenue | 2.750% | 12/1/41 | 735 | 743 |
| Massachusetts Housing Finance Agency | | | | |
| Single Family Housing Revenue | 3.500% | 6/1/42 | 925 | 970 |
| Massachusetts Housing Finance Agency | | | | |
| Single Family Housing Revenue | 4.000% | 12/1/43 | 2,285 | 2,371 |
| Massachusetts Housing Finance Agency | | | | |
| Single Family Housing Revenue | 5.000% | 12/1/43 | 750 | 802 |
| Massachusetts Housing Finance Agency | | | | |
| Single Family Housing Revenue | 4.000% | 12/1/44 | 2,255 | 2,342 |
| Massachusetts Housing Finance Agency | | | | |
| Single Family Housing Revenue | 4.000% | 6/1/45 | 1,230 | 1,292 |
| Massachusetts Housing Finance Agency | | | | |
| Single Family Housing Revenue | 4.050% | 12/1/52 | 4,490 | 4,588 |
| Massachusetts Port Authority Revenue | 5.000% | 7/1/25 | 1,230 | 1,400 |
28
| | | | |
| Massachusetts Tax-Exempt Fund | | | | |
| |
| |
| |
| | | | Face | Market |
| | | Maturity | Amount | Value • |
| | Coupon | Date | ($000) | ($000) |
| Massachusetts Port Authority Revenue | 5.000% | 7/1/30 | 2,000 | 2,265 |
| Massachusetts Port Authority Revenue | 5.000% | 7/1/31 | 1,800 | 2,037 |
| Massachusetts Port Authority Revenue | 5.000% | 7/1/33 | 4,650 | 5,227 |
| Massachusetts Port Authority Revenue | 5.000% | 7/1/34 | 3,845 | 4,460 |
| Massachusetts Port Authority Revenue | 5.000% | 7/1/35 | 1,500 | 1,735 |
| Massachusetts Port Authority Revenue | 5.000% | 7/1/40 | 6,850 | 7,872 |
| Massachusetts School Building Authority | | | | |
| Dedicated Sales Tax Revenue | 5.000% | 8/15/22 | 5,035 | 5,743 |
| Massachusetts School Building Authority | | | | |
| Dedicated Sales Tax Revenue | 5.000% | 8/15/23 (ETM) | 1,690 | 1,970 |
| Massachusetts School Building Authority | | | | |
| Dedicated Sales Tax Revenue | 5.000% | 8/15/25 | 3,150 | 3,597 |
| Massachusetts School Building Authority | | | | |
| Dedicated Sales Tax Revenue | 5.000% | 8/15/26 | 5,025 | 5,734 |
| Massachusetts School Building Authority | | | | |
| Dedicated Sales Tax Revenue | 5.000% | 8/15/27 | 10,000 | 11,386 |
| Massachusetts School Building Authority | | | | |
| Dedicated Sales Tax Revenue | 5.000% | 8/15/28 | 7,250 | 8,248 |
| Massachusetts School Building Authority | | | | |
| Dedicated Sales Tax Revenue | 5.000% | 8/15/29 | 11,520 | 13,089 |
| Massachusetts School Building Authority | | | | |
| Dedicated Sales Tax Revenue | 5.000% | 11/15/29 | 2,400 | 2,885 |
| Massachusetts School Building Authority | | | | |
| Dedicated Sales Tax Revenue | 5.000% | 8/15/30 | 8,050 | 9,139 |
| Massachusetts School Building Authority | | | | |
| Dedicated Sales Tax Revenue | 5.000% | 11/15/30 | 4,700 | 5,628 |
| Massachusetts School Building Authority | | | | |
| Dedicated Sales Tax Revenue | 5.000% | 11/15/31 | 7,855 | 9,372 |
| Massachusetts School Building Authority | | | | |
| Dedicated Sales Tax Revenue | 4.000% | 8/15/32 | 4,000 | 4,299 |
| Massachusetts School Building Authority | | | | |
| Dedicated Sales Tax Revenue | 5.000% | 10/15/32 | 2,515 | 2,806 |
| Massachusetts School Building Authority | | | | |
| Dedicated Sales Tax Revenue | 5.000% | 11/15/34 | 7,010 | 8,284 |
| Massachusetts School Building Authority | | | | |
| Dedicated Sales Tax Revenue | 5.000% | 11/15/34 | 2,000 | 2,354 |
| Massachusetts School Building Authority | | | | |
| Dedicated Sales Tax Revenue | 5.250% | 10/15/35 | 10,090 | 11,347 |
| Massachusetts School Building Authority | | | | |
| Dedicated Sales Tax Revenue | 4.000% | 8/15/36 | 5,000 | 5,288 |
| Massachusetts School Building Authority | | | | |
| Dedicated Sales Tax Revenue | 4.000% | 1/15/37 | 3,000 | 3,155 |
| Massachusetts School Building Authority | | | | |
| Dedicated Sales Tax Revenue | 5.000% | 11/15/37 | 5,000 | 5,845 |
| Massachusetts School Building Authority | | | | |
| Dedicated Sales Tax Revenue | 5.000% | 5/15/38 | 2,660 | 2,997 |
| Massachusetts School Building Authority | | | | |
| Dedicated Sales Tax Revenue | 5.000% | 11/15/42 | 70 | 81 |
| Massachusetts School Building Authority | | | | |
| Dedicated Sales Tax Revenue | 5.000% | 11/15/45 | 5,000 | 5,806 |
| Massachusetts School Building Authority | | | | |
| Dedicated Sales Tax Revenue | 4.000% | 11/15/46 | 4,700 | 4,923 |
| Massachusetts Special Obligation Dedicated | | | | |
| Tax Revenue | 5.500% | 1/1/27 (14) | 10,000 | 12,468 |
29
| | | | |
| Massachusetts Tax-Exempt Fund | | | | |
| |
| |
| |
| | | | Face | Market |
| | | Maturity | Amount | Value • |
| | Coupon | Date | ($000) | ($000) |
| Massachusetts Special Obligation Dedicated | | | | |
| Tax Revenue | 5.500% | 1/1/28 (14) | 3,750 | 4,712 |
| Massachusetts Transportation Fund Revenue | 4.000% | 6/1/38 | 4,415 | 4,782 |
| Massachusetts Transportation Fund Revenue | | | | |
| (Accelerated Bridge Program) | 5.000% | 6/1/21 (Prere.) | 2,750 | 3,052 |
| Massachusetts Transportation Fund Revenue | | | | |
| (Accelerated Bridge Program) | 5.000% | 6/1/21 (Prere.) | 5,000 | 5,550 |
| Massachusetts Transportation Fund Revenue | | | | |
| (Accelerated Bridge Program) | 5.000% | 6/1/21 (Prere.) | 2,050 | 2,275 |
| Massachusetts Transportation Fund Revenue | | | | |
| (Accelerated Bridge Program) | 5.000% | 6/1/21 (Prere.) | 2,000 | 2,227 |
| Massachusetts Transportation Fund Revenue | | | | |
| (Accelerated Bridge Program) | 5.000% | 6/1/21 (Prere.) | 20 | 22 |
| Massachusetts Transportation Fund Revenue | | | | |
| (Accelerated Bridge Program) | 4.000% | 6/1/37 | 1,960 | 2,049 |
| Massachusetts Transportation Fund Revenue | | | | |
| (Accelerated Bridge Program) | 5.000% | 6/1/44 | 5,060 | 5,778 |
| Massachusetts Transportation Fund Revenue | | | | |
| (Accelerated Bridge Program) | 4.000% | 6/1/45 | 7,000 | 7,435 |
| Massachusetts Transportation Fund Revenue | | | | |
| (Accelerated Bridge Program) | 4.000% | 6/1/46 | 10,000 | 10,614 |
| Massachusetts Transportation Fund Revenue | | | | |
| (Rail Enhancement Program) | 5.000% | 6/1/30 | 1,700 | 1,995 |
| Massachusetts Transportation Fund Revenue | | | | |
| (Rail Enhancement Program) | 5.000% | 6/1/31 | 1,500 | 1,755 |
| Massachusetts Transportation Fund Revenue | | | | |
| (Rail Enhancement Program) | 5.000% | 6/1/32 | 2,000 | 2,334 |
| Massachusetts Transportation Fund Revenue | | | | |
| (Rail Enhancement Program) | 5.000% | 6/1/34 | 3,325 | 3,868 |
| Massachusetts Transportation Fund Revenue | | | | |
| (Rail Enhancement Program) | 5.000% | 6/1/40 | 5,020 | 5,846 |
| Massachusetts Transportation Fund Revenue | | | | |
| (Rail Enhancement Program) | 5.000% | 6/1/41 | 7,015 | 8,180 |
| Massachusetts Transportation Fund Revenue | | | | |
| (Rail Enhancement Program) | 4.000% | 6/1/45 | 7,300 | 7,746 |
| Massachusetts Transportation Fund Revenue | | | | |
| (Rail Enhancement Program) | 5.000% | 6/1/45 | 5,640 | 6,573 |
| Massachusetts Turnpike Authority Revenue | | | | |
| (Metropolitan Highway System) | 0.000% | 1/1/20 (14) | 3,000 | 2,878 |
| Massachusetts Turnpike Authority Revenue | | | | |
| (Metropolitan Highway System) | 0.000% | 1/1/25 (14) | 5,035 | 4,168 |
| Massachusetts Turnpike Authority Revenue | | | | |
| (Metropolitan Highway System) | 0.000% | 1/1/28 (14) | 6,670 | 4,961 |
| Massachusetts Water Pollution Abatement | | | | |
| Trust Revenue | 5.000% | 8/1/27 | 8,010 | 9,468 |
| Massachusetts Water Pollution Abatement | | | | |
| Trust Revenue | 5.000% | 8/1/28 | 975 | 1,147 |
| Massachusetts Water Pollution Abatement | | | | |
| Trust Revenue | 5.250% | 8/1/29 | 1,520 | 1,933 |
| Massachusetts Water Pollution Abatement | | | | |
| Trust Revenue | 5.750% | 8/1/29 | 190 | 191 |
| Massachusetts Water Pollution Abatement | | | | |
| Trust Revenue | 5.000% | 8/1/32 | 2,415 | 2,620 |
30
| | | | |
| Massachusetts Tax-Exempt Fund | | | | |
| |
| |
| |
| | | | Face | Market |
| | | Maturity | Amount | Value • |
| | Coupon | Date | ($000) | ($000) |
| Massachusetts Water Pollution Abatement | | | | |
| Trust Revenue | 5.000% | 8/1/32 | 5,685 | 5,992 |
| Massachusetts Water Resources Authority | | | | |
| Revenue | 5.000% | 8/1/19 (Prere.) | 2,950 | 3,114 |
| Massachusetts Water Resources Authority | | | | |
| Revenue | 5.000% | 8/1/20 (Prere.) | 2,775 | 3,017 |
| Massachusetts Water Resources Authority | | | | |
| Revenue | 5.000% | 8/1/20 (Prere.) | 500 | 544 |
| Massachusetts Water Resources Authority | | | | |
| Revenue | 5.500% | 8/1/20 (4) | 1,000 | 1,100 |
| Massachusetts Water Resources Authority | | | | |
| Revenue | 5.000% | 8/1/21 (Prere.) | 180 | 201 |
| Massachusetts Water Resources Authority | | | | |
| Revenue | 5.000% | 8/1/21 (Prere.) | 820 | 914 |
| Massachusetts Water Resources Authority | | | | |
| Revenue | 5.000% | 8/1/22 (Prere.) | 2,400 | 2,749 |
| Massachusetts Water Resources Authority | | | | |
| Revenue | 5.500% | 8/1/22 (4) | 1,490 | 1,735 |
| Massachusetts Water Resources Authority | | | | |
| Revenue | 5.000% | 8/1/27 | 2,000 | 2,167 |
| Massachusetts Water Resources Authority | | | | |
| Revenue | 5.000% | 8/1/27 | 5,000 | 6,116 |
| Massachusetts Water Resources Authority | | | | |
| Revenue | 5.000% | 8/1/28 | 800 | 973 |
| Massachusetts Water Resources Authority | | | | |
| Revenue | 5.000% | 8/1/29 | 1,070 | 1,311 |
| Massachusetts Water Resources Authority | | | | |
| Revenue | 5.000% | 8/1/29 | 6,000 | 6,668 |
| Massachusetts Water Resources Authority | | | | |
| Revenue | 5.000% | 8/1/31 | 2,280 | 2,739 |
| Massachusetts Water Resources Authority | | | | |
| Revenue | 5.000% | 8/1/31 | 1,000 | 1,213 |
| Massachusetts Water Resources Authority | | | | |
| Revenue | 5.250% | 8/1/31 (4) | 1,085 | 1,399 |
| Massachusetts Water Resources Authority | | | | |
| Revenue | 5.000% | 8/1/32 | 5,140 | 6,152 |
| Massachusetts Water Resources Authority | | | | |
| Revenue | 5.000% | 8/1/33 | 3,300 | 3,969 |
| Massachusetts Water Resources Authority | | | | |
| Revenue | 5.000% | 8/1/34 | 3,465 | 4,151 |
| Massachusetts Water Resources Authority | | | | |
| Revenue | 5.250% | 8/1/35 (4) | 6,310 | 8,306 |
| Massachusetts Water Resources Authority | | | | |
| Revenue | 4.000% | 8/1/36 | 7,200 | 7,706 |
| Massachusetts Water Resources Authority | | | | |
| Revenue | 5.000% | 8/1/36 | 2,710 | 3,073 |
| Massachusetts Water Resources Authority | | | | |
| Revenue | 5.000% | 8/1/40 | 2,715 | 3,180 |
| Massachusetts Water Resources Authority | | | | |
| Revenue | 5.000% | 8/1/40 | 4,860 | 5,693 |
| Massachusetts Water Resources Authority | | | | |
| Revenue | 5.000% | 8/1/42 | 1,000 | 1,120 |
| Massachusetts Water Resources Authority | | | | |
| Revenue | 5.250% | 8/1/42 | 10,000 | 11,137 |
31
| | | | |
| Massachusetts Tax-Exempt Fund | | | | |
| |
| |
| |
| | | | Face | Market |
| | | Maturity | Amount | Value • |
| | Coupon | Date | ($000) | ($000) |
| Massachusetts Water Resources Authority | | | | |
| Revenue | 5.000% | 8/1/44 | 8,000 | 9,209 |
| Massachusetts Water Resources Authority | | | | |
| Revenue VRDO | 0.980% | 12/7/17 | 2,100 | 2,100 |
| Metropolitan Boston MA Transit Parking Corp. | | | | |
| Revenue | 5.000% | 7/1/31 | 1,000 | 1,108 |
| Metropolitan Boston MA Transit Parking Corp. | | | | |
| Revenue | 5.250% | 7/1/33 | 190 | 212 |
| Metropolitan Boston MA Transit Parking Corp. | | | | |
| Revenue | 5.250% | 7/1/36 | 7,000 | 7,796 |
| Scituate MA GO | 4.000% | 9/15/39 | 3,000 | 3,145 |
| Stoughton MA GO | 4.000% | 10/15/31 | 3,865 | 4,269 |
| University of Massachusetts Building | | | | |
| Authority Revenue | 5.000% | 11/1/31 | 2,500 | 2,938 |
| University of Massachusetts Building | | | | |
| Authority Revenue | 5.000% | 11/1/32 | 4,060 | 4,752 |
| University of Massachusetts Building | | | | |
| Authority Revenue | 5.000% | 11/1/35 | 5,460 | 6,488 |
| University of Massachusetts Building | | | | |
| Authority Revenue | 5.000% | 5/1/38 | 2,000 | 2,240 |
| University of Massachusetts Building | | | | |
| Authority Revenue | 5.000% | 11/1/38 | 4,615 | 5,449 |
| University of Massachusetts Building | | | | |
| Authority Revenue | 5.000% | 11/1/39 | 7,545 | 8,642 |
| University of Massachusetts Building | | | | |
| Authority Revenue | 5.000% | 11/1/39 | 6,695 | 7,473 |
| University of Massachusetts Building | | | | |
| Authority Revenue | 5.000% | 11/1/40 | 3,000 | 3,465 |
| University of Massachusetts Building | | | | |
| Authority Revenue | 5.000% | 11/1/44 | 3,365 | 3,843 |
| University of Massachusetts Building | | | | |
| Authority Revenue | 4.000% | 11/1/45 | 6,020 | 6,320 |
| University of Massachusetts Building | | | | |
| Authority Revenue | 5.250% | 11/1/47 | 5,000 | 6,034 |
| Worcester MA GO | 5.250% | 8/15/21 (14) | 315 | 316 |
| | | | | 1,692,272 |
| Guam (0.8%) | | | | |
| Guam Government Business Privilege Tax | | | | |
| Revenue | 5.000% | 11/15/27 | 2,000 | 2,252 |
| Guam Government Business Privilege Tax | | | | |
| Revenue | 5.000% | 1/1/31 | 2,600 | 2,752 |
| Guam Government Business Privilege Tax | | | | |
| Revenue | 5.000% | 11/15/33 | 3,000 | 3,287 |
| Guam Government Waterworks Authority | | | | |
| Water & Waste Water System Revenue | 5.500% | 7/1/43 | 2,285 | 2,555 |
| Guam Power Authority Revenue | 5.000% | 10/1/20 | 500 | 536 |
| Guam Power Authority Revenue | 5.000% | 10/1/23 | 1,000 | 1,122 |
| Guam Power Authority Revenue | 5.000% | 10/1/25 | 720 | 808 |
| Guam Power Authority Revenue | 5.000% | 10/1/31 | 300 | 325 |
| | | | | 13,637 |
| Total Tax-Exempt Municipal Bonds (Cost $1,658,427) | | | 1,705,909 |
32
| |
| Massachusetts Tax-Exempt Fund | |
| |
| |
| |
| |
| | Amount |
| | ($000) |
| Other Assets and Liabilities (0.2%) | |
| Other Assets | |
| Investment in Vanguard | 102 |
| Receivables for Investment Securities Sold | 2,918 |
| Receivables for Accrued Income | 22,236 |
| Receivables for Capital Shares Issued | 1,468 |
| Variation Margin Receivable-Futures Contracts | 98 |
| Other Assets | 199 |
| Total Other Assets | 27,021 |
| Liabilities | |
| Payables for Investment Securities Purchased | (19,111) |
| Payables for Capital Shares Redeemed | (1,616) |
| Payables for Distributions | (985) |
| Payables to Vanguard | (1,074) |
| Variation Margin Payable-Futures Contracts | (221) |
| Other Liabilities | (161) |
| Total Liabilities | (23,168) |
| Net Assets (100%) | |
| Applicable to 159,138,648 outstanding $.001 par value shares of | |
| beneficial interest (unlimited authorization) | 1,709,762 |
| Net Asset Value Per Share | $10.74 |
| |
| |
| At November 30, 2017, net assets consisted of: | |
| | Amount |
| | ($000) |
| Paid-in Capital | 1,662,927 |
| Undistributed Net Investment Income | — |
| Accumulated Net Realized Losses | (524) |
| Unrealized Appreciation (Depreciation) | |
| Investment Securities | 47,482 |
| Futures Contracts | (123) |
| Net Assets | 1,709,762 |
• See Note A in Notes to Financial Statements.
1 Security purchased on a when-issued or delayed-delivery basis for which the fund has not taken delivery as of November 30, 2017.
2 Securities with a value of $482,000 have been segregated as initial margin for open futures contracts.
3 Security exempt from registration under Rule 144A of the Securities Act of 1933. Such securities may be sold in transactions
exempt from registration, normally to qualified institutional buyers. At November 30, 2017, the aggregate value of these securities
was $10,800,000, representing 0.6% of net assets.
A key to abbreviations and other references follows the Statement of Net Assets.
See accompanying Notes, which are an integral part of the Financial Statements.
33
Massachusetts Tax-Exempt Fund
Key to Abbreviations
ARS—Auction Rate Security.
BAN—Bond Anticipation Note.
COP—Certificate of Participation.
CP—Commercial Paper.
FR—Floating Rate.
GAN—Grant Anticipation Note.
GO—General Obligation Bond.
PILOT—Payments in Lieu of Taxes.
PUT—Put Option Obligation.
RAN—Revenue Anticipation Note.
TAN—Tax Anticipation Note.
TOB—Tender Option Bond.
TRAN—Tax Revenue Anticipation Note.
VRDO—Variable Rate Demand Obligation.
VRDP—Variable Rate Demand Preferred.
(ETM)—Escrowed to Maturity.
(Prere.)—Prerefunded.
Scheduled principal and interest payments are guaranteed by:
(1) MBIA (Municipal Bond Investors Assurance).
(2) AMBAC (Ambac Assurance Corporation).
(3) FGIC (Financial Guaranty Insurance Company).
(4) AGM (Assured Guaranty Municipal Corporation).
(5) BIGI (Bond Investors Guaranty Insurance).
(6) Connie Lee Inc.
(7) FHA (Federal Housing Authority).
(8) CapMAC (Capital Markets Assurance Corporation).
(9) American Capital Access Financial Guaranty Corporation.
(10) XL Capital Assurance Inc.
(11) CIFG (CDC IXIS Financial Guaranty).
(12) AGC (Assured Guaranty Corporation).
(13) BHAC (Berkshire Hathaway Assurance Corporation).
(14) NPFG (National Public Finance Guarantee Corporation).
(15) BAM (Build America Mutual Assurance Company).
(16) MAC (Municipal Assurance Corporation).
(17) RAA (Radian Asset Assurance Inc.).
(18) SBLF (Michigan School Bond Loan Fund).
(19) TPSF (Texas Permanent School Fund).
The insurance does not guarantee the market value of the municipal bonds.
LOC—Scheduled principal and interest payments are guaranteed by bank letter of credit.
34
| | | | |
| Massachusetts Tax-Exempt Fund | | | | |
| |
| |
| Derivative Financial Instruments Outstanding as of Period End | | |
| Futures Contracts | | | | |
| | | | | ($000) |
| | | | | Value and |
| | | Number of | | Unrealized |
| | | Long (Short) | Notional | Appreciation |
| | Expiration | Contracts | Amount | (Depreciation) |
| Long Futures Contracts | | | | |
| 2-Year U.S. Treasury Note | March 2018 | 226 | 48,456 | (34) |
| 5-Year U.S. Treasury Note | March 2018 | 332 | 38,626 | (109) |
| 10-Year U.S. Treasury Note | March 2018 | 154 | 19,103 | (134) |
| 30-Year U.S. Treasury Bond | March 2018 | 63 | 9,558 | (70) |
| | | | (347) |
| |
| Short Futures Contracts | | | | |
| Ultra Long U.S. Treasury Bond | March 2018 | (47) | (7,749) | 71 |
| Ultra 10-Year U.S. Treasury Note | March 2018 | (155) | (20,642) | 153 |
| | | | | 224 |
| | | | | (123) |
Unrealized appreciation (depreciation) on open futures contracts is required to be treated as realized gain (loss) for tax purposes.
See accompanying Notes, which are an integral part of the Financial Statements.
35
| |
| Massachusetts Tax-Exempt Fund | |
| |
| |
| Statement of Operations | |
| |
| | Year Ended |
| | November30,2017 |
| | ($000) |
| Investment Income | |
| Income | |
| Interest | 49,324 |
| Total Income | 49,324 |
| Expenses | |
| The Vanguard Group—Note B | |
| Investment Advisory Services | 215 |
| Management and Administrative | 1,818 |
| Marketing and Distribution | 266 |
| Custodian Fees | 19 |
| Auditing Fees | 36 |
| Shareholders’ Reports and Proxy | 38 |
| Trustees’ Fees and Expenses | 1 |
| Total Expenses | 2,393 |
| Net Investment Income | 46,931 |
| Realized Net Gain (Loss) | |
| Investment Securities Sold | 866 |
| Futures Contracts | (671) |
| Realized Net Gain (Loss) | 195 |
| Change in Unrealized Appreciation (Depreciation) | |
| Investment Securities | 45,673 |
| Futures Contracts | (67) |
| Change in Unrealized Appreciation (Depreciation) | 45,606 |
| Net Increase (Decrease) in Net Assets Resulting from Operations | 92,732 |
See accompanying Notes, which are an integral part of the Financial Statements.
36
| | |
| Massachusetts Tax-Exempt Fund | | |
| |
| |
| Statement of Changes in Net Assets | | |
| |
| | Year Ended November 30, |
| | 2017 | 2016 |
| | ($000) | ($000) |
| Increase (Decrease) in Net Assets | | |
| Operations | | |
| Net Investment Income | 46,931 | 42,198 |
| Realized Net Gain (Loss) | 195 | 8,350 |
| Change in Unrealized Appreciation (Depreciation) | 45,606 | (65,480) |
| Net Increase (Decrease) in Net Assets Resulting from Operations | 92,732 | (14,932) |
| Distributions | | |
| Net Investment Income | (46,926) | (42,165) |
| Realized Capital Gain1 | (7,445) | (2,006) |
| Total Distributions | (54,371) | (44,171) |
| Capital Share Transactions | | |
| Issued | 446,016 | 386,397 |
| Issued in Lieu of Cash Distributions | 41,529 | 32,506 |
| Redeemed | (274,885) | (187,088) |
| Net Increase (Decrease) from Capital Share Transactions | 212,660 | 231,815 |
| Total Increase (Decrease) | 251,021 | 172,712 |
| Net Assets | | |
| Beginning of Period | 1,458,741 | 1,286,029 |
| End of Period2 | 1,709,762 | 1,458,741 |
1 Includes fiscal 2017 and 2016 short-term gain distributions totaling $578,000 and $204,000, respectively. Short-term gain
distributions are treated as ordinary income dividends for tax purposes.
2 Net Assets—End of Period includes undistributed (overdistributed) net investment income of $0 and $1,000.
See accompanying Notes, which are an integral part of the Financial Statements.
37
| | | | | |
| Massachusetts Tax-Exempt Fund | | | | | |
| |
| |
| Financial Highlights | | | | | |
| |
| |
| For a Share Outstanding | | | Year Ended November 30, |
| Throughout Each Period | 2017 | 2016 | 2015 | 2014 | 2013 |
| Net Asset Value, Beginning of Period | $10.47 | $10.87 | $10.87 | $10.27 | $11.13 |
| Investment Operations | | | | | |
| Net Investment Income | . 3161 | .323 | .334 | .345 | .340 |
| Net Realized and Unrealized Gain (Loss) | | | | | |
| on Investments | . 324 | (. 383) | . 067 | . 600 | (. 860) |
| Total from Investment Operations | . 640 | (. 060) | . 401 | . 945 | (. 520) |
| Distributions | | | | | |
| Dividends from Net Investment Income | (. 317) | (. 323) | (. 334) | (. 345) | (. 340) |
| Distributions from Realized Capital Gains | (.053) | (.017) | (.067) | — | — |
| Total Distributions | (. 370) | (. 340) | (. 401) | (. 345) | (. 340) |
| Net Asset Value, End of Period | $10.74 | $10.47 | $10.87 | $10.87 | $10.27 |
| Total Return2 | 6.19% | -0.68% | 3.77% | 9.32% | -4.71% |
| Ratios/Supplemental Data | | | | | |
| Net Assets, End of Period (Millions) | $1,710 | $1,459 | $1,286 | $1,148 | $1,001 |
| Ratio of Total Expenses to Average Net Assets | 0.15% | 0.15% | 0.16% | 0.16% | 0.16% |
| Ratio of Net Investment Income to | | | | | |
| Average Net Assets | 2.96% | 2.91% | 3.09% | 3.24% | 3.21% |
| Portfolio Turnover Rate | 18% | 25% | 15% | 27% | 36% |
1 Calculated based on average shares outstanding.
2 Total returns do not include account service fees that may have applied in the periods shown. Fund prospectuses provide information
about any applicable account service fees.
See accompanying Notes, which are an integral part of the Financial Statements.
38
Massachusetts Tax-Exempt Fund
Notes to Financial Statements
Vanguard Massachusetts Tax-Exempt Fund is registered under the Investment Company Act of 1940 as an open-end investment company, or mutual fund. The fund invests in debt instruments of municipal issuers whose ability to meet their obligations may be affected by economic and political developments in the state.
A. The following significant accounting policies conform to generally accepted accounting principles for U.S. investment companies. The fund consistently follows such policies in preparing its financial statements.
1. Security Valuation: Securities are valued as of the close of trading on the New York Stock Exchange (generally 4 p.m., Eastern time) on the valuation date. Bonds and temporary cash investments are valued using the latest bid prices or using valuations based on a matrix system (which considers such factors as security prices, yields, maturities, and ratings), both as furnished by independent pricing services. Securities for which market quotations are not readily available, or whose values have been affected by events occurring before the fund’s pricing time but after the close of the securities’ primary markets, are valued by methods deemed by the board of trustees to represent fair value.
2. Futures Contracts: The fund uses futures contracts to invest in fixed income asset classes with greater efficiency and lower cost than is possible through direct investment, to add value when these instruments are attractively priced, or to adjust sensitivity to changes in interest rates. The primary risks associated with the use of futures contracts are imperfect correlation between changes in market values of bonds held by the fund and the prices of futures contracts, and the possibility of an illiquid market. Counterparty risk involving futures is mitigated because a regulated clearinghouse is the counterparty instead of the clearing broker. To further mitigate counterparty risk, the fund trades futures contracts on an exchange, monitors the financial strength of its clearing brokers and clearinghouse, and has entered into clearing agreements with its clearing brokers. The clearinghouse imposes initial margin requirements to secure the fund’s performance and requires daily settlement of variation margin representing changes in the market value of each contract.
Futures contracts are valued at their quoted daily settlement prices. The notional amounts of the contracts are not recorded in the Statement of Net Assets. Fluctuations in the value of the contracts are recorded in the Statement of Net Assets as an asset (liability) and in the Statement of Operations as unrealized appreciation (depreciation) until the contracts are closed, when they are recorded as realized futures gains (losses).
During the year ended November 30, 2017, the fund’s average investments in long and short futures contracts represented 5% and 2% of net assets, respectively, based on the average of the notional amounts at each quarter-end during the period.
3. Federal Income Taxes: The fund intends to continue to qualify as a regulated investment company and distribute all of its income. Management has analyzed the fund’s tax positions taken for all open federal income tax years (November 30, 2014–2017), and has concluded that no provision for federal income tax is required in the fund’s financial statements.
4. Distributions: Distributions from net investment income are declared daily and paid on the first business day of the following month. Annual distributions from realized capital gains, if any, are recorded on the ex-dividend date.
39
Massachusetts Tax-Exempt Fund
5. Credit Facility: The fund and certain other funds managed by The Vanguard Group (“Vanguard”) participate in a $3.1 billion committed credit facility provided by a syndicate of lenders pursuant to a credit agreement that may be renewed annually; each fund is individually liable for its borrowings, if any, under the credit facility. Borrowings may be utilized for temporary and emergency purposes, and are subject to the fund’s regulatory and contractual borrowing restrictions. The participating funds are charged administrative fees and an annual commitment fee of 0.10% of the undrawn amount of the facility; these fees are allocated to the funds based on a method approved by the fund’s board of trustees and included in Management and Administrative expenses on the fund’s Statement of Operations. Any borrowings under this facility bear interest at a rate based upon the higher of the one-month London Interbank Offered Rate, federal funds effective rate, or overnight bank funding rate plus an agreed-upon spread.
The fund had no borrowings outstanding at November 30, 2017, or at any time during the period then ended.
6. Other: Interest income is accrued daily. Premiums and discounts on debt securities purchased are amortized and accreted, respectively, to interest income over the lives of the respective securities. Security transactions are accounted for on the date securities are bought or sold. Costs used to determine realized gains (losses) on the sale of investment securities are those of the specific securities sold.
B. In accordance with the terms of a Funds’ Service Agreement (the “FSA”) between Vanguard and the fund, Vanguard furnishes to the fund investment advisory, corporate management, administrative, marketing, and distribution services at Vanguard’s cost of operations (as defined by the FSA). These costs of operations are allocated to the fund based on methods and guidelines approved by the board of trustees. Vanguard does not require reimbursement in the current period for certain costs of operations (such as deferred compensation/benefits and risk/insurance costs); the fund’s liability for these costs of operations is included in Payables to Vanguard on the Statement of Net Assets.
Upon the request of Vanguard, the fund may invest up to 0.40% of its net assets as capital in Vanguard. At November 30, 2017, the fund had contributed to Vanguard capital in the amount of $102,000, representing 0.01% of the fund’s net assets and 0.04% of Vanguard’s capitalization. The fund’s trustees and officers are also directors and employees, respectively, of Vanguard.
C. Various inputs may be used to determine the value of the fund’s investments. These inputs are summarized in three broad levels for financial statement purposes. The inputs or methodologies used to value securities are not necessarily an indication of the risk associated with investing in those securities.
Level 1—Quoted prices in active markets for identical securities.
Level 2—Other significant observable inputs (including quoted prices for similar securities, interest
rates, prepayment speeds, credit risk, etc.).
Level 3—Significant unobservable inputs (including the fund’s own assumptions used to determine
the fair value of investments). Any investments valued with significant unobservable inputs are
noted on the Statement of Net Assets.
40
Massachusetts Tax-Exempt Fund
The following table summarizes the market value of the fund’s investments as of November 30, 2017, based on the inputs used to value them:
| | | |
| | Level 1 | Level 2 | Level 3 |
| Investments | ($000) | ($000) | ($000) |
| Tax-Exempt Municipal Bonds | — | 1,705,909 | — |
| Futures Contracts—Assets1 | 98 | — | — |
| Futures Contracts—Liabilities1 | (221) | — | — |
| Total | (123) | 1,705,909 | — |
| 1 Represents variation margin on the last day of the reporting period. | | | |
D. Capital gain distributions are determined on a tax basis and may differ from realized capital gains for financial reporting purposes. Differences may be permanent or temporary. Permanent differences are reclassified among capital accounts in the financial statements to reflect their tax character. Temporary differences arise when gains or losses are recognized in different periods for financial statement and tax purposes. These differences will reverse at some time in the future.
For tax purposes, at November 30, 2017, the fund had short-term and long-term capital gains of $6,000 and $37,000, respectively, available for distribution. Short-term gain distributions are treated as ordinary income dividends for tax purposes.
At November 30, 2017, the cost of investment securities for tax purposes was $1,659,117,000. Net unrealized appreciation of investment securities for tax purposes was $46,792,000, consisting of unrealized gains of $54,044,000 on securities that had risen in value since their purchase and $7,252,000 in unrealized losses on securities that had fallen in value since their purchase.
E. During the year ended November 30, 2017, the fund purchased $483,820,000 of investment securities and sold $267,507,000 of investment securities, other than temporary cash investments.
The fund purchased securities from and sold securities to other Vanguard funds or accounts managed by Vanguard or its affiliates, in accordance with procedures adopted by the board of trustees in compliance with Rule 17a-7 of the Investment Company Act of 1940. For the year ended November 30, 2017, such purchases and sales were $98,703,000 and $78,435,000, respectively; these amounts are included in the purchases and sales of investment securities noted above.
| | |
| F. Capital shares issued and redeemed were: | | |
| | Year Ended November 30, |
| | 2017 | 2016 |
| | Shares | Shares |
| | (000) | (000) |
| Issued | 41,820 | 35,040 |
| Issued in Lieu of Cash Distributions | 3,890 | 2,947 |
| Redeemed | (25,850) | (17,064) |
| Net Increase (Decrease) in Shares Outstanding | 19,860 | 20,923 |
G. Management has determined that no material events or transactions occurred subsequent to November 30, 2017, that would require recognition or disclosure in these financial statements.
41
Report of Independent Registered Public Accounting Firm
To the Board of Trustees of Vanguard Massachusetts Tax-Exempt Funds and the Shareholders of Vanguard Massachusetts Tax-Exempt Fund In our opinion, the accompanying statement of net assets and the related statements of operations and of changes in net assets and the financial highlights present fairly, in all material respects, the financial position of Vanguard Massachusetts Tax-Exempt Fund (constituting Vanguard Massachusetts Tax-Exempt Funds, hereafter referred to as the “Fund”) as of November 30, 2017, the results of its operations for the year then ended, the changes in its net assets for each of the two years in the period then ended, and the financial highlights for each of the five years in the period then ended, in conformity with accounting principles generally accepted in the United States of America. These financial statements and financial highlights (hereafter referred to as “financial statements”) are the responsibility of the Fund’s management. Our responsibility is to express an opinion on these financial statements based on our audits. We conducted our audits of these financial statements in accordance with the standards of the Public Company Accounting Oversight Board (United States). Those standards require that we plan and perform the audit to obtain reasonable assurance about whether the financial statements are free of material misstatement. An audit includes examining, on a test basis, evidence supporting the amounts and disclosures in the financial statements, assessing the accounting principles used and significant estimates made by management, and evaluating the overall financial statement presentation. We believe that our audits, which included confirmation of securities as of November 30, 2017 by correspondence with the custodian and brokers, provide a reasonable basis for our opinion.
/s/PricewaterhouseCoopers LLP
Philadelphia, Pennsylvania
January 16, 2018
Special 2017 tax information (unaudited) for Vanguard Massachusetts Tax-Exempt Fund
This information for the fiscal year ended November 30, 2017, is included pursuant to provisions
of the Internal Revenue Code.
The fund distributed $6,914,000 as capital gain dividends (20% rate gain distributions) to
shareholders during the fiscal year.
For nonresident alien shareholders, 100% of short-term capital gain dividends distributed by the
fundare qualified short-term capital gains.
The fund designates 100% of its income dividends as exempt-interest dividends.
42
About Your Fund’s Expenses
As a shareholder of the fund, you incur ongoing costs, which include costs for portfolio management, administrative services, and shareholder reports (like this one), among others. Operating expenses, which are deducted from a fund’s gross income, directly reduce the investment return of the fund.
A fund’s expenses are expressed as a percentage of its average net assets. This figure is known as the expense ratio. The following examples are intended to help you understand the ongoing costs (in dollars) of investing in your fund and to compare these costs with those of other mutual funds. The examples are based on an investment of $1,000 made at the beginning of the period shown and held for the entire period.
The accompanying table illustrates your fund’s costs in two ways:
• Based on actual fund return. This section helps you to estimate the actual expenses that you paid over the period. The ”Ending Account Value“ shown is derived from the fund‘s actual return, and the third column shows the dollar amount that would have been paid by an investor who started with $1,000 in the fund. You may use the information here, together with the amount you invested, to estimate the expenses that you paid over the period.
To do so, simply divide your account value by $1,000 (for example, an $8,600 account value divided by $1,000 = 8.6), then multiply the result by the number given for your fund under the heading ”Expenses Paid During Period.“
• Based on hypothetical 5% yearly return. This section is intended to help you compare your fund‘s costs with those of other mutual funds. It assumes that the fund had a yearly return of 5% before expenses, but that the expense ratio is unchanged. In this case—because the return used is not the fund’s actual return—the results do not apply to your investment. The example is useful in making comparisons because the Securities and Exchange Commission requires all mutual funds to calculate expenses based on a 5% return. You can assess your fund’s costs by comparing this hypothetical example with the hypothetical examples that appear in shareholder reports of other funds.
Note that the expenses shown in the table are meant to highlight and help you compare ongoing costs only and do not reflect transaction costs incurred by the fund for buying and selling securities. Further, the expenses do not include any purchase, redemption, or account service fees described in the fund prospectus. If such fees were applied to your account, your costs would be higher. Your fund does not carry a “sales load.”
The calculations assume no shares were bought or sold during the period. Your actual costs may have been higher or lower, depending on the amount of your investment and the timing of any purchases or redemptions.
You can find more information about the fund’s expenses, including annual expense ratios, in the Financial Statements section of this report. For additional information on operating expenses and other shareholder costs, please refer to your fund’s current prospectus.
43
| | | |
| Six Months Ended November 30, 2017 | | | |
| | Beginning | Ending | Expenses |
| | Account Value | Account Value | Paid During |
| Massachusetts Tax-Exempt Fund | 5/31/2017 | 11/30/2017 | Period |
| Based on Actual Fund Return | $1,000.00 | $1,008.11 | $0.76 |
| Based on Hypothetical 5% Yearly Return | 1,000.00 | 1,024.32 | 0.76 |
The calculations are based on expenses incurred in the most recent six-month period. The fund’s annualized six-month expense ratio for
that period is 0.15%. The dollar amounts shown as “Expenses Paid” are equal to the annualized expense ratio multiplied by the average
account value over the period, multiplied by the number of days in the most recent six-month period, then divided by the number of days in
the most recent 12-month period (183/365).
44
Glossary
30-Day SEC Yield. A fund’s 30-day SEC yield is derived using a formula specified by the U.S. Securities and Exchange Commission. Under the formula, data related to the fund’s security holdings in the previous 30 days are used to calculate the fund’s hypothetical net income for that period, which is then annualized and divided by the fund’s estimated average net assets over the calculation period. For the purposes of this calculation, a security’s income is based on its current market yield to maturity (for bonds), its actual income (for asset-backed securities), or its projected dividend yield (for stocks). Because the SEC yield represents hypothetical annualized income, it will differ—at times significantly—from the fund’s actual experience. As a result, the fund’s income distributions may be higher or lower than implied by the SEC yield.
Average Coupon. The average interest rate paid on the fixed income securities held by a fund. It is expressed as a percentage of face value.
Average Duration. An estimate of how much the value of the bonds held by a fund will fluctuate in response to a change in interest rates. To see how the value could change, multiply the average duration by the change in rates. If interest rates rise by 1 percentage point, the value of the bonds in a fund with an average duration of five years would decline by about 5%. If rates decrease by a percentage point, the value would rise by 5%.
Average Stated Maturity. The average length of time until fixed income securities held by a fund reach maturity and are repaid using the maturity date of the security. The figure reflects the proportion of fund assets represented by each security; it also reflects any futures contracts held. In general, the longer the average stated maturity, the more a fund’s share price will fluctuate in response to changes in market interest rates.
Beta. A measure of the magnitude of a fund’s past share-price fluctuations in relation to the ups and downs of a given market index. The index is assigned a beta of 1.00. Compared with a given index, a fund with a beta of 1.20 typically would have seen its share price rise or fall by 12% when the index rose or fell by 10%. For this report, beta is based on returns over the past 36 months for both the fund and the index. Note that a fund’s beta should be reviewed in conjunction with its R-squared (see definition). The lower the R-squared, the less correlation there is between the fund and the index, and the less reliable beta is as an indicator of volatility.
Credit Quality. Credit-quality ratings are measured on a scale that generally ranges from AAA (highest) to D (lowest). Credit-quality ratings are obtained from Moody’s and S&P, and the higher rating for each issue is used. ”Not Rated” is used to classify securities for which a rating is not available. Not rated securities include a fund’s investment in Vanguard Market Liquidity Fund or Vanguard Municipal Cash Management Fund, each of which invests in high-quality money market instruments and may serve as a cash management vehicle for the Vanguard funds, trusts, and accounts.
Expense Ratio. A fund’s total annual operating expenses expressed as a percentage of the fund’s average net assets. The expense ratio includes management and administrative expenses, but does not include the transaction costs of buying and selling portfolio securities.
Inception Date. The date on which the assets of a fund (or one of its share classes) are first invested in accordance with the fund’s investment objective. For funds with a subscription period, the inception date is the day after that period ends. Investment performance is measured from the inception date.
45
R-Squared. A measure of how much of a fund’s past returns can be explained by the returns from the market in general, as measured by a given index. If a fund’s total returns were precisely synchronized with an index’s returns, its R-squared would be 1.00. If the fund’s returns bore no relationship to the index’s returns, its R-squared would be 0. For this report, R-squared is based on returns over the past 36 months for both the fund and the index.
Short-Term Reserves. The percentage of a fund invested in highly liquid, short-term securities that can be readily converted to cash.
Yield to Maturity. The rate of return an investor would receive if the fixed income securities held by a fund were held to their maturity dates.
46
BLOOMBERG is a trademark and service mark of Bloomberg Finance L.P. BARCLAYS is a trademark and service mark
of Barclays Bank Plc, used under license. Bloomberg Finance L.P. and its affiliates, including Bloomberg Index Services
Limited (BISL) (collectively, Bloomberg), or Bloomberg’s licensors, own all proprietary rights in the Bloomberg Barclays
MA Municipal Bond Index (Index or Bloomberg Barclays Index).
Neither Barclays Bank Plc, Barclays Capital Inc., or any affiliate (collectively Barclays) or Bloomberg is the issuer or
producer of the Massachusetts Tax-Exempt Fund and neither Bloomberg nor Barclays has any responsibilities, obligations
or duties to investors in the Massachusetts Tax-Exempt Fund. The Index is licensed for use by The Vanguard Group, Inc.
(Vanguard) as the sponsor of the Massachusetts Tax-Exempt Fund. Bloomberg and Barclays’ only relationship with
Vanguard in respect of the Index is the licensing of the Index, which is determined, composed and calculated by BISL,
or any successor thereto, without regard to the Issuer or the Massachusetts Tax-Exempt Fund or the owners of the
Massachusetts Tax-Exempt Fund.
Additionally, Vanguard may for itself execute transaction(s) with Barclays in or relating to the Index in connection
with the Massachusetts Tax-Exempt Fund. Investors acquire the Massachusetts Tax-Exempt Fund from Vanguard and
investors neither acquire any interest in the Index nor enter into any relationship of any kind whatsoever with Bloomberg
or Barclays upon making an investment in the Massachusetts Tax-Exempt Fund. The Massachusetts Tax-Exempt Fund
is not sponsored, endorsed, sold or promoted by Bloomberg or Barclays. Neither Bloomberg nor Barclays makes any
representation or warranty, express or implied regarding the advisability of investing in the Massachusetts Tax-Exempt
Fund or the advisability of investing in securities generally or the ability of the Index to track corresponding or relative
market performance. Neither Bloomberg nor Barclays has passed on the legality or suitability of the Massachusetts
Tax-Exempt Fund with respect to any person or entity. Neither Bloomberg nor Barclays is responsible for and has not
participated in the determination of the timing of, prices at, or quantities of the Massachusetts Tax-Exempt Fund to
be issued. Neither Bloomberg nor Barclays has any obligation to take the needs of the Issuer or the owners of the
Massachusetts Tax-Exempt Fund or any other third party into consideration in determining, composing or calculating
the Index. Neither Bloomberg nor Barclays has any obligation or liability in connection with administration, marketing
or trading of the Massachusetts Tax-Exempt Fund.
47
The licensing agreement between Bloomberg and Barclays is solely for the benefit of Bloomberg and Barclays and not for
the benefit of the owners of the Massachusetts Tax-Exempt Fund, investors or other third parties. In addition, the licensing
agreement between Vanguard and Bloomberg is solely for the benefit of Vanguard and Bloomberg and not for the benefit
of the owners of the Massachusetts Tax-Exempt Fund, investors or other third parties.
NEITHER BLOOMBERG NOR BARCLAYS SHALL HAVE ANY LIABILITY TO THE ISSUER, INVESTORS OR TO OTHER THIRD
PARTIES FOR THE QUALITY, ACCURACY AND/OR COMPLETENESS OF THE BLOOMBERG BARCLAYS INDEX OR ANY
DATA INCLUDED THEREIN OR FOR INTERRUPTIONS IN THE DELIVERY OF THE BLOOMBERG BARCLAYS INDEX. NEITHER
BLOOMBERG NOR BARCLAYS MAKES ANY WARRANTY, EXPRESS OR IMPLIED, AS TO RESULTS TO BE OBTAINED BY
THE ISSUER, THE INVESTORS OR ANY OTHER PERSON OR ENTITY FROM THE USE OF THE BLOOMBERG BARCLAYS
INDEX OR ANY DATA INCLUDED THEREIN. NEITHER BLOOMBERG NOR BARCLAYS MAKES ANY EXPRESS OR IMPLIED
WARRANTIES, AND EACH HEREBY EXPRESSLY DISCLAIMS ALL WARRANTIES OF MERCHANTABILITY OR FITNESS
FOR A PARTICULAR PURPOSE OR USE WITH RESPECT TO THE BLOOMBERG BARCLAYS INDEX OR ANY DATA INCLUDED
THEREIN. BLOOMBERG RESERVES THE RIGHT TO CHANGE THE METHODS OF CALCULATION OR PUBLICATION, OR TO
CEASE THE CALCULATION OR PUBLICATION OF THE BLOOMBERG BARCLAYS INDEX, AND NEITHER BLOOMBERG
NOR BARCLAYS SHALL BE LIABLE FOR ANY MISCALCULATION OF OR ANY INCORRECT, DELAYED OR INTERRUPTED
PUBLICATION WITH RESPECT TO ANY OF THE BLOOMBERG BARCLAYS INDEX. NEITHER BLOOMBERG NOR BARCLAYS
SHALL BE LIABLE FOR ANY DAMAGES, INCLUDING, WITHOUT LIMITATION, ANY SPECIAL, INDIRECT OR
CONSEQUENTIAL DAMAGES, OR ANY LOST PROFITS AND EVEN IF ADVISED OF THE POSSIBLITY OF SUCH, RESULTING
FROM THE USE OF THE BLOOMBERG BARCLAYS INDEX OR ANY DATA INCLUDED THEREIN OR WITH RESPECT TO THE
MASSACHUSETTS TAX-EXEMPT FUND.
None of the information supplied by Bloomberg or Barclays and used in this publication may be reproduced in any manner
without the prior written permission of both Bloomberg and Barclays Capital, the investment banking division of Barclays
Bank Plc. Barclays Bank Plc is registered in England No. 1026167. Registered office 1 Churchill Place London E14 5HP.
© 2017 Bloomberg. Used with Permission.
Source: Bloomberg Index Services Limited. Copyright 2017, Bloomberg. All rights reserved.
48
This page intentionally left blank.
This page intentionally left blank.
The People Who Govern Your Fund
The trustees of your mutual fund are there to see that the fund is operated and managed in your best interests since, as a shareholder, you are a part owner of the fund. Your fund’s trustees also serve on the board of directors of The Vanguard Group, Inc., which is owned by the Vanguard funds and provides services to them on an at-cost basis.
A majority of Vanguard’s board members are independent, meaning that they have no affiliation with Vanguard or the funds they oversee, apart from the sizable personal investments they have made as private individuals. The independent board members have distinguished backgrounds in business, academia, and public service. Each of the trustees and executive officers oversees 201 Vanguard funds.
Information for each trustee and executive officer of the fund appears below. The mailing address of the trustees and officers is P.O. Box 876, Valley Forge, PA 19482. More information about the trustees is in the Statement of Additional Information, which can be obtained, without charge, by contacting Vanguard at 800-662-7447, or online at vanguard.com.
Interested Trustee1
F. William McNabb III
Born 1957. Trustee Since July 2009. Chairman of the Board. Principal Occupation(s) During the Past Five Years and Other Experience: Chairman of the Board of The Vanguard Group, Inc., and of each of the investment companies served by The Vanguard Group, since January 2010; Chief Executive Officer and Director of The Vanguard Group and President and Chief Executive Officer of each of the investment companies served by The Vanguard Group, since 2008; Director of Vanguard Marketing Corporation; President of The Vanguard Group (2008–2017); Managing Director of The Vanguard Group (1995–2008).
Independent Trustees
Emerson U. Fullwood
Born 1948. Trustee Since January 2008. Principal Occupation(s) During the Past Five Years and Other Experience: Executive Chief Staff and Marketing Officer for North America and Corporate Vice President (retired 2008) of Xerox Corporation (document management products and services); Executive in Residence and 2009–2010 Distinguished Minett Professor at the Rochester Institute of Technology; Lead Director of SPX FLOW, Inc. (multi-industry manufacturing); Director of the United Way of Rochester, the University of Rochester Medical Center, Monroe Community College Foundation, North Carolina A&T University, and Roberts Wesleyan College; Trustee of the University of Rochester.
Rajiv L. Gupta
Born 1945. Trustee Since December 2001.2 Principal Occupation(s) During the Past Five Years and Other Experience: Chairman and Chief Executive Officer (retired 2009) and President (2006–2008) of Rohm and Haas Co. (chemicals); Director of Arconic Inc. (diversified manufacturer), HP Inc. (printer and personal computer manufacturing), and Delphi Automotive plc (automotive components); Senior Advisor at New Mountain Capital.
Amy Gutmann
Born 1949. Trustee Since June 2006. Principal Occupation(s) During the Past Five Years and Other Experience: President of the University of Pennsylvania; Christopher H. Browne
1 Mr. McNabb is considered an “interested person,” as defined in the Investment Company Act of 1940, because he is an officer of the
Vanguard funds.
2 December 2002 for Vanguard Equity Income Fund, the Vanguard Municipal Bond Funds, and the Vanguard State Tax-Exempt Funds.
Distinguished Professor of Political Science, School of Arts and Sciences, and Professor of Communication, Annenberg School for Communication, with secondary faculty appointments in the Department of Philosophy, School of Arts and Sciences, and at the Graduate School of Education, University of Pennsylvania; Trustee of the National Constitution Center.
JoAnn Heffernan Heisen
Born 1950. Trustee Since July 1998. Principal Occupation(s) During the Past Five Years and Other Experience: Corporate Vice President and Member of the Executive Committee (1997–2008), Chief Global Diversity Officer (retired 2008), Vice President and Chief Information Officer (1997–2006), Controller (1995–1997), Treasurer (1991–1995), and Assistant Treasurer (1989–1991) of Johnson & Johnson (pharmaceuticals/medical devices/ consumer products); Director of Skytop Lodge Corporation (hotels) and the Robert Wood Johnson Foundation; Member of the Advisory Board of the Institute for Women’s Leadership at Rutgers University.
F. Joseph Loughrey
Born 1949. Trustee Since October 2009. Principal Occupation(s) During the Past Five Years and Other Experience: President and Chief Operating Officer (retired 2009) of Cummins Inc. (industrial machinery); Chairman of the Board of Hillenbrand, Inc. (specialized consumer services), Oxfam America, and the Lumina Foundation for Education; Director of the V Foundation for Cancer Research; Member of the Advisory Council for the College of Arts and Letters and Chair of the Advisory Board to the Kellogg Institute for International Studies, both at the University of Notre Dame.
Mark Loughridge
Born 1953. Trustee Since March 2012. Principal Occupation(s) During the Past Five Years and Other Experience: Senior Vice President and Chief Financial Officer (retired 2013) at IBM (information technology services); Fiduciary Member of IBM’s Retirement Plan Committee (2004–2013); Member of the Council on Chicago Booth.
Scott C. Malpass
Born 1962. Trustee Since March 2012. Principal Occupation(s) During the Past Five Years and Other Experience: Chief Investment Officer and Vice President at the University of Notre Dame; Assistant Professor of Finance at the Mendoza College of Business at Notre Dame; Member of the Notre Dame 403(b) Investment Committee, the Board of Advisors for Spruceview Capital Partners, the Board of Catholic Investment Services, Inc. (investment advisor), and the Board of Superintendence of the Institute for the Works of Religion; Chairman of the Board of TIFF Advisory Services, Inc. (investment advisor).
André F. Perold
Born 1952. Trustee Since December 2004. Principal Occupation(s) During the Past Five Years and Other Experience: George Gund Professor of Finance and Banking, Emeritus at the Harvard Business School (retired 2011); Chief Investment Officer and Co-Managing Partner of HighVista Strategies LLC (private investment firm); Overseer of the Museum of Fine Arts Boston.
Peter F. Volanakis
Born 1955. Trustee Since July 2009. Principal Occupation(s) During the Past Five Years and Other Experience: President and Chief Operating Officer (retired 2010) of Corning Incorporated (communications equipment); Chairman of the Board of Trustees of Colby-Sawyer College; Member of the Board of Hypertherm, Inc. (industrial cutting systems, software, and consumables).
Executive Officers
Glenn Booraem
Born 1967. Investment Stewardship Officer Since February 2017. Principal Occupation(s) During the Past Five Years and Other Experience: Principal of The Vanguard Group, Inc.; Treasurer (2015–2017), Controller (2010–2015), and Assistant Controller (2001–2010) of each of the investment companies served by The Vanguard Group.
Christine M. Buchanan
Born 1970. Treasurer Since November 2017. Principal Occupation(s) During the Past Five Years and Other Experience: Principal of The Vanguard Group, Inc.; Treasurer of each of the investment companies served by The Vanguard Group; Global Head of Vanguard Fund Administration at The Vanguard Group; Partner at KPMG LLP (2005–2017).
Thomas J. Higgins
Born 1957. Chief Financial Officer Since September 2008. Principal Occupation(s) During the Past Five Years and Other Experience: Principal of The Vanguard Group, Inc.; Chief Financial Officer of each of the investment companies served by The Vanguard Group; Treasurer of each of the investment companies served by The Vanguard Group (1998–2008).
Peter Mahoney
Born 1974. Controller Since May 2015. Principal Occupation(s) During the Past Five Years and Other Experience: Principal of The Vanguard Group, Inc.; Controller of each of the investment companies served by The Vanguard Group; Head of International Fund Services at The Vanguard Group (2008–2014).
Anne E. Robinson
Born 1970. Secretary Since September 2016. Principal Occupation(s) During the Past Five Years and Other Experience: Managing Director of The Vanguard Group, Inc.; General Counsel of The Vanguard Group; Secretary of The Vanguard Group and of each of the investment companies served by The Vanguard Group; Director and Senior Vice President of Vanguard Marketing Corporation; Managing Director and General Counsel of Global Cards and Consumer Services at Citigroup (2014–2016); Counsel at American Express (2003–2014).
Michael Rollings
Born 1963. Finance Director Since November 2017. Principal Occupation(s) During the Past Five Years and Other Experience: Managing Director of The Vanguard Group, Inc.; Director of Vanguard Marketing Corporation; Treasurer of each of the investment companies served by The Vanguard Group (February 2017–November 2017); Executive Vice President and Chief Financial Officer of MassMutual Financial Group (2006–2016).
| |
| Vanguard Senior Management Team |
| |
| Mortimer J. Buckley | Chris D. McIsaac |
| Gregory Davis | James M. Norris |
| John James | Thomas M. Rampulla |
| Martha G. King | Karin A. Risi |
| John T. Marcante | |
Chairman Emeritus and Senior Advisor
John J. Brennan
Chairman, 1996–2009
Chief Executive Officer and President, 1996–2008
Founder
John C. Bogle
Chairman and Chief Executive Officer, 1974–1996
|  |
| | P.O. Box 2600 |
| | Valley Forge, PA 19482-2600 |
| |
| |
| |
| Connect with Vanguard® >vanguard.com | |
| |
| |
| |
| Fund Information > 800-662-7447 | CFA® is a registered trademark owned by CFA Institute. |
| Direct Investor Account Services > 800-662-2739 |
| Institutional Investor Services > 800-523-1036 |
| Text Telephone for People | |
| Who Are Deaf or Hard of Hearing> 800-749-7273 |
| |
| This material may be used in conjunction |
| with the offering of shares of any Vanguard |
| fund only if preceded or accompanied by |
| the fund’s current prospectus. | |
| |
| All comparative mutual fund data are from Lipper, a |
| Thomson Reuters Company, or Morningstar, Inc., unless |
| otherwise noted. | |
| |
| You can obtain a free copy of Vanguard’s proxy voting |
| guidelines by visiting vanguard.com/proxyreporting or by |
| calling Vanguard at 800-662-2739. The guidelines are |
| also available from the SEC’s website, sec.gov. In |
| addition, you may obtain a free report on how your fund |
| voted the proxies for securities it owned during the 12 |
| months ended June 30. To get the report, visit either |
| vanguard.com/proxyreporting or sec.gov. |
| |
| You can review and copy information about your fund at |
| the SEC’s Public Reference Room in Washington, D.C. To |
| find out more about this public service, call the SEC at |
| 202-551-8090. Information about your fund is also |
| available on the SEC’s website, and you can receive |
| copies of this information, for a fee, by sending a |
| request in either of two ways: via email addressed to |
| publicinfo@sec.gov or via regular mail addressed to the |
| Public Reference Section, Securities and Exchange |
| Commission, Washington, DC 20549-1520. |
| | © 2018 The Vanguard Group, Inc. |
| | All rights reserved. |
| | Vanguard Marketing Corporation, Distributor. |
| |
| | Q1680 012018 |
Item 2 : Code of Ethics. The Registrant has adopted a code of ethics that applies to the Registrant s principal executive officer, principal financial officer, principal accounting officer or controller or persons performing similar functions. The Code of Ethics was amended during the reporting period covered by this report to make certain technical, non-material changes.
Item 3 : Audit Committee Financial Expert. All members of the Audit Committee have been determined by the Registrant s Board of Trustees to be Audit Committee Financial Experts and to be independent: Rajiv L. Gupta, JoAnn Heffernan Heisen, F. Joseph Loughrey, Mark Loughridge, and Peter F. Volanakis.
Item 4 : Principal Accountant Fees and Services.
(a) Audit Fees.
Audit Fees of the Registrant
Fiscal Year Ended November 30, 2017: $36,000
Fiscal Year Ended November 30, 2016: $35,000 |
Aggregate Audit Fees of Registered Investment Companies in the Vanguard Group.
Fiscal Year Ended November 30, 2017: $8,424,459
Fiscal Year Ended November 30, 2016: $9,629,849 |
Includes fees billed in connection with audits of the Registrant, other registered investment companies in the Vanguard complex, The Vanguard Group, Inc. and Vanguard Marketing Corporation.
(b) Audit-Related Fees.
Fiscal Year Ended November 30, 2017: $3,194,093
Fiscal Year Ended November 30, 2016: $2,717,627 |
Includes fees billed in connection with assurance and related services provided to the Registrant, other registered investment companies in the Vanguard complex, The Vanguard Group, Inc., and Vanguard Marketing Corporation.
(c) Tax Fees.
Fiscal Year Ended November 30, 2017: $274,313
Fiscal Year Ended November 30, 2016: $254,050 |
Includes fees billed in connection with tax compliance, planning, and advice services provided to the Registrant, other registered investment companies in the Vanguard complex, The Vanguard Group, Inc., and Vanguard Marketing Corporation.
(d) All Other Fees.
Fiscal Year Ended November 30, 2017: $0
Fiscal Year Ended November 30, 2016: $214,225 |
Includes fees billed for services related to tax reported information provided to the Registrant, other registered investment companies in the Vanguard complex, The Vanguard Group, Inc., and Vanguard Marketing Corporation.
(e) (1) Pre-Approval Policies. The policy of the Registrant s Audit Committee is to consider and, if appropriate, approve before the principal accountant is engaged for such services, all specific audit and non-audit services provided to: the Registrant, other registered investment companies in the Vanguard complex, The Vanguard Group, Inc., and entities controlled by The Vanguard Group, Inc. that provide ongoing services to the Registrant. In making a determination, the Audit Committee considers whether the services are consistent with maintaining the principal accountant s independence.
In the event of a contingency situation in which the principal accountant is needed to provide services in between scheduled Audit Committee meetings, the Chairman of the Audit Committee would be called on to consider and, if appropriate, pre-approve audit or permitted non-audit services in an amount sufficient to complete services through the next Audit Committee meeting, and to determine if such services would be consistent with maintaining the accountant s independence. At the next scheduled Audit Committee meeting, services and fees would be presented to the Audit Committee for formal consideration, and, if appropriate, approval by the entire Audit Committee. The Audit Committee would again consider whether such services and fees are consistent with maintaining the principal accountant s independence.
The Registrant s Audit Committee is informed at least annually of all audit and non-audit services provided by the principal accountant to the Vanguard complex, whether such services are provided to: the Registrant, other registered investment companies in the Vanguard complex, The Vanguard Group, Inc., or other entities controlled by The Vanguard Group, Inc. that provide ongoing services to the Registrant.
(2) No percentage of the principal accountant s fees or services were approved pursuant to the waiver provision of paragraph (c)(7)(i)(C) of Rule 2-01 of Regulation S-X.
(f) For the most recent fiscal year, over 50% of the hours worked under the principal accountant s engagement were not performed by persons other than full-time, permanent employees of the principal accountant.
(g) Aggregate Non-Audit Fees.
Fiscal Year Ended November 30, 2017: $274,313
Fiscal Year Ended November 30, 2016: $468,275 |
Includes fees billed for non-audit services provided to the Registrant, other registered investment companies in the Vanguard complex, The Vanguard Group, Inc., and Vanguard Marketing Corporation.
(h) For the most recent fiscal year, the Audit Committee has determined that the provision of all non-audit services was consistent with maintaining the principal accountant s independence.
Item 5 : Audit Committee of Listed Registrants.
Not Applicable.
Item 6 : Investments.
Not Applicable.
Item 7 : Disclosure of Proxy Voting Policies and Procedures for Closed-End Management
Investment Companies.
Not Applicable.
Item 8 : Portfolio Managers of Closed-End Management Investment Companies.
Not Applicable.
Item 9 : Purchase of Equity Securities by Closed-End Management Investment Company and
Affiliated Purchasers.
Not Applicable.
Item 10 : Submission of Matters to a Vote of Security Holders.
Not Applicable.
Item 11 : Controls and Procedures. |
(a) Disclosure Controls and Procedures. The Principal Executive and Financial Officers concluded that the Registrant s Disclosure Controls and Procedures are effective based on their evaluation of the Disclosure Controls and Procedures as of a date within 90 days of the filing date of this report.
(b) Internal Control Over Financial Reporting. There were no significant changes in Registrant s Internal Control Over Financial Reporting or in other factors that could significantly affect this control subsequent to the date of the evaluation, including any corrective actions with regard to significant deficiencies and material weaknesses.
Item 12: Disclosure of Securities Lending Activities for Closed-End Management Investment Companies.
Not Applicable.
Item 13: Exhibits.
(a) Code of Ethics.
(b) Certifications.
Pursuant to the requirements of the Securities Exchange Act of 1934 and the Investment Company Act of 1940, the registrant has duly caused this report to be signed on its behalf by the undersigned, thereunto duly authorized.
| |
| | VANGUARD MASSACHUSETTS TAX-EXEMPT FUNDS |
| |
| |
| BY: | /s/ MORTIMER J. BUCKLEY* |
| | MORTIMER J. BUCKLEY |
| | CHIEF EXECUTIVE OFFICER |
| |
| Date: | January 22, 2018 |
Pursuant to the requirements of the Securities Exchange Act of 1934 and the Investment Company Act of 1940, this report has been signed below by the following persons on behalf of the registrant and in the capacities and on the dates indicated.
| |
| | VANGUARD MASSACHUSETTS TAX-EXEMPT FUNDS |
| |
| BY: | /s/ MORTIMER J. BUCKLEY * |
| | MORTIMER J. BUCKLEY |
| | CHIEF EXECUTIVE OFFICER |
|
| Date: | January 22, 2018 |
| |
| | VANGUARD MASSACHUSETTS TAX-EXEMPT FUNDS |
| |
| BY: | /s/ THOMAS J. HIGGINS* |
| | THOMAS J. HIGGINS |
| | CHIEF FINANCIAL OFFICER |
|
| Date: | January 22, 2018 |
* By: /s/ Anne E. Robinson
Anne E. Robinson, pursuant to a Power of Attorney filed on January 18, 2018 see file Number 33-32216, Incorporated by Reference.
0448435, v0.61