UNITED STATES
SECURITIES AND EXCHANGE COMMISSION
Washington, D.C. 20549
FORM N-CSR
CERTIFIED SHAREHOLDER REPORT
OF
REGISTERED MANAGEMENT INVESTMENT COMPANIES
| | |
Investment Company Act file number: 811-09005 |
Name of Registrant: Vanguard Massachusetts Tax-Exempt Funds |
Address of Registrant: P.O. Box 2600
Valley Forge, PA 19482 |
|
Name and address of agent for service: Heidi Stam, Esquire
P.O. Box 876
Valley Forge, PA 19482 |
|
|
Registrant’s telephone number, including area code: (610) 669-1000 |
| Date of fiscal year end: November 30 | |
Date of reporting period: December 1, 2013 – November 30, 2014 |
| Item 1: Reports to Shareholders | |

Annual Report | November 30, 2014
Vanguard Massachusetts Tax-Exempt Fund
The mission continues
On May 1, 1975, Vanguard began operations, a fledgling company based on the simple but revolutionary idea that a mutual fund company should be managed solely in the interest of its investors.
Four decades later, that revolutionary spirit continues to animate the enterprise. Vanguard remains on a mission to give investors the best chance of investment success.
As we mark our 40th anniversary, we thank you for entrusting your assets to Vanguard and giving us the opportunity to help you reach your financial goals in the decades to come.
| |
| Contents | |
| Your Fund’s Total Returns. | 1 |
| Chairman’s Letter. | 2 |
| Advisor’s Report. | 7 |
| Fund Profile. | 11 |
| Performance Summary. | 12 |
| Financial Statements. | 14 |
| About Your Fund’s Expenses. | 33 |
| Glossary. | 35 |
Please note: The opinions expressed in this report are just that—informed opinions. They should not be considered promises or advice. Also, please keep in mind that the information and opinions cover the period through the date on the front of this report. Of course, the risks of investing in your fund are spelled out in the prospectus.
See the Glossary for definitions of investment terms used in this report.
About the cover: Since our founding, Vanguard has drawn inspiration from the enterprise and valor demonstrated by British naval hero Horatio Nelson and his command at the Battle of the Nile in 1798. The photograph displays a replica of a merchant ship from the same era as Nelson’s flagship, the HMS Vanguard.
Your Fund’s Total Returns
| | | | | | |
| Fiscal Year Ended November 30, 2014 | | | | | |
| | SEC
Yield | Taxable-
Equivalent
Yield | Income
Returns | Capital
Returns | Total
Returns |
| |
| |
| Vanguard Massachusetts Tax-Exempt Fund | 2.16% | 4.03% | 3.48% | 5.84% | 9.32% |
| Barclays MA Municipal Bond Index | | | | | 7.72 |
| Massachusetts Municipal Debt Funds Average | | | | | 8.86 |
Massachusetts Municipal Debt Funds Average: Derived from data provided by Lipper, a Thomson Reuters Company.
The calculation of taxable-equivalent yield assumes a typical itemized tax return and is based on the maximum federal tax rate of 43.4% and the maximum income tax rate for the state. Local taxes were not considered. Please see the prospectus for a detailed explanation of the calculation.
| | | | | |
Your Fund’s Performance at a Glance
November 30, 2013, Through November 30, 2014 | | | | |
| | | | |
| | | | Distributions Per Share |
| | Starting
Share
Price | Ending
Share
Price | Income
Dividends | Capital
Gains |
| |
| Vanguard Massachusetts Tax-Exempt Fund | $10.27 | $10.87 | $0.345 | $0.000 |
1

Chairman’s Letter
Dear Shareholder,
After a rough start, the broad U.S. municipal bond market advanced for 11 consecutive months to finish the fiscal year ended November 30, 2014, with a return of about 8%.
Vanguard Massachusetts Tax-Exempt Fund participated in this upswing and exceeded the broader market result. The fund returned 9.32% for the 12 months, surpassing the 7.72% return of its benchmark, the Barclays Massachusetts Municipal Bond Index, and the 8.86% average return of competing Massachusetts tax-exempt funds.
Price appreciation accounted for a healthy portion of the fund’s result, unlike in the previous fiscal year, when price depreciation was a significant detractor. The fund’s capital return this time was 5.84%, and its return from interest income was 3.48%.
Because bond yields and prices move in opposite directions, the fund’s 30-day SEC yield fell to 2.16% as of November 30, from 2.94% a year earlier.
Please note: The fund is permitted to invest in securities whose income is subject to the alternative minimum tax (AMT). However, as of the end of the period, it owned none of these bonds.
U.S. taxable bond prices climbed as yields declined even further
Yields in the United States were low when the fiscal year began, and they defied expectations by moving even lower despite the Federal Reserve’s
winding down of its bond-buying program from January through October. Falling yields and “safe haven” demand by overseas investors for U.S. Treasuries helped the broad U.S. taxable bond market return 5.27% for the 12 months. The yield of the 10-year Treasury note ended November at 2.25%, down from 2.74% a year earlier.
International bonds (as measured by the Barclays Global Aggregate Index ex USD) returned –2.53% for U.S. investors, as many foreign currencies weakened against the U.S. dollar during the fiscal year. (International bonds produced a positive return for U.S. investors after currency hedging, which helps mitigate the effects of movements in foreign exchange rates.)
Monetary actions gave U.S. stocks a boost, as did corporate earnings
The broad U.S. stock market gained more than 15% for the 12 months. The generally accommodative global monetary actions and strong corporate earnings offset investors’ concern about geopolitical issues such as economic struggles in Europe and strife in the Middle East.
Investors seemed to take comfort in the Fed’s assurances that it would keep short-term interest rates low, even as it ended its bond-buying program as anticipated. The Bank of Japan, the European Central Bank, and the People’s Bank of China all announced more stimulus measures.
| | | |
| Market Barometer | | | |
| | Average Annual Total Returns
Periods Ended November 30, 2014 |
| | One
Year | Three
Years | Five
Years |
| Bonds | | | |
| Barclays U.S. Aggregate Bond Index (Broad taxable |
| market) | 5.27% | 3.00% | 4.10% |
| Barclays Municipal Bond Index (Broad tax-exempt market) | 8.23 | 4.78 | 5.12 |
| Citigroup Three-Month U.S. Treasury Bill Index | 0.04 | 0.04 | 0.06 |
| |
| Stocks | | | |
| Russell 1000 Index (Large-caps) | 16.56% | 21.05% | 16.25% |
| Russell 2000 Index (Small-caps) | 3.99 | 18.36 | 16.69 |
| Russell 3000 Index (Broad U.S. market) | 15.53 | 20.84 | 16.28 |
| FTSE All-World ex US Index (International) | 1.05 | 10.29 | 5.94 |
| |
| CPI | | | |
| Consumer Price Index | 1.32% | 1.44% | 1.77% |
3
As many currencies weakened against the U.S. dollar, international stocks managed a return of about 1% in dollar terms. Emerging markets fared better than the developed markets of Europe and the Pacific region.
Reversing their 2013 performance, muni bonds made a strong showing
Municipal bonds were under pressure through much of 2013 amid the prospect of the Fed’s taper and unsettling headlines about distressed issuers such as Puerto Rico and Detroit. But other considerations took center stage in the new year, including a domestic economic recovery marked by stops and starts, instability in Eastern Europe and the Middle East, and muni yields that were attractive both on their own and compared with those of Treasuries and corporate bonds.
These factors contributed to resurgent demand for munis in 2014 by their usual buyers: high-income earners looking for tax-exempt income. Munis’ compelling yields elicited demand from nontraditional buyers as well, including foreign investors and U.S. banks, insurance companies, and hedge funds.
Tax collection remained solid at state and local levels, broadly speaking. While supply remained generally light across the nation, Massachusetts bucked this trend, with supply rising in 2014.
| | |
Expense Ratios
Your Fund Compared With Its Peer Group |
|
| | | Peer Group
Average |
| | Fund |
| Massachusetts Tax-Exempt Fund | 0.16% | 1.10% |
| The fund expense ratio shown is from the prospectus dated March 27, 2014, and represents estimated costs for the current fiscal year. For the fiscal year ended November 30, 2014, the fund’s expense ratio was 0.16%. The peer-group expense ratio is derived from data provided by Lipper, a Thomson Reuters Company, and captures information through year-end 2013. |
|
|
| |
| Peer group: Massachusetts Municipal Debt Funds. | | |
4
Although the Massachusetts Tax-Exempt Fund wasn’t affected as much by this trend, it benefited from the skill of its advisor, Vanguard Fixed Income Group. An outsized allocation to higher-yielding, lower-rated securities (particularly those ranked A in credit quality by major rating agencies) provided an advantage.
The fund’s holdings in premium callable bonds also significantly aided relative performance. Such bonds may be redeemed before maturity, so they tend to pay slightly higher coupons as compensation for that risk.
Although it was a strong year for munis, keep in mind that because yields have fallen so low, it’s unlikely that the fund will produce similar returns next year.
For more information about the advisor’s approach and the fund’s positioning during the year, please see the Advisor’s Report that follows this letter.
Strong credit analysis guided the fund through tough times
Over the ten years ended November 30, 2014, worrisome news about the credit-worthiness of municipal issuers and a small number of widely publicized municipal bankruptcies rattled the muni market at times. At Vanguard, however, our in-house analysis—one of the main pillars of our investment process—has helped us sidestep potential problems and identify opportunities among muni bonds. And that process is ongoing, even for the bonds already held in our portfolio.
| | |
Total Returns
Ten Years Ended November 30, 2014 |
|
| | Average
Annual Return |
| |
| Massachusetts Tax-Exempt Fund | 4.53% |
| Barclays MA Municipal Bond Index | 4.82 |
| Massachusetts Municipal Debt Funds Average | 3.90 |
| Massachusetts Municipal Debt Funds Average: Derived from data provided by Lipper, a Thomson Reuters Company. | |
The figures shown represent past performance, which is not a guarantee of future results. (Current performance may be lower or higher than the performance data cited. For performance data current to the most recent month-end, visit our website at vanguard.com/performance.) Note, too, that both investment returns and principal value can fluctuate widely, so an investor’s shares, when sold, could be worth more or less than their original cost.
5
The work of our credit analysts, along with the competitive advantage of our low costs, has been instrumental in enabling the fund to outperform its peer group and stay competitive with its benchmark index. The fund’s average annual return for the decade was 4.53%, a bit behind the index return of 4.82% but ahead of the 3.90% peer-fund average.
Although we take heed of the benchmark, our most important gauge of the fund’s relative success is how it performs against its peers. Competitors generally have higher costs than Vanguard, whereas benchmark indexes have none, which gives the benchmarks an inevitable performance advantage.
Realistic expectations are key to reaching your long-term goals
Over the last several years, investors have grown accustomed to mostly strong returns from both stocks and bonds. This, of course, has been a welcome development for our clients as they strive to achieve their financial goals. But as any experienced investor knows, markets aren’t always so favorable
Our recently published economic and market outlook research paper cautions that, over the next decade, returns for a balanced 60% equity/40% bond portfolio are likely to be moderately below long-run historical averages. (For more details, see Vanguard’s Economic and Investment Outlook, available at vanguard.com/research.)
I point out our modest projections not to be discouraging but to be helpful. Realistic expectations are the foundation of a sound plan to reach your long-term objective, whether it’s establishing a secure retirement, paying for a child’s education, or achieving some other goal.
If you expect too much from the markets, you might not save sufficiently. You might also take on excessive risk in your portfolio in the pursuit of unrealistically high returns.
We firmly believe that a better course is to follow Vanguard’s principles for investing success:
• Goals. Create clear, appropriate investment goals.
• Balance. Develop a suitable asset allocation using broadly diversified funds.
• Cost. Minimize cost.
• Discipline. Maintain perspective and long-term discipline.
The beauty of these principles is that, unlike market returns, each one is within your control, and focusing on them can put you on the right path.
As always, thank you for investing with Vanguard.
Sincerely,

F. William McNabb III
Chairman and Chief Executive Officer
December 12, 2014
Advisor’s Report
For the 12 months ended November 30, 2014, Vanguard Massachusetts Tax-Exempt Fund returned 9.32%. The fund surpassed its benchmark, the Barclays Massachusetts Municipal Bond Index, which returned 7.72%, and its peer group, which had an average return of 8.86%.
The investment environment
It was a remarkable year for municipal bonds. While the macroeconomic environment helped the overall bond market produce solid returns, munis did even better, boosted by light supply and a surge in demand. In contrast to most of the nation, supply increased in Massachusetts, a difference we’ll address in more detail later in this letter.
The bond market was shaken in 2013 when the Federal Reserve signaled its intention to wind down its unprecedented bond-buying program. The Fed eventually succeeded in reassuring investors that the tapering would be gradual, that it would proceed only if the Fed saw sufficient underlying strength in the economy, and that interest rates were likely to remain low for a considerable period even after the program ended.
The economy provided the signals the Fed was looking for. Gross domestic product increased at an annual rate of above 2.5% over the 12 months ended September 30, 2014, despite a sharp contraction in the first quarter of 2014
| | | |
Yields of Municipal Securities
(AAA-Rated General-Obligation Issues) |
|
| | November 30, | November 30, |
| Maturity | 2013 | 2014 |
| 2 years | 0.33% | 0.14% |
| 5 years | 1.16 | 0.88 |
| 10 years | 2.65 | 1.98 |
| 30 years | 4.10 | 3.00 |
| Source: Vanguard. | | |
7
due in part to severe winter weather. The labor market also improved, with the U.S. unemployment rate falling to 5.8%, and inflation remained well below the Fed’s target. Massachusetts’ labor market improved as well, with state unemployment at 6.0% in October.
This benign environment for bonds—moderate economic growth, low inflation, and continuing easy monetary policy—helped revive demand. Heightened tensions in Eastern Europe and the Middle East were factors as well, with more risk-averse investors turning to bonds as a safe harbor. International buyers also stepped in, drawn by the relative value of U.S. bonds and the strong dollar.
Over the period, the Treasury yield curve flattened, as securities with longer maturities strongly outperformed those with shorter maturities. Corporate bonds as a whole fared even better as investors were lured by their higher yields, drawing credit spreads tighter.
Demand for municipal securities rebounded. After munis fell out of favor in 2013, their valuations reached very attractive levels compared with Treasuries and corporate bonds. Those valuations drew back individual investors looking for tax-free income along with many buyers that otherwise would not have been interested, including insurance companies, pension funds, and foreign investors.
Muni investors have acknowledged that many issuers have made progress in putting their fiscal houses in order since the Great Recession. For states as a whole, tax revenues have been rising for four years. Local governments are also in better shape now that property taxes, which make up a good portion of their total revenues, have started to pick up along with the housing market.
Revenue in Massachusetts for the state fiscal year ended June 30, 2014, was just ahead of official estimates and also incorporated a small income tax cut, from 5.25% to 5.20%, that took effect last January. Withholding taxes, estimated payments, and sales and use taxes all showed solid gains, but final tax collections fell below forecast, as they did in many states.
Massachusetts’ economy continues to recover more quickly than that of the nation as a whole, according to a gauge of current economic conditions for each state published monthly by the Federal Reserve Bank of Philadelphia. The bank’s index for Massachusetts climbed 19% from its low point in 2009 through October 2014, compared with a 14% increase for the U.S. index.
The commonwealth recently began two initiatives, each with potential to reduce the volume of long-term, fixed-rate bonds available for bond funds. In March, it launched MassDirect Notes, a program designed to give retail investors direct access to new-issue Massachusetts general obligation bonds. The notes have maturities of up to ten years only. Through November 30, roughly $310
8
million worth of MassDirect Notes were issued in 11 series, with $450 million more expected to be issued through mid-2015.
Separately, in June, Massachusetts announced a plan to reduce interest rate risk and cash-flow volatility through a long-term asset/liability management program. To achieve its goal, it plans to issue up to $3.6 billion of variable-rate bonds, instead of 100% fixed-rate bonds, over the next five years.
Management of the fund
Our outsized allocation to longer-dated bonds worked out well. Although many investors thought rates would increase significantly and wanted to limit their exposure to the longer end of the yield curve, we thought that rates would remain relatively stable and that holding bonds with maturities of ten years or more would help us maximize yield.
As for credit exposure in the fund, we saw relative value in A-rated bonds in particular when the period began. Their prices rose significantly as investors intensified their search for yield, and so, as with longer-dated bonds, we gradually reduced our exposure.
Other favorable decisions included our allocation to premium callable bonds; because of the risk that their issuers may redeem them before they mature, they offer a higher yield than noncallable bonds.
Unlike in many states, Massachusetts’ bond issuance increased. This larger supply slightly hindered overall performance but provided opportunities. Recent noteworthy investments include holdings in a $566 million Massachusetts Water Pollution Abatement Trust new issue deal and a $156 million Massachusetts Port Authority new issue deal.
Although the fund’s overall results were solid, there were areas of weakness. Our allocation to premium callable bonds generally lifted returns, but our modest underweighting to more mature callable bonds––particularly those issued more than three years ago––restrained performance a bit.
A look ahead
The strong performance of municipal bonds has made their valuations much higher than 12 months ago. And with yields so low, the economy still improving, and a potential interest rate rise in the offing, we expect muni returns over the next year to be more or less in line with the coupons they pay out.
Our outlook is for the U.S. economy to grow at a moderate pace in 2015. The Fed is likely to begin raising the federal funds target rate in the second half of the year. Although market volatility will probably pick up as we approach that point, we believe that the pace of tightening in monetary policy will be slow and that the target rate will ultimately end up below its historical average. For muni bonds, that’s likely to mean interest rates will remain lower than their levels over the past 10 to 15 years.
As we enter the new fiscal year, the fund has a duration that is modestly shorter than its benchmark’s (because of the prospect of rising rates) and an allocation favoring
9
longer maturities, but we’ve taken a more neutral stance on quality. In terms of sectors, the fund still has a tilt toward health care, project finance, and corporate-backed munis that we believe provide attractive compensation for the risk being taken. As for Puerto Rico, we are likely to remain largely on the sidelines until we see sustained growth and budget discipline. Although the yields of Puerto Rican bonds are high, so is their level of credit risk because of the territory’s debt load, unbalanced budget, and poor economic prospects.
Given that an eventual tightening of monetary policy is likely to mean more market volatility, we will continue to hold above-average liquidity that will give us the ability to take advantage of any pricing dislocations that may arise.
As always, our experienced team of portfolio managers, traders, and credit analysts will seek out opportunities to add to the fund’s performance by identifying bonds that appear to be mispriced by the market.
Christopher W. Alwine, CFA, Principal,
Head of Municipal Bond Funds
Marlin G. Brown, Portfolio Manager
Vanguard Fixed Income Group
December 16, 2014
10
Massachusetts Tax-Exempt Fund
Fund Profile
As of November 30, 2014
| | | | |
| Financial Attributes | | |
| | | Barclays
MA
Municipal
Bond
Index | Barclays
Municipal
Bond
Index |
| | |
| | Fund |
| Number of Bonds | 284 | 1,567 | 46,044 |
| Yield to Maturity |
| (before expenses) | 2.3% | 2.0% | 2.1% |
| Average Coupon | 4.6% | 4.9% | 4.8% |
| Average Duration | 6.3 years | 6.8 years | 6.5 years |
| Average Stated |
| Maturity | 16.0 years | 13.2 years | 13.4 years |
| Ticker Symbol | VMATX | — | — |
| Expense Ratio1 | 0.16% | — | — |
| 30-Day SEC Yield | 2.16% | — | — |
| Short-Term | | | |
| Reserves | 4.8% | — | — |
| | | |
| Volatility Measures | | |
| | Barclays MA
Municipal
Bond Index | Barclays
Municipal
Bond Index |
| |
| |
| R-Squared | 0.99 | 0.99 |
| Beta | 1.16 | 1.18 |
| These measures show the degree and timing of the fund’s fluctuations compared with the indexes over 36 months. |
|
| | |
| Distribution by Stated Maturity | |
| (% of portfolio) | |
| Under 1 Year | 6.2% |
| 1 - 3 Years | 4.0 |
| 3 - 5 Years | 4.2 |
| 5 - 10 Years | 11.9 |
| 10 - 20 Years | 37.0 |
| 20 - 30 Years | 33.8 |
| Over 30 Years | 2.9 |
| | |
| Distribution by Credit Quality (% of portfolio) |
| AAA | 17.5% |
| AA | 60.8 |
| A | 13.9 |
| BBB | 7.7 |
| Not Rated | 0.1 |
| Credit-quality ratings are from Moody's and S&P. The higher rating for each issue is shown. "Not Rated" is used to classify securities for which a rating is not available. For more information about these ratings, see the Glossary entry for Credit Quality. |
|
|
|
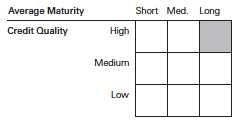
Investment Focus
1 The expense ratio shown is from the prospectus dated March 27, 2014, and represents estimated costs for the current fiscal year. For the fiscal year ended November 30, 2014, the expense ratio was 0.16%.
11
Massachusetts Tax-Exempt Fund
Performance Summary
All of the returns in this report represent past performance, which is not a guarantee of future results that may be achieved by the fund. (Current performance may be lower or higher than the performance data cited. For performance data current to the most recent month-end, visit our website at vanguard.com/performance.) Note, too, that both investment returns and principal value can fluctuate widely, so an investor’s shares, when sold, could be worth more or less than their original cost. The returns shown do not reflect taxes that a shareholder would pay on fund distributions or on the sale of fund shares.
Cumulative Performance: November 30, 2004, Through November 30, 2014
Initial Investment of $10,000

| | | | | |
| | | Average Annual Total Returns
Periods Ended November 30, 2014 | |
| | | |
| | | One
Year | Five
Years | Ten
Years | Final Value
of a $10,000
Investment |
| | |
| Massachusetts Tax-Exempt Fund | 9.32% | 4.81% | 4.53% | $15,573 |
| •••••••• | Barclays MA Municipal Bond Index | 7.72 | 4.73 | 4.82 | 16,013 |
| – – – – | Massachusetts Municipal Debt Funds | 8.86 | 4.62 | 3.90 | 14,661 |
| Barclays Average Municipal Bond Index | 8.23 | 5.12 | 4.81 | 15,999 |
| Massachusetts Municipal Debt Funds Average: Derived from data provided by Lipper, a Thomson Reuters Company. |
See Financial Highlights for dividend and capital gains information.
12
Massachusetts Tax-Exempt Fund
| | | | |
| Fiscal-Year Total Returns (%): November 30, 2004, Through November 30, 2014 | |
| | | | | Barclays MA
Municipal
Bond Index
Total Returns |
| | | | |
| | | | |
| Fiscal Year | Income Returns | Capital Returns | Total Returns |
| 2005 | 4.12% | -0.59% | 3.53% | 3.43% |
| 2006 | 4.38 | 2.16 | 6.54 | 6.13 |
| 2007 | 4.18 | -2.03 | 2.15 | 3.27 |
| 2008 | 4.00 | -6.72 | -2.72 | -1.30 |
| 2009 | 4.42 | 7.94 | 12.36 | 13.60 |
| 2010 | 3.80 | -0.39 | 3.41 | 3.96 |
| 2011 | 3.76 | 2.56 | 6.32 | 6.41 |
| 2012 | 3.49 | 6.92 | 10.41 | 9.57 |
| 2013 | 3.02 | -7.73 | -4.71 | -3.52 |
| 2014 | 3.48 | 5.84 | 9.32 | 7.72 |
| | | | | | | |
| Average Annual Total Returns: Periods Ended September 30, 2014 | | | |
| This table presents returns through the latest calendar quarter—rather than through the end of the fiscal period. |
| Securities and Exchange Commission rules require that we provide this information. |
| |
| | | | | | | Ten Years |
| | Inception Date | One Year | Five Years | Income | Capital | Total |
| Massachusetts | | | | | | |
| Tax-Exempt Fund | 12/9/1998 | 9.07% | 4.27% | 3.87% | 0.53% | 4.40% |
13
Massachusetts Tax-Exempt Fund
Financial Statements
Statement of Net Assets
As of November 30, 2014
The fund reports a complete list of its holdings in regulatory filings four times in each fiscal year, at the quarter-ends. For the second and fourth fiscal quarters, the lists appear in the fund’s semiannual and annual reports to shareholders. For the first and third fiscal quarters, the fund files the lists with the Securities and Exchange Commission on Form N-Q. Shareholders can look up the fund’s Forms N-Q on the SEC’s website at sec.gov. Forms N-Q may also be reviewed and copied at the SEC’s Public Reference Room (see the back cover of this report for further information).
| | | | |
| | | | Face | Market |
| | | Maturity | Amount | Value |
| | Coupon | Date | ($000) | ($000) |
| Tax-Exempt Municipal Bonds (99.0%) | | | | |
| Massachusetts (98.4%) | | | | |
| Boston MA GO | 5.000% | 2/1/24 | 2,345 | 2,807 |
| Boston MA GO | 5.000% | 3/1/24 | 3,000 | 3,671 |
| Boston MA Housing Authority Revenue | 5.000% | 4/1/23 (4) | 2,000 | 2,241 |
| Boston MA Housing Authority Revenue | 5.000% | 4/1/25 (4) | 5,440 | 6,079 |
| Boston MA Water & Sewer Commission Revenue | 5.000% | 11/1/20 | 1,550 | 1,855 |
| Boston MA Water & Sewer Commission Revenue | 5.000% | 11/1/25 | 3,725 | 4,304 |
| Boston MA Water & Sewer Commission Revenue | 5.000% | 11/1/30 | 1,000 | 1,140 |
| Boston MA Water & Sewer Commission Revenue | 5.000% | 11/1/30 | 750 | 874 |
| Braintree MA GO | 5.000% | 5/15/27 | 4,000 | 4,587 |
| Cambridge MA GO | 5.000% | 1/1/23 | 850 | 1,018 |
| Holyoke MA GO | 5.000% | 9/1/30 | 1,690 | 1,943 |
| Massachusetts Bay Transportation Authority | | | | |
| Assessment Revenue | 5.250% | 7/1/31 | 2,285 | 2,957 |
| Massachusetts Bay Transportation Authority | | | | |
| Assessment Revenue | 5.250% | 7/1/34 | 18,000 | 20,264 |
| Massachusetts Bay Transportation Authority | | | | |
| Assessment Revenue | 5.000% | 7/1/41 | 5,000 | 5,640 |
| Massachusetts Bay Transportation Authority | | | | |
| Sales Tax Revenue | 5.500% | 7/1/17 (ETM) | 75 | 84 |
| Massachusetts Bay Transportation Authority | | | | |
| Sales Tax Revenue | 5.250% | 7/1/22 | 3,500 | 4,330 |
| Massachusetts Bay Transportation Authority | | | | |
| Sales Tax Revenue | 5.500% | 7/1/22 | 5,285 | 6,631 |
| Massachusetts Bay Transportation Authority | | | | |
| Sales Tax Revenue | 5.000% | 7/1/23 | 4,000 | 4,918 |
| Massachusetts Bay Transportation Authority | | | | |
| Sales Tax Revenue | 5.250% | 7/1/23 | 2,825 | 3,534 |
| Massachusetts Bay Transportation Authority | | | | |
| Sales Tax Revenue | 5.500% | 7/1/24 | 3,020 | 3,891 |
| Massachusetts Bay Transportation Authority | | | | |
| Sales Tax Revenue | 5.500% | 7/1/26 (14) | 2,000 | 2,575 |
| Massachusetts Bay Transportation Authority | | | | |
| Sales Tax Revenue | 5.000% | 7/1/27 | 5,000 | 6,209 |
| Massachusetts Bay Transportation Authority | | | | |
| Sales Tax Revenue | 0.000% | 7/1/29 | 1,020 | 539 |
| Massachusetts Bay Transportation Authority | | | | |
| Sales Tax Revenue | 5.250% | 7/1/33 | 2,000 | 2,578 |
14
Massachusetts Tax-Exempt Fund
| | | | |
| | | | Face | Market |
| | | Maturity | Amount | Value |
| | Coupon | Date | ($000) | ($000) |
| Massachusetts Bay Transportation Authority | | | | |
| Sales Tax Revenue | 5.000% | 7/1/35 | 2,145 | 2,432 |
| 1 Massachusetts Bay Transportation Authority | | | | |
| Sales Tax Revenue TOB VRDO | 0.160% | 12/5/14 | 2,889 | 2,889 |
| Massachusetts Clean Energy Cooperative Corp. | | | | |
| Revenue (Municipal Lighting Plant) | 5.000% | 7/1/26 | 2,875 | 3,413 |
| Massachusetts Clean Energy Cooperative Corp. | | | | |
| Revenue (Municipal Lighting Plant) | 5.000% | 7/1/29 | 3,300 | 3,848 |
| Massachusetts Clean Energy Cooperative Corp. | | | | |
| Revenue (Municipal Lighting Plant) | 5.000% | 7/1/32 | 2,500 | 2,878 |
| Massachusetts College Building | | | | |
| Authority Revenue | 0.000% | 5/1/17 (10) | 3,340 | 3,261 |
| Massachusetts College Building | | | | |
| Authority Revenue | 5.000% | 5/1/25 | 1,100 | 1,319 |
| Massachusetts College Building | | | | |
| Authority Revenue | 5.000% | 5/1/26 | 1,430 | 1,712 |
| Massachusetts College Building | | | | |
| Authority Revenue | 5.000% | 5/1/27 | 1,200 | 1,427 |
| Massachusetts College Building | | | | |
| Authority Revenue | 5.000% | 5/1/29 | 1,500 | 1,732 |
| Massachusetts College Building | | | | |
| Authority Revenue | 5.000% | 5/1/30 | 1,610 | 1,856 |
| Massachusetts College Building | | | | |
| Authority Revenue | 5.000% | 5/1/30 | 1,075 | 1,237 |
| Massachusetts College Building | | | | |
| Authority Revenue | 5.000% | 5/1/36 | 4,000 | 4,526 |
| Massachusetts College Building | | | | |
| Authority Revenue | 5.000% | 5/1/41 | 5,000 | 5,607 |
| Massachusetts College Building | | | | |
| Authority Revenue | 5.000% | 5/1/43 | 3,285 | 3,661 |
| Massachusetts College Building | | | | |
| Authority Revenue | 4.500% | 5/1/48 | 3,000 | 3,177 |
| Massachusetts Department of Transportation | | | | |
| Metropolitan Highway System Revenue | 5.000% | 1/1/20 | 3,500 | 4,096 |
| Massachusetts Department of Transportation | | | | |
| Metropolitan Highway System Revenue | 5.000% | 1/1/32 | 5,620 | 6,208 |
| Massachusetts Department of Transportation | | | | |
| Metropolitan Highway System Revenue | 5.000% | 1/1/35 | 2,350 | 2,650 |
| Massachusetts Department of Transportation | | | | |
| Metropolitan Highway System Revenue | 5.000% | 1/1/37 | 3,000 | 3,286 |
| Massachusetts Department of Transportation | | | | |
| Metropolitan Highway System Revenue VRDO | 0.030% | 12/5/14 | 5,000 | 5,000 |
| Massachusetts Development Finance Agency | | | | |
| Higher Education Revenue (Emerson College) | 5.000% | 1/1/18 | 2,000 | 2,158 |
| Massachusetts Development Finance Agency | | | | |
| Higher Education Revenue (Emerson College) | 5.000% | 1/1/20 | 3,105 | 3,340 |
| Massachusetts Development Finance Agency | | | | |
| Higher Education Revenue (Emerson College) | 5.000% | 1/1/22 | 1,985 | 2,130 |
| Massachusetts Development Finance Agency | | | | |
| Hospital Revenue (Cape Cod Healthcare | | | | |
| Obligated Group) | 5.250% | 11/15/36 | 5,130 | 5,740 |
| Massachusetts Development Finance Agency | | | | |
| Revenue (Baystate Medical Obligated Group) | 5.000% | 7/1/34 | 1,500 | 1,674 |
15
Massachusetts Tax-Exempt Fund
| | | | |
| | | | Face | Market |
| | | Maturity | Amount | Value |
| | Coupon | Date | ($000) | ($000) |
| Massachusetts Development Finance Agency | | | | |
| Revenue (Baystate Medical Obligated Group) | 5.000% | 7/1/44 | 2,000 | 2,183 |
| Massachusetts Development Finance Agency | | | | |
| Revenue (Berklee College of Music) | 5.250% | 10/1/41 | 3,300 | 3,685 |
| Massachusetts Development Finance Agency | | | | |
| Revenue (Berkshire Health System) | 5.000% | 10/1/22 | 2,000 | 2,267 |
| Massachusetts Development Finance Agency | | | | |
| Revenue (Berkshire Health System) | 5.000% | 10/1/28 | 1,250 | 1,377 |
| Massachusetts Development Finance Agency | | | | |
| Revenue (Berkshire Health System) | 5.000% | 10/1/29 | 1,500 | 1,642 |
| Massachusetts Development Finance Agency | | | | |
| Revenue (Berkshire Health System) | 5.000% | 10/1/30 | 1,430 | 1,558 |
| Massachusetts Development Finance Agency | | | | |
| Revenue (Berkshire Health System) | 5.000% | 10/1/31 | 1,250 | 1,358 |
| Massachusetts Development Finance Agency | | | | |
| Revenue (Boston College) | 5.000% | 7/1/19 | 500 | 586 |
| Massachusetts Development Finance Agency | | | | |
| Revenue (Boston College) | 5.000% | 7/1/40 | 2,000 | 2,254 |
| Massachusetts Development Finance Agency | | | | |
| Revenue (Boston Medical Center) | 5.000% | 7/1/29 | 6,000 | 6,438 |
| Massachusetts Development Finance Agency | | | | |
| Revenue (Boston University) | 6.000% | 5/15/29 (2) | 1,400 | 1,751 |
| Massachusetts Development Finance Agency | | | | |
| Revenue (Boston University) | 5.000% | 10/1/35 (2) | 2,000 | 2,062 |
| Massachusetts Development Finance Agency | | | | |
| Revenue (Boston University) | 5.375% | 5/15/39 | 1,575 | 1,936 |
| Massachusetts Development Finance Agency | | | | |
| Revenue (Boston University) | 5.000% | 7/1/42 | 10,000 | 10,869 |
| Massachusetts Development Finance Agency | | | | |
| Revenue (Boston University) | 5.000% | 10/1/48 | 7,400 | 8,151 |
| Massachusetts Development Finance Agency | | | | |
| Revenue (Boston University) | 6.000% | 5/15/59 (10) | 5,575 | 6,915 |
| 2 Massachusetts Development Finance Agency | | | | |
| Revenue (Boston University) PUT | 0.620% | 3/30/17 | 5,000 | 5,009 |
| Massachusetts Development Finance Agency | | | | |
| Revenue (Broad Institute Inc.) | 5.250% | 4/1/37 | 4,000 | 4,592 |
| Massachusetts Development Finance Agency | | | | |
| Revenue (Carleton-Willard Village) | 5.250% | 12/1/25 | 600 | 664 |
| Massachusetts Development Finance Agency | | | | |
| Revenue (Carleton-Willard Village) | 5.625% | 12/1/30 | 550 | 613 |
| Massachusetts Development Finance Agency | | | | |
| Revenue (Children’s Hospital) | 5.000% | 10/1/34 | 2,440 | 2,831 |
| Massachusetts Development Finance Agency | | | | |
| Revenue (Children’s Hospital) | 5.000% | 10/1/46 | 5,500 | 6,226 |
| Massachusetts Development Finance Agency | | | | |
| Revenue (College of the Holy Cross) VRDO | 0.040% | 12/1/14 LOC | 2,230 | 2,230 |
| Massachusetts Development Finance Agency | | | | |
| Revenue (Commonwealth Contract Assistance) | 5.500% | 2/1/40 | 2,160 | 2,486 |
| Massachusetts Development Finance Agency | | | | |
| Revenue (Deerfield Academy) | 5.000% | 10/1/40 | 4,665 | 5,338 |
| Massachusetts Development Finance Agency | | | | |
| Revenue (Draper Laboratory) | 5.750% | 9/1/25 | 5,000 | 5,783 |
| Massachusetts Development Finance Agency | | | | |
| Revenue (Emerson College) | 5.000% | 1/1/40 | 5,000 | 5,306 |
16
Massachusetts Tax-Exempt Fund
| | | | |
| | | | Face | Market |
| | | Maturity | Amount | Value |
| | Coupon | Date | ($000) | ($000) |
| Massachusetts Development Finance Agency | | | | |
| Revenue (Harvard University) | 5.000% | 10/15/28 | 1,000 | 1,172 |
| Massachusetts Development Finance Agency | | | | |
| Revenue (Harvard University) | 5.250% | 2/1/34 | 6,000 | 7,006 |
| Massachusetts Development Finance Agency | | | | |
| Revenue (Harvard University) | 5.000% | 10/15/40 | 9,790 | 11,230 |
| Massachusetts Development Finance Agency | | | | |
| Revenue (Lawrence General Hospital) | 5.250% | 7/1/34 | 2,245 | 2,415 |
| Massachusetts Development Finance Agency | | | | |
| Revenue (Loomis Obligated Group) | 6.000% | 1/1/33 | 4,000 | 4,510 |
| Massachusetts Development Finance Agency | | | | |
| Revenue (Lowell General Hospital) | 5.000% | 7/1/37 | 4,800 | 5,139 |
| Massachusetts Development Finance Agency | | | | |
| Revenue (Lowell General Hospital) | 5.000% | 7/1/44 | 5,000 | 5,286 |
| Massachusetts Development Finance Agency | | | | |
| Revenue (Massachusetts College of | | | | |
| Pharmacy & Allied HealthSciences) | 5.000% | 7/1/19 | 175 | 202 |
| Massachusetts Development Finance Agency | | | | |
| Revenue (Massachusetts College of | | | | |
| Pharmacy & Allied HealthSciences) | 5.000% | 7/1/21 | 300 | 352 |
| Massachusetts Development Finance Agency | | | | |
| Revenue (Massachusetts College of | | | | |
| Pharmacy & Allied HealthSciences) | 5.000% | 7/1/23 | 250 | 298 |
| Massachusetts Development Finance Agency | | | | |
| Revenue (Massachusetts College of | | | | |
| Pharmacy & Allied HealthSciences) | 5.000% | 7/1/26 | 1,380 | 1,613 |
| Massachusetts Development Finance Agency | | | | |
| Revenue (Merrimack College) | 5.000% | 7/1/32 | 2,000 | 2,094 |
| Massachusetts Development Finance Agency | | | | |
| Revenue (Merrimack College) | 5.250% | 7/1/42 | 1,470 | 1,539 |
| Massachusetts Development Finance Agency | | | | |
| Revenue (Merrimack College) | 5.125% | 7/1/44 | 2,500 | 2,615 |
| Massachusetts Development Finance Agency | | | | |
| Revenue (Milford Regional Medical Center) | 5.750% | 7/15/43 | 6,755 | 7,511 |
| Massachusetts Development Finance Agency | | | | |
| Revenue (Mount Holyoke College) | 5.000% | 7/1/36 | 1,500 | 1,658 |
| Massachusetts Development Finance Agency | | | | |
| Revenue (Northeastern University) | 5.000% | 10/1/29 | 3,250 | 3,686 |
| Massachusetts Development Finance Agency | | | | |
| Revenue (Northeastern University) | 5.000% | 10/1/30 | 1,750 | 1,976 |
| Massachusetts Development Finance Agency | | | | |
| Revenue (Northeastern University) | 5.000% | 3/1/32 | 950 | 1,084 |
| Massachusetts Development Finance Agency | | | | |
| Revenue (Northeastern University) | 5.000% | 3/1/39 | 3,500 | 3,938 |
| Massachusetts Development Finance Agency | | | | |
| Revenue (Northeastern University) | 5.000% | 3/1/44 | 3,750 | 4,182 |
| Massachusetts Development Finance Agency | | | | |
| Revenue (Olin College) | 5.000% | 11/1/38 | 6,000 | 6,665 |
| Massachusetts Development Finance Agency | | | | |
| Revenue (Partners Healthcare) | 5.000% | 7/1/28 | 2,000 | 2,316 |
| Massachusetts Development Finance Agency | | | | |
| Revenue (Partners Healthcare) | 5.000% | 7/1/30 | 1,500 | 1,731 |
| Massachusetts Development Finance Agency | | | | |
| Revenue (Partners Healthcare) | 5.000% | 7/1/31 | 5,705 | 6,522 |
17
Massachusetts Tax-Exempt Fund
| | | | |
| | | | Face | Market |
| | | Maturity | Amount | Value |
| | Coupon | Date | ($000) | ($000) |
| Massachusetts Development Finance Agency | | | | |
| Revenue (Partners Healthcare) | 5.000% | 7/1/36 | 4,000 | 4,516 |
| Massachusetts Development Finance Agency | | | | |
| Revenue (Partners Healthcare) | 5.375% | 7/1/41 | 4,000 | 4,475 |
| 2 Massachusetts Development Finance Agency | | | | |
| Revenue (Partners Healthcare) PUT | 0.590% | 1/30/18 | 7,945 | 7,943 |
| Massachusetts Development Finance Agency | | | | |
| Revenue (Phillips Academy) | 5.000% | 9/1/38 | 1,545 | 1,780 |
| Massachusetts Development Finance Agency | | | | |
| Revenue (Phillips Academy) | 5.000% | 9/1/43 | 2,500 | 2,868 |
| Massachusetts Development Finance Agency | | | | |
| Revenue (Simmons College) | 5.500% | 10/1/28 | 1,000 | 1,148 |
| Massachusetts Development Finance Agency | | | | |
| Revenue (Simmons College) | 5.125% | 10/1/33 | 2,000 | 2,197 |
| Massachusetts Development Finance Agency | | | | |
| Revenue (Simmons College) | 5.250% | 10/1/39 | 3,000 | 3,300 |
| Massachusetts Development Finance Agency | | | | |
| Revenue (Southcoast Health System | | | | |
| Obligated Group) | 5.000% | 7/1/27 | 1,550 | 1,793 |
| Massachusetts Development Finance Agency | | | | |
| Revenue (Suffolk University) | 5.000% | 7/1/30 | 3,000 | 3,216 |
| Massachusetts Development Finance Agency | | | | |
| Revenue (Suffolk University) | 5.125% | 7/1/40 | 3,000 | 3,178 |
| Massachusetts Development Finance Agency | | | | |
| Revenue (Tufts Medical Center) | 7.250% | 1/1/32 | 2,500 | 3,058 |
| Massachusetts Development Finance Agency | | | | |
| Revenue (Tufts Medical Center) | 6.750% | 1/1/36 | 850 | 1,009 |
| Massachusetts Development Finance Agency | | | | |
| Revenue (Tufts Medical Center) | 6.875% | 1/1/41 | 2,000 | 2,371 |
| Massachusetts Development Finance Agency | | | | |
| Revenue (UMass Memorial Medical Center) | 5.125% | 7/1/26 | 2,750 | 2,915 |
| Massachusetts Development Finance Agency | | | | |
| Revenue (UMass Memorial Medical Center) | 5.500% | 7/1/31 | 4,750 | 5,122 |
| Massachusetts Development Finance Agency | | | | |
| Revenue (Wellesley College) | 5.000% | 7/1/42 | 2,000 | 2,306 |
| Massachusetts Development Finance Agency | | | | |
| Revenue (WGBH Educational Foundation) | 5.000% | 1/1/36 (12) | 5,000 | 5,402 |
| Massachusetts Development Finance Agency | | | | |
| Revenue (Williams College) | 5.000% | 7/1/38 | 4,000 | 4,599 |
| Massachusetts Development Finance Agency | | | | |
| Revenue (Williams College) | 5.000% | 7/1/43 | 6,000 | 6,844 |
| 2 Massachusetts Development Finance Agency | | | | |
| Revenue (Williams College) PUT | 0.320% | 7/1/17 | 5,000 | 4,991 |
| Massachusetts Development Finance Agency | | | | |
| Revenue (Worcester Polytechnic Institute) | 5.000% | 9/1/50 | 2,650 | 2,899 |
| Massachusetts Development Finance Agency | | | | |
| Special Obligation Revenue | 5.000% | 5/1/34 | 1,295 | 1,485 |
| Massachusetts Development Finance Agency | | | | |
| Special Obligation Revenue | 5.000% | 5/1/39 | 1,000 | 1,132 |
| Massachusetts Development Finance Agency | | | | |
| Special Obligation Revenue | 5.000% | 5/1/39 | 6,470 | 7,325 |
| Massachusetts Educational Financing Authority | | | | |
| Education Loan Revenue | 5.500% | 1/1/17 | 3,000 | 3,283 |
18
Massachusetts Tax-Exempt Fund
| | | | |
| | | | Face | Market |
| | | Maturity | Amount | Value |
| | Coupon | Date | ($000) | ($000) |
| Massachusetts Federal Highway GAN | | | | |
| (Accelerated Bridge Program) | 5.000% | 6/15/26 | 3,000 | 3,581 |
| Massachusetts GO | 5.250% | 8/1/17 (Prere.) | 1,500 | 1,684 |
| Massachusetts GO | 5.500% | 11/1/17 | 3,000 | 3,421 |
| 2 Massachusetts GO | 0.470% | 1/1/18 | 5,000 | 5,021 |
| Massachusetts GO | 5.000% | 8/1/18 (Prere.) | 4,185 | 4,817 |
| Massachusetts GO | 5.000% | 8/1/18 (Prere.) | 4,500 | 5,180 |
| Massachusetts GO | 5.500% | 8/1/19 | 5,000 | 5,979 |
| Massachusetts GO | 5.500% | 10/1/19 (12) | 1,000 | 1,200 |
| Massachusetts GO | 5.500% | 10/1/19 (2) | 2,000 | 2,401 |
| Massachusetts GO | 5.500% | 11/1/19 (4) | 5,550 | 6,674 |
| Massachusetts GO | 5.000% | 9/1/20 | 2,000 | 2,386 |
| Massachusetts GO | 5.000% | 8/1/21 | 5,000 | 6,018 |
| Massachusetts GO | 5.000% | 8/1/22 | 4,400 | 5,340 |
| Massachusetts GO | 5.250% | 8/1/22 | 5,000 | 6,157 |
| Massachusetts GO | 5.250% | 8/1/23 | 1,000 | 1,249 |
| Massachusetts GO | 5.000% | 11/1/23 | 4,000 | 4,865 |
| Massachusetts GO | 5.000% | 6/1/24 | 3,615 | 4,226 |
| Massachusetts GO | 5.000% | 7/1/24 | 5,765 | 6,926 |
| Massachusetts GO | 5.250% | 9/1/24 (4) | 7,800 | 9,801 |
| Massachusetts GO | 5.000% | 6/1/25 | 3,000 | 3,500 |
| Massachusetts GO | 5.000% | 7/1/25 | 9,000 | 10,708 |
| Massachusetts GO | 5.000% | 7/1/26 | 9,000 | 10,673 |
| Massachusetts GO | 5.000% | 8/1/26 | 6,500 | 7,692 |
| Massachusetts GO | 5.000% | 8/1/28 | 4,535 | 5,118 |
| Massachusetts GO | 5.500% | 8/1/30 (2) | 9,000 | 11,705 |
| Massachusetts GO | 4.000% | 8/1/32 | 5,000 | 5,232 |
| Massachusetts GO | 5.000% | 8/1/32 (2) | 1,250 | 1,375 |
| Massachusetts GO | 5.000% | 8/1/33 | 2,000 | 2,316 |
| Massachusetts GO | 5.000% | 8/1/36 | 9,000 | 10,339 |
| Massachusetts GO | 5.000% | 8/1/37 | 5,000 | 5,732 |
| Massachusetts GO | 4.000% | 6/1/42 | 8,000 | 8,151 |
| Massachusetts GO | 4.000% | 6/1/43 | 5,000 | 5,109 |
| Massachusetts GO | 4.500% | 8/1/43 | 3,705 | 3,910 |
| 1 Massachusetts GO TOB VRDO | 0.040% | 12/1/14 | 2,000 | 2,000 |
| Massachusetts GO VRDO | 0.030% | 12/1/14 | 6,600 | 6,600 |
| Massachusetts GO VRDO | 0.040% | 12/1/14 | 5,200 | 5,200 |
| Massachusetts Health & Educational Facilities | | | | |
| Authority Revenue (Berklee College of Music) | 5.000% | 10/1/26 | 1,755 | 1,926 |
| Massachusetts Health & Educational Facilities | | | | |
| Authority Revenue (Boston Medical Center) | 5.000% | 7/1/28 | 3,000 | 3,141 |
| Massachusetts Health & Educational Facilities | | | | |
| Authority Revenue (Caregroup) | 5.000% | 7/1/28 | 2,000 | 2,123 |
| Massachusetts Health & Educational Facilities | | | | |
| Authority Revenue (Caregroup) | 5.125% | 7/1/33 | 3,015 | 3,191 |
| Massachusetts Health & Educational Facilities | | | | |
| Authority Revenue (Caregroup) | 5.125% | 7/1/38 | 3,500 | 3,690 |
| Massachusetts Health & Educational Facilities | | | | |
| Authority Revenue (Children’s Hospital) | 5.500% | 12/1/39 | 4,000 | 4,592 |
| Massachusetts Health & Educational Facilities | | | | |
| Authority Revenue (Dana-Farber Cancer Institute) | 5.000% | 12/1/37 | 5,000 | 5,412 |
| Massachusetts Health & Educational Facilities | | | | |
| Authority Revenue (Harvard University) | 6.250% | 4/1/20 | 3,000 | 3,784 |
19
Massachusetts Tax-Exempt Fund
| | | | |
| | | | Face | Market |
| | | Maturity | Amount | Value |
| | Coupon | Date | ($000) | ($000) |
| Massachusetts Health & Educational Facilities | | | | |
| Authority Revenue (Harvard University) | 5.000% | 12/15/21 | 2,000 | 2,435 |
| Massachusetts Health & Educational Facilities | | | | |
| Authority Revenue (Harvard University) | 5.000% | 12/15/24 | 810 | 956 |
| Massachusetts Health & Educational Facilities | | | | |
| Authority Revenue (Harvard University) | 5.500% | 11/15/36 | 16,000 | 18,598 |
| 1 Massachusetts Health & Educational Facilities | | | | |
| Authority Revenue (Harvard University) | | | | |
| TOB VRDO | 0.050% | 12/1/14 | 4,575 | 4,575 |
| Massachusetts Health & Educational Facilities | | | | |
| Authority Revenue (Isabella Stewart | | | | |
| Gardner Museum) | 5.000% | 5/1/27 | 1,650 | 1,880 |
| Massachusetts Health & Educational Facilities | | | | |
| Authority Revenue (Isabella Stewart | | | | |
| Gardner Museum) | 5.000% | 5/1/28 | 2,080 | 2,345 |
| Massachusetts Health & Educational Facilities | | | | |
| Authority Revenue (Lahey Clinic Medical Center) | 5.250% | 8/15/37 | 6,650 | 7,039 |
| Massachusetts Health & Educational Facilities | | | | |
| Authority Revenue (MIT) | 5.000% | 7/1/17 (Prere.) | 3,500 | 3,896 |
| Massachusetts Health & Educational Facilities | | | | |
| Authority Revenue (MIT) | 5.250% | 7/1/25 | 3,605 | 4,605 |
| Massachusetts Health & Educational Facilities | | | | |
| Authority Revenue (MIT) | 5.250% | 7/1/30 | 3,000 | 3,928 |
| Massachusetts Health & Educational Facilities | | | | |
| Authority Revenue (Museum of Fine Arts) VRDO | 0.050% | 12/1/14 | 16,100 | 16,100 |
| Massachusetts Health & Educational Facilities | | | | |
| Authority Revenue (Northeastern University) | 5.000% | 10/1/19 | 3,000 | 3,498 |
| Massachusetts Health & Educational Facilities | | | | |
| Authority Revenue (Northeastern University) | 5.000% | 10/1/23 | 3,435 | 3,887 |
| Massachusetts Health & Educational Facilities | | | | |
| Authority Revenue (Northeastern University) | 5.000% | 10/1/32 | 1,000 | 1,117 |
| Massachusetts Health & Educational Facilities | | | | |
| Authority Revenue (Northeastern University) | 5.000% | 10/1/33 | 3,000 | 3,317 |
| Massachusetts Health & Educational Facilities | | | | |
| Authority Revenue (Partners Healthcare System) | 5.250% | 7/1/29 | 10,000 | 11,433 |
| 1 Massachusetts Health & Educational Facilities | | | | |
| Authority Revenue (Partners Healthcare System) | | | | |
| TOB VRDO | 0.050% | 12/5/14 | 600 | 600 |
| Massachusetts Health & Educational Facilities | | | | |
| Authority Revenue (Simmons College) | 8.000% | 10/1/15 (Prere.) | 1,025 | 1,092 |
| Massachusetts Health & Educational Facilities | | | | |
| Authority Revenue (Simmons College) | 8.000% | 10/1/39 | 1,475 | 1,566 |
| Massachusetts Health & Educational Facilities | | | | |
| Authority Revenue (South Coast Health System) | 5.000% | 7/1/39 | 6,000 | 6,468 |
| Massachusetts Health & Educational Facilities | | | | |
| Authority Revenue (Sterling & Francine Clark) | 5.000% | 7/1/36 | 6,200 | 6,564 |
| Massachusetts Health & Educational Facilities | | | | |
| Authority Revenue (Stonehill College) VRDO | 0.030% | 12/1/14 LOC | 1,000 | 1,000 |
| Massachusetts Health & Educational Facilities | | | | |
| Authority Revenue (Tufts University) | 5.250% | 2/15/22 | 1,400 | 1,716 |
| Massachusetts Health & Educational Facilities | | | | |
| Authority Revenue (Tufts University) | 5.250% | 2/15/26 | 1,880 | 2,349 |
| Massachusetts Health & Educational Facilities | | | | |
| Authority Revenue (Tufts University) VRDO | 0.030% | 12/1/14 | 1,200 | 1,200 |
20
Massachusetts Tax-Exempt Fund
| | | | |
| | | | Face | Market |
| | | Maturity | Amount | Value |
| | Coupon | Date | ($000) | ($000) |
| Massachusetts Health & Educational Facilities | | | | |
| Authority Revenue (Tufts University) VRDO | 0.030% | 12/1/14 | 1,500 | 1,500 |
| Massachusetts Health & Educational Facilities | | | | |
| Authority Revenue (Wellesley College) VRDO | 0.030% | 12/1/14 | 5,200 | 5,200 |
| Massachusetts Health & Educational Facilities | | | | |
| Authority Revenue (Williams College) | 5.000% | 7/1/31 | 385 | 408 |
| Massachusetts Health & Educational Facilities | | | | |
| Authority Revenue (Winchester Hospital) | 5.250% | 7/1/38 | 2,840 | 3,093 |
| Massachusetts Housing Finance Agency | | | | |
| Single Family Housing Revenue | 2.650% | 12/1/41 | 5,305 | 5,499 |
| Massachusetts Housing Finance Agency | | | | |
| Single Family Housing Revenue | 2.750% | 12/1/41 | 1,615 | 1,660 |
| Massachusetts Housing Finance Agency | | | | |
| Single Family Housing Revenue | 4.000% | 12/1/43 | 3,910 | 4,267 |
| Massachusetts Housing Finance Agency | | | | |
| Single Family Housing Revenue | 4.000% | 12/1/44 | 3,500 | 3,829 |
| Massachusetts Housing Finance Agency | | | | |
| Single Family Housing Revenue | 4.000% | 6/1/45 | 1,750 | 1,920 |
| Massachusetts Port Authority Revenue | 5.500% | 7/1/16 (4) | 4,000 | 4,321 |
| Massachusetts Port Authority Revenue | 5.000% | 7/1/17 (4) | 3,000 | 3,333 |
| Massachusetts Port Authority Revenue | 5.000% | 7/1/25 | 1,230 | 1,444 |
| Massachusetts Port Authority Revenue | 5.000% | 7/1/30 | 2,000 | 2,281 |
| Massachusetts Port Authority Revenue | 5.000% | 7/1/31 | 1,800 | 2,048 |
| Massachusetts Port Authority Revenue | 5.000% | 7/1/33 | 4,650 | 5,267 |
| Massachusetts Port Authority Revenue | 5.000% | 7/1/34 | 3,845 | 4,461 |
| Massachusetts School Building Authority | | | | |
| Dedicated Sales Tax Revenue | 5.000% | 8/15/15 (Prere.) | 645 | 667 |
| Massachusetts School Building Authority | | | | |
| Dedicated Sales Tax Revenue | 5.000% | 8/15/15 (Prere.) | 5,000 | 5,172 |
| Massachusetts School Building Authority | | | | |
| Dedicated Sales Tax Revenue | 5.000% | 8/15/22 | 5,000 | 6,097 |
| Massachusetts School Building Authority | | | | |
| Dedicated Sales Tax Revenue | 5.000% | 8/15/25 | 3,110 | 3,746 |
| Massachusetts School Building Authority | | | | |
| Dedicated Sales Tax Revenue | 5.000% | 8/15/26 | 5,000 | 5,992 |
| Massachusetts School Building Authority | | | | |
| Dedicated Sales Tax Revenue | 5.000% | 8/15/27 | 10,000 | 11,918 |
| Massachusetts School Building Authority | | | | |
| Dedicated Sales Tax Revenue | 5.000% | 8/15/28 | 7,250 | 8,585 |
| Massachusetts School Building Authority | | | | |
| Dedicated Sales Tax Revenue | 5.000% | 8/15/29 | 10,000 | 11,767 |
| Massachusetts School Building Authority | | | | |
| Dedicated Sales Tax Revenue | 5.000% | 8/15/30 | 8,000 | 9,358 |
| Massachusetts School Building Authority | | | | |
| Dedicated Sales Tax Revenue | 5.000% | 8/15/30 (4) | 2,500 | 2,576 |
| Massachusetts School Building Authority | | | | |
| Dedicated Sales Tax Revenue | 5.000% | 10/15/32 | 2,400 | 2,788 |
| Massachusetts School Building Authority | | | | |
| Dedicated Sales Tax Revenue | 5.250% | 10/15/35 | 10,000 | 11,727 |
| Massachusetts School Building Authority | | | | |
| Dedicated Sales Tax Revenue | 5.000% | 8/15/37 (2) | 4,735 | 5,158 |
| Massachusetts Special Obligation | | | | |
| Dedicated Tax Revenue | 5.500% | 1/1/27 (14) | 13,000 | 16,170 |
| Massachusetts Special Obligation | | | | |
| Dedicated Tax Revenue | 5.500% | 1/1/28 (14) | 3,750 | 4,676 |
21
Massachusetts Tax-Exempt Fund
| | | | |
| | | | Face | Market |
| | | Maturity | Amount | Value |
| | Coupon | Date | ($000) | ($000) |
| Massachusetts Transportation Fund Revenue | | | | |
| (Accelerated Bridge Program) | 5.000% | 6/1/21 | 5,000 | 6,055 |
| Massachusetts Transportation Fund Revenue | | | | |
| (Accelerated Bridge Program) | 5.000% | 6/1/29 | 2,000 | 2,350 |
| Massachusetts Transportation Fund Revenue | | | | |
| (Accelerated Bridge Program) | 5.000% | 6/1/33 | 2,050 | 2,372 |
| Massachusetts Transportation Fund Revenue | | | | |
| (Accelerated Bridge Program) | 4.000% | 6/1/37 | 1,960 | 2,040 |
| Massachusetts Transportation Fund Revenue | | | | |
| (Accelerated Bridge Program) | 5.000% | 6/1/38 | 2,750 | 3,135 |
| Massachusetts Transportation Fund Revenue | | | | |
| (Accelerated Bridge Program) | 5.000% | 6/1/43 | 5,000 | 5,688 |
| Massachusetts Turnpike Authority Revenue | | | | |
| (Metropolitan Highway System) | 0.000% | 1/1/20 (14) | 3,000 | 2,762 |
| Massachusetts Turnpike Authority Revenue | | | | |
| (Metropolitan Highway System) | 0.000% | 1/1/25 (14) | 5,000 | 3,822 |
| Massachusetts Turnpike Authority Revenue | | | | |
| (Metropolitan Highway System) | 0.000% | 1/1/28 (14) | 9,070 | 6,102 |
| Massachusetts Water Pollution Abatement | | | | |
| Trust Revenue | 5.250% | 8/1/17 | 540 | 558 |
| Massachusetts Water Pollution Abatement | | | | |
| Trust Revenue | 5.000% | 8/1/20 | 1,180 | 1,414 |
| Massachusetts Water Pollution Abatement | | | | |
| Trust Revenue | 5.000% | 8/1/22 | 3,000 | 3,676 |
| Massachusetts Water Pollution Abatement | | | | |
| Trust Revenue | 5.000% | 8/1/25 | 2,500 | 3,130 |
| Massachusetts Water Pollution Abatement | | | | |
| Trust Revenue | 5.000% | 8/1/27 | 8,000 | 9,760 |
| Massachusetts Water Pollution Abatement | | | | |
| Trust Revenue | 5.000% | 8/1/28 | 975 | 1,182 |
| Massachusetts Water Pollution Abatement | | | | |
| Trust Revenue | 5.250% | 8/1/29 | 1,520 | 1,970 |
| Massachusetts Water Pollution Abatement | | | | |
| Trust Revenue | 5.750% | 8/1/29 | 190 | 191 |
| Massachusetts Water Pollution Abatement | | | | |
| Trust Revenue | 5.000% | 8/1/32 | 2,415 | 2,786 |
| Massachusetts Water Resources | | | | |
| Authority Revenue | 5.000% | 8/1/16 (Prere.) | 5,990 | 6,451 |
| Massachusetts Water Resources | | | | |
| Authority Revenue | 5.000% | 8/1/16 (Prere.) | 2,005 | 2,160 |
| Massachusetts Water Resources | | | | |
| Authority Revenue | 5.000% | 8/1/16 (Prere.) | 2,995 | 3,225 |
| Massachusetts Water Resources | | | | |
| Authority Revenue | 5.500% | 8/1/20 (4) | 1,000 | 1,221 |
| Massachusetts Water Resources | | | | |
| Authority Revenue | 5.500% | 8/1/22 (4) | 1,490 | 1,871 |
| Massachusetts Water Resources | | | | |
| Authority Revenue | 5.000% | 8/1/24 | 5,000 | 6,183 |
| Massachusetts Water Resources | | | | |
| Authority Revenue | 5.000% | 8/1/27 | 2,000 | 2,326 |
| Massachusetts Water Resources | | | | |
| Authority Revenue | 5.000% | 8/1/29 | 2,400 | 2,802 |
| Massachusetts Water Resources | | | | |
| Authority Revenue | 5.000% | 8/1/30 | 2,775 | 3,217 |
22
Massachusetts Tax-Exempt Fund
| | | | |
| | | | Face | Market |
| | | Maturity | Amount | Value |
| | Coupon | Date | ($000) | ($000) |
| Massachusetts Water Resources | | | | |
| Authority Revenue | 5.000% | 8/1/31 | 2,230 | 2,615 |
| Massachusetts Water Resources | | | | |
| Authority Revenue | 5.250% | 8/1/31 (4) | 1,000 | 1,275 |
| Massachusetts Water Resources | | | | |
| Authority Revenue | 5.000% | 8/1/34 (14) | 8,000 | 8,723 |
| Massachusetts Water Resources | | | | |
| Authority Revenue | 5.000% | 8/1/35 (14) | 13,900 | 15,188 |
| Massachusetts Water Resources | | | | |
| Authority Revenue | 5.250% | 8/1/35 (4) | 1,310 | 1,675 |
| Massachusetts Water Resources | | | | |
| Authority Revenue | 5.000% | 8/1/36 | 2,710 | 3,119 |
| Massachusetts Water Resources | | | | |
| Authority Revenue | 5.000% | 8/1/36 | 1,700 | 1,807 |
| Massachusetts Water Resources | | | | |
| Authority Revenue | 5.000% | 8/1/36 | 1,000 | 1,149 |
| Massachusetts Water Resources | | | | |
| Authority Revenue | 5.000% | 8/1/39 | 2,950 | 3,333 |
| Massachusetts Water Resources | | | | |
| Authority Revenue | 5.000% | 8/1/40 | 500 | 564 |
| Massachusetts Water Resources | | | | |
| Authority Revenue | 5.000% | 8/1/41 | 4,450 | 5,080 |
| Massachusetts Water Resources | | | | |
| Authority Revenue | 5.000% | 8/1/42 | 1,000 | 1,122 |
| Massachusetts Water Resources | | | | |
| Authority Revenue | 5.250% | 8/1/42 | 10,000 | 11,384 |
| Massachusetts Water Resources | | | | |
| Authority Revenue | 5.000% | 8/1/44 | 8,000 | 9,175 |
| Metropolitan Boston MA Transit Parking | | | | |
| Corp. Revenue | 5.000% | 7/1/31 | 1,000 | 1,141 |
| Metropolitan Boston MA Transit Parking | | | | |
| Corp. Revenue | 5.250% | 7/1/36 | 7,000 | 8,102 |
| University of Massachusetts Building | | | | |
| Authority Revenue | 5.000% | 11/1/15 (Prere.) | 2,695 | 2,815 |
| University of Massachusetts Building | | | | |
| Authority Revenue | 5.000% | 11/1/15 (Prere.) | 1,760 | 1,839 |
| University of Massachusetts Building | | | | |
| Authority Revenue | 5.000% | 11/1/15 (Prere.) | 1,980 | 2,068 |
| University of Massachusetts Building | | | | |
| Authority Revenue | 5.000% | 11/1/15 (Prere.) | 1,990 | 2,079 |
| University of Massachusetts Building | | | | |
| Authority Revenue | 5.000% | 11/1/19 | 2,000 | 2,354 |
| University of Massachusetts Building | | | | |
| Authority Revenue | 5.000% | 5/1/38 | 2,000 | 2,270 |
| University of Massachusetts Building | | | | |
| Authority Revenue | 5.000% | 5/1/38 (4) | 1,615 | 1,782 |
| University of Massachusetts Building | | | | |
| Authority Revenue | 5.000% | 11/1/39 | 6,695 | 7,558 |
| University of Massachusetts Building | | | | |
| Authority Revenue | 5.000% | 11/1/39 | 3,000 | 3,467 |
| Worcester MA GO | 5.500% | 8/15/15 (14) | 240 | 241 |
| Worcester MA GO | 5.250% | 8/15/21 (14) | 315 | 316 |
| | | | | 1,129,858 |
23
Massachusetts Tax-Exempt Fund
| | | | |
| | | | Face | Market |
| | | Maturity | Amount | Value |
| | Coupon | Date | ($000) | ($000) |
| Virgin Islands (0.4%) | | | | |
| Virgin Islands Public Finance Authority Revenue | 5.000% | 10/1/30 | 4,000 | 4,394 |
| |
| Guam (0.2%) | | | | |
| Guam Government Waterworks Authority | | | | |
| Water & Waste Water System Revenue | 5.500% | 7/1/43 | 2,250 | 2,573 |
| Total Tax-Exempt Municipal Bonds (Cost $1,074,665) | | | 1,136,825 |
| Other Assets and Liabilities (1.0%) | | | | |
| Other Assets | | | | 15,866 |
| Liabilities | | | | (4,290) |
| | | | | 11,576 |
| Net Assets (100%) | | | | |
| Applicable to 105,679,640 outstanding $.001 par value shares of |
| beneficial interest (unlimited authorization) | | | | 1,148,401 |
| Net Asset Value Per Share | | | | $10.87 |
| |
| |
| At November 30, 2014, net assets consisted of: | | | | |
| | | | | Amount |
| | | | | ($000) |
| Paid-in Capital | | | | 1,079,965 |
| Undistributed Net Investment Income | | | | — |
| Accumulated Net Realized Gains | | | | 6,276 |
| Unrealized Appreciation (Depreciation) | | | | 62,160 |
| Net Assets | | | | 1,148,401 |
See Note A in Notes to Financial Statements.
1 Security exempt from registration under Rule 144A of the Securities Act of 1933. Such securities may be sold in transactions exempt from registration, normally to qualified institutional buyers. At November 30, 2014, the aggregate value of these securities was $10,064,000, representing 0.9% of net assets.
2 Adjustable-rate security.
A key to abbreviations and other references follows the Statement of Net Assets.
See accompanying Notes, which are an integral part of the Financial Statements.
24
Massachusetts Tax-Exempt Fund
Key to Abbreviations
ARS—Auction Rate Security.
BAN—Bond Anticipation Note.
COP—Certificate of Participation.
CP—Commercial Paper.
FR—Floating Rate.
GAN—Grant Anticipation Note.
GO—General Obligation Bond.
PILOT—Payments in Lieu of Taxes.
PUT—Put Option Obligation.
RAN—Revenue Anticipation Note.
TAN—Tax Anticipation Note.
TOB—Tender Option Bond.
TRAN—Tax Revenue Anticipation Note.
VRDO—Variable Rate Demand Obligation.
VRDP—Variable Rate Demand Preferred.
(ETM)—Escrowed to Maturity.
(Prere.)—Prerefunded.
Scheduled principal and interest payments are guaranteed by:
(1) MBIA (Municipal Bond Investors Assurance).
(2) AMBAC (Ambac Assurance Corporation).
(3) FGIC (Financial Guaranty Insurance Company).
(4) AGM (Assured Guaranty Municipal Corporation).
(5) BIGI (Bond Investors Guaranty Insurance).
(6) Connie Lee Inc.
(7) FHA (Federal Housing Authority).
(8) CapMAC (Capital Markets Assurance Corporation).
(9) American Capital Access Financial Guaranty Corporation.
(10) XL Capital Assurance Inc.
(11) CIFG (CDC IXIS Financial Guaranty).
(12) AGC (Assured Guaranty Corporation).
(13) BHAC (Berkshire Hathaway Assurance Corporation).
(14) NPFG (National Public Finance Guarantee Corporation).
(15) BAM (Build America Mutual Assurance Company).
(16) MAC (Municipal Assurance Corporation).
(17) RAA (Radian Asset Assurance Inc.).
The insurance does not guarantee the market value of the municipal bonds.
LOC—Scheduled principal and interest payments are guaranteed by bank letter of credit.
Massachusetts Tax-Exempt Fund
Statement of Operations
| |
| | Year Ended |
| | November 30, 2014 |
| | ($000) |
| Investment Income |
| Income |
| Interest | 36,347 |
| Total Income | 36,347 |
| Expenses |
| The Vanguard Group—Note B | |
| Investment Advisory Services | 104 |
| Management and Administrative | 1,341 |
| Marketing and Distribution | 206 |
| Custodian Fees | 18 |
| Auditing Fees | 33 |
| Shareholders’ Reports | 9 |
| Trustees’ Fees and Expenses | 1 |
| Total Expenses | 1,712 |
| Net Investment Income | 34,635 |
| Realized Net Gain (Loss) |
| Investment Securities Sold | 7,800 |
| Futures Contracts | (427) |
| Realized Net Gain (Loss) | 7,373 |
| Change in Unrealized Appreciation (Depreciation) of Investment Securities | 51,523 |
| Net Increase (Decrease) in Net Assets Resulting from Operations | 93,531 |
See accompanying Notes, which are an integral part of the Financial Statements.
26
Massachusetts Tax-Exempt Fund
Statement of Changes in Net Assets
| | |
| | Year Ended November 30, |
| | 2014 | 2013 |
| | ($000) | ($000) |
| Increase (Decrease) in Net Assets |
| Operations |
| Net Investment Income | 34,635 | 34,365 |
| Realized Net Gain (Loss) | 7,373 | 8,727 |
| Change in Unrealized Appreciation (Depreciation) | 51,523 | (97,849) |
| Net Increase (Decrease) in Net Assets Resulting from Operations | 93,531 | (54,757) |
| Distributions |
| Net Investment Income | (34,635) | (34,365) |
| Realized Capital Gain | — | — |
| Total Distributions | (34,635) | (34,365) |
| Capital Share Transactions |
| Issued | 205,583 | 206,683 |
| Issued in Lieu of Cash Distributions | 24,623 | 24,610 |
| Redeemed | (142,017) | (267,510) |
| Net Increase (Decrease) from Capital Share Transactions | 88,189 | (36,217) |
| Total Increase (Decrease) | 147,085 | (125,339) |
| Net Assets |
| Beginning of Period | 1,001,316 | 1,126,655 |
| End of Period | 1,148,401 | 1,001,316 |
See accompanying Notes, which are an integral part of the Financial Statements.
27
Massachusetts Tax-Exempt Fund
Financial Highlights
| | | | | |
| For a Share Outstanding | | | Year Ended November 30, |
| Throughout Each Period | 2014 | 2013 | 2012 | 2011 | 2010 |
| Net Asset Value, Beginning of Period | $10.27 | $11.13 | $10.41 | $10.15 | $10.19 |
| Investment Operations |
| Net Investment Income | .345 | .340 | .349 | .366 | .386 |
| Net Realized and Unrealized Gain (Loss) |
| on Investments | . 600 | (. 860) | .720 | . 260 | (.040) |
| Total from Investment Operations | .945 | (.520) | 1.069 | .626 | .346 |
| Distributions |
| Dividends from Net Investment Income | (. 345) | (. 340) | (. 349) | (. 366) | (. 386) |
| Distributions from Realized Capital Gains | — | — | — | — | — |
| Total Distributions | (. 345) | (. 340) | (. 349) | (. 366) | (. 386) |
| Net Asset Value, End of Period | $10.87 | $10.27 | $11.13 | $10.41 | $10.15 |
| Total Return1 | 9.32% | -4.71% | 10.41% | 6.32% | 3.41% |
| Ratios/Supplemental Data | | | | | |
| Net Assets, End of Period (Millions) | $1,148 | $1,001 | $1,127 | $942 | $983 |
| Ratio of Total Expenses to Average Net Assets | 0.16% | 0.16% | 0.16% | 0.17% | 0.17% |
| Ratio of Net Investment Income to |
| Average Net Assets | 3.24% | 3.21% | 3.22% | 3.61% | 3.75% |
| Portfolio Turnover Rate | 27% | 36% | 13% | 13% | 18% |
| 1 Total returns do not include account service fees that may have applied in the periods shown. Fund prospectuses provide information about any applicable account service fees. |
|
See accompanying Notes, which are an integral part of the Financial Statements.
28
Massachusetts Tax-Exempt Fund
Notes to Financial Statements
Vanguard Massachusetts Tax-Exempt Fund is registered under the Investment Company Act of 1940 as an open-end investment company, or mutual fund. The fund invests in debt instruments of municipal issuers whose ability to meet their obligations may be affected by economic and political developments in the state.
A. The following significant accounting policies conform to generally accepted accounting principles for U.S. investment companies. The fund consistently follows such policies in preparing its financial statements.
1. Security Valuation: Securities are valued as of the close of trading on the New York Stock Exchange (generally 4 p.m., Eastern time) on the valuation date. Bonds, and temporary cash investments acquired over 60 days to maturity, are valued using the latest bid prices or using valuations based on a matrix system (which considers such factors as security prices, yields, maturities, and ratings), both as furnished by independent pricing services. Other temporary cash investments are valued at amortized cost, which approximates market value. Securities for which market quotations are not readily available, or whose values have been affected by events occurring before the fund’s pricing time but after the close of the securities’ primary markets, are valued by methods deemed by the board of trustees to represent fair value.
2. Futures Contracts: The fund uses futures contracts to invest in fixed income asset classes with greater efficiency and lower cost than is possible through direct investment, to add value when these instruments are attractively priced, or to adjust sensitivity to changes in interest rates. The primary risks associated with the use of futures contracts are imperfect correlation between changes in market values of bonds held by the fund and the prices of futures contracts, and the possibility of an illiquid market. Counterparty risk involving futures is mitigated because a regulated clearinghouse is the counterparty instead of the clearing broker. To further mitigate counterparty risk, the fund trades futures contracts on an exchange, monitors the financial strength of its clearing brokers and clearinghouse, and has entered into clearing agreements with its clearing brokers. The clearinghouse imposes initial margin requirements to secure the fund’s performance and requires daily settlement of variation margin representing changes in the market value of each contract.
Futures contracts are valued at their quoted daily settlement prices. The aggregate settlement values of the contracts are not recorded in the Statement of Net Assets. Fluctuations in the value of the contracts are recorded in the Statement of Net Assets as an asset (liability) and in the Statement of Operations as unrealized appreciation (depreciation) until the contracts are closed, when they are recorded as realized futures gains (losses).
During the year ended November 30, 2014, the fund’s average investments in long and short futures contracts each represented less than 1% of net assets, based on the average of aggregate settlement values at each quarter-end during the period. The fund had no open futures contracts at November 30, 2014.
3. Federal Income Taxes: The fund intends to continue to qualify as a regulated investment company and distribute all of its income. Management has analyzed the fund’s tax positions taken for all open federal income tax years (November 30, 2011–2014), and has concluded that no provision for federal income tax is required in the fund’s financial statements.
4. Distributions: Distributions from net investment income are declared daily and paid on the first business day of the following month. Annual distributions from realized capital gains, if any, are recorded on the ex-dividend date.
29
Massachusetts Tax-Exempt Fund
5. Credit Facility: The fund and certain other funds managed by The Vanguard Group participate in a $2.89 billion committed credit facility provided by a syndicate of lenders pursuant to a credit agreement that may be renewed annually; each fund is individually liable for its borrowings, if any, under the credit facility. Borrowings may be utilized for temporary and emergency purposes, and are subject to the fund’s regulatory and contractual borrowing restrictions. The participating funds are charged administrative fees and an annual commitment fee of 0.06% of the undrawn amount of the facility; these fees are allocated to the funds based on a method approved by the fund’s board of trustees and included in Management and Administrative expenses on the fund’s Statement of Operations. Any borrowings under this facility bear interest at a rate equal to the higher of the federal funds rate or LIBOR reference rate plus an agreed-upon spread.
The fund had no borrowings outstanding at November 30, 2014, or at any time during the period then ended.
6. Other: Interest income is accrued daily. Premiums and discounts on debt securities purchased are amortized and accreted, respectively, to interest income over the lives of the respective securities. Security transactions are accounted for on the date securities are bought or sold. Costs used to determine realized gains (losses) on the sale of investment securities are those of the specific securities sold.
B. The Vanguard Group furnishes at cost investment advisory, corporate management, administrative, marketing, and distribution services. The costs of such services are allocated to the fund based on methods approved by the board of trustees. The fund has committed to invest up to 0.40% of its net assets in Vanguard. At November 30, 2014, the fund had contributed capital of $111,000 to Vanguard (included in Other Assets), representing 0.01% of the fund’s net assets and 0.04% of Vanguard’s capitalization. The fund’s trustees and officers are also directors and officers of Vanguard.
C. Various inputs may be used to determine the value of the fund’s investments. These inputs are summarized in three broad levels for financial statement purposes. The inputs or methodologies used to value securities are not necessarily an indication of the risk associated with investing in those securities.
Level 1—Quoted prices in active markets for identical securities.
Level 2—Other significant observable inputs (including quoted prices for similar securities, interest rates, prepayment speeds, credit risk, etc.).
Level 3—Significant unobservable inputs (including the fund’s own assumptions used to determine the fair value of investments).
At November 30, 2014, 100% of the market value of the fund’s investments was determined based on Level 2 inputs.
D. Capital gain distributions are determined on a tax basis and may differ from realized capital gains for financial reporting purposes. Differences may be permanent or temporary. Permanent differences are reclassified among capital accounts in the financial statements to reflect their tax character. Temporary differences arise when gains or losses are recognized in different periods for financial statement and tax purposes. These differences will reverse at some time in the future.
The fund used a tax accounting practice to treat a portion of the price of capital shares redeemed during the year as distributions from realized capital gains. Accordingly, the fund has reclassified $628,000 from accumulated net realized gains to paid-in capital.
30
Massachusetts Tax-Exempt Fund
For tax purposes, at November 30, 2014, the fund had short-term and long-term capital gains of $1,781,000 and $5,330,000, respectively, available for distribution. Short-term gain distributions are treated as ordinary income dividends for tax purposes.
At November 30, 2014, the cost of investment securities for tax purposes was $1,075,500,000. Net unrealized appreciation of investment securities for tax purposes was $61,325,000, consisting of unrealized gains of $61,583,000 on securities that had risen in value since their purchase and $258,000 in unrealized losses on securities that had fallen in value since their purchase.
E. During the year ended November 30, 2014, the fund purchased $350,146,000 of investment securities and sold $271,206,000 of investment securities, other than temporary cash investments.
F. Capital shares issued and redeemed were:
| | |
| | Year Ended November 30, |
| | 2014
Shares
(000) | 2013
Shares
(000) |
| |
| Issued | 19,337 | 19,417 |
| Issued in Lieu of Cash Distributions | 2,308 | 2,333 |
| Redeemed | (13,428) | (25,509) |
| Net Increase (Decrease) in Shares Outstanding | 8,217 | (3,759) |
G. Management has determined that no material events or transactions occurred subsequent to November 30, 2014, that would require recognition or disclosure in these financial statements.
31
Report of Independent Registered
Public Accounting Firm
To the Board of Trustees of Vanguard Massachusetts Tax-Exempt Funds and the Shareholders of Vanguard Massachusetts Tax-Exempt Fund:
In our opinion, the accompanying statement of net assets and the related statements of operations and of changes in net assets and the financial highlights present fairly, in all material respects, the financial position of Vanguard Massachusetts Tax-Exempt Fund (constituting Vanguard Massachusetts Tax-Exempt Funds, hereafter referred to as the “Fund”) at November 30, 2014, the results of its operations for the year then ended, the changes in its net assets for each of the two years in the period then ended, and the financial highlights for each of the five years in the period then ended, in conformity with accounting principles generally accepted in the United States of America. These financial statements and financial highlights (hereafter referred to as “financial statements”) are the responsibility of the Fund’s management. Our responsibility is to express an opinion on these financial statements based on our audits. We conducted our audits of these financial statements in accordance with the standards of the Public Company Accounting Oversight Board (United States). Those standards require that we plan and perform the audit to obtain reasonable assurance about whether the financial statements are free of material misstatement. An audit includes examining, on a test basis, evidence supporting the amounts and disclosures in the financial statements, assessing the accounting principles used and significant estimates made by management, and evaluating the overall financial statement presentation. We believe that our audits, which included confirmation of securities at November 30, 2014 by correspondence with the custodian and the application of alternative auditing procedures where securities purchased had not been received, provide a reasonable basis for our opinion.
/s/PricewaterhouseCoopers LLP
Philadelphia, Pennsylvania
January 13, 2015

Special 2014 tax information (unaudited) for Vanguard Massachusetts Tax-Exempt Fund
This information for the fiscal year ended November 30, 2014, is included pursuant to provisions of the Internal Revenue Code.
The fund distributed $471,000 as capital gain dividends (from net long-term capital gains) to shareholders during the fiscal year.
The fund designates 100% of its income dividends as exempt-interest dividends.
32
About Your Fund’s Expenses
As a shareholder of the fund, you incur ongoing costs, which include costs for portfolio management, administrative services, and shareholder reports (like this one), among others. Operating expenses, which are deducted from a fund’s gross income, directly reduce the investment return of the fund.
A fund’s expenses are expressed as a percentage of its average net assets. This figure is known as the expense ratio. The following examples are intended to help you understand the ongoing costs (in dollars) of investing in your fund and to compare these costs with those of other mutual funds. The examples are based on an investment of $1,000 made at the beginning of the period shown and held for the entire period.
The accompanying table illustrates your fund’s costs in two ways:
• Based on actual fund return. This section helps you to estimate the actual expenses that you paid over the period. The ”Ending Account Value“ shown is derived from the fund‘s actual return, and the third column shows the dollar amount that would have been paid by an investor who started with $1,000 in the fund. You may use the information here, together with the amount you invested, to estimate the expenses that you paid over the period.
To do so, simply divide your account value by $1,000 (for example, an $8,600 account value divided by $1,000 = 8.6), then multiply the result by the number given for your fund under the heading ”Expenses Paid During Period.“
• Based on hypothetical 5% yearly return. This section is intended to help you compare your fund‘s costs with those of other mutual funds. It assumes that the fund had a yearly return of 5% before expenses, but that the expense ratio is unchanged. In this case—because the return used is not the fund’s actual return—the results do not apply to your investment. The example is useful in making comparisons because the Securities and Exchange Commission requires all mutual funds to calculate expenses based on a 5% return. You can assess your fund’s costs by comparing this hypothetical example with the hypothetical examples that appear in shareholder reports of other funds.
Note that the expenses shown in the table are meant to highlight and help you compare ongoing costs only and do not reflect transaction costs incurred by the fund for buying and selling securities. Further, the expenses do not include any purchase, redemption, or account service fees described in the fund prospectus. If such fees were applied to your account, your costs would be higher. Your fund does not carry a “sales load.”
The calculations assume no shares were bought or sold during the period. Your actual costs may have been higher or lower, depending on the amount of your investment and the timing of any purchases or redemptions.
You can find more information about the fund’s expenses, including annual expense ratios, in the Financial Statements section of this report. For additional information on operating expenses and other shareholder costs, please refer to your fund’s current prospectus.
33
| | | |
| Six Months Ended November 30, 2014 | | | |
| | Beginning
Account Value | Ending
Account Value | Expenses
Paid During |
| |
| Massachusetts Tax-Exempt Fund | 5/31/2014 | 11/30/2014 | Period |
| Based on Actual Fund Return | $1,000.00 | $1,026.15 | $0.81 |
| Based on Hypothetical 5% Yearly Return | 1,000.00 | 1,024.27 | 0.81 |
| The calculations are based on expenses incurred in the most recent six-month period. The fund’s annualized six-month expense ratio for that period is 0.16%. The dollar amounts shown as “Expenses Paid” are equal to the annualized expense ratio multiplied by the average account value over the period, multiplied by the number of days in the most recent six-month period, then divided by the number of days in the most recent 12-month period. |
|
|
|
34
Glossary
30-Day SEC Yield. A fund’s 30-day SEC yield is derived using a formula specified by the U.S. Securities and Exchange Commission. Under the formula, data related to the fund’s security holdings in the previous 30 days are used to calculate the fund’s hypothetical net income for that period, which is then annualized and divided by the fund’s estimated average net assets over the calculation period. For the purposes of this calculation, a security’s income is based on its current market yield to maturity (for bonds), its actual income (for asset-backed securities), or its projected dividend yield (for stocks). Because the SEC yield represents hypothetical annualized income, it will differ—at times significantly—from the fund’s actual experience. As a result, the fund’s income distributions may be higher or lower than implied by the SEC yield.
Average Coupon. The average interest rate paid on the fixed income securities held by a fund. It is expressed as a percentage of face value.
Average Duration. An estimate of how much the value of the bonds held by a fund will fluctuate in response to a change in interest rates. To see how the value could change, multiply the average duration by the change in rates. If interest rates rise by 1 percentage point, the value of the bonds in a fund with an average duration of five years would decline by about 5%. If rates decrease by a percentage point, the value would rise by 5%.
Average Stated Maturity. The average length of time until fixed income securities held by a fund reach maturity and are repaid using the maturity date of the security. The figure reflects the proportion of fund assets represented by each security; it also reflects any futures contracts held. In general, the longer the average stated maturity, the more a fund’s share price will fluctuate in response to changes in market interest rates.
Beta. A measure of the magnitude of a fund’s past share-price fluctuations in relation to the ups and downs of a given market index. The index is assigned a beta of 1.00. Compared with a given index, a fund with a beta of 1.20 typically would have seen its share price rise or fall by 12% when the index rose or fell by 10%. For this report, beta is based on returns over the past 36 months for both the fund and the index. Note that a fund’s beta should be reviewed in conjunction with its R-squared (see definition). The lower the R-squared, the less correlation there is between the fund and the index, and the less reliable beta is as an indicator of volatility.
Credit Quality. For Vanguard tax-exempt bond funds, credit-quality ratings are measured on a scale that generally ranges from AAA (highest) to D (lowest). “Not Rated” is used to classify securities for which a rating is not available. Credit-quality ratings are obtained from Moody’s and S&P, and the higher rating for each issue is used.
Expense Ratio. A fund’s total annual operating expenses expressed as a percentage of the fund’s average net assets. The expense ratio includes management and administrative expenses, but does not include the transaction costs of buying and selling portfolio securities.
Inception Date. The date on which the assets of a fund (or one of its share classes) are first invested in accordance with the fund’s investment objective. For funds with a subscription period, the inception date is the day after that period ends. Investment performance is measured from the inception date.
35
R-Squared. A measure of how much of a fund’s past returns can be explained by the returns from the market in general, as measured by a given index. If a fund’s total returns were precisely synchronized with an index’s returns, its R-squared would be 1.00. If the fund’s returns bore no relationship to the index’s returns, its R-squared would be 0. For this report, R-squared is based on returns over the past 36 months for both the fund and the index.
Short-Term Reserves. The percentage of a fund invested in highly liquid, short-term securities that can be readily converted to cash.
Yield to Maturity. The rate of return an investor would receive if the fixed income securities held by a fund were held to their maturity dates.
36
This page intentionally left blank.
This page intentionally left blank.
This page intentionally left blank.
The People Who Govern Your Fund
The trustees of your mutual fund are there to see that the fund is operated and managed in your best interests since, as a shareholder, you are a part owner of the fund. Your fund’s trustees also serve on the board of directors of The Vanguard Group, Inc., which is owned by the Vanguard funds and provides services to them on an at-cost basis.
A majority of Vanguard’s board members are independent, meaning that they have no affiliation with Vanguard or the funds they oversee, apart from the sizable personal investments they have made as private individuals. The independent board members have distinguished backgrounds in business, academia, and public service. Each of the trustees and executive officers oversees 177 Vanguard funds.
The following table provides information for each trustee and executive officer of the fund. More information about the trustees is in the Statement of Additional Information, which can be obtained, without charge, by contacting Vanguard at 800-662-7447, or online at vanguard.com.
| |
| InterestedTrustee1 | and Delphi Automotive LLP (automotive components); |
| Senior Advisor at New Mountain Capital. |
| F. William McNabb III | |
| Born 1957. Trustee Since July 2009. Chairman of the | Amy Gutmann |
| Board. Principal Occupation(s) During the Past Five | Born 1949. Trustee Since June 2006. Principal |
| Years: Chairman of the Board of The Vanguard Group, | Occupation(s) During the Past Five Years: President of |
| Inc., and of each of the investment companies served | the University of Pennsylvania; Christopher H. Browne |
| by The Vanguard Group, since January 2010; Director | Distinguished Professor of Political Science, School of |
| of The Vanguard Group since 2008; Chief Executive | Arts and Sciences, and Professor of Communication, |
| Officer and President of The Vanguard Group, and of | Annenberg School for Communication, with secondary |
| each of the investment companies served by The | faculty appointments in the Department of Philosophy, |
| Vanguard Group, since 2008; Director of Vanguard | School of Arts and Sciences, and at the Graduate |
| Marketing Corporation; Managing Director of The | School of Education, University of Pennsylvania; |
| Vanguard Group (1995–2008). | Trustee of the National Constitution Center; Chair |
| of the Presidential Commission for the Study of |
| IndependentTrustees | Bioethical Issues. |
| |
| Emerson U. Fullwood | JoAnn Heffernan Heisen |
| Born 1948. Trustee Since January 2008. Principal | Born 1950. Trustee Since July 1998. Principal |
| Occupation(s) During the Past Five Years: Executive | Occupation(s) During the Past Five Years: Corporate |
| Chief Staff and Marketing Officer for North America | Vice President and Chief Global Diversity Officer |
| and Corporate Vice President (retired 2008) of Xerox | (retired 2008) and Member of the Executive |
| Corporation (document management products and | Committee (1997–2008) of Johnson & Johnson |
| services); Executive in Residence and 2009–2010 | (pharmaceuticals/medical devices/consumer |
| Distinguished Minett Professor at the Rochester | products); Director of Skytop Lodge Corporation |
| Institute of Technology; Director of SPX Corporation | (hotels), the University Medical Center at Princeton, |
| (multi-industry manufacturing), the United Way of | the Robert Wood Johnson Foundation, and the Center |
| Rochester, Amerigroup Corporation (managed health | for Talent Innovation; Member of the Advisory Board |
| care), the University of Rochester Medical Center, | of the Maxwell School of Citizenship and Public Affairs |
| Monroe Community College Foundation, and North | at Syracuse University. |
| Carolina A&T University. | |
| F. Joseph Loughrey |
| Rajiv L. Gupta | Born 1949. Trustee Since October 2009. Principal |
| Born 1945. Trustee Since December 2001.2 | Occupation(s) During the Past Five Years: President |
| Principal Occupation(s) During the Past Five Years: | and Chief Operating Officer (retired 2009) of Cummins |
| Chairman and Chief Executive Officer (retired 2009) | Inc. (industrial machinery); Chairman of the Board |
| and President (2006–2008) of Rohm and Haas Co. | of Hillenbrand, Inc. (specialized consumer services), |
| (chemicals); Director of Tyco International, Ltd. | and of Oxfam America; Director of SKF AB (industrial |
| (diversified manufacturing and services), Hewlett- | machinery), Hyster-Yale Materials Handling, Inc. |
| Packard Co. (electronic computer manufacturing), | (forklift trucks), the Lumina Foundation for Education, |
| | |
| | |
| and the V Foundation for Cancer Research; Member | Executive Officers | |
| of the Advisory Council for the College of Arts and |
| Letters and of the Advisory Board to the Kellogg | Glenn Booraem |
| Institute for International Studies, both at the | Born 1967. Controller Since July 2010. Principal |
| University of Notre Dame. | Occupation(s) During the Past Five Years: Principal |
| of The Vanguard Group, Inc.; Controller of each of |
| Mark Loughridge | the investment companies served by The Vanguard |
| Born 1953. Trustee Since March 2012. Principal | Group; Assistant Controller of each of the investment |
| Occupation(s) During the Past Five Years: Senior Vice | companies served by The Vanguard Group (2001–2010). |
| President and Chief Financial Officer (retired 2013) |
| at IBM (information technology services); Fiduciary | Thomas J. Higgins |
| Member of IBM’s Retirement Plan Committee (2004– | Born 1957. Chief Financial Officer Since September |
| 2013); Member of the Council on Chicago Booth. | 2008. Principal Occupation(s) During the Past Five |
| | Years: Principal of The Vanguard Group, Inc.; Chief |
| Scott C. Malpass | Financial Officer of each of the investment companies |
| Born 1962. Trustee Since March 2012. Principal | served by The Vanguard Group; Treasurer of each of |
| Occupation(s) During the Past Five Years: Chief | the investment companies served by The Vanguard |
| Investment Officer and Vice President at the University | Group (1998–2008). |
| of Notre Dame; Assistant Professor of Finance at the |
| Mendoza College of Business at Notre Dame; Member | Kathryn J. Hyatt |
| of the Notre Dame 403(b) Investment Committee; | Born 1955. Treasurer Since November 2008. Principal |
| Board Member of TIFF Advisory Services, Inc. | Occupation(s) During the Past Five Years: Principal of |
| (investment advisor); Member of the Investment | The Vanguard Group, Inc.; Treasurer of each of the |
| Advisory Committees of the Financial Industry | investment companies served by The Vanguard |
| Regulatory Authority (FINRA) and of Major League | Group; Assistant Treasurer of each of the investment |
| Baseball. | companies served by The Vanguard Group (1988–2008). |
| |
| André F. Perold | Heidi Stam |
| Born 1952. Trustee Since December 2004. Principal | Born 1956. Secretary Since July 2005. Principal |
| Occupation(s) During the Past Five Years: George | Occupation(s) During the Past Five Years: Managing |
| Gund Professor of Finance and Banking, Emeritus | Director of The Vanguard Group, Inc.; General Counsel |
| at the Harvard Business School (retired 2011); | of The Vanguard Group; Secretary of The Vanguard |
| Chief Investment Officer and Managing Partner of | Group and of each of the investment companies |
| HighVista Strategies LLC (private investment firm); | served by The Vanguard Group; Director and Senior |
| Director of Rand Merchant Bank; Overseer of the | Vice President of Vanguard Marketing Corporation. |
| Museum of Fine Arts Boston. |
| | Vanguard Senior ManagementTeam |
| Alfred M. Rankin, Jr. | | |
| Born 1941. Trustee Since January 1993. Principal | Mortimer J. Buckley | Chris D. McIsaac |
| Occupation(s) During the Past Five Years: Chairman, | Kathleen C. Gubanich | Michael S. Miller |
| President, and Chief Executive Officer of NACCO | Paul A. Heller | James M. Norris |
| Industries, Inc. (housewares/lignite), and of Hyster- | Martha G. King | Glenn W. Reed |
| Yale Materials Handling, Inc. (forklift trucks); Chairman | John T. Marcante |
| of the Board of University Hospitals of Cleveland. |
| Chairman Emeritus and Senior Advisor |
| Peter F. Volanakis |
| Born 1955. Trustee Since July 2009. Principal | John J. Brennan | |
| Occupation(s) During the Past Five Years: President | Chairman, 1996–2009 |
| and Chief Operating Officer (retired 2010) of Corning | Chief Executive Officer and President, 1996–2008 |
| Incorporated (communications equipment); Trustee of |
| Colby-Sawyer College; Member of the Advisory Board | Founder |
| of the Norris Cotton Cancer Center and of the Advisory |
| Board of the Parthenon Group (strategy consulting). | John C. Bogle |
| Chairman and Chief Executive Officer, 1974–1996 |
| | |
1 Mr. McNabb is considered an “interested person,” as defined in the Investment Company Act of 1940, because he is an officer of the Vanguard funds.
2 December 2002 for Vanguard Equity Income Fund, the Vanguard Municipal Bond Funds, and the Vanguard State Tax-Exempt Funds.
|  |
| | P.O. Box 2600 |
| | Valley Forge, PA 19482-2600 |
| |
| |
| |
| Connect with Vanguard® > vanguard.com | |
| |
| |
| |
| Fund Information > 800-662-7447 | CFA® is a registered trademark owned by CFA Institute. |
| Direct Investor Account Services > 800-662-2739 | |
| Institutional Investor Services > 800-523-1036 | |
| Text Telephone for People | |
| Who Are Deaf or Hard of Hearing> 800-749-7273 | |
| |
| This material may be used in conjunction | |
| with the offering of shares of any Vanguard | |
| fund only if preceded or accompanied by | |
| the fund’s current prospectus. | |
| |
| All comparative mutual fund data are from Lipper, a | |
| Thomson Reuters Company, or Morningstar, Inc., unless | |
| otherwise noted. | |
| |
| You can obtain a free copy of Vanguard’s proxy voting | |
| guidelines by visiting vanguard.com/proxyreporting or by | |
| calling Vanguard at 800-662-2739. The guidelines are | |
| also available from the SEC’s website, sec.gov. In | |
| addition, you may obtain a free report on how your fund | |
| voted the proxies for securities it owned during the 12 | |
| months ended June 30. To get the report, visit either | |
| vanguard.com/proxyreporting or sec.gov. | |
| |
| You can review and copy information about your fund at | |
| the SEC’s Public Reference Room in Washington, D.C. To | |
| find out more about this public service, call the SEC at | |
| 202-551-8090. Information about your fund is also | |
| available on the SEC’s website, and you can receive | |
| copies of this information, for a fee, by sending a | |
| request in either of two ways: via e-mail addressed to | |
| publicinfo@sec.gov or via regular mail addressed to the | |
| Public Reference Section, Securities and Exchange | |
| Commission, Washington, DC 20549-1520. | |
| |
| | © 2015 The Vanguard Group, Inc. |
| | All rights reserved. |
| | Vanguard Marketing Corporation, Distributor. |
| |
| | Q1680 012015 |
Item 2: Code of Ethics. The Registrant has adopted a code of ethics that applies to the Registrant’s principal executive officer, principal financial officer, principal accounting officer or controller or persons performing similar functions. The Code of Ethics was amended during the reporting period covered by this report to make certain technical, non-material changes.
Item 3: Audit Committee Financial Expert. The following members of the Audit Committee have been determined by the Registrant’s Board of Trustees to be Audit Committee Financial Experts serving on its Audit Committee, and to be independent: Rajiv L. Gupta, Amy Gutmann, JoAnn Heffernan Heisen, F. Joseph Loughrey, Mark Loughridge, Scott C. Malpass, and André F. Perold.
Item 4: Principal Accountant Fees and Services.
(a) Audit Fees.
Audit Fees of the Registrant
Fiscal Year Ended November 30, 2014: $33,000
Fiscal Year Ended November 30, 2013: $29,000
Aggregate Audit Fees of Registered Investment Companies in the Vanguard Group.
Fiscal Year Ended November 30, 2014: $6,605,127
Fiscal Year Ended November 30, 2013: $5,714,113
Includes fees billed in connection with audits of the Registrant, other registered investment companies in the Vanguard complex, The Vanguard Group, Inc. and Vanguard Marketing Corporation.
(b) Audit-Related Fees.
Fiscal Year Ended November 30, 2014: $2,176,479
Fiscal Year Ended November 30, 2013: $1,552,950
Includes fees billed in connection with assurance and related services provided to the Registrant, other registered investment companies in the Vanguard complex, The Vanguard Group, Inc., and Vanguard Marketing Corporation.
(c) Tax Fees.
Fiscal Year Ended November 30, 2014: $316,869
Fiscal Year Ended November 30, 2013: $110,000
Includes fees billed in connection with tax compliance, planning, and advice services provided to the Registrant, other registered investment companies in the Vanguard complex, The Vanguard Group, Inc., and Vanguard Marketing Corporation.
(d) All Other Fees.
Fiscal Year Ended November 30, 2014: $198,163
Fiscal Year Ended November 30, 2013: $132,000
Includes fees billed for services related to tax reported information provided to the Registrant, other registered investment companies in the Vanguard complex, The Vanguard Group, Inc., and Vanguard Marketing Corporation.
(e) (1) Pre-Approval Policies. The policy of the Registrant’s Audit Committee is to consider and, if appropriate, approve before the principal accountant is engaged for such services, all specific audit and non-audit services provided to: the Registrant, other registered investment companies in the Vanguard complex, The Vanguard Group, Inc., and entities controlled by The Vanguard Group, Inc. that provide ongoing services to the Registrant. In making a determination, the Audit Committee considers whether the services are consistent with maintaining the principal accountant’s independence.
In the event of a contingency situation in which the principal accountant is needed to provide services in between scheduled Audit Committee meetings, the Chairman of the Audit Committee would be called on to consider and, if appropriate, pre-approve audit or permitted non-audit services in an amount sufficient to complete services through the next Audit Committee meeting, and to determine if such services would be consistent with maintaining the accountant’s independence. At the next scheduled Audit Committee meeting, services and fees would be presented to the Audit Committee for formal consideration, and, if appropriate, approval by the entire Audit Committee. The Audit Committee would again consider whether such services and fees are consistent with maintaining the principal accountant’s independence.
The Registrant’s Audit Committee is informed at least annually of all audit and non-audit services provided by the principal accountant to the Vanguard complex, whether such services are provided to: the Registrant, other registered investment companies in the Vanguard complex, The Vanguard Group, Inc., or other entities controlled by The Vanguard Group, Inc. that provide ongoing services to the Registrant.
(2) No percentage of the principal accountant’s fees or services were approved pursuant to the waiver provision of paragraph (c)(7)(i)(C) of Rule 2-01 of Regulation S-X.
(f) For the most recent fiscal year, over 50% of the hours worked under the principal accountant’s engagement were not performed by persons other than full-time, permanent employees of the principal accountant.
(g) Aggregate Non-Audit Fees.
Fiscal Year Ended November 30, 2014: $515,032
Fiscal Year Ended November 30, 2013: $242,000
Includes fees billed for non-audit services provided to the Registrant, other registered investment companies in the Vanguard complex, The Vanguard Group, Inc., and Vanguard Marketing Corporation.
(h) For the most recent fiscal year, the Audit Committee has determined that the provision of all non-audit services was consistent with maintaining the principal accountant’s independence.
Item 5: Audit Committee of Listed Registrants.
Not Applicable.
Item 6: Investments.
Not Applicable.
Item 7: Disclosure of Proxy Voting Policies and Procedures for Closed-End Management Investment Companies.
Not Applicable.
Item 8: Portfolio Managers of Closed-End Management Investment Companies.
Not Applicable.
Item 9: Purchase of Equity Securities by Closed-End Management Investment Company and Affiliated Purchasers.
Not Applicable.
Item 10: Submission of Matters to a Vote of Security Holders.
Not Applicable.
Item 11: Controls and Procedures.
(a) Disclosure Controls and Procedures. The Principal Executive and Financial Officers concluded that the Registrant’s Disclosure Controls and Procedures are effective based on their evaluation of the Disclosure Controls and Procedures as of a date within 90 days of the filing date of this report.
(b) Internal Control Over Financial Reporting. There were no significant changes in Registrant’s Internal Control Over Financial Reporting or in other factors that could significantly affect this control subsequent to the date of the evaluation, including any corrective actions with regard to significant deficiencies and material weaknesses.
Item 12: Exhibits.
(a) Code of Ethics.
(b) Certifications.
Pursuant to the requirements of the Securities Exchange Act of 1934 and the Investment Company Act of 1940, the registrant has duly caused this report to be signed on its behalf by the undersigned, thereunto duly authorized.
| |
| | VANGUARD MASSACHUSETTS TAX-EXEMPT FUNDS |
| BY: | /s/ F. WILLIAM MCNABB III* |
| | F. WILLIAM MCNABB III |
| | CHIEF EXECUTIVE OFFICER |
| |
| Date: January 21, 2015 |
Pursuant to the requirements of the Securities Exchange Act of 1934 and the Investment Company Act of 1940, this report has been signed below by the following persons on behalf of the registrant and in the capacities and on the dates indicated.
| |
| | VANGUARD MASSACHUSETTS TAX-EXEMPT FUNDS |
| BY: | /s/ F. WILLIAM MCNABB III* |
| | F. WILLIAM MCNABB III |
| | CHIEF EXECUTIVE OFFICER |
Date: January 21, 2015 |
| | VANGUARD MASSACHUSETTS TAX-EXEMPT FUNDS |
| BY: | /s/ THOMAS J. HIGGINS* |
| | THOMAS J. HIGGINS |
| | CHIEF FINANCIAL OFFICER |
| Date: January 21, 2015 |
* By: /s/ Heidi Stam
Heidi Stam, pursuant to a Power of Attorney filed on April 22, 2014 see file Number
2-17620, Incorporated by Reference.