UNITED STATES
SECURITIES AND EXCHANGE COMMISSION
Washington, D.C. 20549
FORM N-CSR
CERTIFIED SHAREHOLDER REPORT
OF
REGISTERED MANAGEMENT INVESTMENT COMPANIES
| | |
| Investment Company Act file number: | 811-09005 |
Name of Registrant: | Vanguard Massachusetts Tax-Exempt Funds |
Address of Registrant: | P.O. Box 2600 |
| | Valley Forge, PA 19482 |
Name and address of agent for service: | Heidi Stam, Esquire |
| | P.O. Box 876 |
| | Valley Forge, PA 19482 |
Registrant’s telephone number, including area code: (610) 669-1000 |
Date of fiscal year end: November 30 |
Date of reporting period: December 1, 2014 – November 30, 2015 |
Item 1: Reports to Shareholders |

Annual Report | November 30, 2015
Vanguard Massachusetts Tax-Exempt Fund
Vanguard’s Principles for Investing Success
We want to give you the best chance of investment success. These principles, grounded in Vanguard’s research and experience, can put you on the right path.
Goals. Create clear, appropriate investment goals.
Balance. Develop a suitable asset allocation using broadly diversified funds. Cost. Minimize cost.
Discipline. Maintain perspective and long-term discipline.
A single theme unites these principles: Focus on the things you can control.
We believe there is no wiser course for any investor.
| |
| Contents | |
| Your Fund’s Total Returns. | 1 |
| Chairman’s Letter. | 2 |
| Advisor’s Report. | 8 |
| Fund Profile. | 12 |
| Performance Summary. | 13 |
| Financial Statements. | 15 |
| About Your Fund’s Expenses. | 36 |
| Glossary. | 38 |
Please note: The opinions expressed in this report are just that—informed opinions. They should not be considered promises or advice.
Also, please keep in mind that the information and opinions cover the period through the date on the front of this report. Of course, the
risks of investing in your fund are spelled out in the prospectus.
See the Glossary for definitions of investment terms used in this report.
About the cover: Pictured is a sailing block on the Brilliant, a 1932 schooner docked in Mystic, Connecticut. A type of pulley, the
sailing block helps coordinate the setting of the sails. At Vanguard, the intricate coordination of technology and people allows
us to help millions of clients around the world reach their financial goals.
Your Fund’s Total Returns
| | | | | |
| Fiscal Year Ended November 30, 2015 | | | | | |
| | | Taxable- | | | |
| | SEC | Equivalent | Income | Capital | Total |
| | Yield | Yield | Returns | Returns | Returns |
| Vanguard Massachusetts Tax-Exempt Fund | 2.11% | 3.93% | 3.15% | 0.62% | 3.77% |
| Barclays MA Municipal Bond Index | | | | | 3.14 |
| Massachusetts Municipal Debt Funds Average | | | | | 2.67 |
Massachusetts Municipal Debt Funds Average: Derived from data provided by Lipper, a Thomson Reuters Company.
The calculation of taxable-equivalent yield assumes a typical itemized tax return and is based on the maximum federal tax rate of 43.4% and
the maximum income tax rate for the state. Local taxes were not considered. Please see the prospectus for a detailed explanation of the
calculation.
| | | | |
| Your Fund’s Performance at a Glance | | | | |
| November 30, 2014, Through November 30, 2015 | | | | |
| |
| | | | Distributions Per Share |
| | Starting | Ending | | |
| | Share | Share | Income | Capital |
| | Price | Price | Dividends | Gains |
| Vanguard Massachusetts Tax-Exempt Fund | $10.87 | $10.87 | $0.334 | $0.067 |
1

Chairman’s Letter
Dear Shareholder,
The broad U.S. municipal bond market performed relatively well for the 12 months ended November 30, 2015—a less turbulent period for munis than some recent years. The muni market’s return of about 3% was more than 2 percentage points higher than that of the broad taxable bond market.
Returns for Vanguard Massachusetts Tax-Exempt Fund also surpassed the broader market result, as well as those of its comparative standards. The fund returned 3.77% for the 12 months, exceeding the 3.14% return of its benchmark, the Barclays Massachusetts Municipal Bond Index, and the 2.67% average return of competing Massachu-setts tax-exempt funds.
In contrast to the prior fiscal year, interest income, not price appreciation, was the main driver of bond funds’ returns. The fund’s capital return was 0.62% and its return from income was 3.15%. Its 30-day SEC yield dipped to 2.11% as of November 30, from 2.16% a year earlier.
Please note: The fund is permitted to invest in securities whose income is subject to the alternative minimum tax (AMT). However, as of the end of the period, it owned no such securities.
Bonds managed slight gains as investors waited for the Fed
Bond returns broadly were muted over the period as markets absorbed the Federal Reserve’s latest statements about the
2
timing of a potential rise in short-term interest rates. (In mid-December, after the close of the reporting period, the Fed raised its target for short-term interest rates to between 0.25% and 0.5%.) Investors seemed alternately to seek and shun safe-haven assets, depending on stock market volatility.
The broad U.S. taxable bond market returned 0.97%, with income providing the gain. The yield of the 10-year Treasury note ended November at 2.22%, down from 2.25% a year earlier.
International bond markets (as measured by the Barclays Global Aggregate Index ex USD) returned –8.29%, hindered by the dollar’s strength against many foreign currencies. Without this currency effect, results were positive.
The Fed’s 0%–0.25% target for short-term rates continued to limit returns for money market funds and savings accounts.
The broad U.S. stock market produced modest returns
U.S. stocks traveled a rocky route on their way to returns that approached 3% for the 12 months. Most of the turmoil came in late summer; markets tumbled in August and September amid fears about the ripple effects of China’s slowing economic growth.
| | | |
| Market Barometer | | | |
| | Average Annual Total Returns |
| | Periods Ended November 30, 2015 |
| | One | Three | Five |
| | Year | Years | Years |
| Bonds | | | |
| Barclays U.S. Aggregate Bond Index (Broad taxable | | | |
| market) | 0.97% | 1.50% | 3.09% |
| Barclays Municipal Bond Index (Broad tax-exempt market) | 3.10 | 2.49 | 4.79 |
| Citigroup Three-Month U.S. Treasury Bill Index | 0.02 | 0.02 | 0.04 |
| |
| Stocks | | | |
| Russell 1000 Index (Large-caps) | 2.53% | 16.10% | 14.32% |
| Russell 2000 Index (Small-caps) | 3.51 | 14.92 | 12.02 |
| Russell 3000 Index (Broad U.S. market) | 2.58 | 16.00 | 14.13 |
| FTSE All-World ex US Index (International) | -6.43 | 3.85 | 3.41 |
| |
| CPI | | | |
| Consumer Price Index | 0.50% | 1.02% | 1.64% |
3
Stocks recovered markedly in October and stood firm in November. Central banks in Europe and Asia discussed or enacted more stimulus measures to combat weak growth and low inflation.
International stocks returned about –6% as the dollar’s strength hurt results. Returns for emerging markets, which were especially affected by the concerns about China, trailed those of the developed markets of the Pacific region and Europe.
Demand for munis was strong despite some headline concerns
U.S. Treasury bonds establish the level of risk-free interest rates, and taxable and tax-exempt bonds trade in relation to comparable-maturity Treasury rates. (And, as I noted in my last letter, because of municipal bonds’ tax-exempt status, their interest rates typically also reflect tax rates; this relationship is dynamic.) In some recent years, the relationship between the bellwether 10-year Treasury note and its tax-exempt counterpart has undergone notable shifts. But this fiscal year, that relationship was nearly unchanged from start to finish, despite some minor moves in between.
Supply and demand also play a key role in municipal bond performance. Investors digested a significant year-over-year increase in bond issuance in the first half of the fiscal year and a much smaller increase in the second half. Demand across the nation was strong not only
| | |
| Expense Ratios | | |
| Your Fund Compared With Its Peer Group | | |
| |
| | | Peer Group |
| | Fund | Average |
| Massachusetts Tax-Exempt Fund | 0.16% | 1.09% |
The fund expense ratio shown is from the prospectus dated March 26, 2015, and represents estimated costs for the current fiscal year. For
the fiscal year ended November 30, 2015, the fund’s expense ratio was 0.16%. The peer-group expense ratio is derived from data provided by
Lipper, a Thomson Reuters Company, and captures information through year-end 2014.
Peer group: Massachusetts Municipal Debt Funds.
4
from traditional buyers in higher income tax brackets but also from nontraditional buyers such as banks and insurance companies. In Massachusetts, supply also increased from a year earlier, while demand decreased.
Broadly, investors looked beyond the well-publicized fiscal challenges faced by Illinois and Puerto Rico to the generally stable to improving creditworthiness of the vast majority of municipal borrowers. Municipals benefited from some of the safe-haven demand that helped Treasury bonds amid concerns about Greece and the slower growth in China.
The Massachusetts Tax-Exempt Fund was helped by the favorable overall environment and investors’ continued search for the higher yields offered by longer-maturity and lower-quality bonds. The fund was also well positioned by its advisor, Vanguard Fixed Income Group. A lighter allocation to higher-rated securities (particularly those ranked AAA and AA in credit quality by major rating agencies) and overall issuer selection boosted relative returns.
For more information about the advisor’s approach and the fund’s positioning during the fiscal year, please see the Advisor’s Report that follows this letter.
Low costs, discipline, and research helped the fund over the decade
Although the most recent fiscal year was relatively calm for the broad municipal bond market, the past decade was marked by some turmoil. We have seen a small
| |
| Total Returns | |
| Ten Years Ended November 30, 2015 | |
| | Average |
| | Annual Return |
| Massachusetts Tax-Exempt Fund | 4.55% |
| Barclays MA Municipal Bond Index | 4.79 |
| Massachusetts Municipal Debt Funds Average | 3.85 |
Massachusetts Municipal Debt Funds Average: Derived from data provided by Lipper, a Thomson Reuters Company.
The figures shown represent past performance, which is not a guarantee of future results. (Current performance may be
lower or higher than the performance data cited. For performance data current to the most recent month-end, visit our
website at vanguard.com/performance.) Note, too, that both investment returns and principal value can fluctuate widely, so
an investor’s shares, when sold, could be worth more or less than their original cost.
5
number of widely publicized bankruptcies, including Detroit’s (though that was resolved rather swiftly). And tax revenues shrank during the Great Recession and its aftermath, further straining already challenged borrowers.
Through it all, the Massachusetts Tax-Exempt Fund has benefited from the expertise and experience of our team of independent credit analysts, who work closely with the entire portfolio management team. (For more on the credit team, see the insight box below.)
The work of our credit analysts, combined with the competitive advantage of our low costs, has helped the fund outperform its peer group and stay ahead of its benchmark index. For the decade ended November 30, the fund’s average annual return was 4.55%, a step behind the index’s 4.79% return but ahead of the 3.85% average return of peer funds.
While we are attentive to the benchmark, our most important gauge of the fund’s relative success is how it performs against its peers. Competitors generally have higher costs than Vanguard, while
| Credit research: A key part of Vanguard’s investment process |
| |
| When our funds buy a municipal bond, fund shareholders are lending money to a school |
| district, turnpike authority, hospital, university, or other tax-exempt borrower. We expect |
| those loans to be repaid. That’s why credit research is a pillar of our investment process |
| and why our credit analysts work closely with our portfolio managers and traders. |
| |
| Our credit team conducts an objective, thorough, and independent analysis of each issuer’s |
| overall creditworthiness. This quantitative and qualitative approach may include testing the |
| sensitivity of projected cash flows, analyzing demographic and economic drivers, negotiating |
| legal covenants, meeting with the issuer’s officials, and, of course, digging into financial |
| statements. |
| |
| Credit analysts look to identify opportunities or problems among any bonds we own or |
| are considering. Their informed opinions help us understand and manage risk, sidestep |
| troubled issuers, and uncover value. |
| |
| Our senior municipal credit analysts average more than 23 years of industry experience |
| and more than 10 years at Vanguard. This experience, along with stability in our team |
| structure, helps ensure consistency in credit exposure and risk management across |
| funds with similar objectives. |
6
benchmark indexes have none, which gives the benchmarks an inevitable performance advantage.
A dose of discipline is crucial when markets become volatile
The developments over the past few months remind us that nobody can control the direction of the markets or reliably predict where they’ll go in the short term. However, investors can control how they react to unstable and turbulent markets.
During periods of market adversity, it’s more important than ever to keep sight of one of Vanguard’s key principles: Maintain perspective and long-term discipline. Whether you’re investing for yourself or on behalf of clients, your success is affected greatly by how you respond—or don’t respond—during turbulent markets. (You can read Vanguard’s Principles for Investing Success at vanguard.com/research.)
As I’ve written in the past, the best course for long-term investors is generally to ignore daily market moves and not make decisions based on emotion. This is also a good time to evaluate your portfolio and make sure your asset allocation is aligned with your time horizon, goals, and risk tolerance.
The markets are unpredictable and often confounding. Keeping your long-term plans clearly in focus can help you weather these periodic storms.
As always, thank you for investing with Vanguard.
Sincerely,

F. William McNabb III
Chairman and Chief Executive Officer
January 7, 2016
7
Advisor’s Report
For the 12 months ended November 30, 2015, Vanguard Massachusetts Tax-Exempt Fund returned 3.77%. The fund surpassed its benchmark, the Barclays Massachusetts Municipal Bond Index, which returned 3.14%, and its peer group, which had an average return of 2.67%.
The investment environment
The fiscal year began just as the Federal Reserve wrapped up its multiyear stimulative bond-buying program. Attention then turned to when the Fed would begin to raise rates, a question that remained a focus of stock and bond investors globally throughout the period. (The Fed raised its target for short-term rates to between 0.25% and 0.5% in mid-December, after the close of the reporting period.)
In the years leading up to the decision, the Fed had made clear that the timing of its first rate hike in almost a decade would depend on the overall health of the economy and on the picture for employment and inflation in particular. Those data points generally moved in the desired direction over the fiscal year.
While growth in gross domestic product (GDP) almost ground to a halt in the first calendar quarter of 2015—in part because of a harsh winter and a West Coast port strike—it recovered in the second and third quarters. Job growth was generally strong. The national unemployment rate fell during the period from 5.8% to 5.0%, a level not seen since April 2008. And although inflation came under pressure from falling
| | |
| Yields of Municipal Securities | | |
| (AAA-Rated General-Obligation Issues) | | |
| | November 30, | November 30, |
| Maturity | 2014 | 2015 |
| 2 years | 0.38% | 0.72% |
| 5 years | 1.15 | 1.26 |
| 10 years | 2.08 | 2.02 |
| 30 years | 3.01 | 2.96 |
| Source: Vanguard. |
8
energy and import prices, it was expected to move toward the Fed’s 2% target in the medium term.
The unemployment rate in Massachusetts declined from 5.5% to 4.6% over the period. Massachusetts’ economy has been growing faster than that of the United States as a whole, according to a gauge of current economic conditions published monthly by the Federal Reserve Bank of Philadelphia. The bank’s index for Massachusetts climbed about 5% between November 2014 and October 2015, while at the national level the index rose a bit less than 3%. (Each state’s index incorporates data on nonfarm payroll employment, the jobless rate, average hours worked in manufacturing, and inflation-adjusted wage and salary payments.) Given the prominence of the higher education, health care, and technology sectors in Massachusetts, the state appears poised for continued expansion.
Recent tax collections in Massachusetts exceeded forecasts. Revenue for the state fiscal year ended June 30, 2015, rose 6.7%, more than the projected 4.9%. Nevertheless, spending increases posed budgetary challenges. In January, the commonwealth announced a midyear budget gap of $768 million, about 2% of the $36.5 billion budget. The main drivers behind the shortfall were MassHealth (the state Medicaid program), social services, and snow removal costs after severe winter storms.
Massachusetts closed the fiscal year 2015 gap with a variety of spending and revenue adjustments—but also suspended the planned transfer of funds to the budget stabilization fund and redirected these funds toward operations. At fiscal year-end, the budget stabilization fund balance was a modest 3% of expenditures. The fiscal year 2016 budget is balanced without drawing from the budget stabilization fund, but diverts roughly $300 million to operations that would have gone toward building up the commonwealth’s reserves.
The commonwealth’s general obligation debt rating from Moody’s and Fitch remained unchanged during the year: Aa1 with a stable outlook from Moody’s and AA+ with a stable outlook from Fitch. In November, Standard & Poor’s kept its AA+ rating but changed the outlook from stable to negative, citing the commonwealth’s “decline in financial reserves over the past several years despite a prolonged period of economic expansion and generally positive revenue trends.” S&P’s adjusted outlook also reflects its expectation that fiscal year 2016 will see a further decline in reserves “from currently adequate levels.”
Management of the fund
At Vanguard, we strive to add value through a diversified mix of strategies—mainly duration and yield-curve positioning, credit-quality decisions, and security selection. We don’t try to hit home runs, preferring to consistently hit singles and doubles. Risk management is key in our investment
9
processes. And we collaborate closely with Vanguard’s experienced team of credit analysts. They perform an objective, thorough, and independent analysis of the overall creditworthiness of every issuer whose bonds we own or consider buying.
We made no significant shifts during the period in the fund’s portfolio strategy or positioning. In a relatively range-bound environment for bond yields and credit spreads, we believed that picking up additional yield would boost outperformance. To do this, we started and ended with a tilt toward lower-quality and longer-dated bonds compared with the credit and maturity profiles of the fund’s benchmark. This strategy, which served us well for the fund’s fiscal year, was part of our defensive posture while awaiting the Fed’s first move, as longer-dated bond yields are influenced more by inflation expectations than they are by short-term borrowing costs.
We added value by holding premium callable bonds. Because these bonds may be redeemed before maturity, exposing investors to reinvestment risk, they offer attractive yields and favorable total return potential across many interest rate scenarios.
We have favored revenue bonds over general obligation bonds for their more identifiable cash-flow streams to service debt.
A look ahead
Although the U.S. economy’s growth slowed in the third calendar quarter, we believe that it’s on track to average about 2.5% or a bit higher in 2016. Inflation should continue to be tempered by oil prices, which seem to have settled into a range far below their summer 2014 peak.
The monetary-tightening cycle that the Fed initiated just after the close of the period is likely to be very slow and gradual. Moreover, it may well end at a level below the historical average, given the moderate pace of U.S. economic growth, fragile growth abroad, and the modest outlook for inflation. These expectations are already largely built into bond prices.
Apart from Fed policy, which should help lift money market yields, interest rates are likely to remain range-bound. We expect their floor to be set, at least in part, by the strength of the U.S. economy. The cap will be determined by global conditions, including the relative strength of the dollar, slower growth overseas, and foreign central bank policies—all of which have driven down bond yields abroad.
As interest rates fell in recent years, we captured many opportunities for price appreciation. We don’t see much scope for credit spreads to tighten significantly, nor do we expect them to widen back out. Given the macroeconomic environment and current valuations for muni and taxable
10
bonds, we expect to keep seeking to add value through duration and maturity positioning, credit-quality profiles, and security selection.
Because market volatility may increase as interest rates move higher, we will continue to hold above-average levels of liquidity that will give us the “dry powder” to take advantage of any dislocations in pricing.
And as always, our experienced team of portfolio managers, traders, and credit analysts will continue to seek out opportunities to add to the fund’s performance, whatever the markets may bring.
Christopher W. Alwine, CFA, Principal,
Head of Municipal Bond Funds
Marlin G. Brown, Portfolio Manager
Vanguard Fixed Income Group
December 17, 2015
11
Massachusetts Tax-Exempt Fund
Fund Profile
As of November 30, 2015
| | | |
| Financial Attributes | | |
| |
| | | Barclays | |
| | | MA | Barclays |
| | | Municipal | Municipal |
| | | Bond | Bond |
| | Fund | Index | Index |
| Number of Bonds | 324 | 1,599 | 47,840 |
| Yield to Maturity | | | |
| (before expenses) | 2.2% | 2.0% | 2.2% |
| Average Coupon | 4.7% | 4.9% | 4.8% |
| Average Duration | 6.3 years | 6.6 years | 6.4 years |
| Average Stated | | | |
| Maturity | 16.6 years | 13.1 years | 13.1 years |
| Ticker Symbol | VMATX | — | — |
| Expense Ratio1 | 0.16% | — | — |
| 30-Day SEC Yield | 2.11% | — | — |
| Short-Term | | | |
| Reserves | 5.0% | — | — |
| | |
| Volatility Measures | | |
| | Barclays MA | Barclays |
| | Municipal | Municipal |
| | Bond Index | Bond Index |
| R-Squared | 0.99 | 0.99 |
| Beta | 1.20 | 1.20 |
These measures show the degree and timing of the fund’s fluctuations compared with the indexes over 36 months.
| |
| Distribution by Stated Maturity | |
| (% of portfolio) | |
| Under 1 Year | 5.1% |
| 1 - 3 Years | 5.3 |
| 3 - 5 Years | 3.3 |
| 5 - 10 Years | 9.2 |
| 10 - 20 Years | 39.2 |
| 20 - 30 Years | 35.7 |
| Over 30 Years | 2.2 |
| |
| Distribution by Credit Quality (% of portfolio) |
| AAA | 12.5% |
| AA | 65.2 |
| A | 13.4 |
| BBB | 8.4 |
| Not Rated | 0.5 |
Credit-quality ratings are obtained from Moody's and S&P, and the higher rating for each issue is shown. "Not Rated" is used to
classify securities for which a rating is not available. Not rated securities include a fund's investment in Vanguard Market Liquidity
Fund or Vanguard Municipal Cash Management Fund, each of which invests in high-quality money market instruments and may
serve as a cash management vehicle for the Vanguard funds, trusts, and accounts. For more information about these ratings, see
the Glossary entry for Credit Quality.
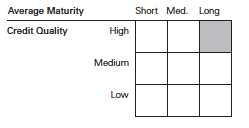
Investment Focus
1 The expense ratio shown is from the prospectus dated March 26, 2015, and represents estimated costs for the current fiscal year. For the
fiscal year ended November 30, 2015, the expense ratio was 0.16%.
12
Massachusetts Tax-Exempt Fund
Performance Summary
All of the returns in this report represent past performance, which is not a guarantee of future results that may be achieved by the fund. (Current performance may be lower or higher than the performance data cited. For performance data current to the most recent month-end, visit our website at vanguard.com/performance.) Note, too, that both investment returns and principal value can fluctuate widely, so an investor’s shares, when sold, could be worth more or less than their original cost. The returns shown do not reflect taxes that a shareholder would pay on fund distributions or on the sale of fund shares.
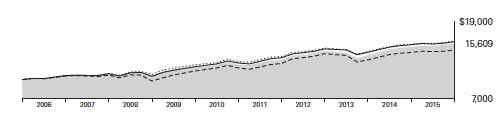
Cumulative Performance: November 30, 2005, Through November 30, 2015
Initial Investment of $10,000
| | | | | |
| | | Average Annual Total Returns | |
| | | Periods Ended November 30, 2015 | |
| | | | | | Final Value |
| | | One | Five | Ten | of a $10,000 |
| | | Year | Years | Years | Investment |
| | Massachusetts Tax-Exempt Fund | 3.77% | 4.88% | 4.55% | $15,609 |
| •••••••• | Barclays MA Municipal Bond Index | 3.14 | 4.56 | 4.79 | 15,967 |
| – – – – | Massachusetts Municipal Debt Funds | | | | |
| |
| | Average | 2.67 | 4.34 | 3.85 | 14,588 |
| | Barclays Municipal Bond Index | 3.10 | 4.79 | 4.73 | 15,878 |
| Massachusetts Municipal Debt Funds Average: Derived from data provided by Lipper, a Thomson Reuters Company. |
See Financial Highlights for dividend and capital gains information.
13
Massachusetts Tax-Exempt Fund
Fiscal-Year Total Returns (%): November 30, 2005, Through November 30, 2015
| | | | |
| | | | | Barclays MA |
| | | | | Municipal |
| | | | | Bond Index |
| Fiscal Year | Income Returns | Capital Returns | Total Returns | Total Returns |
| 2006 | 4.38% | 2.16% | 6.54% | 6.13% |
| 2007 | 4.18 | -2.03 | 2.15 | 3.27 |
| 2008 | 4.00 | -6.72 | -2.72 | -1.30 |
| 2009 | 4.42 | 7.94 | 12.36 | 13.60 |
| 2010 | 3.80 | -0.39 | 3.41 | 3.96 |
| 2011 | 3.76 | 2.56 | 6.32 | 6.41 |
| 2012 | 3.49 | 6.92 | 10.41 | 9.57 |
| 2013 | 3.02 | -7.73 | -4.71 | -3.52 |
| 2014 | 3.48 | 5.84 | 9.32 | 7.72 |
| 2015 | 3.15 | 0.62 | 3.77 | 3.14 |
Average Annual Total Returns: Periods Ended September 30, 2015
This table presents returns through the latest calendar quarter—rather than through the end of the fiscal period.
Securities and Exchange Commission rules require that we provide this information.
| | | | | | |
| | | | | | | Ten Years |
| | Inception Date | One Year | Five Years | Income | Capital | Total |
| Massachusetts | | | | | | |
| Tax-Exempt Fund | 12/9/1998 | 3.58% | 4.11% | 3.78% | 0.65% | 4.43% |
14
Massachusetts Tax-Exempt Fund
Financial Statements
Statement of Net Assets
As of November 30, 2015
The fund reports a complete list of its holdings in regulatory filings four times in each fiscal year, at the quarter-ends. For the second and fourth fiscal quarters, the lists appear in the fund’s semiannual and annual reports to shareholders. For the first and third fiscal quarters, the fund files the lists with the Securities and Exchange Commission on Form N-Q. Shareholders can look up the fund’s Forms N-Q on the SEC’s website at sec.gov. Forms N-Q may also be reviewed and copied at the SEC’s Public Reference Room (see the back cover of this report for further information).
| | | | |
| | | | Face | Market |
| | | Maturity | Amount | Value• |
| | Coupon | Date | ($000) | ($000) |
| Tax-Exempt Municipal Bonds (99.4%) | | | | |
| Massachusetts (98.6%) | | | | |
| Boston MA GO | 5.000% | 2/1/24 | 2,345 | 2,794 |
| Boston MA GO | 5.000% | 3/1/24 | 3,000 | 3,640 |
| Boston MA Housing Authority Revenue | 5.000% | 4/1/23 (4) | 2,000 | 2,174 |
| Boston MA Housing Authority Revenue | 5.000% | 4/1/25 (4) | 5,440 | 5,900 |
| Boston MA Water & Sewer Commission Revenue | 5.000% | 5/1/19 (Prere.) | 3,725 | 4,216 |
| Boston MA Water & Sewer Commission Revenue | 5.000% | 11/1/20 | 1,550 | 1,833 |
| Boston MA Water & Sewer Commission Revenue | 5.000% | 11/1/30 | 1,000 | 1,126 |
| Boston MA Water & Sewer Commission Revenue | 5.000% | 11/1/30 | 750 | 871 |
| Braintree MA GO | 5.000% | 5/15/19 (Prere.) | 4,000 | 4,532 |
| Braintree MA GO | 5.000% | 5/15/26 | 2,300 | 2,887 |
| Cambridge MA GO | 5.000% | 1/1/23 | 850 | 1,014 |
| Cambridge MA GO | 4.000% | 1/1/26 | 1,600 | 1,845 |
| Cambridge MA GO | 4.000% | 1/1/27 | 1,000 | 1,142 |
| Essex MA North Shore Agricultural & | | | | |
| Technical School District GO | 4.000% | 6/1/39 | 2,810 | 2,920 |
| Holyoke MA GO | 5.000% | 9/1/30 | 1,690 | 1,972 |
| Massachusetts Bay Transportation Authority | | | | |
| Assessment Revenue | 5.250% | 7/1/31 | 2,285 | 2,931 |
| Massachusetts Bay Transportation Authority | | | | |
| Assessment Revenue | 5.000% | 7/1/41 | 5,000 | 5,744 |
| Massachusetts Bay Transportation Authority | | | | |
| Sales Tax Revenue | 5.500% | 7/1/17 (ETM) | 75 | 81 |
| Massachusetts Bay Transportation Authority | | | | |
| Sales Tax Revenue | 5.250% | 7/1/18 (Prere.) | 5,215 | 5,789 |
| Massachusetts Bay Transportation Authority | | | | |
| Sales Tax Revenue | 5.250% | 7/1/22 | 3,500 | 4,286 |
| Massachusetts Bay Transportation Authority | | | | |
| Sales Tax Revenue | 5.500% | 7/1/22 | 5,285 | 6,554 |
| Massachusetts Bay Transportation Authority | | | | |
| Sales Tax Revenue | 5.000% | 7/1/23 | 4,000 | 4,893 |
| Massachusetts Bay Transportation Authority | | | | |
| Sales Tax Revenue | 5.250% | 7/1/23 | 2,825 | 3,508 |
| Massachusetts Bay Transportation Authority | | | | |
| Sales Tax Revenue | 5.500% | 7/1/26 (14) | 2,000 | 2,594 |
| Massachusetts Bay Transportation Authority | | | | |
| Sales Tax Revenue | 5.000% | 7/1/27 | 5,000 | 6,285 |
15
| | | | |
| Massachusetts Tax-Exempt Fund | | | | |
| |
| |
| |
| | | | Face | Market |
| | | Maturity | Amount | Value• |
| | Coupon | Date | ($000) | ($000) |
| Massachusetts Bay Transportation Authority | | | | |
| Sales Tax Revenue | 0.000% | 7/1/29 | 1,020 | 557 |
| Massachusetts Bay Transportation Authority | | | | |
| Sales Tax Revenue | 4.000% | 7/1/32 | 2,870 | 3,110 |
| Massachusetts Bay Transportation Authority | | | | |
| Sales Tax Revenue | 5.250% | 7/1/32 | 2,900 | 3,772 |
| Massachusetts Bay Transportation Authority | | | | |
| Sales Tax Revenue | 5.250% | 7/1/33 | 10,000 | 13,057 |
| Massachusetts Bay Transportation Authority | | | | |
| Sales Tax Revenue | 5.250% | 7/1/33 | 2,000 | 2,611 |
| Massachusetts Bay Transportation Authority | | | | |
| Sales Tax Revenue | 5.250% | 7/1/34 | 12,785 | 14,077 |
| Massachusetts Bay Transportation Authority | | | | |
| Sales Tax Revenue | 4.000% | 7/1/35 | 1,980 | 2,108 |
| Massachusetts Bay Transportation Authority | | | | |
| Sales Tax Revenue | 4.000% | 7/1/35 | 3,000 | 3,202 |
| Massachusetts Bay Transportation Authority | | | | |
| Sales Tax Revenue | 5.000% | 7/1/35 | 2,145 | 2,429 |
| 1 Massachusetts Bay Transportation Authority | | | | |
| Sales Tax Revenue TOB VRDO | 0.110% | 12/7/15 | 2,885 | 2,885 |
| Massachusetts Bay Transportation Authority | | | | |
| Sales Tax Revenue VRDO | 0.010% | 12/7/15 | 4,300 | 4,300 |
| Massachusetts Clean Energy Cooperative Corp. | | | | |
| Revenue (Municipal Lighting Plant) | 5.000% | 7/1/26 | 2,875 | 3,399 |
| Massachusetts Clean Energy Cooperative Corp. | | | | |
| Revenue (Municipal Lighting Plant) | 5.000% | 7/1/29 | 3,300 | 3,817 |
| Massachusetts Clean Energy Cooperative Corp. | | | | |
| Revenue (Municipal Lighting Plant) | 5.000% | 7/1/32 | 2,500 | 2,855 |
| Massachusetts Clean Water Trust Revenue | 5.000% | 2/1/28 | 3,000 | 3,614 |
| Massachusetts Clean Water Trust Revenue | 5.000% | 2/1/35 | 3,000 | 3,493 |
| Massachusetts Clean Water Trust Revenue | 5.000% | 2/1/45 | 2,085 | 2,377 |
| Massachusetts College Building | | | | |
| Authority Revenue | 0.000% | 5/1/17 (10) | 3,340 | 3,294 |
| Massachusetts College Building | | | | |
| Authority Revenue | 5.000% | 5/1/25 | 1,100 | 1,311 |
| Massachusetts College Building | | | | |
| Authority Revenue | 5.000% | 5/1/26 | 1,430 | 1,708 |
| Massachusetts College Building | | | | |
| Authority Revenue | 5.000% | 5/1/27 | 1,200 | 1,433 |
| Massachusetts College Building | | | | |
| Authority Revenue | 5.000% | 5/1/29 | 1,500 | 1,717 |
| Massachusetts College Building | | | | |
| Authority Revenue | 5.000% | 5/1/30 | 1,610 | 1,841 |
| Massachusetts College Building | | | | |
| Authority Revenue | 5.000% | 5/1/30 | 1,075 | 1,227 |
| Massachusetts College Building | | | | |
| Authority Revenue | 5.000% | 5/1/31 | 2,000 | 2,358 |
| Massachusetts College Building | | | | |
| Authority Revenue | 5.000% | 5/1/34 | 3,290 | 3,850 |
| Massachusetts College Building | | | | |
| Authority Revenue | 5.000% | 5/1/36 | 4,000 | 4,501 |
| Massachusetts College Building | | | | |
| Authority Revenue | 5.000% | 5/1/39 | 3,000 | 3,427 |
| Massachusetts College Building | | | | |
| Authority Revenue | 5.000% | 5/1/41 | 5,000 | 5,583 |
16
| | | | |
| Massachusetts Tax-Exempt Fund | | | | |
| |
| |
| |
| | | | Face | Market |
| | | Maturity | Amount | Value• |
| | Coupon | Date | ($000) | ($000) |
| Massachusetts College Building | | | | |
| Authority Revenue | 5.000% | 5/1/43 | 3,285 | 3,646 |
| Massachusetts College Building | | | | |
| Authority Revenue | 4.500% | 5/1/48 | 3,000 | 3,190 |
| Massachusetts Department of Transportation | | | | |
| Metropolitan Highway System Revenue | 5.000% | 1/1/20 | 3,500 | 4,005 |
| Massachusetts Department of Transportation | | | | |
| Metropolitan Highway System Revenue | 5.000% | 1/1/23 | 3,000 | 3,436 |
| Massachusetts Department of Transportation | | | | |
| Metropolitan Highway System Revenue | 5.000% | 1/1/32 | 5,620 | 6,297 |
| Massachusetts Department of Transportation | | | | |
| Metropolitan Highway System Revenue | 5.000% | 1/1/35 | 2,350 | 2,655 |
| Massachusetts Department of Transportation | | | | |
| Metropolitan Highway System Revenue | 5.000% | 1/1/37 | 3,000 | 3,345 |
| Massachusetts Development Finance Agency | | | | |
| Higher Education Revenue (Emerson College) | 5.000% | 1/1/17 (Prere.) | 2,000 | 2,097 |
| Massachusetts Development Finance Agency | | | | |
| Higher Education Revenue (Emerson College) | 5.000% | 1/1/17 (Prere.) | 3,105 | 3,255 |
| Massachusetts Development Finance Agency | | | | |
| Higher Education Revenue (Emerson College) | 5.000% | 1/1/17 (Prere.) | 1,985 | 2,081 |
| Massachusetts Development Finance Agency | | | | |
| Hospital Revenue (Cape Cod Healthcare | | | | |
| Obligated Group) | 5.250% | 11/15/36 | 5,130 | 5,817 |
| Massachusetts Development Finance Agency | | | | |
| Revenue (Baystate Medical Obligated Group) | 5.000% | 7/1/34 | 1,500 | 1,681 |
| Massachusetts Development Finance Agency | | | | |
| Revenue (Berklee College of Music) | 5.250% | 10/1/41 | 3,300 | 3,685 |
| Massachusetts Development Finance Agency | | | | |
| Revenue (Berkshire Health System) | 5.000% | 10/1/22 | 2,000 | 2,272 |
| Massachusetts Development Finance Agency | | | | |
| Revenue (Berkshire Health System) | 5.000% | 10/1/28 | 1,250 | 1,385 |
| Massachusetts Development Finance Agency | | | | |
| Revenue (Berkshire Health System) | 5.000% | 10/1/29 | 1,500 | 1,655 |
| Massachusetts Development Finance Agency | | | | |
| Revenue (Berkshire Health System) | 5.000% | 10/1/30 | 1,430 | 1,572 |
| Massachusetts Development Finance Agency | | | | |
| Revenue (Berkshire Health System) | 5.000% | 10/1/31 | 1,250 | 1,371 |
| Massachusetts Development Finance Agency | | | | |
| Revenue (Boston College) | 5.000% | 7/1/19 | 500 | 568 |
| Massachusetts Development Finance Agency | | | | |
| Revenue (Boston College) | 5.000% | 7/1/40 | 2,000 | 2,254 |
| Massachusetts Development Finance Agency | | | | |
| Revenue (Boston Medical Center) | 5.000% | 7/1/22 (Prere.) | 470 | 567 |
| Massachusetts Development Finance Agency | | | | |
| Revenue (Boston Medical Center) | 5.000% | 7/1/22 (Prere.) | 2,995 | 3,612 |
| Massachusetts Development Finance Agency | | | | |
| Revenue (Boston Medical Center) | 5.000% | 7/1/29 | 2,535 | 2,779 |
| Massachusetts Development Finance Agency | | | | |
| Revenue (Boston Medical Center) | 5.000% | 7/1/44 | 2,000 | 2,158 |
| Massachusetts Development Finance Agency | | | | |
| Revenue (Boston University) | 6.000% | 5/15/29 (2) | 1,400 | 1,735 |
| Massachusetts Development Finance Agency | | | | |
| Revenue (Boston University) | 5.375% | 5/15/39 | 1,575 | 1,940 |
| Massachusetts Development Finance Agency | | | | |
| Revenue (Boston University) | 5.000% | 7/1/42 | 10,000 | 10,582 |
17
| | | | |
| Massachusetts Tax-Exempt Fund | | | | |
| |
| |
| |
| | | | Face | Market |
| | | Maturity | Amount | Value• |
| | Coupon | Date | ($000) | ($000) |
| Massachusetts Development Finance Agency | | | | |
| Revenue (Boston University) | 5.000% | 10/1/48 | 7,400 | 8,262 |
| Massachusetts Development Finance Agency | | | | |
| Revenue (Boston University) | 6.000% | 5/15/59 (10) | 5,575 | 6,932 |
| 2 Massachusetts Development Finance Agency | | | | |
| Revenue (Boston University) PUT | 0.590% | 3/30/17 | 5,000 | 4,992 |
| Massachusetts Development Finance Agency | | | | |
| Revenue (Broad Institute Inc.) | 5.250% | 4/1/37 | 4,000 | 4,627 |
| Massachusetts Development Finance Agency | | | | |
| Revenue (CareGroup Inc.) | 5.000% | 7/1/32 | 1,000 | 1,123 |
| Massachusetts Development Finance Agency | | | | |
| Revenue (CareGroup Inc.) | 5.000% | 7/1/33 | 1,000 | 1,119 |
| Massachusetts Development Finance Agency | | | | |
| Revenue (Carleton-Willard Village) | 5.250% | 12/1/25 | 600 | 663 |
| Massachusetts Development Finance Agency | | | | |
| Revenue (Carleton-Willard Village) | 5.625% | 12/1/30 | 550 | 616 |
| Massachusetts Development Finance Agency | | | | |
| Revenue (Children’s Hospital) | 5.000% | 10/1/34 | 2,440 | 2,798 |
| Massachusetts Development Finance Agency | | | | |
| Revenue (Children’s Hospital) | 5.000% | 10/1/46 | 5,500 | 6,223 |
| Massachusetts Development Finance Agency | | | | |
| Revenue (Commonwealth Contract Assistance) | 5.000% | 5/1/35 | 5,210 | 6,013 |
| Massachusetts Development Finance Agency | | | | |
| Revenue (Commonwealth Contract Assistance) | 5.500% | 2/1/40 | 2,160 | 2,472 |
| Massachusetts Development Finance Agency | | | | |
| Revenue (Deerfield Academy) | 5.000% | 10/1/40 | 4,665 | 5,343 |
| Massachusetts Development Finance Agency | | | | |
| Revenue (Draper Laboratory) | 5.750% | 9/1/18 (Prere.) | 5,000 | 5,650 |
| Massachusetts Development Finance Agency | | | | |
| Revenue (Emerson College) | 5.000% | 1/1/35 | 3,000 | 3,279 |
| Massachusetts Development Finance Agency | | | | |
| Revenue (Emerson College) | 5.000% | 1/1/40 | 6,000 | 6,307 |
| Massachusetts Development Finance Agency | | | | |
| Revenue (Harvard University) | 5.000% | 10/15/28 | 1,000 | 1,155 |
| Massachusetts Development Finance Agency | | | | |
| Revenue (Harvard University) | 5.250% | 2/1/34 | 6,000 | 7,046 |
| Massachusetts Development Finance Agency | | | | |
| Revenue (Harvard University) | 5.000% | 10/15/40 | 9,790 | 11,221 |
| Massachusetts Development Finance Agency | | | | |
| Revenue (Lahey Clinic Obligated Group) | 5.000% | 8/15/28 | 750 | 847 |
| Massachusetts Development Finance Agency | | | | |
| Revenue (Lahey Clinic Obligated Group) | 5.000% | 8/15/40 | 1,750 | 1,960 |
| Massachusetts Development Finance Agency | | | | |
| Revenue (Lahey Clinic Obligated Group) | 5.000% | 8/15/45 | 5,000 | 5,591 |
| Massachusetts Development Finance Agency | | | | |
| Revenue (Lawrence General Hospital) | 5.250% | 7/1/34 | 2,245 | 2,375 |
| Massachusetts Development Finance Agency | | | | |
| Revenue (Loomis Obligated Group) | 6.000% | 1/1/33 | 4,000 | 4,474 |
| Massachusetts Development Finance Agency | | | | |
| Revenue (Lowell General Hospital) | 5.000% | 7/1/37 | 4,800 | 5,124 |
| Massachusetts Development Finance Agency | | | | |
| Revenue (Lowell General Hospital) | 5.000% | 7/1/44 | 5,000 | 5,297 |
| Massachusetts Development Finance Agency | | | | |
| Revenue (Massachusetts College of Pharmacy | | | | |
| & Allied HealthSciences) | 5.000% | 7/1/19 | 175 | 198 |
18
| | | | |
| Massachusetts Tax-Exempt Fund | | | | |
| |
| |
| |
| | | | Face | Market |
| | | Maturity | Amount | Value• |
| | Coupon | Date | ($000) | ($000) |
| Massachusetts Development Finance Agency | | | | |
| Revenue (Massachusetts College of Pharmacy | | | | |
| & Allied HealthSciences) | 5.000% | 7/1/21 | 300 | 354 |
| Massachusetts Development Finance Agency | | | | |
| Revenue (Massachusetts College of Pharmacy | | | | |
| & Allied HealthSciences) | 5.000% | 7/1/23 | 250 | 301 |
| Massachusetts Development Finance Agency | | | | |
| Revenue (Massachusetts College of Pharmacy | | | | |
| & Allied HealthSciences) | 5.000% | 7/1/26 | 1,380 | 1,616 |
| Massachusetts Development Finance Agency | | | | |
| Revenue (MCPHS University) | 5.000% | 7/1/31 | 400 | 464 |
| Massachusetts Development Finance Agency | | | | |
| Revenue (MCPHS University) | 5.000% | 7/1/32 | 300 | 347 |
| Massachusetts Development Finance Agency | | | | |
| Revenue (MCPHS University) | 5.000% | 7/1/37 | 450 | 514 |
| Massachusetts Development Finance Agency | | | | |
| Revenue (Merrimack College) | 5.000% | 7/1/32 | 2,000 | 2,103 |
| Massachusetts Development Finance Agency | | | | |
| Revenue (Merrimack College) | 5.250% | 7/1/42 | 1,470 | 1,546 |
| Massachusetts Development Finance Agency | | | | |
| Revenue (Merrimack College) | 5.125% | 7/1/44 | 2,500 | 2,636 |
| Massachusetts Development Finance Agency | | | | |
| Revenue (Milford Regional Medical Center) | 5.625% | 7/15/36 | 1,000 | 1,095 |
| Massachusetts Development Finance Agency | | | | |
| Revenue (Milford Regional Medical Center) | 5.750% | 7/15/43 | 5,755 | 6,308 |
| Massachusetts Development Finance Agency | | | | |
| Revenue (Mount Holyoke College) | 5.000% | 7/1/36 | 1,500 | 1,629 |
| Massachusetts Development Finance Agency | | | | |
| Revenue (Northeastern University) | 5.000% | 10/1/29 | 3,250 | 3,759 |
| Massachusetts Development Finance Agency | | | | |
| Revenue (Northeastern University) | 5.000% | 10/1/30 | 1,750 | 2,021 |
| Massachusetts Development Finance Agency | | | | |
| Revenue (Northeastern University) | 5.000% | 3/1/32 | 950 | 1,079 |
| Massachusetts Development Finance Agency | | | | |
| Revenue (Northeastern University) | 5.000% | 3/1/39 | 3,500 | 3,924 |
| Massachusetts Development Finance Agency | | | | |
| Revenue (Northeastern University) | 5.000% | 3/1/44 | 3,750 | 4,178 |
| Massachusetts Development Finance Agency | | | | |
| Revenue (Olin College) | 5.000% | 11/1/38 | 6,000 | 6,768 |
| Massachusetts Development Finance Agency | | | | |
| Revenue (Partners Healthcare) | 5.000% | 7/1/28 | 2,000 | 2,311 |
| Massachusetts Development Finance Agency | | | | |
| Revenue (Partners Healthcare) | 5.000% | 7/1/30 | 1,500 | 1,712 |
| Massachusetts Development Finance Agency | | | | |
| Revenue (Partners Healthcare) | 5.000% | 7/1/31 | 5,705 | 6,566 |
| Massachusetts Development Finance Agency | | | | |
| Revenue (Partners Healthcare) | 5.000% | 7/1/36 | 4,000 | 4,561 |
| Massachusetts Development Finance Agency | | | | |
| Revenue (Partners Healthcare) | 5.000% | 7/1/40 | 3,000 | 3,390 |
| Massachusetts Development Finance Agency | | | | |
| Revenue (Partners Healthcare) | 5.375% | 7/1/41 | 4,000 | 4,527 |
| Massachusetts Development Finance Agency | | | | |
| Revenue (Partners Healthcare) | 5.000% | 7/1/45 | 3,775 | 4,233 |
| Massachusetts Development Finance Agency | | | | |
| Revenue (Phillips Academy) | 5.000% | 9/1/38 | 1,545 | 1,803 |
19
| | | | |
| Massachusetts Tax-Exempt Fund | | | | |
| |
| |
| |
| | | | Face | Market |
| | | Maturity | Amount | Value• |
| | Coupon | Date | ($000) | ($000) |
| Massachusetts Development Finance Agency | | | | |
| Revenue (Phillips Academy) | 5.000% | 9/1/43 | 2,500 | 2,898 |
| Massachusetts Development Finance Agency | | | | |
| Revenue (Seven Hills Foundation | | | | |
| Obligated Group) | 5.000% | 9/1/35 | 3,915 | 4,049 |
| Massachusetts Development Finance Agency | | | | |
| Revenue (Seven Hills Foundation | | | | |
| Obligated Group) | 5.000% | 9/1/45 | 2,000 | 2,061 |
| Massachusetts Development Finance Agency | | | | |
| Revenue (Simmons College) | 5.500% | 10/1/28 | 1,000 | 1,143 |
| Massachusetts Development Finance Agency | | | | |
| Revenue (Simmons College) | 5.125% | 10/1/33 | 2,000 | 2,191 |
| Massachusetts Development Finance Agency | | | | |
| Revenue (Simmons College) | 5.000% | 10/1/36 | 2,000 | 2,209 |
| Massachusetts Development Finance Agency | | | | |
| Revenue (Simmons College) | 5.250% | 10/1/39 | 3,000 | 3,277 |
| Massachusetts Development Finance Agency | | | | |
| Revenue (Southcoast Health System | | | | |
| Obligated Group) | 5.000% | 7/1/27 | 1,550 | 1,778 |
| Massachusetts Development Finance Agency | | | | |
| Revenue (Sterling & Francine Clark Art Institute) | 5.000% | 7/1/34 | 1,000 | 1,153 |
| Massachusetts Development Finance Agency | | | | |
| Revenue (Sterling & Francine Clark Art Institute) | 5.000% | 7/1/35 | 2,000 | 2,297 |
| Massachusetts Development Finance Agency | | | | |
| Revenue (Suffolk University) | 5.000% | 7/1/30 | 3,000 | 3,202 |
| Massachusetts Development Finance Agency | | | | |
| Revenue (Suffolk University) | 5.125% | 7/1/40 | 3,000 | 3,163 |
| Massachusetts Development Finance Agency | | | | |
| Revenue (Tufts Medical Center) | 6.250% | 1/1/27 | 3,545 | 4,158 |
| Massachusetts Development Finance Agency | | | | |
| Revenue (Tufts Medical Center) | 7.250% | 1/1/32 | 4,500 | 5,426 |
| Massachusetts Development Finance Agency | | | | |
| Revenue (Tufts Medical Center) | 6.750% | 1/1/36 | 850 | 999 |
| Massachusetts Development Finance Agency | | | | |
| Revenue (Tufts Medical Center) | 6.875% | 1/1/41 | 2,000 | 2,358 |
| Massachusetts Development Finance Agency | | | | |
| Revenue (Tufts University) | 5.000% | 8/15/38 | 1,000 | 1,163 |
| Massachusetts Development Finance Agency | | | | |
| Revenue (UMass Memorial Medical Center) | 5.000% | 7/1/16 | 275 | 281 |
| Massachusetts Development Finance Agency | | | | |
| Revenue (UMass Memorial Medical Center) | 5.125% | 7/1/26 | 2,750 | 3,035 |
| Massachusetts Development Finance Agency | | | | |
| Revenue (UMass Memorial Medical Center) | 5.500% | 7/1/31 | 5,500 | 6,083 |
| Massachusetts Development Finance Agency | | | | |
| Revenue (Wellesley College) | 5.000% | 7/1/42 | 2,000 | 2,276 |
| Massachusetts Development Finance Agency | | | | |
| Revenue (WGBH Educational Foundation) | 5.000% | 1/1/36 (12) | 5,000 | 5,313 |
| Massachusetts Development Finance Agency | | | | |
| Revenue (Williams College) | 5.000% | 7/1/38 | 4,000 | 4,562 |
| Massachusetts Development Finance Agency | | | | |
| Revenue (Williams College) | 5.000% | 7/1/43 | 3,000 | 3,400 |
| Massachusetts Development Finance Agency | | | | |
| Revenue (Worcester Polytechnic Institute) | 5.000% | 9/1/50 | 2,650 | 2,934 |
| Massachusetts Development Finance Agency | | | | |
| Special Obligation Revenue | 5.000% | 5/1/34 | 1,295 | 1,466 |
20
| | | | |
| Massachusetts Tax-Exempt Fund | | | | |
| |
| |
| |
| | | | Face | Market |
| | | Maturity | Amount | Value• |
| | Coupon | Date | ($000) | ($000) |
| Massachusetts Development Finance Agency | | | | |
| Special Obligation Revenue | 5.000% | 5/1/39 | 1,000 | 1,119 |
| Massachusetts Development Finance Agency | | | | |
| Special Obligation Revenue | 5.000% | 5/1/39 | 6,470 | 7,313 |
| Massachusetts Educational Financing Authority | | | | |
| Education Loan Revenue | 5.500% | 1/1/17 | 3,000 | 3,152 |
| Massachusetts Federal Highway GAN | | | | |
| (Accelerated Bridge Program) | 5.000% | 6/15/26 | 3,000 | 3,564 |
| Massachusetts Federal Highway Revenue | 5.000% | 6/15/27 | 6,000 | 7,272 |
| Massachusetts GO | 5.000% | 8/1/17 (Prere.) | 1,250 | 1,337 |
| Massachusetts GO | 5.250% | 8/1/17 (Prere.) | 1,500 | 1,610 |
| Massachusetts GO | 5.500% | 11/1/17 | 3,000 | 3,269 |
| Massachusetts GO | 5.000% | 8/1/18 (Prere.) | 4,185 | 4,607 |
| Massachusetts GO | 5.000% | 8/1/18 (Prere.) | 4,500 | 4,954 |
| Massachusetts GO | 5.000% | 8/1/18 (Prere.) | 4,535 | 5,020 |
| Massachusetts GO | 5.500% | 8/1/19 | 5,000 | 5,788 |
| Massachusetts GO | 5.500% | 10/1/19 (12) | 1,000 | 1,163 |
| Massachusetts GO | 5.500% | 10/1/19 (2) | 2,000 | 2,327 |
| Massachusetts GO | 5.500% | 11/1/19 (4) | 5,550 | 6,472 |
| Massachusetts GO | 5.000% | 8/1/22 | 4,400 | 5,325 |
| Massachusetts GO | 5.250% | 8/1/22 | 5,000 | 6,129 |
| Massachusetts GO | 5.250% | 8/1/23 | 1,000 | 1,241 |
| Massachusetts GO | 5.000% | 11/1/23 | 4,000 | 4,846 |
| Massachusetts GO | 5.000% | 6/1/24 | 3,615 | 4,154 |
| Massachusetts GO | 5.000% | 7/1/24 | 5,765 | 6,916 |
| Massachusetts GO | 5.000% | 6/1/25 | 3,000 | 3,447 |
| Massachusetts GO | 5.000% | 7/1/25 | 9,000 | 10,756 |
| Massachusetts GO | 5.000% | 7/1/26 | 9,000 | 10,701 |
| Massachusetts GO | 5.000% | 8/1/26 | 6,500 | 7,666 |
| Massachusetts GO | 5.500% | 8/1/30 (2) | 14,330 | 18,595 |
| Massachusetts GO | 4.000% | 8/1/32 | 5,000 | 5,272 |
| Massachusetts GO | 5.000% | 7/1/33 | 7,000 | 8,326 |
| Massachusetts GO | 5.000% | 8/1/33 | 2,000 | 2,332 |
| Massachusetts GO | 4.000% | 5/1/35 | 5,000 | 5,242 |
| Massachusetts GO | 5.000% | 7/1/35 | 4,000 | 4,717 |
| Massachusetts GO | 5.000% | 8/1/36 | 9,000 | 10,409 |
| Massachusetts GO | 5.000% | 7/1/37 | 500 | 585 |
| Massachusetts GO | 5.000% | 8/1/37 | 5,000 | 5,783 |
| Massachusetts GO | 5.000% | 7/1/40 | 13,055 | 15,204 |
| Massachusetts GO | 4.000% | 6/1/42 | 8,000 | 8,229 |
| Massachusetts GO | 4.000% | 6/1/43 | 7,820 | 8,011 |
| Massachusetts GO | 4.500% | 8/1/43 | 3,705 | 3,959 |
| Massachusetts GO | 4.000% | 5/1/45 | 10,000 | 10,298 |
| Massachusetts GO | 5.000% | 7/1/45 | 12,000 | 13,846 |
| 1 Massachusetts GO TOB VRDO | 0.010% | 12/1/15 | 900 | 900 |
| Massachusetts Health & Educational Facilities | | | | |
| Authority Revenue (Baystate Medical Center) | | | | |
| VRDO | 0.010% | 12/1/15 LOC | 2,200 | 2,200 |
| Massachusetts Health & Educational Facilities | | | | |
| Authority Revenue (Baystate Medical Center) | | | | |
| VRDO | 0.010% | 12/7/15 LOC | 4,865 | 4,865 |
| Massachusetts Health & Educational Facilities | | | | |
| Authority Revenue (Berklee College of Music) | 5.000% | 10/1/26 | 1,755 | 1,881 |
| Massachusetts Health & Educational Facilities | | | | |
| Authority Revenue (Boston Medical Center) | 5.000% | 7/1/18 (Prere.) | 315 | 347 |
21
| | | | |
| Massachusetts Tax-Exempt Fund | | | | |
| |
| |
| |
| | | | Face | Market |
| | | Maturity | Amount | Value• |
| | Coupon | Date | ($000) | ($000) |
| Massachusetts Health & Educational Facilities | | | | |
| Authority Revenue (Boston Medical Center) | 5.000% | 7/1/28 | 2,575 | 2,707 |
| Massachusetts Health & Educational Facilities | | | | |
| Authority Revenue (CareGroup) | 5.000% | 7/1/28 | 2,000 | 2,175 |
| Massachusetts Health & Educational Facilities | | | | |
| Authority Revenue (CareGroup) | 5.125% | 7/1/33 | 3,015 | 3,203 |
| Massachusetts Health & Educational Facilities | | | | |
| Authority Revenue (CareGroup) | 5.125% | 7/1/38 | 3,500 | 3,701 |
| Massachusetts Health & Educational Facilities | | | | |
| Authority Revenue (Children’s Hospital) | 5.500% | 12/1/39 | 4,000 | 4,523 |
| Massachusetts Health & Educational Facilities | | | | |
| Authority Revenue (Dana-Farber Cancer Institute) | 5.000% | 12/1/37 | 5,000 | 5,437 |
| Massachusetts Health & Educational Facilities | | | | |
| Authority Revenue (Harvard University) | 6.250% | 4/1/20 | 3,000 | 3,644 |
| Massachusetts Health & Educational Facilities | | | | |
| Authority Revenue (Harvard University) | 5.000% | 12/15/24 | 810 | 932 |
| Massachusetts Health & Educational Facilities | | | | |
| Authority Revenue (Harvard University) | 5.000% | 12/15/30 | 925 | 1,054 |
| Massachusetts Health & Educational Facilities | | | | |
| Authority Revenue (Harvard University) | 5.500% | 11/15/36 | 16,000 | 18,137 |
| Massachusetts Health & Educational Facilities | | | | |
| Authority Revenue (Harvard University) VRDO | 0.010% | 12/1/15 | 3,100 | 3,100 |
| Massachusetts Health & Educational Facilities | | | | |
| Authority Revenue (Isabella Stewart Gardner | | | | |
| Museum) | 5.000% | 5/1/27 | 1,650 | 1,837 |
| Massachusetts Health & Educational Facilities | | | | |
| Authority Revenue (Isabella Stewart Gardner | | | | |
| Museum) | 5.000% | 5/1/28 | 2,080 | 2,311 |
| Massachusetts Health & Educational Facilities | | | | |
| Authority Revenue (Lahey Clinic Medical Center) | 5.250% | 8/15/17 (Prere.) | 6,650 | 7,166 |
| Massachusetts Health & Educational Facilities | | | | |
| Authority Revenue (MIT) | 5.000% | 7/1/17 (Prere.) | 3,500 | 3,739 |
| Massachusetts Health & Educational Facilities | | | | |
| Authority Revenue (MIT) | 5.250% | 7/1/30 | 3,000 | 3,938 |
| Massachusetts Health & Educational Facilities | | | | |
| Authority Revenue (Museum of Fine Arts) VRDO | 0.010% | 12/1/15 | 11,635 | 11,635 |
| Massachusetts Health & Educational Facilities | | | | |
| Authority Revenue (Museum of Fine Arts) VRDO | 0.010% | 12/1/15 | 14,800 | 14,800 |
| Massachusetts Health & Educational Facilities | | | | |
| Authority Revenue (Northeastern University) | 5.000% | 10/1/19 | 3,000 | 3,410 |
| Massachusetts Health & Educational Facilities | | | | |
| Authority Revenue (Northeastern University) | 5.000% | 10/1/23 | 3,435 | 3,775 |
| Massachusetts Health & Educational Facilities | | | | |
| Authority Revenue (Northeastern University) | 5.000% | 10/1/32 | 1,000 | 1,123 |
| Massachusetts Health & Educational Facilities | | | | |
| Authority Revenue (Northeastern University) | 5.000% | 10/1/33 | 3,000 | 3,268 |
| Massachusetts Health & Educational Facilities | | | | |
| Authority Revenue (Partners Healthcare System) | 5.250% | 7/1/29 | 10,000 | 11,304 |
| Massachusetts Health & Educational Facilities | | | | |
| Authority Revenue (Partners Healthcare System) | 5.000% | 7/1/39 | 500 | 555 |
| 1 Massachusetts Health & Educational Facilities | | | | |
| Authority Revenue (Partners Healthcare System) | | | | |
| TOB VRDO | 0.020% | 12/7/15 | 1,800 | 1,800 |
| Massachusetts Health & Educational Facilities | | | | |
| Authority Revenue (Partners Healthcare System) | | | | |
| VRDO | 0.010% | 12/7/15 | 3,100 | 3,100 |
22
| | | | |
| Massachusetts Tax-Exempt Fund | | | | |
| |
| |
| |
| | | | Face | Market |
| | | Maturity | Amount | Value• |
| | Coupon | Date | ($000) | ($000) |
| Massachusetts Health & Educational Facilities | | | | |
| Authority Revenue (Partners Healthcare System) | | | | |
| VRDO | 0.010% | 12/7/15 | 2,600 | 2,600 |
| Massachusetts Health & Educational Facilities | | | | |
| Authority Revenue (South Coast Health System) | 5.000% | 7/1/39 | 6,000 | 6,426 |
| Massachusetts Health & Educational Facilities | | | | |
| Authority Revenue (Tufts University) | 5.250% | 2/15/22 | 1,400 | 1,699 |
| Massachusetts Health & Educational Facilities | | | | |
| Authority Revenue (Tufts University) | 5.250% | 2/15/26 | 1,880 | 2,353 |
| Massachusetts Health & Educational Facilities | | | | |
| Authority Revenue (Tufts University) VRDO | 0.010% | 12/1/15 | 7,600 | 7,600 |
| Massachusetts Health & Educational Facilities | | | | |
| Authority Revenue (Williams College) | 5.000% | 7/1/31 | 385 | 394 |
| Massachusetts Health & Educational Facilities | | | | |
| Authority Revenue (Winchester Hospital) | 5.250% | 7/1/38 | 2,840 | 3,119 |
| Massachusetts Housing Finance Agency Single | | | | |
| Family Housing Revenue | 2.650% | 12/1/41 | 4,290 | 4,370 |
| Massachusetts Housing Finance Agency Single | | | | |
| Family Housing Revenue | 2.750% | 12/1/41 | 1,300 | 1,331 |
| 3 Massachusetts Housing Finance Agency Single | | | | |
| Family Housing Revenue | 3.500% | 6/1/42 | 1,100 | 1,164 |
| Massachusetts Housing Finance Agency Single | | | | |
| Family Housing Revenue | 4.000% | 12/1/43 | 3,405 | 3,628 |
| Massachusetts Housing Finance Agency Single | | | | |
| Family Housing Revenue | 4.000% | 12/1/44 | 3,285 | 3,556 |
| Massachusetts Housing Finance Agency Single | | | | |
| Family Housing Revenue | 4.000% | 6/1/45 | 1,655 | 1,788 |
| Massachusetts Port Authority Revenue | 5.500% | 7/1/16 (4) | 4,000 | 4,121 |
| Massachusetts Port Authority Revenue | 5.000% | 7/1/17 (4) | 3,000 | 3,200 |
| Massachusetts Port Authority Revenue | 5.000% | 7/1/25 | 1,230 | 1,462 |
| Massachusetts Port Authority Revenue | 5.000% | 7/1/30 | 2,000 | 2,346 |
| Massachusetts Port Authority Revenue | 5.000% | 7/1/31 | 1,800 | 2,103 |
| Massachusetts Port Authority Revenue | 5.000% | 7/1/33 | 4,650 | 5,380 |
| Massachusetts Port Authority Revenue | 5.000% | 7/1/34 | 3,845 | 4,480 |
| Massachusetts Port Authority Revenue | 5.000% | 7/1/35 | 1,500 | 1,756 |
| Massachusetts Port Authority Revenue | 5.000% | 7/1/40 | 6,850 | 7,928 |
| Massachusetts School Building Authority | | | | |
| Dedicated Sales Tax Revenue | 5.000% | 8/15/22 | 5,000 | 6,038 |
| Massachusetts School Building Authority | | | | |
| Dedicated Sales Tax Revenue | 5.000% | 8/15/25 | 3,110 | 3,725 |
| Massachusetts School Building Authority | | | | |
| Dedicated Sales Tax Revenue | 5.000% | 8/15/26 | 5,000 | 5,960 |
| Massachusetts School Building Authority | | | | |
| Dedicated Sales Tax Revenue | 5.000% | 8/15/27 | 10,000 | 11,853 |
| Massachusetts School Building Authority | | | | |
| Dedicated Sales Tax Revenue | 5.000% | 8/15/28 | 7,250 | 8,571 |
| Massachusetts School Building Authority | | | | |
| Dedicated Sales Tax Revenue | 5.000% | 8/15/29 | 10,000 | 11,809 |
| Massachusetts School Building Authority | | | | |
| Dedicated Sales Tax Revenue | 5.000% | 8/15/30 | 8,000 | 9,439 |
| 3 Massachusetts School Building Authority | | | | |
| Dedicated Sales Tax Revenue | 4.000% | 8/15/32 | 4,000 | 4,299 |
| Massachusetts School Building Authority | | | | |
| Dedicated Sales Tax Revenue | 5.000% | 10/15/32 | 2,400 | 2,802 |
23
| | | | |
| Massachusetts Tax-Exempt Fund | | | | |
| |
| |
| |
| | | | Face | Market |
| | | Maturity | Amount | Value• |
| | Coupon | Date | ($000) | ($000) |
| Massachusetts School Building Authority | | | | |
| Dedicated Sales Tax Revenue | 5.250% | 10/15/35 | 10,000 | 11,778 |
| 3 Massachusetts School Building Authority | | | | |
| Dedicated Sales Tax Revenue | 4.000% | 8/15/36 | 5,000 | 5,292 |
| Massachusetts School Building Authority | | | | |
| Dedicated Sales Tax Revenue | 4.000% | 1/15/37 | 3,000 | 3,109 |
| Massachusetts School Building Authority | | | | |
| Dedicated Sales Tax Revenue | 5.000% | 8/15/37 (2) | 4,735 | 5,026 |
| Massachusetts School Building Authority | | | | |
| Dedicated Sales Tax Revenue | 5.000% | 5/15/38 | 2,660 | 3,061 |
| Massachusetts Special Obligation Dedicated | | | | |
| Tax Revenue | 5.500% | 1/1/27 (14) | 13,000 | 16,424 |
| Massachusetts Special Obligation Dedicated | | | | |
| Tax Revenue | 5.500% | 1/1/28 (14) | 3,750 | 4,751 |
| Massachusetts Transportation Fund Revenue | | | | |
| (Accelerated Bridge Program) | 5.000% | 6/1/29 | 2,000 | 2,338 |
| Massachusetts Transportation Fund Revenue | | | | |
| (Accelerated Bridge Program) | 5.000% | 6/1/33 | 2,050 | 2,388 |
| Massachusetts Transportation Fund Revenue | | | | |
| (Accelerated Bridge Program) | 4.000% | 6/1/37 | 1,960 | 2,061 |
| Massachusetts Transportation Fund Revenue | | | | |
| (Accelerated Bridge Program) | 5.000% | 6/1/38 | 2,750 | 3,178 |
| Massachusetts Transportation Fund Revenue | | | | |
| (Accelerated Bridge Program) | 5.000% | 6/1/43 | 5,000 | 5,756 |
| Massachusetts Transportation Fund Revenue | | | | |
| (Accelerated Bridge Program) | 5.000% | 6/1/44 | 5,000 | 5,770 |
| Massachusetts Transportation Fund Revenue | | | | |
| (Rail Enhancement Program) | 4.000% | 6/1/45 | 7,300 | 7,611 |
| Massachusetts Turnpike Authority Revenue | | | | |
| (Metropolitan Highway System) | 0.000% | 1/1/20 (14) | 3,000 | 2,822 |
| Massachusetts Turnpike Authority Revenue | | | | |
| (Metropolitan Highway System) | 0.000% | 1/1/25 (14) | 5,000 | 4,008 |
| Massachusetts Turnpike Authority Revenue | | | | |
| (Metropolitan Highway System) | 0.000% | 1/1/28 (14) | 6,000 | 4,323 |
| Massachusetts Water Pollution Abatement | | | | |
| Trust Revenue | 5.250% | 8/1/17 | 540 | 542 |
| Massachusetts Water Pollution Abatement | | | | |
| Trust Revenue | 5.000% | 8/1/22 | 3,000 | 3,646 |
| Massachusetts Water Pollution Abatement | | | | |
| Trust Revenue | 5.000% | 8/1/27 | 8,000 | 9,713 |
| Massachusetts Water Pollution Abatement | | | | |
| Trust Revenue | 5.000% | 8/1/28 | 975 | 1,178 |
| Massachusetts Water Pollution Abatement | | | | |
| Trust Revenue | 5.250% | 8/1/29 | 1,520 | 1,977 |
| Massachusetts Water Pollution Abatement | | | | |
| Trust Revenue | 5.750% | 8/1/29 | 190 | 191 |
| Massachusetts Water Pollution Abatement | | | | |
| Trust Revenue | 5.000% | 8/1/32 | 2,415 | 2,777 |
| Massachusetts Water Resources | | | | |
| Authority Revenue | 5.000% | 8/1/16 (Prere.) | 2,005 | 2,068 |
| Massachusetts Water Resources | | | | |
| Authority Revenue | 5.000% | 8/1/16 (Prere.) | 2,995 | 3,088 |
| Massachusetts Water Resources | | | | |
| Authority Revenue | 5.000% | 8/1/17 (Prere.) | 500 | 536 |
24
| | | | |
| Massachusetts Tax-Exempt Fund | | | | |
| |
| |
| |
| | | | Face | Market |
| | | Maturity | Amount | Value• |
| | Coupon | Date | ($000) | ($000) |
| Massachusetts Water Resources | | | | |
| Authority Revenue | 5.500% | 8/1/20 (4) | 1,000 | 1,192 |
| Massachusetts Water Resources | | | | |
| Authority Revenue | 5.500% | 8/1/22 (4) | 1,490 | 1,857 |
| Massachusetts Water Resources | | | | |
| Authority Revenue | 5.000% | 8/1/27 | 2,000 | 2,316 |
| Massachusetts Water Resources | | | | |
| Authority Revenue | 5.000% | 8/1/29 | 2,400 | 2,789 |
| Massachusetts Water Resources | | | | |
| Authority Revenue | 5.000% | 8/1/30 | 2,775 | 3,189 |
| Massachusetts Water Resources | | | | |
| Authority Revenue | 5.250% | 8/1/31 (4) | 1,000 | 1,288 |
| Massachusetts Water Resources | | | | |
| Authority Revenue | 5.000% | 8/1/34 (14) | 7,500 | 7,962 |
| Massachusetts Water Resources | | | | |
| Authority Revenue | 5.000% | 8/1/35 (14) | 13,900 | 14,776 |
| Massachusetts Water Resources | | | | |
| Authority Revenue | 5.250% | 8/1/35 (4) | 1,310 | 1,700 |
| Massachusetts Water Resources | | | | |
| Authority Revenue | 5.000% | 8/1/36 | 2,710 | 3,089 |
| Massachusetts Water Resources | | | | |
| Authority Revenue | 5.000% | 8/1/36 | 1,700 | 1,749 |
| Massachusetts Water Resources | | | | |
| Authority Revenue | 5.000% | 8/1/36 | 1,000 | 1,164 |
| Massachusetts Water Resources | | | | |
| Authority Revenue | 5.000% | 8/1/39 | 2,950 | 3,295 |
| Massachusetts Water Resources | | | | |
| Authority Revenue | 5.000% | 8/1/40 | 500 | 569 |
| Massachusetts Water Resources | | | | |
| Authority Revenue | 5.000% | 8/1/41 | 4,450 | 5,168 |
| Massachusetts Water Resources | | | | |
| Authority Revenue | 5.000% | 8/1/42 | 1,000 | 1,114 |
| Massachusetts Water Resources | | | | |
| Authority Revenue | 5.250% | 8/1/42 | 10,000 | 11,747 |
| Massachusetts Water Resources | | | | |
| Authority Revenue | 5.000% | 8/1/44 | 8,000 | 9,108 |
| Massachusetts Water Resources | | | | |
| Authority Revenue VRDO | 0.020% | 12/7/15 | 3,900 | 3,900 |
| Metropolitan Boston MA Transit Parking | | | | |
| Corp. Revenue | 5.000% | 7/1/31 | 1,000 | 1,139 |
| Metropolitan Boston MA Transit Parking | | | | |
| Corp. Revenue | 5.250% | 7/1/36 | 7,000 | 8,155 |
| Scituate MA GO | 4.000% | 9/15/39 | 3,000 | 3,101 |
| University of Massachusetts Building | | | | |
| Authority Revenue | 5.000% | 11/1/31 | 2,500 | 2,995 |
| University of Massachusetts Building | | | | |
| Authority Revenue | 5.000% | 11/1/32 | 4,060 | 4,837 |
| University of Massachusetts Building | | | | |
| Authority Revenue | 5.000% | 5/1/38 (4) | 1,615 | 1,749 |
| University of Massachusetts Building | | | | |
| Authority Revenue | 5.000% | 5/1/38 | 2,000 | 2,249 |
| University of Massachusetts Building | | | | |
| Authority Revenue | 5.000% | 11/1/39 | 6,695 | 7,517 |
| University of Massachusetts Building | | | | |
| Authority Revenue | 5.000% | 11/1/39 | 3,000 | 3,449 |
25
| | | | |
| Massachusetts Tax-Exempt Fund | | | | |
| |
| |
| |
| | | | Face | Market |
| | | Maturity | Amount | Value• |
| | Coupon | Date | ($000) | ($000) |
| University of Massachusetts Building | | | | |
| Authority Revenue | 5.000% | 11/1/40 | 3,000 | 3,481 |
| University of Massachusetts Building | | | | |
| Authority Revenue | 5.000% | 11/1/44 | 3,365 | 3,849 |
| University of Massachusetts Building | | | | |
| Authority Revenue | 4.000% | 11/1/45 | 2,000 | 2,046 |
| Worcester MA GO | 5.250% | 8/15/21 (14) | 315 | 316 |
| | | | | 1,268,501 |
| Guam (0.5%) | | | | |
| Guam Government Business Privilege | | | | |
| Tax Revenue | 5.000% | 11/15/33 | 3,000 | 3,352 |
| Guam Government Waterworks Authority | | | | |
| Water & Waste Water System Revenue | 5.500% | 7/1/43 | 2,250 | 2,536 |
| | | | | 5,888 |
| Virgin Islands (0.3%) | | | | |
| Virgin Islands Public Finance Authority Revenue | 5.000% | 10/1/30 | 4,000 | 4,357 |
| Total Tax-Exempt Municipal Bonds (Cost $1,211,513) | | | 1,278,746 |
| |
| | Amount |
| | ($000) |
| Other Assets and Liabilities (0.6%) | |
| Other Assets | |
| Investment in Vanguard | 111 |
| Receivables for Investment Securities Sold | 4,600 |
| Receivables for Accrued Income | 16,098 |
| Receivables for Capital Shares Issued | 1,446 |
| Other Assets | 4,852 |
| Total Other Assets | 27,107 |
| Liabilities | |
| Payables for Investment Securities Purchased | (17,139) |
| Payables for Capital Shares Redeemed | (478) |
| Payables for Distributions | (885) |
| Payables to Vanguard | (1,176) |
| Other Liabilities | (146) |
| Total Liabilities | (19,824) |
| Net Assets (100%) | |
| Applicable to 118,355,186 outstanding $.001 par value shares of | |
| beneficial interest (unlimited authorization) | 1,286,029 |
| Net Asset Value Per Share | $10.87 |
26
| |
| Massachusetts Tax-Exempt Fund | |
| |
| |
| |
| At November 30, 2015, net assets consisted of: | |
| | Amount |
| | ($000) |
| Paid-in Capital | 1,217,644 |
| Undistributed Net Investment Income | — |
| Accumulated Net Realized Gains | 1,152 |
| Unrealized Appreciation (Depreciation) | 67,233 |
| Net Assets | 1,286,029 |
• See Note A in Notes to Financial Statements.
1 Security exempt from registration under Rule 144A of the Securities Act of 1933. Such securities may be sold in transactions exempt from
registration, normally to qualified institutional buyers. At November 30, 2015, the aggregate value of these securities was $5,585,000,
representing 0.4% of net assets.
2 Adjustable-rate security.
3 Security purchased on a when-issued or delayed-delivery basis for which the fund has not taken delivery as of November 30, 2015.
A key to abbreviations and other references follows the Statement of Net Assets.
See accompanying Notes, which are an integral part of the Financial Statements.
27
Massachusetts Tax-Exempt Fund
Key to Abbreviations
ARS—Auction Rate Security.
BAN—Bond Anticipation Note.
COP—Certificate of Participation.
CP—Commercial Paper.
FR—Floating Rate.
GAN—Grant Anticipation Note.
GO—General Obligation Bond.
PILOT—Payments in Lieu of Taxes.
PUT—Put Option Obligation.
RAN—Revenue Anticipation Note.
TAN—Tax Anticipation Note.
TOB—Tender Option Bond.
TRAN—Tax Revenue Anticipation Note.
VRDO—Variable Rate Demand Obligation.
VRDP—Variable Rate Demand Preferred.
(ETM)—Escrowed to Maturity.
(Prere.)—Prerefunded.
Scheduled principal and interest payments are guaranteed by:
(1) MBIA (Municipal Bond Investors Assurance).
(2) AMBAC (Ambac Assurance Corporation).
(3) FGIC (Financial Guaranty Insurance Company).
(4) AGM (Assured Guaranty Municipal Corporation).
(5) BIGI (Bond Investors Guaranty Insurance).
(6) Connie Lee Inc.
(7) FHA (Federal Housing Authority).
(8) CapMAC (Capital Markets Assurance Corporation).
(9) American Capital Access Financial Guaranty Corporation.
(10) XL Capital Assurance Inc.
(11) CIFG (CDC IXIS Financial Guaranty).
(12) AGC (Assured Guaranty Corporation).
(13) BHAC (Berkshire Hathaway Assurance Corporation).
(14) NPFG (National Public Finance Guarantee Corporation).
(15) BAM (Build America Mutual Assurance Company).
(16) MAC (Municipal Assurance Corporation).
(17) RAA (Radian Asset Assurance Inc.).
The insurance does not guarantee the market value of the municipal bonds.
LOC—Scheduled principal and interest payments are guaranteed by bank letter of credit.
28
Massachusetts Tax-Exempt Fund
Statement of Operations
| |
| | Year Ended |
| | November 30, 2015 |
| | ($000) |
| Investment Income | |
| Income | |
| Interest | 39,752 |
| Total Income | 39,752 |
| Expenses | |
| The Vanguard Group—Note B | |
| Investment Advisory Services | 126 |
| Management and Administrative | 1,551 |
| Marketing and Distribution | 223 |
| Custodian Fees | 14 |
| Auditing Fees | 34 |
| Shareholders’ Reports | 9 |
| Trustees’ Fees and Expenses | 1 |
| Total Expenses | 1,958 |
| Net Investment Income | 37,794 |
| Realized Net Gain (Loss) | |
| Investment Securities Sold | 2,341 |
| Futures Contracts | (62) |
| Realized Net Gain (Loss) | 2,279 |
| Change in Unrealized Appreciation (Depreciation) of Investment Securities | 5,073 |
| Net Increase (Decrease) in Net Assets Resulting from Operations | 45,146 |
See accompanying Notes, which are an integral part of the Financial Statements.
29
Massachusetts Tax-Exempt Fund
Statement of Changes in Net Assets
| | |
| | Year Ended November 30, |
| | 2015 | 2014 |
| | ($000) | ($000) |
| Increase (Decrease) in Net Assets | | |
| Operations | | |
| Net Investment Income | 37,794 | 34,635 |
| Realized Net Gain (Loss) | 2,279 | 7,373 |
| Change in Unrealized Appreciation (Depreciation) | 5,073 | 51,523 |
| Net Increase (Decrease) in Net Assets Resulting from Operations | 45,146 | 93,531 |
| Distributions | | |
| Net Investment Income | (37,794) | (34,635) |
| Realized Capital Gain1 | (7,117) | — |
| Total Distributions | (44,911) | (34,635) |
| Capital Share Transactions | | |
| Issued | 242,766 | 205,583 |
| Issued in Lieu of Cash Distributions | 32,933 | 24,623 |
| Redeemed | (138,306) | (142,017) |
| Net Increase (Decrease) from Capital Share Transactions | 137,393 | 88,189 |
| Total Increase (Decrease) | 137,628 | 147,085 |
| Net Assets | | |
| Beginning of Period | 1,148,401 | 1,001,316 |
| End of Period2 | 1,286,029 | 1,148,401 |
1 Includes fiscal 2015 short-term gain distributions totaling $1,785,000. Short-term gain distributions are treated as ordinary income dividends for tax purposes.
2 Net Assets—End of Period includes undistributed (overdistributed) net investment income of $0 and $0.
See accompanying Notes, which are an integral part of the Financial Statements.
30
Massachusetts Tax-Exempt Fund
Financial Highlights
| | | | | |
| For a Share Outstanding | Year Ended November 30, |
| Throughout Each Period | 2015 | 2014 | 2013 | 2012 | 2011 |
| Net Asset Value, Beginning of Period | $10.87 | $10.27 | $11.13 | $10.41 | $10.15 |
| Investment Operations | | | | | |
| Net Investment Income | . 334 | .345 | .340 | .349 | .366 |
| Net Realized and Unrealized Gain (Loss) | | | | | |
| on Investments | .067 | .600 | (. 860) | .720 | . 260 |
| Total from Investment Operations | .401 | .945 | (.520) | 1.069 | .626 |
| Distributions | | | | | |
| Dividends from Net Investment Income | (.334) | (.345) | (. 340) | (. 349) | (. 366) |
| Distributions from Realized Capital Gains | (.067) | — | — | — | — |
| Total Distributions | (.401) | (.345) | (. 340) | (. 349) | (. 366) |
| Net Asset Value, End of Period | $10.87 | $10.87 | $10.27 | $11.13 | $10.41 |
| |
| Total Return1 | 3.77% | 9.32% | -4.71% | 10.41% | 6.32% |
| |
| Ratios/Supplemental Data | | | | | |
| Net Assets, End of Period (Millions) | $1,286 | $1,148 | $1,001 | $1,127 | $942 |
| Ratio of Total Expenses to Average Net Assets | 0.16% | 0.16% | 0.16% | 0.16% | 0.17% |
| Ratio of Net Investment Income to | | | | | |
| Average Net Assets | 3.09% | 3.24% | 3.21% | 3.22% | 3.61% |
| Portfolio Turnover Rate | 15% | 27% | 36% | 13% | 13% |
1 Total returns do not include account service fees that may have applied in the periods shown. Fund prospectuses provide information about
any applicable account service fees.
See accompanying Notes, which are an integral part of the Financial Statements.
31
Massachusetts Tax-Exempt Fund
Notes to Financial Statements
Vanguard Massachusetts Tax-Exempt Fund is registered under the Investment Company Act of 1940 as an open-end investment company, or mutual fund. The fund invests in debt instruments of municipal issuers whose ability to meet their obligations may be affected by economic and political developments in the state.
A. The following significant accounting policies conform to generally accepted accounting principles for U.S. investment companies. The fund consistently follows such policies in preparing its financial statements.
1. Security Valuation: Securities are valued as of the close of trading on the New York Stock Exchange (generally 4 p.m., Eastern time) on the valuation date. Bonds, and temporary cash investments acquired over 60 days to maturity, are valued using the latest bid prices or using valuations based on a matrix system (which considers such factors as security prices, yields, maturities, and ratings), both as furnished by independent pricing services. Other temporary cash investments are valued at amortized cost, which approximates market value. Securities for which market quotations are not readily available, or whose values have been affected by events occurring before the fund’s pricing time but after the close of the securities’ primary markets, are valued by methods deemed by the board of trustees to represent fair value.
2. Futures Contracts: The fund uses futures contracts to invest in fixed income asset classes with greater efficiency and lower cost than is possible through direct investment, to add value when these instruments are attractively priced, or to adjust sensitivity to changes in interest rates. The primary risks associated with the use of futures contracts are imperfect correlation between changes in market values of bonds held by the fund and the prices of futures contracts, and the possibility of an illiquid market. Counterparty risk involving futures is mitigated because a regulated clearinghouse is the counterparty instead of the clearing broker. To further mitigate counterparty risk, the fund trades futures contracts on an exchange, monitors the financial strength of its clearing brokers and clearinghouse, and has entered into clearing agreements with its clearing brokers. The clearinghouse imposes initial margin requirements to secure the fund’s performance and requires daily settlement of variation margin representing changes in the market value of each contract.
Futures contracts are valued at their quoted daily settlement prices. The aggregate settlement values of the contracts are not recorded in the Statement of Net Assets. Fluctuations in the value of the contracts are recorded in the Statement of Net Assets as an asset (liability) and in the Statement of Operations as unrealized appreciation (depreciation) until the contracts are closed, when they are recorded as realized futures gains (losses).
During the year ended November 30, 2015, the fund’s average investments in long and short futures contracts each represented 0% of net assets, based on the average of aggregate settlement values at each quarter-end during the period. The fund had no open futures contracts at November 30, 2015.
3. Federal Income Taxes: The fund intends to continue to qualify as a regulated investment company and distribute all of its income. Management has analyzed the fund’s tax positions taken for all open federal income tax years (November 30, 2012–2015), and has concluded that no provision for federal income tax is required in the fund’s financial statements.
32
Massachusetts Tax-Exempt Fund
4. Distributions: Distributions from net investment income are declared daily and paid on the first business day of the following month. Annual distributions from realized capital gains, if any, are recorded on the ex-dividend date.
5. Credit Facility: The fund and certain other funds managed by The Vanguard Group (“Vanguard”) participate in a $3 billion committed credit facility provided by a syndicate of lenders pursuant to a credit agreement that may be renewed annually; each fund is individually liable for its borrowings, if any, under the credit facility. Borrowings may be utilized for temporary and emergency purposes, and are subject to the fund’s regulatory and contractual borrowing restrictions. The participating funds are charged administrative fees and an annual commitment fee of 0.06% of the undrawn amount of the facility; these fees are allocated to the funds based on a method approved by the fund’s board of trustees and included in Management and Administrative expenses on the fund’s Statement of Operations. Any borrowings under this facility bear interest at a rate equal to the higher of the federal funds rate or LIBOR reference rate plus an agreed-upon spread.
The fund had no borrowings outstanding at November 30, 2015, or at any time during the period then ended.
6. Other: Interest income is accrued daily. Premiums and discounts on debt securities purchased are amortized and accreted, respectively, to interest income over the lives of the respective securities. Security transactions are accounted for on the date securities are bought or sold. Costs used to determine realized gains (losses) on the sale of investment securities are those of the specific securities sold.
B. In accordance with the terms of a Funds’ Service Agreement (the “FSA”) between Vanguard and the fund, Vanguard furnishes to the fund investment advisory, corporate management, administrative, marketing, and distribution services at Vanguard’s cost of operations (as defined by the FSA). These costs of operations are allocated to the fund based on methods and guidelines approved by the board of trustees. Vanguard does not require reimbursement in the current period for certain costs of operations (such as deferred compensation/benefits and risk/insurance costs); the fund’s liability for these costs of operations is included in Payables to Vanguard on the Statement of Net Assets.
Upon the request of Vanguard, the fund may invest up to 0.40% of its net assets as capital in Vanguard. At November 30, 2015, the fund had contributed to Vanguard capital in the amount of $111,000, representing 0.01% of the fund’s net assets and 0.04% of Vanguard’s capitalization. The fund’s trustees and officers are also directors and employees, respectively, of Vanguard.
C. Various inputs may be used to determine the value of the fund’s investments. These inputs are summarized in three broad levels for financial statement purposes. The inputs or methodologies used to value securities are not necessarily an indication of the risk associated with investing in those securities.
Level 1—Quoted prices in active markets for identical securities.
Level 2—Other significant observable inputs (including quoted prices for similar securities, interest rates, prepayment speeds, credit risk, etc.).
Level 3—Significant unobservable inputs (including the fund’s own assumptions used to determine the fair value of investments).
33
Massachusetts Tax-Exempt Fund
The following table summarizes the market value of the fund’s investments as of November 30, 2015, based on the inputs used to value them:
| | | |
| | Level 1 | Level 2 | Level 3 |
| Investments | ($000) | ($000) | ($000) |
| Tax-Exempt Municipal Bonds | — | 1,278,746 | — |
| Futures Contracts—Assets1 | 5 | — | — |
| Futures Contracts—Liabilities1 | (4) | — | — |
| Total | 1 | 1,278,746 | — |
| 1 Represents variation margin on the last day of the reporting period for recently closed futures contracts. |
D. Capital gain distributions are determined on a tax basis and may differ from realized capital gains for financial reporting purposes. Differences may be permanent or temporary. Permanent differences are reclassified among capital accounts in the financial statements to reflect their tax character. Temporary differences arise when gains or losses are recognized in different periods for financial statement and tax purposes. These differences will reverse at some time in the future.
The fund used a tax accounting practice to treat a portion of the price of capital shares redeemed during the year as distributions from realized capital gains. Accordingly, the fund has reclassified $286,000 from accumulated net realized gains to paid-in capital.
For tax purposes, at November 30, 2015, the fund had short-term and long-term capital gains of $206,000 and $1,804,000, respectively, available for distribution. Short-term gain distributions are treated as ordinary income dividends for tax purposes.
At November 30, 2015, the cost of investment securities for tax purposes was $1,212,371,000. Net unrealized appreciation of investment securities for tax purposes was $66,375,000, consisting of unrealized gains of $66,822,000 on securities that had risen in value since their purchase and $447,000 in unrealized losses on securities that had fallen in value since their purchase.
E. During the year ended November 30, 2015, the fund purchased $304,118,000 of investment securities and sold $169,148,000 of investment securities, other than temporary cash investments.
F. Capital shares issued and redeemed were:
| | |
| | Year Ended November 30, |
| | 2015 | 2014 |
| | Shares | Shares |
| | (000) | (000) |
| Issued | 22,432 | 19,337 |
| Issued in Lieu of Cash Distributions | 3,042 | 2,308 |
| Redeemed | (12,798) | (13,428) |
| Net Increase (Decrease) in Shares Outstanding | 12,676 | 8,217 |
G. Management has determined that no material events or transactions occurred subsequent to November 30, 2015, that would require recognition or disclosure in these financial statements.
34
Report of Independent Registered
Public Accounting Firm
To the Board of Trustees of Vanguard Massachusetts Tax-Exempt Funds and the Shareholders of Vanguard Massachusetts Tax-Exempt Fund:
In our opinion, the accompanying statement of net assets and the related statements of operations and of changes in net assets and the financial highlights present fairly, in all material respects, the financial position of Vanguard Massachusetts Tax-Exempt Fund (constituting Vanguard Massachusetts Tax-Exempt Funds, hereafter referred to as the “Fund”) at November 30, 2015, the results of its operations for the year then ended, the changes in its net assets for each of the two years in the period then ended, and the financial highlights for each of the five years in the period then ended, in conformity with accounting principles generally accepted in the United States of America. These financial statements and financial highlights (hereafter referred to as “financial statements”) are the responsibility of the Fund’s management. Our responsibility is to express an opinion on these financial statements based on our audits. We conducted our audits of these financial statements in accordance with the standards of the Public Company Accounting Oversight Board (United States). Those standards require that we plan and perform the audit to obtain reasonable assurance about whether the financial statements are free of material misstatement. An audit includes examining, on a test basis, evidence supporting the amounts and disclosures in the financial statements, assessing the accounting principles used and significant estimates made by management, and evaluating the overall financial statement presentation. We believe that our audits, which included confirmation of securities at November 30, 2015 by correspondence with the custodian and brokers and the application of alternative auditing procedures where securities purchased had not been received, provide a reasonable basis for our opinion.
/s/PricewaterhouseCoopers LLP
Philadelphia, Pennsylvania
January 13, 2016
Special 2015 tax information (unaudited) for Vanguard Massachusetts Tax-Exempt Fund
This information for the fiscal year ended November 30, 2015, is included pursuant to provisions of the Internal Revenue Code.
The fund distributed $5,595,000 as capital gain dividends (20% rate gain distributions) to shareholders during the fiscal year.
For nonresident alien shareholders, 100% of short-term capital gain dividends distributed by the fund are qualified short-term capital gains.
The fund designates 100% of its income dividends as exempt-interest dividends.
35
About Your Fund’s Expenses
As a shareholder of the fund, you incur ongoing costs, which include costs for portfolio management, administrative services, and shareholder reports (like this one), among others. Operating expenses, which are deducted from a fund’s gross income, directly reduce the investment return of the fund.
A fund’s expenses are expressed as a percentage of its average net assets. This figure is known as the expense ratio. The following examples are intended to help you understand the ongoing costs (in dollars) of investing in your fund and to compare these costs with those of other mutual funds. The examples are based on an investment of $1,000 made at the beginning of the period shown and held for the entire period.
The accompanying table illustrates your fund’s costs in two ways:
• Based on actual fund return. This section helps you to estimate the actual expenses that you paid over the period. The ”Ending Account Value“ shown is derived from the fund‘s actual return, and the third column shows the dollar amount that would have been paid by an investor who started with $1,000 in the fund. You may use the information here, together with the amount you invested, to estimate the expenses that you paid over the period.
To do so, simply divide your account value by $1,000 (for example, an $8,600 account value divided by $1,000 = 8.6), then multiply the result by the number given for your fund under the heading ”Expenses Paid During Period.“
• Based on hypothetical 5% yearly return. This section is intended to help you compare your fund‘s costs with those of other mutual funds. It assumes that the fund had a yearly return of 5% before expenses, but that the expense ratio is unchanged. In this case—because the return used is not the fund’s actual return—the results do not apply to your investment. The example is useful in making comparisons because the Securities and Exchange Commission requires all mutual funds to calculate expenses based on a 5% return. You can assess your fund’s costs by comparing this hypothetical example with the hypothetical examples that appear in shareholder reports of other funds.
Note that the expenses shown in the table are meant to highlight and help you compare ongoing costs only and do not reflect transaction costs incurred by the fund for buying and selling securities. Further, the expenses do not include any purchase, redemption, or account service fees described in the fund prospectus. If such fees were applied to your account, your costs would be higher. Your fund does not carry a “sales load.”
The calculations assume no shares were bought or sold during the period. Your actual costs may have been higher or lower, depending on the amount of your investment and the timing of any purchases or redemptions.
You can find more information about the fund’s expenses, including annual expense ratios, in the Financial Statements section of this report. For additional information on operating expenses and other shareholder costs, please refer to your fund’s current prospectus.
36
| | | |
| Six Months Ended November 30, 2015 | | | |
| | Beginning | Ending | Expenses |
| | Account Value | Account Value | Paid During |
| Massachusetts Tax-Exempt Fund | 5/31/2015 | 11/30/2015 | Period |
| Based on Actual Fund Return | $1,000.00 | $1,028.00 | $0.86 |
| Based on Hypothetical 5% Yearly Return | 1,000.00 | 1,024.22 | 0.86 |
The calculations are based on expenses incurred in the most recent six-month period. The fund’s annualized six-month expense ratio for that
period is 0.17%. The dollar amounts shown as “Expenses Paid” are equal to the annualized expense ratio multiplied by the average account
value over the period, multiplied by the number of days in the most recent six-month period, then divided by the number of days in the most
recent 12-month period (183/365).
37
Glossary
30-Day SEC Yield. A fund’s 30-day SEC yield is derived using a formula specified by the U.S. Securities and Exchange Commission. Under the formula, data related to the fund’s security holdings in the previous 30 days are used to calculate the fund’s hypothetical net income for that period, which is then annualized and divided by the fund’s estimated average net assets over the calculation period. For the purposes of this calculation, a security’s income is based on its current market yield to maturity (for bonds), its actual income (for asset-backed securities), or its projected dividend yield (for stocks). Because the SEC yield represents hypothetical annualized income, it will differ—at times significantly—from the fund’s actual experience. As a result, the fund’s income distributions may be higher or lower than implied by the SEC yield.
Average Coupon. The average interest rate paid on the fixed income securities held by a fund. It is expressed as a percentage of face value.
Average Duration. An estimate of how much the value of the bonds held by a fund will fluctuate in response to a change in interest rates. To see how the value could change, multiply the average duration by the change in rates. If interest rates rise by 1 percentage point, the value of the bonds in a fund with an average duration of five years would decline by about 5%. If rates decrease by a percentage point, the value would rise by 5%.
Average Stated Maturity. The average length of time until fixed income securities held by a fund reach maturity and are repaid using the maturity date of the security. The figure reflects the proportion of fund assets represented by each security; it also reflects any futures contracts held. In general, the longer the average stated maturity, the more a fund’s share price will fluctuate in response to changes in market interest rates.
Beta. A measure of the magnitude of a fund’s past share-price fluctuations in relation to the ups and downs of a given market index. The index is assigned a beta of 1.00. Compared with a given index, a fund with a beta of 1.20 typically would have seen its share price rise or fall by 12% when the index rose or fell by 10%. For this report, beta is based on returns over the past 36 months for both the fund and the index. Note that a fund’s beta should be reviewed in conjunction with its R-squared (see definition). The lower the R-squared, the less correlation there is between the fund and the index, and the less reliable beta is as an indicator of volatility.
Credit Quality. Credit-quality ratings are measured on a scale that generally ranges from AAA (highest) to D (lowest). Credit-quality ratings are obtained from Moody’s and S&P, and the higher rating for each issue is used. ”Not Rated” is used to classify securities for which a rating is not available. Not rated securities include a fund’s investment in Vanguard Market Liquidity Fund or Vanguard Municipal Cash Management Fund, each of which invests in high-quality money market instruments and may serve as a cash management vehicle for the Vanguard funds, trusts, and accounts.
Expense Ratio. A fund’s total annual operating expenses expressed as a percentage of the fund’s average net assets. The expense ratio includes management and administrative expenses, but does not include the transaction costs of buying and selling portfolio securities.
Inception Date. The date on which the assets of a fund (or one of its share classes) are first invested in accordance with the fund’s investment objective. For funds with a subscription period, the inception date is the day after that period ends. Investment performance is measured from the inception date.
38
R-Squared. A measure of how much of a fund’s past returns can be explained by the returns from the market in general, as measured by a given index. If a fund’s total returns were precisely synchronized with an index’s returns, its R-squared would be 1.00. If the fund’s returns bore no relationship to the index’s returns, its R-squared would be 0. For this report, R-squared is based on returns over the past 36 months for both the fund and the index.
Short-Term Reserves. The percentage of a fund invested in highly liquid, short-term securities that can be readily converted to cash.
Yield to Maturity. The rate of return an investor would receive if the fixed income securities held by a fund were held to their maturity dates.
39
The People Who Govern Your Fund
The trustees of your mutual fund are there to see that the fund is operated and managed in your best interests since, as a shareholder, you are a part owner of the fund. Your fund’s trustees also serve on the board of directors of The Vanguard Group, Inc., which is owned by the Vanguard funds and provides services to them on an at-cost basis.
A majority of Vanguard’s board members are independent, meaning that they have no affiliation with Vanguard or the funds they oversee, apart from the sizable personal investments they have made as private individuals. The independent board members have distinguished backgrounds in business, academia, and public service. Each of the trustees and executive officers oversees 194 Vanguard funds.
The following table provides information for each trustee and executive officer of the fund. More information about the trustees is in the Statement of Additional Information, which can be obtained, without charge, by contacting Vanguard at 800-662-7447, or online at vanguard.com.
| |
| InterestedTrustee1 | Rajiv L. Gupta |
| | Born 1945. Trustee Since December 2001.2 Principal |
| F. William McNabb III | Occupation(s) During the Past Five Years and Other |
| Born 1957. Trustee Since July 2009. Chairman of | Experience: Chairman and Chief Executive Officer |
| the Board. Principal Occupation(s) During the Past | (retired 2009) and President (2006–2008) of |
| Five Years and Other Experience: Chairman of the | Rohm and Haas Co. (chemicals); Director of Tyco |
| Board of The Vanguard Group, Inc., and of each of | International PLC (diversified manufacturing and |
| the investment companies served by The Vanguard | services), Hewlett-Packard Co. (electronic computer |
| Group, since January 2010; Director of The Vanguard | manufacturing), and Delphi Automotive PLC |
| Group since 2008; Chief Executive Officer and | (automotive components); Senior Advisor at New |
| President of The Vanguard Group, and of each of | Mountain Capital. |
| the investment companies served by The Vanguard | |
| Group, since 2008; Director of Vanguard Marketing | Amy Gutmann |
| Corporation; Managing Director of The Vanguard | Born 1949. Trustee Since June 2006. Principal |
| Group (1995–2008). | Occupation(s) During the Past Five Years and |
| | Other Experience: President of the University of |
| IndependentTrustees | Pennsylvania; Christopher H. Browne Distinguished |
| | Professor of Political Science, School of Arts and |
| Emerson U. Fullwood | Sciences, and Professor of Communication, Annenberg |
| Born 1948. Trustee Since January 2008. Principal | School for Communication, with secondary faculty |
| Occupation(s) During the Past Five Years and | appointments in the Department of Philosophy, School |
| Other Experience: Executive Chief Staff and | of Arts and Sciences, and at the Graduate School of |
| Marketing Officer for North America and Corporate | Education, University of Pennsylvania; Trustee of the |
| Vice President (retired 2008) of Xerox Corporation | National Constitution Center; Chair of the Presidential |
| (document management products and services); | Commission for the Study of Bioethical Issues. |
| Executive in Residence and 2009–2010 Distinguished | |
| Minett Professor at the Rochester Institute of | JoAnn Heffernan Heisen |
| Technology; Director of SPX Corporation (multi-industry | Born 1950. Trustee Since July 1998. Principal |
| manufacturing), the United Way of Rochester, the | Occupation(s) During the Past Five Years and |
| University of Rochester Medical Center, Monroe | Other Experience: Corporate Vice President and |
| Community College Foundation, and North Carolina | Chief Global Diversity Officer (retired 2008) and |
| A&T University. | Member of the Executive Committee (1997–2008) |
| | of Johnson & Johnson (pharmaceuticals/medical |
| | devices/consumer products); Director of Skytop |
| | Lodge Corporation (hotels) and the Robert Wood |
| | Johnson Foundation; Member of the Advisory |
| | Board of the Institute for Women’s Leadership |
| | at Rutgers University. |
| | |
| F. Joseph Loughrey | Executive Officers | |
| Born 1949. Trustee Since October 2009. Principal | | |
| Occupation(s) During the Past Five Years and Other | Glenn Booraem | |
| Experience: President and Chief Operating Officer | Born 1967. Treasurer Since May 2015. Principal |
| (retired 2009) of Cummins Inc. (industrial machinery); | Occupation(s) During the Past Five Years and |
| Chairman of the Board of Hillenbrand, Inc. (specialized | Other Experience: Principal of The Vanguard Group, |
| consumer services), and of Oxfam America; Director | Inc.; Treasurer of each of the investment companies |
| of SKF AB (industrial machinery), Hyster-Yale Materials | served by The Vanguard Group; Controller of each of |
| Handling, Inc. (forklift trucks), the Lumina Foundation | the investment companies served by The Vanguard |
| for Education, and the V Foundation for Cancer | Group (2010–2015); Assistant Controller of each of |
| Research; Member of the Advisory Council for the | the investment companies served by The Vanguard |
| College of Arts and Letters and of the Advisory Board | Group (2001–2010). | |
| to the Kellogg Institute for International Studies, both | | |
| at the University of Notre Dame. | Thomas J. Higgins | |
| Born 1957. Chief Financial Officer Since September |
| Mark Loughridge | 2008. Principal Occupation(s) During the Past Five |
| Born 1953. Trustee Since March 2012. Principal | Years and Other Experience: Principal of The Vanguard |
| Occupation(s) During the Past Five Years and Other | Group, Inc.; Chief Financial Officer of each of the |
| Experience: Senior Vice President and Chief Financial | investment companies served by The Vanguard Group; |
| Officer (retired 2013) at IBM (information technology | Treasurer of each of the investment companies served |
| services); Fiduciary Member of IBM’s Retirement Plan | by The Vanguard Group (1998–2008). |
| Committee (2004–2013); Director of the Dow Chemical | | |
| Company; Member of the Council on Chicago Booth. | Peter Mahoney | |
| Born 1974. Controller Since May 2015. Principal |
| Scott C. Malpass | Occupation(s) During the Past Five Years and |
| Born 1962. Trustee Since March 2012. Principal | Other Experience: Head of Global Fund Accounting |
| Occupation(s) During the Past Five Years and Other | at The Vanguard Group, Inc.; Controller of each of the |
| Experience: Chief Investment Officer and Vice | investment companies served by The Vanguard Group; |
| President at the University of Notre Dame; Assistant | Head of International Fund Services at The Vanguard |
| Professor of Finance at the Mendoza College of | Group (2008–2014). | |
| Business at Notre Dame; Member of the Notre Dame | | |
| 403(b) Investment Committee; Board Member of | Heidi Stam | |
| TIFF Advisory Services, Inc., and Catholic Investment | Born 1956. Secretary Since July 2005. Principal |
| Services, Inc. (investment advisors); Member of | Occupation(s) During the Past Five Years and Other |
| the Investment Advisory Committee of Major | Experience: Managing Director of The Vanguard |
| Group, Inc.; General Counsel of The Vanguard Group; |
| Secretary of The Vanguard Group and of each of the |
| André F. Perold | investment companies served by The Vanguard Group; |
| Born 1952. Trustee Since December 2004. Principal | Director and Senior Vice President of Vanguard |
| Occupation(s) During the Past Five Years and Other | Marketing Corporation. | |
| Experience: George Gund Professor of Finance and | | |
| Banking, Emeritus at the Harvard Business School | Vanguard Senior ManagementTeam |
| (retired 2011); Chief Investment Officer and Managing | Mortimer J. Buckley | Chris D. McIsaac |
| Partner of HighVista Strategies LLC (private investment | Kathleen C. Gubanich | James M. Norris |
| firm); Director of Rand Merchant Bank; Overseer of | Paul A. Heller | Thomas M. Rampulla |
| the Museum of Fine Arts Boston. | Martha G. King | Glenn W. Reed |
| John T. Marcante | Karin A. Risi |
| Peter F. Volanakis | | |
| Born 1955. Trustee Since July 2009. Principal | | |
| Occupation(s) During the Past Five Years and Other | Chairman Emeritus and Senior Advisor |
| Experience: President and Chief Operating Officer | | |
| (retired 2010) of Corning Incorporated (communications | John J. Brennan | |
| equipment); Trustee of Colby-Sawyer College; | | |
| Member of the Advisory Board of the Norris Cotton | Chairman, 1996–2009 | |
| Cancer Center and of the Advisory Board of the | | |
| Parthenon Group (strategy consulting). | Chief Executive Officer and President, 1996–2008 |
| | |
| | |
| Founder | |
| | John C. Bogle | |
| | Chairman and Chief Executive Officer, 1974–1996 |
1 Mr. McNabb is considered an “interested person,” as defined in the Investment Company Act of 1940, because he is an officer of the Vanguard funds.
2 December 2002 for Vanguard Equity Income Fund, the Vanguard Municipal Bond Funds, and the Vanguard State Tax-Exempt Funds.
|  |
| | P.O. Box 2600 |
| | Valley Forge, PA 19482-2600 |
| |
| |
| |
| Connect with Vanguard® > vanguard.com | |
| |
| |
| |
| Fund Information > 800-662-7447 | CFA® is a registered trademark owned by CFA Institute. |
| Direct Investor Account Services > 800-662-2739 | |
| Institutional Investor Services > 800-523-1036 | |
| Text Telephone for People | |
| Who Are Deaf or Hard of Hearing> 800-749-7273 | |
| |
| This material may be used in conjunction | |
| with the offering of shares of any Vanguard | |
| fund only if preceded or accompanied by | |
| the fund’s current prospectus. | |
| |
| All comparative mutual fund data are from Lipper, a | |
| Thomson Reuters Company, or Morningstar, Inc., unless | |
| otherwise noted. | |
| |
| You can obtain a free copy of Vanguard’s proxy voting | |
| guidelines by visiting vanguard.com/proxyreporting or by | |
| calling Vanguard at 800-662-2739. The guidelines are | |
| also available from the SEC’s website, sec.gov. In | |
| addition, you may obtain a free report on how your fund | |
| voted the proxies for securities it owned during the 12 | |
| months ended June 30. To get the report, visit either | |
| vanguard.com/proxyreporting or sec.gov. | |
| |
| You can review and copy information about your fund at | |
| the SEC’s Public Reference Room in Washington, D.C. To | |
| find out more about this public service, call the SEC at | |
| 202-551-8090. Information about your fund is also | |
| available on the SEC’s website, and you can receive | |
| copies of this information, for a fee, by sending a | |
| request in either of two ways: via email addressed to | |
| publicinfo@sec.gov or via regular mail addressed to the | |
| Public Reference Section, Securities and Exchange | |
| Commission, Washington, DC 20549-1520. | |
| |
| | © 2016 The Vanguard Group, Inc. |
| | All rights reserved. |
| | Vanguard Marketing Corporation, Distributor. |
| |
| | Q1680 012016 |
Item 2: Code of Ethics. The Registrant has adopted a code of ethics that applies to the Registrant’s principal executive officer, principal financial officer, principal accounting officer or controller or persons performing similar functions. The Code of Ethics was amended during the reporting period covered by this report to make certain technical, non-material changes.
Item 3: Audit Committee Financial Expert. The following members of the Audit Committee have been determined by the Registrant’s Board of Trustees to be Audit Committee Financial Experts serving on its Audit Committee, and to be independent: Rajiv L. Gupta, Amy Gutmann, JoAnn Heffernan Heisen, F. Joseph Loughrey, Mark Loughridge, Scott C. Malpass, and André F. Perold.
Item 4: Principal Accountant Fees and Services.
(a) Audit Fees.
Audit Fees of the Registrant
Fiscal Year Ended November 30, 2015: $34,000
Fiscal Year Ended November 30, 2014: $33,000
Aggregate Audit Fees of Registered Investment Companies in the Vanguard Group.
Fiscal Year Ended November 30, 2015: $7,000,200
Fiscal Year Ended November 30, 2014: $6,605,127
Includes fees billed in connection with audits of the Registrant, other registered investment companies in the Vanguard complex, The Vanguard Group, Inc. and Vanguard Marketing Corporation.
(b) Audit-Related Fees.
Fiscal Year Ended November 30, 2015: $2,899,096
Fiscal Year Ended November 30, 2014: $2,176,479
Includes fees billed in connection with assurance and related services provided to the Registrant, other registered investment companies in the Vanguard complex, The Vanguard Group, Inc., and Vanguard Marketing Corporation.
(c) Tax Fees.
Fiscal Year Ended November 30, 2015: $353,389
Fiscal Year Ended November 30, 2014: $316,869
Includes fees billed in connection with tax compliance, planning, and advice services provided to the Registrant, other registered investment companies in the Vanguard complex, The Vanguard Group, Inc., and Vanguard Marketing Corporation.
(d) All Other Fees.
Fiscal Year Ended November 30, 2015: $202,313 Fiscal Year Ended November 30, 2014: $198,163
Includes fees billed for services related to tax reported information provided to the Registrant, other registered investment companies in the Vanguard complex, The Vanguard Group, Inc., and Vanguard Marketing Corporation.
(e) (1) Pre-Approval Policies. The policy of the Registrant’s Audit Committee is to consider and, if appropriate, approve before the principal accountant is engaged for such services, all specific audit and non-audit services provided to: the Registrant, other registered investment companies in the Vanguard complex, The Vanguard Group, Inc., and entities controlled by The Vanguard Group, Inc. that provide ongoing services to the Registrant. In making a determination, the Audit Committee considers whether the services are consistent with maintaining the principal accountant’s independence.
In the event of a contingency situation in which the principal accountant is needed to provide services in between scheduled Audit Committee meetings, the Chairman of the Audit Committee would be called on to consider and, if appropriate, pre-approve audit or permitted non-audit services in an amount sufficient to complete services through the next Audit Committee meeting, and to determine if such services would be consistent with maintaining the accountant’s independence. At the next scheduled Audit Committee meeting, services and fees would be presented to the Audit Committee for formal consideration, and, if appropriate, approval by the entire Audit Committee. The Audit Committee would again consider whether such services and fees are consistent with maintaining the principal accountant’s independence.
The Registrant’s Audit Committee is informed at least annually of all audit and non-audit services provided by the principal accountant to the Vanguard complex, whether such services are provided to: the Registrant, other registered investment companies in the Vanguard complex, The Vanguard Group, Inc., or other entities controlled by The Vanguard Group, Inc. that provide ongoing services to the Registrant.
(2) No percentage of the principal accountant’s fees or services were approved pursuant to the waiver provision of paragraph (c)(7)(i)(C) of Rule 2-01 of Regulation S-X.
(f) For the most recent fiscal year, over 50% of the hours worked under the principal accountant’s engagement were not performed by persons other than full-time, permanent employees of the principal accountant.
(g) Aggregate Non-Audit Fees.
Fiscal Year Ended November 30, 2015: $555,702
Fiscal Year Ended November 30, 2014: $515,032
Includes fees billed for non-audit services provided to the Registrant, other registered investment companies in the Vanguard complex, The Vanguard Group, Inc., and Vanguard Marketing Corporation.
(h) For the most recent fiscal year, the Audit Committee has determined that the provision of all non-audit services was consistent with maintaining the principal accountant’s independence.
Item 5: Audit Committee of Listed Registrants.
Not Applicable.
Item 6: Investments.
Not Applicable.
Item 7: Disclosure of Proxy Voting Policies and Procedures for Closed-End Management
Investment Companies.
Not Applicable.
Item 8: Portfolio Managers of Closed-End Management Investment Companies.
Not Applicable.
Item 9: Purchase of Equity Securities by Closed-End Management Investment Company and
Affiliated Purchasers.
Not Applicable.
Item 10: Submission of Matters to a Vote of Security Holders.
Not Applicable.
Item 11: Controls and Procedures.
(a) Disclosure Controls and Procedures. The Principal Executive and Financial Officers concluded that the Registrant’s Disclosure Controls and Procedures are effective based on their evaluation of the Disclosure Controls and Procedures as of a date within 90 days of the filing date of this report.
(b) Internal Control Over Financial Reporting. There were no significant changes in Registrant’s Internal Control Over Financial Reporting or in other factors that could significantly affect this control subsequent to the date of the evaluation, including any corrective actions with regard to significant deficiencies and material weaknesses.
Item 12: Exhibits.
(a) Code of Ethics.
(b) Certifications.
Pursuant to the requirements of the Securities Exchange Act of 1934 and the Investment Company Act of 1940, the registrant has duly caused this report to be signed on its behalf by the undersigned, thereunto duly authorized.
| |
| | VANGUARD MASSACHUSETTS TAX-EXEMPT FUNDS |
| |
| |
| BY: | /s/ F. WILLIAM MCNABB III* |
| | F. WILLIAM MCNABB III |
| | CHIEF EXECUTIVE OFFICER |
| |
| Date: January 19, 2016 |
Pursuant to the requirements of the Securities Exchange Act of 1934 and the Investment Company Act of 1940, this report has been signed below by the following persons on behalf of the registrant and in the capacities and on the dates indicated.
| |
| | VANGUARD MASSACHUSETTS TAX-EXEMPT FUNDS |
| |
| BY: | /s/ F. WILLIAM MCNABB III* |
| | F. WILLIAM MCNABB III |
| | CHIEF EXECUTIVE OFFICER |
| Date: January 19, 2016 |
| VANGUARD MASSACHUSETTS TAX-EXEMPT FUNDS |
| |
BY: | /s/ THOMAS J. HIGGINS* |
| | THOMAS J. HIGGINS |
| | CHIEF FINANCIAL OFFICER |
Date: January 19, 2016 |
* By: /s/ Heidi Stam
Heidi Stam, pursuant to a Power of Attorney filed on April 22, 2014 see file Number 2-17620, Incorporated by Reference.