UNITED STATES
SECURITIES AND EXCHANGE COMMISSION
Washington, D.C. 20549
FORM N-CSR
CERTIFIED SHAREHOLDER REPORT
OF
REGISTERED MANAGEMENT INVESTMENT COMPANIES
| | |
| Investment Company Act file number: | 811-09005 | |
Name of Registrant: | Vanguard Massachusetts Tax-Exempt Funds |
Address of Registrant: | P.O. Box 2600 |
| | Valley Forge, PA 19482 |
Name and address of agent for service: | Anne E. Robinson, Esquire |
| | P.O. Box 876 |
| | Valley Forge, PA 19482 |
Registrant’s telephone number, including area code: (610) 669-1000 |
Date of fiscal year end: November 30 | |
Date of reporting period: December 1, 2015 – November 30, 2016 |
Item 1: Reports to Shareholders | |
Annual Report | November 30, 2016
Vanguard Massachusetts Tax-Exempt Fund
A new format, unwavering commitment
As you begin reading this report, you’ll notice that we’ve made some improvements to the opening sections—based on feedback from you, our clients.
Page 1 starts with a new ”Your Fund’s Performance at a Glance,” a concise, handy summary of how your fund performed during the period.
In the renamed ”Chairman’s Perspective,” Bill McNabb will focus on enduring principles and investment insights.
We’ve modified some tables, and eliminated some redundancy, but we haven’t removed any information.
At Vanguard, we’re always looking for better ways to communicate and to help you make sound investment decisions. Thank you for entrusting your assets to us.
| |
| Contents | |
| Your Fund’s Performance at a Glance. | 1 |
| Chairman’s Perspective. | 3 |
| Advisor’s Report. | 7 |
| Fund Profile. | 11 |
| Performance Summary. | 12 |
| Financial Statements. | 14 |
| About Your Fund’s Expenses. | 37 |
| Glossary. | 39 |
Please note: The opinions expressed in this report are just that—informed opinions. They should not be considered promises or advice.
Also, please keep in mind that the information and opinions cover the period through the date on the front of this report. Of course, the
risks of investing in your fund are spelled out in the prospectus.
See the Glossary for definitions of investment terms used in this report.
About the cover: No matter what language you speak, Vanguard has one consistent message and set of principles. Our primary
focus is on you, our clients. We conduct our business with integrity as a faithful steward of your assets. This message is shown
translated into seven languages, reflecting our expanding global presence.
Your Fund’s Performance at a Glance
• For the 12 months ended November 30, 2016, Vanguard Massachusetts Tax-Exempt
Fund returned –0.68%, slightly ahead of its benchmark index, which returned –0.82%.
The average return of its peer funds was –0.01%.
• The fund’s capital return of (–3.53%) was partially offset by its interest income (+2.85%).
• Bond markets fell late in the fiscal year. Longer-dated bonds saw the largest price
declines. Because the fund is overweight in this category of bonds, most of its prior
gains for the fiscal year were wiped out during this slump.
• For most of the fiscal year, municipal bonds enjoyed solid returns, thanks to strong
demand. Concerns about global growth helped boost returns.
| | | | | |
| Total Returns: Fiscal Year Ended November 30, 2016 | | | | |
| | | Taxable- | | | |
| | SEC | Equivalent | Income | Capital | Total |
| | Yield | Yield | Returns | Returns | Returns |
| Vanguard Massachusetts Tax-Exempt Fund | 2.31% | 4.30% | 2.85% | -3.53% | -0.68% |
| Bloomberg Barclays MA Municipal Bond Index | | | | | -0.82 |
| Massachusetts Municipal Debt Funds Average | | | | | -0.01 |
Massachusetts Municipal Debt Funds Average: Derived from data provided by Lipper, a Thomson Reuters Company.
The calculation of taxable-equivalent yield assumes a typical itemized tax return and is based on the maximum federal tax rate of 43.4% and
the maximum income tax rate for the state. Local taxes were not considered. Please see the prospectus for a detailed explanation of the
calculation.
| |
| Total Returns: Ten Years Ended November 30, 2016 | |
| | Average |
| | Annual Return |
| Massachusetts Tax-Exempt Fund | 3.82% |
| Bloomberg Barclays MA Municipal Bond Index | 4.08 |
| Massachusetts Municipal Debt Funds Average | 3.29 |
| Massachusetts Municipal Debt Funds Average: Derived from data provided by Lipper, a Thomson Reuters Company. | |
The figures shown represent past performance, which is not a guarantee of future results. (Current performance may be
lower or higher than the performance data cited. For performance data current to the most recent month-end, visit our
website at vanguard.com/performance.) Note, too, that both investment returns and principal value can fluctuate widely, so
an investor’s shares, when sold, could be worth more or less than their original cost.
1
| | |
| Expense Ratios | | |
| Your Fund Compared With Its Peer Group | | |
| | | Peer Group |
| | Fund | Average |
| Massachusetts Tax-Exempt Fund | 0.16% | 1.03% |
The fund expense ratio shown is from the prospectus dated March 29, 2016, and represents estimated costs for the current fiscal year. For
the fiscal year ended November 30, 2016, the fund’s expense ratio was 0.15%. The peer-group expense ratio is derived from data provided by
Lipper, a Thomson Reuters Company, and captures information through year-end 2015.
Peer group: Massachusetts Municipal Debt Funds.
2
Chairman’s Perspective

Bill McNabb
Chairman and Chief Executive Officer
Dear Shareholder,
If you’re like most investors, a big question on your mind is: What’s in store for the markets and the economy in 2017?
At Vanguard, we’re just as curious about the immediate future. But our curiosity is tempered by our belief that forecasts should give a range of possible outcomes, not pinpoint predictions. After all, there are bound to be occurrences the experts won’t see coming.
What really matters for investors
In 2016, we saw two cases in point: The United Kingdom’s June vote to exit the European Union and the November election of Donald Trump as U.S. president. Both unexpected outcomes triggered swift market reactions. But despite some short-term volatility, the markets’ 12-month performance as of November 30, 2016, proved to be less dramatic. U.S. stocks and bonds posted returns close to their long-term averages. International stocks and bonds also advanced, although returns for U.S. investors were reduced by the strength of the U.S. dollar.
The surprises of 2016 remind us to be skeptical of overly precise short-term predictions about 2017. At the cusp of a new year, market prognosticators forecast where the Standard & Poor’s 500 Index or the yield on the 10-year Treasury note will end up in 12 months. Such predictions can be attention-getting. They can also be dead wrong.
3
Investors are better off taking note of long-term trends that stand to influence our economies and markets. We’re watching these trends closely, and we discuss our latest assessment in our 2017 economic and market outlook, which you can read at vanguard.com/research.
Our global economic outlook: Expect stabilization, not stagnation
One phenomenon in particular that we’re watching is the low-growth, low-interest-rate environment that has marked the global economy since the 2008–09 financial crisis. We don’t think this economic backdrop is simply the result of cyclically weak demand or long-term stagnation. Instead, certain structural forces are contributing: Falling technology costs are restraining the amounts businesses are spending on capital investment, an aging population is weighing on growth in the developed world, and the free movement of capital and products across the globe has restrained prices and wages.
In the near term, these forces will continue to dampen growth, inflation, and interest rates. They also make it unlikely that further monetary stimulus from central banks will do much to spur growth.
I realize this all may sound gloomy, but that’s not how we see it. We expect global growth to stabilize at more modest levels, not stagnate. The world isn’t headed for Japanese-style deflation, in which a widespread sustained drop in prices puts economic activity into hibernation.
| | | |
| Market Barometer | | | |
| | Average Annual Total Returns |
| | Periods Ended November 30, 2016 |
| | One | Three | Five |
| | Year | Years | Years |
| Stocks | | | |
| Russell 1000 Index (Large-caps) | 8.01% | 8.88% | 14.45% |
| Russell 2000 Index (Small-caps) | 12.08 | 6.45 | 13.98 |
| Russell 3000 Index (Broad U.S. market) | 8.31 | 8.68 | 14.41 |
| FTSE All-World ex US Index (International) | 0.26 | -1.76 | 4.71 |
| |
| Bonds | | | |
| Bloomberg Barclays U.S. Aggregate Bond Index | | | |
| (Broad taxable market) | 2.17% | 2.79% | 2.43% |
| Bloomberg Barclays Municipal Bond Index | | | |
| (Broad tax-exempt market) | -0.22 | 3.64 | 3.43 |
| Citigroup Three-Month U.S. Treasury Bill Index | 0.25 | 0.08 | 0.07 |
| |
| CPI | | | |
| Consumer Price Index | 1.69% | 1.17% | 1.30% |
4
In fact, we believe that global growth could pick up modestly over time. Our expectation is based on a potential rebound in productivity as new digital technologies are used more effectively. We also anticipate a slight recovery in the labor force as the baby boom generation finishes its transition to retirement, nudging up demand for workers.
Put expansion in perspective
Looking to the United States, the world’s largest economy remains firmly on a long-term-growth path of about 2% per year. That’s lower than the historical average of 3.25% since 1950. We see such growth at this level as fundamentally sound, rather than abnormally low. Our evaluation takes into account lower U.S. population growth and the reality that the economic expansion from the 1980s until the financial crisis was fueled by debt, distorting the numbers.
Turning to prices, we think that core U.S. inflation should modestly exceed 2% in 2017. That, in turn, will support further interest rate hikes by the Federal Reserve, similar to the one at the end of 2016.
We expect the Fed to raise rates in 2017 before taking an extended pause, and we see the federal funds rate staying below 2% through at least 2018.
Prepare for muted returns
And what about prospects for the markets? Vanguard’s outlook for global stocks and bonds remains the most guarded in ten years, given fairly high stock valuations
| Expect more modest returns, rely on time-tested principles |
| |
| In Vanguard’s economic and market outlook for 2017, Global Chief Economist Joseph Davis |
| and his team offer a projection of more modest returns from the global stock and bond |
| markets. They caution that, over the next decade, returns for a balanced portfolio are likely |
| to be moderately below long-run historical averages. |
| |
| The team’s simulations indicate that for the decade ending in 2026, the average annualized |
| return of a 60% stock/40% bond portfolio is likely to be centered in the 3%–5% range after |
| inflation. That’s below the actual average after-inflation return of 6% for the same portfolio |
| for the nine decades since 1926. |
| |
| Ultimately, our global market outlook points toward a somewhat more challenging environment, |
| yet one in which, over time, investors with an appropriate level of discipline, diversification, and |
| patience are likely to be rewarded with reasonable inflation-adjusted returns. |
| |
| For more information about our expectations and the probability of various outcomes, see 2017 |
| Economic and Market Outlook: Stabilization, Not Stagnation, available at vanguard.com/research. |
IMPORTANT: The projections and other information generated by the Vanguard Capital Markets Model® (VCMM)
regarding the likelihood of various investment outcomes are hypothetical in nature, do not reflect actual investment
results, and are not guarantees of future results. Distribution of return outcomes from the VCMM are derived
from 10,000 simulations for each modeled asset class. Simulations as of September 30, 2016. Results from the
model may vary with each use and over time. For more information, see page 6.
5
and the low-interest-rate environment. We don’t expect global bond yields to increase materially from year-end 2016 levels.
Our outlook for global equities is annualized returns of 5%–8% over the next decade. This outlook isn’t bearish, but is actually fairly positive when you take into account the current low-rate environment. (See the box on page 5 for more.)
Focus on the four keys to investment success
Significant trends often happen gradually. Like shifting tides, they’re sometimes barely noticeable at first but ultimately can change the landscape entirely. Other times, apparent trends can end up receding before they have much of a long-term impact. Given the future’s inherent unpredictability, it’s not reasonable to expect a surefire block-buster revelation from any prognosticator or investment firm.
What to conclude, then? No matter what scenario plays out, we believe investors have the best chance for success if they stay focused on what they can control: their goals, asset allocation, and investment costs, along with the discipline to stick to a plan. As Tim Buckley, our chief investment officer, likes to say, this can be easy to say but harder to do, especially in times of uncertainty. Investors who can stay focused on those four keys will find themselves well-positioned to weather any market.
As always, thank you for investing with Vanguard.
Sincerely,

F. William McNabb III
Chairman and Chief Executive Officer
December 12, 2016
IMPORTANT: The projections and other information generated by the Vanguard Capital Markets Model regarding
the likelihood of various investment outcomes are hypothetical in nature, do not reflect actual investment results,
and are not guarantees of future results. VCMM results will vary with each use and over time.
The VCMM projections are based on a statistical analysis of historical data. Future returns may behave differently from the
historical patterns captured in the VCMM. More important, the VCMM may be underestimating extreme negative scenarios
unobserved in the historical period on which the model estimation is based.
The VCMM is a proprietary financial simulation tool developed and maintained by Vanguard’s Investment Strategy Group.
The model forecasts distributions of future returns for a wide array of broad asset classes. Those asset classes include U.S.
and international equity markets, several maturities of the U.S. Treasury and corporate fixed income markets, international
fixed income markets, U.S. money markets, commodities, and certain alternative investment strategies. The theoretical and
empirical foundation for the Vanguard Capital Markets Model is that the returns of various asset classes reflect the compensation
investors require for bearing different types of systematic risk (beta). At the core of the model are estimates of the dynamic
statistical relationship between risk factors and asset returns, obtained from statistical analysis based on available monthly
financial and economic data. Using a system of estimated equations, the model then applies a Monte Carlo simulation method
to project the estimated interrelationships among risk factors and asset classes as well as uncertainty and randomness over
time. The model generates a large set of simulated outcomes for each asset class over several time horizons. Forecasts are
obtained by computing measures of central tendency in these simulations. Results produced by the tool will vary with each
use and over time.
6
Advisor’s Report
For the 12 months ended November 30, 2016, Vanguard Massachusetts Tax-Exempt Fund returned –0.68%. The fund slightly surpassed its benchmark, the Bloomberg Barclays Massachusetts Municipal Bond Index, which returned –0.82%, but trailed its peer group, which had an average return of –0.01%.
The fund’s capital return was –3.53%, but its interest income return of 2.85% offset much of that negative result. With municipal bond prices falling toward the end of the period, the fund’s 30-day SEC yield climbed to 2.31% from 2.11% a year earlier (and from 1.60% six months earlier).
Please note: The fund is permitted to invest in bonds whose income is subject to the alternative minimum tax (AMT). However, as of the end of the period, it did not own any AMT bonds.
The investment environment
Overall municipal bond supply, which ran high at times, was matched for much of the fund’s fiscal year by solid demand from investors reaching for yield. That demand began to wane, however, and then dropped markedly after the U.S. presidential election as the markets began to anticipate faster growth and higher inflation. U.S. Treasury yields rose and prices fell, resulting in a
| | |
| Yields of Municipal Securities | | |
| (AAA-Rated General-Obligation Issues) | | |
| | November 30, | November 30, |
| Maturity | 2015 | 2016 |
| 2 years | 0.72% | 1.16% |
| 5 years | 1.26 | 1.85 |
| 10 years | 2.02 | 2.52 |
| 30 years | 2.96 | 3.26 |
| Source: Vanguard. | | |
7
negative price return which reduced total return to 1%. Municipal bonds as a whole saw even sharper movements and ended the period with a slightly negative return.
The Federal Reserve held to a slow and steady course toward normalizing monetary policy. In December 2015, for the first time in a decade, the Fed increased the target range for the federal funds rate, bumping it to 0.25%–0.50% from near zero. It cited considerable improvement in the labor market and its confidence that inflation would rise to its 2% objective. Market expectations for further hikes, however, were dampened in early 2016 by steep declines in commodity prices and weak economic growth, especially in China, and then in June by the uncertainty sparked by the United Kingdom’s vote to leave the European Union.
With a recovery in the financial markets by the end of the summer, however, and improving economic data, investors began anticipating another rate hike at the Fed’s December meeting. That anticipation was bolstered partly by third-quarter GDP. The U.S. economy posted weak results in the early part of your fund’s fiscal year, but showed a little more steam in the third quarter of 2016, growing 3.2%. Employment gains averaging around 180,000 per month in 2016 helped push the unemployment rate down to 4.6% in November while wages trended modestly higher. GDP growth, lower unemployment, and a rebound in commodity prices helped nudge inflation closer to the Fed’s 2% objective.
In Massachusetts, the unemployment rate declined from 4.9% to 3.3% over the period. The commonwealth’s economy has been growing faster than that of the United States as a whole, according to a gauge of current economic conditions published monthly by the Federal Reserve Bank of Philadelphia. The bank’s index for Massachusetts climbed more than 5% between November 2015 and October 2016, while at the national level the index rose less than 3%. (Each state’s index incorporates data on nonfarm payroll employment, the jobless rate, average hours worked in manufacturing, and inflation-adjusted wage and salary payments.) Given the prominence of the higher education, health care, financial services, and technology sectors in Massachusetts, the state appears poised for continued expansion.
Tax revenue for the state fiscal year ended June 30, 2016, fell short of projections. However, the budget stayed balanced, in part thanks to mid-fiscal-year expenditure cuts and the diversion of revenue previously earmarked for the “rainy day” fund. At the end of fiscal year 2016, the amount of the rainy day fund—$1.25 billion—was essentially unchanged from 12 months earlier.
A budget gap of $300 million for fiscal year 2017 was identified in October. Recurring expenditures, spending on MassHealth (the state Medicaid program), and lower-than-expected sales-tax revenues accounted for the shortfall.
8
Massachusetts’ credit ratings from Moody’s, Fitch, and Standard & Poor’s remained unchanged during the fiscal year: Aa1 with a stable outlook from Moody’s, AA+ with a stable outlook from Fitch, and AA+ with a negative outlook from S&P. S&P had changed its outlook from stable to negative in November 2015, citing the commonwealth’s “decline in financial reserves over the past several years despite a prolonged period of economic expansion and generally positive revenue trends.” The agency also noted that this adjusted outlook reflected its expectation that the state would see a further decline in reserves “from currently adequate levels” in fiscal year 2016.
Management of the fund
Our investment process at Vanguard relies on risk management as we strive to add value through a diversified mix of strategies that include duration, yield-curve positioning, credit-quality decisions, and security selection. Vanguard’s experienced team of credit analysts perform an objective, complete, and independent analysis of the overall creditworthiness of every issuer of bonds we own or consider owning.
The fund’s AA-rated bonds and its bonds with maturities of 5–10 years helped its performance compared to its benchmark index. Its longer-dated A-rated bonds, however, hindered its relative performance.
Overall favorable security selection boosted the fund’s relative results. Our general obligation holdings, which held up better than their benchmark counterparts, offset weaker results among university revenue issues.
A look ahead
After the close of the period, the Fed raised the short-term rate by 25 basis points and hinted there may be three additional hikes in 2017. This aligns with our expectations that it will gradually raise rates in 2017, but leave the rate below 2% through at least 2018. The pace of future rate hikes is likely to depend on future economic growth. Although U.S. growth and inflation may modestly exceed expectations for the first time in five years, we expect economic growth to be modest and inflation to be tame, especially compared with prior periods of economic recovery.
The dollar will likely remain strong as long as central banks such as the Bank of Japan and the European Central Bank continue to maintain the accommodative monetary stances that have produced negative interest rates in those regions. In the United States, we continue to believe that the Fed is likely to continue its dovish tightening over the next several years.
9
Of course, market conditions could change, especially given the results of the U.S. presidential election and the possibility that job growth and inflation could exceed expectations. But we are confident that our team of experienced managers, analysts, and traders can handle whatever the market brings and find opportunities that will produce competitive returns.
Christopher W. Alwine, CFA, Principal,
Head of Municipal Group
Marlin G. Brown, Portfolio Manager
Vanguard Fixed Income Group
December 16, 2016
Massachusetts Tax-Exempt Fund
Fund Profile
As of November 30, 2016
| | | |
| Financial Attributes | | |
| |
| |
| | | Bloomberg | |
| | | Barclays | Bloomberg |
| | | MA | Barclays |
| | | Municipal | Municipal |
| | Fund | Bond Index | Bond Index |
| |
| Number of | | | |
| Bonds | 374 | 1,820 | 50,263 |
| |
| Yield to Maturity | | | |
| (before | | | |
| expenses) | 2.8% | 2.7% | 2.8% |
| |
| Average Coupon | 4.7% | 4.8% | 4.8% |
| |
| Average Duration | 7.1 years | 7.1 years | 6.6 years |
| |
| Average Stated | | | |
| Maturity | 16.3 years | 12.9 years | 12.8 years |
| |
| Ticker Symbol | VMATX | — | — |
| |
| Expense Ratio1 | 0.16% | — | — |
| |
| 30-Day SEC | | | |
| Yield | 2.31% | — | — |
| Short-Term | | | |
| Reserves | 3.6% | — | — |
| | |
| Volatility Measures | | |
| | Bloomberg | Bloomberg |
| | Barclays MA | Barclays |
| | Municipal | Municipal |
| | Bond Index | Bond Index |
| R-Squared | 0.99 | 0.99 |
| Beta | 1.12 | 1.18 |
| These measures show the degree and timing of the fund’s |
| fluctuations compared with the indexes over 36 months. |
| |
| Distribution by Stated Maturity | |
| (% of portfolio) | |
| Under 1 Year | 5.3% |
| 1 - 3 Years | 3.7 |
| 3 - 5 Years | 3.4 |
| 5 - 10 Years | 10.7 |
| 10 - 20 Years | 41.7 |
| 20 - 30 Years | 32.9 |
| Over 30 Years | 2.3 |
| |
| Distribution by Credit Quality (% of portfolio) |
| |
| AAA | 13.8% |
| AA | 62.5 |
| A | 14.1 |
| BBB | 9.3 |
| Not Rated | 0.3 |
| |
| Credit-quality ratings are obtained from Moody's and S&P, and the |
| higher rating for each issue is shown. "Not Rated" is used to |
| classify securities for which a rating is not available. Not rated |
| securities include a fund's investment in Vanguard Market Liquidity |
| Fund or Vanguard Municipal Cash Management Fund, each of |
| which invests in high-quality money market instruments and may |
| serve as a cash management vehicle for the Vanguard funds, |
| trusts, and accounts. For more information about these ratings, see |
| the Glossary entry for Credit Quality. | |
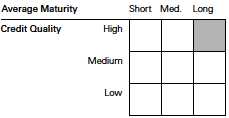
Investment Focus
1 The expense ratio shown is from the prospectus dated March 29, 2016, and represents estimated costs for the current fiscal year. For the
fiscal year ended November 30, 2016, the expense ratio was 0.15%.
11
Massachusetts Tax-Exempt Fund
Performance Summary
All of the returns in this report represent past performance, which is not a guarantee of future
results that may be achieved by the fund. (Current performance may be lower or higher than
the performance data cited. For performance data current to the most recent month-end, visit
our website at vanguard.com/performance.) Note, too, that both investment returns and principal
value can fluctuate widely, so an investor’s shares, when sold, could be worth more or less than
their original cost. The returns shown do not reflect taxes that a shareholder would pay on fund
distributions or on the sale of fund shares.
Cumulative Performance: November 30, 2006, Through November 30, 2016
Initial Investment of $10,000

| | | | |
| | Average Annual Total Returns | |
| | Periods Ended November 30, 2016 | |
| |
| | | | | Final Value |
| | One | Five | Ten | of a $10,000 |
| | Year | Years | Years | Investment |
| |
| Massachusetts Tax-Exempt Fund | -0.68% | 3.46% | 3.82% | $14,551 |
| Bloomberg Barclays MA Municipal | | | | |
| • • • • • • • • | | | | |
| Bond Index | -0.82 | 3.10 | 4.08 | 14,921 |
| |
| – – – – Massachusetts Municipal Debt Funds | | | | |
| Average | -0.01 | 3.14 | 3.29 | 13,821 |
| Bloomberg Barclays Municipal Bond | | | | |
| Index | -0.22 | 3.43 | 4.09 | 14,929 |
| Massachusetts Municipal Debt Funds Average: Derived from data provided by Lipper, a Thomson Reuters Company. | |
See Financial Highlights for dividend and capital gains information.
12
Massachusetts Tax-Exempt Fund
| | | | |
| Fiscal-Year Total Returns (%): November 30, 2006, Through November 30, 2016 | |
| | | | | Bloomberg |
| | | | | Barclays MA |
| | | | | Municipal |
| | | | | Bond Index |
| Fiscal Year | Income Returns | Capital Returns | Total Returns | Total Returns |
| 2007 | 4.18% | -2.03% | 2.15% | 3.27% |
| 2008 | 4.00 | -6.72 | -2.72 | -1.30 |
| 2009 | 4.42 | 7.94 | 12.36 | 13.60 |
| 2010 | 3.80 | -0.39 | 3.41 | 3.96 |
| 2011 | 3.76 | 2.56 | 6.32 | 6.41 |
| 2012 | 3.49 | 6.92 | 10.41 | 9.57 |
| 2013 | 3.02 | -7.73 | -4.71 | -3.52 |
| 2014 | 3.48 | 5.84 | 9.32 | 7.72 |
| 2015 | 3.15 | 0.62 | 3.77 | 3.14 |
| 2016 | 2.85 | -3.53 | -0.68 | -0.82 |
Average Annual Total Returns: Periods Ended September 30, 2016
This table presents returns through the latest calendar quarter—rather than through the end of the fiscal period.
Securities and Exchange Commission rules require that we provide this information.
| | | | | | |
| | | | | Ten Years |
| | Inception Date | One Year | Five Years | Income | Capital | Total |
| Massachusetts | | | | | | |
| Tax-Exempt Fund | 12/9/1998 | 6.19% | 4.65% | 3.66% | 0.93% | 4.59% |
13
Massachusetts Tax-Exempt Fund
Financial Statements
Statement of Net Assets
As of November 30, 2016
The fund reports a complete list of its holdings in regulatory filings four times in each fiscal year, at
the quarter-ends. For the second and fourth fiscal quarters, the lists appear in the fund’s semiannual
and annual reports to shareholders. For the first and third fiscal quarters, the fund files the lists with
the Securities and Exchange Commission on Form N-Q. Shareholders can look up the fund’s Forms
N-Q on the SEC’s website at sec.gov. Forms N-Q may also be reviewed and copied at the SEC’s
Public Reference Room (see the back cover of this report for further information).
| | | | |
| | | | Face | Market |
| | | Maturity | Amount | Value• |
| | Coupon | Date | ($000) | ($000) |
| Tax-Exempt Municipal Bonds (98.9%) | | | | |
| Massachusetts (98.5%) | | | | |
| Boston MA GO | 5.000% | 2/1/24 | 2,345 | 2,676 |
| Boston MA GO | 5.000% | 3/1/24 | 3,000 | 3,486 |
| Boston MA GO | 5.000% | 4/1/28 | 1,940 | 2,277 |
| Boston MA Housing Authority Revenue | 5.000% | 4/1/23 (4) | 2,000 | 2,091 |
| Boston MA Housing Authority Revenue | 5.000% | 4/1/25 (4) | 5,440 | 5,684 |
| 1 Boston MA Water & Sewer Commission Revenue | 5.000% | 5/1/19 (Prere.) | 3,725 | 4,043 |
| Boston MA Water & Sewer Commission Revenue | 5.000% | 11/1/19 (Prere.) | 1,000 | 1,100 |
| Boston MA Water & Sewer Commission Revenue | 5.000% | 11/1/20 | 1,550 | 1,741 |
| Boston MA Water & Sewer Commission Revenue | 5.000% | 11/1/30 | 750 | 846 |
| Braintree MA GO | 5.000% | 5/15/26 | 2,300 | 2,749 |
| Cambridge MA GO | 5.000% | 1/1/23 | 850 | 971 |
| Cambridge MA GO | 4.000% | 1/1/26 | 1,600 | 1,773 |
| Cambridge MA GO | 4.000% | 1/1/27 | 1,000 | 1,099 |
| Essex MA North Shore Agricultural & Technical | | | | |
| School District GO | 4.000% | 6/1/39 | 2,810 | 2,824 |
| Holyoke MA GO | 5.000% | 9/1/30 | 1,690 | 1,885 |
| Massachusetts Bay Transportation Authority | | | | |
| Assessment Revenue | 5.250% | 7/1/31 | 2,285 | 2,803 |
| Massachusetts Bay Transportation Authority | | | | |
| Assessment Revenue | 5.000% | 7/1/41 | 7,430 | 8,258 |
| Massachusetts Bay Transportation Authority | | | | |
| Revenue VRDO | 0.590% | 12/7/16 | 3,195 | 3,195 |
| Massachusetts Bay Transportation Authority | | | | |
| Sales Tax Revenue | 0.000% | 7/1/17 (Prere.) | 1,020 | 575 |
| Massachusetts Bay Transportation Authority | | | | |
| Sales Tax Revenue | 5.500% | 7/1/17 (ETM) | 75 | 77 |
| Massachusetts Bay Transportation Authority | | | | |
| Sales Tax Revenue | 5.250% | 7/1/22 | 3,500 | 4,073 |
| Massachusetts Bay Transportation Authority | | | | |
| Sales Tax Revenue | 5.500% | 7/1/22 | 5,285 | 6,220 |
| Massachusetts Bay Transportation Authority | | | | |
| Sales Tax Revenue | 5.000% | 7/1/23 | 4,000 | 4,655 |
| Massachusetts Bay Transportation Authority | | | | |
| Sales Tax Revenue | 5.250% | 7/1/23 | 2,825 | 3,333 |
| Massachusetts Bay Transportation Authority | | | | |
| Sales Tax Revenue | 5.500% | 7/1/26 (14) | 2,000 | 2,464 |
14
| | | | |
| Massachusetts Tax-Exempt Fund | | | | |
| |
| |
| |
| | | | Face | Market |
| | | Maturity | Amount | Value• |
| | Coupon | Date | ($000) | ($000) |
| Massachusetts Bay Transportation Authority | | | | |
| Sales Tax Revenue | 5.000% | 7/1/27 | 5,950 | 7,109 |
| Massachusetts Bay Transportation Authority | | | | |
| Sales Tax Revenue | 4.000% | 7/1/32 | 2,870 | 2,965 |
| Massachusetts Bay Transportation Authority | | | | |
| Sales Tax Revenue | 5.250% | 7/1/32 | 2,900 | 3,549 |
| Massachusetts Bay Transportation Authority | | | | |
| Sales Tax Revenue | 5.250% | 7/1/33 | 2,000 | 2,452 |
| Massachusetts Bay Transportation Authority | | | | |
| Sales Tax Revenue | 5.250% | 7/1/33 | 10,000 | 12,259 |
| Massachusetts Bay Transportation Authority | | | | |
| Sales Tax Revenue | 4.000% | 7/1/35 | 1,980 | 2,022 |
| Massachusetts Bay Transportation Authority | | | | |
| Sales Tax Revenue | 4.000% | 7/1/35 | 3,000 | 3,063 |
| Massachusetts Bay Transportation Authority | | | | |
| Sales Tax Revenue | 5.000% | 7/1/35 | 2,145 | 2,342 |
| 2 Massachusetts Bay Transportation Authority | | | | |
| Sales Tax Revenue TOB VRDO | 0.650% | 12/7/16 | 2,881 | 2,880 |
| Massachusetts Clean Energy Cooperative Corp. | | | | |
| Revenue (Municipal Lighting Plant) | 5.000% | 7/1/26 | 2,875 | 3,276 |
| Massachusetts Clean Energy Cooperative Corp. | | | | |
| Revenue (Municipal Lighting Plant) | 5.000% | 7/1/29 | 2,000 | 2,247 |
| Massachusetts Clean Energy Cooperative Corp. | | | | |
| Revenue (Municipal Lighting Plant) | 5.000% | 7/1/32 | 2,500 | 2,770 |
| Massachusetts Clean Water Trust Revenue | 5.000% | 2/1/28 | 3,000 | 3,482 |
| Massachusetts Clean Water Trust Revenue | 5.000% | 2/1/29 | 405 | 480 |
| Massachusetts Clean Water Trust Revenue | 5.000% | 2/1/30 | 405 | 476 |
| Massachusetts Clean Water Trust Revenue | 5.000% | 2/1/35 | 3,000 | 3,391 |
| Massachusetts Clean Water Trust Revenue | 5.000% | 2/1/45 | 2,085 | 2,331 |
| Massachusetts College Building Authority | | | | |
| Revenue | 0.000% | 5/1/17 (10) | 3,340 | 3,324 |
| Massachusetts College Building Authority | | | | |
| Revenue | 5.000% | 5/1/25 | 1,100 | 1,253 |
| Massachusetts College Building Authority | | | | |
| Revenue | 5.000% | 5/1/26 | 1,430 | 1,627 |
| Massachusetts College Building Authority | | | | |
| Revenue | 5.000% | 5/1/27 | 1,200 | 1,366 |
| Massachusetts College Building Authority | | | | |
| Revenue | 4.000% | 5/1/29 | 2,015 | 2,139 |
| Massachusetts College Building Authority | | | | |
| Revenue | 5.000% | 5/1/29 | 1,500 | 1,650 |
| Massachusetts College Building Authority | | | | |
| Revenue | 5.000% | 5/1/30 | 1,075 | 1,201 |
| Massachusetts College Building Authority | | | | |
| Revenue | 5.000% | 5/1/30 | 1,610 | 1,769 |
| Massachusetts College Building Authority | | | | |
| Revenue | 5.000% | 5/1/31 | 2,000 | 2,253 |
| Massachusetts College Building Authority | | | | |
| Revenue | 5.000% | 5/1/36 | 4,000 | 4,414 |
| Massachusetts College Building Authority | | | | |
| Revenue | 5.000% | 5/1/39 | 3,000 | 3,312 |
| Massachusetts College Building Authority | | | | |
| Revenue | 5.000% | 5/1/41 | 5,000 | 5,494 |
| Massachusetts College Building Authority | | | | |
| Revenue | 5.000% | 5/1/43 | 3,285 | 3,606 |
15
| | | | |
| Massachusetts Tax-Exempt Fund | | | | |
| |
| |
| |
| | | | Face | Market |
| | | Maturity | Amount | Value• |
| | Coupon | Date | ($000) | ($000) |
| Massachusetts Department of Transportation | | | | |
| Metropolitan Highway System Revenue | 5.000% | 1/1/20 | 3,500 | 3,831 |
| Massachusetts Department of Transportation | | | | |
| Metropolitan Highway System Revenue | 5.000% | 1/1/23 | 3,000 | 3,294 |
| Massachusetts Department of Transportation | | | | |
| Metropolitan Highway System Revenue | 5.000% | 1/1/32 | 5,620 | 6,094 |
| Massachusetts Department of Transportation | | | | |
| Metropolitan Highway System Revenue | 5.000% | 1/1/35 | 2,350 | 2,558 |
| Massachusetts Department of Transportation | | | | |
| Metropolitan Highway System Revenue | 5.000% | 1/1/37 | 3,000 | 3,229 |
| Massachusetts Development Finance Agency | | | | |
| Higher Education Revenue (Emerson College) | 5.000% | 1/1/17 (Prere.) | 1,985 | 1,992 |
| Massachusetts Development Finance Agency | | | | |
| Higher Education Revenue (Emerson College) | 5.000% | 1/1/17 (Prere.) | 2,000 | 2,007 |
| Massachusetts Development Finance Agency | | | | |
| Hospital Revenue (Cape Cod Healthcare | | | | |
| Obligated Group) | 5.250% | 11/15/36 | 5,130 | 5,657 |
| Massachusetts Development Finance Agency | | | | |
| Revenue (Baystate Medical Obligated Group) | 5.000% | 7/1/34 | 1,500 | 1,637 |
| Massachusetts Development Finance Agency | | | | |
| Revenue (Bentley University) | 5.000% | 7/1/40 | 3,000 | 3,279 |
| Massachusetts Development Finance Agency | | | | |
| Revenue (Berklee College of Music) | 5.000% | 10/1/31 | 1,685 | 1,892 |
| Massachusetts Development Finance Agency | | | | |
| Revenue (Berklee College of Music) | 5.250% | 10/1/41 | 3,300 | 3,687 |
| Massachusetts Development Finance Agency | | | | |
| Revenue (Berklee College of Music) | 5.000% | 10/1/46 | 1,500 | 1,635 |
| Massachusetts Development Finance Agency | | | | |
| Revenue (Berkshire Health System) | 5.000% | 10/1/22 | 2,000 | 2,227 |
| Massachusetts Development Finance Agency | | | | |
| Revenue (Berkshire Health System) | 5.000% | 10/1/28 | 1,250 | 1,353 |
| Massachusetts Development Finance Agency | | | | |
| Revenue (Berkshire Health System) | 5.000% | 10/1/29 | 1,500 | 1,617 |
| Massachusetts Development Finance Agency | | | | |
| Revenue (Berkshire Health System) | 5.000% | 10/1/30 | 1,430 | 1,535 |
| Massachusetts Development Finance Agency | | | | |
| Revenue (Berkshire Health System) | 5.000% | 10/1/31 | 1,250 | 1,339 |
| Massachusetts Development Finance Agency | | | | |
| Revenue (Boston College) | 5.000% | 7/1/19 | 500 | 544 |
| Massachusetts Development Finance Agency | | | | |
| Revenue (Boston College) | 5.000% | 7/1/40 | 2,000 | 2,175 |
| Massachusetts Development Finance Agency | | | | |
| Revenue (Boston Medical Center) | 5.000% | 7/1/22 (Prere.) | 470 | 543 |
| Massachusetts Development Finance Agency | | | | |
| Revenue (Boston Medical Center) | 5.000% | 7/1/22 (Prere.) | 2,995 | 3,459 |
| Massachusetts Development Finance Agency | | | | |
| Revenue (Boston Medical Center) | 5.000% | 7/1/29 | 2,535 | 2,723 |
| Massachusetts Development Finance Agency | | | | |
| Revenue (Boston Medical Center) | 5.000% | 7/1/29 | 3,100 | 3,367 |
| Massachusetts Development Finance Agency | | | | |
| Revenue (Boston Medical Center) | 5.000% | 7/1/30 | 2,450 | 2,633 |
| Massachusetts Development Finance Agency | | | | |
| Revenue (Boston Medical Center) | 5.000% | 7/1/31 | 4,245 | 4,545 |
| Massachusetts Development Finance Agency | | | | |
| Revenue (Boston Medical Center) | 5.000% | 7/1/34 | 1,510 | 1,592 |
16
| | | | |
| Massachusetts Tax-Exempt Fund | | | | |
| |
| |
| |
| | | | Face | Market |
| | | Maturity | Amount | Value• |
| | Coupon | Date | ($000) | ($000) |
| Massachusetts Development Finance Agency | | | | |
| Revenue (Boston Medical Center) | 5.000% | 7/1/37 | 1,000 | 1,047 |
| Massachusetts Development Finance Agency | | | | |
| Revenue (Boston Medical Center) | 5.000% | 7/1/44 | 12,000 | 12,492 |
| Massachusetts Development Finance Agency | | | | |
| Revenue (Boston University) | 6.000% | 5/15/29 (2) | 1,400 | 1,670 |
| Massachusetts Development Finance Agency | | | | |
| Revenue (Boston University) | 5.375% | 5/15/39 | 1,575 | 1,856 |
| Massachusetts Development Finance Agency | | | | |
| Revenue (Boston University) | 5.000% | 7/1/42 | 10,000 | 10,200 |
| Massachusetts Development Finance Agency | | | | |
| Revenue (Boston University) | 4.000% | 10/1/46 | 3,000 | 2,854 |
| Massachusetts Development Finance Agency | | | | |
| Revenue (Boston University) | 5.000% | 10/1/46 | 3,000 | 3,265 |
| Massachusetts Development Finance Agency | | | | |
| Revenue (Boston University) | 5.000% | 10/1/48 | 5,000 | 5,469 |
| Massachusetts Development Finance Agency | | | | |
| Revenue (Boston University) | 6.000% | 5/15/59 (10) | 5,575 | 6,802 |
| Massachusetts Development Finance Agency | | | | |
| Revenue (Broad Institute Inc.) | 5.250% | 4/1/37 | 4,000 | 4,435 |
| Massachusetts Development Finance Agency | | | | |
| Revenue (CareGroup Inc.) | 5.000% | 7/1/28 | 3,000 | 3,444 |
| Massachusetts Development Finance Agency | | | | |
| Revenue (CareGroup Inc.) | 5.000% | 7/1/32 | 1,000 | 1,110 |
| Massachusetts Development Finance Agency | | | | |
| Revenue (CareGroup Inc.) | 5.000% | 7/1/33 | 1,000 | 1,106 |
| Massachusetts Development Finance Agency | | | | |
| Revenue (CareGroup Inc.) | 5.000% | 7/1/37 | 1,000 | 1,098 |
| Massachusetts Development Finance Agency | | | | |
| Revenue (CareGroup Inc.) | 5.000% | 7/1/38 | 1,000 | 1,097 |
| Massachusetts Development Finance Agency | | | | |
| Revenue (Carleton-Willard Village) | 5.250% | 12/1/25 | 600 | 645 |
| Massachusetts Development Finance Agency | | | | |
| Revenue (Carleton-Willard Village) | 5.625% | 12/1/30 | 550 | 595 |
| Massachusetts Development Finance Agency | | | | |
| Revenue (Children’s Hospital) | 5.000% | 10/1/34 | 2,440 | 2,751 |
| Massachusetts Development Finance Agency | | | | |
| Revenue (Children’s Hospital) | 5.000% | 10/1/46 | 4,000 | 4,460 |
| Massachusetts Development Finance Agency | | | | |
| Revenue (Commonwealth Contract Assistance) | 5.000% | 5/1/35 | 5,210 | 5,784 |
| Massachusetts Development Finance Agency | | | | |
| Revenue (Commonwealth Contract Assistance) | 5.500% | 2/1/40 | 2,160 | 2,371 |
| Massachusetts Development Finance Agency | | | | |
| Revenue (Dana-Farber Cancer Institute) | 5.000% | 12/1/30 | 2,115 | 2,373 |
| Massachusetts Development Finance Agency | | | | |
| Revenue (Dana-Farber Cancer Institute) | 5.000% | 12/1/41 | 11,105 | 12,070 |
| Massachusetts Development Finance Agency | | | | |
| Revenue (Dana-Farber Cancer Institute) | 5.000% | 12/1/46 | 4,000 | 4,317 |
| Massachusetts Development Finance Agency | | | | |
| Revenue (Deerfield Academy) | 5.000% | 10/1/40 | 4,665 | 5,146 |
| Massachusetts Development Finance Agency | | | | |
| Revenue (Draper Laboratory) | 5.750% | 9/1/18 (Prere.) | 5,000 | 5,388 |
| Massachusetts Development Finance Agency | | | | |
| Revenue (Emerson College) | 5.000% | 1/1/28 | 1,825 | 1,963 |
17
| | | | |
| Massachusetts Tax-Exempt Fund | | | | |
| |
| |
| |
| | | | Face | Market |
| | | Maturity | Amount | Value• |
| | Coupon | Date | ($000) | ($000) |
| Massachusetts Development Finance Agency | | | | |
| Revenue (Emerson College) | 5.000% | 1/1/35 | 3,000 | 3,099 |
| Massachusetts Development Finance Agency | | | | |
| Revenue (Emerson College) | 5.000% | 1/1/40 | 6,000 | 6,250 |
| Massachusetts Development Finance Agency | | | | |
| Revenue (Emerson College) | 5.000% | 1/1/41 | 2,960 | 3,029 |
| 3 Massachusetts Development Finance Agency | | | | |
| Revenue (Emerson College) | 5.250% | 1/1/42 | 1,700 | 1,790 |
| 3 Massachusetts Development Finance Agency | | | | |
| Revenue (Emerson College) | 5.000% | 1/1/47 | 4,330 | 4,430 |
| Massachusetts Development Finance Agency | | | | |
| Revenue (Emmanuel College) | 5.000% | 10/1/43 | 4,000 | 4,100 |
| Massachusetts Development Finance Agency | | | | |
| Revenue (Harvard University) | 5.000% | 10/15/20 (Prere.) | 9,790 | 11,017 |
| Massachusetts Development Finance Agency | | | | |
| Revenue (Harvard University) | 5.000% | 10/15/20 (Prere.) | 740 | 833 |
| Massachusetts Development Finance Agency | | | | |
| Revenue (Harvard University) | 5.000% | 10/15/20 (Prere.) | 260 | 293 |
| Massachusetts Development Finance Agency | | | | |
| Revenue (Harvard University) | 5.250% | 2/1/21 (Prere.) | 11,000 | 12,466 |
| Massachusetts Development Finance Agency | | | | |
| Revenue (Harvard University) | 5.000% | 7/15/33 | 5,340 | 6,227 |
| Massachusetts Development Finance Agency | | | | |
| Revenue (Harvard University) | 4.000% | 7/15/36 | 3,500 | 3,610 |
| Massachusetts Development Finance Agency | | | | |
| Revenue (Harvard University) | 5.000% | 7/15/36 | 2,000 | 2,449 |
| Massachusetts Development Finance Agency | | | | |
| Revenue (Harvard University) | 5.000% | 7/15/40 | 21,000 | 25,841 |
| Massachusetts Development Finance Agency | | | | |
| Revenue (Lahey Clinic Obligated Group) | 5.000% | 8/15/28 | 750 | 820 |
| Massachusetts Development Finance Agency | | | | |
| Revenue (Lahey Clinic Obligated Group) | 5.000% | 8/15/40 | 1,750 | 1,906 |
| Massachusetts Development Finance Agency | | | | |
| Revenue (Lahey Clinic Obligated Group) | 5.000% | 8/15/45 | 11,515 | 12,424 |
| Massachusetts Development Finance Agency | | | | |
| Revenue (Loomis Obligated Group) | 6.000% | 1/1/33 | 4,000 | 4,327 |
| Massachusetts Development Finance Agency | | | | |
| Revenue (Lowell General Hospital) | 5.000% | 7/1/37 | 4,800 | 5,024 |
| Massachusetts Development Finance Agency | | | | |
| Revenue (Lowell General Hospital) | 5.000% | 7/1/44 | 4,650 | 4,840 |
| Massachusetts Development Finance Agency | | | | |
| Revenue (Massachusetts College of Pharmacy | | | | |
| & Allied Health Sciences) | 5.000% | 7/1/19 | 175 | 190 |
| Massachusetts Development Finance Agency | | | | |
| Revenue (Massachusetts College of Pharmacy | | | | |
| & Allied Health Sciences) | 5.000% | 7/1/21 | 300 | 338 |
| Massachusetts Development Finance Agency | | | | |
| Revenue (Massachusetts College of Pharmacy | | | | |
| & Allied Health Sciences) | 5.000% | 7/1/23 | 250 | 288 |
| Massachusetts Development Finance Agency | | | | |
| Revenue (Massachusetts College of Pharmacy | | | | |
| & Allied Health Sciences) | 5.000% | 7/1/26 | 1,380 | 1,548 |
| Massachusetts Development Finance Agency | | | | |
| Revenue (MCPHS University) | 5.000% | 7/1/31 | 400 | 446 |
18
| | | | |
| Massachusetts Tax-Exempt Fund | | | | |
| |
| |
| |
| | | | Face | Market |
| | | Maturity | Amount | Value• |
| | Coupon | Date | ($000) | ($000) |
| Massachusetts Development Finance Agency | | | | |
| Revenue (MCPHS University) | 5.000% | 7/1/32 | 300 | 333 |
| Massachusetts Development Finance Agency | | | | |
| Revenue (MCPHS University) | 5.000% | 7/1/37 | 450 | 493 |
| Massachusetts Development Finance Agency | | | | |
| Revenue (Merrimack College) | 5.000% | 7/1/32 | 2,000 | 2,081 |
| Massachusetts Development Finance Agency | | | | |
| Revenue (Merrimack College) | 5.250% | 7/1/42 | 1,470 | 1,533 |
| Massachusetts Development Finance Agency | | | | |
| Revenue (Merrimack College) | 5.125% | 7/1/44 | 1,500 | 1,580 |
| Massachusetts Development Finance Agency | | | | |
| Revenue (Milford Regional Medical Center) | 5.625% | 7/15/36 | 1,000 | 1,093 |
| Massachusetts Development Finance Agency | | | | |
| Revenue (Milford Regional Medical Center) | 5.750% | 7/15/43 | 5,755 | 6,273 |
| Massachusetts Development Finance Agency | | | | |
| Revenue (Mount Holyoke College) | 5.000% | 7/1/36 | 1,500 | 1,573 |
| Massachusetts Development Finance Agency | | | | |
| Revenue (Northeastern University) | 5.000% | 10/1/29 | 3,250 | 3,619 |
| Massachusetts Development Finance Agency | | | | |
| Revenue (Northeastern University) | 5.000% | 10/1/30 | 1,750 | 1,948 |
| Massachusetts Development Finance Agency | | | | |
| Revenue (Northeastern University) | 5.000% | 3/1/32 | 950 | 1,041 |
| Massachusetts Development Finance Agency | | | | |
| Revenue (Northeastern University) | 5.000% | 3/1/39 | 3,500 | 3,785 |
| Massachusetts Development Finance Agency | | | | |
| Revenue (Olin College) | 5.000% | 11/1/38 | 6,000 | 6,615 |
| Massachusetts Development Finance Agency | | | | |
| Revenue (Partners Healthcare) | 5.000% | 7/1/28 | 2,000 | 2,248 |
| Massachusetts Development Finance Agency | | | | |
| Revenue (Partners Healthcare) | 5.000% | 7/1/29 | 6,000 | 6,942 |
| Massachusetts Development Finance Agency | | | | |
| Revenue (Partners Healthcare) | 5.000% | 7/1/30 | 1,500 | 1,664 |
| Massachusetts Development Finance Agency | | | | |
| Revenue (Partners Healthcare) | 5.000% | 7/1/31 | 5,705 | 6,338 |
| Massachusetts Development Finance Agency | | | | |
| Revenue (Partners Healthcare) | 4.000% | 7/1/32 | 8,000 | 8,198 |
| Massachusetts Development Finance Agency | | | | |
| Revenue (Partners Healthcare) | 5.000% | 7/1/36 | 4,000 | 4,420 |
| Massachusetts Development Finance Agency | | | | |
| Revenue (Partners Healthcare) | 5.000% | 7/1/40 | 3,000 | 3,294 |
| Massachusetts Development Finance Agency | | | | |
| Revenue (Partners Healthcare) | 5.375% | 7/1/41 | 4,000 | 4,386 |
| Massachusetts Development Finance Agency | | | | |
| Revenue (Partners Healthcare) | 5.000% | 7/1/45 | 3,775 | 4,130 |
| Massachusetts Development Finance Agency | | | | |
| Revenue (Phillips Academy) | 5.000% | 9/1/38 | 1,545 | 1,740 |
| Massachusetts Development Finance Agency | | | | |
| Revenue (Phillips Academy) | 5.000% | 9/1/43 | 8,295 | 9,297 |
| Massachusetts Development Finance Agency | | | | |
| Revenue (Seven Hills Foundation | | | | |
| Obligated Group) | 5.000% | 9/1/35 | 1,500 | 1,552 |
| Massachusetts Development Finance Agency | | | | |
| Revenue (Simmons College) | 5.500% | 10/1/28 | 1,000 | 1,132 |
| Massachusetts Development Finance Agency | | | | |
| Revenue (Simmons College) | 5.125% | 10/1/33 | 2,000 | 2,138 |
19
| | | | |
| Massachusetts Tax-Exempt Fund | | | | |
| |
| |
| |
| | | | Face | Market |
| | | Maturity | Amount | Value• |
| | Coupon | Date | ($000) | ($000) |
| Massachusetts Development Finance Agency | | | | |
| Revenue (Simmons College) | 5.000% | 10/1/36 | 2,250 | 2,366 |
| Massachusetts Development Finance Agency | | | | |
| Revenue (Simmons College) | 5.250% | 10/1/39 | 3,000 | 3,248 |
| Massachusetts Development Finance Agency | | | | |
| Revenue (South Shore Hospital Inc.) | 5.000% | 7/1/41 | 2,000 | 2,162 |
| Massachusetts Development Finance Agency | | | | |
| Revenue (Southcoast Health System | | | | |
| Obligated Group) | 5.000% | 7/1/27 | 1,550 | 1,723 |
| Massachusetts Development Finance Agency | | | | |
| Revenue (Sterling & Francine Clark Art Institute) | 5.000% | 7/1/34 | 1,000 | 1,122 |
| Massachusetts Development Finance Agency | | | | |
| Revenue (Sterling & Francine Clark Art Institute) | 5.000% | 7/1/35 | 2,000 | 2,240 |
| Massachusetts Development Finance Agency | | | | |
| Revenue (Sterling & Francine Clark Art Institute) | 4.000% | 7/1/41 | 4,000 | 3,963 |
| Massachusetts Development Finance Agency | | | | |
| Revenue (Suffolk University) | 5.000% | 7/1/30 | 3,000 | 3,144 |
| Massachusetts Development Finance Agency | | | | |
| Revenue (Suffolk University) | 5.125% | 7/1/40 | 3,000 | 3,123 |
| Massachusetts Development Finance Agency | | | | |
| Revenue (Tufts Medical Center) | 6.250% | 1/1/27 | 3,545 | 4,008 |
| Massachusetts Development Finance Agency | | | | |
| Revenue (Tufts Medical Center) | 7.250% | 1/1/32 | 4,500 | 5,247 |
| Massachusetts Development Finance Agency | | | | |
| Revenue (Tufts Medical Center) | 6.750% | 1/1/36 | 850 | 966 |
| Massachusetts Development Finance Agency | | | | |
| Revenue (Tufts Medical Center) | 6.875% | 1/1/41 | 2,000 | 2,283 |
| Massachusetts Development Finance Agency | | | | |
| Revenue (Tufts University) | 5.000% | 8/15/38 | 1,000 | 1,116 |
| Massachusetts Development Finance Agency | | | | |
| Revenue (UMass Memorial Medical Center) | 5.125% | 7/1/26 | 2,750 | 3,002 |
| Massachusetts Development Finance Agency | | | | |
| Revenue (UMass Memorial Medical Center) | 5.000% | 7/1/31 | 1,000 | 1,082 |
| Massachusetts Development Finance Agency | | | | |
| Revenue (UMass Memorial Medical Center) | 5.500% | 7/1/31 | 5,500 | 6,001 |
| Massachusetts Development Finance Agency | | | | |
| Revenue (UMass Memorial Medical Center) | 5.000% | 7/1/41 | 700 | 736 |
| Massachusetts Development Finance Agency | | | | |
| Revenue (UMass Memorial Medical Center) | 5.000% | 7/1/46 | 1,355 | 1,421 |
| Massachusetts Development Finance Agency | | | | |
| Revenue (Wellesley College) | 5.000% | 7/1/42 | 2,000 | 2,229 |
| Massachusetts Development Finance Agency | | | | |
| Revenue (Western New England University) | 5.000% | 9/1/45 | 2,825 | 2,949 |
| Massachusetts Development Finance Agency | | | | |
| Revenue (WGBH Educational Foundation) | 5.000% | 1/1/18 (Prere.) | 2,350 | 2,449 |
| Massachusetts Development Finance Agency | | | | |
| Revenue (WGBH Educational Foundation) | 5.000% | 1/1/35 | 1,720 | 1,896 |
| Massachusetts Development Finance Agency | | | | |
| Revenue (WGBH Educational Foundation) | 5.000% | 1/1/36 | 1,000 | 1,099 |
| Massachusetts Development Finance Agency | | | | |
| Revenue (WGBH Educational Foundation) | 5.000% | 1/1/36 (12) | 2,650 | 2,729 |
| Massachusetts Development Finance Agency | | | | |
| Revenue (WGBH Educational Foundation) | 0.000% | 1/1/38 (12) | 5,000 | 2,178 |
| Massachusetts Development Finance Agency | | | | |
| Revenue (WGBH Educational Foundation) | 0.000% | 1/1/39 (12) | 5,000 | 2,089 |
20
| | | | |
| Massachusetts Tax-Exempt Fund | | | | |
| |
| |
| |
| | | | Face | Market |
| | | Maturity | Amount | Value• |
| | Coupon | Date | ($000) | ($000) |
| Massachusetts Development Finance Agency | | | | |
| Revenue (Williams College) | 5.000% | 7/1/33 | 5,600 | 6,392 |
| Massachusetts Development Finance Agency | | | | |
| Revenue (Williams College) | 5.000% | 7/1/38 | 4,000 | 4,467 |
| Massachusetts Development Finance Agency | | | | |
| Revenue (Worcester Polytechnic Institute) | 5.000% | 9/1/50 | 2,650 | 2,857 |
| Massachusetts Development Finance Agency | | | | |
| Revenue (Worcester Polytechnic Institute) | 5.000% | 9/1/52 | 9,095 | 9,823 |
| Massachusetts Development Finance Agency | | | | |
| Special Obligation Revenue | 5.000% | 5/1/34 | 1,295 | 1,432 |
| Massachusetts Development Finance Agency | | | | |
| Special Obligation Revenue | 5.000% | 5/1/39 | 6,470 | 7,119 |
| Massachusetts Development Finance Agency | | | | |
| Special Obligation Revenue | 5.000% | 5/1/39 | 1,000 | 1,100 |
| Massachusetts Educational Financing Authority | | | | |
| Education Loan Revenue | 5.500% | 1/1/17 | 3,000 | 3,011 |
| Massachusetts Federal Highway GAN | | | | |
| (Accelerated Bridge Program) | 5.000% | 6/15/26 | 3,000 | 3,421 |
| Massachusetts Federal Highway Revenue | 5.000% | 6/15/27 | 6,000 | 6,946 |
| Massachusetts GO | 5.000% | 8/1/17 (Prere.) | 1,250 | 1,285 |
| Massachusetts GO | 5.250% | 8/1/17 (Prere.) | 1,500 | 1,544 |
| Massachusetts GO | 5.500% | 11/1/17 | 3,000 | 3,125 |
| Massachusetts GO | 5.000% | 7/1/19 (Prere.) | 780 | 850 |
| Massachusetts GO | 5.500% | 8/1/19 | 5,000 | 5,512 |
| Massachusetts GO | 5.500% | 10/1/19 (2) | 2,000 | 2,217 |
| Massachusetts GO | 5.500% | 10/1/19 (12) | 1,000 | 1,108 |
| Massachusetts GO | 5.500% | 11/1/19 (4) | 5,550 | 6,168 |
| Massachusetts GO | 5.000% | 8/1/21 (Prere.) | 2,000 | 2,282 |
| Massachusetts GO | 5.250% | 8/1/22 | 5,000 | 5,823 |
| Massachusetts GO | 5.000% | 5/1/23 | 2,500 | 2,902 |
| Massachusetts GO | 5.250% | 8/1/23 | 1,000 | 1,181 |
| Massachusetts GO | 5.000% | 11/1/23 | 4,000 | 4,622 |
| Massachusetts GO | 5.000% | 7/1/24 | 5,765 | 6,586 |
| Massachusetts GO | 5.000% | 11/1/24 | 3,500 | 4,024 |
| Massachusetts GO | 5.000% | 7/1/25 | 9,000 | 10,282 |
| Massachusetts GO | 5.000% | 7/1/26 | 9,000 | 10,259 |
| Massachusetts GO | 5.000% | 8/1/26 | 6,500 | 7,317 |
| Massachusetts GO | 5.000% | 7/1/27 | 10,000 | 12,131 |
| Massachusetts GO | 5.000% | 7/1/28 | 10,740 | 12,630 |
| Massachusetts GO | 5.000% | 7/1/29 | 4,900 | 5,724 |
| Massachusetts GO | 5.000% | 7/1/30 | 560 | 651 |
| Massachusetts GO | 5.500% | 8/1/30 (2) | 7,000 | 8,789 |
| Massachusetts GO | 5.000% | 7/1/32 | 3,460 | 3,980 |
| Massachusetts GO | 4.000% | 8/1/32 | 5,000 | 5,194 |
| Massachusetts GO | 5.000% | 7/1/33 | 5,215 | 5,961 |
| Massachusetts GO | 5.000% | 7/1/34 | 5,000 | 5,685 |
| Massachusetts GO | 4.000% | 5/1/35 | 5,000 | 5,114 |
| Massachusetts GO | 5.000% | 7/1/35 | 4,000 | 4,505 |
| Massachusetts GO | 5.000% | 7/1/35 | 5,000 | 5,667 |
| Massachusetts GO | 5.000% | 7/1/36 | 4,000 | 4,520 |
| Massachusetts GO | 5.000% | 8/1/36 | 9,000 | 10,013 |
| Massachusetts GO | 5.000% | 7/1/37 | 500 | 561 |
| Massachusetts GO | 5.000% | 8/1/37 | 5,000 | 5,551 |
| Massachusetts GO | 5.000% | 7/1/38 | 5,000 | 5,628 |
| Massachusetts GO | 5.000% | 7/1/40 | 8,000 | 8,940 |
21
| | | | |
| Massachusetts Tax-Exempt Fund | | | | |
| |
| |
| |
| | | | Face | Market |
| | | Maturity | Amount | Value• |
| | Coupon | Date | ($000) | ($000) |
| Massachusetts GO | 5.000% | 3/1/41 | 8,000 | 8,854 |
| Massachusetts GO | 4.000% | 9/1/41 | 3,000 | 2,972 |
| Massachusetts GO | 4.000% | 9/1/42 | 6,900 | 6,878 |
| Massachusetts GO | 4.000% | 6/1/43 | 7,820 | 7,944 |
| Massachusetts GO | 4.500% | 8/1/43 | 3,705 | 3,954 |
| Massachusetts GO | 4.000% | 5/1/45 | 10,000 | 10,090 |
| Massachusetts GO | 5.000% | 7/1/45 | 2,000 | 2,221 |
| 2 Massachusetts GO TOB VRDO | 0.580% | 12/1/16 LOC | 25,000 | 25,000 |
| 2 Massachusetts GO TOB VRDO | 0.580% | 12/1/16 LOC | 12,300 | 12,300 |
| Massachusetts Health & Educational Facilities | | | | |
| Authority Revenue (Boston Medical Center) | 5.000% | 7/1/18 (Prere.) | 315 | 333 |
| Massachusetts Health & Educational Facilities | | | | |
| Authority Revenue (Boston Medical Center) | 5.000% | 7/1/18 (Prere.) | 2,575 | 2,724 |
| Massachusetts Health & Educational Facilities | | | | |
| Authority Revenue (CareGroup) | 5.000% | 7/1/18 (Prere.) | 2,000 | 2,120 |
| Massachusetts Health & Educational Facilities | | | | |
| Authority Revenue (CareGroup) | 5.125% | 7/1/18 (Prere.) | 3,500 | 3,717 |
| Massachusetts Health & Educational Facilities | | | | |
| Authority Revenue (CareGroup) | 5.125% | 7/1/18 (Prere.) | 3,015 | 3,202 |
| Massachusetts Health & Educational Facilities | | | | |
| Authority Revenue (Children’s Hospital) | 5.500% | 12/1/39 | 4,000 | 4,356 |
| Massachusetts Health & Educational Facilities | | | | |
| Authority Revenue (Children’s Hospital) VRDO | 0.580% | 12/1/16 LOC | 600 | 600 |
| Massachusetts Health & Educational Facilities | | | | |
| Authority Revenue (Dana-Farber Cancer Institute) | 5.000% | 12/1/37 | 5,000 | 5,257 |
| Massachusetts Health & Educational Facilities | | | | |
| Authority Revenue (Harvard University) | 5.000% | 10/1/17 (Prere.) | 1,405 | 1,453 |
| Massachusetts Health & Educational Facilities | | | | |
| Authority Revenue (Harvard University) | 5.000% | 12/15/19 (Prere.) | 810 | 895 |
| Massachusetts Health & Educational Facilities | | | | |
| Authority Revenue (Harvard University) | 5.000% | 12/15/19 (Prere.) | 925 | 1,022 |
| Massachusetts Health & Educational Facilities | | | | |
| Authority Revenue (Harvard University) | 6.250% | 4/1/20 | 3,000 | 3,450 |
| Massachusetts Health & Educational Facilities | | | | |
| Authority Revenue (Isabella Stewart Gardner | | | | |
| Museum) | 5.000% | 5/1/19 (Prere.) | 2,080 | 2,257 |
| Massachusetts Health & Educational Facilities | | | | |
| Authority Revenue (Isabella Stewart Gardner | | | | |
| Museum) | 5.000% | 5/1/19 (Prere.) | 1,650 | 1,790 |
| 1 Massachusetts Health & Educational Facilities | | | | |
| Authority Revenue (MIT) | 5.500% | 7/1/18 (Prere.) | 1,000 | 1,067 |
| Massachusetts Health & Educational Facilities | | | | |
| Authority Revenue (MIT) | 5.250% | 7/1/30 | 3,000 | 3,718 |
| Massachusetts Health & Educational Facilities | | | | |
| Authority Revenue (Northeastern University) | 5.000% | 10/1/19 | 3,000 | 3,268 |
| Massachusetts Health & Educational Facilities | | | | |
| Authority Revenue (Northeastern University) | 5.000% | 10/1/23 | 3,435 | 3,645 |
| Massachusetts Health & Educational Facilities | | | | |
| Authority Revenue (Northeastern University) | 5.000% | 10/1/32 | 1,000 | 1,097 |
| Massachusetts Health & Educational Facilities | | | | |
| Authority Revenue (Northeastern University) | 5.000% | 10/1/33 | 3,000 | 3,160 |
| Massachusetts Health & Educational Facilities | | | | |
| Authority Revenue (Partners Healthcare System) | 5.250% | 7/1/29 | 10,000 | 10,874 |
| Massachusetts Health & Educational Facilities | | | | |
| Authority Revenue (Partners Healthcare System) | 5.000% | 7/1/39 | 500 | 536 |
22
| | | | |
| Massachusetts Tax-Exempt Fund | | | | |
| |
| |
| |
| | | | Face | Market |
| | | Maturity | Amount | Value• |
| | Coupon | Date | ($000) | ($000) |
| 2 Massachusetts Health & Educational Facilities | | | | |
| Authority Revenue (Partners Healthcare System) | | | | |
| TOB VRDO | 0.580% | 12/7/16 | 3,800 | 3,800 |
| Massachusetts Health & Educational Facilities | | | | |
| Authority Revenue (Partners Healthcare System) | | | | |
| VRDO | 0.590% | 12/7/16 | 3,700 | 3,700 |
| Massachusetts Health & Educational Facilities | | | | |
| Authority Revenue (South Coast Health System) | 5.000% | 7/1/39 | 6,000 | 6,257 |
| Massachusetts Health & Educational Facilities | | | | |
| Authority Revenue (Tufts University) | 5.250% | 2/15/22 | 1,400 | 1,611 |
| Massachusetts Health & Educational Facilities | | | | |
| Authority Revenue (Tufts University) | 5.250% | 2/15/26 | 1,880 | 2,240 |
| Massachusetts Health & Educational Facilities | | | | |
| Authority Revenue (UMass Memorial Medical | | | | |
| Center) | 5.000% | 7/1/21 | 100 | 109 |
| Massachusetts Health & Educational Facilities | | | | |
| Authority Revenue (Winchester Hospital) | 5.250% | 7/1/38 | 2,840 | 3,061 |
| Massachusetts Housing Finance Agency Single | | | | |
| Family Housing Revenue | 2.650% | 12/1/41 | 3,370 | 3,403 |
| Massachusetts Housing Finance Agency Single | | | | |
| Family Housing Revenue | 2.750% | 12/1/41 | 1,005 | 1,013 |
| Massachusetts Housing Finance Agency Single | | | | |
| Family Housing Revenue | 3.500% | 6/1/42 | 1,045 | 1,082 |
| Massachusetts Housing Finance Agency Single | | | | |
| Family Housing Revenue | 4.000% | 12/1/43 | 2,845 | 2,949 |
| Massachusetts Housing Finance Agency Single | | | | |
| Family Housing Revenue | 4.000% | 12/1/44 | 2,865 | 2,960 |
| Massachusetts Housing Finance Agency Single | | | | |
| Family Housing Revenue | 4.000% | 6/1/45 | 1,475 | 1,544 |
| Massachusetts Port Authority Revenue | 5.000% | 7/1/17 (4) | 3,000 | 3,072 |
| Massachusetts Port Authority Revenue | 5.000% | 7/1/25 | 1,230 | 1,404 |
| Massachusetts Port Authority Revenue | 5.000% | 7/1/30 | 2,000 | 2,243 |
| Massachusetts Port Authority Revenue | 5.000% | 7/1/31 | 1,800 | 2,018 |
| Massachusetts Port Authority Revenue | 5.000% | 7/1/33 | 4,650 | 5,188 |
| Massachusetts Port Authority Revenue | 5.000% | 7/1/34 | 3,845 | 4,289 |
| Massachusetts Port Authority Revenue | 5.000% | 7/1/35 | 1,500 | 1,680 |
| Massachusetts Port Authority Revenue | 5.000% | 7/1/40 | 6,850 | 7,612 |
| Massachusetts School Building Authority | | | | |
| Dedicated Sales Tax Revenue | 5.000% | 8/15/17 (Prere.) | 20 | 21 |
| Massachusetts School Building Authority | | | | |
| Dedicated Sales Tax Revenue | 5.000% | 8/15/22 | 5,000 | 5,766 |
| Massachusetts School Building Authority | | | | |
| Dedicated Sales Tax Revenue | 5.000% | 8/15/25 | 3,110 | 3,561 |
| Massachusetts School Building Authority | | | | |
| Dedicated Sales Tax Revenue | 5.000% | 8/15/26 | 5,000 | 5,713 |
| Massachusetts School Building Authority | | | | |
| Dedicated Sales Tax Revenue | 5.000% | 8/15/27 | 10,000 | 11,426 |
| Massachusetts School Building Authority | | | | |
| Dedicated Sales Tax Revenue | 5.000% | 8/15/28 | 7,250 | 8,239 |
| Massachusetts School Building Authority | | | | |
| Dedicated Sales Tax Revenue | 5.000% | 8/15/29 | 11,450 | 12,973 |
| Massachusetts School Building Authority | | | | |
| Dedicated Sales Tax Revenue | 5.000% | 11/15/29 | 2,400 | 2,809 |
| Massachusetts School Building Authority | | | | |
| Dedicated Sales Tax Revenue | 5.000% | 8/15/30 | 8,000 | 9,030 |
23
| | | | |
| Massachusetts Tax-Exempt Fund | | | | |
| |
| |
| |
| | | | Face | Market |
| | | Maturity | Amount | Value• |
| | Coupon | Date | ($000) | ($000) |
| Massachusetts School Building Authority | | | | |
| Dedicated Sales Tax Revenue | 5.000% | 11/15/30 | 4,700 | 5,469 |
| Massachusetts School Building Authority | | | | |
| Dedicated Sales Tax Revenue | 5.000% | 11/15/31 | 7,855 | 9,103 |
| Massachusetts School Building Authority | | | | |
| Dedicated Sales Tax Revenue | 4.000% | 8/15/32 | 4,000 | 4,125 |
| Massachusetts School Building Authority | | | | |
| Dedicated Sales Tax Revenue | 5.000% | 10/15/32 | 2,400 | 2,675 |
| Massachusetts School Building Authority | | | | |
| Dedicated Sales Tax Revenue | 5.000% | 11/15/34 | 2,000 | 2,262 |
| Massachusetts School Building Authority | | | | |
| Dedicated Sales Tax Revenue | 5.000% | 11/15/34 | 10,000 | 11,414 |
| Massachusetts School Building Authority | | | | |
| Dedicated Sales Tax Revenue | 5.250% | 10/15/35 | 10,000 | 11,298 |
| Massachusetts School Building Authority | | | | |
| Dedicated Sales Tax Revenue | 4.000% | 8/15/36 | 5,000 | 5,081 |
| Massachusetts School Building Authority | | | | |
| Dedicated Sales Tax Revenue | 4.000% | 1/15/37 | 3,000 | 3,037 |
| Massachusetts School Building Authority | | | | |
| Dedicated Sales Tax Revenue | 5.000% | 11/15/37 | 5,000 | 5,617 |
| Massachusetts School Building Authority | | | | |
| Dedicated Sales Tax Revenue | 5.000% | 5/15/38 | 2,660 | 2,937 |
| Massachusetts School Building Authority | | | | |
| Dedicated Sales Tax Revenue | 4.000% | 11/15/46 | 4,700 | 4,643 |
| Massachusetts School Building Authority | | | | |
| Dedicated Sales Tax Revenue | 5.000% | 11/15/46 | 5,000 | 5,613 |
| Massachusetts Special Obligation Dedicated | | | | |
| Tax Revenue | 5.500% | 1/1/27 (14) | 13,000 | 15,634 |
| Massachusetts Special Obligation Dedicated | | | | |
| Tax Revenue | 5.500% | 1/1/28 (14) | 3,750 | 4,534 |
| Massachusetts Health & Education Facilities | | | | |
| Authority | 5.000% | 10/1/17 (Prere.) | 1,635 | 1,691 |
| Massachusetts Health & Education Facilities | | | | |
| Authority | 5.000% | 10/1/26 | 120 | 124 |
| Massachusetts Transportation Fund Revenue | | | | |
| (Accelerated Bridge Program) | 5.000% | 6/1/21 (Prere.) | 2,000 | 2,272 |
| Massachusetts Transportation Fund Revenue | | | | |
| (Accelerated Bridge Program) | 5.000% | 6/1/33 | 2,050 | 2,269 |
| Massachusetts Transportation Fund Revenue | | | | |
| (Accelerated Bridge Program) | 4.000% | 6/1/37 | 1,960 | 2,010 |
| Massachusetts Transportation Fund Revenue | | | | |
| (Accelerated Bridge Program) | 5.000% | 6/1/38 | 2,750 | 3,044 |
| Massachusetts Transportation Fund Revenue | | | | |
| (Accelerated Bridge Program) | 5.000% | 6/1/43 | 5,000 | 5,523 |
| Massachusetts Transportation Fund Revenue | | | | |
| (Accelerated Bridge Program) | 5.000% | 6/1/44 | 5,000 | 5,557 |
| Massachusetts Transportation Fund Revenue | | | | |
| (Rail Enhancement Program) | 5.000% | 6/1/40 | 5,000 | 5,626 |
| Massachusetts Transportation Fund Revenue | | | | |
| (Rail Enhancement Program) | 4.000% | 6/1/45 | 7,300 | 7,379 |
| Massachusetts Transportation Fund Revenue | | | | |
| (Rail Enhancement Program) | 5.000% | 6/1/45 | 5,640 | 6,319 |
| Massachusetts Turnpike Authority Revenue | | | | |
| (Metropolitan Highway System) | 0.000% | 1/1/20 (14) | 3,000 | 2,825 |
24
| | | | |
| Massachusetts Tax-Exempt Fund | | | | |
| |
| |
| |
| | | | Face | Market |
| | | Maturity | Amount | Value• |
| | Coupon | Date | ($000) | ($000) |
| Massachusetts Turnpike Authority Revenue | | | | |
| (Metropolitan Highway System) | 0.000% | 1/1/25 (14) | 5,000 | 4,012 |
| Massachusetts Turnpike Authority Revenue | | | | |
| (Metropolitan Highway System) | 0.000% | 1/1/28 (14) | 6,095 | 4,405 |
| Massachusetts Water Pollution Abatement Trust | | | | |
| Revenue | 5.250% | 8/1/17 | 540 | 542 |
| Massachusetts Water Pollution Abatement Trust | | | | |
| Revenue | 5.000% | 8/1/22 | 3,000 | 3,478 |
| Massachusetts Water Pollution Abatement Trust | | | | |
| Revenue | 5.000% | 8/1/27 | 8,000 | 9,388 |
| Massachusetts Water Pollution Abatement Trust | | | | |
| Revenue | 5.000% | 8/1/28 | 975 | 1,138 |
| Massachusetts Water Pollution Abatement Trust | | | | |
| Revenue | 5.250% | 8/1/29 | 1,520 | 1,886 |
| Massachusetts Water Pollution Abatement Trust | | | | |
| Revenue | 5.750% | 8/1/29 | 190 | 191 |
| Massachusetts Water Pollution Abatement Trust | | | | |
| Revenue | 5.000% | 8/1/32 | 2,415 | 2,670 |
| Massachusetts Water Pollution Abatement Trust | | | | |
| Revenue | 5.000% | 8/1/32 | 5,685 | 6,140 |
| Massachusetts Water Resources Authority | | | | |
| Revenue | 5.000% | 8/1/17 (Prere.) | 500 | 514 |
| Massachusetts Water Resources Authority | | | | |
| Revenue | 5.000% | 8/1/17 (Prere.) | 875 | 899 |
| Massachusetts Water Resources Authority | | | | |
| Revenue | 5.000% | 8/1/19 (Prere.) | 2,950 | 3,221 |
| Massachusetts Water Resources Authority | | | | |
| Revenue | 5.000% | 8/1/20 (Prere.) | 2,775 | 3,106 |
| 1 Massachusetts Water Resources Authority | | | | |
| Revenue | 5.000% | 8/1/20 (Prere.) | 500 | 560 |
| Massachusetts Water Resources Authority | | | | |
| Revenue | 5.500% | 8/1/20 (4) | 1,000 | 1,135 |
| Massachusetts Water Resources Authority | | | | |
| Revenue | 5.000% | 8/1/21 (Prere.) | 180 | 205 |
| Massachusetts Water Resources Authority | | | | |
| Revenue | 5.000% | 8/1/21 (Prere.) | 820 | 935 |
| Massachusetts Water Resources Authority | | | | |
| Revenue | 5.000% | 8/1/22 (Prere.) | 2,400 | 2,786 |
| Massachusetts Water Resources Authority | | | | |
| Revenue | 5.500% | 8/1/22 (4) | 1,490 | 1,764 |
| Massachusetts Water Resources Authority | | | | |
| Revenue | 5.000% | 8/1/27 | 2,000 | 2,225 |
| Massachusetts Water Resources Authority | | | | |
| Revenue | 5.000% | 8/1/27 | 5,000 | 5,920 |
| Massachusetts Water Resources Authority | | | | |
| Revenue | 5.000% | 8/1/28 | 800 | 942 |
| Massachusetts Water Resources Authority | | | | |
| Revenue | 5.000% | 8/1/29 | 6,000 | 6,720 |
| Massachusetts Water Resources Authority | | | | |
| Revenue | 5.000% | 8/1/31 | 2,270 | 2,618 |
| Massachusetts Water Resources Authority | | | | |
| Revenue | 5.250% | 8/1/31 (4) | 1,000 | 1,228 |
| Massachusetts Water Resources Authority | | | | |
| Revenue | 5.000% | 8/1/32 | 5,000 | 5,734 |
25
| | | | |
| Massachusetts Tax-Exempt Fund | | | | |
| |
| |
| |
| | | | Face | Market |
| | | Maturity | Amount | Value• |
| | Coupon | Date | ($000) | ($000) |
| Massachusetts Water Resources Authority | | | | |
| Revenue | 5.000% | 8/1/34 (14) | 7,500 | 7,672 |
| Massachusetts Water Resources Authority | | | | |
| Revenue | 5.000% | 8/1/35 (14) | 13,025 | 13,325 |
| Massachusetts Water Resources Authority | | | | |
| Revenue | 5.250% | 8/1/35 (4) | 6,310 | 7,697 |
| Massachusetts Water Resources Authority | | | | |
| Revenue | 4.000% | 8/1/36 | 7,200 | 7,345 |
| Massachusetts Water Resources Authority | | | | |
| Revenue | 5.000% | 8/1/36 | 2,710 | 3,009 |
| Massachusetts Water Resources Authority | | | | |
| Revenue | 5.000% | 8/1/40 | 2,690 | 3,023 |
| Massachusetts Water Resources Authority | | | | |
| Revenue | 5.000% | 8/1/40 | 9,860 | 11,081 |
| Massachusetts Water Resources Authority | | | | |
| Revenue | 5.000% | 8/1/42 | 1,000 | 1,102 |
| Massachusetts Water Resources Authority | | | | |
| Revenue | 5.250% | 8/1/42 | 10,000 | 11,250 |
| Massachusetts Water Resources Authority | | | | |
| Revenue | 5.000% | 8/1/44 | 8,000 | 8,823 |
| Massachusetts Water Resources Authority | | | | |
| Revenue VRDO | 0.570% | 12/7/16 | 1,100 | 1,100 |
| Metropolitan Boston MA Transit Parking Corp. | | | | |
| Revenue | 5.000% | 7/1/31 | 1,000 | 1,098 |
| Metropolitan Boston MA Transit Parking Corp. | | | | |
| Revenue | 5.250% | 7/1/36 | 7,000 | 7,800 |
| Scituate MA GO | 4.000% | 9/15/39 | 3,000 | 3,028 |
| University of Massachusetts Building Authority | | | | |
| Revenue | 5.000% | 11/1/31 | 2,500 | 2,851 |
| University of Massachusetts Building Authority | | | | |
| Revenue | 5.000% | 11/1/32 | 4,060 | 4,610 |
| University of Massachusetts Building Authority | | | | |
| Revenue | 5.000% | 5/1/38 (4) | 1,615 | 1,687 |
| University of Massachusetts Building Authority | | | | |
| Revenue | 5.000% | 5/1/38 | 2,000 | 2,194 |
| University of Massachusetts Building Authority | | | | |
| Revenue | 5.000% | 11/1/39 | 6,695 | 7,478 |
| University of Massachusetts Building Authority | | | | |
| Revenue | 5.000% | 11/1/39 | 3,000 | 3,309 |
| University of Massachusetts Building Authority | | | | |
| Revenue | 5.000% | 11/1/40 | 3,000 | 3,340 |
| University of Massachusetts Building Authority | | | | |
| Revenue | 5.000% | 11/1/44 | 3,365 | 3,697 |
| Worcester MA GO | 5.250% | 8/15/21 (14) | 315 | 316 |
| | | | | 1,436,958 |
| Guam (0.4%) | | | | |
| Guam Government Business Privilege Tax | | | | |
| Revenue | 5.000% | 11/15/33 | 3,000 | 3,210 |
| Guam Government Waterworks Authority | | | | |
| Water & Waste Water System Revenue | 5.500% | 7/1/43 | 2,250 | 2,446 |
| | | | | 5,656 |
| Total Tax-Exempt Municipal Bonds (Cost $1,440,805) | | | 1,442,614 |
26
| |
| Massachusetts Tax-Exempt Fund | |
| |
| |
| |
| |
| | Amount |
| | ($000) |
| Other Assets and Liabilities (1.1%) | |
| Other Assets | |
| Investment in Vanguard | 118 |
| Receivables for Investment Securities Sold | 4,865 |
| Receivables for Accrued Income | 18,833 |
| Receivables for Capital Shares Issued | 2,698 |
| Other Assets | 155 |
| Total Other Assets | 26,669 |
| Liabilities | |
| Payables for Investment Securities Purchased | (6,320) |
| Payables for Capital Shares Redeemed | (1,990) |
| Payables for Distributions | (924) |
| Payables to Vanguard | (1,131) |
| Other Liabilities | (177) |
| Total Liabilities | (10,542) |
| Net Assets (100%) | |
| Applicable to 139,278,345 outstanding $.001 par value shares of | |
| beneficial interest (unlimited authorization) | 1,458,741 |
| Net Asset Value Per Share | $10.47 |
| |
| |
| At November 30, 2016, net assets consisted of: | |
| | Amount |
| | ($000) |
| Paid-in Capital | 1,450,220 |
| Undistributed Net Investment Income | 1 |
| Accumulated Net Realized Gains | 6,767 |
| Unrealized Appreciation (Depreciation) | |
| Investment Securities | 1,809 |
| Futures Contracts | (56) |
| Net Assets | 1,458,741 |
• See Note A in Notes to Financial Statements.
1 Securities with a value of $875,000 have been segregated as initial margin for open futures contracts.
2 Security exempt from registration under Rule 144A of the Securities Act of 1933. Such securities may be sold in transactions exempt from
registration, normally to qualified institutional buyers. At November 30, 2016, the aggregate value of these securities was $43,980,000,
representing 3.0% of net assets.
3 Security purchased on a when-issued or delayed-delivery basis for which the fund has not taken delivery as of November 30, 2016.
A key to abbreviations and other references follows the Statement of Net Assets.
See accompanying Notes, which are an integral part of the Financial Statements.
27
Massachusetts Tax-Exempt Fund
Key to Abbreviations
ARS—Auction Rate Security.
BAN—Bond Anticipation Note.
COP—Certificate of Participation.
CP—Commercial Paper.
FR—Floating Rate.
GAN—Grant Anticipation Note.
GO—General Obligation Bond.
PILOT—Payments in Lieu of Taxes.
PUT—Put Option Obligation.
RAN—Revenue Anticipation Note.
TAN—Tax Anticipation Note.
TOB—Tender Option Bond.
TRAN—Tax Revenue Anticipation Note.
VRDO—Variable Rate Demand Obligation.
VRDP—Variable Rate Demand Preferred.
(ETM)—Escrowed to Maturity.
(Prere.)—Prerefunded.
Scheduled principal and interest payments are guaranteed by:
(1) MBIA (Municipal Bond Investors Assurance).
(2) AMBAC (Ambac Assurance Corporation).
(3) FGIC (Financial Guaranty Insurance Company).
(4) AGM (Assured Guaranty Municipal Corporation).
(5) BIGI (Bond Investors Guaranty Insurance).
(6) Connie Lee Inc.
(7) FHA (Federal Housing Authority).
(8) CapMAC (Capital Markets Assurance Corporation).
(9) American Capital Access Financial Guaranty Corporation.
(10) XL Capital Assurance Inc.
(11) CIFG (CDC IXIS Financial Guaranty).
(12) AGC (Assured Guaranty Corporation).
(13) BHAC (Berkshire Hathaway Assurance Corporation).
(14) NPFG (National Public Finance Guarantee Corporation).
(15) BAM (Build America Mutual Assurance Company).
(16) MAC (Municipal Assurance Corporation).
(17) RAA (Radian Asset Assurance Inc.).
(18) SBLF (Michigan School Bond Loan Fund).
The insurance does not guarantee the market value of the municipal bonds.
LOC—Scheduled principal and interest payments are guaranteed by bank letter of credit.
28
Massachusetts Tax-Exempt Fund
Statement of Operations
| |
| | Year Ended |
| | November 30, 2016 |
| | ($000) |
| Investment Income | |
| Income | |
| Interest | 44,376 |
| Total Income | 44,376 |
| Expenses | |
| The Vanguard Group—Note B | |
| Investment Advisory Services | 155 |
| Management and Administrative | 1,665 |
| Marketing and Distribution | 292 |
| Custodian Fees | 19 |
| Auditing Fees | 35 |
| Shareholders’ Reports | 11 |
| Trustees’ Fees and Expenses | 1 |
| Total Expenses | 2,178 |
| Net Investment Income | 42,198 |
| Realized Net Gain (Loss) | |
| Investment Securities Sold | 9,090 |
| Futures Contracts | (740) |
| Realized Net Gain (Loss) | 8,350 |
| Change in Unrealized Appreciation (Depreciation) | |
| Investment Securities | (65,424) |
| Futures Contracts | (56) |
| Change in Unrealized Appreciation (Depreciation) | (65,480) |
| Net Increase (Decrease) in Net Assets Resulting from Operations | (14,932) |
See accompanying Notes, which are an integral part of the Financial Statements.
29
Massachusetts Tax-Exempt Fund
Statement of Changes in Net Assets
| | |
| | Year Ended November 30, |
| | 2016 | 2015 |
| | ($000) | ($000) |
| Increase (Decrease) in Net Assets | | |
| Operations | | |
| Net Investment Income | 42,198 | 37,794 |
| Realized Net Gain (Loss) | 8,350 | 2,279 |
| Change in Unrealized Appreciation (Depreciation) | (65,480) | 5,073 |
| Net Increase (Decrease) in Net Assets Resulting from Operations | (14,932) | 45,146 |
| Distributions | | |
| Net Investment Income | (42,165) | (37,794) |
| Realized Capital Gain1 | (2,006) | (7,117) |
| Total Distributions | (44,171) | (44,911) |
| Capital Share Transactions | | |
| Issued | 386,397 | 242,766 |
| Issued in Lieu of Cash Distributions | 32,506 | 32,933 |
| Redeemed | (187,088) | (138,306) |
| Net Increase (Decrease) from Capital Share Transactions | 231,815 | 137,393 |
| Total Increase (Decrease) | 172,712 | 137,628 |
| Net Assets | | |
| Beginning of Period | 1,286,029 | 1,148,401 |
| End of Period2 | 1,458,741 | 1,286,029 |
| 1 Includes fiscal 2016 and 2015 short-term gain distributions totaling $204,000 and $1,785,000, respectively. Short-term gain distributions |
| are treated as ordinary income dividends for tax purposes. |
| 2 Net Assets—End of Period includes undistributed (overdistributed) net investment income of $1,000 and $0. |
See accompanying Notes, which are an integral part of the Financial Statements.
30
Massachusetts Tax-Exempt Fund
Financial Highlights
| | | | | |
| For a Share Outstanding | Year Ended November 30, |
| Throughout Each Period | 2016 | 2015 | 2014 | 2013 | 2012 |
| Net Asset Value, Beginning of Period | $10.87 | $10.87 | $10.27 | $11.13 | $10.41 |
| Investment Operations | | | | | |
| Net Investment Income | .323 | .334 | .345 | .340 | .349 |
| Net Realized and Unrealized Gain (Loss) | | | | | |
| on Investments | (.383) | .067 | .600 | (.860) | .720 |
| Total from Investment Operations | (. 060) | . 401 | . 945 | (. 520) | 1.069 |
| Distributions | | | | | |
| Dividends from Net Investment Income | (. 323) | (. 334) | (. 345) | (. 340) | (. 349) |
| Distributions from Realized Capital Gains | (.017) | (.067) | — | — | — |
| Total Distributions | (. 340) | (. 401) | (. 345) | (. 340) | (. 349) |
| Net Asset Value, End of Period | $10.47 | $10.87 | $10.87 | $10.27 | $11.13 |
| |
| Total Return1 | -0.68% | 3.77% | 9.32% | -4.71% | 10.41% |
| |
| Ratios/Supplemental Data | | | | | |
| Net Assets, End of Period (Millions) | $1,459 | $1,286 | $1,148 | $1,001 | $1,127 |
| Ratio of Total Expenses to Average Net Assets | 0.15% | 0.16% | 0.16% | 0.16% | 0.16% |
| Ratio of Net Investment Income to | | | | | |
| Average Net Assets | 2.91% | 3.09% | 3.24% | 3.21% | 3.22% |
| Portfolio Turnover Rate | 25% | 15% | 27% | 36% | 13% |
| 1 Total returns do not include account service fees that may have applied in the periods shown. Fund prospectuses provide information about |
| any applicable account service fees. |
See accompanying Notes, which are an integral part of the Financial Statements.
31
Massachusetts Tax-Exempt Fund
Notes to Financial Statements
Vanguard Massachusetts Tax-Exempt Fund is registered under the Investment Company Act of
1940 as an open-end investment company, or mutual fund. The fund invests in debt instruments of
municipal issuers whose ability to meet their obligations may be affected by economic and political
developments in the state.
A. The following significant accounting policies conform to generally accepted accounting principles
for U.S. investment companies. The fund consistently follows such policies in preparing its financial
statements.
1. Security Valuation: Securities are valued as of the close of trading on the New York Stock Exchange
(generally 4 p.m., Eastern time) on the valuation date. Bonds and temporary cash investments are
valued using the latest bid prices or using valuations based on a matrix system (which considers
such factors as security prices, yields, maturities, and ratings), both as furnished by independent
pricing services. Securities for which market quotations are not readily available, or whose values have
been affected by events occurring before the fund’s pricing time but after the close of the securities’
primary markets, are valued by methods deemed by the board of trustees to represent fair value.
2. Futures Contracts: The fund uses futures contracts to invest in fixed income asset classes with
greater efficiency and lower cost than is possible through direct investment, to add value when these
instruments are attractively priced, or to adjust sensitivity to changes in interest rates. The primary
risks associated with the use of futures contracts are imperfect correlation between changes in market
values of bonds held by the fund and the prices of futures contracts, and the possibility of an illiquid
market. Counterparty risk involving futures is mitigated because a regulated clearinghouse is the
counterparty instead of the clearing broker. To further mitigate counterparty risk, the fund trades
futures contracts on an exchange, monitors the financial strength of its clearing brokers and clearing-
house, and has entered into clearing agreements with its clearing brokers. The clearinghouse imposes
initial margin requirements to secure the fund’s performance and requires daily settlement of variation
margin representing changes in the market value of each contract.
Futures contracts are valued at their quoted daily settlement prices. The aggregate settlement values
of the contracts are not recorded in the Statement of Net Assets. Fluctuations in the value of the
contracts are recorded in the Statement of Net Assets as an asset (liability) and in the Statement of
Operations as unrealized appreciation (depreciation) until the contracts are closed, when they are
recorded as realized futures gains (losses).
During the year ended November 30, 2016, the fund’s average investments in long and short futures
contracts represented 1% and 0% of net assets, respectively, based on the average of aggregate
settlement values at each quarter-end during the period.
3. Federal Income Taxes: The fund intends to continue to qualify as a regulated investment company
and distribute all of its income. Management has analyzed the fund’s tax positions taken for all open
federal income tax years (November 30, 2013–2016), and has concluded that no provision for federal
income tax is required in the fund’s financial statements.
4. Distributions: Distributions from net investment income are declared daily and paid on the first
business day of the following month. Annual distributions from realized capital gains, if any, are
recorded on the ex-dividend date.
32
Massachusetts Tax-Exempt Fund
5. Credit Facility: The fund and certain other funds managed by The Vanguard Group (“Vanguard”) participate in a $3.1 billion committed credit facility provided by a syndicate of lenders pursuant to a credit agreement that may be renewed annually; each fund is individually liable for its borrowings, if any, under the credit facility. Borrowings may be utilized for temporary and emergency purposes, and are subject to the fund’s regulatory and contractual borrowing restrictions. The participating funds are charged administrative fees and an annual commitment fee of 0.10% of the undrawn amount of the facility; these fees are allocated to the funds based on a method approved by the fund’s board of trustees and included in Management and Administrative expenses on the fund’s Statement of Operations. Any borrowings under this facility bear interest at a rate based upon the higher of the one-month London Interbank Offered Rate, federal funds effective rate, or overnight bank funding rate plus an agreed-upon spread.
The fund had no borrowings outstanding at November 30, 2016, or at any time during the period then ended.
6. Other: Interest income is accrued daily. Premiums and discounts on debt securities purchased are amortized and accreted, respectively, to interest income over the lives of the respective securities. Security transactions are accounted for on the date securities are bought or sold. Costs used to determine realized gains (losses) on the sale of investment securities are those of the specific securities sold.
B. In accordance with the terms of a Funds’ Service Agreement (the “FSA”) between Vanguard and the fund, Vanguard furnishes to the fund investment advisory, corporate management, administrative, marketing, and distribution services at Vanguard’s cost of operations (as defined by the FSA). These costs of operations are allocated to the fund based on methods and guidelines approved by the board of trustees. Vanguard does not require reimbursement in the current period for certain costs of operations (such as deferred compensation/benefits and risk/insurance costs); the fund’s liability for these costs of operations is included in Payables to Vanguard on the Statement of Net Assets.
Upon the request of Vanguard, the fund may invest up to 0.40% of its net assets as capital in Vanguard. At November 30, 2016, the fund had contributed to Vanguard capital in the amount of $118,000, representing 0.01% of the fund’s net assets and 0.05% of Vanguard’s capitalization. The fund’s trustees and officers are also directors and employees, respectively, of Vanguard.
C. Various inputs may be used to determine the value of the fund’s investments. These inputs are summarized in three broad levels for financial statement purposes. The inputs or methodologies used to value securities are not necessarily an indication of the risk associated with investing in those securities.
Level 1—Quoted prices in active markets for identical securities.
Level 2—Other significant observable inputs (including quoted prices for similar securities, interest rates, prepayment speeds, credit risk, etc.).
Level 3—Significant unobservable inputs (including the fund’s own assumptions used to determine the fair value of investments).
33
Massachusetts Tax-Exempt Fund
The following table summarizes the market value of the fund’s investments as of November 30, 2016,
based on the inputs used to value them:
| | | |
| | Level 1 | Level 2 | Level 3 |
| Investments | ($000) | ($000) | ($000) |
| Tax-Exempt Municipal Bonds | — | 1,442,614 | — |
| Futures Contracts—Liabilities1 | (177) | — | — |
| Total | (177) | 1,442,614 | — |
| 1 Represents variation margin on the last day of the reporting period. | | | |
D. At November 30, 2016, the aggregate settlement value of open futures contracts and the related unrealized appreciation (depreciation) were:
| | | | |
| | | | ($000) |
| | | | Aggregate | |
| | | Number of | Settlement | Unrealized |
| | | Long (Short) | Value | Appreciation |
| Futures Contracts | Expiration | Contracts | Long (Short) | (Depreciation) |
| 5-Year U.S. Treasury Note | March 2017 | 197 | 23,215 | (48) |
| 30-Year U.S. Treasury Bond | March 2017 | 50 | 7,564 | (8) |
| | | | | (56) |
Unrealized appreciation (depreciation) on open futures contracts is required to be treated as realized gain (loss) for tax purposes.
E. Capital gain distributions are determined on a tax basis and may differ from realized capital gains for financial reporting purposes. Differences may be permanent or temporary. Permanent differences are reclassified among capital accounts in the financial statements to reflect their tax character. Temporary differences arise when gains or losses are recognized in different periods for financial statement and tax purposes. These differences will reverse at some time in the future.
The fund used a tax accounting practice to treat a portion of the price of capital shares redeemed during the year as distributions from realized capital gains. Accordingly, the fund has reclassified $761,000 from accumulated net realized gains to paid-in capital.
For tax purposes, at November 30, 2016, the fund had short-term and long-term capital gains of $584,000 and $6,860,000, respectively, available for distribution. Short-term gain distributions are treated as ordinary income dividends for tax purposes.
At November 30, 2016, the cost of investment securities for tax purposes was $1,441,538,000. Net unrealized appreciation of investment securities for tax purposes was $1,076,000, consisting of unrealized gains of $35,425,000 on securities that had risen in value since their purchase and $34,349,000 in unrealized losses on securities that had fallen in value since their purchase.
F. During the year ended November 30, 2016, the fund purchased $580,458,000 of investment securities and sold $335,423,000 of investment securities, other than temporary cash investments.
34
Massachusetts Tax-Exempt Fund
The fund purchased securities from and sold securities to other Vanguard funds or accounts managed by Vanguard or its affiliates, in accordance with procedures adopted by the board of trustees in compliance with Rule 17a-7 of the Investment Company Act of 1940. For the year ended November 30, 2016, such purchases and sales were $154,985,000 and $176,414,000, respectively; these amounts are included in the purchases and sales of investment securities noted above.
G. Capital shares issued and redeemed were:
| | |
| | Year Ended November 30, |
| | 2016 | 2015 |
| | Shares | Shares |
| | (000) | (000) |
| Issued | 35,040 | 22,432 |
| Issued in Lieu of Cash Distributions | 2,947 | 3,042 |
| Redeemed | (17,064) | (12,798) |
| Net Increase (Decrease) in Shares Outstanding | 20,923 | 12,676 |
H. Management has determined that no material events or transactions occurred subsequent to November 30, 2016, that would require recognition or disclosure in these financial statements.
35
Report of Independent Registered
Public Accounting Firm
To the Board of Trustees of Vanguard Massachusetts Tax-Exempt Funds and the Shareholders of
Vanguard Massachusetts Tax-Exempt Fund:
In our opinion, the accompanying statement of net assets and the related statements of operations
and of changes in net assets and the financial highlights present fairly, in all material respects, the
financial position of Vanguard Massachusetts Tax-Exempt Fund (constituting Vanguard Massachusetts
Tax-Exempt Funds, hereafter referred to as the “Fund”) at November 30, 2016, the results of its
operations for the year then ended, the changes in its net assets for each of the two years in the
period then ended, and the financial highlights for each of the five years in the period then ended,
in conformity with accounting principles generally accepted in the United States of America. These
financial statements and financial highlights (hereafter referred to as “financial statements”) are the
responsibility of the Fund’s management. Our responsibility is to express an opinion on these financial
statements based on our audits. We conducted our audits of these financial statements in accordance
with the standards of the Public Company Accounting Oversight Board (United States). Those
standards require that we plan and perform the audit to obtain reasonable assurance about whether
the financial statements are free of material misstatement. An audit includes examining, on a test
basis, evidence supporting the amounts and disclosures in the financial statements, assessing the
accounting principles used and significant estimates made by management, and evaluating the overall
financial statement presentation. We believe that our audits, which included confirmation of securities
at November 30, 2016 by correspondence with the custodian and brokers, provide a reasonable basis
for our opinion.
/s/PricewaterhouseCoopers LLP
Philadelphia, Pennsylvania
January 12, 2017

Special 2016 tax information (unaudited) for Vanguard Massachusetts Tax-Exempt Fund
This information for the fiscal year ended November 30, 2016, is included pursuant to provisions of
the Internal Revenue Code.
The fund distributed $2,502,000 as capital gain dividends (20% rate gain distributions) to shareholders
during the fiscal year.
For nonresident alien shareholders, 100% of short-term capital gain dividends distributed by the fund
are qualified short-term capital gains.
The fund designates 100% of its income dividends as exempt-interest dividends.
36
About Your Fund’s Expenses
As a shareholder of the fund, you incur ongoing costs, which include costs for portfolio management, administrative services, and shareholder reports (like this one), among others. Operating expenses, which are deducted from a fund’s gross income, directly reduce the investment return of the fund.
A fund’s expenses are expressed as a percentage of its average net assets. This figure is known as the expense ratio. The following examples are intended to help you understand the ongoing costs (in dollars) of investing in your fund and to compare these costs with those of other mutual funds. The examples are based on an investment of $1,000 made at the beginning of the period shown and held for the entire period.
The accompanying table illustrates your fund’s costs in two ways:
• Based on actual fund return. This section helps you to estimate the actual expenses that you paid over the period. The ”Ending Account Value“ shown is derived from the fund‘s actual return, and the third column shows the dollar amount that would have been paid by an investor who started with $1,000 in the fund. You may use the information here, together with the amount you invested, to estimate the expenses that you paid over the period.
To do so, simply divide your account value by $1,000 (for example, an $8,600 account value divided by $1,000 = 8.6), then multiply the result by the number given for your fund under the heading ”Expenses Paid During Period.“
• Based on hypothetical 5% yearly return. This section is intended to help you compare your fund‘s costs with those of other mutual funds. It assumes that the fund had a yearly return of 5% before expenses, but that the expense ratio is unchanged. In this case—because the return used is not the fund’s actual return—the results do not apply to your investment. The example is useful in making comparisons because the Securities and Exchange Commission requires all mutual funds to calculate expenses based on a 5% return. You can assess your fund’s costs by comparing this hypothetical example with the hypothetical examples that appear in shareholder reports of other funds.
Note that the expenses shown in the table are meant to highlight and help you compare ongoing costs only and do not reflect transaction costs incurred by the fund for buying and selling securities. Further, the expenses do not include any purchase, redemption, or account service fees described in the fund prospectus. If such fees were applied to your account, your costs would be higher. Your fund does not carry a “sales load.”
The calculations assume no shares were bought or sold during the period. Your actual costs may have been higher or lower, depending on the amount of your investment and the timing of any purchases or redemptions.
You can find more information about the fund’s expenses, including annual expense ratios, in the Financial Statements section of this report. For additional information on operating expenses and other shareholder costs, please refer to your fund’s current prospectus.
37
| | | |
| Six Months Ended November 30, 2016 | | | |
| | Beginning | Ending | Expenses |
| | Account Value | Account Value | Paid During |
| Massachusetts Tax-Exempt Fund | 5/31/2016 | 11/30/2016 | Period |
| Based on Actual Fund Return | $1,000.00 | $956.87 | $0.68 |
| Based on Hypothetical 5% Yearly Return | 1,000.00 | 1,024.30 | 0.71 |
The calculations are based on expenses incurred in the most recent six-month period. The fund’s annualized six-month expense ratio for that
period is 0.14%. The dollar amounts shown as “Expenses Paid” are equal to the annualized expense ratio multiplied by the average account
value over the period, multiplied by the number of days in the most recent six-month period, then divided by the number of days in the most
recent 12-month period (183/366).
38
Glossary
30-Day SEC Yield. A fund’s 30-day SEC yield is derived using a formula specified by the U.S. Securities and Exchange Commission. Under the formula, data related to the fund’s security holdings in the previous 30 days are used to calculate the fund’s hypothetical net income for that period, which is then annualized and divided by the fund’s estimated average net assets over the calculation period. For the purposes of this calculation, a security’s income is based on its current market yield to maturity (for bonds), its actual income (for asset-backed securities), or its projected dividend yield (for stocks). Because the SEC yield represents hypothetical annualized income, it will differ—at times significantly—from the fund’s actual experience. As a result, the fund’s income distributions may be higher or lower than implied by the SEC yield.
Average Coupon. The average interest rate paid on the fixed income securities held by a fund. It is expressed as a percentage of face value.
Average Duration. An estimate of how much the value of the bonds held by a fund will fluctuate in response to a change in interest rates. To see how the value could change, multiply the average duration by the change in rates. If interest rates rise by 1 percentage point, the value of the bonds in a fund with an average duration of five years would decline by about 5%. If rates decrease by a percentage point, the value would rise by 5%.
Average Stated Maturity. The average length of time until fixed income securities held by a fund reach maturity and are repaid using the maturity date of the security. The figure reflects the proportion of fund assets represented by each security; it also reflects any futures contracts held. In general, the longer the average stated maturity, the more a fund’s share price will fluctuate in response to changes in market interest rates.
Beta. A measure of the magnitude of a fund’s past share-price fluctuations in relation to the ups and downs of a given market index. The index is assigned a beta of 1.00. Compared with a given index, a fund with a beta of 1.20 typically would have seen its share price rise or fall by 12% when the index rose or fell by 10%. For this report, beta is based on returns over the past 36 months for both the fund and the index. Note that a fund’s beta should be reviewed in conjunction with its R-squared (see definition). The lower the R-squared, the less correlation there is between the fund and the index, and the less reliable beta is as an indicator of volatility.
Credit Quality. Credit-quality ratings are measured on a scale that generally ranges from AAA (highest) to D (lowest). Credit-quality ratings are obtained from Moody’s and S&P, and the higher rating for each issue is used. ”Not Rated” is used to classify securities for which a rating is not available. Not rated securities include a fund’s investment in Vanguard Market Liquidity Fund or Vanguard Municipal Cash Management Fund, each of which invests in high-quality money market instruments and may serve as a cash management vehicle for the Vanguard funds, trusts, and accounts.
Expense Ratio. A fund’s total annual operating expenses expressed as a percentage of the fund’s average net assets. The expense ratio includes management and administrative expenses, but does not include the transaction costs of buying and selling portfolio securities.
Inception Date. The date on which the assets of a fund (or one of its share classes) are first invested in accordance with the fund’s investment objective. For funds with a subscription period, the inception date is the day after that period ends. Investment performance is measured from the inception date.
39
R-Squared. A measure of how much of a fund’s past returns can be explained by the returns from the market in general, as measured by a given index. If a fund’s total returns were precisely synchronized with an index’s returns, its R-squared would be 1.00. If the fund’s returns bore no relationship to the index’s returns, its R-squared would be 0. For this report, R-squared is based on returns over the past 36 months for both the fund and the index.
Short-Term Reserves. The percentage of a fund invested in highly liquid, short-term securities that can be readily converted to cash.
Yield to Maturity. The rate of return an investor would receive if the fixed income securities held by a fund were held to their maturity dates.
40
This page intentionally left blank.
This page intentionally left blank.
The Vanguard Municipal Bond Funds are not sponsored, endorsed, issued, sold, or promoted by Barclays Risk Analytics and
Index Solutions Limited or any of its affiliates (“Barclays”). Barclays makes no representation or warranty, express or implied,
to the owners or purchasers of the Vanguard Municipal Bond Funds or any member of the public regarding the advisability of
investing in securities generally or in the Vanguard Municipal Bond Funds particularly or the ability of the Bloomberg Barclays
Indices to track general bond market performance. Barclays has not passed on the legality or suitability of the Vanguard
Municipal Bond Funds with respect to any person or entity. Barclays’ only relationship to Vanguard and the Vanguard Municipal
Bond Funds is the licensing of the Bloomberg Barclays Indices, which are determined, composed, and calculated by Barclays
without regard to Vanguard or the Vanguard Municipal Bond Funds or any owners or purchasers of the Vanguard Municipal
Bond Funds. Barclays has no obligation to take the needs of Vanguard, the Vanguard Municipal Bond Funds, or the owners
of the Vanguard Municipal Bond Funds into consideration in determining, composing, or calculating the Bloomberg Barclays
Indices. Barclays is not responsible for and has not participated in the determination of the timing of, prices at, or quantities of
the Vanguard Municipal Bond Funds to be issued. Barclays has no obligation or liability in connection with the administration,
marketing, or trading of the Vanguard Municipal Bond Funds.
BARCLAYS SHALL HAVE NO LIABILITY TO THIRD PARTIES FOR THE QUALITY, ACCURACY AND/OR COMPLETENESS OF THE
INDEX OR ANY DATA INCLUDED THEREIN OR FOR INTERRUPTIONS IN THE DELIVERY OF THE INDEX. BARCLAYS MAKES
NO WARRANTY, EXPRESS OR IMPLIED, AS TO RESULTS TO BE OBTAINED BY OWNERS OF THE VANGUARD MUNICIPAL
BOND FUNDS OR ANY OTHER PERSON OR ENTITY FROM THE USE OF THE INDEX OR ANY DATA INCLUDED THEREIN IN
CONNECTION WITH THE RIGHTS LICENSED HEREUNDER OR FOR ANY OTHER USE. BARCLAYS RESERVES THE RIGHT
TO CHANGE THE METHODS OF CALCULATION OR PUBLICATION, OR TO CEASE THE CALCULATION OR PUBLICATION OF
THE BLOOMBERG BARCLAYS INDICES, AND BARCLAYS SHALL NOT BE LIABLE FOR ANY MISCALCULATION OF OR ANY
INCORRECT, DELAYED OR INTERRUPTED PUBLICATION WITH RESPECT TO ANY OF THE BLOOMBERG BARCLAYS INDICES.
BARCLAYS MAKES NO EXPRESS OR IMPLIED WARRANTIES, AND HEREBY EXPRESSLY DISCLAIMS ALL WARRANTIES
OF MERCHANTABILITY OR FITNESS FOR A PARTICULAR PURPOSE OR USE WITH RESPECT TO THE INDEX OR ANY DATA
INCLUDED THEREIN. BARCLAYS SHALL NOT BE LIABLE FOR ANY DAMAGES, INCLUDING, WITHOUT LIMITATION, ANY
INDIRECT OR CONSEQUENTIAL DAMAGES RESULTING FROM THE USE OF THE INDEX OR ANY DATA INCLUDED THEREIN.
© 2017 Barclays. Used with Permission.
Source: Barclays Global Family of Indices. Copyright 2017, Barclays. All rights reserved.
The People Who Govern Your Fund
The trustees of your mutual fund are there to see that the fund is operated and managed in your best interests since, as a shareholder, you are a part owner of the fund. Your fund’s trustees also serve on the board of directors of The Vanguard Group, Inc., which is owned by the Vanguard funds and provides services to them on an at-cost basis.
A majority of Vanguard’s board members are independent, meaning that they have no affiliation with Vanguard or the funds they oversee, apart from the sizable personal investments they have made as private individuals. The independent board members have distinguished backgrounds in business, academia, and public service. Each of the trustees and executive officers oversees 198 Vanguard funds.
The following table provides information for each trustee and executive officer of the fund. The mailing address of the trustees and officers is P.O. Box 876, Valley Forge, PA 19482. More information about the trustees is in the Statement of Additional Information, which can be obtained, without charge, by contacting Vanguard at 800-662-7447, or online at vanguard.com.
InterestedTrustee1
F. William McNabb III
Born 1957. Trustee Since July 2009. Chairman of the Board. Principal Occupation(s) During the Past Five Years and Other Experience: Chairman of the Board of The Vanguard Group, Inc., and of each of the investment companies served by The Vanguard Group, since January 2010; Director of The Vanguard Group since 2008; Chief Executive Officer and President of The Vanguard Group, and of each of the investment companies served by The Vanguard Group, since 2008; Director of Vanguard Marketing Corporation; Managing Director of The Vanguard Group (1995–2008).
IndependentTrustees
Emerson U. Fullwood
Born 1948. Trustee Since January 2008. Principal Occupation(s) During the Past Five Years and Other Experience: Executive Chief Staff and Marketing Officer for North America and Corporate Vice President (retired 2008) of Xerox Corporation (document management products and services); Executive in Residence and 2009–2010 Distinguished Minett Professor at the Rochester Institute of Technology; Lead Director of SPX FLOW, Inc. (multi-industry manufacturing); Director of the United Way of Rochester, the University of Rochester Medical Center, Monroe Community College Foundation, North Carolina A&T University, and Roberts Wesleyan College.
Rajiv L. Gupta
Born 1945. Trustee Since December 2001.2 Principal Occupation(s) During the Past Five Years and Other Experience: Chairman and Chief Executive Officer (retired 2009) and President (2006–2008) of Rohm and Haas Co. (chemicals); Director of Tyco International plc (diversified manufacturing and services), HP Inc. (printer and personal computer manufacturing), and Delphi Automotive plc (automotive components); Senior Advisor at New Mountain Capital.
Amy Gutmann
Born 1949. Trustee Since June 2006. Principal Occupation(s) During the Past Five Years and Other Experience: President of the University of Pennsylvania; Christopher H. Browne Distinguished Professor of Political Science, School of Arts and Sciences, and Professor of Communication, Annenberg School for Communication, with secondary faculty appointments in the Department of Philosophy, School of Arts and Sciences, and at the Graduate School of Education, University of Pennsylvania; Trustee of the National Constitution Center; Chair of the Presidential Commission for the Study of Bioethical Issues.
JoAnn Heffernan Heisen
Born 1950. Trustee Since July 1998. Principal Occupation(s) During the Past Five Years and Other Experience: Corporate Vice President and Chief Global Diversity Officer (retired 2008) and Member of the Executive Committee (1997–2008) of Johnson & Johnson (pharmaceuticals/medical devices/consumer products); Director of Skytop Lodge Corporation (hotels) and the Robert Wood Johnson Foundation; Member of the Advisory Board of the Institute for Women’s Leadership at Rutgers University.
F. Joseph Loughrey
Born 1949. Trustee Since October 2009. Principal Occupation(s) During the Past Five Years and Other Experience: President and Chief Operating Officer (retired 2009) of Cummins Inc. (industrial machinery); Chairman of the Board of Hillenbrand, Inc. (specialized consumer services), and of Oxfam America; Director of SKF AB (industrial machinery), Hyster-Yale Materials Handling, Inc. (forklift trucks), the Lumina Foundation for Education, and the V Foundation for Cancer Research; Member of the Advisory Council for the College of Arts and Letters and of the Advisory Board to the Kellogg Institute for International Studies, both at the University of Notre Dame.
Mark Loughridge
Born 1953. Trustee Since March 2012. Principal Occupation(s) During the Past Five Years and Other Experience: Senior Vice President and Chief Financial Officer (retired 2013) at IBM (information technology services); Fiduciary Member of IBM’s Retirement Plan Committee (2004–2013); Director of the Dow Chemical Company; Member of the Council on Chicago Booth.
Scott C. Malpass
Born 1962. Trustee Since March 2012. Principal Occupation(s) During the Past Five Years and Other Experience: Chief Investment Officer and Vice President at the University of Notre Dame; Assistant Professor of Finance at the Mendoza College of Business at Notre Dame; Member of the Notre Dame 403(b) Investment Committee, the Board of Advisors for Spruceview Capital Partners, and the Investment Advisory Committee of Major League Baseball; Board Member of TIFF Advisory Services, Inc., and Catholic Investment Services, Inc. (investment advisors).
André F. Perold
Born 1952. Trustee Since December 2004. Principal Occupation(s) During the Past Five Years and Other Experience: George Gund Professor of Finance and Banking, Emeritus at the Harvard Business School (retired 2011); Chief Investment Officer and Managing Partner of HighVista Strategies LLC (private investment firm); Director of Rand Merchant Bank; Overseer of the Museum of Fine Arts Boston.
Peter F. Volanakis
Born 1955. Trustee Since July 2009. Principal Occupation(s) During the Past Five Years and Other Experience: President and Chief Operating Officer (retired 2010) of Corning Incorporated (communications equipment); Chairman of the Board of Trustees of Colby-Sawyer College; Member of the Advisory Board of the Norris Cotton Cancer Center.
Executive Officers
Glenn Booraem
Born 1967. Treasurer Since May 2015. Principal Occupation(s) During the Past Five Years and Other Experience: Principal of The Vanguard Group, Inc.; Treasurer of each of the investment companies served by The Vanguard Group; Controller of each of the investment companies served by The Vanguard Group (2010–2015); Assistant Controller of each of the investment companies served by The Vanguard Group (2001–2010).
Thomas J. Higgins
Born 1957. Chief Financial Officer Since September 2008. Principal Occupation(s) During the Past Five Years and Other Experience: Principal of The Vanguard Group, Inc.; Chief Financial Officer of each of the investment companies served by The Vanguard Group; Treasurer of each of the investment companies served by The Vanguard Group (1998–2008).
Peter Mahoney
Born 1974. Controller Since May 2015. Principal Occupation(s) During the Past Five Years and Other Experience: Head of Global Fund Accounting at The Vanguard Group, Inc.; Controller of each of the investment companies served by The Vanguard Group; Head of International Fund Services at The Vanguard Group (2008–2014).
Anne E. Robinson
Born 1970. Secretary Since September 2016. Principal Occupation(s) During the Past Five Years and Other Experience: Managing Director of The Vanguard Group, Inc.; General Counsel of The Vanguard Group; Secretary of The Vanguard Group and of each of the investment companies served by The Vanguard Group; Director and Senior Vice President of Vanguard Marketing Corporation; Managing Director and General Counsel of Global Cards and Consumer Services at Citigroup (2014–2016); Counsel at American Express (2003–2014).
| |
| Vanguard Senior Management Team |
| Mortimer J. Buckley | James M. Norris |
| Kathleen C. Gubanich | Thomas M. Rampulla |
| Martha G. King | Glenn W. Reed |
| John T. Marcante | Karin A. Risi |
| Chris D. McIsaac | Michael Rollings |
| |
| Chairman Emeritus and Senior Advisor |
| John J. Brennan | |
| Chairman, 1996–2009 | |
| Chief Executive Officer and President, 1996–2008 |
| |
| Founder | |
| John C. Bogle | |
| Chairman and Chief Executive Officer, 1974–1996 |
1 Mr. McNabb is considered an “interested person,” as defined in the Investment Company Act of 1940, because he is an officer of the Vanguard funds.
2 December 2002 for Vanguard Equity Income Fund, the Vanguard Municipal Bond Funds, and the Vanguard State Tax-Exempt Funds.
|  |
| | P.O. Box 2600 |
| | Valley Forge, PA 19482-2600 |
| |
| |
| |
| Connect with Vanguard® > vanguard.com | |
| |
| |
| |
| Fund Information > 800-662-7447 | CFA® is a registered trademark owned by CFA Institute. |
| Direct Investor Account Services > 800-662-2739 | |
| Institutional Investor Services > 800-523-1036 | |
| Text Telephone for People | |
| Who Are Deaf or Hard of Hearing > 800-749-7273 | |
| |
| This material may be used in conjunction | |
| with the offering of shares of any Vanguard | |
| fund only if preceded or accompanied by | |
| the fund’s current prospectus. | |
| |
| All comparative mutual fund data are from Lipper, a | |
| Thomson Reuters Company, or Morningstar, Inc., unless | |
| otherwise noted. | |
| |
| You can obtain a free copy of Vanguard’s proxy voting | |
| guidelines by visiting vanguard.com/proxyreporting or by | |
| calling Vanguard at 800-662-2739. The guidelines are | |
| also available from the SEC’s website, sec.gov. In | |
| addition, you may obtain a free report on how your fund | |
| voted the proxies for securities it owned during the 12 | |
| months ended June 30. To get the report, visit either | |
| vanguard.com/proxyreporting or sec.gov. | |
| |
| You can review and copy information about your fund at | |
| the SEC’s Public Reference Room in Washington, D.C. To | |
| find out more about this public service, call the SEC at | |
| 202-551-8090. Information about your fund is also | |
| available on the SEC’s website, and you can receive | |
| copies of this information, for a fee, by sending a | |
| request in either of two ways: via email addressed to | |
| publicinfo@sec.gov or via regular mail addressed to the | |
| Public Reference Section, Securities and Exchange | |
| Commission, Washington, DC 20549-1520. | |
| |
| | © 2017 The Vanguard Group, Inc. |
| | All rights reserved. |
| | Vanguard Marketing Corporation, Distributor. |
| |
| | Q1680 012017 |
Item 2: Code of Ethics. The Registrant has adopted a code of ethics that applies to the Registrant’s principal executive officer, principal financial officer, principal accounting officer or controller or persons performing similar functions. The Code of Ethics was amended during the reporting period covered by this report to make certain technical, non-material changes.
Item 3: Audit Committee Financial Expert. All members of the Audit Committee have been determined by the Registrant’s Board of Trustees to be Audit Committee Financial Experts and to be independent: Rajiv L. Gupta, JoAnn Heffernan Heisen, F. Joseph Loughrey, Mark Loughridge, and Peter F. Volanakis.
Item 4: Principal Accountant Fees and Services.
(a) Audit Fees.
Audit Fees of the Registrant
Fiscal Year Ended November 30, 2016: $35,000
Fiscal Year Ended November 30, 2015: $34,000
Aggregate Audit Fees of Registered Investment Companies in the Vanguard Group.
Fiscal Year Ended November 30, 2016: $9,629,849
Fiscal Year Ended November 30, 2015: $7,000,200
Includes fees billed in connection with audits of the Registrant, other registered investment companies in the Vanguard complex, The Vanguard Group, Inc. and Vanguard Marketing Corporation.
(b) Audit-Related Fees.
Fiscal Year Ended November 30, 2016: $2,717,627
Fiscal Year Ended November 30, 2015: $2,899,096
Includes fees billed in connection with assurance and related services provided to the Registrant, other registered investment companies in the Vanguard complex, The Vanguard Group, Inc., and Vanguard Marketing Corporation.
(c) Tax Fees.
Fiscal Year Ended November 30, 2016: $254,050
Fiscal Year Ended November 30, 2015: $353,389
Includes fees billed in connection with tax compliance, planning, and advice services provided to the Registrant, other registered investment companies in the Vanguard complex, The Vanguard Group, Inc., and Vanguard Marketing Corporation.
(d) All Other Fees.
Fiscal Year Ended November 30, 2016: $214,225
Fiscal Year Ended November 30, 2015: $202,313
Includes fees billed for services related to tax reported information provided to the Registrant, other registered investment companies in the Vanguard complex, The Vanguard Group, Inc., and Vanguard Marketing Corporation.
(e) (1) Pre-Approval Policies. The policy of the Registrant’s Audit Committee is to consider and, if appropriate, approve before the principal accountant is engaged for such services, all specific audit and non-audit services provided to: the Registrant, other registered investment companies in the Vanguard complex, The Vanguard Group, Inc., and entities controlled by The Vanguard Group, Inc. that provide ongoing services to the Registrant. In making a determination, the Audit Committee considers whether the services are consistent with maintaining the principal accountant’s independence.
In the event of a contingency situation in which the principal accountant is needed to provide services in between scheduled Audit Committee meetings, the Chairman of the Audit Committee would be called on to consider and, if appropriate, pre-approve audit or permitted non-audit services in an amount sufficient to complete services through the next Audit Committee meeting, and to determine if such services would be consistent with maintaining the accountant’s independence. At the next scheduled Audit Committee meeting, services and fees would be presented to the Audit Committee for formal consideration, and, if appropriate, approval by the entire Audit Committee. The Audit Committee would again consider whether such services and fees are consistent with maintaining the principal accountant’s independence.
The Registrant’s Audit Committee is informed at least annually of all audit and non-audit services provided by the principal accountant to the Vanguard complex, whether such services are provided to: the Registrant, other registered investment companies in the Vanguard complex, The Vanguard Group, Inc., or other entities controlled by The Vanguard Group, Inc. that provide ongoing services to the Registrant.
(2) No percentage of the principal accountant’s fees or services were approved pursuant to the waiver provision of paragraph (c)(7)(i)(C) of Rule 2-01 of Regulation S-X.
(f) For the most recent fiscal year, over 50% of the hours worked under the principal accountant’s engagement were not performed by persons other than full-time, permanent employees of the principal accountant.
(g) Aggregate Non-Audit Fees.
Fiscal Year Ended November 30, 2016: $468,275
Fiscal Year Ended November 30, 2015: $555,702
Includes fees billed for non-audit services provided to the Registrant, other registered investment companies in the Vanguard complex, The Vanguard Group, Inc., and Vanguard Marketing Corporation.
(h) For the most recent fiscal year, the Audit Committee has determined that the provision of all non-audit services was consistent with maintaining the principal accountant’s independence.
Item 5: Audit Committee of Listed Registrants.
Not Applicable.
Item 6: Investments.
Not Applicable.
Item 7: Disclosure of Proxy Voting Policies and Procedures for Closed-End Management
Investment Companies.
Not Applicable.
Item 8: Portfolio Managers of Closed-End Management Investment Companies.
Not Applicable.
Item 9: Purchase of Equity Securities by Closed-End Management Investment Company and
Affiliated Purchasers.
Not Applicable.
Item 10: Submission of Matters to a Vote of Security Holders.
Not Applicable.
Item 11: Controls and Procedures.
(a) Disclosure Controls and Procedures. The Principal Executive and Financial Officers concluded that the Registrant’s Disclosure Controls and Procedures are effective based on their evaluation of the Disclosure Controls and Procedures as of a date within 90 days of the filing date of this report.
(b) Internal Control Over Financial Reporting. There were no significant changes in Registrant’s Internal Control Over Financial Reporting or in other factors that could significantly affect this control subsequent to the date of the evaluation, including any corrective actions with regard to significant deficiencies and material weaknesses.
Item 12: Exhibits.
(a) Code of Ethics.
(b) Certifications.
Pursuant to the requirements of the Securities Exchange Act of 1934 and the Investment Company Act of 1940, the registrant has duly caused this report to be signed on its behalf by the undersigned, thereunto duly authorized.
| |
| | VANGUARD MASSACHUSETTS TAX-EXEMPT FUNDS |
| |
| |
| BY: | /s/ F. WILLIAM MCNABB III* |
| | F. WILLIAM MCNABB III |
| | CHIEF EXECUTIVE OFFICER |
| |
| Date: January 17, 2017 |
Pursuant to the requirements of the Securities Exchange Act of 1934 and the Investment Company Act of 1940, this report has been signed below by the following persons on behalf of the registrant and in the capacities and on the dates indicated.
| |
| | VANGUARD MASSACHUSETTS TAX-EXEMPT FUNDS |
| |
| BY: | /s/ F. WILLIAM MCNABB III* |
| | F. WILLIAM MCNABB III |
| | CHIEF EXECUTIVE OFFICER |
| Date: January 17, 2017 |
| VANGUARD MASSACHUSETTS TAX-EXEMPT FUNDS |
BY: | /s/ THOMAS J. HIGGINS* |
| | THOMAS J. HIGGINS |
| | CHIEF FINANCIAL OFFICER |
Date: January 17, 2017 |
* By: /s/ Anne E. Robinson
Anne E. Robinson, pursuant to a Power of Attorney filed on October 4, 2016 see file Number
33-32548, Incorporated by Reference.