UNITED STATES
SECURITIES AND EXCHANGE COMMISSION
Washington, D.C. 20549
FORM N-CSR
CERTIFIED SHAREHOLDER REPORT OF REGISTERED MANAGEMENT
INVESTMENT COMPANIES
Investment Company Act file number 811-09037
Nuveen Investment Trust III
(Exact name of registrant as specified in charter)
Nuveen Investments
333 West Wacker Drive Chicago, IL 60606
(Address of principal executive offices) (Zip code)
Kevin J. McCarthy
Nuveen Investments
333 West Wacker Drive Chicago, IL 60606
(Name and address of agent for service)
Registrant’s telephone number, including area code: (312) 917-7700
Date of fiscal year end: September 30
Date of reporting period: March 31, 2012
Form N-CSR is to be used by management investment companies to file reports with the Commission not later than 10 days after the transmission to stockholders of any report that is required to be transmitted to stockholders under Rule 30e-1 under the Investment Company Act of 1940 (17 CFR 270.30e-1). The Commission may use the information provided on Form N-CSR in its regulatory, disclosure review, inspection, and policy making roles.
A registrant is required to disclose the information specified by Form N-CSR, and the Commission will make this information public. A registrant is not required to respond to the collection of information contained in Form N-CSR unless the Form displays a currently valid Office of Management and Budget (“OMB”) control number. Please direct comments concerning the accuracy of the information collection burden estimate and any suggestions for reducing the burden to Secretary, Securities and Exchange Commission, 450 Fifth Street, NW, Washington, DC 20549-0609. The OMB has reviewed this collection of information under the clearance requirements of 44 U.S.C. ss.3507.
Item 1. Reports to Stockholders.

Mutual Funds
Nuveen Taxable Bond Funds
For investors seeking a high level of current income and capital appreciation.
Semi-Annual Report
March 31, 2012
| | | | | | | | |
| | | Share Class / Ticker Symbol |
| | | | |
| Fund Name | | Class A | | Class C | | Class R3 | | Class I |
Nuveen Symphony Credit Opportunities Fund | | NCOAX | | NCFCX | | NCORX | | NCOIX |
Nuveen Symphony Floating Rate Income Fund | | NFRAX | | NFFCX | | NFFRX | | NFRIX |
LIFE IS COMPLEX.
Nuveen makes things e-simple.
It only takes a minute to sign up for e-Reports. Once enrolled, you’ll receive an e-mail as soon as your Nuveen Fund information is ready. No more waiting for delivery by regular mail. Just click on the link within the e-mail to see the report and save it on your computer if you wish.
Free e-Reports right to your e-mail!
www.investordelivery.com
If you receive your Nuveen Fund distributions and statements from your financial advisor or brokerage account.
OR
www.nuveen.com/accountaccess
If you receive your Nuveen Fund distributions and statements directly from Nuveen.
| | | | | | |
| Must be preceded by or accompanied by a prospectus. | | NOT FDIC INSURED | | MAY LOSE VALUE | | NO BANK GUARANTEE |
Table of Contents
Chairman’s
Letter to Shareholders

Dear Shareholders,
In recent months the positive atmosphere in financial markets has reflected efforts by central banks in the U.S. and Europe to provide liquidity to the financial system and keep interest rates low. At the same time, future economic growth in these countries still faces serious headwinds in the form of high energy prices, uncertainties about potential political leadership changes and increasing pressure to reduce government spending regardless of its impact on the economy. Together with the continuing political tensions in the Middle East, investors have many reasons to remain cautious.
Though progress has been painfully slow, officials in Europe have taken important steps to address critical issues. The European Central Bank has provided vital liquidity to the banking system. Similarly, officials in the Euro area finally agreed to an enhanced “firewall” of funding to deal with financial crises in member countries. These steps, in addition to the completion of another round of financing for Greece, have eased credit conditions across the continent. Several very significant challenges remain with the potential to derail the recent progress but European leaders have demonstrated political will and persistence in dealing with their problems.
In the U.S., strong corporate earnings and continued progress on job creation have contributed to a rebound in the equity market and many of the major stock market indexes are approaching their levels before the financial crisis. The Fed’s commitment to an extended period of low interest rates is promoting economic growth, which remains moderate but steady and raises concerns about the future course of long term rates once the program ends. Pre-election maneuvering has added to the highly partisan atmosphere in the Congress. The end of the Bush-era tax cuts and implementation of the spending restrictions of the Budget Control Act of 2011, both scheduled to take place at year-end, loom closer with little progress being made to deal with them.
During the last year, investors have experienced a sharp decline and a strong recovery in the equity markets. Experienced investment teams keep their eye on a longer time horizon and use their practiced investment disciplines to negotiate through market peaks and valleys to achieve long term goals for investors. Monitoring this process is an important consideration for the Fund Board as it oversees your Nuveen funds on your behalf.
As always, I encourage you to contact your financial consultant if you have any questions about your investment in a Nuveen Fund. On behalf of the other members of your Fund Board, we look forward to continuing to earn your trust in the months and years ahead.
Sincerely,

Robert P. Bremner
Chairman of the Board
May 18, 2012
Portfolio Managers’ Comments
Certain statements in this report are forward-looking statements. Discussions of specific investments are for illustration only and are not intended as recommendations of individual investments. The forward-looking statements and other views expressed herein are those of the portfolio managers as of the date of this report. Actual future results or occurrences may differ significantly from those anticipated in any forward-looking statements and the views expressed herein are subject to change at any time, due to numerous market and other factors. The Funds disclaim any obligation to update publicly or revise any forward-looking statements or views expressed herein.
Ratings shown are the highest rating given by one of the following national rating agencies: Standard & Poor’s Group, Moody’s Investors Service, Inc. or Fitch, Inc. Credit ratings are subject to change. AAA, AA, A, and BBB are investment grade ratings; BB, B, CCC, CC, C and D are below-investment grade ratings. Certain bonds backed by U.S. Government or agency securities are regarded as having an implied rating equal to the rating of such securities. Holdings designated N/R are not rated by a national rating agency.
These Funds are managed by Symphony Asset Management LLC, an affiliate of Nuveen Investments. Gunther Stein, Director of Investment Strategies at Symphony, and Jenny Rhee manage the Nuveen Symphony Credit Opportunities Fund, while Gunther and Scott Caraher oversee the investments of the Nuveen Symphony Floating Rate Income Fund. Gunther, Jenny and Scott have 27, 12 and 13 years, respectively, of investment management experience. Here the managers discuss the performance of the Funds and their investment strategies for the six-month reporting period ended March 31, 2012.
How did the Funds perform during the six-month period ended March 31, 2012?
The tables in the Fund Performance and Expense Ratios section of this report provide total return performance information for the Funds (Class A Shares at net asset value) for the six-month, one-year and since inception periods ended March 31, 2012. Over this period, the Nuveen Symphony Credit Opportunities Fund outperformed a blended index, the BofA Merrill Lynch Index and relevant Lipper classification average. The Nuveen Symphony Floating Rate Income Fund outperformed both its comparative index and Lipper classification average. A more detailed account of each Fund’s relative performance is provided later in this report.
What are the Funds’ investment strategies and how were they applied during the six-month period ended March 31, 2012? How did these strategies influence performance?
Nuveen Symphony Credit Opportunities Fund
The Fund seeks current income and capital appreciation by investing primarily in debt instruments such as bonds, loans and convertible securities, a substantial portion of which may be rated below investment grade.
The Fund is designed to leverage Symphony Asset Management’s industry-focused research process in a fully-integrated approach to non-investment grade corporate credit. The Fund’s investment team looks actively across the debt side of a company’s balance sheet in search of total return opportunities.
The Fund is managed by one integrated team of industry specialists that make investments across the entire capital structure of companies in a wide range of sectors. We believe that aggregating and synergizing information across these interrelated markets and understanding industry dynamics is critical to managing total return credit strategies.
The Fund’s portfolio holdings are not designed to replicate an index fund. While the Fund has a blended benchmark it will seek to outperform, it does not seek results by tracking
an index. The Fund has been built from the bottom-up, using Symphony’s internal fundamental research process and risk-management capabilities. This may result in a lower correlation to indexes and other funds with similar mandates.
Following a period of significant downward pressure in the corporate credit market, riskier assets began to rally in October 2011. This change in sentiment was seen most clearly in the high yield market. During the fourth quarter 2011 and first quarter 2012, high yield bond mutual funds saw substantial inflows. These inflows reversed the trend of outflows in high yield funds that had continued through the third quarter of 2011. In contrast, senior loans saw outflows during the fourth quarter 2011 and first quarter 2012.
During the period, senior loan assets continued to struggle to find favor among retail investors, who tend to focus on the “floating rate” nature of the senior loan asset class versus the seniority and security profile which, in our view, is particularly valuable during a period of economic concern. Senior loan prices increased while their yields declined.
We continued to favor high yield relative to senior loans overall as we felt that the momentum within the high yield market was compelling. In many cases, the current yield on high yield bonds was higher than senior loans. This made them more attractive than senior loans, which had yet to find a catalyst to unlock their upside potential. We tend to look at long-term relative value and the direction and momentum of the market.
During the period, we took advantage of a dislocated market. We focused on discounted names that we could purchase at low prices, but which had greater volatility and enough liquidity that, as money flowed back into the high yield market, would be attractive to mutual fund buyers. One such position was First Data Corporation, whose 7.375%, 2019 bonds added significant total return to the overall performance. First Data manages a significant amount of the processing technology for Mastercard and Visa. Similar to First Data on the higher-risk side, we added exposure to Clear Channel Communications, Inc. This media and billboard operator had seen its bond prices decline following a sell-off in the high yield market in August and September 2011. By the end of the reporting period, these bond prices rebounded. While the Fund has had little convertible bond exposure, one of the largest contributors to performance was Equinix Inc.’s 2.50%, 2012 convertible bonds. Equinix provides data center services. Equinix earnings were higher than industry estimates, and the stock rose significantly during the period which in turn caused the conversion value of the convertible bonds to increase.
Several holdings detracted from performance, including LifeCare Holdings, Inc., Term Loan. The company received a subpoena from the U.S. Department of Health and Human Services for overbilling related to long-term acute care hospital units recently acquired from HealthSouth. Also lagging the overall market was a position in Linn Energy LLC Finance Corporation’s 6.25%, 2019 bonds. Linn Energy, an oil and natural gas company, experienced stock and bond price declines during the fourth quarter 2012 after announcing a discounted share offering.
Nuveen Symphony Floating Rate Income Fund
The Fund seeks current income and capital appreciation by investing primarily in floating rate loans and other floating rate securities, a substantial portion of which will be rated below investment grade.
The Fund’s investment team bases its investment process on fundamental, bottom-up credit analysis. Analysts assess sector dynamics, company business models and asset quality. Inherent in our credit analysis process is the evaluation of potential upside and downside to any credit. As such, we concentrate our efforts on sectors where we believe there is both sufficient transparency to assess the downside risk and where firms have assets to support meaningful recovery in case of default. In its focus on downside protection, we favor opportunities where valuations can be quantified and risks assessed.
During the period, senior loan assets continued to struggle to find favor among retail investors, who tend to focus on the “floating rate” nature of the senior loan asset class versus the seniority and security profile which, in our view, is particularly valuable during a period of economic concern. Senior loan prices increased while their yields declined.
Holdings that performed well during the period included Avaya Inc.’s 9.75%, 2015 bonds. Avaya reported strong earnings and investors were encouraged by the company’s anticipated IPO. Other bond holdings that performed well were SoftBrands, Inc. 11.50%, 2018 bonds. These bonds soared above par on news that it would merge with Infor Global Solutions Intermediate Holdings, Ltd.
Holdings that detracted from performance included BlackBoard, Inc., Term Loan. BlackBoard sold off following the capital outflow from senior loan funds during the fourth quarter 2011 and first quarter 2012. As senior loan flows began to stabilize, the newer-issue BlackBoard, Inc., Term Loan price rebounded. Also detracting from performance was LifeCare Holdings, Inc., Term Loan, and Valeant Pharmaceuticals, Term Loan.
Risk Considerations
Mutual fund investing involves risk; principal loss is possible. Debt or fixed income securities such as those held by the Funds are subject to market risk, credit risk, interest rate risk, derivatives risk, liquidity risk, and income risk. As interest rates rise, bond prices fall. Below investment grade or high yield debt securities are subject to liquidity risk and heightened credit risk. Foreign investments involve additional risks, including currency fluctuation, political and economic instability, lack of liquidity and differing legal and accounting standards. The value of a Fund’s convertible securities may decline in response to such factors as rising interest rates and fluctuations in the market price of the underlying securities. These Funds are subject to loan settlement risk due to the lack of established settlement standards or remedies for failure to settle. Because each Fund currently has less assets than a larger fund, large inflows and outflows may impact the Fund’s market exposure and subsequently its performance. Redemption of a large number of shares may subject each Fund and its shareholders to leverage risk and disrupt the overall composition of the Fund’s portfolio and thereby impede the ability to pursue the investment strategy.
[THIS PAGE INTENTIONALLY LEFT BLANK]
Fund Performance and Expense Ratios
The Fund Performance and Expense Ratios for each Fund are shown on the following two pages.
Returns quoted represent past performance, which is no guarantee of future results. Current performance may be higher or lower than the performance shown. Investment returns and principal value will fluctuate so that when shares are redeemed, they may be worth more or less than their original cost. Returns without sales charges would be lower if the sales charge were included. Returns do not reflect the deduction of taxes that a shareholder would pay on Fund distributions or the redemption of Fund shares.
Returns may reflect a contractual agreement between certain Funds and the investment adviser to waive certain fees and expenses; see Notes to Financial Statements, Footnote 7 — Management Fees and Other Transactions with Affiliates for more information. In addition, returns may reflect a voluntary expense limitation by the Funds’ investment adviser that may be modified or discontinued at any time without notice. For the most recent month-end performance visit www.nuveen.com or call (800) 257-8787.
Returns reflect differences in sales charges and expenses, which are primarily differences in distribution and service fees. Fund returns assume reinvestment of dividends and capital gains.
Comparative index and Lipper return information is provided for the Funds’ Class A Shares at net asset value (NAV) only.
The expense ratios shown reflect the Funds’ total operating expenses (before fee waivers or expense reimbursements, if any) as shown in the Funds’ most recent prospectus. The expense ratios include management fees and other fees and expenses.
Fund Performance and Expense Ratios (continued)
Nuveen Symphony Credit Opportunities Fund
Refer to the first page of this Fund Performance and Expense Ratios section for further explanation of the information included within this page.
Fund Performance
Average Annual Total Returns as of March 31, 2012*
| | | | | | | | | | | | |
| | |
| | | Cumulative | | | Average Annual | |
| | | |
| | | 6-Month | | | 1-Year | | | Since
Inception** | |
Class A Shares at NAV | | | 13.19% | | | | 7.04% | | | | 10.09% | |
Class A Shares at maximum Offering Price | | | 7.81% | | | | 1.96% | | | | 7.34% | |
BofA Merrill Lynch – Credit Suisse Index Blend*** | | | 9.50% | | | | 4.47% | | | | 7.61% | |
BofA Merrill Lynch U.S. High Yield Master II Index*** | | | 11.65% | | | | 5.63% | | | | 9.01% | |
Lipper High Current Yield Funds Classification Average*** | | | 11.36% | | | | 4.64% | | | | 8.25% | |
| | | | | | | | | | | | |
Class C Shares | | | 12.79% | | | | 6.20% | | | | 9.24% | |
Class R3 Shares | | | 13.05% | | | | 6.77% | | | | 9.81% | |
Class I Shares | | | 13.33% | | | | 7.27% | | | | 10.35% | |
Class A Shares have a maximum 4.75% sales charge (Offering Price). Class A Share purchases of $1 million or more are sold at net asset value without an up-front sales charge but may be subject to a contingent deferred sales charge (CDSC), also known as a back-end sales charge, if redeemed within eighteen months of purchase. Class C Shares have a 1% CDSC for redemptions within less than twelve months, which is not reflected in the one-year total return. Class R3 Shares have no sales charge and are available to only certain retirement plan clients of financial intermediaries. Class I Shares have no sales charge and may be purchased under limited circumstances or by specified classes of investors.
Expense Ratios as of Most Recent Prospectus
| | | | | | | | |
| | |
| | | Gross
Expense
Ratios | | | Net
Expense
Ratios | |
Class A Shares | | | 1.16% | | | | 1.08% | |
Class C Shares | | | 1.91% | | | | 1.83% | |
Class R3 Shares | | | 1.49% | | | | 1.33% | |
Class I Shares | | | 0.92% | | | | 0.83% | |
The investment adviser has agreed to waive fees and/or reimburse expenses through January 31, 2013, so that total annual Fund operating expenses (excluding 12b-1 distribution and/or service fees, interest expenses, taxes, fees incurred in acquiring and disposing of portfolio securities and extraordinary expenses) do not exceed 0.85% (1.35% after January 31, 2013) of the average daily net assets of any class of Fund shares. The expense limitation expiring January 31, 2013, may be terminated or modified prior to that date only with the approval of the Board of Trustees of the Fund. The expense limitation in effect thereafter may be terminated or modified only with the approval of shareholders of the Fund.
| * | Six-month returns are cumulative; all other returns are annualized. |
| ** | Since inception returns are from 4/28/10. |
| *** | Refer to the Glossary of Terms Used in this Report for definitions. |
Nuveen Symphony Floating Rate Income Fund
Refer to the first page of this Fund Performance and Expense Ratios section for further explanation of the information included within this page.
Fund Performance
Average Annual Total Returns as of March 31, 2012*
| | | | | | | | |
| | |
| | | Cumulative | | | Average Annual | |
| | |
| | | 6-Month | | | Since
Inception** | |
Class A Shares at NAV | | | 10.31% | | | | 4.32% | |
Class A Shares at maximum Offering Price | | | 5.07% | | | | -0.63% | |
Credit Suisse Leveraged Loan Index*** | | | 6.29% | | | | 2.02% | |
Lipper Loan Participation Funds Classification Average*** | | | 7.07% | | | | 2.32% | |
| | |
Class C Shares | | | 9.90% | | | | 3.61% | |
Class R3 Shares | | | 10.12% | | | | 4.04% | |
Class I Shares | | | 10.39% | | | | 4.54% | |
Class A Shares have a maximum 4.75% sales charge (Offering Price). Class A Share purchases of $1 million or more are sold at net asset value without an up-front sales charge but may be subject to a contingent deferred sales charge (CDSC), also known as a back-end sales charge, if redeemed within eighteen months of purchase. Class C Shares have a 1% CDSC for redemptions within less than twelve months, which is not reflected in the one-year total return. Class R3 Shares have no sales charge and are available to only certain retirement plan clients of financial intermediaries. Class I Shares have no sales charge and may be purchased under limited circumstances or by specified classes of investors.
Expense Ratios as of Most Recent Prospectus
| | | | | | | | |
| | |
| | | Gross
Expense
Ratios | | | Net
Expense
Ratios | |
Class A Shares | | | 1.54% | | | | 1.08% | |
Class C Shares | | | 2.28% | | | | 1.83% | |
Class R3 Shares | | | 1.78% | | | | 1.33% | |
Class I Shares | | | 1.28% | | | | 0.83% | |
The investment adviser has agreed to waive fees and/or reimburse expenses through January 31, 2014, so that total annual Fund operating expenses (excluding 12b-1 distribution and/or service fees, interest expenses, taxes, fees incurred in acquiring and disposing of portfolio securities and extraordinary expenses) do not exceed 0.85% (1.10% after January 31, 2014) of the average daily net assets of any class of Fund shares. This expense limitation expiring January 31, 2014, may be terminated or modified prior to that date only with the approval of the Board of Trustees of the Fund. The expense limitation in effect thereafter may be terminated or modified only with the approval of shareholders of the Fund.
| * | Six-month returns are cumulative; all other returns are annualized. |
| ** | Since inception returns are from 5/2/11. |
| *** | Refer to the Glossary of Terms Used in this Report for definitions. |
Yields as of March 31, 2012
Dividend Yield is the most recent dividend per share (annualized) divided by the offering price per share.
The SEC 30-Day Yield is a standardized measure of a Fund’s yield that accounts for the future amortization of premiums or discounts of bonds held in the Fund’s portfolio. The SEC 30-Day Yield is computed under an SEC standardized formula and is based on the maximum offer price per share. Dividend Yield may differ from the SEC 30-Day Yield because the Fund may be paying out more or less than it is earning and it may not include the effect of amortization of bond premium.
Nuveen Symphony Credit Opportunities Fund
| | | | | | | | |
| | |
| | | Dividend
Yield | | | SEC 30-Day
Yield | |
Class A Shares1 | | | 6.06% | | | | 5.19% | |
Class C Shares | | | 5.64% | | | | 4.79% | |
Class R3 Shares | | | 6.11% | | | | 5.26% | |
Class I Shares | | | 6.62% | | | | 5.79% | |
Nuveen Symphony Floating Rate Income Fund
| | | | | | | | |
| | |
| | | Dividend
Yield | | | SEC 30-Day
Yield | |
Class A Shares1 | | | 5.22% | | | | 4.64% | |
Class C Shares | | | 4.73% | | | | 4.28% | |
Class R3 Shares | | | 5.24% | | | | 4.61% | |
Class I Shares | | | 5.73% | | | | 5.11% | |
| 1 | The SEC Yield for Class A shares quoted in the table reflects the maximum sales load. Investors paying a reduced load because of volume discounts, investors paying no load because they qualify for one of the several exclusions from the load, and existing shareholders who previously paid a load but would like to know the SEC Yield applicable to their shares on a going-forward basis, should understand that the SEC Yield effectively applicable to them would be higher than the figure quoted in the table. |
Holding Summaries as of March 31, 2012
This data relates to the securities held in each Fund’s portfolio of investments. It should not be construed as a measure of performance for the Fund itself.
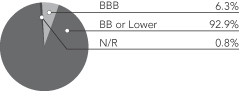
Ratings shown are the highest rating given by one of the following national rating agencies: Standard & Poor’s Group, Moody’s Investors Service, Inc. or Fitch, Inc. Credit ratings are subject to change. AAA, AA, A, and BBB are investment grade ratings; BB, B, CCC, CC, C and D are below-investment grade ratings. Certain bonds backed by U.S. Government or agency securities are regarded as having an implied rating equal to the rating of such securities. Holdings designated N/R are not rated by a national rating agency.
Nuveen Symphony Credit
Opportunities Fund
Portfolio Credit Quality1

Nuveen Symphony Floating Rate Income Fund
Portfolio Credit Quality1
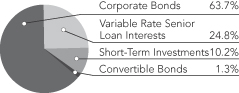
Portfolio Allocation2
Portfolio Allocation2

| | | | |
| Portfolio Composition2 | | | |
Oil, Gas, & Consumable Fuels | | | 8.0% | |
Media | | | 7.6% | |
IT Services | | | 5.3% | |
Health Care Providers & Services | | | 5.2% | |
Diversified Telecommunication Services | | | 4.2% | |
Hotels, Restaurants & Leisure | | | 4.1% | |
Communications Equipment | | | 3.8% | |
Energy Equipment & Services | | | 3.6% | |
Chemicals | | | 3.4% | |
Software | | | 3.1% | |
Trading Cos & Distributors | | | 3.1% | |
Specialty Retail | | | 3.0% | |
Containers & Packaging | | | 2.7% | |
Health Care Equipment & Supplies | | | 2.7% | |
Food & Staples Retailing | | | 2.1% | |
Machinery | | | 2.1% | |
Food Products | | | 1.8% | |
Internet Software & Services | | | 1.8% | |
Pharmaceuticals | | | 1.8% | |
Independent Power Producers & Energy Traders | | | 1.5% | |
Short-Term Investments | | | 10.2% | |
| Other | | | 18.9% | |
| | | | |
| Portfolio Composition2 | | | |
IT Services | | | 9.6% | |
Software | | | 8.7% | |
Health Care Providers & Services | | | 8.4% | |
Pharmaceuticals | | | 7.7% | |
Chemicals | | | 5.7% | |
Internet Software & Services | | | 5.4% | |
Oil, Gas, & Consumable Fuels | | | 5.4% | |
Communications Equipment | | | 5.3% | |
Specialty Retail | | | 4.4% | |
Leisure Equipment & Products | | | 3.7% | |
Media | | | 3.4% | |
Diversified Financial Services | | | 3.3% | |
Health Care Equipment & Supplies | | | 3.3% | |
Biotechnology | | | 3.0% | |
Short-Term Investments | | | 5.5% | |
Other | | | 17.2% | |
| 1 | As a percentage of total investments (excluding short-term investments) as of March 31, 2012. Holdings are subject to change. |
| 2 | As a percentage of total investments as of March 31, 2012. Holdings are subject to change. |
Expense Examples
As a shareholder of one or more of the Funds, you incur two types of costs: (1) transaction costs, including up-front and back-end sales charges (loads) or redemption fees, where applicable; and (2) ongoing costs, including management fees; distribution and service (12b-1) fees, where applicable; and other Fund expenses. The Examples below are intended to help you understand your ongoing costs (in dollars) of investing in the Funds and to compare these costs with the ongoing costs of investing in other mutual funds.
The Examples below are based on an investment of $1,000 invested at the beginning of the period and held for the period.
The information under “Actual Performance,” together with the amount you invested, allows you to estimate actual expenses incurred over the reporting period. Simply divide your account value by $1,000 (for example, an $8,600 account value divided by $1,000 = 8.60) and multiply the result by the cost shown for your share class, in the row entitled “Expenses Incurred During Period” to estimate the expenses incurred on your account during this period.
The information under “Hypothetical Performance,” provides information about hypothetical account values and hypothetical expenses based on the respective Fund’s actual expense ratio and an assumed rate of return of 5% per year before expenses, which is not the Fund’s actual return. The hypothetical account values and expenses may not be used to estimate the actual ending account balance or expense you incurred for the period. You may use this information to compare the ongoing costs of investing in the Fund and other Funds. To do so, compare this 5% hypothetical example with the 5% hypothetical examples that appear in the shareholder reports of the other funds.
Please note that the expenses shown in the table are meant to highlight your ongoing costs only and do not reflect any transaction costs. Therefore, the hypothetical information is useful in comparing ongoing costs only, and will not help you determine the relative total costs of owning different funds or share classes. In addition, if these transaction costs were included, your costs would have been higher.
Nuveen Symphony Credit Opportunities Fund
| | | | | | | | | | | | | | | | | | | | | | | | | | | | | | | | | | |
| | | | | | | | | | | | | | | | | Hypothetical Performance | |
| | | Actual Performance | | | | | (5% annualized return before expenses) | |
| | | A Shares | | | C Shares | | | R3 Shares | | | I Shares | | | | | A Shares | | | C Shares | | | R3 Shares | | | I Shares | |
| Beginning Account Value (10/01/11) | | $ | 1,000.00 | | | $ | 1,000.00 | | | $ | 1,000.00 | | | $ | 1,000.00 | | | | | $ | 1,000.00 | | | $ | 1,000.00 | | | $ | 1,000.00 | | | $ | 1,000.00 | |
| Ending Account Value (3/31/12) | | $ | 1,131.90 | | | $ | 1,127.90 | | | $ | 1,130.50 | | | $ | 1,133.30 | | | | | $ | 1,019.65 | | | $ | 1,015.90 | | | $ | 1,018.40 | | | $ | 1,020.90 | |
| Expenses Incurred During Period | | $ | 5.70 | | | $ | 9.68 | | | $ | 7.03 | | | $ | 4.37 | | | | | $ | 5.40 | | | $ | 9.17 | | | $ | 6.66 | | | $ | 4.14 | |
For each class of the Fund, expenses are equal to the Fund’s annualized net expense ratio of 1.07%, 1.82%, 1.32% and .82% for Classes A, C, R3 and I, respectively, multiplied by the average account value over the period, multiplied by 183/366 (to reflect the one-half year period).
Nuveen Symphony Floating Rate Income Fund
| | | | | | | | | | | | | | | | | | | | | | | | | | | | | | | | | | |
| | | | | | | | | | | | | | | | | Hypothetical Performance | |
| | | Actual Performance | | | | | (5% annualized return before expenses) | |
| | | A Shares | | | C Shares | | | R3 Shares | | | I Shares | | | | | A Shares | | | C Shares | | | R3 Shares | | | I Shares | |
| Beginning Account Value (10/01/11) | | $ | 1,000.00 | | | $ | 1,000.00 | | | $ | 1,000.00 | | | $ | 1,000.00 | | | | | $ | 1,000.00 | | | $ | 1,000.00 | | | $ | 1,000.00 | | | $ | 1,000.00 | |
| Ending Account Value (3/31/12) | | $ | 1,103.10 | | | $ | 1,099.00 | | | $ | 1,101.20 | | | $ | 1,103.90 | | | | | $ | 1,019.60 | | | $ | 1,015.85 | | | $ | 1,018.35 | | | $ | 1,020.85 | |
| Expenses Incurred During Period | | $ | 5.68 | | | $ | 9.60 | | | $ | 6.99 | | | $ | 4.37 | | | | | $ | 5.45 | | | $ | 9.22 | | | $ | 6.71 | | | $ | 4.19 | |
For each class of the Fund, expenses are equal to the Fund’s annualized net expense ratio of 1.08%, 1.83%, 1.33% and .83% for Classes A, C, R3 and I, respectively, multiplied by the average account value over the period, multiplied by 183/366 (to reflect the one-half year period).
Portfolio of Investments (Unaudited)
Nuveen Symphony Credit Opportunities Fund
March 31, 2012
| | | | | | | | | | | | | | | | | | | | |
Principal
Amount (000) | | | Description (1) | | Coupon | | | Maturity | | | Ratings (2) | | | Value | |
| | | | | | | | | | | | | | | | | | | | |
| | | | CONVERTIBLE BONDS – 1.3% | | | | | | | | | | | | | | | | |
| | | | | |
| | | | Health Care Equipment & Supplies – 0.6% | | | | | | | | | | | | | | | | |
| | | | | |
| $ | 1,000 | | | Hologic Inc. Convertible Bond | | | 2.000% | | | | 12/15/37 | | | | BB+ | | | $ | 993,750 | |
| | | | Internet Software & Services – 0.6% | | | | | | | | | | | | | | | | |
| | | | | |
| | 750 | | | Equinix Inc., Convertible Bond | | | 2.500% | | | | 4/15/12 | | | | B | | | | 1,043,438 | |
| | | | Multiline Retail – 0.1% | | | | | | | | | | | | | | | | |
| | | | | |
| | 200 | | | Saks, Inc., Convertible Bonds | | | 2.000% | | | | 3/15/24 | | | | BB | | | | 212,250 | |
| $ | 1,950 | | | Total Convertible Bonds (cost $1,888,424) | | | | | | | | | | | | | | | 2,249,438 | |
| | | | | |
Principal
Amount (000) | | | Description (1) | | Coupon | | | Maturity | | | Ratings (2) | | | Value | |
| | | | CORPORATE BONDS – 64.2% | | | | | | | | | | | | | | | | |
| | | | | |
| | | | Aerospace & Defense – 0.6% | | | | | | | | | | | | | | | | |
| | | | | |
| $ | 1,000 | | | TransDigm Inc. | | | 7.750% | | | | 12/15/18 | | | | B– | | | $ | 1,082,500 | |
| | | | Auto Components – 0.5% | | | | | | | | | | | | | | | | |
| | | | | |
| | 250 | | | Goodyear Tire & Rubber Company | | | 7.000% | | | | 5/15/22 | | | | B+ | | | | 243,125 | |
| | | | | |
| | 500 | | | Tenneco Inc. | | | 7.750% | | | | 8/15/18 | | | | BB– | | | | 540,000 | |
| | 750 | | | Total Auto Components | | | | | | | | | | | | | | | 783,125 | |
| | | | Building Products – 1.3% | | | | | | | | | | | | | | | | |
| | | | | |
| | 2,000 | | | McJunkin Red Man Corporation | | | 9.500% | | | | 12/15/16 | | | | B– | | | | 2,180,000 | |
| | | | Chemicals – 2.0% | | | | | | | | | | | | | | | | |
| | | | | |
| | 500 | | | Ferro Corporation | | | 7.875% | | | | 8/15/18 | | | | B+ | | | | 510,000 | |
| | | | | |
| | 200 | | | Hexion US Finance Corporation | | | 8.875% | | | | 2/01/18 | | | | B3 | | | | 207,000 | |
| | | | | |
| | 1,600 | | | Ineos Finance PLC, 144A | | | 8.375% | | | | 2/15/19 | | | | Ba3 | | | | 1,692,000 | |
| | | | | |
| | 250 | | | LyondellBasell Industries NV, 144A | | | 6.000% | | | | 11/15/21 | | | | BB+ | | | | 262,500 | |
| | | | | |
| | 200 | | | Phibro Animal Health Corporation, 144A | | | 9.250% | | | | 7/01/18 | | | | B– | | | | 198,500 | |
| | | | | |
| | 500 | | | PolyOne Corporation | | | 7.375% | | | | 9/15/20 | | | | Baa3 | | | | 530,000 | |
| | 3,250 | | | Total Chemicals | | | | | | | | | | | | | | | 3,400,000 | |
| | | | Commercial Services & Supplies – 0.8% | | | | | | | | | | | | | | | | |
| | | | | |
| | 300 | | | Ceridian Corporation | | | 12.250% | | | | 11/15/15 | | | | CCC | | | | 270,750 | |
| | | | | |
| | 1,000 | | | International Lease Finance Corporation | | | 4.875% | | | | 4/01/15 | | | | BBB– | | | | 989,804 | |
| | 1,300 | | | Total Commercial Services & Supplies | | | | | | | | | | | | | | | 1,260,554 | |
| | | | Communications Equipment – 2.8% | | | | | | | | | | | | | | | | |
| | | | | |
| | 1,700 | | | Avaya Inc. | | | 10.125% | | | | 11/01/15 | | | | CCC+ | | | | 1,683,000 | |
| | | | | |
| | 1,000 | | | Avaya Inc. | | | 9.750% | | | | 11/01/15 | | | | CCC+ | | | | 985,000 | |
| | | | | |
| | 2,000 | | | Nortel Networks Limited, (3) | | | 0.000% | | | | 7/15/13 | | | | N/R | | | | 2,100,000 | |
| | 4,700 | | | Total Communications Equipment | | | | | | | | | | | | | | | 4,768,000 | |
| | | | Computers & Peripherals – 0.5% | | | | | | | | | | | | | | | | |
| | | | | |
| | 800 | | | Seagate HDD Cayman, 144A | | | 7.750% | | | | 12/15/18 | | | | BB+ | | | | 876,000 | |
| | | | Consumer Finance – 0.3% | | | | | | | | | | | | | | | | |
| | | | | |
| | 500 | | | Ally Financial Inc. | | | 7.500% | | | | 9/15/20 | | | | BB– | | | | 540,000 | |
| | | | Containers & Packaging – 1.8% | | | | | | | | | | | | | | | | |
| | | | | |
| | 1,000 | | | Ardagh Packaging Finance PLC, 144A | | | 7.375% | | | | 10/15/17 | | | | BB– | | | | 1,072,500 | |
| | | | | |
| | 500 | | | Reynolds Group, 144A | | | 6.875% | | | | 2/15/21 | | | | BB– | | | | 517,500 | |
| | | | | |
| | 1,400 | | | Reynolds Group | | | 7.875% | | | | 8/15/19 | | | | BB– | | | | 1,505,000 | |
| | 2,900 | | | Total Containers & Packaging | | | | | | | | | | | | | | | 3,095,000 | |
Portfolio of Investments (Unaudited)
Nuveen Symphony Credit Opportunities Fund (continued)
March 31, 2012
| | | | | | | | | | | | | | | | | | | | |
Principal
Amount (000) | | | Description (1) | | Coupon | | | Maturity | | | Ratings (2) | | | Value | |
| | | | | | | | | | | | | | | | | | | | |
| | | | Diversified Consumer Services – 0.6% | | | | | | | | | | | | | | | | |
| | | | | |
| $ | 1,000 | | | Servicemaster Company, 144A | | | 8.000% | | | | 2/15/20 | | | | B– | | | $ | 1,065,000 | |
| | | | Diversified Financial Services – 0.6% | | | | | | | | | | | | | | | | |
| | | | | |
| | 1,000 | | | Charter Communications, CCO Holdings LLC | | | 7.375% | | | | 6/01/20 | | | | BB– | | | | 1,085,000 | |
| | | | Diversified Telecommunication Services – 4.2% | | | | | | | | | | | | | | | | |
| | | | | |
| | 1,500 | | | Cincinnati Bell Inc. | | | 8.375% | | | | 10/15/20 | | | | B1 | | | | 1,507,500 | |
| | | | | |
| | 130 | | | Insight Communications, 144A | | | 9.380% | | | | 7/15/2018 | | | | B– | | | | 148,525 | |
| | | | | |
| | 1,000 | | | IntelSat Jackson Holdings, 144A | | | 7.250% | | | | 4/01/19 | | | | B | | | | 1,051,250 | |
| | | | | |
| | 1,000 | | | IntelSat Jackson Holdings, 144A | | | 7.500% | | | | 4/01/21 | | | | B | | | | 1,051,250 | |
| | | | | |
| | 2,000 | | | Level 3 Financing Inc., 144A | | | 8.625% | | | | 7/15/20 | | | | BB– | | | | 2,100,000 | |
| | | | | |
| | 250 | | | Windstream Corporation | | | 8.125% | | | | 9/01/18 | | | | BB+ | | | | 267,500 | |
| | | | | |
| | 1,000 | | | Windstream Corporation | | | 7.500% | | | | 4/01/23 | | | | BB+ | | | | 1,030,000 | |
| | 6,880 | | | Total Diversified Telecommunication Services | | | | | | | | | | | | | | | 7,156,025 | |
| | | | Electric Utilities – 1.3% | | | | | | | | | | | | | | | | |
| | | | | |
| | 200 | | | Energy Future Holdings | | | 10.250% | | | | 1/15/20 | | | | B | | | | 217,000 | |
| | | | | |
| | 1,000 | | | Energy Future Intermediate Holding Company LLC, 144A | | | 11.750% | | | | 3/01/22 | | | | B | | | | 1,022,500 | |
| | | | | |
| | 800 | | | Energy Future Intermediate Holding Company LLC | | | 10.000% | | | | 12/01/20 | | | | B | | | | 872,000 | |
| | 2,000 | | | Total Electric Utilities | | | | | | | | | | | | | | | 2,111,500 | |
| | | | Energy Equipment & Services – 3.6% | | | | | | | | | | | | | | | | |
| | | | | |
| | 400 | | | Atwood Oceanics Inc. | | | 6.500% | | | | 2/01/20 | | | | BB | | | | 420,000 | |
| | | | | |
| | 2,000 | | | Hornbeck Offshore Services Inc. | | | 5.875% | | | | 4/01/20 | | | | BB– | | | | 2,005,000 | |
| | | | | |
| | 2,000 | | | Hercules Offshore LLC, (WI/DD) | | | 7.125% | | | | 4/01/17 | | | | B+ | | | | 2,002,500 | |
| | | | | |
| | 600 | | | Petroleum Geo-Services ASA, 144A | | | 7.375% | | | | 12/15/18 | | | | BB | | | | 624,000 | |
| | | | | |
| | 1,000 | | | Trinidad Drilling Limited, 144A | | | 7.875% | | | | 1/15/19 | | | | BB– | | | | 1,063,750 | |
| | 6,000 | | | Total Energy Equipment & Services | | | | | | | | | | | | | | | 6,115,250 | |
| | | | Food & Staples Retailing – 0.3% | | | | | | | | | | | | | | | | |
| | | | | |
| | 500 | | | Rite Aid Corporation | | | 8.000% | | | | 8/15/20 | | | | BB– | | | | 575,625 | |
| | | | Food Products – 1.5% | | | | | | | | | | | | | | | | |
| | | | | |
| | 1,000 | | | Del Monte Corporation | | | 7.625% | | | | 2/15/19 | | | | CCC+ | | | | 995,000 | |
| | | | | |
| | 1,500 | | | JBS USA LLC, 144A | | | 8.250% | | | | 2/01/20 | | | | BB | | | | 1,541,250 | |
| | 2,500 | | | Total Food Products | | | | | | | | | | | | | | | 2,536,250 | |
| | | | Gas Utilities – 1.2% | | | | | | | | | | | | | | | | |
| | | | | |
| | 2,000 | | | AmeriGas Finance LLC | | | 7.000% | | | | 5/20/22 | | | | BB | | | | 2,040,000 | |
| | | | Health Care Equipment & Supplies – 1.6% | | | | | | | | | | | | | | | | |
| | | | | |
| | 500 | | | Apria Healthcare Group Inc. | | | 12.375% | | | | 11/01/14 | | | | BB– | | | | 498,750 | |
| | | | | |
| | 400 | | | Beagle Acquisition Corporation, 144A | | | 11.000% | | | | 12/31/19 | | | | CCC+ | | | | 452,000 | |
| | | | | |
| | 1,000 | | | Biomet Inc. | | | 11.625% | | | | 10/15/17 | | | | B– | | | | 1,081,250 | |
| | | | | |
| | 600 | | | Chiron Merger Sub Inc., 144A | | | 10.500% | | | | 11/01/18 | | | | B | | | | 623,250 | |
| | 2,500 | | | Total Health Care Equipment & Supplies | | | | | | | | | | | | | | | 2,655,250 | |
| | | | Health Care Providers & Services – 2.9% | | | | | | | | | | | | | | | | |
| | | | | |
| | 1,000 | | | Aviv Healthcare Properties LP | | | 7.750% | | | | 2/15/19 | | | | B+ | | | | 1,027,500 | |
| | | | | |
| | 200 | | | Capella Healthcare Inc., 144A | | | 9.250% | | | | 7/01/17 | | | | B | | | | 205,000 | |
| | | | | |
| | 1,000 | | | Fesenius Medical Care II, 144A | | | 5.875% | | | | 1/31/22 | | | | B+ | | | | 1,027,500 | |
| | | | | |
| | 2,000 | | | Vanguard Health Holding LLC/Inc. | | | 7.750% | | | | 2/01/19 | | | | B– | | | | 1,990,000 | |
| | | | | |
| | 132 | | | Select Medical Corporation | | | 7.625% | | | | 2/01/15 | | | | CCC+ | | | | 130,515 | |
| | | | | | | | | | | | | | | | | | | | |
Principal
Amount (000) | | | Description (1) | | Coupon | | | Maturity | | | Ratings (2) | | | Value | |
| | | | | | | | | | | | | | | | | | | | |
| | | | Health Care Providers & Services (continued) | | | | | | | | | | | | | | | | |
| | | | | |
| $ | 500 | | | Universal Health Services Inc. | | | 7.000% | | | | 10/01/18 | | | | B+ | | | $ | 535,000 | |
| | 4,832 | | | Total Health Care Providers & Services | | | | | | | | | | | | | | | 4,915,515 | |
| | | | Health Care Technology – 0.3% | | | | | | | | | | | | | | | | |
| | | | | |
| | 500 | | | MedAssets Inc., 144A | | | 8.000% | | | | 11/15/18 | | | | B | | | | 525,000 | |
| | | | Hotels, Restaurants & Leisure – 4.1% | | | | | | | | | | | | | | | | |
| | | | | |
| | 500 | | | Harrah’s Operating Company, Inc., 144A | | | 5.625% | | | | 6/01/15 | | | | CCC | | | | 382,500 | |
| | | | | |
| | 200 | | | Harrah’s Operating Company, Inc. | | | 11.250% | | | | 6/01/17 | | | | B | | | | 218,000 | |
| | | | | |
| | 1,200 | | | MGM Resorts International Inc., 144A | | | 8.625% | | | | 2/01/19 | | | | B– | | | | 1,287,000 | |
| | | | | |
| | 1,200 | | | MGM Resorts International Inc. | | | 7.750% | | | | 3/15/22 | | | | B– | | | | 1,221,000 | |
| | | | | |
| | 200 | | | Pinnacle Entertainment Inc. | | | 8.750% | | | | 5/15/20 | | | | B | | | | 218,500 | |
| | | | | |
| | 2,000 | | | Pinnacle Entertainment Inc. | | | 7.750% | | | | 4/01/22 | | | | B3 | | | | 2,095,000 | |
| | | | | |
| | 500 | | | Scientific Games Corporation | | | 8.125% | | | | 9/15/18 | | | | BB– | | | | 544,375 | |
| | | | | |
| | 1,000 | | | Seven Seas Cruises S de RL LLC, 144A | | | 9.125% | | | | 5/15/19 | | | | B– | | | | 1,015,000 | |
| | 6,800 | | | Total Hotels, Restaurants & Leisure | | | | | | | | | | | | | | | 6,981,375 | |
| | | | Household Products – 0.8% | | | | | | | | | | | | | | | | |
| | | | | |
| | 200 | | | Central Garden & Pet Compa | | | 8.250% | | | | 3/01/18 | | | | B | | | | 206,250 | |
| | | | | |
| | 1,000 | | | Sprectum Brands Inc. | | | 9.500% | | | | 6/15/18 | | | | BB– | | | | 1,127,500 | |
| | 1,200 | | | Total Household Products | | | | | | | | | | | | | | | 1,333,750 | |
| | | | Independent Power Producers & Energy Traders – 1.4% | | | | | | | | | | | | | | | | |
| | | | | |
| | 400 | | | Calpine Corporation, 144A | | | 7.875% | | | | 7/31/20 | | | | BB | | | | 435,000 | |
| | | | | |
| | 1,000 | | | NRG Energy Inc. | | | 7.625% | | | | 1/15/18 | | | | BB | | | | 1,002,500 | |
| | | | | |
| | 1,000 | | | NRG Energy Inc. | | | 7.875% | | | | 5/15/21 | | | | N/R | | | | 960,000 | |
| | 2,400 | �� | | Total Independent Power Producers & Energy Traders | | | | | | | | | | | | | | | 2,397,500 | |
| | | | Industrial Conglomerates – 1.2% | | | | | | | | | | | | | | | | |
| | | | | |
| | 2,000 | | | J.B. Poindexter & Company, 144A, (WI/DD) | | | 9.000% | | | | 4/01/22 | | | | B | | | | 2,057,500 | |
| | | | Internet & Catalog Retail – 0.1% | | | | | | | | | | | | | | | | |
| | | | | |
| | 250 | | | Travelport LLC | | | 9.875% | | | | 9/01/14 | | | | CCC+ | | | | 158,125 | |
| | | | IT Services – 2.1% | | | | | | | | | | | | | | | | |
| | | | | |
| | 3,000 | | | First Data Corporation, 144A | | | 7.375% | | | | 6/15/19 | | | | BB– | | | | 3,056,250 | |
| | | | | |
| | 450 | | | Sterling Merger Inc. | | | 11.000% | | | | 10/01/19 | | | | CCC+ | | | | 474,750 | |
| | 3,450 | | | Total IT Services | | | | | | | | | | | | | | | 3,531,000 | |
| | | | Leisure Equipment & Products – 0.3% | | | | | | | | | | | | | | | | |
| | | | | |
| | 500 | | | The Academy Limited Finance, 144A | | | 9.250% | | | | 8/01/19 | | | | Caa1 | | | | 513,125 | |
| | | | Machinery – 2.1% | | | | | | | | | | | | | | | | |
| | | | | |
| | 1,500 | | | NES Rental Holdings Inc., 144A | | | 12.250% | | | | 4/15/15 | | | | CCC+ | | | | 1,402,500 | |
| | | | | |
| | 1,000 | | | Schaeffler Finance BV, 144A | | | 7.750% | | | | 2/15/17 | | | | B1 | | | | 1,057,500 | |
| | | | | |
| | 1,000 | | | Schaeffler Finance BV, 144A | | | 8.500% | | | | 2/15/19 | | | | B1 | | | | 1,067,500 | |
| | 3,500 | | | Total Machinery | | | | | | | | | | | | | | | 3,527,500 | |
| | | | Media – 5.8% | | | | | | | | | | | | | | | | |
| | | | | |
| | 1,000 | | | Charter Communications, CCO Holdings LLC | | | 7.000% | | | | 1/15/19 | | | | BB– | | | | 1,060,000 | |
| | | | | |
| | 1,000 | | | Charter Communications, CCO Holdings LLC | | | 6.625% | | | | 1/31/22 | | | | BB– | | | | 1,037,500 | |
| | | | | |
| | 1,000 | | | Clear Channel Communications, Inc. | | | 5.500% | | | | 9/15/14 | | | | CCC– | | | | 885,000 | |
| | | | | |
| | 1,000 | | | Clear Channel Communications, Inc. | | | 11.000% | | | | 8/01/16 | | | | CCC– | | | | 740,000 | |
| | | | | |
| | 500 | | | Clear Channel Communications, Inc. | | | 10.750% | | | | 8/01/16 | | | | CCC– | | | | 377,500 | |
Portfolio of Investments (Unaudited)
Nuveen Symphony Credit Opportunities Fund (continued)
March 31, 2012
| | | | | | | | | | | | | | | | | | | | |
Principal
Amount (000) | | | Description (1) | | Coupon | | | Maturity | | | Ratings (2) | | | Value | |
| | | | | | | | | | | | | | | | | | | | |
| | | | Media (continued) | | | | | | | | | | | | | | | | |
| | | | | |
| $ | 500 | | | Clear Channel Worldwide Holdings Inc., 144A | | | 7.625% | | | | 3/15/20 | | | | B+ | | | $ | 482,500 | |
| | | | | |
| | 1,100 | | | Clear Channel Worldwide Holdings Inc. | | | 7.625% | | | | 3/15/20 | | | | B+ | | | | 1,078,000 | |
| | | | | |
| | 400 | | | Entravision Communications Corporation | | | 8.750% | | | | 8/01/17 | | | | B1 | | | | 423,500 | |
| | | | | |
| | 500 | | | Kabel BW Erste Beteilgungs GmbH, 144A | | | 7.500% | | | | 3/15/19 | | | | B+ | | | | 540,000 | |
| | | | | |
| | 1,000 | | | Mediacom LLC, 144A | | | 7.250% | | | | 2/15/22 | | | | B | | | | 1,010,000 | |
| | | | | |
| | 500 | | | Nielsen Finance LLC Co | | | 7.750% | | | | 10/15/18 | | | | BB– | | | | 551,250 | |
| | | | | |
| | 1,000 | | | UPCB Finance Limited, 144A | | | 7.250% | | | | 11/15/21 | | | | B1 | | | | 1,057,500 | |
| | | | | |
| | 500 | | | UPCB Finance VI Limtied, 144A | | | 6.875% | | | | 1/15/22 | | | | Ba3 | | | | 516,250 | |
| | 10,000 | | | Total Media | | | | | | | | | | | | | | | 9,759,000 | |
| | | | Metals & Mining – 0.3% | | | | | | | | | | | | | | | | |
| | | | | |
| | 500 | | | Novellis Inc. | | | 8.750% | | | | 12/15/20 | | | | B | | | | 547,500 | |
| | | | Multi-Utilities – 0.1% | | | | | | | | | | | | | | | | |
| | | | | |
| | 250 | | | Bon-Ton Department Stores Inc. | | | 10.250% | | | | 3/15/14 | | | | CCC+ | | | | 218,125 | |
| | | | Oil, Gas, & Consumable Fuels – 7.2% | | | | | | | | | | | | | | | | |
| | | | | |
| | 500 | | | Breitburn Energy Partners LP, 144A | | | 7.875% | | | | 4/15/22 | | | | B | | | | 510,000 | |
| | | | | |
| | 1,000 | | | Calumet Specialty Products, 144A | | | 9.375% | | | | 5/01/19 | | | | B | | | | 1,040,000 | |
| | | | | |
| | 200 | | | Chaparral Energy Inc. | | | 8.875% | | | | 2/01/17 | | | | B– | | | | 209,000 | |
| | | | | |
| | 500 | | | Chespeake Midstream Partners LP, 144A | | | 6.125% | | | | 7/15/22 | | | | BB | | | | 503,750 | |
| | | | | |
| | 600 | | | Energy XXI Gulf Coast Inc. | | | 7.750% | | | | 6/15/19 | | | | B | | | | 618,000 | |
| | | | | |
| | 1,000 | | | Genesis Energy LP, 144A | | | 7.875% | | | | 12/15/18 | | | | B | | | | 1,020,000 | |
| | | | | |
| | 2,000 | | | Linn Energy LLC Finance Corporation, 144A | | | 6.250% | | | | 11/01/19 | | | | B | | | | 1,940,000 | |
| | | | | |
| | 2,000 | | | Oasis Petroleum Inc. | | | 6.500% | | | | 11/01/21 | | | | B | | | | 2,010,000 | |
| | | | | |
| | 2,000 | | | PetroBakken Energy Limited, 144A | | | 8.625% | | | | 2/01/20 | | | | CCC+ | | | | 2,085,000 | |
| | | | | |
| | 1,200 | | | Samson Investment Company, 144A | | | 9.750% | | | | 2/15/20 | | | | B1 | | | | 1,215,000 | |
| | | | | |
| | 1,000 | | | Targa Resources Inc., 144A | | | 6.375% | | | | 8/01/22 | | | | B– | | | | 1,015,000 | |
| | 12,000 | | | Total Oil, Gas, & Consumable Fuels | | | | | | | | | | | | | | | 12,165,750 | |
| | | | Personal Products – 0.7% | | | | | | | | | | | | | | | | |
| | | | | |
| | 1,000 | | | Prestige Brands Inc. | | | 8.125% | | | | 2/01/20 | | | | B– | | | | 1,083,750 | |
| | | | Pharmaceuticals – 0.9% | | | | | | | | | | | | | | | | |
| | | | | |
| | 1,000 | | | Angiotech Pharmaceuticals Inc. | | | 5.000% | | | | 12/01/13 | | | | N/R | | | | 905,000 | |
| | | | | |
| | 500 | | | Warner Chilcott Company LLC | | | 7.750% | | | | 9/15/18 | | | | BB | | | | 521,250 | |
| | 1,500 | | | Total Pharmaceuticals | | | | | | | | | | | | | | | 1,426,250 | |
| | | | Road & Rail – 1.1% | | | | | | | | | | | | | | | | |
| | | | | |
| | 1,000 | | | Avis Budget Car Rental | | | 8.250% | | | | 1/15/19 | | | | B+ | | | | 1,042,500 | |
| | | | | |
| | 200 | | | Florida East Railway Corporation, 144A | | | 8.125% | | | | 2/01/17 | | | | B– | | | | 204,000 | |
| | | | | |
| | 500 | | | Swift Services Holdings Inc. | | | 10.000% | | | | 11/15/18 | | | | B | | | | 544,375 | |
| | 1,700 | | | Total Road & Rail | | | | | | | | | | | | | | | 1,790,875 | |
| | | | Software – 1.0% | | | | | | | | | | | | | | | | |
| | | | | |
| | 750 | | | Lawson Software Inc., (WI/DD) | | | 9.375% | | | | 4/01/19 | | | | B– | | | | 776,250 | |
| | | | | |
| | 850 | | | SoftBrands Inc/Atlantis, 144A | | | 11.500% | | | | 7/15/18 | | | | B– | | | | 939,250 | |
| | 1,600 | | | Total Software | | | | | | | | | | | | | | | 1,715,500 | |
| | | | Specialty Retail – 1.7% | | | | | | | | | | | | | | | | |
| | | | | |
| | 2,000 | | | Claires Stores, Inc., 144A | | | 9.000% | | | | 3/15/19 | | | | B | | | | 2,067,500 | |
| | | | | | | | | | | | | | | | | | | | |
Principal
Amount (000) | | | Description (1) | | Coupon | | | Maturity | | | Ratings (2) | | | Value | |
| | | | | | | | | | | | | | | | | | | | |
| | | | Specialty Retail (continued) | | | | | | | | | | | | | | | | |
| | | | | |
| $ | 1,000 | | | Claires Stores, Inc. | | | 10.500% | | | | 6/01/17 | | | | CCC | | | $ | 790,000 | |
| | 3,000 | | | Total Specialty Retail | | | | | | | | | | | | | | | 2,857,500 | |
| | | | Textiles Apparel & Luxury Goods – 0.8% | | | | | | | | | | | | | | | | |
| | | | | |
| | 1,000 | | | Perry Ellis International | | | 7.875% | | | | 4/01/19 | | | | B+ | | | | 995,000 | |
| | | | | |
| | 250 | | | Polymer Group Inc., 144A | | | 7.750% | | | | 2/01/19 | | | | B1 | | | | 263,125 | |
| | 1,250 | | | Total Textiles Apparel & Luxury Goods | | | | | | | | | | | | | | | 1,258,125 | |
| | | | Trading Cos & Distributors – 3.1% | | | | | | | | | | | | | | | | |
| | | | | |
| | 2,000 | | | Rexel SA, 144A | | | 6.125% | | | | 12/15/19 | | | | BB | | | | 2,025,000 | |
| | | | | |
| | 2,000 | | | United Rental Financing Escrow Corporation, 144A | | | 5.750% | | | | 7/15/18 | | | | BB– | | | | 2,047,500 | |
| | | | | |
| | 1,200 | | | United Rental Financing Escrow Corporation, 144A | | | 7.375% | | | | 5/15/20 | | | | B | | | | 1,227,000 | |
| | 5,200 | | | Total Trading Cos & Distributors | | | | | | | | | | | | | | | 5,299,500 | |
| | | | Wireless Telecommunication Services – 0.7% | | | | | | | | | | | | | | | | |
| | | | | |
| | 1,000 | | | Syniverse Holdings Inc. | | | 9.125% | | | | 1/15/19 | | | | B– | | | | 1,102,500 | |
| $ | 106,012 | | | Total Corporate Bonds (cost $104,936,478) | | | | | | | | | | | | | | | 108,489,844 | |
| | | | | |
Principal
Amount (000) | | | Description (1) | | Weighted
Average
Coupon | | | Maturity (4) | | | Ratings (2) | | | Value | |
| | | | VARIABLE RATE SENIOR LOAN INTERESTS – 25.0% (5) | | | | | | | | | | | | | | | | |
| | | | | |
| | | | Airlines – 0.1% | | | | | | | | | | | | | | | | |
| | | | | |
| $ | 243 | | | United Air Lines, Inc., Term Loan B | | | 2.250% | | | | 2/01/14 | | | | BB– | | | $ | 236,052 | |
| | | | Biotechnology – 0.2% | | | | | | | | | | | | | | | | |
| | | | | |
| | 298 | | | Grifols, Inc., Term Loan | | | 4.500% | | | | 6/01/17 | | | | BB | | | | 297,627 | |
| | | | Chemicals – 1.4% | | | | | | | | | | | | | | | | |
| | | | | |
| | 435 | | | Ashland, Inc., Term Loan | | | 3.750% | | | | 8/23/18 | | | | Baa3 | | | | 435,904 | |
| | | | | |
| | 1,000 | | | Styron S.a.r.l. Corporation, Term Loan, (WI/DD) | | | TBD | | | | TBD | | | | B+ | | | | 915,919 | |
| | | | | |
| | 107 | | | Tronox, Inc., Delayed Term Loan, (6) | | | 0.500% | | | | 2/08/18 | | | | BB+ | | | | 107,210 | |
| | | | | |
| | 393 | | | Tronox, Inc., Term Loan B, First Lien | | | 4.250% | | | | 2/03/18 | | | | BB+ | | | | 393,594 | |
| | | | | |
| | 494 | | | Univar, Inc., Term Loan | | | 5.000% | | | | 6/30/17 | | | | B+ | | | | 495,448 | |
| | 2,429 | | | Total Chemicals | | | | | | | | | | | | | | | 2,348,075 | |
| | | | Communications Equipment – 1.0% | | | | | | | | | | | | | | | | |
| | | | | |
| | 1,232 | | | Avaya, Inc., Term Loan | | | 3.241% | | | | 10/27/14 | | | | B1 | | | | 1,195,646 | |
| | | | | |
| | 500 | | | Genesys International Corporation, Term Loan B | | | 6.750% | | | | 1/31/19 | | | | BB– | | | | 504,812 | |
| | 1,732 | | | Total Communications Equipment | | | | | | | | | | | | | | | 1,700,458 | |
| | | | Construction Materials – 0.6% | | | | | | | | | | | | | | | | |
| | | | | |
| | 955 | | | Schaeffler AG, Term Loan C2, First Lien, (WI/DD) | | | TBD | | | | TBD | | | | B1 | | | | 960,611 | |
| | | | Consumer Finance – 0.2% | | | | | | | | | | | | | | | | |
| | | | | |
| | 375 | | | Springleaf Financial Funding Company, Term Loan | | | 5.500% | | | | 5/10/17 | | | | B2 | | | | 346,172 | |
| | | | Containers & Packaging – 0.9% | | | | | | | | | | | | | | | | |
| | | | | |
| | 853 | | | Reynolds Group Holdings, Inc., Add on Term Loan | | | 6.500% | | | | 8/09/18 | | | | BB– | | | | 864,941 | |
| | | | | |
| | 616 | | | Sealed Air Corporation, Term Loan | | | 4.750% | | | | 10/03/18 | | | | Ba1 | | | | 623,400 | |
| | 1,469 | | | Total Containers & Packaging | | | | | | | | | | | | | | | 1,488,341 | |
| | | | Food & Staples Retailing – 1.7% | | | | | | | | | | | | | | | | |
| | | | | |
| | 500 | | | Roundy’s Supermarkets, Inc., Term Loan B, First Lien | | | 5.750% | | | | 2/10/19 | | | | BB– | | | | 503,750 | |
| | | | | |
| | 2,469 | | | U.S. Foodservice, Inc., Term Loan | | | 2.740% | | | | 7/03/14 | | | | B | | | | 2,387,383 | |
| | 2,969 | | | Total Food & Staples Retailing | | | | | | | | | | | | | | | 2,891,133 | |
Portfolio of Investments (Unaudited)
Nuveen Symphony Credit Opportunities Fund (continued)
March 31, 2012
| | | | | | | | | | | | | | | | | | | | |
Principal
Amount (000) | | | Description (1) | | Weighted
Average
Coupon | | | Maturity (4) | | | Ratings (2) | | | Value | |
| | | | | | | | | | | | | | | | | | | | |
| | | | Food Products – 0.3% | | | | | | | | | | | | | | | | |
| | | | | |
| $ | 494 | | | Pierre Foods, Inc., Term Loan | | | 7.001% | | | | 9/30/16 | | | | B+ | | | $ | 494,367 | |
| | | | Health Care Equipment & Supplies – 0.6% | | | | | | | | | | | | | | | | |
| | | | | |
| | 998 | | | Chiron Merger Sub, Inc., Term Loan | | | 7.000% | | | | 5/04/18 | | | | Ba2 | | | | 1,018,775 | |
| | | | Health Care Providers & Services – 2.3% | | | | | | | | | | | | | | | | |
| | | | | |
| | 694 | | | Gentiva Health Services, Inc., Term Loan B | | | 6.500% | | | | 8/17/16 | | | | B1 | | | | 666,358 | |
| | | | | |
| | 464 | | | IASIS Healthcare LLC, Term Loan B | | | 5.000% | | | | 5/03/18 | | | | Ba3 | | | | 464,635 | |
| | | | | |
| | 455 | | | Kindred Healthcare, Term Loan | | | 5.250% | | | | 6/01/18 | | | | Ba3 | | | | 437,837 | |
| | | | | |
| | 94 | | | LifeCare Holdings, Inc., Term Loan Add On | | | 8.327% | | | | 2/01/16 | | | | CCC– | | | | 79,792 | |
| | | | | |
| | 522 | | | LifeCare, Term Loan | | | 8.327% | | | | 2/01/16 | | | | B2 | | | | 442,317 | |
| | | | | |
| | 365 | | | MultiPlan, Inc., Term Loan B | | | 4.750% | | | | 8/26/17 | | | | Ba3 | | | | 361,888 | |
| | | | | |
| | 743 | | | National Mentor Holdings, Inc., Tranche B | | | 7.000% | | | | 2/09/17 | | | | B+ | | | | 740,180 | |
| | | | | |
| | 496 | | | Select Medical Corporation, Term Loan | | | 5.500% | | | | 6/01/18 | | | | BB– | | | | 485,084 | |
| | | | | |
| | 239 | | | Skilled Healthcare Group, Inc., Term Loan | | | 5.302% | | | | 4/09/16 | | | | B1 | | | | 235,669 | |
| | 4,072 | | | Total Health Care Providers & Services | | | | | | | | | | | | | | | 3,913,760 | |
| | | | Health Care Technology – 0.4% | | | | | | | | | | | | | | | | |
| | | | | |
| | 665 | | | Emdeon Business Services LLC, Term Loan | | | 6.750% | | | | 11/02/18 | | | | BB– | | | | 675,557 | |
| | | | Household Products – 0.0% | | | | | | | | | | | | | | | | |
| | | | | |
| | 79 | | | Visant Corporation, Term Loan | | | 5.250% | | | | 12/22/16 | | | | BB– | | | | 77,118 | |
| | | | Internet Software & Services – 1.2% | | | | | | | | | | | | | | | | |
| | | | | |
| | 630 | | | Go Daddy Operating Co., LLC, Term Loan, First Lien | | | 5.500% | | | | 12/17/18 | | | | Ba3 | | | | 632,530 | |
| | | | | |
| | 1,480 | | | Web.com, Term Loan, First Lien | | | 7.000% | | | | 10/27/17 | | | | Ba3 | | | | 1,469,629 | |
| | 2,110 | | | Total Internet Software & Services | | | | | | | | | | | | | | | 2,102,159 | |
| | | | IT Services – 3.3% | | | | | | | | | | | | | | | | |
| | | | | |
| | 488 | | | Attachmate Corporation, Term Loan | | | 6.500% | | | | 4/27/17 | | | | BB– | | | | 486,434 | |
| | | | | |
| | 153 | | | First Data Corporation, Term Loan B-1 | | | 5.242% | | | | 3/23/17 | | | | B+ | | | | 153,363 | |
| | | | | |
| | 1,162 | | | Frac Tech International LLC, Term Loan | | | 6.250% | | | | 5/06/16 | | | | B+ | | | | 1,159,503 | |
| | | | | |
| | 400 | | | Infor Global Solutions Intermediate Holdings, Ltd., Holdco PIK Term Loan, (WI/DD) | | | TBD | | | | TBD | | | | N/R | | | | 400,333 | |
| | | | | |
| | 183 | | | Infor Global Solutions Intermediate Holdings, Ltd., Second Lien Delayed Draw | | | 6.491% | | | | 3/02/14 | | | | Caa2 | | | | 183,218 | |
| | | | | |
| | 317 | | | Infor Global Solutions Intermediate Holdings, Ltd., Term Loan, Second Lien | | | 6.491% | | | | 3/02/14 | | | | Caa2 | | | | 313,974 | |
| | | | | |
| | 1,500 | | | Infor Global Solutions, Second Lien Term Loan B1, (WI/DD) | | | TBD | | | | TBD | | | | Caa2 | | | | 1,489,062 | |
| | | | | |
| | 909 | | | SRA International Inc., Term Loan | | | 6.500% | | | | 7/20/18 | | | | B1 | | | | 906,868 | |
| | | | | |
| | 458 | | | Virtu Financial LLC, First Lien Term Loan | | | 7.500% | | | | 7/08/16 | | | | BBB– | | | | 458,717 | |
| | 5,570 | | | Total IT Services | | | | | | | | | | | | | | | 5,551,472 | |
| | | | Leisure Equipment & Products – 0.9% | | | | | | | | | | | | | | | | |
| | | | | |
| | 499 | | | Academy, Ltd., Term Loan | | | 6.000% | | | | 8/03/18 | | | | B | | | | 501,605 | |
| | | | | |
| | 973 | | | Eastman Kodak Co., DIP Term Loan | | | 8.500% | | | | 7/20/13 | | | | B1 | | | | 985,524 | |
| | 1,472 | | | Total Leisure Equipment & Products | | | | | | | | | | | | | | | 1,487,129 | |
| | | | Media – 1.9% | | | | | | | | | | | | | | | | |
| | | | | |
| | 1,000 | | | Cequel Communications LLC, Term Loan | | | 4.000% | | | | 2/14/19 | | | | Ba2 | | | | 992,188 | |
| | | | | |
| | 698 | | | Cumulus Media, Inc., Term Loan, First Lien | | | 5.750% | | | | 9/17/18 | | | | Ba2 | | | | 701,202 | |
| | | | | |
| | 350 | | | Cumulus Media, Inc., Term Loan | | | 7.500% | | | | 3/18/19 | | | | B2 | | | | 355,799 | |
| | | | | |
| | 500 | | | Kabel Deutschland GmbH, Term Loan F | | | 4.250% | | | | 1/20/19 | | | | Ba2 | | | | 499,792 | |
| | | | | |
| | 1,000 | | | Tribune Company, Term Loan B, (3) | | | 0.000% | | | | 6/04/14 | | | | Ca | | | | 661,250 | |
| | 3,548 | | | Total Media | | | | | | | | | | | | | | | 3,210,231 | |
| | | | | | | | | | | | | | | | | | | | |
Principal
Amount (000) | | | Description (1) | | Weighted
Average
Coupon | | | Maturity (4) | | | Ratings (2) | | | Value | |
| | | | | | | | | | | | | | | | | | | | |
| | | | Metals & Mining – 0.6% | | | | | | | | | | | | | | | | |
| | | | | |
| $ | 1,000 | | | Noranda Aluminum Acquisition Holding Corp., Term Loan B | | | 5.750% | | | | 2/24/19 | | | | Ba2 | | | $ | 1,008,750 | |
| | | | Multiline Retail – 0.8% | | | | | | | | | | | | | | | | |
| | | | | |
| | 1,281 | | | 99 Cents Only Store, Term Loan B | | | 7.750% | | | | 1/11/19 | | | | B+ | | | | 1,306,898 | |
| | | | Oil, Gas, & Consumable Fuels – 0.9% | | | | | | | | | | | | | | | | |
| | | | | |
| | 509 | | | Western Refining, Inc., Term Loan | | | 7.500% | | | | 3/15/17 | | | | B+ | | | | 515,560 | |
| | | | | |
| | 998 | | | CCS Income Trust, Delayed Term Loan | | | 3.241% | | | | 11/14/14 | | | | B | | | | 968,662 | |
| | 1,507 | | | Total Oil, Gas, & Consumable Fuels | | | | | | | | | | | | | | | 1,484,222 | |
| | | | Personal Products – 0.3% | | | | | | | | | | | | | | | | |
| | | | | |
| | 481 | | | Prestige Brands, Inc., Term Loan 1 | | | 5.297% | | | | 1/27/19 | | | | BB– | | | | 484,819 | |
| | | | Pharmaceuticals – 0.9% | | | | | | | | | | | | | | | | |
| | | | | |
| | 277 | | | ConvaTec Healthcare, Term Loan | | | 5.750% | | | | 12/30/16 | | | | Ba3 | | | | 275,809 | |
| | | | | |
| | 56 | | | Graceway Pharmaceuticals LLC, Term Loan, (3) | | | 0.000% | | | | 5/03/12 | | | | N/R | | | | 44,529 | |
| | | | | |
| | 499 | | | Pharmaceutical Product Development, Inc., Term Loan | | | 6.250% | | | | 12/05/18 | | | | BB– | | | | 505,348 | |
| | | | | |
| | 794 | | | Quintiles Transnational Corporation, Term Loan B | | | 5.000% | | | | 6/08/18 | | | | BB– | | | | 796,978 | |
| | 1,626 | | | Total Pharmaceuticals | | | | | | | | | | | | | | | 1,622,664 | |
| | | | Real Estate Management & Development – 0.5% | | | | | | | | | | | | | | | | |
| | | | | |
| | 467 | | | Capital Automotive LP, Tranche B | | | 5.250% | | | | 3/11/17 | | | | Ba3 | | | | 462,836 | |
| | | | | |
| | 405 | | | LNR Property Corporation, Term Loan | | | 4.750% | | | | 4/29/16 | | | | BB+ | | | | 405,699 | |
| | 872 | | | Total Real Estate Management & Development | | | | | | | | | | | | | | | 868,535 | |
| | | | Road & Rail – 0.3% | | | | | | | | | | | | | | | | |
| | | | | |
| | 443 | | | Swift Transportation Company, Inc., Term Loan, Tranche B2 | | | 5.000% | | | | 12/15/17 | | | | BB | | | | 446,461 | |
| | | | Software – 2.1% | | | | | | | | | | | | | | | | |
| | | | | |
| | 998 | | | BlackBoard, Inc., Term Loan, First Lien | | | 7.500% | | | | 9/23/18 | | | | B+ | | | | 994,227 | |
| | | | | |
| | 451 | | | Datatel Parent Corp, Term Loan B | | | 6.250% | | | | 7/19/18 | | | | B+ | | | | 458,891 | |
| | | | | |
| | 1,181 | | | Infor Enterprise Applications, Term Loan, (WI/DD) | | | TBD | | | | TBD | | | | Ba3 | | | | 1,169,438 | |
| | | | | |
| | 995 | | | Softbrands, Inc., and Lawson Software, Inc., Term Loan | | | 6.750% | | | | 7/05/17 | | | | Ba3 | | | | 997,238 | |
| | 3,625 | | | Total Software | | | | | | | | | | | | | | | 3,619,794 | |
| | | | Specialty Retail – 1.4% | | | | | | | | | | | | | | | | |
| | | | | |
| | 1,249 | | | Toys “R” Us - Delaware Inc., Term Loan | | | 5.250% | | | | 5/17/18 | | | | B+ | | | | 1,244,621 | |
| | | | | |
| | 239 | | | Burlington Coat Factory Warehouse Corporation, Term Loan B | | | 6.250% | | | | 2/23/17 | | | | B– | | | | 240,710 | |
| | | | | |
| | 446 | | | Jo-Ann Stores, Inc., Term Loan | | | 4.750% | | | | 3/16/18 | | | | B+ | | | | 443,450 | |
| | | | | |
| | 375 | | | Lord & Taylor Holdings LLC, Term Loan | | | 5.750% | | | | 12/21/18 | | | | BB | | | | 377,656 | |
| | 2,309 | | | Total Specialty Retail | | | | | | | | | | | | | | | 2,306,437 | |
| | | | Wireless Telecommunication Services – 0.2% | | | | | | | | | | | | | | | | |
| | | | | |
| | 474 | | | Clear Channel Communications, Inc., Tranche B, Term Loan | | | 3.891% | | | | 1/29/16 | | | | CCC+ | | | | 385,888 | |
| $ | 43,096 | | | Total Variable Rate Senior Loan Interests (cost $41,461,631) | | | | | | | | | | | | | | | 42,333,505 | |
Portfolio of Investments (Unaudited)
Nuveen Symphony Credit Opportunities Fund (continued)
March 31, 2012
| | | | | | | | | | | | | | | | | | |
Principal
Amount (000) | | | Description (1) | | Coupon | | | Maturity | | | | | Value | |
| | | | | | | | | | | | | | | | | | |
| | | | SHORT-TERM INVESTMENTS – 10.3% | | | | | | | | | | | | | | |
| | | | | |
| $ | 17,331 | | | Repurchase Agreement with State Street Bank, dated 3/30/12,
repurchase price $17,330,914, collateralized by $17,705,000 U.S.
Treasury Notes, 4.250%, due 8/15/15, value $17,678,301 | | | 0.010% | | | | 4/02/12 | | | | | $ | 17,330,900 | |
| | | | Total Short-Term Investments (cost $17,330,900) | | | | | | | | | | | | | 17,330,900 | |
| | | | Total Investments (cost $165,617,433) – 100.8% | | | | | | | | | | | | | 170,403,687 | |
| | | | Other Assets Less Liabilities – (0.8)% | | | | | | | | | | | | | (1,333,788) | |
| | | | Net Assets – 100% | | | | | | | | | | | | $ | 169,069,899 | |
| | | | For Fund portfolio compliance purposes, the Fund’s industry classifications refer to any one or more of the industry subclassifications used by one or more widely recognized market indexes or ratings group indexes, and/or as defined by Fund management. This definition may not apply for purposes of this report, which may combine industry sub-classifications into sectors for reporting ease. |
| | (1) | | All percentages shown in the Portfolio of Investments are based on net assets. |
| | (2) | | Ratings: Using the highest of Standard & Poor’s Group (“Standard & Poor’s”), Moody’s Investors Service, Inc. (“Moody’s”) or Fitch, Inc. (“Fitch”) rating. Ratings below BBB by Standard & Poor’s, Baa by Moody’s or BBB by Fitch are considered to be below investment grade. Holdings designated N/R are not rated by any of these national rating agencies. |
| | (3) | | At or subsequent to the end of the reporting period, this security is non-income producing. Non-income producing security, in the case of a bond or senior loan, generally denotes that the issuer has (1) defaulted on the payment of principal or interest, (2) is under the protection of the Federal Bankruptcy Court or (3) the Fund’s Adviser has concluded that the issue is not likely to meet its future interest payment obligations and has directed the Fund’s custodian to cease accruing additional income on the Fund’s records. |
| | (4) | | Senior Loans generally are subject to mandatory and/or optional prepayment. Because of these mandatory prepayment conditions and because there may be significant economic incentives for a borrower to prepay, prepayments of Senior Loans may occur. As a result, the actual remaining maturity of Senior Loans held may be substantially less than the stated maturities shown. |
| | (5) | | Senior Loans generally pay interest at rates which are periodically adjusted by reference to a base short-term, floating lending rate plus an assigned fixed rate. These floating lending rates are generally (i) the lending rate referenced by the London Inter-Bank Offered Rate (“LIBOR”), or (ii) the prime rate offered by one or more major United States banks. |
| | | | Senior Loans may be considered restricted in that the Fund ordinarily is contractually obligated to receive approval from the Agent Bank and/or borrower prior to the disposition of a Senior Loan. |
| | (6) | | Investment, or portion of investment, represents an unfunded Senior Loan commitment outstanding at March 31, 2012. |
| | WI/DD | | Purchased on a when-issued or delayed delivery basis. |
| | 144A | | Investment is exempt from registration under Rule 144A of the Securities Act of 1933, as amended. These investments may only be resold in transactions exempt from registration, which are normally those transactions with qualified institutional buyers. |
| | TBD | | Senior Loan purchased on a when-issued or delayed-delivery basis. Certain details associated with this purchase are not known prior to the settlement date of the transaction. In addition, Senior Loans typically trade without accrued interest and therefore a weighted average coupon rate is not available prior to settlement. At settlement, if still unknown, the borrower or counterparty will provide the Fund with the final weighted average coupon rate and maturity date. |
See accompanying notes to financial statements.
Portfolio of Investments (Unaudited)
Nuveen Symphony Floating Rate Income Fund
March 31, 2012
| | | | | | | | | | | | | | | | | | | | |
Principal
Amount (000) | | | Description (1) | | Coupon | | | Maturity | | | Ratings (2) | | | Value | |
| | | | | | | | | | | | | | | | | | | | |
| | | | CORPORATE BONDS – 8.1% | | | | | | | | | | | | | |
| | | | |
| | | | Building Products – 1.7% | | | | | | | | | | | | | |
| | | | | |
| $ | 200 | | | McJunkin Red Man Corporation | | | 9.500% | | | | 12/15/16 | | | | B– | | | $ | 218,000 | |
| | | | Communications Equipment – 1.0% | | | | | | | | | | | | | |
| | | | | |
| | 125 | | | Avaya Inc., 144A | | | 7.000% | | | | 4/01/19 | | | | B1 | | | | 125,313 | |
| | | | Diversified Financial Services – 2.8% | | | | | | | | | | | | | |
| | | | | |
| | 350 | | | UPCB Finance III Limited, 144A | | | 6.625% | | | | 7/01/20 | | | | Ba3 | | | | 357,000 | |
| | | | IT Services – 1.6% | | | | | | | | | | | | | |
| | | | | |
| | 200 | | | First Data Corporation | | | 9.875% | | | | 9/24/15 | | | | B– | | | | 201,000 | |
| | | | Pharmaceuticals – 1.0% | | | | | | | | | | | | | |
| | | | | |
| | 125 | | | Warner Chilcott Company LLC | | | 7.750% | | | | 9/15/18 | | | | BB | | | | 130,314 | |
| $ | 1,000 | | | Total Corporate Bonds (cost $1,020,975) | | | | | | | | | | | | | | | 1,031,627 | |
| | | | | |
Principal
Amount (000) | | | Description (1) | | Weighted
Average
Coupon | | | Maturity (3) | | | Ratings (2) | | | Value | |
| | | | VARIABLE RATE SENIOR LOAN INTERESTS – 91.8% (4) | | | | | | | | | | | | | |
| | | | |
| | | | Biotechnology – 3.2% | | | | | | | | | | | | | |
| | | | | |
| $ | 208 | | | Alkermes, Inc., Term Loan, First Lien | | | 6.750% | | | | 9/16/17 | | | | BB | | | $ | 213,020 | |
| | | | | |
| | 199 | | | Onex Carestream Finance LP, Term Loan | | | 5.000% | | | | 2/25/17 | | | | BB– | | | | 195,986 | |
| | | | | |
| | 407 | | | Total Biotechnology | | | | | | | | | | | | | | | 409,006 | |
| | | | Capital Markets – 1.6% | | | | | | | | | | | | | | | | |
| | | | | |
| | 200 | | | LPL Holdings, Inc., Term Loan B, (WI/DD) | | | TBD | | | | TBD | | | | Ba2 | | | | 200,125 | |
| | | | Chemicals – 6.1% | | | | | | | | | | | | | |
| | | | | |
| | 218 | | | Ashland, Inc., Term Loan | | | 3.750% | | | | 8/23/18 | | | | Baa3 | | | | 217,952 | |
| | | | | |
| | 250 | | | Taminco Global Chemical Corporation, Term Loan | | | 6.250% | | | | 1/27/19 | | | | BB– | | | | 252,110 | |
| | | | | |
| | 64 | | | Tronox, Inc., Delayed Term Loan, (5) | | | 0.500% | | | | 2/08/18 | | | | BB+ | | | | 64,326 | |
| | | | | |
| | 236 | | | Tronox, Inc., Term Loan B, First Lien | | | 4.250% | | | | 2/03/18 | | | | BB+ | | | | 236,156 | |
| | | | | |
| | 768 | | | Total Chemicals | | | | | | | | | | | | | | | 770,544 | |
| | | | Communications Equipment – 4.6% | | | | | | | | | | | | | |
| | | | | |
| | 346 | | | Avaya, Inc., Term Loan | | | 3.241% | | | | 10/27/14 | | | | B1 | | | | 336,175 | |
| | | | | |
| | 250 | | | Genesys International Corporation, Term Loan B | | | 6.750% | | | | 1/31/19 | | | | BB- | | | | 252,406 | |
| | | | | |
| | 596 | | | Total Communications Equipment | | | | | | | | | | | | | | | 588,581 | |
| | | | Construction Materials – 1.9% | | | | | | | | | | | | | |
| | | | | |
| | 238 | | | Schaeffler AG, Term Loan C2, First Lien, (WI/DD) | | | TBD | | | | TBD | | | | B1 | | | | 239,398 | |
| | | | Containers & Packaging – 1.8% | | | | | | | | | | | | | |
| | | | | |
| | 230 | | | Reynolds Group Holdings, Inc., Add on Term Loan | | | 6.500% | | | | 8/09/18 | | | | BB– | | | | 232,869 | |
| | | | Diversified Consumer Services – 1.0% | | | | | | | | | | | | | |
| | | | | |
| | 133 | | | Laureate Education, Inc., Extended Term Loan | | | 5.250% | | | | 6/15/18 | | | | B1 | | | | 130,568 | |
| | | | Diversified Financial Services – 0.7% | | | | | | | | | | | | | |
| | | | | |
| | 93 | | | UPC Broadband Holding BV, Term Loan, Tranche AB | | | 4.750% | | | | 12/31/17 | | | | Ba3 | | | | 92,954 | |
| | | | Food & Staples Retailing – 2.2% | | | | | | | | | | | | | | | | |
| | | | | |
| | 296 | | | U.S. Foodservice, Inc., Term Loan | | | 2.740% | | | | 7/03/14 | | | | B | | | | 286,099 | |
| | | | Health Care Equipment & Supplies – 3.5% | | | | | | | | | | | | | | | | |
| | | | | |
| | 249 | | | Chiron Merger Sub, Inc., Term Loan | | | 7.000% | | | | 5/04/18 | | | | Ba2 | | | | 254,694 | |
| | | | | |
| | 29 | | | Fenwal, Inc., Delayed Term Loan | | | 2.739% | | | | 2/28/14 | | | | B | | | | 28,251 | |
| | | | | |
| | 170 | | | Fenwal, Inc., Term Loan | | | 2.739% | | | | 2/28/14 | | | | B | | | | 164,739 | |
| | | | | |
| | 448 | | | Total Health Care Equipment & Supplies | | | | | | | | | | | | | | | 447,684 | |
Portfolio of Investments (Unaudited)
Nuveen Symphony Floating Rate Income Fund (continued)
March 31, 2012
| | | | | | | | | | | | | | | | | | | | |
Principal
Amount (000) | | | Description (1) | | Weighted
Average
Coupon | | | Maturity (3) | | | Ratings (2) | | | Value | |
| | | | | | | | | | | | | | | | | | | | |
| | | | Health Care Providers & Services – 8.9% | | | | | | | | | | | | | | | | |
| | | | | |
| $ | 249 | | | Golden Living, Term Loan | | | 5.000% | | | | 5/04/18 | | | | B+ | | | $ | 236,266 | |
| | | | | |
| | 120 | | | Health Management Associates, Inc., Term Loan B | | | 4.500% | | | | 11/16/18 | | | | BB– | | | | 118,940 | |
| | | | | |
| | 283 | | | LifeCare Holdings, Inc., Term Loan Add On | | | 8.327% | | | | 2/01/16 | | | | CCC– | | | | 239,965 | |
| | | | | |
| | 249 | | | RegionalCare Hospital Partners Holdings Inc, Term Loan | | | 8.000% | | | | 11/03/18 | | | | B | | | | 252,170 | |
| | | | | |
| | 298 | | | Select Medical Corporation, Term Loan | | | 5.500% | | | | 6/01/18 | | | | BB– | | | | 291,051 | |
| | | | | |
| | 1,199 | | | Total Health Care Providers & Services | | | | | | | | | | | | | | | 1,138,392 | |
| | | | Health Care Technology – 2.7% | | | | | | | | | | | | | | | | |
| | | | | |
| | 333 | | | Emdeon Business Services LLC, Term Loan | | | 6.750% | | | | 11/02/18 | | | | BB– | | | | 337,778 | |
| | | | Hotels, Restaurants & Leisure – 1.1% | | | | | | | | | | | | | | | | |
| | | | | |
| | 150 | | | Caesars Entertainment Operating Company, Inc., Term Loan B6 | | | 5.492% | | | | 1/28/18 | | | | B | | | | 135,703 | |
| | | | Internet Software & Services – 5.7% | | | | | | | | | | | | | | | | |
| | | | | |
| | 175 | | | Sabre, Inc., Term Loan | | | 2.328% | | | | 9/30/14 | | | | B1 | | | | 164,141 | |
| | | | | |
| | 158 | | | Go Daddy Operating Co., LLC, Term Loan, First Lien | | | 5.500% | | | | 12/17/18 | | | | Ba3 | | | | 158,132 | |
| | | | | |
| | 175 | | | Sabre, Inc., Extended Term Loan, First Lien | | | 6.078% | | | | 2/28/17 | | | | B1 | | | | 166,039 | |
| | | | | |
| | 245 | | | Web.com, Term Loan, First Lien | | | 7.000% | | | | 10/27/17 | | | | Ba3 | | | | 243,574 | |
| | | | | |
| | 753 | | | Total Internet Software & Services | | | | | | | | | | | | | | | 731,886 | |
| | | | IT Services – 8.5% | | | | | | | | | | | | | | | | |
| | | | | |
| | 179 | | | First Data Corporation, Term Loan B-1 | | | 5.242% | | | | 3/23/17 | | | | B+ | | | | 170,973 | |
| | | | | |
| | 282 | | | Frac Tech International LLC, Term Loan | | | 6.250% | | | | 5/06/16 | | | | B+ | | | | 281,568 | |
| | | | | |
| | 103 | | | Infor Global Solutions Intermediate Holdings, Ltd., Extended Delayed Draw Term Loan | | | 5.970% | | | | 7/28/15 | | | | B1 | | | | 102,456 | |
| | | | | |
| | 92 | | | Infor Global Solutions Intermediate Holdings, Ltd., Second Lien Delayed Draw, (WI/DD) | | | TBD | | | | TBD | | | | Caa2 | | | | 91,609 | |
| | | | | |
| | 158 | | | Infor Global Solutions Intermediate Holdings, Ltd., Term Loan, Second Lien, (WI/DD) | | | TBD | | | | TBD | | | | Caa2 | | | | 156,987 | |
| | | | | |
| | 194 | | | Infor Global Solutions Intermediate Holdings, Ltd., Term Loan | | | 4.000% | | | | 7/21/15 | | | | B1 | | | | 192,998 | |
| | | | | |
| | 92 | | | Virtus Financial LLC, First Lien Term Loan | | | 7.500% | | | | 7/08/16 | | | | BBB– | | | | 91,743 | |
| | | | | |
| | 1,100 | | | Total IT Services | | | | | | | | | | | | | | | 1,088,334 | |
| | | | Leisure Equipment & Products – 3.9% | | | | | | | | | | | | | | | | |
| | | | | |
| | 249 | | | Academy, Ltd., Term Loan | | | 6.000% | | | | 8/03/18 | | | | B | | | | 250,803 | |
| | | | | |
| | 243 | | | Eastman Kodak Co., DIP Term Loan | | | 8.500% | | | | 7/20/13 | | | | B1 | | | | 246,381 | |
| | | | | |
| | 492 | | | Total Leisure Equipment & Products | | | | | | | | | | | | | | | 497,184 | |
| | | | Media – 3.6% | | | | | | | | | | | | | | | | |
| | | | | |
| | 213 | | | EMI Music Publishing LLC, Term Loan B, (WI/DD) | | | TBD | | | | TBD | | | | BB– | | | | 213,855 | |
| | | | | |
| | 250 | | | Kabel Deutschland GmbH, Term Loan F | | | 4.250% | | | | 1/20/19 | | | | Ba2 | | | | 249,896 | |
| | | | | |
| | 463 | | | Total Media | | | | | | | | | | | | | | | 463,751 | |
| | | | Multiline Retail – 1.1% | | | | | | | | | | | | | | | | |
| | | | | |
| | 142 | | | 99 Cents Only Store, Term Loan B | | | 7.750% | | | | 1/11/19 | | | | B+ | | | | 144,568 | |
| | | | Oil, Gas, & Consumable Fuels – 5.7% | | | | | | | | | | | | | | | | |
| | | | | |
| | 299 | | | CCS Income Trust, Add on Term Loan B | | | 6.500% | | | | 11/14/14 | | | | B | | | | 300,746 | |
| | | | | |
| | 430 | | | Energy Transfer Partners LP, Term Loan B | | | 3.750% | | | | 3/21/17 | | | | Ba1 | | | | 422,386 | |
| | | | | |
| | 729 | | | Total Oil, Gas, and Consumable Fuels | | | | | | | | | | | | | | | 723,132 | |
| | | | Pharmaceuticals – 7.1% | | | | | | | | | | | | | | | | |
| | | | | |
| | 399 | | | Pharmaceutical Product Development, Inc., Term Loan | | | 6.250% | | | | 12/05/18 | | | | BB– | | | | 404,278 | |
| | | | | |
| | 250 | | | Valeant Pharmaceuticals, Term Loan B, First Lien | | | 3.260% | | | | 2/01/19 | | | | BBB– | | | | 248,360 | |
| | | | | | | | | | | | | | | | | | | | |
Principal
Amount (000) | | | Description (1) | | Weighted
Average
Coupon | | | Maturity (3) | | | Ratings (2) | | | Value | |
| | | | | | | | | | | | | | | | | | | | |
| | | | Pharmaceuticals (continued) | | | | | | | | | | | | | | | | |
| | | | | |
| $ | 114 | | | Warner Chilcott Corporation, Term Loan B1 | | | 4.250% | | | | 3/17/18 | | | | BBB– | | | $ | 113,761 | |
| | | | | |
| | 57 | | | Warner Chilcott Corporation, Term Loan B2 | | | 4.250% | | | | 3/17/18 | | | | BBB– | | | | 56,881 | |
| | | | | |
| | 78 | | | Warner Chilcott Corporation, Term Loan B3 | | | 4.250% | | | | 3/17/18 | | | | BBB– | | | | 78,211 | |
| | | | | |
| | 898 | | | Total Pharmaceuticals | | | | | | | | | | | | | | | 901,491 | |
| | | | Real Estate Management & Development – 1.1% | | | | | | | | | | | | | | | | |
| | | | | |
| | 139 | | | Capital Automotive LP, Tranche B | | | 5.250% | | | | 3/11/17 | | | | Ba3 | | | | 137,599 | |
| | | | Software – 9.2% | | | | | | | | | | | | | | | | |
| | | | | |
| | 249 | | | BlackBoard, Inc., Term Loan, First Lien | | | 7.500% | | | | 9/23/18 | | | | B+ | | | | 248,557 | |
| | | | | |
| | 251 | | | Datatel Parent Corp, Term Loan B | | | 6.250% | | | | 7/19/18 | | | | B+ | | | | 255,491 | |
| | | | | |
| | 350 | | | Infor Enterprise Applications, Term Loan, (WI/DD) | | | TBD | | | | TBD | | | | Ba3 | | | | 346,500 | |
| | | | | |
| | 323 | | | IPC Systems, Inc., Extended Term Loan, Tranche B1, First Lien | | | 5.664% | | | | 7/31/17 | | | | B– | | | | 316,862 | |
| | | | | |
| | 1,173 | | | Total Software | | | | | | | | | | | | | | | 1,167,410 | |
| | | | Specialty Retail – 4.7% | | | | | | | | | | | | | | | | |
| | | | | |
| | 218 | | | Toys “R” Us – Delaware Inc., Term Loan | | | 5.250% | | | | 5/17/18 | | | | B+ | | | | 217,531 | |
| | | | | |
| | 375 | | | Lord & Taylor Holdings LLC, Term Loan | | | 5.750% | | | | 12/21/18 | | | | BB | | | | 377,656 | |
| | | | | |
| | 593 | | | Total Specialty Retail | | | | | | | | | | | | | | | 595,187 | |
| | | | Wireless Telecommunication Services – 1.9% | | | | | | | | | | | | | | | | |
| | | | | |
| | 295 | | | Clear Channel Communications, Inc., Tranche B, Term Loan | | | 3.891% | | | | 1/29/16 | | | | CCC+ | | | | 240,173 | |
| $ | 11,868 | | | Total Variable Rate Senior Loan Interests (cost $11,531,445) | | | | | | | | | | | | | | | 11,700,416 | |
| | | | | |
Principal
Amount (000) | | | Description (1) | | | | | Coupon | | | Maturity | | | Value | |
| | | | SHORT-TERM INVESTMENTS – 5.8% | | | | | | | | | | | | | | | | |
| | | | | |
| $ | 744 | | | Repurchase Agreement with State Street Bank, dated 3/30/12, repurchase price $743,957, collateralized by $760,000 U.S. Treasury Notes, 4.250%, due 8/15/15, value $758,854 | | | | | | | 0.010% | | | | 4/02/12 | | | $ | 743,956 | |
| | | | Total Short-Term Investments (cost $743,956) | | | | | | | | | | | | | | | 743,956 | |
| | | | Total Investments (cost $13,296,376) – 105.7% | | | | | | | | | | | | | | | 13,475,999 | |
| | | | Other Assets Less Liabilities – (5.7)% | | | | | | | | | | | | | | | (728,610) | |
| | | | Net Assets – 100% | | | | | | | | | | | | | | $ | 12,747,389 | |
| | | | For Fund portfolio compliance purposes, the Fund’s industry classifications refer to any one or more of the industry subclassifications used by one or more widely recognized market indexes or ratings group indexes, and/or as defined by Fund management. This definition may not apply for purposes of this report, which may combine industry sub-classifications into sectors for reporting ease. |
| | (1) | | All percentages shown in the Portfolio of Investments are based on net assets. |
| | (2) | | Ratings: Using the highest of Standard & Poor’s Group (“Standard & Poor’s”), Moody’s Investors Service, Inc. (“Moody’s”) or Fitch, Inc. (“Fitch”) rating. Ratings below BBB by Standard & Poor’s, Baa by Moody’s or BBB by Fitch are considered to be below investment grade. Holdings designated N/R are not rated by any of these national rating agencies. |
| | (3) | | Senior Loans generally are subject to mandatory and/or optional prepayment. Because of these mandatory prepayment conditions and because there may be significant economic incentives for a borrower to prepay, prepayments of Senior Loans may occur. As a result, the actual remaining maturity of Senior Loans held may be substantially less than the stated maturities shown. |
| | (4) | | Senior Loans generally pay interest at rates which are periodically adjusted by reference to a base short-term, floating lending rate plus an assigned fixed rate. These floating lending rates are generally (i) the lending rate referenced by the London Inter- Bank Offered Rate (“LIBOR”), or (ii) the prime rate offered by one or more major United States banks. |
| | | | Senior Loans may be considered restricted in that the Fund ordinarily is contractually obligated to receive approval from the Agent Bank and/or borrower prior to the disposition of a Senior Loan. |
| | (5) | | Investment, or portion of investment, represents an unfunded Senior Loan commitment outstanding at March 31, 2012. |
| | WI/DD | | Purchased on a when-issued or delayed delivery basis. |
| | 144A | | Investment is exempt from registration under Rule 144A of the Securities Act of 1933, as amended. These investments may only be resold in transactions exempt from registration, which are normally those transactions with qualified institutional buyers. |
| | TBD | | Senior Loan purchased on a when-issued or delayed-delivery basis. Certain details associated with this purchase are not known prior to the settlement date of the transaction. In addition, Senior Loans typically trade without accrued interest and therefore a weighted average coupon rate is not available prior to settlement. At settlement, if still unknown, the borrower or counterparty will provide the Fund with the final weighted average coupon rate and maturity date. |
See accompanying notes to financial statements.
Statement of Assets and Liabilities (Unaudited)
March 31, 2012
| | | | | | | | |
| | | Symphony Credit
Opportunities | | | Symphony Floating
Rate Income | |
Assets | | | | | | | | |
Investments, at value (cost $148,286,533 and $12,552,420 respectively) | | $ | 153,072,787 | | | $ | 12,732,043 | |
Short-term investments (at cost, which approximates value) | | | 17,330,900 | | | | 743,956 | |
Receivables: | | | | | | | | |
From Adviser | | | — | | | | 13,281 | |
Interest | | | 2,117,452 | | | | 91,890 | |
Investments sold | | | 4,971,354 | | | | 478,741 | |
Shares sold | | | 2,674,156 | | | | 7,500 | |
Other assets | | | 701 | | | | 19 | |
Total assets | | | 180,167,350 | | | | 14,067,430 | |
Liabilities | | | | | | | | |
Payables: | | | | | | | | |
Dividends | | | 73,276 | | | | 47,457 | |
Investments purchased | | | 10,430,652 | | | | 1,224,240 | |
Shares redeemed | | | 302,381 | | | | — | |
Unfunded senior loans | | | 107,143 | | | | 47,752 | |
Accrued expenses: | | | | | | | | |
Management fees | | | 79,489 | | | | — | |
12b-1 distribution and service fees | | | 29,194 | | | | 592 | |
Other | | | 75,316 | | | | — | |
Total liabilities | | | 11,097,451 | | | | 1,320,041 | |
Net assets | | $ | 169,069,899 | | | $ | 12,747,389 | |
Class A Shares | | | | | | | | |
Net assets | | $ | 53,871,483 | | | $ | 523,358 | |
Shares outstanding | | | 2,528,304 | | | | 26,283 | |
Net asset value per share | | $ | 21.31 | | | $ | 19.91 | |
Offering price per share (net asset value per share plus maximum sales charge of 4.75% of offering price) | | $ | 22.37 | | | $ | 20.90 | |
Class C Shares | | | | | | | | |
Net assets | | $ | 23,666,368 | | | $ | 545,207 | |
Shares outstanding | | | 1,112,050 | | | | 27,398 | |
Net asset value and offering price per share | | $ | 21.28 | | | $ | 19.90 | |
Class R3 Shares | | | | | | | | |
Net assets | | $ | 54,200 | | | $ | 248,932 | |
Shares outstanding | | | 2,545 | | | | 12,500 | |
Net asset value and offering price per share | | $ | 21.30 | | | $ | 19.91 | |
Class I Shares | | | | | | | | |
Net assets | | $ | 91,477,848 | | | $ | 11,429,892 | |
Shares outstanding | | | 4,292,441 | | | | 573,971 | |
Net asset value and offering price per share | | $ | 21.31 | | | $ | 19.91 | |
Net assets consist of: | | | | | | | | |
Capital paid-in | | $ | 164,655,621 | | | $ | 12,706,004 | |
Undistributed (Over-distribution of) net investment income | | | 275,638 | | | | 4,195 | |
Accumulated net realized gain (loss) | | | (647,614 | ) | | | (142,433 | ) |
Net unrealized appreciation (depreciation) | | | 4,786,254 | | | | 179,623 | |
Net assets | | $ | 169,069,899 | | | $ | 12,747,389 | |
Authorized shares | | | Unlimited | | | | Unlimited | |
Par value per share | | $ | 0.01 | | | $ | 0.01 | |
See accompanying notes to financial statements.
Statement of Operations (Unaudited)
Six Months Ended March 31, 2012
| | | | | | | | |
| | | Symphony Credit
Opportunities | | | Symphony Floating
Rate Income | |
Investment Income | | $ | 4,431,209 | | | $ | 382,687 | |
Expenses | | | | | | | | |
Management fees | | | 373,076 | | | | 35,023 | |
12b-1 service fees – Class A | | | 45,680 | | | | 502 | |
12b-1 distribution and service fees – Class C | | | 77,148 | | | | 1,672 | |
12b-1 distribution and service fees – Class R3 | | | 131 | | | | 605 | |
Shareholders’ servicing agent fees and expenses | | | 38,845 | | | | 655 | |
Custodian’s fees and expenses | | | 15,032 | | | | 6,595 | |
Trustees’ fees and expenses | | | 1,640 | | | | 322 | |
Professional fees | | | 24,014 | | | | 21,637 | |
Shareholders’ reports – printing and mailing expenses | | | 16,027 | | | | 5,504 | |
Federal and state registration fees | | | 36,487 | | | | 7,211 | |
Other expenses | | | 2,030 | | | | 506 | |
Total expenses before expense reimbursement | | | 630,110 | | | | 80,232 | |
Expense reimbursement | | | (13,885 | ) | | | (31,208 | ) |
Net expenses | | | 616,225 | | | | 49,024 | |
Net investment income (loss) | | | 3,814,984 | | | | 333,663 | |
Realized and Unrealized Gain (Loss) | | | | | | | | |
Net realized gain (loss) from investments | | | (217,030 | ) | | | 17,656 | |
Change in net unrealized appreciation (depreciation) of investments | | | 10,574,737 | | | | 730,892 | |
Net realized and unrealized gain (loss) | | | 10,357,707 | | | | 748,548 | |
Net increase (decrease) in net assets from operations | | $ | 14,172,691 | | | $ | 1,082,211 | |
See accompanying notes to financial statements.
Statement of Changes in Net Assets (Unaudited)
| | | | | | | | | | | | | | | | |
| | | Symphony Credit
Opportunities | | | Symphony Floating
Rate Income | |
| | | Six Months
Ended
3/31/12 | | | Year
Ended
9/30/11 | | | Six Months
Ended
3/31/12 | | | For the Period
5/2/2011
(commencement
of operations)
through 9/30/11 | |
Operations | | | | | | | | | | | | | | | | |
Net investment income (loss) | | $ | 3,814,984 | | | $ | 4,824,297 | | | $ | 333,663 | | | $ | 182,053 | |
Net realized gain (loss) from investments | | | (217,030 | ) | | | (488,721 | ) | | | 17,656 | | | | (158,710 | ) |
Change in net unrealized appreciation (depreciation) of
investments | | | 10,574,737 | | | | (6,347,953 | ) | | | 730,892 | | | | (551,269 | ) |
Net increase (decrease) in net assets from operations | | | 14,172,691 | | | | (2,012,377 | ) | | | 1,082,211 | | | | (527,926 | ) |
Distributions to Shareholders | | | | | | | | | | | | | | | | |
From net investment income: | | | | | | | | | | | | | | | | |
Class A | | | (1,188,645 | ) | | | (893,322 | ) | | | (11,254 | ) | | | (4,870 | ) |
Class C | | | (443,630 | ) | | | (370,834 | ) | | | (8,091 | ) | | | (4,043 | ) |
Class R3 | | | (1,654 | ) | | | (52,508 | ) | | | (6,525 | ) | | | (4,194 | ) |
Class I | | | (2,303,907 | ) | | | (2,970,011 | ) | | | (299,258 | ) | | | (175,750 | ) |
From accumulated net realized gains: | | | | | | | | | | | | | | | | |
Class A | | | — | | | | (35,150 | ) | | | — | | | | — | |
Class C | | | — | | | | (11,027 | ) | | | — | | | | — | |
Class R3 | | | — | | | | (6,531 | ) | | | — | | | | — | |
Class I | | | — | | | | (121,505 | ) | | | — | | | | — | |
Decrease in net assets from distributions to shareholders | | | (3,937,836 | ) | | | (4,460,888 | ) | | | (325,128 | ) | | | (188,857 | ) |
Fund Share Transactions | | | | | | | | | | | | | | | | |
Proceeds from sale of shares | | | 81,491,617 | | | | 93,968,100 | | | | 2,653,613 | | | | 10,059,774 | |
Proceeds from shares issued to shareholders due to reinvestment of distributions | | | 3,513,347 | | | | 3,177,671 | | | | 41,418 | | | | 444 | |
| | | 85,004,964 | | | | 97,145,771 | | | | 2,695,031 | | | | 10,060,218 | |
Cost of shares redeemed | | | (14,571,644 | ) | | | (25,726,635 | ) | | | (48,160 | ) | | | — | |
Net increase (decrease) in net assets from Fund share transactions | | | 70,433,320 | | | | 71,419,136 | | | | 2,646,871 | | | | 10,060,218 | |
Net increase (decrease) in net assets | | | 80,668,175 | | | | 64,945,871 | | | | 3,403,954 | | | | 9,343,435 | |
Net assets at the beginning of period | | | 88,401,724 | | | | 23,455,853 | | | | 9,343,435 | | | | — | |
Net assets at the end of period | | $ | 169,069,899 | | | $ | 88,401,724 | | | $ | 12,747,389 | | | $ | 9,343,435 | |
Undistributed (Over-distribution of) net investment income at
the end of period | | $ | 275,638 | | | $ | 398,490 | | | $ | 4,195 | | | $ | (4,340 | ) |
See accompanying notes to financial statements.
Statement of Cash Flows (Unaudited)
Six Months Ended March 31, 2012
| | | | | | | | |
| | | Symphony Credit
Opportunities | | | Symphony Floating
Rate Income | |
Cash Flows from Operating Activities: | | | | | | | | |
Net Increase (Decrease) in Net Assets from Operations | | $ | 14,172,691 | | | $ | 1,082,211 | |
Adjustments to reconcile the net increase (decrease) in net assets from operations to net cash provided by (used in) operating activities: | | | | | | | | |
Purchases of investments | | | (110,088,539 | ) | | | (10,318,124 | ) |
Proceeds from sales and maturities of investments | | | 54,332,150 | | | | 7,618,897 | |
Proceeds from (Purchase of) short-term investments, net | | | (15,468,715 | ) | | | (197,422 | ) |
Amortization (Accretion) of premiums and discounts, net | | | (315,570 | ) | | | (31,656 | ) |
(Increase) Decrease in: | | | | | | | | |
Receivable from Adviser | | | 4,531 | | | | (13,281 | ) |
Receivable for interest | | | (440,112 | ) | | | (21,190 | ) |
Receivable for investments sold | | | (4,333,635 | ) | | | 73,453 | |
Other assets | | | (701 | ) | | | (19 | ) |
Increase (Decrease) in: | | | | | | | | |
Payable for investments purchased | | | 8,309,152 | | | | 227,383 | |
Payable for unfunded senior loans | | | 107,143 | | | | 47,752 | |
Accrued management fees | | | 79,489 | | | | (93 | ) |
Accrued 12b-1 distribution and service fees | | | 15,044 | | | | 234 | |
Accrued other expenses | | | (6,766 | ) | | | (19,465 | ) |
Net realized (gain) loss from: | | | | | | | | |
Investments | | | 217,030 | | | | (17,656 | ) |
Paydowns | | | (150,530 | ) | | | (36,672 | ) |
Change in net unrealized (appreciation) depreciation of investments | | | (10,574,737 | ) | | | (730,892 | ) |
Net cash provided by (used in) operating activities | | | (64,142,075 | ) | | | (2,336,540 | ) |
Cash Flows from Financing Activities: | | | | | | | | |
Cash distributions paid to shareholders | | | (437,646 | ) | | | (283,391 | ) |
Proceeds from sale of shares | | | 79,134,600 | | | | 2,658,215 | |
Cost of shares redeemed | | | (14,554,879 | ) | | | (48,160 | ) |
Net cash provided by (used in) financing activities | | | 64,142,075 | | | | 2,326,664 | |
Net Increase (Decrease) in Cash | | | — | | | | (9,876 | ) |
Cash at the beginning of period | | | — | | | | 9,876 | |
Cash at the End of Period | | $ | — | | | $ | — | |
Supplemental Disclosure of Cash Flow Information
Non-cash financing activities not included herein consist of reinvestment of distributions of $3,513,347 and $41,418 for Symphony Credit Opportunities and Symphony Floating Rate Income, respectively.
See accompanying notes to financial statements.
Financial Highlights (Unaudited)
| | | | | | | | | | | | | | | | | | | | | | | | | | | | | | | | | | | | |
| Selected data for a share outstanding throughout each period: | | | | | | | |
| | | | | | | |
| Class (Commencement Date) | | | | | | | | | | | | | | | | | | | | | | |
| | | | | | Investment Operations | | | Less Distributions | | | | |
| | | | | | |
| SYMPHONY CREDIT OPPORTUNITIES | | | | | | | | | | | | | | | | | | | |
Year Ended
September 30, | | Beginning
Net
Asset
Value | | | Net
Invest-
ment
Income
(Loss)(a) | | | Net
Realized/
Unrealized
Gain
(Loss) | | | Total | | | Net
Invest-
ment
Income | | | Capital
Gains(b) | | | Total | | | Ending
Net
Asset
Value | | | Total
Return(c) | |
Class A (4/10) | | | | | | | | | | | | | | | | | | | | | | | | | | | | | | | | | |
2012(e) | | $ | 19.45 | | | $ | .64 | | | $ | 1.90 | | | $ | 2.54 | | | $ | (.68 | ) | | $ | — | | | $ | (.68 | ) | | $ | 21.31 | | | | 13.19 | % |
2011 | | | 20.42 | | | | 1.40 | | | | (1.00 | ) | | | .40 | | | | (1.27 | ) | | | (.10 | ) | | | (1.37 | ) | | | 19.45 | | | | 1.76 | |
2010(f) | | | 20.00 | | | | .45 | | | | .43 | | | | .88 | | | | (.46 | ) | | | — | | | | (.46 | ) | | | 20.42 | | | | 4.48 | |
Class C (4/10) | | | | | | | | | | | | | | | | | | | | | | | | | | | | | | | | | |
2012(e) | | | 19.42 | | | | .57 | | | | 1.89 | | | | 2.46 | | | | (.60 | ) | | | — | | | | (.60 | ) | | | 21.28 | | | | 12.79 | |
2011 | | | 20.40 | | | | 1.26 | | | | (1.02 | ) | | | .24 | | | | (1.12 | ) | | | (.10 | ) | | | (1.22 | ) | | | 19.42 | | | | .96 | |
2010(f) | | | 20.00 | | | | .38 | | | | .43 | | | | .81 | | | | (.41 | ) | | | — | | | | (.41 | ) | | | 20.40 | | | | 4.12 | |
Class R3 (4/10) | | | | | | | | | | | | | | | | | | | | | | | | | | | | | | | | | |
2012(e) | | | 19.44 | | | | .64 | | | | 1.87 | | | | 2.51 | | | | (.65 | ) | | | — | | | | (.65 | ) | | | 21.30 | | | | 13.05 | |
2011 | | | 20.41 | | | | 1.27 | | | | (.92 | ) | | | .35 | | | | (1.22 | ) | | | (.10 | ) | | | (1.32 | ) | | | 19.44 | | | | 1.52 | |
2010(f) | | | 20.00 | | | | .43 | | | | .42 | | | | .85 | | | | (.44 | ) | | | — | | | | (.44 | ) | | | 20.41 | | | | 4.34 | |
Class I (4/10) | | | | | | | | | | | | | | | | | | | | | | | | | | | | | | | | | |
2012(e) | | | 19.45 | | | | .68 | | | | 1.89 | | | | 2.57 | | | | (.71 | ) | | | — | | | | (.71 | ) | | | 21.31 | | | | 13.33 | |
2011 | | | 20.43 | | | | 1.45 | | | | (1.00 | ) | | | .45 | | | | (1.33 | ) | | | (.10 | ) | | | (1.43 | ) | | | 19.45 | | | | 1.97 | |
2010(f) | | | 20.00 | | | | .47 | | | | .44 | | | | .91 | | | | (.48 | ) | | | — | | | | (.48 | ) | | | 20.43 | | | | 4.61 | |
| | | | | | | | | | | | | | | | | | | | | | |
| | | | | |
| | | | | | | | | | | | | | | | | |
| Ratios/Supplemental Data | |
| | | | Ratios to Average
Net Assets Before
Reimbursement | | | Ratios to Average
Net Assets After
Reimbursement(d) | | | | |
Ending
Net
Assets
(000) | | | Expenses | | | Net
Invest-
ment
Income
(Loss) | | | Expenses | | | Net
Invest-
ment
Income
(Loss) | | | Portfolio
Turnover
Rate | |
| | | | | | | | | | | | | | | | | | | | | | |
| $ | 53,871 | | | | 1.09 | %* | | | 6.27 | %* | | | 1.07 | %* | | | 6.29 | %* | | | 48 | % |
| | 23,883 | | | | 1.16 | | | | 6.69 | | | | 1.08 | | | | 6.77 | | | | 137 | |
| | 4,436 | | | | 1.74 | * | | | 4.65 | * | | | 1.09 | * | | | 5.31 | * | | | 68 | |
| | | | | | | | | | | | | | | | | | | | | | |
| | 23,666 | | | | 1.85 | * | | | 5.54 | * | | | 1.82 | * | | | 5.56 | * | | | 48 | |
| | 11,037 | | | | 1.91 | | | | 6.02 | | | | 1.83 | | | | 6.10 | | | | 137 | |
| | 1,359 | | | | 2.93 | * | | | 3.44 | * | | | 1.84 | * | | | 4.53 | * | | | 68 | |
| | | | | | | | | | | | | | | | | | | | | | |
| | 54 | | | | 1.35 | * | | | 6.17 | * | | | 1.32 | * | | | 6.19 | * | | | 48 | |
| | 49 | | | | 1.49 | | | | 5.81 | | | | 1.33 | | | | 5.97 | | | | 137 | |
| | 1,276 | | | | 2.45 | * | | | 3.92 | * | | | 1.34 | * | | | 5.04 | * | | | 68 | |
| | | | | | | | | | | | | | | | | | | | | | |
| | 91,478 | | | | .85 | * | | | 6.60 | * | | | .82 | * | | | 6.62 | * | | | 48 | |
| | 53,432 | | | | .92 | | | | 6.85 | | | | .83 | | | | 6.94 | | | | 137 | |
| | 16,385 | | | | 1.16 | * | | | 5.21 | * | | | .84 | * | | | 5.54 | * | | | 68 | |
| (a) | Per share Net Investment Income (Loss) is calculated using the average daily shares method. |
| (b) | Distributions from Capital Gains include short-term capital gains, if any. |
| (c) | Total return is the combination of changes in net asset value without any sales charge, reinvested dividend income at net asset value and reinvested capital gains distributions at net asset value, if any. Total returns are not annualized. |
| (d) | After expense reimbursement from the Adviser, where applicable. Ratios do not reflect the effect of custodian fee credits earned on the Fund’s net cash on deposit with the custodian bank, where applicable. |
| (e) | For the six months ended March 31, 2012. |
| (f) | For the period April 28, 2010 (commencement of operations) through September 30, 2010. |
See accompanying notes to financial statements.
Financial Highlights (Unaudited) (continued)
| | | | | | | | | | | | | | | | | | | | | | | | | | | | | | | | | | | | |
| Selected data for a share outstanding throughout each period: | |
| | | | | | | |
| Class (Commencement Date) | | | | | | | | | | | | | | | | | | | | | | |
| | | | | | Investment Operations | | | Less Distributions | | | | |
| | | | | | |
| SYMPHONY FLOATING RATE INCOME | | | | | | | | | | | | | | | | | | | |
Year Ended
September 30, | | Beginning
Net
Asset
Value | | | Net
Invest-
ment
Income
(Loss)(a) | | | Net
Realized/
Unrealized
Gain
(Loss) | | | Total | | | Net
Invest-
ment
Income | | | Capital
Gains(b) | | | Total | | | Ending
Net
Asset
Value | | | Total
Return(c) | |
Class A (5/11) | | | | | | | | | | | | | | | | | | | | | | | | | | | | | | | | | |
2012(e) | | $ | 18.57 | | | $ | .56 | | | $ | 1.33 | | | $ | 1.89 | | | $ | (.55 | ) | | $ | — | | | $ | (.55 | ) | | $ | 19.91 | | | | 10.31 | % |
2011(f) | | | 20.00 | | | | .35 | | | | (1.42 | ) | | | (1.07 | ) | | | (.36 | ) | | | — | | | | (.36 | ) | | | 18.57 | | | | (5.43 | ) |
Class C (5/11) | | | | | | | | | | | | | | | | | | | | | | | | | | | | | | | | | |
2012(e) | | | 18.56 | | | | .49 | | | | 1.32 | | | | 1.81 | | | | (.47 | ) | | | — | | | | (.47 | ) | | | 19.90 | | | | 9.90 | |
2011(f) | | | 20.00 | | | | .29 | | | | (1.42 | ) | | | (1.13 | ) | | | (.31 | ) | | | — | | | | (.31 | ) | | | 18.56 | | | | (5.72 | ) |
Class R3 (5/11) | | | | | | | | | | | | | | | | | | | | | | | | | | | | | | | | | |
2012(e) | | | 18.58 | | | | .53 | | | | 1.32 | | | | 1.85 | | | | (.52 | ) | | | — | | | | (.52 | ) | | | 19.91 | | | | 10.12 | |
2011(f) | | | 20.00 | | | | .33 | | | | (1.41 | ) | | | (1.08 | ) | | | (.34 | ) | | | — | | | | (.34 | ) | | | 18.58 | | | | (5.52 | ) |
Class I (5/11) | | | | | | | | | | | | | | | | | | | | | | | | | | | | | | | | | |
2012(e) | | | 18.57 | | | | .58 | | | | 1.33 | | | | 1.91 | | | | (.57 | ) | | | — | | | | (.57 | ) | | | 19.91 | | | | 10.39 | |
2011(f) | | | 20.00 | | | | .37 | | | | (1.42 | ) | | | (1.05 | ) | | | (.38 | ) | | | — | | | | (.38 | ) | | | 18.57 | | | | (5.30 | ) |
| | | | | | | | | | | | | | | | | | | | | | |
| | | | | |
| | | | | | | | | | | | | | | | | |
| Ratios/Supplemental Data | |
| | | | Ratios to Average
Net Assets Before
Reimbursement | | | Ratios to Average
Net Assets After
Reimbursement(d) | | | | |
Ending
Net
Assets
(000) | | | Expenses | | | Net
Invest-
ment
Income
(Loss) | | | Expenses | | | Net
Invest-
ment
Income
(Loss) | | | Portfolio
Turnover
Rate | |
| | | | | | | | | | | | | | | | | | | | | | |
| $ | 523 | | | | 1.68 | %* | | | 5.20 | %* | | | 1.08 | %* | | | 5.80 | %* | | | 70 | % |
| | 274 | | | | 1.54 | * | | | 3.87 | * | | | 1.08 | * | | | 4.33 | * | | | 97 | |
| | | | | | | | | | | | | | | | | | | | | | |
| | 545 | | | | 2.43 | * | | | 4.45 | * | | | 1.83 | * | | | 5.05 | * | | | 70 | |
| | 248 | | | | 2.28 | * | | | 3.08 | * | | | 1.83 | * | | | 3.54 | * | | | 97 | |
| | | | | | | | | | | | | | | | | | | | | | |
| | 249 | | | | 1.86 | * | | | 4.97 | * | | | 1.33 | * | | | 5.51 | * | | | 70 | |
| | 232 | | | | 1.78 | * | | | 3.54 | * | | | 1.33 | * | | | 4.00 | * | | | 97 | |
| | | | | | | | | | | | | | | | | | | | | | |
| | 11,430 | | | | 1.38 | * | | | 5.45 | * | | | .83 | * | | | 6.00 | * | | | 70 | |
| | 8,589 | | | | 1.28 | * | | | 4.04 | * | | | .83 | * | | | 4.50 | * | | | 97 | |
| (a) | Per share Net Investment Income (Loss) is calculated using the average daily shares method. |
| (b) | Distributions from Capital Gains include short-term capital gains, if any. |
| (c) | Total return is the combination of changes in net asset value without any sales charge, reinvested dividend income at net asset value and reinvested capital gains distributions at net asset value, if any. Total returns are not annualized. |
| (d) | After expense reimbursement from the Adviser, where applicable. Ratios do not reflect the effect of custodian fee credits earned on the Fund’s net cash on deposit with the custodian bank, where applicable. |
| (e) | For the six months end March 31, 2012. |
| (f) | For the period May 2, 2011 (commencement of operations) through September 30, 2011. |
See accompanying notes to financial statements.
Notes to Financial Statements (Unaudited)
1. General Information and Significant Accounting Policies
General Information
The Nuveen Investment Trust III (the “Trust”) is an open-end management investment company registered under the Investment Company Act of 1940, as amended. The Trust is comprised of Nuveen Symphony Credit Opportunities Fund (“Symphony Credit Opportunities”) and Nuveen Symphony Floating Rate Income Fund (“Symphony Floating Rate Income”) (each a “Fund” and collectively, the “Funds”), among others. The Trust was organized as a Massachusetts business trust in 1998.
Symphony Credit Opportunities’ investment objective is to seek current income and capital appreciation. Under normal market conditions, the Fund invests primarily in debt instruments (e.g., bonds, loans and convertible securities), a substantial portion of which may be rated below investment-grade or, if unrated, deemed by the Fund’s sub-adviser Symphony Asset Management LLC (“Symphony”), a subsidiary of Nuveen Investments, Inc. (“Nuveen”) to be of comparable quality. Below investment-grade securities are commonly referred to as “high yield” or “junk bonds.” Although the Fund invests primarily in debt issued by U.S. companies, it may invest up to 25% of its net assets in U.S. dollar-denominated debt issued by non-U.S. companies that is traded over-the-counter or listed on an exchange. The Fund may use derivatives, such as swaps, futures contracts and options, to gain investment exposure.
Symphony Floating Rate Income’s investment objective is to seek a high level of current income and the secondary investment objective of the Fund is to seek capital appreciation. Under normal market conditions, the Fund invests at least 80% of its net assets (plus the amount of any borrowings for investment purposes) in floating rate securities. Floating rate securities are defined to include floating rate loans, other floating rate debt securities, money market securities and shares of money market and short-term bond funds. The Fund may invest up to 20% of its net assets in other securities, which would primarily be fixed rate debt securities, convertible securities and equity securities received as a result of the restructuring of an issuer’s debt. A substantial portion of the Fund’s assets generally will be invested in securities rated below investment grade or, if unrated, deemed by the Fund’s sub-adviser, Symphony, to be of comparable quality. Below investment-grade securities are commonly referred to as “high yield” or “junk bonds.” Although the Fund invests primarily in securities issued by U.S. companies, the Fund may invest up to 35% of its net assets in dollar denominated securities issued by non-U.S. companies that are traded in the United States over the counter or listed on a domestic exchange. The Fund’s average portfolio duration will not be longer than one year.
Each Fund’s most recent prospectus provides further description of each Fund’s investment objective, principal investment strategies, and principal risks.
Significant Accounting Policies
The following is a summary of significant accounting policies followed by the Funds in the preparation of their financial statements in accordance with accounting principles generally accepted in the United States (“U.S. GAAP”).
Investment Valuation
Prices of fixed-income securities and senior loans are provided by a pricing service approved by the Funds’ Board of Trustees. These securities are generally classified as Level 2 for fair value measurement purposes. The pricing service establishes a security’s fair value using methods that may include consideration of the following: yields or prices of investments of comparable quality, type of issue, coupon, maturity and rating, market quotes or indications of value from security dealers, evaluations of anticipated cash flows or collateral, general market conditions and other information and analysis, including the obligor’s credit characteristics considered relevant. In pricing certain securities, particularly less liquid and lower quality securities, the pricing service may consider information about a security, its issuer, or market activity provided by Nuveen Fund Advisors, Inc., (the “Adviser”), a wholly-owned subsidiary of Nuveen. These securities are generally classified as Level 2 or Level 3 depending on the priority of the significant inputs.
Like most fixed-income securities, the senior loans in which the Funds invest are not listed on an organized exchange. The secondary market for such investments may be less liquid relative to markets for other fixed-income securities. Consequently, the value of senior and subordinated loans, determined as described above, may differ significantly from the value that would have been determined had there been an active market for that senior loan. These securities are generally classified as Level 2.
Repurchase agreements are valued at contract amount plus accrued interest, which approximates market value. These securities are generally classified as Level 2.
Certain securities may not be able to be priced by the pre-established pricing methods as described above. Such securities may be valued by the Funds’ Board of Trustees or its designee at fair value. These securities generally include, but are not limited to, restricted securities (securities which may not be publicly sold without registration under the Securities Act of 1933, as amended) for which a pricing service is unable to provide a market price; securities whose trading has been formally suspended; debt securities that have gone into default and for which there is no current market quotation; a security whose market price is not available from a pre-established pricing source; a security with respect to which an event has occurred that is likely to materially affect the value of the security after the market has closed but before the calculation of a Fund’s net asset value (as may be the case in non-U.S. markets on which the security is primarily traded) or make it difficult or impossible to obtain a reliable market quotation; and a security whose price, as provided by the pricing service, is not deemed to reflect the security’s fair value. As a general principle, the fair value of a security would appear to be the amount that the owner might reasonably expect to receive for it in a current sale. A variety of factors
may be considered in determining the fair value of such securities, which may include consideration of the following: yields or prices of investments of comparable quality, type of issue, coupon, maturity and rating, market quotes or indications of value from security dealers, evaluations of anticipated cash flows or collateral, general market conditions and other information and analysis, including the obligor’s credit characteristics considered relevant. These securities are generally classified as Level 2 or Level 3 depending on the priority of the significant inputs. Regardless of the method employed to value a particular security, all valuations are subject to review by the Funds’ Board of Trustees or its designee.
Refer to Footnote 2 – Fair Value Measurements for further details on the leveling of securities held by the Funds as of the end of the reporting period.
Investment Transactions
Investment transactions are recorded on a trade date basis. Trade date for senior and subordinated loans purchased in the “primary market” is considered the date on which the loan allocations are determined. Trade date for senior and subordinated loans purchased in the “secondary market” is the date on which the transaction is entered into. Realized gains and losses from investment transactions are determined on the specific identification method, which is the same basis used for federal income tax purposes. Investments purchased on a when-issued/delayed delivery basis may have extended settlement periods. Any investments so purchased are subject to market fluctuation during this period. The Funds have instructed the custodian to segregate assets with a current value at least equal to the amount of the when-issued/delayed delivery purchase commitments. At March 31, 2012, Symphony Credit Opportunities and Symphony Floating Rate Income each had outstanding when-issued/delayed delivery purchase commitments of $9,430,652 and $1,224,240, respectively.
Investment Income
Investment income, which reflects the amortization of premiums and includes accretion of discounts for financial reporting purposes, is recorded on an accrual basis. Investment income also reflects paydown gains and losses and fee income, if any. Fee income, if any, consists primarily of amendment fees. Amendment fees are earned as compensation for evaluating and accepting charges to an original senior loan agreement and are recognized when received.
Income Taxes
Each Fund is a separate taxpayer for federal income tax purposes. Each Fund intends to distribute substantially all of its net investment income and net capital gains to shareholders and to otherwise comply with the requirements of Subchapter M of the Internal Revenue Code applicable to regulated investment companies (“RICs”). Therefore, no federal income tax provision is required.
For all open tax years and all major taxing jurisdictions, management of the Funds has concluded that there are no significant uncertain tax positions that would require recognition in the financial statements. Open tax years are those that are open for examination by taxing authorities (i.e., generally the last four tax year ends and the interim tax period since then). Furthermore, management of the Funds is also not aware of any tax positions for which it is reasonably possible that the total amounts of unrecognized tax benefits will significantly change in the next twelve months.
Dividends and Distributions to Shareholders
The Funds declare dividends from their net investment income daily and pay shareholders monthly. Fund shares begin to accrue dividends on the business day after the day when the monies used to purchase Fund shares are collected by the Funds’ transfer agent.
Net realized capital gains from investment transactions, if any, are declared and distributed to shareholders at least annually. Furthermore, capital gains are distributed only to the extent they exceed available capital loss carryforwards.
Distributions to shareholders are recorded on the ex-dividend date. The amount and timing of distributions are determined in accordance with federal income tax regulations, which may differ from U.S. GAAP.
Flexible Sales Charge Program
Class A Shares are generally sold with an up-front sales charge and incur a .25% annual 12b-1 service fee. Class A Share purchases of $1 million or more are sold at net asset value without an up-front sales charge but may be subject to a contingent deferred sales charge (“CDSC”) if redeemed within eighteen months of purchase. Class C Shares are sold without an up-front sales charge but incur a .75% annual 12b-1 distribution fee and a .25% annual 12b-1 service fee. Class C Shares are subject to a CDSC of 1% if redeemed within twelve months of purchase. Class R3 Shares are sold without an up-front sales charge but incur a .25% annual 12b-1 distribution fee and a .25% annual 12b-1 service fee. Class I Shares are not subject to any sales charge or 12b-1 distribution or service fees.
During the period October 1, 2011 through March 30, 2012, each Fund may have imposed a 2% redemption fee on shares that were redeemed or exchanged within 90 days of acquisition. Fees imposed on shares redeemed or exchanged are recorded as an increase to each Fund’s capital paid-in and recognized as “Redemption fees” on the Statement of Changes in Net Assets, when applicable.
Effective March 30, 2012, the Funds no longer impose a redemption fee on shares that are redeemed or exchanged within 90 days of acquisition.
Notes to Financial Statements (Unaudited) (continued)
Derivative Financial Instruments
Each Fund is authorized to invest in certain derivative instruments, including foreign currency forwards, futures, options and swap contracts. Although the Funds are authorized to invest in such derivative instruments, and may do so in the future, they did not make any such investments during the six months ended March 31, 2012.
Zero Coupon Securities
Each Fund is authorized to invest in zero coupon securities. A zero coupon security does not pay a regular interest coupon to its holders during the life of the security. Tax-exempt income to the holder of the security comes from accretion of the difference between the original purchase price of the security at issuance and the par value of the security at maturity and is effectively paid at maturity. The market prices of zero coupon securities generally are more volatile than the market prices of securities that pay interest periodically.
Multiclass Operations and Allocations
Income and expenses of the Funds that are not directly attributable to specific class of shares are prorated among the classes based on the relative settled shares of each class. Expenses directly attributable to a class of shares, which presently only include 12b-1 distribution and service fees, are recorded to the specific class.
Realized and unrealized gains and losses of the Funds are prorated among the classes based on the relative net assets of each class.
Repurchase Agreements
In connection with transactions in repurchase agreements, it is each Fund’s policy that its custodian take possession of the underlying collateral securities, the fair value of which exceeds the principal amount of the repurchase transaction, including accrued interest, at all times. If the counterparty defaults, and the fair value of the collateral declines, realization of the collateral may be delayed or limited.
Custodian Fee Credit
Each Fund has an arrangement with the custodian bank whereby certain custodian fees and expenses are reduced by net credits earned on each Fund’s cash on deposit with the bank. Such deposit arrangements are an alternative to overnight investments. Credits for cash balances may be offset by charges for any days on which a Fund overdraws its account at the custodian bank.
Indemnifications
Under the Trust’s organizational documents, its officers and trustees are indemnified against certain liabilities arising out of the performance of their duties to the Trust. In addition, in the normal course of business, the Trust enters into contracts that provide general indemnifications to other parties. The Trust’s maximum exposure under these arrangements is unknown as this would involve future claims that may be made against the Trust that have not yet occurred. However, the Trust has not had prior claims or losses pursuant to these contracts and expects the risk of loss to be remote.
Use of Estimates
The preparation of financial statements in conformity with U.S. GAAP requires management to make estimates and assumptions that affect the reported amounts of assets and liabilities at the date of the financial statements and the reported amounts of increases and decreases in net assets from operations during the reporting period. Actual results may differ from those estimates.
2. Fair Value Measurements
Fair value is defined as the price that the Funds would receive upon selling an investment or transferring a liability in an orderly transaction to an independent buyer in the principal or most advantageous market for the investment. A three-tier hierarchy is used to maximize the use of observable market data and minimize the use of unobservable inputs and to establish classification of fair value measurements for disclosure purposes. Observable inputs reflect the assumptions market participants would use in pricing the asset or liability. Observable inputs are based on market data obtained from sources independent of the reporting entity. Unobservable inputs reflect the reporting entity’s own assumptions about the assumptions market participants would use in pricing the asset or liability. Unobservable inputs are based on the best information available in the circumstances. The three-tier hierarchy of inputs is summarized in the three broad levels listed below:
| | |
| Level 1 – | | Quoted prices in active markets for identical securities. |
| Level 2 – | | Other significant observable inputs (including quoted prices for similar securities, interest rates, prepayment speeds, credit risk, etc.). |
| Level 3 – | | Significant unobservable inputs (including management’s assumptions in determining the fair value of investments). |
The inputs or methodologies used for valuing securities are not an indication of the risk associated with investing in those securities.
The following is a summary of each Fund’s fair value measurements as of March 31, 2012:
| | | | | | | | | | | | | | | | |
| Symphony Credit Opportunities | | Level 1 | | | Level 2 | | | Level 3 | | | Total | |
Long-Term Investments: | | | | | | | | | | | | | | | | |
Convertible Bonds | | $ | — | | | $ | 2,249,438 | | | $ | — | | | $ | 2,249,438 | |
Corporate Bonds | | | — | | | | 108,489,844 | | | | — | | | | 108,489,844 | |
Variable Rate Senior Loan Interests | | | — | | | | 42,333,505 | | | | — | | | | 42,333,505 | |
Short-Term Investments: | | | | | | | | | | | | | | | | |
Repurchase Agreements | | | — | | | | 17,330,900 | | | | — | | | | 17,330,900 | |
Total | | $ | — | | | $ | 170,403,687 | | | $ | — | | | $ | 170,403,687 | |
| | | | | | | | | | | | | | | | |
| Symphony Floating Rate Income | | Level 1 | | | Level 2 | | | Level 3 | | | Total | |
Long-Term Investments: | | | | | | | | | | | | | | | | |
Corporate Bonds | | $ | — | | | $ | 1,031,627 | | | $ | — | | | $ | 1,031,627 | |
Variable Rate Senior Loan Interests | | | — | | | | 11,700,416 | | | | — | | | | 11,700,416 | |
Short-Term Investments: | | | | | | | | | | | | | | | | |
Repurchase Agreements | | | — | | | | 743,956 | | | | — | | | | 743,956 | |
Total | | $ | — | | | $ | 13,475,999 | | | $ | — | | | $ | 13,475,999 | |
During the six months ended March 31, 2012, the Funds recognized no significant transfers to or from Level 1, Level 2 or Level 3.
3. Derivative Instruments and Hedging Activities
The Funds record derivative instruments at fair value, with changes in fair value recognized on the Statement of Operations, when applicable. Even though the Funds’ investments in derivatives may represent economic hedges, they are not considered to be hedge transactions for financial reporting purposes. The Funds did not invest in derivative instruments during the six months ended March 31, 2012.
4. Fund Shares
Transactions in Fund shares were as follows:
| | | | | | | | | | | | | | | | |
| | | Symphony Credit Opportunities | |
| | | Six Months Ended
3/31/12 | | | Year Ended
9/30/11 | |
| | | Shares | | | Amount | | | Shares | | | Amount | |
Shares sold: | | | | | | | | | | | | | | | | |
Class A | | | 1,500,197 | | | $ | 30,983,663 | | | | 1,161,564 | | | $ | 24,447,461 | |
Class C | | | 582,562 | | | | 12,148,605 | | | | 616,650 | | | | 12,938,145 | |
Class R3 | | | — | | | | — | | | | 141 | | | | 3,025 | |
Class I | | | 1,851,030 | | | | 38,359,349 | | | | 2,702,173 | | | | 56,579,469 | |
Shares issued to shareholders due to reinvestment of distributions: | | | | | | | | | | | | | | | | |
Class A | | | 52,728 | | | | 1,101,115 | | | | 36,764 | | | | 759,700 | |
Class C | | | 13,940 | | | | 290,867 | | | | 8,736 | | | | 180,180 | |
Class R3 | | | 5 | | | | 95 | | | | 4 | | | | 92 | |
Class I | | | 101,717 | | | | 2,121,270 | | | | 107,918 | | | | 2,237,699 | |
| | | | 4,102,179 | | | | 85,004,964 | | | | 4,633,950 | | | | 97,145,771 | |
Shares redeemed: | | | | | | | | | | | | | | | | |
Class A | | | (252,788 | ) | | | (5,232,859 | ) | | | (187,391 | ) | | | (3,924,595 | ) |
Class C | | | (52,697 | ) | | | (1,080,472 | ) | | | (123,720 | ) | | | (2,588,040 | ) |
Class R3 | | | — | | | | — | | | | (60,105 | ) | | | (1,271,965 | ) |
Class I | | | (407,072 | ) | | | (8,258,313 | ) | | | (865,302 | ) | | | (17,942,035 | ) |
| | | | (712,557 | ) | | | (14,571,644 | ) | | | (1,236,518 | ) | | | (25,726,635 | ) |
Net increase (decrease) | | | 3,389,622 | | | $ | 70,433,320 | | | | 3,397,432 | | | $ | 71,419,136 | |
| | | | | | | | | | | | | | | | |
| | | Symphony Floating Rate Income | |
| | | Six Months Ended
3/31/12 | | | For the Period 5/2/11
(commencement of
operations) through 9/30/11 | |
| | | Shares | | | Amount | | | Shares | | | Amount | |
Shares sold: | | | | | | | | | | | | | | | | |
Class A | | | 12,101 | | | $ | 234,896 | | | | 14,726 | | | $ | 293,219 | |
Class C | | | 15,691 | | | | 307,334 | | | | 13,362 | | | | 266,555 | |
Class R3 | | | — | | | | — | | | | 12,500 | | | | 250,000 | |
Class I | | | 109,662 | | | | 2,111,383 | | | | 462,500 | | | | 9,250,000 | |
Shares issued to shareholders due to reinvestment of distributions: | | | | | | | | | | | | | | | | |
Class A | | | 183 | | | | 3,593 | | | | 17 | | | | 326 | |
Class C | | | 111 | | | | 2,192 | | | | 7 | | | | 118 | |
Class R3 | | | — | | | | — | | | | — | | | | — | |
Class I | | | 1,809 | | | | 35,633 | | | | — | | | | — | |
| | | | 139,557 | | | | 2,695,031 | | | | 503,112 | | | | 10,060,218 | |
Notes to Financial Statements (Unaudited) (continued)
| | | | | | | | | | | | | | | | |
| | | Symphony Floating Rate Income | |
| | | Six Months Ended
3/31/12 | | | For the Period 5/2/11
(commencement of
operations) through 9/30/11 | |
| | | Shares | | | Amount | | | Shares | | | Amount | |
Shares redeemed: | | | | | | | | | | | | | | | | |
Class A | | | (744 | ) | | $ | (14,140 | ) | | | — | | | $ | — | |
Class C | | | (1,773 | ) | | | (34,020 | ) | | | — | | | | — | |
Class R3 | | | — | | | | — | | | | — | | | | — | |
Class I | | | — | | | | — | | | | — | | | | — | |
| | | | (2,517 | ) | | | (48,160 | ) | | | — | | | | — | |
Net increase (decrease) | | | 137,040 | | | $ | 2,646,871 | | | | 503,112 | | | $ | 10,060,218 | |
5. Investment Transactions
Purchases and sales (including maturities but excluding short-term investments) for the six months ended March 31, 2012, were as follows:
| | | | | | | | |
| | | Symphony
Credit
Opportunities | | | Symphony
Floating Rate
Income | |
Purchases | | $ | 110,088,539 | | | $ | 10,318,124 | |
Sales and maturities | | | 54,332,150 | | | | 7,618,897 | |
6. Income Tax Information
The following information is presented on an income tax basis. Differences between amounts for financial statement and federal income tax purposes are primarily due to timing differences in recognizing certain gains and losses on investment transactions. To the extent that differences arise that are permanent in nature, such amounts are reclassified within the capital accounts as detailed below. Temporary differences do not require reclassification. Temporary and permanent differences do not impact the net asset values of the Funds.
At March 31, 2012, the cost and unrealized appreciation (depreciation) of investments, as determined on a federal income tax basis, were as follows:
| | | | | | | | |
| | | Symphony
Credit
Opportunities | | | Symphony
Floating Rate
Income | |
Cost of investments | | $ | 165,650,994 | | | $ | 13,299,557 | |
Gross unrealized: | | | | | | | | |
Appreciation | | $ | 5,549,357 | | | $ | 284,979 | |
Depreciation | | | (796,664 | ) | | | (108,537 | ) |
Net unrealized appreciation (depreciation) of investments | | $ | 4,752,693 | | | $ | 176,442 | |
Permanent differences, primarily due to nondeductible stock issuance costs, paydowns and bond premium amortization, resulted in reclassifications among the Funds’ components of net assets at September 30, 2011, the Funds’ last tax year end, as follows:
| | | | | | | | |
| | | Symphony
Credit
Opportunities | | | Symphony
Floating Rate
Income | |
Capital paid-in | | $ | — | | | $ | (1,085 | ) |
Undistributed (Over-distribution of) net investment income | | | (110,412 | ) | | | 2,464 | |
Accumulated net realized gain (loss) | | | 110,412 | | | | (1,379 | ) |
The tax components of undistributed net ordinary income and net long-term capital gains at September 30, 2011, the Funds’ last tax year end, were as follows:
| | | | | | | | |
| | | Symphony
Credit
Opportunities | | | Symphony
Floating Rate
Income | |
Undistributed net ordinary income* | | $ | 942,109 | | | $ | 45,157 | |
Undistributed net long-term capital gains | | | — | | | | — | |
| * | Undistributed net ordinary income (on a tax basis) has not been reduced for the dividend declared during the period September 1, 2011 through September 30, 2011, and paid on October 3, 2011. Net ordinary income consists of net taxable income derived from dividends, interest, and net short-term capital gains, if any. |
The tax character of distributions paid during the Funds’ last tax year ended September 30, 2011, was designated for purposes of the dividends paid deduction as follows:
| | | | | | | | |
| | | Symphony
Credit
Opportunities | | | Symphony
Floating Rate
Income** | |
Distributions from net ordinary income* | | $ | 3,974,826 | | | $ | 141,507 | |
Distributions from net long-term capital gains | | | — | | | | — | |
| * | Net ordinary income consists of net taxable income derived from dividends, interest, and net short-term capital gains, if any. |
| ** | For the period May 2, 2011 (commencement of operations) through September 30, 2011. |
The Funds have elected to defer net realized losses from investments incurred from November 1, 2010 through September 30, 2011, the Funds’ last tax year end, (“post-October losses”) in accordance with federal income tax regulations. Post-October losses are treated as having arisen on the first day of the current fiscal year. The Funds have elected to defer post-October losses as follows:
| | | | | | | | |
| | | Symphony
Credit
Opportunities | | | Symphony
Floating Rate
Income* | |
Post-October capital losses | | $ | 430,929 | | | $ | 160,089 | |
| * | For the period May 2, 2011 (commencement of operations) through September 30, 2011. |
7. Management Fees and Other Transactions with Affiliates
Each Fund’s management fee consists of two components – a fund-level fee, based only on the amount of assets within the Fund, and a complex-level fee, based on the aggregate amount of all eligible fund assets managed by the Adviser. This pricing structure enables each Fund’s shareholders to benefit from growth in the assets within their respective Fund as well as from growth in the amount of complex-wide assets managed by the Adviser.
The annual fund-level fee for each Fund, payable monthly, is calculated according to the following schedule:
| | | | | | | | |
| Average Daily Net Assets | | Symphony Credit
Opportunities
Fund-Level
Fee Rate | | | Symphony
Floating Rate
Income
Fund-Level
Fee Rate | |
For the first $125 million | | | .4500 | % | | | .4500 | % |
For the next $125 million | | | .4375 | | | | .4375 | |
For the next $250 million | | | .4250 | | | | .4250 | |
For the next $500 million | | | .4125 | | | | .4125 | |
For the next $1 billion | | | .4000 | | | | .4000 | |
For net assets over $2 billion | | | .3750 | | | | .3750 | |
The annual complex-level fee for each Fund, payable monthly, is calculated according to the following schedule:
| | | | |
| Complex-Level Asset Breakpoint Level* | | Effective Rate at Breakpoint Level | |
$55 billion | | | .2000 | % |
$56 billion | | | .1996 | |
$57 billion | | | .1989 | |
$60 billion | | | .1961 | |
$63 billion | | | .1931 | |
$66 billion | | | .1900 | |
$71 billion | | | .1851 | |
$76 billion | | | .1806 | |
$80 billion | | | .1773 | |
$91 billion | | | .1691 | |
$125 billion | | | .1599 | |
$200 billion | | | .1505 | |
$250 billion | | | .1469 | |
$300 billion | | | .1445 | |
| * | The complex-level fee is calculated based upon the aggregate daily “eligible assets” of all Nuveen Funds. Eligible assets do not include assets attributable to investments in other Nuveen Funds or assets in excess of $2 billion added to the Nuveen Fund complex in connection with the Adviser’s assumption of the management of the former First American Funds effective January 1, 2011. Eligible assets include closed-end fund assets managed by the Adviser that are attributable to financial leverage. For these purposes, financial leverage includes the closed-end funds’ use of preferred stock and borrowings and investments in the residual interest certificates (also called inverse floating rate securities) in tender option bond (TOB) trusts, including the portion of assets held by a TOB trust that has been effectively financed by the trust’s issuance of floating rate securities, subject to an agreement by the Adviser as to certain funds to limit the amount of such assets for determining eligible assets in certain circumstances. As of March 31, 2012, the complex-level fee rate for each of these Funds was .1735%. |
Notes to Financial Statements (Unaudited) (continued)
The management fee compensates the Adviser for overall investment advisory and administrative services and general office facilities. The Adviser is responsible for each Fund’s overall strategy and asset allocation decisions. The Adviser has entered into sub-advisory agreements with Symphony under which Symphony manages the investment portfolios of the Funds. Symphony is compensated for its services to the Funds from the management fees paid to the Adviser.
The Adviser has agreed to waive fees and reimburse expenses (“Expense Cap”) of the Funds so that total annual Fund operating expenses (excluding 12b-1 distribution and/or service fees, interest expenses, taxes, fees incurred in acquiring and disposing of portfolio securities and extraordinary expenses) do not exceed the average daily net assets of any class of Fund shares in the amounts and for the time periods stated in the following table.
| | | | | | | | | | | | |
| Fund | | Temporary
Expense Cap | | | Temporary
Expense Cap
Expiration Date | | | Permanent
Expense Cap | |
Symphony Credit Opportunities | | | .85 | % | | | January 31, 2013 | | | | 1.35 | % |
Symphony Floating Rate Income | | | .85 | | | | January 31, 2014 | | | | 1.10 | |
The Adviser may also voluntarily reimburse expenses from time to time in any of the Funds. Voluntary reimbursements may be terminated at any time at the Adviser’s discretion.
The Trust pays no compensation directly to those of its trustees who are affiliated with the Adviser or to its officers, all of whom receive remuneration for their services to the Trust from the Adviser or its affiliates. The Board of Trustees has adopted a deferred compensation plan for independent trustees that enables trustees to elect to defer receipt of all or a portion of the annual compensation they are entitled to receive from certain Nuveen-advised funds. Under the plan, deferred amounts are treated as though equal dollar amounts had been invested in shares of select Nuveen-advised funds.
During the six months ended March 31, 2012, Nuveen Securities, LLC (the “Distributor”), a wholly-owned subsidiary of Nuveen, collected sales charges on purchases of Class A Shares, the majority of which were paid out as concessions to financial intermediaries as follows:
| | | | | | | | |
| | | Symphony
Credit
Opportunities | | | Symphony
Floating Rate
Income | |
Sales charges collected | | $ | 90,942 | | | $ | — | |
Paid to financial intermediaries | | | 81,662 | | | | — | |
The Distributor also received 12b-1 service fees on Class A Shares, substantially all of which were paid to compensate financial intermediaries for providing services to shareholders relating to their investments.
During the six months ended March 31, 2012, the Distributor compensated financial intermediaries directly with commission advances at the time of purchase as follows:
| | | | | | | | |
| | | Symphony
Credit
Opportunities | | | Symphony
Floating Rate
Income | |
Commission advances | | $ | 121,735 | | | $ | 2,163 | |
To compensate for commissions advanced to financial intermediaries and all 12b-1 service and distribution fees collected on Class C Shares during the first year following a purchase are retained by the Distributor. During the six months ended March 31, 2012, the Distributor retained such 12b-1 fees as follows:
| | | | | | | | |
| | | Symphony
Credit
Opportunities | | | Symphony
Floating Rate
Income | |
12b-1 fees retained | | $ | 60,935 | | | $ | 1,544 | |
The remaining 12b-1 fees charged to the Funds were paid to compensate financial intermediaries for providing services to shareholders relating to their investments.
The Distributor also collected and retained CDSC on share redemptions during the six months ended March 31, 2012, as follows:
| | | | | | | | |
| | | Symphony
Credit
Opportunities | | | Symphony
Floating Rate
Income | |
CDSC retained | | $ | 5,353 | | | $ | 295 | |
At March 31, 2012, Nuveen owned shares of the Funds as follows:
| | | | | | | | |
| | | Symphony
Credit
Opportunities | | | Symphony
Floating Rate
Income | |
Class A Shares | | | — | | | $ | 12,500 | |
Class C Shares | | | — | | | | 12,500 | |
Class R3 Shares | | | 2,395 | | | | 12,500 | |
Class I Shares | | | — | | | | 462,500 | |
8. Senior Loan Commitments
Unfunded Commitments
Pursuant to the terms of certain of the variable rate senior loan agreements, the Funds may have unfunded senior loan commitments. Each Fund will maintain with the custodian, cash, liquid securities and/or liquid senior loans having an aggregate value at least equal to the amount of unfunded senior loan commitments. At March 31, 2012, Symphony Credit Opportunities and Symphony Floating Rate Income had unfunded senior loan commitments of $107,143 and $64,286, respectively.
Participation Commitments
With respect to the senior loans held in each Fund’s portfolio, the Funds may: 1) invest in assignments; 2) act as a participant in primary lending syndicates; or 3) invest in participations. If a Fund purchases a participation of a senior loan interest, the Fund would typically enter into a contractual agreement with the lender or other third party selling the participation, rather than directly with the borrower. As such, the Fund not only assumes the credit risk of the borrower, but also that of the selling participant or other persons interpositioned between the Fund and the borrower. At March 31, 2012, there were no such outstanding participation commitments in either of the Funds.
9. New Accounting Pronouncements
Financial Accounting Standards Board (“FASB”) Transfers and Servicing (Topic 860): Reconsideration of Effective Control for Repurchase Agreements
On April 15, 2011, the FASB issued Accounting Standards Update (“ASU”) No. 2011-03 (“ASU No. 2011-03”). The guidance in ASU No. 2011-03 is intended to improve the accounting for repurchase agreements and other similar agreements. Specifically, ASU No. 2011-03 modifies the criteria for determining when these transactions would be accounted for as financing transactions (secured borrowings/lending agreements) as opposed to sale (purchase) transactions with commitments to repurchase (resell). The effective date of ASU No. 2011-03 is for interim and annual periods beginning on or after December 15, 2011. At this time, management is evaluating the implications of this guidance and the impact it will have to the financial statement amounts and footnote disclosures, if any.
Fair Value Measurements and Disclosures
On May 12, 2011, the FASB issued ASU No. 2011-04 modifying Topic 820, Fair Value Measurements and Disclosures. At the same time, the International Accounting Standards Board (“IASB”) issued International Financial Reporting Standard (“IFRS”) 13, Fair Value Measurement. The objective of the FASB and IASB is convergence of their guidance on fair value measurements and disclosures. Specifically, ASU No. 2011-04 requires reporting entities to disclose i) the amounts of any transfers between Level 1 and Level 2, and the reasons for the transfers and ii) for Level 3 fair value measurements, a) quantitative information about significant unobservable inputs used, b) a description of the valuation processes used by the reporting entity and c) a narrative description of the sensitivity of the fair value measurement to changes in unobservable inputs if a change in those inputs might result in a significantly higher or lower fair value measurement. The effective date of ASU No. 2011-04 is for interim and annual periods beginning after December 15, 2011. At this time, management is evaluating the implications of this guidance and the impact it will have to the financial statement amounts and footnote disclosures, if any.
Glossary of Terms Used in this Report
Average Annual Total Return: This is a commonly used method to express an investment’s performance over a particular, usually multi-year time period. It expresses the return that would have been necessary each year to equal the investment’s actual cumulative performance (including change in NAV or offer price and reinvested distributions and capital gains, if any) over the time period being considered.
BofA Merrill Lynch – Credit Suisse Index Blend: An index comprised 60% of the BofA Merrill Lynch U.S. High Yield Master II Index and 40% Credit Suisse Leveraged Loan Index. The BofA Merrill Lynch U.S. High Yield Master II Index is a market value-weighted index of all domestic and yankee high-yield bonds having maturities of one year or more and a credit rating lower than BBB-/Baa3, but are not in default. The Credit Suisse Leveraged Loan Index is a representative, unmanaged index of tradeable, senior, U.S. dollar-denominated leveraged loans. Index returns assume reinvestment of distributions, but do not reflect any applicable sales charges or management fees. It is not possible to invest directly in an index.
BofA Merrill Lynch U.S. High Yield Master II Index: A market value-weighted index of all domestic and yankee high-yield bonds having maturities of one year or more and a credit rating lower than BBB-/Baa3, but are not in default. Index returns assume reinvestment of distributions, but do not reflect any applicable sales charges or management fees. It is not possible to invest directly in an index.
Credit Suisse Leveraged Loan Index: The Credit Suisse Leveraged Loan Index is a representative, unmanaged index of tradeable, senior, U.S. dollar-denominated leveraged loans. Index returns assume reinvestment of distributions, but do not reflect any applicable sales charges or management fees. It is not possible to invest directly in an index.
Lipper High Current Yield Funds Classification Average: Represents the average annualized total return for all reporting funds in the Lipper High Current Yield Funds Classification. The High Current Yield Funds Classification Average contained 508, 500 and 463 funds for the 6-month, 1-year and since inception periods, respectively, ended March 31, 2012. Lipper returns account for the effects of management fees and assume reinvestment of distributions, but do not reflect any applicable sales charges. The Lipper average is not available for direct investment.
Lipper Loan Participation Funds Classification Average: Represents the average annualized total return for all reporting funds in the Lipper Loan Participation Funds Classification. The Lipper Loan Participation Funds Classification Average contained 163 and 139 funds for the 6-month and since inception periods, respectively, ended March 31, 2012. Lipper returns account for the effects of management fees and assume reinvestment of distributions, but do not reflect any applicable sales charges. The Lipper average is not available for direct investment.
Net Asset Value (NAV): The net market value of all securities held in a portfolio.
Net Asset Value (NAV) Per Share: The market value of one share of a mutual fund or closed-end fund. For a Fund, the NAV is calculated daily by taking the Fund’s total assets (securities, cash, and accrued earnings), subtracting the Fund’s liabilities, and dividing by the number of shares outstanding.
Zero Coupon Bond: A zero coupon bond does not pay a regular interest coupon to its holders during the life of the bond. Tax-exempt income to the holder of the bond comes from accretion of the difference between the original purchase price of the bond at issuance and the par value of the bond at maturity and is effectively paid at maturity. The market prices of zero coupon bonds generally are more volatile than the market prices of bonds that pay interest periodically.
Additional Fund Information
Fund Manager
Nuveen Fund Advisors, Inc.
333 West Wacker Drive
Chicago, IL 60606
Sub-Adviser
Symphony Asset Management LLC
555 California Street
Rene Suite 2975
San Francisco, CA 94104
Legal Counsel
Chapman and Cutler LLP
Chicago, IL
Independent Registered Public Accounting Firm
PricewaterhouseCoopers LLP
Chicago, IL
Custodian
State Street Bank & Trust Company
Boston, MA
Transfer Agent and Shareholder Services
Boston Financial
Data Services, Inc.
Nuveen Investor Services
P.O. Box 8530
Boston, MA 02266-8530
(800) 257-8787
Quarterly Portfolio of Investments and Proxy Voting information: You may obtain (i) each Fund’s quarterly portfolio of investments, (ii) information regarding how the Funds voted proxies relating to portfolio securities held during the most recent twelve-month period ended June 30, and (iii) a description of the policies and procedures that the Funds used to determine how to vote proxies relating to portfolio securities without charge, upon request, by calling Nuveen Investments at (800) 257-8787 or on Nuveen’s website at www.nuveen.com.
You may also obtain this and other Fund information directly from the Securities and Exchange Commission (SEC). The SEC may charge a copying fee for this information. Visit the SEC on-line at http://www.sec.gov or in person at the SEC’s Public Reference Room in Washington, D.C. Call the SEC at (202) 942-8090 for room hours and operation. You may also request Fund information by sending an e-mail request to publicinfo@sec.gov or by writing to the SEC’s Public Reference Section at 100 F Street NE, Washington, D.C. 20549.
The Financial Industry Regulatory Authority (FINRA) provides a Public Disclosure Program which supplies certain information regarding the disciplinary history of FINRA members and their associated persons in response to either telephone inquiries at (800) 289-9999 or written inquiries at www.finra.org. FINRA also provides an investor brochure that includes information describing the Public Disclosure Program.
Nuveen Investments:
Serving Investors for Generations
Since 1898, financial advisors and their clients have relied on Nuveen Investments to provide dependable investment solutions through continued adherence to proven, long-term investing principles. Today, we offer a range of high quality equity and fixed-income solutions designed to be integral components of a well-diversified core portfolio.
Focused on meeting investor needs.
Nuveen Investments provides high-quality investment services designed to help secure the longterm goals of institutional and individual investors as well as the consultants and financial advisors who serve them. Nuveen Investments markets a wide range of specialized investment solutions which provide investors access to capabilities of its high-quality boutique investment affiliates-Nuveen Asset Management, Symphony Asset Management, NWQ Investment Management Company, Santa Barbara Asset Management, Tradewinds Global Investors, Winslow Capital Management, and Gresham Investment Management. In total, Nuveen Investments managed approximately $227 billion as of March 31, 2012.
Find out how we can help you.
To learn more about how the products and services of Nuveen Investments may be able to help you meet your financial goals, talk to your financial advisor, or call us at (800) 257-8787. Please read the information provided carefully before you invest. Investors should consider the investment objective and policies, risk considerations, charges and expenses of any investment carefully. Where applicable, be sure to obtain a prospectus, which contains this and other relevant information. To obtain a prospectus, please contact your securities representative or Nuveen Investments, 333 W. Wacker Dr., Chicago, IL 60606. Please read the prospectus carefully before you invest or send money.
Learn more about Nuveen Funds at: www.nuveen.com/mf
| | |
Distributed by Nuveen Securities, LLC 333 West Wacker Drive Chicago, IL 60606 www.nuveen.com | | |
MSA-SCFR-0312P
Item 2. Code of Ethics.
Not applicable to this filing.
Item 3. Audit Committee Financial Expert.
Not applicable to this filing.
Item 4. Principal Accountant Fees and Services.
Not applicable to this filing.
Item 5. Audit Committee of Listed Registrants.
Not applicable to this registrant.
Item 6. Schedule of Investments.
(a) See Portfolio of Investments in Item 1.
(b) Not applicable.
Item 7. Disclosure of Proxy Voting Policies and Procedures for Closed-End Management Investment Companies.
Not applicable to this registrant.
Item 8. Portfolio Managers of Closed-End Management Investment Companies.
Not applicable to this registrant.
Item 9. Purchases of Equity Securities by Closed-End Management Investment Company and Affiliated Purchasers.
Not applicable to this registrant.
Item 10. Submission of Matters to a Vote of Security Holders.
There have been no material changes to the procedures by which shareholders may recommend nominees to the registrant’s Board implemented after the registrant last provided disclosure in response to this item.
Item 11. Controls and Procedures.
| (a) | The registrant’s principal executive and principal financial officers, or persons performing similar functions, have concluded that the registrant’s disclosure controls and procedures (as defined in Rule 30a-3(c) under the Investment Company Act of 1940, as amended (the “1940 Act”) (17 CFR 270.30a-3(c))) are effective, as of a date within 90 days of the filing date of this report that includes the disclosure required by this paragraph, based on their evaluation of the controls and procedures required by Rule 30a-3(b) under the 1940 Act (17 CFR 270.30a-3(b)) and Rules 13a-15(b) or 15d-15(b) under the Securities Exchange Act of 1934, as amended (the “Exchange Act”) (17 CFR 240.13a-15(b) or 240.15d-15(b)). |
| (b) | There were no changes in the registrant’s internal control over financial reporting (as defined in Rule 30a-3(d) under the 1940 Act (17 CFR 270.30a-3(d)) that occurred during the second fiscal quarter of the period covered by this report that has materially affected, or is reasonably likely to materially affect, the registrant’s internal control over financial reporting. |
Item 12. Exhibits.
File the exhibits listed below as part of this Form.
(a)(1) Any code of ethics, or amendment thereto, that is the subject of the disclosure required by Item 2, to the extent that the registrant intends to satisfy the Item 2 requirements through filing of an exhibit: Not applicable to this filing.
(a)(2) A separate certification for each principal executive officer and principal financial officer of the registrant as required by Rule 30a-2(a) under the 1940 Act (17 CFR 270.30a-2(a)) in the exact form set forth below: See EX-99.CERT attached hereto.
(a)(3) Any written solicitation to purchase securities under Rule 23c-1 under the 1940 Act (17 CFR 270.23c-1) sent or given during the period covered by the report by or on behalf of the registrant to 10 or more persons: Not applicable to this registrant.
(b) If the report is filed under Section 13(a) or 15(d) of the Exchange Act, provide the certifications required by Rule 30a-2(b) under the 1940 Act (17 CFR 270.30a-2(b)), Rule 13a-14(b) or Rule 15d-14(b) under the Exchange Act (17 CFR 240.13a-14(b) or 240.15d-14(b)), and Section 1350 of Chapter 63 of Title 18 of the United States Code (18 U.S.C. 1350) as an Exhibit. A certification furnished pursuant to this paragraph will not be deemed “filed” for purposes of Section 18 of the Exchange Act (15 U.S.C. 78r), or otherwise subject to the liability of that section. Such certification will not be deemed to be incorporated by reference into any filing under the Securities Act of 1933 or the Exchange Act, except to the extent that the registration specifically incorporates it by reference: See EX-99.906 CERT attached hereto.
SIGNATURES
Pursuant to the requirements of the Securities Exchange Act of 1934 and the Investment Company Act of 1940, the registrant has duly caused this report to be signed on its behalf by the undersigned, thereunto duly authorized.
(Registrant) Nuveen Investment Trust III
| | | | | | |
| By | | (Signature and Title) | | /s/ Kevin J. McCarthy | | |
| | | | Kevin J. McCarthy Vice President and Secretary | | |
Date: June 7, 2012
Pursuant to the requirements of the Securities Exchange Act of 1934 and the Investment Company Act of 1940, this report has been signed below by the following persons on behalf of the registrant and in the capacities and on the dates indicated.
| | | | | | |
| By | | (Signature and Title) | | /s/ Gifford R. Zimmerman | | |
| | | | Gifford R. Zimmerman Chief Administrative Officer (principal executive officer) | | |
Date: June 7, 2012
| | | | | | |
| By | | (Signature and Title) | | /s/ Stephen D. Foy | | |
| | | | Stephen D. Foy Vice President and Controller (principal financial officer) | | |
Date: June 7, 2012