UNITED STATES
SECURITIES AND EXCHANGE COMMISSION
Washington, D.C. 20549
FORM N-CSR
CERTIFIED SHAREHOLDER REPORT OF REGISTERED MANAGEMENT
INVESTMENT COMPANIES
Investment Company Act file number 811-09037
Nuveen Investment Trust III
(Exact name of registrant as specified in charter)
Nuveen Investments
333 West Wacker Drive, Chicago, IL 60606
(Address of principal executive offices) (Zip code)
Kevin J. McCarthy
Nuveen Investments
333 West Wacker Drive, Chicago, IL 60606
(Name and address of agent for service)
Registrant’s telephone number, including area code: (312) 917-7700
Date of fiscal year end: September 30
Date of reporting period: March 31, 2013
Form N-CSR is to be used by management investment companies to file reports with the Commission not later than 10 days after the transmission to stockholders of any report that is required to be transmitted to stockholders under Rule 30e-1 under the Investment Company Act of 1940 (17 CFR 270.30e-1). The Commission may use the information provided on Form N-CSR in its regulatory, disclosure review, inspection, and policy making roles.
A registrant is required to disclose the information specified by Form N-CSR, and the Commission will make this information public. A registrant is not required to respond to the collection of information contained in Form N-CSR unless the Form displays a currently valid Office of Management and Budget (“OMB”) control number. Please direct comments concerning the accuracy of the information collection burden estimate and any suggestions for reducing the burden to Secretary, Securities and Exchange Commission, 450 Fifth Street, NW, Washington, DC 20549-0609. The OMB has reviewed this collection of information under the clearance requirements of 44 U.S.C. ss.3507.
Item 1. Reports to Stockholders.

Mutual Funds
Nuveen Taxable Bond Funds
For investors seeking a high level of current income and capital appreciation.
Semi-Annual Report
March 31, 2013
| | | | | | |
| | | Share Class / Ticker Symbol |
| | | |
| Fund Name | | Class A | | Class C | | Class I |
Nuveen Symphony Credit Opportunities Fund | | NCOAX | | NCFCX | | NCOIX |
Nuveen Symphony Floating Rate Income Fund | | NFRAX | | NFFCX | | NFRIX |
Nuveen Symphony High Yield Bond Fund | | NSYAX | | NSYCX | | NSYIX |
LIFE IS COMPLEX.
Nuveen makes things e-simple.
It only takes a minute to sign up for e-Reports. Once enrolled, you’ll receive an e-mail as soon as your Nuveen Fund information is ready. No more waiting for delivery by regular mail. Just click on the link within the e-mail to see the report and save it on your computer if you wish.
Free e-Reports right to your e-mail!
www.investordelivery.com
If you receive your Nuveen Fund distributions and statements from your financial advisor or brokerage account.
OR
www.nuveen.com/accountaccess
If you receive your Nuveen Fund distributions and statements directly from Nuveen.
| | | | | | |
| Must be preceded by or accompanied by a prospectus. | | NOT FDIC INSURED | | MAY LOSE VALUE | | NO BANK GUARANTEE |
Table of Contents
Chairman’s
Letter to Shareholders

Dear Shareholders,
The global economy continues to struggle with low growth rates. The European Central Bank’s commitment to “do what it takes” to support sovereign debt markets has stabilized the broader euro area financial markets. The larger member states of the European Union (EU) are working diligently on a tighter financial and banking union and meaningful progress is being made. However, economic conditions in the southern tier members are not improving and their political leaders are becoming more forceful in their demands for loosening the current EU fiscal targets and timetables. Economic growth in emerging market countries continues to be buffeted by lower overseas demand for their manufactured products and raw materials.
In the U.S., the Fed’s commitment to low interest rates through Quantitative Easing is the subject of increasing debate in its policy making deliberations and many independent economists are expressing concern about the economic distortions resulting from negative real interest rates. There are encouraging signs in Congress that both political parties are working toward compromises on previously irreconcilable issues such as reforming immigration laws and the tax code. It is too early to tell whether those efforts will produce meaningful results or pave the way for cooperation on the major fiscal issues that loom ahead. Over the longer term, there are some positive trends for the U.S. economy: house prices are clearly recovering, banks and corporations continue to strengthen their financial positions and incentives for capital investment in the U.S. by domestic and foreign corporations are increasing due to more competitive energy and labor costs.
During the last eighteen months, U.S. investors have benefited from strong returns in the domestic equity markets and steady total returns in many fixed income markets. However, many macroeconomic risks remain unresolved, including negotiating through the many U.S. fiscal issues, achieving a better balance between fiscal discipline and encouraging economic growth in the euro area and reducing the potential economic impact of geopolitical issues, particularly in the Middle East and East Asia. In the face of these uncertainties, the experienced investment professionals at Nuveen Investments seek out investments that are enjoying positive and sustainable returns. At the same time they are always on the alert for risks in markets that are subject to the excessive optimism that can accompany an extended period of abnormally low interest rates. Monitoring this process is a critical function for the Fund Board as it oversees your Nuveen Fund on your behalf.
As always, I encourage you to communicate with your financial consultant if you have any questions about your investment in a Nuveen Fund. On behalf of the other members of your Fund Board, we look forward to continuing to earn your trust in the months and years ahead.
Sincerely,

Robert P. Bremner
Chairman of the Board
May 24, 2013
Portfolio Managers’ Comments
Certain statements in this report are forward-looking statements. Discussions of specific investments are for illustration only and are not intended as recommendations of individual investments. The forward-looking statements and other views expressed herein are those of the portfolio managers as of the date of this report. Actual future results or occurrences may differ significantly from those anticipated in any forward-looking statements and the views expressed herein are subject to change at any time, due to numerous market and other factors. The Funds disclaim any obligation to update publicly or revise any forward-looking statements or views expressed herein.
Ratings shown are the highest rating given by one of the following national rating agencies: Standard & Poor’s, Moody’s Investors Service, Inc. or Fitch, Inc. Credit ratings are subject to change. AAA, AA, A, and BBB are investment grade ratings; BB, B, CCC, CC, C and D are below-investment grade ratings. Certain bonds backed by U.S. Government or agency securities are regarded as having an implied rating equal to the rating of such securities. Holdings designated N/R are not rated by these national rating agencies.
These Funds are managed by Symphony Asset Management LLC, (Symphony), an affiliate of Nuveen Investments. Gunther Stein, director of investment strategies at Symphony, and Jenny Rhee manage the Nuveen Symphony Credit Opportunities Fund and the Nuveen Symphony High Yield Bond Fund, while Gunther and Scott Caraher oversee the investments of the Nuveen Symphony Floating Rate Income Fund.
Here the managers discuss their key strategies and the performance of the Funds for the six-month reporting period ended March 31, 2013. The Nuveen Symphony High Yield Bond Fund has an abbreviated reporting period from the Fund’s commencement of operations on December 10, 2012 through March 31, 2013.
How did the Funds perform during the six-month reporting period ended March 31, 2013?
The tables in the Fund Performance and Expense Ratios section of this report provide total return performance information for the Funds’ Class A Shares at net asset value (NAV) for the six-month, one-year and since inception periods ended March 31, 2013. The tables also compare the Funds’ returns to comparative market indexes and Lipper classification averages. A more detailed account of each Fund’s performance is provided later in this report.
What was the primary investment strategy for each Fund and how did this strategy affect the Fund’s performance for the six-month period ended March 31, 2013?
Nuveen Symphony Credit Opportunities Fund
The Fund’s Class A Shares at NAV outperformed the BofA Merrill Lynch U.S. High Yield Master II Index, the Custom Benchmark Index and the Lipper High Yield Funds Classification Average during the reporting period. In previous reports the Market Benchmark Index was used as the primary comparative index. During the reporting period, the Market Benchmark Index was renamed the Custom Benchmark Index and given secondary benchmark status. The former secondary benchmark for the Fund, the BofA Merrill Lynch U.S. High Yield Master II Index, became the primary index. Both indexes will be used for performance comparison going forward.
The Fund seeks current income and capital appreciation by investing primarily in debt instruments such as bonds, loans and convertible securities, a substantial portion of which may be rated below investment grade or, if unrated, we deem to be of comparable quality. The Fund may utilize derivatives, including options; futures contracts; options on futures contracts; swap agreements, including interest rate swaps, total return swaps, and credit default swaps; and options on swap agreements.
We base our investment process on fundamental, bottom-up credit analysis. Analysts assess sector dynamics, company business models and asset quality. Specific recommendations are based on an analysis of the relative value of the various types of debt within a company’s capital structure. Inherent in our credit analysis process is the evaluation of potential upside and downside to any credit. As such, we concentrate our efforts on sectors where there is sufficient transparency to assess the downside risk and where firms have assets to support meaningful recovery in case of default. In its focus on downside protection, we favor opportunities where valuations can be quantified and risks assessed.
During the reporting period, high yield bonds and leveraged loans posted strong results. For the fourth quarter 2012 (the most recent data available at the time this report was prepared), Credit Suisse reported bond issuance was $97.4 billion. Senior loan issuance was also robust, with a volume of $96.3 billion. Although investor demand for high yield credit remained strong throughout the earlier part of 2012, investor appetites shifted in the fourth quarter. High yield bond mutual funds saw outflows while loan mutual funds saw inflows. Despite the outflows in the fourth quarter 2012, heavy demand throughout the year led to an increase in the average high yield bond price and a corresponding decrease in yields to near record lows.
During the first quarter of 2013, investors continued to allocate money to risk assets. Although high yield bonds and senior loans lagged equities, they outperformed investment grade bonds and the 10-year Treasury.
During the reporting period, default rates remained well below the historical average long term default rate of 4.2%, according to Credit Suisse. Meanwhile, for fourth quarter the default rate was recorded by Credit Suisse as .59% (or 2.35% annualized).
The Fund benefited from exposure to HD Supply Inc. We owned several of the high yield bond facilities. HD Supply is the commercial arm of Home Depot. The company has performed well recently amid speculation of an IPO. Also enhancing the Fund’s performance were the bonds of Claire’s Stores, Inc., which announced strong earnings during the reporting period. The term loans of Clear Channel also benefited performance. The company is one of the leading global media and entertainment companies specializing in radio, digital, outdoor, mobile, live events, and on-demand entertainment and information services for local communities. The company was expected to address near-term maturities with refinancing transactions. Given Clear Channel’s leverage, this is seen as an overall positive for the company.
Several holdings that detracted from performance included Cengage Learning Acquisitions, Inc., Term Loan. The textbook and software maker announced disappointing earnings during the period. The company also continues to seek merger and acquisition related solutions. Additionally lagging the market was Fairpoint Communications 8.75% bonds. The holding was involved in an amendment and refinancing during the period. Lastly, the B-2 term loan of Toys R Us detracted from performance. The company announced weak holiday sales during the first quarter of 2013.
Nuveen Symphony Floating Rate Income Fund
The Fund’s Class A Shares at NAV outperformed both the Credit Suisse Leveraged Loan Index and the Lipper Loan Participation Funds Classification Average during the reporting period.
The Fund seeks current income and capital appreciation by investing primarily in floating rate loans and other floating rate securities, a substantial portion of which will be rated below investment-grade. The Fund invests at least 80% of its net assets (plus the amount of any borrowings for investment purposes) in floating rate securities. Floating rate securities are defined to include floating rate loans, other floating rate debt securities, money market securities and shares of money market and short-term bond funds. The Fund may invest up to 20% of its net assets in other securities, which would primarily be fixed rate debt securities, convertible securities and equity securities received as a result of the restructuring of an issuer’s debt. A substantial portion of the Fund’s assets generally will be invested in securities rated below investment grade or, if unrated, we deemed to be of comparable quality. The Fund may utilize derivatives, including options; futures contracts; options on futures contracts; swap agreements, including interest rate swaps, total return swaps, and credit default swaps; and options on swap agreements.
We base our investment process on fundamental, bottom-up credit analysis. Analysts assess sector dynamics, company business models and asset quality. Inherent in our credit analysis process is the evaluation of potential upside and downside to any credit. As such, we concentrate our efforts on sectors where there is sufficient transparency to assess the downside risk and where firms have assets to support meaningful recovery in case of default. In our focus on downside protection, we favor opportunities where valuations can be quantified and risks assessed.
During the period, the Fund’s capital was deployed into assets that we believe offer attractive current income and yield for the associated risk profile. Fundamentally, we feel that many of these companies have stable businesses, good asset coverage for senior debt holders, and can perform well in a stable to slow-growth environment.
Helping performance were the term loans of Clear Channel, as the media concern was expected to address near-term maturities with refinancing transactions. Also helping performance was exposure to IASIS Healthcare bonds and loans.
Detracting from performance was Cengage Learning Acquisitions, Inc. The textbook and software maker announced disappointing earnings during the period. The company continues to seek merger and acquisition-related solutions. Spectrum Brands, which is a global and diversified consumer products company, also detracted from performance. The company announced an acquisition during the period along with $1 billion of new issue bonds to finance the transaction.
Nuveen Symphony High Yield Bond Fund
The Fund’s Class A Shares at NAV outperformed both the BofA Merrill Lynch U.S. High Yield Master II Index and the Lipper High Yield Funds Classification Average during the abbreviated reporting period from December 10, 2012 through March 31, 2013.
The Fund seeks current income and capital appreciation by investing primarily in below investment grade bonds using a bottom up, research driven process. The Fund invests at least 80% of its net assets (plus the amount of any borrowings for investment purposes) in bonds rated below investment-grade or, if unrated, we deemed to be of comparable quality. The Fund may invest up to 20% of its net assets, collectively, in the bank loans, convertible securities and equity securities.
We base our investment process on fundamental, bottom-up credit analysis. Analysts assess sector dynamics, company business models and asset quality. Specific recommendations are based on an analysis of the relative value of the various types of debt within a company’s capital structure. Inherent in our credit analysis process is the evaluation of potential upside and downside to any credit. As such, we concentrate our efforts on sectors where there is sufficient transparency to assess the downside risk and where firms have assets to support meaningful recovery in case of default. In its focus on downside protection, we favor opportunities where valuations can be quantified and risks assessed.
During the first quarter of 2013, investors continued to allocate money to risk assets. Although high yield bonds and senior loans lagged equities, they outperformed investment grade bonds and the 10-year Treasury for the first quarter 2013. During the abbreviated reporting period, default rates remained well below the historical average long term default rate of 4.2%, according to Credit Suisse. In the first quarter of 2013, the default rate totaled .12%.
The Fund benefited from its exposure to IASIS Healthcare bonds and loans. This is despite being in a sector that is generally somewhat exposed to medicare reimbursement cuts. Holdings that contributed to performance included the term loans of Clear Channel. The company is one of the leading global media and entertainment companies specializing in radio, digital, outdoor, mobile, live events, and on-demand entertainment and information services for local communities. The company was expected to address near-term maturities with refinancing transactions. Given Clear Channel’s leverage, this is seen as an overall positive for the company. Additionally, Tempur Pedic bonds contributed to performance. The company announced better than expected Q4 2012 earnings.
Risk Considerations
Mutual fund investing involves risk; principal loss is possible. Debt or fixed income securities such as those held by the Funds are subject to market risk, credit risk, interest rate risk, derivatives risk, liquidity risk, and income risk. As interest rates rise, bond prices fall. Below investment grade or high yield debt securities are subject to liquidity risk and heightened credit risk. Foreign investments involve additional risks, including currency fluctuation, political and economic instability, lack of liquidity and differing legal and accounting standards. The value of a Fund’s convertible securities may decline in response to such factors as rising interest rates and fluctuations in the market price of the underlying securities. These Funds are subject to loan settlement risk due to the lack of established settlement standards or remedies for failure to settle. Because each Fund currently has less assets than a larger fund, large inflows and outflows may impact the Fund’s market exposure and subsequently its performance. Redemption of a large number of shares may subject each Fund and its shareholders to leverage risk and disrupt the overall composition of the Fund’s portfolio and thereby impede the ability to pursue the investment strategy.
Fund Performance and Expense Ratios
The Fund Performance and Expense Ratios for each Fund are shown on the following three pages.
Returns quoted represent past performance, which is no guarantee of future results. Current performance may be higher or lower than the performance shown. Investment returns and principal value will fluctuate so that when shares are redeemed, they may be worth more or less than their original cost. Returns without sales charges would be lower if the sales charge were included. Returns do not reflect the deduction of taxes that a shareholder would pay on Fund distributions or the redemption of Fund shares.
Returns may reflect a contractual agreement between certain Funds and the investment adviser to waive certain fees and expenses; see Notes to Financial Statements, Footnote 7 — Management Fees and Other Transactions with Affiliates for more information. In addition, returns may reflect a voluntary expense limitation by the Funds’ investment adviser that may be modified or discontinued at any time without notice. For the most recent month-end performance visit www.nuveen.com or call (800) 257-8787.
Returns reflect differences in sales charges and expenses, which are primarily differences in distribution and service fees. Fund returns assume reinvestment of dividends and capital gains.
Comparative index and Lipper return information is provided for the Funds’ Class A Shares at net asset value (NAV) only.
The expense ratios shown reflect the Funds’ total operating expenses (before fee waivers and/or expense reimbursements, if any) as shown in the Funds’ most recent prospectus. The expense ratios include management fees and other fees and expenses.
Fund Performance and Expense Ratios (continued)
Nuveen Symphony Credit Opportunities Fund
Refer to the first page of this Fund Performance and Expense Ratios section for further explanation of the information included within this page.
Fund Performance
Average Annual Total Returns as of March 31, 2013
| | | | | | | | | | | | |
| | |
| | | Cumulative | | | Average Annual | |
| | | |
| | | 6-Month | | | 1-Year | | | Since
Inception* | |
Class A Shares at NAV | | | 6.90% | �� | | | 13.07% | | | | 11.09% | |
Class A Shares at maximum Offering Price | | | 1.83% | | | | 7.70% | | | | 9.26% | |
BofA Merrill Lynch U.S. High Yield Master II Index** | | | 6.17% | | | | 13.06% | | | | 10.38% | |
Custom Benchmark Index** | | | 5.27% | | | | 11.12% | | | | 8.84% | |
Lipper High Yield Funds Classification Average** | | | 5.95% | | | | 11.80% | | | | 9.51% | |
| | | | | | | | | | | | |
Class C Shares | | | 6.48% | | | | 12.22% | | | | 10.24% | |
Class I Shares | | | 6.98% | | | | 13.35% | | | | 11.36% | |
Class A Shares have a maximum 4.75% sales charge (Offering Price). Class A Share purchases of $1 million or more are sold at net asset value without an up-front sales charge but may be subject to a contingent deferred sales charge (CDSC), also known as a back-end sales charge, if redeemed within eighteen months of purchase. Class C Shares have a 1% CDSC for redemptions within less than twelve months, which is not reflected in the one-year total return. Class I Shares have no sales charge and may be purchased under limited circumstances or by specified classes of investors.
Expense Ratios as of Most Recent Prospectus
| | | | | | | | |
| | |
| | | Gross
Expense
Ratios | | | Net
Expense
Ratios | |
Class A Shares | | | 1.12% | | | | 1.07% | |
Class C Shares | | | 1.87% | | | | 1.82% | |
Class I Shares | | | 0.87% | | | | 0.82% | |
The Fund’s investment adviser has agreed to waive fees and/or reimburse expenses through January 31, 2014, so that total annual Fund operating expenses (excluding 12b-1 distribution and/or service fees, interest expenses, taxes, acquired fund fee and expenses, fees incurred in acquiring and disposing of portfolio securities and extraordinary expenses) do not exceed 0.85% (1.35% after January 31, 2014) of the average daily net assets of any class of Fund shares. The expense limitation expiring January 31, 2014, may be terminated or modified prior to that date only with the approval of the Board of Trustees of the Fund. The expense limitation in effect thereafter may be terminated or modified only with the approval of shareholders of the Fund.
| * | Since inception returns are from 4/28/10. |
| ** | Refer to the Glossary of Terms Used in this Report for definitions. Indexes and Lipper averages are not available for direct investment. |
Fund Performance and Expense Ratios (continued)
Nuveen Symphony Floating Rate Income Fund
Refer to the first page of this Fund Performance and Expense Ratios section for further explanation of the information included within this page.
Fund Performance
Average Annual Total Returns as of March 31, 2013
| | | | | | | | | | | | |
| | |
| | | Cumulative | | | Average Annual | |
| | | |
| | | 6-Month | | | 1-Year | | | Since
Inception** | |
Class A Shares at NAV | | | 5.12% | | | | 9.34% | | | | 7.11% | |
Class A Shares at maximum Offering Price* | | | 1.97% | | | | 6.06% | | | | 5.42% | |
Credit Suisse Leveraged Loan Index*** | | | 3.93% | | | | 8.27% | | | | 5.33% | |
Lipper Loan Participation Funds Classification Average*** | | | 3.74% | | | | 7.51% | | | | 5.12% | |
| | | |
Class C Shares | | | 4.74% | | | | 8.48% | | | | 6.29% | |
Class I Shares | | | 5.30% | | | | 9.60% | | | | 7.36% | |
Class A Shares have a maximum 4.75% sales charge (Offering Price). Class A Share purchases of $1 million or more are sold at net asset value without an up-front sales charge but may be subject to a contingent deferred sales charge (CDSC), also known as a back-end sales charge, if redeemed within eighteen months of purchase. Class C Shares have a 1% CDSC for redemptions within less than twelve months, which is not reflected in the one-year total return. Class I Shares have no sales charge and may be purchased under limited circumstances or by specified classes of investors.
Expense Ratios as of Most Recent Prospectus
| | | | | | | | |
| | |
| | | Gross
Expense
Ratios | | | Net
Expense
Ratios | |
Class A Shares | | | 1.90% | | | | 1.07% | |
Class C Shares | | | 2.69% | | | | 1.82% | |
Class I Shares | | | 1.62% | | | | 0.82% | |
The Fund’s investment adviser has agreed to waive fees and/or reimburse expenses through January 31, 2014, so that total annual Fund operating expenses (excluding 12b-1 distribution and/or service fees, interest expenses, taxes, acquired fund fees and expenses, fees incurred in acquiring and disposing of portfolio securities and extraordinary expenses) do not exceed 0.85% (1.10% after January 31, 2014) of the average daily net assets of any class of Fund shares. This expense limitation expiring January 31, 2014, may be terminated or modified prior to that date only with the approval of the Board of Trustees of the Fund. The expense limitation in effect thereafter may be terminated or modified only with the approval of shareholders of the Fund.
| * | Effective April 1, 2013 (subsequent to the close of this reporting period) Class A Shares have a maximum 3.00% sales charge (Offering Price). |
| ** Since | inception returns are from 5/2/11. |
| *** | Refer to the Glossary of Terms Used in this Report for definitions. Indexes and Lipper averages are not available for direct investment. |
Fund Performance and Expense Ratios (continued)
Nuveen Symphony High Yield Bond Fund
Refer to the first page of this Fund Performance and Expense Ratios section for further explanation of the information included within this page.
Fund Performance
Cumulative Total Returns as of March 31, 2013
| | | | |
| | | | |
| |
| | | Since
Inception* | |
Class A Shares at NAV | | | 6.30% | |
Class A Shares at maximum Offering Price | | | 1.25% | |
BofA Merrill Lynch U.S. High Yield Master II Index** | | | 3.43% | |
Lipper High Yield Funds Classification Average** | | | 3.39% | |
| |
Class C Shares | | | 6.10% | |
Class I Shares | | | 6.40% | |
Class A Shares have a maximum 4.75% sales charge (Offering Price). Class A Share purchases of $1 million or more are sold at net asset value without an up-front sales charge but may be subject to a contingent deferred sales charge (CDSC), also known as a back-end sales charge, if redeemed within eighteen months of purchase. Class C Shares have a 1% CDSC for redemptions within less than twelve months, which is not reflected in the one-year total return. Class I Shares have no sales charge and may be purchased under limited circumstances or by specified classes of investors.
Expense Ratios as of Most Recent Prospectus
| | | | | | | | |
| | |
| | | Gross
Expense
Ratios | | | Net
Expense
Ratios | |
Class A Shares | | | 1.29% | | | | 1.10% | |
Class C Shares | | | 2.04% | | | | 1.85% | |
Class I Shares | | | 1.04% | | | | 0.85% | |
The Fund’s investment adviser has agreed to waive fees and/or reimburse expenses through January 31, 2015, so that total annual Fund operating expenses (excluding 12b-1 distribution and/or service fees, interest expenses, taxes, acquired fund fees and expenses, fees incurred in acquiring and disposing of portfolio securities and extraordinary expenses) do not exceed 0.85% of the average daily net assets of any class of Fund shares. This expense limitation expiring January 31, 2015, may be terminated or modified prior to that date only with the approval of the Board of Trustees of the Fund. The expense limitation in effect thereafter may be terminated or modified only with the approval of shareholders of the Fund.
| * | Since inception returns are from 12/10/12. |
| ** | Refer to the Glossary of Terms Used in this Report for definitions. Indexes and Lipper averages are not available for direct investment. |
Yields as of March 31, 2013
Dividend Yield is the most recent dividend per share (annualized) divided by the offering price per share.
The SEC 30-Day Yield is a standardized measure of a Fund’s yield that accounts for the future amortization of premiums or discounts of bonds held in the Fund’s portfolio. The SEC 30-Day Yield is computed under an SEC standardized formula and is based on the maximum offer price per share. Dividend Yield may differ from the SEC 30-Day Yield because the Fund may be paying out more or less than it is earning and it may not include the effect of amortization of bond premium.
Nuveen Symphony Credit Opportunities Fund
| | | | | | | | |
| | |
| | | Dividend
Yield | | | SEC 30-Day
Yield | |
Class A Shares1 | | | 5.73% | | | | 4.49% | |
Class C Shares | | | 5.28% | | | | 3.95% | |
Class I Shares | | | 6.26% | | | | 5.02% | |
Nuveen Symphony Floating Rate Income Fund
| | | | | | | | |
| | |
| | | Dividend
Yield | | | SEC 30-Day
Yield | |
Class A Shares1 | | | 4.61% | | | | 2.71% | |
Class C Shares | | | 4.09% | | | | 2.11% | |
Class I Shares | | | 5.08% | | | | 3.02% | |
Nuveen Symphony High Yield Bond Fund
| | | | |
| |
| | | SEC 30-Day
Yield | |
Class A Shares1 | | | 5.71% | |
Class C Shares | | | 5.25% | |
Class I Shares | | | 6.26% | |
| 1 | The SEC Yield for Class A shares quoted in the table reflects the maximum sales load. Investors paying a reduced load because of volume discounts, investors paying no load because they qualify for one of the several exclusions from the load, and existing shareholders who previously paid a load but would like to know the SEC Yield applicable to their shares on a going-forward basis, should understand that the SEC Yield effectively applicable to them would be higher than the figure quoted in the table. |
Holding Summaries as of March 31, 2013
This data relates to the securities held in each Fund’s portfolio of investments. It should not be construed as a measure of performance for the Fund itself.
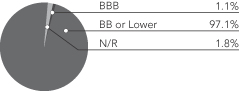
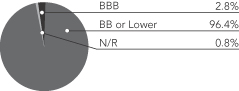
Ratings shown are the highest rating given by one of the following national rating agencies: Standard & Poor’s Group, Moody’s Investors Service, Inc. or Fitch, Inc. Credit ratings are subject to change. AAA, AA, A, and BBB are investment grade ratings; BB, B, CCC, CC, C and D are below-investment grade ratings. Certain bonds backed by U.S. Government or agency securities are regarded as having an implied rating equal to the rating of such securities. Holdings designated N/R are not rated by these national rating agencies.
Nuveen Symphony Credit
Opportunities Fund
Portfolio Credit Quality1
Nuveen Symphony Floating Rate Income Fund
Portfolio Credit Quality2
| | | | |
| Portfolio Allocation3 | | | |
| Corporate Bonds | | | 66.6% | |
| Variable Rate Senior Loan Interests | | | 26.1% | |
| Short-Term Investments | | | 8.5% | |
| Convertible Bonds | | | 1.1% | |
$1,000 Par (or similar) Institutional Structures | | | 0.3% | |
| Common Stocks | | | 0.2% | |
| Other4 | | | (2.8)% | |
| | | | |
| Portfolio Allocation3 | | | |
| Variable Rate Senior Loan Interests | | | 75.5% | |
| Short-Term Investments | | | 28.4% | |
| Corporate Bonds | | | 17.1% | |
| Other4 | | | (21.0)% | |
| | | | |
| Portfolio Composition3 | | | |
| Health Care Providers & Services | | | 8.6% | |
| Media | | | 6.9% | |
| Oil, Gas & Consumable Fuels | | | 6.8% | |
| Commercial Services & Supplies | | | 4.8% | |
| Wireless Telecommunication Services | | | 4.2% | |
| Hotels, Restaurants & Leisure | | | 4.2% | |
| Diversified Telecommunication Services | | | 3.3% | |
| Food & Staples Retailing | | | 3.1% | |
| Food Products | | | 3.1% | |
| Specialty Retail | | | 2.9% | |
| Chemicals | | | 2.9% | |
| Household Products | | | 2.7% | |
| Software | | | 2.6% | |
| Health Care Equipment & Supplies | | | 2.5% | |
| Distributors | | | 2.5% | |
| Communications Equipment | | | 2.4% | |
| Pharmaceuticals | | | 2.1% | |
| Machinery | | | 2.1% | |
| Household Durables | | | 2.0% | |
| IT Services | | | 2.0% | |
| Diversified Financial Services | | | 1.9% | |
| Containers & Packaging | | | 1.8% | |
| Short-Term Investments | | | 8.5% | |
| Other5 | | | 16.1% | |
| | | | |
| Portfolio Composition3 | | | |
| Media | | | 9.3% | |
| Pharmaceuticals | | | 7.0% | |
| Health Care Providers & Services | | | 6.4% | |
| Food Products | | | 5.6% | |
| Wireless Telecommunication Services | | | 4.7% | |
| Oil, Gas & Consumable Fuels | | | 4.7% | |
| Hotels, Restaurants & Leisure | | | 4.5% | |
| Health Care Equipment & Supplies | | | 4.0% | |
| Software | | | 4.0% | |
| Commercial Services & Supplies | | | 3.9% | |
| Short-Term Investments | | | 28.4% | |
| Other6 | | | 17.5% | |
| 1 | As a percentage of total long-term investments (excluding common stocks). Holdings are subject to change. |
| 2 | As a percentage of total long-term investments. Holdings are subject to change. |
| 3 | As a percentage of net assets. Holdings are subject to change. |
| 4 | Other assets less liabilities. |
| 5 | Includes other assets less liabilities and all industries less than 1.8% of net assets. |
| 6 | Includes other assets less liabilities and all industries less than 3.9% of net assets. |
Holding Summaries as of March 31, 2013 (continued)
Nuveen Symphony High Yield Bond Fund
Portfolio Credit Quality1

| | | | |
| Portfolio Allocation2 | | | |
| Corporate Bonds | | | 89.5% | |
| Variable Rate Senior Loan Interests | | | 8.6% | |
| Other3 | | | 1.9% | |
| | | | |
| Portfolio Composition3 | | | |
| Media | | | 10.7% | |
| Commercial Services & Supplies | | | 9.9% | |
| Hotels, Restaurants & Leisure | | | 9.5% | |
| Oil, Gas & Consumable Fuels | | | 8.8% | |
| Machinery | | | 7.6% | |
| Specialty Retail | | | 7.2% | |
| Distributors | | | 5.6% | |
| Household Durables | | | 5.0% | |
| Building Products | | | 5.0% | |
| Health Care Providers & Services | | | 4.9% | |
| Containers & Packaging | | | 4.8% | |
| Health Care Equipment & Supplies | | | 4.1% | |
| Other4 | | | 16.9% | |
| 1 | As a percentage of total investments. Holdings are subject to change. |
| 2 | As a percentage of net assets. Holdings are subject to change. |
| 3 | Other assets less liabilities. |
| 4 | Includes other assets less liabilities and all industries less than 4.1% of net assets. |
Expense Examples
As a shareholder of one or more of the Funds, you incur two types of costs: (1) transaction costs, including up-front and back-end sales charges (loads) or redemption fees, where applicable; and (2) ongoing costs, including management fees; distribution and service (12b-1) fees, where applicable; and other Fund expenses. The Examples below are intended to help you understand your ongoing costs (in dollars) of investing in the Funds and to compare these costs with the ongoing costs of investing in other mutual funds. Since the expense examples for Nuveen Symphony High Yield Bond Fund reflect only 112 days of the Fund’s operations, they may not provide a meaningful understanding of the Fund’s ongoing expenses.
The Examples below are based on an investment of $1,000 invested at the beginning of the period and held through the end of the period.
The information under “Actual Performance,” together with the amount you invested, allows you to estimate actual expenses incurred over the reporting period. Simply divide your account value by $1,000 (for example, an $8,600 account value divided by $1,000 = 8.60) and multiply the result by the cost shown for your share class, in the row entitled “Expenses Incurred During Period” to estimate the expenses incurred on your account during this period.
The information under “Hypothetical Performance,” provides information about hypothetical account values and hypothetical expenses based on the respective Fund’s actual expense ratio and an assumed rate of return of 5% per year before expenses, which is not the Fund’s actual return. The hypothetical account values and expenses may not be used to estimate the actual ending account balance or expense you incurred for the period. You may use this information to compare the ongoing costs of investing in the Fund and other Funds. To do so, compare this 5% hypothetical example with the 5% hypothetical examples that appear in the shareholder reports of the other funds.
Please note that the expenses shown in the table are meant to highlight your ongoing costs only and do not reflect any transaction costs. Therefore, the hypothetical information is useful in comparing ongoing costs only, and will not help you determine the relative total costs of owning different funds or share classes. In addition, if these transaction costs were included, your costs would have been higher.
Nuveen Symphony Credit Opportunities Fund
| | | | | | | | | | | | | | | | | | | | | | | | | | |
| | | | | | | | | | | | | | Hypothetical Performance | |
| | | Actual Performance | | | | | (5% annualized return before expenses) | |
| | | A Shares | | | C Shares | | | I Shares | | | | | A Shares | | | C Shares | | | I Shares | |
| Beginning Account Value (10/01/12) | | $ | 1,000.00 | | | $ | 1,000.00 | | | $ | 1,000.00 | | | | | $ | 1,000.00 | | | $ | 1,000.00 | | | $ | 1,000.00 | |
| Ending Account Value (3/31/13) | | $ | 1,069.00 | | | $ | 1,064.80 | | | $ | 1,069.80 | | | | | $ | 1,019.75 | | | $ | 1,016.01 | | | $ | 1,020.94 | |
| Expenses Incurred During Period | | $ | 5.36 | | | $ | 9.21 | | | $ | 4.13 | | | | | $ | 5.24 | | | $ | 9.00 | | | $ | 4.03 | |
For each class of the Fund, expenses are equal to the Fund’s annualized net expense ratio of 1.04%, 1.79% and .80% for Classes A, C and I, respectively, multiplied by the average account value over the period, multiplied by 182/365 (to reflect the one-half year period).
Nuveen Symphony Floating Rate Income Fund
| | | | | | | | | | | | | | | | | | | | | | | | | | |
| | | | | | | | | | | | | | Hypothetical Performance | |
| | | Actual Performance | | | | | (5% annualized return before expenses) | |
| | | A Shares | | | C Shares | | | I Shares | | | | | A Shares | | | C Shares | | | I Shares | |
| Beginning Account Value (10/01/12) | | $ | 1,000.00 | | | $ | 1,000.00 | | | $ | 1,000.00 | | | | | $ | 1,000.00 | | | $ | 1,000.00 | | | $ | 1,000.00 | |
| Ending Account Value (3/31/13) | | $ | 1,051.20 | | | $ | 1,047.40 | | | $ | 1,053.00 | | | | | $ | 1,019.60 | | | $ | 1,015.86 | | | $ | 1,020.84 | |
| Expenses Incurred During Period | | $ | 5.47 | | | $ | 9.29 | | | $ | 4.20 | | | | | $ | 5.39 | | | $ | 9.15 | | | $ | 4.13 | |
For each class of the Fund, expenses are equal to the Fund’s annualized net expense ratio of 1.07%, 1.82% and .82% for Classes A, C and I, respectively, multiplied by the average account value over the period, multiplied by 182/365 (to reflect the one-half year period).
Nuveen Symphony High Yield Bond Fund
| | | | | | | | | | | | | | | | | | | | | | | | | | |
| | | | | | | | | | | | | | Hypothetical Performance | |
| | | Actual Performance | | | | | (5% annualized return before expenses) | |
| | | A Shares | | | C Shares | | | I Shares | | | | | A Shares | | | C Shares | | | I Shares | |
| Beginning Account Value (12/10/12) | | $ | 1,000.00 | | | $ | 1,000.00 | | | $ | 1,000.00 | | | | | $ | 1,000.00 | | | $ | 1,000.00 | | | $ | 1,000.00 | |
| Ending Account Value (3/31/13) | | $ | 1,063.00 | | | $ | 1,061.00 | | | $ | 1,064.00 | | | | | $ | 1,012.06 | | | $ | 1,009.76 | | | $ | 1,012.83 | |
| Expenses Incurred During Period | | $ | 3.39 | | | $ | 5.75 | | | $ | 2.60 | | | | | $ | 3.30 | | | $ | 5.61 | | | $ | 2.53 | |
For each class of the Fund, expenses are equal to the Fund’s annualized net expense ratio of 1.07%, 1.82% and .82% for Classes A, C and I, respectively, multiplied by the average account value over the period, multiplied by 112/365 (to reflect the 112 days in the period since the Fund’s commencement of operations).
Portfolio of Investments (Unaudited)
Nuveen Symphony Credit Opportunities Fund
March 31, 2013
| | | | | | | | | | | | | | | | | | | | |
| Shares | | | Description (1) | | | | | | | | | | | Value | |
| | | | COMMON STOCKS – 0.2% | | | | | | | | | | | | | | | | |
| | | | | |
| | | | Media – 0.2% | | | | | | | | | | | | | | | | |
| | | | | |
| | 11,546 | | | Tribune Company | | | | | | | | | | | | | | $ | 656,390 | |
| | | | | |
| | 9,292 | | | Tribune Company, (3) | | | | | | | | | | | | | | | — | |
| | | | Total Media | | | | | | | | | | | | | | | 656,390 | |
| | | | Paper & Forest Products – 0.0% | | | | | | | | | | | | | | | | |
| | | | | |
| | 30,709 | | | Catalyst Paper Corporation, (2), (4) | | | | | | | | | | | | | | | 69,529 | |
| | | | Total Common Stocks (cost $478,435) | | | | | | | | | | | | | | | 725,919 | |
| | | | | |
Principal
Amount (000) | | | Description (1) | | Coupon | | | | | | Ratings (5) | | | Value | |
| | | | $1,000 PAR (OR SIMILAR) INSTITUTIONAL STRUCTURES – 0.3% | | | | | | | | | | | | | | | | |
| | | | | |
| | | | IT Services – 0.3% | | | | | | | | | | | | | | | | |
| | | | | |
| $ | 1,000 | | | Zayo Escrow Corporation | | | 8.125% | | | | | | | | B1 | | | $ | 1,120,000 | |
| | | | Total $1,000 Par (or similar) Institutional Structures (cost $1,000,000) | | | | | | | | | | | | | | | 1,120,000 | |
| | | | | |
Principal
Amount (000) | | | Description (1) | | Coupon | | | Maturity | | | Ratings (5) | | | Value | |
| | | | CONVERTIBLE BONDS – 1.1% | | | | | | | | | | | | | | | | |
| | | | | |
| | | | Health Care Equipment & Supplies – 0.4% | | | | | | | | | | | | | | | | |
| | | | | |
| $ | 1,537 | | | Hologic Inc. | | | 2.000% | | | | 12/15/43 | | | | N/R | | | $ | 1,610,967 | |
| | | | Health Care Providers & Services – 0.3% | | | | | | | | | | | | | | | | |
| | | | | |
| | 500 | | | LifePoint Hospitals, Inc. | | | 3.500% | | | | 5/15/14 | | | | BB– | | | | 545,313 | |
| | | | | |
| | 500 | | | Omnicare, Inc. | | | 3.250% | | | | 12/15/35 | | | | B+ | | | | 499,375 | |
| | 1,000 | | | Total Health Care Providers & Services | | | | | | | | | | | | | | | 1,044,688 | |
| | | | Life Sciences Tools & Services – 0.1% | | | | | | | | | | | | | | | | |
| | | | | |
| | 500 | | | Charles River Laboratories International, Inc. | | | 2.250% | | | | 6/15/13 | | | | BB+ | | | | 504,063 | |
| | | | Multiline Retail – 0.0% | | | | | | | | | | | | | | | | |
| | | | | |
| | 200 | | | Saks, Inc. | | | 2.000% | | | | 3/15/24 | | | | BB | | | | 200,875 | |
| | | | Semiconductors & Equipment – 0.3% | | | | | | | | | | | | | | | | |
| | | | | |
| | 1,000 | | | ON Semiconductor Corporation | | | 2.625% | | | | 12/15/26 | | | | BB+ | | | | 1,040,000 | |
| $ | 4,237 | | | Total Convertible Bonds (cost $4,171,513) | | | | | | | | | | | | | | | 4,400,593 | |
| | | | | |
Principal
Amount (000) | | | Description (1) | | Coupon | | | Maturity | | | Ratings (5) | | | Value | |
| | | | CORPORATE BONDS – 66.6% | | | | | | | | | | | | | | | | |
| | | | | |
| | | | Aerospace & Defense – 0.8% | | | | | | | | | | | | | | | | |
| | | | | |
| $ | 1,150 | | | Bombardier Inc., 144A | | | 6.125% | | | | 1/15/23 | | | | BB | | | $ | 1,193,125 | |
| | | | | |
| | 750 | | | Sequa Corporation, 144A | | | 7.000% | | | | 12/15/17 | | | | CCC+ | | | | 759,375 | |
| | | | | |
| | 1,000 | | | TransDigm Inc. | | | 7.750% | | | | 12/15/18 | | | | B– | | | | 1,097,500 | |
| | 2,900 | | | Total Aerospace & Defense | | | | | | | | | | | | | | | 3,050,000 | |
| | | | Airlines – 0.8% | | | | | | | | | | | | | | | | |
| | | | | |
| | 3,000 | | | Continental Airlines, Inc., 144A | | | 6.750% | | | | 9/15/15 | | | | Ba2 | | | | 3,142,500 | |
| | | | Auto Components – 0.3% | | | | | | | | | | | | | | | | |
| | | | | |
| | 500 | | | Sonic Automotive Inc. | | | 7.000% | | | | 7/15/22 | | | | BB– | | | | 551,875 | |
| | | | | |
| | 500 | | | Tenneco Inc. | | | 7.750% | | | | 8/15/18 | | | | BB | | | | 550,000 | |
| | 1,000 | | | Total Auto Components | | | | | | | | | | | | | | | 1,101,875 | |
Portfolio of Investments (Unaudited)
Nuveen Symphony Credit Opportunities Fund (continued)
March 31, 2013
| | | | | | | | | | | | | | | | | | | | |
Principal
Amount (000) | | | Description (1) | | Coupon | | | Maturity | | | Ratings (5) | | | Value | |
| | | | Chemicals – 2.5% | | | | | | | | | | | | | | | | |
| | | | | |
| $ | 500 | | | Ferro Corporation | | | 7.875% | | | | 8/15/18 | | | | B1 | | | $ | 518,750 | |
| | | | | |
| | 7,000 | | | Hexion US Finance, 144A | | | 6.625% | | | | 4/15/20 | | | | B1 | | | | 7,017,500 | |
| | | | | |
| | 1,600 | | | Ineos Finance PLC, 144A | | | 8.375% | | | | 2/15/19 | | | | BB– | | | | 1,770,000 | |
| | | | | |
| | 500 | | | PolyOne Corporation | | | 7.375% | | | | 9/15/20 | | | | BB– | | | | 552,500 | |
| | 9,600 | | | Total Chemicals | | | | | | | | | | | | | | | 9,858,750 | |
| | | | Commercial Services & Supplies – 3.8% | | | | | | | | | | | | | | | | |
| | | | | |
| | 2,500 | | | 313 Group Incorporated, 144A | | | 6.375% | | | | 12/01/19 | | | | B1 | | | | 2,481,250 | |
| | | | | |
| | 1,500 | | | Aramark Corporation, 144A | | | 5.750% | | | | 3/15/20 | | | | B– | | | | 1,533,750 | |
| | | | | |
| | 3,000 | | | Ceridian Corporation, 144A | | | 8.875% | | | | 7/15/19 | | | | B1 | | | | 3,491,250 | |
| | | | | |
| | 810 | | | Ceridian Corporation, 144A | | | 11.000% | | | | 3/15/21 | | | | CCC | | | | 868,725 | |
| | | | | |
| | 54 | | | Ceridian Corporation | | | 12.250% | | | | 11/15/15 | | | | CCC | | | | 55,823 | |
| | | | | |
| | 6,000 | | | Harland Clarke Holdings | | | 9.500% | | | | 5/15/15 | | | | B– | | | | 5,917,500 | |
| | | | | |
| | 500 | | | Mead Products LLC/ACCO Brands, 144A | | | 6.750% | | | | 4/30/20 | | | | BB | | | | 533,750 | |
| | | | | |
| | 225 | | | Tervita Corporation, 144A | | | 8.000% | | | | 11/15/18 | | | | B2 | | | | 232,594 | |
| | 14,589 | | | Total Commercial Services & Supplies | | | | | | | | | | | | | | | 15,114,642 | |
| | | | Communications Equipment – 1.6% | | | | | | | | | | | | | | | | |
| | | | | |
| | 2,000 | | | Avaya Inc., 144A | | | 9.000% | | | | 4/01/19 | | | | B1 | | | | 2,080,000 | |
| | | | | |
| | 1,000 | | | IntelSat Jackson Holdings | | | 7.250% | | | | 4/01/19 | | | | B | | | | 1,092,500 | |
| | | | | |
| | 1,000 | | | IntelSat Jackson Holdings | | | 7.500% | | | | 4/01/21 | | | | B | | | | 1,112,500 | |
| | | | | |
| | 2,000 | | | Nortel Networks Limited, (8) | | | 0.000% | | | | 7/15/11 | | | | BB– | | | | 2,095,000 | |
| | 6,000 | | | Total Communications Equipment | | | | | | | | | | | | | | | 6,380,000 | |
| | | | Computers & Peripherals – 0.6% | | | | | | | | | | | | | | | | |
| | | | | |
| | 800 | | | Seagate HDD Cayman | | | 7.750% | | | | 12/15/18 | | | | BB+ | | | | 877,000 | |
| | | | | |
| | 1,500 | | | Sungard Data Systems Inc., 144A | | | 6.625% | | | | 11/01/19 | | | | B– | | | | 1,548,750 | |
| | 2,300 | | | Total Computers & Peripherals | | | | | | | | | | | | | | | 2,425,750 | |
| | | | Containers & Packaging – 1.5% | | | | | | | | | | | | | | | | |
| | | | | |
| | 1,750 | | | Ardagh Packaging Finance / MP HD USA, 144A | | | 7.000% | | | | 11/15/20 | | | | B3 | | | | 1,798,125 | |
| | | | | |
| | 1,000 | | | Ardagh Packaging Finance PLC, 144A | | | 7.375% | | | | 10/15/17 | | | | Ba3 | | | | 1,095,000 | |
| | | | | |
| | 1,000 | | | Ardagh Packaging Finance PLC, 144A | | | 7.375% | | | | 10/15/17 | | | | Ba3 | | | | 1,093,750 | |
| | | | | |
| | 1,250 | | | Reynolds Group | | | 7.875% | | | | 8/15/19 | | | | B+ | | | | 1,378,125 | |
| | | | | |
| | 500 | | | Reynolds Group | | | 6.875% | | | | 2/15/21 | | | | B+ | | | | 532,500 | |
| | 5,500 | | | Total Containers & Packaging | | | | | | | | | | | | | | | 5,897,500 | |
| | | | Distributors – 2.2% | | | | | | | | | | | | | | | | |
| | | | | |
| | 7,590 | | | HD Supply Inc., 144A | | | 11.500% | | | | 7/15/20 | | | | CCC+ | | | | 8,994,150 | |
| | | | Diversified Consumer Services – 0.3% | | | | | | | | | | | | | | | | |
| | | | | |
| | 1,000 | | | Servicemaster Company | | | 8.000% | | | | 2/15/20 | | | | BB– | | | | 1,072,500 | |
| | | | Diversified Financial Services – 1.3% | | | | | | | | | | | | | | | | |
| | | | | |
| | 1,000 | | | Charter Communications, CCO Holdings LLC | | | 7.375% | | | | 6/01/20 | | | | BB– | | | | 1,108,750 | |
| | | | | |
| | 2,000 | | | Harland Clarke Holdings | | | 5.040% | | | | 5/15/15 | | | | B– | | | | 1,920,000 | |
| | | | | |
| | 2,000 | | | Jefferies Finance LLC, 144A | | | 7.375% | | | | 4/01/20 | | | | CCC+ | | | | 2,035,000 | |
| | 5,000 | | | Total Diversified Financial Services | | | | | | | | | | | | | | | 5,063,750 | |
| | | | Diversified Telecommunication Services – 3.3% | | | | | | | | | | | | | | | | |
| | | | | |
| | 1,213 | | | Cincinnati Bell Inc. | | | 8.375% | | | | 10/15/20 | | | | B1 | | | | 1,261,520 | |
| | | | | |
| | 1,500 | | | CyrusOne LP Finance, 144A | | | 6.375% | | | | 11/15/22 | | | | B+ | | | | 1,571,250 | |
| | | | | | | | | | | | | | | | | | | | |
Principal
Amount (000) | | | Description (1) | | Coupon | | | Maturity | | | Ratings (5) | | | Value | |
| | | | Diversified Telecommunication Services (continued) | | | | | | | | | | | | | | | | |
| | | | | |
| $ | 2,000 | | | IntelSat Limited, 144A, (WI/DD) | | | 7.750% | | | | 6/01/21 | | | | CCC+ | | | $ | 2,035,000 | |
| | | | | |
| | 3,000 | | | IntelSat Limited, 144A, (WI/DD) | | | 8.125% | | | | 6/01/23 | | | | CCC+ | | | | 3,048,750 | |
| | | | | |
| | 2,000 | | | Level 3 Financing Inc., 144A | | | 7.000% | | | | 6/01/20 | | | | BB– | | | | 2,095,000 | |
| | | | | |
| | 2,000 | | | Level 3 Financing Inc. | | | 8.625% | | | | 7/15/20 | | | | BB– | | | | 2,230,000 | |
| | | | | |
| | 1,000 | | | Windstream Corporation | | | 7.500% | | | | 4/01/23 | | | | BB+ | | | | 1,060,000 | |
| | 12,713 | | | Total Diversified Telecommunication Services | | | | | | | | | | | | | | | 13,301,520 | |
| | | | Energy Equipment & Services – 1.3% | | | | | | | | | | | | | | | | |
| | | | | |
| | 2,000 | | | Hornbeck Offshore Services Inc. | | | 5.875% | | | | 4/01/20 | | | | BB– | | | | 2,070,000 | |
| | | | | |
| | 3,000 | | | Offshore Group Investment Limited | | | 7.125% | | | | 4/01/23 | | | | B– | | | | 3,067,500 | |
| | 5,000 | | | Total Energy Equipment & Services | | | | | | | | | | | | | | | 5,137,500 | |
| | | | Food & Staples Retailing – 1.9% | | | | | | | | | | | | | | | | |
| | | | | |
| | 1,600 | | | Rite Aid Corporation | | | 9.250% | | | | 3/15/20 | | | | CCC+ | | | | 1,806,000 | |
| | | | | |
| | 500 | | | Rite Aid Corporation | | | 8.000% | | | | 8/15/20 | | | | BB– | | | | 565,000 | |
| | | | | |
| | 5,000 | | | U.S. Foodservice, 144A | | | 8.500% | | | | 6/30/19 | | | | CCC+ | | | | 5,306,250 | |
| | 7,100 | | | Total Food & Staples Retailing | | | | | | | | | | | | | | | 7,677,250 | |
| | | | Food Products – 0.7% | | | | | | | | | | | | | | | | |
| | | | | |
| | 1,000 | | | Chiquita Brands International Inc., Corporate Bond, 144A | | | 7.875% | | | | 2/01/21 | | | | B1 | | | | 1,048,750 | |
| | | | | |
| | 1,500 | | | JBS USA LLC, 144A | | | 8.250% | | | | 2/01/20 | | | | BB | | | | 1,638,750 | |
| | 2,500 | | | Total Food Products | | | | | | | | | | | | | | | 2,687,500 | |
| | | | Gas Utilities – 0.5% | | | | | | | | | | | | | | | | |
| | | | | |
| | 2,000 | | | AmeriGas Finance LLC | | | 7.000% | | | | 5/20/22 | | | | Ba2 | | | | 2,175,000 | |
| | | | Health Care Equipment & Supplies – 1.9% | | | | | | | | | | | | | | | | |
| | | | | |
| | 500 | | | Apria Healthcare Group Inc. | | | 12.375% | | | | 11/01/14 | | | | B– | | | | 510,000 | |
| | | | | |
| | 1,500 | | | Biomet Inc., 144A | | | 6.500% | | | | 8/01/20 | | | | B– | | | | 1,591,874 | |
| | | | | |
| | 500 | | | DJO Finance LLC/DJO Finance Corporation, 144A | | | 8.750% | | | | 3/15/18 | | | | B– | | | | 557,500 | |
| | | | | |
| | 2,400 | | | Kinetic Concepts | | | 10.500% | | | | 11/01/18 | | | | B | | | | 2,598,000 | |
| | | | | |
| | 2,400 | | | Kinetic Concepts | | | 12.500% | | | | 11/01/19 | | | | CCC+ | | | | 2,364,000 | |
| | | | | |
| | 165 | | | Rotech Healthcare Inc. | | | 10.750% | | | | 10/15/15 | | | | Caa1 | | | | 165,000 | |
| | 7,465 | | | Total Health Care Equipment & Supplies | | | | | | | | | | | | | | | 7,786,374 | |
| | | | Health Care Providers & Services – 6.4% | | | | | | | | | | | | | | | | |
| | | | | |
| | 1,000 | | | Aviv Healthcare Properties LP | | | 7.750% | | | | 2/15/19 | | | | BB | | | | 1,075,000 | |
| | | | | |
| | 500 | | | Capella Healthcare Inc. | | | 9.250% | | | | 7/01/17 | | | | B | | | | 541,250 | |
| | | | | |
| | 1,000 | | | HCA Holdings Inc. | | | 6.250% | | | | 2/15/21 | | | | B– | | | | 1,066,250 | |
| | | | | |
| | 4,000 | | | IASIS Healthcare Capital Corporation | | | 8.375% | | | | 5/15/19 | | | | CCC+ | | | | 4,205,000 | |
| | | | | |
| | 3,000 | | | Prospect Medical Holdings Inc., 144A | | | 8.375% | | | | 5/01/19 | | | | B2 | | | | 3,195,000 | |
| | | | | |
| | 1,385 | | | Symbion Inc. | | | 8.000% | | | | 6/15/16 | | | | B | | | | 1,464,638 | |
| | | | | |
| | 500 | | | Universal Health Services Inc. | | | 7.000% | | | | 10/01/18 | | | | BB– | | | | 543,750 | |
| | | | | |
| | 2,000 | | | Universal Hospital Services Inc., 144A | | | 7.625% | | | | 8/15/20 | | | | B+ | | | | 2,152,500 | |
| | | | | |
| | 2,000 | | | Vanguard Health Holding LLC/Inc., 144A | | | 7.750% | | | | 2/01/19 | | | | B– | | | | 2,140,000 | |
| | | | | |
| | 1,200 | | | Vanguard Health Holding LLC/Inc. | | | 8.000% | | | | 2/01/18 | | | | B– | | | | 1,276,500 | |
| | | | | |
| | 7,000 | | | Wolverine Healthcare Analytics, 144A | | | 10.625% | | | | 6/01/20 | | | | CCC+ | | | | 7,980,000 | |
| | 23,585 | | | Total Health Care Providers & Services | | | | | | | | | | | | | | | 25,639,888 | |
| | | | Health Care Technology – 0.1% | | | | | | | | | | | | | | | | |
| | | | | |
| | 500 | | | MedAssets Inc., 144A | | | 8.000% | | | | 11/15/18 | | | | B– | | | | 546,250 | |
Portfolio of Investments (Unaudited)
Nuveen Symphony Credit Opportunities Fund (continued)
March 31, 2013
| | | | | | | | | | | | | | | | | | | | |
Principal
Amount (000) | | | Description (1) | | Coupon | | | Maturity | | | Ratings (5) | | | Value | |
| | | | Hotels, Restaurants & Leisure – 3.2% | | | | | | | | | | | | | | | | |
| | | | | |
| $ | 1,000 | | | Caesars Operating Escrow, 144A | | | 9.000% | | | | 2/15/20 | | | | B– | | | $ | 1,006,250 | |
| | | | | |
| | 350 | | | Carrols Restaurant Group, 144A | | | 11.250% | | | | 5/15/18 | | | | B– | | | | 394,188 | |
| | | | | |
| | 3,000 | | | Landry’s Holdings, 144A | | | 10.250% | | | | 1/01/18 | | | | CCC+ | | | | 3,142,500 | |
| | | | | |
| | 1,000 | | | Landry’s Restaurants Inc., 144A | | | 9.375% | | | | 5/01/20 | | | | BB– | | | | 1,077,500 | |
| | | | | |
| | 1,200 | | | MGM Resorts International Inc. | | | 7.750% | | | | 3/15/22 | | | | B+ | | | | 1,332,000 | |
| | | | | |
| | 2,000 | | | Pinnacle Entertainment Inc. | | | 7.750% | | | | 4/01/22 | | | | B | | | | 2,147,500 | |
| | | | | |
| | 2,000 | | | RHP Hotel Properties LP Finance, 144A | | | 5.000% | | | | 4/15/21 | | | | BB | | | | 2,015,000 | |
| | | | | |
| | 1,500 | | | Station Casinos LLC, 144A | | | 7.500% | | | | 3/01/21 | | | | CCC+ | | | | 1,541,250 | |
| | 12,050 | | | Total Hotels, Restaurants & Leisure | | | | | | | | | | | | | | | 12,656,188 | |
| | | | Household Durables – 1.1% | | | | | | | | | | | | | | | | |
| | | | | |
| | 1,440 | | | Libbey Glass Inc. | | | 6.875% | | | | 5/15/20 | | | | B+ | | | | 1,553,400 | |
| | | | | |
| | 1,000 | | | RSI Home Products Incorporated, 144A | | | 6.875% | | | | 3/01/18 | | | | B+ | | | | 1,015,000 | |
| | | | | |
| | 1,000 | | | Spectrum Brands Inc., 144A | | | 6.375% | | | | 11/15/20 | | | | BB– | | | | 1,073,750 | |
| | | | | |
| | 750 | | | Tempur Pedic International Inc., 144A | | | 6.875% | | | | 12/15/20 | | | | B+ | | | | 800,625 | |
| | 4,190 | | | Total Household Durables | | | | | | | | | | | | | | | 4,442,775 | |
| | | | Household Products – 2.7% | | | | | | | | | | | | | | | | |
| | | | | |
| | 5,000 | | | 313 Group Incorporated, 144A | | | 8.750% | | | | 12/01/20 | | | | CCC+ | | | | 5,056,250 | |
| | | | | |
| | 3,000 | | | Serta Simmons Holdings LLC, 144A | | | 8.125% | | | | 10/01/20 | | | | CCC+ | | | | 3,116,250 | |
| | | | | |
| | 1,500 | | | Spectrum Brands Inc., 144A | | | 6.625% | | | | 11/15/22 | | | | BB– | | | | 1,627,500 | |
| | | | | |
| | 1,000 | | | Spectrum Brands Inc. | | | 9.500% | | | | 6/15/18 | | | | Ba3 | | | | 1,132,500 | |
| | 10,500 | | | Total Household Products | | | | | | | | | | | | | | | 10,932,500 | |
| | | | Independent Power Producers & Energy Traders – 0.4% | | | | | | | | | | | | | | | | |
| | | | | |
| | 1,500 | | | NRG Energy Inc., 144A | | | 6.625% | | | | 3/15/23 | | | | BB | | | | 1,590,000 | |
| | | | Insurance – 0.5% | | | | | | | | | | | | | | | | |
| | | | | |
| | 2,000 | | | Fidelity & Guaranty Life Holdings Inc., 144A | | | 6.375% | | | | 4/01/21 | | | | BB– | | | | 2,040,000 | |
| | | | IT Services – 0.8% | | | | | | | | | | | | | | | | |
| | | | | |
| | 3,000 | | | First Data Corporation, 144A | | | 7.375% | | | | 6/15/19 | | | | BB– | | | | 3,191,250 | |
| | | | Leisure Equipment & Products – 0.6% | | | | | | | | | | | | | | | | |
| | | | | |
| | 2,000 | | | PC Merger Sub Inc., 144A | | | 8.875% | | | | 8/01/20 | | | | CCC+ | | | | 2,195,000 | |
| | | | Machinery – 2.1% | | | | | | | | | | | | | | | | |
| | | | | |
| | 1,750 | | | Cleaver-Brooks Inc., 144A | | | 8.750% | | | | 12/15/19 | | | | B | | | | 1,887,813 | |
| | | | | |
| | 1,500 | | | NES Rental Holdings Inc., 144A | | | 12.250% | | | | 4/15/15 | | | | CCC+ | | | | 1,586,250 | |
| | | | | |
| | 2,000 | | | Terex Corporation | | | 6.000% | | | | 5/15/21 | | | | B+ | | | | 2,105,000 | |
| | | | | |
| | 3,000 | | | Xerium Technologies | | | 8.875% | | | | 6/15/18 | | | | B | | | | 2,872,500 | |
| | 8,250 | | | Total Machinery | | | | | | | | | | | | | | | 8,451,563 | |
| | | | Media – 4.8% | | | | | | | | | | | | | | | | |
| | | | | |
| | 1,750 | | | Cequel Communications Holding I LLC Capital | | | 6.375% | | | | 9/15/20 | | | | B– | | | | 1,815,625 | |
| | | | | |
| | 1,000 | | | Charter Communications, CCO Holdings LLC | | | 7.000% | | | | 1/15/19 | | | | BB– | | | | 1,077,500 | |
| | | | | |
| | 1,000 | | | Charter Communications, CCO Holdings LLC | | | 6.625% | | | | 1/31/22 | | | | BB– | | | | 1,072,500 | |
| | | | | |
| | 109 | | | Clear Channel Communications, Inc., 144A | | | 9.000% | | | | 12/15/19 | | | | CCC+ | | | | 104,776 | |
| | | | | |
| | 1,000 | | | Clear Channel Communications, Inc., 144A | | | 11.250% | | | | 3/01/21 | | | | CCC+ | | | | 1,025,000 | |
| | | | | |
| | 2,000 | | | Clear Channel Communications, Inc. | | | 4.900% | | | | 5/15/15 | | | | CCC– | | | | 1,855,000 | |
| | | | | |
| | 2,500 | | | Clear Channel Communications, Inc. | | | 11.000% | | | | 8/01/16 | | | | CCC– | | | | 1,975,000 | |
| | | | | |
| | 500 | | | Clear Channel Worldwide Holdings Inc. | | | 7.625% | | | | 3/15/20 | | | | B | | | | 516,875 | |
| | | | | | | | | | | | | | | | | | | | |
Principal
Amount (000) | | | Description (1) | | Coupon | | | Maturity | | | Ratings (5) | | | Value | |
| | | | Media (continued) | | | | | | | | | | | | | | | | |
| | | | | |
| $ | 1,100 | | | Clear Channel Worldwide Holdings Inc. | | | 7.625% | | | | 3/15/20 | | | | B | | | $ | 1,148,125 | |
| | | | | |
| | 337 | | | Entravision Communications Corporation | | | 8.750% | | | | 8/01/17 | | | | B+ | | | | 365,645 | |
| | | | | |
| | 4,000 | | | McGraw-Hill Global Education Holdings, 144A | | | 9.750% | | | | 4/01/21 | | | | BB | | | | 3,960,000 | |
| | | | | |
| | 1,000 | | | Mediacom LLC | | | 7.250% | | | | 2/15/22 | | | | B | | | | 1,100,000 | |
| | | | | |
| | 500 | | | UnityMedia Hessen GmBH, 144A | | | 7.500% | | | | 3/15/19 | | | | BB– | | | | 546,875 | |
| | | | | |
| | 1,000 | | | UPCB Finance Limited, 144A | | | 7.250% | | | | 11/15/21 | | | | BB– | | | | 1,105,000 | |
| | | | | |
| | 500 | | | UPCB Finance VI Limited, 144A | | | 6.875% | | | | 1/15/22 | | | | BB– | | | | 543,750 | |
| | | | | |
| | 1,000 | | | WideOpenWest Finance Capital Corporation, 144A | | | 10.250% | | | | 7/15/19 | | | | CCC+ | | | | 1,112,500 | |
| | 19,296 | | | Total Media | | | | | | | | | | | | | | | 19,324,171 | |
| | | | Metals & Mining – 0.7% | | | | | | | | | | | | | | | | |
| | | | | |
| | 1,000 | | | Global Brass and Copper, 144A | | | 9.500% | | | | 6/01/19 | | | | B | | | | 1,107,500 | |
| | | | | |
| | 500 | | | Novellis Inc. | | | 8.750% | | | | 12/15/20 | | | | B | | | | 563,750 | |
| | | | | |
| | 1,100 | | | Walter Energy Inc., 144A | | | 8.500% | | | | 4/15/21 | | | | B | | | | 1,127,500 | |
| | 2,600 | | | Total Metals & Mining | | | | | | | | | | | | | | | 2,798,750 | |
| | | | Multiline Retail – 0.7% | | | | | | | | | | | | | | | | |
| | | | | |
| | 1,390 | | | Bon-Ton Department Stores Inc. | | | 10.250% | | | | 3/15/14 | | | | CCC | | | | 1,396,950 | |
| | | | | |
| | 1,300 | | | Revlon Consumer Products, 144A | | | 5.750% | | | | 2/15/21 | | | | B1 | | | | 1,304,875 | |
| | 2,690 | | | Total Multiline Retail | | | | | | | | | | | | | | | 2,701,825 | |
| | | | Oil, Gas & Consumable Fuels – 6.6% | | | | | | | | | | | | | | | | |
| | | | | |
| | 1,000 | | | Calumet Specialty Products | | | 9.375% | | | | 5/01/19 | | | | B | | | | 1,120,000 | |
| | | | | |
| | 250 | | | Chaparral Energy Inc., 144A | | | 7.625% | | | | 11/15/22 | | | | B– | | | | 273,124 | |
| | | | | |
| | 1,400 | | | Cheniere Energy Inc., 144A | | | 5.625% | | | | 2/01/21 | | | | BB+ | | | | 1,452,500 | |
| | | | | |
| | 2,000 | | | Drill Rigs Holdings Inc., 144A | | | 6.500% | | | | 10/01/17 | | | | B | | | | 2,020,000 | |
| | | | | |
| | 500 | | | EPL Oil & Gas Inc., 144A | | | 8.250% | | | | 2/15/18 | | | | B– | | | | 530,000 | |
| | | | | |
| | 1,250 | | | Everest Acquisition LLC Finance, 144A | | | 7.750% | | | | 9/01/22 | | | | B | | | | 1,381,250 | |
| | | | | |
| | 1,000 | | | Genesis Energy LP | | | 7.875% | | | | 12/15/18 | | | | B1 | | | | 1,097,500 | |
| | | | | |
| | 500 | | | Halcon Resources Limited Liability Corporation, 144A | | | 8.875% | | | | 5/15/21 | | | | CCC+ | | | | 538,750 | |
| | | | | |
| | 2,000 | | | Laredo Petroleum Inc. | | | 7.375% | | | | 5/01/22 | | | | B– | | | | 2,190,000 | |
| | | | | |
| | 2,000 | | | Linn Energy LLC Finance Corporation, 144A | | | 6.250% | | | | 11/01/19 | | | | B | | | | 2,045,000 | |
| | | | | |
| | 2,850 | | | Magnum Hunter Resources Corporation | | | 9.750% | | | | 5/15/20 | | | | CCC+ | | | | 2,992,500 | |
| | | | | |
| | 2,000 | | | Oasis Petroleum Inc. | | | 6.500% | | | | 11/01/21 | | | | B | | | | 2,180,000 | |
| | | | | |
| | 2,000 | | | PetroBakken Energy Limited, 144A | | | 8.625% | | | | 2/01/20 | | | | CCC+ | | | | 2,040,000 | |
| | | | | |
| | 3,000 | | | Plains Exploration & Production Company | | | 6.500% | | | | 11/15/20 | | | | B1 | | | | 3,315,000 | |
| | | | | |
| | 1,300 | | | Range Resources Corporation | | | 5.000% | | | | 3/15/23 | | | | BB | | | | 1,329,250 | |
| | | | | |
| | 1,600 | | | Shelf Drill Holdings Limited, 144A | | | 8.625% | | | | 11/01/18 | | | | B1 | | | | 1,696,000 | |
| | 24,650 | | | Total Oil, Gas & Consumable Fuels | | | | | | | | | | | | | | | 26,200,874 | |
| | | | Paper & Forest Products – 0.6% | | | | | | | | | | | | | | | | |
| | | | | |
| | 2,332 | | | Catalyst Paper Corporation | | | 11.000% | | | | 10/30/17 | | | | N/R | | | | 1,854,079 | |
| | | | | |
| | 500 | | | Unifrax I LLC / Unifrax Holdings, 144A | | | 7.500% | | | | 2/15/19 | | | | B– | | | | 515,000 | |
| | 2,832 | | | Total Paper & Forest Products | | | | | | | | | | | | | | | 2,369,079 | |
| | | | Personal Products – 0.3% | | | | | | | | | | | | | | | | |
| | | | | |
| | 1,000 | | | Prestige Brands Inc. | | | 8.125% | | | | 2/01/20 | | | | B– | | | | 1,128,750 | |
| | | | Pharmaceuticals – 0.4% | | | | | | | | | | | | | | | | |
| | | | | |
| | 53 | | | Angiotech Pharmaceuticals Inc. | | | 5.000% | | | | 12/01/13 | | | | N/R | | | | 53,199 | |
Portfolio of Investments (Unaudited)
Nuveen Symphony Credit Opportunities Fund (continued)
March 31, 2013
| | | | | | | | | | | | | | | | | | | | |
Principal
Amount (000) | | | Description (1) | | Coupon | | | Maturity | | | Ratings (5) | | | Value | |
| | | | Pharmaceuticals (continued) | | | | | | | | | | | | | | | | |
| | | | | |
| $ | 897 | | | Angiotech Pharmaceuticals Inc. | | | 9.000% | | | | 12/01/16 | | | | N/R | | | $ | 900,363 | |
| | | | | |
| | 750 | | | Warner Chilcott Company LLC | | | 7.750% | | | | 9/15/18 | | | | BB | | | | 801,563 | |
| | 1,700 | | | Total Pharmaceuticals | | | | | | | | | | | | | | | 1,755,125 | |
| | | | Real Estate Investment Trust – 0.3% | | | | | | | | | | | | | | | | |
| | | | | |
| | 1,200 | | | Istar Financial Inc. | | | 9.000% | | | | 6/01/17 | | | | B+ | | | | 1,341,000 | |
| | | | Road & Rail – 0.7% | | | | | | | | | | | | | | | | |
| | | | | |
| | 1,250 | | | Avis Budget Car Rental, 144A, (WI/DD) | | | 5.500% | | | | 4/01/23 | | | | BB– | | | | 1,246,875 | |
| | | | | |
| | 1,000 | | | Avis Budget Car Rental | | | 8.250% | | | | 1/15/19 | | | | B+ | | | | 1,108,750 | |
| | | | | |
| | 500 | | | Swift Services Holdings Inc. | | | 10.000% | | | | 11/15/18 | | | | B+ | | | | 572,500 | |
| | 2,750 | | | Total Road & Rail | | | | | | | | | | | | | | | 2,928,125 | |
| | | | Software – 1.1% | | | | | | | | | | | | | | | | |
| | | | | |
| | 400 | | | Emdeon Incorporated | | | 11.000% | | | | 12/31/19 | | | | CCC+ | | | | 461,000 | |
| | | | | |
| | 2,000 | | | First Data Corporation, (WI/DD) | | | 10.625% | | | | 6/15/21 | | | | B– | | | | 2,022,500 | |
| | | | | |
| | 850 | | | Infor Us Inc. | | | 11.500% | | | | 7/15/18 | | | | B– | | | | 998,750 | |
| | | | | |
| | 750 | | | Infor Us Inc. | | | 9.375% | | | | 4/01/19 | | | | B– | | | | 850,312 | |
| | 4,000 | | | Total Software | | | | | | | | | | | | | | | 4,332,562 | |
| | | | Specialty Retail – 2.1% | | | | | | | | | | | | | | | | |
| | | | | |
| | 3,000 | | | Claire’s Stores, Inc., 144A | | | 9.000% | | | | 3/15/19 | | | | B2 | | | | 3,390,000 | |
| | | | | |
| | 1,000 | | | Claire’s Stores, Inc. | | | 10.500% | | | | 6/01/17 | | | | CCC | | | | 1,012,500 | |
| | | | | |
| | 1,000 | | | Claire’s Stores, Inc. | | | 8.875% | | | | 3/15/19 | | | | CCC | | | | 1,055,000 | |
| | | | | |
| | 2,850 | | | Jo-Ann Stores Holdings Inc., 144A | | | 9.750% | | | | 10/15/19 | | | | CCC+ | | | | 2,992,500 | |
| | 7,850 | | | Total Specialty Retail | | | | | | | | | | | | | | | 8,450,000 | |
| | | | Textiles, Apparel & Luxury Goods – 0.8% | | | | | | | | | | | | | | | | |
| | | | | |
| | 2,000 | | | Levi Strauss & Company | | | 6.875% | | | | 5/01/22 | | | | BB– | | | | 2,190,000 | |
| | | | | |
| | 1,000 | | | Perry Ellis International | | | 7.875% | | | | 4/01/19 | | | | B+ | | | | 1,050,000 | |
| | 3,000 | | | Total Textiles, Apparel & Luxury Goods | | | | | | | | | | | | | | | 3,240,000 | |
| | | | Thrifts & Mortgage Finance – 0.4% | | | | | | | | | | | | | | | | |
| | | | | |
| | 1,500 | | | Nationstar Mortgage LLC Capital Corporation | | | 6.500% | | | | 7/01/21 | | | | B+ | | | | 1,563,750 | |
| | | | Trading Companies & Distributors – 0.8% | | | | | | | | | | | | | | | | |
| | | | | |
| | 2,000 | | | Rexel SA, 144A, (WI/DD) | | | 5.250% | | | | 6/15/20 | | | | BB | | | | 2,025,000 | |
| | | | | |
| | 1,200 | | | United Rentals Financing Escrow Corporation, 144A | | | 7.375% | | | | 5/15/20 | | | | B+ | | | | 1,332,000 | |
| | 3,200 | | | Total Trading Companies & Distributors | | | | | | | | | | | | | | | 3,357,000 | |
| | | | Wireless Telecommunication Services – 3.1% | | | | | | | | | | | | | | | | |
| | | | | |
| | 2,000 | | | CenturyLink Inc. | | | 5.625% | | | | 4/01/20 | | | | BB+ | | | | 2,045,000 | |
| | | | | |
| | 2,000 | | | Digicel Limited, 144A | | | 6.000% | | | | 4/15/21 | | | | B1 | | | | 1,990,000 | |
| | | | | |
| | 2,000 | | | FairPoint Communications Inc., 144A | | | 8.750% | | | | 8/15/19 | | | | B | | | | 1,940,000 | |
| | | | | |
| | 1,700 | | | MetroPCS Wireless Inc., 144A | | | 6.250% | | | | 4/01/21 | | | | BB | | | | 1,729,750 | |
| | | | | |
| | 2,500 | | | MetroPCS Wireless Inc., 144A | | | 6.625% | | | | 4/01/23 | | | | BB | | | | 2,550,000 | |
| | | | | |
| | 1,000 | | | Nortel Networks Limited, (8) | | | 10.125% | | | | 7/15/13 | | | | N/R | | | | 1,140,000 | |
| | | | | |
| | 1,000 | | | Syniverse Holdings Inc. | | | 9.125% | | | | 1/15/19 | | | | B– | | | | 1,097,500 | |
| | 12,200 | | | Total Wireless Telecommunication Services | | | | | | | | | | | | | | | 12,492,250 | |
| $ | 253,300 | | | Total Corporate Bonds (cost $253,406,494) | | | | | | | | | | | | | | | 266,535,236 | |
| | | | | | | | | | | | | | | | | | | | |
Principal
Amount (000) | | | Description (1) | | Coupon | | | Maturity (6) | | | Ratings (5) | | | Value | |
| | | | VARIABLE RATE SENIOR LOAN INTERESTS – 26.1% (7) | | | | | | | | | | | | | | | | |
| | | | | |
| | | | Aerospace & Defense – 0.7% | | | | | | | | | | | | | | | | |
| | | | | |
| $ | 2,000 | | | Beechcraft Holdings LLC, Exit Term Loan B | | | 5.750% | | | | 2/15/20 | | | | BB– | | | $ | 2,012,500 | |
| | | | | |
| | 878 | | | Hamilton Sundstrand, Term Loan, First Lien | | | 4.000% | | | | 12/13/19 | | | | B1 | | | | 884,804 | |
| | 2,878 | | | Total Aerospace & Defense | | | | | | | | | | | | | | | 2,897,304 | |
| | | | Airlines – 0.6% | | | | | | | | | | | | | | | | |
| | | | | |
| | 2,000 | | | Delta Air Lines, Inc., Term Loan B1 | | | 5.250% | | | | 10/18/18 | | | | Ba2 | | | | 2,034,376 | |
| | | | | |
| | 500 | | | United Air Lines, Inc., Term Loan B, (WI/DD) | | | TBD | | | | TBD | | | | Ba2 | | | | 506,094 | |
| | 2,500 | | | Total Airlines | | | | | | | | | | | | | | | 2,540,470 | |
| | | | Auto Components – 0.5% | | | | | | | | | | | | | | | | |
| | | | | |
| | 998 | | | FleetPride Corporation, Term Loan, First Lien | | | 5.250% | | | | 11/16/19 | | | | B1 | | | | 1,011,839 | |
| | | | | |
| | 955 | | | Schaeffler AG, Term Loan C | | | 4.250% | | | | 1/07/17 | | | | Ba3 | | | | 966,938 | |
| | 1,953 | | | Total Auto Components | | | | | | | | | | | | | | | 1,978,777 | |
| | | | Biotechnology – 0.1% | | | | | | | | | | | | | | | | |
| | | | | |
| | 294 | | | Grifols, Inc., Term Loan | | | 4.250% | | | | 6/01/17 | | | | BB | | | | 297,106 | |
| | | | Capital Markets – 0.7% | | | | | | | | | | | | | | | | |
| | | | | |
| | 850 | | | American Capital, LTD., Senior Secured Term Loan | | | 5.500% | | | | 8/15/16 | | | | B+ | | | | 864,875 | |
| | | | | |
| | 1,962 | | | Walter Investment Management First Lien Term Loan | | | 5.750% | | | | 11/28/17 | | | | B+ | | | | 2,000,117 | |
| | 2,812 | | | Total Capital Markets | | | | | | | | | | | | | | | 2,864,992 | |
| | | | Chemicals – 0.4% | | | | | | | | | | | | | | | | |
| | | | | |
| | 891 | | | Ineos US Finance LLC, Term Loan B | | | 6.500% | | | | 5/04/18 | | | | B+ | | | | 906,315 | |
| | | | | |
| | 489 | | | Univar, Inc., Term Loan | | | 5.000% | | | | 6/30/17 | | | | B+ | | | | 494,207 | |
| | 1,380 | | | Total Chemicals | | | | | | | | | | | | | | | 1,400,522 | |
| | | | Commercial Services & Supplies – 1.0% | | | | | | | | | | | | | | | | |
| | | | | |
| | 833 | | | Aramark Corporation, Term Loan, Tranche D | | | 4.000% | | | | 2/20/20 | | | | BB– | | | | 843,375 | |
| | | | | |
| | 435 | | | CCS Income Trust, Term Loan, First Lien | | | 6.250% | | | | 5/12/18 | | | | B2 | | | | 440,270 | |
| | | | | |
| | 2,491 | | | Ceridian Corporation, Extended Term Loan | | | 5.953% | | | | 5/09/17 | | | | B1 | | | | 2,541,232 | |
| | 3,759 | | | Total Commercial Services & Supplies | | | | | | | | | | | | | | | 3,824,877 | |
| | | | Communications Equipment – 0.8% | | | | | | | | | | | | | | | | |
| | | | | |
| | 998 | | | Alcatel-Lucent, Term Loan C | | | 7.250% | | | | 1/29/19 | | | | BB– | | | | 1,014,853 | |
| | | | | |
| | 998 | | | CompuCom Systems, Inc., Term Loan, First Lien | | | 6.500% | | | | 10/04/18 | | | | B+ | | | | 1,010,800 | |
| | | | | |
| | 995 | | | Zayo Group LLC, Term Loan B, (WI/DD) | | | TBD | | | | TBD | | | | B1 | | | | 1,007,064 | |
| | 2,991 | | | Total Communications Equipment | | | | | | | | | | | | | | | 3,032,717 | |
| | | | Consumer Finance – 0.1% | | | | | | | | | | | | | | | | |
| | | | | |
| | 375 | | | Springleaf Financial Funding Company, Term Loan | | | 5.500% | | | | 5/10/17 | | | | B3 | | | | 378,105 | |
| | | | Containers & Packaging – 0.3% | | | | | | | | | | | | | | | | |
| | | | | |
| | 712 | | | Reynolds Group Holdings, Inc., Term Loan | | | 4.750% | | | | 9/28/18 | | | | B+ | | | | 722,967 | |
| | | | | |
| | 351 | | | Sealed Air Corporation, Term Loan B1 | | | 4.000% | | | | 10/03/18 | | | | Ba1 | | | | 357,302 | |
| | 1,063 | | | Total Containers & Packaging | | | | | | | | | | | | | | | 1,080,269 | |
| | | | Distributors – 0.3% | | | | | | | | | | | | | | | | |
| | | | | |
| | 1,244 | | | HD Supply, Inc., Term Loan B | | | 4.500% | | | | 10/12/17 | | | | B+ | | | | 1,275,621 | |
| | | | Diversified Consumer Services – 0.2% | | | | | | | | | | | | | | | | |
| | | | | |
| | 992 | | | Cengage Learning Acquisitions, Inc., Term Loan | | | 2.710% | | | | 7/03/14 | | | | CCC | | | | 768,278 | |
| | | | Diversified Financial Services – 0.6% | | | | | | | | | | | | | | | | |
| | | | | |
| | 2,408 | | | WideOpenWest Finance LLC, Term Loan B, (WI/DD) | | | TBD | | | | TBD | | | | B1 | | | | 2,433,483 | |
Portfolio of Investments (Unaudited)
Nuveen Symphony Credit Opportunities Fund (continued)
March 31, 2013
| | | | | | | | | | | | | | | | | | | | |
Principal
Amount (000) | | | Description (1) | | Coupon | | | Maturity (6) | | | Ratings (5) | | | Value | |
| | | | Food & Staples Retailing – 1.2% | | | | | | | | | | | | | | | | |
| | | | | |
| $ | 1,000 | | | Albertsons Incorporated, (WI/DD) | | | TBD | | | | TBD | | | | Caa1 | | | $ | 1,018,304 | |
| | | | | |
| | 500 | | | BJ Wholesale Club, Inc., Term Loan, Second Lien | | | 9.750% | | | | 3/26/20 | | | | CCC+ | | | | 520,312 | |
| | | | | |
| | 1,000 | | | Rite Aid Corporation, Tranche 1, Term Loan, Second Lien | | | 5.750% | | | | 8/21/20 | | | | B– | | | | 1,038,333 | |
| | | | | |
| | 896 | | | Wendy’s/Arby’s Restaurants LLC, Term Loan B | | | 4.750% | | | | 5/15/19 | | | | BB– | | | | 906,370 | |
| | | | | |
| | 1,463 | | | Wilton Brands LLC, Term Loan B | | | 7.500% | | | | 8/30/18 | | | | B1 | | | | 1,488,094 | |
| | 4,859 | | | Total Food & Staples Retailing | | | | | | | | | | | | | | | 4,971,413 | |
| | | | Food Products – 2.4% | | | | | | | | | | | | | | | | |
| | | | | |
| | 998 | | | AdvancePierre Foods, Inc., Term Loan, First Lien | | | 5.750% | | | | 7/10/17 | | | | B1 | | | | 1,013,709 | |
| | | | | |
| | 900 | | | AdvancePierre Foods, Inc., Term Loan, Second Lien | | | 9.500% | | | | 10/10/17 | | | | CCC+ | | | | 933,750 | |
| | | | | |
| | 898 | | | BJ’s Wholesale Club, Inc., Term Loan, First Lien | | | 4.250% | | | | 9/26/19 | | | | B | | | | 907,288 | |
| | | | | |
| | 3,600 | | | H.J Heinz Company, Term Loan B2, (WI/DD) | | | TBD | | | | TBD | | | | BB | | | | 3,635,550 | |
| | | | | |
| | 500 | | | Supervalu, Inc., New Term Loan | | | 6.250% | | | | 3/13/19 | | | | BB– | | | | 509,419 | |
| | | | | |
| | 2,441 | | | U.S. Foodservice, Inc., Extended Term Loan | | | 5.750% | | | | 3/31/17 | | | | B2 | | | | 2,478,101 | |
| | 9,337 | | | Total Food Products | | | | | | | | | | | | | | | 9,477,817 | |
| | | | Health Care Equipment & Supplies – 0.2% | | | | | | | | | | | | | | | | |
| | | | | |
| | 871 | | | Hologic, Inc., Term Loan B | | | 4.500% | | | | 8/01/19 | | | | BBB– | | | | 883,775 | |
| | | | Health Care Providers & Services – 1.9% | | | | | | | | | | | | | | | | |
| | | | | |
| | 693 | | | Gentiva Health Services, Inc., Term Loan B | | | 6.500% | | | | 8/17/16 | | | | B+ | | | | 699,514 | |
| | | | | |
| | 459 | | | IASIS Healthcare LLC, Term Loan B2, First Lien | | | 4.500% | | | | 5/15/18 | | | | Ba3 | | | | 465,986 | |
| | | | | |
| | 98 | | | LifeCare Holdings, Inc., Term Loan Add On, (8) | | | 0.000% | | | | 2/01/16 | | | | N/R | | | | 91,517 | |
| | | | | |
| | 543 | | | LifeCare, Term Loan, (8) | | | 0.000% | | | | 2/01/16 | | | | N/R | | | | 507,369 | |
| | | | | |
| | 746 | | | National Mentor Holdings, Inc., Term Loan B | | | 6.500% | | | | 2/09/17 | | | | B+ | | | | 755,989 | |
| | | | | |
| | 491 | | | Select Medical Corporation, Term Loan | | | 5.500% | | | | 6/01/18 | | | | B+ | | | | 496,085 | |
| | | | | |
| | 1,489 | | | Select Medical Corporation, Tranche B, Term Loan A | | | 5.501% | | | | 6/01/18 | | | | BB– | | | | 1,498,055 | |
| | | | | |
| | 1,985 | | | Sheridan Holdings, Inc., Term Loan, First Lien | | | 4.500% | | | | 2/13/18 | | | | B+ | | | | 2,005,288 | |
| | | | | |
| | 948 | | | Skilled Healthcare Group, Inc., Term Loan | | | 6.750% | | | | 4/09/16 | | | | B1 | | | | 958,763 | |
| | 7,452 | | | Total Health Care Providers & Services | | | | | | | | | | | | | | | 7,478,566 | |
| | | | Health Care Technology – 0.2% | | | | | | | | | | | | | | | | |
| | | | | |
| | 658 | | | Emdeon Business Services LLC, Term Loan B1 | | | 5.000% | | | | 11/02/18 | | | | BB– | | | | 668,020 | |
| | | | Hotels, Restaurants & Leisure – 1.0% | | | | | | | | | | | | | | | | |
| | | | | |
| | 1,485 | | | Landry’s Restaurants, Inc., Term Loan B | | | 4.750% | | | | 4/24/18 | | | | B+ | | | | 1,498,613 | |
| | | | | |
| | 1,496 | | | MGM Resorts International, Term Loan B | | | 4.250% | | | | 12/20/19 | | | | BB | | | | 1,523,236 | |
| | | | | |
| | 1,000 | | | Station Casino LLC, Term Loan B | | | 5.000% | | | | 3/02/20 | | | | B1 | | | | 1,012,500 | |
| | 3,981 | | | Total Hotels, Restaurants & Leisure | | | | | | | | | | | | | | | 4,034,349 | |
| | | | Household Durables – 0.9% | | | | | | | | | | | | | | | | |
| | | | | |
| | 1,500 | | | AOT Bedding Super Holdings LLC, Term Loan B | | | 5.003% | | | | 10/01/19 | | | | B+ | | | | 1,522,812 | |
| | | | | |
| | 2,000 | | | Sun Products Corporation, Term Loan | | | 5.500% | | | | 3/20/20 | | | | Ba3 | | | | 2,023,750 | |
| | 3,500 | | | Total Household Durables | | | | | | | | | | | | | | | 3,546,562 | |
| | | | Household Products – 0.0% | | | | | | | | | | | | | | | | |
| | | | | |
| | 65 | | | Visant Corporation, Term Loan B | | | 5.250% | | | | 12/22/16 | | | | BB– | | | | 62,715 | |
| | | | Industrial Conglomerates – 0.5% | | | | | | | | | | | | | | | | |
| | | | | |
| | 2,000 | | | DuPont Performance Coatings, Dollar Term Loan B | | | 4.750% | | | | 1/17/20 | | | | B+ | | | | 2,028,864 | |
| | | | Internet & Catalog Retail – 0.4% | | | | | | | | | | | | | | | | |
| | | | | |
| | 218 | | | Burlington Coat Factory Warehouse Corporation, Term Loan B1 | | | 5.500% | | | | 2/23/17 | | | | B+ | | | | 220,924 | |
| | | | | | | | | | | | | | | | | | | | |
Principal
Amount (000) | | | Description (1) | | Coupon | | | Maturity (6) | | | Ratings (5) | | | Value | |
| | | | Internet & Catalog Retail (continued) | | | | | | | | | | | | | | | | |
| | | | | |
| $ | 1,496 | | | EIG Investors Corp., Term Loan, First Lien | | | 6.250% | | | | 11/09/19 | | | | B1 | | | $ | 1,509,342 | |
| | 1,714 | | | Total Internet & Catalog Retail | | | | | | | | | | | | | | | 1,730,266 | |
| | | | Internet Software & Services – 0.4% | | | | | | | | | | | | | | | | |
| | | | | |
| | 1,750 | | | Sabre, Inc., Term Loan B | | | 5.253% | | | | 2/19/19 | | | | B1 | | | | 1,775,148 | |
| | | | IT Services – 0.9% | | | | | | | | | | | | | | | | |
| | | | | |
| | 1,000 | | | EIG Investors Corp., Term Loan, Second Lien | | | 10.250% | | | | 5/09/20 | | | | CCC+ | | | | 1,005,000 | |
| | | | | |
| | 606 | | | SRA International, Term Loan | | | 6.500% | | | | 7/20/18 | | | | B1 | | | | 606,126 | |
| | | | | |
| | 1,500 | | | SunGard Data Systems, Inc., Term Loan E | | | 4.000% | | | | 3/07/20 | | | | BB | | | | 1,520,625 | |
| | | | | |
| | 405 | | | Virtu Financial LLC, First Lien Term Loan | | | 5.769% | | | | 6/01/16 | | | | N/R | | | | 409,848 | |
| | 3,511 | | | Total IT Services | | | | | | | | | | | | | | | 3,541,599 | |
| | | | Media – 1.8% | | | | | | | | | | | | | | | | |
| | | | | |
| | 275 | | | Atlantic Broadband Finance LLC, Term Loan B | | | 4.500% | | | | 9/20/19 | | | | BB | | | | 279,812 | |
| | | | | |
| | 691 | | | Cumulus Media, Inc., Term Loan B, First Lien | | | 4.500% | | | | 9/18/18 | | | | Ba2 | | | | 700,474 | |
| | | | | |
| | 350 | | | Cumulus Media, Inc., Term Loan, Second Lien | | | 7.500% | | | | 9/16/19 | | | | B2 | | | | 364,000 | |
| | | | | |
| | 1,000 | | | Internet Brands, Inc., Term Loan B | | | 6.250% | | | | 3/13/19 | | | | B+ | | | | 1,003,750 | |
| | | | | |
| | 500 | | | Kabel Deutschland GmbH, Term Loan F1 | | | 3.250% | | | | 1/20/19 | | | | Ba2 | | | | 503,170 | |
| | | | | |
| | 2,000 | | | McGraw-Hill Education Holdings LLC, Term Loan | | | 9.000% | | | | 3/15/20 | | | | B2 | | | | 1,940,000 | |
| | | | | |
| | 1,496 | | | Tribune Company, Exit Term Loan B | | | 4.000% | | | | 12/17/19 | | | | BB+ | | | | 1,512,335 | |
| | | | | |
| | 988 | | | WMG Acquisition Corporation, Term Loan | | | 5.250% | | | | 11/01/18 | | | | Ba2 | | | | 1,006,016 | |
| | 7,300 | | | Total Media | | | | | | | | | | | | | | | 7,309,557 | |
| | | | Metals & Mining – 0.3% | | | | | | | | | | | | | | | | |
| | | | | |
| | 1,270 | | | FMG Resources, Ltd., Term Loan B | | | 5.250% | | | | 10/18/17 | | | | BB+ | | | | 1,286,553 | |
| | | | Multiline Retail – 0.0% | | | | | | | | | | | | | | | | |
| | | | | |
| | 195 | | | 99 Cents Only Stores, Term Loan B1 | | | 5.250% | | | | 1/11/19 | | | | B+ | | | | 197,421 | |
| | | | Multi-Utilities – 0.3% | | | | | | | | | | | | | | | | |
| | | | | |
| | 998 | | | ADS Waste Holdings, Inc., Term Loan B | | | 4.250% | | | | 8/05/19 | | | | B+ | | | | 1,009,844 | |
| | | | Oil, Gas & Consumable Fuels – 0.3% | | | | | | | | | | | | | | | | |
| | | | | |
| | 1,000 | | | El Paso Corporation, Tranche B1, Term Loan | | | 5.000% | | | | 5/24/18 | | | | Ba3 | | | | 1,012,946 | |
| | | | Personal Products – 0.6% | | | | | | | | | | | | | | | | |
| | | | | |
| | 2,000 | | | Bombardier Recreational Products, Inc., Term Loan B | | | 5.000% | | | | 1/23/19 | | | | B+ | | | | 2,022,292 | |
| | | | | |
| | 337 | | | Prestige Brands, Inc., Term Loan B1 | | | 3.750% | | | | 1/31/19 | | | | BB– | | | | 342,515 | |
| | 2,337 | | | Total Personal Products | | | | | | | | | | | | | | | 2,364,807 | |
| | | | Pharmaceuticals – 1.7% | | | | | | | | | | | | | | | | |
| | | | | |
| | 1,985 | | | Bausch & Lomb, Inc., Term Loan B | | | 5.250% | | | | 5/17/19 | | | | B+ | | | | 2,006,437 | |
| | | | | |
| | 271 | | | ConvaTec Healthcare, Incremental Term Loan B | | | 5.000% | | | | 12/22/16 | | | | Ba3 | | | | 275,869 | |
| | | | | |
| | 48 | | | Graceway Pharmaceuticals LLC, Term Loan, (8) | | | 0.000% | | | | 5/03/12 | | | | N/R | | | | 52,358 | |
| | | | | |
| | 1,368 | | | Par Pharmaceutical Companies, Inc., Additional Term Loan B1 | | | 4.250% | | | | 9/30/19 | | | | B+ | | | | 1,385,088 | |
| | | | | |
| | 493 | | | Pharmaceutical Product Development, Inc., Term Loan B, First Lien | | | 4.250% | | | | 12/01/18 | | | | Ba3 | | | | 500,380 | |
| | | | | |
| | 776 | | | Quintiles Transnational Corp., Term Loan B2 | | | 4.500% | | | | 6/08/18 | | | | BB– | | | | 787,535 | |
| | | | | |
| | 1,796 | | | Valeant Pharmaceuticals International, Inc., Series D, Term Loan | | | 3.500% | | | | 2/19/19 | | | | BBB– | | | | 1,813,895 | |
| | 6,737 | | | Total Pharmaceuticals | | | | | | | | | | | | | | | 6,821,562 | |
| | | | Real Estate Investment Trust – 0.3% | | | | | | | | | | | | | | | | |
| | | | | |
| | 1,379 | | | iStar Financial, Inc., Term Loan | | | 4.500% | | | | 10/16/17 | | | | B+ | | | | 1,395,565 | |
Portfolio of Investments (Unaudited)
Nuveen Symphony Credit Opportunities Fund (continued)
March 31, 2013
| | | | | | | | | | | | | | | | | | | | |
Principal
Amount (000) | | | Description (1) | | Coupon | | | Maturity (6) | | | Ratings (5) | | | Value | |
| | | | Real Estate Management & Development – 0.6% | | | | | | | | | | | | | | | | |
| | | | | |
| $ | 433 | | | Capital Automotive LP, Tranche B | | | 5.250% | | | | 3/11/17 | | | | Ba3 | | | $ | 435,858 | |
| | | | | |
| | 361 | | | LNR Property Corporation, Term Loan | | | 4.750% | | | | 4/29/16 | | | | BB+ | | | | 361,953 | |
| | | | | |
| | 1,500 | | | Realogy Corporation, Term Loan B | | �� | 4.500% | | | | 3/01/20 | | | | BB– | | | | 1,522,970 | |
| | 2,294 | | | Total Real Estate Management & Development | | | | | | | | | | | | | | | 2,320,781 | |
| | | | Road & Rail – 0.1% | | | | | | | | | | | | | | | | |
| | | | | |
| | 269 | | | Swift Transportation Company, Inc., Term Loan B2 | | | 4.000% | | | | 12/01/17 | | | | BB | | | | 273,691 | |
| | | | Software – 1.5% | | | | | | | | | | | | | | | | |
| | | | | |
| | 1,699 | | | Attachmate Corporation, Term Loan, First Lien | | | 7.272% | | | | 11/22/17 | | | | BB– | | | | 1,718,923 | |
| | | | | |
| | 453 | | | Blackboard, Inc., Term Loan B2 | | | 6.250% | | | | 10/04/18 | | | | B+ | | | | 458,923 | |
| | | | | |
| | 436 | | | Datatel Parent Corp, Term Loan B | | | 4.500% | | | | 7/19/18 | | | | B+ | | | | 443,406 | |
| | | | | |
| | 500 | | | Deltek, Inc., Term Loan, Second Lien | | | 10.000% | | | | 10/10/19 | | | | CCC+ | | | | 508,906 | |
| | | | | |
| | 439 | | | Greeneden U.S. Holdings II LLC, Term Loan B | | | 4.000% | | | | 2/01/20 | | | | B+ | | | | 442,289 | |
| | | | | |
| | 1,172 | | | Infor Enterprise Applications, Term Loan B | | | 5.250% | | | | 4/05/18 | | | | Ba3 | | | | 1,194,144 | |
| | | | | |
| | 1,190 | | | SS&C Technologies, Inc./ Sunshine Acquisition II, Inc., Funded Term Loan B1 | | | 5.000% | | | | 6/07/19 | | | | BB– | | | | 1,204,594 | |
| | | | | |
| | 123 | | | SS&C Technologies, Inc./ Sunshine Acquisition II, Inc., Funded Term Loan B2 | | | 5.000% | | | | 6/07/19 | | | | BB– | | | | 125,075 | |
| | 6,012 | | | Total Software | | | | | | | | | | | | | | | 6,096,260 | |
| | | | Specialty Retail – 0.8% | | | | | | | | | | | | | | | | |
| | | | | |
| | 1,829 | | | Collective Brands, Inc., Term Loan B | | | 7.250% | | | | 10/09/19 | | | | B | | | | 1,860,183 | |
| | | | | |
| | 441 | | | Jo-Ann Stores, Inc., Term Loan, First Lien | | | 4.000% | | | | 2/05/18 | | | | B+ | | | | 444,949 | |
| | | | | |
| | 124 | | | Lord & Taylor Holdings LLC, Term Loan | | | 5.750% | | | | 1/11/19 | | | | BB | | | | 125,480 | |
| | | | | |
| | 950 | | | Tempur-Pedic International, Inc., Term Loan B | | | 5.000% | | | | 11/20/19 | | | | BB | | | | 964,505 | |
| | 3,344 | | | Total Specialty Retail | | | | | | | | | | | | | | | 3,395,117 | |
| | | | Textiles, Apparel & Luxury Goods – 0.4% | | | | | | | | | | | | | | | | |
| | | | | |
| | 1,500 | | | Philips-Van Heusen Corporation, Term Loan B | | | 3.250% | | | | 12/19/19 | | | | BBB– | | | | 1,518,164 | |
| | | | Wireless Telecommunication Services – 1.1% | | | | | | | | | | | | | | | | |
| | | | | |
| | 365 | | | Clear Channel Communications, Inc., Tranche B, Term Loan | | | 3.854% | | | | 1/29/16 | | | | CCC+ | | | | 324,775 | |
| | | | | |
| | 1,500 | | | Cricket Communications, Inc., Term Loan C, (WI/DD) | | | TBD | | | | TBD | | | | Ba3 | | | | 1,511,483 | |
| | | | | |
| | 500 | | | Integra Telecom, Inc., Term Loan, First Lien | | | 6.000% | | | | 2/22/19 | | | | B | | | | 507,688 | |
| | | | | |
| | 1,990 | | | IPC Systems, Inc., Term Loan, Tranche C, First Lien | | | 7.750% | | | | 7/31/17 | | | | B1 | | | | 1,990,000 | |
| | 4,355 | | | Total Wireless Telecommunication Services | | | | | | | | | | | | | | | 4,333,946 | |
| $ | 103,337 | | | Total Variable Rate Senior Loan Interests (cost $102,183,735) | | | | | | | | | | | | | | | 104,307,829 | |
| | | | | |
Principal
Amount (000) | | | Description (1) | | Coupon | | | Maturity | | | | | | Value | |
| | | | SHORT-TERM INVESTMENTS – 8.5% | | | | | | | | | | | | | | | | |
| | | | | |
| $ | 34,047 | | | Repurchase Agreement with State Street Bank, dated 3/28/13, repurchase price $34,047,249, collateralized by $33,965,000 U.S. Treasury Notes, 1.000%, due 3/31/17, value $34,729,077 | | | 0.010% | | | | 4/01/13 | | | | | | | $ | 34,047,211 | |
| | | | Total Short-Term Investments (cost $34,047,211) | | | | | | | | | | | | | | | 34,047,211 | |
| | | | Total Investments (cost $395,287,388) – 102.8% | | | | | | | | | | | | | | | 411,136,788 | |
| | | | Other Assets Less Liabilities – (2.8)% | | | | | | | | | | | | | | | (11,119,612) | |
| | | | Net Assets – 100% | | | | | | | | | | | | | | $ | 400,017,176 | |
| | | | For Fund portfolio compliance purposes, the Fund’s industry classifications refer to any one or more of the industry sub-classifications used by one or more widely recognized market indexes or ratings group indexes, and/or as defined by Fund management. This definition may not apply for purposes of this report, which may combine industry sub-classifications into sectors for reporting ease. |
| | (1) | | All percentages shown in the Portfolio of Investments are based on net assets. |
| | (2) | | Non-income producing; issuer has not declared a dividend within the past twelve months. |
| | (3) | | Investment valued at fair value using methods determined in good faith by, or at the discretion of, the Board of Trustees. For fair value measurement disclosure purposes, investment classified as Level 3. See Notes to Financial Statements, Footnote 1 – General Information and Significant Accounting Policies, Investment Valuation for more information. |
| | (4) | | For fair value measurement disclosure purposes, Common Stock classified as Level 2. See Notes to Financial Statements, Footnote 1 – General Information and Significant Accounting Policies, Investment Valuation for more Information. |
| | (5) | | Ratings: Using the highest of Standard & Poor’s Group (“Standard & Poor’s”), Moody’s Investors Service, Inc. (“Moody’s”) or Fitch, Inc. (“Fitch”) rating. Ratings below BBB by Standard & Poor’s, Baa by Moody’s or BBB by Fitch are considered to be below investment grade. Holdings designated N/R are not rated by any of these national rating agencies. |
| | (6) | | Senior Loans generally are subject to mandatory and/or optional prepayment. Because of these mandatory prepayment conditions and because there may be significant economic incentives for a borrower to prepay, prepayments of Senior Loans may occur. As a result, the actual remaining maturity of Senior Loans held may be substantially less than the stated maturities shown. |
| | (7) | | Senior Loans generally pay interest at rates which are periodically adjusted by reference to a base short-term, floating lending rate plus an assigned fixed rate. These floating lending rates are generally (i) the lending rate referenced by the London Inter-Bank Offered Rate (“LIBOR”), or (ii) the prime rate offered by one or more major United States banks. |
| | | | Senior Loans may be considered restricted in that the Fund ordinarily is contractually obligated to receive approval from the Agent Bank and/or borrower prior to the disposition of a Senior Loan. |
| | (8) | | At or subsequent to the end of the reporting period, this security is non-income producing. Non-income producing security, in the case of a fixed-income security, generally denotes that the issuer has (1) defaulted on the payment of principal or interest, (2) is under the protection of the Federal Bankruptcy Court or (3) the Fund’s Adviser has concluded that the issue is not likely to meet its future interest payment obligations and has directed the Fund’s custodian to cease accruing additional income on the Fund’s records. |
| | WI/DD | | Purchased on a when-issued or delayed delivery basis. |
| | 144A | | Investment is exempt from registration under Rule 144A of the Securities Act of 1933, as amended. These investments may only be resold in transactions exempt from registration, which are normally those transactions with qualified institutional buyers. |
| | TBD | | Senior Loan purchased on a when-issued or delayed-delivery basis. Certain details associated with this purchase are not known prior to the settlement date of the transaction. In addition, Senior Loans typically trade without accrued interest and therefore a coupon rate is not available prior to settlement. As of settlement, if still unknown, the borrower or counterparty will provide the Fund with the final coupon rate and maturity date. |
See accompanying notes to financial statements.
Portfolio of Investments (Unaudited)
Nuveen Symphony Floating Rate Fund
March 31, 2013
| | | | | | | | | | | | | | | | | | | | |
Principal
Amount (000) | | | Description (1) | | Coupon | | | Maturity | | | Ratings (2) | | | Value | |
| | | | CORPORATE BONDS – 17.1% | | | | | | | | | | | | | | | | |
| | | | | |
| | | | Commercial Services & Supplies – 1.2% | | | | | | | | | | | | | | | | |
| | | | | |
| $ | 250 | | | Ceridian Corporation, 144A | | | 8.875% | | | | 7/15/19 | | | | B1 | | | $ | 290,938 | |
| | | | | |
| | 500 | | | Ceridian Corporation | | | 12.250% | | | | 11/15/15 | | | | CCC | | | | 516,875 | |
| | 750 | | | Total Commercial Services & Supplies | | | | | | | | | | | | | | | 807,813 | |
| | | | Distributors – 0.9% | | | | | | | | | | | | | | | | |
| | | | | |
| | 500 | | | HD Supply Inc. | | | 11.500% | | | | 7/15/20 | | | | CCC+ | | | | 592,500 | |
| | | | Diversified Financial Services – 1.4% | | | | | | | | | | | | | | | | |
| | | | | |
| | 850 | | | UPCB Finance Limited, 144A | | | 6.625% | | | | 7/01/20 | | | | BB– | | | | 913,750 | |
| | | | Diversified Telecommunication Services – 1.5% | | | | | | | | | | | | | | | | |
| | | | | |
| | 500 | | | IntelSat Limited, 144A, (WI/DD) | | | 7.750% | | | | 6/01/21 | | | | CCC+ | | | | 508,750 | |
| | | | | |
| | 500 | | | IntelSat Limited, (WI/DD) | | | 8.125% | | | | 6/01/23 | | | | CCC+ | | | | 508,125 | |
| | 1,000 | | | Total Diversified Telecommunication Services | | | | | | | | | | | | | | | 1,016,875 | |
| | | | Health Care Equipment & Supplies – 1.8% | | | | | | | | | | | | | | | | |
| | | | | |
| | 1,100 | | | Kinetic Concepts | | | 10.500% | | | | 11/01/18 | | | | B | | | | 1,190,750 | |
| | | | Health Care Providers & Services – 2.1% | | | | | | | | | | | | | | | | |
| | | | | |
| | 1,000 | | | IASIS Healthcare Capital Corporation | | | 8.375% | | | | 5/15/19 | | | | CCC+ | | | | 1,051,250 | |
| | | | | |
| | 300 | | | Vanguard Health Holding LLC/Inc. | | | 8.000% | | | | 2/01/18 | | | | B– | | | | 319,125 | |
| | 1,300 | | | Total Health Care Providers & Services | | | | | | | | | | | | | | | 1,370,375 | |
| | | | Hotels, Restaurants & Leisure – 0.4% | | | | | | | | | | | | | | | | |
| | | | | |
| | 250 | | | Caesars Operating Escrow, 144A | | | 9.000% | | | | 2/15/20 | | | | B | | | | 251,563 | |
| | | | Household Products – 2.1% | | | | | | | | | | | | | | | | |
| | | | | |
| | 1,250 | | | Spectrum Brands Inc., 144A | | | 6.625% | | | | 11/15/22 | | | | BB– | | | | 1,356,250 | |
| | | | Machinery – 0.4% | | | | | | | | | | | | | | | | |
| | | | | |
| | 250 | | | Xerium Technologies | | | 8.875% | | | | 6/15/18 | | | | B | | | | 239,375 | |
| | | | Media – 1.8% | | | | | | | | | | | | | | | | |
| | | | | |
| | 500 | | | Cequel Communications Holding I LLC Capital | | | 6.375% | | | | 9/15/20 | | | | B– | | | | 518,750 | |
| | | | | |
| | 91 | | | Clear Channel Communications, Inc. | | | 9.000% | | | | 12/15/19 | | | | CCC+ | | | | 87,474 | |
| | | | | |
| | 500 | | | WideOpenWest Finance Capital Corporation, 144A | | | 10.250% | | | | 7/15/19 | | | | CCC+ | | | | 556,250 | |
| | 1,091 | | | Total Media | | | | | | | | | | | | | | | 1,162,474 | |
| | | | Pharmaceuticals – 3.5% | | | | | | | | | | | | | | | | |
| | | | | |
| | 1,250 | | | Endo Pharmaceutical Holdings Inc. | | | 7.250% | | | | 1/15/22 | | | | BB | | | | 1,343,750 | |
| | | | | |
| | 875 | | | Warner Chilcott Company LLC | | | 7.750% | | | | 9/15/18 | | | | BB | | | | 935,155 | |
| | 2,125 | | | Total Pharmaceuticals | | | | | | | | | | | | | | | 2,278,905 | |
| $ | 10,466 | | | Total Corporate Bonds (cost $11,118,111) | | | | | | | | | | | | | | | 11,180,630 | |
| | | | | |
Principal
Amount (000) | | | Description (1) | | Coupon | | | Maturity (3) | | | Ratings (2) | | | Value | |
| | | | VARIABLE RATE SENIOR LOAN INTERESTS – 75.5% (4) | | | | | | | | | | | | | | | | |
| | | | | |
| | | | Aerospace & Defense – 1.2% | | | | | | | | | | | | | | | | |
| | | | | |
| $ | 748 | | | Sequa Corporation, Term Loan B, DD1 | | | 5.250% | | | | 6/19/17 | | | | B1 | | | $ | 760,905 | |
| | | | Airlines – 2.9% | | | | | | | | | | | | | | | | |
| | | | | |
| | 900 | | | Delta Air Lines, Inc., Term Loan B1, DD1 | | | 5.250% | | | | 10/18/18 | | | | Ba2 | | | | 915,469 | |
| | | | | |
| | 1,000 | | | United Air Lines, Inc., Term Loan B, (WI/DD) | | | TBD | | | | TBD | | | | Ba2 | | | | 1,012,188 | |
| | 1,900 | | | Total Airlines | | | | | | | | | | | | | | | 1,927,657 | |
| | | | | | | | | | | | | | | | | | | | |
Principal
Amount (000) | | | Description (1) | | Coupon | | | Maturity (3) | | | Ratings (2) | | | Value | |
| | | | Auto Components – 1.2% | | | | | | | | | | | | | | | | |
| | | | | |
| $ | 748 | | | FleetPride Corporation, Term Loan, First Lien, DD1 | | | 5.250% | | | | 11/16/19 | | | | B1 | | | $ | 758,879 | |
| | | | Biotechnology – 0.3% | | | | | | | | | | | | | | | | |
| | | | | |
| | 197 | | | Onex Carestream Finance LP, Term Loan | | | 5.000% | | | | 2/25/17 | | | | BB– | | | | 198,545 | |
| | | | Capital Markets – 1.5% | | | | | | | | | | | | | | | | |
| | | | | |
| | 213 | | | American Capital, LTD., Senior Secured Term Loan | | | 5.500% | | | | 8/15/16 | | | | B+ | | | | 216,219 | |
| | | | | |
| | 734 | | | Walter Investment Management First Lien Term Loan | | | 5.750% | | | | 11/28/17 | | | | B+ | | | | 748,471 | |
| | 947 | | | Total Capital Markets | | | | | | | | | | | | | | | 964,690 | |
| | | | Commercial Services & Supplies – 2.7% | | | | | | | | | | | | | | | | |
| | | | | |
| | 625 | | | Aramark Corporation, Term Loan, Tranche D | | | 4.000% | | | | 2/20/20 | | | | BB– | | | | 632,531 | |
| | | | | |
| | 130 | | | CCS Income Trust, Term Loan, First Lien | | | 6.250% | | | | 5/12/18 | | | | B2 | | | | 132,112 | |
| | | | | |
| | 399 | | | Ceridian Corporation, Extended Term Loan | | | 5.953% | | | | 5/09/17 | | | | B1 | | | | 407,232 | |
| | | | | |
| | 230 | | | Harland Clarke Holdings Corporation, Extended Term Loan | | | 5.454% | | | | 6/30/17 | | | | B+ | | | | 227,176 | |
| | | | | |
| | 399 | | | Harland Clarke Holdings Corporation, Tranche B, Term Loan, (WI/DD) | | | TBD | | | | TBD | | | | B+ | | | | 397,446 | |
| | 1,783 | | | Total Commercial Services & Supplies | | | | | | | | | | | | | | | 1,796,497 | |
| | | | Communications Equipment – 2.8% | | | | | | | | | | | | | | | | |
| | | | | |
| | 499 | | | AlcatelLucent, Term Loan C | | | 7.250% | | | | 1/29/19 | | | | BB– | | | | 507,426 | |
| | | | | |
| | 237 | | | Cricket Communications, Inc., Term Loan B | | | 4.750% | | | | 10/10/19 | | | | Ba3 | | | | 238,757 | |
| | | | | |
| | 1,098 | | | Zayo Group LLC, Term Loan B, DD1 | | | 4.500% | | | | 6/20/19 | | | | B1 | | | | 1,111,176 | |
| | 1,834 | | | Total Communications Equipment | | | | | | | | | | | | | | | 1,857,359 | |
| | | | Computers & Peripherals – 0.3% | | | | | | | | | | | | | | | | |
| | | | | |
| | 200 | | | SunGard Data Systems, Inc., Term Loan D | | | 4.500% | | | | 1/31/20 | | | | BB | | | | 202,749 | |
| | | | Consumer Finance – 0.3% | | | | | | | | | | | | | | | | |
| | | | | |
| | 198 | | | Royalty Pharma Finance Trust, Incremental Term Loan | | | 4.000% | | | | 11/09/18 | | | | Baa2 | | | | 200,119 | |
| | | | Distributors – 0.4% | | | | | | | | | | | | | | | | |
| | | | | |
| | 250 | | | HD Supply, Inc., Term Loan B | | | 4.500% | | | | 10/12/17 | | | | B+ | | | | 256,406 | |
| | | | Diversified Consumer Services – 1.5% | | | | | | | | | | | | | | | | |
| | | | | |
| | 997 | | | Laureate Education, Inc., Extended Term Loan | | | 5.250% | | | | 6/15/18 | | | | B1 | | | | 1,009,092 | |
| | | | Diversified Financial Services – 1.2% | | | | | | | | | | | | | | | | |
| | | | | |
| | 500 | | | Ocwen Financial Corporation, Term Loan B | | | 5.000% | | | | 1/23/18 | | | | B1 | | | | 508,750 | |
| | | | | |
| | 275 | | | WideOpenWest Finance LLC, Term Loan B, (WI/DD) | | | TBD | | | | TBD | | | | B1 | | | | 277,789 | |
| | 775 | | | Total Diversified Financial Services | | | | | | | | | | | | | | | 786,539 | |
| | | | Diversified Telecommunication Services – 0.8% | | | | | | | | | | | | | | | | |
| | | | | |
| | 499 | | | Windstream Corporation Term Loan B | | | 3.500% | | | | 1/23/20 | | | | Baa3 | | | | 504,361 | |
| | | | Food & Staples Retailing – 1.6% | | | | | | | | | | | | | | | | |
| | | | | |
| | 500 | | | Albertson’s, Inc., Term Loan B, (WI/DD) | | | TBD | | | | TBD | | | | BB– | | | | 509,152 | |
| | | | | |
| | 500 | | | Rite Aid Corporation, Tranche 1, Term Loan, Second Lien | | | 5.750% | | | | 8/21/20 | | | | B– | | | | 519,166 | |
| | 1,000 | | | Total Food & Staples Retailing | | | | | | | | | | | | | | | 1,028,318 | |
| | | | Food Products – 5.6% | | | | | | | | | | | | | | | | |
| | | | | |
| | 150 | | | AdvancePierre Foods, Inc., Term Loan, First Lien | | | 5.750% | | | | 7/10/17 | | | | B1 | | | | 152,056 | |
| | | | | |
| | 225 | | | AdvancePierre Foods, Inc., Term Loan, Second Lien | | | 9.500% | | | | 10/10/17 | | | | CCC+ | | | | 233,438 | |
| | | | | |
| | 209 | | | BJ’s Wholesale Club, Inc., Term Loan, First Lien | | | 4.250% | | | | 9/26/19 | | | | B | | | | 211,700 | |
| | | | | |
| | 2,250 | | | H.J Heinz Company, Term Loan B2, (WI/DD) | | | TBD | | | | TBD | | | | BB | | | | 2,272,219 | |
| | | | | |
| | 500 | | | Supervalu, Inc., New Term Loan, DD1 | | | 6.250% | | | | 3/13/19 | | | | BB– | | | | 509,419 | |
| | | | | |
| | 293 | | | U.S. Foodservice, Inc., Extended Term Loan | | | 5.750% | | | | 3/31/17 | | | | B2 | | | | 296,971 | |
| | 3,627 | | | Total Food Products | | | | | | | | | | | | | | | 3,675,803 | |
Portfolio of Investments (Unaudited)
Nuveen Symphony Floating Rate Fund (continued)
March 31, 2013
| | | | | | | | | | | | | | | | | | | | |
Principal
Amount (000) | | | Description (1) | | Coupon | | | Maturity (3) | | | Ratings (2) | | | Value | |
| | | | Health Care Equipment & Supplies – 2.2% | | | | | | | | | | | | | | | | |
| | | | | |
| $ | 247 | | | Kinetic Concepts, Inc., Term Loan C1 | | | 5.500% | | | | 5/04/18 | | | | Ba2 | | | $ | 251,663 | |
| | | | | |
| | 206 | | | United Surgical Partners International, Inc., Incremental Term Loan, (WI/DD) | | | TBD | | | | TBD | | | | B1 | | | | 206,747 | |
| | | | | |
| | 500 | | | United Surgical Partners International, Inc., Term Loan, First Lien, (WI/DD) | | | TBD | | | | TBD | | | | B1 | | | | 500,934 | |
| | | | | |
| | 500 | | | Bausch & Lomb Incorporated, HoldCo Term Loan, (WI/DD), (5) | | | TBD | | | | TBD | | | | N/A | | | | 496,250 | |
| | 1,453 | | | Total Health Care Equipment & Supplies | | | | | | | | | | | | | | | 1,455,594 | |
| | | | Health Care Providers & Services – 4.3% | | | | | | | | | | | | | | | | |
| | | | | |
| | 500 | | | Vanguard Health Holding Company II LLC, Term Loan B | | | 3.750% | | | | 1/29/16 | | | | Ba2 | | | | 506,875 | |
| | | | | |
| | 394 | | | Golden Living, Term Loan | | | 5.000% | | | | 5/04/18 | | | | B1 | | | | 381,620 | |
| | | | | |
| | 117 | | | Health Management Associates, Inc., Replacement Term Loan B | | | 3.500% | | | | 11/16/18 | | | | BB– | | | | 117,918 | |
| | | | | |
| | 125 | | | Lifepoint Hospitals, Inc., Incremental Term Loan B | | | 2.710% | | | | 6/01/17 | | | | Ba1 | | | | 125,701 | |
| | | | | |
| | 499 | | | Select Medical Corporation, Term Loan B, (WI/DD) | | | TBD | | | | TBD | | | | B+ | | | | 501,867 | |
| | | | | |
| | 96 | | | Select Medical Corporation, Term Loan | | | 5.500% | | | | 6/01/18 | | | | B+ | | | | 96,705 | |
| | | | | |
| | 99 | | | Select Medical Corporation, Tranche B, Term Loan A | | | 5.501% | | | | 6/01/18 | | | | BB– | | | | 99,870 | |
| | | | | |
| | 499 | | | Sheridan Holdings, Inc., Term Loan, First Lien, (WI/DD) | | | TBD | | | | TBD | | | | B+ | | | | 503,841 | |
| | | | | |
| | 250 | | | Sheridan Holdings, Inc., Term Loan, Second Lien | | | 9.000% | | | | 7/01/19 | | | | B– | | | | 255,313 | |
| | | | | |
| | 249 | | | Truven Health Analytics, Inc., Term Loan B | | | 5.750% | | | | 5/23/19 | | | | Ba3 | | | | 253,100 | |
| | 2,828 | | | Total Health Care Providers & Services | | | | | | | | | | | | | | | 2,842,810 | |
| | | | Health Care Technology – 0.8% | | | | | | | | | | | | | | | | |
| | | | | |
| | 500 | | | Quintiles Transnational Corporation, Term Loan | | | 7.500% | | | | 2/28/17 | | | | B | | | | 513,125 | |
| | | | Hotels, Restaurants & Leisure – 4.1% | | | | | | | | | | | | | | | | |
| | | | | |
| | 450 | | | Caesars Entertainment Operating Company, Inc., Term Loan B6, DD1 | | | 5.454% | | | | 1/28/18 | | | | B | | | | 418,050 | |
| | | | | |
| | 996 | | | Landry’s Restaurants, Inc., Term Loan B, DD1 | | | 4.750% | | | | 4/24/18 | | | | B+ | | | | 1,004,738 | |
| | | | | |
| | 249 | | | MGM Resorts International, Term Loan B | | | 4.250% | | | | 12/20/19 | | | | BB | | | | 253,873 | |
| | | | | |
| | 1,000 | | | BLB Management Services, Inc., Term Loan, (WI/DD) | | | TBD | | | | TBD | | | | BB– | | | | 1,009,583 | |
| | 2,695 | | | Total Hotels, Restaurants & Leisure | | | | | | | | | | | | | | | 2,686,244 | |
| | | | Household Durables – 1.9% | | | | | | | | | | | | | | | | |
| | | | | |
| | 1,250 | | | Sun Products Corporation, Term Loan | | | 5.500% | | | | 3/20/20 | | | | Ba3 | | | | 1,264,844 | |
| | | | Independent Power Producers & Energy Traders – 0.9% | | | | | | | | | | | | | | | | |
| | | | | |
| | 499 | | | Calpine Corporation, Term Loan B1, (WI/DD) | | | TBD | | | | TBD | | | | BB– | | | | 506,131 | |
| | | | | |
| | 100 | | | Calpine Corporation, Term Loan B3 | | | 4.000% | | | | 10/14/19 | | | | BB– | | | | 100,955 | |
| | 599 | | | Total Independent Power Producers & Energy Traders | | | | | | | | | | | | | | | 607,086 | |
| | | | Industrial Conglomerates – 3.0% | | | | | | | | | | | | | | | | |
| | | | | |
| | 1,000 | | | DuPont Performance Coatings, Dollar Term Loan B | | | 4.750% | | | | 1/17/20 | | | | B+ | | | | 1,014,432 | |
| | | | | |
| | 948 | | | U.S. Foodservice, Inc., Term Loan, First Lien, DD1 | | | 5.750% | | | | 3/31/17 | | | | B2 | | | | 958,835 | |
| | 1,948 | | | Total Industrial Conglomerates | | | | | | | | | | | | | | | 1,973,267 | |
| | | | Internet & Catalog Retail – 0.3% | | | | | | | | | | | | | | | | |
| | | | | |
| | 200 | | | EIG Investors Corp., Term Loan, First Lien | | | 6.250% | | | | 11/09/19 | | | | B1 | | | | 201,246 | |
| | | | Internet Software & Services – 0.9% | | | | | | | | | | | | | | | | |
| | | | | |
| | 600 | | | Sabre, Inc., Term Loan B, DD1 | | | 5.253% | | | | 2/19/19 | | | | B1 | | | | 608,622 | |
| | | | IT Services – 1.7% | | | | | | | | | | | | | | | | |
| | | | | |
| | 100 | | | EIG Investors Corp., Term Loan, Second Lien | | | 10.250% | | | | 5/09/20 | | | | CCC+ | | | | 100,500 | |
| | | | | |
| | 1,000 | | | SunGard Data Systems, Inc., Term Loan E | | | 4.000% | | | | 3/07/20 | | | | BB | | | | 1,013,750 | |
| | 1,100 | | | Total IT Services | | | | | | | | | | | | | | | 1,114,250 | |
| | | | | | | | | | | | | | | | | | | | |
Principal
Amount (000) | | | Description (1) | | Coupon | | | Maturity (3) | | | Ratings (2) | | | Value | |
| | | | Leisure Equipment & Products – 0.5% | | | | | | | | | | | | | | | | |
| | | | | |
| $ | 350 | | | Equinox Holdings, Inc., Term Loan, First Lien | | | 5.500% | | | | 1/31/20 | | | | B1 | | | $ | 356,344 | |
| | | | Media – 7.5% | | | | | | | | | | | | | | | | |
| | | | | |
| | 92 | | | Atlantic Broadband Finance LLC, Term Loan B | | | 4.500% | | | | 9/20/19 | | | | BB | | | | 93,085 | |
| | | | | |
| | 211 | | | EMI Music Publishing LLC, Term Loan B | | | 4.250% | | | | 3/14/18 | | | | BB– | | | | 214,345 | |
| | | | | |
| | 499 | | | FoxCo Acquisition Sub LLC, Initial Term Loan | | | 5.500% | | | | 7/14/17 | | | | B | | | | 508,515 | |
| | | | | |
| | 500 | | | Internet Brands, Inc., Term Loan B | | | 6.250% | | | | 3/13/19 | | | | B+ | | | | 501,875 | |
| | | | | |
| | 1,500 | | | McGraw-Hill Education Holdings LLC, Term Loan, DD1 | | | 9.000% | | | | 3/15/20 | | | | B2 | | | | 1,455,000 | |
| | | | | |
| | 249 | | | Mediacom Broadband LLC, Tranche G, Term Loan | | | 4.000% | | | | 1/20/20 | | | | Ba3 | | | | 252,492 | |
| | | | | |
| | 143 | | | NEP Broadcasting, Term Loan, Second Lien | | | 9.500% | | | | 6/18/20 | | | | CCC+ | | | | 148,214 | |
| | | | | |
| | 500 | | | Nine Entertainment Group, Term Loan B, (WI/DD) | | | TBD | | | | TBD | | | | BB | | | | 502,110 | |
| | | | | |
| | 898 | | | Tribune Company, Exit Term Loan B, DD1 | | | 4.000% | | | | 12/17/19 | | | | BB+ | | | | 907,401 | |
| | | | | |
| | 93 | | | UPC Broadband Holding BV, Term Loan AF | | | 4.000% | | | | 1/31/21 | | | | BB– | | | | 94,250 | |
| | | | | |
| | 247 | | | WMG Acquisition Corporation, Term Loan | | | 5.250% | | | | 11/01/18 | | | | Ba2 | | | | 251,504 | |
| | 4,932 | | | Total Media | | | | | | | | | | | | | | | 4,928,791 | |
| | | | Oil, Gas & Consumable Fuels – 4.7% | | | | | | | | | | | | | | | | |
| | | | | |
| | 225 | | | El Paso Corporation, Tranche B1, Term Loan | | | 5.000% | | | | 5/24/18 | | | | Ba3 | | | | 227,913 | |
| | | | | |
| | 350 | | | Plains Exploration and Production Company, Term Loan | | | 4.000% | | | | 11/30/19 | | | | Ba1 | | | | 351,313 | |
| | | | | |
| | 500 | | | Ruby Western Pipeline Holdings LLC, Term Loan B, (WI/DD) | | | TBD | | | | TBD | | | | BB+ | | | | 506,875 | |
| | | | | |
| | 208 | | | Samson Investment Company, Initial Term Loan, Second Lien | | | 6.000% | | | | 9/25/18 | | | | B1 | | | | 211,354 | |
| | | | | |
| | 750 | | | Saxon Energy Services, Inc., Term Loan, DD1 | | | 5.500% | | | | 2/13/19 | | | | Ba3 | | | | 756,188 | |
| | | | | |
| | 1,000 | | | Vantage Drilling Company, Term Loan B, (WI/DD) | | | TBD | | | | TBD | | | | B– | | | | 1,007,500 | |
| | 3,033 | | | Total Oil Gas, & Consumable Fuels | | | | | | | | | | | | | | | 3,061,143 | |
| | | | Personal Products – 0.8% | | | | | | | | | | | | | | | | |
| | | | | |
| | 500 | | | Bombardier Recreational Products, Inc., Term Loan B | | | 5.000% | | | | 1/23/19 | | | | B+ | | | | 505,573 | |
| | | | Pharmaceuticals – 3.5% | | | | | | | | | | | | | | | | |
| | | | | |
| | 199 | | | Bausch & Lomb, Inc., Term Loan B | | | 5.250% | | | | 5/17/19 | | | | B+ | | | | 200,644 | |
| | | | | |
| | 217 | | | Generic Drug Holdings, Inc., Term Loan B | | | 5.000% | | | | 10/29/19 | | | | B+ | | | | 219,626 | |
| | | | | |
| | 556 | | | Par Pharmaceutical Companies, Inc., Additional Term Loan B1, DD1 | | | 4.250% | | | | 9/30/19 | | | | B+ | | | | 563,060 | |
| | | | | |
| | 396 | | | Pharmaceutical Product Development, Inc., Term Loan B, First Lien | | | 4.250% | | | | 12/01/18 | | | | Ba3 | | | | 401,956 | |
| | | | | |
| | 393 | | | Quintiles Transnational Corp., Term Loan B1 | | | 4.500% | | | | 6/08/18 | | | | BB– | | | | 397,855 | |
| | | | | |
| | 100 | | | Valeant Pharmaceuticals International, Inc., Series D, Term Loan | | | 3.500% | | | | 2/19/19 | | | | BBB– | | | | 100,519 | |
| | | | | |
| | 67 | | | Warner Chilcott Corporation, Term Loan B | | | 4.250% | | | | 3/15/18 | | | | BBB– | | | | 68,188 | |
| | | | | |
| | 154 | | | Warner Chilcott PLC, Term Loan B1 | | | 4.250% | | | | 3/15/18 | | | | BBB– | | | | 156,250 | |
| | | | | |
| | 55 | | | Warner Chilcott PLC, Term Loan B2 | | | 4.250% | | | | 3/15/18 | | | | BBB– | | | | 55,367 | |
| | | | | |
| | 121 | | | Warner Chilcott PLC, Term Loan B3 | | | 4.250% | | | | 3/15/18 | | | | BBB– | | | | 123,127 | |
| | 2,258 | | | Total Pharmaceuticals | | | | | | | | | | | | | | | 2,286,592 | |
| | | | Professional Services – 0.3% | | | | | | | | | | | | | | | | |
| | | | | |
| | 219 | | | CHG Healthcare, Term Loan, Second Lien | | | 9.000% | | | | 11/19/20 | | | | CCC+ | | | | 224,834 | |
| | | | Real Estate Investment Trust – 1.2% | | | | | | | | | | | | | | | | |
| | | | | |
| | 775 | | | iStar Financial, Inc., Term Loan, DD1 | | | 4.500% | | | | 10/16/17 | | | | B+ | | | | 784,318 | |
| | | | Real Estate Management & Development – 0.8% | | | | | | | | | | | | | | | | |
| | | | | |
| | 500 | | | Realogy Corporation, Term Loan B | | | 4.500% | | | | 3/01/20 | | | | BB– | | | | 507,657 | |
| | | | Semiconductors & Equipment – 0.5% | | | | | | | | | | | | | | | | |
| | | | | |
| | 299 | | | NXP Semiconductor LLC, Incremental Term Loan C | | | 4.750% | | | | 12/06/19 | | | | B+ | | | | 306,482 | |
Portfolio of Investments (Unaudited)
Nuveen Symphony Floating Rate Fund (continued)
March 31, 2013
| | | | | | | | | | | | | | | | | | | | |
Principal
Amount (000) | | | Description (1) | | Coupon | | | Maturity (3) | | | Ratings (2) | | | Value | |
| | | | Software – 4.0% | | | | | | | | | | | | | | | | |
| | | | | |
| $ | 500 | | | Blackboard, Inc., Term Loan B2, (WI/DD) | | | TBD | | | | TBD | | | | B+ | | | $ | 506,875 | |
| | | | | |
| | 692 | | | Datatel Parent Corp, Term Loan B, DD1 | | | 4.500% | | | | 7/19/18 | | | | B+ | | | | 703,617 | |
| | | | | |
| | 1,172 | | | Infor Enterprise Applications, Term Loan B, DD1 | | | 5.250% | | | | 4/05/18 | | | | Ba3 | | | | 1,194,176 | |
| | | | | |
| | 200 | | | RedPrairie Corporation, Term Loan, First Lien | | | 6.750% | | | | 12/21/18 | | | | B+ | | | | 203,739 | |
| | 2,564 | | | Total Software | | | | | | | | | | | | | | | 2,608,407 | |
| | | | Specialty Retail – 0.7% | | | | | | | | | | | | | | | | |
| | | | | |
| | 457 | | | Collective Brands, Inc., Term Loan B | | | 7.250% | | | | 10/09/19 | | | | B | | | | 465,046 | |
| | | | Textiles, Apparel & Luxury Goods – 0.8% | | | | | | | | | | | | | | | | |
| | | | | |
| | 500 | | | Philips–Van Heusen Corporation, Term Loan B | | | 3.250% | | | | 12/19/19 | | | | BBB– | | | | 506,054 | |
| | | | Trading Companies & Distributors – 0.7% | | | | | | | | | | | | | | | | |
| | | | | |
| | 423 | | | Wesco Distribution Inc., Term Loan B | | | 4.500% | | | | 12/04/19 | | | | Ba3 | | | | 427,784 | |
| | | | Transportation Infrastructure – 0.4% | | | | | | | | | | | | | | | | |
| | | | | |
| | 250 | | | American Commercial Lines LLC, Term Loan, First Lien | | | 7.500% | | | | 9/20/19 | | | | B– | | | | 250,625 | |
| | | | Wireless Telecommunication Services – 4.7% | | | | | | | | | | | | | | | | |
| | | | | |
| | 2,054 | | | Clear Channel Communications, Inc., Tranche B, Term Loan, DD1 | | | 3.854% | | | | 1/29/16 | | | | CCC+ | | | | 1,825,741 | |
| | | | | |
| | 500 | | | Cricket Communications, Inc., Term Loan C, (WI/DD) | | | TBD | | | | TBD | | | | Ba3 | | | | 503,828 | |
| | | | | |
| | 499 | | | IPC Systems, Inc., Term Loan, Tranche C, First Lien, DD1 | | | 7.750% | | | | 7/31/17 | | | | B1 | | | | 498,747 | |
| | | | | |
| | 250 | | | Syniverse Holdings, Inc., Delayed Draw, Term Loan, (6) | | | 0.500% | | | | 4/06/19 | | | | BB– | | | | 250,625 | |
| | 3,303 | | | Total Wireless Telecommunication Services | | | | | | | | | | | | | | | 3,078,941 | |
| $ | 49,239 | | | Total Variable Rate Senior Loan Interests (cost $48,830,241) | | | | | | | | | | | | | | | 49,493,598 | |
| | | | | |
Principal
Amount (000) | | | Description (1) | | Coupon | | | Maturity | | | | | | Value | |
| | | | SHORT-TERM INVESTMENTS – 28.4% | | | | | | | | | | | | | | | | |
| | | | | |
| $ | 18,626 | | | Repurchase Agreement with State Street Bank, dated 3/28/13, repurchase price $18,625,910, collateralized by $18,585,000 U.S. Treasury Notes, 1.000%, due 3/31/17, value $19,003,088 | | | 0.010% | | | | 4/01/13 | | | | | | | $ | 18,625,889 | |
| | | | Total Short-Term Investments (cost $18,625,889) | | | | | | | | | | | | | | | 18,625,889 | |
| | | | Total Investments (cost $78,574,241) – 121.0% | | | | | | | | | | | | | | | 79,300,117 | |
| | | | Other Assets Less Liabilities – (21.0)% | | | | | | | | | | | | | | | (13,751,624) | |
| | | | Net Assets – 100% | | | | | | | | | | | | | | $ | 65,548,493 | |
| | | | For Fund portfolio compliance purposes, the Fund’s industry classifications refer to any one or more of the industry subclassifications used by one or more widely recognized market indexes or ratings group indexes, and/or as defined by Fund management. This definition may not apply for purposes of this report, which may combine industry sub-classifications into sectors for reporting ease. |
| | (1) | | All percentages shown in the Portfolio of Investments are based on net assets. |
| | (2) | | Ratings: Using the highest of Standard & Poor’s Group (“Standard & Poor’s”), Moody’s Investors Service, Inc. (“Moody’s”) or Fitch, Inc. (“Fitch”) rating. Ratings below BBB by Standard & Poor’s, Baa by Moody’s or BBB by Fitch are considered to be below investment grade. Holdings designated N/R are not rated by any of these national rating agencies. |
| | (3) | | Senior Loans generally are subject to mandatory and/or optional prepayment. Because of these mandatory prepayment conditions and because there may be significant economic incentives for a borrower to prepay, prepayments of Senior Loans may occur. As a result, the actual remaining maturity of Senior Loans held may be substantially less than the stated maturities shown. |
| | (4) | | Senior Loans generally pay interest at rates which are periodically adjusted by reference to a base short-term, floating lending rate plus an assigned fixed rate. These floating lending rates are generally (i) the lending rate referenced by the London Inter-Bank Offered Rate (“LIBOR”), or (ii) the prime rate offered by one or more major United States banks. |
| | | | Senior Loans may be considered restricted in that the Fund ordinarily is contractually obligated to receive approval from the Agent Bank and/or borrower prior to the disposition of a Senior Loan. |
| | (5) | | Investment, or portion of investment, represents a participation of a Senior Loan commitment outstanding. |
| | (6) | | Investment, or portion of investment, represents an unfunded Senior Loan commitment outstanding. |
| | DD1 | | Portion of investment purchased on a delayed delivery basis. |
| | WI/DD | | Purchased on a when-issued or delayed delivery basis. |
| | 144A | | Investment is exempt from registration under Rule 144A of the Securities Act of 1933, as amended. These investments may only be resold in transactions exempt from registration, which are normally those transactions with qualified institutional buyers. |
| | TBD | | Senior Loan purchased on a when-issued or delayed-delivery basis. Certain details associated with this purchase are not known prior to the settlement date of the transaction. In addition, Senior Loans typically trade without accrued interest and therefore a coupon rate is not available prior to settlement. As of settlement, if still unknown, the borrower or counterparty will provide the Fund with the final coupon rate and maturity date. |
See accompanying notes to financial statements.
Portfolio of Investments (Unaudited)
Nuveen Symphony High Yield Bond Fund
March 31, 2013
| | | | | | | | | | | | | | | | | | | | |
Principal
Amount (000) | | | Description (1) | | Coupon | | | Maturity | | | Ratings (2) | | | Value | |
| | | | CORPORATE BONDS – 89.5% | | | | | | | | | | | | | | | | |
| | | | | |
| | | | Building Products – 5.0% | | | | | | | | | | | | | | | | |
| | | | | |
| $ | 250 | | | Gibraltar Steel Corporation | | | 6.250% | | | | 2/01/21 | | | | BB– | | | $ | 265,000 | |
| | | | Chemicals – 2.4% | | | | | | | | | | | | | | | | |
| | | | | |
| | 125 | | | Hexion US Finance, 144A | | | 6.625% | | | | 4/15/20 | | | | B1 | | | | 125,313 | |
| | | | Commercial Services & Supplies – 9.9% | | | | | | | | | | | | | | | | |
| | | | | |
| | 250 | | | 313 Group Incorporated, 144A | | | 6.375% | | | | 12/01/19 | | | | B1 | | | | 248,124 | |
| | | | | |
| | 30 | | | Ceridian Corporation, 144A | | | 11.000% | | | | 3/15/21 | | | | CCC | | | | 32,175 | |
| | | | | |
| | 250 | | | Harland Clarke Holdings | | | 9.500% | | | | 5/15/15 | | | | B– | | | | 246,563 | |
| | 530 | | | Total Commercial Services & Supplies | | | | | | | | | | | | | | | 526,862 | |
| | | | Containers & Packaging – 4.8% | | | | | | | | | | | | | | | | |
| | | | | |
| | 250 | | | Ardagh Packaging Finance / MP HD USA, 144A | | | 7.000% | | | | 11/15/20 | | | | B3 | | | | 256,875 | |
| | | | Distributors – 5.6% | | | | | | | | | | | | | | | | |
| | | | | |
| | 250 | | | HD Supply Inc. | | | 11.500% | | | | 7/15/20 | | | | CCC+ | | | | 296,248 | |
| | | | Health Care Equipment & Supplies – 4.1% | | | | | | | | | | | | | | | | |
| | | | | |
| | 200 | | | Kinetic Concepts | | | 10.500% | | | | 11/01/18 | | | | B | | | | 216,500 | |
| | | | Health Care Providers & Services – 4.9% | | | | | | | | | | | | | | | | |
| | | | | |
| | 250 | | | IASIS Healthcare Capital Corporation | | | 8.375% | | | | 5/15/19 | | | | CCC+ | | | | 262,813 | |
| | | | Hotels, Restaurants & Leisure – 4.7% | | | | | | | | | | | | | | | | |
| | | | | |
| | 250 | | | Caesars Operating Escrow, 144A | | | 9.000% | | | | 2/15/20 | | | | B | | | | 251,563 | |
| | | | Household Durables – 5.0% | | | | | | | | | | | | | | | | |
| | | | | |
| | 250 | | | Tempur Pedic International Inc., 144A | | | 6.875% | | | | 12/15/20 | | | | B+ | | | | 266,875 | |
| | | | Machinery – 7.6% | | | | | | | | | | | | | | | | |
| | | | | |
| | 250 | | | Cleaver-Brooks Inc., 144A | | | 8.750% | | | | 12/15/19 | | | | B | | | | 269,687 | |
| | | | | |
| | 141 | | | Xerium Technologies | | | 8.875% | | | | 6/15/18 | | | | B | | | | 135,008 | |
| | 391 | | | Total Machinery | | | | | | | | | | | | | | | 404,695 | |
| | | | Media – 10.7% | | | | | | | | | | | | | | | | |
| | | | | |
| | 200 | | | Cequel Communications Holding I LLC Capital | | | 6.375% | | | | 9/15/20 | | | | BB+ | | | | 207,500 | |
| | | | | |
| | 250 | | | Clear Channel Communications, Inc., 144A | | | 9.000% | | | | 12/15/19 | | | | CCC+ | | | | 240,313 | |
| | | | | |
| | 125 | | | McGraw-Hill Global Education Holdings, 144A | | | 9.750% | | | | 4/01/21 | | | | BB | | | | 123,750 | |
| | 575 | | | Total Media | | | | | | | | | | | | | | | 571,563 | |
| | | | Multiline Retail – 2.0% | | | | | | | | | | | | | | | | |
| | | | | |
| | 103 | | | Bon-Ton Department Stores Inc. | | | 10.250% | | | | 3/15/14 | | | | CCC | | | | 103,515 | |
| | | | Oil, Gas & Consumable Fuels – 8.8% | | | | | | | | | | | | | | | | |
| | | | | |
| | 200 | | | Cheniere Energy Inc., 144A | | | 5.625% | | | | 2/01/21 | | | | BB+ | | | | 207,500 | |
| | | | | |
| | 150 | | | Magnum Hunter Resources Corporation | | | 9.750% | | | | 5/15/20 | | | | CCC+ | | | | 157,500 | |
| | | | | |
| | 100 | | | Range Resources Corporation | | | 5.000% | | | | 3/15/23 | | | | BB | | | | 102,250 | |
| | 450 | | | Total Oil, Gas & Consumable Fuels | | | | | | | | | | | | | | | 467,250 | |
| | | | Pharmaceuticals – 3.0% | | | | | | | | | | | | | | | | |
| | | | | |
| | 150 | | | Warner Chilcott Company LLC | | | 7.750% | | | | 9/15/18 | | | | BB | | | | 160,313 | |
| | | | Specialty Retail – 7.2% | | | | | | | | | | | | | | | | |
| | | | | |
| | 200 | | | Claire’s Stores, Inc., 144A | | | 9.000% | | | | 3/15/19 | | | | B2 | | | | 226,000 | |
| | | | | |
| | 150 | | | Jo-Ann Stores Holdings Inc. | | | 9.750% | | | | 10/15/19 | | | | CCC+ | | | | 157,500 | |
| | 350 | | | Total Specialty Retail | | | | | | | | | | | | | | | 383,500 | |
| | | | | | | | | | | | | | | | | | | | |
Principal
Amount (000) | | | Description (1) | | Coupon | | | Maturity | | | Ratings (2) | | | Value | |
| | | | Wireless Telecommunication Services – 3.8% | | | | | | | | | | | | | | | | |
| | | | | |
| $ | 100 | | | MetroPCS Wireless Inc., 144A | | | 6.250% | | | | 4/01/21 | | | | BB | | | $ | 101,750 | |
| | | | | |
| | 100 | | | MetroPCS Wireless Inc., 144A | | | 6.625% | | | | 4/01/23 | | | | BB | | | | 102,000 | |
| | 200 | | | Total Wireless Telecommunication Services | | | | | | | | | | | | | | | 203,750 | |
| $ | 4,574 | | | Total Corporate Bonds (cost $4,622,263) | | | | | | | | | | | | | | | 4,762,635 | |
| | | | | |
Principal
Amount (000) | | | Description (1) | | Coupon | | | Maturity (3) | | | Ratings (2) | | | Value | |
| | | | VARIABLE RATE SENIOR LOAN INTERESTS – 8.6% (4) | | | | | | | | | | | | | | | | |
| | | | | |
| | | | Computers & Peripherals – 3.8% | | | | | | | | | | | | | | | | |
| | | | | |
| $ | 200 | | | SunGard Data Systems, Inc., Term Loan D | | | 4.500% | | | | 1/31/20 | | | | BB | | | $ | 202,749 | |
| | | | Hotels, Restaurants & Leisure – 4.8% | | | | | | | | | | | | | | | | |
| | | | | |
| | 249 | | | MGM Resorts International, Term Loan B | | | 4.250% | | | | 12/20/19 | | | | BB | | | | 253,873 | |
| $ | 449 | | | Total Variable Rate Senior Loan Interests (cost $448,100) | | | | | | | | | | | | | | | 456,622 | |
| | | | Total Investments (cost $5,070,363) – 98.1% | | | | | | | | | | | | | | | 5,219,257 | |
| | | | Other Assets Less Liabilities – 1.9% | | | | | | | | | | | | | | | 100,648 | |
| | | | Net Assets – 100% | | | | | | | | | | | | | | $ | 5,319,905 | |
| | | | For Fund portfolio compliance purposes, the Fund’s industry classifications refer to any one or more of the industry sub-classifications used by one or more widely recognized market indexes or ratings group indexes, and/or as defined by Fund management. This definition may not apply for purposes of this report, which may combine industry sub-classifications into sectors for reporting ease. |
| | (1) | | All percentages shown in the Portfolio of Investments are based on net assets. |
| | (2) | | Ratings: Using the highest of Standard & Poor’s Group (“Standard & Poor’s”), Moody’s Investors Service, Inc. (“Moody’s”) or Fitch, Inc. (“Fitch”) rating. Ratings below BBB by Standard & Poor’s, Baa by Moody’s or BBB by Fitch are considered to be below investment grade. Holdings designated N/R are not rated by any of these national rating agencies. |
| | (3) | | Senior Loans generally are subject to mandatory and/or optional prepayment. Because of these mandatory prepayment conditions and because there may be significant economic incentives for a borrower to prepay, prepayments of Senior Loans may occur. As a result, the actual remaining maturity of Senior Loans held may be substantially less than the stated maturities shown. |
| | (4) | | Senior Loans generally pay interest at rates which are periodically adjusted by reference to a base short-term, floating lending rate plus an assigned fixed rate. These floating lending rates are generally (i) the lending rate referenced by the London Inter-Bank Offered Rate (“LIBOR”), or (ii) the prime rate offered by one or more major United States banks. |
| | | | Senior Loans may be considered restricted in that the Fund ordinarily is contractually obligated to receive approval from the Agent Bank and/or borrower prior to the disposition of a Senior Loan. |
| | 144A | | Investment is exempt from registration under Rule 144A of the Securities Act of 1933, as amended. These investments may only be resold in transactions exempt from registration, which are normally those transactions with qualified institutional buyers. |
See accompanying notes to financial statements.
Statement of Assets and Liabilities (Unaudited)
March 31, 2013
| | | | | | | | | | | | |
| | | Symphony Credit
Opportunities | | | Symphony Floating
Rate Income | | | Symphony High
Yield Bond | |
Assets | | | | | | | | | | | | |
Long-term investments, at value (cost $361,240,177, $59,948,352 and $5,070,363, respectively) | | $ | 377,089,577 | | | $ | 60,674,228 | | | $ | 5,219,257 | |
Short-term investments, at value | | | 34,047,211 | | | | 18,625,889 | | | | — | |
Receivables: | | | | | | | | | | | | |
Interest | | | 5,868,918 | | | | 342,349 | | | | 100,325 | |
Investments sold | | | 4,062,992 | | | | 3,762,965 | | | | 262,571 | |
Reclaims | | | — | | | | — | | | | 651 | |
Shares sold | | | 2,862,217 | | | | 6,894,083 | | | | — | |
Other assets | | | 1,691 | | | | 46,097 | | | | — | |
Total assets | | | 423,932,606 | | | | 90,345,611 | | | | 5,582,804 | |
Liabilities | | | | | | | | | | | | |
Cash overdraft | | | — | | | | — | | | | 230,874 | |
Payables: | | | | | | | | | | | | |
Dividends | | | 269,324 | | | | 46,679 | | | | — | |
Investments purchased | | | 22,487,595 | | | | 24,431,996 | | | | — | |
Shares redeemed | | | 777,710 | | | | 25,865 | | | | — | |
Unfunded senior loans | | | — | | | | 250,000 | | | | — | |
Accrued expenses: | | | | | | | | | | | | |
Management fees | | | 205,868 | | | | 4,205 | | | | 121 | |
Trustees fees | | | 4,112 | | | | 176 | | | | 18 | |
12b-1 distribution and service fees | | | 74,078 | | | | 3,318 | | | | 56 | |
Other | | | 96,743 | | | | 34,879 | | | | 31,830 | |
Total liabilities | | | 23,915,430 | | | | 24,797,118 | | | | 262,899 | |
Net assets | | $ | 400,017,176 | | | $ | 65,548,493 | | | $ | 5,319,905 | |
Class A Shares | | | | | | | | | | | | |
Net assets | | $ | 137,752,156 | | | $ | 9,392,422 | | | $ | 53,160 | |
Shares outstanding | | | 6,112,674 | | | | 456,922 | | | | 2,500 | |
Net asset value per share | | $ | 22.54 | | | $ | 20.56 | | | $ | 21.26 | |
Offering price per share (net asset value per share plus maximum sales charge of 4.75% of offering price) | | $ | 23.66 | | | $ | 21.59 | | | $ | 22.32 | |
Class C Shares | | | | | | | | | | | | |
Net assets | | $ | 56,575,655 | | | $ | 2,424,311 | | | $ | 53,038 | |
Shares outstanding | | | 2,514,248 | | | | 118,049 | | | | 2,500 | |
Net asset value and offering price per share | | $ | 22.50 | | | $ | 20.54 | | | $ | 21.22 | |
Class I Shares | | | | | | | | | | | | |
Net assets | | $ | 205,689,365 | | | $ | 53,731,760 | | | $ | 5,213,707 | |
Shares outstanding | | | 9,126,117 | | | | 2,614,029 | | | | 245,000 | |
Net asset value and offering price per share | | $ | 22.54 | | | $ | 20.56 | | | $ | 21.28 | |
Net assets consist of: | | | | | | | | | | | | |
Capital paid-in | | $ | 380,356,351 | | | $ | 64,886,366 | | | $ | 5,000,000 | |
Undistributed (Over-distribution of) net investment income | | | (188,085 | ) | | | (177,792 | ) | | | 90,212 | |
Accumulated net realized gain (loss) | | | 3,999,510 | | | | 114,043 | | | | 80,799 | |
Net unrealized appreciation (depreciation) | | | 15,849,400 | | | | 725,876 | | | | 148,894 | |
Net assets | | $ | 400,017,176 | | | $ | 65,548,493 | | | $ | 5,319,905 | |
Authorized shares – per class | | | Unlimited | | | | Unlimited | | | | Unlimited | |
Par value per share | | $ | 0.01 | | | $ | 0.01 | | | $ | 0.01 | |
See accompanying notes to financial statements.
Statement of Operations (Unaudited)
Six Months Ended March 31, 2013
| | | | | | | | | | | | |
| | | Symphony Credit
Opportunities | | | Symphony Floating
Rate Income | | | Symphony High*
Yield Bond | |
Investment Income | | $ | 10,755,197 | | | $ | 564,211 | | | $ | 103,381 | |
Expenses | | | | | | | | | | | | |
Management fees | | | 920,864 | | | | 70,861 | | | | 9,794 | |
12b-1 service fees – Class A | | | 126,670 | | | | 6,311 | | | | 40 | |
12b-1 distribution and service fees – Class C | | | 241,541 | | | | 5,429 | | | | 158 | |
Shareholder servicing agent fees and expenses | | | 101,345 | | | | 3,642 | | | | 6,271 | |
Custodian fees and expenses | | | 46,864 | | | | 12,497 | | | | 2,508 | |
Trustees fees and expenses | | | 6,703 | | | | 540 | | | | 37 | |
Professional fees | | | 16,635 | | | | 25,553 | | | | 21,277 | |
Shareholder reporting expenses | | | 47,346 | | | | 7,391 | | | | 10,409 | |
Federal and state registration fees | | | 55,121 | | | | 30,603 | | | | 1,283 | |
Other expenses | | | 9,561 | | | | 2,503 | | | | 712 | |
Total expenses before fee waiver/expense reimbursement | | | 1,572,650 | | | | 165,330 | | | | 52,489 | |
Fee waiver/expense reimbursement | | | — | | | | (59,698 | ) | | | (39,320 | ) |
Net expenses | | | 1,572,650 | | | | 105,632 | | | | 13,169 | |
Net investment income (loss) | | | 9,182,547 | | | | 458,579 | | | | 90,212 | |
Realized and Unrealized Gain (Loss) | | | | | | | | | | | | |
Net realized gain (loss) from investments | | | 4,091,996 | | | | 151,812 | | | | 80,799 | |
Change in net unrealized appreciation (depreciation) of investments | | | 6,904,964 | | | | 561,068 | | | | 148,894 | |
Net realized and unrealized gain (loss) | | | 10,996,960 | | | | 712,880 | | | | 229,693 | |
Net increase (decrease) in net assets from operations | | $ | 20,179,507 | | | $ | 1,171,459 | | | $ | 319,905 | |
| * | For the period December 10, 2012 (commencement of operations) through March 31, 2013. |
See accompanying notes to financial statements.
Statement of Changes in Net Assets (Unaudited)
| | | | | | | | | | | | | | | | | | | | |
| | | Symphony Credit
Opportunities | | | Symphony Floating
Rate Income | | | Symphony High
Yield Bond | |
| | | Six Months
Ended
3/31/13 | | | Year
Ended
9/30/12 | | | Six Months
Ended
3/31/13 | | | Year
Ended
9/30/12 | | | For the period
12/10/2012
(commencement
of operations)
through 3/31/13 | |
Operations | | | | | | | | | | | | | | | | | | | | |
Net investment income (loss) | | $ | 9,182,547 | | | $ | 9,852,958 | | | $ | 458,579 | | | $ | 626,107 | | | $ | 90,212 | |
Net realized gain (loss) from investments | | | 4,091,996 | | | | 1,718,020 | | | | 151,812 | | | | 191,719 | | | | 80,799 | |
Change in net unrealized appreciation (depreciation) of investments | | | 6,904,964 | | | | 14,732,919 | | | | 561,068 | | | | 716,077 | | | | 148,894 | |
Net increase (decrease) in net assets from operations | | | 20,179,507 | | | | 26,303,897 | | | | 1,171,459 | | | | 1,533,903 | | | | 319,905 | |
Distributions to Shareholders | | | | | | | | | | | | | | | | | | | | |
From net investment income: | | | | | | | | | | | | | | | | | | | | |
Class A | | | (3,094,258 | ) | | | (3,245,116 | ) | | | (128,433 | ) | | | (34,169 | ) | | | — | |
Class C | | | (1,300,362 | ) | | | (1,332,265 | ) | | | (23,456 | ) | | | (20,722 | ) | | | — | |
Class R3 | | | N/A | | | | (2,198 | ) | | | N/A | | | | (8,665 | ) | | | N/A | |
Class I | | | (4,874,567 | ) | | | (5,798,321 | ) | | | (442,215 | ) | | | (604,509 | ) | | | — | |
From accumulated net realized gains: | | | | | | | | | | | | | | | | | | | | |
Class A | | | (453,779 | ) | | | — | | | | (14,033 | ) | | | — | | | | — | |
Class C | | | (225,428 | ) | | | — | | | | (2,500 | ) | | | — | | | | — | |
Class R3 | | | N/A | | | | — | | | | N/A | | | | — | | | | N/A | |
Class I | | | (688,863 | ) | | | — | | | | (48,835 | ) | | | — | | | | — | |
Decrease in net assets from distributions to shareholders | | | (10,637,257 | ) | | | (10,377,900 | ) | | | (659,472 | ) | | | (668,065 | ) | | | — | |
Fund Share Transactions | | | | | | | | | | | | | | | | | | | | |
Proceeds from sale of shares | | | 167,876,546 | | | | 177,869,968 | | | | 55,231,524 | | | | 4,532,634 | | | | 5,000,000 | |
Proceeds from shares issued to shareholders due to reinvestment of distributions | | | 9,400,058 | | | | 9,243,709 | | | | 405,657 | | | | 138,638 | | | | — | |
| | | 177,276,604 | | | | 187,113,677 | | | | 55,637,181 | | | | 4,671,272 | | | | 5,000,000 | |
Cost of shares redeemed | | | (41,540,936 | ) | | | (36,702,140 | ) | | | (2,521,854 | ) | | | (2,959,366 | ) | | | — | |
Net increase (decrease) in net assets from Fund share transactions | | | 135,735,668 | | | | 150,411,537 | | | | 53,115,327 | | | | 1,711,906 | | | | 5,000,000 | |
Net increase (decrease) in net assets | | | 145,277,918 | | | | 166,337,534 | | | | 53,627,314 | | | | 2,577,744 | | | | 5,319,905 | |
Net assets at the beginning of period | | | 254,739,258 | | | | 88,401,724 | | | | 11,921,179 | | | | 9,343,435 | | | | — | |
Net assets at the end of period | | $ | 400,017,176 | | | $ | 254,739,258 | | | $ | 65,548,493 | | | $ | 11,921,179 | | | $ | 5,319,905 | |
Undistributed (Over-distribution of) net investment income at the end of period | | $ | (188,085 | ) | | $ | (101,445 | ) | | $ | (177,792 | ) | | $ | (42,267 | ) | | $ | 90,212 | |
| N/A – | After the close of business on May 30, 2012, Symphony Credit Opportunities and Symphony Floating Rate Income liquidated all of their Class R3 Shares. Symphony High Yield Bond does not offer Class R3 Shares. |
See accompanying notes to financial statements.
Statement of Cash Flows (Unaudited)
Six Months Ended March 31, 2013
| | | | | | | | | | | | |
| | | Symphony Credit
Opportunities | | | Symphony Floating
Rate Income | | | Symphony High*
Yield Bond | |
Cash Flows from Operating Activities: | | | | | | | | | | | | |
Net Increase (Decrease) in Net Assets from Operations | | $ | 20,179,507 | | | $ | 1,171,459 | | | $ | 319,905 | |
Adjustments to reconcile the net increase (decrease) in net assets from operations to net cash provided by (used in) operating activities: | | | | | | | | | | | | |
Purchases of investments | | | (253,585,762 | ) | | | (61,612,405 | ) | | | (10,090,067 | ) |
Proceeds from sales and maturities of investments | | | 132,889,743 | | | | 13,130,232 | | | | 5,099,389 | |
Payment-in-kind distributions | | | (10,161 | ) | | | — | | | | — | |
Proceeds from (Purchase of) short-term investments, net | | | (19,368,964 | ) | | | (18,079,680 | ) | | | — | |
Amortization (Accretion) of premiums and discounts, net | | | (299,316 | ) | | | (20,061 | ) | | | 1,114 | |
(Increase) Decrease in: | | | | | | | | | | | | |
Receivable from Adviser | | | — | | | | 3,830 | | | | — | |
Receivable for interest | | | (2,051,245 | ) | | | (250,186 | ) | | | (100,325 | ) |
Receivable for investments sold | | | 3,356,013 | | | | (668,177 | ) | | | (262,571 | ) |
Receivable for reclaims | | | — | | | | — | | | | (651 | ) |
Other assets | | | (703 | ) | | | (45,854 | ) | | | — | |
Increase (Decrease) in: | | | | | | | | | | | | |
Payable for investments purchased | | | 5,027,549 | | | | 21,222,026 | | | | — | |
Payable for unfunded senior loans | | | — | | | | 250,000 | | | | — | |
Accrued management fees | | | 29,246 | | | | 4,205 | | | | 121 | |
Accrued Trustees fees | | | 2,965 | | | | 98 | | | | 18 | |
Accrued 12b-1 distribution and service fees | | | 26,370 | | | | 2,715 | | | | 56 | |
Accrued other expenses | | | (59,687 | ) | | | 7,824 | | | | 31,830 | |
Net realized (gain) loss from investments | | | (4,091,996 | ) | | | (151,812 | ) | | | (80,799 | ) |
Change in net unrealized (appreciation) depreciation of investments | | | (6,904,964 | ) | | | (561,068 | ) | | | (148,894 | ) |
Net cash provided by (used in) operating activities | | | (124,861,405 | ) | | | (45,596,854 | ) | | | (5,230,874 | ) |
Cash Flows from Financing Activities: | | | | | | | | | | | | |
Increase (Decrease) in cash overdraft | | | — | | | | — | | | | 230,874 | |
Cash distributions paid to shareholders | | | (1,105,095 | ) | | | (241,984 | ) | | | — | |
Proceeds from sale of shares | | | 167,295,470 | | | | 48,337,441 | | | | 5,000,000 | |
Cost of shares redeemed | | | (41,328,970 | ) | | | (2,498,603 | ) | | | — | |
Net cash provided by (used in) financing activities | | | 124,861,405 | | | | 45,596,854 | | | | 5,230,874 | |
Net Increase (Decrease) in Cash | | | — | | | | — | | | | — | |
Cash at the beginning of period | | | — | | | | — | | | | — | |
Cash at the End of Period | | $ | — | | | $ | — | | | $ | — | |
| * | For the period December 10, 2012 (commencement of operations) through March 31, 2013. |
Supplemental Disclosure of Cash Flow Information
Non-cash financing activities not included herein consist of reinvestment of distributions of $9,400,058 and $405,657 for Symphony Credit Opportunities and Symphony Floating Rate Income, respectively.
See accompanying notes to financial statements.
Financial Highlights (Unaudited)
| | | | | | | | | | | | | | | | | | | | | | | | | | | | | | | | |
| Selected data for a share outstanding throughout each period: | | | | |
| | | | | | |
| Class (Commencement Date) | | | | | | | | | | | | | | | | | | | |
| | | | | | Investment Operations | | | Less Distributions | | | | |
| | | | | |
| SYMPHONY CREDIT OPPORTUNITIES | | | | | | | | | | | | | | | | |
Year Ended
September 30, | | Beginning
Net
Asset
Value | | | Net
Invest-
ment
Income
(Loss)(a) | | | Net
Realized/
Unrealized
Gain
(Loss) | | | Total | | | From
Net
Invest-
ment
Income | | | From
Accum-
ulated
Net
Realized
Gains | | | Total | | | Ending
Net
Asset
Value | |
Class A (4/10) | | | | | | | | | | | | | | | | | | | | | | | | | | | | | |
2013(e) | | $ | 21.85 | | | $ | .67 | | | $ | .80 | | | $ | 1.47 | | | $ | (.68 | ) | | $ | (.10 | ) | | $ | (.78 | ) | | $ | 22.54 | |
2012 | | | 19.45 | | | | 1.27 | | | | 2.49 | | | | 3.76 | | | | (1.36 | ) | | | — | | | | (1.36 | ) | | | 21.85 | |
2011 | | | 20.42 | | | | 1.40 | | | | (1.00 | ) | | | .40 | | | | (1.27 | ) | | | (.10 | ) | | | (1.37 | ) | | | 19.45 | |
2010(d) | | | 20.00 | | | | .45 | | | | .43 | | | | .88 | | | | (.46 | ) | | | — | | | | (.46 | ) | | | 20.42 | |
Class C (4/10) | | | | | | | | | | | | | | | | | | | | | | | | | | | | | |
2013(e) | | | 21.82 | | | | .59 | | | | .79 | | | | 1.38 | | | | (.60 | ) | | | (.10 | ) | | | (.70 | ) | | | 22.50 | |
2012 | | | 19.42 | | | | 1.11 | | | | 2.49 | | | | 3.60 | | | | (1.20 | ) | | | — | | | | (1.20 | ) | | | 21.82 | |
2011 | | | 20.40 | | | | 1.26 | | | | (1.02 | ) | | | .24 | | | | (1.12 | ) | | | (.10 | ) | | | (1.22 | ) | | | 19.42 | |
2010(d) | | | 20.00 | | | | .38 | | | | .43 | | | | .81 | | | | (.41 | ) | | | — | | | | (.41 | ) | | | 20.40 | |
Class I (4/10) | | | | | | | | | | | | | | | | | | | | | | | | | | | | | |
2013(e) | | | 21.85 | | | | .70 | | | | .80 | | | | 1.50 | | | | (.71 | ) | | | (.10 | ) | | | (.81 | ) | | | 22.54 | |
2012 | | | 19.45 | | | | 1.33 | | | | 2.48 | | | | 3.81 | | | | (1.41 | ) | | | — | | | | (1.41 | ) | | | 21.85 | |
2011 | | | 20.43 | | | | 1.45 | | | | (1.00 | ) | | | .45 | | | | (1.33 | ) | | | (.10 | ) | | | (1.43 | ) | | | 19.45 | |
2010(d) | | | 20.00 | | | | .47 | | | | .44 | | | | .91 | | | | (.48 | ) | | | — | | | | (.48 | ) | | | 20.43 | |
| | | | | | | | | | | | | | | | | | | | | | | | | | |
| | | | | | |
| | | | | | | | | | | | | | | | | | | | |
| Ratios/Supplemental Data | |
| | | | | | | Ratios to Average
Net Assets Before
Waiver/Reimbursement | | | Ratios to Average
Net Assets After
Waiver/Reimbursement(c) | | | | |
Total
Return(b) | | | Ending
Net
Assets
(000) | | | Expenses | | |
Net
Invest-
ment
Income
(Loss) | | | Expenses | | | Net
Invest-
ment
Income
(Loss) | | | Portfolio
Turnover
Rate | |
| | | | | | | | | | | | | | | | | | | | | | | | | | |
| | 6.90 | % | | $ | 137,752 | | | | 1.04 | %* | | | 6.05 | %* | | | 1.04 | %* | | | 6.05 | %* | | | 45 | % |
| | 19.72 | | | | 77,603 | | | | 1.13 | | | | 5.99 | | | | 1.07 | | | | 6.05 | | | | 83 | |
| | 1.76 | | | | 23,883 | | | | 1.16 | | | | 6.69 | | | | 1.08 | | | | 6.77 | | | | 137 | |
| | 4.48 | | | | 4,436 | | | | 1.74 | * | | | 4.65 | * | | | 1.09 | * | | | 5.31 | * | | | 68 | |
| | | | | | | | | | | | | | | | | | | | | | | | | | |
| | 6.48 | | | | 56,576 | | | | 1.79 | * | | | 5.31 | * | | | 1.79 | * | | | 5.31 | | | | 45 | |
| | 18.87 | | | | 41,128 | | | | 1.88 | | | | 5.24 | | | | 1.82 | | | | 5.29 | | | | 83 | |
| | .96 | | | | 11,037 | | | | 1.91 | | | | 6.02 | | | | 1.83 | | | | 6.10 | | | | 137 | |
| | 4.12 | | | | 1,359 | | | | 2.93 | * | | | 3.44 | * | | | 1.84 | * | | | 4.53 | * | | | 68 | |
| | | | | | | | | | | | | | | | | | | | | | | | | | |
| | 6.98 | | | | 205,689 | | | | .80 | * | | | 6.31 | * | | | .80 | * | | | 6.31 | | | | 45 | |
| | 20.08 | | | | 136,009 | | | | .88 | | | | 6.29 | | | | .82 | | | | 6.34 | | | | 83 | |
| | 1.97 | | | | 53,432 | | | | .92 | | | | 6.85 | | | | .83 | | | | 6.94 | | | | 137 | |
| | 4.61 | | | | 16,385 | | | | 1.16 | * | | | 5.21 | * | | | .84 | * | | | 5.54 | * | | | 68 | |
| (a) | Per share Net Investment Income (Loss) is calculated using the average daily shares method. |
| (b) | Total return is the combination of changes in net asset value without any sales charge, reinvested dividend income at net asset value and reinvested capital gains distributions at net asset value, if any. Total returns are not annualized. |
| (c) | After fee waiver and/or expense reimbursement from the Adviser, where applicable. |
| (d) | For the period April 28, 2010 (commencement of operations) through September 30, 2010. |
| (e) | For the six months ended March 31, 2013. |
See accompanying notes to financial statements.
Financial Highlights (Unaudited) (continued)
| | | | | | | | | | | | | | | | | | | | | | | | | | | | | | | | |
| Selected data for a share outstanding throughout each period: | |
| | | | | | |
| Class (Commencement Date) | | | | | | | | | | | | | | | | | | | |
| | | | | | Investment Operations | | | Less Distributions | | | | |
| | | | | |
| SYMPHONY FLOATING RATE INCOME | | | | | | | | | | | | | | | | |
Year Ended
September 30, | | Beginning
Net
Asset
Value | | | Net
Invest-
ment
Income
(Loss)(a) | | | Net
Realized/
Unrealized
Gain
(Loss) | | | Total | | | From
Net
Invest-
ment
Income | | | From
Accum-
ulated
Net
Realized
Gains | | | Total | | | Ending
Net
Asset
Value | |
Class A (5/11) | | | | | | | | | | | | | | | | | | | | | | | | | | | | | |
2013(e) | | $ | 20.15 | | | $ | .38 | | | $ | .64 | | | $ | 1.02 | | | $ | (.53 | ) | | $ | (.08 | ) | | $ | (.61 | ) | | $ | 20.56 | |
2012 | | | 18.57 | | | | 1.01 | | | | 1.66 | | | | 2.67 | | | | (1.09 | ) | | | — | | | | (1.09 | ) | | | 20.15 | |
2011(d) | | | 20.00 | | | | .35 | | | | (1.42 | ) | | | (1.07 | ) | | | (.36 | ) | | | — | | | | (.36 | ) | | | 18.57 | |
Class C (5/11) | | | | | | | | | | | | | | | | | | | | | | | | | | | | | |
2013(e) | | | 20.13 | | | | .32 | | | | .62 | | | | .94 | | | | (.45 | ) | | | (.08 | ) | | | (.53 | ) | | | 20.54 | |
2012 | | | 18.56 | | | | .87 | | | | 1.64 | | | | 2.51 | | | | (.94 | ) | | | — | | | | (.94 | ) | | | 20.13 | |
2011(d) | | | 20.00 | | | | .29 | | | | (1.42 | ) | | | (1.13 | ) | | | (.31 | ) | | | — | | | | (.31 | ) | | | 18.56 | |
Class I (5/11) | | | | | | | | | | | | | | | | | | | | | | | | | | | | | |
2013(e) | | | 20.14 | | | | .42 | | | | .63 | | | | 1.05 | | | | (.55 | ) | | | (.08 | ) | | | (.63 | ) | | | 20.56 | |
2012 | | | 18.57 | | | | 1.07 | | | | 1.64 | | | | 2.71 | | | | (1.14 | ) | | | — | | | | (1.14 | ) | | | 20.14 | |
2011(d) | | | 20.00 | | | | .37 | | | | (1.42 | ) | | | (1.05 | ) | | | (.38 | ) | | | — | | | | (.38 | ) | | | 18.57 | |
| | | | | | | | | | | | | | | | | | | | | | | | | | |
| | | | | | |
| | | | | | | | | | | | | | | | | | | | |
| Ratios/Supplemental Data | |
| | | | | | | Ratios to Average
Net Assets Before
Waiver/Reimbursement | | | Ratios to Average
Net Assets After
Waiver/Reimbursement(c) | | | | |
Total
Return(b) | | | Ending
Net
Assets
(000) | | | Expenses | | |
Net
Invest-
ment
Income
(Loss) | | | Expenses | | | Net
Invest-
ment
Income
(Loss) | | | Portfolio
Turnover
Rate | |
| | | | | | | | | | | | | | | | | | | | | | | | | | |
| | 5.12 | % | | $ | 9,392 | | | | 1.56 | %* | | | 3.28 | %* | | | 1.07 | %* | | | 3.77 | %* | | | 55 | % |
| | 14.74 | | | | 1,088 | | | | 1.91 | | | | 4.30 | | | | 1.07 | | | | 5.14 | | | | 210 | |
| | (5.43 | ) | | | 274 | | | | 1.54 | * | | | 3.87 | * | | | 1.08 | * | | | 4.33 | * | | | 97 | |
| | | | | | | | | | | | | | | | | | | | | | | | | | |
| | 4.74 | | | | 2,424 | | | | 2.33 | * | | | 2.64 | * | | | 1.82 | * | | | 3.15 | * | | | 55 | |
| | 13.82 | | | | 487 | | | | 2.70 | | | | 3.58 | | | | 1.82 | | | | 4.46 | | | | 210 | |
| | (5.72 | ) | | | 248 | | | | 2.28 | * | | | 3.08 | * | | | 1.83 | * | | | 3.54 | * | | | 97 | |
| | | | | | | | | | | | | | | | | | | | | | | | | | |
| | 5.30 | | | | 53,732 | | | | 1.35 | * | | | 3.59 | * | | | .82 | * | | | 4.12 | * | | | 55 | |
| | 14.90 | | | | 10,346 | | | | 1.63 | | | | 4.62 | | | | .82 | | | | 5.42 | | | | 210 | |
| | (5.30 | ) | | | 8,589 | | | | 1.28 | * | | | 4.04 | * | | | .83 | * | | | 4.50 | * | | | 97 | |
| (a) | Per share Net Investment Income (Loss) is calculated using the average daily shares method. |
| (b) | Total return is the combination of changes in net asset value without any sales charge, reinvested dividend income at net asset value and reinvested capital gains distributions at net asset value, if any. Total returns are not annualized. |
| (c) | After fee waiver and/or expense reimbursement from the Adviser, where applicable. |
| (d) | For the period May 2, 2011 (commencement of operations) through September 30, 2011. |
| (e) | For the six months ended March 31, 2013. |
See accompanying notes to financial statements.
Financial Highlights (Unaudited) (continued)
| | | | | | | | | | | | | | | | | | | | | | | | | | | | | | | | |
| Selected data for a share outstanding throughout each period: | |
| | | | | | |
| Class (Commencement Date) | | | | | | | | | | | | | | | | | | | |
| | | | | | Investment Operations | | | Less Distributions | | | | |
| | | | | |
| SYMPHONY HIGH YIELD BOND | | | | | | | | | | | | | | | | |
Year Ended
September 30, | | Beginning
Net
Asset
Value | | | Net
Invest-
ment
Income
(Loss)(a) | | | Net
Realized/
Unrealized
Gain
(Loss) | | | Total | | | From
Net
Invest-
ment
Income | | | From
Accum-
ulated
Net
Realized
Gains | | | Total | | | Ending
Net
Asset
Value | |
Class A (12/12) | | | | | | | | | | | | | | | | | | | | | | | | | | | | | |
2013(d) | | $ | 20.00 | | | $ | .35 | | | $ | .91 | | | $ | 1.26 | | | $ | — | | | $ | — | | | $ | — | | | $ | 21.26 | |
Class C (12/12) | | | | | | | | | | | | | | | | | | | | | | | | | | | | | |
2013(d) | | | 20.00 | | | | .30 | | | | .92 | | | | 1.22 | | | | — | | | | — | | | | — | | | | 21.22 | |
Class I (12/12) | | | | | | | | | | | | | | | | | | | | | | | | | | | | | |
2013(d) | | | 20.00 | | | | .36 | | | | .92 | | | | 1.28 | | | | — | | | | — | | | | — | | | | 21.28 | |
| | | | | | | | | | | | | | | | | | | | | | | | | | |
| | | | | | |
| | | | | | | | | | | | | | | | | | | | |
| Ratios/Supplemental Data | |
| | | | | | | Ratios to Average
Net Assets Before
Waiver/Reimbursement | | | Ratios to Average
Net Assets After
Waiver/Reimbursement(c) | | | | |
Total
Return(b) | | | Ending
Net
Assets
(000) | | | Expenses | | |
Net
Invest-
ment
Income
(Loss) | | | Expenses | | | Net
Invest-
ment
Income
(Loss) | | | Portfolio
Turnover
Rate | |
| | | | | | | | | | | | | | | | | | | | | | | | | | |
| | 6.30 | % | | $ | 53 | | | | 3.55 | %* | | | 2.97 | %* | | | 1.07 | %* | | | 5.45 | %* | | | 98 | % |
| | | | | | | | | | | | | | | | | | | | | | | | | | |
| | 6.10 | | | | 53 | | | | 4.29 | * | | | 2.22 | * | | | 1.82 | * | | | 4.70 | * | | | 98 | |
| | | | | | | | | | | | | | | | | | | | | | | | | | |
| | 6.40 | | | | 5,214 | | | | 3.30 | * | | | 3.22 | * | | | .82 | * | | | 5.70 | * | | | 98 | |
| (a) | Per share Net Investment Income (Loss) is calculated using the average daily shares method. |
| (b) | Total return is the combination of changes in net asset value without any sales charge, reinvested dividend income at net asset value and reinvested capital gains distributions at net asset value, if any. Total returns are not annualized. |
| (c) | After fee waiver and/or expense reimbursement from the Adviser, where applicable. |
| (d) | For the period December 10, 2012 (commencement of operations) through March 31, 2013. |
See accompanying notes to financial statements.
Notes to Financial Statements (Unaudited)
1. General Information and Significant Accounting Policies
General Information
The Nuveen Investment Trust III (the “Trust”) is an open-end management investment company registered under the Investment Company Act of 1940, as amended. The Trust is comprised of Nuveen Symphony Credit Opportunities Fund (“Symphony Credit Opportunities”), Nuveen Symphony Floating Rate Income Fund (“Symphony Floating Rate Income”) and Nuveen Symphony High Yield Bond Fund (“Symphony High Yield Bond”) (each a “Fund” and collectively, the “Funds”), as diversified funds, among others. The Trust was organized as a Massachusetts business trust in 1998. Symphony High Yield Bond commenced operations on December 10, 2012.
On December 31, 2012, the Funds’ investment adviser converted from a Delaware corporation to a Delaware limited liability company. As a result, Nuveen Fund Advisors, Inc., a wholly-owned subsidiary of Nuveen Investments, Inc. (“Nuveen”), changed its name to Nuveen Fund Advisors, LLC (the “Adviser”). There were no changes to the identities or roles of any personnel as a result of the change.
Symphony Credit Opportunities’ investment objective is to seek current income and capital appreciation. Under normal market conditions, the Fund invests primarily in debt instruments (e.g., bonds, loans and convertible securities), a substantial portion of which may be rated below investment-grade or, if unrated, deemed by the Fund’s sub-adviser Symphony Asset Management LLC (“Symphony”), an affiliate of Nuveen, to be of comparable quality. Below investment-grade securities are commonly referred to as “high yield” or “junk bonds.” The Fund invests both in debt issued by U.S. companies and in U.S. dollar-denominated debt issued by non-U.S. companies that is traded over-the-counter or listed on an exchange.
Symphony Floating Rate Income’s principal investment objective is to seek a high level of current income and the secondary investment objective of the Fund is to seek capital appreciation. Under normal market conditions, the Fund invests at least 80% of its net assets (plus the amount of any borrowings for investment purposes) in floating rate securities. Floating rate securities are defined to include floating rate loans, other floating rate debt securities, money market securities and shares of money market and short-term bond funds. The Fund may invest up to 20% of its net assets in other securities, which would primarily be fixed rate debt securities, convertible securities and equity securities received as a result of the restructuring of an issuer’s debt. A substantial portion of the Fund’s assets generally will be invested in securities rated below investment grade or, if unrated, deemed by the Fund’s sub-adviser, Symphony, to be of comparable quality. Below investment-grade securities are commonly referred to as “high yield” or “junk bonds.” The Fund invests both in debt issued by U.S. companies and in U.S. dollar-denominated debt issued by non-U.S. companies that is traded over-the-counter or listed on an exchange. Under normal market conditions, the Fund’s average portfolio duration will not be longer than one year.
Symphony High Yield Bond’s investment objective is to seek current income and capital appreciation. Under normal market conditions, the Fund invests at least 80% of its net assets (plus the amount of any borrowings for investment purposes) in bonds rated below investment-grade or, if unrated, deemed by the Fund’s sub-adviser, Symphony, to be of comparable quality. Below investment-grade bonds are commonly referred to as “high yield” or “junk bonds.” The Fund may invest up to 20% of its net assets, collectively, in bank loans, convertible securities, and equity securities. The Fund may invest in securities issued by U.S. companies and in U.S. dollar-denominated securities issued by non-U.S. companies that are traded over-the-counter or listed on an exchange.
Each Fund may utilize the following derivatives: options; futures contracts; options on futures contracts; swap agreements, including interest rate swaps, total return swaps, and credit default swaps; and options on swap agreements. Each Fund may use these derivatives in an attempt to manage market risk, credit risk and yield curve risk, to manage the effective maturity or duration of securities in the Fund’s portfolio, including the use of interest rate derivatives to convert fixed-rate securities to floating rate securities for Symphony Floating Rate Income, or for speculative purposes in an effort to increase the Fund’s yield or to enhance returns. The use of a derivative is speculative if the Fund is primarily seeking to enhance returns, rather than offset the risk of other positions.
The Funds’ most recent prospectus provides further descriptions of each Fund’s investment objective, principal investment strategies and principal risks.
Significant Accounting Policies
The following is a summary of significant accounting policies followed by the Funds in the preparation of their financial statements in accordance with accounting principles generally accepted in the United States (“U.S. GAAP”).
Investment Valuation
Prices of fixed-income securities and senior loans are provided by a pricing service approved by the Funds’ Board of Trustees. These securities are generally classified as Level 2 for fair value measurement purposes. The pricing service establishes a security’s fair value using methods that may include consideration of the following: yields or prices of investments of comparable quality, type of issue, coupon, maturity and rating, market quotes or indications of value from security dealers, evaluations of anticipated cash flows or collateral, general market conditions and other information and analysis, including the obligor’s credit characteristics considered relevant. In pricing certain securities, particularly less liquid and lower quality securities, the pricing service may consider information about a security, its issuer, or market activity provided by the Adviser. These securities are generally classified as Level 2 or Level 3 depending on the priority of the significant inputs.
Like most fixed-income securities, the senior and subordinated loans in which the Funds invest are not listed on an organized exchange. The secondary market of such investments may be less liquid relative to markets for other fixed-income securities. Consequently, the value of senior and subordinated loans, determined as described above, may differ significantly from the value that would have been determined had there been an active market for that senior loan. These securities are generally classified as Level 2.
Repurchase agreements are valued at contract amount plus accrued interest, which approximates market value. These securities are generally classified as Level 2.
Certain securities may not be able to be priced by the pre-established pricing methods as described above. Such securities may be valued by the Funds’ Board of Trustees or its designee at fair value. These securities generally include, but are not limited to, restricted securities (securities which may not be publicly sold without registration under the Securities Act of 1933, as amended) for which a pricing service is unable to provide a market price; securities whose trading has been formally suspended; debt securities that have gone into default and for which there is no current market quotation; a security whose market price is not available from a pre-established pricing source; a security with respect to which an event has occurred that is likely to materially affect the value of the security after the market has closed but before the calculation of a Fund’s net asset value (as may be the case in non-U.S. markets on which the security is primarily traded) or make it difficult or impossible to obtain a reliable market quotation; and a security whose price, as provided by the pricing service, is not deemed to reflect the security’s fair value. As a general principle, the fair value of a security would appear to be the amount that the owner might reasonably expect to receive for it in a current sale. A variety of factors may be considered in determining the fair value of such securities, which may include consideration of the following: yields or prices of investments of comparable quality, type of issue, coupon, maturity and rating, market quotes or indications of value from security dealers, evaluations of anticipated cash flows or collateral, general market conditions and other information and analysis, including the obligor’s credit characteristics considered relevant. These securities are generally classified as Level 2 or Level 3 depending on the priority of the significant inputs. Regardless of the method employed to value a particular security, all valuations are subject to review by the Funds’ Board of Trustees or its designee.
Refer to Footnote 2 – Fair Value Measurements for further details on the leveling of securities held by the Funds as of the end of the reporting period.
Investment Transactions
Investment transactions are recorded on a trade date basis. Trade date for senior and subordinated loans purchased in the “primary market” is considered the date on which the loan allocations are determined. Trade date for senior and subordinated loans purchased in the “secondary market” is the date on which the transaction is entered into. Realized gains and losses from investment transactions are determined on the specific identification method, which is the same basis used for federal income tax purposes. Investments purchased on a when-issued/delayed delivery basis may have extended settlement periods. Any investments so purchased are subject to market fluctuation during this period. The Funds have instructed the custodian to earmark securities in the Funds’ portfolios with a current value at least equal to the amount of the when-issued/delayed delivery purchase commitments. As of March 31, 2013, Symphony Credit Opportunities and Symphony Floating Rate Income each had outstanding when-issued/delayed delivery purchase commitments of $20,252,270 and $23,138,996, respectively. There were no such outstanding purchase commitments in Symphony High Yield Bond.
Investment Income
Investment income, which reflects the amortization of premiums and includes accretion of discounts for financial reporting purposes, is recorded on an accrual basis. Investment income also reflects fee income, if any. Fee income, consists primarily of amendment fees. Amendment fees are earned as compensation for evaluating and accepting changes to an original senior loan agreement and are recognized when received.
Professional Fees
Professional fees presented on the Statement of Operations consist of legal fees incurred in the normal course of operations, audit fees, tax consulting fees and, in some cases, workout expenditures. Workout expenditures are incurred in an attempt to protect or enhance an investment, or to pursue other claims or legal actions on behalf of Fund shareholders. Legal fee refund presented on the Statement of Operations reflects a refund of workout expenditures paid in a prior reporting period, when applicable.
Income Taxes
Each Fund is a separate taxpayer for federal income tax purposes. Each Fund intends to distribute substantially all of its net investment income and net capital gains to shareholders and to otherwise comply with the requirements of Subchapter M of the Internal Revenue Code applicable to regulated investment companies. Therefore, no federal income tax provision is required.
For all open tax years and all major taxing jurisdictions, management of the Funds has concluded that there are no significant uncertain tax positions that would require recognition in the financial statements. Open tax years are those that are open for examination by taxing authorities (i.e., generally the last four tax year ends and the interim tax period since then). Furthermore, management of the Funds is also not aware of any tax positions for which it is reasonably possible that the total amounts of unrecognized tax benefits will significantly change in the next twelve months.
Notes to Financial Statements (Unaudited) (continued)
Dividends and Distributions to Shareholders
The Funds declare dividends from their net investment income daily and pay shareholders monthly. Fund shares begin to accrue dividends on the business day after the day when the monies used to purchase Fund shares are collected by the Funds’ transfer agent.
Net realized capital gains from investment transactions, if any, are declared and distributed to shareholders at least annually. Furthermore, capital gains are distributed only to the extent they exceed available capital loss carryforwards.
Distributions to shareholders are recorded on the ex-dividend date. The amount and timing of distributions are determined in accordance with federal income tax regulations, which may differ from U.S. GAAP.
Share Classes and Sales Charges
Class A Shares are generally sold with an up-front sales charge and incur a ..25% annual 12b-1 service fee. Class A Share purchases of $1 million or more are sold at net asset value without an up-front sales charge but may be subject to a contingent deferred sales charge (“CDSC”) if redeemed within eighteen months of purchase. Class C Shares are sold without an up-front sales charge but incur a .75% annual 12b-1 distribution fee and a .25% annual 12b-1 service fee. Class C Shares are subject to a CDSC of 1% if redeemed within twelve months of purchase. Class I Shares are not subject to any sales charge or 12b-1 distribution or service fees.
Symphony Floating Rate Income charges a 2% redemption fee on shares that are redeemed or exchanged within 90 days of acquisition. Fees imposed on shares redeemed or exchanged are recorded as an increase to the Fund’s capital paid-in and recognized as “Redemption fees” on the Statement of Changes in Net Assets, when applicable.
Effective April 1, 2013, (subsequent to the close of this reporting period) the maximum up-front sales charge imposed on Class A Shares for Symphony Floating Rate Income was reduced from 4.75% to 3.00%.
Derivative Financial Instruments
Each Fund is authorized to invest in certain derivative instruments, including futures, options and swap contracts. Although each Fund is authorized to invest in such derivative instruments, and may do so in the future, they did not make any such investments during the six months ended March 31, 2013.
Zero Coupon Securities
Each Fund is authorized to invest in zero coupon securities. A zero coupon security does not pay a regular interest coupon to its holders during the life of the security. Income to the holder of the security comes from accretion of the difference between the original purchase price of the security at issuance and the par value of the security at maturity and is effectively paid at maturity. The market prices of zero coupon securities generally are more volatile than the market prices of securities that pay interest periodically.
Multiclass Operations and Allocations
Income and expenses of the Funds that are not directly attributable to a specific class of shares are prorated among the classes based on the relative settled shares of each class. Expenses directly attributable to a class of shares, which presently only include 12b-1 distribution and shareholder service fees, are recorded to the specific class.
Realized and unrealized capital gains and losses of the Funds are prorated among the classes based on the relative net assets of each class.
Repurchase Agreements
In connection with transactions in repurchase agreements, it is each Fund’s policy that its custodian take possession of the underlying collateral securities, the fair value of which exceeds the principal amount of the repurchase transaction, including accrued interest, at all times. If the counterparty defaults, and the fair value of the collateral declines, realization of the collateral may be delayed or limited.
Indemnifications
Under the Trust’s organizational documents, its officers and trustees are indemnified against certain liabilities arising out of the performance of their duties to the Trust. In addition, in the normal course of business, the Trust enters into contracts that provide general indemnifications to other parties. The Trust’s maximum exposure under these arrangements is unknown as this would involve future claims that may be made against the Trust that have not yet occurred. However, the Trust has not had prior claims or losses pursuant to these contracts and expects the risk of loss to be remote.
Use of Estimates
The preparation of financial statements in conformity with U.S. GAAP requires management to make estimates and assumptions that affect the reported amounts of assets and liabilities at the date of the financial statements and the reported amounts of increases and decreases in net assets from operations during the reporting period. Actual results may differ from those estimates.
2. Fair Value Measurements
Fair value is defined as the price that the Funds would receive upon selling an investment or transferring a liability in an orderly transaction to an independent buyer in the principal or most advantageous market for the investment. A three-tier hierarchy is used to maximize the use of observable market data and minimize the use of unobservable inputs and to establish classification of fair value measurements for disclosure purposes. Observable inputs reflect the assumptions market participants would use in pricing the asset
or liability. Observable inputs are based on market data obtained from sources independent of the reporting entity. Unobservable inputs reflect the reporting entity’s own assumptions about the assumptions market participants would use in pricing the asset or liability. Unobservable inputs are based on the best information available in the circumstances. The following is a summary of the three-tiered hierarchy of valuation input levels.
| | |
| Level 1 – | | Inputs are unadjusted and prices are determined using quoted prices in active markets for identical securities. |
| Level 2 – | | Prices are determined using other significant observable inputs (including quoted prices for similar securities, interest rates, prepayment speeds, credit risk, etc.). |
| Level 3 – | | Prices are determined using significant unobservable inputs (including management’s assumptions in determining the fair value of investments). |
The inputs or methodologies used for valuing securities are not an indication of the risks associated with investing in those securities.
The following is a summary of each Fund’s fair value measurements as of the end of the reporting period:
| | | | | | | | | | | | | | | | |
| | | | |
| Symphony Credit Opportunities | | Level 1 | | | Level 2 | | | Level 3 | | | Total | |
Long-Term Investments*: | | | | | | | | | | | | | | | | |
Common Stocks | | $ | 656,390 | | | $ | 69,529 | | | $ | — | ** | | $ | 725,919 | |
$1,000 Par (or similar) Institutional Structures | | | — | | | | 1,120,000 | | | | — | | | | 1,120,000 | |
Convertible Bonds | | | — | | | | 4,400,593 | | | | — | | | | 4,400,593 | |
Corporate Bonds | | | — | | | | 266,535,236 | | | | — | | | | 266,535,236 | |
Variable Rate Senior Loan Interests | | | — | | | | 104,307,829 | | | | — | | | | 104,307,829 | |
Short-Term Investments: | | | | | | | | | | | | | | | | |
Repurchase Agreements | | | — | | | | 34,047,211 | | | | — | | | | 34,047,211 | |
Total | | $ | 656,390 | | | $ | 410,480,398 | | | $ | — | | | $ | 411,136,788 | |
| | | | |
| Symphony Floating Rate Income | | Level 1 | | | Level 2 | | | Level 3 | | | Total | |
Long-Term Investments*: | | | | | | | | | | | | | | | | |
Corporate Bonds | | $ | — | | | $ | 11,180,630 | | | $ | — | | | $ | 11,180,630 | |
Variable Rate Senior Loan Interests | | | — | | | | 49,493,598 | | | | — | | | | 49,493,598 | |
Short-Term Investments: | | | | | | | | | | | | | | | | |
Repurchase Agreements | | | — | | | | 18,625,889 | | | | — | | | | 18,625,889 | |
Total | | $ | — | | | $ | 79,300,117 | | | $ | — | | | $ | 79,300,117 | |
| | | | |
| Symphony High Yield Bond | | Level 1 | | | Level 2 | | | Level 3 | | | Total | |
Long-Term Investments*: | | | | | | | | | | | | | | | | |
Corporate Bonds | | $ | — | | | $ | 4,762,635 | | | $ | — | | | $ | 4,762,635 | |
Variable Rate Senior Loan Interests | | | — | | | | 456,622 | | | | — | | | | 456,622 | |
Total | | $ | — | | | $ | 5,219,257 | | | $ | — | | | $ | 5,219,257 | |
| * | Refer to the Fund’s Portfolio of Investments for industry classifications and breakdown of Common Stocks classified as Level 2 and Level 3, where applicable. |
| ** | Value equals zero as of the end of the reporting period. |
The Nuveen funds’ Board of Directors/Trustees is responsible for the valuation process and has delegated the oversight of the daily valuation process to the Adviser’s Valuation Committee. The Valuation Committee, pursuant to the valuation policies and procedures adopted by the Board of Directors/Trustees, is responsible for making fair value determinations, evaluating the effectiveness of the funds’ pricing policies, and reporting to the Board of Directors/Trustees. The Valuation Committee is aided in its efforts by the Adviser’s dedicated Securities Valuation Team, which is responsible for administering the daily valuation process and applying fair value methodologies as approved by the Valuation Committee. When determining the reliability of independent pricing services for investments owned by the funds, the Valuation Committee, among other things, conducts due diligence reviews of the pricing services and monitors the quality of security prices received through various testing reports conducted by the Securities Valuation Team.
The Valuation Committee will consider pricing methodologies it deems relevant and appropriate when making fair value determinations. Examples of possible methodologies include, but are not limited to, multiple of earnings; discount from market of a similar freely traded security; discounted cash-flow analysis; book value or a multiple thereof; risk premium/yield analysis; yield to maturity; and/or fundamental investment analysis. The Valuation Committee will also consider factors it deems relevant and appropriate in light of the facts and circumstances. Examples of possible factors include, but are not limited to, the type of security; the issuer’s financial statements; the purchase price of the security; the discount from market value of unrestricted securities of the same class at the time of purchase; analysts’ research and observations from financial institutions; information regarding any transactions or offers with respect to the security; the existence of merger proposals or tender offers affecting the security; the price and extent of public trading in similar securities of the issuer or comparable companies; and the existence of a shelf registration for restricted securities.
For each portfolio security that has been fair valued pursuant to the policies adopted by the Board of Directors/Trustees, the fair value price is compared against the last available and next available market quotations. The Valuation Committee reviews the results of such testing and fair valuation occurrences are reported to the Board of Directors/Trustees.
Notes to Financial Statements (Unaudited) (continued)
3. Derivative Instruments and Hedging Activities
The Funds record derivative instruments at fair value, with changes in fair value recognized on the Statement of Operations, when applicable. Even though the Funds’ investments in derivatives may represent economic hedges, they are not considered to be hedge transactions for financial reporting purposes. The Funds did not invest in derivative instruments during the six months ended March 31, 2013.
4. Fund Shares
Transactions in Fund shares were as follows:
| | | | | | | | | | | | | | | | |
| | | Symphony Credit Opportunities | |
| | | Six Months Ended
3/31/13 | | | Year Ended
9/30/12 | |
| | | Shares | | | Amount | | | Shares | | | Amount | |
Shares sold: | | | | | | | | | | | | | | | | |
Class A | | | 3,009,933 | | | $ | 66,845,024 | | | | 2,818,507 | | | $ | 59,229,378 | |
Class C | | | 747,175 | | | | 16,551,578 | | | | 1,443,879 | | | | 30,554,699 | |
Class R3 | | | N/A | | | | N/A | | | | — | | | | — | |
Class I | | | 3,786,047 | | | | 84,479,944 | | | | 4,165,352 | | | | 88,085,891 | |
Shares issued to shareholders due to reinvestment of distributions: | | | | | | | | | | | | | | | | |
Class A | | | 148,864 | | | | 3,304,307 | | | | 141,548 | | | | 3,005,946 | |
Class C | | | 52,679 | | | | 1,166,686 | | | | 44,028 | | | | 935,788 | |
Class R3 | | | N/A | | | | N/A | | | | 5 | | | | 112 | |
Class I | | | 222,267 | | | | 4,929,065 | | | | 249,942 | | | | 5,301,863 | |
| | | | 7,966,965 | | | | 177,276,604 | | | | 8,863,261 | | | | 187,113,677 | |
Shares redeemed: | | | | | | | | | | | | | | | | |
Class A | | | (598,492 | ) | | | (13,256,890 | ) | | | (635,853 | ) | | | (13,443,062 | ) |
Class C | | | (170,817 | ) | | | (3,783,491 | ) | | | (170,941 | ) | | | (3,608,963 | ) |
Class R3 | | | N/A | | | | N/A | | | | (2,545 | ) | | | (53,448 | ) |
Class I | | | (1,107,305 | ) | | | (24,500,555 | ) | | | (936,952 | ) | | | (19,596,667 | ) |
| | | | (1,876,614 | ) | | | (41,540,936 | ) | | | (1,746,291 | ) | | | (36,702,140 | ) |
Net increase (decrease) | | | 6,090,351 | | | $ | 135,735,668 | | | | 7,116,970 | | | $ | 150,411,537 | |
| N/A | – After the close of business on May 30, 2012, Symphony Credit Opportunities liquidated all of its Class R3 Shares. |
| | | | | | | | | | | | | | | | |
| | | Symphony Floating Rate Income | |
| | | Six Months Ended
3/31/13 | | | Year Ended
9/30/12 | |
| | | Shares | | | Amount | | | Shares | | | Amount | |
Shares sold: | | | | | | | | | | | | | | | | |
Class A | | | 502,006 | | | $ | 10,207,446 | | | | 51,622 | | | $ | 1,021,918 | |
Class C | | | 96,017 | | | | 1,955,785 | | | | 28,452 | | | | 561,708 | |
Class R3 | | | N/A | | | | N/A | | | | — | | | | — | |
Class I | | | 2,103,083 | | | | 43,068,293 | | | | 151,702 | | | | 2,949,008 | |
Shares issued to shareholders due to reinvestment of distributions: | | | | | | | | | | | | | | | | |
Class A | | | 6,504 | | | | 132,577 | | | | 1,002 | | | | 19,927 | |
Class C | | | 1,237 | | | | 25,203 | | | | 572 | | | | 11,359 | |
Class R3 | | | N/A | | | | N/A | | | | — | | | | — | |
Class I | | | 12,144 | | | | 247,877 | | | | 5,409 | | | | 107,352 | |
| | | | 2,720,991 | | | | 55,637,181 | | | | 238,759 | | | | 4,671,272 | |
Shares redeemed: | | | | | | | | | | | | | | | | |
Class A | | | (105,598 | ) | | | (2,150,071 | ) | | | (13,357 | ) | | | (262,905 | ) |
Class C | | | (3,393 | ) | | | (68,839 | ) | | | (18,205 | ) | | | (358,603 | ) |
Class R3 | | | N/A | | | | N/A | | | | (12,500 | ) | | | (246,750 | ) |
Class I | | | (14,856 | ) | | | (302,944 | ) | | | (105,953 | ) | | | (2,091,108 | ) |
| | | | (123,847 | ) | | | (2,521,854 | ) | | | (150,015 | ) | | | (2,959,366 | ) |
Net increase (decrease) | | | 2,597,144 | | | $ | 53,115,327 | | | | 88,744 | | | $ | 1,711,906 | |
| N/A | – After the close of business on May 30, 2012, Symphony Floating Rate Income liquidated all of its Class R3 Shares. |
| | | | | | | | |
| | | Symphony High Yield Bond | |
| | | For the Period 12/10/12
(commencement of
operations) through 3/31/13 | |
| | | Shares | | | Amount | |
Shares sold: | | | | | | | | |
Class A | | | 2,500 | | | $ | 50,000 | |
Class C | | | 2,500 | | | | 50,000 | |
Class I | | | 245,000 | | | | 4,900,000 | |
Shares issued to shareholders due to reinvestment of distributions: | | | | | | | | |
Class A | | | — | | | | — | |
Class C | | | — | | | | — | |
Class I | | | — | | | | — | |
| | | | 250,000 | | | | 5,000,000 | |
Shares redeemed: | | | | | | | | |
Class A | | | — | | | | — | |
Class C | | | — | | | | — | |
Class I | | | — | | | | — | |
Net increase (decrease) | | | 250,000 | | | $ | 5,000,000 | |
5. Investment Transactions
Purchases and sales (including maturities but excluding short-term investments) during the six months ended March 31, 2013, were as follows:
| | | | | | | | | | | | |
| | | Symphony
Credit
Opportunities | | | Symphony
Floating Rate
Income | | | Symphony
High Yield
Bond | |
Purchases | | $ | 253,585,762 | | | $ | 61,612,405 | | | $ | 10,090,067 | |
Sales and maturities | | | 132,889,743 | | | | 13,130,232 | | | | 5,099,389 | |
6. Income Tax Information
The following information is presented on an income tax basis. Differences between amounts for financial statement and federal income tax purposes are primarily due to timing differences in recognizing certain gains and losses on investment transactions. To the extent that differences arise that are permanent in nature, such amounts are reclassified within the capital accounts as detailed below. Temporary differences do not require reclassification. Temporary and permanent differences do not impact the net asset values of the Funds.
As of March 31, 2013, the cost and unrealized appreciation (depreciation) of investments, as determined on a federal income tax basis, were as follows:
| | | | | | | | | | | | |
| | | Symphony
Credit
Opportunities | | | Symphony
Floating Rate
Income | | | Symphony
High Yield
Bond | |
Cost of investments | | $ | 395,605,112 | | | $ | 78,579,058 | | | $ | 5,072,542 | |
Gross unrealized: | | | | | | | | | | | | |
Appreciation | | $ | 16,041,792 | | | $ | 792,700 | | | $ | 154,527 | |
Depreciation | | | (510,116 | ) | | | (71,641 | ) | | | (7,812 | ) |
Net unrealized appreciation (depreciation) of investments | | $ | 15,531,676 | | | $ | 721,059 | | | $ | 146,715 | |
Permanent differences, primarily due to federal taxes paid and bond premium amortization adjustments, resulted in reclassifications among the Funds’ components of net assets as of September 30, 2012, the Funds’ last tax year end, as follows:
| | | | | | | | |
| | | Symphony
Credit
Opportunities | | | Symphony
Floating Rate
Income | |
Capital paid-in | | $ | (13,155 | ) | | $ | — | |
Undistributed (Over-distribution of) net investment income | | | 25,007 | | | | 4,031 | |
Accumulated net realized gain (loss) | | | (11,852 | ) | | | (4,031 | ) |
Notes to Financial Statements (Unaudited) (continued)
The tax components of undistributed net ordinary income and net long-term capital gains as of September 30, 2012, the Funds’ last tax year end, were as follows:
| | | | | | | | |
| | | Symphony
Credit
Opportunities | | | Symphony
Floating Rate
Income | |
Undistributed net ordinary income* | | $ | 2,247,321 | | | $ | 46,743 | |
Undistributed net long-term capital gains | | | 392,396 | | | | — | |
| * | Undistributed net ordinary income (on a tax basis) has not been reduced for the dividends declared during the period September 1, 2012 through September 30, 2012, and paid on October 1, 2012. Net ordinary income consists of net taxable income derived from dividends, interest, and net short-term capital gains, if any. |
The tax character of distributions paid during the Funds’ last tax year ended September 30, 2012, was designated for purposes of the dividends paid deduction as follows:
| | | | | | | | |
| | | Symphony
Credit
Opportunities | | | Symphony
Floating
Rate
Income | |
Distributions from net ordinary income* | | $ | 9,628,807 | | | $ | 660,558 | |
Distributions from net long-term capital gains | | | — | | | | — | |
| * | Net ordinary income consists of net taxable income derived from dividends, interest, and net short-term capital gains, if any. |
Under the Regulated Investment Company Modernization Act of 2010, capital losses incurred by the Funds after December 31, 2010, will not be subject to expiration. During the Funds’ last tax year ended September 30, 2012, there were no post-enactment capital losses generated by any of the Funds.
The Funds have elected to defer losses incurred from November 1, 2011 through September 30, 2012, the Funds’ last tax year end, in accordance with federal income tax rules. These losses are treated as having arisen on the first day of the current fiscal year. The following Fund has elected to defer post-October losses as follows:
| | | | |
| | | Symphony
Floating Rate
Income | |
Post-October capital losses | | $ | 3,002 | |
Late-Year ordinary losses | | | — | |
7. Management Fees and Other Transactions with Affiliates
Each Fund’s management fee consists of two components – a fund-level fee, based only on the amount of assets within each individual Fund, and a complex-level fee, based on the aggregate amount of all eligible fund assets managed by the Adviser. This pricing structure enables each Fund’s shareholders to benefit from growth in the assets within their respective Fund as well as from growth in the amount of complex-wide assets managed by the Adviser.
The annual fund-level fee for each Fund, payable monthly, is calculated according to the following schedule:
| | | | |
| Average Daily Net Assets | | Fund-Level Fee Rate | |
For the first $125 million | | | .4500 | % |
For the next $125 million | | | .4375 | |
For the next $250 million | | | .4250 | |
For the next $500 million | | | .4125 | |
For the next $1 billion | | | .4000 | |
For net assets over $2 billion | | | .3750 | |
The annual complex-level fee for each Fund, payable monthly, is calculated according to the following schedule:
| | | | |
| Complex-Level Asset Breakpoint Level* | | Effective Rate at Breakpoint Level | |
$55 billion | | | .2000 | % |
$56 billion | | | .1996 | |
$57 billion | | | .1989 | |
$60 billion | | | .1961 | |
$63 billion | | | .1931 | |
$66 billion | | | .1900 | |
$71 billion | | | .1851 | |
$76 billion | | | .1806 | |
$80 billion | | | .1773 | |
$91 billion | | | .1691 | |
$125 billion | | | .1599 | |
$200 billion | | | .1505 | |
$250 billion | | | .1469 | |
$300 billion | | | .1445 | |
| * | The complex-level fee is calculated based upon the aggregate daily “eligible assets” of all Nuveen Funds. Eligible assets do not include assets attributable to investments in other Nuveen Funds or assets in excess of $2 billion added to the Nuveen Fund complex in connection with the Adviser’s assumption of the management of the former First American Funds effective January 1, 2011. Eligible assets include closed-end fund assets managed by the Adviser that are attributable to financial leverage. For these purposes, financial leverage includes the closed-end funds’ use of preferred stock and borrowings and certain investments in the residual interest certificates (also called inverse floating rate securities) in tender option bond (TOB) trusts, including the portion of assets held by a TOB trust that has been effectively financed by the trust’s issuance of floating rate securities, subject to an agreement by the Adviser as to certain funds to limit the amount of such assets for determining eligible assets in certain circumstances. As of March 31, 2013, the complex-level fee rate for these Funds was .1668%. |
The management fee compensates the Adviser for overall investment advisory and administrative services and general office facilities. The Adviser is responsible for each Fund’s overall investment strategy and asset allocation decisions. The Adviser has entered into sub-advisory agreements with Symphony under which Symphony manages the investment portfolios of the Funds. Symphony is compensated for its services to the Funds from the management fees paid to the Adviser.
The Adviser has agreed to waive fees and/or reimburse expenses (“Expense Cap”) of the Funds so that total annual Fund operating expenses (excluding 12b-1 distribution and/or service fees, interest expenses, taxes, acquired fund fees and expenses, fees incurred in acquiring and disposing of portfolio securities and extraordinary expenses) do not exceed the average daily net assets of any class of Fund shares in the amounts and for the time periods stated in the following table.
| | | | | | | | | | | | |
| Fund | | Temporary
Expense Cap | | | Temporary
Expense Cap
Expiration Date | | | Permanent
Expense Cap | |
Symphony Credit Opportunities | | | .85 | % | | | January 31, 2014 | | | | 1.35 | % |
Symphony Floating Rate Income | | | .85 | | | | January 31, 2014 | | | | 1.10 | |
Symphony High Yield Bond | | | .85 | | | | January 31, 2015 | | | | N/A | |
The Adviser may also voluntarily reimburse additional expenses from time to time in any of the Funds. Voluntary reimbursements may be terminated at any time at the Adviser’s discretion.
The Trust pays no compensation directly to those of its trustees who are affiliated with the Adviser or to its officers, all of whom receive remuneration for their services to the Trust from the Adviser or its affiliates. The Board of Trustees has adopted a deferred compensation plan for independent trustees that enables trustees to elect to defer receipt of all or a portion of the annual compensation they are entitled to receive from certain Nuveen-advised funds. Under the plan, deferred amounts are treated as though equal dollar amounts had been invested in shares of select Nuveen-advised funds.
During the six months ended March 31, 2013, Nuveen Securities, LLC (the “Distributor”), a wholly-owned subsidiary of Nuveen, collected sales charges on purchases of Class A Shares, the majority of which were paid out as concessions to financial intermediaries as follows:
| | | | | | | | | | | | |
| | | Symphony
Credit
Opportunities | | | Symphony
Floating Rate
Income | | | Symphony
High Yield
Bond | |
Sales charges collected | | $ | 288,966 | | | $ | 54,895 | | | $ | — | |
Paid to financial intermediaries | | | 265,287 | | | | 50,245 | | | | — | |
The Distributor also received 12b-1 service fees on Class A Shares, substantially all of which were paid to compensate financial intermediaries for providing services to shareholders relating to their investments.
Notes to Financial Statements (Unaudited) (continued)
During the six months ended March 31, 2013, the Distributor compensated financial intermediaries directly with commission advances at the time of purchase as follows:
| | | | | | | | | | | | |
| | | Symphony
Credit
Opportunities | | | Symphony
Floating Rate
Income | | | Symphony
High Yield
Bond | |
Commission advances | | $ | 244,986 | | | $ | 28,626 | | | $ | — | |
To compensate for commissions advanced to financial intermediaries and all 12b-1 service and distribution fees collected on Class C Shares during the first year following a purchase are retained by the Distributor. During the six months ended March 31, 2013, the Distributor retained such 12b-1 fees as follows:
| | | | | | | | | | | | |
| | | Symphony
Credit
Opportunities | | | Symphony
Floating Rate
Income | | | Symphony
High Yield
Bond | |
12b-1 fees retained | | $ | 163,766 | | | $ | 4,199 | | | $ | 158 | |
The remaining 12b-1 fees charged to the Funds were paid to compensate financial intermediaries for providing services to shareholders relating to their investments.
The Distributor also collected and retained CDSC on share redemptions during the six months ended March 31, 2013, as follows:
| | | | | | | | | | | | |
| | | Symphony
Credit
Opportunities | | | Symphony
Floating Rate
Income | | | Symphony
High Yield
Bond | |
CDSC retained | | $ | 18,467 | | | $ | 322 | | | $ | — | |
As of March 31, 2013, Nuveen owned shares of the Funds as follows:
| | | | | | | | | | | | |
| | | Symphony
Credit
Opportunities | | | Symphony
Floating Rate
Income | | | Symphony
High Yield
Bond | |
Class A Shares | | | — | | | | — | | | | 2,500 | |
Class C Shares | | | — | | | | — | | | | 2,500 | |
Class I Shares | | | — | | | | 360,725 | | | | 245,000 | |
8. Senior Loan Commitments
Unfunded Commitments
Pursuant to the terms of certain of the variable rate senior loan agreements, the Funds may have unfunded senior loan commitments. Each Fund will maintain with the custodian, cash, liquid securities and/or liquid senior loans having an aggregate value at least equal to the amount of unfunded senior loan commitments. As of March 31, 2013, Symphony Floating Rate Income had unfunded senior loan commitments of $250,000. There were no such outstanding senior loan commitments in Symphony Credit Opportunities or Symphony High Yield Bond.
Participation Commitments
With respect to the senior loans held in each Fund’s portfolio, the Funds may: 1) invest in assignments; 2) act as a participant in primary lending syndicates; or 3) invest in participations. If a Fund purchases a participation of a senior loan interest, the Fund would typically enter into a contractual agreement with the lender or other third party selling the participation, rather than directly with the borrower. As such, the Fund not only assumes the credit risk of the borrower, but also that of the selling participant or other persons interpositioned between the Fund and the borrower. As of March 31, 2013, Symphony Floating Rate Income had outstanding participation commitments of $500,000. There were no such outstanding participation commitments in Symphony Credit Opportunities or Symphony High Yield Bond.
9. New Accounting Pronouncements
Financial Accounting Standards Board (“FASB”) Balance Sheet (Topic 210): Disclosures about Offsetting Assets and Liabilities
In January 2013, Accounting Standards Update (“ASU”) 2013-01, Clarifying the Scope of Disclosures about Offsetting Assets and Liabilities, replaced ASU 2011-11, Disclosures about Offsetting Assets and Liabilities. ASU 2013-01 is effective for fiscal years beginning on or after January 1, 2013. ASU 2011-11 was intended to enhance disclosure requirements on the offsetting of financial assets and liabilities. ASU 2013-01 limits the scope of the new balance sheet offsetting disclosures to derivatives, repurchase agreements and securities lending transactions to the extent that they are (1) offset in the financial statements or (2) subject to an enforceable master netting arrangement or similar agreement. Management is currently evaluating the application of ASU 2013-01 and its impact to the financial statements and footnote disclosures, if any.
Annual Investment Management Agreement Approval Process
(Unaudited)
The Board of Trustees (each, a “Board” and each Trustee, a “Board Member”) of the Funds, including the Board Members who are not parties to the Funds’ advisory or sub-advisory agreements or “interested persons” of any such parties (the “Independent Board Members”), is responsible for approving the advisory agreements (each, an “Investment Management Agreement”) between each Fund and Nuveen Fund Advisors, LLC (formerly known as Nuveen Fund Advisors, Inc.) (the “Advisor”) and the sub-advisory agreements (each, a “Sub-Advisory Agreement”) between the Advisor and Symphony Asset Management LLC (the “Sub-Advisor”) (the Investment Management Agreements and the Sub-Advisory Agreements are referred to collectively as the “Advisory Agreements”) and their periodic continuation. Pursuant to the Investment Company Act of 1940, as amended (the “1940 Act”), after an initial term of up to two years, the Board is required to consider the continuation of the Advisory Agreements on an annual basis. Accordingly, at an in-person meeting held on May 21-23, 2012 (the “May Meeting”), the Board, including a majority of the Independent Board Members, considered and approved the continuation of the Advisory Agreements for the Nuveen Symphony Credit Opportunities Fund (the “Credit Opportunities Fund”) and the Nuveen Symphony Floating Rate Income Fund (the “Floating Rate Income Fund”) for an additional one-year period.
The Nuveen Symphony High Yield Bond Fund (the “High Yield Bond Fund”) is new. The initial advisory agreement between the Advisor and such Fund and the initial sub-advisory agreement between the Advisor and the Sub-Advisor, on behalf of such Fund, were approved separately at a meeting of the Board of such Fund held on November 12-14, 2012.
The discussion of the approvals for the Credit Opportunities Fund and the Floating Rate Income Fund is set forth in Section I, followed by the discussion in Section II of the approvals for the High Yield Bond Fund.
I.
Nuveen Symphony Credit Opportunities Fund
Nuveen Symphony Floating Rate Income Fund
With respect to the funds listed immediately above (for purposes of this Section I, the “Funds”), in preparation for its considerations at the May Meeting, the Board requested and received extensive materials prepared in connection with the review of the Funds’ Advisory Agreements. The materials provided a broad range of information regarding the Funds, the Advisor and the Sub-Advisor (for purposes of this Section I, the Advisor and the Sub-Advisor are collectively, the “Fund Advisers” and each, a “Fund Adviser”). As described in more detail below, the information provided included, among other things, a review of Fund performance, including Fund investment performance assessments against peer groups and appropriate benchmarks, a comparison of Fund fees and expenses relative to peers, a description and assessment of shareholder service levels for the Funds, a summary of the performance of certain service providers, a review of product initiatives and shareholder communications and an analysis of the Advisor’s profitability with comparisons to comparable peers in the managed fund business. As part of its annual review, the Board also held a separate meeting on April 18-19, 2012, to review the Funds’ investment performance and consider an analysis provided by the Advisor of the Sub-Advisor which generally evaluated the Sub-Advisor’s investment team, investment mandate, organizational structure and history, investment philosophy and process, performance of the applicable Fund, and significant changes to the foregoing. As a result of its review of the materials and discussions, the Board presented the Advisor with questions and the Advisor responded.
The materials and information prepared in connection with the annual review of the Advisory Agreements supplement the information and analysis provided to the Board during the year. In this regard, throughout the year, the Board, acting directly or through its committees, regularly reviews the performance and various services provided by the Advisor and the Sub-Advisor. The Board meets at least quarterly as well as at other times as the need arises. At its quarterly meetings, the Board reviews reports by the Advisor which include, among other things, Fund performance, a review of the investment teams and reports on compliance, regulatory matters and risk management. The Board also meets with key investment personnel managing the Fund portfolios during the year. In October 2011, the Board also created two new standing committees (the Open-end Fund Committee and the Closed-end Fund Committee) to assist the full Board in monitoring and gaining a deeper insight into the distinctive issues and business practices of open-end and closed-end funds.
In addition, the Board continues its program of seeking to have the Board Members or a subset thereof visit each sub-advisor to the Nuveen funds at least once over a multiple year rotation, meeting with key investment and business personnel. In this regard, the Independent Board Members attended a presentation by the Sub-Advisor in February 2011. Further, an ad hoc committee of the Board visited the then-current transfer agents of the Nuveen funds in 2011 and the audit committee of the Board visited the various pricing agents for the Nuveen funds in January 2012.
The Board considers factors and information that are relevant to its annual consideration of the renewal of the Advisory Agreements at the meetings held throughout the year. Accordingly, the Board considers the information provided and knowledge gained at these meetings when performing its annual review of the Advisory Agreements. The Independent Board Members are assisted throughout the process by independent legal counsel who provided materials describing applicable law and the duties of directors or trustees in reviewing advisory contracts and met with the Independent Board Members in executive sessions without management present. In addition, it is important to recognize that the management arrangements for the Nuveen funds are the result of many years of review and discussion between the Independent Board Members and fund management and that the Board Members’ conclusions may be based, in part, on their consideration of fee arrangements and other factors developed in previous years.
Annual Investment Management Agreement Approval Process
(Unaudited) (continued)
The Board considered all factors it believed relevant with respect to each Fund, including among other factors: (a) the nature, extent and quality of the services provided by the Fund Advisers, (b) the investment performance of the Fund and Fund Advisers, (c) the advisory fees and costs of the services to be provided to the Fund and the profitability of the Fund Advisers, (d) the extent of any economies of scale, (e) any benefits derived by the Fund Advisers from the relationship with the Fund and (f) other factors. Each Board Member may have accorded different weight to the various factors in reaching his or her conclusions with respect to a Fund’s Advisory Agreements. The Independent Board Members did not identify any single factor as all important or controlling. The Independent Board Members’ considerations were instead based on a comprehensive consideration of all the information presented. The principal factors considered by the Board and its conclusions are described below.
A. Nature, Extent and Quality of Services
In considering renewal of the Advisory Agreements, the Independent Board Members considered the nature, extent and quality of the Fund Adviser’s services, including advisory services and the resulting Fund performance and administrative services. The Independent Board Members further considered the overall reputation and capabilities of the Advisor and its affiliates, the commitment of the Advisor to provide high quality service to the Funds, their overall confidence in the Advisor’s integrity and the Advisor’s responsiveness to questions and concerns raised by them. The Independent Board Members reviewed materials outlining, among other things, the Fund Adviser’s organization and business; the types of services that the Fund Adviser or its affiliates provide to the Funds; the performance record of the applicable Fund (as described in further detail below); and any initiatives Nuveen had taken for the applicable fund product line.
In considering advisory services, the Board recognized that the Advisor provides various oversight, administrative, compliance and other services for the Funds and the Sub-Advisor generally provides the portfolio investment management services to the Funds. In reviewing the portfolio management services provided to each Fund, the Board reviewed the materials provided by the Nuveen Investment Services Oversight Team analyzing, among other things, the Sub-Advisor’s investment team and changes thereto, organization and history, assets under management, Fund objectives and mandate, the investment team’s philosophy and strategies in managing the Fund, developments affecting the Sub-Advisor or Fund and Fund performance. The Independent Board Members also reviewed portfolio manager compensation arrangements to evaluate each Fund Adviser’s ability to attract and retain high quality investment personnel, preserve stability, and reward performance but not provide an inappropriate incentive to take undue risks. In addition, the Board considered the Advisor’s execution of its oversight responsibilities over the Sub-Advisor. Given the importance of compliance, the Independent Board Members also considered Nuveen’s compliance program, including the report of the chief compliance officer regarding the Funds’ compliance policies and procedures; the resources dedicated to compliance; and the record of compliance with the policies and procedures.
In addition to advisory services, the Board considered the quality and extent of administrative and other non-investment advisory services the Advisor and its affiliates provide to the Funds, including product management, investment services (such as oversight of investment policies and procedures, risk management, and pricing), fund administration, oversight of service providers, shareholder services and communications, administration of Board relations, regulatory and portfolio compliance and legal support. The Board further recognized Nuveen’s additional investments in personnel, including in compliance and risk management. In reviewing the services provided, the Board also reviewed materials describing various notable initiatives and projects the Advisor performed in connection with the open-end fund product line. These initiatives included efforts to eliminate product overlap through mergers or liquidations; commencement of various new funds; elimination of insurance mandates for various funds; updates in investment policies or guidelines for several funds; and reductions in management fees and expense caps for certain funds.
Based on their review, the Independent Board Members found that, overall, the nature, extent and quality of services provided to the respective Funds under each applicable Advisory Agreement were satisfactory.
B. The Investment Performance of the Funds and Fund Advisers
The Board, including the Independent Board Members, reviewed and considered the performance history of each Fund over various time periods. The Board reviewed, among other things, each Fund’s historic investment performance as well as information comparing the Fund’s performance information with that of other funds (the “Performance Peer Group”) based on data compiled by Nuveen that was provided by an independent provider of mutual fund data and with recognized and/or customized benchmarks (i.e., benchmarks derived from multiple recognized benchmarks).
The Board reviewed reports, including a comprehensive analysis of the Funds’ performance and the applicable investment team. In this regard, the Board reviewed each Fund’s total return information compared to the returns of its Performance Peer Group and recognized and/or customized benchmarks for the quarter and one-year periods ending December 31, 2011, as well as performance information reflecting the first quarter of 2012 (or for the periods available for the Floating Rate Income Fund, which did not exist for part of the foregoing time frame).
In reviewing performance comparison information, the Independent Board Members recognized that the usefulness of the comparisons of the performance of certain funds with the performance of their respective Performance Peer Group may be limited because the Performance Peer Group may not adequately represent the objectives and strategies of the applicable funds or may be limited in size or number. The Independent Board Members also noted that the investment experience of a particular shareholder in
the Nuveen funds will vary depending on when such shareholder invests in the applicable fund, the class held (if multiple classes are offered in a fund) and the performance of the fund (or respective class) during that shareholder’s investment period. In addition, although the performance below reflects the performance results for the time periods ending as of the most recent calendar year end (unless otherwise indicated), the Board also recognized that selecting a different ending time period may derive different results. Furthermore, while the Board is cognizant of the relevant performance of a fund’s peer set and/or benchmark(s), the Board evaluated fund performance in light of the respective fund’s investment objectives, investment parameters and guidelines and recognized that the objectives, investment parameters and guidelines of peers and/or benchmarks may differ to some extent, thereby resulting in differences in performance results. Nevertheless, with respect to any Nuveen funds that the Board considers to have underperformed their peers and/or benchmarks from time to time, the Board monitors such funds closely and considers any steps necessary or appropriate to address such issues.
In considering the results of the comparisons for the Funds, the Independent Board Members observed, among other things, that the Funds were relatively new with a shorter performance history available, thereby limiting the ability to make a meaningful assessment of performance. Nonetheless, based on their review, the Independent Board Members determined that the Funds’ investment performance had been satisfactory.
C. Fees, Expenses and Profitability
1. Fees and Expenses
The Board evaluated the management fees and expenses of each Fund reviewing, among other things, such Fund’s gross management fees, net management fees and net expense ratios in absolute terms as well as compared to the fee and expenses of a comparable universe of funds provided by an independent fund data provider (the “Peer Universe”) and to a more focused subset of funds in the Peer Universe (the “Peer Group”) and any expense limitations.
The Independent Board Members further reviewed the methodology regarding the construction of the applicable Peer Universe and Peer Group. In reviewing the comparisons of fee and expense information, the Independent Board Members took into account that in certain instances various factors such as: the limited size and particular composition of the Peer Universe or Peer Group (including the inclusion of other Nuveen funds in the peer set); expense anomalies; changes in the funds comprising the Peer Universe or Peer Group from year to year; levels of reimbursement or fee waivers; and the timing of information used may impact the comparative data, thereby limiting somewhat the ability to make a meaningful comparison with peers.
In reviewing the fee schedule for a Fund, the Independent Board Members also considered the fund-level and complex-wide breakpoint schedules (described in further detail below) and any fee waivers and reimbursements provided by Nuveen. In reviewing fees and expenses, the Board considered the expenses and fees to be higher if they were over 10 basis points higher, slightly higher if they were approximately 6 to 10 basis points higher, in line if they were within approximately 5 basis points higher than the peer average and below if they were below the peer average of the Peer Group. In reviewing the reports, the Board noted that the overwhelming majority of the Nuveen funds were at, close to or below their Peer Group or Peer Universe (if no separate Peer Group) average based on the net total expense ratio.
The Independent Board Members observed that the Funds had net management fees and net expense ratios (including fee waivers and expense reimbursements, if any) below their respective peer averages.
Based on their review of the fee and expense information provided, the Independent Board Members determined that each Fund’s management fees were reasonable in light of the nature, extent and quality of services provided to the Fund.
2. Comparisons with the Fees of Other Clients
The Independent Board Members further reviewed information regarding the nature of services and range of fees offered by the Advisor to other clients, including separately managed accounts (both retail and institutional accounts), collective trusts, foreign investment funds offered by Nuveen and funds that are not offered by Nuveen but are sub-advised by one of Nuveen’s investment management teams. In evaluating the comparisons of fees, the Independent Board Members noted that the fee rates charged to the Funds and other clients vary, among other things, because of the different services involved and the additional regulatory and compliance requirements associated with registered investment companies, such as the Funds. Accordingly, the Independent Board Members considered the differences in the product types, including, but not limited to, the services provided, the structure and operations, product distribution and costs thereof, portfolio investment policies, investor profiles, account sizes and regulatory requirements. The Independent Board Members noted, in particular, that the range of services provided to the Funds (as discussed above) is much more extensive than that provided to separately managed accounts. Given the inherent differences in the various products, particularly the extensive services provided to the Funds, the Independent Board Members believe such facts justify the different levels of fees.
In considering the fees of the Sub-Advisor, the Independent Board Members also considered the pricing schedule or fees that the Sub-Advisor charges for similar investment management services for other Nuveen funds, funds of other sponsors (if any), and other clients (such as retail and/or institutional managed accounts), as applicable. The Independent Board Members also reviewed the fees that the Sub-Advisor assesses for equity and taxable fixed-income hedge funds it manages, which include a performance fee.
Annual Investment Management Agreement Approval Process
(Unaudited) (continued)
3. Profitability of Fund Advisers
In conjunction with their review of fees, the Independent Board Members also considered the profitability of Nuveen for its advisory activities and its financial condition. The Independent Board Members reviewed the revenues and expenses of Nuveen’s advisory activities for the last two calendar years, the allocation methodology used in preparing the profitability data and an analysis of the key drivers behind the changes in revenues and expenses that impacted profitability in 2011. The Independent Board Members noted this information supplemented the profitability information requested and received during the year to help keep them apprised of developments affecting profitability (such as changes in fee waivers and expense reimbursement commitments). In this regard, the Independent Board Members noted that they have an Independent Board Member serve as a point person to review and keep them apprised of changes to the profitability analysis and/or methodologies during the year. The Independent Board Members also considered Nuveen’s revenues for advisory activities, expenses, and profit margin compared to that of various unaffiliated management firms with comparable assets under management (based on asset size and asset composition).
In reviewing profitability, the Independent Board Members recognized the Advisor’s continued investment in its business to enhance its services, including capital improvements to investment technology, updated compliance systems, and additional personnel in compliance, risk management, and product development as well as its ability to allocate resources to various areas of the Advisor as the need arises. In addition, in evaluating profitability, the Independent Board Members also recognized the subjective nature of determining profitability which may be affected by numerous factors including the allocation of expenses. Further, the Independent Board Members recognized the difficulties in making comparisons as the profitability of other advisers generally is not publicly available and the profitability information that is available for certain advisers or management firms may not be representative of the industry and may be affected by, among other things, the adviser’s particular business mix, capital costs, types of funds managed and expense allocations. Notwithstanding the foregoing, the Independent Board Members reviewed Nuveen’s methodology and assumptions for allocating expenses across product lines to determine profitability. In reviewing profitability, the Independent Board Members recognized Nuveen’s investment in its fund business. Based on their review, the Independent Board Members concluded that the Advisor’s level of profitability for its advisory activities was reasonable in light of the services provided.
With respect to sub-advisers affiliated with Nuveen, including the Sub-Advisor, the Independent Board Members reviewed the sub-adviser’s revenues, expenses and profitability margins (pre- and post-tax) for its advisory activities and the methodology used for allocating expenses among the internal sub-advisers. Based on their review, the Independent Board Members were satisfied that the Sub-Advisor’s level of profitability was reasonable in light of the services provided.
In evaluating the reasonableness of the compensation, the Independent Board Members also considered other amounts paid to a Fund Adviser by the Funds as well as any indirect benefits (such as soft dollar arrangements, if any) the Fund Adviser and its affiliates receive, or are expected to receive, that are directly attributable to the management of the Funds, if any. See Section E below for additional information on indirect benefits a Fund Adviser may receive as a result of its relationship with the Funds. Based on their review of the overall fee arrangements of each Fund, the Independent Board Members determined that the advisory fees and expenses of the respective Fund were reasonable.
D. Economies of Scale and Whether Fee Levels Reflect These Economies of Scale
With respect to economies of scale, the Independent Board Members have recognized the potential benefits resulting from the costs of a fund being spread over a larger asset base, although economies of scale are difficult to measure and predict with precision, particularly on a fund-by-fund basis. One method to help ensure the shareholders share in these benefits is to include breakpoints in the advisory fee schedule. Generally, management fees for funds in the Nuveen complex are comprised of a fund-level component and a complex-level component, subject to certain exceptions. Accordingly, the Independent Board Members reviewed and considered the applicable fund-level breakpoints in the advisory fee schedules that reduce advisory fees as asset levels increase.
In addition to fund-level advisory fee breakpoints, the Board also considered the Funds’ complex-wide fee arrangement. Pursuant to the complex-wide fee arrangement, the fees of the funds in the Nuveen complex are generally reduced as the assets in the fund complex reach certain levels. The complex-wide fee arrangement seeks to provide the benefits of economies of scale to fund shareholders when total fund complex assets increase, even if assets of a particular fund are unchanged or have decreased. The approach reflects the notion that some of Nuveen’s costs are attributable to services provided to all its funds in the complex and therefore all funds benefit if these costs are spread over a larger asset base. In addition, with the acquisition of the funds previously advised by FAF Advisors, Inc., the Board noted that a portion of such funds’ assets at the time of acquisition were deemed eligible to be included in the complex-wide fee calculation in order to deliver fee savings to shareholders in the combined complex and such funds were subject to differing complex-level fee rates.
Based on their review, the Independent Board Members concluded that the breakpoint schedules and complex-wide fee arrangement were acceptable and reflect economies of scale to be shared with shareholders when assets under management increase.
E. Indirect Benefits
In evaluating fees, the Independent Board Members received and considered information regarding potential “fall out” or ancillary benefits the respective Fund Adviser or its affiliates may receive as a result of its relationship with each Fund. In this regard, the
Independent Board Members considered, among other things, any sales charges, distribution fees and shareholder services fees received and retained by the Funds’ principal underwriter, an affiliate of the Advisor, which includes fees received pursuant to any 12b-1 plan. The Independent Board Members, therefore, considered the 12b-1 fees retained by Nuveen during the last calendar year.
In addition to the above, the Independent Board Members considered whether the Fund Advisers received any benefits from soft dollar arrangements whereby a portion of the commissions paid by a Fund for brokerage may be used to acquire research that may be useful to the Fund Adviser in managing the assets of the Funds and other clients. The Independent Board Members recognized that the Advisor has the authority to pay a higher commission in return for brokerage and research services if it determines in good faith that the commission paid is reasonable in relation to the value of the brokerage and research services provided and may benefit from such soft dollar arrangements. Similarly, the Board recognized that the research received pursuant to soft dollar arrangements by the Advisor may also benefit a Fund and shareholders to the extent the research enhances the ability of the Advisor to manage the Fund. The Independent Board Members noted that the Advisor’s profitability may be somewhat lower if it did not receive the research services pursuant to the soft dollar arrangements and had to acquire such services directly. In addition, the Board considered that the Sub-Advisor currently does not enter into soft dollar arrangements; however, it has adopted a soft dollar policy in the event it does so in the future.
Based on their review, the Independent Board Members concluded that any indirect benefits received by a Fund Adviser as a result of its relationship with the Funds were reasonable and within acceptable parameters.
F. Other Considerations
The Independent Board Members did not identify any single factor discussed previously as all-important or controlling. The Board Members, including the Independent Board Members, unanimously concluded that the terms of each Advisory Agreement are fair and reasonable, that the respective Fund Adviser’s fees are reasonable in light of the services provided to each Fund and that the Funds’ Advisory Agreements be renewed.
II.
Nuveen Symphony High Yield Bond Fund
The Board is responsible for approving advisory arrangements for the fund listed immediately above (for purposes of this Section II, the “Fund”) and, at a meeting held on November 12-14, 2012 (for purposes of this Section II, the “Meeting”), was asked to approve the advisory arrangements for the Fund. At the Meeting, the Board Members, including the Independent Board Members, considered and approved the investment management agreement (for purposes of this Section II, the “Investment Management Agreement”) between the Fund and the Advisor, and the investment sub-advisory agreement (for purposes of this Section II, the “Sub-Advisory Agreement”) between the Advisor and the Sub-Advisor, on behalf of the Fund. For purposes of this Section II, the Advisor and the Sub-Advisor are each hereafter a “Fund Adviser” and the Investment Management Agreement and the Sub-Advisory Agreement are each hereafter an “Advisory Agreement.”
To assist the Board in its evaluation of an Advisory Agreement with a Fund Adviser at the Meeting, the Independent Board Members had received, in adequate time in advance of the Meeting or at prior meetings, materials which outlined, among other things:
| | • | | the nature, extent and quality of services expected to be provided by the Fund Adviser; |
| | • | | the organization of the Fund Adviser, including the responsibilities of various departments and key personnel; |
| | • | | the expertise and background of the Fund Adviser with respect to the Fund’s investment strategy; |
| | • | | certain performance-related information (as described below); |
| | • | | the profitability of Nuveen Investments, Inc. (“Nuveen”); |
| | • | | the proposed management fees of the Fund Adviser, including comparisons of such fees with the management fees of comparable funds; |
| | • | | the expected expenses of the Fund, including comparisons of the Fund’s expected expense ratio with the expense ratios of comparable funds; and |
| | • | | the soft dollar practices of the Fund Adviser, if any. |
At the Meeting, the Advisor made a presentation to and responded to questions from the Board. During the Meeting, the Independent Board Members also met privately with their legal counsel to review the Board’s duties under the 1940 Act, the general principles of state law in reviewing and approving advisory contracts, the standards used by courts in determining whether investment company boards of directors have fulfilled their duties, factors to be considered in voting on advisory contracts and an adviser’s fiduciary duty with respect to advisory agreements and compensation. It is with this background that the Independent Board Members considered the Advisory Agreements. As outlined in more detail below, the Independent Board Members considered all factors they
Annual Investment Management Agreement Approval Process
(Unaudited) (continued)
believed relevant with respect to the Fund, including the following: (a) the nature, extent and quality of the services to be provided by the Fund Advisers; (b) investment performance, as described below; (c) the advisory fees and costs of the services to be provided to the Fund and the profitability of the Fund Advisers; (d) the extent of any anticipated economies of scale; (e) any benefits expected to be derived by the Fund Advisers from their relationships with the Fund; and (f) other factors. Each Board Member may have accorded different weight to the various factors in reaching his or her conclusions with respect to the Fund’s Advisory Agreements.
A. Nature, Extent and Quality of Services
The Independent Board Members considered the nature, extent and quality of the respective Fund Adviser’s services, including advisory services and administrative services. As the Advisor and the Sub-Advisor already serve as adviser and sub-adviser, respectively, to other Nuveen funds overseen by the Board Members, the Board has a good understanding of each Fund Adviser’s organization, operations and personnel. As the Independent Board Members meet regularly throughout the year to oversee the Nuveen funds, including funds currently advised by the Fund Advisers, the Independent Board Members have relied upon their knowledge from their meetings and any other interactions throughout the year of the respective Fund Adviser and its services in evaluating the Advisory Agreements.
At the Meeting and at prior meetings, the Independent Board Members reviewed materials outlining, among other things, the respective Fund Adviser’s organization and business; the types of services that such Fund Adviser or its affiliates provide to the Nuveen funds and are expected to provide to the Fund; and the experience of the respective Fund Adviser with applicable investment strategies. Further, the Independent Board Members have evaluated the background and experience of the Fund Adviser’s investment personnel.
In addition to advisory services, the Independent Board Members have considered the quality and extent of administrative and other non-investment advisory services to be provided. In this regard, the Advisor is expected to provide the Fund with such administrative and other services (exclusive of, and in addition to, any such services provided by others for the Fund) and officers and other personnel as are necessary for the operations of the Fund. In addition to investment management services, the Advisor and its affiliates will provide the Fund with a wide range of services, including, among other things, product management, investment services (such as oversight of investment policies and procedures, risk management, and pricing), fund administration, oversight of service providers, shareholder services and communications, administration of Board relations, regulatory and portfolio compliance and legal support. The Independent Board Members also recognized that the Advisor would oversee the Sub-Advisor.
In evaluating the services of the Sub-Advisor, the Independent Board Members noted that the Sub-Advisor was generally expected to supply portfolio investment management services to the Fund. In addition, the Board Members recognized the Sub-Advisor’s experience and investment process.
Based on their review, the Independent Board Members found that, overall, the nature, extent and quality of services expected to be provided to the Fund under each Advisory Agreement were satisfactory.
B. Investment Performance
The Fund was new and therefore did not have its own performance history. However, the Independent Board Members are familiar with the performance records of other Nuveen funds advised by the Advisor and sub-advised by the Sub-Advisor.
The Independent Board Members recognized that the portfolio managers who were expected to manage the Fund had managed the Credit Opportunities Fund since its inception in April 2010 and that they also managed the Symphony Long-Short Credit Strategy in connection with a private fund (the “Private Fund”). In that regard, the Independent Board Members reviewed certain performance information relating to the Credit Opportunities Fund and the Private Fund, including trailing gross returns for the year-to-date, one-year and since May 2010 periods for the Credit Opportunities Fund and the year-to-date, one-year, three-year, five-year, ten-year, since May 2010 and since October 1999 periods for the Private Fund, as well as calendar year gross returns for 2011 for the Credit Opportunities Fund and for 2002 thru 2011 for the Private Fund.
C. Fees, Expenses and Profitability
1. Fees and Expenses
In evaluating the management fees and expenses that the Fund was expected to bear, the Independent Board Members considered, among other things, the Fund’s proposed management fee structure, the rationale for its proposed fee levels, and its expected expense ratio in absolute terms as well as compared with the fees and expense ratios of comparable funds. In this regard, the Independent Board Members reviewed, among other things, comparative data pertaining to the expense ratios and management fees of the funds comprising the Lipper high yield funds category. Further, the Independent Board Members recognized the Sub-Advisor’s taxable fixed income expertise and reputation and noted that the proposed management fees were consistent with those of other existing comparable funds managed by the Sub-Advisor, including the Credit Opportunities Fund and the Floating Rate Income Fund.
In addition, the Independent Board Members considered the fund-level breakpoint schedule and the complex-wide breakpoint schedule (described in further detail below) and any applicable fee waivers and expense reimbursements expected to be provided. Based on their review of the fee and expense information provided, the Independent Board Members determined that the Fund’s management fees were reasonable in light of the nature, extent and quality of services to be provided to it.
2. Comparisons with the Fees of Other Clients
Due to their experience with other Nuveen funds, the Board Members were familiar with the nature of services and range of fees offered by the Advisor to other clients. Such other clients include separately managed accounts (both retail and institutional accounts), collective trusts, foreign investment funds offered by Nuveen and funds that are not offered by Nuveen but are sub-advised by one of Nuveen’s investment management teams. In evaluating the comparisons of fees, the Independent Board Members have noted, at the Meeting or at prior meetings, that the fee rates charged to a fund (such as the Fund) and charged to other clients vary, among other things, because of the different services involved and the additional regulatory and compliance requirements associated with registered investment companies, such as the Fund. Accordingly, the Independent Board Members have considered the differences in the product types, including, but not limited to, the services to be provided, the structure and operations, product distribution and costs thereof, portfolio investment policies, investor profiles, account sizes and regulatory requirements. The Independent Board Members have noted, in particular, that the range of services as described above to be provided to a fund (such as the Fund) is much more extensive than that provided to separately managed accounts. Given the inherent differences in the various products, particularly the extensive services to be provided to the Fund, the Independent Board Members believe such facts justify the different levels of fees.
In considering the fees of the Sub-Advisor, the Independent Board Members are familiar with the pricing schedule or fees that the Sub-Advisor charges for similar investment management services for other Nuveen funds, funds of other sponsors (if any), and other clients (such as retail and/or institutional managed accounts), as applicable. The Independent Board Members have also reviewed the fees that the Sub-Advisor assesses for equity and taxable fixed-income hedge funds it manages, which include a performance fee.
3. Profitability of Fund Advisers
In conjunction with their review of fees at prior meetings, the Independent Board Members have considered the profitability of Nuveen for its advisory activities and its financial condition. At the Meeting or prior meetings, the Independent Board Members reviewed the revenues and expenses of Nuveen’s advisory activities, the allocation methodology used in preparing the profitability data and an analysis of the key drivers behind the changes in revenues and expenses that impacted profitability. They also reviewed certain financial information included in reports dated October 12, 2012 and August 14, 2012, and Nuveen’s June 30, 2012 consolidated financial statements. The Independent Board Members have also considered, at the Meeting or at prior meetings, Nuveen’s revenues for advisory activities, expenses, and profit margin compared to that of various unaffiliated management firms with comparable assets under management (based on asset size and asset composition).
In reviewing profitability, the Independent Board Members have recognized the Advisor’s continued investment in its business to enhance its services, including capital improvements to investment technology, updated compliance systems, and additional personnel in compliance, risk management, and product development as well as its ability to allocate resources to various areas of the Advisor as the need arises. In addition, in evaluating profitability, the Independent Board Members have also recognized the subjective nature of determining profitability which may be affected by numerous factors, including the allocation of expenses. Further, the Independent Board Members have recognized the difficulties in making comparisons as the profitability of other advisers generally is not publicly available and the profitability information that is available for certain advisers or management firms may not be representative of the industry and may be affected by, among other things, the adviser’s particular business mix, capital costs, types of funds managed and expense allocations. Notwithstanding the foregoing, the Independent Board Members have reviewed Nuveen’s methodology and assumptions for allocating expenses across product lines to determine profitability. In reviewing profitability, the Independent Board Members have recognized Nuveen’s investment in its fund business. Based on their review, the Independent Board Members concluded that the Advisor’s level of profitability for its advisory activities was reasonable in light of the services to be provided.
With respect to sub-advisers that are affiliated with Nuveen, including the Sub-Advisor, the Independent Board Members have previously reviewed such sub-advisers’ revenues, expenses and profitability margins (pre- and post-tax) for their advisory activities and the methodology used for allocating expenses among the internal sub-advisers. Based on their review, the Independent Board Members were satisfied that the Sub-Advisor’s level of profitability was reasonable in light of the services to be provided to the Fund.
In evaluating the reasonableness of the compensation, the Independent Board Members also considered any other amounts expected to be paid to a Fund Adviser by the Fund as well as any indirect benefits (such as soft dollar arrangements, if any) the respective Fund Adviser and its affiliates are expected to receive that are directly attributable to the management of the Fund, if any. See Section E below for additional information on indirect benefits a Fund Adviser may receive as a result of its relationship with the Fund. Based on their review of the overall fee arrangements of the Fund, the Independent Board Members determined that the advisory fees and expected expenses of the Fund were reasonable.
D. Economies of Scale and Whether Fee Levels Reflect These Economies of Scale
With respect to economies of scale, the Independent Board Members have recognized the potential benefits resulting from the costs of a fund being spread over a larger asset base, although economies of scale are difficult to measure and predict with precision,
Annual Investment Management Agreement Approval Process
(Unaudited) (continued)
particularly on a fund-by-fund basis. The Independent Board Members therefore considered whether the Fund could be expected to benefit from any economies of scale. One method to help ensure that the shareholders share in these benefits is to include breakpoints in the advisory fee schedule. Generally, management fees for funds in the Nuveen complex are comprised of a fund-level component and a complex-level component. Accordingly, the Independent Board Members received and reviewed the schedule of proposed advisory fees for the Fund, including fund-level breakpoints thereto.
In addition to fund-level advisory fee breakpoints, the Board also considered the Fund’s complex-wide fee arrangement. Pursuant to the complex-wide fee arrangement, the fees of the funds in the Nuveen complex, including the Fund, are generally reduced as the assets in the fund complex reach certain levels. In evaluating the complex-wide fee arrangement, the Independent Board Members have considered that the complex-wide fee arrangement seeks to provide the benefits of economies of scale to fund shareholders when total fund complex assets increase, even if assets of a particular fund are unchanged or have decreased. The approach reflects the notion that some of Nuveen’s costs are attributable to services provided to all its funds in the complex and therefore all funds benefit if these costs are spread over a larger asset base.
Based on their review, the Independent Board Members concluded that the breakpoint schedules and complex-wide fee arrangement were acceptable and reflect economies of scale to be shared with the Fund’s shareholders when assets under management increase.
E. Indirect Benefits
In evaluating fees, the Independent Board Members also considered information regarding potential “fall out” or ancillary benefits that a Fund Adviser or its affiliates may receive as a result of its relationship with the Fund. In this regard, the Independent Board Members considered, among other things, any sales charges, distribution fees and shareholder services fees expected to be received and retained by the Fund’s principal underwriter, an affiliate of the Advisor, including fees to be received pursuant to any 12b-1 plan.
In addition to the above, the Independent Board Members considered whether the Fund Advisers will receive any benefits from soft dollar arrangements whereby a portion of the commissions paid by the Fund for brokerage may be used to acquire research that may be useful to a Fund Adviser in managing the assets of the Fund and other clients. The Independent Board Members recognized that the Advisor has the authority to pay a higher commission in return for brokerage and research services if it determines in good faith that the commission paid is reasonable in relation to the value of the brokerage and research services provided and may benefit from such soft dollar arrangements. Similarly, the Board recognized that the research received pursuant to soft dollar arrangements by the Advisor may also benefit the Fund and shareholders to the extent the research enhances the ability of the Advisor to manage the Fund. The Independent Board Members noted that the Advisor’s profitability may be somewhat lower if it did not receive the research services pursuant to the soft dollar arrangements and had to acquire such services directly. In addition, the Board considered that the Sub-Advisor currently does not enter into soft dollar arrangements; however, it has adopted a soft dollar policy in the event it does so in the future.
Based on their review, the Independent Board Members concluded that any indirect benefits expected to be received by a Fund Adviser as a result of its relationship with the Fund were reasonable and within acceptable parameters.
F. Approval
The Independent Board Members did not identify any single factor discussed previously as all-important or controlling. The Board Members, including a majority of the Independent Board Members, concluded that the terms of the Investment Management Agreement and Sub-Advisory Agreement were fair and reasonable, that the respective Fund Adviser’s fees are reasonable in light of the services to be provided to the Fund and that the Investment Management Agreement and Sub-Advisory Agreement should be and were approved on behalf of the Fund.
Notes
Notes
Notes
Glossary of Terms Used in this Report
Average Annual Total Return: This is a commonly used method to express an investment’s performance over a particular, usually multi-year time period. It expresses the return that would have been necessary each year to equal the investment’s actual cumulative performance (including change in NAV or offer price and reinvested dividends and capital gains distributions, if any) over the time period being considered.
BofA Merrill Lynch U.S. High Yield Master II Index: Tracks the performance of U.S. Dollar-denominated below investment grade corporate debt publicly issued in the U.S. domestic market. Index returns assume reinvestment of distributions, but do not reflect any applicable sales charges and management fee.
Credit Suisse Leveraged Loan Index: A representative, unmanaged index of tradeable, senior, U.S. dollar-denominated leveraged loans. Index returns assume reinvestment of distributions, but do not reflect any applicable sales charges or management fees.
Custom Benchmark Index: An index comprised 60% of the BofA Merrill Lynch U.S. High Yield Master II Index and 40% Credit Suisse Leveraged Loan Index. The BofA Merrill Lynch U.S. High Yield Master II Index tracks the performance of U.S. Dollar-denominated below investment grade corporate debt publicly issued in the U.S. domestic market. The Credit Suisse Leveraged Loan Index is a representative, unmanaged index of tradeable, senior, U.S. dollar-denominated leveraged loans. Index returns assume reinvestment of distributions, but do not reflect any applicable sales charges or management fees.
Gross Domestic Product (GDP): The total market value of all final goods and services produced in a country/region in a given year, equal to total consumer, investment and government spending, plus the value of exports, minus the value of imports.
Lipper High Yield Funds Classification Average: Represents the average annualized total return for all reporting funds in the Lipper High Yield Funds Classification. Lipper returns account for the effects of management fees and assume reinvestment of distributions, but do not reflect any applicable sales charges.
Lipper Loan Participation Funds Classification Average: Represents the average annualized total return for all reporting funds in the Lipper Loan Participation Funds Classification. Lipper returns account for the effects of management fees and assume reinvestment of distributions, but do not reflect any applicable sales charges.
Net Asset Value (NAV): The net market value of all securities held in a portfolio.
Net Asset Value (NAV) Per Share: The market value of one share of a mutual fund or closed-end fund. For a Fund, the NAV is calculated daily by taking the Fund’s total assets (securities, cash, and accrued earnings), subtracting the Fund’s liabilities, and dividing by the number of shares outstanding.
Zero Coupon Bond: A zero coupon bond does not pay a regular interest coupon to its holders during the life of the bond. Income to the holder of the bond comes from accretion of the difference between the original purchase price of the bond at issuance and the par value of the bond at maturity and is effectively paid at maturity. The market prices of zero coupon bonds generally are more volatile than the market prices of bonds that pay interest periodically.
Additional Fund Information
Fund Manager
Nuveen Fund Advisors, LLC
333 West Wacker Drive
Chicago, IL 60606
Sub-Adviser
Symphony Asset Management LLC
555 California Street
Rene Suite 2975
San Francisco, CA 94104
Legal Counsel
Chapman and Cutler LLP
Chicago, IL
Independent Registered Public Accounting Firm
PricewaterhouseCoopers LLP
Chicago, IL
Custodian
State Street Bank & Trust Company
Boston, MA
Transfer Agent and Shareholder Services
Boston Financial
Data Services, Inc.
Nuveen Investor Services
P.O. Box 8530
Boston, MA 02266-8530
(800) 257-8787
Quarterly Form N-Q Portfolio of Investments Information. Each Fund is required to file its complete schedule of portfolio holdings with the Securities and Exchange Commission (SEC) for the first and third quarters of each fiscal year on Form N-Q. You may obtain this information directly from the SEC. Visit the SEC on-line at http://www.sec.gov or in person at the SEC’s Public Reference Room in Washington, D.C. Call the SEC toll-free at (800) SEC-0330 for room hours and operation.
Nuveen Funds’ Proxy Voting Information. You may obtain (i) information regarding how each Fund voted proxies relating to portfolio securities held during the most recent twelve-month period ended June 30, and (ii) a description of the policies and procedures that each Fund used to determine how to vote proxies relating to portfolio securities without charge, upon request, by calling Nuveen Investments toll-free at (800) 257-8787 or on Nuveen’s website at www.nuveen.com. You may also obtain this information directly from the SEC. Visit the SEC on-line at http://www.sec.gov.
The Financial Industry Regulatory Authority (FINRA) provides a Public Disclosure Program which supplies certain information regarding the disciplinary history of FINRA members and their associated persons in response to either telephone inquiries at (800) 289-9999 or written inquiries at www.finra.org. FINRA also provides an investor brochure that includes information describing the Public Disclosure Program.
Nuveen Investments:
Serving Investors for Generations
Since 1898, financial advisors and their clients have relied on Nuveen Investments to provide dependable investment solutions through continued adherence to proven, long-term investing principles. Today, we offer a range of high quality equity and fixed-income solutions designed to be integral components of a well-diversified core portfolio.
Focused on meeting investor needs.
Nuveen Investments provides high-quality investment services designed to help secure the longterm goals of institutional and individual investors as well as the consultants and financial advisors who serve them. Nuveen Investments markets a wide range of specialized investment solutions which provide investors access to capabilities of its high-quality boutique investment affiliates–Nuveen Asset Management, Symphony Asset Management, NWQ Investment Management Company, Santa Barbara Asset Management, Tradewinds Global Investors, Winslow Capital Management, and Gresham Investment Management. In total, Nuveen Investments managed $224 billion as of March 31, 2013.
Find out how we can help you.
To learn more about how the products and services of Nuveen Investments may be able to help you meet your financial goals, talk to your financial advisor, or call us at (800) 257-8787. Please read the information provided carefully before you invest. Investors should consider the investment objective and policies, risk considerations, charges and expenses of any investment carefully. Where applicable, be sure to obtain a prospectus, which contains this and other relevant information. To obtain a prospectus, please contact your securities representative or Nuveen Investments, 333 W. Wacker Dr., Chicago, IL 60606. Please read the prospectus carefully before you invest or send money.
Learn more about Nuveen Funds at: www.nuveen.com/mf
| | |
Distributed by Nuveen Securities, LLC 333 West Wacker Drive Chicago, IL 60606 www.nuveen.com | | |
MSA-SCFR-0313P
Item 2. Code of Ethics.
Not applicable to this filing.
Item 3. Audit Committee Financial Expert.
Not applicable to this filing.
Item 4. Principal Accountant Fees and Services.
Not applicable to this filing.
Item 5. Audit Committee of Listed Registrants.
Not applicable to this registrant.
Item 6. Schedule of Investments.
(a) See Portfolio of Investments in Item 1.
(b) Not applicable.
Item 7. Disclosure of Proxy Voting Policies and Procedures for Closed-End Management Investment Companies.
Not applicable to this registrant.
Item 8. Portfolio Managers of Closed-End Management Investment Companies.
Not applicable to this registrant.
Item 9. Purchases of Equity Securities by Closed-End Management Investment Company and Affiliated Purchasers.
Not applicable to this registrant.
Item 10. Submission of Matters to a Vote of Security Holders.
There have been no material changes to the procedures by which shareholders may recommend nominees to the registrant’s Board implemented after the registrant last provided disclosure in response to this Item.
Item 11. Controls and Procedures.
| (a) | The registrant’s principal executive and principal financial officers, or persons performing similar functions, have concluded that the registrant’s disclosure controls and procedures (as defined in Rule 30a-3(c) under the Investment Company Act of 1940, as amended (the “1940 Act”) (17 CFR 270.30a-3(c))) are effective, as of a date within 90 days of the filing date of this report that includes the disclosure required by this paragraph, based on their evaluation of the controls and procedures required by Rule 30a-3(b) under the 1940 Act (17 CFR 270.30a-3(b)) and Rules 13a-15(b) or 15d-15(b) under the Securities Exchange Act of 1934, as amended (the “Exchange Act”) (17 CFR 240.13a-15(b) or 240.15d-15(b)). |
| (b) | There were no changes in the registrant’s internal control over financial reporting (as defined in Rule 30a-3(d) under the 1940 Act (17 CFR 270.30a-3(d)) that occurred during the second fiscal quarter of the period covered by this report that has materially affected, or is reasonably likely to materially affect, the registrant’s internal control over financial reporting. |
Item 12. Exhibits.
File the exhibits listed below as part of this Form.
(a)(1) Any code of ethics, or amendment thereto, that is the subject of the disclosure required by Item 2, to the extent that the registrant intends to satisfy the Item 2 requirements through filing of an exhibit: Not applicable to this filing.
(a)(2) A separate certification for each principal executive officer and principal financial officer of the registrant as required by Rule 30a-2(a) under the 1940 Act (17 CFR 270.30a-2(a)) in the exact form set forth below: See EX-99.CERT attached hereto.
(a)(3) Any written solicitation to purchase securities under Rule 23c-1 under the 1940 Act (17 CFR 270.23c-1) sent or given during the period covered by the report by or on behalf of the registrant to 10 or more persons: Not applicable to this registrant.
(b) If the report is filed under Section 13(a) or 15(d) of the Exchange Act, provide the certifications required by Rule 30a-2(b) under the 1940 Act (17 CFR 270.30a-2(b)), Rule 13a-14(b) or Rule 15d-14(b) under the Exchange Act (17 CFR 240.13a-14(b) or 240.15d-14(b)), and Section 1350 of Chapter 63 of Title 18 of the United States Code (18 U.S.C. 1350) as an Exhibit. A certification furnished pursuant to this paragraph will not be deemed “filed” for purposes of Section 18 of the Exchange Act (15 U.S.C. 78r), or otherwise subject to the liability of that section. Such certification will not be deemed to be incorporated by reference into any filing under the Securities Act of 1933 or the Exchange Act, except to the extent that the registration specifically incorporates it by reference: See EX-99.906 CERT attached hereto.
SIGNATURES
Pursuant to the requirements of the Securities Exchange Act of 1934 and the Investment Company Act of 1940, the registrant has duly caused this report to be signed on its behalf by the undersigned, thereunto duly authorized.
(Registrant) Nuveen Investment Trust III
| | | | | | |
| By | | (Signature and Title) | | /s/ Kevin J. McCarthy | | |
| | | | Kevin J. McCarthy Vice President and Secretary | | |
Date: June 7, 2013
Pursuant to the requirements of the Securities Exchange Act of 1934 and the Investment Company Act of 1940, this report has been signed below by the following persons on behalf of the registrant and in the capacities and on the dates indicated.
| | | | | | |
| By | | (Signature and Title) | | /s/ Gifford R. Zimmerman | | |
| | | | Gifford R. Zimmerman Chief Administrative Officer (principal executive officer) | | |
Date: June 7, 2013
| | | | | | |
| By | | (Signature and Title) | | /s/ Stephen D. Foy | | |
| | | | Stephen D. Foy Vice President and Controller (principal financial officer) | | |
Date: June 7, 2013