Exhibit (c)(5)
PROJECT ROCKET SPECIAL COMMITTEE MEETING NOVEMBER 14, 2011

TABLE OF CONTENTS I. SITUATION OVERVIEW II. COMPANY OVERVIEW III. FINANCIAL SUMMARY IV. PRELIMINARY VALUATION ANALYSIS A. NON-CORE ASSETS VALUATION B. CORE BUSINESS VALUATION V. PRELIMINARY EVALUATION OF ALTERNATIVES VI. PROCESS CONSIDERATIONS APPENDIX A. PRELIMINARY VALUATION SUPPORT This presentation was prepared exclusively for the benefit and internal use of the ROCKET Special Committee in order to indicate, on a preliminary basis, the feasibility of a possible transaction or transactions and does not carry any right of publication or disclosure to any other party. The contents of this presentation may not be used for any other purpose without the prior written consent of Stephens Inc. This foregoing material has been presented solely for informative purposes as of its stated date and is not a solicitation, or an offer, to buy or sell any security. It does not purport to be a complete description of the products, securities, markets or developments referred to in the material. Information included in the presentation was obtained from sources considered to be reliable, but has not been independently verified and is not guaranteed to be accurate or complete. All expressions of opinion apply on the date of the presentation. No subsequent publication or distribution of this presentation shall mean or imply that any such information or opinion is accurate or remains current at any time after the stated date of the presentation. You will not be advised of any changes in any such information or opinion. Stephens Inc., its employees, officers, directors and/or affiliates may from time to time have a long or short position in the securities mentioned and may sell or buy such securities. Stephens does not provide legal, tax or accounting advice; please consult your legal or tax professional. The individuals principally responsible for preparation of this presentation have received compensation that is based upon, among other factors, Stephens Inc.’s investment banking revenues. Additional information available upon request. ©Stephens Inc. 2011

I. SITUATION OVERVIEW
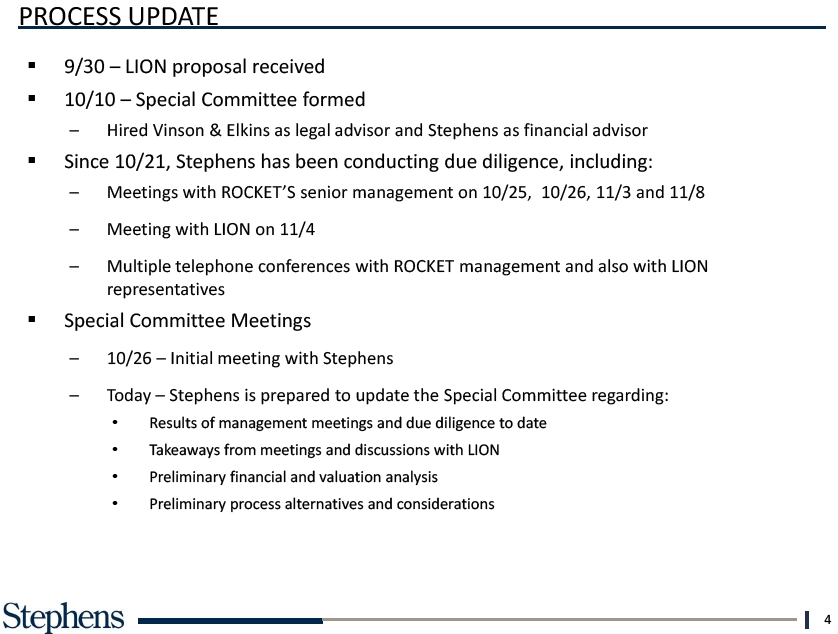
PROCESS UPDATE § 9/30 – LION proposal received§ 10/10 – Special Committee formed – Hired Vinson & Elkins as legal advisor and Stephens as financial advisor § Since 10/21, Stephens has been conducting due diligence, including: – Meetings with ROCKET’S senior management on 10/25, 10/26, 11/3 and 11/8 – Meeting with LION on 11/4 – Multiple telephone conferences with ROCKET management and also with LION representatives § Special Committee Meetings – 10/26 – Initial meeting with Stephens – Today – Stephens is prepared to update the Special Committee regarding: • Results of management meetings and due diligence to date • Takeaways from meetings and discussions with LION • Preliminary financial and valuation analysis • Preliminary process alternatives and considerations 4

LION PROPOSAL – 9/30/11 § Acquire 100% of common equity shares outstanding§ Purchase Price – $8.00 – $8.25 per share§ Consideration – 100% cash – Would like to discuss rollover of senior management equity as part of transaction § Financing – Combination of equity financing from LION and debt financing from third party lenders§ Contingencies: – Completion of confirmatory due diligence • Have “substantially completed” business due diligence – Availability of debt financing – Negotiation of mutually acceptable definitive documentation – Required regulatory approvals§ Other Considerations: – Definitive documentation to include no-shop provision, subject to fiduciary duties of the Board, and customary break-up fee consistent with similar transactions 5
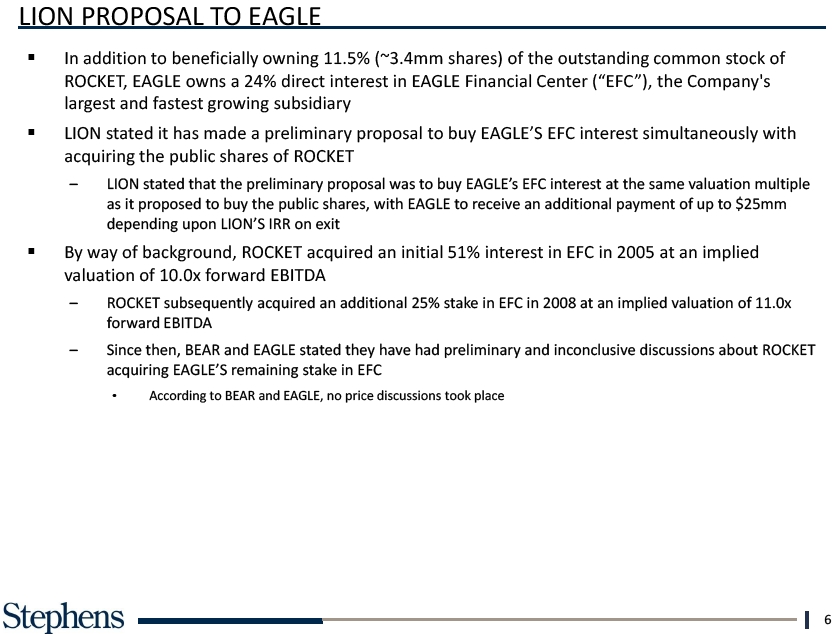
LION PROPOSAL TO EAGLE § In addition to beneficially owning 11.5% (~3.4mm shares) of the outstanding common stock of ROCKET, EAGLE owns a 24% direct interest in EAGLE Financial Center (“EFC”), the Company’s largest and fastest growing subsidiary§ LION stated it has made a preliminary proposal to buy EAGLE’S EFC interest simultaneously with acquiring the public shares of ROCKET – LION stated that the preliminary proposal was to buy EAGLE’s EFC interest at the same valuation multiple as it proposed to buy the public shares, with EAGLE to receive an additional payment of up to $25mm depending upon LION’S IRR on exit§ By way of background, ROCKET acquired an initial 51% interest in EFC in 2005 at an implied valuation of 10.0x forward EBITDA – ROCKET subsequently acquired an additional 25% stake in EFC in 2008 at an implied valuation of 11.0x forward EBITDA – Since then, BEAR and EAGLE stated they have had preliminary and inconclusive discussions about ROCKET acquiring EAGLE’S remaining stake in EFC • According to BEAR and EAGLE, no price discussions took place 6

DISCUSSIONS WITH LION § History of discussions – Looked at the Company three years ago and liked the asset management business, particularly the Mass Affluent segment, but decided the overall business was too complicated – After reviewing the business, representatives of LION have maintained a dialogue with BEAR § Due diligence status – Multiple conversations with EAGLE, BEAR, and their spouses – Primary focus has been on Mass Affluent with “desktop” diligence on the Other Wealth Management – Have worked at a high level on this since June, but emphasized that they had limited access to people and information – Estimated remaining diligence would take 4-6 weeks – Key areas will be regulatory diligence and PWC accounting diligence (quality of earnings report) § Valuation – Focused on developing a run rate EBITDA for the core Mass Affluent business and other asset management business – Attributing no value to the strategic growth initiatives of the Mass Affluent segment or Other Wealth Management acquisitions – Not interested in the non-core assets – attributing some value but have not indicated how much § Other key takeaways – Working with three financing sources and expect a similar due diligence timeline – Expect significant equity “roll” from management team – Expect voting agreement from BEAR, EAGLE and other insiders holding an aggregate of approximately 30% of ROCKET shares – Have engaged an advisor to assist in financing or marketing the EADV/Salient receivable – Not willing to commit time and money to finalize diligence until clearer understanding of price and Special Committee process – Not willing to participate in a competitive process 7
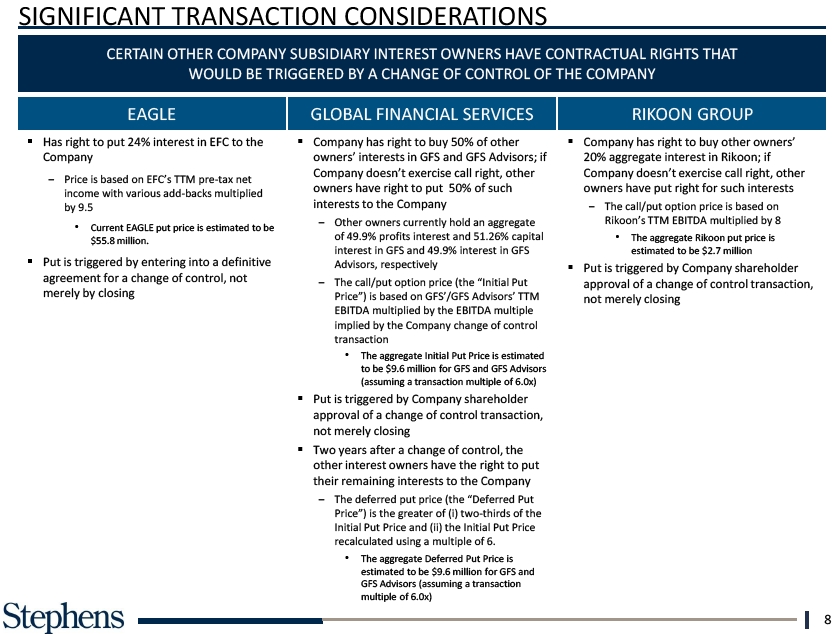
SIGNIFICANT TRANSACTION CONSIDERATIONS CERTAIN OTHER COMPANY SUBSIDIARY INTEREST OWNERS HAVE CONTRACTUAL RIGHTS THAT WOULD BE TRIGGERED BY A CHANGE OF CONTROL OF THE COMPANY EAGLE GLOBAL FINANCIAL SERVICES RIKOON GROUP § Has right to put 24% interest in EFC to the§ Company has right to buy 50% of other§ Company has right to buy other owners’ Company owners’ interests in GFS and GFS Advisors; if 20% aggregate interest in Rikoon; if Company doesn’t exercise call right, other Company doesn’t exercise call right, other Price is based on EFC’s TTM pre-tax net owners have right to put 50% of such owners have put right for such interests income with various add-backs multiplied by 9.5 interests to the Company The call/put option price is based on Other owners currently hold an aggregate Rikoon’s TTM EBITDA multiplied by 8 • Current EAGLE put price is estimated to be $55.8 million. of 49.9% profits interest and 51.26% capital • The aggregate Rikoon put price is interest in GFS and 49.9% interest in GFS estimated to be $2.7 million§ Put is triggered by entering into a definitive Advisors, respectively§ Put is triggered by Company shareholder agreement for a change of control, not The call/put option price (the “Initial Put approval of a change of control transaction, merely by closing Price”) is based on GFS’/GFS Advisors’ TTM not merely closing EBITDA multiplied by the EBITDA multiple implied by the Company change of control transaction • The aggregate Initial Put Price is estimated to be $9.6 million for GFS and GFS Advisors (assuming a transaction multiple of 6.0x) § Put is triggered by Company shareholder approval of a change of control transaction, not merely closing§ Two years after a change of control, the other interest owners have the right to put their remaining interests to the Company The deferred put price (the “Deferred Put Price”) is the greater of (i) two-thirds of the Initial Put Price and (ii) the Initial Put Price recalculated using a multiple of 6. • The aggregate Deferred Put Price is estimated to be $9.6 million for GFS and GFS Advisors (assuming a transaction multiple of 6.0x) 8

OTHER DUE DILIGENCE OBSERVATIONS OPPORTUNITIES CHALLENGES AND RISKS § Leverage the EAGLE name and system into new§ Key man/key employees markets – Brand tied to one person § Operating leverage as AUM grows – Several non-solicitation and employment agreements have expired with key employees of § Moving Other Wealth Management businesses partially owned subsidiaries (e.g. Global) to EMAP may improve efficiency – Other key senior management and large and profitability shareholders § Potentially accretive acquisitions (one deal § Commoditization of EMAP – current blended fee currently identified) of 145bps is at the high end of “market” fees § New business initiatives, while in early stages of § Growth hurdles analysis and development, could provide upside – Lead count has been flat for several quarters to revenue growth despite expanding into new markets§ Stock market improvement – New business initiatives are unproven and expensive – Acquiring new wealth managers will require financing, the availability of which is limited § Culture difference between Mass Affluent leadership and Other Wealth Management divisions§ Key product – all EMAP customers essentially own the same product and could be lost at a very rapid pace§ Decline in value of relatively large, limited life, non-core assets§ Stock market declines 9

OVERVIEW OF NON-CORE ASSETS (Dollars in Millions) EADV/SALIENT PROTON THERAPY CENTER § Pursuant to the Limited Partnership Agreement§ ROCKET owns a stake in this cancer treatment of Endowment Advisers, ROCKET sold its stake in center in Houston the partnership in 2008 § ROCKET’S value is derived from two sources: § EADV financed the buyout by granting ROCKET a Ownership position and related distributions contractual right to priority cash flow Management contract distributions § Total amount due: $86mm plus 6% annual OTHER ASSETS return § Among other assets, ROCKET holds other long-§ Payments are due quarterly in the amount of term receivables, primarily related to the the greater of: disposition of Concept Capital, as well as various 23.15% of cash distributions available from EADV illiquid securities and carried interests in private $3mm, adjusted annually for changes in the CPI equity investments § Book value as of 9/30/11: $57.0mm ($67.6mm BOOK VALUE OF NON-CORE ASSETS es outstanding balance) Fi nanci al EADV $ 57 Book value, net of associated deferred tax Sal i ent Level 1 As s ets 2 liability of approximately $24mm, is $33mm Proton Therapy Cen Concept 4 § In a transaction related to the sale of its EADV Other Level 2 & 3 Other 5 stake, ROCKET sold its 50% interest in Salient $ 70 Partners, which has controlling interest over EADV § ROCKET received a $9.3mm Salient note§ Book value as of 9/30/11: $2.7mm ($4.2mm outstanding balance) Source: Company filings and provided materials. 10

II. COMPANY OVERVIEW
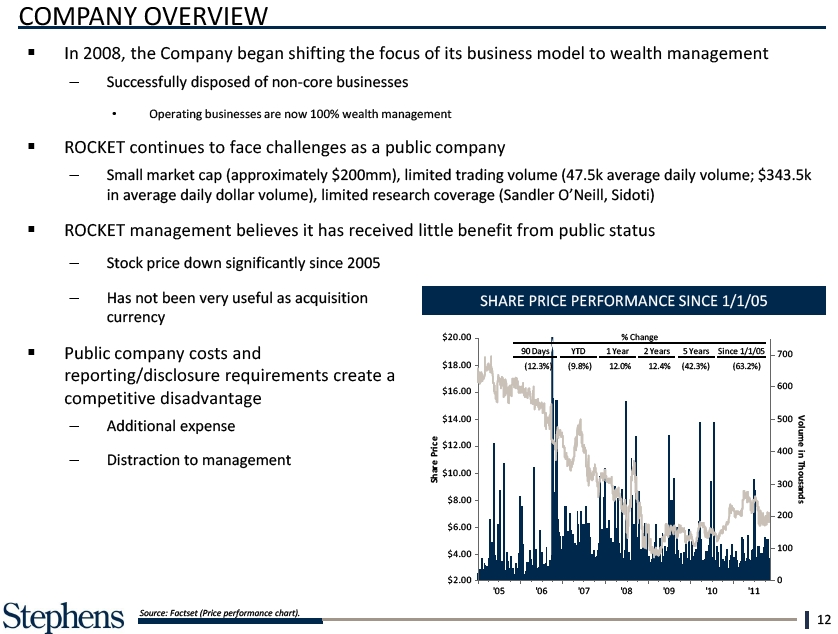
are COMPANY OVERVIEW § In 2008, the Company began shifting the focus of its business model $10.00 wealth management – Successfully disposed of non-core businesses Sh • Operating businesses are now 100% wealth management § ROCKET continues to face challenges as a public company $8.00 – Small market cap (approximately $200mm), limited trading volume (47.5k average daily volume; $343.5k in average daily dollar volume), limited research coverage (Sandler O’Neill, Sidoti) § ROCKET management believes it has received little benefit from public status – Stock price down significantly since 2005 $6.00 – Has not been very useful as acquisition SHARE PRICE PERFORMANCE SINCE 1/1/05 currency § Public company costs and 90 Days YTD ( 12.3%) ( 9.8% reporting/disclosure requirements create a $4.00 competitive disadvantage – Additional expense – Distraction to management $2.00 Source: Factset (Price performance chart). 12

RECENT TRADING HISTORY (November 11, 2010 – November 11, 2011) 52-Week High Low $6.00$ 8.87 $ 5.84 11/11/1 Impact Impact Price Volume* Price Volume* A 11/29/10 Agreed to acquire a 50.1% interest in 4.9% 18.4% E 5/26/11 Shareholders approved company name (0.8%) 34.9% Global Financial Services, a wealth change management firm with approximately $4 billion of client assets B 3/15/11 EAGLE named Co-CEO 0.7% 38.9% F 8/9/11 Reported 2Q11 EPS from continuing 20.8% 77.3% operations of $0.14 vs. $0.08 in 2Q10; client assets rose to $18.8 billion, up $11.1 billion from prior year C 4/22/11 Aired the first episode of EAGLE’S (2.5%) (43.1%) G 10/11/11 Disclosed the intent to exit the (0.6%) (21.1%) television program independent representative business at the end of 2011 D 5/10/11 Reported 1Q11 EPS from continuing 8.1% (33.9%) H 11/8/11 Reported 3Q11 earnings from core 7.5% (30.4%) operations of $0.10, up 11.1%; client operations of $0.09/share vs. assets rose to $18.2 billion, up 52.9% $0.10/share in 2Q11; AUM declined to from $11.9 billion a year earlier $17.0 billion from $18.8 billion in 2Q11 Source: Capital IQ, FactSet and Company press releases. * Percent differential vs. 90 day average volume. 13

ONE YEAR PRICE PERFORMANCE (November 11, 2010 – November 11, 2011) ROCKET HAS TRADED BETTER THAN .COMPARABLE COMPANIES IN THE LAST YEAR ROCKET 9.9% (40.0%) Broker/Dealer Comps (10.8%) Asset Manager Comps (19.8%) Source: SNL Financial. Note: “Broker/Dealer Comps” includes AMTD, LPLA, RJF, SCHW & SF. Note: “Asset Manager Comps” includes EPHC, EV, FII, JNS, LM, VRTS, WDR & WHG. 14

ROCKET olLTM TRADING 50.0% ANALYSIS 50.0% (As of November 11, 2011) Vol § Over the last twelve months, ROCKET shares . have traded in a $5.84 – $8.87 range and at a $7.24 45.0% volume weighted. average price§ Shares traded as a percentage 50.0% shares is approximately 20% % % 40.0% § Over the last twelve months, 8.8% of volume, . or about 1.8% of shares outstanding has traded above . .0% 1-MONTH (WEIGHTED AVG. PRICE: $6.63) 3-MONTH (WEIGHTED AVG. PRICE: $6.60) 20.0% 35.0% 20.0% 40.0% Price: $7.00 Current Price: $7.00 Volume 10.0% olume 30.0% 10.0% 0.0% 30.0% 0.0% 25.0% 0.0% V of of $5. 20.0% to $6. Total %Traded as a 20.0% Shares 2.2% Total %Traded as a Percentage of Shares Outstanding: 6.2% 15.0% 6-MONTH (WEIGHTED AVG. PRICE: $7.12) 1-YEAR (WEIGHTED AVG. PRICE $7.24) Current Price: $7.00 10.0%7.00 10.0% 5.0% 0.0% 0.0% 0.0% $5.00 to $6.00 Total Shares Traded as a Percentage of Shares Outstanding: 12.4% Total Shares Traded as a Percentage of Shares Outstanding: 20.6% Source: FactSet. Light brown denotes current trading price. 15
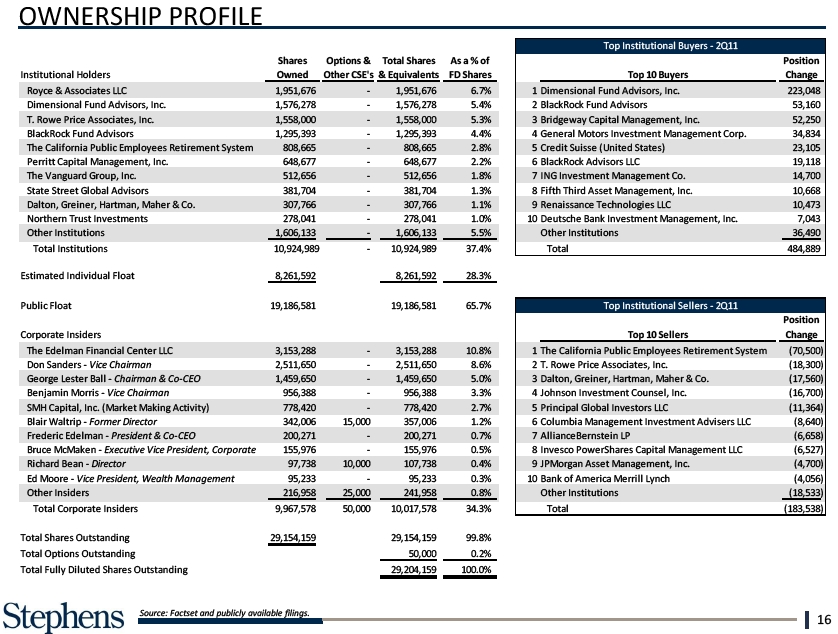
OWNERSHIP PROFILE Total Corpor Total Shares Ou Total Options O Total Fully Dilu Source: Factset and publicly available filings. 16
III. FINANCIAL SUMMARY

PROJECTIONS OVERVIEW IN THIS SECTION WE DISCUSS THREE SETS OF PROJECTIONS AS OUTLINED BELOW § Retreat projections Management developed these projections in connection with a strategic planning meeting (Retreat) in July In connection with our due diligence, management indicated that a number of the assumptions are no longer valid (see page 20) § Adjusted Retreat projections Based on our due diligence and guidance from management, we excluded the new business initiatives and potential acquisitions from the Retreat projections to arrive at the Adjusted Retreat projections This set of projections assumes revenue grows at a 17.2% CAGR from 2011 – 2014 and EBITDA margin expands from 11.1% to 19.4% § Sensitized projections We further adjusted the Adjusted Retreat projections to prepare preliminary Sensitized projections, based on • Preliminary guidance from certain senior management members that further adjustments should be made to bring the Company’s projections in line with current management expectations • Our comparison of the Adjusted Retreat projections with comparable companies’ expectations (per their public filings and Wall Street estimates), which suggested that the Adjusted Retreat projections remain aggressive in various respects § The Adjusted Retreat projections and Sensitized projections are preliminary and subject to further discussion with management and revision 18
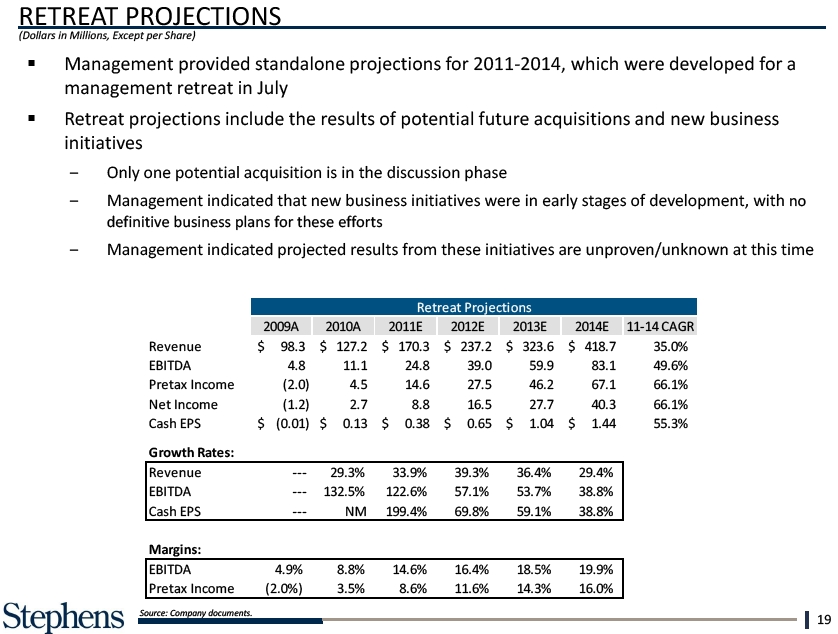
RETREAT PROJE TIONS (Dollars in Millions, Except perCash EPS $ § Management provided standalone projections for 2011-2014, which were developed for a management retreat in July§ Retreat projections Growth potential Rates:new business initiatives Only one Rev potential acquisition en is in the discussion uephase Management that ess initiatives were in early stages of development, with no definitive business plans for these efforts Management EBITDAfrom these initiatives are unproven/unknown at this time Cash EPS Margins: EBITDA Pretax Income Source: Company documents. 19
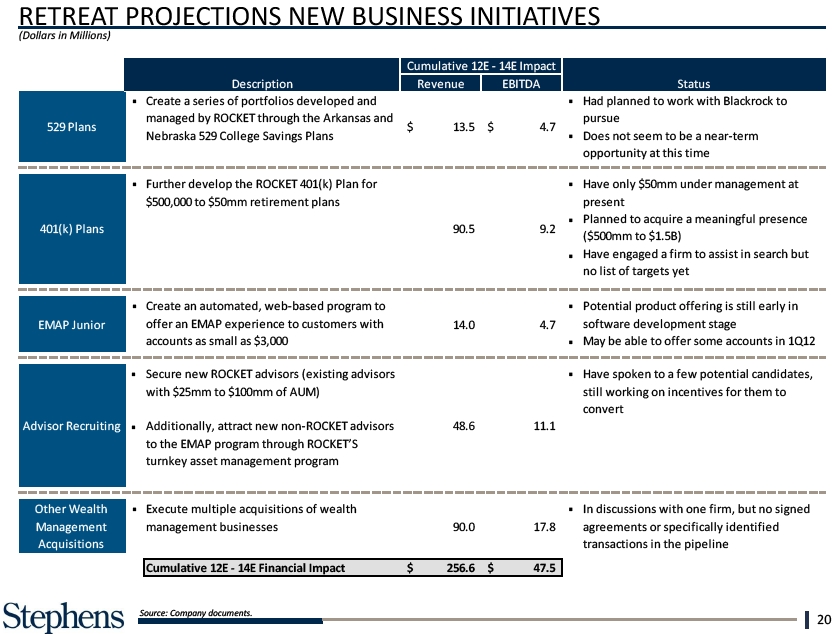
RETREAT PROJECTIONS NEW BUSINESS INITIATIVES (Dollars in Millions) Other Wealth Managemen Acquisitions Source: Company documents. 20
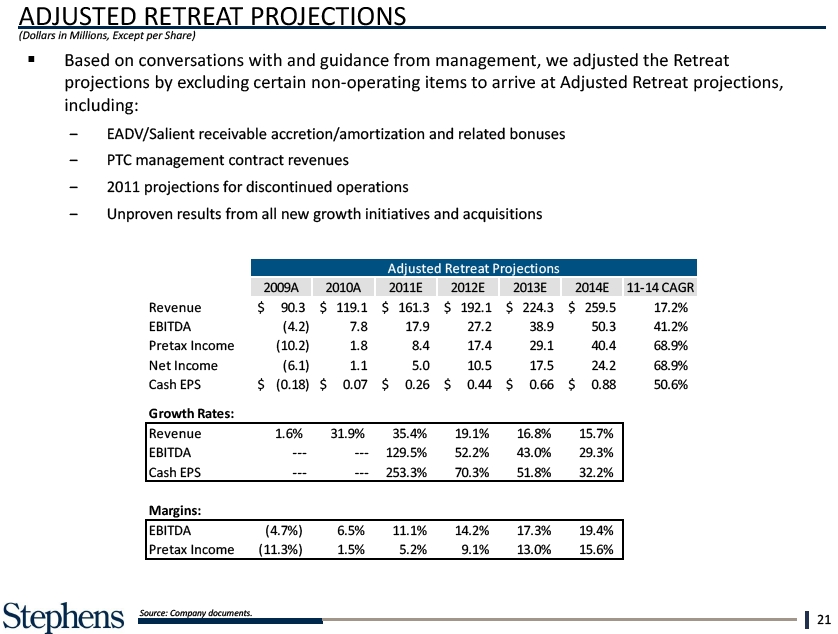
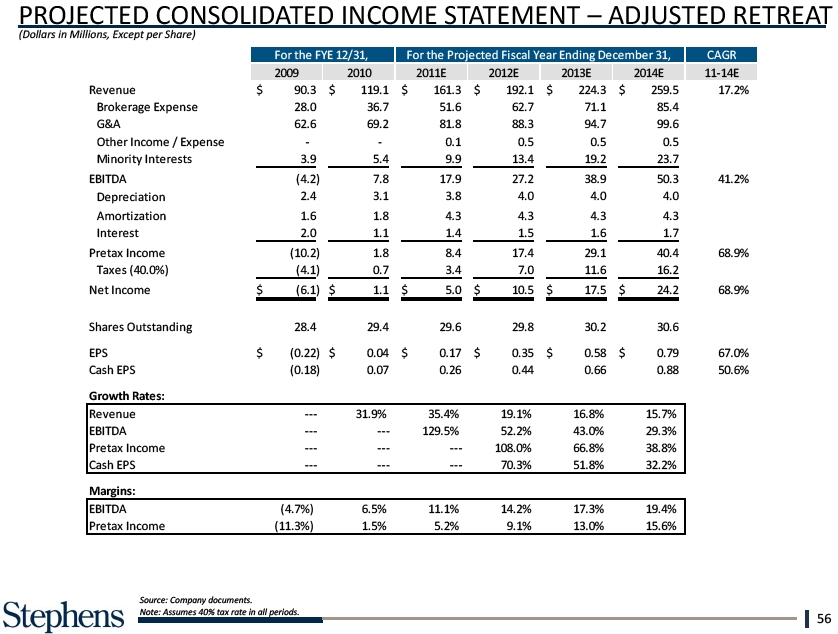
ADJUSTED RETREAT PROJECTIONS (Dollars in Millions, Except per Share) § Based on conversations with and guidance from management, we adjusted the Retreat projections by Growthitems Rates: Retreat projections, including: EADV/Salient Rev receivable accre tion/amortization nue and related bonuses PTC management venues 2011 projections for discontinued operations Unproven EBITDA and acquisitions Cash EPS Margins: EBITDA Pretax Income ( Source: Company documents. 21
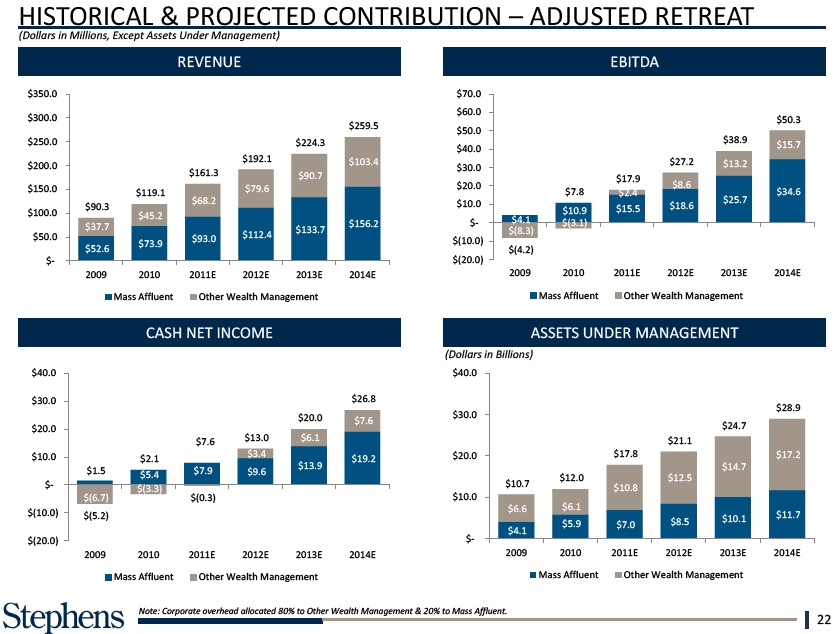
HISTORICAL $10 $30& ..0 PROJECTED CONTRIBUTION – $45.2 (Dollars in Millions, Except Assets Under Management) $- $4 REVENUE $37.7 $30.0EBITDA $(8 $20.0 $50.0 $(10.0) $73.9 $52.6 $(4 $- $(20.0) $10.0 $20.0 $2.1 2009 2010 20 $1.5 $5.4 $- Mass $10 $(3.3) $(6.7) $10.0 CASH NET INCOME ASSETS UNDER MANAGEMENT $6. $(10.0) $(5.2) (Dollars in Billions) $4. $(20.0) $-2009 2010 2009 Mass Affluent Note: Corporate overhead allocated 80% to Other Wealth Management & 20% to Mass Affluent. 22

ADJUSTED Concept (Dollars in Thousands) § We worked closely with management to evaluate recent EBITDA trends (particular emphasis on 2011) § ROCKET’S EBITDA Deferred Comp Market performance of AUM Wide Othther Management (isegment Pro w/o New staff and offices in the Mass Affluent segment § Other observations: EBITDA is projected to grow 129.5% in 2011 over 2010 Core3Q11I nc expected o decline me Befo This trend is primarily the result of the equity market decline since June and increased expenses related to the Mass Affluent Depreci a ti on Despite this trend, EBITDA in the Adjusted Retreat projections grows by 50%+ in 2012, with margin improving significantly in eachAmorti za ti on I nteres t EBI TDA Margin % Sequential Grow Source: Company documents. 23

SENSITIZED PROJECTIONS (Dollars in Millions) EBITDA BASED ON GEMENT, STEPHENS ALSO EVALUATED SENSITIZED PROJECTIONS TO REFLECT THE RISKS ASSOCIATED WITH POTENTIALLY LOWER AUM GROWTH AND A DECLINING FEE ENVIRONMENT § The SensitizedMarginprojections by: – Lowering AUM growth rate for Mass Affluent to 15% and for Other Wealth Management to 8% from management estimates of 17%+ each – Lowering Mass Affluent fees earned on AUM from approximately 140bps to 130bps by 2014E – Increasing annual Overhead growth to 8.0% compared with (2.4%) § Results in EBITDA margin expansion to 15.3% by 2014E compared with 19.4% in the Adjusted Retreat projections Growth Rates: Mass Affluent Re Other Wealth Ma Total Revenue EBITDA Source: Company filings and provided materials. 24

BALANCE SHEET (Dollars in Millions) Notes, Loans and Oth Equity: EADV Sal i ent Concept Other Common Equity Fi nanci al Ins Noncontrolling Level st1 As s ets Proton Therapy Center Other Level 2 & 3 As s ets Total Equity Total liabilities & equity Source: Company documents & public filings. 25
IV. PRELIMINARY VALUATION ANALYSIS
PRELIMINARY VALUATION APPROACH § Stephens analyzed and valued ROCKET from a non-core assets and core business perspective, utilizing various valuation methodologies to arrive at a preliminary range of values for each NON-CORE ASSETS CORE BUSINESS § EADV/Salient receivable§ Mass Affluent § Proton Therapy Center§ Other Wealth Management§ Other assets and receivables § To arrive at a preliminary combined valuation for ROCKET, a valuation range of the non-core assets was added to the implied preliminary range of values for the core business 27

A. NON-CORE ASSETS VALUATION

PRELIMINARY VALUATION vel APPROACH – NON-CORE ASSETS (Dollars in Millions, Except per Share) STEPHENS UTILIZED MULTIPLE VALUATION METHODOLOGIES IN ANALYZING THE COMPANY’S NON-CORE ASSETS § Worked with management to understand the after-tax market value of non-core assets such as long-term receivables and other privately held investments§ Utilized discounted cash flow analysis, book value, term sheet negotiations and cash flow coverage ratios to arrive at a preliminary range of values Concept Other Total Value per Shar (a) Net of estimated deferred tax liability. (b) Applied a discount rate of 15% – 20% to expected future cash flows given the asset concentration of 72% from Merrill Lynch as a fund distributor. Utilized a marginal tax rate of 40% given EADV interest and principal are fully taxable. (c) Level 1 Assets consist primarily of ROCKET common stock. (d) Level 2 & 3 Assets consist of warrants and other securities, primarily associated with private equity investments. Source: Company filings and provided materials. 29
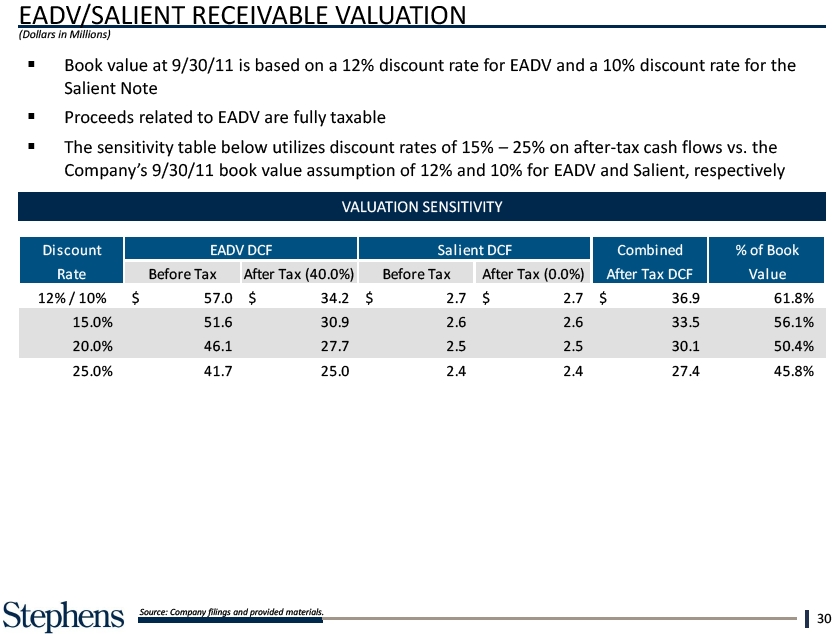
EADV/SALIENT RECEIVABLE VALUATION (Dollars in Millions) § Book value at 9/30/11 is based on a 12% discount rate for EADV and a 10% discount rate for the Salient Note§ Proceeds related to EADV are fully taxable§ The sensitivity table below utilizes discount rates of 15% – 25% on after-tax cash flows vs. the Company’s 9/30/11 book value assumption of 12% and 10% for EADV and Salient, respectively Di s c ount Ra te 1 2 % / 1 0 % 1 5 .0 % 2 0 .0 % 2 5 .0 % Source: Company filings and provided materials. 30
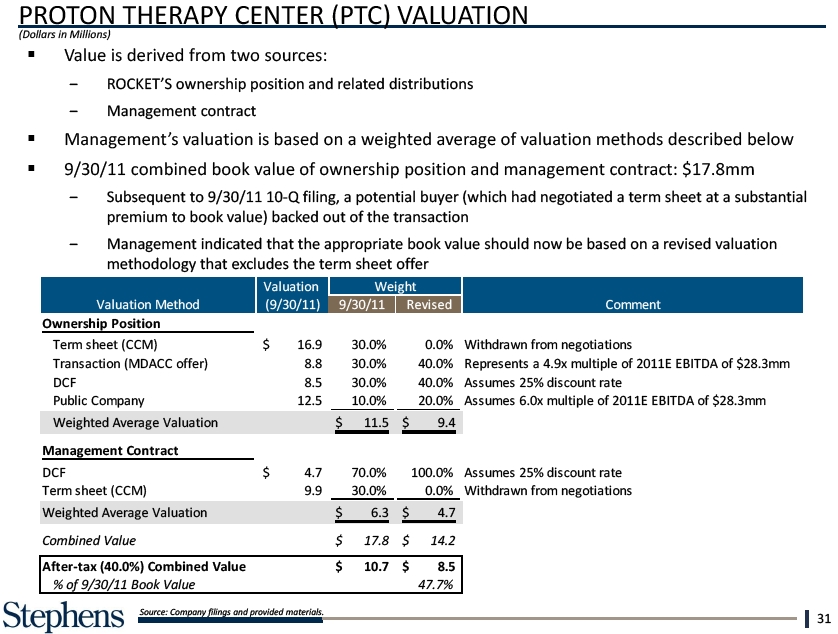
PROTON THERAPY CENTER (PTC) VALUATION (Dollars in Millions) § Management ROCKET’S ownership position and related distributions Management contract § DCFbased on a weighted average of valuation methods described below § 9/30/11 combined book value of ownership position and management contract: $17.8mm a (which erm sheet Termout of sheet (CC Management indicated that the appropriate book value should now be based on a revised valuation Weighted Aver Combined Valu After-tax (40.0 % of 9/30/11 Source: Company filings and provided materials. 31
B. CORE BUSINESS VALUATION

PRELIMINARY VALUATION APPROACH – CORE BUSINESS STEPHENS UTILIZED BOTH ADJUSTED RETREAT AND SENSITIZED PROJECTIONS FOR PURPOSES OF OUR PRELIMINARY VALUATION ANALYSIS § Few substantially comparable public companies to ROCKET based on our knowledge of the Company and Industry§ Examined current 2011E and 2012E trading multiples of selected publicly traded companies with COMPARABLE COMPANY characteristics or business units that are similar to ROCKET § Key metrics include AUM, EBITDA, EPS and Cash EPS, as well as relative growth, margins, returns on capital, size, etc. § Few substantially comparable transactions and limited transactions of similar companies with COMPARABLE disclosed multiples TRANSACTION§ Reviewed multiples paid in acquisitions of other broker/dealer, asset management and wealth advisory companies § Derived a preliminary valuation by discounting the projected free cash flows for the Company based on management estimates over the next three years and a terminal value in three years DISCOUNTED CASH FLOW based on a multiple of EBITDA § Utilized Company weighted average cost of capital § Preliminary valuation based on Company projected cash flows, currently available debt and LEVERAGED BUYOUT equity and estimated financial sponsor return thresholds based on estimated risk § Reviewed premiums paid for historical change of control transactions in the financial institution PREMIUMS PAID industry and similar sized public companies § Reviewed publicly available Wall Street analyst research and estimates RESEARCH ESTIMATES 33

PRELIMINARY PER SHARE VALUATION SUMMARY 1 8 Note: Assumes net cash of $23.0mm and 29.5mm fully diluted shares. LBO assumes “in-the-money” options are exercised and restricted units vest. Public Research Source: Bloomberg. 34
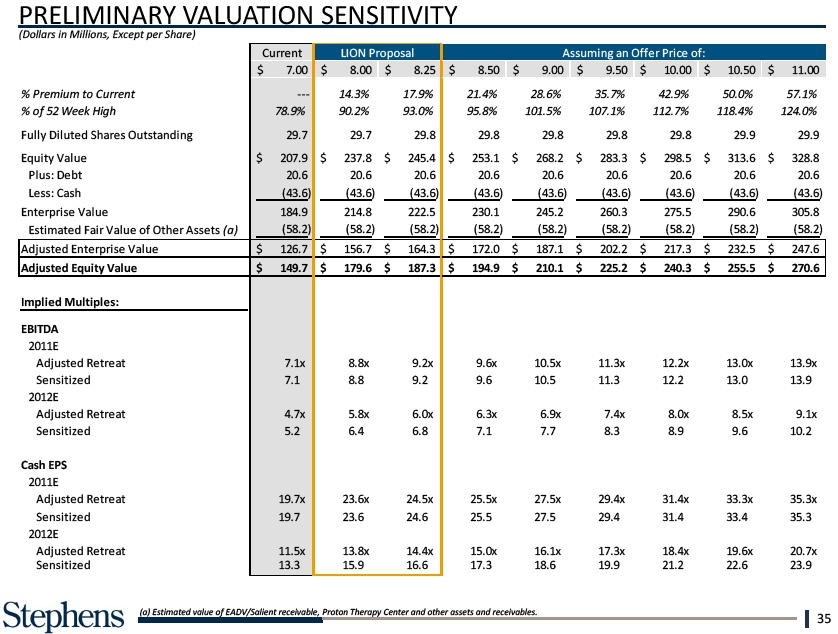
PRELIMINARY VALUATION SENSITIVITY (Dollars in Millions, Except per Share) Adjusted Re Sensitized 2012E Adjusted Re Sensitized (a) Estimated value of EADV/Salient receivable, Proton Therapy Center and other assets and receivables. 35
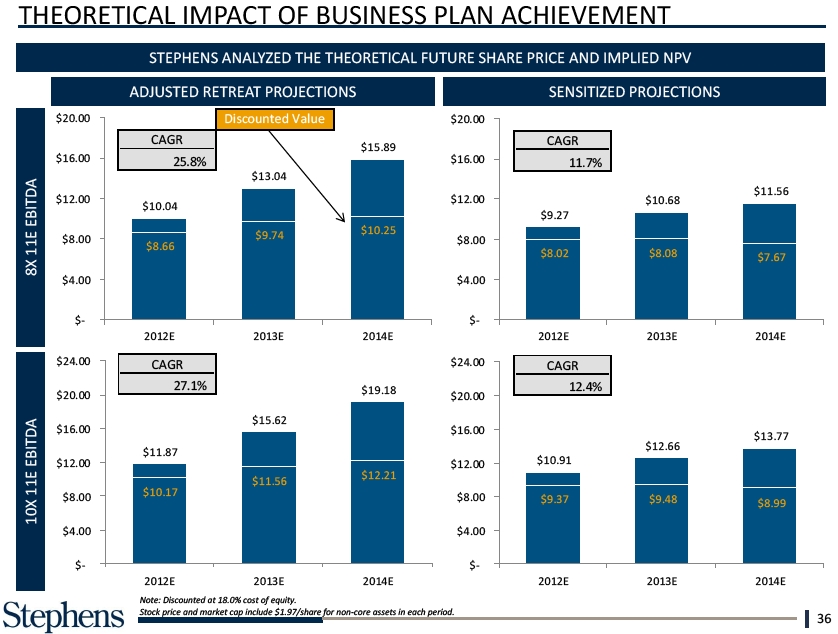
THEORETICAL IMPACT OF $8.00ANALYZED THE .1% $20.00 $8.66 ADJUSTED RETREAT PROJECTIONS PROJECTIONS $$4.00 EBITDA 11E $12.00 8X $- 2012E $10.17 $8.00 $8.00 EBITDA $4.00 $4.00 11E 10X $- $- 2012E Note: Discounted at 18.0% cost of equity. Stock price and market cap include $1.97/share for non-core assets in each period. 36
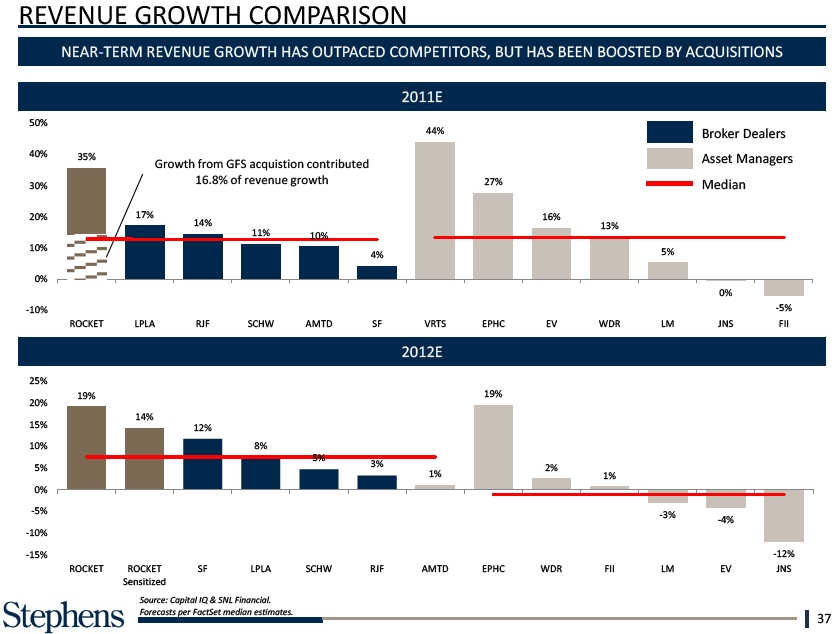
REVENUE25% GROWTH COMPARISON NEAR-TERM REVENUE GROWTH HAS OUTPACED COMPETITORS, BUT HAS BEEN BOOSTED BY ACQUISITIONS 20% 2011E 15% Broker Dealers Asset Managers 10% 0% Median -10% 5% 0% 2012E -5% -10% -15% ROCKET Source: Capital IQ & SNL Financial. Forecasts per FactSet median estimates. 37

EBITDA 25% 50% COMPARISION ROCKET’S NEAR-TERM EBITDA MARGIN LAGS SELECTED COMPS’ 45% 2011E 15% 40% Broker Dealers 10% 35% Asset Managers Median 30% 5% 25% 0% AMTD 20% 2012E 15% 10% 5% 0% AMT Source: Capital IQ & SNL Financial. Forecasts per FactSet median estimates. 38

AUM 40% 45% COMPARISON RECENT ABOVE AVERAGE AUM GROWTH DRIVEN BY ACQUISITIONS 30% 40% LTM (6/30/1 35% 20% Broker Dealers 30% Asset Managers Median 10% 25% 20% 20% 0% 15% 10% ANNUALIZED YTD 6/30/1 5% 0% -5% -10% ROCKE Source: Capital IQ & SNL Financial. 39

V. PRELIMINARY EVALUATION OF ALTERNATIVES

POSSIBLE SPECIAL COMMITTEE ALTERNATIVES Potential Special Committee Responses to the Proposal from LION Decline to Recommend the Negotiate to Improve the Proposal and Terminate Recommend Sale of Price and/or Other Terms of Recommend Sale Process Discussions/Pursue Non-Core Assets the Proposal Standalone Strategy § Consider if either§ Potentially gives§ Explore process to sell§ Explore sale of other non-shareholder value is shareholders immediate Company to highest bidder core assets, possibly maximized by pursuing the liquidity§ Scope (limited to broad) to combined with a dividend existing business plan or the§ Eliminates disadvantages of be defined or recapitalization plan or proposal is not fair and public ownership§ Contact most likely strategic accelerated acquisition cannot be improved to a§ Precludes public and financial buyers strategy fair level shareholders from§ Depending on scope, could§ Would facilitate the§ Consider risks in executing participating in future take up to 120 days to get possible subsequent sale of business plan results firm offers the Company§ Conduct post-signing§ Would require considerable§ Requires determination of market check time commitment from available alternatives and management the consequences of each§ However, LION has stated it would not participate in a competitive process. Other bidders may also decline to participate 41
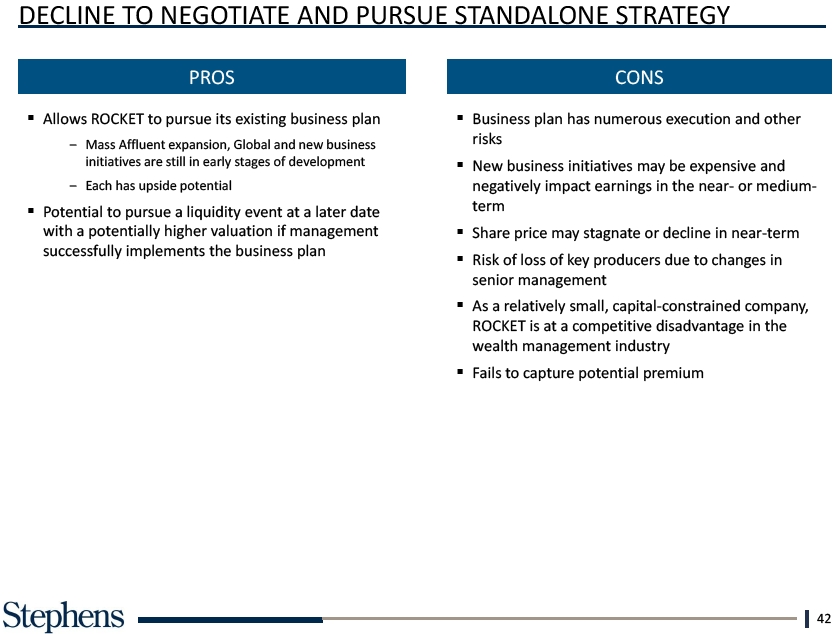
DECLINE TO NEGOTIATE AND PURSUE STANDALONE STRATEGY PROS CONS § Allows ROCKET to pursue its existing business plan§ Business plan has numerous execution and other Mass Affluent expansion, Global and new business risks initiatives are still in early stages of development§ New business initiatives may be expensive and Each has upside potential negatively impact earnings in the near- or medium-§ Potential to pursue a liquidity event at a later date term with a potentially higher valuation if management§ Share price may stagnate or decline in near-term successfully implements the business plan§ Risk of loss of key producers due to changes in senior management§ As a relatively small, capital-constrained company, ROCKET is at a competitive disadvantage in the wealth management industry§ Fails to capture potential premium 42
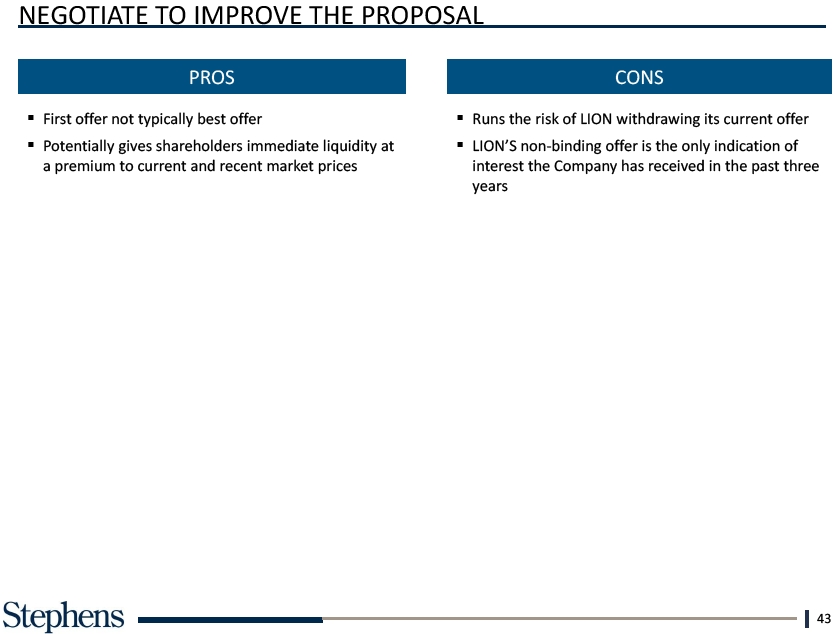
NEGOTIATE TO IMPROVE THE PROPOSAL PROS CONS § First offer not typically best offer§ Runs the risk of LION withdrawing its current offer§ Potentially gives shareholders immediate liquidity at§ LION’S non-binding offer is the only indication of a premium to current and recent market prices interest the Company has received in the past three years 43
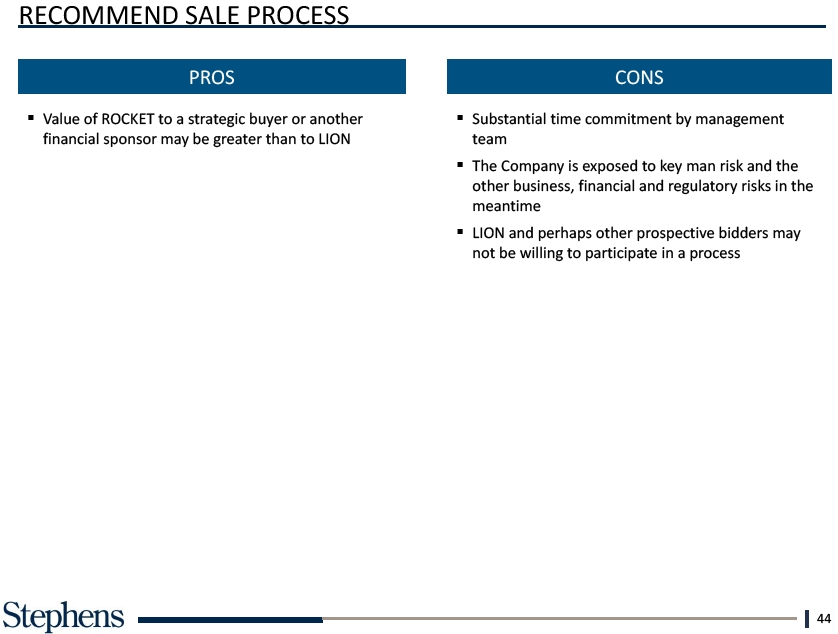
RECOMMEND SALE PROCESS PROS CONS § Value of ROCKET to a strategic buyer or another§ Substantial time commitment by management financial sponsor may be greater than to LION team§ The Company is exposed to key man risk and the other business, financial and regulatory risks in the meantime§ LION and perhaps other prospective bidders may not be willing to participate in a process 44

RECOMMEND SALE OF NON-CORE ASSETS PROS CONS § Enables ROCKET to realize value for these assets§ May require multiple sales/parties that likely is not being fully recognized in the public § Assets likely to be sold at a discount to book value market, or by potential suitor§ Substantial future cash flow will be lost that can be§ Use of proceeds to enhance shareholder value used for growth of the core business Reinvest in business However, sales proceeds can be used for growth Accelerate growth plans (acquisitions) Return to shareholders via dividend or share repurchase § Potentially allows ROCKET to more effectively pursue buyers for the core business 45
VI. PROCESS CONSIDERATIONS
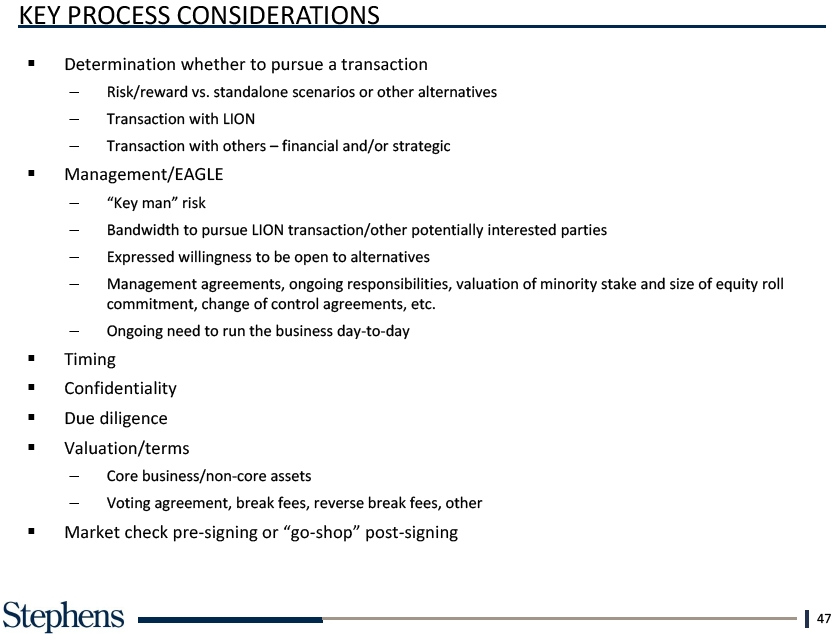
KEY PROCESS CONSIDERATIONS § Determination whether to pursue a transaction – Risk/reward vs. standalone scenarios or other alternatives – Transaction with LION – Transaction with others – financial and/or strategic§ Management/EAGLE – “Key man” risk – Bandwidth to pursue LION transaction/other potentially interested parties – Expressed willingness to be open to alternatives – Management agreements, ongoing responsibilities, valuation of minority stake and size of equity roll commitment, change of control agreements, etc. – Ongoing need to run the business day-to-day§ Timing§ Confidentiality§ Due diligence§ Valuation/terms – Core business/non-core assets – Voting agreement, break fees, reverse break fees, other§ Market check pre-signing or “go-shop” post-signing 47

MARKET CHECK PROS CONS § Ability to utilize competitive tension to§ Ability to maintain confidentiality maximize valuation and minimize time§ Timing/increased management burden PRE-SIGNING investment § Could lose “bird-in-hand” offer § Ability to theoretically extract the highest price § Deal certainty – “bird-in-hand” when you§ No competitive inertia to drive initial price approach market for better price and term§ Avoid business and execution risk of failed§ Limited evidence of success in achieving auction and being “shop-worn” higher price § Ability to control confidentiality§ Bidders must offer premium price in excess POST-SIGNING of break fees§ Can be effectively pursued in 40-60 days GO-SHOP § Potential acquirors may elect not to§ Less burdensome on management time –participate only dealing with serious inquiries§ Provides adequate opportunity for potential purchasers that would consider a higher price than announced offer 48
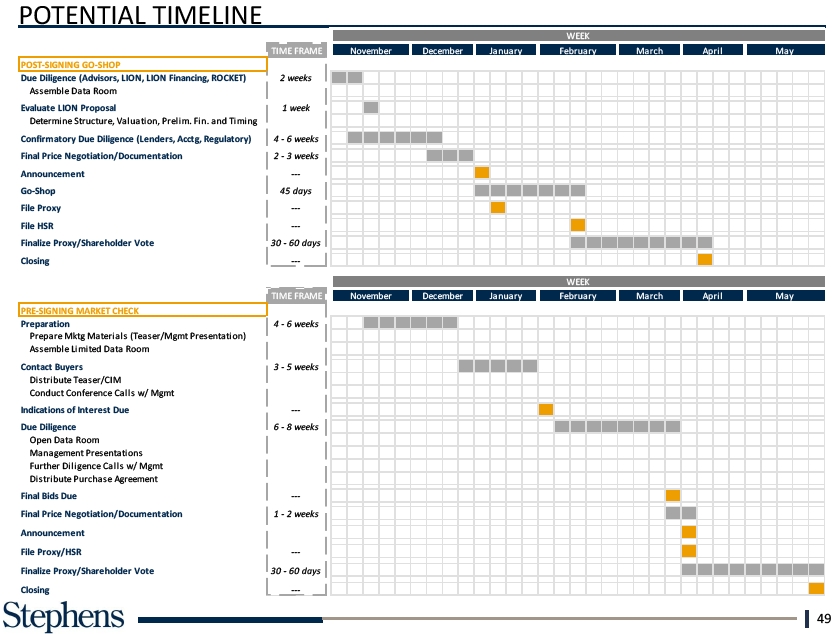
POTENTIAL TIMELINE Announcement File Proxy/HSR Finalize Proxy/Sha Closing 49

NON-CORE ASSETS § Depending on ultimate conversations with LION or others regarding the valuation of ROCKET’S components (core vs. non-core assets), the Special Committee may consider other alternatives to maximize value for the non-core assets§ These structures have many sub-optimal features vs. negotiation with one buyer for all the components, including potential multiple layers of tax, ongoing obligations and expense, complexity and delayed receipt of proceeds, among others KEY CONSIDERATIONS DESCRIPTION TAX ONGOING OBLIGATIONS COMMENTS Sale Prior to§ Pursue a single§ Corporate level tax§ None§ Management time Closing transaction or multiple commitment transactions for the§ Distraction to process liquidation of the non-§ How quickly can core assets transactions be completed and for what portion of the assets? § Inherent discount to move the assets§ Negotiation of Purchase Price Adjustment Distribution to§ Place non-core assets§ Taxable to corporation§ Shareholders bear the§ Potentially long process Shareholders into NEWCO and and shareholders upon cost of management, to receive full value, distribute to shareholders distribution at FMV, and including filing and could accelerate by any future incremental reporting requirements, pursuing sale process at a value created audit, etc. discount§ Non-transferable, pass-through entity may eliminate future double taxation issues when assets are liquidated and gains may be recognized 50
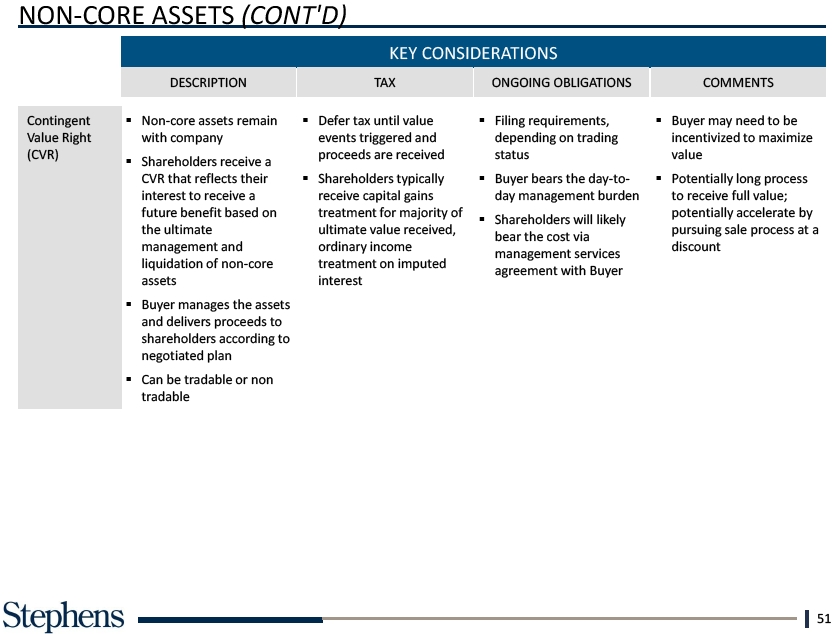
NON-CORE ASSETS (CONT’D) KEY CONSIDERATIONS DESCRIPTION TAX ONGOING OBLIGATIONS COMMENTS Contingent§ Non-core assets remain§ Defer tax until value§ Filing requirements,§ Buyer may need to be Value Right with company events triggered and depending on trading incentivized to maximize (CVR)§ proceeds are received status value Shareholders receive a CVR that reflects their§ Shareholders typically§ Buyer bears the day-to-§ Potentially long process interest to receive a receive capital gains day management burden to receive full value; future benefit based on treatment for majority of potentially accelerate by§ Shareholders will likely the ultimate ultimate value received, pursuing sale process at a bear the cost via management and ordinary income discount management services liquidation of non-core treatment on imputed agreement with Buyer assets interest§ Buyer manages the assets and delivers proceeds to shareholders according to negotiated plan§ Can be tradable or non tradable 51

(Dollars in Billions) THIS IS A PRELIMINARY LIST OF PRIVATE EQUITY FIRMS WHICH WE BELIEVE HAVE AN INTEREST IN THE WEALTH MANAGEMENT SPACE AND WHICH ARE LARGE ENOUGH TO EFFECT A CONTROL TRANSACTION Fi rm KKR Warburg Pincus Source: PitchBook. 52

POTENTIAL STRATEGIC ACQUIRORS – PRELIMINARY LIST (Dollars in Millions) PRELIMINARY LIST OF FINANCIAL SERVICES PARTICIPANTS WHO MAY HAVE AN INTEREST IN A COMPANY LIKE ROCKET Market Market Company Description Company Description Cap Cap $1,797§ Provides comprehensive investment management to $28,342§ Provides retail banking, corporate and institutional banking, approximately 4,800 institutions and intermediaries including asset management and residential mortgage banking corporations, government entities, insurers and others§ Manages $351.7 billion in assets $9,685§ Provides securities brokerage services and technology-based $15,697§ Provides brokerage, banking, money management and financial financial services to retail investors, traders and independent advisory services to individuals and independent advisors RIAs§ Over 300 offices and 8.5 million active brokerage accounts, 1.5§ Offers products and services through the Internet, a network of million corporate retirement plan participants, 769,000 banking retail branches, mobile trading applications and via telephone accounts and $1.6 trillion in client assets $52,755§ Provides investment management services to individuals, $375§ Provides wealth management software and services to financial investment companies, pension and profit sharing plans, advisors charitable organizations, corporations and others§ Manages equity, fixed income and alternative investment portfolios $16,438§ Offers a full range of consumer and commercial banking, $3,412§ Provides life insurance, long term care insurance, financial securities brokerage, asset management, mortgage and protection coverages, and independent advisor-based wealth insurance products and services management§ Manages $168 billion in assets and operates 1,800 financial centers $1,670§ The Company’s broker-dealer affiliates provide securities§ Axa $33,798§ Operates in three major business lines: property-casualty brokerage, investment banking, trading, investment advisory insurance, life & savings, and asset management and related financial services to individual investors,§ 214,000 employees and 95 million clients professional money managers, businesses and municipalities§ In addition to a strong international presence, Stifel has 318 offices in 44 states $3,830§ The Company’s three principal wholly owned broker/dealers, $7,330§ Provides retirement and investment services, as well as Raymond James & Associates, Raymond James Financial insurance and banking Services and Raymond James Ltd. have approximately 5,400§ $320.8 billion in assets under management and 17.8 million financial advisors serving 2 million accounts in 2,400 locations customers worldwide§ Total client assets are approximately $256 billion§ Offices in Asia, Australia, Europe, Latin America and the U.S. $3,159§ Largest independent broker/dealer in the United States (based $10,684§ Offers financial planning services, investments, insurance and on revenue, Financial Planning magazine, June 1996-2011) annuity products§ Offers proprietary technology, comprehensive clearing and§ Over $650 billion in assets under management and compliance services, practice management programs and administration training, and independent research to about 12,800 financial§ Top-10 provider of mutual funds, financial planning, annuities advisors and roughly 730 financial institutions and insurance Source: SNL Financial. 53

APPENDIX
A. PRELIMINARY VALUATION SUPPORT
PROJECTED INCOME RETREAT (Dollars in Millions,Pretax Income Cash EPS Margins: EBITDA Pretax Income Source: Company documents. Note: Assumes 40% tax rate in all periods. 56

PROJECTED Revenue SEGMENT INCOME STATEMENTS RETREAT Revenue (Dollars in Millions) MASS AFFLUENT OTHER WEALTH MANAGEMENT Pretax Income Pretax Income Margins: Margins: EBITDA EBITDA Pretax Income Pretax Income Source: Company documents. Note: Corporate overhead allocated 80% to Other Wealth Management & 20% to Mass Affluent. 57

TRADING COMPARABLES (Dollars in Millions, Except per Share) Capital BROKER/DEALERS Virtus Inves tm Epoch Holding ROCKET (c) ROCKET (a) ASSET MANAGERS ROCKET (c) ROCKET (a) Source: Capital IQ & SNL Financial. (a) FactSet median estimates. (b) LPLA LTM EBITDA excludes $238mm of expenses associated with the Company’s IPO. (c) Based on Adjusted Retreat projections. 58

RECENT IPO FILING – MANNING & NAPIER (Dollars in Millions) $40.0 AUM IPO DETAILS VALUATION Implied Equity Value § Initial Filing Date: 7/1/11 $35.0§ Expected Pricing Date: Week of 11/14/11§ Non High voting stock (Class B) $30.0 Mid $25.0 Plus: Debt (Post-Money) Equity Value (M Less: Cash (Post-Money) $20.0 Implied Enterprise Value (Mid) $14. $15.0 BUSINESS DESCRIPTION HISTORICAL AUM GROWTH ($ BILLIONS)§ Independent investment management firm that provides a range of investment solutions $10.0 through separately managed accounts, mutual CAGR 22.7% funds and collective investment trust funds § Offers equity and fixed income portfolios as well $5.0 as blended asset portfolios, such as life cycle funds that use a mix of stocks and bonds $-§ Founded in 1970 and based in Fairport, NY 2006 Source: Manning & Napier S-1. 59

DISCOUNTED Total ANALYSIS Shares Ou (Dollars in Millions, Except per Share) Implied Price Per (a) Fully diluted shares outstanding and options proceeds assuming all options are “In-the-Money.” 60

LEVERAGED Plus: BUYOUT Debt ANALYSIS (9/30/11) (Dollars in Millions, Less: Share) Cash (9/30/11) Uses TRANSACTION ASSUMPTIONS SOURCES & USES Implied Enterprise Value Purchase of Equit Refi nance Existing Enterprise Value / Financing Fees Revenue Transaction Expe EBITDA Total Uses 2014E RETURN SUMMARY I Pr o For m a De bt Exi t Mul ount t. EVR Tr a ns a c ti on Debt $ 4 0 .0 7.5x $ 377 8.0x 402 8.5x 427 9.0x 452 9.5x 477 ADDITIONAL ASSUMPTIONS § Assumes $2mm of annual public company cost savings§ Transaction expenses represent 2% of total transaction value§ Excess cash flow used to pay down Transaction Debt§ Tax rate: 40%§ Min cash: $20mm§ 1.3% financing fee§ All restricted units immediately vest 61
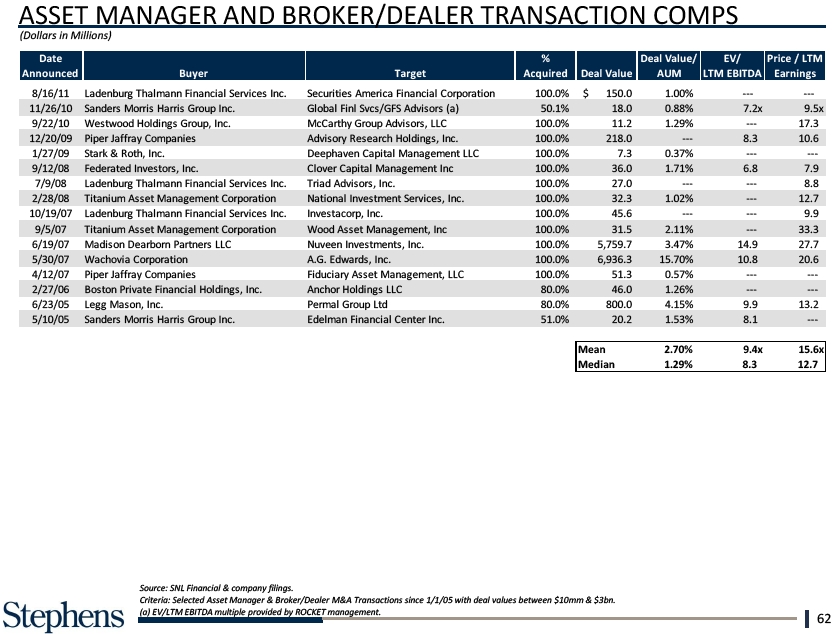
(Dollars in Millions) 6/23/05 L 5/10/05 S Source: SNL Financial & company filings. Criteria: Selected Asset Manager & Broker/Dealer M&A Transactions since 1/1/05 with deal values between $10mm & $3bn. (a) EV/LTM EBITDA multiple provided by ROCKET management. 62
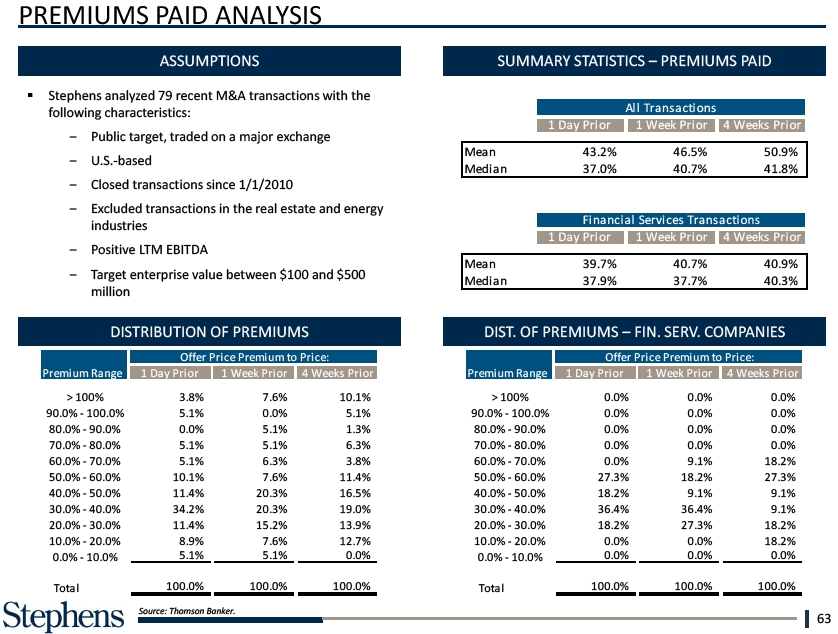
PREMIUMS PAID ANALYSIS Mean > 100% Medi3.8% an ASSUMPTIONS SUMMARY STATISTICS – PREMIUMS PAID § Stephens 90.0% analyzed recent - 100.0% transactions the 90. 5.1%100.0% following characteristics: 80.0% traded -on90.0% 80. 0.0%90.0% U.S.-based 70.0% - since 80.0% 1/1/2010 70. 5.1%80. 1 Da Excluded transactions in the real estate and energy 60.0% industries - 70.0% 60. 5.1%70.0% Mean Positive LTM EBITDA 50.0%value - 60.0% $ 500 Medi 5010.0%.1%60 an .0% million 40.0% - 50.0% 4011.0% .4%50.0% DISTRIBUTION OF PREMIUMS DIST. OF PREMIUMS – FIN. SERV. COMPANIES 30.0% - 40.0% 3034.0% .2%40.0% 20.0% - 30.0% 2011.0% .4%30.0% 10.0% - 20.0% 10. 8.9%20.0% 0.0% - 10.0% 0. 5.1% 10.0% Total Total 100.0% Source: Thomson Banker. 63

WEIGHTED AVERAGE COST OF CAPITAL (Dollars in Millions) Westwood Holdi Comparable Me ROCKET (a) Source: Ibbotson Associates’ “Stocks, Bonds, Bills and Inflation 2011 Yearbook”. (b) Defined as comparable mean unlevered beta * (1+((1-target’s tax rate) * target’s debt/equity)). (c) 2 year levered beta relative to the S&P 500. Source: Bloomberg adjusted beta as of 11/11/11. (d) Defined as current market capitalization. (e) Defined as levered beta/(1+((1-tax rate) * debt/equity)). 64