Exhibit (c)(9)

PROJECT ROCKET SPECIAL COMMITTEE DISCUSSION MATERIALS MARCH 20, 2012
DISCLAIMER This presentation was prepared exclusively for the benefit and internal use of the ROCKET Special Committee in order to indicate, on a preliminary basis, the feasibility of a possible transaction or transactions and does not carry any right of publication or disclosure to any other party. The contents of this presentation may not be used for any other purpose without the prior written consent of Stephens Inc. This foregoing material has been presented solely for informative purposes as of its stated date and is not a solicitation, or an offer, to buy or sell any security. It does not purport to be a complete description of the products, securities, markets or developments referred to in the material. Information included in the presentation was obtained from sources considered to be reliable, but has not been independently verified and is not guaranteed to be accurate or complete. All expressions of opinion apply on the date of the presentation. No subsequent publication or distribution of this presentation shall mean or imply that any such information or opinion is accurate or remains current at any time after the stated date of the presentation. You will not be advised of any changes in any such information or opinion. Stephens Inc., its employees, officers, directors and/or affiliates may from time to time have a long or short position in the securities mentioned and may sell or buy such securities. Stephens does not provide legal, tax or accounting advice; please consult your legal or tax professional. The individuals principally responsible for preparation of this presentation have received compensation that is based upon, among other factors, Stephens Inc.’s investment banking revenues. Additional information available upon request. ©Stephens Inc. 2012 2

PROCESS UPDATE § LION and its advisors continue confirmatory due diligence — Business diligence (LION) — Lenders diligence (managed by LION in conjunction with banks) — Quality of Earnings (PwC) — Tax, Accounting and HR (PwC) — Legal (Fried Frank) — Insurance (Aon) § Ongoing negotiations around the various transaction agreements and lender commitments § Earnings release on March 13 — Sandler O’Neill and Sidoti analysts reiterated price targets and ratings § Management re-confirmed projections used in our analysis 3

$ PER SHARE VALUATION RANGE (Dollars in Millions, Except per Share) Previous Range (A High Low Note: Assumes broker compensation payout ratio of 29.5% and net cash of $21.5mm. Shares include accelerated vesting of RSUs and exercise of options with a strike below $8.85/share. Estimated EBITDA and Cash EPS is based on Management Projections adjusted to separate Core Business operating earnings from Non-Core Asset earnings (valued separately). (a) Based on 20 trading day average closing share price of $6.79 as of 3/16/12. (b) Future price targets (typically 12-month projections) based on two most recent research reports published as of 3/13/12. 4

VALUATION MULTIPLES – CURRENT MARKET (Dollars in Millions, Except per Share) 2011 EBITDA EV / 2011 EBIT 2012E EBITDA EV / 2012E EBI (a) Unadjusted Core EPS ($0.46) represents the Company’s reported “Core” EPS, which adjusts for nonrecurring items. Adjusted Core EPS ($0.15) excludes $6.0mm and $5.5mm of earnings from EADV and PTC, respectively. (b) Core Cash EPS defined as Core EPS plus tax-effected amortization per share. (c) Based on equity value to common plus $19.1mm debt, and less $40.6mm cash as of 12/31/11. Note: The two columns labeled “Adjusted for Non-Core Assets” (Liquidation or “Conservative” and Fair Value or “Company”) include enterprise values, per share prices, EBITDA and cash EPS adjusted to exclude the asset value and related EBITDA and cash EPS related to “Non-Core” assets. 5

VALUATION MULTIPLES – TRANSACTION (Dollars in Millions, Except per Share) 2011 EBITDA EV / 2011 EBIT 2012E EBITDA EV / 2012E EBI (a) Unadjusted Core EPS ($0.46) represents the Company’s reported “Core” EPS, which adjusts for nonrecurring items. Adjusted Core EPS ($0.15) excludes $6.0mm and $5.5mm of earnings from EADV and PTC, respectively. (b) Core Cash EPS defined as Core EPS plus tax-effected amortization per share. (c) Based on equity value to common plus $19.1mm debt, and less $40.6mm cash as of 12/31/11. Note: The two columns labeled “Adjusted for Non-Core Assets” (Liquidation or “Conservative” and Fair Value or “Company”) include enterprise values, per share prices, EBITDA and cash EPS adjusted to exclude the asset value and related EBITDA and cash EPS related to “Non-Core” assets. 6
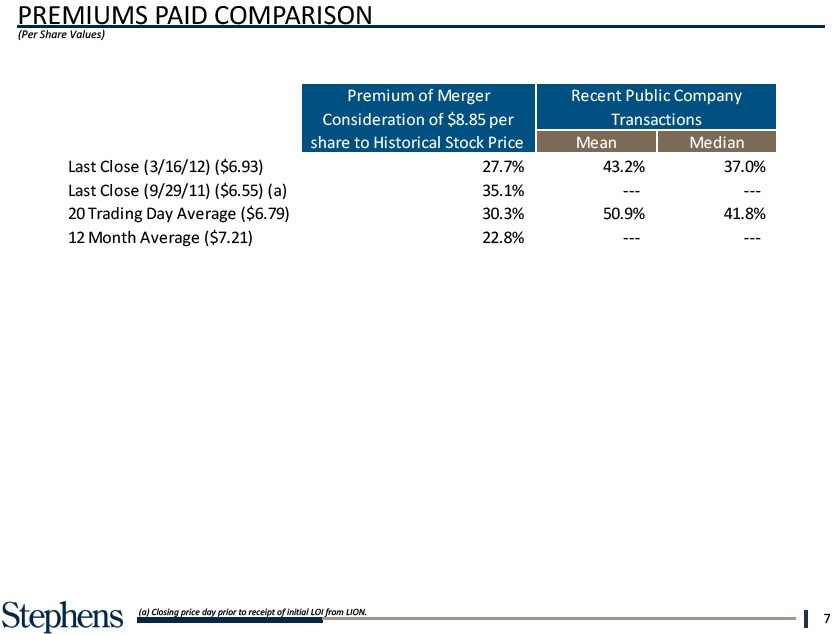
PREMIUMS PAID COMPARISON (Per Share Values) Last Cl ose (3/16/ Last Cl ose (9/29/ 20 Tradi ng Day A 12 Month Ave rag (a) Closing price day prior to receipt of initial LOI from LION. 7
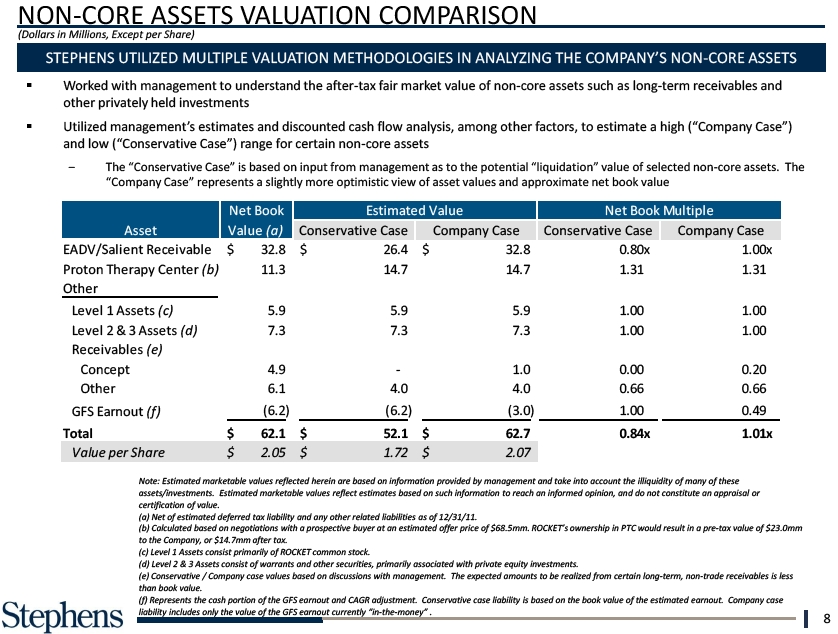
NON-CORE ASSETS VALUATION COMPARISON (Dollars in Millions, Except per Share) 1 Assets STEPHENS UTILIZED MULTIPLE VALUATION METHODOLOGIES IN ANALYZING THE COMPANY’S NON-CORE ASSETS s § Worked with management to understand the after-tax fair market value of non-core assets such as long-term receivables and other privately held investments § Utilized management’s estimates and discounted cash flow analysis, among other factors, to estimate a high (“Company Case”) R (e) and low (“Conservative Case”) range for certain non-core assets The “Conservative Case” is based on input from management as to the potential “liquidation” value of selected non-core assets. The “Company Case” represents a slightly more optimistic view of asset values and approximate net book value Concept Other GFS Earnout (f) Total Value per Shar Note: Estimated marketable values reflected herein are based on information provided by management and take into account the illiquidity of many of these assets/investments. Estimated marketable values reflect estimates based on such information to reach an informed opinion, and do not constitute an appraisal or certification of value. (a) Net of estimated deferred tax liability and any other related liabilities as of 12/31/11. (b) Calculated based on negotiations with a prospective buyer at an estimated offer price of $68.5mm. ROCKET’s ownership in PTC would result in a pre-tax value of $23.0mm to the Company, or $14.7mm after tax. (c) Level 1 Assets consist primarily of ROCKET common stock. (d) Level 2 & 3 Assets consist of warrants and other securities, primarily associated with private equity investments. (e) Conservative / Company case values based on discussions with management. The expected amounts to be realized from certain long-term, non-trade receivables is less than book value. (f) Represents the cash portion of the GFS earnout and CAGR adjustment. Conservative case liability is based on the book value of the estimated earnout. Company case liability includes only the value of the GFS earnout currently “in-the-money” .. 8
EXHIBITS
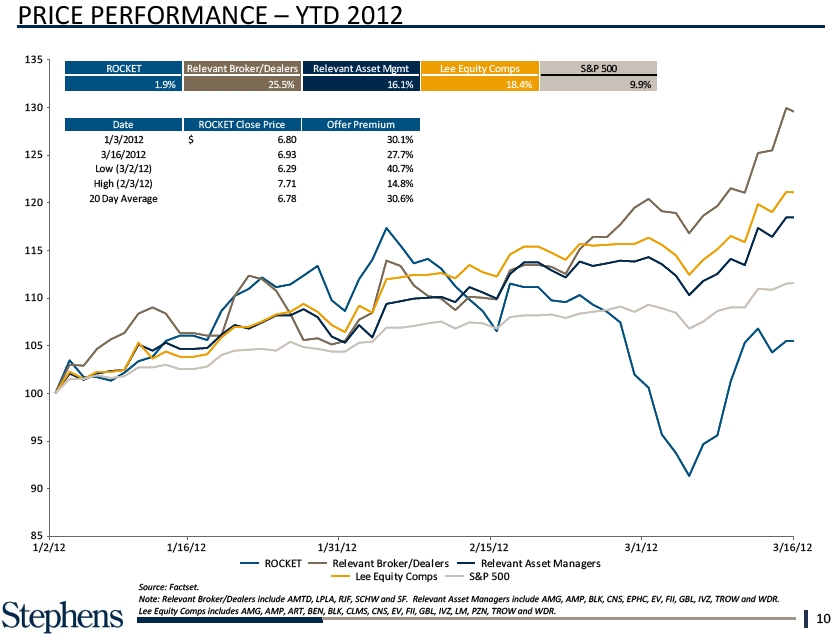
PRICE PERFORMANCE – YTD 2012 ROCKET Date 85 1/3/2012 3/16/2012 Low ( 3/2/12) Hi gh ( 2/3/12) 20 Day Ave rage 1/2/12 Source: Factset. Note: Relevant Broker/Dealers include AMTD, LPLA, RJF, SCHW and SF. Relevant Asset Managers include AMG, AMP, BLK, CNS, EPHC, EV, FII, GBL, IVZ, TROW and WDR. Lee Equity Comps includes AMG, AMP, ART, BEN, BLK, CLMS, CNS, EV, FII, GBL, IVZ, LM, PZN, TROW and WDR. 10
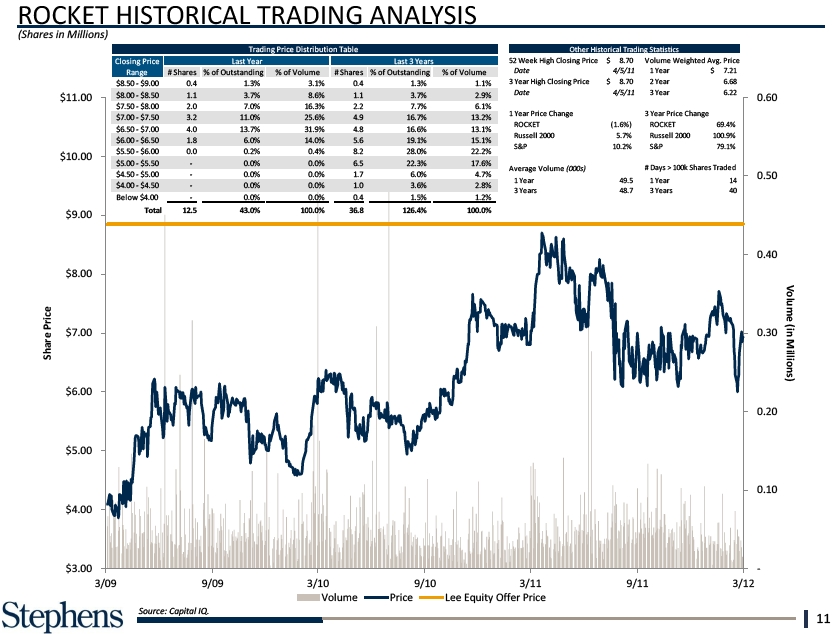
ROCKET $5.50 - $6.00 Russell 200 . 0 (Shares in Millions) $5.00 - $5.50 S&P -$4.50 - $5.00 - $4.00 - $4.50 Average Volume - (000s Below $4.00 1 Year - 3 Years Total 12.5 $3.00 3/0 Source: Capital IQ. 11

TRADING Affiliated INDUSTRY Man (Dollars in Eaton Vance C BROKER/DEALERS Federated Financial Inv Waddell & Reed GAMCO Invest Cohen & Steer MANAGERS Epoch Holding ASSET Source: Company filings, Capital IQ & SNL Financial. Criteria: Selected broker/dealers and asset managers, generally with expected revenue and EPS growth, market caps between $600.0 million and $36.0 billion, available earnings estimates and a majority of revenue derived from asset management and retail commissions. Note: No directly comparable public companies exist. We note that the selected group are much larger companies than ROCKET, with greater market liquidity. (a) Enterprise Value calculated as market cap plus debt and less cash (with certain exceptions). For SCHW and AMTD, restricted cash is not deducted. For RJF and SF, cash at bank subsidiaries is not deducted. (b) FactSet median estimates. 12
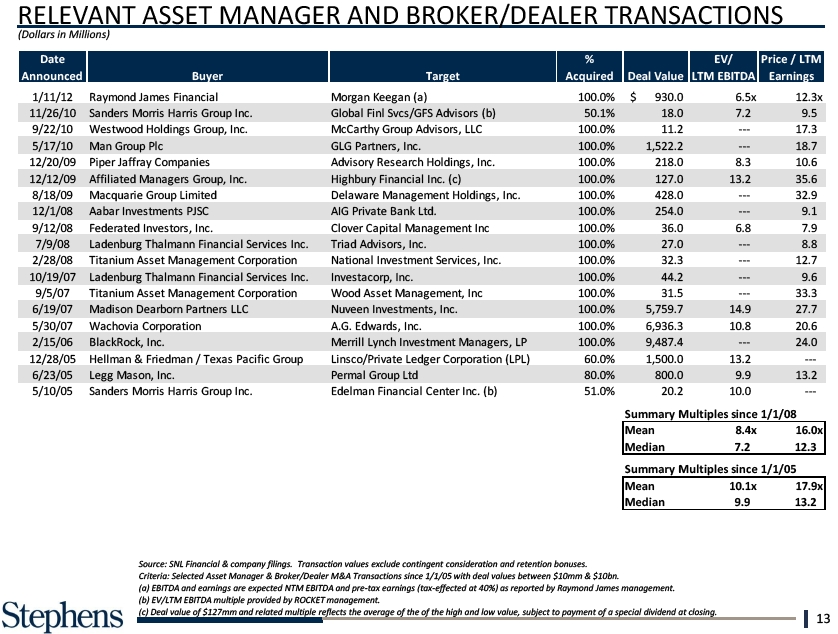
RELEVANT ASSET MANAGER AND BROKER/DEALER TRANSACTIONS (Dollars in Millions) Source: SNL Financial & company filings. Transaction values exclude contingent consideration and retention bonuses. Criteria: Selected Asset Manager & Broker/Dealer M&A Transactions since 1/1/05 with deal values between $10mm & $10bn. (a) EBITDA and earnings are expected NTM EBITDA and pre-tax earnings (tax-effected at 40%) as reported by Raymond James management. (b) EV/LTM EBITDA multiple provided by ROCKET management. (c) Deal value of $127mm and related multiple reflects the average of the of the high and low value, subject to payment of a special dividend at closing. 13
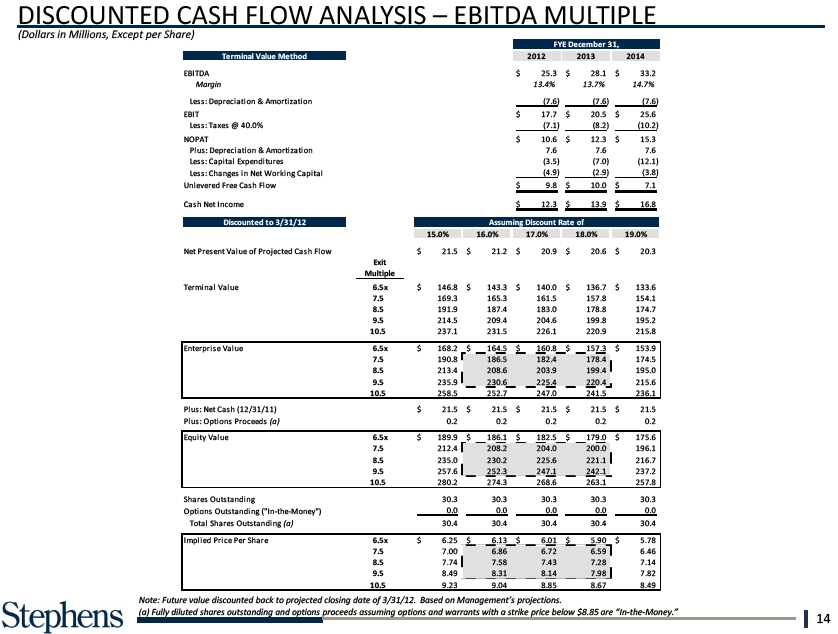
DISCOUNTED CASHTotal ANALYSIS Shares MULTIPLE Outstand (Dollars in Millions, Except per Share) Implied Price Per Share Note: Future value discounted back to projected closing date of 3/31/12. Based on Management’s projections. (a) Fully diluted shares outstanding and options proceeds assuming options and warrants with a strike price below $8.85 are “In-the-Money.” 14

DISCOUNTED Total ANALYSIS Shares INCOME Outst (Dollars in Millions, Except per Share) Implied Price Per Sh Note: Future value discounted back to projected closing date of 3/31/12. Based on Management’s projections. (a) Fully diluted shares outstanding and options proceeds assuming options and warrants with a strike price below $8.85 are “In-the-Money.” 15
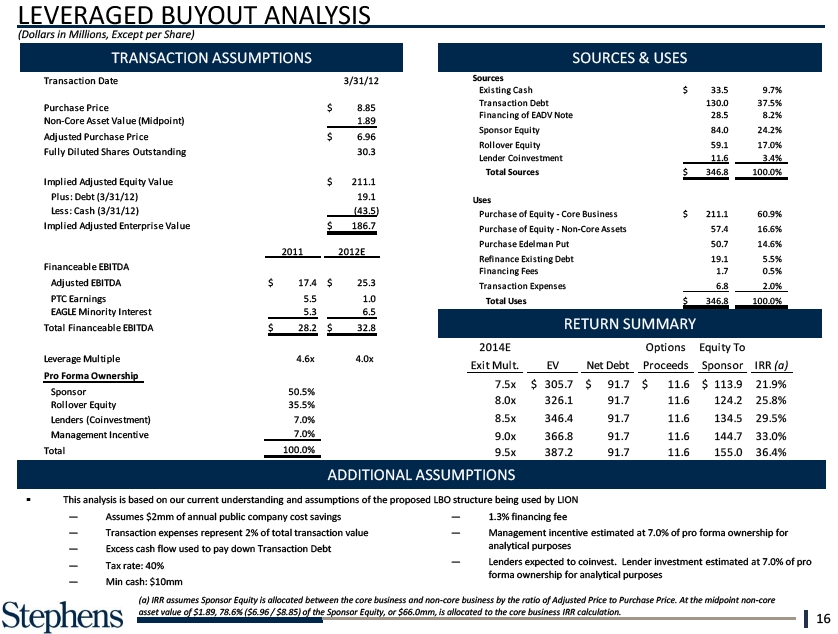
LEVERAGED Adj usBUYOUT ted Purchas ANALYSIS e Pri ce (Dollars in Millions, Except per Share) Purchase of Equity Ful l y Di l uted Shares Outs tandi&ng Purchase Edelman Impl i ed Adj us ted Equi ty Val ue Refinance Existing Pl us : Debt (3/31/12) Les s : Cas h (3/31/12) Financing Fees Fi na ncea bl e EBI TDA Impl i ed Adj us ted Enterpri s e Val ue Adj us ted EBI TDA Transaction Expen PTC Ea rni ngs EAGLE Mi nori ty I nteres tTotal Uses Tota l Fi na ncea bl e EBI TDA 2014E RETURN SUMMARY Exi t Mul t. EV Pro Levera Forma ge Ownership Mul ti pl e 7.5x $ 305 Spons or 8.0x 326 Rol l over Equi ty 8.5x 346 Lenders (Coi nves tment) Ma na gement I ncenti ve 9.0x 366 Tota l 9.5x 387 ADDITIONAL ASSUMPTIONS § This analysis is based on our current understanding and assumptions of the proposed LBO structure being used by LION — Assumes $2mm of annual public company cost savings — 1.3% financing fee — Transaction expenses represent 2% of total transaction value — Management incentive estimated at 7.0% of pro forma ownership for — Excess cash flow used to pay down Transaction Debt analytical purposes — Tax rate: 40% — Lenders expected to coinvest. Lender investment estimated at 7.0% of pro forma ownership for analytical purposes — Min cash: $10mm (a) IRR assumes Sponsor Equity is allocated between the core business and non-core business by the ratio of Adjusted Price to Purchase Price. At the midpoint non-core asset value of $1.89, 78.6% ($6.96 / $8.85) of the Sponsor Equity, or $66.0mm, is allocated to the core business IRR calculation. 16

PREMIUMS PAID ANALYSIS 1 Da > 100% 3.2% ASSUMPTIONS SUMMARY STATISTICS – PREMIUMS PAID Mean § Stephens 90.0% analyzed recent - 100.0% transactions the Medi 90. 4.3%100 an .0% following characteristics: 80.0% traded -on90.0% 80. 1.1%90.0 U.S.-based 1 Da 70.0% - since 80.0% 1/1/2010 70. 4.3%80. Excluded transactions in the real estate and energy Mean 60.0% industries - 70.0% 60. 4.3%70.0% Positive LTM EBITDA Medi an 50.0%value - 60.0% $ 500 5010.0% .6%60.0% million 40.0% - 50.0% 4011.0% .7%50.0% DISTRIBUTION OF PREMIUMS DIST. OF PREMIUMS – FIN. SERV. COMPANIES 30.0% - 40.0% 3031.0% .9%40.0% 20.0% - 30.0% 2012.0% .8%30.0% 10.0% - 20.0% 10. 9.6%20.0% 0.0% - 10.0% 0. 6.4% 10.0% Total Total 100.0% Source: Thomson Banker. 17

2/26/10 § A number of recent 2/11/10 Financial buyers Deal size greater than $50 million 4/3/09 2/20/09 Source: Capital IQ and MergerMetrics. Note: Termination fee % is the termination fee as a percentage of equity value. (a) Denotes duration of primary go-shop period only. (b) Go-Shop period extendable to 55 days if the Board receives a superior proposal within the first 40 days. 18
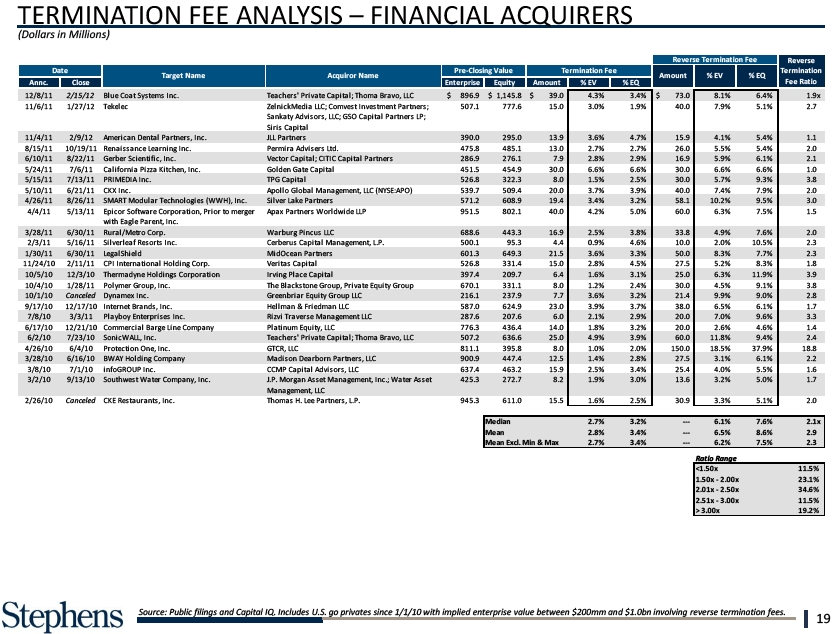
TERMINATION FEE ANALYSIS – FINANCIAL ACQUIRERS (Dollars in Millions) Source: Public filings and Capital IQ. Includes U.S. go privates since 1/1/10 with implied enterprise value between $200mm and $1.0bn involving reverse termination fees. 19

EADV/SALIENT RECEIVABLE VALUATION (Dollars in Millions) § Book value at 12/31/11 is based on a 12% discount rate for EADV and a 10% discount rate for the Salient Note§ Proceeds related to EADV are fully taxable § The table below indicates the value of the receivable with management’s 12% / 10% discount rates vs. a more conservative 16% discount rate VALUATION SENSITIVITY Ca s e Compa ny Ca s e Cons er va ti ve Ca s Source: Company filings and provided materials. 20
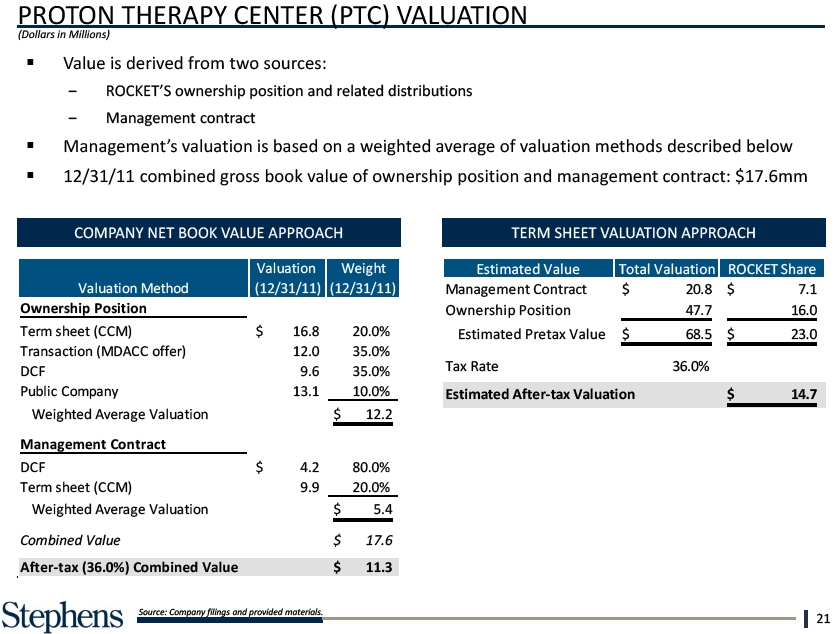
PROTON THERAPY CENTER (PTC) VALUATION (Dollars in Millions) § Value is derived from two sources: Managementdistributions Contract § Management’s valuation is based on a weighted average of valuation methods described below § combined gross book value of ownership position and management contract: $17.6mm DCF Estimated COMPANY NET BOOK VALUE APPROACH TERM SHEET VALUATION APPROACH Co Term sheet (CCM) Ownership Posi Estimated Pre Weighted Tax Rate Estimated After Combined Value After-tax (36.0%) Combined V Source: Company filings and provided materials. 21

“ADJUSTED” INCOME (Dollars in Millions) Pretax Income Cash Net Income Margins: EBITDA Pretax Income (a) Cash Net Income defined as Net Income plus tax-effected amortization. Source: Company filings and provided materials. 22

CONSOLIDATED BALANCE SHEET (Dollars in Millions) Equity: Common Equity (a) Noncontrolling intere Total Equity Total Liabilities & Equi (a) Cash and Common Equity are pro forma for the $8.0mm repurchase of the Fletcher warrants. Source: Company filings and provided materials. 23

EAGLE PUT EAGLE Put Value § This information is in§ Key put terms are as follows: EAGLE has the right Ito mp interest lied Enterprise V Price is based on EFS’s TTM pretax income multiplied by 9.5x Put is triggered by signing2011a EFSalthough EBITDAthe put upon closing Implied EBITDA Multi Transaction EBITDA M Implied EAGLE Put Discount of EAGLE Pu 24

QUARTERLY MARKET MOVEMENT IMPACT ON AUM (25.0%) 2Q0 Note: Data labels correspond with the blue line – market movement in AUM. Source: Company provided materials. 25

QUARTERLY NET ASSET FLOW (Dollars in Millions) $(600.0) 2Q0 Note: Excludes the impact of acquisitions and dispositions. Source: Company provided materials. 26

Market Appreci at (Dollars in Millions) Total Change i n A AUM Net New Fl o Market Appreci at Total Change i n A Note: Excludes the impact of acquisitions and dispositions. Source: Company provided materials. 27
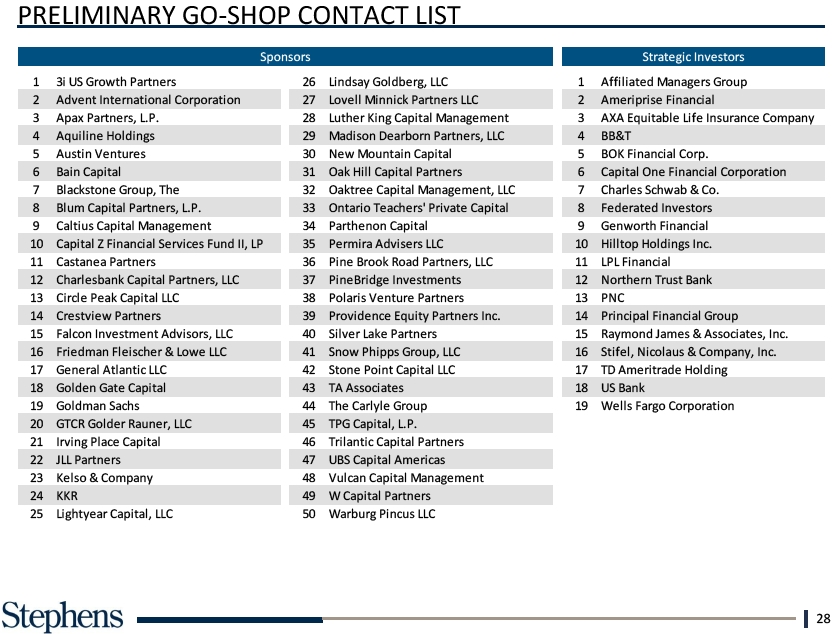
21 Irving Pla 22 JLL Partn 23 Kelso & 24 KKR 25 Lightyear 28