Exhibit (c)(8)

PROJECT ROCKET SPECIAL COMMITTEE DISCUSSION MATERIALS JANUARY 18, 2012
1/13/12 MEETING UPDATE § Call participants included LION, ROCKET, and Stephens§ Primary call topics: Potential overhead cost savings Preliminary Q4 financial update Overview of TP negotiations and potential financial impact General business update § Key observations / conclusions: No material adjustments to the current EBITDA run rate resulted from the call Q4 AUM and Revenues came in below budget, but earnings were in-line based on lower than projected expenses Lead flows in January are up 30% year-over-year, possibly due to two new radio markets and improving investor sentiment After the call, Gormley conveyed via email that LION was aware of most of the information provided on the call and had already considered the information in their valuation; LION’s offer did not change as a result of the call 2

ESTIMATED COST SAVINGS DISCUSSION (Dollars in Thousands) Overhead Mitiga § Management further detailed and discussed COST SAVINGS DETAIL approximately $2mm in potential cost savings related to public company expenses Retail branch op§ Discussed additional annualized cost savings related to Juda lease expense expiring in June 2012 § Reviewed overhead mitigation plans potentially providing a $1.5mm net increase to EBITDA from discontinuing retail branch operations Potential savings are very preliminary and likely can’t be recognized in the next twelve months Future Assets: § Future one-time tax benefit of $2.5mm from vesting of stock-based compensation in connection with a sale transaction Tax benefit fro Source: Company Management. 3

TP ACQUISITION UPDATE (Dollars in Thousands) § Management updated all parties on the status of TP ACQUISITION HIGHLIGHTS negotiations and potential pro forma impact of Potential Total the transaction § Expects to acquire a 60% stake in approximately $1.3bn in AUM Will eventually convert AUM from current platform to EMAP Management believes the client assets will be Consideration converted without much difficulty § Management expressed confidence in closing the transaction by early April or early July Cash§ Additional acquisitions similar to the TP opportunity could become available if other Stock advisors within Ameriprise perceive EMAP as a better alternative However, the TP acquisition would likely use up all of the Company’s excess cash as of 9/30 Source: Company Management. 4
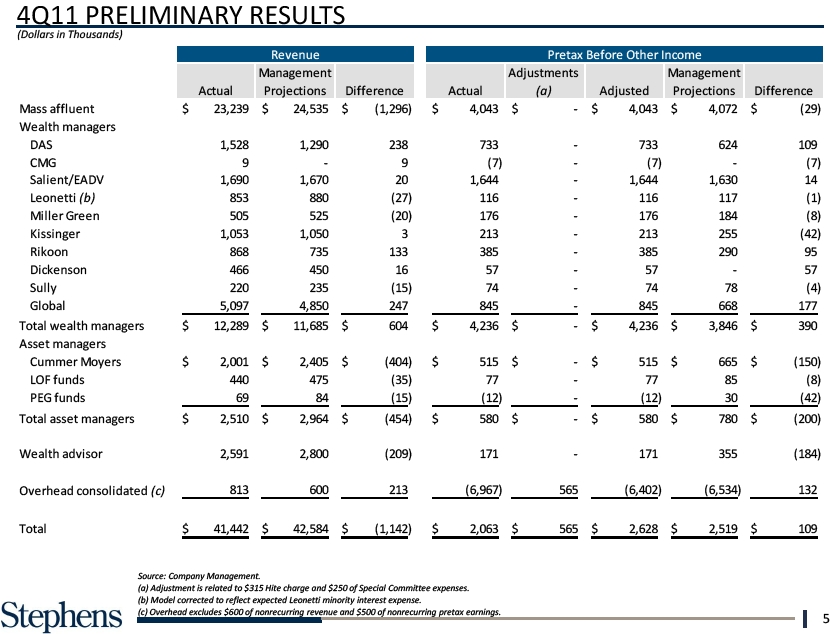
4Q11 (DollarsWealth PRELIMINARY RESULTS advisor Overhead cons Total Source: Company Management. (a) Adjustment is related to $315 Hite charge and $250 of Special Committee expenses. (b) Model corrected to reflect expected Leonetti minority interest expense. (c) Overhead excludes $600 of nonrecurring revenue and $500 of nonrecurring pretax earnings. 5

EBITDA ADJUSTMENTS LA PRELIMINARY Juda Lease TO CHANGE (Dollars in Thousands) Leonetti Correcti on Q4 Actual vs. Manage Updated 2011E EBITDA Change Source: Company Management. 6

NEGOTIATION CHRONOLOGY 9/30/11 11/25/11 12/8/11 12/14/11 12/17/11 12/23/11 1/6/12 Party LION ROCKET LION ROCKET LION ROCKET LION Price $8.00 – $8.25 High $9.00 – $8.00 Reiterated $9.25 $8.50 $9.10 $8.60 Low $10.00 Range Go-Shop No Shop “Reasonable” Did not “Full” Go-Shop 20 Business 45 Days (Plus 30 35 Days Period Go-Shop specifically Days days to sign a Provisions address superior offer) Breakup Consistent with Did not Did not Did not 3.5% 1.375% during 2.75% during Fee other specifically specifically specifically Go-Shop (2.75% Go-Shop (3.5% Transaction transactions address address address after Go-Shop) after Go-Shop) Value defined to include EAGLE’s Transaction Transaction minority interest Value defined to Value defined to exclude EAGLE’s include EAGLE’s minority interest minority interest 7
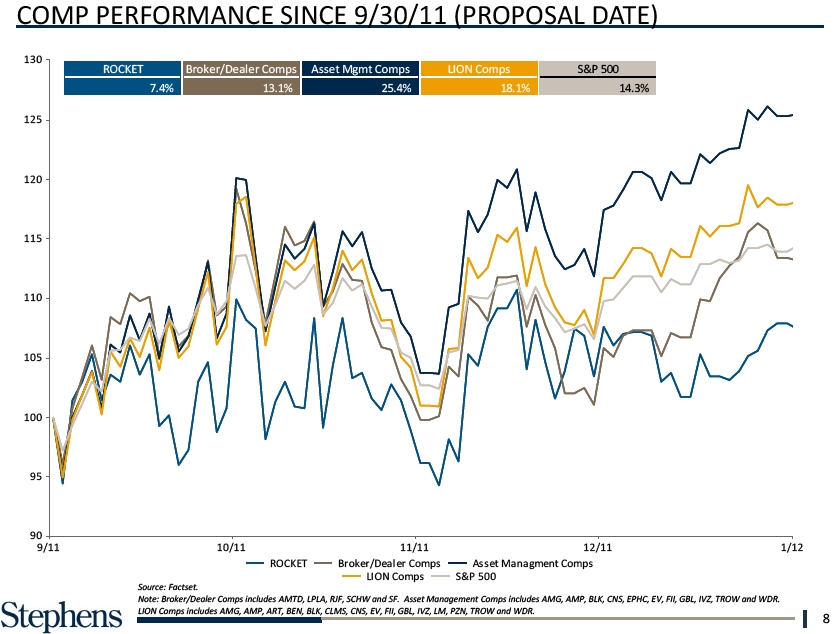
COMP PERFORMANCE SINCE 9/30/11 (PROPOSAL DATE) ROCKET 7.4 90 9/11 Source: Factset. Note: Broker/Dealer Comps includes AMTD, LPLA, RJF, SCHW and SF. Asset Management Comps includes AMG, AMP, BLK, CNS, EPHC, EV, FII, GBL, IVZ, TROW and WDR. LION Comps includes AMG, AMP, ART, BEN, BLK, CLMS, CNS, EV, FII, GBL, IVZ, LM, PZN, TROW and WDR. 8
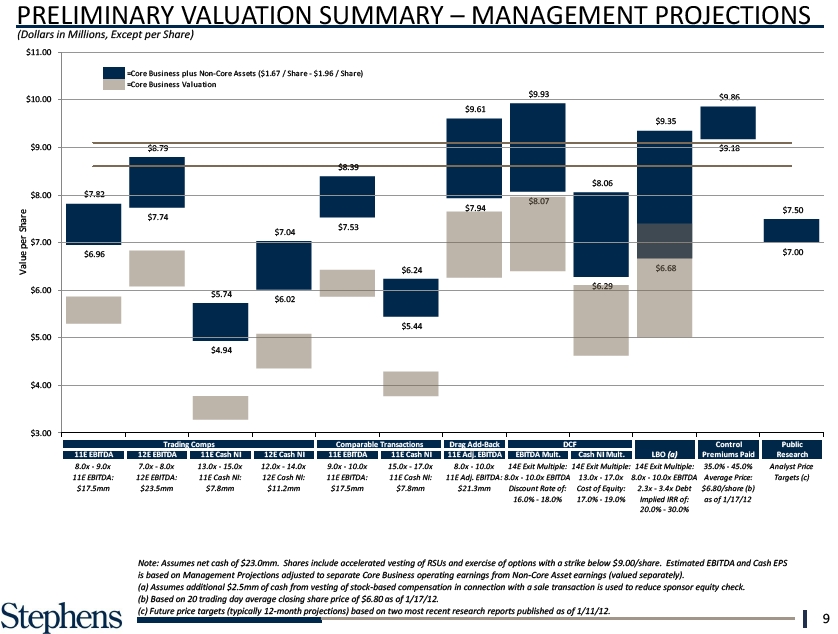
PRELIMINARY VALUATION SUMMARY – MANAGEME (Dollars in Millions, Except per Share) 1 8 11 $ Note: Assumes net cash of $23.0mm. Shares include accelerated vesting of RSUs and exercise of options with a strike below $9.00/share. Estimated EBITDA and Cash EPS is based on Management Projections adjusted to separate Core Business operating earnings from Non-Core Asset earnings (valued separately). (a) Assumes additional $2.5mm of cash from vesting of stock-based compensation in connection with a sale transaction is used to reduce sponsor equity check. (b) Based on 20 trading day average closing share price of $6.80 as of 1/17/12. (c) Future price targets (typically 12-month projections) based on two most recent research reports published as of 1/11/12. 9

PRELIMINARY VALUATION SENSITIVITY (Dollars in Millions, Except per Share) Adjusted Enterp 2011E EBITDA M 2011E Adjusted 2012E EBITDA M 2012E Adjusted (a) Shares include accelerated vesting of RSUs, exercise of options with a strike below the offer price per share and shares expected to be issued related to the GFS acquisition. (b) For analytical purposes, EBITDA is adjusted by adding back $3.8mm and $2.5mm of pretax losses related to ROCKET office expansion efforts in 2011 and 2012, respectively. 10
APPENDIX

ROCKET $5.50 - $6.00 Russell 2000 (Shares in Millions) $5.00 - $5.50 S&P -$4.50 - $5.00 -$4.00 - $4.50 Average Volume - (000 Below $4.00 -1 Year Total 3 Years 12.5 $3.00 1/0 Source: Capital IQ. 12

70 ROCKET 160 HISTORICAL INDEXED PERFORMANCE ROCKET’S stock has outperformed its peers’ since 2008 140 6 MONTH 60 1 YEAR ROCKET Broke ROCKET al 7/11 ( 13.4%) 1/11 ( 120 60 ROCKET 100 Ma Asset 40 nag 80 60 3 YEARS 20 5 YEARS ROCKET Broke ROCKET al 1/09 59.1% ( 41 ROCKET Asset Manage Source: Factset. Note: Broker/Dealer Comps includes AMTD, LPLA, RJF, SCHW and SF. Asset Management Comps includes AMG, AMP, BLK, CNS, EPHC, EV, FII, GBL, IVZ, TROW and WDR. 13
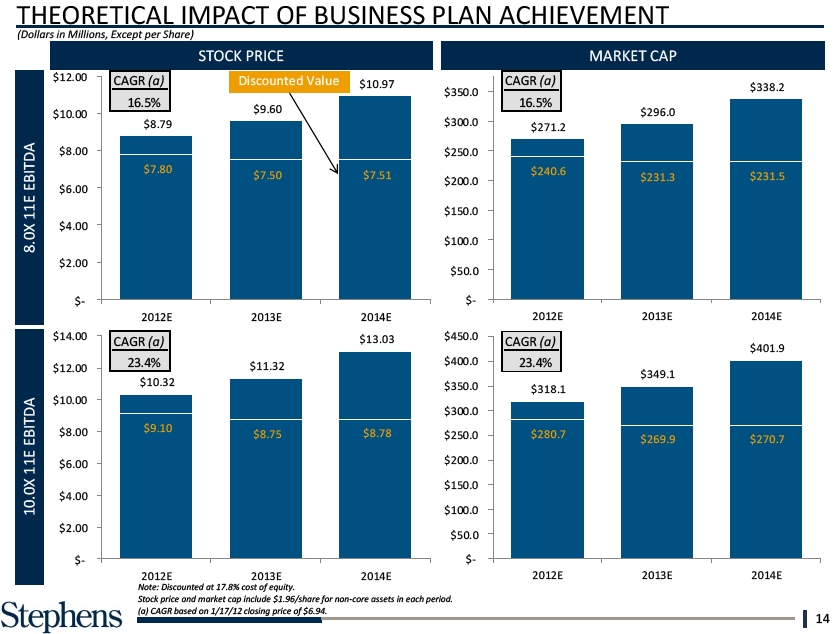
THEORETICAL IMPACT OF $10.32 (Dollars in Millions, $Except per .Share) $350.0 $10.00 STOCK PRICE AP $300.0 EBITDA $2 8.00 $9.10 $250.0 11E 8.0X $200.0 $6.00 $-$150.0 $4.00 $100.0 EBITDA $2.00 $50.0 11E 10.0X $- $-2012E Note: Discounted at 17.8% cost of equity. Stock price and market cap include $1.96/share for non-core assets in each period. (a) CAGR based on 1/17/12 closing price of $6.94. 14

PRELIMINARY SUM OF THE PARTS ANALYSIS – SUMMARY (Dollars in Millions, Except per Share) BELOW IS A SUMMARY OF IMPLIED PER SHARE VALUES BASED ON A SUM OF THE PARTS ANALYSIS ASSUMING CORPORATE OVERHEAD ALLOCATION OF 80% TO OTHER WEALTH MANAGEMENT AND 20% TO MASS AFFLUENT 2011E 2011E Adj uste d 2012E 2012E Adj uste d (a) For analytical purposes, EBITDA is adjusted by adding back $3.8mm and $2.5mm of pretax losses related to ROCKET office expansion efforts in 2011 and 2012, respectively. 15

NON-CORE ASSETS PRELIMINARY VALUATION COMPARISON (Dollars in Millions, Except per Share) Concept Other GFS Earnout (e Total Value per Shar Note: Estimated marketable values reflected herein are based on information provided by management and take into account the illiquidity of many of these assets/investments. Estimated marketable values reflect estimates based on such information to reach an informed opinion, and do not constitute an appraisal or certification of value. Note: LION data based on our preliminary understanding from discussions to date. (a) Net of estimated deferred tax liability and any other related liabilities. (b) Calculated based on negotiations with a prospective buyer at an estimated offer price of $68.5mm. ROCKET’s ownership in PTC would result in a pre-tax value of $23.0mm to the Company, or $14.7mm after tax. (c) Level 1 Assets consist primarily of ROCKET common stock. (d) Level 2 & 3 Assets consist of warrants and other securities, primarily associated with private equity investments. (e) Represents the cash portion of the GFS earnout and CAGR adjustment. LION’s liability includes the value of the “in-the-money” earnout and “out-of-the-money” CAGR adjustment. Stephens liability includes only the value of the “in-the-money” GFS earnout. Source: Company filings and provided materials. 16
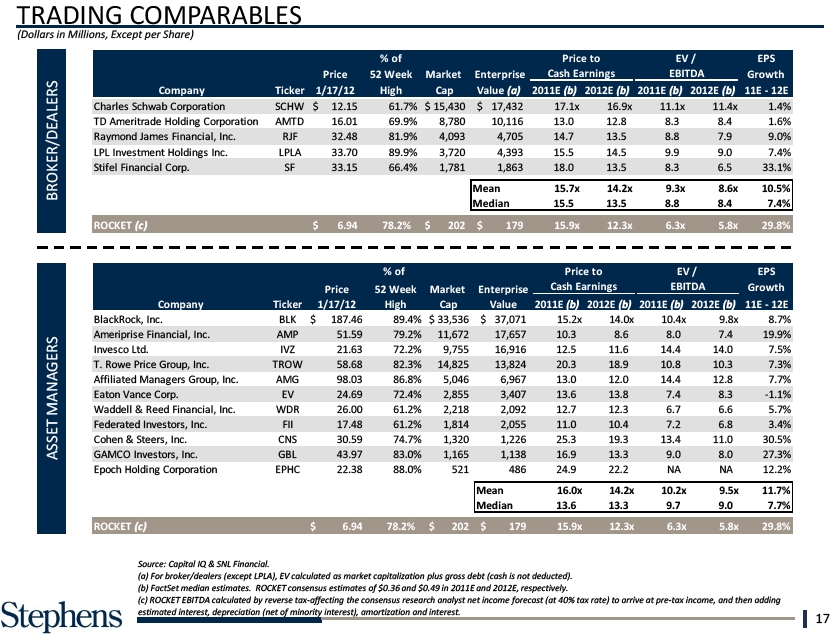
TRADING LPL Inves tment (Dollars in Millions, Waddell & Reed Stifel Financial BROKER/DEALERS Federated Inves Cohen & Steers GAMCO Investo Epoch Holding MANAGERS ASSET ROCKET (c) Source: Capital IQ & SNL Financial. (a) For broker/dealers (except LPLA), EV calculated as market capitalization plus gross debt (cash is not deducted). (b) FactSet median estimates. ROCKET consensus estimates of $0.36 and $0.49 in 2011E and 2012E, respectively. (c) ROCKET EBITDA calculated by reverse tax-affecting the consensus research analyst net income forecast (at 40% tax rate) to arrive at pre-tax income, and then adding estimated interest, depreciation (net of minority interest), amortization and interest. 17

6/23/05 L 5/10/05 S Source: SNL Financial & company filings. Criteria: Selected Asset Manager & Broker/Dealer M&A Transactions since 1/1/05 with deal values between $10mm & $3bn. (a) EBITDA and earnings are expected NTM EBITDA and pre-tax earnings (tax-effected at 40%) as reported by Raymond James management. (b) EV/LTM EBITDA multiple provided by ROCKET management. 18

RJF ACQUISITION OF MORGAN KEEGAN (Dollars in Millions) § Regions initially announced plans to sell Morgan Keegan in June 2011 in order to repay TARP Other rumored potential bidders included Stifel Financial, along with several private equity firms Stifel is rumored to have bid $875mm in cash and stock on January 8 Raymond James and Regions announced the deal on January 11§ Morgan Keegan will also pay Regions a $250mm dividend before closing Dividend is not included in the transaction value, as the payment appears to be from excess cash and no debt is assumed by Raymond James§ Morgan Asset Management and Regions Morgan Keegan Trust are not included in the sale and will remain part of Regions’ Wealth Management organization§ Regions will indemnify Raymond James for any and all claims related to certain matters (e.g., RMK Funds, ARS matters, etc.), and for all post-closing litigation arising from pre-closing events, subject to a $2mm annual deductible for the first three years§ Regions and Raymond James also announced that they would N enter into t “several mutually beneficial business relationships”, (b) including for deposits and loan referrals ACQUISITION VALUATION Value Purchase Price / 2012E EBITDA 2012E Net Income Tangible Book Value Source: Company filings and news reports. (a) Expected NTM EBITDA as reported by RJF. (b) Expected NTM pre-tax income as reported by RJF, tax effected at 40.0%. 19
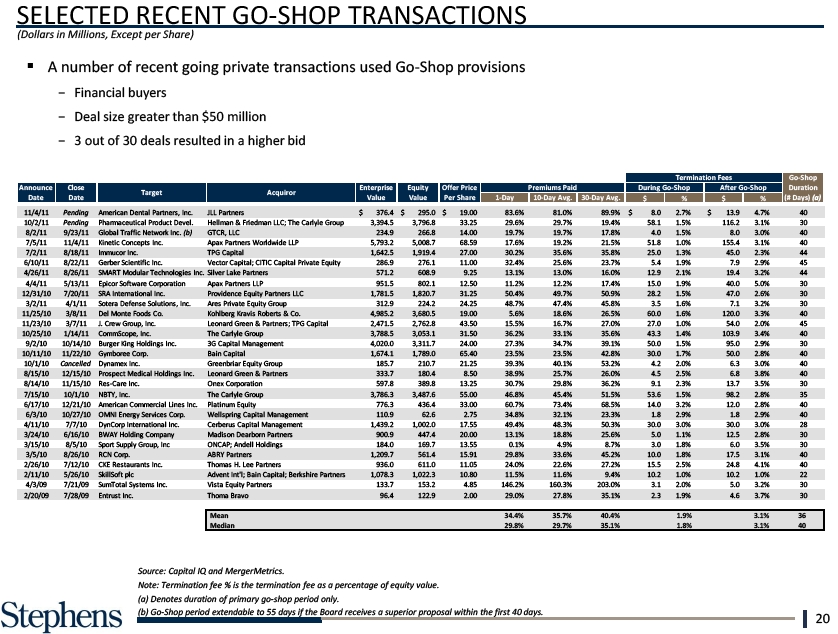
2/26/10 SELECTED (Dollars in Millions, Except 2/11/10 3 out of 30 deals resulted in a higher bid 4/3/09 2/20/09 Source: Capital IQ and MergerMetrics. Note: Termination fee % is the termination fee as a percentage of equity value. (a) Denotes duration of primary go-shop period only. (b) Go-Shop period extendable to 55 days if the Board receives a superior proposal within the first 40 days. 20