Exhibit (c)(6)

PROJECT ROCKET SPECIAL COMMITTEE DISCUSSION MATERIALS DECEMBER 14, 2011

TABLE OF CONTENTS I. PROCESS UPDATE 3 II. LION DISCUSSIONS 5 III. PRELIMINARY VALUATION SUMMARY 9 IV. PROCESS ALTERNATIVES 12 APPENDIX 18 A. PRELIMINARY VALUATION SUPPORT B. MANAGEMENT PROJECTIONS This presentation was prepared exclusively for the benefit and internal use of the ROCKET Special Committee in order to indicate, on a preliminary basis, the feasibility of a possible transaction or transactions and does not carry any right of publication or disclosure to any other party. The contents of this presentation may not be used for any other purpose without the prior written consent of Stephens Inc. This foregoing material has been presented solely for informative purposes as of its stated date and is not a solicitation, or an offer, to buy or sell any security. It does not purport to be a complete description of the products, securities, markets or developments referred to in the material. Information included in the presentation was obtained from sources considered to be reliable, but has not been independently verified and is not guaranteed to be accurate or complete. All expressions of opinion apply on the date of the presentation. No subsequent publication or distribution of this presentation shall mean or imply that any such information or opinion is accurate or remains current at any time after the stated date of the presentation. You will not be advised of any changes in any such information or opinion. Stephens Inc., its employees, officers, directors and/or affiliates may from time to time have a long or short position in the securities mentioned and may sell or buy such securities. Stephens does not provide legal, tax or accounting advice; please consult your legal or tax professional. The individuals principally responsible for preparation of this presentation have received compensation that is based upon, among other factors, Stephens Inc.’s investment banking revenues. Additional information available upon request. ©Stephens Inc. 2011

I. PROCESS UPDATE 3
PROCESS UPDATE § Since the Special Committee meeting on 11/21, the process has primarily involved: – Continued due diligence focused on Q4 projections, 2011E EBITDA run rates, and non-core asset valuations – Discussions with LION about due diligence and bidding matters § Based on the results of diligence and discussions to date, Stephens has prepared updated materials for the Special Committee regarding: – LION valuation approach and bid status – Stephens preliminary valuation analysis – Process alternatives and next steps 4

II. LION DISCUSSIONS 5

LION VALUATION APPROACH (Dollars in Millions, Except per Share) § LION’s negotiating strategy has been to focus narrowly on LION IMPLIED VALUATION ult 2011E run rate EBITDA – Recalculated 2011E EBITDA pro forma for new expenses or cost savings in effect at the end of the year LION Adjusted 2011 – Significantly reduces EBITDA due to the investment associated with newly opened offices§ LION maintains that since its initial bid, it has learned of two items that materially affect its analysis: 2011E EBITDA + Dra – EADV receivable is fully taxable (both principal and interest), resulting in a value reduction of approximately $0.67 per share – Overstating EBITDA by approximately $1.2mm of PTC-related earnings 2012E EBITDA Mult § At $8.00 per share, LION contends it is offering 12.0x its adjusted 2011E EBITDA figure – Assumes $1.63 per share for non-core assets (see p8)§ However, the implied multiple is (i) 8.1x 2011E EBITDA adjusted for the negative impact (“drag”) from investment in new offices and (ii) 7.2x 2012E EBITDA Note: LION data based on our preliminary understanding from discussions to date. (a) LION shares include 156k shares related to the CAGR portion of the GFS earnout. 6

RUN RATE EBITDA COMPARISON (Dollars in Thousands) Interest LION: Certain cost savings are not yet in effect EBITDA Stephens: Certain savings already in effect; other identified savings will be effective in less than one year LION: 4Q11 new office losses should be annualized and Plus: EFX Drag deducted from 2011 EBITDA; no credit for investment because all new offices not cash flow positive until 2015 Stephens: Actual 2011 new office drag should be added to EBITDA; investment increases, not Adjusted EBITDA decreases, value; in aggregate, new office cash flow improves substantially in 2012 and is positive in 2013 Note: LION data based on Stephens preliminary understanding from discussions to date. 7

NON-CORE ASSETS PRELIMINARY VALUATION COMPARISON (Dollars in Millions, Except per Share) Concept Other GFS Earnout (d Total Value per Shar Note: Estimated marketable values reflected herein are based on information provided by management and take into account the illiquidity of many of these assets/investments. Estimated marketable values reflect estimates based on such information to reach an informed opinion, and do not constitute an appraisal or certification of value. Note: LION data based on our preliminary understanding from discussions to date. (a) Net of estimated deferred tax liability and any other related liabilities. (b) Level 1 Assets consist primarily of ROCKET common stock. (c) Level 2 & 3 Assets consist of warrants and other securities, primarily associated with private equity investments. (d) Represents the cash portion of the GFS earnout and CAGR adjustment. LION’s liability includes the value of the “in-the-money” earnout and “out-of-the-money” CAGR adjustment. Stephens liability includes only the value of the “in-the-money” GFS earnout. Source: Company filings and provided materials. 8

III. PRELIMINARY VALUATION SUMMARY 9

PRELIMINARY VALUATION SUMMARY – MANAGEME (Dollars in Millions, Except per Share) 1 8 11 $ Note: Assumes net cash of $23.0mm. Shares include accelerated vesting of RSUs and exercise of options with a strike below $9.00/share. Estimated EBITDA and Cash EPS is based on Management Projections adjusted to separate Core Business operating earnings from Non-Core Asset earnings (valued separately). (a) Based on 20 trading day average closing share price of $6.65 as of 12/13/11. (b) Future price targets (typically 12-month projections) based on two most recent research reports published as of 11/8/11. 10

PRELIMINARY VALUATION SENSITIVITY (Dollars Non in Millions, Except per Share) -Core Asset Adjusted Ente 2011E EBITDA 2011E Adjuste 2012E EBITDA (a) Shares include accelerated vesting of RSUs, exercise of options with a strike below the offer price per share and shares expected to be issued related to the GFS acquisition. (b) For analytical purposes, we adjusted EBITDA by adding back $3.8mm of pretax losses related to ROCKET office expansion efforts in 2011. 11

IV. PROCESS ALTERNATIVES 12

THREE PRINCIPAL ALTERNATIVES PROS CONS CONTINUE TO§ LION has done substantial work and has§ So far, LION has declined to raise its bid above $8.00 NEGOTIATE informational and timing advantages at this point§ LION has said it has some flexibility to pay more than WITH LION § Management appears comfortable with prospect of $8.00 per share, but unclear how much LION ownership § In the absence of competitive pressure from other bidders, LION appears to feel it has strong position with management/insider stockholder backing§ LION still has substantial due diligence to do, and may try to retrade any price agreed to now RUN A§ May find a buyer at more than $8.00 per share§ LION has stated it will not participate in process; PROCESS TO some potential bidders may take same position § Market check will bolster committee’s conviction SOLICIT BIDS§ about company value Confidentiality concerns FOR ROCKET § Senior management has stated openness to other§ Additional management distraction bidders at higher price § Length of time to complete, with associated business§ Insider stockholders appear to want liquidity and market risks§ Risk of failed process DETERMINE§ Allows company to focus on executing business plan§ Company specific risks: business plan execution, NOT TO business unit integration, management transition,§ Gives company an opportunity to achieve projected PURSUE A key man, etc. near-term growth, which should improve valuation POSSIBLE SALE § Market risks: stock market performance, etc. AT THIS TIME§ May enable company to capture more of non-core asset value in meantime 13
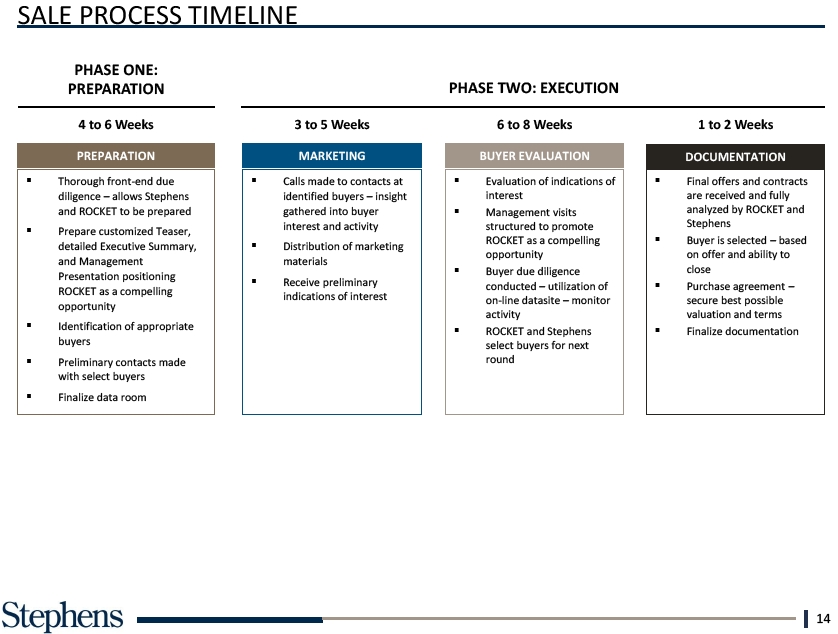
SALE PROCESS TIMELINE PHASE ONE: PREPARATION PHASE TWO: EXECUTION 4 to 6 Weeks 3 to 5 Weeks 6 to 8 Weeks 1 to 2 Weeks PREPARATION MARKETING BUYER EVALUATION DOCUMENTATION § Thorough front-end due§ Calls made to contacts at§ Evaluation of indications of§ Final offers and contracts diligence – allows Stephens identified buyers – insight interest are received and fully and ROCKET to be prepared gathered into buyer§ Management visits analyzed by ROCKET and interest and activity structured to promote Stephens§ Prepare customized Teaser, ROCKET as a compelling§ Buyer is selected – based detailed Executive Summary,§ Distribution of marketing opportunity on offer and ability to and Management materials§ Buyer due diligence close Presentation positioning§ Receive preliminary conducted – utilization of§ Purchase agreement –ROCKET as a compelling indications of interest on-line datasite – monitor secure best possible opportunity activity valuation and terms§ Identification of appropriate§ ROCKET and Stephens§ Finalize documentation buyers select buyers for next§ Preliminary contacts made round with select buyers§ Finalize data room 14

POTENTIAL LION TRANSACTION VS. BROAD SALE PROCESS TIMELINES Announcement File Proxy/HSR Finalize Proxy/Sha Closing 15

(Dollars in Billions) THIS IS A PRELIMINARY LIST OF PRIVATE EQUITY FIRMS WHICH WE BELIEVE HAVE AN INTEREST IN THE WEALTH MANAGEMENT SPACE AND WHICH ARE LARGE ENOUGH TO EFFECT A CONTROL TRANSACTION Fi rm KKR Warburg Pincus Source: PitchBook. 16

POTENTIAL STRATEGIC ACQUIRORS – PRELIMINARY LIST (Dollars in Millions) WE HAVE PROVIDED A LIST OF COMPANIES WHICH MIGHT HAVE AN INTEREST IN ROCKET. WE DO NOT HOWEVER HAVE A REASON TO BELIEVE THEY WOULD BE AGGRESSIVE BIDDERS FOR A COMPANY WITH ROCKET’S CHARACTERISTICS Market Market Company Description Company Description Cap Cap $1,797§ Provides comprehensive investment management to $28,342§ Provides retail banking, corporate and institutional banking, approximately 4,800 institutions and intermediaries including asset management and residential mortgage banking corporations, government entities, insurers and others§ Manages $351.7 billion in assets $9,685§ Provides securities brokerage services and technology-based $15,697§ Provides brokerage, banking, money management and financial financial services to retail investors, traders and independent advisory services to individuals and independent advisors RIAs§ Over 300 offices and 8.5 million active brokerage accounts, 1.5§ Offers products and services through the Internet, a network of million corporate retirement plan participants, 769,000 banking retail branches, mobile trading applications and via telephone accounts and $1.6 trillion in client assets $16,438§ Offers a full range of consumer and commercial banking, $3,412§ Provides life insurance, long term care insurance, financial securities brokerage, asset management, mortgage and protection coverages, and independent advisor-based wealth insurance products and services management§ Manages $168 billion in assets and operates 1,800 financial centers $1,670§ The Company’s broker-dealer affiliates provide securities§ Axa $33,798§ Operates in three major business lines: property-casualty brokerage, investment banking, trading, investment advisory insurance, life & savings, and asset management and related financial services to individual investors,§ 214,000 employees and 95 million clients professional money managers, businesses and municipalities§ In addition to a strong international presence, Stifle has 318 offices in 44 states $3,830§ The Company’s three principal wholly owned broker/dealers, $7,330§ Provides retirement and investment services, as well as Raymond James & Associates, Raymond James Financial insurance and banking Services and Raymond James Ltd. have approximately 5,400§ $320.8 billion in assets under management and 17.8 million financial advisors serving 2 million accounts in 2,400 locations customers worldwide§ Total client assets are approximately $256 billion§ Offices in Asia, Australia, Europe, Latin America and the U.S. $3,159§ Largest independent broker/dealer in the United States (based $10,684§ Offers financial planning services, investments, insurance and on revenue, Financial Planning magazine, June 1996-2011) annuity products§ Offers proprietary technology, comprehensive clearing and§ Over $650 billion in assets under management and compliance services, practice management programs and administration training, and independent research to about 12,800 financial§ Top-10 provider of mutual funds, financial planning, annuities advisors and roughly 730 financial institutions and insurance Source: SNL Financial. 17
APPENDIX 18
A. PRELIMINARY VALUATION SUPPORT 19
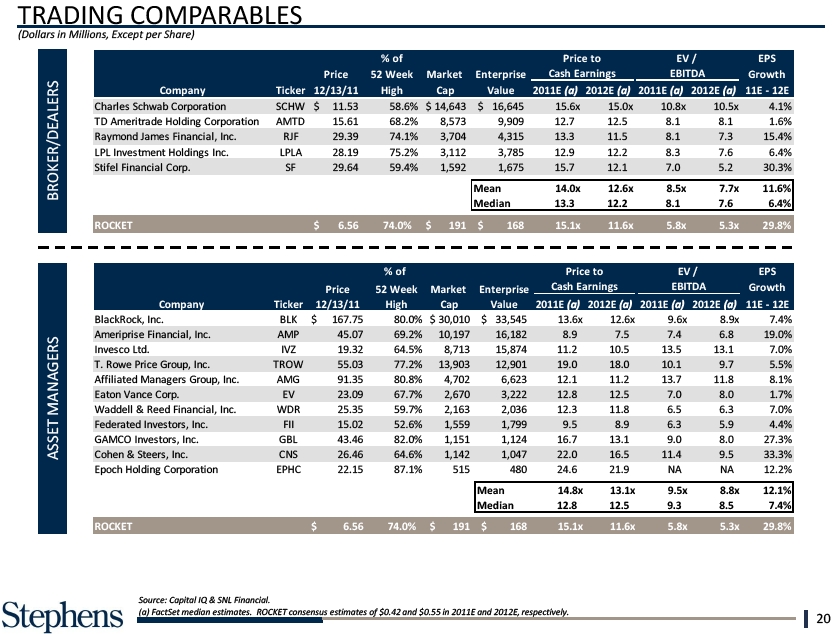
TRADING LPL Inves tment (Dollars in Millions, Waddell & Reed Stifel Financial BROKER/DEALERS Federated Inves GAMCO Investo Cohen & Steers Epoch Holding MANAGERS ASSET ROCKET Source: Capital IQ & SNL Financial. (a) FactSet median estimates. ROCKET consensus estimates of $0.42 and $0.55 in 2011E and 2012E, respectively. 20
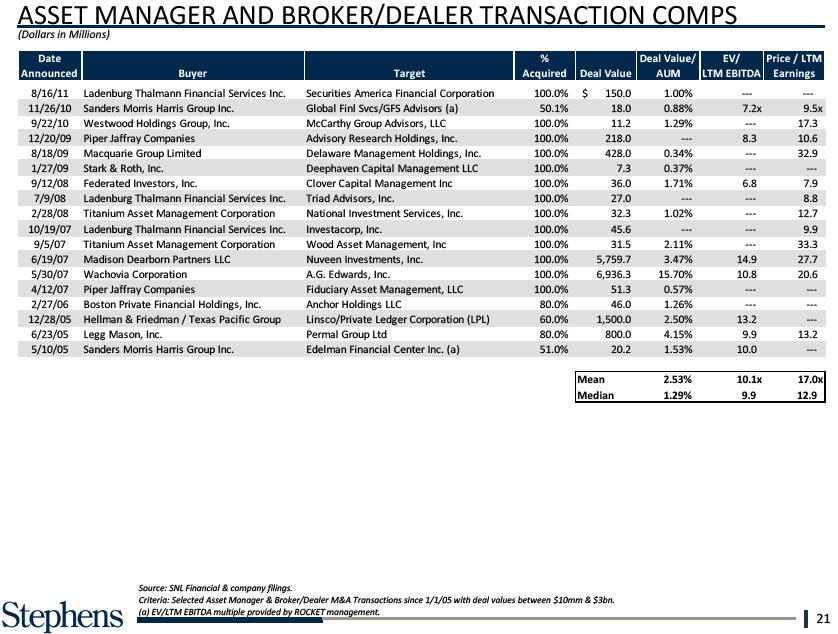
(Dollars in Millions) 6/23/05 L 5/10/05 S Source: SNL Financial & company filings. Criteria: Selected Asset Manager & Broker/Dealer M&A Transactions since 1/1/05 with deal values between $10mm & $3bn. (a) EV/LTM EBITDA multiple provided by ROCKET management. 21
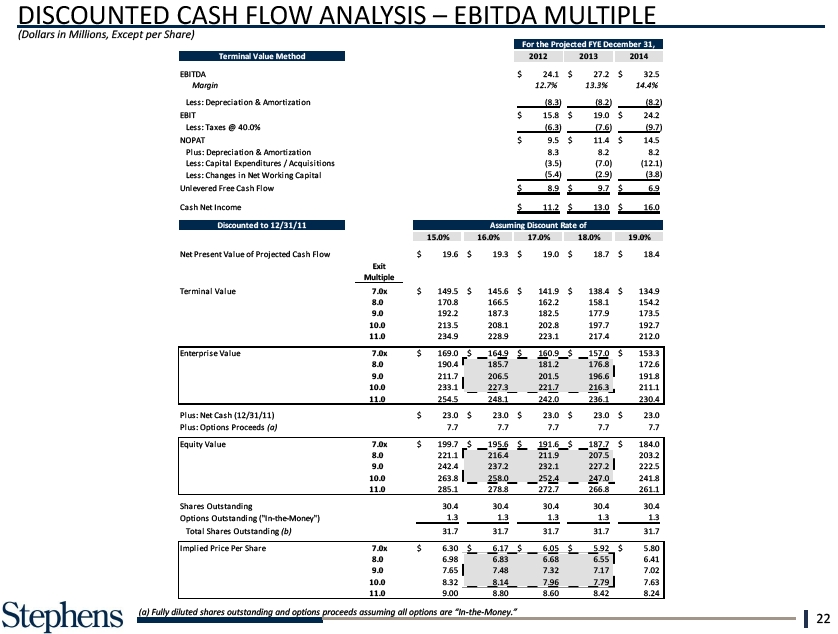
DISCOUNTED CASHTotal ANALYSIS Shares MULTIPLE Outstan (Dollars in Millions, Except per Share) Implied Price Per Share (a) Fully diluted shares outstanding and options proceeds assuming all options are “In-the-Money.” 22
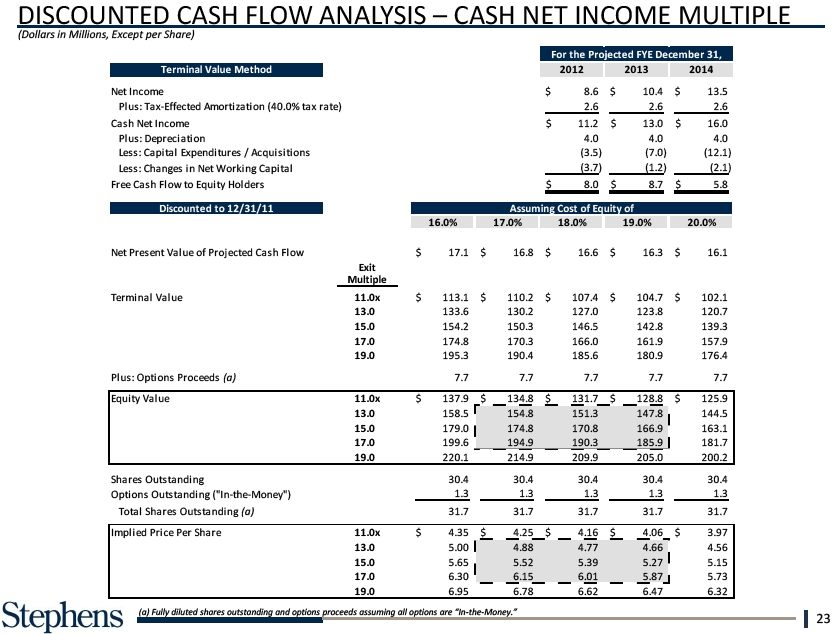
DISCOUNTED ANALYSIS INCOME (Dollars in Millions, Except per Share) Total Shares Outst Implied Price Per Sh (a) Fully diluted shares outstanding and options proceeds assuming all options are “In-the-Money.” 23

LEVERAGED Plus: BUYOUT Debt ANALYSIS (9/30/11) (Dollars in Millions, Less: Share) Cash (9/30/11) TRANSACTION ASSUMPTIONS Uses SOURCES & USES Implied Enterprise Value Purchase of Equi t Refi nance Exi sti ng Fi nanci ng Fees Enterprise Value / Transacti on Expe Revenue Total Uses EBITDA 2014E RETURN SUMMARY Exi t Mul t. EV I Pr o For m a De bt Am 8.0x ount $ 259 R Tr a ns a c ti on Debt $ 4 0 .0 8.5x 276 9.0x 292 9.5x 308 10.0x 324 ADDITIONAL ASSUMPTIONS § Assumes $2mm of annual public company cost savings§ Transaction expenses represent 2% of total transaction value§ Excess cash flow used to pay down Transaction Debt§ Tax rate: 40%§ Min cash: $20mm§ 1.3% financing fee§ All restricted units immediately vest 24
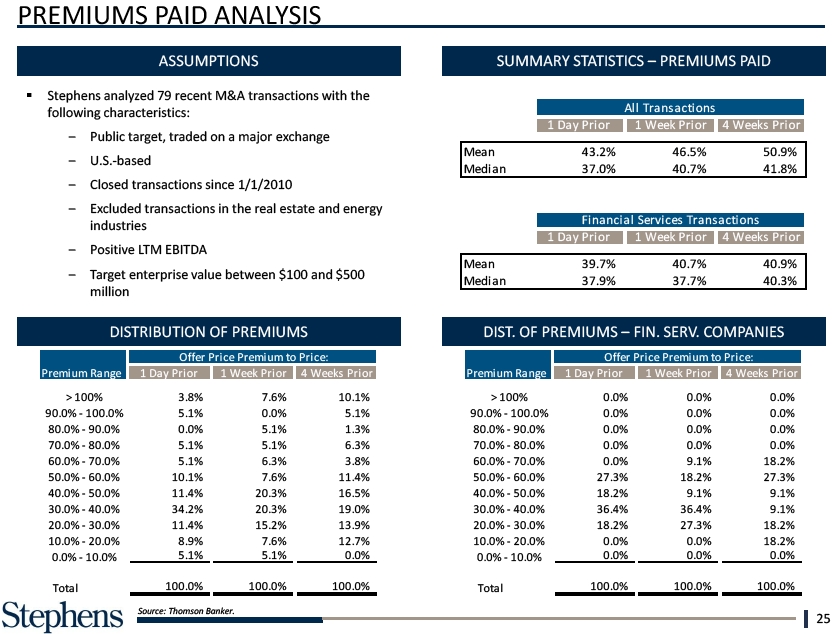
PREMIUMS PAID ANALYSIS Mean > 100% Medi3.8% an ASSUMPTIONS SUMMARY STATISTICS – PREMIUMS PAID § Stephens 90.0% analyzed recent - 100.0% transactions the 90. 5.1%100.0% following characteristics: 80.0% traded -on90.0% 80. 0.0%90.0% U.S.-based 70.0% - since 80.0% 1/1/2010 70. 5.1%80. 1 Da Excluded transactions in the real estate and energy 60.0% industries - 70.0% 60. 5.1%70.0% Mean Positive LTM EBITDA 50.0%value - 60.0% $ 500 Medi 5010.0%.1%60 an .0% million 40.0% - 50.0% 4011.0% .4%50.0% DISTRIBUTION OF PREMIUMS DIST. OF PREMIUMS – FIN. SERV. COMPANIES 30.0% - 40.0% 3034.0% .2%40.0% 20.0% - 30.0% 2011.0% .4%30.0% 10.0% - 20.0% 10. 8.9%20.0% 0.0% - 10.0% 0. 5.1% 10.0% Total Total 100.0% Source: Thomson Banker. 25

B. MANAGEMENT PROJECTIONS 26

CONSOLIDATED STATEMENT PROJECTIONS (Dollars in Millions) Pretax Income Cash Net Income Margins: EBITDA Pretax Income Source: Company documents. Note: Assumes 40% tax rate in all periods. Excludes income from Non-Core assets (receivables and other investments), which are valued separately. (a) Cash Net Income defined as GAAP Net Income plus tax-effected amortization. 27